Heat and Mass Transfer Scale-Up Issues During Freeze-Drying, III: Control and Characterization of Dryer Differences via Operational Qualification Tests Submitted: January 15, 2004; Accepted: February 9, 2006; Published: April 21, 2006 S. Rambhatla, 1,2 S. Tchessalov, 1,3 and Michael J. Pikal 1 1 School of Pharmacy, University of Connecticut, Storrs, CT 06269 2 Present address: Talecris Biotherapeutic, Inc., Clayton, NC 3 Present address: Wyeth BioPharma, Drug Products Development, Andover, MA ABSTRACT The objective of this research was to estimate differences in heat and mass transfer between freeze dryers due to inherent design characteristics using data obtained from sublimation tests. This study also aimed to provide guide- lines for convenient scale-up of the freeze-drying process. Data obtained from sublimation tests performed on labo- ratory-scale, pilot, and production freeze dryers were used to evaluate various heat and mass transfer parameters: nonuniformity in shelf surface temperatures, resistance of pipe, refrigeration system, and condenser. Emissivity mea- surements of relevant surfaces such as the chamber wall and the freeze dryer door were taken to evaluate the impact of atypical radiation heat transfer during scale-up. “Hot” and “cold” spots were identified on the shelf surface of different freeze dryers, and the impact of variation in shelf surface temperatures on the primary drying time and the product temperature during primary drying was studied. Calculations performed using emissivity measurements on different freeze dryers suggest that a front vial in the laboratory lyophilizer received 1.8 times more heat than a front vial in a manufacturing freeze dryer operating at a shelf temperature of –25°C and a chamber pressure of 150 mTorr during primary drying. Therefore, front vials in the laboratory are much more atypical than front vials in manufacturing. Steady-state heat and mass transfer equa- tions were used to study a combination of different scale- up issues pertinent during lyophilization cycles commonly used for the freeze-drying of pharmaceuticals. KEYWORDS: Operational qualification, freeze-drying, scale-upR INTRODUCTION An important objective of freeze-drying process design is the development of a process that is robust, is economical, and can be easily transferred to all freeze dryers irrespective of size and design. To be fully transferable, the process should be equivalent—that is, the product temperature:time profile should be identical—when the same freeze-drying process is performed on different freeze dryers. Achieving this objective poses some challenges. First, the freeze dryer under consideration must be tested for performance under conditions of thermal load that it would typically experi- ence during the process. This requirement means that the performance of all components (ie, the condenser, the re- frigeration system, and the chamber) that influence the flow of water vapor during primary drying must be tested. Fur- thermore, those components that affect process design that differ from one dryer to another need to be identified, and the process has to be developed such that the impact of dryer performance may be taken into consideration in the development of equivalent cycles. An ideal process is one where the product, not the equipment, limits the process time. It is important to design appropriate qualification protocols such that all qualification data needed to translate freeze- drying cycles between dryers are obtained. The commonly employed procedure of testing the freeze dryer “clean, dry, and empty” does not give usable scale-up data. Variation of shelf temperature during known representative loads (ie, during sublimation at known rates) and vapor removal ca- pacity under conditions of known high load are examples of important data not obtained with the usual protocols. The principal test designed to obtain such data, the “subli- mation test,” requires running a controlled pseudo-steady- state sublimation test using pure ice where the sublimation rate and the thermal load (ie, the heat transfer rate) are known. It is important that the thermal loads and chamber pressures span the range needed for the anticipated appli- cations. The reader is referred to earlier work 1 regarding generation of heat transfer data for interpretation of subli- mation test results. An assessment of variations in shelf surface temperature is important in the assessment of the intervial variation in sublimation rate. In general, one may assume that the shelf surface temperature is not perfectly uniform during pri- mary drying. 2 A limited amount of data obtained for a pilot scale dryer 3 indicate that temperature differences between different positions on the same shelf exist and that these AAPS PharmSciTech 2006; 7 (2) Article 39 (http://www.aapspharmscitech.org). E1 Corresponding Author: Michael J. Pikal, School of Pharmacy, University of Connecticut, Storrs, CT 06269. Tel: (860) 486-3202; Fax: (860) 486-4998; E-mail: [email protected]

Welcome message from author
This document is posted to help you gain knowledge. Please leave a comment to let me know what you think about it! Share it to your friends and learn new things together.
Transcript

Heat and Mass Transfer Scale-Up Issues During Freeze-Drying, III: Controland Characterization of Dryer Differences via Operational Qualification TestsSubmitted: January 15, 2004; Accepted: February 9, 2006; Published: April 21, 2006
S. Rambhatla,1,2 S. Tchessalov,1,3 and Michael J. Pikal1
1School of Pharmacy, University of Connecticut, Storrs, CT 062692Present address: Talecris Biotherapeutic, Inc., Clayton, NC3Present address: Wyeth BioPharma, Drug Products Development, Andover, MA
ABSTRACT
The objective of this research was to estimate differences inheat and mass transfer between freeze dryers due toinherent design characteristics using data obtained fromsublimation tests. This study also aimed to provide guide-lines for convenient scale-up of the freeze-drying process.Data obtained from sublimation tests performed on labo-ratory-scale, pilot, and production freeze dryers were usedto evaluate various heat and mass transfer parameters:nonuniformity in shelf surface temperatures, resistance ofpipe, refrigeration system, and condenser. Emissivity mea-surements of relevant surfaces such as the chamber walland the freeze dryer door were taken to evaluate the impactof atypical radiation heat transfer during scale-up. “Hot”and “cold” spots were identified on the shelf surface ofdifferent freeze dryers, and the impact of variation in shelfsurface temperatures on the primary drying time and theproduct temperature during primary drying was studied.Calculations performed using emissivity measurements ondifferent freeze dryers suggest that a front vial in thelaboratory lyophilizer received 1.8 times more heat than afront vial in a manufacturing freeze dryer operating at ashelf temperature of –25°C and a chamber pressure of150 mTorr during primary drying. Therefore, front vials inthe laboratory are much more atypical than front vials inmanufacturing. Steady-state heat and mass transfer equa-tions were used to study a combination of different scale-up issues pertinent during lyophilization cycles commonlyused for the freeze-drying of pharmaceuticals.
KEYWORDS: Operational qualification, freeze-drying,scale-upR
INTRODUCTION
An important objective of freeze-drying process design isthe development of a process that is robust, is economical,and can be easily transferred to all freeze dryers irrespective
of size and design. To be fully transferable, the processshould be equivalent—that is, the product temperature:timeprofile should be identical—when the same freeze-dryingprocess is performed on different freeze dryers. Achievingthis objective poses some challenges. First, the freeze dryerunder consideration must be tested for performance underconditions of thermal load that it would typically experi-ence during the process. This requirement means that theperformance of all components (ie, the condenser, the re-frigeration system, and the chamber) that influence the flowof water vapor during primary drying must be tested. Fur-thermore, those components that affect process design thatdiffer from one dryer to another need to be identified, andthe process has to be developed such that the impact ofdryer performance may be taken into consideration in thedevelopment of equivalent cycles. An ideal process is onewhere the product, not the equipment, limits the processtime.
It is important to design appropriate qualification protocolssuch that all qualification data needed to translate freeze-drying cycles between dryers are obtained. The commonlyemployed procedure of testing the freeze dryer “clean, dry,and empty” does not give usable scale-up data. Variation ofshelf temperature during known representative loads (ie,during sublimation at known rates) and vapor removal ca-pacity under conditions of known high load are examplesof important data not obtained with the usual protocols.The principal test designed to obtain such data, the “subli-mation test,” requires running a controlled pseudo-steady-state sublimation test using pure ice where the sublimationrate and the thermal load (ie, the heat transfer rate) areknown. It is important that the thermal loads and chamberpressures span the range needed for the anticipated appli-cations. The reader is referred to earlier work1 regardinggeneration of heat transfer data for interpretation of subli-mation test results.
An assessment of variations in shelf surface temperature isimportant in the assessment of the intervial variation insublimation rate. In general, one may assume that the shelfsurface temperature is not perfectly uniform during pri-mary drying.2 A limited amount of data obtained for a pilotscale dryer3 indicate that temperature differences betweendifferent positions on the same shelf exist and that these
AAPS PharmSciTech 2006; 7 (2) Article 39 (http://www.aapspharmscitech.org).
E1
Corresponding Author: Michael J. Pikal, School ofPharmacy, University of Connecticut, Storrs, CT 06269.Tel: (860) 486-3202; Fax: (860) 486-4998;E-mail: [email protected]
differences are proportional to the heat transfer rate. Thevariation in product temperature due to variations in shelfsurface temperature across the shelf is an important scale-up issue, one that can affect process. Identification of the“hot” and “cold” spots (ie, regions of differing temperature)on the shelf surface can direct process modification so as toaccount for these variations.
The vial heat transfer coefficient is also affected by theemissivities of relevant surfaces: the shelf surface, the sideand back walls of the chamber, the door,4 and the viewport. Values of emissivity may vary depending on thefreeze dryer design and the deterioration of the “polish” onthe freeze dryer with use. This variation in emissivity needsto be recognized in process design because it can affect thecontribution of radiation heat transfer to the overall vialheat transfer coefficient, particularly at a low shelf temper-ature and low chamber pressure, where radiation effects arerelatively more important.
It has been found with both laboratory and productiondryers that at a particular sublimation rate the thermal loadbecomes too high for the dryer and chamber pressure con-trol is lost.5 Data for the minimum chamber pressure andmaximum condenser temperature at “high” thermal loadallow calculation of the thermal load at which loss of pres-sure control will occur.6 As part of this research, the theo-retical predictions will be compared with experimentalresults obtained from the sublimation test.
Given the operational qualification (OQ) data on both labo-ratory and production dryers and the known variance invial heat transfer coefficient, we will describe the estima-tion of the intervial variation in heat transfer for a pro-duction operation. The corresponding variation in producttemperature and drying time will then be calculated. Thisresearch aims at developing reliable scale-up proceduresand guidelines that also consider several other scale-upissues, such as the edge-vial effect and the effect of het-erogeneity in nucleation temperatures.7,8 With the afore-mentioned information, steady-state heat and mass transfertheory can then be used to define the manufacturing pro-cess that provides essentially the same product temperature:time history as found in the laboratory process.
MATERIALS AND METHODS
Materials
De-ionized water was used in sublimation experiments. Fastresponse thermocouples (Omega Instruments, Stamford, CT)with self-adhesive backing were used to record shelf sur-face temperatures during sublimation tests. The emissivityof representative surfaces such as the chamber wall and thedryer door was determined using an infrared thermometer.
Equipment
OQ sublimation tests were performed on different lyophi-lizers. Two laboratory lyophilizers, Durastop and Lyostar I(Kinetics Thermal Systems, Inc); a pilot lyophilizer, EdwardsLyofast S20; and a manufacturing lyophilizer, Lyomax (BOCEdwards Inc), were used. We also obtained data from a sub-limation test performed in an earlier study on a manufac-turing scale (Stokes) dryer. The basic characteristics of thelyophilizers are shown in Table 1.
OQ Sublimation Tests
Deionized water was loaded into trays made from thinplastic bags (≈0.003 cm). Equal amounts of water wereadded to each shelf of the lyophilizer; this amount varieddepending on the size of the lyophilizer. The intent was toadd enough water to provide ≈1 cm ice thickness. The plas-tic sheet (black garbage bags) was fastened to the steel band(commonly used as part of a bottomless tray) and formedthe bottom of the tray. The plastic, being very thin, doesnot impose a significant heat transfer barrier and, when filledwith water, deforms to fit the contour of the shelf. Flat ad-hesive thermocouples were placed on the shelf surface atrepresentative shelf positions. To insulate the thermocouplefrom the bottom of the tray, several layers of aluminum foiland thin plastic (transparency film) were placed betweenthe thermocouple joint and the tray bottom. Temperaturemeasurements are generally subject to random error ofabout ±0.2°C, but shelf surface temperatures are also sub-ject to a systematic error due to heat exchange with theice above the temperature sensor. That is, insulation of thethermocouple is not perfect. This impact of this effect is
Table 1. Basic Characteristics of Lyophilizers*
Characteristics
Laboratory (KTS) PilotLyofast (Edwards)
Manufacturing
Durastop Lyostar I Lyomax (Edwards) Stokes
Total shelf surface, m2 0.38 0.35 2 39 24.2Condenser surface, m2 0.64 0.37 2 43 24.6Chamber to condenser pathway D = 0.05
L = 0.27D = 0.1L = 0.48
D = 0.25L = 0.75
D = 0.91L ≈ 1.5
D = 0.9L = 0.9
*D and L are the diameter (m) and length (m) of the chamber to condenser pathway, respectively. KTS indicates Kinetics Thermal Systems.
AAPS PharmSciTech 2006; 7 (2) Article 39 (http://www.aapspharmscitech.org).
E2
discussed in the next section. Additionally, thermocoupleswere placed on the surface of the plastic-bottomed tray tomeasure the product temperature. The sublimation test wasperformed using the following protocol:
1. Ramp to –15°C at 10°C/hr; hold for 1 hour.2. Ramp from –15°C to –40°C at 60°C/hr; hold for
4 hours.3. Pull vacuum to 80 mTorr; ramp from –40°C to –5°C
at 30°C/hr; hold for 3 hours. These conditions willgive a sublimation load of ≈0.5 kg hr–1m–2.
4. Set vacuum to 120 mTorr; ramp at 60°C/hr to 25°C;hold for 2 hours. This step provides a sublimationrate of 1.09 kg hr–1m–2.
5. Change pressure to 0 mTorr; ramp to 40°C at 60°C/hr;hold for 3 hours. Determine the “steady state” mini-mum chamber pressure attained under these condi-tions. Lower the shelf temperature to 30°C if pressurerises above 0.4 Torr.
6. Set pressure to 400 mTorr; hold at 40°C for 3 hours;visually check ice distribution on condenser plates.Lower the shelf temperature to 30°C if there is loss ofpressure control.
Emissivity Measurements
The infrared thermometer, Omegascope (Omega Instruments,Samford, CT), uses a laser sight (with a distance-to-spot-sizeratio of 30:1) designed to measure surface temperature ata given surface spot of known emissivity. The infrared ther-mometer uses the Stefan-Boltzmann equation7 for directlycalculating the temperature of an object of known emissiv-ity. A sensor inside the thermometer determines the am-bient temperature (ie, the temperature of the thermometer).In our studies, we measured the temperature of the surfaceusing a thermocouple and determined the emissivity of thesurface at that surface temperature by finding the emissivitythat resulted in a match of thermocouple and infrared ther-mometer readings. With this technique, the infrared ther-mometer measures values of emissivity ranging from 0.1 to1 in steps of 0.01.
RESULTS AND DISCUSSION
Temperature Differences
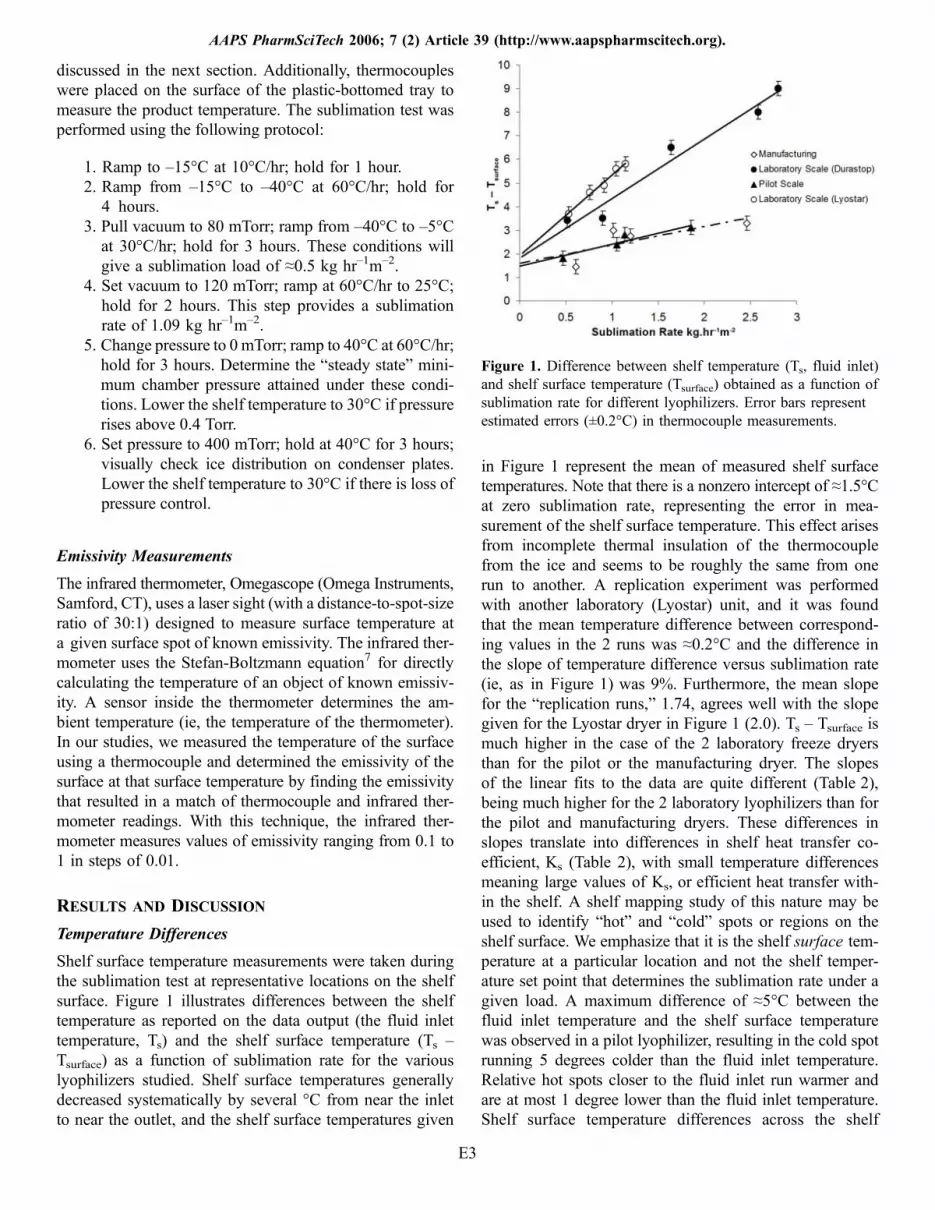
Shelf surface temperature measurements were taken duringthe sublimation test at representative locations on the shelfsurface. Figure 1 illustrates differences between the shelftemperature as reported on the data output (the fluid inlettemperature, Ts) and the shelf surface temperature (Ts –Tsurface) as a function of sublimation rate for the variouslyophilizers studied. Shelf surface temperatures generallydecreased systematically by several °C from near the inletto near the outlet, and the shelf surface temperatures given
in Figure 1 represent the mean of measured shelf surfacetemperatures. Note that there is a nonzero intercept of ≈1.5°Cat zero sublimation rate, representing the error in mea-surement of the shelf surface temperature. This effect arisesfrom incomplete thermal insulation of the thermocouplefrom the ice and seems to be roughly the same from onerun to another. A replication experiment was performedwith another laboratory (Lyostar) unit, and it was foundthat the mean temperature difference between correspond-ing values in the 2 runs was ≈0.2°C and the difference inthe slope of temperature difference versus sublimation rate(ie, as in Figure 1) was 9%. Furthermore, the mean slopefor the “replication runs,” 1.74, agrees well with the slopegiven for the Lyostar dryer in Figure 1 (2.0). Ts – Tsurface ismuch higher in the case of the 2 laboratory freeze dryersthan for the pilot or the manufacturing dryer. The slopesof the linear fits to the data are quite different (Table 2),being much higher for the 2 laboratory lyophilizers than forthe pilot and manufacturing dryers. These differences inslopes translate into differences in shelf heat transfer co-efficient, Ks (Table 2), with small temperature differencesmeaning large values of Ks, or efficient heat transfer with-in the shelf. A shelf mapping study of this nature may beused to identify “hot” and “cold” spots or regions on theshelf surface. We emphasize that it is the shelf surface tem-perature at a particular location and not the shelf temper-ature set point that determines the sublimation rate under agiven load. A maximum difference of ≈5°C between thefluid inlet temperature and the shelf surface temperaturewas observed in a pilot lyophilizer, resulting in the cold spotrunning 5 degrees colder than the fluid inlet temperature.Relative hot spots closer to the fluid inlet run warmer andare at most 1 degree lower than the fluid inlet temperature.Shelf surface temperature differences across the shelf
Figure 1. Difference between shelf temperature (Ts, fluid inlet)and shelf surface temperature (Tsurface) obtained as a function ofsublimation rate for different lyophilizers. Error bars representestimated errors (±0.2°C) in thermocouple measurements.
AAPS PharmSciTech 2006; 7 (2) Article 39 (http://www.aapspharmscitech.org).
E3
translate to variations in heat flow and in turn, to variationsin primary drying time. Such differences need to be con-sidered during scale-up. For example, consider a process tobe transferred from a laboratory freeze dryer to the pilotscale lyophilizer. Consider a hypothetical product of lowresistance (2.5 Torr.hr.cm2g–1) of ≈1.4 cm fill depth in a vialwhose internal surface area is roughly 4.9 cm2. The heattransfer coefficient of the vial is 3.7*10−4 cal.sec–1cm–2K−1.The primary drying conditions for shelf temperature andchamber pressure are –5°C and 80 mTorr, respectively.Suppose that the lyophilization cycle for this product is≈22 hours in a freeze dryer where the differences betweenshelf fluid inlet temperature and shelf surface temper-ature at various locations is essentially zero. The producttemperature during sublimation is –31.8°C in this case.However, suppose, as with the pilot scale freeze dryer, thedifference between the shelf fluid inlet temperature andthe coldest spot on the shelf surface is 5°C (ie, the coldspot is –10°C). Using the coupled heat and mass transferequations,8 the lower shelf temperature translates to 26 hoursof primary drying and a product temperature of –32.8°C.This would mean that the translated drying cycle wouldhave to incorporate an additional 4 hours in primary dryingtime to ensure that primary drying is complete for the vial inthe vicinity of the cold spot. However, the shelf temperatureset point could be raised by as much as 1°C (ie, to –4°C) sincethe relative “hot” spot is 1 degree colder than the fluid inlettemperature. This increase would mean the cold spot isnow –9°C and would result in an increase of primary dry-ing time of 3 hours instead of 4 hours. Such evaluationsbecome important in process design to ensure that primary
drying is complete for all the vials before the shelf tem-perature is raised for secondary drying. These evaluationsare more critical when the process is designed to run closeto optimum.
Shelf Heat Transfer Coefficient Studies
Sublimation tests were performed according to the protocolmentioned in the OQ Sublimation Tests section. The heattransfer coefficient of the tray, Kv, was determined earlier(M. Pikal and M. Roy, unpublished data, June 16, 1994)and is represented as a function of pressure as follows:
104 Kv ðcal : s− 1 : cm− 2 : -K − 1Þ ¼ 0:70þ 33:2P
1þ 2:88P; ð1Þ
where P is the chamber pressure in Torr (ie, mm Hg). Withthe heat transfer coefficient, Kv, characterized as a func-tion of chamber pressure for this configuration and knowl-edge of shelf surface temperature, the exact sublimationrate (dm/dt) in kg.hr–1.m–2 may be calculated according toEquations 2 and 3:
dm
dt¼ 53:25 ⋅ KTðTshelf inlet− TiceÞ ð2Þ
dm
dt¼ 53:25 ⋅ Kv ðTshelf surface− TpÞ; ð3Þ
where the total heat transfer coefficient KT is expressed asfollows:
KT ¼ Kv
1þ KvKlþ Kv
Ks
� � ;Kl ¼ 0:0066
Liceð4Þ
In the above set of equations, Tshelf inlet is the fluid inlettemperature that the equipment records, Tshelf surface is thedirectly measured mean temperature of the shelf surface,Kv is the heat transfer coefficient of the “plastic” bottomtray, Tice is the temperature of ice at the ice vapor interface,Tp is the directly measured ice temperature at the bottom ofthe pan, KI is the heat transfer coefficient of ice, Lice is thethickness of ice, and Ks is the heat transfer coefficient ofthe shelf itself. All heat transfer coefficients are in. Thenumber 53.25 comes from the conversion of units for theheat of sublimation of ice (53.25 = 3600*10 000/676 000).Ks may be evaluated from sublimation rate data accordingto the following equation:
dm
dtðkg ⋅ hr− 1⋅ m− 2Þ ¼ 53:25 ⋅ Ks⋅ðTshelf inlet− Tshelf surfaceÞ ; ð5Þ
Table 2. Shelf Heat Transfer Coefficient (Ks) for VariousLyophilizers Calculated From Data Obtained During OperationalQualification Tests and Calculated Using Regression Analysisof the Data*
LyophilizerSlope
hr.m2.Kg-.1°C–1Intercept(°C)
Ks*103,
cal.s–1cm–2.K–1
CalculatedFrom Slope
Laboratory(Lyostar I)
3.4 1.9 5.4 ± 1.9
Laboratory(Durastop)
2.6 1.5 8.0 ± 2.3
Pilot(Edwards)
0.77 1.5 18.1 ± 4.3
Manufacturing(Stokes)
0.93 1.7 13.9 ± 8.5
*Regression analysis was performed according to the equationQðcal s−1 cm− 2Þ ¼ Ks ⋅ ðTs− Tshelf surface−ΔTerrorÞ, where Tshelf surfacerepresents average shelf surface temperature measured across the shelfand ∆Terror represents the shelf surface temperature measurement error(ie, the intercept in Figure 1). Both Ks and ∆Terror were determinedby regression analysis, and the uncertainties given represent the standarderror in the parameter as given by the regression analysis.
AAPS PharmSciTech 2006; 7 (2) Article 39 (http://www.aapspharmscitech.org).
E4
where the difference between the shelf inlet temperatureand the shelf surface temperature is assumed to be propor-tional to the sublimation rate, dm/dt. In our case, Ks wasdetermined by regression analysis of sublimation rate andshelf temperature data.
Table 2 shows a comparison of values of shelf heat transfercoefficients obtained for freeze dryers used in this study.We note that earlier work (M. Pikal andM. Roy, unpublisheddata, June 16, 1994) evaluated Ks for a laboratory scaleVirtis 25SRC-X freeze dryer as 6:8 ⋅ 10−3 and for a Stokesproduction dryer as ≈3 ⋅ 10−3.2 Note that the value of Ks
determined for the manufacturing dryer studied in thisresearch (Table 2) is much higher than that determined forthe “literature” Stokes production dryer, while the labo-ratory lyophilizers studied here have values of Ks com-parable to those evaluated earlier for the Virtis 25SRC-X.
Sublimation Tests
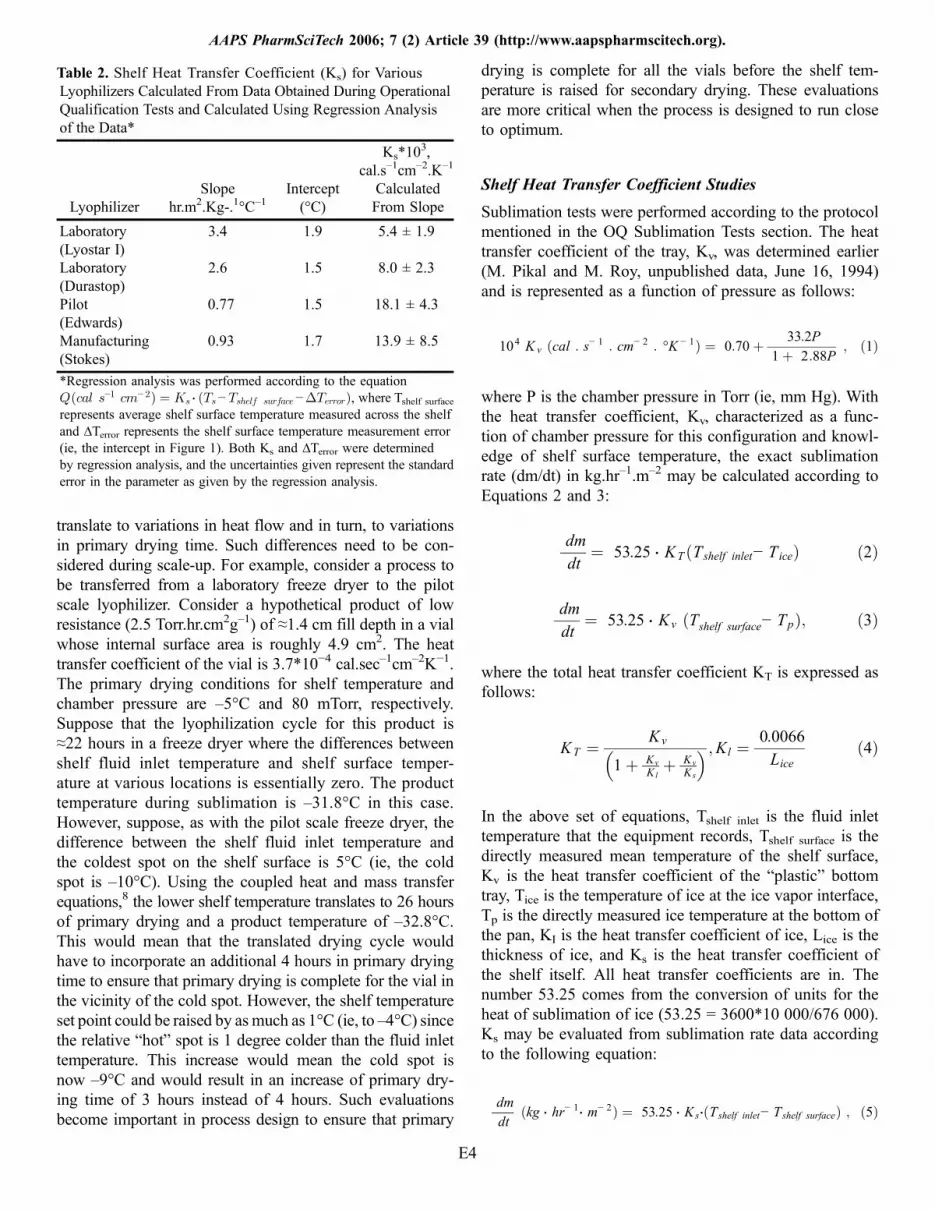
Sublimation test results were used to evaluate the minimumchamber pressure and maximum condenser temperatureattainable at a given load, using the simplified Kobayashi’srelationships.1 The steps of the sublimation test used to de-fine different steady-state periods and the results obtained fora pilot scale Edwards freeze dryer are presented in Table 3.The first setting, 80 mTorr and –5°C shelf temperature, waschosen to give a moderate sublimation rate, 0.5 kg.hr–1m–2,a process typically used in the freeze drying of a material oflow collapse temperature and low dried product resistance.There was good control of both chamber pressure and shelftemperature.
The second condition, 120 mTorr and 25°C shelf temper-ature, was designed to give a higher load of 1.09 kg.hr–1m–2.No oscillations in shelf temperature and chamber pressurewere observed; however, the chamber pressure could not becontrolled at the set point. Instead, the chamber pressurewas controlled at 146 mTorr, higher than the set point
chamber pressure of 120 mTorr, and the corresponding sub-limation rate was slightly greater than planned. The thirdcondition, 40°C and 0 mTorr, was designed to determinethe minimum chamber pressure attainable under conditionsof very high load (greater than 1 kg.hr–1m–2). In this casethe shelf temperature did not experience any oscillationsand the chamber pressure reached a steady-state value of158 mTorr within 20 minutes. The condenser temperaturemeasured –60.5°C in this condition. The last condition,30°C and 400 mTorr, was designed to test the freeze dryerunder severe load conditions. The nominal load in thiscase was 1.86 kg.hr–1m–2, and the shelf temperature andchamber pressure were both well controlled. The condensertemperature was –57°C. These observations show that thepilot scale freeze dryer performed satisfactorily in the OQsublimation test except for the inability to control pressureat the set point of 120 mTorr in step 2. Note also that evenin steps 1 and 4, the pressure was not exactly at the set point.This is, however, not due to an overload of the condenserand probably represents an offset in the control system.
Table 4 shows a summary of results obtained for the labo-ratory scale Durastop freeze dryer. It may be observed thatwhile the shelf temperature was well controlled, the chamberpressure was not under control in steps 1 and 2 of the sub-limation test. Since we did not observe an increase in thecondenser temperature, the refrigeration resistance may beruled out as a cause for the lack of pressure control. Thedesign of the condenser system is such that blockage offull vapor flow seems unlikely or impossible. Hence, wemay deduce that the mass transfer resistance of the chamberto condenser pathway is likely responsible for the freezedryer’s inability to control pressure in this case. A separatetest established that the chamber pressure and shelf tem-perature were well controlled at a shelf temperature of20°C and a chamber pressure of 250 mTorr. The subli-mation rate under these conditions was 1.08 kg.hr–1m–2.Thus, a study of this kind is useful in identifying inherent
Table 3. Parameters of the Steady-State Process Obtained for a Pilot Scale Edwards Freeze Dryer
Steady-State Process
Step 1 Step 2 Step 3 Step 4
Shelf temperature setting, °C –5 25 30 30Chamber pressure setting, mTorr 80 120 0 400Shelf temperature reading (readout from instrumentrecorded as the shelf temperature), °C, Tinlet.readout
–4.5 23.2 28.3 29.4
Chamber pressure reading, mTorr 84 141 158 419Calculated ice surface temperature, Tice, °C –41 –36 –35 –26.5Condenser temperature, ºC –70.0 –62.8 –60.5 –57.0Ice bottom temperature, Tp, °C –39 –29.5 –29.8 –21Average shelf surface temperature, Tshelf surf, °C –8.3 20.8 25.3 26.6Sublimation rate (kg.hr–1m–2), calculatedusing Tp
0.51 1.09 1.21 1.80
AAPS PharmSciTech 2006; 7 (2) Article 39 (http://www.aapspharmscitech.org).
E5

design issues that can lead to a lyophilizer’s failure to con-trol pressure at the selected set point under the required loadconditions.
Evaluation of Dryer Performance Parameters
Information obtained from the sublimation test was used tocalculate mass and heat transfer resistances of the freezedryer, namely the resistance of the chamber to condenserpathway (or pipe resistance), Rc; the resistance to transportof water vapor in the condenser and conversion to ice, Rc*;and the resistance of the refrigeration system to removalof heat coming from the conversion of vapor to ice, RR*.Briefly, the calculations involve an evaluation of the rele-vant resistances from mass flow rate data obtained from thesublimation test using our approximate version of Kobaya-shi’s theory.1
The mass flow rate, dm/dt (kg/s), may be expressed as theratio of the pressure difference and the relevant resistance:
dm
dt¼ ðPch − PcdÞ
Rc¼ ðPcd − Pr
�ÞRc
� ¼ ð Pr� − PR
�ÞRR
� ; ð6Þ
where Pch is the chamber pressure; Pcd is the pressure at theentrance to the condenser; Pr* is the vapor pressure of ice atthe condenser temperature, Tr*; and PR* is the vapor pres-sure at the minimum temperature of the condenser, TR* (ie,no load temperature). The vapor pressure of ice (Torr) at aparticular temperature may be calculated according to thefollowing equation:
lnðPi�Þ ¼ 24:01849 −
6144:96
Ti� ; ð7Þ
where Ti is the temperature (K) of the ice. Rc, Rc*, and RR*were evaluated for different sublimation rates. Details ofthe calculations have been discussed elsewhere.1,5
At each steady-state condition of the sublimation test,standard resistance constants KP, KC, and KR werecalculated according to the following equations:
RC ¼ KP
Pch þ Pcdð8Þ
Rc� ≅ KC ⋅ ðPcd þ Pr
�Þ ð9Þ
RR� ¼ KR ⋅
ffiffiffiffiffiffiffiPr�p
ð10Þ
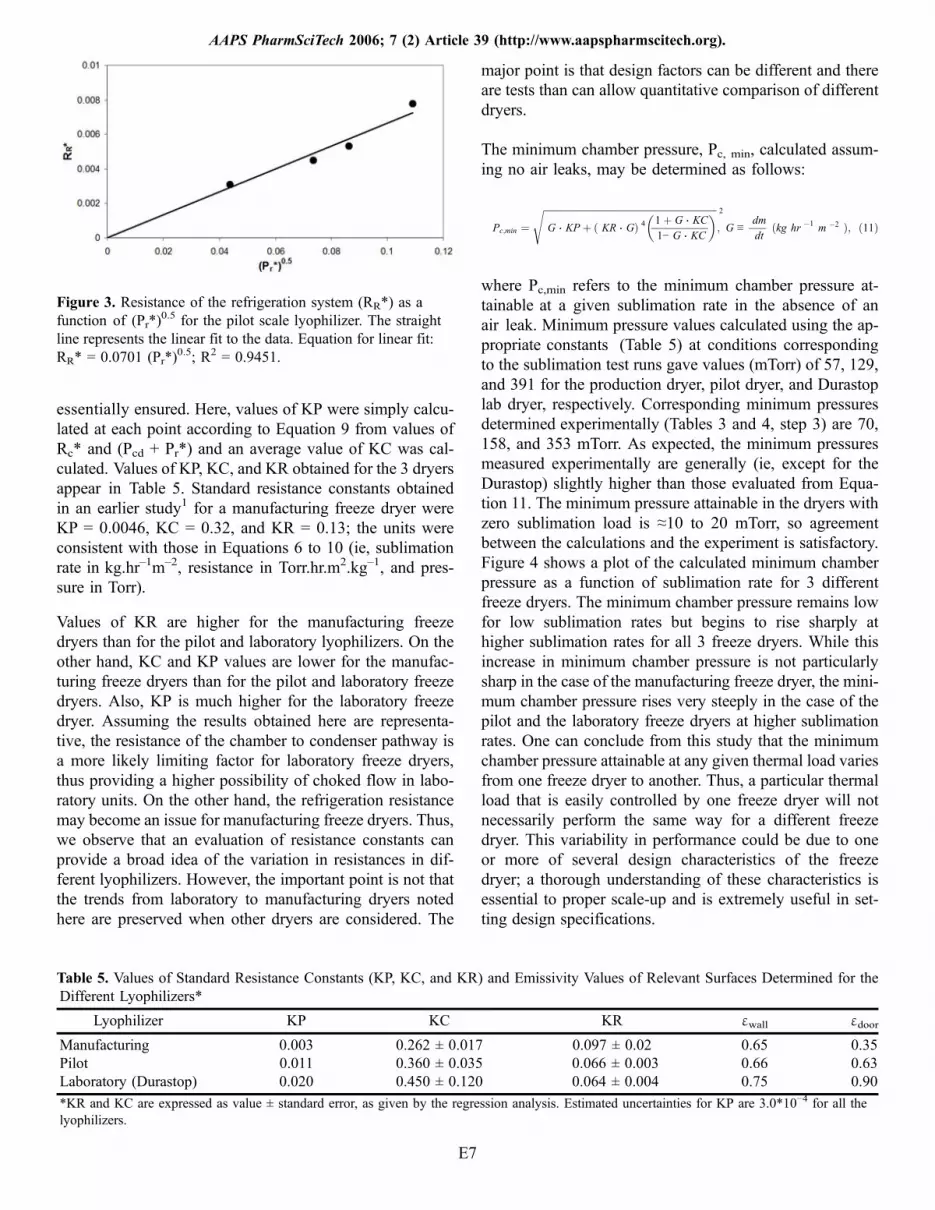
KP and KR were determined from the slopes of the linearplots according to Equations 8 and 10. Plots of Rc versus
1PchþPcd
and RR* vs (Pr*)0.5 obtained for the pilot scale freeze
dryer are shown in Figures 2 and 3. Linearity was satis-factory. The distribution of data points for Rc* and (Pcd +Pr*) did not allow for a meaningful test of linearity. Basi-cally, the data consisted of 2 points close to one anotherand one data point well removed so that linearity was
Table 4. Parameters of the Steady-State Process Obtained for a Laboratory Scale (Durastop) Freeze Dryer
Steady-State Process
Step 1 Step 2 Step 3 Step 4
Shelf temperature setting, °C –5 25 50 50Chamber pressure setting, mTorr 80 120 0 400Shelf temperature reading (readout from instrumentrecorded as the shelf temperature), °C, Tinlet.readout
–5 25 50 50
Chamber Pressure reading, mTorr 270 319 353 403Calculated ice surface temperature, Tice, °C –30 –25.8 –28.3 –26.5Condenser temperature, °C –70.2 –73.5 –76.0 –77.8Ice bottom temperature, Tp, °C –29 –26 –26 –28Average shelf surface temperature, Tshelf surf, °C –8.5 18.5 42 41Sublimation rate (kg.hr-1m-2), calculated using Tp 0.68 1.64 2.58 2.80
Figure 2. Resistance of the chamber to condenser pathway (Rc)as a function of (Pch + Pcd)
–1 for the pilot scale lyophilizer. Thestraight line represents the linear fit to the data. Equation forlinear fit: Rc = 0.011/(Pch + Pcd); R
2 = 0.9696.
AAPS PharmSciTech 2006; 7 (2) Article 39 (http://www.aapspharmscitech.org).
E6
essentially ensured. Here, values of KP were simply calcu-lated at each point according to Equation 9 from values ofRc* and (Pcd + Pr*) and an average value of KC was cal-culated. Values of KP, KC, and KR obtained for the 3 dryersappear in Table 5. Standard resistance constants obtainedin an earlier study1 for a manufacturing freeze dryer wereKP = 0.0046, KC = 0.32, and KR = 0.13; the units wereconsistent with those in Equations 6 to 10 (ie, sublimationrate in kg.hr–1m–2, resistance in Torr.hr.m2.kg–1, and pres-sure in Torr).
Values of KR are higher for the manufacturing freezedryers than for the pilot and laboratory lyophilizers. On theother hand, KC and KP values are lower for the manufac-turing freeze dryers than for the pilot and laboratory freezedryers. Also, KP is much higher for the laboratory freezedryer. Assuming the results obtained here are representa-tive, the resistance of the chamber to condenser pathway isa more likely limiting factor for laboratory freeze dryers,thus providing a higher possibility of choked flow in labo-ratory units. On the other hand, the refrigeration resistancemay become an issue for manufacturing freeze dryers. Thus,we observe that an evaluation of resistance constants canprovide a broad idea of the variation in resistances in dif-ferent lyophilizers. However, the important point is not thatthe trends from laboratory to manufacturing dryers notedhere are preserved when other dryers are considered. The
major point is that design factors can be different and thereare tests than can allow quantitative comparison of differentdryers.
The minimum chamber pressure, Pc, min, calculated assum-ing no air leaks, may be determined as follows:
Pc;min ¼ffiffiffiffiffiffiffiffiffiffiffiffiffiffiffiffiffiffiffiffiffiffiffiffiffiffiffiffiffiffiffiffiffiffiffiffiffiffiffiffiffiffiffiffiffiffiffiffiffiffiffiffiffiffiffiffiffiffiffiffiffiffiffiffiffiffiffiffiffiffiffiffiffiffiG ⋅ KP þ ð KR ⋅ GÞ 4 1þ G ⋅ KC
1− G ⋅ KC
� �s 2
; G ≡dm
dtðkg hr �1 m �2 Þ; ð11Þ
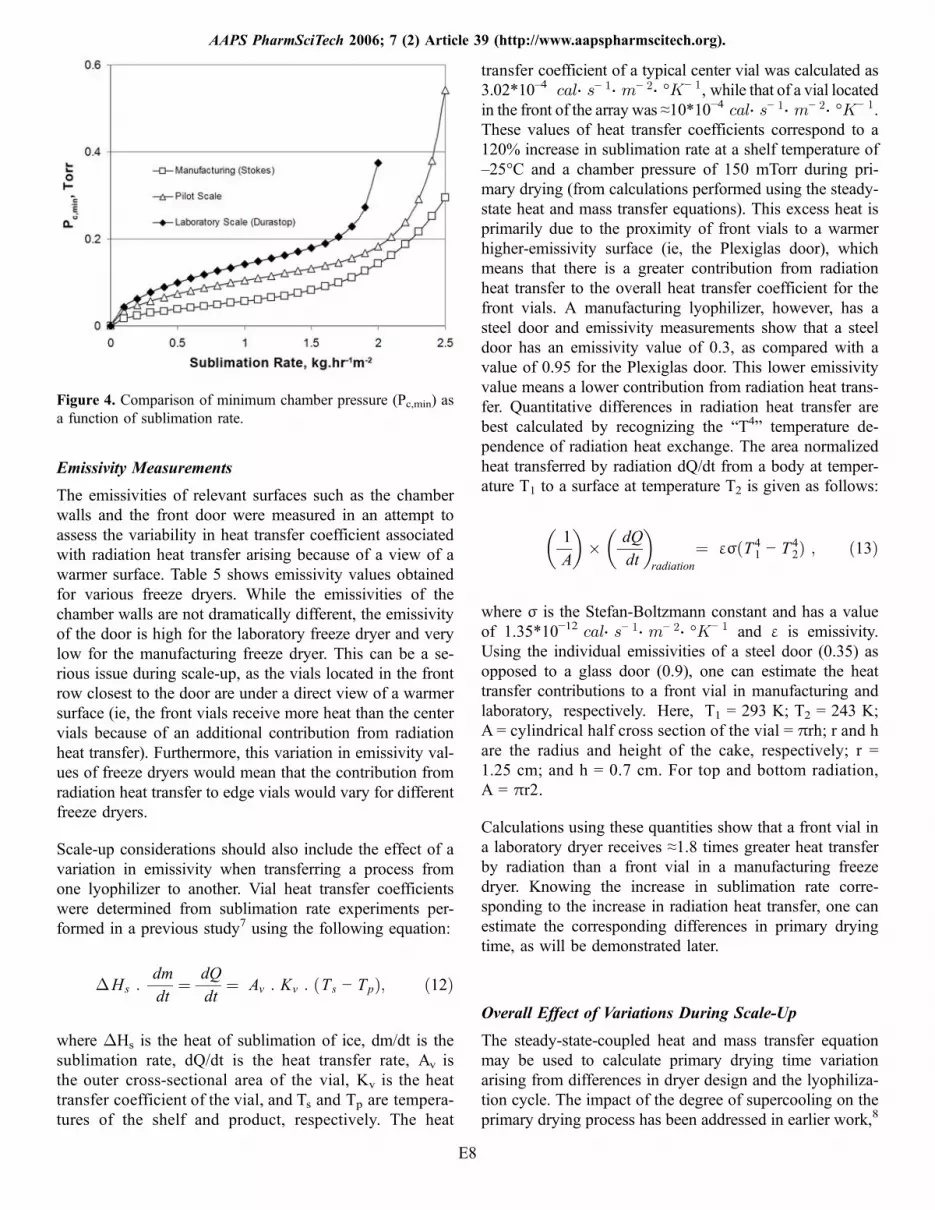
where Pc,min refers to the minimum chamber pressure at-tainable at a given sublimation rate in the absence of anair leak. Minimum pressure values calculated using the ap-propriate constants (Table 5) at conditions correspondingto the sublimation test runs gave values (mTorr) of 57, 129,and 391 for the production dryer, pilot dryer, and Durastoplab dryer, respectively. Corresponding minimum pressuresdetermined experimentally (Tables 3 and 4, step 3) are 70,158, and 353 mTorr. As expected, the minimum pressuresmeasured experimentally are generally (ie, except for theDurastop) slightly higher than those evaluated from Equa-tion 11. The minimum pressure attainable in the dryers withzero sublimation load is ≈10 to 20 mTorr, so agreementbetween the calculations and the experiment is satisfactory.Figure 4 shows a plot of the calculated minimum chamberpressure as a function of sublimation rate for 3 differentfreeze dryers. The minimum chamber pressure remains lowfor low sublimation rates but begins to rise sharply athigher sublimation rates for all 3 freeze dryers. While thisincrease in minimum chamber pressure is not particularlysharp in the case of the manufacturing freeze dryer, the mini-mum chamber pressure rises very steeply in the case of thepilot and the laboratory freeze dryers at higher sublimationrates. One can conclude from this study that the minimumchamber pressure attainable at any given thermal load variesfrom one freeze dryer to another. Thus, a particular thermalload that is easily controlled by one freeze dryer will notnecessarily perform the same way for a different freezedryer. This variability in performance could be due to oneor more of several design characteristics of the freezedryer; a thorough understanding of these characteristics isessential to proper scale-up and is extremely useful in set-ting design specifications.
Figure 3. Resistance of the refrigeration system (RR*) as afunction of (Pr*)
0.5 for the pilot scale lyophilizer. The straightline represents the linear fit to the data. Equation for linear fit:RR* = 0.0701 (Pr*)
0.5; R2 = 0.9451.
Table 5. Values of Standard Resistance Constants (KP, KC, and KR) and Emissivity Values of Relevant Surfaces Determined for theDifferent Lyophilizers*
Lyophilizer KP KC KR εwall εdoor
Manufacturing 0.003 0.262 ± 0.017 0.097 ± 0.02 0.65 0.35Pilot 0.011 0.360 ± 0.035 0.066 ± 0.003 0.66 0.63Laboratory (Durastop) 0.020 0.450 ± 0.120 0.064 ± 0.004 0.75 0.90
*KR and KC are expressed as value ± standard error, as given by the regression analysis. Estimated uncertainties for KP are 3.0*10−4 for all thelyophilizers.
AAPS PharmSciTech 2006; 7 (2) Article 39 (http://www.aapspharmscitech.org).
E7
Emissivity Measurements
The emissivities of relevant surfaces such as the chamberwalls and the front door were measured in an attempt toassess the variability in heat transfer coefficient associatedwith radiation heat transfer arising because of a view of awarmer surface. Table 5 shows emissivity values obtainedfor various freeze dryers. While the emissivities of thechamber walls are not dramatically different, the emissivityof the door is high for the laboratory freeze dryer and verylow for the manufacturing freeze dryer. This can be a se-rious issue during scale-up, as the vials located in the frontrow closest to the door are under a direct view of a warmersurface (ie, the front vials receive more heat than the centervials because of an additional contribution from radiationheat transfer). Furthermore, this variation in emissivity val-ues of freeze dryers would mean that the contribution fromradiation heat transfer to edge vials would vary for differentfreeze dryers.
Scale-up considerations should also include the effect of avariation in emissivity when transferring a process fromone lyophilizer to another. Vial heat transfer coefficientswere determined from sublimation rate experiments per-formed in a previous study7 using the following equation:
ΔHs :dm
dt¼ dQ
dt¼ Av : Kv : ðTs − TpÞ; ð12Þ
where ΔHs is the heat of sublimation of ice, dm/dt is thesublimation rate, dQ/dt is the heat transfer rate, Av isthe outer cross-sectional area of the vial, Kv is the heattransfer coefficient of the vial, and Ts and Tp are tempera-tures of the shelf and product, respectively. The heat
transfer coefficient of a typical center vial was calculated as3.02*10–4 cal⋅ s− 1⋅ m− 2⋅ -K− 1, while that of a vial locatedin the front of the array was ≈10*10−4 cal⋅ s− 1⋅ m− 2⋅ -K− 1.These values of heat transfer coefficients correspond to a120% increase in sublimation rate at a shelf temperature of–25°C and a chamber pressure of 150 mTorr during pri-mary drying (from calculations performed using the steady-state heat and mass transfer equations). This excess heat isprimarily due to the proximity of front vials to a warmerhigher-emissivity surface (ie, the Plexiglas door), whichmeans that there is a greater contribution from radiationheat transfer to the overall heat transfer coefficient for thefront vials. A manufacturing lyophilizer, however, has asteel door and emissivity measurements show that a steeldoor has an emissivity value of 0.3, as compared with avalue of 0.95 for the Plexiglas door. This lower emissivityvalue means a lower contribution from radiation heat trans-fer. Quantitative differences in radiation heat transfer arebest calculated by recognizing the “T4” temperature de-pendence of radiation heat exchange. The area normalizedheat transferred by radiation dQ/dt from a body at temper-ature T1 to a surface at temperature T2 is given as follows:
1
A
� �� dQ
dt
� �radiation
¼ εσðT 41 − T4
2Þ ; ð13Þ
where σ is the Stefan-Boltzmann constant and has a valueof 1.35*10−12 cal⋅ s− 1⋅ m− 2⋅ -K− 1 and ε is emissivity.Using the individual emissivities of a steel door (0.35) asopposed to a glass door (0.9), one can estimate the heattransfer contributions to a front vial in manufacturing andlaboratory, respectively. Here, T1 = 293 K; T2 = 243 K;A = cylindrical half cross section of the vial = πrh; r and hare the radius and height of the cake, respectively; r =1.25 cm; and h = 0.7 cm. For top and bottom radiation,A = πr2.
Calculations using these quantities show that a front vial ina laboratory dryer receives ≈1.8 times greater heat transferby radiation than a front vial in a manufacturing freezedryer. Knowing the increase in sublimation rate corre-sponding to the increase in radiation heat transfer, one canestimate the corresponding differences in primary dryingtime, as will be demonstrated later.
Overall Effect of Variations During Scale-Up
The steady-state-coupled heat and mass transfer equationmay be used to calculate primary drying time variationarising from differences in dryer design and the lyophiliza-tion cycle. The impact of the degree of supercooling on theprimary drying process has been addressed in earlier work,8
Figure 4. Comparison of minimum chamber pressure (Pc,min) asa function of sublimation rate.
AAPS PharmSciTech 2006; 7 (2) Article 39 (http://www.aapspharmscitech.org).
E8
where the correlation between product resistance and spe-cific surface area in a laboratory lyophilizer was used toestimate the increase in product resistance in a manufactur-ing environment. This difference in product resistance be-tween laboratory and manufacturing was used to determinethe primary drying time differences and accordingly alterthe freeze-drying cycle to bring about equivalence in freeze-drying cycles.
Coupling between heat and mass transfer may be expressedas follows:
ΔHsP0 − Pc
Rps
� �Av
Ap
� �− Av Kv ðTs − TpÞ ¼ 0; ð14Þ
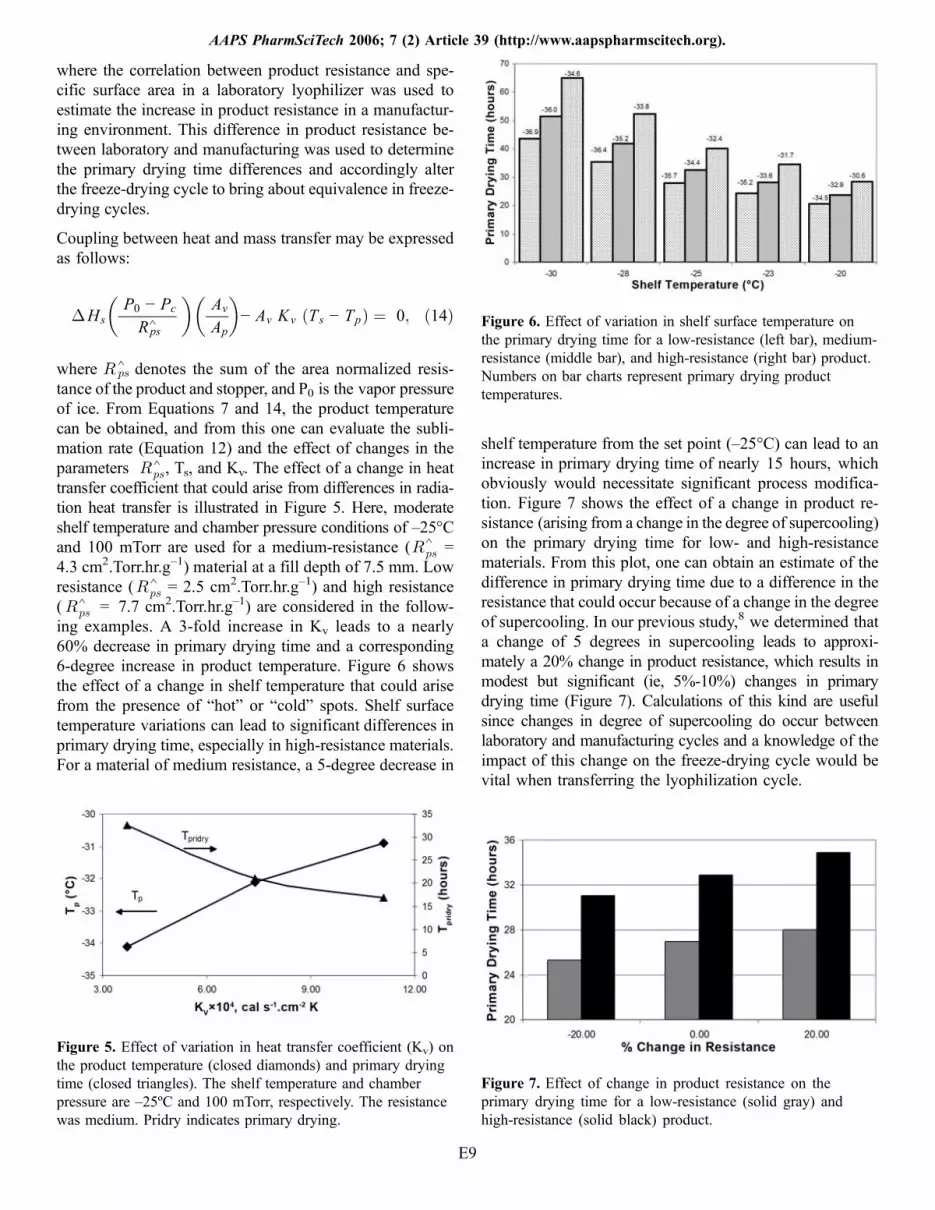
where Rps denotes the sum of the area normalized resis-tance of the product and stopper, and P0 is the vapor pressureof ice. From Equations 7 and 14, the product temperaturecan be obtained, and from this one can evaluate the subli-mation rate (Equation 12) and the effect of changes in theparameters Rps, Ts, and Kv. The effect of a change in heattransfer coefficient that could arise from differences in radia-tion heat transfer is illustrated in Figure 5. Here, moderateshelf temperature and chamber pressure conditions of –25°Cand 100 mTorr are used for a medium-resistance (Rps =4.3 cm2.Torr.hr.g–1) material at a fill depth of 7.5 mm. Lowresistance (Rps = 2.5 cm2.Torr.hr.g–1) and high resistance(Rps = 7.7 cm2.Torr.hr.g–1) are considered in the follow-ing examples. A 3-fold increase in Kv leads to a nearly60% decrease in primary drying time and a corresponding6-degree increase in product temperature. Figure 6 showsthe effect of a change in shelf temperature that could arisefrom the presence of “hot” or “cold” spots. Shelf surfacetemperature variations can lead to significant differences inprimary drying time, especially in high-resistance materials.For a material of medium resistance, a 5-degree decrease in
shelf temperature from the set point (–25°C) can lead to anincrease in primary drying time of nearly 15 hours, whichobviously would necessitate significant process modifica-tion. Figure 7 shows the effect of a change in product re-sistance (arising from a change in the degree of supercooling)on the primary drying time for low- and high-resistancematerials. From this plot, one can obtain an estimate of thedifference in primary drying time due to a difference in theresistance that could occur because of a change in the degreeof supercooling. In our previous study,8 we determined thata change of 5 degrees in supercooling leads to approxi-mately a 20% change in product resistance, which results inmodest but significant (ie, 5%-10%) changes in primarydrying time (Figure 7). Calculations of this kind are usefulsince changes in degree of supercooling do occur betweenlaboratory and manufacturing cycles and a knowledge of theimpact of this change on the freeze-drying cycle would bevital when transferring the lyophilization cycle.
Figure 5. Effect of variation in heat transfer coefficient (Kv) onthe product temperature (closed diamonds) and primary dryingtime (closed triangles). The shelf temperature and chamberpressure are –25ºC and 100 mTorr, respectively. The resistancewas medium. Pridry indicates primary drying.
Figure 6. Effect of variation in shelf surface temperature onthe primary drying time for a low-resistance (left bar), medium-resistance (middle bar), and high-resistance (right bar) product.Numbers on bar charts represent primary drying producttemperatures.
Figure 7. Effect of change in product resistance on theprimary drying time for a low-resistance (solid gray) andhigh-resistance (solid black) product.
^
^
^
^
^
^
AAPS PharmSciTech 2006; 7 (2) Article 39 (http://www.aapspharmscitech.org).
E9

CONCLUSIONS
OQ data obtained from sublimation tests may be used to testthe performance of lyophilizers under conditions of knownthermal load and provide the data needed to ensure equiva-lence of freeze-drying cycles from one freeze dryer to another.Given the different performance factors between dryers, sim-ple steady-state heat and mass transfer equations may be usedto estimate the effect of dryer variations on the lyophilizationcycle, particularly the primary drying time and the producttemperature during primary drying. Such theoretical calcula-tions are extremely important in both the optimization of thefreeze-drying process and scale-up of the laboratory processinto manufacturing.
ACKNOWLEDGMENTS
The authors would like to thank Ernesto Renzi and MikeStella at BOC Edwards Inc (Tonawanda, NY) for their helpwith OQ tests on the production freeze dryer. Madhav Kamatand Myron Ludzinski at Bristol Myers Squibb (Parsippany,NJ) are acknowledged for their assistance with the sublima-tion tests on the pilot freeze dryer. This project was fundedby a grant from the National Science Foundation’s Center forPharmaceutical Processing Research.
REFERENCES
1. Rambhatla S, Pikal MJ. Heat and mass transfer issues in freeze-dryingprocess development. In: Borchardt RT, Middaugh CR, eds. Biotech-nology: Pharmaceutical Aspects. Vol 2. Lyophilizationof Biopharmaceuticals. Arlington, VA: AAPS Press; 2004:75Y109.
2. Pikal MJ. Use of laboratory data in freeze drying process design: heatand mass transfer coefficients and the computer simulation of freezedrying. J Parenter Sci Technol. 1985;39:115Y139.
3. Pikal MJ, Roy ML, Shah S. Mass and heat transfer in vial freeze-drying of pharmaceuticals: role of the vial. J Pharm Sci. 1984;73:1224Y1237.
4. Incropera FP, Dewitt DP. Introduction to Heat Transfer. New York,NY: John Wiley & Sons; 1990.
5. Kobayashi M. Development of new refrigeration system andoptimum geometry of the vapor condenser for pharmaceutical freezedryers. In: Toei R, Mujumdar A, eds. Proceedings of the 4th InternationalDrying Symposium; July 9-12, 1984; Kyoto, Japan; 2:464Y471.
6. Liapis AI, Pikal MJ, Bruttini R. Research and development needsand opportunities in freeze drying. Drying Technol. 1996;14:1265Y1300.
7. Rambhatla S, Pikal MJ. Heat and mass transfer scale up issuesduring freeze drying, I: atypical radiation and the edge-vial effect.AAPS PharmSciTech. 2003;4:e14.
8. Rambhatla S, Ramot R, Bhugra C, Pikal MJ. Heat and masstransfer scale up issues during freeze drying, II: control andcharacterization of the degree of supercooling. AAPS PharmSciTech.2004;5:e58.
AAPS PharmSciTech 2006; 7 (2) Article 39 (http://www.aapspharmscitech.org).
E10
Related Documents