International Journal of Cardiology 84 (2002) 141–151 www.elsevier.com / locate / ijcard Heart rate variability before the onset of ventricular tachycardia: differences between slow and fast arrhythmias a, b a a c * ¨ Udo Meyerfeldt , Niels Wessel , Henry Schutt , Daniela Selbig , Agnes Schumann , c b b a a ¨ Andreas Voss , Jurgen Kurths , Christine Ziehmann , Rainer Dietz , Alexander Schirdewan a ´ HELIOS Klinikum Berlin, Franz-Volhard-Hospital, Charite, Humboldt-University, Wiltbergstrasse 50, D-13125 Berlin, Germany b University of Potsdam, Potsdam, Germany c University of Applied Sciences, Jena, Germany Received 8 June 2001; received in revised form 1 February 2002; accepted 5 March 2002 Abstract Background: We tested whether or not heart rate variability (HRV) changes can serve as early signs of ventricular tachycardia (VT) and predict slow and fast VT in patients with an implantable cardioverter defibrillator (ICD). Methods and results: We studied the ICD stored 1000 beat-to-beat intervals before the onset of VT (131 episodes) and during a control time without VT (74 series) in 63 chronic heart failure ICD patients. Standard HRV parameters as well as two nonlinear parameters, namely ‘Polvar10’ from symbolic dynamics and the finite time growth rates ‘Fitgra9’ were calculated. Comparing the control and the VT series, no linear HRV parameter showed a significant difference. The nonlinear parameters detected a significant increase in short phases with low variability before the onset of VT (for time series with less than 10% ectopy, P,0.05). Subdividing VT into fast (cycle length #270 ms) and slow (.270 ms) events, we found that the onset of slow VT was characterized by a significant increase in heart rate, whereas fast VT was triggered during decreased heart rates, compared to the control series. Conclusions: Our data may permit the development of automatic ICD algorithms based on nonlinear dynamic HRV parameters to predict VT before it starts. Furthermore, they may facilitate improved prevention strategies. 2002 Elsevier Science Ireland Ltd. All rights reserved. Keywords: Autonomic nervous system; Defibrillator; Ventricular tachycardia; Heart rate variability 1. Introduction natural history of spontaneous VT. Previous VT studies depended on randomly recorded episodes Implantable cardioverter defibrillators (ICD) are a during Holter monitoring. These studies captured safe and effective treatment for ventricular tachycar- only relatively small numbers of VT episodes from dia (VT) [1–4]. Third generation ICD offer not only patients with various heart diseases [8–10]. In con- important advances in arrhythmia treatment, but also trast, ICD studies have examined the electrocar- permit the correct characterization of the rhythm diographic initiating patterns, especially the occur- leading to intervention [5–7]. This feature has been rence of premature beats and special beat sequences extremely helpful in systematically investigating the [11–17]. These studies were based on short-term intracardiac ICD electrocardiogram storage. Newer ICD systems offer not only a short-term intracardiac *Corresponding author. Tel.: 149-30-9417-2443; fax: 149-30-9417- electrocardiogram, but also an RR-interval memory 2466. E-mail address: [email protected] (U. Meyerfeldt). up to 1024 consecutive beat-to-beat intervals before 0167-5273 / 02 / $ – see front matter 2002 Elsevier Science Ireland Ltd. All rights reserved. PII: S0167-5273(02)00139-0

Welcome message from author
This document is posted to help you gain knowledge. Please leave a comment to let me know what you think about it! Share it to your friends and learn new things together.
Transcript
International Journal of Cardiology 84 (2002) 141–151www.elsevier.com/ locate/ ijcard
H eart rate variability before the onset of ventricular tachycardia:differences between slow and fast arrhythmias
a , b a a c* ¨Udo Meyerfeldt , Niels Wessel , Henry Schutt , Daniela Selbig , Agnes Schumann ,c b b a a¨Andreas Voss , Jurgen Kurths , Christine Ziehmann , Rainer Dietz , Alexander Schirdewan
a ´HELIOS Klinikum Berlin, Franz-Volhard-Hospital, Charite, Humboldt-University, Wiltbergstrasse 50, D-13125 Berlin, GermanybUniversity of Potsdam, Potsdam, Germany
cUniversity of Applied Sciences, Jena, Germany
Received 8 June 2001; received in revised form 1 February 2002; accepted 5 March 2002
Abstract
Background: We tested whether or not heart rate variability (HRV) changes can serve as early signs of ventricular tachycardia (VT)and predict slow and fast VT in patients with an implantable cardioverter defibrillator (ICD).Methods and results: We studied the ICDstored 1000 beat-to-beat intervals before the onset of VT (131 episodes) and during a control time without VT (74 series) in 63 chronicheart failure ICD patients. Standard HRV parameters as well as two nonlinear parameters, namely ‘Polvar10’ from symbolic dynamics andthe finite time growth rates ‘Fitgra9’ were calculated. Comparing the control and the VT series, no linear HRV parameter showed asignificant difference. The nonlinear parameters detected a significant increase in short phases with low variability before the onset of VT(for time series with less than 10% ectopy,P,0.05). Subdividing VT into fast (cycle length#270 ms) and slow (.270 ms) events, wefound that the onset of slow VT was characterized by a significant increase in heart rate, whereas fast VT was triggered during decreasedheart rates, compared to the control series.Conclusions: Our data may permit the development of automatic ICD algorithms based onnonlinear dynamic HRV parameters to predict VT before it starts. Furthermore, they may facilitate improved prevention strategies. 2002 Elsevier Science Ireland Ltd. All rights reserved.
Keywords: Autonomic nervous system; Defibrillator; Ventricular tachycardia; Heart rate variability
1 . Introduction natural history of spontaneous VT. Previous VTstudies depended on randomly recorded episodes
Implantable cardioverter defibrillators (ICD) are a during Holter monitoring. These studies capturedsafe and effective treatment for ventricular tachycar- only relatively small numbers of VT episodes fromdia (VT) [1–4]. Third generation ICD offer not only patients with various heart diseases [8–10]. In con-important advances in arrhythmia treatment, but also trast, ICD studies have examined the electrocar-permit the correct characterization of the rhythm diographic initiating patterns, especially the occur-leading to intervention [5–7]. This feature has been rence of premature beats and special beat sequencesextremely helpful in systematically investigating the [11–17]. These studies were based on short-term
intracardiac ICD electrocardiogram storage. NewerICD systems offer not only a short-term intracardiac
*Corresponding author. Tel.:149-30-9417-2443; fax:149-30-9417-electrocardiogram, but also an RR-interval memory2466.
E-mail address: [email protected](U. Meyerfeldt). up to 1024 consecutive beat-to-beat intervals before
0167-5273/02/$ – see front matter 2002 Elsevier Science Ireland Ltd. All rights reserved.PI I : S0167-5273( 02 )00139-0

142 U. Meyerfeldt et al. / International Journal of Cardiology 84 (2002) 141–151
Table 1the start of VT. This feature allows a heart rateCharacteristics of the patients (mean6S.D.)variability (HRV) analysis of many spontaneous VTGenderepisodes to estimate the influence of the autonomicMale 55
nervous system on the origin of VT. Autonomic Female 8nervous system tone has a significant bearing on VT
Age (years) 58612development [18–24]. The hypothesis of our study Range (42–73)was that VT can be predicted by RR-interval analy-
Heart diseasesis. By identification of specific RR-interval triggerCAD 48 (76%)
patterns, we assumed it may be possible to identify DCM 11 (18%)specific VT predictors in patients with an ICD for HTN 4 (6%)
new preventative strategies. We therefore calculatedLVEF 36614%Range (15–45%)different linear and nonlinear HRV parameters from
ICD stored VT episodes [17,25–28]. A new promis-AA drugs
ing approach for the estimation of autonomic tone, Metoprolol 39 (85%)the heart rate turbulence [29], is beyond the scope ofClass I or II 0
our paper—it requires a greater amount of data.ICD indicationMVT 56 (79%)VF 7 (11%)
CAD, coronary heart disease; DCM, dilated cardiomyopathy; HTN,2 . Methodshypertensive heart disease; LVEF, left ventricular ejection fraction; AA,antiarrhythmic drugs; ICD, implantable cardiac defibrillator; MVT,multiple ventricular tachycardias; VF, ventricular fibrillation.2 .1. Patients
We studied the ICD stored beat-to-beat intervals intervals prior to a sustained VT as well as a controlbefore the onset of 131 VT episodes and at 74 control tachogram from the same patient. To subdivide theintervals without VT in 63 ICD patients of the Franz- VT episodes into slow and fast arrhythmias we usedVolhard-Hospital with severe congestive heart failure. the cut-off point of 270 ms. At this cycle length theNo patient had received a class I or class III efficacy of antitachycardia stimulation is low and theantiarrhythmic drug for 1869 months prior to the differentiation between monomorphic and polymor-study. The patient characteristics are shown in Table phic VT by a stored bipolar or farfield electrocar-1. The patients underwent implantation of an ICD diogram is not always possible.(PCD 7220/7221, Medtronic) capable of storing atleast 1024 beat-to-beat intervals prior to onset of VT 2 .2. Standard heart rate variability analysis(10-ms resolution), which corresponds to about 15min. We analyzed the time series just before the onset To detect early signs of life-threatening VT, weof VT and at an arbitrarily selected control period applied a multiparametric analysis. Before startingwithout an arrhythmic event stored just before a the analysis, ventricular premature beats and artifactsregular ICD follow-up examination. Time series usually should be removed from the time series toincluding more than one episode of nonsustained VT, construct the so-called ‘normal-to-normal’ beat timeepisode of induced VT, ventricular pacing, or more series (NN). We used the adaptive filtering algorithmthan 10% of ventricular premature beats are excluded [30] for preprocessing of the data. The followingfrom the analysis. To estimate the amount of ven- standard HRV parameters from time domain [25]tricular premature beats we use an adaptive filtering were calculated from all corrected and from thealgorithm for preprocessing, which tends to be su- original unfiltered time series: the mean beat-to-beatperior to standard algorithms [30]. The beat-to-beat interval of the time series (meanNN), the standardintervals of the VT at the end of the time series were deviation (sdNN), the percentage of beat-to-beatremoved from the tachograms so that we analyzed interval differences greater than 50 ms (pNN50), andonly the dynamics occurring immediately prior to VT. the root mean square of successive beat-to-beat
Fig. 1 shows an example of 1000 beat-to-beat interval differences (rmssd). In addition, the standard

U. Meyerfeldt et al. / International Journal of Cardiology 84 (2002) 141–151 143
Fig. 1. One thousand beat-to-beat intervals before a sustained VT (below) and the respective control time series (above) from the same patient. For HRVanalysis, all beat-to-beat intervals of the VT itself at the end of time series are removed from the tachograms.
parameters (VLF, LF, HF, and P) were calculated the time series, we present the following nonlinearfrom the frequency domain [25]. VLF represents the concepts of symbolic dynamics and the finite-timepower in the frequency band from 0.0033 to 0.04 Hz, growth rates outlined below.LF is the power from 0.04 to 0.15 Hz, HF representsthe power from 0.15 to 0.4 Hz, and P denotes the 2 .3. Symbolic dynamicstotal power from 0.0033 to 0.4 Hz. The spectra wereestimated using a fast Fourier transformation. To Heart rate variability reflects the complex interac-avoid any ‘leakage’ effect, a Blackman Harris win- tions of many different control loops of the car-dow function was applied. The following ratios were diovascular system. With regard to the complexity ofincluded in the analysis: VLF/P, HF/P, and LF/HF, the sinus node activity modulation system, a moreas well as LFn the normalized low frequency band. predominantly nonlinear behavior must be assumed.These standard parameters of HRV analysis are based In this way, the detailed description and classificationon linear techniques. To classify dynamic changes in of dynamic changes using time and frequency mea-

144 U. Meyerfeldt et al. / International Journal of Cardiology 84 (2002) 141–151
¯sures is often not sufficient. Therefore, we introduced nearest neighborX of the situationX in the recon-k k
methods derived from symbolic dynamics to dis- structed space and observes how these two trajec-tinguish between different states of the autonomic tories diverge in time [17]. From the original distanceinteractions [26,27]. The first step is the transforma- of both states and the distance of the evolved states
T T¯tion of the time series into symbol sequences with X and X after T steps, we calculate the finite-timek k(n,t,T )symbols from a given alphabet. Some details are lost growth ratel :k
in this process; however, the advantage is that theT T¯iX 2X i1 k kcoarse dynamic behavior can be analyzed. The pa- (n,t,T )
] ]]]]l 5 ln , k 50, . . . ,N 2 (n 2 1)tk ¯Trameter used, Polvar10 (Probability of low vari- iX 2X ik k
ability, 10 ms difference), characterizes short phaseswheren is the embedding dimension andt the delay.of low variability from successive symbols of aThis value quantifies the local short-term predictabili-simple alphabet, consisting of only the symbols 0 andty for each situation or pointX . If the values arek1, where 0 stands for a small difference of less thanpositive, the distances increase with time and the10 ms between two successive RR-intervals (10 ms isstate is unstable. The larger the values, the lessthe resolution of the defibrillators used in this study),predictable is the situation. Negative values reflectand where 1 represent cases when the differencehighly predictable situations. As we have a value ofbetween two successive RR-intervals exceeds this (n,t,T )l for eachX from the original time series wek klimit, specifically given the time seriesx , x , . . . , x (n,t,T )1 2 N can derive a growth rate time seriesl . Averag-kone obtains the symbol seriessn (n,t,T )ing over k leads to the average growth ratelwhich quantifies a global short-term predictability.1: ux 2 x u$ 10 msn n21s 5Hn We determined the rate of growth from the average0: ux 2 x u, 10 msn n21behavior of the five nearest neighbors to reduce noise
Words consisting of the unique symbols all 0 or all effects. The embedding dimension is 9 and the delay1 were counted. To obtain a statistically robust time is 1, i.e. a state is defined by nine consecutiveestimate of the word distribution, we restricted our- values of the time series. The average finite timeselves to the 64 words defined by six consecutive growth rate for an evolution timeT 5 1 is denoted assymbols. Polvar10 represents the probability of the Fitgra9 (Finite time growth rates, dimension9). Forword 000000 occurring and thus detects even inter- heart rate time series, this parameter can be inter-mittently decreased HRV. We introduced this parame- preted as a measure of regularity. The smaller thister with the knowledge that a decreased HRV is a risk value, the larger is the number of epochs with regularmarker in cardiac patients [25]. The standard parame-or predictable short-term dynamics in the HRV timeters of HRV analysis such as sdNN and rmssd are notseries indicating a loss of short-term variability.able to detect short phases with a decreased HRV.
2 .5. Statistical analysis
2 .4. Finite time growth ratesWe calculated the parameters described in the
previous sections for both the VT and the control timeA second approach to characterize dynamic be-series and then tested for equality of the averagedhavior is the finite time growth rates which arevalues obtained from both groups. The statisticalderived from the concept of Lyapunov exponentsanalysis was based on the two-tailedt-test as well as[31,32]. For the calculation of the growth rates, thethe nonparametric Mann–WhitneyU-test.state of the system is reconstructed using delay
coordinates [33]. In this space, the actual dynamicbehavior can be represented by a point and the timeevolution of the system by a trajectory. To analyze 3 . Resultsthe stability or predictability of a current situationover a given durationT, its time evolution is com- We observed 131 VT episodes and 74 controlpared with the time evolution of the closest analogous series in 63 patients. Sixty-four VT episodes and 27situations found in the past, namely, one searches thecontrol series were not included because of atrial

U. Meyerfeldt et al. / International Journal of Cardiology 84 (2002) 141–151 145
Table 2 length was 310653 ms. Comparing the HRV parame-Summary of 47 control series compared to 67 VT time series ters of all 67 VT and 47 control time series, only the
Control VT P-value mean sinus rhythm cycle length showed differences,n547 n567
the time series leading to VT had a significantlymeanNN filtered 760.816140.22 694.436138.09 ,0.01 shorter cycle length (meanNN 694.46138.1 ms), thanmeanNN unfiltered 760.966139.92 693.926138.37 ,0.01
the control time series (meanNN 760.86140.2 ms).Ectopy time (s) 68.2698.1 96.06129.9 n.s.Ectopy time (%) 9 14 n.s. The ectopy time, calculated as the sum of theVT cycle length 309.6652.50 coupling interval and the following pause of all
n.s., not significant,P$0.05. premature beats, did not differ between the VT andcontrol time series. The ectopy time of the VT group
fibrillation, permanent pacing, incessant VT, incom- was 96.06129.9 s according to 14% of all 1024plete storage of episodes, or storage artifacts. The beat-to-beat intervals and 68.2698.1 s, according toremaining 67 VT episodes and 47 control series from 9% of the control time series (P.0.05). These results46 patients comprise the report. The mean VT cycle are summarized in Table 2.
Fig. 2. One thousand beat-to-beat intervals before a VT time series with many ventricular premature beats (above lined, below dotted). When more than10% ventricular premature beats are present, or when artifacts are abundant, all filtering procedures fail [30]. No useful HRV parameter of the sinus rhythmcan be determined in these cases and only the mean heart rate provides a hint of sympathetic activity.
146 U. Meyerfeldt et al. / International Journal of Cardiology 84 (2002) 141–151
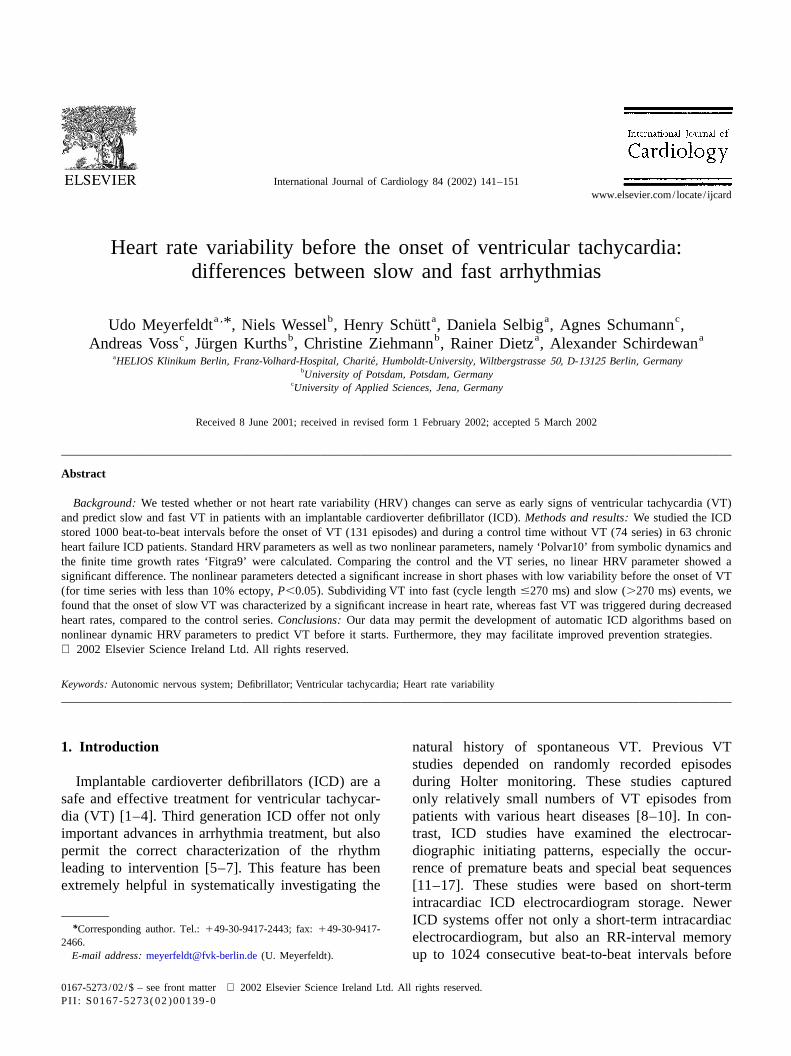
Table 3 time growth rates, showed significant differencesThe results of 34 control and 36 VT filtered time series, with less than between VT (Polvar1050.1360.17, Fitgra9510% premature beats
0.1460.04, P-value for Polvar10,0.05) and controlControl VT P-value
(Polvar1050.0560.05, Fitgra950.1760.06, P-valuen534 n536for Fitgra9,0.05) time series.
meanNN 731.736122.24 683.326157.24 n.s.We were next interested if there were RR-intervalsdNN 49.00625.13 49.09635.83 n.s.
pNN50 0.01860.022 0.01460.025 n.s. behavior differences between slow and fast VT andrmssd 16.5068.37 13.7467.79 n.s. their corresponding control time series. The subdivi-VLF/P 0.5260.17 0.5460.15 n.s.
sion was made by the VT cycle length, namely aLH/HF 3.2861.54 3.9364.02 n.s.HF/P 0.0460.04 0.0560.04 n.s. 270-ms cut-off point. All VT episodes with a cycleLFn 0.7360.12 0.7260.15 n.s. length#270 ms were defined as potentially fatal VT.Polvar10 0.0560.05 0.1360.17 ,0.05 We had 48 slow VT episodes with 35 correspondingFitgra9 0.1760.06 0.1460.04 ,0.05
control time series and 19 fast VT episodes and 17n.s., not significant,P$0.05.
corresponding control time series. Amongst thesetime series were 25 slow VT episodes and 21
Recent studies demonstrated the circadian rhythm corresponding control time series as well 11 fast VTof HRV, it could be shown that this diurnal rhythm is time series and their 13 control time series which hadmore marked in the healthy population and in the low ,10% premature ventricular beats. These latter timerisk group than in high-risk patients [34]. The data series were used for further analyses. In the filteredwe analyzed were recorded from a high risk group, time series comparisons, the slow VT were precededtherefore, the circadian variations should not have a by a significantly shorter sinus rhythm cycle lengthsignificant influence in our analysis. All control data (665.76137.8 ms) than their corresponding controlssets were stored just before a regular ICD follow up (771.16154.3 ms,P,0.01). The traditional linearexamination in the day time from 08:10 h to 16:48 h, HRV parameters of the slow VT time series and theirthe mean follow-up time was at 11:51 h. The VT controls did not show significant differences (exceptevents range from 00:02 h to 23:45 h, with the mean meanNN, see Table 4). However, the nonlineartime of 12:35 h. More than 64% of all VT episodes parameters Polvar10 and Fitgra9 revealed significantoccurred in the day time between 08:00 h and 20:00 differences as shown in Table 4.h. Even though 36% of the tachyarrhythmias hap- The fast VT episodes were preceded by an in-pened at night the mean beat-to-beat interval before creased sinus rhythm cycle length (828.06169.4 ms),an VT event was significantly shorter. However, one compared to the control time series (650.96136.1).would expect that at night it would be larger and thus However, the HRV analysis did not indicate anyit seems to be that the circadian variation is not significant difference. The nonlinear parametersrelevant in our study.
Since the filter methods in time series with a large Table 4number of premature beats are relatively ineffective, Filtered time series of VT cycle length.270 ms and their controls with
less than 10% ventricular premature beatsas compared in Fig. 2, we calculated the HRVparameters in a second step for 36 VT and 34 control Control VT P-value
n521 n525time series with less than 10% of premature beats, asmeanNN 771.356154.30 665.686137.81 ,0.01given in Table 3. The difference in the mean cyclesdNN 57.13634.19 49.39637.47 n.s.length of the VT time series (meanNN 683.36157.2pNN50 0.0460.11 0.0160.03 n.s.
ms) and the control time series (meanNN rmssd 21.18621.51 12.9869.22 n.s.731.76122.2 ms) were only apparent as a trend. The VLF/P 0.3060.24 0.2660.21 n.s.
LH/HF 3.4561.37 3.9464.27 n.s.other time and frequency domain HRV parametersHF/P 0.0560.05 0.0560.04 n.s.showed no significant differences between VT and LFn 0.7660.06 0.7360.13 n.s.
control time series. However, the parameters of Polvar10 0.0460.05 0.1360.18 ,0.05Fitgra9 0.1660.06 0.1360.04 ,0.05nonlinear HRV analysis Polvar10, characterizing
short phases of low variability, and Fitgra9, the finite- n.s., not significant,P$0.05.
U. Meyerfeldt et al. / International Journal of Cardiology 84 (2002) 141–151 147
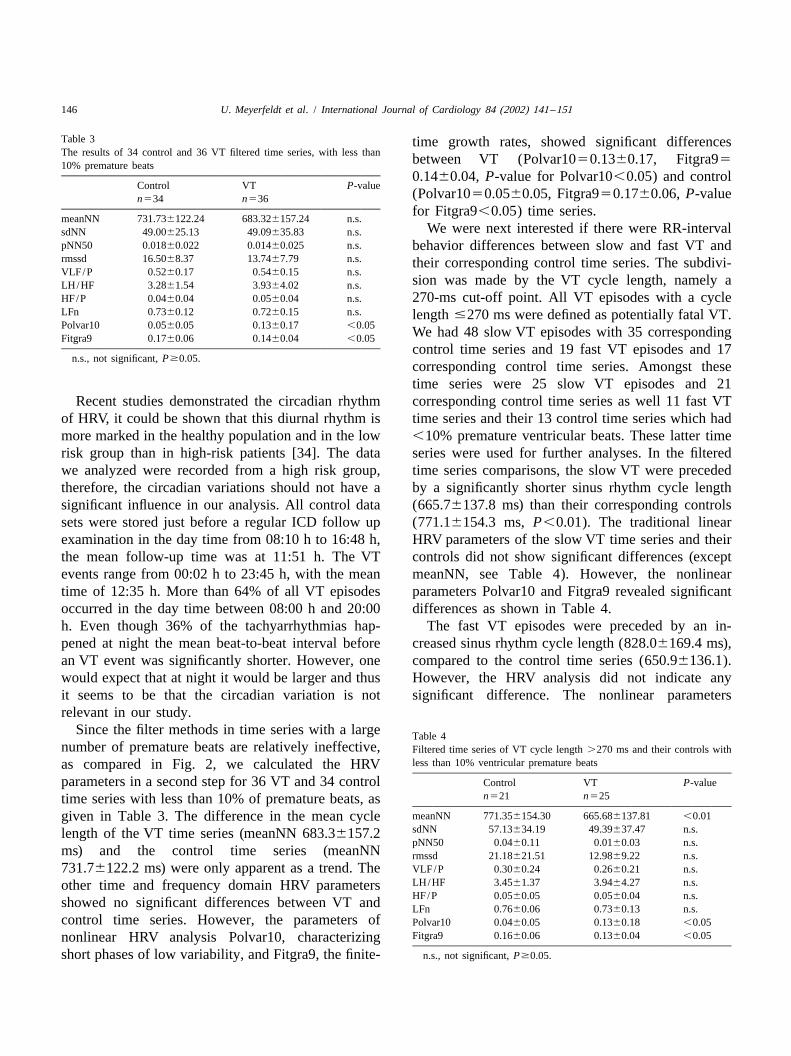
Table 5 Polvar10 and Fitgra9 had similar numeric differencesComparison of filtered VT time series#270 ms cycle length and.270 as the fast VT time series. The small group sizesms cycle length; 25 series with VT.270 ms versus 11 VT series with
were likely responsible for the failure to identify#270 ms
statistical significance.VT CL.270 ms VT CL#270 ms P-valuen525 n511 The contrast between slow and fast VT time series
becomes more clear by a direct comparison as shownmeanNN 665.686137.81 828.046169.44 ,0.05sdNN 49.39637.47 73.62650.91 n.s. in Table 5. Whereas the slow VT episodes werepNN50 0.0160.03 0.0560.04 ,0.05 preceded by an increase in heart rate indicated by thermssd 12.9869.22 22.56611.80 ,0.05
shorter cycle length (665.76137.8 ms), the fast VTVLF/P 0.2660.21 0.5560.08 n.s.LH/HF 3.9464.27 4.9062.80 n.s. episodes were triggered during significant slowerHF/P 0.0560.04 0.0460.03 n.s. heart rates (828.06169.4 ms,P,0.05). Fig. 3 showsLFn 0.7360.13 0.7860.14 n.s. the 1-min-averaged beat-to-beat intervals before thePolvar10 0.1360.18 0.0860.18 ,0.05
onset of VT for both groups. The averaged beat-to-Fitgra9 0.1360.04 0.1360.03 n.s.
beat interval for the slow VT group decreases 2 minn.s., not significantP$0.05.
Fig. 3. The averaged 1-min beat-to-beat intervals for the slow and the fast VT group. The values of the fast VT group are significantly higher compared tothe beat-to-beat intervals in the slow VT group. Moreover, there is a clear trend for an increase in heart rate from minute 9 to 1 in the slow VT group.

148 U. Meyerfeldt et al. / International Journal of Cardiology 84 (2002) 141–151
Fig. 4. Two representative VT episodes. The upper time series shows the development to a slow VT. The heart rate increased and the HRV decreased. Incontrast, the lower time series demonstrates the evolution to a fast and potentially fatal VT. No changes in heart rate are visible before the onset of VT.
before the onset of VT whereas it remains constant [35,36]. Our data confirm these results, however, weon a higher level for the fast VT group. There were could not find a difference in diurnal variationalso significant differences in other HRV parameter between the slow and the fast VTs. The slow VTsanalysis detected by the pNN50, rmssd and Polvar10 occurred between 00:02 h and 23:45 h with a mean(P,0.05). Fig. 4 demonstrates the basic principle. time of 12:37 h, whereas the fast VTs happenedThe slow VT develops from a sinus arrhythmia while between 02:12 h and 21:23 h with a mean time ofthe fast VT shows no heart rate increase prior to 12:30 h. The percentage of daytime VTs (from 08:00onset. h to 20:00 h) was 62% in the slow and 69% in the
Beside the circadian rhythm of HRV there is also a fast VT group. Since we have more fast VTs in thecircadian pattern of ventricular tachyarrhythmias. The day time we would expect to have a higher heart rateincidence of VT is higher in the morning hours and before such events. However, as shown in Table 5,the afternoon than in the sleeping time at night the mean heart rate is significantly slower in the fast

U. Meyerfeldt et al. / International Journal of Cardiology 84 (2002) 141–151 149
VT group. Thus, it seems to be that the differences bias. However, we could show that there is seeminglyfound between the slow and the fast VT group were no influence from circadian variation of HRV.not due to circadian variation of VT occurrence. Another important finding in our study was the
Finally, to validate the results obtained above we significant RR-interval difference before the onset ofcarried out a validation paired statistical analysis, slow and fast VT. The onset of slow VT waswhich considered only one VT and the respective characterized by a significant increase in heart rate,control series. The results in Table 2 were confirmed; compared to the corresponding control time series.the differences in mean heart rate remained signifi- By estimating the linear HRV parameters, there werecant (P,0.05). The same proved true for the data in no differences between the slow VT and control timeTable 3; the significant differences for Polvar10 series. However, by the methods of nonlinear HRVincreased toP50.03. TheP-value for Fitgra9 was analysis with the Polvar10 and the Fitgra9, we were0.05. Comparing slow VT episodes and their controls able to identify significant differences in the data sets.given in Table 4, the significant differences for In contrast, the time series before fast VT showed ameanNN, Polvar10, and Fitgra9 were confirmed as different behavior. The fast VT episodes were trig-trends (P50.07,P50.06, andP50.10, respectively). gered during decreased heart rates, compared to theWhen we compared the VT and the control series of control time series. This finding was not significant;fast VT, no significant differences were found (not however, it was a recognizable trend. The standardshown here). From Table 5, only the significant HRV parameters also showed no significant differ-differences in meanNN were confirmed as a trend ences. The nonlinear parameters had the same results(P50.06). as the slow VT results, but the differences were not
significant because of the small group sizes. Theopposing effects of the autonomic nervous systemprior to fast and slow VT episodes were more evident
4 . Discussion by the direct comparison of the triggering time series.There were significant differences prior to VT as well
We identified significant differences in the dynamic in the standard parameters meanNN, pNN50 andbehavior of beat-to-beat intervals between the VT and rmssd as in the nonlinear parameter Polvar10.control time series by means of nonlinear dynamics. In our study, we could confirm the circadianThe parameters Polvar10 and Fitgra9 reflect increased pattern of ventricular tachyarrhythmias. The inci-short phases with low variability in patients with dence of VT is higher during the day time than atcongestive heart failure. This result demonstrates that night [35,36]. However, we did not find a differencea loss of short-term variability precedes the onset of in diurnal variation between the slow and the fast
¨VT [17]. Similar findings were reported by Makikal- VTs. Thus, it seems to be that the above differenceslio and Skinner, who estimated other parameters of were not due to circadian variation of VT occurrence.nonlinear dynamics during Holter monitoring in post We assume that these differences illustrate amyocardial infarction patients [10,37]. In accord with different role of autonomic regulation prior to theother authors reporting HRV analyses before VT start of VT in both groups. Therefore, various typesduring Holter monitoring [8–10,38–42] and from of ventricular arrhythmias with a different risk forICD stored episodes [20], we could not find signifi- sudden death may have been triggered during sig-cant differences in time or frequency domain parame- nificantly different activation states of the sympa-ters in our HRV analyses. The increase in heart rate thetic and vagal nervous systems. Whereas slow VTbefore the start of the VT described by Nemec et al. began during sympathetic activation, as identified by[20], Pruvot et al. [43] and Lombardi et al. [44] was significantly increased heart rate and decreased linearconfirmed in our data set (Table 2). parameters of heart variability prior to VT, the fast
It is well known that there is a circadian rhythm of arrhythmias were preceded by decreased heart rates.HRV [34]. Since all control data sets were stored in Both types of arrhythmias were triggered duringthe day time, the VT events however are distributed periods with increased short phases with low vari-over the whole day, one might expect an important ability. This result suggests that the myocardium

150 U. Meyerfeldt et al. / International Journal of Cardiology 84 (2002) 141–151
[2] Grimm W, Flores BT, Marchlinski FE. Shock occurrence andbecomes susceptible to VT by a more complexsurvival in 241 patients with implantable cardioverter-defibrillatormechanism dependent on variable neurohumoral reg- therapy. Circulation 1993;87:18880–8.
ulatory systems, rather than solely by sympathetic [3] Saksena S. (for the PCD Investigator Group). Clinical outcome ofpatients with malignant ventricular tachyarrhythmias and a multip-activation. Additional time-dependent modulatingrogrammable implantable cardioverter-defibrillator implanted withfactors seem to be involved in arrhythmogenesis,or without thoracotomy: An international multicenter study. J Am
particularly in the case of fast VT. Considering these Coll Cardiol 1994;23:1521–30.results, we noticed that all patients received the [4] The antiarrhythmic versus implantable defibrillators (AVID) inves-
tigators. A comparison of antiarrhythmic drug therapy with implant-currently available best medical therapy, especiallyable defibrillators in patients resuscitated from near fatal ventricularwith the high percentage of beta blockers and ACEarrhythmias. N Engl J Med 1997;337:1576–83.
inhibitors employed in our study. There were no [5] Marchlinski FE, Callans DJ, Gottlieb CD et al. Benefits and lessonsdifferences in medical therapy between patients with from stored electrogram information in implantable defibrillators. J
Cardiovasc Electrophysiol 1995;6:832–51.fast and slow VT. Despite the favorable effects of[6] Hook BG, Callans DJ, Kleiman RB et al. Implantable cardioverter-beta blockers on heart rate variability [45,46] it was
defibrillator therapy in the absence of significant symptoms. Circula-nonetheless possible to identify the periods preceding tion 1993;87:1897–906.life-threatening VT in a high risk patient group by the [7] Gronefeld GC, Mauss O, Li YG et al. Association between atrial
fibrillation and appropriate implantable cardioverter defibrillatordescribed methods of nonlinear dynamics. Moreover,therapy: results from a prospective study. J Cardiovasc Elec-our study demonstrated the advantage of using meth-trophysiol 2000;11:1208–14.
ods from nonlinear dynamics. Particularly, the evolu- [8] Leclercq JF, Coumel P. Lessons from recordings of sudden death bytion of points in phase space provided a deeper Holter monitoring. In: de Luna AB et al., editor, Sudden cardiac
death, Norwell, MA: Kluwer, 1991, pp. 99–111.insight into the dynamic aspects of rhythm regulation.[9] Makikallio TH, Koistinen J, Jordaens L et al. Heart Rate DynamicsThe limitations of our study were the relatively small
before spontaneous onset of ventricular fibrillation in patients withnumber of time series and the subsequently limited healed myocardial infarcts. Am J Cardiol 1999;83:880–4.statistical analysis in terms of subdivisions con- [10] Berger MD, Waxman HL, Buxton AE et al. Spontaneous compared
with induced onset of ventricular tachycardia. Circulationcerning age, sex, and heart disease. Thus, these1988;78P:885–92.results must be validated with a larger data base. The
[11] Marchlinski FE, Schwartzman D, Gottlieb CD et al. Electricalfirst studies are now in progress to prevent VT by events associated with arrhythmia initiation and stimulation tech-atrioventricular stimulation to shorten the pause after niques for arrhythmia prevention. In: Zipes DP, Jalife J, editors,
Cardiac electrophysiology: from cell to bedside, 2nd ed., Philadel-premature beats [47]. Moreover, heart rate dynamicsphia, PA: W.B. Saunders, 1995, pp. 863–77.prior to VT onset in terms of drug treatment are
[12] Roelke M, Garan H, McGovern BA et al. Analysis of the initiationcurrently being investigated [43]. Our data offer the of spontaneous monomorphic ventricular tachycardia by stored
intracardiac electrograms. J Am Coll Cardiol 1994;23:117–22.possibility of developing automatic ICD algorithms[13] Meyerfeldt U, Schirdewan A, Wiedemann M et al. The mode ofbased on nonlinear dynamic HRV parameters. This
onset of ventricular tachycardia. A patient-specific phenomenon. Eurapproach may permit the automatic short-term predic- Heart J 1997;18:1956–65.tion of VT and the initiation of earlier modes of [14] Leenhardt A, Maison-Blanche P, Denjoy I et al. Mechanisms of
spontaneous initiation of tachycardias. Arch Mal Coeur Vaissprevention.1999;92:17–22.
[15] Capucci A, Villani GQ, Groppi F et al. Comparison of therapydetection times between implantable cardioverter defibrillators withstandard dual- and single-chamber pacing. J Interv Card Elec-A cknowledgementstrophysiol 1999;3:329–33.
[16] Saeed M, Link MS, Mahapatra S et al. Analysis at intracardiacThis work was supported by grants from the electrograms showing monomorphic ventricular tachycardia in
Federal Ministry of Education, Science, Research and patients with implantable defibrillators. Am J Cardiol 2000;85:580–7.Technology BMBF (13N7113/5) and the Deutsche
[17] Wessel N, Ziehmann C, Kurths J et al. Short-term forecasting ofForschungsgemeinschaft DFG (vo505-2/1). life-threatening cardiac arrhythmias based on symbolic dynamicsand finite-time growth rates. Phys Rev E 2000;61:733–9.
[18] Schwartz PJ, La Rovere MT, Vanoli E. Autonomic nervous systemand sudden cardiac death. Circulation 1992;85:I77–91.R eferences
[19] Myerburg RJ, Kessler KM, Castellanos A. Sudden cardiac death:Structure, function and time dependence of risk. Circulation1992;85:I2–I10.[1] Mirowski M, Reid PR, Mower MM et al. Termination of malignant
ventricular tachyarrhythmias with an implanted automatic defibril- [20] Nemec J, Hammill SC, Shen WK. Increase in heart rates precedeslator in human beings. N Engl J Med 1980;303:322–4. episodes of ventricular tachycardia and ventricular fibrillation in

U. Meyerfeldt et al. / International Journal of Cardiology 84 (2002) 141–151 151
patients with implantable cardioverter defibrillators. Pacing Clin [36] Behrens S, Galecka M, Bruggemann T et al. Circadian variation ofElectrophysiol 1999;22:1729–38. sustained ventricular tachyarrhythmias terminated by appropriate
[21] Mani V, Wu X, Wood M et al. Variation of power immediately prior shocks in patients with an implantable cardioverter defibrillator. Amto spontaneous onset of ventricular fibrillation in patients with Heart J 1995;130:79–84.implantable cardioverter defibrillators. J Cardiovasc Electrophysiol [37] Skinner JE, Pratt CM, Vybiral T. A reduction in the correlation1999;10:1586–96. dimension of heart beat intervals precedes imminent ventricular
[22] Schubert B, Van Dongen AM, Kirsch GE et al. Beta-adrenergic arrhythmias. Am Heart J 1993;125:731–43.inhibition of cardiac sodium channels by dual G-protein pathways. [38] Denes P, Gabster A, Huang SK. Clinical electrocardiographic andScience 1989;245:516–9. follow-up observations in patients having ventricular fibrillation
[23] Taylor E, Berger R, Hummel JD et al. Analysis of the pattern of during Holter monitoring. Role of quinidine therapy. Am J Cardiolinitiation of sustained ventricular arrhythmias in patients with 1981;48:9–16.implantable defibrillators. J Cardiovasc Electrophysiol 2000;11:719– [39] Huikuri HV, Valkama JO, Airaksinen KE et al. Frequency domain26. measures of heart variability before the onset of nonsustained and
[24] Wood MA, Ellenbogen KA. Initiation of spontaneous ventricular sustained ventricular tachycardia in patients with coronary arterytachycardia: from spark to fire. J Cardiovasc Electrophysiol disease. Circulation 1993;87:1220–8.2000;11:727–9. [40] Shusterman V, Aysin B, Gottipaty V et al. Autonomic nervous
[25] Task Force of the European Society of Cardiology and the North system activity and the spontaneous initiation of ventricular tachy-American Society of Pacing and Electrophysiology. Heart rate cardia. ESVEM Investigators. Electrophysiologic Study Versusvariability: standards of measurement, physiological interpretation Electrocardiographic Monitoring Trial. J Am Coll Cardioland clinical use. Circulation 1996;93:1043–65. 1998;32:1891–9.
[26] Kurths J, Voss A, Witt A et al. Quantitative analysis of heart rate [41] Huikuri HV, Seppanen T, Koistinen MJ et al. Abnormalities invariability. Chaos 1995;5:88–94. beat-to-beat dynamics of heart rate before the spontaneous onset of
[27] Glass L. Chaos and heart rate variability. J Cardiovasc Elec- life-threatening ventricular tachyarrhythmias in patients with priortrophysiol 1999;10:1358–60. myocardial infarction. Circulation 1996;93:1836–44.
[28] Voss A, Kurths J, Kleiner HJ et al. The application of methods of [42] Vybiral T, Glaeser DH, Goldberger AL et al. Conventional heart ratenon-linear dynamics for the improved and predictive recognition of variability analysis of ambulatory electrocardiographic recordingspatients threatened by sudden cardiac death. Cardiovasc Res fails to predict imminent ventricular fibrillation. J Am Coll Cardiol1996;31:419–33. 1993;22:557–65.
[29] Schmidt G, Malik M, Barthel P et al. Heart-rate turbulence after [43] Pruvot E, Thonet G,Vesin JM et al. Heart rate dynamics at the onsetventricular premature beats as a predictor of mortality after acute of ventricular tachyarrhythmias as retrieved from implantable car-myocardial infarction. Lancet 1999;353(9162):1390–6. dioverter-defibrillators in patients with coronary artery disease.
[30] Wessel N, Voss A, Malberg H et al. Nonlinear analysis of complex Circulation 2000;101:2398–404.phenomena in cardiological data. Herzschr Elektrophys [44] Lombardi F, Porta A, Marzegalli M et al. Heart rate variability2000;11(3):159–73. patterns before ventricular tachycardia onset in patients with an
[31] Oseledec VI. A multiplicative ergodic theorem. Ljapunov charac- implantable cardioverter defibrillator. Am J Cardiol 2000;86:959–teristic numbers for dynamical systems. Trans Moscow Math Soc 63.1968;19:197–231. [45] Lin JL, Chan HL, Du CC et al. Long-term beta-blocker therapy
[32] Wolf A, Swift JB, Swinney HL et al. Determining Lyapunov improves autonomic nervous regulation in advanced congestiveExponents from a time series. Physica D 1985;16:285–317. heart failure: a longitudinal heart rate variability study. Am Heart J
[33] Takens F. Detecting strange attractors in turbulence, In: Rand E, 1999;137:658–865.Young LS, editors. Dynamical systems and turbulence (Warwick, [46] Pousset F, Copie X, Lechat P et al. Effects of bisoprolol on heart1980) (Lecture Notes in Mathematics 898), Berlin: Springer, 1981, rate variability in heart failure. Am J Cardiol 1996;77:612–7.pp. 366–381. [47] Fromer M, Wietholt D. Algorithm for the prevention of ventricular
[34] Malik M, Farrell T, Camm AJ. Circadian rhythm of heart rate tachycardia onset: The Prevent Study. Am J Cardiol 1999;83:45D–variability after acute myocardial infarction and its influence on the 7D.prognostic value of heart rate variability. Am J Cardiol1990;66:1049–54.
[35] Saito K, Matsuyama K, Niki T et al. Characteristics of non-sustainedventricular tachycardia detected by ambulatory electrocardiography.Jpn Circ J 1984;48:421–6.
Related Documents