State of Illinois Rod R. Blagojevich, Governor Department of Public Health Damon T. Arnold, M.D., M.P.H., Director Survey on Assessment of Local Health Departments Regarding Heart Disease And Stroke Prevention

Welcome message from author
This document is posted to help you gain knowledge. Please leave a comment to let me know what you think about it! Share it to your friends and learn new things together.
Transcript
State of IllinoisRod R. Blagojevich, Governor
Department of Public HealthDamon T. Arnold, M.D., M.P.H., Director
Survey on Assessment ofLocal Health DepartmentsRegarding Heart DiseaseAnd Stroke Prevention
1
SURVEY ON ASSESSMENT OF
LOCAL HEALTH DEPARTMENTS
IN ILLINOIS
REGARDING HEART DISEASE
AND STROKE PREVENTION Illinois Heart Disease and Stroke Prevention Program Illinois Department of Public Health April 2006
2
Acknowledgements The Illinois Department of Public Health would like to acknowledge the contributions made by the following: Report Prepared by: Illinois Prevention Research Center, Institute for Health Research and Policy, School of Public Health, University of Illinois at Chicago: Karen Peters, Dr.P.H. William Baldyga, Dr. P.H. Sunanda Gupta, M.D., M.P.H. Illinois Department of Public Health Julie B. Doetsch, M.A., Data Unit Manager Division of Chronic Disease Prevention and Control Julie A. Harvill, M.P.A., M.P.H., Administrator Illinois Heart Disease and Stroke Prevention Program Division of Chronic Disease Prevention and Control Lynette E. Shaw, M.S.Ed., CHES, Health Educator Illinois Heart Disease and Stroke Prevention Program Division of Chronic Disease Prevention and Control With support from the Division of Heart Disease and Stroke Prevention, National Center for Chronic Disease Prevention and Health Promotion, U.S. Centers for Disease Control and Prevention Cooperative Agreement #U50/CCU521343.
3
ILLINOIS DEPARTMENT OF PUBLIC HEALTH
Survey on Assessment of Local Health Departments in Illinois Regarding Heart Disease and Stroke Prevention
April 2006
Table of Contents Page Executive Summary…………………………………………………………………………3 Background and Purpose ……………………………………………………………………3 Review of the Literature…………………………………………………………………….4 - 12 Methodology………………………………………………………………………………...12 - 17 Analysis and Dissemination of Findings
1. General Section...............................................................................................................17 - 24 2. Screening for High Blood Pressure…………………………………………………….24 - 29 3. Screening for Cholesterol………………………………………………………………29 - 33 4. Know Signs and Symptoms of Heart Attack/Stroke…………………………………...33 - 34 5. Improve Emergency Response…………………………………………………………34 - 36 6. Improve Quality of Care………………………………………………………………..36 - 37 7. Disparities………………………………………………………………………………37 - 39 8. Training…………………………………………………………………………………39 - 43 9. Data……………………………………………………………………………………..43 - 44 10. Closing Questions………………………………………………………………………44 - 45
Recommendations………………………………………………………………………….45 - 47 References………………………………………………………………………………….48 – 54 List of Appendices………………………………………………………………………….55 Appendix A: Table of Working Group Members
Appendix B: Letter to Planning Committee Appendix C: Table of Planning Committee Members Appendix D: Table of Other Surveys and Tools Utilized Appendix E: Evaluation Question Instrument Appendix F: Planning Committee Comments on Survey Appendix G: CDC Comments on Survey Appendix H: Survey Instrument (PDF file) Appendix I: Cover Letter from Director Whitaker Appendix J: Cover Letter from Joint Project Directors Appendix K: List of Illinois Local Health Department Counties Appendix L: References Appendix M: Supplementary Report
4
Assessment of Cardiovascular and Stroke Prevention Activities in Illinois
April 2006
Executive Summary
In order to better plan for essential public health services for the prevention and control of heart disease
and stroke, the Illinois Department of Public Health (IDPH) collaborated with the Illinois Prevention
Research Center (IPRC) of the University of Illinois at Chicago (UIC) to assess the heart disease and
stroke activities conducted by local health departments (LHDs) in Illinois. The assessment was designed
to establish the current state of practices, policies, plans and anticipated needs for individual and
community programs for heart disease and stroke (HD & S) prevention. The assessment was conducted
through a Web survey sent to all LHDs and designed to be relevant to a wide scope of HD & S activities.
The outcomes of the assessment include:
broad knowledge about current practices
the ability to share information with LHDs
greater capacity to plan for enhanced programs and services
Background and Purpose
IDPH Heart Disease and Stroke Prevention program leadership collaborated with University of Illinois
researchers to assemble a group of national public health experts to advise on the design, pre-test and
administration of an on-line survey instrument to collect comprehensive, current data about HD & S
prevention activities throughout Illinois at the county and sub-county level. The survey measured: the
priority accorded to HD & S prevention by LHDs; facilities and infrastructure, educational programs,
screening services and targeted populations, and access to heart disease and stroke care at the county
level; partnerships and collaborative efforts created to facilitate HD & S control and prevention; the
availability and nature of blood pressure and cholesterol screening and follow-up; emergency response
strategies and improvement plans; quality improvement strategies, including efforts to reduce disparities
identify barriers to existing and new HD & S prevention and control activities.
The assessment also tested the feasibility of designing and implementing a comprehensive HD & S
survey instrument that could be adapted for use by other state health departments or organizations,
providing local area information that can be shared among health departments to further improve HD & S
control and prevention, and providing IDPH with appropriate analysis to better understand local
conditions and effectively plan for improvement.
Heart Disease and Stroke in Illinois
5
IDPH data indicate that in an average year nearly 40,000 Illinoisans will die of cardiovascular disease
(CVD), which includes heart disease, stroke and a spectrum of rarer conditions. Each year, more
Illinoisans die from CVD than from cancer, unintentional injuries, lung disease, pneumonia, influenza and
diabetes combined. In other words, each year the state loses the equivalent of a city the size of Belleville,
Rock Island or Tinley Park to the ravages of this disease, which is preventable to a considerable extent by
life style modification and early treatment of risk factors including hypertension, high blood cholesterol
and diabetes. The number of annual deaths from CVD in Illinois has remained virtually unchanged the
last 10 years, in spite of the recent advances in treatment. A 2004 report from the National Center for
Health Statistics shows that Illinois is among the states with the second highest overall mortality rate due
to heart disease and stroke (233.2 – 268.0 per 100,000) (CDC, 2004, National and State Perspectives).
An alarming 88 percent of all Illinois residents have at least one risk factor for CVD, while almost a third
have two risk factors, and 12 percent are afflicted with three, greatly enhancing their predisposition to a
heart or brain attack (stroke).
Survey Methods and Results
A final Internet survey of 59 questions was sent in August 2005by the Illinois Prevention Research Center
to 94 LHD administrators in Illinois with a cover letter from Eric E. Whitaker, IDPH Director. After
several prompts, a 100 percent response rate was achieved.
Analysis of the data provides the following highlights:
HD & S prevention is a high priority topic for LHDs.
Nearly all LHDs provide HD & S prevention activities to appropriate population groups.
Collaborations with local organizations (schools, hospitals, providers, media, community and
faith–based organizations, worksite wellness programs and IDPH) are widely implemented.
Primary activities of LHDs are public education, including prevention information.
Nearly all LHDs directly provide blood pressure screening services and referral.
LHDs collaborate with a wide range of community organization to offer a comprehensive blood
pressure screening program that includes risk factor education.
Approximately two-thirds of LHDs provide cholesterol screening and offer referral to the general
public, often in collaboration with community centers and employee groups.
Most LHDs provide general public education and media to increase knowledge about the signs
and symptoms of heart disease and stroke using opportunities available in the community through
outreach events, screening and waiting rooms.
More than half of the LHDs do not possess an automated external defibrillator.
6
About half of the LHDs report collaborating with appropriate agencies (emergency service
agencies and systems, medical services, fire and police departments and hospitals) to improve
emergency response.
More than half of the LHDs have enhanced 911 services, another one-third have basic 911.
Most LHDs do not specifically target underserved groups to reduce disparities.
Although significant staff expertise exists, training needs remain, particularly in data management
and analysis. Funding is a major barrier to increased training.
Identified opportunities for additional HD & S prevention training conducted by LHD staff are
available in the community.
Low levels of funding, staff and additional resources constrain LHD progress in HD & S
prevention. Respondents identified stable funding as a prerequisite to increased HD & S
prevention activities.
Recommendations
The LHDs play a major role in implementing and disseminating public health programs. A survey of the
current capacity of the Heart Disease and Stroke Prevention Program in the 94 LHDs in Illinois revealed
significant statewide activity in HD & S prevention. To achieve IDPH and Healthy People 2010 goals,
additional efforts will be required. Analyses of the results of the survey provide direction and
recommendations for strengthening the program. These recommendations can only be advanced with
additional resources.
Move HD & S prevention to one of the two top priorities in all LHDs.
Offer resources to assure all LHDs can provide basic public health education and blood pressure
and cholesterol screening.
Offer communications resources and materials to LHDs. Develop an evidence based statewide
public information campaign.
Improve efforts to reduce health disparities by targeting programs, developing programs to
overcome linguistic and other barriers, and working closely with minority organizations to meet
needs.
Enhance the already significant partnership activities to be more inclusive of minority serving
organizations, business groups, rehabilitations service providers and other provider organizations
and national program efforts.
Increase efforts to implement effective prevention policies at the local level, specifically with
provider organizations, and to increase knowledge about the capacity of local facilities.
Enhance collaboration with hospitals to improve response and quality of services provided to
stroke and heart attack victims.
7
Strengthen cholesterol screening efforts by promoting ATP III guidelines, forging alliances with
service providers and improving LHD record keeping and reminder systems.
Strengthen blood pressure screening efforts by promoting JNC VII guidelines, improving health
education resources and improving LHD record keeping and reminder systems.
Increase efforts to inform providers of linguistic and other barriers to services and providing
resources to overcome barriers and improve disparities.
Provide additional training opportunities to LHD staff on identified priority topics.
Conclusion
A statewide survey of HD & S prevention program activities was highly successful, attracting a 100
percent response and providing rich data for planning and program implementation. The survey should be
repeated in two to three years to measure progress toward state and national goals.
Overview of Project on Needs Assessment for Prevention of Heart Disease and Stroke in Local
Health Departments (LHDs) of Illinois
In February 2005, the Illinois Department of Public Health (IDPH) developed collaboration with the
Illinois Prevention Research Center (IPRC) at the Institute for Health Research and Policy (IHRP) of the
University of Illinois at Chicago (UIC) to assess the heart disease and stroke activities conducted by local
health departments (LHDs) in Illinois. The assessment was designed to establish the current state of
practices, policies, plans, and anticipated needs for individual and community programs for heart disease
8
and stroke prevention. The assessment was based on a Web survey sent to all LHDs and designed to be
relevant to a wide scope of cardiovascular disease (CVD) and stroke activities conducted by LHDs. The
survey would result in broad knowledge about current practices, the ability to share information between
LHDs, and greater capacity to plan for enhanced programs and services. This report describes the
background and purpose for the project, provides a brief review of the literature, discusses the
methodology utilized, and provides preliminary analysis and discussion of the results of the survey. A set
of recommendations also is included.
Background and Purpose
IDPH contracted with the IPRC to plan, implement, analyze, and report on a survey of CVD and stroke
plans and actions conducted by LHDs in Illinois. At the request of CDC, IDPH and IPRC agreed to
design an instrument that could be adapted for use by other states or health departments. The survey is
intended to be comprehensive of contemporary LHD practices, programs, policies, infrastructure,
priorities, and plans for the prevention and control of CVD and stroke in Illinois. The survey measures the
activities and plans of organizations, institutions and communities, including those conducted by or
coordinated through LHDs. The data collected through the survey will be shared with respondents to
enhance knowledge, improve program dissemination, and more effectively plan for CVD and stroke
control and prevention. Survey results also will allow IDPH to more effectively plan for future programs
and services, coordinate existing efforts, monitor LHD activities and seek resources for enhanced
programs. Specific objectives include:
• Collect comprehensive current information about CVD and stroke prevention activities
throughout Illinois at the county and sub-county level.
• Assess the priority accorded to CVD and stroke prevention by LHDs.
• Measure the availability of facilities and infrastructure, educational programs, screening services,
and access to heart disease and stroke care at the county level.
• Identify partnerships and collaborative efforts created to facilitate CVD and stroke control and
prevention.
• Establish the availability and nature of blood pressure and cholesterol screening and follow-up;
• Understand emergency response strategies and improvement plans.
• Identify quality improvement strategies, including efforts to reduce disparities.
• Assess county-level CVD and stroke educational efforts for policymakers, providers and
community residents.
• Identify barriers to existing and new CVD and stroke prevention and control activities;
• Design and test a comprehensive CVD and stroke survey instrument capable of measuring current
9
practices, priorities, infrastructure, and needs that could be adapted for use by other state health
departments or organizations.
• Provide local area information about Illinois that can be shared among health departments to raise
awareness of practices and further improve CVD and stroke control and prevention.
• Provide IDPH with appropriate analysis of the data collected to better understand local conditions
and effectively plan for improvement.
Review of the Literature
Global overview of heart disease and stroke
According to the 2004 World Health Organization (WHO) report, 16.7 million people around the globe
die of cardiovascular diseases (CVD) each year. This is about one-third of all deaths worldwide.
By 2020, heart disease and stroke will become the leading cause of both death and disability in the world,
with the number of fatalities projected to increase to more than 20 million a year, and to more than 24
million a year by 2030. It is projected that by 2020, chronic diseases will account for almost three fourths
of all deaths (WHO, Geneva, 2003). About half of all deaths from CVD are from coronary heart disease
(CHD), and nearly one-third of deaths are from stroke (British Heart Foundation, European
Cardiovascular Disease Statistics, 2000 Edition). These diseases are seen in the most productive years of
life, and those afflicted rarely return to full productivity, particularly after a stroke. In the United States,
the number of years of productive life lost to CVD will increase by 20 percent from 2000 to 2030 (2004,
Columbia University, New York.). In both developed and developing countries, 40 to 75 percent of all
heart attack victims die before reaching the hospital (Integrated Management of Cardiovascular Risk:
Report of a WHO Meeting, Geneva, July 2002). These figures have enormous public health implications,
as it has been well documented that the lack of awareness of signs and symptoms of high blood pressure,
heart attack and stroke, and delay in seeking treatment is the cause of preventable morbidity and
mortality. According to WHO estimates, 15 million people each year suffer strokes and, of these, 5
million are left permanently disabled (WHO, 2004). Globally, high blood pressure accounts for
approximately 7.1 million deaths, about 13 percent of the total global fatalities. WHO research indicates
that about 62 percent of strokes and 49 percent of heart attacks are caused by high blood pressure (WHO
World Health Report, 2002). Internationally, high blood cholesterol is estimated to cause about 4.4
million deaths (7.9 percent of total deaths).
Enormity of the Problem in United States
10
Cardiovascular Diseases
Cardiovascular diseases (CVD) are composed of a spectrum of diseases including high blood pressure
(HBP), coronary heart disease (CHD), myocardial infarction (MI or heart attack), heart failure (HF),
stroke and congenital cardiovascular defects.
Heart disease and stroke are the most commonly seen chronic diseases in the world, as well as in the
United States. The most recent statistics reflect the magnitude of the problem of heart disease and stroke
in the U.S. population (AHA Statistical Update, 2006). High blood pressure has been detected in 65
million Americans. Coronary heart disease (CHD), heart attack, chest pain (angina) and heart failure
collectively account for 31.9 million cases, and there are 5.5 million people afflicted with stroke in the
nation. It means that one in three adults have some form of cardiovascular disease (NHANES 1999–02,
CDC/NCHS). Data from the Framingham Heart Study (FHS) indicate that the lifetime risk for CVD at
age 40 is two in three for men and more than one in two for women.
Prevalence
Statistics released in the Vital Health Statistics report of 2005 (CDC/NHS, 2005) reveal the prevalence of
cardiovascular diseases in people aged 18 and older according to race. The reported racial prevalence of
CVD in the United States is as follows:
Among whites only, 11.4 percent have heart disease, 5.9 percent have CHD, 20.5 percent have
hypertension, and 2.3 percent have had a stroke.
Among blacks or African Americans only, 9.9 percent have heart disease, 5.3 percent have CHD,
31.6 percent have hypertension, and 3.5 percent have had a stroke.
Among Hispanics or Latinos, 7.7 percent have heart disease, 4.5 percent have CHD, 19.0 percent
have hypertension, and 2.2 percent have had a stroke.
Among Asians, 5.6 percent have heart disease, 3.8 percent have CHD, 16.1 percent have
hypertension, and 1.8 percent has had a stroke.
Among Native Hawaiians or other Pacific Islanders, 16.6 percent have heart disease, 4.9 percent
have CHD, and 18.2 percent have hypertension.
Among American Indians or Alaska Natives, 13.8 percent have heart disease, 8.2 percent have
CHD, 23.9 percent have hypertension, and 3.1 percent have had a stroke.
It is evident that African Americans have the highest prevalence of HBP and stroke among all races. The
data also indicate that the African Americans and whites are more at risk compared to Hispanics, Asians,
11
and American Indians, though the risk for minorities is compounded by the disparity in available health
care (NCHS, 2005).
Mortality for Cardiovascular Diseases (CVD)
Preliminary mortality data for 2003 demonstrate that CVD was the underlying cause of death in 37.3
percent of the total 2,440,000 deaths in the United States, or one out of every 2.7 deaths. In addition,
CVD was a contributing cause of death in about 58 percent of all deaths in 2002. Since 1900, CVD has
been the No. 1 killer in the United States, except in 1918. Nearly 2500 Americans die of CVD each day,
an average of 1 death every 35 seconds. Heart disease and stroke together claim more lives each year than
the next four leading causes of death combined, which are cancer, chronic lower respiratory diseases,
accidents, and diabetes mellitus.
The 2003 overall preliminary death rate from CVD was 308.8/100,000. The rates were 359.1 for white
males and 479.6 for black males, and 256.2 for white females and 354.8 for black females. These figures
reflect a distinct racial disparity for blacks.
According to estimates by CDC/NCHS, eliminating all major forms of CVD would increase life
expectancy by almost seven years compared to a three-year gain if all cancers were eliminated. In 2002,
32 percent of deaths from CVD occurred prematurely or before age 75. In 2001, the proportion of
premature deaths (<65 years) from diseases of the heart was greatest among American Indians or Alaska
Natives (36%) and blacks (31.5%), and lowest among whites (14.7%). Premature death was higher for
Hispanics (23.5%) than non-Hispanics (16.5%) and for males (24%) compared to females (10%).
Role of EMS and CPR
Myerburg (1993) conducted an epidemiological study of sudden cardiac death and concluded that about
two-thirds of unexpected cardiac deaths occur without prior recognition of cardiac disease. In a study on
the role of EMS in treating cardiac emergencies, about 60 percent of unexpected cardiac deaths were
treated by EMS. The same study concluded that the average proportion of cases of out-of-hospital cardiac
arrest that receive bystander CPR is 27.4 percent (Nichol et al, 1999). The incidence of EMS-treated out-
of-hospital cardiac arrest is 36/100 000–81/100 000 (Chugh, 2004; Cobb, 2002). This implies that EMS
treats about 107,000 to 240,000 cardiac arrests in the United States annually (AHA, 2006). These figures
reflect the importance of training the public in resuscitative measures, and how to access quick emergency
care, to reduce the morbidity and mortality of heart disease.

12
Risk Factors for CVD
Data from the 2003 Behavior Risk Factor Surveillance System (BRFSS) showed that, in adults age 18 and
older, the prevalence of those reporting two or more risk factors for heart disease and stroke increased
with increasing age. The prevalence of having two or more risk factors was highest among blacks (48.7%)
and American Indians/Alaska Natives (46.7%), and lowest among Asians (25.9%); prevalence was
similar in women (36.4%) and men (37.8%). Low socioeconomic status has an important role in
prevalence. Persons reporting household income of $50,000 or more had the lowest prevalence (28.8%),
while those reporting $10,000 or less income had the highest prevalence (52.5%) (Thom, Feb2006).
The results of the Chicago Heart Association Detection Project , which had an average follow-up of 31
years, showed that in younger women (ages 18–39) with favorable levels for all five major risk factors
(blood pressure, serum cholesterol, BMI, diabetes and smoking), the future incidence of CHD and CVD
was rare. Long-term and all-cause mortality were much lower compared with those who had unfavorable
or elevated risk factor levels at young ages. Similar findings applied to men in this study (Daviglus, 2004;
Stamler J, 1999).
The Burden of Age
The U.S. census estimates that there will be 40 million Americans age 65 and older in 2010, and this
number is likely to keep rising as the generation of baby boomers enters this age group. The increase in
longevity will also add to the number of adults 65 and older. The aging of the population will indisputably
result in an increased incidence of chronic diseases, including coronary artery disease, heart failure and
stroke (Bonow, 2002). As these diseases are the major killers in old age, much can be done to reduce the
prevalence by proper public health efforts on risk counseling and healthy life-style behaviors, beginning
at a young age.
What is more significant is the alarming increase in unattended risk factors in the younger generations,
which will continue to fuel the cardiovascular epidemic for years to come.
Economic implications of CVD
The estimated direct and indirect cost of CVD for 2006 in the United States is $403.1 billion (AHA,
2006). This figure includes health expenditures (direct costs, which include the cost of physicians and
other professionals, hospital and nursing home services, the cost of medications, home health care and

13
other medical durables), and lost productivity resulting from morbidity and mortality (indirect costs). In
2001, $29.3 billion in program payments were made to Medicare beneficiaries discharged from short-stay
hospitals with a principal diagnosis of cardiovascular disease. That was an average of $8,354 per
discharge (Health Care Financing Review, 2003). In a study of National Hospital Discharge Survey data
of 2001, CVD ranked highest among all disease categories in hospital discharges (NCHS, 2004).
Heart Disease
Risks of Developing Heart Disease
The National Heart, Lung and Blood Institute's (NHLBI) Framingham Heart Study (FHS) has a 44-year
follow-up of participants, and a 20-year follow-up of their offspring, measuring the risks of developing
heart disease (Hurst, 2002). The study points out that CHD comprises more than half of all cardiovascular
events in men and women younger than age 75.The lifetime risk of developing CHD after age 40 is 49
percent for men and 32 percent for women (Lloyd-Jones,1999). The incidence of CHD in women lags
behind men by 10 years for total CHD, and by 20 years for more serious clinical events such as
myocardial infarction and sudden death.
Mortality and Morbidity from Heart Disease
The latest American Heart Association statistics reveal that CHD caused one of every five deaths in the
United States in 2003. CHD is the single largest killer of American males and females alike. It is
estimated that one American will suffer a coronary event every 26 seconds, and someone will die from
one approximately every minute. About 40 percent of the people who experience a coronary attack in a
given year will die from it.
From 1993–2003, the death rate from CHD declined 30.2 percent, but the actual number of deaths
declined only 14.7 percent, due to an increase in the older adult population. In 2003, the overall CHD
death rate was 162.6 per 100,000 populations. The death rates were 209.2/100,000 for white males and
241.1 for black males; for white females, the rate was 125.1 and for black females, it was 160.3. The 2002
death rates for CHD were 138.3 for Hispanics or Latinos, 114.0 for American Indians or Alaska Natives,
and 98.6 for Asians or Pacific Islanders (Health, United States, 2004). These figures highlight the very
high rates of mortality in both male and female American Africans, and indicate the need for public health
efforts to reduce these glaring disparities. Depending on their gender and clinical outcome, people who
survive the acute stage of a heart attack have a chance of illness and death that is 1.5–15 times higher than
that of the general population. The risk of another heart attack, sudden death, chest pain, heart failure and
14
stroke—for both men and women—is substantial (FHS, NHLBI). The projected average number of years
of life lost due to a heart attack is 14.2 years (NHLBI).
Risk Factors for Heart Disease
The major risk factors for CHD include high total blood cholesterol levels or current medication with
cholesterol-lowering drugs, hypertension or current medication with blood pressure-lowering drugs,
current cigarette use, and clinical report of diabetes (Greenland et al, 2003). Greenland conducted a study
of men and women in three prospective cohort studies, and found that antecedent major CHD risk factor
exposures were very common among those who developed CHD. It was estimated that about 90 percent
of the CHD patients had prior exposure to at least one of these risk factors.
Rehabilitation
A study conducted by the Mayo Clinic found that cardiac rehabilitation after a heart attack is underused in
the community, and particularly by women and the elderly. Women were 55 percent less likely than men
to participate in cardiac rehabilitation, and older study patients were less likely than younger participants
to receive these services (Witt, 2004).
Emergency response
A recent community surveillance study in four U.S. communities (McGinn et al, 2005) reported pre-
hospital delay time and use of emergency medical services for patients with acute myocardial infarction
(heart attack, MI). It reported that, in 2000, the overall proportion of persons with delays to hospital
arrival, of four or more hours from onset of symptoms of acute MI, was 49.5 percent. The study also
reported that there was no statistically significant change in the proportion of patients delaying four or
more hours from 1987–2000, indicating that there has been little improvement in the speed at which
patients with MI symptoms arrive at the hospital after onset of the attack.
Stroke
Prevalence
Muntner et al (2002) conducted a study on “Trends in stroke prevalence between 1973 and 1991 in the
15
U.S. population 25 to 74 years of age.” They estimated that the number of non-institutionalized stroke
survivors increased from 1.5 million to 2.4 million. Statistics from CDC for 1979–2003 indicate the
number of discharges from short-stay in hospitals, with stroke as the first listed diagnosis, increased by 29
percent (National Hospital Discharge Survey, CDC/NCHS).
Incidence
On average, someone in the United States has a stroke every 45 seconds. The National Institute of
Neurological Disorders and Stroke (NINDS) estimates that each year about 46,000 more women than
men have a stroke (AHA, 2006). Blacks have almost twice the risk of first-ever stroke compared with
whites. The age-adjusted stroke incidence rates (per 100,000) for first-ever strokes are 167 for white
females, 138 for white males, 323 for black females and 260 for black males ( AHA, 2006). The
preponderance in black male and females is evident, and the extent of disparity indicates the need for
concentrated intervention at all levels to eliminate the difference.
Disparities in Stroke
The Brain Attack Surveillance in Corpus Christi project (BASIC) clearly demonstrated an increased
incidence of stroke among Mexican Americans compared with non-Hispanic (NH) whites in this
community (Morgenstern et al, 2004). The crude cumulative incidence was 168/10,000 in Mexican
Americans and 136/10,000 in NH whites.
Similar data from the Northern Manhattan Study showed the age-adjusted incidence of first ischemic
stroke per 100,000 was 88 in whites, 149 in Hispanics and 191 in blacks (White et al, 2005). Generally,
the risk of a stroke hospitalization was more than 70 percent greater for blacks than for whites. Both
groups were similar in terms of in-hospital mortality rates (Kennedy, 2002). Men, nonwhites, and those
with lower income and fewer years of education were less likely to be knowledgeable about transient
ischemic attacks, which are a prelude to a stroke (Hill, 2004).
Mortality in Stroke
Stroke accounted for about one of every 15 deaths in the United States in 2003, and is the third most
common cause of death overall. About 50 percent of these deaths occurred out of hospital. On average,
about every three minutes, someone dies of a stroke in the United States (AHA, 2006). The 2003 overall
death rate for stroke was 54.3/100,000. Death rates were 51.9 for white males and 78.8 for black males;
for white females, it was 50.5 and for black females, the rate was 69.1. The mortality rates are much
16
higher in blacks compared to whites in both sexes.
Blood pressure (BP) is a powerful determinant of stroke risk. Subjects with BP less than 120/80 mm Hg
have about half the lifetime risk of stroke, compared to subjects with hypertension (Seshadhri, in Press).
Disability and rehabilitation due to stroke
According to CDC, stroke is a leading cause of serious, long-term disability in the United States
(MMWR. 2001; 50:120–125). The length of time to recover from a stroke depends on its severity, and 15
percent to 30 percent are permanently disabled after a stroke. About 50 percent to 70 percent of stroke
survivors regain functional independence, while 20 percent require institutional care three months after
the stroke occurs. Rehabilitation plays a significant role in extent of recovery.
Delay in Emergency Response
The median time from stroke onset to arrival in an emergency room is between three and six hours,
according to a study of at least 48 unique reports of prehospital delay time for patients with stroke or
stroke-like symptoms (Evenson, 2001). The epidemiological study incorporated data from 17 countries,
including the United States. Improved clinical outcome was observed at three months in patients with
acute ischemic stroke, if intravenous thrombolytic treatment was started within three hours of the onset of
symptoms.
Knowledge of the Signs, Symptoms, and Risk Factors of Stroke
Kothari et al (1997) published a study conducted on patients admitted to an emergency department with
possible stroke, to determine patient’s knowledge of the signs, symptoms, and risk factors of stroke.
Thirty-nine percent of the 163 patients, who were in a condition to respond, were not aware of a single
sign or symptom. Patients older than age 65 were less likely than those younger than 65 to know about a
sign or symptom of stroke (47% versus 28%). Overall, 43 percent did not know a single risk factor for
stroke. The study concluded that, in general, nearly 40 percent of patients admitted with a possible stroke
did not know the signs, symptoms, and risk factors of stroke.
Economic implications of Stroke
The estimated direct and indirect cost of stroke for 2006 is $57.9 billion (AHA, 2006). In 2001, it was
estimated that $3.7 billion ($6,037 per discharge) was paid to Medicare beneficiaries discharged from
17
short-stay hospitals for stroke (Health Care Financing Review, 2003).
High Blood Pressure (HBP)
Definition of HBP
HBP is defined as a systolic pressure of 140 mm Hg or higher or diastolic pressure of 90 mm Hg or
higher. “Prehypertension” is a systolic pressure of 120–139 mm Hg, or diastolic pressure of 80–89 mm
Hg.
Prevalence
Nearly one in three adults in the United States has HBP (Fields et al, 2004) while about 28 percent of
American adults age 18 and older, or about 59 million people, have “prehypertension” (NHANES 1999–
2002, CDC/NCHS, NHLBI). In a study conducted by Greenlund et al (2004) on prevalence of heart
disease and stroke risk factors in persons with prehypertension in the United States between 1999–2000,
they found only 39 percent of persons had normal BP. Nearly 31 percent were prehypertensive, and 29
percent were hypertensive. The age-adjusted prevalence of prehypertension was greater in men (39%)
than in women (23.1%). African Americans ages 20–39 had a higher prevalence of prehypertension
(37.4%) than whites (32.2%) and Mexican Americans (30.9%).
Disparities in HBP
The prevalence of hypertension in blacks in the United States is among the highest in the world.
Compared with whites, blacks develop HBP earlier in life, and their average blood pressures are much
higher. Consequently, blacks have a 1.3-times greater rate of nonfatal stroke, a 1.8-times greater rate of
fatal stroke, a 1.5-times greater rate of heart disease death and a 4.2-times greater rate of end-stage kidney
disease compared with whites (JNC 5 and 6).
Mortality in HBP
The latest AHA report (2006) shows that from 1993–2003, the age-adjusted death rate from HBP
increased by 29.3 percent, and the actual number of deaths rose by 56.1 percent. The 2003 overall death
rate from HBP was 18.1/100,000. Death rates were 14.9 for white males, 49.7 for black males, 14.5 for
white females, and 40.8 for black females. HBP was the cause of death in a much larger proportion of
blacks compared to whites and other races. It was estimated that as many as 30 percent of all deaths in
hypertensive black men and 20 percent of all deaths in hypertensive black women may be due to HBP
(JNC 5 and 6).

18
Awareness and Control of HBP
Hajjar et al (2004) analyzed the trends in prevalence, awareness, treatment and control of hypertension in
the United States between 1988–2000. They found that the rates of control in Mexican Americans
(17.7%) were much lower in comparison to non-Hispanic (NH) whites (33.4%) and NH blacks (28.1%).
Data from NHANES for 1999-2000 (Morbidity Mortality Weekly Report (MMWR) 2005:54) showed
that of those people suffering from hypertension, 63.4 percent were aware of their condition, 45.3 percent
were under current treatment, 29.3 percent had it under control, and 70.7 percent did not have it
controlled.
Adverse Consequences of HBP
It has been estimated that approximately 69 percent of people who have a first heart attack, 77 percent
who have a first stroke, and 74 percent who have heart failure have a BP which is higher than 140/90 mm
Hg (AHA,2006). Further, MacMahon et al (1994) studied the epidemiological association between blood
pressure and stroke. They reported that people with systolic BP of 160 mm Hg or higher and/or diastolic
BP of 95 mm Hg or higher have a relative risk for stroke about four times greater than for those with
normal BP. The development of heart failure is preceded by hypertension in 91 percent of cases. HBP is
associated with a two–three times greater risk for developing congestive heart failure (FHS, NHLBI, Levy
et al, 1996).
Economic implications of HBP
The estimated direct and indirect cost of HBP for 2006 is $63.5 billion (AHA, 2006). On the economic
front, HBP caused more visits to doctors than any other condition. Just a 10 percent decline in the
number of doctor visits would save $478 million each year. It is estimated that HBP and its complications
cost the U.S. economy more than $100 billion each year (AHA, 2006).
High Blood Cholesterol
Cholesterol is a normally present constituent of the body and carries out several important metabolic
functions. However, if the levels increase beyond a certain limit, they predispose to development of heart
disease and stroke due to deposit of plaques in the blood vessels, which narrows their diameter and
interferes with the blood flow to organs. The Adult Treatment Panel III, 2001 (ATP III) update
emphasizes that therapeutic lifestyle changes--low saturated fat and low cholesterol diet, physical activity,
and weight control--remain the cornerstone of treatment for patients with heart attack and stroke, and the
19
best preventive measure.
Normal Parameters of Blood Cholesterol
According to the Third Report of the National Cholesterol Education Program (NCEP) Expert Panel on
Detection, Evaluation, and Treatment of High Blood Cholesterol in Adults (Adult Treatment Panel III,
2001), everyone age 20 and older should have their cholesterol measured at least once every five years. It
is best to have a blood test called a “lipoprotein profile” to find out the cholesterol numbers. The mean
level of Low Density Lipoprotein (LDL) cholesterol for American adults age 20 and older is 123 mg/dL.
Levels of 130–159 mg/dL are considered borderline high. Levels of 160–189 mg/dL are classified as
high, and levels of 190 mg/dL and higher are very high.
Prevalence of High Cholesterol
It was estimated that 106.9 million Americans age 20 and older have total blood cholesterol levels of 200
milligrams per deciliter (mg/dL) and higher. Of these, 37.7 million have total blood cholesterol levels of
240 mg/dL or higher. Among white males, 17.8 percent of men have levels of 240 mg/dL or higher,
compared to 10.6 percent of men among African Americans. These estimates are age-adjusted (NHANES
[1999-2000]; Circulation, 2003: 107:2185-2189; Health United States, 2003, CDC/NCHS).
Cholesterol Screening Prevalence and Awareness
BRFSS data from 1991–2003 showed that the prevalence of cholesterol screening during the preceding
five years increased from 67.3 percent in 1991 to 73.1 percent in 2003. The age-adjusted prevalence of
high blood cholesterol awareness among persons screened increased from 25.3 percent in 1991 to 31.1
percent in 2003 (MMWR. 2005; 54; 865–870). According to NHANES 1999–2002, there is a uniformly
higher level of cholesterol in women regardless of age or race.
According to CDC, a population-wide decrease of 10 percent in total cholesterol levels may result in an
estimated 30percent reduction in the incidence of CHD (MMWR. 2000; 49:750–755). Data from
NHANES 1999–2002 showed that, overall, 63.3percent of participants whose test results indicated high
blood cholesterol, or who were taking a cholesterol-lowering medication, had been informed by a
professional that they had high cholesterol.
20
Adherence to Treatment
Based on data from the Third Report of the Expert Panel on Detection, Evaluation, and Treatment of High
Blood Cholesterol in Adults (Adult Treatment Panel Final Report, 2002), it was found that less than 50
percent of people who met the criteria for any kind of lipid-modifying treatment for CHD risk reduction,
actually received it. Less than half of even the highest-risk persons, and even those who had symptomatic
CHD, actually received lipid-lowering treatment. Carrol et al (2005) conducted a 40-year study on
“Trends in serum lipids and lipoproteins of adults, 1960–2002”.They found that only about a third of
treated patients were achieving their LDL goal; less than 20 percent of CHD patients were at their LDL
goal.
Quality of Care
The Institute of Medicine defines quality of care as “the degree to which health services for individuals
and populations increase the likelihood of desired health outcomes and are consistent with current
professional knowledge (IOM, 2001). Trivedi et al (2005) performed a study of data collected over a
seven-year period from all managed care plans administered by Medicare. While clinical performance
improved on all measures for both white and black enrollees, racial disparities did not show a decrease for
glucose control among patients with diabetes, or for cholesterol control among patients with
cardiovascular disorders.
The plethora of statistics, and the consistency of results derived from multiple national and international
studies, including the Framingham Heart Study in USA, give significant evidence of the need for
concerted public health intervention to reduce the prevalence and incidence of morbidity, mortality, and
racial and socioeconomic disparities due to heart disease and stroke.
Heart Disease in Illinois
Data collected from the IDPH Center for Health Statistics indicate that, in an average year, 42,540
Illinoisans will die of cardiovascular disease (CVD), which includes heart disease, stroke, and a spectrum
of rarer conditions. Each year, more Illinoisans die from CVD than from cancer, unintentional injuries,
lung disease, pneumonia, influenza and diabetes combined. In other words, each year the state loses the
equivalent of a city the size of Belleville, Rock Island or Tinley Park to the ravages of this disease, which
is preventable to a considerable extent by life style modification and early treatment of high risk factors

21
like hypertension, high blood cholesterol and diabetes. The number of annual deaths from CVD in Illinois
has remained virtually unchanged for the last 10 years, in spite of the recent advances in treatment. The
2004 NCHS report shows that Illinois is among one of the states with a second highest overall mortality
rate due to heart disease and stroke nationwide (233.2 – 268.0/100,000) (CDC, 2004, National and State
Perspectives). An alarming 88 percent of all Illinois residents possess at least one risk factor for CVD,
while almost a third have two risk factors, while 12 percent are afflicted with three, greatly enhancing
their predisposition to a heart or brain attack (stroke).
Heart disease as a cause of death in Illinois is 251.5/100,000, which is higher compared to the national
average of 246.8. Similarly, stroke as a cause of death is higher in Illinois (58.4) compared to the national
average of 57.7(CDC, 2004, National and State Perspectives).
In 2001, heart disease was the most common cause of death in Illinois, accounting for 30,990 deaths or 29
percent of all deaths. The rate of death from heart disease was 48 percent higher among men than among
women. The mortality rate was between 233.2 – 268.0/100,000(2001 NCHS data). According to figures
on deaths due to diseases of the heart in 2001, by race and ethnicity, the mortality rate was much higher in
blacks compared to any other race (CDC, 2004, National and State Perspectives). The death rate for
whites was 245.8/100,000, blacks was 337.4/100,000, Asian /Pacific Islander was 132.5/100,000,
Hispanic was 144.1/100,000 , while there were too few deaths (20 or fewer) to calculate a stable estimate
in American Indian/Alaska Natives.
Stroke in Illinois
In 2001, stroke was the cause of 7,230 deaths, or 7 percent of all deaths in Illinois. The rate of death from
stroke was 35 percent higher among blacks than among whites. There is a wide disparity among various
ethnic groups, with blacks having the highest rate with 76/100,000, followed by whites with
56.4/100,000, Asian /Pacific Islander with 43.4/100,000 and Hispanic with a rate of 38.6/100,000.
Risk Factors for Heart Disease and Stroke in Illinois
The latest data from CDC (2004) for prevalence of risk factors for heart disease and stroke in Illinois
show a distinct trend towards the higher side. The details for each risk factor are:
High Blood Pressure
In 2001, 32 percent of blacks, 27 percent of multiracial persons, 26 percent of whites, and 13 percent of
Hispanics reported having high blood pressure.
High Blood Cholesterol
22
In 2001, 31 percent of whites, 30 percent of blacks, and 18 percent of Hispanics in Illinois reported
having high blood cholesterol. 31 percent of the U.S. population on average had high cholesterol, while
corresponding figures for Illinois were 59.3 percent.
Overweight/Obesity
According to self-reported height and weight in 2001, 71 percent of blacks, 66 percent of Hispanics, 57
percent of whites, and 37 percent of Asians/Pacific Islanders were overweight. Compared to the national
average of 58.7 percent obese in the total population, 59.3 percent of all Illinoisans are obese
Physical inactivity
No leisure-time physical activity was reported by 47 percent of Hispanics, 34 percent of blacks, 26
percent of Asians/Pacific Islanders and 24 percent of whites. Compared to the national average of no
leisure time physical activity of 25 percent in the population, the figures for Illinois were 28.6 percent.
Dietary habits
Eating fewer than five servings of fruits and vegetables per day was reported by 83 percent of men and 76
percent of women in Illinois. Compared to the national average of 75.5 percent, the figures for Illinois
were 79.1 percent.
Cigarette smoking
In 2002, 26 percent of men and 20 percent of women reported current cigarette smoking. There was a 1.1
percent higher rate of adult smoking compared to the national average.
Economic Burden of CVD and Stroke in Illinois
The cost to Illinois taxpayers under the Medicaid program totaled more than $240 million annually
(Illinois Health Care Cost Containment Council, 1998).Total inpatient hospital charges for CVD
approached $4 billion annually.
Barriers to Prevention
Barriers to prevention of heart attack and stroke, as well as its risk factors, include cultural norms and
dietary habits, insufficient attention to health education by health care practitioners and lack of awareness
of these factors in the general public. Lack of awareness of screening and the symptoms of heart attack
and stroke among the public are a common cause of delay in seeking treatment. Public/private
partnerships with community groups such as civic, philanthropic, religious, and senior citizen
organizations, can provide locally focused orientation to the health needs of diverse populations.
Intervention strategies that address the diversity of racial, ethnic, cultural, linguistic, religious and social
factors in the delivery of preventive/medical services are more likely to be successful in disseminating
preventive health information to the public.
Methodology

23
The LHD needs assessment was conducted in three stages: (a) planning and development, (b) implementation and (c) analysis and dissemination. The survey was designed for completion by LHD program and administrative staff at 94 LHDs in Illinois, and to be applicable to states and LHDs generally. The assessment was bounded by six priorities for the IDPH CVD and stroke control and prevention program. These priorities are:
• Control high BP • Control high cholesterol • Know the signs and symptoms of stroke • Improve emergency response • Improve quality of care • Eliminate disparities
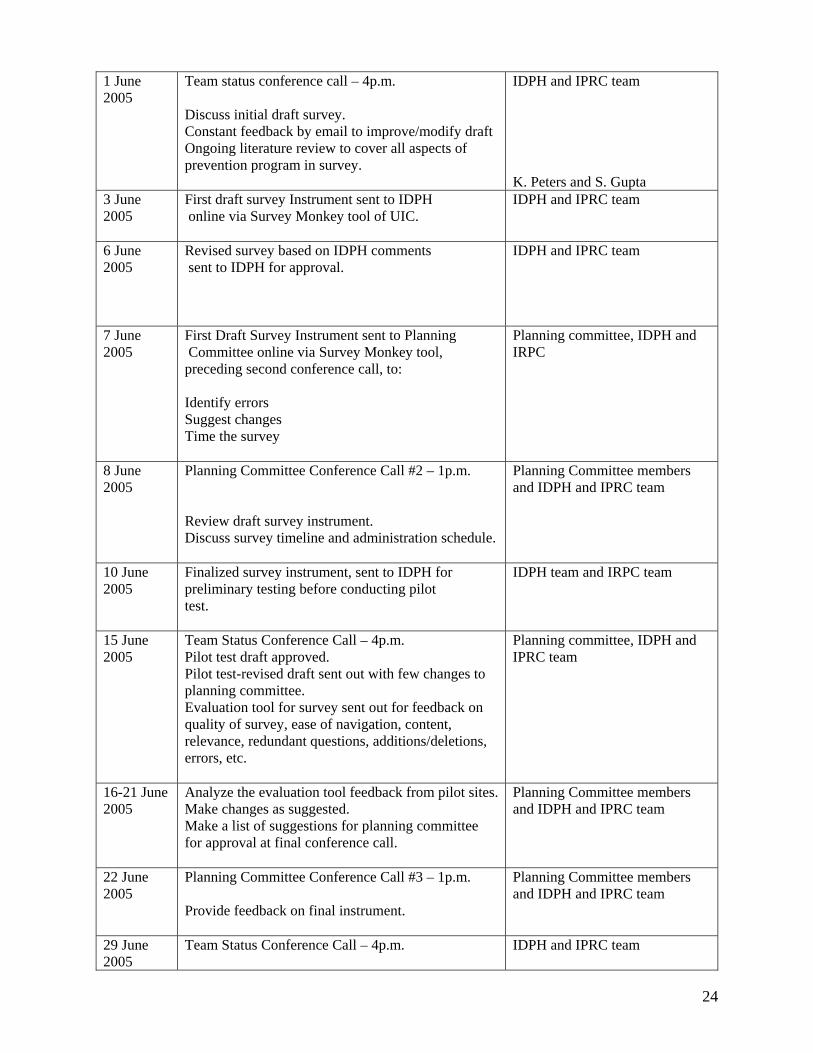
The timeline for the project is indicated in Figure 1 below: Figure 1: Timeline of Project Plan
Date Agenda Group 10 May 2005
Initial planning conference call IPRC-IDPH. Discuss priorities and sections of survey. Method of sending out Web-based survey-which tool to use. Choose expert panel members for planning committee. How to pilot test survey.
J. Harvill, L. Shaw( IDPH Team) K. Peters, B. Baldyga, S. Gupta (IPRC Team)
11 May 2005
Approval and Electronic Distribution of ‘Save the Date’ Planning Committee Conference Call. Ongoing review of literature, organization of project materials, initial drafts of survey domains and test questions.
J. Harvill, L. Shaw, K. Peters S. Gupta, K. Peters
18 May 2005
Team Status Conference Call – 4p.m. Set Agenda for May 25 conference call with expert panel and working group. Discuss question contents and format.
IDPH and IPRC team
25 May 2005
Needs Assessment Planning Committee Conference Call – 1p.m. Identify domains for survey construction. Gather suggestions for appropriate question format, survey length. Suggestions for endorsements (IDPH Director, IPHA, etc.).
IDPH, LHDs in IL, IPRC, Other state LHDs, Nonprofit organization heads
24
1 June 2005
Team status conference call – 4p.m. Discuss initial draft survey. Constant feedback by email to improve/modify draft Ongoing literature review to cover all aspects of prevention program in survey.
IDPH and IPRC team K. Peters and S. Gupta
3 June 2005
First draft survey Instrument sent to IDPH online via Survey Monkey tool of UIC.
IDPH and IPRC team
6 June 2005
Revised survey based on IDPH comments sent to IDPH for approval.
IDPH and IPRC team
7 June 2005
First Draft Survey Instrument sent to Planning Committee online via Survey Monkey tool, preceding second conference call, to: Identify errors Suggest changes Time the survey
Planning committee, IDPH and IRPC
8 June 2005
Planning Committee Conference Call #2 – 1p.m. Review draft survey instrument. Discuss survey timeline and administration schedule.
Planning Committee members and IDPH and IPRC team
10 June 2005
Finalized survey instrument, sent to IDPH for preliminary testing before conducting pilot test.
IDPH team and IRPC team
15 June 2005
Team Status Conference Call – 4p.m. Pilot test draft approved. Pilot test-revised draft sent out with few changes to planning committee. Evaluation tool for survey sent out for feedback on quality of survey, ease of navigation, content, relevance, redundant questions, additions/deletions, errors, etc.
Planning committee, IDPH and IPRC team
16-21 June 2005
Analyze the evaluation tool feedback from pilot sites. Make changes as suggested. Make a list of suggestions for planning committee for approval at final conference call.
Planning Committee members and IDPH and IPRC team
22 June 2005
Planning Committee Conference Call #3 – 1p.m. Provide feedback on final instrument.
Planning Committee members and IDPH and IPRC team
29 June 2005
Team Status Conference Call – 4p.m.
IDPH and IPRC team
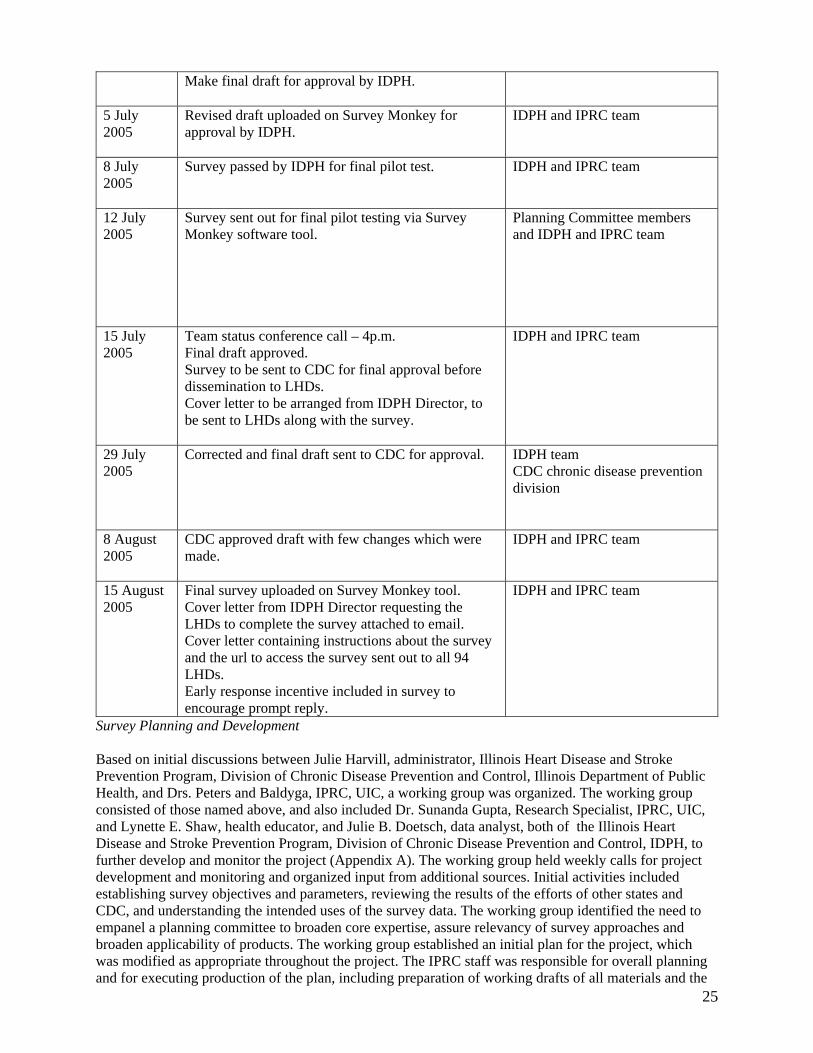
25
Make final draft for approval by IDPH.
5 July 2005
Revised draft uploaded on Survey Monkey for approval by IDPH.
IDPH and IPRC team
8 July 2005
Survey passed by IDPH for final pilot test. IDPH and IPRC team
12 July 2005
Survey sent out for final pilot testing via Survey Monkey software tool.
Planning Committee members and IDPH and IPRC team
15 July 2005
Team status conference call – 4p.m. Final draft approved. Survey to be sent to CDC for final approval before dissemination to LHDs. Cover letter to be arranged from IDPH Director, to be sent to LHDs along with the survey.
IDPH and IPRC team
29 July 2005
Corrected and final draft sent to CDC for approval.
IDPH team CDC chronic disease prevention division
8 August 2005
CDC approved draft with few changes which were made.
IDPH and IPRC team
15 August 2005
Final survey uploaded on Survey Monkey tool. Cover letter from IDPH Director requesting the LHDs to complete the survey attached to email. Cover letter containing instructions about the survey and the url to access the survey sent out to all 94 LHDs. Early response incentive included in survey to encourage prompt reply.
IDPH and IPRC team
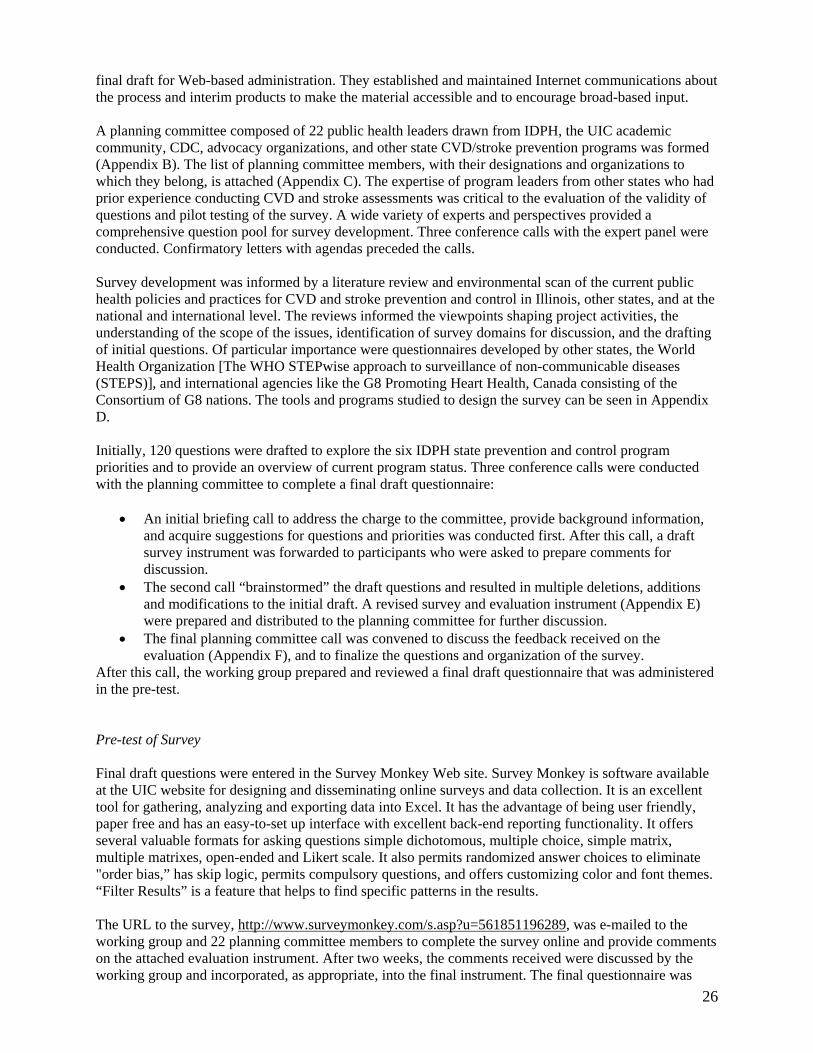
Survey Planning and Development Based on initial discussions between Julie Harvill, administrator, Illinois Heart Disease and Stroke Prevention Program, Division of Chronic Disease Prevention and Control, Illinois Department of Public Health, and Drs. Peters and Baldyga, IPRC, UIC, a working group was organized. The working group consisted of those named above, and also included Dr. Sunanda Gupta, Research Specialist, IPRC, UIC, and Lynette E. Shaw, health educator, and Julie B. Doetsch, data analyst, both of the Illinois Heart Disease and Stroke Prevention Program, Division of Chronic Disease Prevention and Control, IDPH, to further develop and monitor the project (Appendix A). The working group held weekly calls for project development and monitoring and organized input from additional sources. Initial activities included establishing survey objectives and parameters, reviewing the results of the efforts of other states and CDC, and understanding the intended uses of the survey data. The working group identified the need to empanel a planning committee to broaden core expertise, assure relevancy of survey approaches and broaden applicability of products. The working group established an initial plan for the project, which was modified as appropriate throughout the project. The IPRC staff was responsible for overall planning and for executing production of the plan, including preparation of working drafts of all materials and the
26
final draft for Web-based administration. They established and maintained Internet communications about the process and interim products to make the material accessible and to encourage broad-based input. A planning committee composed of 22 public health leaders drawn from IDPH, the UIC academic community, CDC, advocacy organizations, and other state CVD/stroke prevention programs was formed (Appendix B). The list of planning committee members, with their designations and organizations to which they belong, is attached (Appendix C). The expertise of program leaders from other states who had prior experience conducting CVD and stroke assessments was critical to the evaluation of the validity of questions and pilot testing of the survey. A wide variety of experts and perspectives provided a comprehensive question pool for survey development. Three conference calls with the expert panel were conducted. Confirmatory letters with agendas preceded the calls. Survey development was informed by a literature review and environmental scan of the current public health policies and practices for CVD and stroke prevention and control in Illinois, other states, and at the national and international level. The reviews informed the viewpoints shaping project activities, the understanding of the scope of the issues, identification of survey domains for discussion, and the drafting of initial questions. Of particular importance were questionnaires developed by other states, the World Health Organization [The WHO STEPwise approach to surveillance of non-communicable diseases (STEPS)], and international agencies like the G8 Promoting Heart Health, Canada consisting of the Consortium of G8 nations. The tools and programs studied to design the survey can be seen in Appendix D. Initially, 120 questions were drafted to explore the six IDPH state prevention and control program priorities and to provide an overview of current program status. Three conference calls were conducted with the planning committee to complete a final draft questionnaire:
• An initial briefing call to address the charge to the committee, provide background information, and acquire suggestions for questions and priorities was conducted first. After this call, a draft survey instrument was forwarded to participants who were asked to prepare comments for discussion.
• The second call “brainstormed” the draft questions and resulted in multiple deletions, additions and modifications to the initial draft. A revised survey and evaluation instrument (Appendix E) were prepared and distributed to the planning committee for further discussion.
• The final planning committee call was convened to discuss the feedback received on the evaluation (Appendix F), and to finalize the questions and organization of the survey.
After this call, the working group prepared and reviewed a final draft questionnaire that was administered in the pre-test. Pre-test of Survey Final draft questions were entered in the Survey Monkey Web site. Survey Monkey is software available at the UIC website for designing and disseminating online surveys and data collection. It is an excellent tool for gathering, analyzing and exporting data into Excel. It has the advantage of being user friendly, paper free and has an easy-to-set up interface with excellent back-end reporting functionality. It offers several valuable formats for asking questions simple dichotomous, multiple choice, simple matrix, multiple matrixes, open-ended and Likert scale. It also permits randomized answer choices to eliminate "order bias,” has skip logic, permits compulsory questions, and offers customizing color and font themes. “Filter Results” is a feature that helps to find specific patterns in the results. The URL to the survey, http://www.surveymonkey.com/s.asp?u=561851196289, was e-mailed to the working group and 22 planning committee members to complete the survey online and provide comments on the attached evaluation instrument. After two weeks, the comments received were discussed by the working group and incorporated, as appropriate, into the final instrument. The final questionnaire was
27
sent to Belinda O. Minta, Public Health Educator, Cardiovascular Health Branch, U.S. Centers for Disease Control and Prevention for review and comment with the evaluation instrument (Appendix G). Survey Implementation The final survey consisted of 59 questions. Response choices included dichotomous, multiple choice, response matrices, Likert scales and open-ended responses. The survey was comprised of 10 sections with the following characteristics:
1. General introductory questions—responses indicate who completed the survey, agency characteristics, agency priorities, collaborators, educational activities and communication strategies (Q1-13).
2. Screening for High Blood Pressure (HBP)—this section has questions pertaining to the methods and collaborations used to conduct blood pressure screening and follow-up, educational materials used, populations covered and training received to conduct screening/train others to provide screening (Q14-24).
3. Screening for cholesterol—this section has questions pertaining to the methods and collaborations used to conduct cholesterol screening and follow-up, educational materials used, populations covered and training received to conduct screening/train others to provide screening (Q25-34).
4. Signs and symptoms of heart attack/stroke—asks where, when and how the public awareness campaign is conducted (Q35-38).
5. Improve emergency response—asks about awareness of automated external defibrillators (AEDs) and cardio pulmonary resuscitation (CPR) and 911 facilities (Q39-43).
6. Improve quality of care—availability of centers accredited by American Heart Association, American Stroke Association and National Institutes for Neurological Diseases and Stroke in their area, provision of rehabilitative care and collaboration with hospitals to improve care (Q44-45).
7. Disparities—measures available to reduce disparities in access to heart disease and stroke prevention, provided by the LHDs (Q46-49).
8. Training—measures existing training for implementing the heart disease and stroke prevention programs (Q50-55).
9. Data—the use of data for the heart disease and stroke prevention program in the LHDs (Q56). 10. Closing Questions—respondents were asked to identify factors restricting the reach of the
program and suggestions about the needs for improving impact of the program (Q57-59). A final copy of the survey is attached with the appendices, in PDF format (Appendix H). Survey Deployment On August 15, 2005, a letter (Appendix I), signed by Dr. Eric E. Whitaker, director, IDPH, encouraging the 94 LHDs to complete the survey, was sent as an attachment to a joint e-mail from Karen E. Peters, principal investigator, IRPC, UIC, Chicago, and Julie A. Harvill, administrator, Illinois Heart Disease and Stroke Prevention Program, Division of Chronic Disease Prevention and Control, IDPH (Appendix J). This e-mail was sent out to the administrators of the 94 LHDs in Illinois (Appendix K). The cover letter(s) explained the purpose and importance of the survey, contained the URL of the Survey Monkey to access the survey: http://www.surveymonkey.com/s.asp?u=561851196289 , encouraged participation, affirmed confidentiality, and described the use of the survey for planning and resource development. Analysis and Dissemination The data from the survey are reported in 10 sections: 1) General Section, 2) Screening for High Blood Pressure (HBP), 3 )Screening for Cholesterol, 4) Know Signs and Symptoms of Heart Attack/Stroke 5) Improve Emergency Response, 6) Improve Quality of Care, 7) Disparities, 8) Training, 9)Data and 10) Closing Questions
28
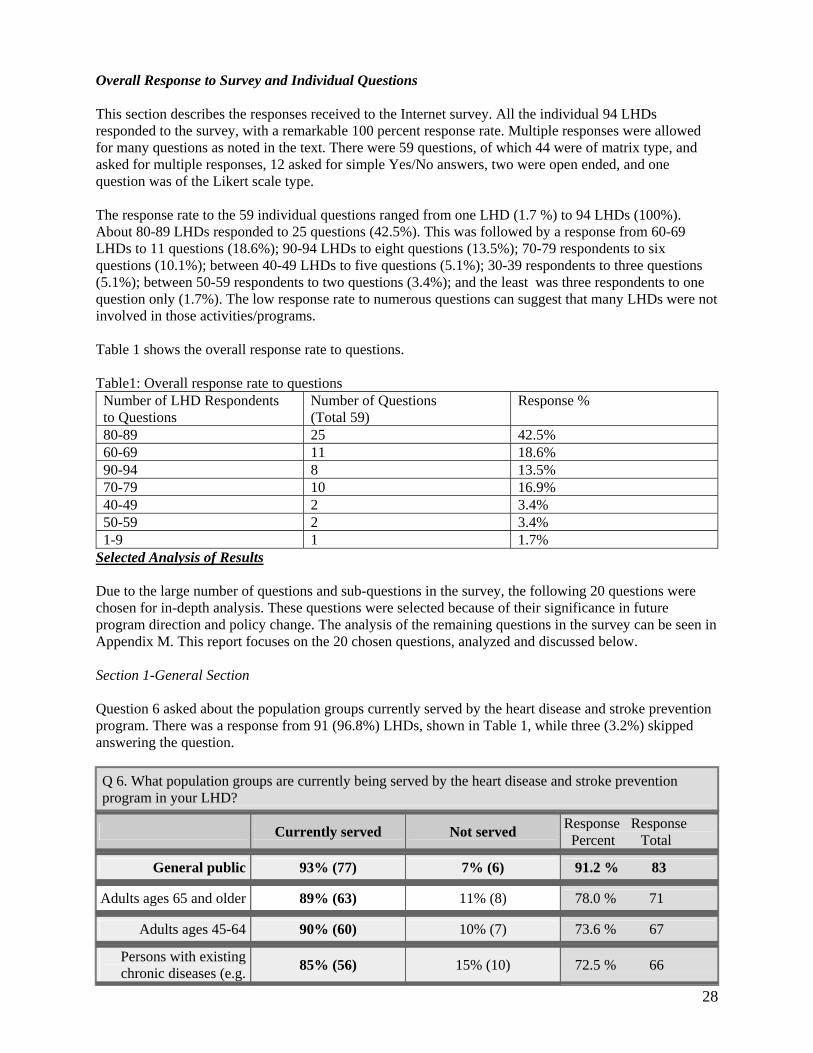
Overall Response to Survey and Individual Questions This section describes the responses received to the Internet survey. All the individual 94 LHDs responded to the survey, with a remarkable 100 percent response rate. Multiple responses were allowed for many questions as noted in the text. There were 59 questions, of which 44 were of matrix type, and asked for multiple responses, 12 asked for simple Yes/No answers, two were open ended, and one question was of the Likert scale type. The response rate to the 59 individual questions ranged from one LHD (1.7 %) to 94 LHDs (100%). About 80-89 LHDs responded to 25 questions (42.5%). This was followed by a response from 60-69 LHDs to 11 questions (18.6%); 90-94 LHDs to eight questions (13.5%); 70-79 respondents to six questions (10.1%); between 40-49 LHDs to five questions (5.1%); 30-39 respondents to three questions (5.1%); between 50-59 respondents to two questions (3.4%); and the least was three respondents to one question only (1.7%). The low response rate to numerous questions can suggest that many LHDs were not involved in those activities/programs. Table 1 shows the overall response rate to questions. Table1: Overall response rate to questions
Number of LHD Respondents to Questions
Number of Questions (Total 59)
Response %
80-89 25 42.5% 60-69 11 18.6% 90-94 8 13.5% 70-79 10 16.9% 40-49 2 3.4% 50-59 2 3.4% 1-9 1 1.7%
Selected Analysis of Results Due to the large number of questions and sub-questions in the survey, the following 20 questions were chosen for in-depth analysis. These questions were selected because of their significance in future program direction and policy change. The analysis of the remaining questions in the survey can be seen in Appendix M. This report focuses on the 20 chosen questions, analyzed and discussed below. Section 1-General Section Question 6 asked about the population groups currently served by the heart disease and stroke prevention program. There was a response from 91 (96.8%) LHDs, shown in Table 1, while three (3.2%) skipped answering the question.
Q 6. What population groups are currently being served by the heart disease and stroke prevention program in your LHD?
Currently served Not served Response Response Percent Total
General public 93% (77) 7% (6) 91.2 % 83
Adults ages 65 and older 89% (63) 11% (8) 78.0 % 71
Adults ages 45-64 90% (60) 10% (7) 73.6 % 67
Persons with existing chronic diseases (e.g. 85% (56) 15% (10) 72.5 % 66
29
hypertension, diabetes)
Medicaid recipients 83% (54) 17% (11) 71.4 % 65
Adults ages 18-44 89% (58) 11% (7) 71.4 % 65
Medicare recipients 81% (51) 19% (12) 69.2 % 63
Only females (targeted by specific programs)
77% (48) 23% (14) 68.1 % 62
Rural residents 78% (46) 22% (13) 64.8 % 59
Students (K-12) 64% (37) 36% (21) 63.7 % 58
At risk groups (e.g. obese, poor diet, high
stress)
81% (47) 19% (11) 63.7 % 58
Specific racial/ethnic groups
53% (28) 47% (25) 58.2 % 53
Low socioeconomic status groups
83% (44) 17% (9) 58.2% 53
Uninsured 77% (41) 23% (12) 58.2% 53
Non-English speakers 40% (19) 60% (29) 52.7% 48
Stroke/heart attack support groups
25% (11) 75% (33) 48.4% 44
People with disabilities 60% (26) 40% (17) 47.3% 43
Only males (targeted by specific programs)
21% (8) 79% (31) 42.9% 39
WISE WOMAN enrollees
28% (11) 72% (28) 42.9% 39
Migrant workers 13% (5) 87% (33) 41.8% 38
Other 35% (6) 65% (11) 18.7% 17
Total Respondents 91
(skipped this question) 3
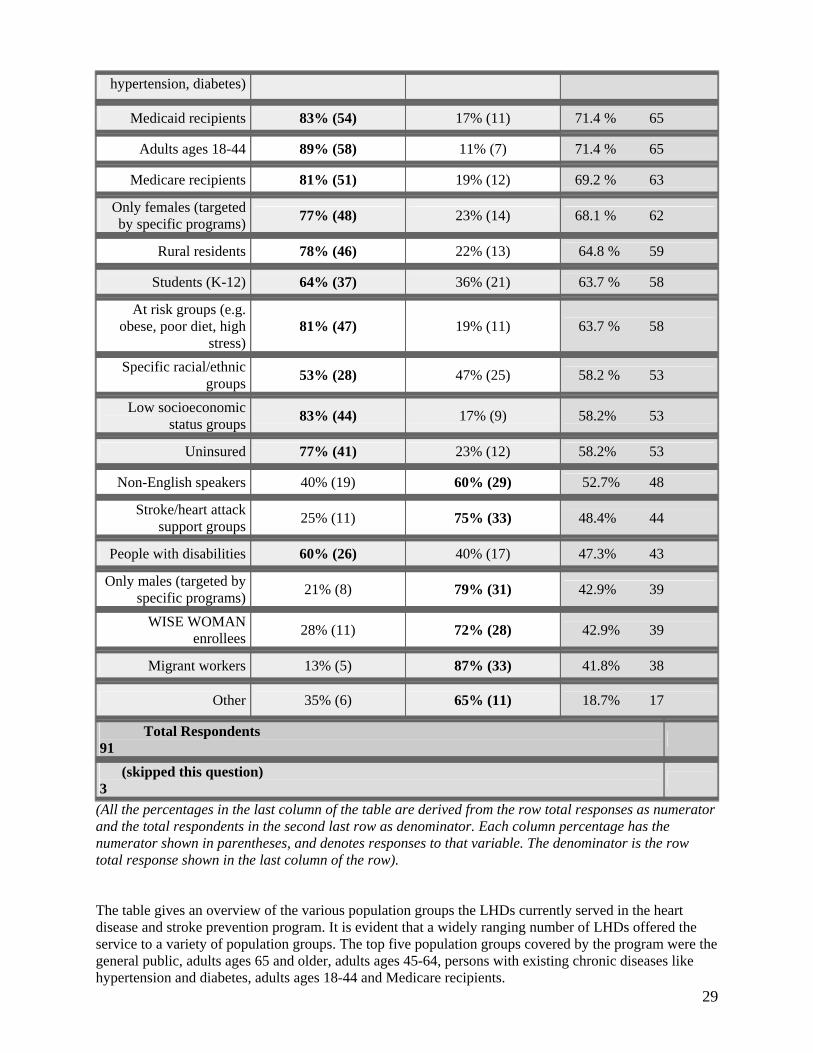
(All the percentages in the last column of the table are derived from the row total responses as numerator and the total respondents in the second last row as denominator. Each column percentage has the numerator shown in parentheses, and denotes responses to that variable. The denominator is the row total response shown in the last column of the row). The table gives an overview of the various population groups the LHDs currently served in the heart disease and stroke prevention program. It is evident that a widely ranging number of LHDs offered the service to a variety of population groups. The top five population groups covered by the program were the general public, adults ages 65 and older, adults ages 45-64, persons with existing chronic diseases like hypertension and diabetes, adults ages 18-44 and Medicare recipients.
30
The maximum response was for the ‘general public’ group [77(93%) of 83 LHD respondents], which may be taken to indicate that the program offered services to all LHD clients, regardless of age or other factors. The next largest group covered was adults age 65 and older [65 LHDs (100%) of 65 respondents], and adults ages 45-64 [61 LHDs (97%) of 63 respondents]. The least coverage was for groups covered by special programs like WISEWOMAN [16 LHDs (37%) of 43 respondents), which indicates that these special programs have a limited coverage as they are governed by study guidelines and funds. The variations in response can mean that the LHDs were not maintaining data according to the groups mentioned in the table, or that there were no specific programs targeting these groups. The coverage of Medicare patients was reported by 51 LHDs [51 (81%) of 63 respondents]. At risk groups, composed of people with obesity, poor diet etc. were reportedly covered by 47 LHDs [47 (81%) of 58 respondents). Students from kindergarten to grade 12 were covered by 37 LHDs [37 (64%) of 58 respondents], and adults ages 18-44 were served by 58 LHDs [58 (89%) of 65 respondents]. These figures indicate that though a fair number of LHDs served community members from these groups, there is scope for improving services, as these groups constitute the ones who would benefit the most from preventive and screening services. Schoolchildren are an easily accessible group, and it may be desirable to offer a single BP screening and education program to all students before they graduate. Prehypertension and high blood cholesterol are known to start at a comparatively younger age, and screening people in the age group 18-44 is vital for early detection, treatment and prevention of HBP and high cholesterol, and their long-term complications of heart disease and stroke. From the table, it is evident that the groups from low socioeconomic status [44 LHDs (83%) of 53 respondents], the disabled [26 LHDs (60%) of 43 respondents], and the uninsured [41 LHDs (77%) of 53 respondents] were not very well served by LHDs. Specific racial/ethnic groups [28 LHDs (53%) of 53 respondents], non-English speakers [19 LHDs (40%) of 48 respondents]; rural residents [46 LHDs (78%) of 59 respondents], migrant workers [five LHDs (13%) of 38 respondents], and stoke/heart attack support groups [11 LHDs (25%) of 44 respondents] were also not as well served by the LHDs. The lack of response by more than 40-50 percent of LHDs to these specific questions may indicate that either they were not offering services to these groups, or they did not have the data classified into these groups. Overall, these figures indicate that the maximum coverage was offered to the public, regardless of age or pre-existing disease. This reflects the current policy that all those attending the LHD should be screened for HBP and cholesterol. The majority (96.8%) of LHDs were providing the services for heart disease and stroke prevention. However, analysis reveals that some groups were not as well served as others, particularly the socially and economically deprived and non-English speakers. The table reflects the disparities in health care that exist due to the acknowledged socio-economic, racial, ethnic and language barriers. Migrant workers were the least covered group. Reduction in health disparities is one of the components of the state heart disease and stroke prevention program, and these figures indicate the need to enhance targeted services to these disadvantaged groups. In general, there is a need to improve servicesto all the population groups and to some groups in particular.
31
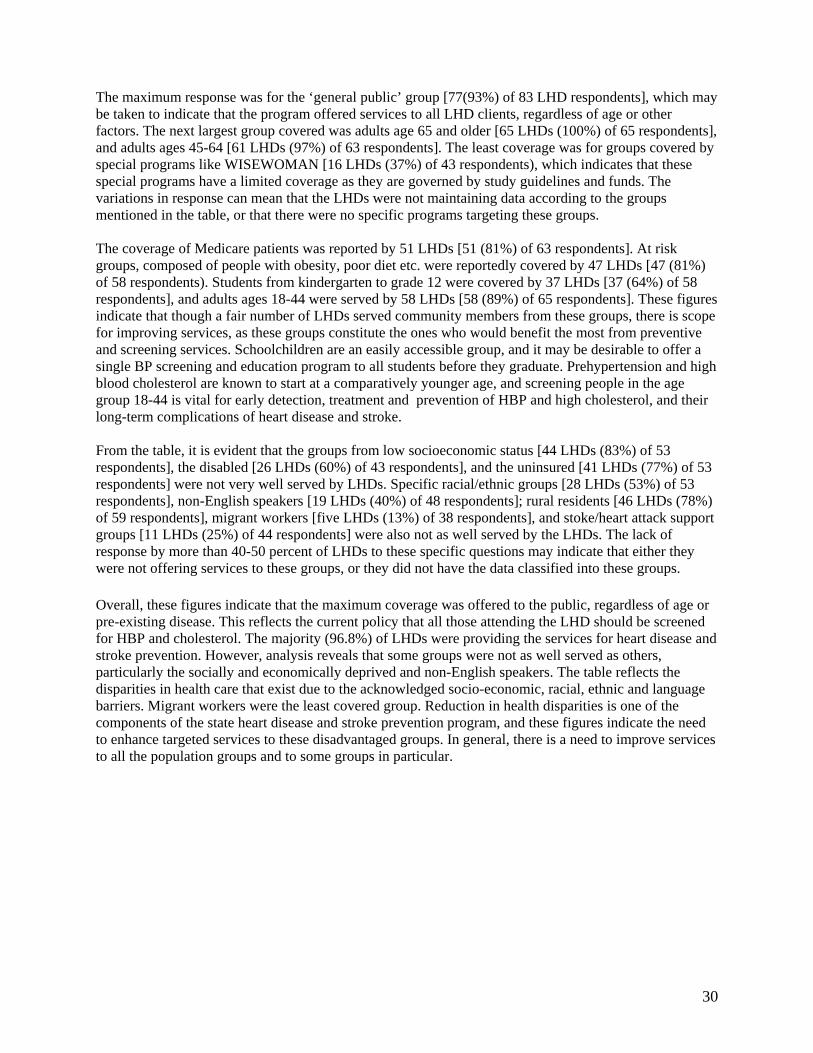
Question 11 dealt with the participation of LHDs in other programs, and coalitions with other organizations involved in heart disease and stroke prevention. The number of LHDs which responded was 86 (91.5 %), with eight non-responders (8.5%).
Q11. Does your LHD participate in any of the following programs/coalitions?
Response Percent
Response Total
None of the above 62.8% 54
Other 19.8% 17
Get with the Guidelines (American Heart Association) 17.4% 15
HRSA / Bureau of Preventive Health Care Health DisparitiesCollaborative 5.8% 5
Heart Check 4.7% 4 Policy and Environmental Communication Guide(CDC) 3.5% 3 Guidelines Applied in Practice (American College of Cardiology) 1.2% 1 Brain Attack Coalition (BAC) 1.2% 1
Making the Business Case to Employers for Cardiovascular Health 1.2% 1 Patient Management System 0% 0
NINDS Know Stroke (National Institute of Neurological Disorders andStroke) 0% 0
Total Respondents 86
(skipped this question) 8 (All the percentages in the table are derived from the row total responses as numerator and the total respondents in the second last row as denominator.) From the table, it is evident that of the 86 LHDs which responded, more than half (62.8%) did not participate in any of the mentioned programs. The highest response was from 17 LHDs [17 (19.8%) of 86 respondents] in the category of ‘other,’ or programs not included in the list. The ‘other’ programs included Red Cross, local diabetes coalition, Heartwalk, local prevention coalitions in community, Heart Smart for Women, monthly clinics on heart disease and stroke prevention with other organizations (not specified) and Heart Smart for Women. Two reported participating in Healthier Communities Partnership programs, of which one specified the Cardiovascular Disease Committee. Other programs mentioned were Wellness Warriors Millennium Neighborhood Project, Heart and Stroke Network, Women Out Walking, Action for Healthy Kids Coalition, Red Dress Campaign, STOP Coalition, Coordinated Approach to Child Health (Catch), and a few similar ones. Two LHDs reported participation in more than one program. Fifteen LHDs [ 15 (17.4%) of 86 respondents] reported participating with the Get with The Guidelines program of the American Heart Association, and five LHDs [ 5 (5.8.4%) of 86 respondents] with the Health Resources and Services Administrations / Bureau of Preventive Health Care Health Disparities Collaborative. Four LHDs [4 (4.7%) of 86 respondents] participated in the Heart Check program, and three LHDs [3 (3.5%) of 86 respondents] in the Policy and Environmental Communication Guide of the CDC. One LHD each [one (1.2%) of 86 respondents] reported participating with Guidelines Applied in
32
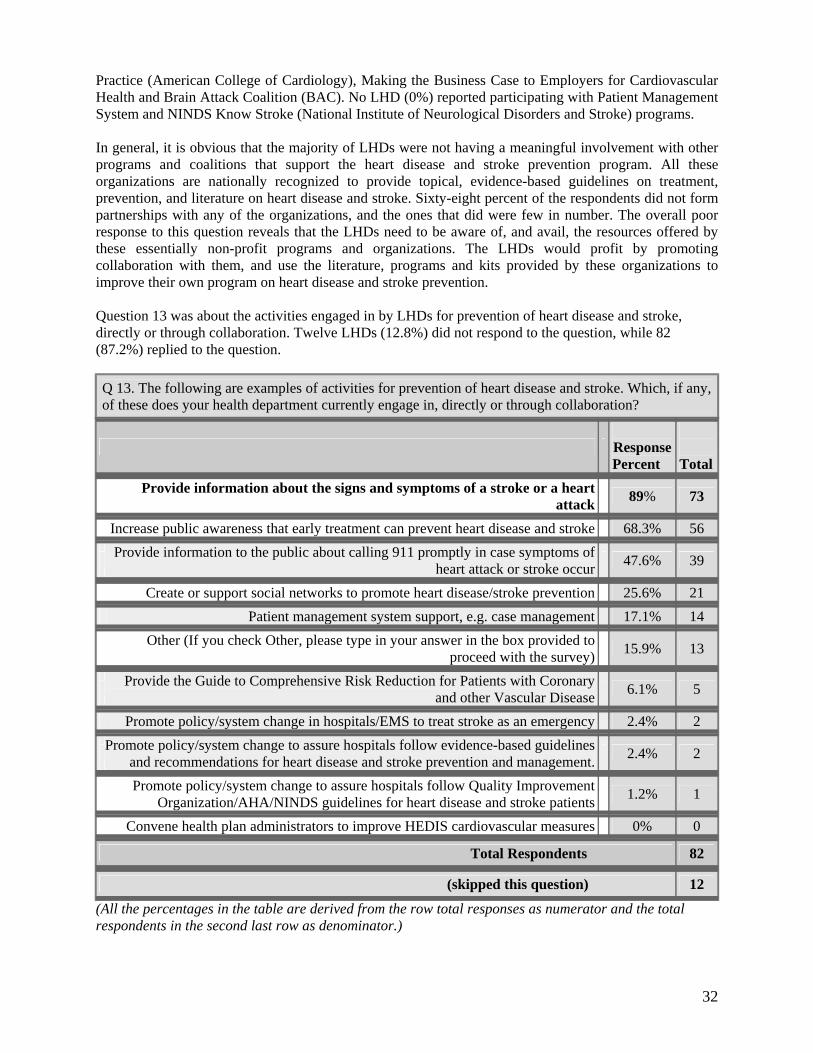
Practice (American College of Cardiology), Making the Business Case to Employers for Cardiovascular Health and Brain Attack Coalition (BAC). No LHD (0%) reported participating with Patient Management System and NINDS Know Stroke (National Institute of Neurological Disorders and Stroke) programs. In general, it is obvious that the majority of LHDs were not having a meaningful involvement with other programs and coalitions that support the heart disease and stroke prevention program. All these organizations are nationally recognized to provide topical, evidence-based guidelines on treatment, prevention, and literature on heart disease and stroke. Sixty-eight percent of the respondents did not form partnerships with any of the organizations, and the ones that did were few in number. The overall poor response to this question reveals that the LHDs need to be aware of, and avail, the resources offered by these essentially non-profit programs and organizations. The LHDs would profit by promoting collaboration with them, and use the literature, programs and kits provided by these organizations to improve their own program on heart disease and stroke prevention. Question 13 was about the activities engaged in by LHDs for prevention of heart disease and stroke, directly or through collaboration. Twelve LHDs (12.8%) did not respond to the question, while 82 (87.2%) replied to the question.
Q 13. The following are examples of activities for prevention of heart disease and stroke. Which, if any, of these does your health department currently engage in, directly or through collaboration?
Response Percent
Total
Provide information about the signs and symptoms of a stroke or a heart
attack 89% 73
Increase public awareness that early treatment can prevent heart disease and stroke 68.3% 56
Provide information to the public about calling 911 promptly in case symptoms of
heart attack or stroke occur 47.6% 39
Create or support social networks to promote heart disease/stroke prevention 25.6% 21
Patient management system support, e.g. case management 17.1% 14
Other (If you check Other, please type in your answer in the box provided toproceed with the survey)
15.9% 13
Provide the Guide to Comprehensive Risk Reduction for Patients with Coronary
and other Vascular Disease 6.1% 5
Promote policy/system change in hospitals/EMS to treat stroke as an emergency 2.4% 2
Promote policy/system change to assure hospitals follow evidence-based guidelines
and recommendations for heart disease and stroke prevention and management. 2.4% 2
Promote policy/system change to assure hospitals follow Quality Improvement
Organization/AHA/NINDS guidelines for heart disease and stroke patients 1.2% 1
Convene health plan administrators to improve HEDIS cardiovascular measures 0% 0
Total Respondents 82
(skipped this question) 12 (All the percentages in the table are derived from the row total responses as numerator and the total respondents in the second last row as denominator.)
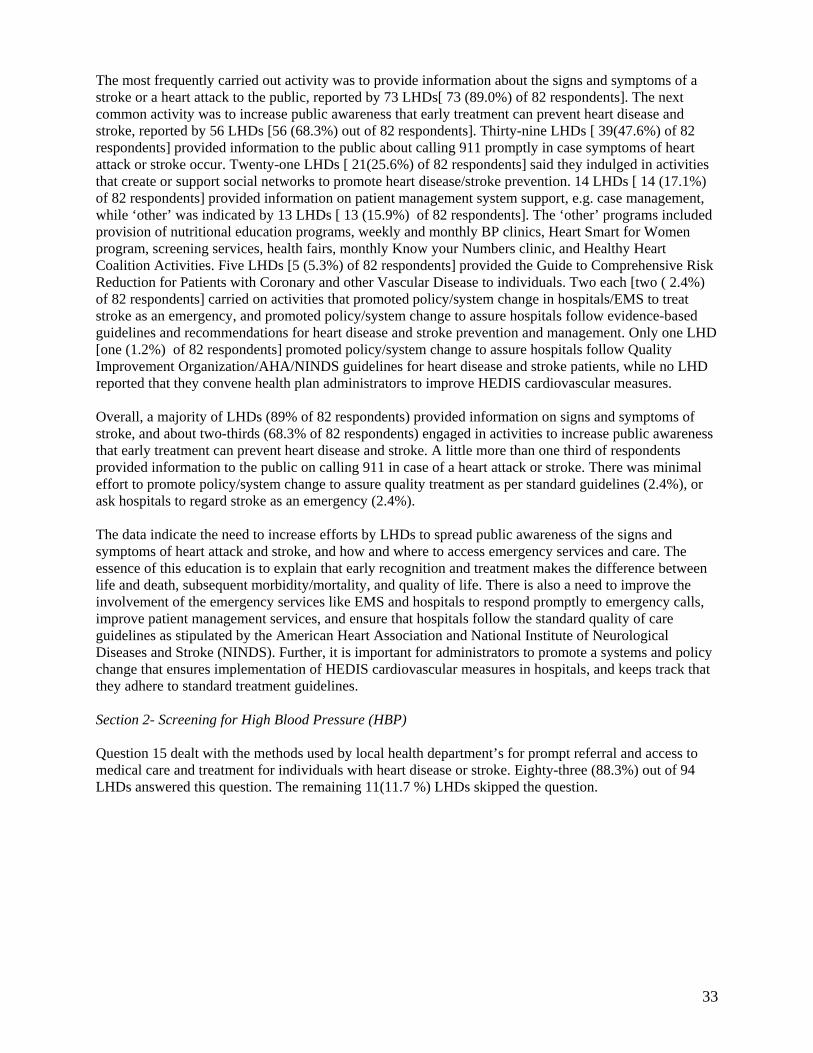
33
The most frequently carried out activity was to provide information about the signs and symptoms of a stroke or a heart attack to the public, reported by 73 LHDs[ 73 (89.0%) of 82 respondents]. The next common activity was to increase public awareness that early treatment can prevent heart disease and stroke, reported by 56 LHDs [56 (68.3%) out of 82 respondents]. Thirty-nine LHDs [ 39(47.6%) of 82 respondents] provided information to the public about calling 911 promptly in case symptoms of heart attack or stroke occur. Twenty-one LHDs [ 21(25.6%) of 82 respondents] said they indulged in activities that create or support social networks to promote heart disease/stroke prevention. 14 LHDs [ 14 (17.1%) of 82 respondents] provided information on patient management system support, e.g. case management, while ‘other’ was indicated by 13 LHDs [ 13 (15.9%) of 82 respondents]. The ‘other’ programs included provision of nutritional education programs, weekly and monthly BP clinics, Heart Smart for Women program, screening services, health fairs, monthly Know your Numbers clinic, and Healthy Heart Coalition Activities. Five LHDs [5 (5.3%) of 82 respondents] provided the Guide to Comprehensive Risk Reduction for Patients with Coronary and other Vascular Disease to individuals. Two each [two ( 2.4%) of 82 respondents] carried on activities that promoted policy/system change in hospitals/EMS to treat stroke as an emergency, and promoted policy/system change to assure hospitals follow evidence-based guidelines and recommendations for heart disease and stroke prevention and management. Only one LHD [one (1.2%) of 82 respondents] promoted policy/system change to assure hospitals follow Quality Improvement Organization/AHA/NINDS guidelines for heart disease and stroke patients, while no LHD reported that they convene health plan administrators to improve HEDIS cardiovascular measures. Overall, a majority of LHDs (89% of 82 respondents) provided information on signs and symptoms of stroke, and about two-thirds (68.3% of 82 respondents) engaged in activities to increase public awareness that early treatment can prevent heart disease and stroke. A little more than one third of respondents provided information to the public on calling 911 in case of a heart attack or stroke. There was minimal effort to promote policy/system change to assure quality treatment as per standard guidelines (2.4%), or ask hospitals to regard stroke as an emergency (2.4%). The data indicate the need to increase efforts by LHDs to spread public awareness of the signs and symptoms of heart attack and stroke, and how and where to access emergency services and care. The essence of this education is to explain that early recognition and treatment makes the difference between life and death, subsequent morbidity/mortality, and quality of life. There is also a need to improve the involvement of the emergency services like EMS and hospitals to respond promptly to emergency calls, improve patient management services, and ensure that hospitals follow the standard quality of care guidelines as stipulated by the American Heart Association and National Institute of Neurological Diseases and Stroke (NINDS). Further, it is important for administrators to promote a systems and policy change that ensures implementation of HEDIS cardiovascular measures in hospitals, and keeps track that they adhere to standard treatment guidelines. Section 2- Screening for High Blood Pressure (HBP) Question 15 dealt with the methods used by local health department’s for prompt referral and access to medical care and treatment for individuals with heart disease or stroke. Eighty-three (88.3%) out of 94 LHDs answered this question. The remaining 11(11.7 %) LHDs skipped the question.
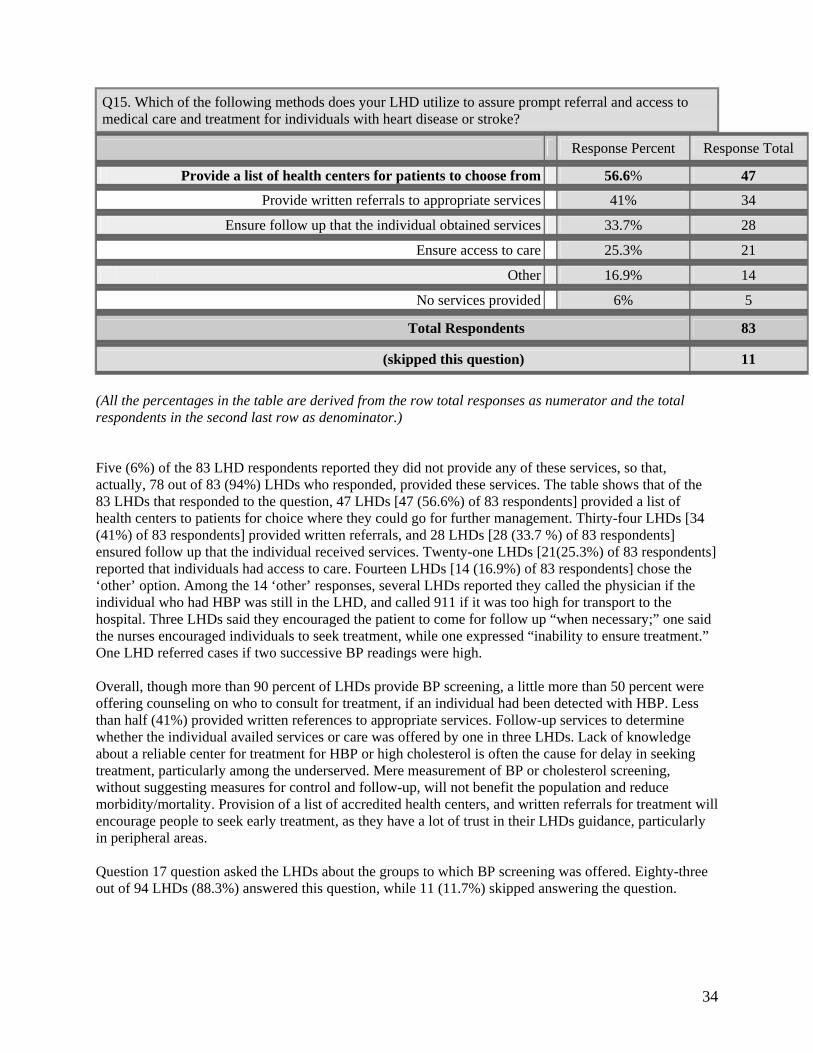
34
Q15. Which of the following methods does your LHD utilize to assure prompt referral and access to medical care and treatment for individuals with heart disease or stroke?
(All the percentages in the table are derived from the row total responses as numerator and the total respondents in the second last row as denominator.) Five (6%) of the 83 LHD respondents reported they did not provide any of these services, so that, actually, 78 out of 83 (94%) LHDs who responded, provided these services. The table shows that of the 83 LHDs that responded to the question, 47 LHDs [47 (56.6%) of 83 respondents] provided a list of health centers to patients for choice where they could go for further management. Thirty-four LHDs [34 (41%) of 83 respondents] provided written referrals, and 28 LHDs [28 (33.7 %) of 83 respondents] ensured follow up that the individual received services. Twenty-one LHDs [21(25.3%) of 83 respondents] reported that individuals had access to care. Fourteen LHDs [14 (16.9%) of 83 respondents] chose the ‘other’ option. Among the 14 ‘other’ responses, several LHDs reported they called the physician if the individual who had HBP was still in the LHD, and called 911 if it was too high for transport to the hospital. Three LHDs said they encouraged the patient to come for follow up “when necessary;” one said the nurses encouraged individuals to seek treatment, while one expressed “inability to ensure treatment.” One LHD referred cases if two successive BP readings were high. Overall, though more than 90 percent of LHDs provide BP screening, a little more than 50 percent were offering counseling on who to consult for treatment, if an individual had been detected with HBP. Less than half (41%) provided written references to appropriate services. Follow-up services to determine whether the individual availed services or care was offered by one in three LHDs. Lack of knowledge about a reliable center for treatment for HBP or high cholesterol is often the cause for delay in seeking treatment, particularly among the underserved. Mere measurement of BP or cholesterol screening, without suggesting measures for control and follow-up, will not benefit the population and reduce morbidity/mortality. Provision of a list of accredited health centers, and written referrals for treatment will encourage people to seek early treatment, as they have a lot of trust in their LHDs guidance, particularly in peripheral areas. Question 17 question asked the LHDs about the groups to which BP screening was offered. Eighty-three out of 94 LHDs (88.3%) answered this question, while 11 (11.7%) skipped answering the question.
Response Percent Response Total
Provide a list of health centers for patients to choose from 56.6% 47
Provide written referrals to appropriate services 41% 34
Ensure follow up that the individual obtained services 33.7% 28
Ensure access to care 25.3% 21
Other 16.9% 14
No services provided 6% 5
Total Respondents 83
(skipped this question) 11
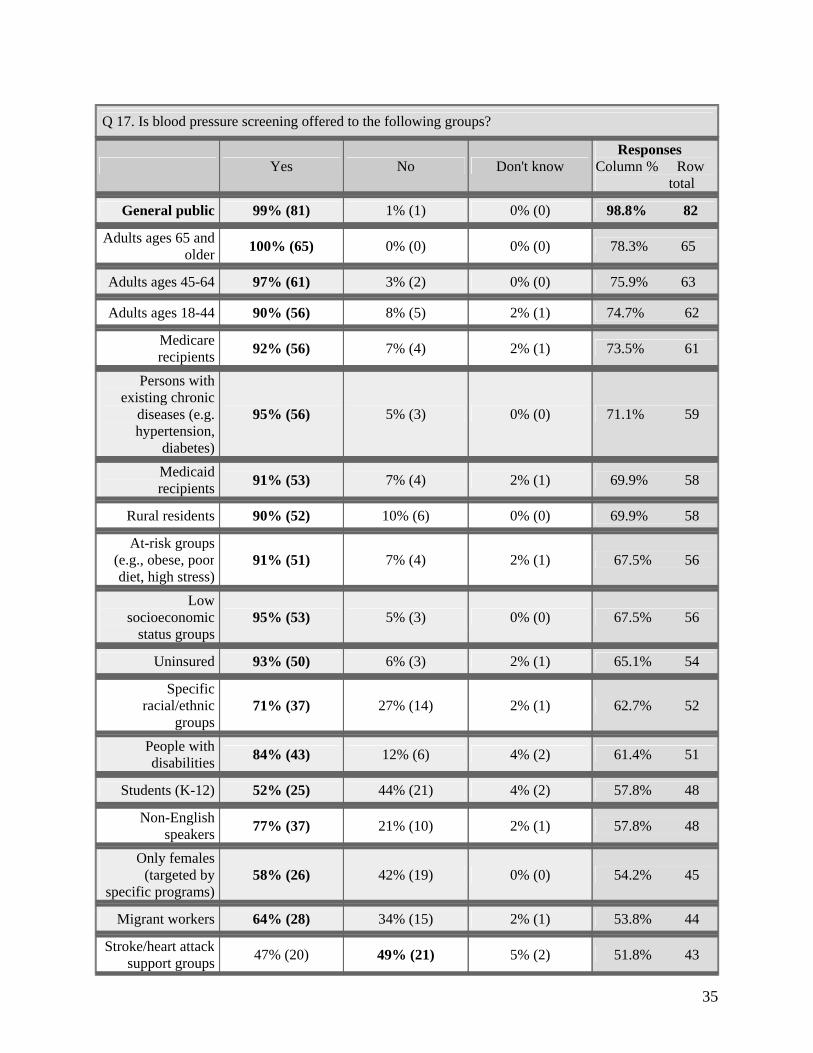
35
Q 17. Is blood pressure screening offered to the following groups?
Yes No Don't know Responses Column % Row total
General public 99% (81) 1% (1) 0% (0) 98.8% 82
Adults ages 65 and older
100% (65) 0% (0) 0% (0) 78.3% 65
Adults ages 45-64 97% (61) 3% (2) 0% (0) 75.9% 63
Adults ages 18-44 90% (56) 8% (5) 2% (1) 74.7% 62
Medicare recipients
92% (56) 7% (4) 2% (1) 73.5% 61
Persons with existing chronic
diseases (e.g. hypertension,
diabetes)
95% (56) 5% (3) 0% (0) 71.1% 59
Medicaid recipients
91% (53) 7% (4) 2% (1) 69.9% 58
Rural residents 90% (52) 10% (6) 0% (0) 69.9% 58
At-risk groups (e.g., obese, poor diet, high stress)
91% (51) 7% (4) 2% (1) 67.5% 56
Low socioeconomic
status groups 95% (53) 5% (3) 0% (0) 67.5% 56
Uninsured 93% (50) 6% (3) 2% (1) 65.1% 54
Specific racial/ethnic
groups 71% (37) 27% (14) 2% (1) 62.7% 52
People with disabilities
84% (43) 12% (6) 4% (2) 61.4% 51
Students (K-12) 52% (25) 44% (21) 4% (2) 57.8% 48
Non-English speakers
77% (37) 21% (10) 2% (1) 57.8% 48
Only females (targeted by
specific programs) 58% (26) 42% (19) 0% (0) 54.2% 45
Migrant workers 64% (28) 34% (15) 2% (1) 53.8% 44
Stroke/heart attack support groups
47% (20) 49% (21) 5% (2) 51.8% 43
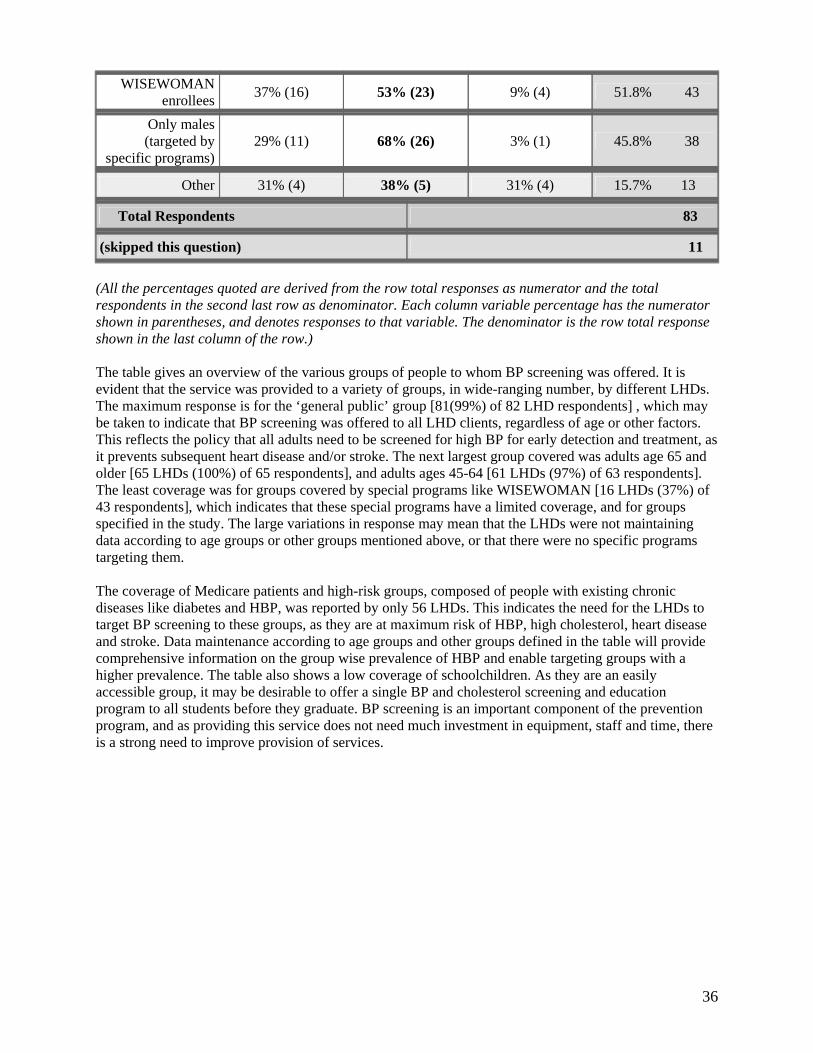
36
WISEWOMAN enrollees
37% (16) 53% (23) 9% (4) 51.8% 43
Only males (targeted by
specific programs) 29% (11) 68% (26) 3% (1) 45.8% 38
Other 31% (4) 38% (5) 31% (4) 15.7% 13
Total Respondents 83
(skipped this question) 11 (All the percentages quoted are derived from the row total responses as numerator and the total respondents in the second last row as denominator. Each column variable percentage has the numerator shown in parentheses, and denotes responses to that variable. The denominator is the row total response shown in the last column of the row.) The table gives an overview of the various groups of people to whom BP screening was offered. It is evident that the service was provided to a variety of groups, in wide-ranging number, by different LHDs. The maximum response is for the ‘general public’ group [81(99%) of 82 LHD respondents] , which may be taken to indicate that BP screening was offered to all LHD clients, regardless of age or other factors. This reflects the policy that all adults need to be screened for high BP for early detection and treatment, as it prevents subsequent heart disease and/or stroke. The next largest group covered was adults age 65 and older [65 LHDs (100%) of 65 respondents], and adults ages 45-64 [61 LHDs (97%) of 63 respondents]. The least coverage was for groups covered by special programs like WISEWOMAN [16 LHDs (37%) of 43 respondents], which indicates that these special programs have a limited coverage, and for groups specified in the study. The large variations in response may mean that the LHDs were not maintaining data according to age groups or other groups mentioned above, or that there were no specific programs targeting them. The coverage of Medicare patients and high-risk groups, composed of people with existing chronic diseases like diabetes and HBP, was reported by only 56 LHDs. This indicates the need for the LHDs to target BP screening to these groups, as they are at maximum risk of HBP, high cholesterol, heart disease and stroke. Data maintenance according to age groups and other groups defined in the table will provide comprehensive information on the group wise prevalence of HBP and enable targeting groups with a higher prevalence. The table also shows a low coverage of schoolchildren. As they are an easily accessible group, it may be desirable to offer a single BP and cholesterol screening and education program to all students before they graduate. BP screening is an important component of the prevention program, and as providing this service does not need much investment in equipment, staff and time, there is a strong need to improve provision of services.
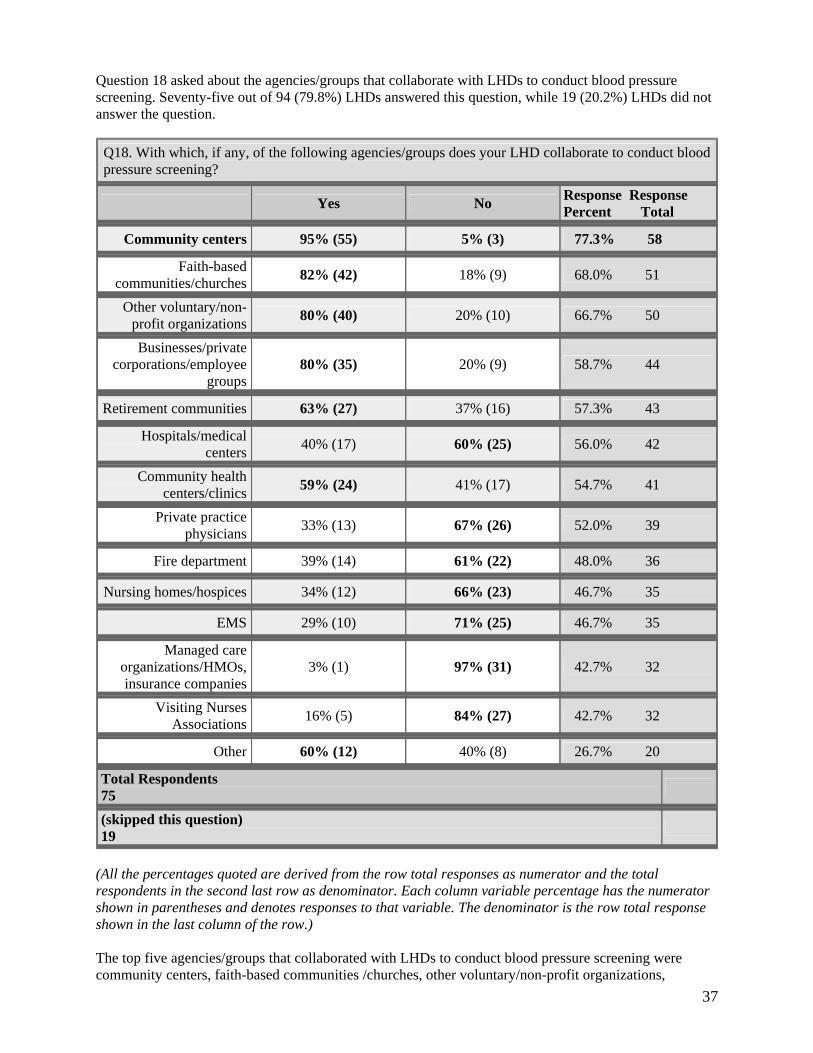
37
Question 18 asked about the agencies/groups that collaborate with LHDs to conduct blood pressure screening. Seventy-five out of 94 (79.8%) LHDs answered this question, while 19 (20.2%) LHDs did not answer the question.
Q18. With which, if any, of the following agencies/groups does your LHD collaborate to conduct blood pressure screening?
Yes No Response Response Percent Total
Community centers 95% (55) 5% (3) 77.3% 58
Faith-based communities/churches
82% (42) 18% (9) 68.0% 51
Other voluntary/non-profit organizations
80% (40) 20% (10) 66.7% 50
Businesses/privatecorporations/employee
groups 80% (35) 20% (9) 58.7% 44
Retirement communities 63% (27) 37% (16) 57.3% 43
Hospitals/medicalcenters
40% (17) 60% (25) 56.0% 42
Community healthcenters/clinics
59% (24) 41% (17) 54.7% 41
Private practicephysicians
33% (13) 67% (26) 52.0% 39
Fire department 39% (14) 61% (22) 48.0% 36
Nursing homes/hospices 34% (12) 66% (23) 46.7% 35
EMS 29% (10) 71% (25) 46.7% 35
Managed careorganizations/HMOs,insurance companies
3% (1) 97% (31) 42.7% 32
Visiting NursesAssociations
16% (5) 84% (27) 42.7% 32
Other 60% (12) 40% (8) 26.7% 20
Total Respondents 75
(skipped this question) 19
(All the percentages quoted are derived from the row total responses as numerator and the total respondents in the second last row as denominator. Each column variable percentage has the numerator shown in parentheses and denotes responses to that variable. The denominator is the row total response shown in the last column of the row.) The top five agencies/groups that collaborated with LHDs to conduct blood pressure screening were community centers, faith-based communities /churches, other voluntary/non-profit organizations,
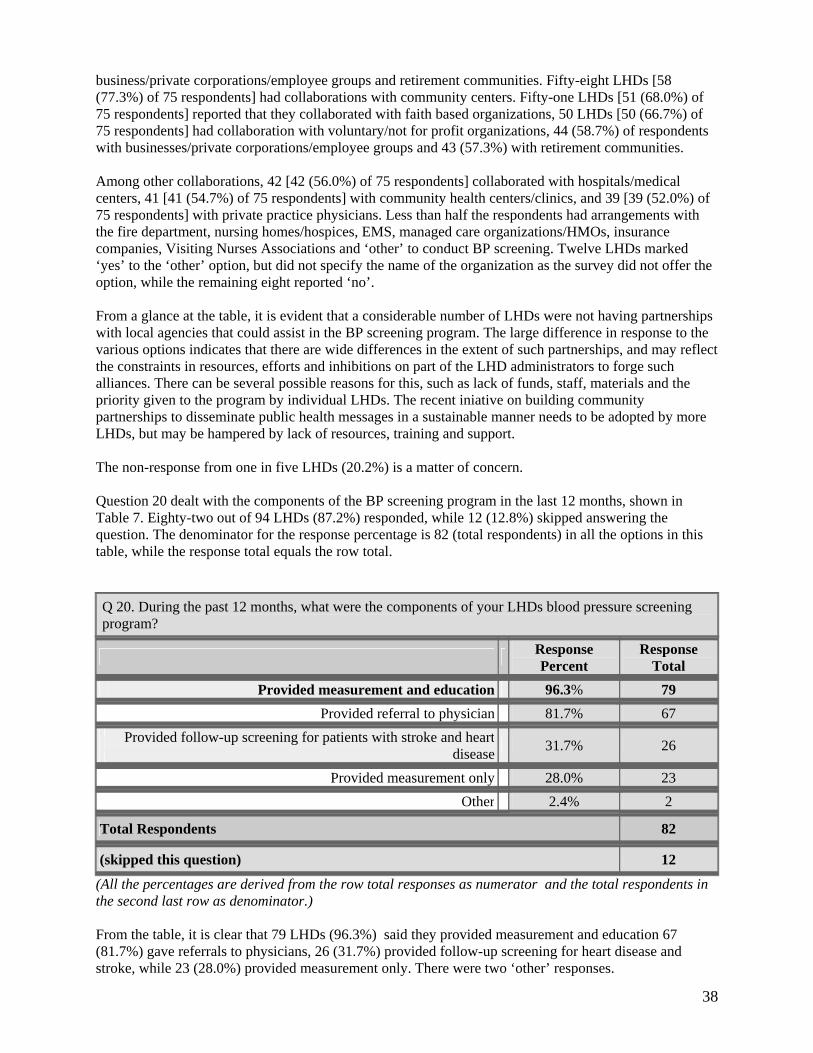
38
business/private corporations/employee groups and retirement communities. Fifty-eight LHDs [58 (77.3%) of 75 respondents] had collaborations with community centers. Fifty-one LHDs [51 (68.0%) of 75 respondents] reported that they collaborated with faith based organizations, 50 LHDs [50 (66.7%) of 75 respondents] had collaboration with voluntary/not for profit organizations, 44 (58.7%) of respondents with businesses/private corporations/employee groups and 43 (57.3%) with retirement communities. Among other collaborations, 42 [42 (56.0%) of 75 respondents] collaborated with hospitals/medical centers, 41 [41 (54.7%) of 75 respondents] with community health centers/clinics, and 39 [39 (52.0%) of 75 respondents] with private practice physicians. Less than half the respondents had arrangements with the fire department, nursing homes/hospices, EMS, managed care organizations/HMOs, insurance companies, Visiting Nurses Associations and ‘other’ to conduct BP screening. Twelve LHDs marked ‘yes’ to the ‘other’ option, but did not specify the name of the organization as the survey did not offer the option, while the remaining eight reported ‘no’. From a glance at the table, it is evident that a considerable number of LHDs were not having partnerships with local agencies that could assist in the BP screening program. The large difference in response to the various options indicates that there are wide differences in the extent of such partnerships, and may reflect the constraints in resources, efforts and inhibitions on part of the LHD administrators to forge such alliances. There can be several possible reasons for this, such as lack of funds, staff, materials and the priority given to the program by individual LHDs. The recent iniative on building community partnerships to disseminate public health messages in a sustainable manner needs to be adopted by more LHDs, but may be hampered by lack of resources, training and support. The non-response from one in five LHDs (20.2%) is a matter of concern. Question 20 dealt with the components of the BP screening program in the last 12 months, shown in Table 7. Eighty-two out of 94 LHDs (87.2%) responded, while 12 (12.8%) skipped answering the question. The denominator for the response percentage is 82 (total respondents) in all the options in this table, while the response total equals the row total.
Q 20. During the past 12 months, what were the components of your LHDs blood pressure screening program?
Response Percent
Response Total
Provided measurement and education 96.3% 79
Provided referral to physician 81.7% 67
Provided follow-up screening for patients with stroke and heart
disease 31.7% 26
Provided measurement only 28.0% 23 Other 2.4% 2
Total Respondents 82
(skipped this question) 12 (All the percentages are derived from the row total responses as numerator and the total respondents in the second last row as denominator.) From the table, it is clear that 79 LHDs (96.3%) said they provided measurement and education 67 (81.7%) gave referrals to physicians, 26 (31.7%) provided follow-up screening for heart disease and stroke, while 23 (28.0%) provided measurement only. There were two ‘other’ responses.
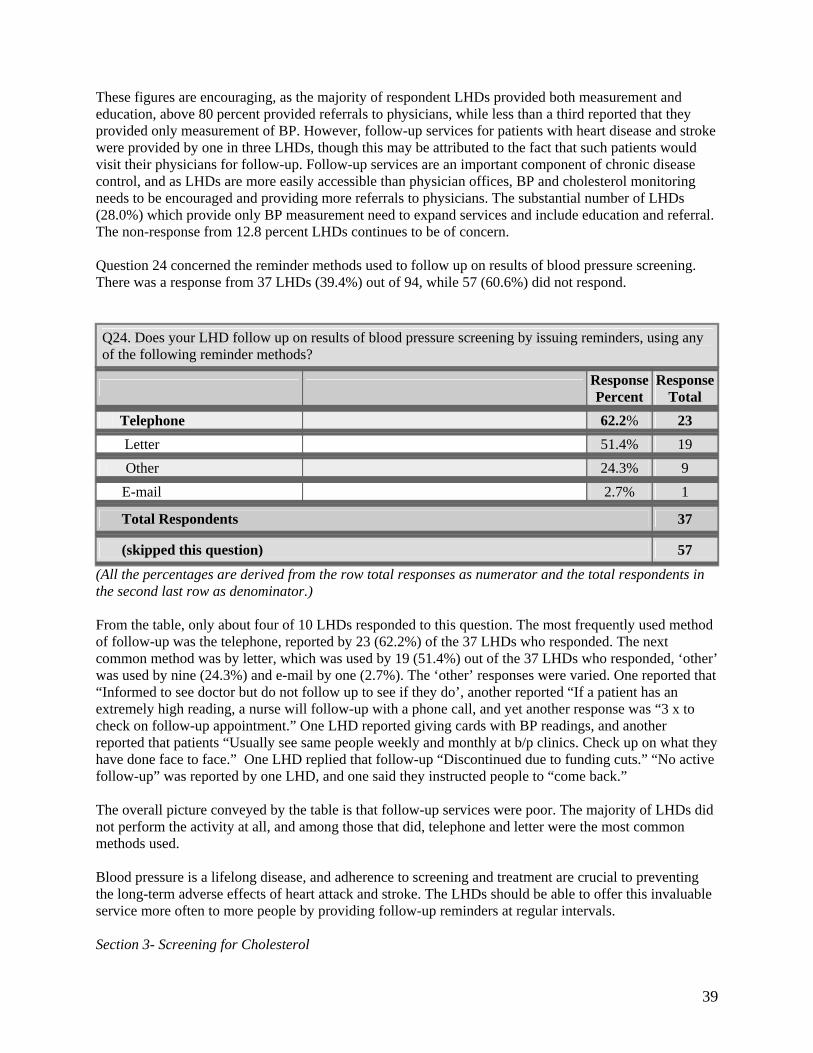
39
These figures are encouraging, as the majority of respondent LHDs provided both measurement and education, above 80 percent provided referrals to physicians, while less than a third reported that they provided only measurement of BP. However, follow-up services for patients with heart disease and stroke were provided by one in three LHDs, though this may be attributed to the fact that such patients would visit their physicians for follow-up. Follow-up services are an important component of chronic disease control, and as LHDs are more easily accessible than physician offices, BP and cholesterol monitoring needs to be encouraged and providing more referrals to physicians. The substantial number of LHDs (28.0%) which provide only BP measurement need to expand services and include education and referral. The non-response from 12.8 percent LHDs continues to be of concern. Question 24 concerned the reminder methods used to follow up on results of blood pressure screening. There was a response from 37 LHDs (39.4%) out of 94, while 57 (60.6%) did not respond.
Q24. Does your LHD follow up on results of blood pressure screening by issuing reminders, using any of the following reminder methods?
Response Percent
Response Total
Telephone 62.2% 23
Letter 51.4% 19 Other 24.3% 9
E-mail 2.7% 1
Total Respondents 37
(skipped this question) 57 (All the percentages are derived from the row total responses as numerator and the total respondents in the second last row as denominator.) From the table, only about four of 10 LHDs responded to this question. The most frequently used method of follow-up was the telephone, reported by 23 (62.2%) of the 37 LHDs who responded. The next common method was by letter, which was used by 19 (51.4%) out of the 37 LHDs who responded, ‘other’ was used by nine (24.3%) and e-mail by one (2.7%). The ‘other’ responses were varied. One reported that “Informed to see doctor but do not follow up to see if they do’, another reported “If a patient has an extremely high reading, a nurse will follow-up with a phone call, and yet another response was “3 x to check on follow-up appointment.” One LHD reported giving cards with BP readings, and another reported that patients “Usually see same people weekly and monthly at b/p clinics. Check up on what they have done face to face.” One LHD replied that follow-up “Discontinued due to funding cuts.” “No active follow-up” was reported by one LHD, and one said they instructed people to “come back.” The overall picture conveyed by the table is that follow-up services were poor. The majority of LHDs did not perform the activity at all, and among those that did, telephone and letter were the most common methods used. Blood pressure is a lifelong disease, and adherence to screening and treatment are crucial to preventing the long-term adverse effects of heart attack and stroke. The LHDs should be able to offer this invaluable service more often to more people by providing follow-up reminders at regular intervals. Section 3- Screening for Cholesterol
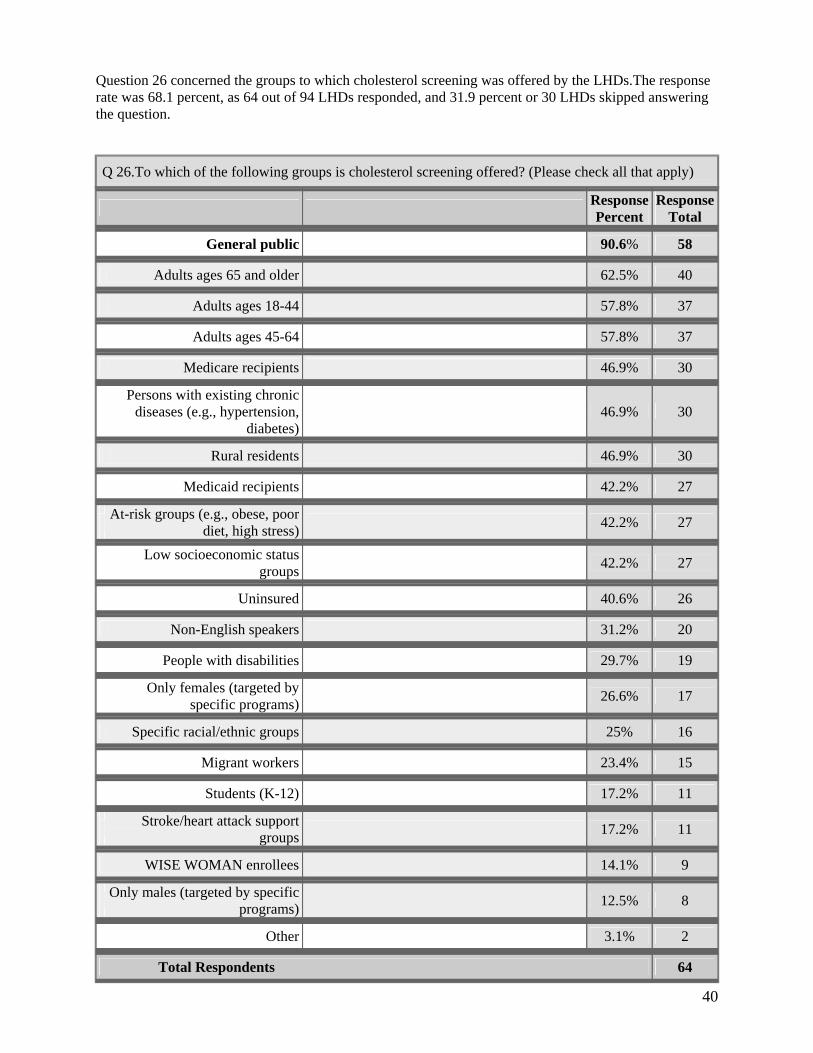
40
Question 26 concerned the groups to which cholesterol screening was offered by the LHDs.The response rate was 68.1 percent, as 64 out of 94 LHDs responded, and 31.9 percent or 30 LHDs skipped answering the question.
Q 26.To which of the following groups is cholesterol screening offered? (Please check all that apply)
Response Percent
Response Total
General public 90.6% 58
Adults ages 65 and older 62.5% 40
Adults ages 18-44 57.8% 37
Adults ages 45-64 57.8% 37
Medicare recipients 46.9% 30
Persons with existing chronic
diseases (e.g., hypertension,diabetes)
46.9% 30
Rural residents 46.9% 30
Medicaid recipients 42.2% 27
At-risk groups (e.g., obese, poor
diet, high stress) 42.2% 27
Low socioeconomic status
groups 42.2% 27
Uninsured 40.6% 26
Non-English speakers 31.2% 20
People with disabilities 29.7% 19
Only females (targeted by
specific programs) 26.6% 17
Specific racial/ethnic groups 25% 16
Migrant workers 23.4% 15
Students (K-12) 17.2% 11
Stroke/heart attack support
groups 17.2% 11
WISE WOMAN enrollees 14.1% 9
Only males (targeted by specific
programs) 12.5% 8
Other 3.1% 2
Total Respondents 64
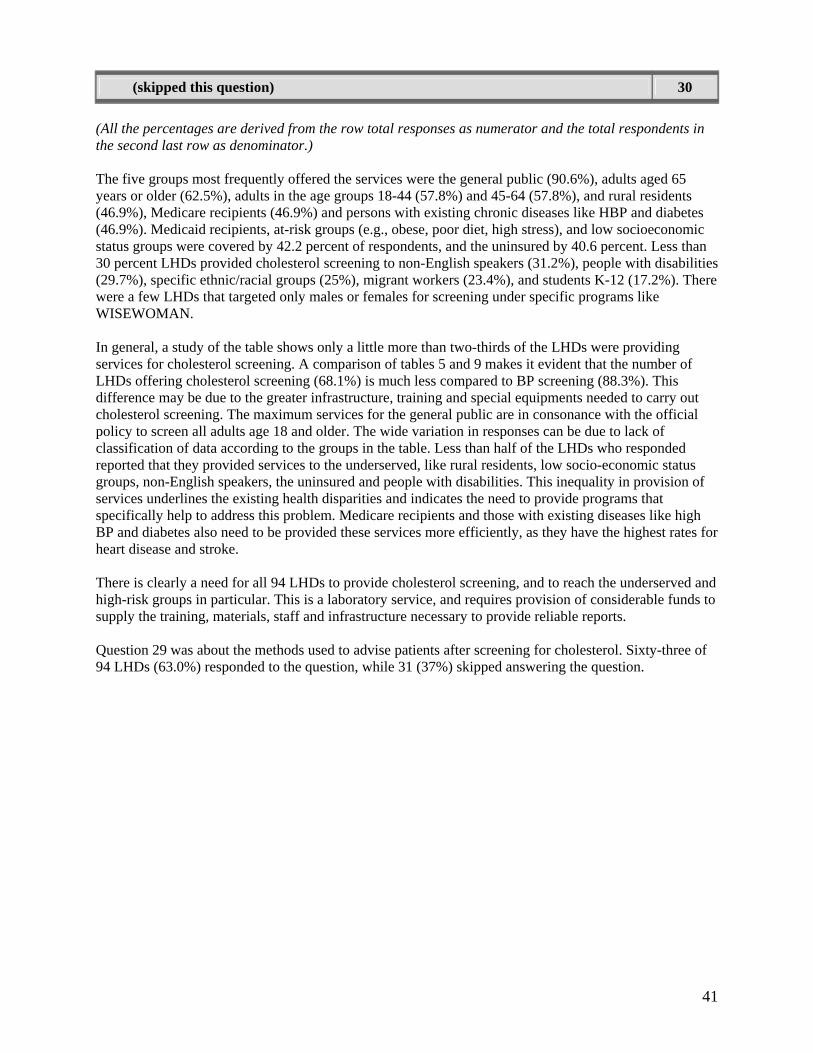
41
(skipped this question) 30 (All the percentages are derived from the row total responses as numerator and the total respondents in the second last row as denominator.) The five groups most frequently offered the services were the general public (90.6%), adults aged 65 years or older (62.5%), adults in the age groups 18-44 (57.8%) and 45-64 (57.8%), and rural residents (46.9%), Medicare recipients (46.9%) and persons with existing chronic diseases like HBP and diabetes (46.9%). Medicaid recipients, at-risk groups (e.g., obese, poor diet, high stress), and low socioeconomic status groups were covered by 42.2 percent of respondents, and the uninsured by 40.6 percent. Less than 30 percent LHDs provided cholesterol screening to non-English speakers (31.2%), people with disabilities (29.7%), specific ethnic/racial groups (25%), migrant workers (23.4%), and students K-12 (17.2%). There were a few LHDs that targeted only males or females for screening under specific programs like WISEWOMAN. In general, a study of the table shows only a little more than two-thirds of the LHDs were providing services for cholesterol screening. A comparison of tables 5 and 9 makes it evident that the number of LHDs offering cholesterol screening (68.1%) is much less compared to BP screening (88.3%). This difference may be due to the greater infrastructure, training and special equipments needed to carry out cholesterol screening. The maximum services for the general public are in consonance with the official policy to screen all adults age 18 and older. The wide variation in responses can be due to lack of classification of data according to the groups in the table. Less than half of the LHDs who responded reported that they provided services to the underserved, like rural residents, low socio-economic status groups, non-English speakers, the uninsured and people with disabilities. This inequality in provision of services underlines the existing health disparities and indicates the need to provide programs that specifically help to address this problem. Medicare recipients and those with existing diseases like high BP and diabetes also need to be provided these services more efficiently, as they have the highest rates for heart disease and stroke. There is clearly a need for all 94 LHDs to provide cholesterol screening, and to reach the underserved and high-risk groups in particular. This is a laboratory service, and requires provision of considerable funds to supply the training, materials, staff and infrastructure necessary to provide reliable reports. Question 29 was about the methods used to advise patients after screening for cholesterol. Sixty-three of 94 LHDs (63.0%) responded to the question, while 31 (37%) skipped answering the question.
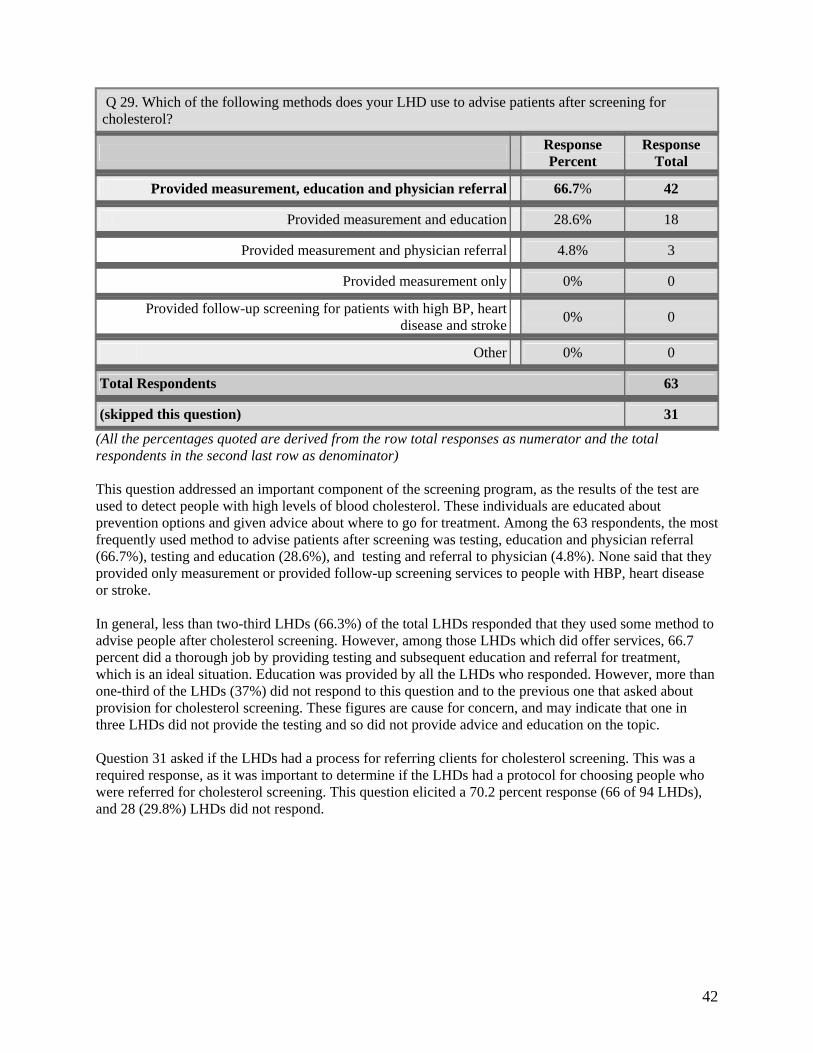
42
Q 29. Which of the following methods does your LHD use to advise patients after screening for cholesterol?
Response Percent
Response Total
Provided measurement, education and physician referral 66.7% 42
Provided measurement and education 28.6% 18
Provided measurement and physician referral 4.8% 3
Provided measurement only 0% 0
Provided follow-up screening for patients with high BP, heartdisease and stroke 0% 0
Other 0% 0
Total Respondents 63
(skipped this question) 31 (All the percentages quoted are derived from the row total responses as numerator and the total respondents in the second last row as denominator) This question addressed an important component of the screening program, as the results of the test are used to detect people with high levels of blood cholesterol. These individuals are educated about prevention options and given advice about where to go for treatment. Among the 63 respondents, the most frequently used method to advise patients after screening was testing, education and physician referral (66.7%), testing and education (28.6%), and testing and referral to physician (4.8%). None said that they provided only measurement or provided follow-up screening services to people with HBP, heart disease or stroke. In general, less than two-third LHDs (66.3%) of the total LHDs responded that they used some method to advise people after cholesterol screening. However, among those LHDs which did offer services, 66.7 percent did a thorough job by providing testing and subsequent education and referral for treatment, which is an ideal situation. Education was provided by all the LHDs who responded. However, more than one-third of the LHDs (37%) did not respond to this question and to the previous one that asked about provision for cholesterol screening. These figures are cause for concern, and may indicate that one in three LHDs did not provide the testing and so did not provide advice and education on the topic. Question 31 asked if the LHDs had a process for referring clients for cholesterol screening. This was a required response, as it was important to determine if the LHDs had a protocol for choosing people who were referred for cholesterol screening. This question elicited a 70.2 percent response (66 of 94 LHDs), and 28 (29.8%) LHDs did not respond.
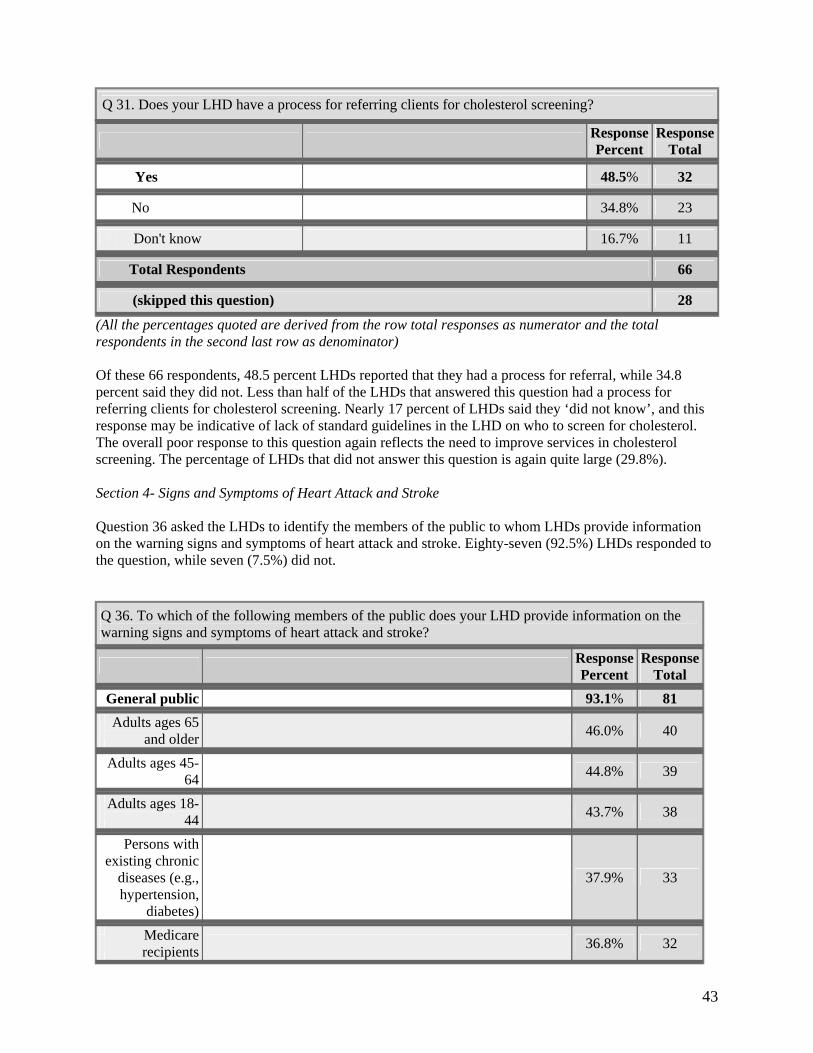
43
Q 31. Does your LHD have a process for referring clients for cholesterol screening?
Response Percent
Response Total
Yes 48.5% 32
No 34.8% 23
Don't know 16.7% 11
Total Respondents 66
(skipped this question) 28 (All the percentages quoted are derived from the row total responses as numerator and the total respondents in the second last row as denominator) Of these 66 respondents, 48.5 percent LHDs reported that they had a process for referral, while 34.8 percent said they did not. Less than half of the LHDs that answered this question had a process for referring clients for cholesterol screening. Nearly 17 percent of LHDs said they ‘did not know’, and this response may be indicative of lack of standard guidelines in the LHD on who to screen for cholesterol. The overall poor response to this question again reflects the need to improve services in cholesterol screening. The percentage of LHDs that did not answer this question is again quite large (29.8%). Section 4- Signs and Symptoms of Heart Attack and Stroke Question 36 asked the LHDs to identify the members of the public to whom LHDs provide information on the warning signs and symptoms of heart attack and stroke. Eighty-seven (92.5%) LHDs responded to the question, while seven (7.5%) did not. Q 36. To which of the following members of the public does your LHD provide information on the warning signs and symptoms of heart attack and stroke?
Response Percent
Response Total
General public 93.1% 81
Adults ages 65
and older 46.0% 40
Adults ages 45-
64 44.8% 39
Adults ages 18-
44 43.7% 38
Persons withexisting chronic
diseases (e.g.,hypertension,
diabetes)
37.9% 33
Medicarerecipients
36.8% 32

44
At-risk groups(e.g., obese,
poor diet, highstress)
36.8% 32
Medicaidrecipients
35.6% 31
Low
socioeconomicstatus groups
35.6% 31
Rural residents 34.5% 30
Uninsured 32.2% 28
Only females(targeted by
specificprograms)
26.4% 23
People withdisabilities
21.8% 19
Students (K-12) 18.4% 16
Non-English
speakers 18.4% 16
Specific
racial/ethnicgroups
16.1% 14
Stroke/heart
attack supportgroups
14.9% 13
Migrantworkers
13.8% 12
WISEWOMAN
enrollees 10.3% 9
Only males(targeted by
specificprograms)
5.7% 5
Other 5.7% 5
Total Respondents 87
(skipped this question) 7
(All the percentages in the table are derived from the row total responses as numerator and the total respondents in the second last row as denominator)
The five groups most frequently provided with information on the warning signs of heart attack and stroke were the general public (93.1%), adults aged 65 and older (46%); adults aged 45-64 (44.8 %), adults aged 18-44 (43.7%), and persons with chronic existing diseases (37.9%). The percentage of LHDs that provided information to Medicare recipients and at risk groups was 36.8 percent each, and Medicaid recipients 35.6 percent. As in the previous tables, similar disparities in provision of services were apparent in this table as well. The percentage of LHDs providing information to low socioeconomic status
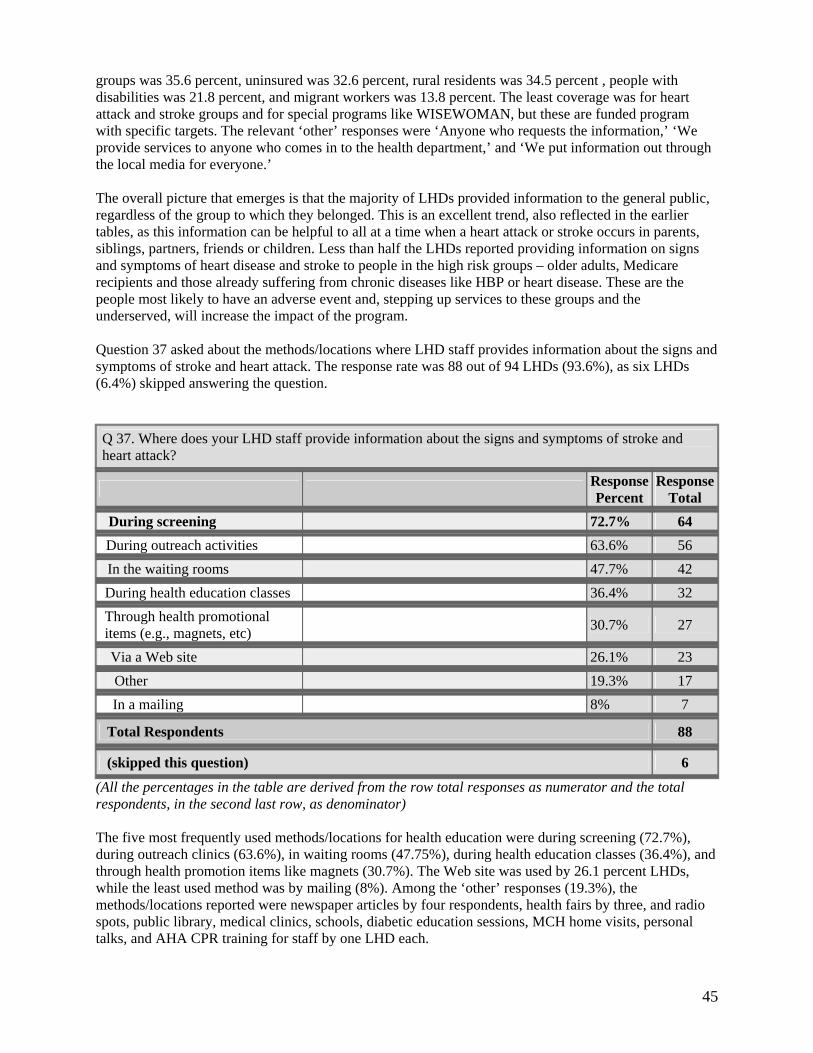
45
groups was 35.6 percent, uninsured was 32.6 percent, rural residents was 34.5 percent , people with disabilities was 21.8 percent, and migrant workers was 13.8 percent. The least coverage was for heart attack and stroke groups and for special programs like WISEWOMAN, but these are funded program with specific targets. The relevant ‘other’ responses were ‘Anyone who requests the information,’ ‘We provide services to anyone who comes in to the health department,’ and ‘We put information out through the local media for everyone.’ The overall picture that emerges is that the majority of LHDs provided information to the general public, regardless of the group to which they belonged. This is an excellent trend, also reflected in the earlier tables, as this information can be helpful to all at a time when a heart attack or stroke occurs in parents, siblings, partners, friends or children. Less than half the LHDs reported providing information on signs and symptoms of heart disease and stroke to people in the high risk groups – older adults, Medicare recipients and those already suffering from chronic diseases like HBP or heart disease. These are the people most likely to have an adverse event and, stepping up services to these groups and the underserved, will increase the impact of the program. Question 37 asked about the methods/locations where LHD staff provides information about the signs and symptoms of stroke and heart attack. The response rate was 88 out of 94 LHDs (93.6%), as six LHDs (6.4%) skipped answering the question.
Q 37. Where does your LHD staff provide information about the signs and symptoms of stroke and heart attack?
Response Percent
Response Total
During screening 72.7% 64
During outreach activities 63.6% 56
In the waiting rooms 47.7% 42
During health education classes 36.4% 32
Through health promotional items (e.g., magnets, etc)
30.7% 27
Via a Web site 26.1% 23 Other 19.3% 17
In a mailing 8% 7
Total Respondents 88
(skipped this question) 6 (All the percentages in the table are derived from the row total responses as numerator and the total respondents, in the second last row, as denominator) The five most frequently used methods/locations for health education were during screening (72.7%), during outreach clinics (63.6%), in waiting rooms (47.75%), during health education classes (36.4%), and through health promotion items like magnets (30.7%). The Web site was used by 26.1 percent LHDs, while the least used method was by mailing (8%). Among the ‘other’ responses (19.3%), the methods/locations reported were newspaper articles by four respondents, health fairs by three, and radio spots, public library, medical clinics, schools, diabetic education sessions, MCH home visits, personal talks, and AHA CPR training for staff by one LHD each.
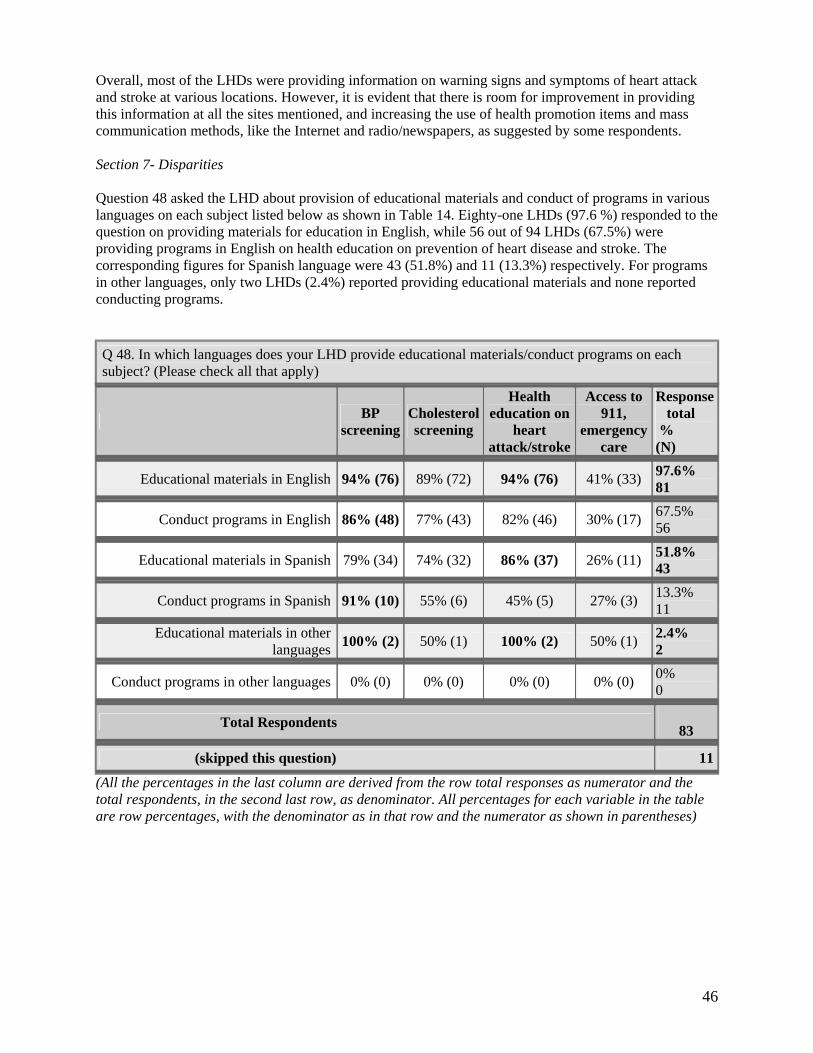
46
Overall, most of the LHDs were providing information on warning signs and symptoms of heart attack and stroke at various locations. However, it is evident that there is room for improvement in providing this information at all the sites mentioned, and increasing the use of health promotion items and mass communication methods, like the Internet and radio/newspapers, as suggested by some respondents. Section 7- Disparities Question 48 asked the LHD about provision of educational materials and conduct of programs in various languages on each subject listed below as shown in Table 14. Eighty-one LHDs (97.6 %) responded to the question on providing materials for education in English, while 56 out of 94 LHDs (67.5%) were providing programs in English on health education on prevention of heart disease and stroke. The corresponding figures for Spanish language were 43 (51.8%) and 11 (13.3%) respectively. For programs in other languages, only two LHDs (2.4%) reported providing educational materials and none reported conducting programs.
Q 48. In which languages does your LHD provide educational materials/conduct programs on each subject? (Please check all that apply)
BP screening
Cholesterol screening
Health education on
heart attack/stroke
Access to 911,
emergency care
Response total
% (N)
Educational materials in English 94% (76) 89% (72) 94% (76) 41% (33) 97.6% 81
Conduct programs in English 86% (48) 77% (43) 82% (46) 30% (17) 67.5% 56
Educational materials in Spanish 79% (34) 74% (32) 86% (37) 26% (11) 51.8% 43
Conduct programs in Spanish 91% (10) 55% (6) 45% (5) 27% (3) 13.3% 11
Educational materials in otherlanguages 100% (2) 50% (1) 100% (2) 50% (1) 2.4%
2
Conduct programs in other languages 0% (0) 0% (0) 0% (0) 0% (0) 0% 0
Total Respondents 83
(skipped this question) 11 (All the percentages in the last column are derived from the row total responses as numerator and the total respondents, in the second last row, as denominator. All percentages for each variable in the table are row percentages, with the denominator as in that row and the numerator as shown in parentheses)
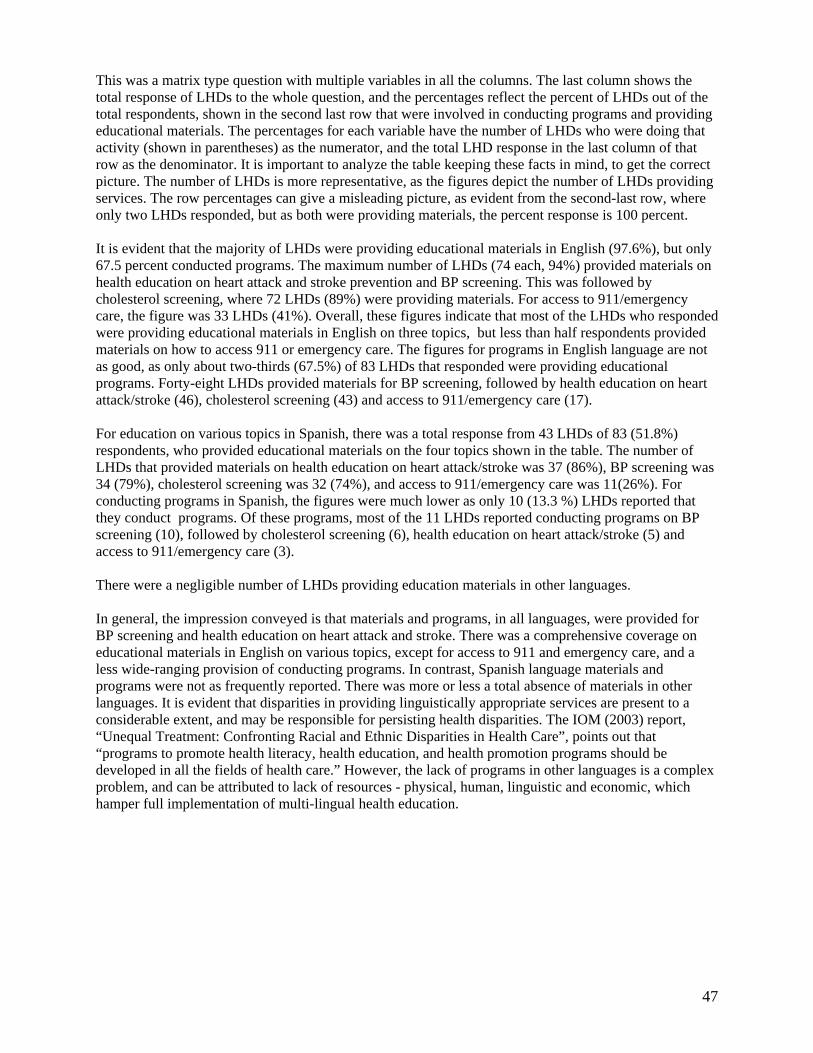
47
This was a matrix type question with multiple variables in all the columns. The last column shows the total response of LHDs to the whole question, and the percentages reflect the percent of LHDs out of the total respondents, shown in the second last row that were involved in conducting programs and providing educational materials. The percentages for each variable have the number of LHDs who were doing that activity (shown in parentheses) as the numerator, and the total LHD response in the last column of that row as the denominator. It is important to analyze the table keeping these facts in mind, to get the correct picture. The number of LHDs is more representative, as the figures depict the number of LHDs providing services. The row percentages can give a misleading picture, as evident from the second-last row, where only two LHDs responded, but as both were providing materials, the percent response is 100 percent. It is evident that the majority of LHDs were providing educational materials in English (97.6%), but only 67.5 percent conducted programs. The maximum number of LHDs (74 each, 94%) provided materials on health education on heart attack and stroke prevention and BP screening. This was followed by cholesterol screening, where 72 LHDs (89%) were providing materials. For access to 911/emergency care, the figure was 33 LHDs (41%). Overall, these figures indicate that most of the LHDs who responded were providing educational materials in English on three topics, but less than half respondents provided materials on how to access 911 or emergency care. The figures for programs in English language are not as good, as only about two-thirds (67.5%) of 83 LHDs that responded were providing educational programs. Forty-eight LHDs provided materials for BP screening, followed by health education on heart attack/stroke (46), cholesterol screening (43) and access to 911/emergency care (17). For education on various topics in Spanish, there was a total response from 43 LHDs of 83 (51.8%) respondents, who provided educational materials on the four topics shown in the table. The number of LHDs that provided materials on health education on heart attack/stroke was 37 (86%), BP screening was 34 (79%), cholesterol screening was 32 (74%), and access to 911/emergency care was 11(26%). For conducting programs in Spanish, the figures were much lower as only 10 (13.3 %) LHDs reported that they conduct programs. Of these programs, most of the 11 LHDs reported conducting programs on BP screening (10), followed by cholesterol screening (6), health education on heart attack/stroke (5) and access to 911/emergency care (3). There were a negligible number of LHDs providing education materials in other languages. In general, the impression conveyed is that materials and programs, in all languages, were provided for BP screening and health education on heart attack and stroke. There was a comprehensive coverage on educational materials in English on various topics, except for access to 911 and emergency care, and a less wide-ranging provision of conducting programs. In contrast, Spanish language materials and programs were not as frequently reported. There was more or less a total absence of materials in other languages. It is evident that disparities in providing linguistically appropriate services are present to a considerable extent, and may be responsible for persisting health disparities. The IOM (2003) report, “Unequal Treatment: Confronting Racial and Ethnic Disparities in Health Care”, points out that “programs to promote health literacy, health education, and health promotion programs should be developed in all the fields of health care.” However, the lack of programs in other languages is a complex problem, and can be attributed to lack of resources - physical, human, linguistic and economic, which hamper full implementation of multi-lingual health education.
48
Question 49 concerned the conduct of programs in languages other than English or Spanish. There were only three responses to this question (3. 2%) out of 94 LHDs, as 91 (96.8%) skipped answering the question.
Q 49. If programs are conducted in other languages, please specify the languages used in your program. (Please check all that apply)
Response Percent
Response Total
Other 100% 3 Chinese 0% 0 Russian 0% 0
Portuguese 0% 0 Japanese 0% 0
Urdu 0% 0
Vietnamese 0% 0
German 0% 0 French 0% 0 Hindi 0% 0
Total Respondents 3
(skipped this question) 91 (All the percentages in the table are derived from the row total responses as numerator and the total respondents, in the second last row, as denominator) Of these three respondents, one reported they conducted programs in Spanish for WIC clients and one reported using Hispanic for this program. This may be because the question did not specifically ask about languages other than Spanish and English. Only one LHD out of the three respondents reported it uses education programs in Polish and Arabic languages for prevention of heart disease and stroke. This table indicates that there is little use of education materials in languages other than English or Spanish for health education on prevention of heart disease and stroke and a complete absence of programs. This is likely due to lack of multilingual staff and written and audio-visual aids in other languages, and a host of factors discussed previously. Section 8 - Training
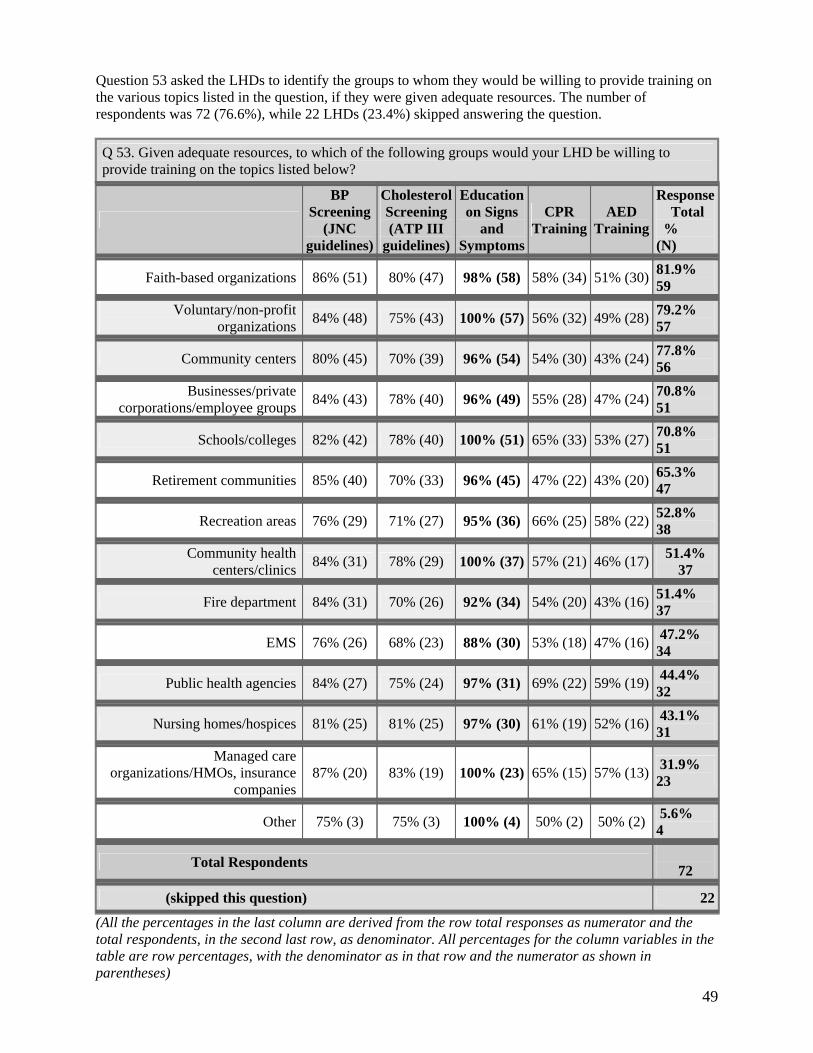
49
Question 53 asked the LHDs to identify the groups to whom they would be willing to provide training on the various topics listed in the question, if they were given adequate resources. The number of respondents was 72 (76.6%), while 22 LHDs (23.4%) skipped answering the question.
Q 53. Given adequate resources, to which of the following groups would your LHD be willing to provide training on the topics listed below?
BP Screening
(JNC guidelines)
Cholesterol Screening (ATP III
guidelines)
Education on Signs
and Symptoms
CPR Training
AED Training
Response Total
% (N)
Faith-based organizations 86% (51) 80% (47) 98% (58) 58% (34) 51% (30) 81.9% 59
Voluntary/non-profit organizations
84% (48) 75% (43) 100% (57) 56% (32) 49% (28) 79.2% 57
Community centers 80% (45) 70% (39) 96% (54) 54% (30) 43% (24) 77.8% 56
Businesses/privatecorporations/employee groups
84% (43) 78% (40) 96% (49) 55% (28) 47% (24) 70.8% 51
Schools/colleges 82% (42) 78% (40) 100% (51) 65% (33) 53% (27) 70.8% 51
Retirement communities 85% (40) 70% (33) 96% (45) 47% (22) 43% (20) 65.3% 47
Recreation areas 76% (29) 71% (27) 95% (36) 66% (25) 58% (22) 52.8% 38
Community healthcenters/clinics
84% (31) 78% (29) 100% (37) 57% (21) 46% (17) 51.4% 37
Fire department 84% (31) 70% (26) 92% (34) 54% (20) 43% (16) 51.4% 37
EMS 76% (26) 68% (23) 88% (30) 53% (18) 47% (16) 47.2% 34
Public health agencies 84% (27) 75% (24) 97% (31) 69% (22) 59% (19) 44.4% 32
Nursing homes/hospices 81% (25) 81% (25) 97% (30) 61% (19) 52% (16) 43.1% 31
Managed careorganizations/HMOs, insurance
companies 87% (20) 83% (19) 100% (23) 65% (15) 57% (13) 31.9%
23
Other 75% (3) 75% (3) 100% (4) 50% (2) 50% (2) 5.6% 4
Total Respondents 72
(skipped this question) 22 (All the percentages in the last column are derived from the row total responses as numerator and the total respondents, in the second last row, as denominator. All percentages for the column variables in the table are row percentages, with the denominator as in that row and the numerator as shown in parentheses)
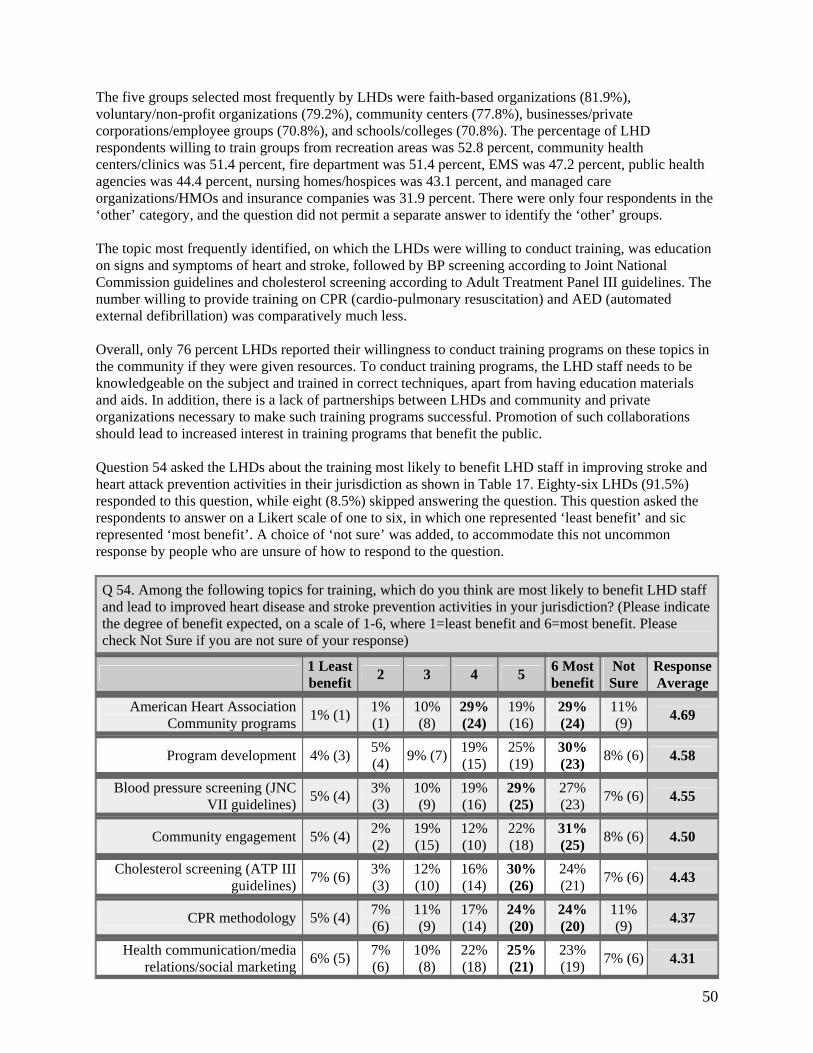
50
The five groups selected most frequently by LHDs were faith-based organizations (81.9%), voluntary/non-profit organizations (79.2%), community centers (77.8%), businesses/private corporations/employee groups (70.8%), and schools/colleges (70.8%). The percentage of LHD respondents willing to train groups from recreation areas was 52.8 percent, community health centers/clinics was 51.4 percent, fire department was 51.4 percent, EMS was 47.2 percent, public health agencies was 44.4 percent, nursing homes/hospices was 43.1 percent, and managed care organizations/HMOs and insurance companies was 31.9 percent. There were only four respondents in the ‘other’ category, and the question did not permit a separate answer to identify the ‘other’ groups. The topic most frequently identified, on which the LHDs were willing to conduct training, was education on signs and symptoms of heart and stroke, followed by BP screening according to Joint National Commission guidelines and cholesterol screening according to Adult Treatment Panel III guidelines. The number willing to provide training on CPR (cardio-pulmonary resuscitation) and AED (automated external defibrillation) was comparatively much less. Overall, only 76 percent LHDs reported their willingness to conduct training programs on these topics in the community if they were given resources. To conduct training programs, the LHD staff needs to be knowledgeable on the subject and trained in correct techniques, apart from having education materials and aids. In addition, there is a lack of partnerships between LHDs and community and private organizations necessary to make such training programs successful. Promotion of such collaborations should lead to increased interest in training programs that benefit the public. Question 54 asked the LHDs about the training most likely to benefit LHD staff in improving stroke and heart attack prevention activities in their jurisdiction as shown in Table 17. Eighty-six LHDs (91.5%) responded to this question, while eight (8.5%) skipped answering the question. This question asked the respondents to answer on a Likert scale of one to six, in which one represented ‘least benefit’ and sic represented ‘most benefit’. A choice of ‘not sure’ was added, to accommodate this not uncommon response by people who are unsure of how to respond to the question.
Q 54. Among the following topics for training, which do you think are most likely to benefit LHD staff and lead to improved heart disease and stroke prevention activities in your jurisdiction? (Please indicate the degree of benefit expected, on a scale of 1-6, where 1=least benefit and 6=most benefit. Please check Not Sure if you are not sure of your response)
1 Least benefit 2 3 4 5 6 Most
benefit Not Sure
Response Average
American Heart AssociationCommunity programs
1% (1) 1% (1)
10% (8)
29% (24)
19% (16)
29% (24)
11% (9) 4.69
Program development 4% (3) 5% (4) 9% (7) 19%
(15) 25% (19)
30% (23) 8% (6) 4.58
Blood pressure screening (JNCVII guidelines)
5% (4) 3% (3)
10% (9)
19% (16)
29% (25)
27% (23) 7% (6) 4.55
Community engagement 5% (4) 2% (2)
19% (15)
12% (10)
22% (18)
31% (25) 8% (6) 4.50
Cholesterol screening (ATP IIIguidelines)
7% (6) 3% (3)
12% (10)
16% (14)
30% (26)
24% (21) 7% (6) 4.43
CPR methodology 5% (4) 7% (6)
11% (9)
17% (14)
24% (20)
24% (20)
11% (9) 4.37
Health communication/mediarelations/social marketing
6% (5) 7% (6)
10% (8)
22% (18)
25% (21)
23% (19) 7% (6) 4.31
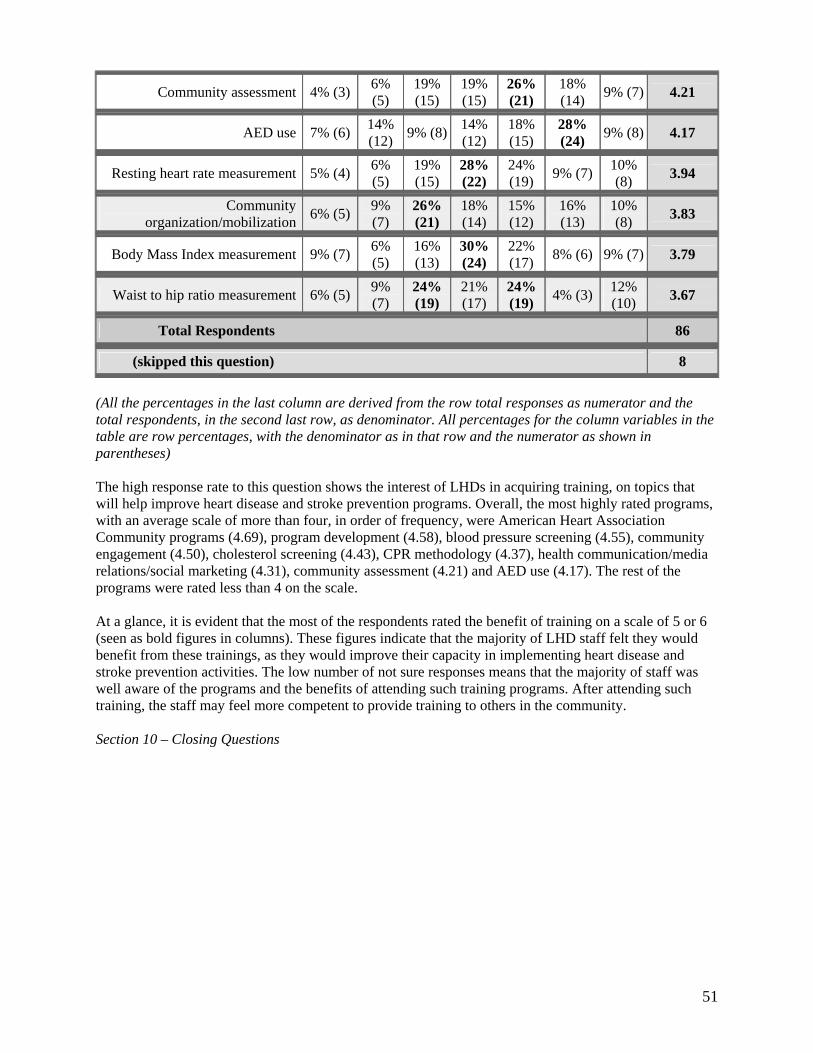
51
Community assessment 4% (3) 6% (5)
19% (15)
19% (15)
26% (21)
18% (14) 9% (7) 4.21
AED use 7% (6) 14% (12) 9% (8) 14%
(12) 18% (15)
28% (24) 9% (8) 4.17
Resting heart rate measurement 5% (4) 6% (5)
19% (15)
28% (22)
24% (19) 9% (7) 10%
(8) 3.94
Community organization/mobilization
6% (5) 9% (7)
26% (21)
18% (14)
15% (12)
16% (13)
10% (8) 3.83
Body Mass Index measurement 9% (7) 6% (5)
16% (13)
30% (24)
22% (17) 8% (6) 9% (7) 3.79
Waist to hip ratio measurement 6% (5) 9% (7)
24% (19)
21% (17)
24% (19) 4% (3) 12%
(10) 3.67
Total Respondents 86
(skipped this question) 8 (All the percentages in the last column are derived from the row total responses as numerator and the total respondents, in the second last row, as denominator. All percentages for the column variables in the table are row percentages, with the denominator as in that row and the numerator as shown in parentheses) The high response rate to this question shows the interest of LHDs in acquiring training, on topics that will help improve heart disease and stroke prevention programs. Overall, the most highly rated programs, with an average scale of more than four, in order of frequency, were American Heart Association Community programs (4.69), program development (4.58), blood pressure screening (4.55), community engagement (4.50), cholesterol screening (4.43), CPR methodology (4.37), health communication/media relations/social marketing (4.31), community assessment (4.21) and AED use (4.17). The rest of the programs were rated less than 4 on the scale. At a glance, it is evident that the most of the respondents rated the benefit of training on a scale of 5 or 6 (seen as bold figures in columns). These figures indicate that the majority of LHD staff felt they would benefit from these trainings, as they would improve their capacity in implementing heart disease and stroke prevention activities. The low number of not sure responses means that the majority of staff was well aware of the programs and the benefits of attending such training programs. After attending such training, the staff may feel more competent to provide training to others in the community. Section 10 – Closing Questions
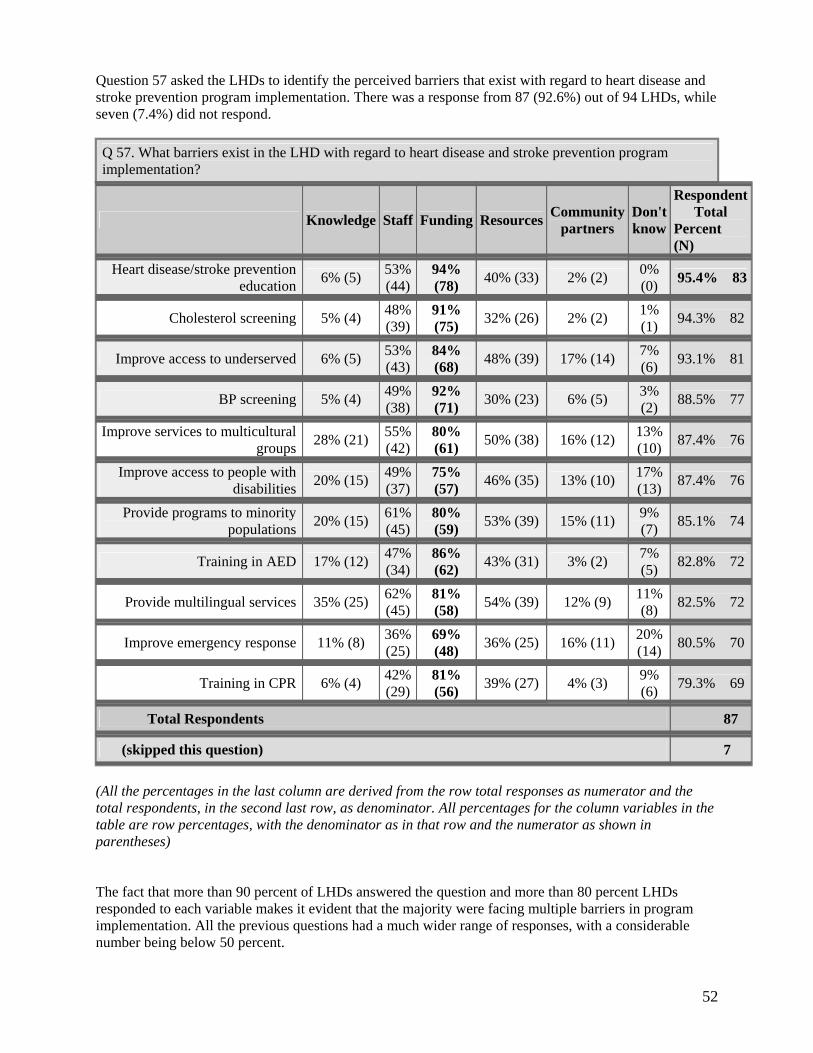
52
Question 57 asked the LHDs to identify the perceived barriers that exist with regard to heart disease and stroke prevention program implementation. There was a response from 87 (92.6%) out of 94 LHDs, while seven (7.4%) did not respond.
Q 57. What barriers exist in the LHD with regard to heart disease and stroke prevention program implementation?
Knowledge Staff Funding Resources Community partners
Don't know
Respondent Total
Percent (N)
Heart disease/stroke preventioneducation
6% (5) 53% (44)
94% (78) 40% (33) 2% (2) 0%
(0) 95.4% 83
Cholesterol screening 5% (4) 48% (39)
91% (75) 32% (26) 2% (2) 1%
(1) 94.3% 82
Improve access to underserved 6% (5) 53% (43)
84% (68) 48% (39) 17% (14) 7%
(6) 93.1% 81
BP screening 5% (4) 49% (38)
92% (71) 30% (23) 6% (5) 3%
(2) 88.5% 77
Improve services to multiculturalgroups
28% (21) 55% (42)
80% (61) 50% (38) 16% (12) 13%
(10) 87.4% 76
Improve access to people withdisabilities
20% (15) 49% (37)
75% (57) 46% (35) 13% (10) 17%
(13) 87.4% 76
Provide programs to minoritypopulations
20% (15) 61% (45)
80% (59) 53% (39) 15% (11) 9%
(7) 85.1% 74
Training in AED 17% (12) 47% (34)
86% (62) 43% (31) 3% (2) 7%
(5) 82.8% 72
Provide multilingual services 35% (25) 62% (45)
81% (58) 54% (39) 12% (9) 11%
(8) 82.5% 72
Improve emergency response 11% (8) 36% (25)
69% (48) 36% (25) 16% (11) 20%
(14) 80.5% 70
Training in CPR 6% (4) 42% (29)
81% (56) 39% (27) 4% (3) 9%
(6) 79.3% 69
Total Respondents 87
(skipped this question) 7 (All the percentages in the last column are derived from the row total responses as numerator and the total respondents, in the second last row, as denominator. All percentages for the column variables in the table are row percentages, with the denominator as in that row and the numerator as shown in parentheses) The fact that more than 90 percent of LHDs answered the question and more than 80 percent LHDs responded to each variable makes it evident that the majority were facing multiple barriers in program implementation. All the previous questions had a much wider range of responses, with a considerable number being below 50 percent.
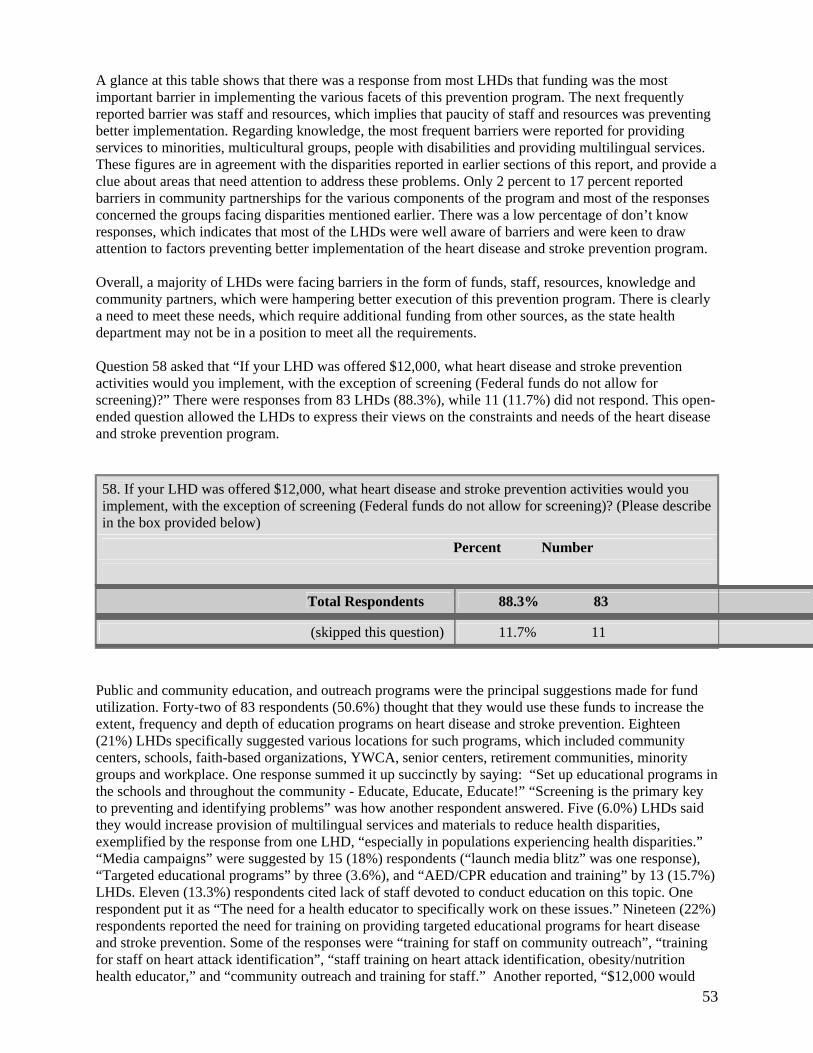
53
A glance at this table shows that there was a response from most LHDs that funding was the most important barrier in implementing the various facets of this prevention program. The next frequently reported barrier was staff and resources, which implies that paucity of staff and resources was preventing better implementation. Regarding knowledge, the most frequent barriers were reported for providing services to minorities, multicultural groups, people with disabilities and providing multilingual services. These figures are in agreement with the disparities reported in earlier sections of this report, and provide a clue about areas that need attention to address these problems. Only 2 percent to 17 percent reported barriers in community partnerships for the various components of the program and most of the responses concerned the groups facing disparities mentioned earlier. There was a low percentage of don’t know responses, which indicates that most of the LHDs were well aware of barriers and were keen to draw attention to factors preventing better implementation of the heart disease and stroke prevention program. Overall, a majority of LHDs were facing barriers in the form of funds, staff, resources, knowledge and community partners, which were hampering better execution of this prevention program. There is clearly a need to meet these needs, which require additional funding from other sources, as the state health department may not be in a position to meet all the requirements. Question 58 asked that “If your LHD was offered $12,000, what heart disease and stroke prevention activities would you implement, with the exception of screening (Federal funds do not allow for screening)?” There were responses from 83 LHDs (88.3%), while 11 (11.7%) did not respond. This open-ended question allowed the LHDs to express their views on the constraints and needs of the heart disease and stroke prevention program.
58. If your LHD was offered $12,000, what heart disease and stroke prevention activities would you implement, with the exception of screening (Federal funds do not allow for screening)? (Please describe in the box provided below)
Percent Number
Total Respondents 88.3% 83
(skipped this question) 11.7% 11 Public and community education, and outreach programs were the principal suggestions made for fund utilization. Forty-two of 83 respondents (50.6%) thought that they would use these funds to increase the extent, frequency and depth of education programs on heart disease and stroke prevention. Eighteen (21%) LHDs specifically suggested various locations for such programs, which included community centers, schools, faith-based organizations, YWCA, senior centers, retirement communities, minority groups and workplace. One response summed it up succinctly by saying: “Set up educational programs in the schools and throughout the community - Educate, Educate, Educate!” “Screening is the primary key to preventing and identifying problems” was how another respondent answered. Five (6.0%) LHDs said they would increase provision of multilingual services and materials to reduce health disparities, exemplified by the response from one LHD, “especially in populations experiencing health disparities.” “Media campaigns” were suggested by 15 (18%) respondents (“launch media blitz” was one response), “Targeted educational programs” by three (3.6%), and “AED/CPR education and training” by 13 (15.7%) LHDs. Eleven (13.3%) respondents cited lack of staff devoted to conduct education on this topic. One respondent put it as “The need for a health educator to specifically work on these issues.” Nineteen (22%) respondents reported the need for training on providing targeted educational programs for heart disease and stroke prevention. Some of the responses were “training for staff on community outreach”, “training for staff on heart attack identification”, “staff training on heart attack identification, obesity/nutrition health educator,” and “community outreach and training for staff.” Another reported, “$12,000 would
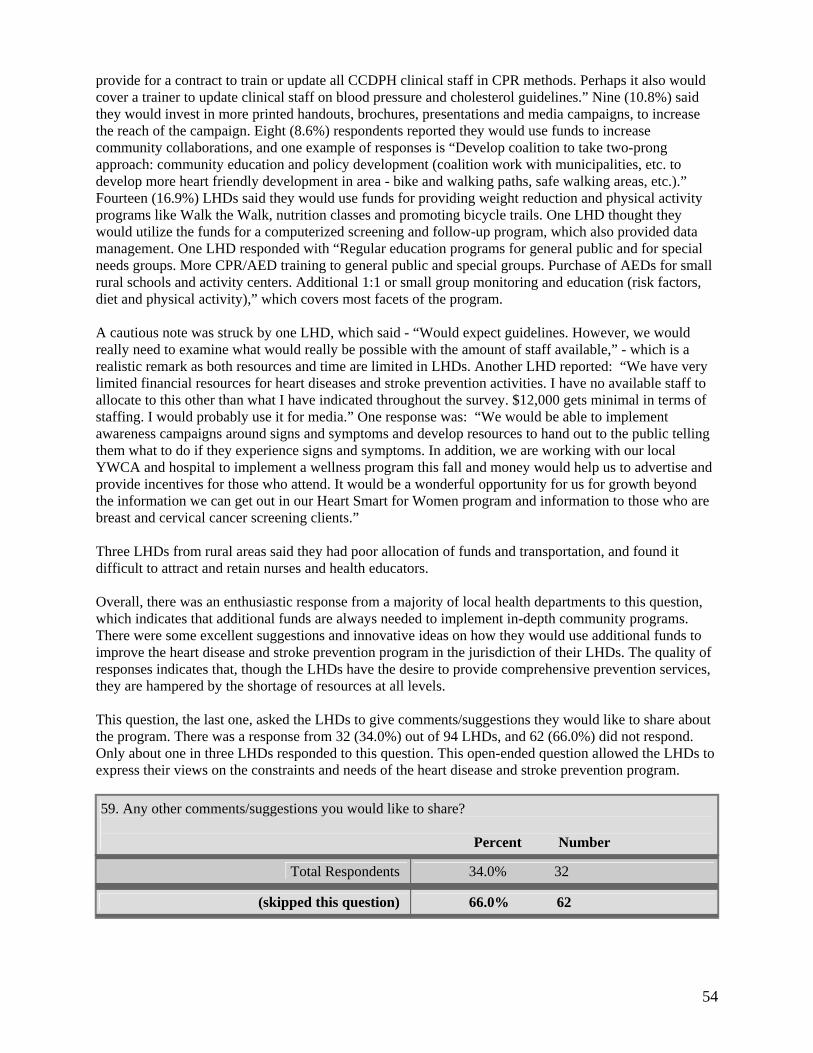
54
provide for a contract to train or update all CCDPH clinical staff in CPR methods. Perhaps it also would cover a trainer to update clinical staff on blood pressure and cholesterol guidelines.” Nine (10.8%) said they would invest in more printed handouts, brochures, presentations and media campaigns, to increase the reach of the campaign. Eight (8.6%) respondents reported they would use funds to increase community collaborations, and one example of responses is “Develop coalition to take two-prong approach: community education and policy development (coalition work with municipalities, etc. to develop more heart friendly development in area - bike and walking paths, safe walking areas, etc.).” Fourteen (16.9%) LHDs said they would use funds for providing weight reduction and physical activity programs like Walk the Walk, nutrition classes and promoting bicycle trails. One LHD thought they would utilize the funds for a computerized screening and follow-up program, which also provided data management. One LHD responded with “Regular education programs for general public and for special needs groups. More CPR/AED training to general public and special groups. Purchase of AEDs for small rural schools and activity centers. Additional 1:1 or small group monitoring and education (risk factors, diet and physical activity),” which covers most facets of the program. A cautious note was struck by one LHD, which said - “Would expect guidelines. However, we would really need to examine what would really be possible with the amount of staff available,” - which is a realistic remark as both resources and time are limited in LHDs. Another LHD reported: “We have very limited financial resources for heart diseases and stroke prevention activities. I have no available staff to allocate to this other than what I have indicated throughout the survey. $12,000 gets minimal in terms of staffing. I would probably use it for media.” One response was: “We would be able to implement awareness campaigns around signs and symptoms and develop resources to hand out to the public telling them what to do if they experience signs and symptoms. In addition, we are working with our local YWCA and hospital to implement a wellness program this fall and money would help us to advertise and provide incentives for those who attend. It would be a wonderful opportunity for us for growth beyond the information we can get out in our Heart Smart for Women program and information to those who are breast and cervical cancer screening clients.” Three LHDs from rural areas said they had poor allocation of funds and transportation, and found it difficult to attract and retain nurses and health educators. Overall, there was an enthusiastic response from a majority of local health departments to this question, which indicates that additional funds are always needed to implement in-depth community programs. There were some excellent suggestions and innovative ideas on how they would use additional funds to improve the heart disease and stroke prevention program in the jurisdiction of their LHDs. The quality of responses indicates that, though the LHDs have the desire to provide comprehensive prevention services, they are hampered by the shortage of resources at all levels. This question, the last one, asked the LHDs to give comments/suggestions they would like to share about the program. There was a response from 32 (34.0%) out of 94 LHDs, and 62 (66.0%) did not respond. Only about one in three LHDs responded to this question. This open-ended question allowed the LHDs to express their views on the constraints and needs of the heart disease and stroke prevention program. 59. Any other comments/suggestions you would like to share? Percent Number
Total Respondents 34.0% 32
(skipped this question) 66.0% 62
55
The common refrain of the 32 (34%) who responded was, “PLEASE SEND MONEY SOON!!!!” Five (15.6%) respondents thought that they were already overworked with other programs and had neither the staff, time nor resources to conduct an exclusive program for heart disease and stroke prevention. Some of the other comments were that “12,000 dollars would be hardly enough money to develop and initiate a quality program”; “our programs are too often driven by resources than needs;” “we currently have no organizational division charged with chronic disease control and thus, no champion.” Another described the fund situation as “$12,000 would be a drop in the bucket!” Another pertinent comment was that “Our local health department has been the Community Training Center for the American Heart Association CPR/AED/First Aid training for approximately 10 years and has never received ANY reimbursement for doing this. We have approximately 40 CPR instructors in the county. The cost for this program falls on the county taxes for support. ANY financial assistance would be wonderful! One suggested that “The state needs to look at RFPs/grants for this on a broader scale.” One county reported, “Local health departments are taxed to the limit and required to do many things that are unfunded? IPLAN is a good example. In …. County the PH budget is primarily supported by local tax dollars with only a small portion funded by IDPH funds. Twenty-five percent of the budget is with funding from DHS while only about 5 percent comes from IDPH. That is a reality.” Another respondent said, “We would need additional funding to support staff. Can't run a program without staff!” One respondent noted, “The needs for added resources are significant in our county. Screening equipment and staff is a significant need for our county to do additional cholesterol checks and blood pressure screens.” All these responses imply that there is a need to actively pursue alternative sources of funds, and the state needs to sanction more funds to create successful and sustainable prevention programs for heart disease and stroke. The comments from the rural LHDs were very informative. From one LHD, the response was “‘in rural southern Illinois, transportation is always a barrier to many program activities as well as funding,” and another reported, “We are a very small rural area agency with the population of 5,084. We have no hospital, industry and no transportation system.” One other LHD said, “Funding is always an issue. With adequate and continuous funding, we could make an impact. Often times the rural counties are overlooked because of lower populations but we still have the same percentage of disease.” These comments make it obvious that rural counties are facing problems at many levels which lead to health disparities, and which need to be addressed at the earliest by providing more funds and other resources. One respondent said, “It seems it takes at least one and a half to two years to establish a program and for word of mouth to get around about it. Then funding ends and programs are discontinued.” This is true, as dissemination and diffusion of programs takes several years, as it is not easy to wean people away from long-established ways of thinking and acting, even for their own health benefit. Only three respondents said they would increase involvement of physicians and hospitals in the program. One LHD commented, “We should be encouraged to use evidenced based programs. A group of programs selected by the department would ensure uniformity within Illinois.” This is a particularly apt suggestion, as a uniform, state-wide policy of program planning and dissemination produces long-term results at lower cost, and allows greater sharing of resources between neighboring departments and counties. Overall, about two-thirds LHDs did not offer any comments or suggestions on the heart disease and stroke prevention program. All those who responded reported that the program implementation was suffering appreciably due to lack of funds and staff. Some also said they needed more materials and community collaborations to make the program reach a wider audience. The rural counties had the opportunity to report problems peculiar to small health departments, but which reflect the disparity in provision of essential health resources and services to rural areas.
56
RECOMMENDATIONS The local health departments (LHDs) in the state play a major role in implementing and disseminating public health programs. The survey of the 94 LHDs in Illinois on the current state of the Heart Disease and Stroke Prevention Program has revealed many areas that need to be addressed to achieve the State and Healthy People 2010 goals. Analyses of the results of the survey have led us to make certain recommendations for strengthening the program.
Priority: Move HD & S prevention to one of the two top priorities in all LHDs
Uniformity of Services: Ensure that all LHDs have a uniform system of offering basic services like BP screening, cholesterol screening, and public health education.
Effective Health Communication:
o Standard Communication Materials: Formulate a standard set of communication materials on heart disease and stroke prevention for statewide distribution to health professionals, LHDs, policy makers, legislators, and all stakeholders. These materials should reflect evidence–based recommendations and be consistent with the current acceptable standards of care.
o Should be consistently available (no photocopies). o Create a public information campaign for statewide dissemination: craft easily
understood messages on cardiovascular health, its risk factors and consequences of neglect; messages on how to recognize a heart attack or stroke and how and where to access help in an emergency. Assess the feasibility of using mass media like radio and television to increase reach of the program.
o Long-term dissemination: The strategy needs to be implemented over a period of at least two to five years for the impact to be felt. A repetitive or cyclic campaign will be more effective in reaching target populations.
o Sustainability: the campaign should be sustainable to overcome public prejudices and beat the competition from commercial food competitors
Partnerships and Collaborations:
1. National:
o Encourage more collaboration with national organizations like American Heart Association and NINDS, CDC for information, materials and help with screening for BP, cholesterol
2. State:
o Encourage the state health departments to promote more inter-LHD partnerships and resource sharing in implementing this program
o Involve other public health agencies like environment and agriculture to promote healthy eating and physical activity initiative.
o Permit some latitude in fund spending when conducting programs
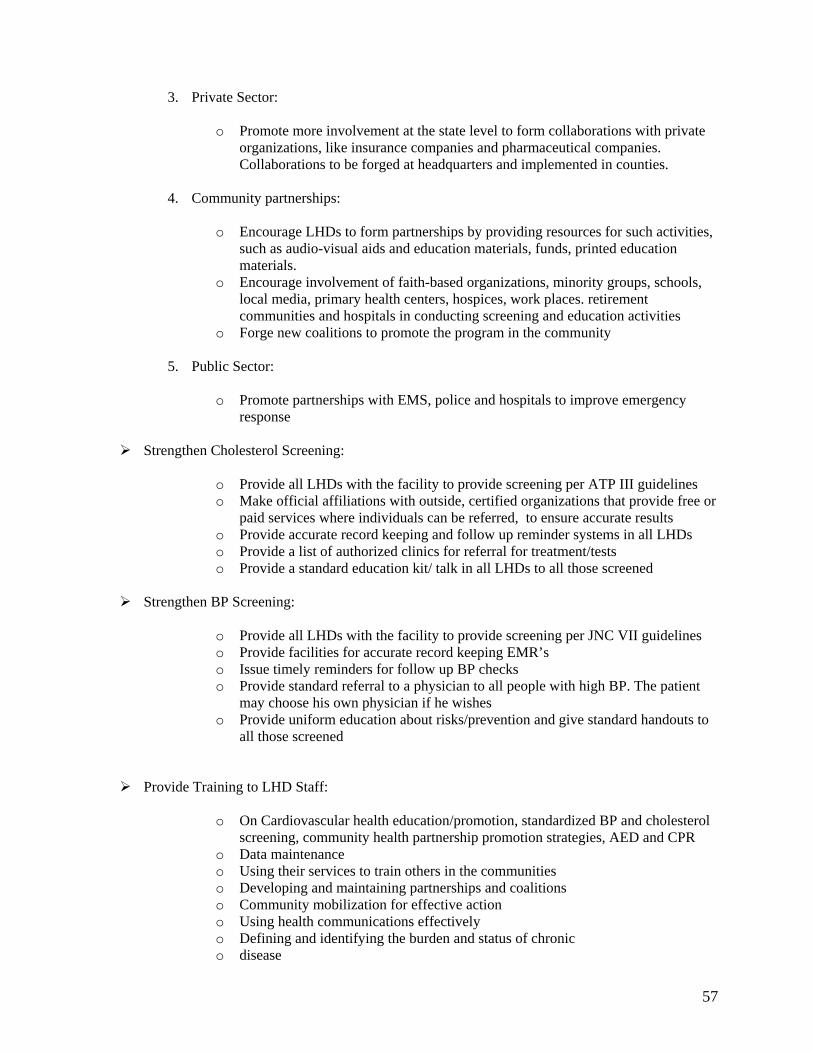
57
3. Private Sector:
o Promote more involvement at the state level to form collaborations with private organizations, like insurance companies and pharmaceutical companies. Collaborations to be forged at headquarters and implemented in counties.
4. Community partnerships:
o Encourage LHDs to form partnerships by providing resources for such activities, such as audio-visual aids and education materials, funds, printed education materials.
o Encourage involvement of faith-based organizations, minority groups, schools, local media, primary health centers, hospices, work places. retirement communities and hospitals in conducting screening and education activities
o Forge new coalitions to promote the program in the community
5. Public Sector:
o Promote partnerships with EMS, police and hospitals to improve emergency response
Strengthen Cholesterol Screening:
o Provide all LHDs with the facility to provide screening per ATP III guidelines o Make official affiliations with outside, certified organizations that provide free or
paid services where individuals can be referred, to ensure accurate results o Provide accurate record keeping and follow up reminder systems in all LHDs o Provide a list of authorized clinics for referral for treatment/tests o Provide a standard education kit/ talk in all LHDs to all those screened
Strengthen BP Screening:
o Provide all LHDs with the facility to provide screening per JNC VII guidelines o Provide facilities for accurate record keeping EMR’s o Issue timely reminders for follow up BP checks o Provide standard referral to a physician to all people with high BP. The patient
may choose his own physician if he wishes o Provide uniform education about risks/prevention and give standard handouts to
all those screened
Provide Training to LHD Staff:
o On Cardiovascular health education/promotion, standardized BP and cholesterol screening, community health partnership promotion strategies, AED and CPR
o Data maintenance o Using their services to train others in the communities o Developing and maintaining partnerships and coalitions o Community mobilization for effective action o Using health communications effectively o Defining and identifying the burden and status of chronic o disease
58
o Developing a training module in consultation with clinicians, academia, voluntary associations and public health agencies. This module can be disseminated to all local and public health agencies. This will ensure uniformity, topicality and reliability
Reduce Disparities:
o Increase provision of education materials in Spanish and other languages o Conduct culturally appropriate interventions targeted to
priority populations o Train community volunteers from underserved groups in CVD prevention in
LHDs and encourage dissemination in communities o Provide multilingual programs in LHDs o Use media for mass dissemination of messages in Spanish o Provide services to uninsured at LHDs
Increase Funding/Staff to LHDs:
Effective social marketing of the program needs material, physical, human and economic resources. To make a success of the program, more funds and resources need to be allocated to the heart disease and stroke prevention program. Conclusion After analyzing the results of the survey, it is obvious that the heart disease and stroke prevention program of IDPH needs to be improved and strengthened in most areas to enhance its reach and dissemination to achieve 2010 Healthy People goals. It implies concerted efforts at the LHD and state level to implement uniform policies for training the staff in public education on the subject, ensure that the LHDs follow a uniform method of screening, and seek collaborations with all stakeholders in the community and business sector to expand services and share costs. Paucity of funds, material, staff and training resources, coupled with limited time available to devote exclusively to a single program, are the main reasons for the LHDs present performance as revealed in the survey. There is a definite call for increased funding to fulfill the needs to make this program a success.

APPENDIX A: WORKING GROUP MEMBERS
NAME OF ORGANIZATION NAME AND TITLE
IDPH Staff
Illinois Heart Disease and Stroke Prevention Program
Division of Chronic Disease Prevention and Control
Julie A. Harvill, M.P.A., M.P.H., Administrator
Illinois Heart Disease and Stroke Prevention Program
Division of Chronic Disease Prevention and Control
Lynette E. Shaw, M.S.Ed., CHES, Health Educator
Division of Chronic Disease Prevention and Control
Julie B. Doetsch, M.A. Data Analyst
Prevention Research Center, Institute of Health Policy and Research, UIC
Institute for Health Research and Policy, UIC, Chicago
William Baldyga, MA, DrPH Associate Director
UIC School of Public Health UIC College of Medicine - Rockford
Karen E. Peters, DrPH Assistant Professor
UIC School of Public Health Assistant Director
National Center for Rural Health Professions
Institute for Health Research and Policy, UIC, Chicago
Sunanda Gupta, MD, MPH Research Specialist
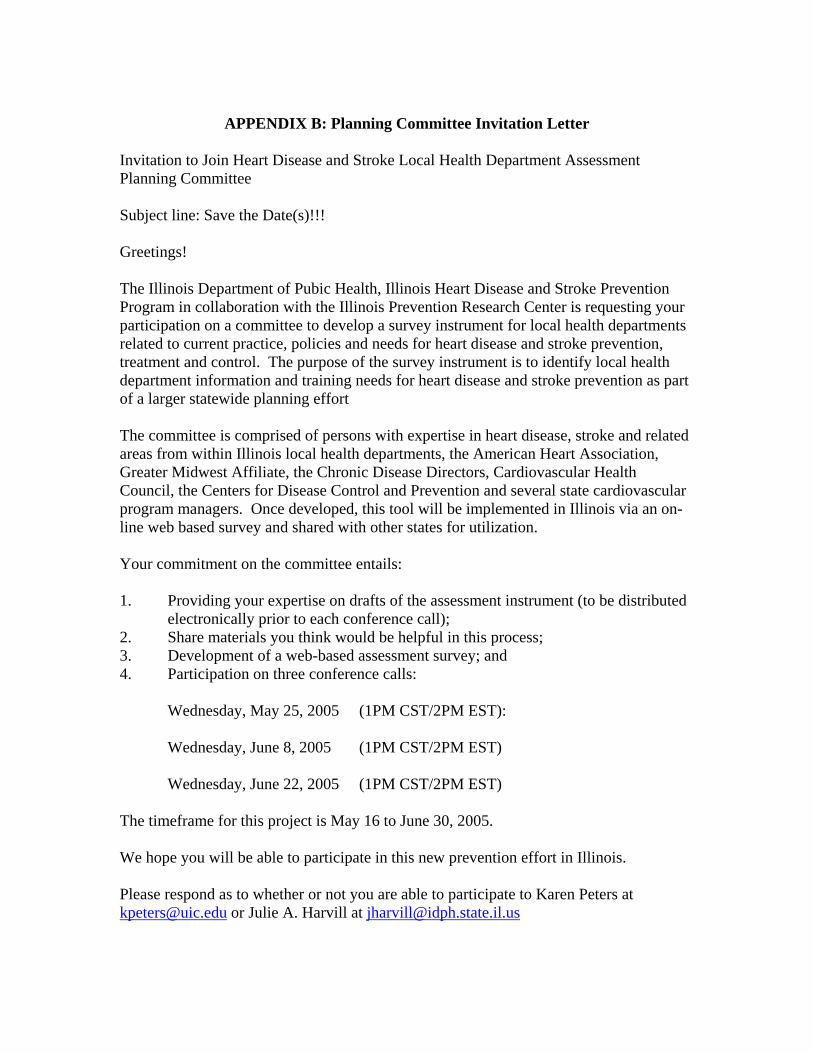
APPENDIX B: Planning Committee Invitation Letter
Invitation to Join Heart Disease and Stroke Local Health Department Assessment Planning Committee Subject line: Save the Date(s)!!! Greetings! The Illinois Department of Pubic Health, Illinois Heart Disease and Stroke Prevention Program in collaboration with the Illinois Prevention Research Center is requesting your participation on a committee to develop a survey instrument for local health departments related to current practice, policies and needs for heart disease and stroke prevention, treatment and control. The purpose of the survey instrument is to identify local health department information and training needs for heart disease and stroke prevention as part of a larger statewide planning effort The committee is comprised of persons with expertise in heart disease, stroke and related areas from within Illinois local health departments, the American Heart Association, Greater Midwest Affiliate, the Chronic Disease Directors, Cardiovascular Health Council, the Centers for Disease Control and Prevention and several state cardiovascular program managers. Once developed, this tool will be implemented in Illinois via an on-line web based survey and shared with other states for utilization. Your commitment on the committee entails: 1. Providing your expertise on drafts of the assessment instrument (to be distributed
electronically prior to each conference call); 2. Share materials you think would be helpful in this process; 3. Development of a web-based assessment survey; and 4. Participation on three conference calls:
Wednesday, May 25, 2005 (1PM CST/2PM EST):
Wednesday, June 8, 2005 (1PM CST/2PM EST)
Wednesday, June 22, 2005 (1PM CST/2PM EST) The timeframe for this project is May 16 to June 30, 2005. We hope you will be able to participate in this new prevention effort in Illinois. Please respond as to whether or not you are able to participate to Karen Peters at [email protected] or Julie A. Harvill at [email protected]
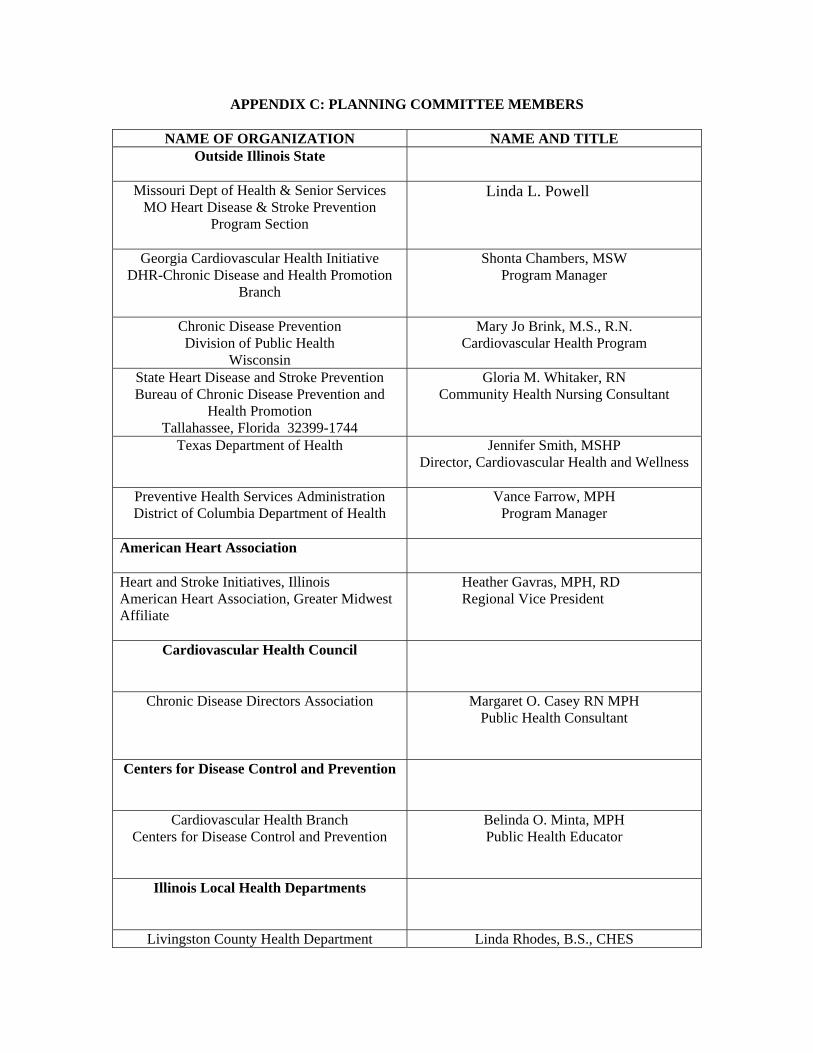
APPENDIX C: PLANNING COMMITTEE MEMBERS
NAME OF ORGANIZATION NAME AND TITLE Outside Illinois State
Missouri Dept of Health & Senior Services MO Heart Disease & Stroke Prevention
Program Section
Linda L. Powell
Georgia Cardiovascular Health Initiative DHR-Chronic Disease and Health Promotion
Branch
Shonta Chambers, MSW Program Manager
Chronic Disease Prevention Division of Public Health
Wisconsin
Mary Jo Brink, M.S., R.N. Cardiovascular Health Program
State Heart Disease and Stroke Prevention Bureau of Chronic Disease Prevention and
Health Promotion Tallahassee, Florida 32399-1744
Gloria M. Whitaker, RN Community Health Nursing Consultant
Texas Department of Health
Jennifer Smith, MSHP Director, Cardiovascular Health and Wellness
Preventive Health Services Administration District of Columbia Department of Health
Vance Farrow, MPH Program Manager
American Heart Association
Heart and Stroke Initiatives, Illinois American Heart Association, Greater Midwest Affiliate
Heather Gavras, MPH, RD Regional Vice President
Cardiovascular Health Council
Chronic Disease Directors Association
Margaret O. Casey RN MPH Public Health Consultant
Centers for Disease Control and Prevention
Cardiovascular Health Branch Centers for Disease Control and Prevention
Belinda O. Minta, MPH Public Health Educator
Illinois Local Health Departments
Livingston County Health Department Linda Rhodes, B.S., CHES
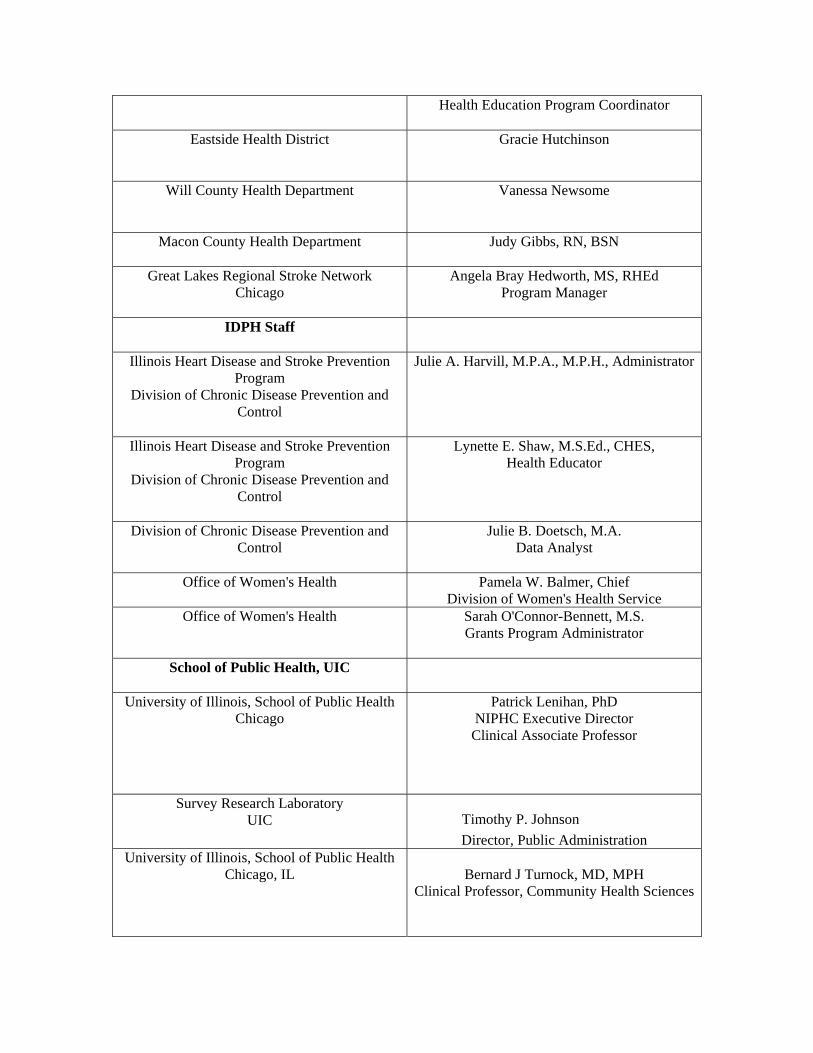
Health Education Program Coordinator
Eastside Health District
Gracie Hutchinson
Will County Health Department
Vanessa Newsome
Macon County Health Department
Judy Gibbs, RN, BSN
Great Lakes Regional Stroke Network Chicago
Angela Bray Hedworth, MS, RHEd Program Manager
IDPH Staff
Illinois Heart Disease and Stroke Prevention Program
Division of Chronic Disease Prevention and Control
Julie A. Harvill, M.P.A., M.P.H., Administrator
Illinois Heart Disease and Stroke Prevention Program
Division of Chronic Disease Prevention and Control
Lynette E. Shaw, M.S.Ed., CHES, Health Educator
Division of Chronic Disease Prevention and Control
Julie B. Doetsch, M.A. Data Analyst
Office of Women's Health
Pamela W. Balmer, Chief Division of Women's Health Service
Office of Women's Health
Sarah O'Connor-Bennett, M.S. Grants Program Administrator
School of Public Health, UIC
University of Illinois, School of Public Health Chicago
Patrick Lenihan, PhD NIPHC Executive Director
Clinical Associate Professor
Survey Research Laboratory UIC Timothy P. Johnson
Director, Public Administration University of Illinois, School of Public Health
Chicago, IL
Bernard J Turnock, MD, MPH Clinical Professor, Community Health Sciences
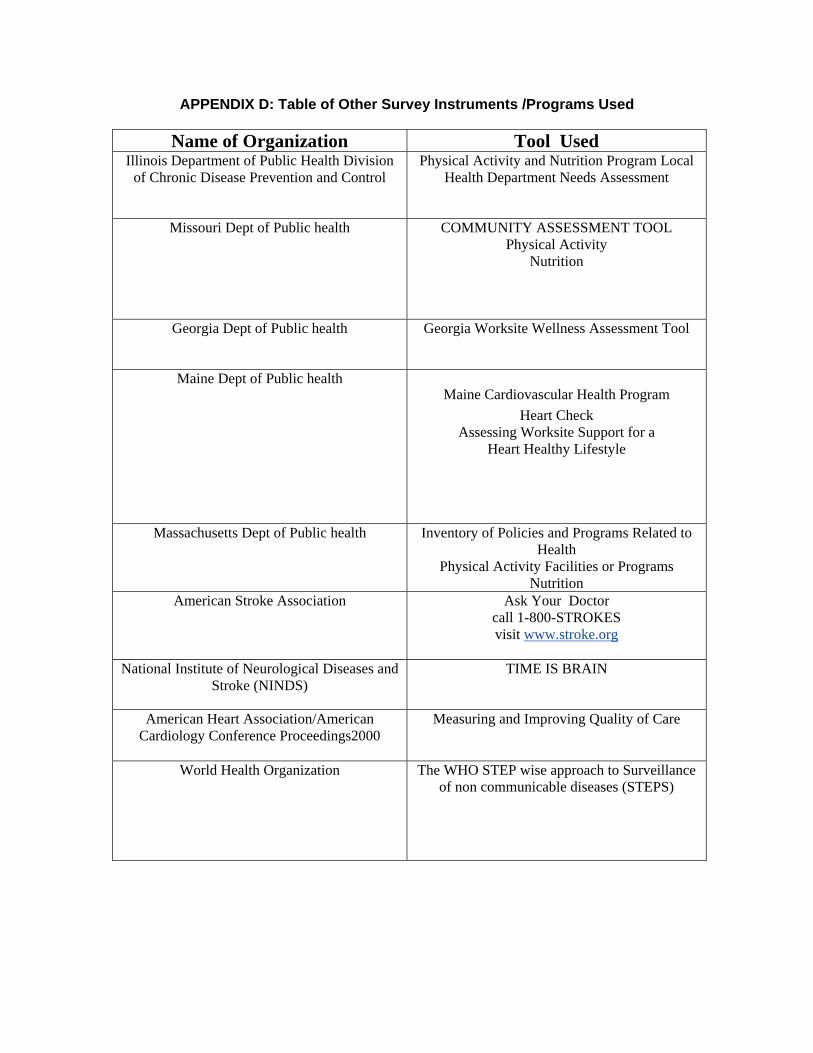
APPENDIX D: Table of Other Survey Instruments /Programs Used
Name of Organization Tool Used Illinois Department of Public Health Division
of Chronic Disease Prevention and Control Physical Activity and Nutrition Program Local
Health Department Needs Assessment
Missouri Dept of Public health
COMMUNITY ASSESSMENT TOOL Physical Activity
Nutrition
Georgia Dept of Public health
Georgia Worksite Wellness Assessment Tool
Maine Dept of Public health Maine Cardiovascular Health Program
Heart Check Assessing Worksite Support for a
Heart Healthy Lifestyle
Massachusetts Dept of Public health
Inventory of Policies and Programs Related to Health
Physical Activity Facilities or Programs Nutrition
American Stroke Association Ask Your Doctor call 1-800-STROKES visit www.stroke.org
National Institute of Neurological Diseases and
Stroke (NINDS) TIME IS BRAIN
American Heart Association/American Cardiology Conference Proceedings2000
Measuring and Improving Quality of Care
World Health Organization
The WHO STEP wise approach to Surveillance of non communicable diseases (STEPS)
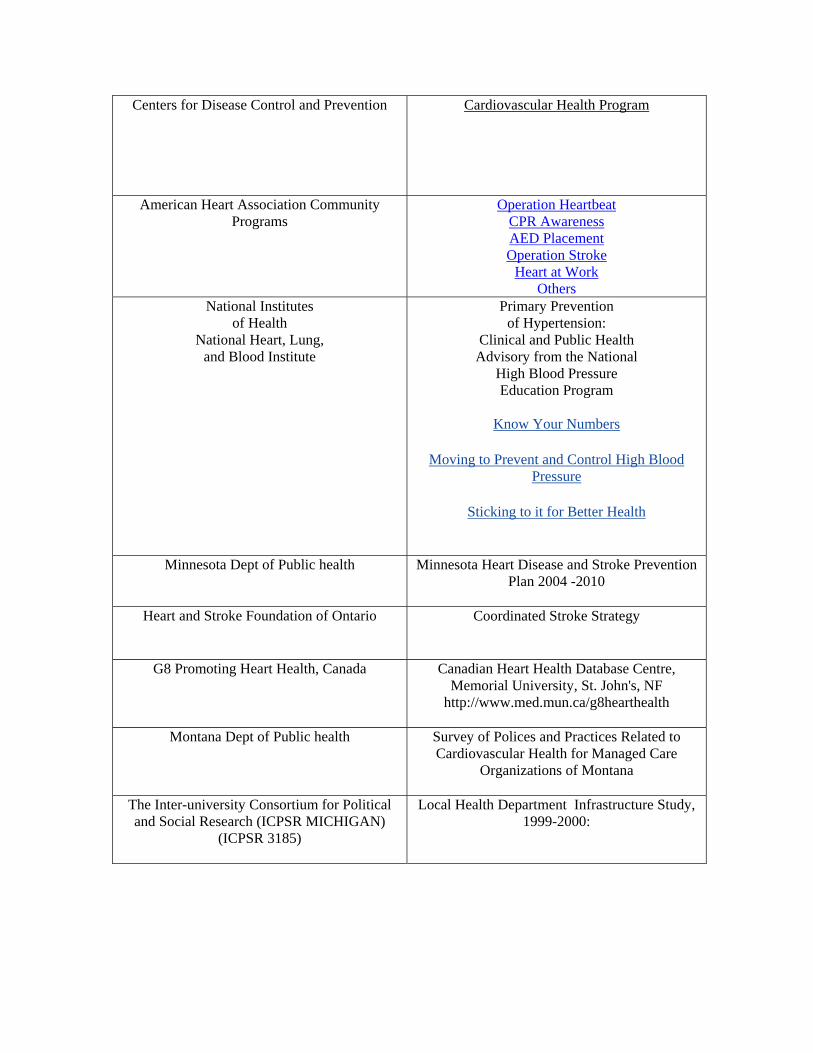
Centers for Disease Control and Prevention Cardiovascular Health Program
American Heart Association Community Programs
Operation Heartbeat CPR Awareness AED Placement Operation Stroke
Heart at Work Others
National Institutes of Health
National Heart, Lung, and Blood Institute
Primary Prevention of Hypertension:
Clinical and Public Health Advisory from the National
High Blood Pressure Education Program
Know Your Numbers
Moving to Prevent and Control High Blood Pressure
Sticking to it for Better Health
Minnesota Dept of Public health
Minnesota Heart Disease and Stroke Prevention
Plan 2004 -2010
Heart and Stroke Foundation of Ontario Coordinated Stroke Strategy
G8 Promoting Heart Health, Canada
Canadian Heart Health Database Centre,
Memorial University, St. John's, NF http://www.med.mun.ca/g8hearthealth
Montana Dept of Public health
Survey of Polices and Practices Related to Cardiovascular Health for Managed Care
Organizations of Montana
The Inter-university Consortium for Political and Social Research (ICPSR MICHIGAN)
(ICPSR 3185)
Local Health Department Infrastructure Study, 1999-2000:

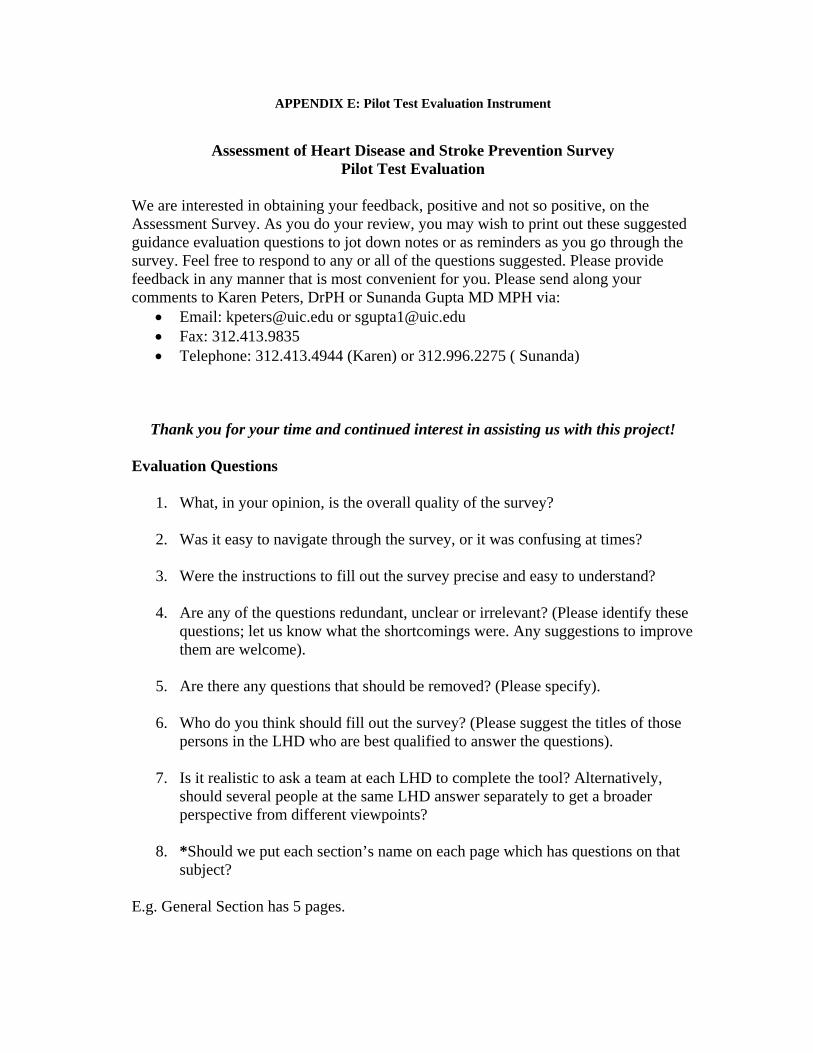
APPENDIX E: Pilot Test Evaluation Instrument
Assessment of Heart Disease and Stroke Prevention Survey Pilot Test Evaluation
We are interested in obtaining your feedback, positive and not so positive, on the Assessment Survey. As you do your review, you may wish to print out these suggested guidance evaluation questions to jot down notes or as reminders as you go through the survey. Feel free to respond to any or all of the questions suggested. Please provide feedback in any manner that is most convenient for you. Please send along your comments to Karen Peters, DrPH or Sunanda Gupta MD MPH via:
• Email: [email protected] or [email protected] • Fax: 312.413.9835 • Telephone: 312.413.4944 (Karen) or 312.996.2275 ( Sunanda)
Thank you for your time and continued interest in assisting us with this project! Evaluation Questions
1. What, in your opinion, is the overall quality of the survey?
2. Was it easy to navigate through the survey, or it was confusing at times?
3. Were the instructions to fill out the survey precise and easy to understand?
4. Are any of the questions redundant, unclear or irrelevant? (Please identify these questions; let us know what the shortcomings were. Any suggestions to improve them are welcome).
5. Are there any questions that should be removed? (Please specify).
6. Who do you think should fill out the survey? (Please suggest the titles of those
persons in the LHD who are best qualified to answer the questions).
7. Is it realistic to ask a team at each LHD to complete the tool? Alternatively, should several people at the same LHD answer separately to get a broader perspective from different viewpoints?
8. *Should we put each section’s name on each page which has questions on that
subject? E.g. General Section has 5 pages.
9. *Should we write: Section on Blood Pressure, Section on Cholesterol, etc for each section, as the page numbers and section numbers do not match? (The survey tool does not allow page numbers to be changed) Critique of Sections 1. Introduction Do we need make any changes in instructions? 2. Consent Is the wording ok? 3. General Section What additional questions can be asked in the General section? Do the current sets of questions capture the ‘needs’ for the program? Can you suggest additions, deletions or rewording of any questions? 4. Control High Blood Pressure Section
• Do the questions cover most of the programs and activities for screening for high BP? Are any deletions, additions or revisions necessary?
5. Control High Cholesterol Section
• Are all aspects of screening programs for cholesterol covered in the list of questions? Do you think that some need to be revised, deleted or additional ones added to increase the depth of the survey?
6. Know Signs/Symptoms of Heart Attack and Stroke
• Are the questions relevant and comprehensive? Are any additional questions necessary? Any need to be revised or deleted?
7. Improve Emergency Response
• Do you think the questions address all relevant issues relating to improving emergency response? Are any additional questions necessary?
8. Disparities
• Do you think the questions are relevant to addressing health disparity? Do we need to make revisions, additions or remove some of them from the tool?
9. Training
• Are the questions on training sufficient to make an assessment of the needs
for training for LHD prevention programming?
• Do we get a clear picture of existing training and the amount of desired training needed for successful implementation?
10. Data and Closing
• Do you think that the questions on data and closing are pertinent to the survey? Do we need to change the format or tone of these questions? Please specify.
Time for Survey
• How long did it take you to fill out the survey? Do you think it is too long, too short or just right?
• What do you think is the most acceptable amount of time to hold the
interest of someone who is filling out an online survey of this type? (Please specify the number of minutes)
• What inducements/incentives can we use to encourage people to complete
the survey? (e.g. small incentives for early bird responses, all completers entered into a lottery to receive a cash prize)
Final Comments/Impressions
• All suggestions are welcome! Please feel free to ask for modifications, deletions or additions anywhere in the whole survey tool.
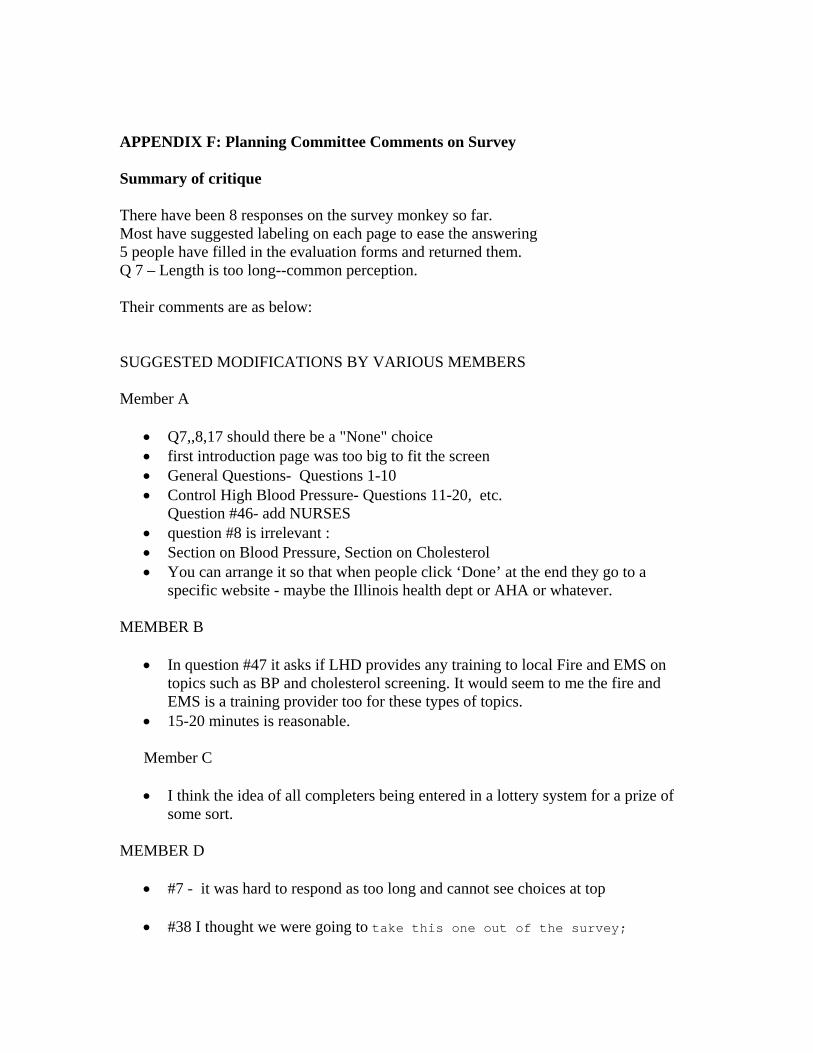
APPENDIX F: Planning Committee Comments on Survey Summary of critique There have been 8 responses on the survey monkey so far. Most have suggested labeling on each page to ease the answering 5 people have filled in the evaluation forms and returned them. Q 7 – Length is too long--common perception. Their comments are as below: SUGGESTED MODIFICATIONS BY VARIOUS MEMBERS Member A
• Q7,,8,17 should there be a "None" choice • first introduction page was too big to fit the screen • General Questions- Questions 1-10 • Control High Blood Pressure- Questions 11-20, etc.
Question #46- add NURSES • question #8 is irrelevant : • Section on Blood Pressure, Section on Cholesterol • You can arrange it so that when people click ‘Done’ at the end they go to a
specific website - maybe the Illinois health dept or AHA or whatever.
MEMBER B • In question #47 it asks if LHD provides any training to local Fire and EMS on
topics such as BP and cholesterol screening. It would seem to me the fire and EMS is a training provider too for these types of topics.
• 15-20 minutes is reasonable. Member C • I think the idea of all completers being entered in a lottery system for a prize of
some sort. MEMBER D
• #7 - it was hard to respond as too long and cannot see choices at top
• #38 I thought we were going to take this one out of the survey;
MEMBER E
• Some problems with the longer checklist, you lost the headings of the column • This was also the case for reading across, particularly the instructions. (This may
have been on my end with the computer – but I couldn’t see the whole screen across).
• Q 6-Confusing area was the check list of populations, male only and female only options, especially if you are checking all that apply .
• Maybe buttons for back to top or something • Ideally the administrator should be aware of most of the information. Both would
be realistic depending on the LHD. One person could complete it with input from others. I think local dynamics would dictate this.
Program managers or health educators would have more information specific to activities, populations serviced, etc.
• Yes it is good to be able to identify what questions you are answering._ Label each section
• Total it took about 35 – 40 minutes. This included going back the second day to review my responses. Maybe length should be 15, no longer than 20, minutes.
APPENDIX G: CDC Comments on Results of Pilot Test
Assessment of Heart Disease and Stroke Prevention Survey Pilot Test Evaluation
We are interested in obtaining your feedback, positive and not so positive, on the Assessment Survey. As you do your review, you may wish to print out these suggested guidance evaluation questions to jot down notes or as reminders as you go through the survey. Feel free to respond to any or all of the questions suggested. Please provide feedback in any manner that is most convenient for you. Please send along your comments to Karen Peters, DrPH or Sunanda Gupta MD MPH via:
• Email: [email protected] or [email protected] • Fax: 312.413.9835 • Telephone: 312.413.4944 (Karen) or 312.996.2275 ( Sunanda)
Thank you for your time and continued interest in assisting us with this project!
Evaluation Questions
1. What, in your opinion, is the overall quality of the survey? Very good
2. Was it easy to navigate through the survey, or it was confusing at times? It was fairly easy and took about 30 minutes to complete.
3. Were the instructions to fill out the survey precise and easy to understand? Yes
4. Are any of the questions redundant, unclear, or irrelevant? (Please identify these
questions; let us know what the shortcomings were. Any suggestions to improve them are welcome).
• General Questions section: question #7 separate Medicaid and Medicare.
These are two different populations and lumping them together will make it difficult to assess whether interventions are geared toward low SES or elderly populations.
• Question #8: Collaborators: primary care: private health centers/clinics, managed care organizations/health plans, worksite wellness/health promotion programs, business coalitions and industry organizations
• Question #9; the format changes from previous questions: the type of organizations are listed in the columns and the methods of collaboration are listed in the rows
• Question #11: Chronic Care Model Collaborative – no such thing. The model is used in the Collaborative, HRSA/BPHC Health Disparities Collaborative.
• Quest #12, Type of Campaign: regular BP screening and control, Cholesterol screening and control for at risk
• Question #13, Recommended Activity: Promote policy/system change to assure hospitals follow evidence-based guidelines and recommendations for heart disease and stroke prevention and management. AHA guidelines are not the only ones that have been developed.
• Control BP Section: same comment as in first bullet. Question: how do you identify persons with low-literacy (is the question that can be answered), at risk groups – can this really be answered or is it captured in the bullet re: persons with existing chronic disease (which includes obesity).
• Community Collaborator: managed care organizations/HMOs, insurance companies/health plans, businesses/private corporations/employee groups/business coalitions
• Addition of the following questions: Does your LDH offer follow-up services/referral to individuals identified with high blood pressure during screenings? Question #15 only speaks to heart disease or stroke not the risk factor.
• Question #20: The list of risk factors are not accurate: should be physical inactivity (not physical activity), poor diet (not nutrition), tobacco use (not smoking cessation), diabetes (not diabetes control)
• Q#21, LHDs may not know specific education campaigns, such as Know Your Numbers. Rephrase question: ….use such national education awareness campaigns such as “Know Your Numbers”…..
• Q#22, I don’t think this question gets to what you are intending to ask. Consider rewording to: Do you provide or has your staff received training on standardized blood pressure standardization measurement?
• Question numbers skips from 24 to 34 • What happened to the cholesterol questions? Seem to be missing a number
of them • Question #34, same comments as in bullet one • Question #41 (from the original draft survey) has been deleted. I would
recommend that you bring it back. It will help to identify where AEDs are placed and possibly an opportunity to provide training to ensure that all potential users know how it works.
• Q#48: Topics: Add last bullet: Partnership development • Q#52, Topics: Community organizations/mobilization/developing
partnerships • Q#55: Improve access to disabled ???? (populations…a word is missing?
5. Are there any questions that should be removed? (Please specify). No
6. Who do you think should fill out the survey? (Please suggest the titles of those
persons in the LHD who are best qualified to answer the questions). I don’t know the structure of local health departments very well, so I am not in the position to suggest any staff.
7. Is it realistic to ask a team at each LHD to complete the tool? Alternatively,
should several people at the same LHD answer separately to get a broader
perspective from different viewpoints? I think it may be beneficial to ask two (but no more) people to complete the survey: one in administration and the other in clinical services (clinicians, or other who provide care/counseling/etc).
8. *Should we put each section’s name on each page that has questions on that
subject? No, this may bias the responses. 9. *Should we write: Section on Blood Pressure, Section on Cholesterol, etc for each section, as the page numbers and section numbers do not match? (The survey tool does not allow page numbers to be changed) Critique of Sections 1. Introduction Do we need make any changes in instructions? No 2. Consent Is the wording ok? Yes 3. General Section What additional questions can be asked in the General section? Do the current sets of questions capture the ‘needs’ for the program? Can you suggest additions, deletions, or rewording of any questions? 4. Control High Blood Pressure Section
• Do the questions cover most of the programs and activities for screening for high BP? Are any deletions, additions, or revisions necessary? See Evaluation question #4
5. Control High Cholesterol Section
• Are all aspects of screening programs for cholesterol covered in the list of questions? Do you think that some need to be revised, deleted, or additional ones added to increase the depth of the survey? See Evaluation question #4
6. Know Signs/Symptoms of Heart Attack and Stroke
• Are the questions relevant and comprehensive? Are any additional questions necessary? Any need to be revised or deleted. See Evaluation question #4
7. Improve Emergency Response
• Do you think the questions address all relevant issues relating to improving emergency response? Are any additional questions necessary? See Evaluation question #4
8. Disparities
• Do you think the questions are relevant to addressing health disparity? Do we need to make revisions, additions or remove some of them from the tool? See Evaluation question #4
9. Training
• Are the questions on training sufficient to assess the needs for training for
LHD prevention programming? See Evaluation question #4
• Do we get a clear picture of existing training and the amount of desired training needed for successful implementation? See Evaluation question #4
10. Data and Closing
• Do you think that the questions on data and closing are pertinent to the survey? Do we need to change the format or tone of these questions? Please specify. See Evaluation question #4
Time for Survey
• How long did it take you to fill out the survey? Do you think it is too long, too short, or just right? About 30 minutes. It may take the LHD a little longer since they are entering real life/experiential responses.
• What do you think is the most acceptable amount of time to hold the
interest of someone who is filling out an online survey of this type? (Please specify the number of minutes) No more than 45 minutes.
• What inducements/incentives can we use to encourage people to complete
the survey? (e.g. small incentives for early bird responses, all completers entered into a lottery to receive a cash prize) CDC funding cannot be used for cash prizes. I think reminders and other triggers should be used. If there are posters, educational materials available, those can be used as incentives.
Final Comments/Impressions
• All suggestions are welcome! Please feel free to ask for modifications, deletions or additions anywhere in the whole survey tool.
Survey on Assessment of LHD's in Illinois regarding Heart Disease and Stroke Prevention
Survey on Assessment of LHD's in Illinois regarding Heart Disease and Stroke Prevention Exit this survey >>
This survey is being conducted to assess the needs for the heart disease and stroke prevention program in all the LHD's in the State of Illinois.Your input will provide valuable data on the subject.
While your participation in this process is completely voluntary and your responses will be confidential,we encourage you to respond to these questions to the extent you feel comfortable.The answers are easy to complete using mostly multiple choice or scale answers.There are some open ended questions that permit you to further elaborate on your responses.
Instructions:Please follow the instruction prompts provided with each question.When you get to the end of a page, please click the "Next" or “Back” prompt, to navigate from page to page.If you would like to leave the survey at any time, just click "Exit this survey" at the top of the page.Your answers will be saved and you can resume it later,but only on the same computer.You are free to change your answers at any time before submission.When you have reached the end of the survey, please click on the "Done" prompt and your responses will be submitted to the database.
The survey should take about 35 minutes to complete. It is divided into ten sections, including a general section and sections on control high blood pressure, control high cholesterol, know signs and symptoms of heart attack and stroke, improve emergency response, improve quality of care, disparities, training, data and a final section on closing questions. If there are other staff who would be helpful in completing the survey, feel free to ask them to assist you in responding to questions. Thank you for your participation in completing this survey.
Next >>
http://www.surveymonkey.com/Users/61769026/Surveys/561851196289/4F466221-5AED-47B4-897A-A5D1D230459B.asp?U=561851196289&DO_NOT_COPY_THIS_LINK10/4/2005 9:54:16 AM
Survey on Assessment of LHD's in Illinois regarding Heart Disease and Stroke Prevention
Survey on Assessment of LHD's in Illinois regarding Heart Disease and Stroke Prevention Exit this survey >>
Consent
By completing the following questionnaire I am voluntarily consenting to participate in this assessment project.I understand that my responses will be confidential and the results of the study will be reported in the aggregate.
<< Prev Next >>
http://www.surveymonkey.com/Users/61769026/Surveys/561851196289/8A806B16-8182-49AD-9552-FC79FDF8391A.asp?U=561851196289&10/4/2005 9:55:14 AM
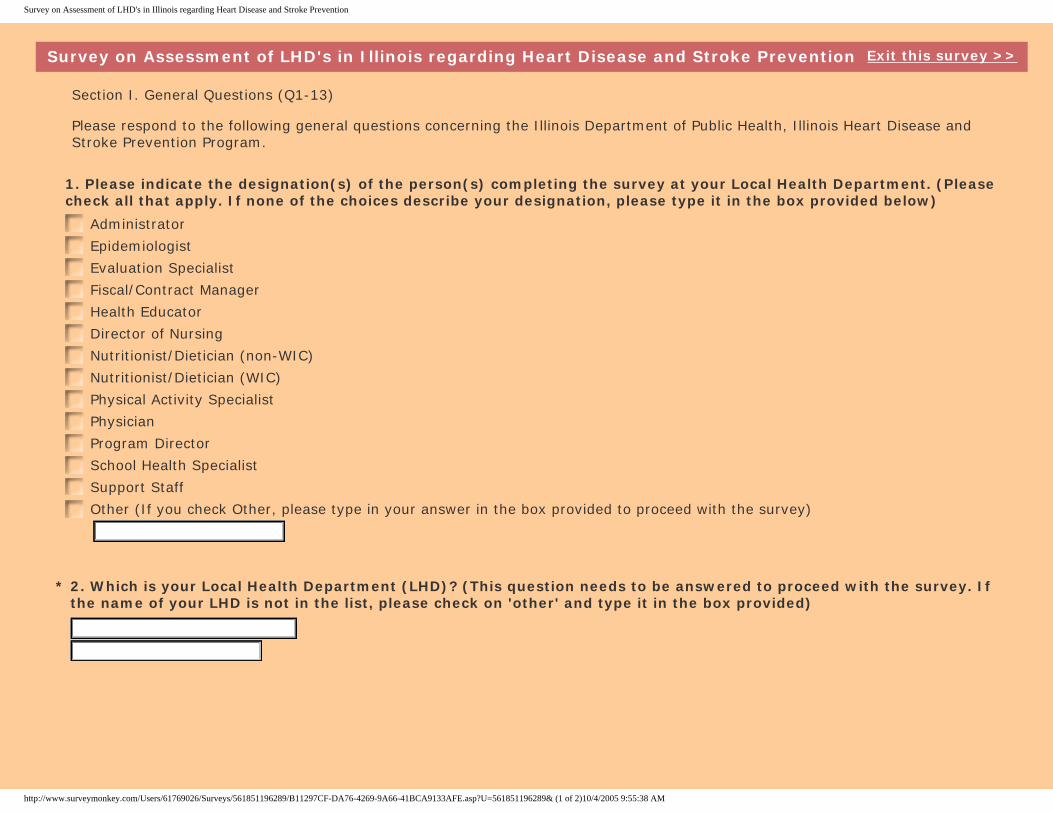
Survey on Assessment of LHD's in Illinois regarding Heart Disease and Stroke Prevention
Survey on Assessment of LHD's in Illinois regarding Heart Disease and Stroke Prevention Exit this survey >>
Section I. General Questions (Q1-13)
Please respond to the following general questions concerning the Illinois Department of Public Health, Illinois Heart Disease and Stroke Prevention Program.
1. Please indicate the designation(s) of the person(s) completing the survey at your Local Health Department. (Please check all that apply. If none of the choices describe your designation, please type it in the box provided below)
Administrator
Epidemiologist
Evaluation Specialist
Fiscal/Contract Manager
Health Educator
Director of Nursing
Nutritionist/Dietician (non-WIC)
Nutritionist/Dietician (WIC)
Physical Activity Specialist
Physician
Program Director
School Health Specialist
Support Staff
Other (If you check Other, please type in your answer in the box provided to proceed with the survey)
* 2. Which is your Local Health Department (LHD)? (This question needs to be answered to proceed with the survey. If the name of your LHD is not in the list, please check on 'other' and type it in the box provided)
http://www.surveymonkey.com/Users/61769026/Surveys/561851196289/B11297CF-DA76-4269-9A66-41BCA9133AFE.asp?U=561851196289& (1 of 2)10/4/2005 9:55:38 AM
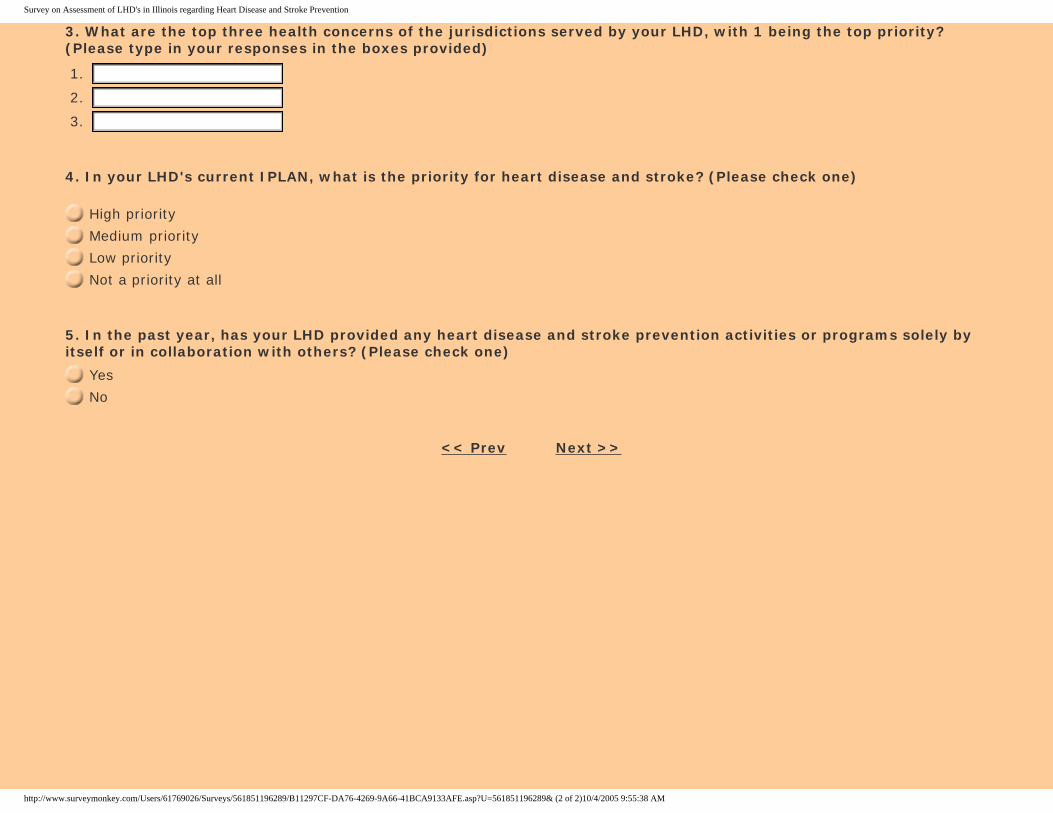
Survey on Assessment of LHD's in Illinois regarding Heart Disease and Stroke Prevention
3. What are the top three health concerns of the jurisdictions served by your LHD, with 1 being the top priority? (Please type in your responses in the boxes provided)
1.
2.
3.
4. In your LHD's current IPLAN, what is the priority for heart disease and stroke? (Please check one)
High priority
Medium priority
Low priority
Not a priority at all
5. In the past year, has your LHD provided any heart disease and stroke prevention activities or programs solely by itself or in collaboration with others? (Please check one)
Yes
No
<< Prev Next >>
http://www.surveymonkey.com/Users/61769026/Surveys/561851196289/B11297CF-DA76-4269-9A66-41BCA9133AFE.asp?U=561851196289& (2 of 2)10/4/2005 9:55:38 AM
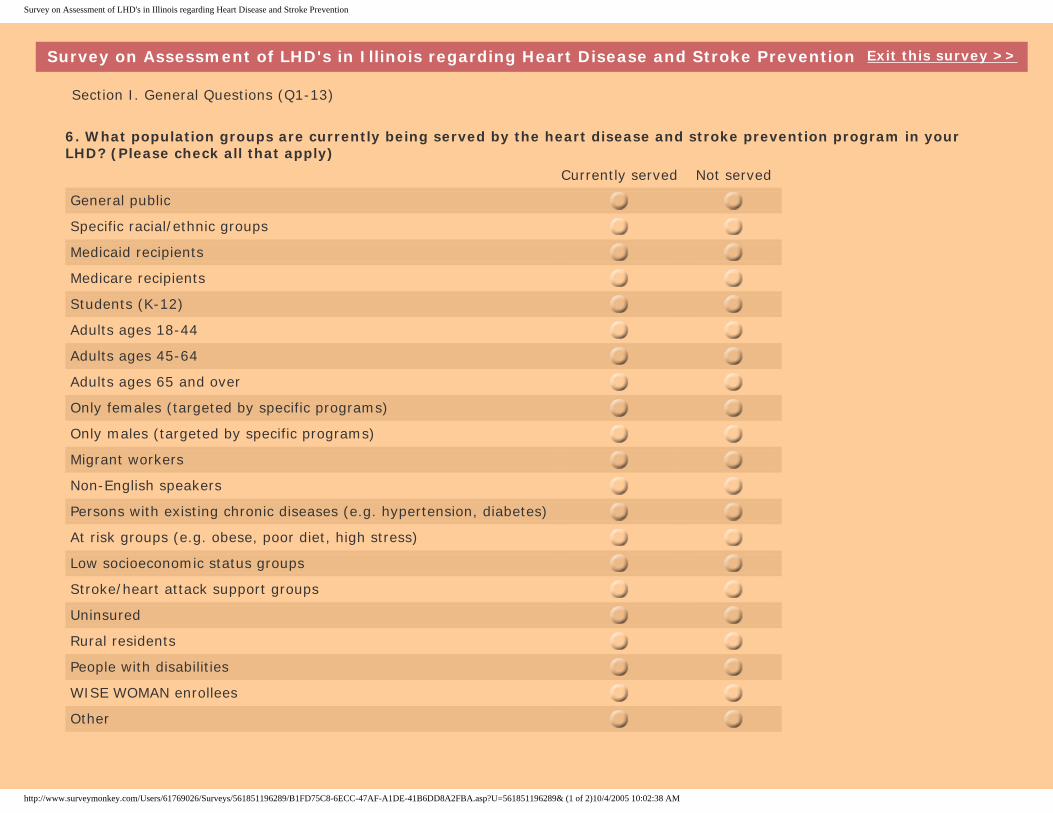
Survey on Assessment of LHD's in Illinois regarding Heart Disease and Stroke Prevention
Survey on Assessment of LHD's in Illinois regarding Heart Disease and Stroke Prevention Exit this survey >>
Section I. General Questions (Q1-13)
6. What population groups are currently being served by the heart disease and stroke prevention program in your LHD? (Please check all that apply) Currently served Not served
General public
Specific racial/ethnic groups
Medicaid recipients
Medicare recipients
Students (K-12)
Adults ages 18-44
Adults ages 45-64
Adults ages 65 and over
Only females (targeted by specific programs)
Only males (targeted by specific programs)
Migrant workers
Non-English speakers
Persons with existing chronic diseases (e.g. hypertension, diabetes)
At risk groups (e.g. obese, poor diet, high stress)
Low socioeconomic status groups
Stroke/heart attack support groups
Uninsured
Rural residents
People with disabilities
WISE WOMAN enrollees
Other
http://www.surveymonkey.com/Users/61769026/Surveys/561851196289/B1FD75C8-6ECC-47AF-A1DE-41B6DD8A2FBA.asp?U=561851196289& (1 of 2)10/4/2005 10:02:38 AM
Survey on Assessment of LHD's in Illinois regarding Heart Disease and Stroke Prevention
<< Prev Next >>
http://www.surveymonkey.com/Users/61769026/Surveys/561851196289/B1FD75C8-6ECC-47AF-A1DE-41B6DD8A2FBA.asp?U=561851196289& (2 of 2)10/4/2005 10:02:38 AM
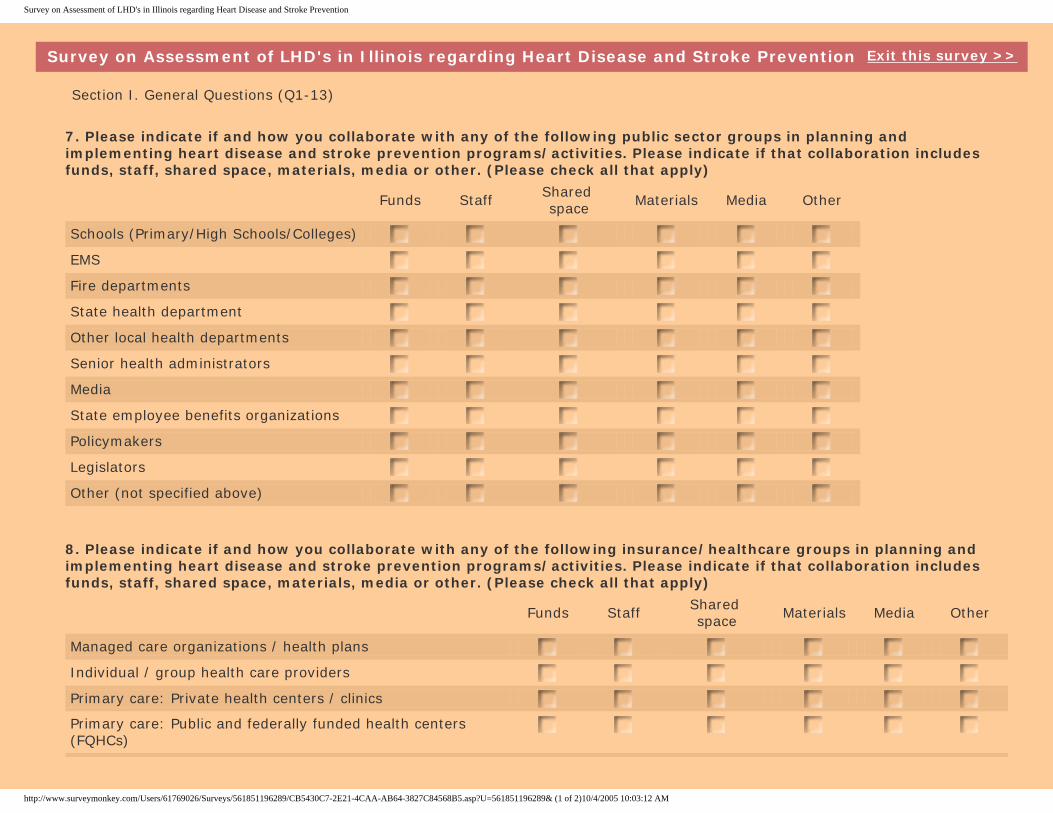
Survey on Assessment of LHD's in Illinois regarding Heart Disease and Stroke Prevention
Survey on Assessment of LHD's in Illinois regarding Heart Disease and Stroke Prevention Exit this survey >>
Section I. General Questions (Q1-13)
7. Please indicate if and how you collaborate with any of the following public sector groups in planning and implementing heart disease and stroke prevention programs/activities. Please indicate if that collaboration includes funds, staff, shared space, materials, media or other. (Please check all that apply)
Funds Staff Shared space Materials Media Other
Schools (Primary/High Schools/Colleges)
EMS
Fire departments
State health department
Other local health departments
Senior health administrators
Media
State employee benefits organizations
Policymakers
Legislators
Other (not specified above)
8. Please indicate if and how you collaborate with any of the following insurance/healthcare groups in planning and implementing heart disease and stroke prevention programs/activities. Please indicate if that collaboration includes funds, staff, shared space, materials, media or other. (Please check all that apply)
Funds Staff Shared space Materials Media Other
Managed care organizations / health plans
Individual / group health care providers
Primary care: Private health centers / clinics
Primary care: Public and federally funded health centers (FQHCs)
http://www.surveymonkey.com/Users/61769026/Surveys/561851196289/CB5430C7-2E21-4CAA-AB64-3827C84568B5.asp?U=561851196289& (1 of 2)10/4/2005 10:03:12 AM
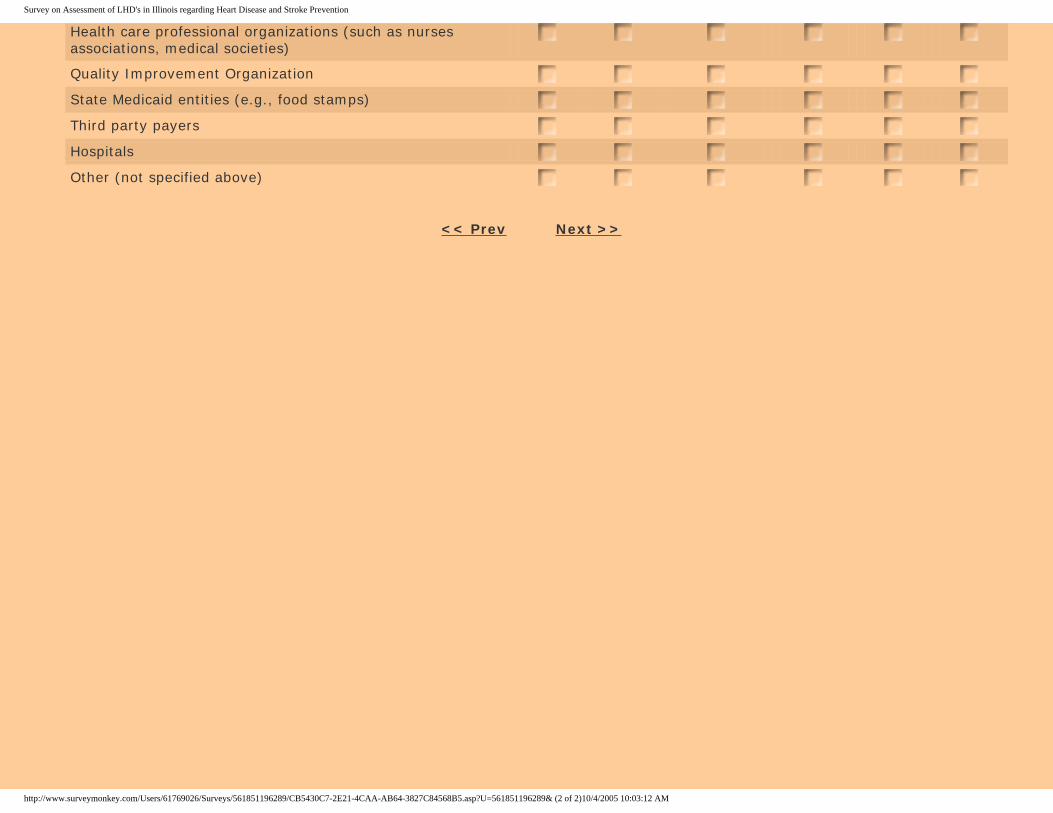
Survey on Assessment of LHD's in Illinois regarding Heart Disease and Stroke Prevention
Health care professional organizations (such as nurses associations, medical societies)
Quality Improvement Organization
State Medicaid entities (e.g., food stamps)
Third party payers
Hospitals
Other (not specified above)
<< Prev Next >>
http://www.surveymonkey.com/Users/61769026/Surveys/561851196289/CB5430C7-2E21-4CAA-AB64-3827C84568B5.asp?U=561851196289& (2 of 2)10/4/2005 10:03:12 AM
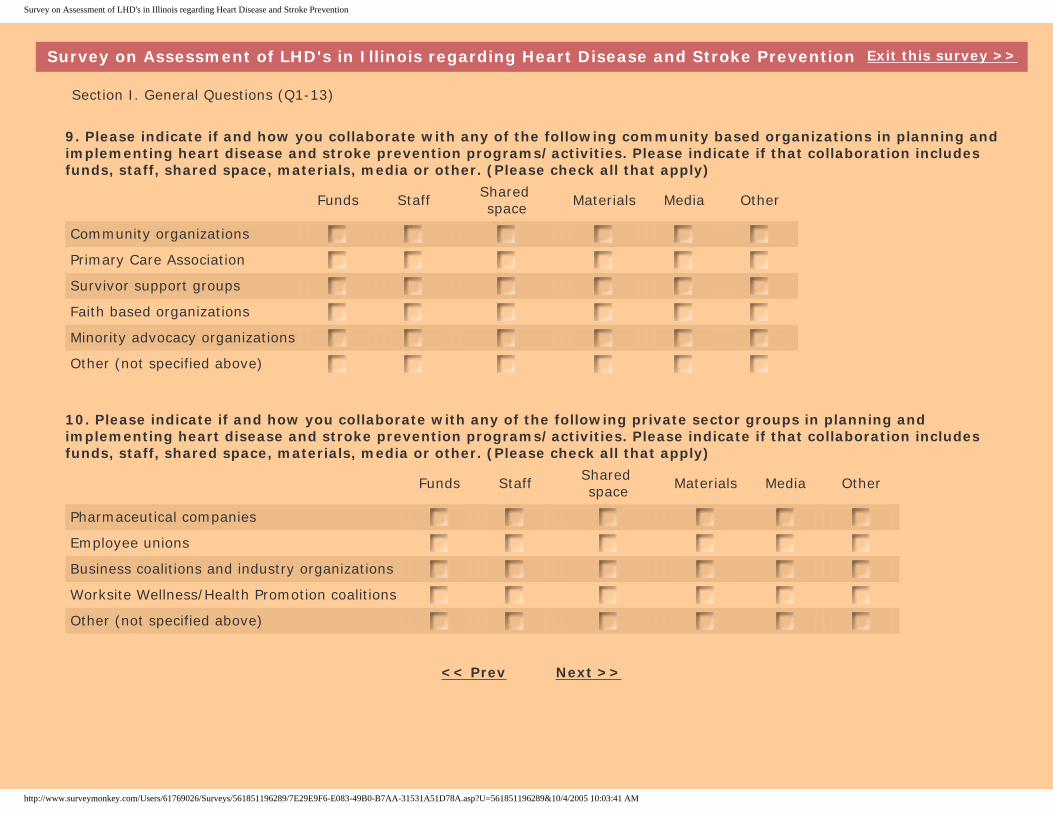
Survey on Assessment of LHD's in Illinois regarding Heart Disease and Stroke Prevention
Survey on Assessment of LHD's in Illinois regarding Heart Disease and Stroke Prevention Exit this survey >>
Section I. General Questions (Q1-13)
9. Please indicate if and how you collaborate with any of the following community based organizations in planning and implementing heart disease and stroke prevention programs/activities. Please indicate if that collaboration includes funds, staff, shared space, materials, media or other. (Please check all that apply)
Funds Staff Shared space Materials Media Other
Community organizations
Primary Care Association
Survivor support groups
Faith based organizations
Minority advocacy organizations
Other (not specified above)
10. Please indicate if and how you collaborate with any of the following private sector groups in planning and implementing heart disease and stroke prevention programs/activities. Please indicate if that collaboration includes funds, staff, shared space, materials, media or other. (Please check all that apply)
Funds Staff Shared space Materials Media Other
Pharmaceutical companies
Employee unions
Business coalitions and industry organizations
Worksite Wellness/Health Promotion coalitions
Other (not specified above)
<< Prev Next >>
http://www.surveymonkey.com/Users/61769026/Surveys/561851196289/7E29E9F6-E083-49B0-B7AA-31531A51D78A.asp?U=561851196289&10/4/2005 10:03:41 AM
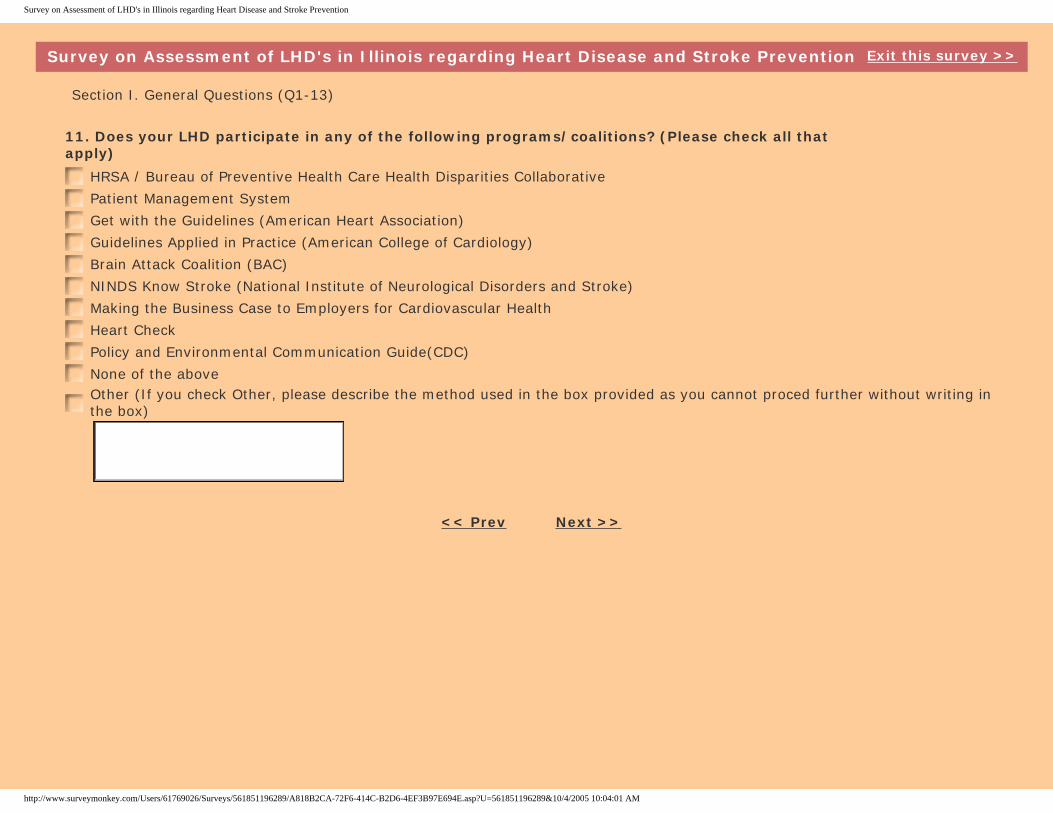
Survey on Assessment of LHD's in Illinois regarding Heart Disease and Stroke Prevention
Survey on Assessment of LHD's in Illinois regarding Heart Disease and Stroke Prevention Exit this survey >>
Section I. General Questions (Q1-13)
11. Does your LHD participate in any of the following programs/coalitions? (Please check all that apply)
HRSA / Bureau of Preventive Health Care Health Disparities Collaborative
Patient Management System
Get with the Guidelines (American Heart Association)
Guidelines Applied in Practice (American College of Cardiology)
Brain Attack Coalition (BAC)
NINDS Know Stroke (National Institute of Neurological Disorders and Stroke)
Making the Business Case to Employers for Cardiovascular Health
Heart Check
Policy and Environmental Communication Guide(CDC)
None of the aboveOther (If you check Other, please describe the method used in the box provided as you cannot proced further without writing in the box)
<< Prev Next >>
http://www.surveymonkey.com/Users/61769026/Surveys/561851196289/A818B2CA-72F6-414C-B2D6-4EF3B97E694E.asp?U=561851196289&10/4/2005 10:04:01 AM
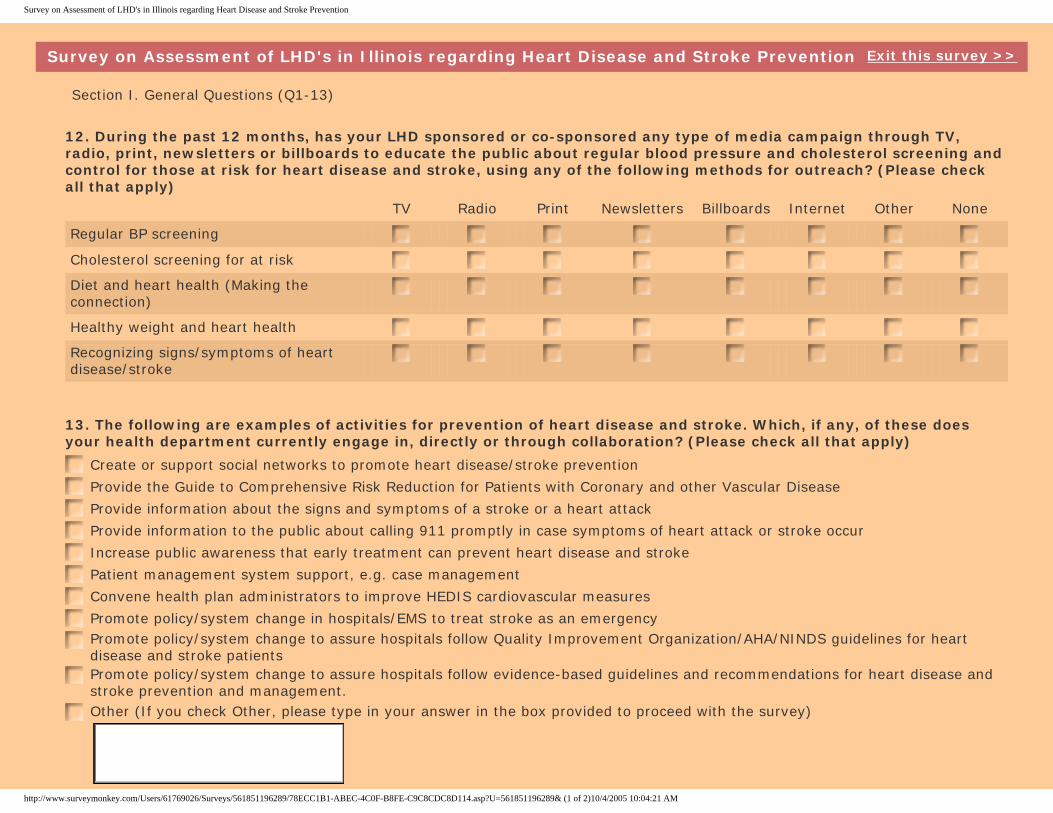
Survey on Assessment of LHD's in Illinois regarding Heart Disease and Stroke Prevention
Survey on Assessment of LHD's in Illinois regarding Heart Disease and Stroke Prevention Exit this survey >>
Section I. General Questions (Q1-13)
12. During the past 12 months, has your LHD sponsored or co-sponsored any type of media campaign through TV, radio, print, newsletters or billboards to educate the public about regular blood pressure and cholesterol screening and control for those at risk for heart disease and stroke, using any of the following methods for outreach? (Please check all that apply) TV Radio Print Newsletters Billboards Internet Other None
Regular BP screening
Cholesterol screening for at risk
Diet and heart health (Making the connection)
Healthy weight and heart health
Recognizing signs/symptoms of heart disease/stroke
13. The following are examples of activities for prevention of heart disease and stroke. Which, if any, of these does your health department currently engage in, directly or through collaboration? (Please check all that apply)
Create or support social networks to promote heart disease/stroke prevention
Provide the Guide to Comprehensive Risk Reduction for Patients with Coronary and other Vascular Disease
Provide information about the signs and symptoms of a stroke or a heart attack
Provide information to the public about calling 911 promptly in case symptoms of heart attack or stroke occur
Increase public awareness that early treatment can prevent heart disease and stroke
Patient management system support, e.g. case management
Convene health plan administrators to improve HEDIS cardiovascular measures
Promote policy/system change in hospitals/EMS to treat stroke as an emergency Promote policy/system change to assure hospitals follow Quality Improvement Organization/AHA/NINDS guidelines for heart disease and stroke patientsPromote policy/system change to assure hospitals follow evidence-based guidelines and recommendations for heart disease and stroke prevention and management. Other (If you check Other, please type in your answer in the box provided to proceed with the survey)
http://www.surveymonkey.com/Users/61769026/Surveys/561851196289/78ECC1B1-ABEC-4C0F-B8FE-C9C8CDC8D114.asp?U=561851196289& (1 of 2)10/4/2005 10:04:21 AM

Survey on Assessment of LHD's in Illinois regarding Heart Disease and Stroke Prevention
<< Prev Next >>
http://www.surveymonkey.com/Users/61769026/Surveys/561851196289/78ECC1B1-ABEC-4C0F-B8FE-C9C8CDC8D114.asp?U=561851196289& (2 of 2)10/4/2005 10:04:21 AM
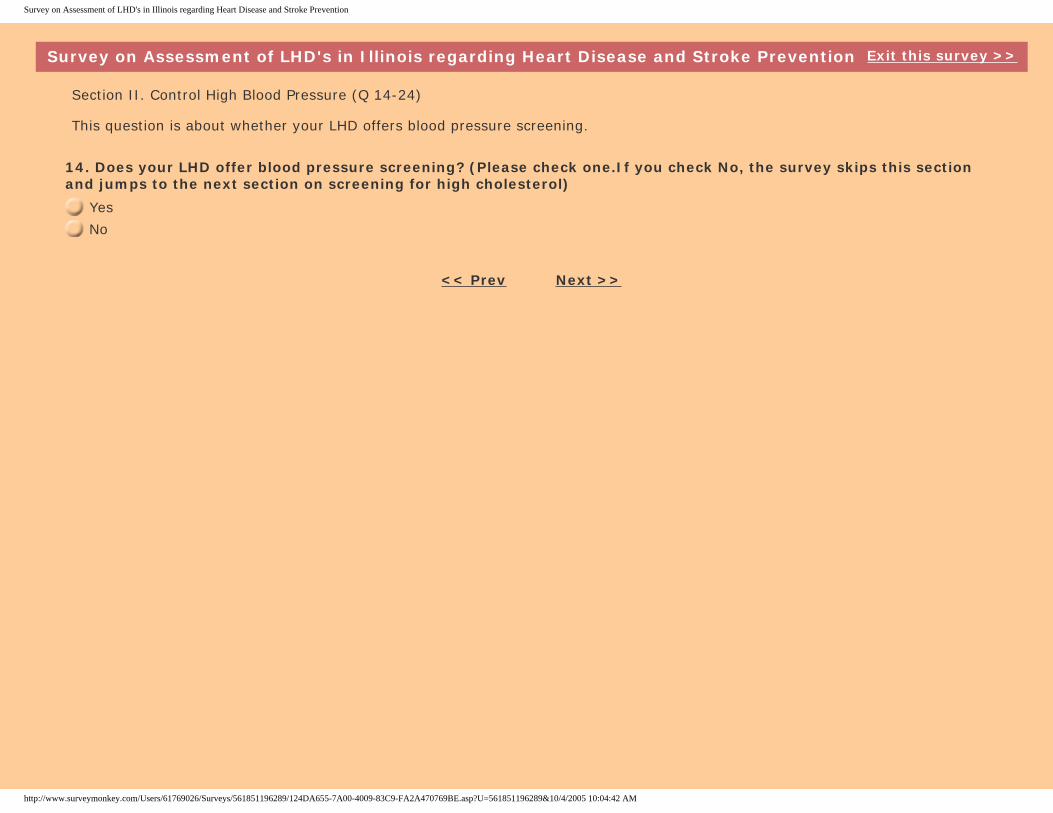
Survey on Assessment of LHD's in Illinois regarding Heart Disease and Stroke Prevention
Survey on Assessment of LHD's in Illinois regarding Heart Disease and Stroke Prevention Exit this survey >>
Section II. Control High Blood Pressure (Q 14-24)
This question is about whether your LHD offers blood pressure screening.
14. Does your LHD offer blood pressure screening? (Please check one.If you check No, the survey skips this section and jumps to the next section on screening for high cholesterol)
Yes
No
<< Prev Next >>
http://www.surveymonkey.com/Users/61769026/Surveys/561851196289/124DA655-7A00-4009-83C9-FA2A470769BE.asp?U=561851196289&10/4/2005 10:04:42 AM
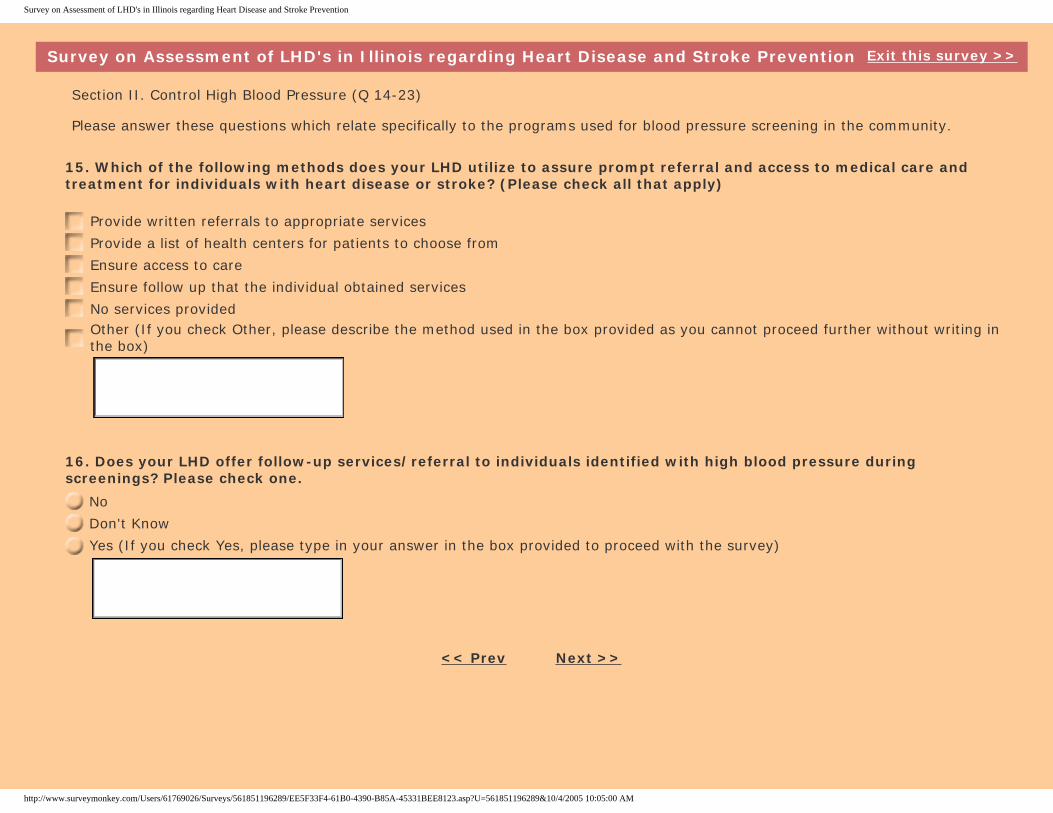
Survey on Assessment of LHD's in Illinois regarding Heart Disease and Stroke Prevention
Survey on Assessment of LHD's in Illinois regarding Heart Disease and Stroke Prevention Exit this survey >>
Section II. Control High Blood Pressure (Q 14-23)
Please answer these questions which relate specifically to the programs used for blood pressure screening in the community.
15. Which of the following methods does your LHD utilize to assure prompt referral and access to medical care and treatment for individuals with heart disease or stroke? (Please check all that apply)
Provide written referrals to appropriate services
Provide a list of health centers for patients to choose from
Ensure access to care
Ensure follow up that the individual obtained services
No services providedOther (If you check Other, please describe the method used in the box provided as you cannot proceed further without writing in the box)
16. Does your LHD offer follow-up services/referral to individuals identified with high blood pressure during screenings? Please check one.
No
Don't Know
Yes (If you check Yes, please type in your answer in the box provided to proceed with the survey)
<< Prev Next >>
http://www.surveymonkey.com/Users/61769026/Surveys/561851196289/EE5F33F4-61B0-4390-B85A-45331BEE8123.asp?U=561851196289&10/4/2005 10:05:00 AM
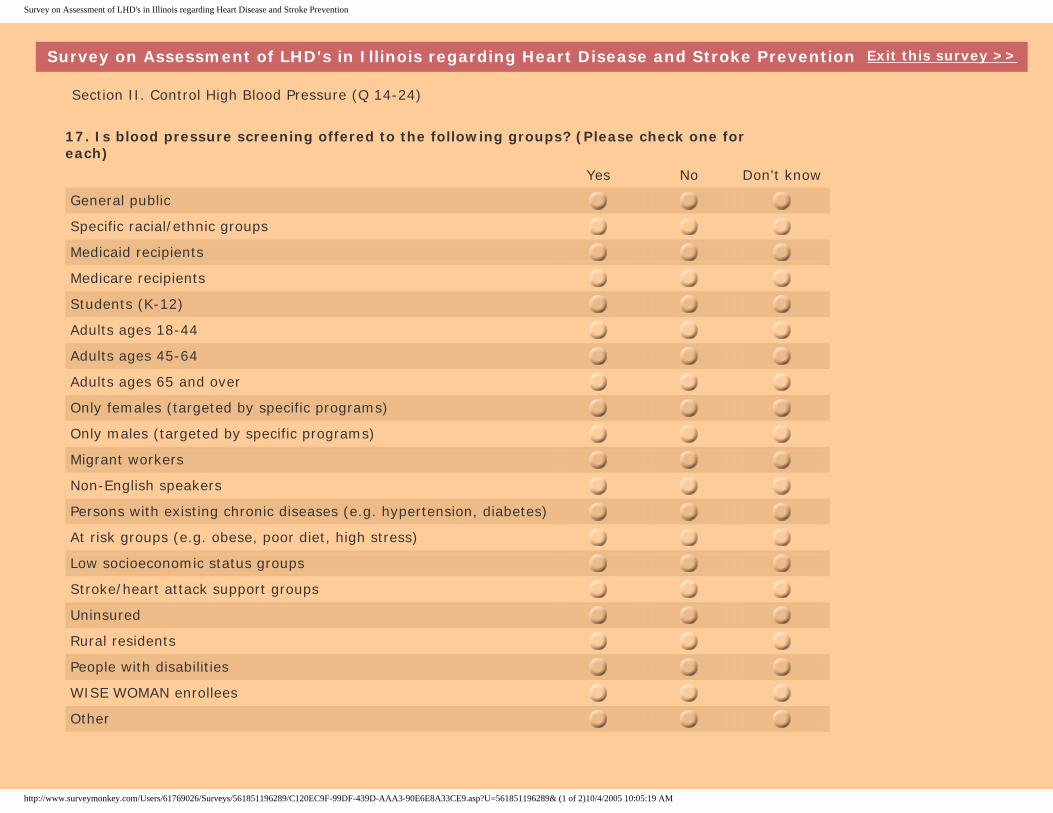
Survey on Assessment of LHD's in Illinois regarding Heart Disease and Stroke Prevention
Survey on Assessment of LHD's in Illinois regarding Heart Disease and Stroke Prevention Exit this survey >>
Section II. Control High Blood Pressure (Q 14-24)
17. Is blood pressure screening offered to the following groups? (Please check one for each) Yes No Don't know
General public
Specific racial/ethnic groups
Medicaid recipients
Medicare recipients
Students (K-12)
Adults ages 18-44
Adults ages 45-64
Adults ages 65 and over
Only females (targeted by specific programs)
Only males (targeted by specific programs)
Migrant workers
Non-English speakers
Persons with existing chronic diseases (e.g. hypertension, diabetes)
At risk groups (e.g. obese, poor diet, high stress)
Low socioeconomic status groups
Stroke/heart attack support groups
Uninsured
Rural residents
People with disabilities
WISE WOMAN enrollees
Other
http://www.surveymonkey.com/Users/61769026/Surveys/561851196289/C120EC9F-99DF-439D-AAA3-90E6E8A33CE9.asp?U=561851196289& (1 of 2)10/4/2005 10:05:19 AM
Survey on Assessment of LHD's in Illinois regarding Heart Disease and Stroke Prevention
<< Prev Next >>
http://www.surveymonkey.com/Users/61769026/Surveys/561851196289/C120EC9F-99DF-439D-AAA3-90E6E8A33CE9.asp?U=561851196289& (2 of 2)10/4/2005 10:05:19 AM
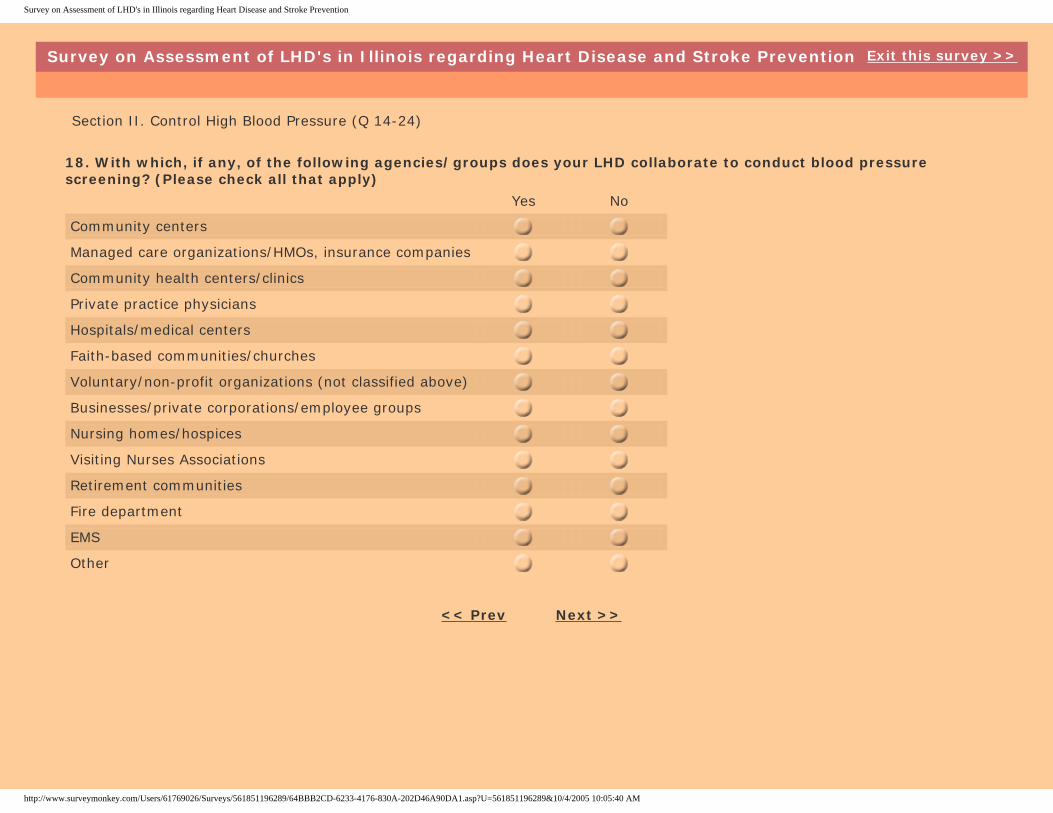
Survey on Assessment of LHD's in Illinois regarding Heart Disease and Stroke Prevention
Survey on Assessment of LHD's in Illinois regarding Heart Disease and Stroke Prevention Exit this survey >>
Section II. Control High Blood Pressure (Q 14-24)
18. With which, if any, of the following agencies/groups does your LHD collaborate to conduct blood pressure screening? (Please check all that apply) Yes No
Community centers
Managed care organizations/HMOs, insurance companies
Community health centers/clinics
Private practice physicians
Hospitals/medical centers
Faith-based communities/churches
Voluntary/non-profit organizations (not classified above)
Businesses/private corporations/employee groups
Nursing homes/hospices
Visiting Nurses Associations
Retirement communities
Fire department
EMS
Other
<< Prev Next >>
http://www.surveymonkey.com/Users/61769026/Surveys/561851196289/64BBB2CD-6233-4176-830A-202D46A90DA1.asp?U=561851196289&10/4/2005 10:05:40 AM
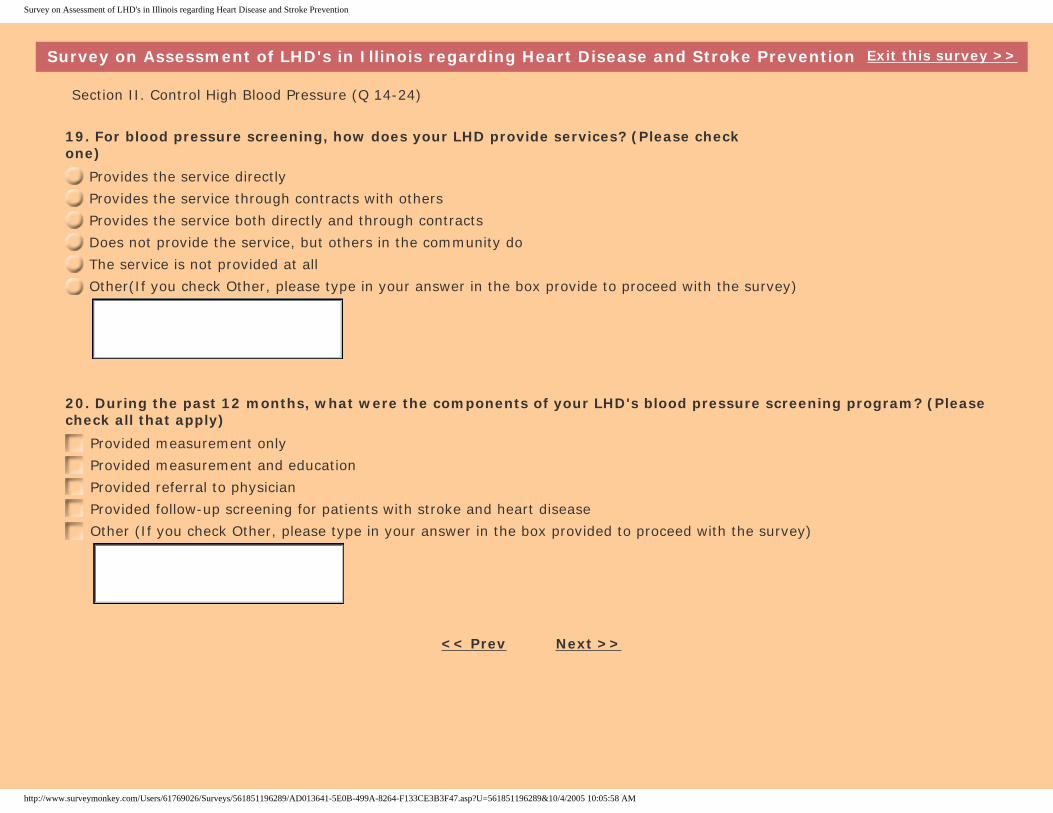
Survey on Assessment of LHD's in Illinois regarding Heart Disease and Stroke Prevention
Survey on Assessment of LHD's in Illinois regarding Heart Disease and Stroke Prevention Exit this survey >>
Section II. Control High Blood Pressure (Q 14-24)
19. For blood pressure screening, how does your LHD provide services? (Please check one)
Provides the service directly
Provides the service through contracts with others
Provides the service both directly and through contracts
Does not provide the service, but others in the community do
The service is not provided at all
Other(If you check Other, please type in your answer in the box provide to proceed with the survey)
20. During the past 12 months, what were the components of your LHD's blood pressure screening program? (Please check all that apply)
Provided measurement only
Provided measurement and education
Provided referral to physician
Provided follow-up screening for patients with stroke and heart disease
Other (If you check Other, please type in your answer in the box provided to proceed with the survey)
<< Prev Next >>
http://www.surveymonkey.com/Users/61769026/Surveys/561851196289/AD013641-5E0B-499A-8264-F133CE3B3F47.asp?U=561851196289&10/4/2005 10:05:58 AM
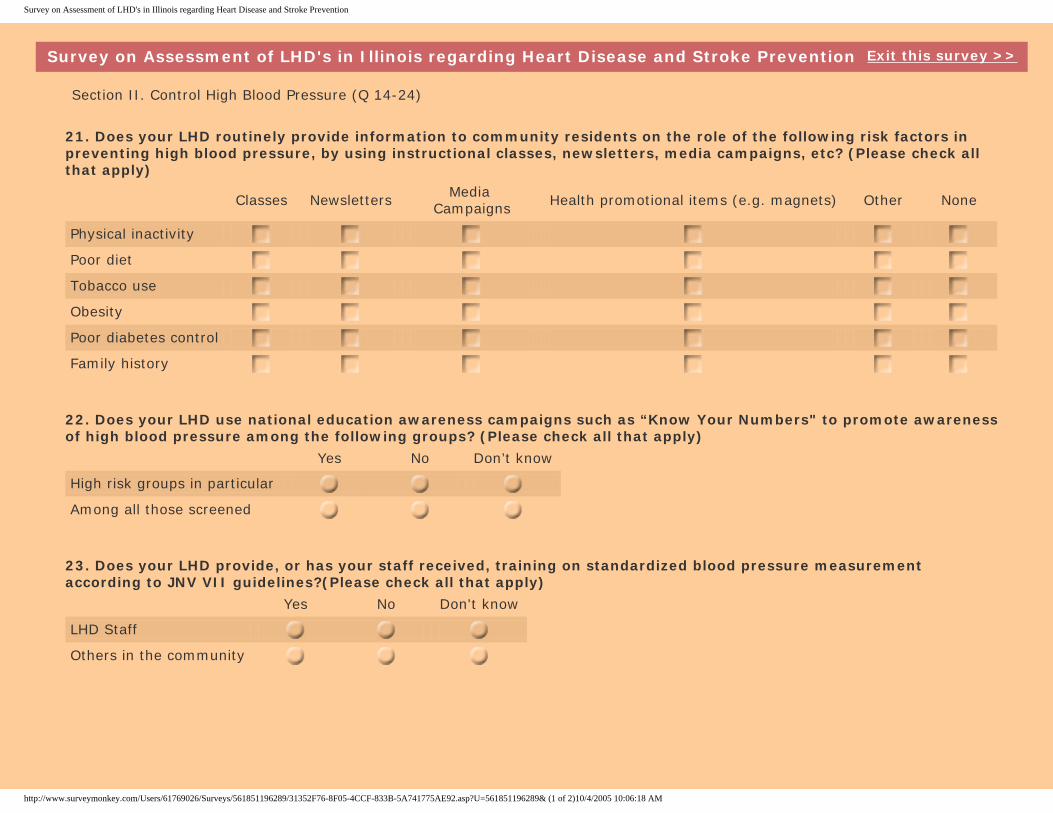
Survey on Assessment of LHD's in Illinois regarding Heart Disease and Stroke Prevention
Survey on Assessment of LHD's in Illinois regarding Heart Disease and Stroke Prevention Exit this survey >>
Section II. Control High Blood Pressure (Q 14-24)
21. Does your LHD routinely provide information to community residents on the role of the following risk factors in preventing high blood pressure, by using instructional classes, newsletters, media campaigns, etc? (Please check all that apply)
Classes Newsletters Media Campaigns Health promotional items (e.g. magnets) Other None
Physical inactivity
Poor diet
Tobacco use
Obesity
Poor diabetes control
Family history
22. Does your LHD use national education awareness campaigns such as “Know Your Numbers" to promote awareness of high blood pressure among the following groups? (Please check all that apply) Yes No Don’t know
High risk groups in particular
Among all those screened
23. Does your LHD provide, or has your staff received, training on standardized blood pressure measurement according to JNV VII guidelines?(Please check all that apply) Yes No Don't know
LHD Staff
Others in the community
http://www.surveymonkey.com/Users/61769026/Surveys/561851196289/31352F76-8F05-4CCF-833B-5A741775AE92.asp?U=561851196289& (1 of 2)10/4/2005 10:06:18 AM
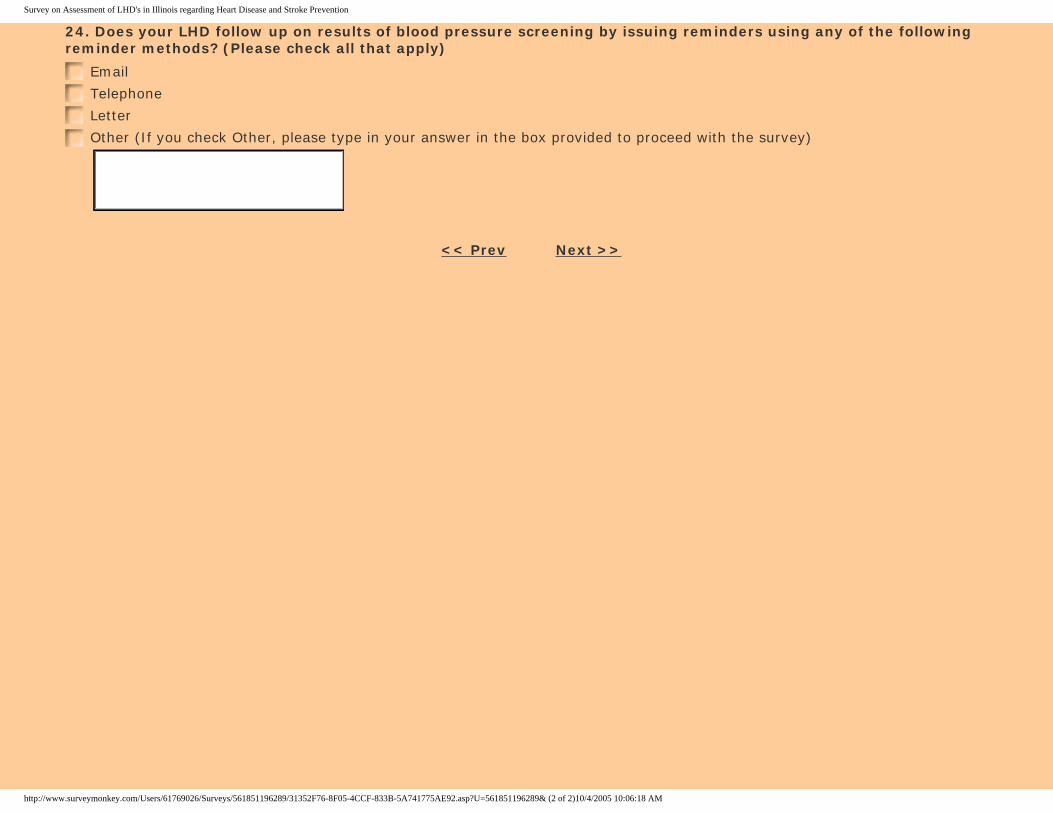
Survey on Assessment of LHD's in Illinois regarding Heart Disease and Stroke Prevention
24. Does your LHD follow up on results of blood pressure screening by issuing reminders using any of the following reminder methods? (Please check all that apply)
Telephone
Letter
Other (If you check Other, please type in your answer in the box provided to proceed with the survey)
<< Prev Next >>
http://www.surveymonkey.com/Users/61769026/Surveys/561851196289/31352F76-8F05-4CCF-833B-5A741775AE92.asp?U=561851196289& (2 of 2)10/4/2005 10:06:18 AM

Survey on Assessment of LHD's in Illinois regarding Heart Disease and Stroke Prevention
Survey on Assessment of LHD's in Illinois regarding Heart Disease and Stroke Prevention Exit this survey >>
Section III. Control High Cholesterol (Q 25-34)
The following question concerns the provision of cholesterol screening by your LHD.
25. Did your LHD provide cholesterol screening during the previous 12 months? (If you check No, the survey skips questions related to this topic and jumps to the next section on ' Know signs and symptoms of stroke' )
Yes
No
<< Prev Next >>
http://www.surveymonkey.com/Users/61769026/Surveys/561851196289/43471C88-05D4-4544-B0F0-8C052E3B019D.asp?U=561851196289&10/4/2005 10:06:48 AM
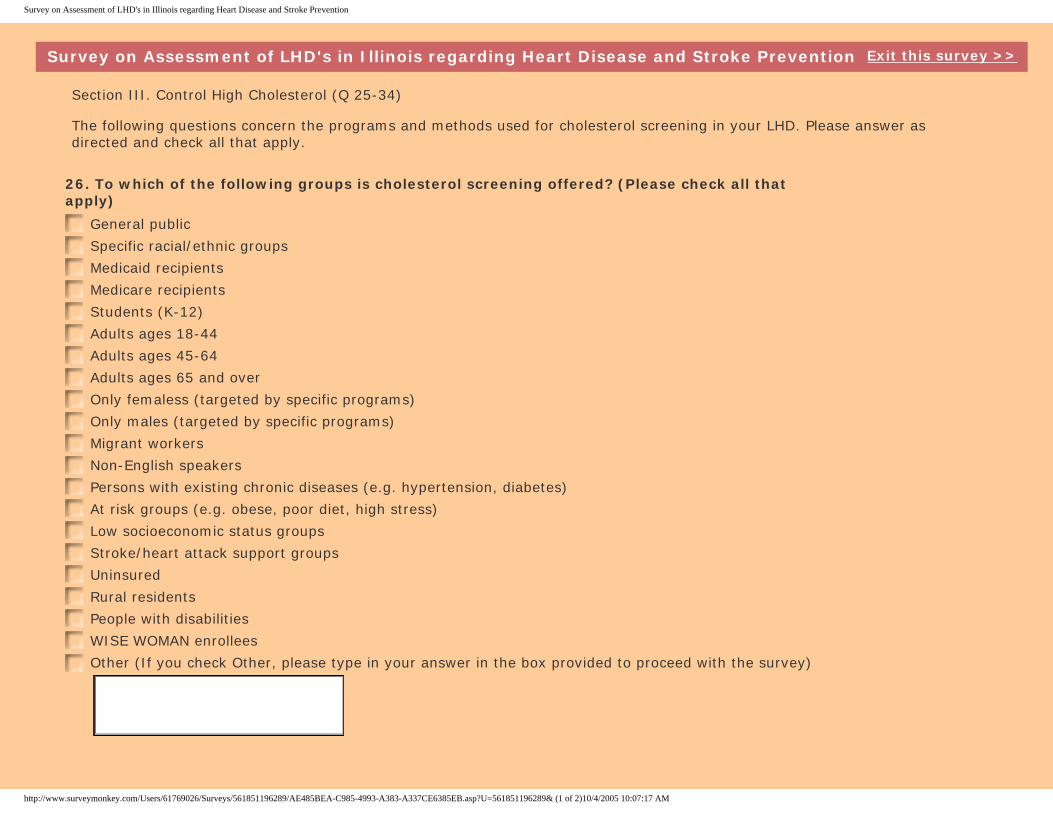
Survey on Assessment of LHD's in Illinois regarding Heart Disease and Stroke Prevention
Survey on Assessment of LHD's in Illinois regarding Heart Disease and Stroke Prevention Exit this survey >>
Section III. Control High Cholesterol (Q 25-34)
The following questions concern the programs and methods used for cholesterol screening in your LHD. Please answer as directed and check all that apply.
26. To which of the following groups is cholesterol screening offered? (Please check all that apply)
General public
Specific racial/ethnic groups
Medicaid recipients
Medicare recipients
Students (K-12)
Adults ages 18-44
Adults ages 45-64
Adults ages 65 and over
Only femaless (targeted by specific programs)
Only males (targeted by specific programs)
Migrant workers
Non-English speakers
Persons with existing chronic diseases (e.g. hypertension, diabetes)
At risk groups (e.g. obese, poor diet, high stress)
Low socioeconomic status groups
Stroke/heart attack support groups
Uninsured
Rural residents
People with disabilities
WISE WOMAN enrollees
Other (If you check Other, please type in your answer in the box provided to proceed with the survey)
http://www.surveymonkey.com/Users/61769026/Surveys/561851196289/AE485BEA-C985-4993-A383-A337CE6385EB.asp?U=561851196289& (1 of 2)10/4/2005 10:07:17 AM

Survey on Assessment of LHD's in Illinois regarding Heart Disease and Stroke Prevention
<< Prev Next >>
http://www.surveymonkey.com/Users/61769026/Surveys/561851196289/AE485BEA-C985-4993-A383-A337CE6385EB.asp?U=561851196289& (2 of 2)10/4/2005 10:07:17 AM
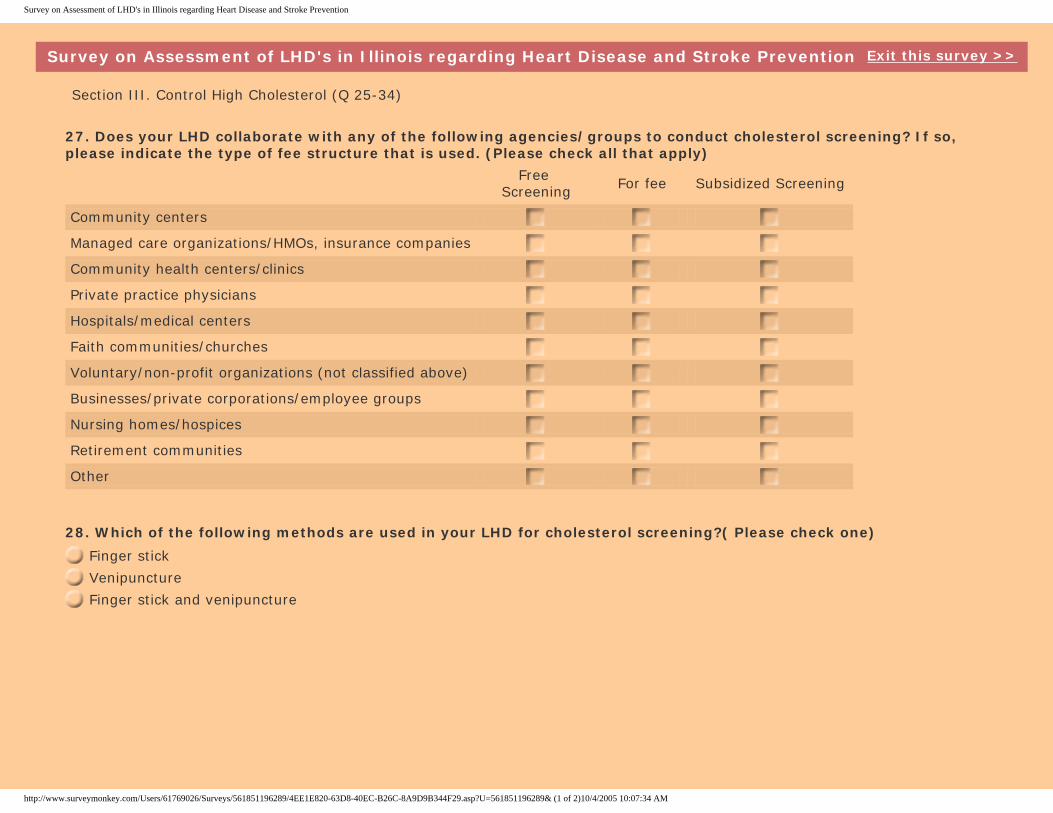
Survey on Assessment of LHD's in Illinois regarding Heart Disease and Stroke Prevention
Survey on Assessment of LHD's in Illinois regarding Heart Disease and Stroke Prevention Exit this survey >>
Section III. Control High Cholesterol (Q 25-34)
27. Does your LHD collaborate with any of the following agencies/groups to conduct cholesterol screening? If so, please indicate the type of fee structure that is used. (Please check all that apply)
Free Screening For fee Subsidized Screening
Community centers
Managed care organizations/HMOs, insurance companies
Community health centers/clinics
Private practice physicians
Hospitals/medical centers
Faith communities/churches
Voluntary/non-profit organizations (not classified above)
Businesses/private corporations/employee groups
Nursing homes/hospices
Retirement communities
Other
28. Which of the following methods are used in your LHD for cholesterol screening?( Please check one)
Finger stick
Venipuncture
Finger stick and venipuncture
http://www.surveymonkey.com/Users/61769026/Surveys/561851196289/4EE1E820-63D8-40EC-B26C-8A9D9B344F29.asp?U=561851196289& (1 of 2)10/4/2005 10:07:34 AM
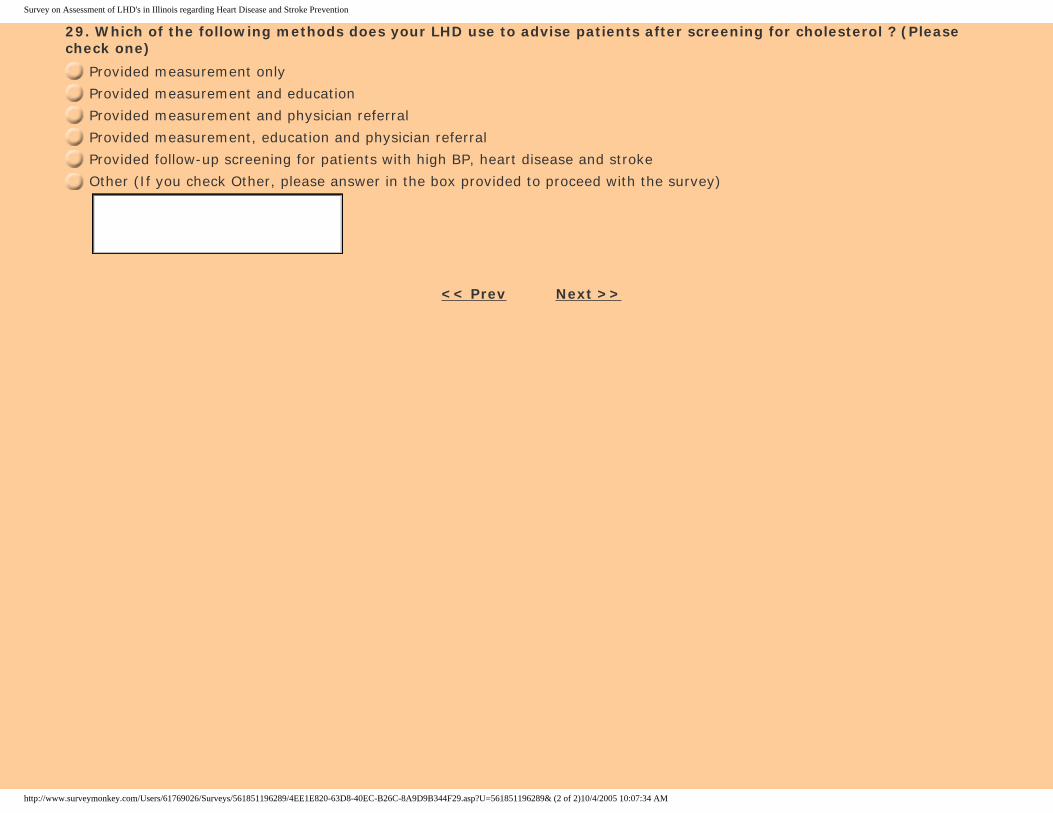
Survey on Assessment of LHD's in Illinois regarding Heart Disease and Stroke Prevention
29. Which of the following methods does your LHD use to advise patients after screening for cholesterol ? (Please check one)
Provided measurement only
Provided measurement and education
Provided measurement and physician referral
Provided measurement, education and physician referral
Provided follow-up screening for patients with high BP, heart disease and stroke
Other (If you check Other, please answer in the box provided to proceed with the survey)
<< Prev Next >>
http://www.surveymonkey.com/Users/61769026/Surveys/561851196289/4EE1E820-63D8-40EC-B26C-8A9D9B344F29.asp?U=561851196289& (2 of 2)10/4/2005 10:07:34 AM
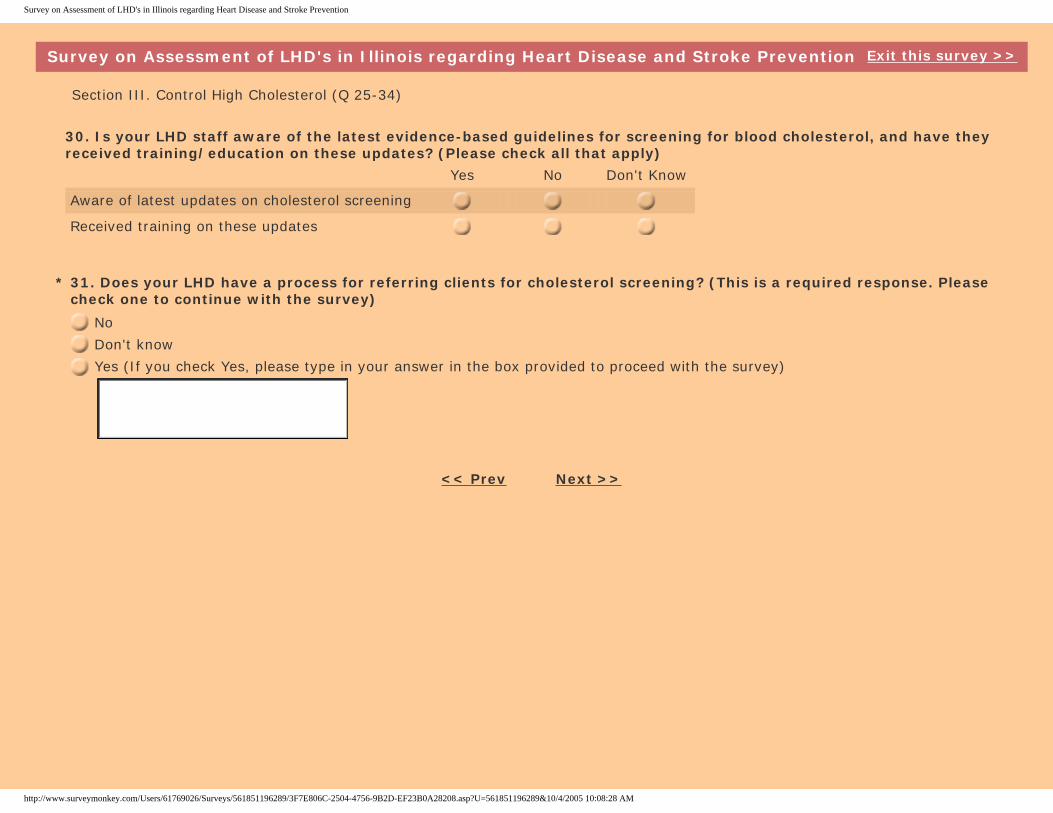
Survey on Assessment of LHD's in Illinois regarding Heart Disease and Stroke Prevention
Survey on Assessment of LHD's in Illinois regarding Heart Disease and Stroke Prevention Exit this survey >>
Section III. Control High Cholesterol (Q 25-34)
30. Is your LHD staff aware of the latest evidence-based guidelines for screening for blood cholesterol, and have they received training/education on these updates? (Please check all that apply) Yes No Don't Know
Aware of latest updates on cholesterol screening
Received training on these updates
* 31. Does your LHD have a process for referring clients for cholesterol screening? (This is a required response. Please check one to continue with the survey)
No
Don't know
Yes (If you check Yes, please type in your answer in the box provided to proceed with the survey)
<< Prev Next >>
http://www.surveymonkey.com/Users/61769026/Surveys/561851196289/3F7E806C-2504-4756-9B2D-EF23B0A28208.asp?U=561851196289&10/4/2005 10:08:28 AM
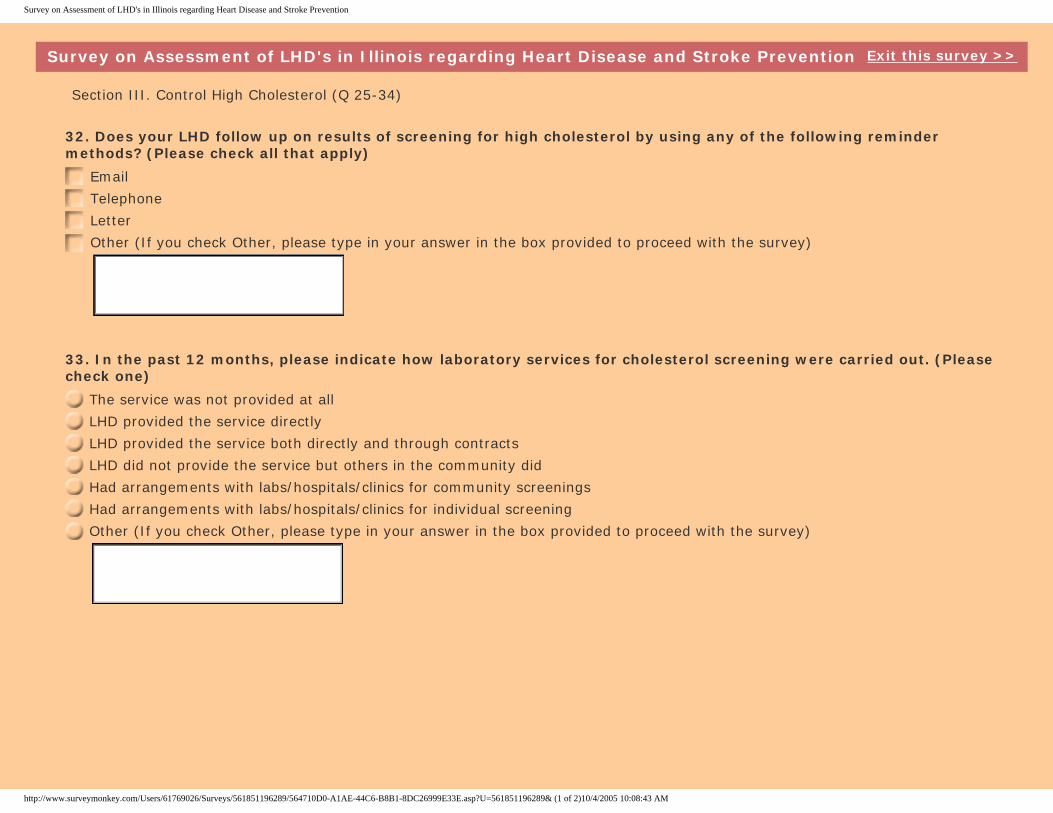
Survey on Assessment of LHD's in Illinois regarding Heart Disease and Stroke Prevention
Survey on Assessment of LHD's in Illinois regarding Heart Disease and Stroke Prevention Exit this survey >>
Section III. Control High Cholesterol (Q 25-34)
32. Does your LHD follow up on results of screening for high cholesterol by using any of the following reminder methods? (Please check all that apply)
Telephone
Letter
Other (If you check Other, please type in your answer in the box provided to proceed with the survey)
33. In the past 12 months, please indicate how laboratory services for cholesterol screening were carried out. (Please check one)
The service was not provided at all
LHD provided the service directly
LHD provided the service both directly and through contracts
LHD did not provide the service but others in the community did
Had arrangements with labs/hospitals/clinics for community screenings
Had arrangements with labs/hospitals/clinics for individual screening
Other (If you check Other, please type in your answer in the box provided to proceed with the survey)
http://www.surveymonkey.com/Users/61769026/Surveys/561851196289/564710D0-A1AE-44C6-B8B1-8DC26999E33E.asp?U=561851196289& (1 of 2)10/4/2005 10:08:43 AM
Survey on Assessment of LHD's in Illinois regarding Heart Disease and Stroke Prevention
34. Does your LHD use an individual card system, electronic medical record or other clinical information system for patient record keeping? (Please check one)
No
Don't know
Yes (If you check Yes, please type in your answer in the box provided to proceed with the survey)
<< Prev Next >>
http://www.surveymonkey.com/Users/61769026/Surveys/561851196289/564710D0-A1AE-44C6-B8B1-8DC26999E33E.asp?U=561851196289& (2 of 2)10/4/2005 10:08:43 AM
Survey on Assessment of LHD's in Illinois regarding Heart Disease and Stroke Prevention
Survey on Assessment of LHD's in Illinois regarding Heart Disease and Stroke Prevention Exit this survey >>
Section IV. Know Signs and Symptoms of Stroke (Q35-38)
Please answer questions in this section about the educational programs conducted in your LHD to increase awareness about the signs and symptoms of heart attack and stroke in the general public.
35. Does your LHD possess any of the following tools and resources to educate the public about the signs and symptoms of heart disease and stroke? (Please check all that apply)
Newsletters/brochures
Posters
Handouts
Video films
Audio systems
Health promotional items(e.g.magnets,etc)
Other (If you check Other, please type in your answer in the box provided to proceed with the survey)
<< Prev Next >>
http://www.surveymonkey.com/Users/61769026/Surveys/561851196289/F976A796-D775-4863-AB30-B3C047307A57.asp?U=561851196289&10/4/2005 10:09:01 AM
Survey on Assessment of LHD's in Illinois regarding Heart Disease and Stroke Prevention
Survey on Assessment of LHD's in Illinois regarding Heart Disease and Stroke Prevention Exit this survey >>
Section IV. Know Signs and Symptoms of Stroke (Q35-38)
36. To which of the following members of the public does your LHD provide information on the warning signs and symptoms of heart attack and stroke? (Please check all that apply)
General public
Specific racial/ethnic groups
Medicaid recipients
Medicare recipients
Students (K-12)
Adults ages 18-44
Adults ages 45-64
Adults ages 65 and over
Only females (targeted by specific programs)
Only males (targeted by specific programs)
Migrant workers
Non-English speakers
Persons with existing chronic diseases (e.g. hypertension, diabetes)
At risk groups (e.g. obese, poor diet, high stress)
Low socioeconomic status groups
Stroke/heart attack support groups
Uninsured
Rural residents
People with disabilities
WISE WOMAN enrollees
Other (please describe e.g.only those in specific programs, to continue with the survey)
<< Prev Next >>
http://www.surveymonkey.com/Users/61769026/Surveys/561851196289/44BF6CA6-8B49-4F07-A0C0-64C2DF3EA648.asp?U=561851196289&10/4/2005 10:13:38 AM
Survey on Assessment of LHD's in Illinois regarding Heart Disease and Stroke Prevention
Survey on Assessment of LHD's in Illinois regarding Heart Disease and Stroke Prevention Exit this survey >>
Section IV. Know Signs and Symptoms of Stroke (Q35-38)
37. Where does your LHD staff provide information about the signs and symptoms of stroke and heart attack? (Please check all that apply)
During health education classes
During screening
During Outreach activities
In the waiting rooms
In a mailing
Via a website
Through health promotional items (e.g. magnets, etc)
Other (If you check Other, please type in your answer in the box provided to proceed with the survey)
38. How frequently are educational activities about heart disease and stroke prevention held in your LHD and/or community jurisdiction? (Please check all that apply) LHD Community
Weekly
Monthly
Quarterly
Annually
When requested by community members
Don’t Know
Not at all
<< Prev Next >>
http://www.surveymonkey.com/Users/61769026/Surveys/561851196289/69EC5E42-CE1A-4120-9C0E-6F11067DC633.asp?U=561851196289&10/4/2005 10:13:58 AM
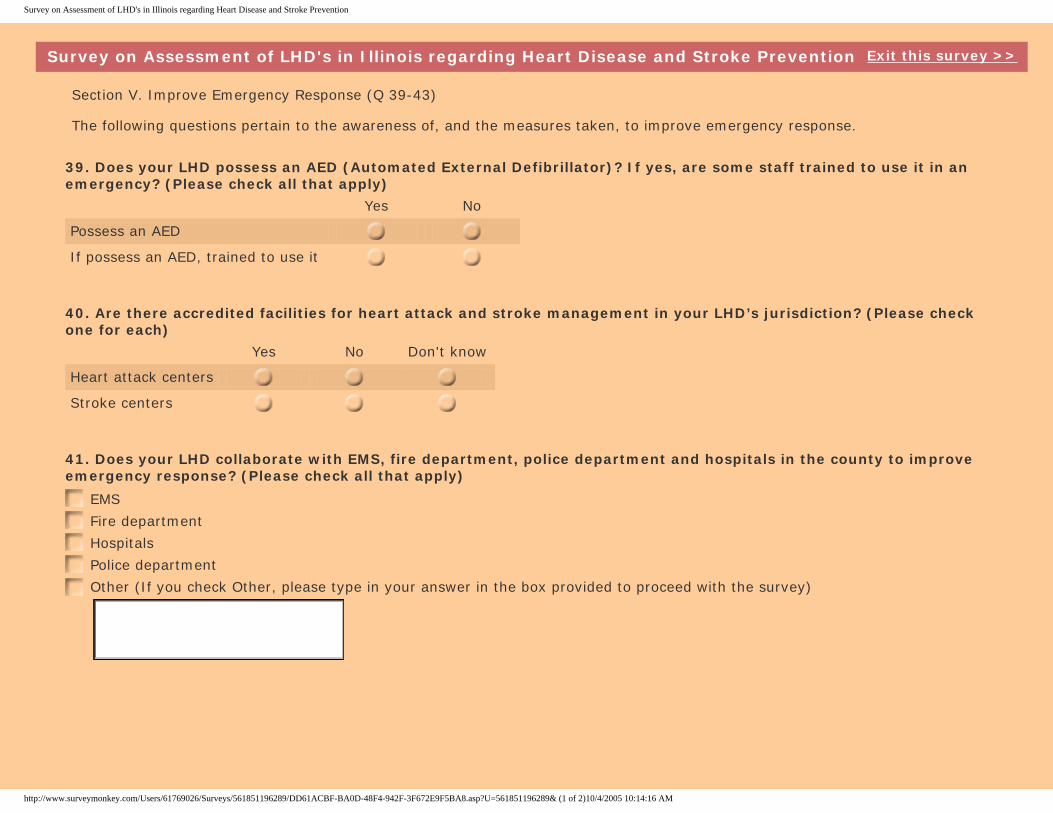
Survey on Assessment of LHD's in Illinois regarding Heart Disease and Stroke Prevention
Survey on Assessment of LHD's in Illinois regarding Heart Disease and Stroke Prevention Exit this survey >>
Section V. Improve Emergency Response (Q 39-43)
The following questions pertain to the awareness of, and the measures taken, to improve emergency response.
39. Does your LHD possess an AED (Automated External Defibrillator)? If yes, are some staff trained to use it in an emergency? (Please check all that apply) Yes No
Possess an AED
If possess an AED, trained to use it
40. Are there accredited facilities for heart attack and stroke management in your LHD’s jurisdiction? (Please check one for each) Yes No Don't know
Heart attack centers
Stroke centers
41. Does your LHD collaborate with EMS, fire department, police department and hospitals in the county to improve emergency response? (Please check all that apply)
EMS
Fire department
Hospitals
Police department
Other (If you check Other, please type in your answer in the box provided to proceed with the survey)
http://www.surveymonkey.com/Users/61769026/Surveys/561851196289/DD61ACBF-BA0D-48F4-942F-3F672E9F5BA8.asp?U=561851196289& (1 of 2)10/4/2005 10:14:16 AM
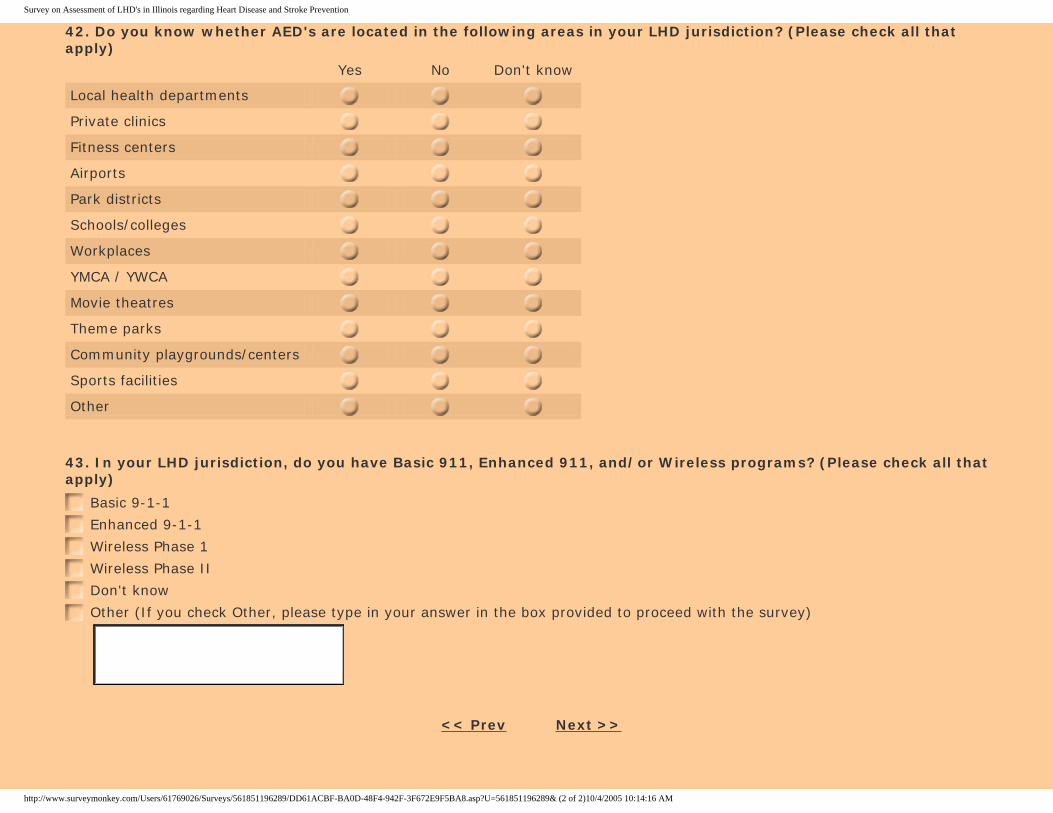
Survey on Assessment of LHD's in Illinois regarding Heart Disease and Stroke Prevention
42. Do you know whether AED's are located in the following areas in your LHD jurisdiction? (Please check all that apply) Yes No Don't know
Local health departments
Private clinics
Fitness centers
Airports
Park districts
Schools/colleges
Workplaces
YMCA / YWCA
Movie theatres
Theme parks
Community playgrounds/centers
Sports facilities
Other
43. In your LHD jurisdiction, do you have Basic 911, Enhanced 911, and/or Wireless programs? (Please check all that apply)
Basic 9-1-1
Enhanced 9-1-1
Wireless Phase 1
Wireless Phase II
Don't know
Other (If you check Other, please type in your answer in the box provided to proceed with the survey)
<< Prev Next >>
http://www.surveymonkey.com/Users/61769026/Surveys/561851196289/DD61ACBF-BA0D-48F4-942F-3F672E9F5BA8.asp?U=561851196289& (2 of 2)10/4/2005 10:14:16 AM
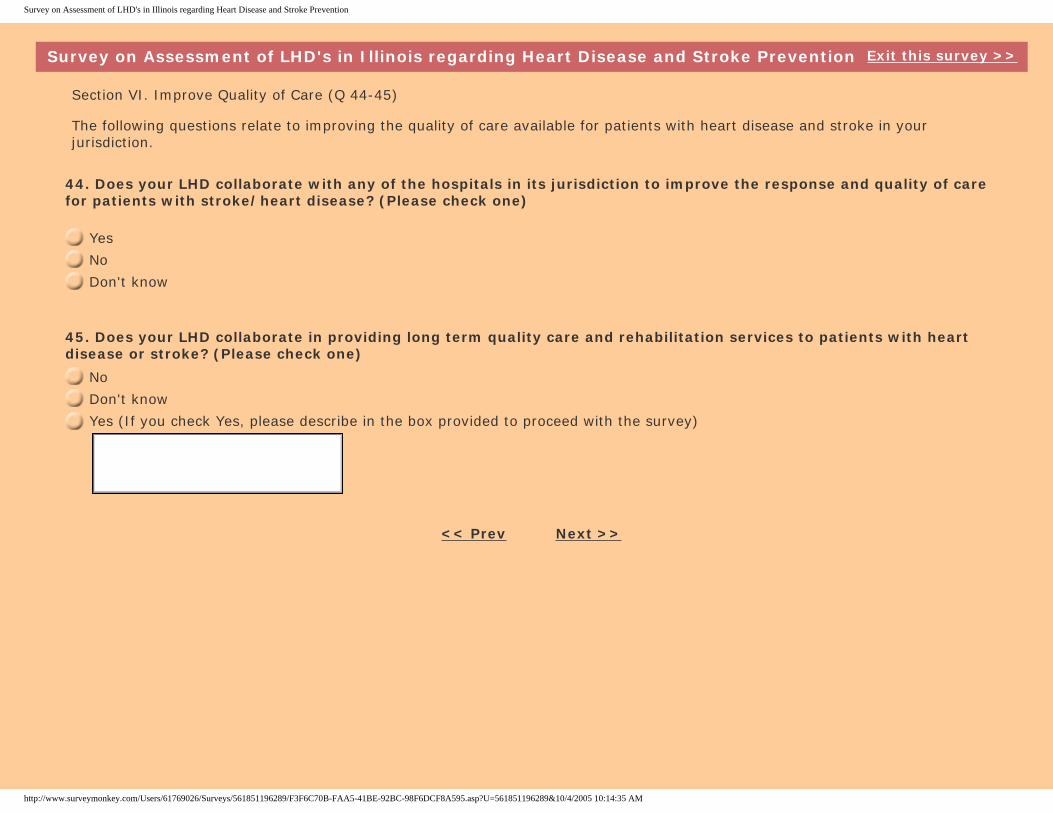
Survey on Assessment of LHD's in Illinois regarding Heart Disease and Stroke Prevention
Survey on Assessment of LHD's in Illinois regarding Heart Disease and Stroke Prevention Exit this survey >>
Section VI. Improve Quality of Care (Q 44-45)
The following questions relate to improving the quality of care available for patients with heart disease and stroke in your jurisdiction.
44. Does your LHD collaborate with any of the hospitals in its jurisdiction to improve the response and quality of care for patients with stroke/heart disease? (Please check one)
Yes
No
Don't know
45. Does your LHD collaborate in providing long term quality care and rehabilitation services to patients with heart disease or stroke? (Please check one)
No
Don't know
Yes (If you check Yes, please describe in the box provided to proceed with the survey)
<< Prev Next >>
http://www.surveymonkey.com/Users/61769026/Surveys/561851196289/F3F6C70B-FAA5-41BE-92BC-98F6DCF8A595.asp?U=561851196289&10/4/2005 10:14:35 AM
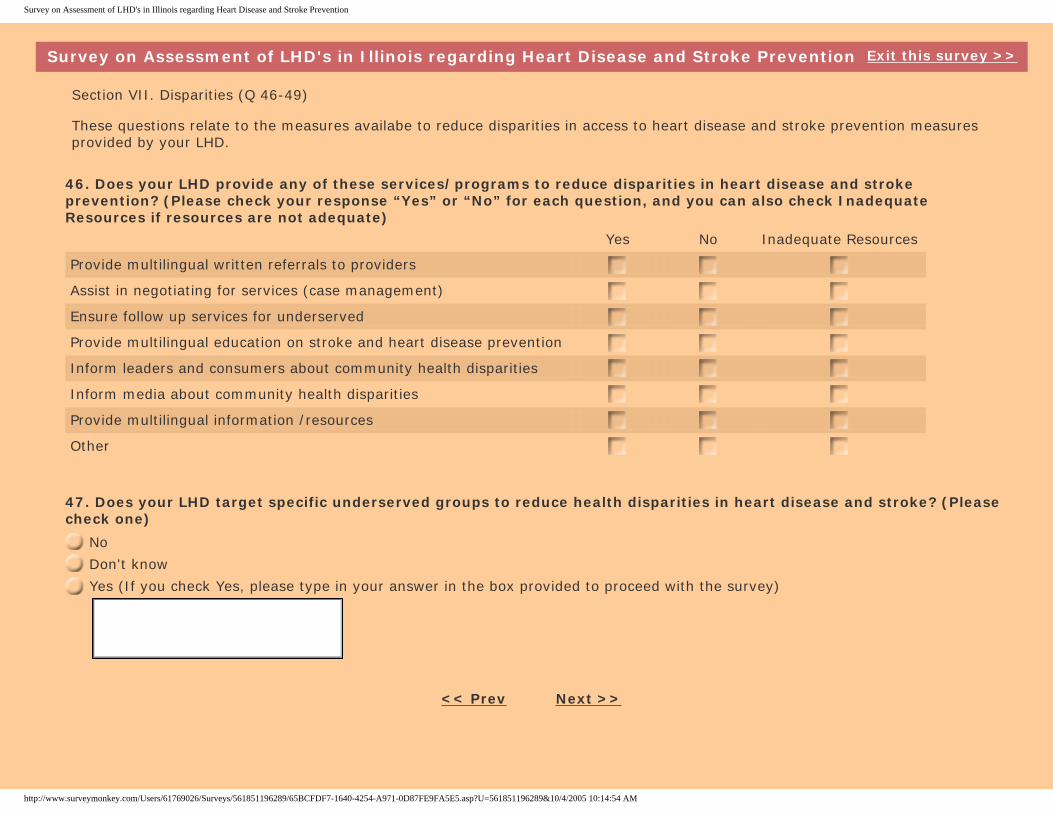
Survey on Assessment of LHD's in Illinois regarding Heart Disease and Stroke Prevention
Survey on Assessment of LHD's in Illinois regarding Heart Disease and Stroke Prevention Exit this survey >>
Section VII. Disparities (Q 46-49)
These questions relate to the measures availabe to reduce disparities in access to heart disease and stroke prevention measures provided by your LHD.
46. Does your LHD provide any of these services/programs to reduce disparities in heart disease and stroke prevention? (Please check your response “Yes” or “No” for each question, and you can also check Inadequate Resources if resources are not adequate) Yes No Inadequate Resources
Provide multilingual written referrals to providers
Assist in negotiating for services (case management)
Ensure follow up services for underserved
Provide multilingual education on stroke and heart disease prevention
Inform leaders and consumers about community health disparities
Inform media about community health disparities
Provide multilingual information /resources
Other
47. Does your LHD target specific underserved groups to reduce health disparities in heart disease and stroke? (Please check one)
No
Don't know
Yes (If you check Yes, please type in your answer in the box provided to proceed with the survey)
<< Prev Next >>
http://www.surveymonkey.com/Users/61769026/Surveys/561851196289/65BCFDF7-1640-4254-A971-0D87FE9FA5E5.asp?U=561851196289&10/4/2005 10:14:54 AM
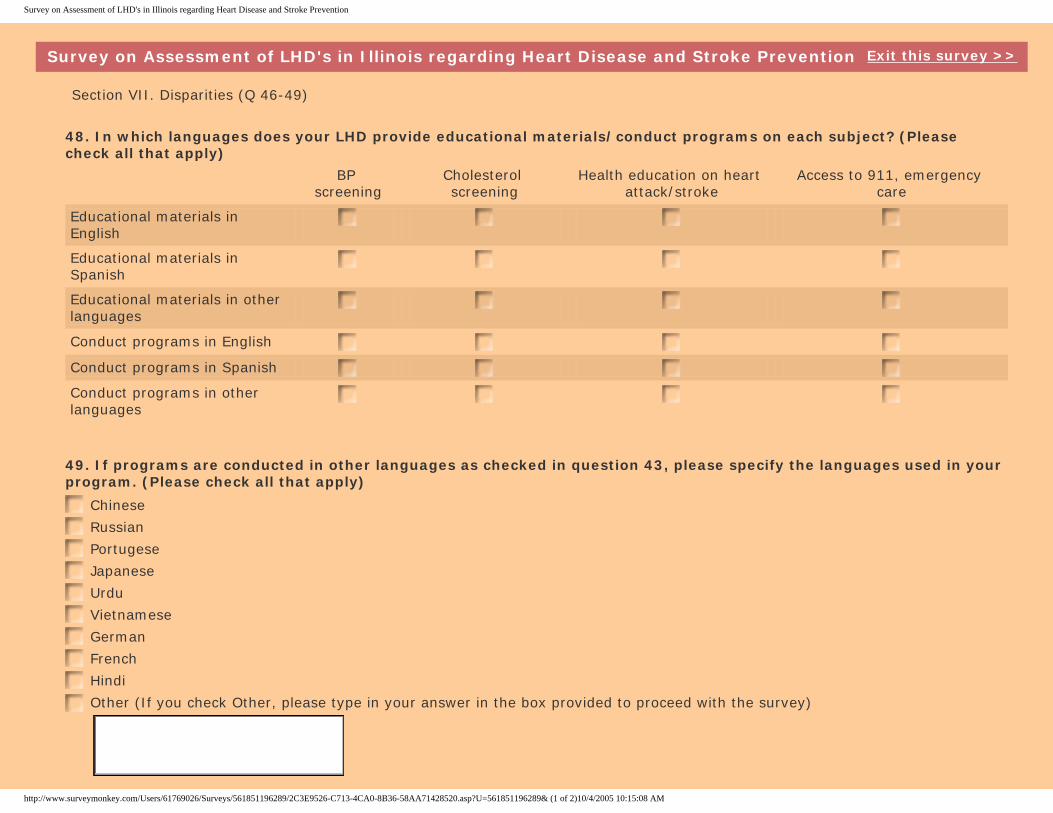
Survey on Assessment of LHD's in Illinois regarding Heart Disease and Stroke Prevention
Survey on Assessment of LHD's in Illinois regarding Heart Disease and Stroke Prevention Exit this survey >>
Section VII. Disparities (Q 46-49)
48. In which languages does your LHD provide educational materials/conduct programs on each subject? (Please check all that apply)
BP screening
Cholesterol screening
Health education on heart attack/stroke
Access to 911, emergency care
Educational materials in English
Educational materials in Spanish
Educational materials in other languages
Conduct programs in English
Conduct programs in Spanish
Conduct programs in other languages
49. If programs are conducted in other languages as checked in question 43, please specify the languages used in your program. (Please check all that apply)
Chinese
Russian
Portugese
Japanese
Urdu
Vietnamese
German
French
Hindi
Other (If you check Other, please type in your answer in the box provided to proceed with the survey)
http://www.surveymonkey.com/Users/61769026/Surveys/561851196289/2C3E9526-C713-4CA0-8B36-58AA71428520.asp?U=561851196289& (1 of 2)10/4/2005 10:15:08 AM

Survey on Assessment of LHD's in Illinois regarding Heart Disease and Stroke Prevention
<< Prev Next >>
http://www.surveymonkey.com/Users/61769026/Surveys/561851196289/2C3E9526-C713-4CA0-8B36-58AA71428520.asp?U=561851196289& (2 of 2)10/4/2005 10:15:08 AM
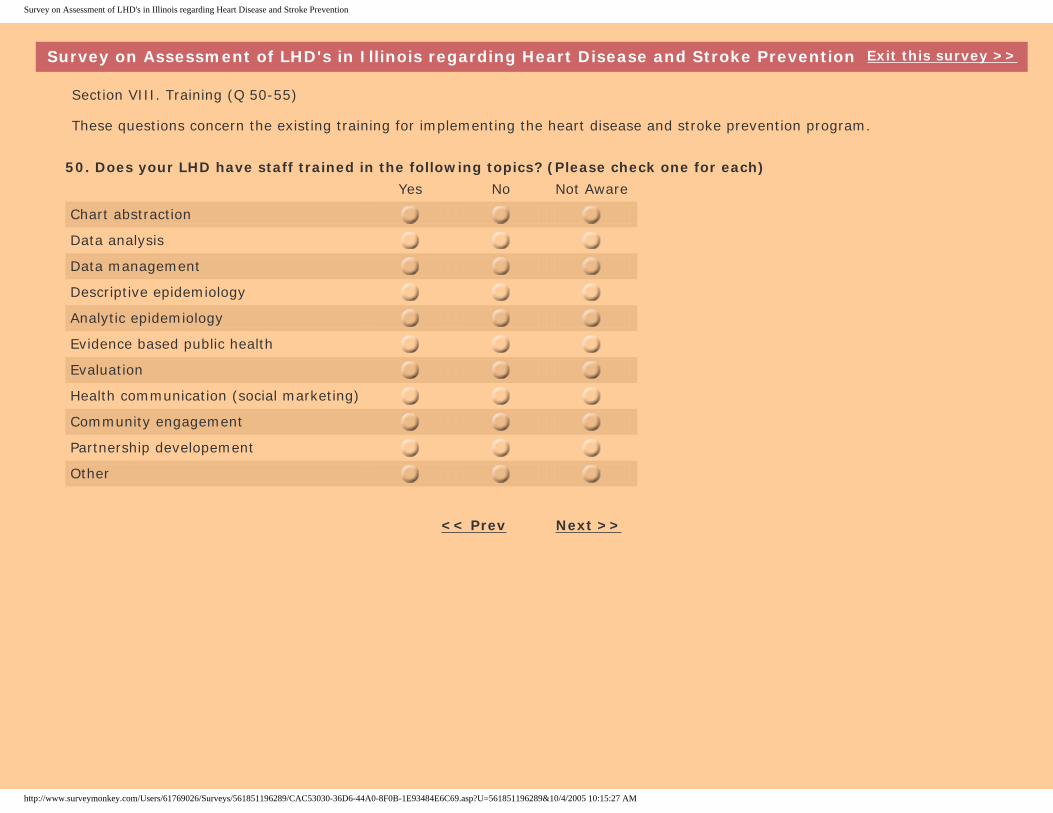
Survey on Assessment of LHD's in Illinois regarding Heart Disease and Stroke Prevention
Survey on Assessment of LHD's in Illinois regarding Heart Disease and Stroke Prevention Exit this survey >>
Section VIII. Training (Q 50-55)
These questions concern the existing training for implementing the heart disease and stroke prevention program.
50. Does your LHD have staff trained in the following topics? (Please check one for each) Yes No Not Aware
Chart abstraction
Data analysis
Data management
Descriptive epidemiology
Analytic epidemiology
Evidence based public health
Evaluation
Health communication (social marketing)
Community engagement
Partnership developement
Other
<< Prev Next >>
http://www.surveymonkey.com/Users/61769026/Surveys/561851196289/CAC53030-36D6-44A0-8F0B-1E93484E6C69.asp?U=561851196289&10/4/2005 10:15:27 AM
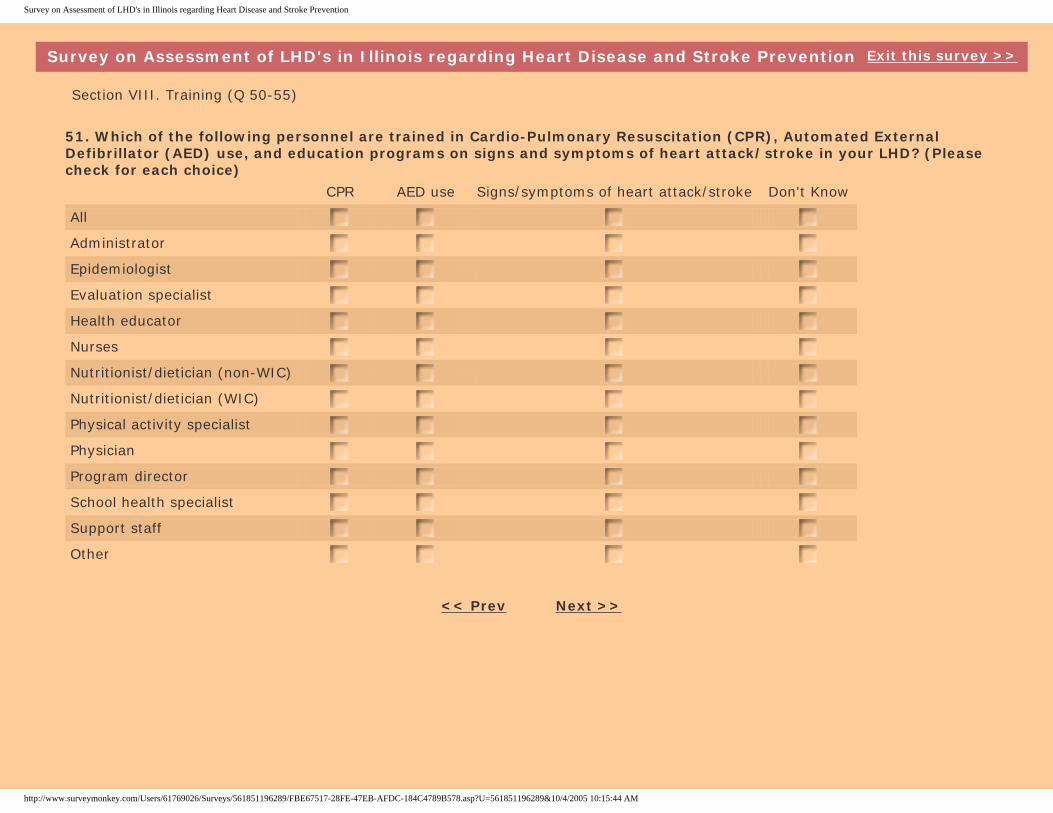
Survey on Assessment of LHD's in Illinois regarding Heart Disease and Stroke Prevention
Survey on Assessment of LHD's in Illinois regarding Heart Disease and Stroke Prevention Exit this survey >>
Section VIII. Training (Q 50-55)
51. Which of the following personnel are trained in Cardio-Pulmonary Resuscitation (CPR), Automated External Defibrillator (AED) use, and education programs on signs and symptoms of heart attack/stroke in your LHD? (Please check for each choice) CPR AED use Signs/symptoms of heart attack/stroke Don't Know
All
Administrator
Epidemiologist
Evaluation specialist
Health educator
Nurses
Nutritionist/dietician (non-WIC)
Nutritionist/dietician (WIC)
Physical activity specialist
Physician
Program director
School health specialist
Support staff
Other
<< Prev Next >>
http://www.surveymonkey.com/Users/61769026/Surveys/561851196289/FBE67517-28FE-47EB-AFDC-184C4789B578.asp?U=561851196289&10/4/2005 10:15:44 AM
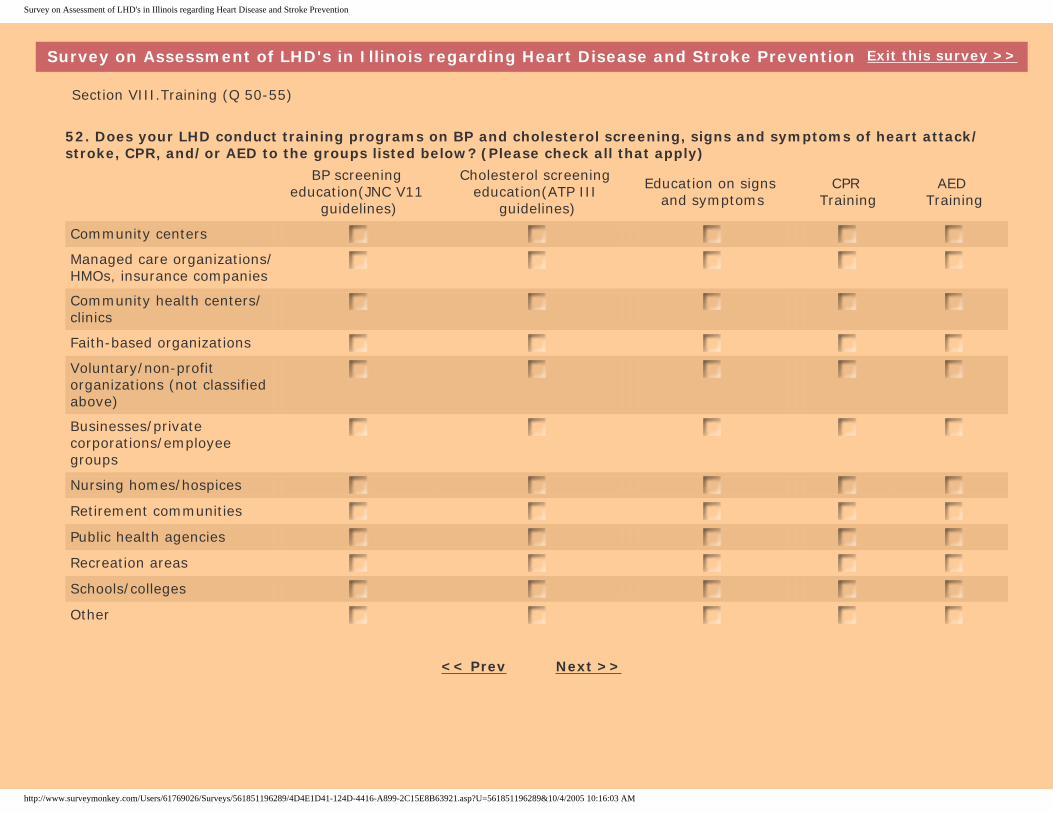
Survey on Assessment of LHD's in Illinois regarding Heart Disease and Stroke Prevention
Survey on Assessment of LHD's in Illinois regarding Heart Disease and Stroke Prevention Exit this survey >>
Section VIII.Training (Q 50-55)
52. Does your LHD conduct training programs on BP and cholesterol screening, signs and symptoms of heart attack/stroke, CPR, and/or AED to the groups listed below? (Please check all that apply)
BP screening
education(JNC V11 guidelines)
Cholesterol screening education(ATP III
guidelines)
Education on signs and symptoms
CPR Training
AED Training
Community centers
Managed care organizations/HMOs, insurance companies
Community health centers/clinics
Faith-based organizations
Voluntary/non-profit organizations (not classified above)
Businesses/private corporations/employee groups
Nursing homes/hospices
Retirement communities
Public health agencies
Recreation areas
Schools/colleges
Other
<< Prev Next >>
http://www.surveymonkey.com/Users/61769026/Surveys/561851196289/4D4E1D41-124D-4416-A899-2C15E8B63921.asp?U=561851196289&10/4/2005 10:16:03 AM
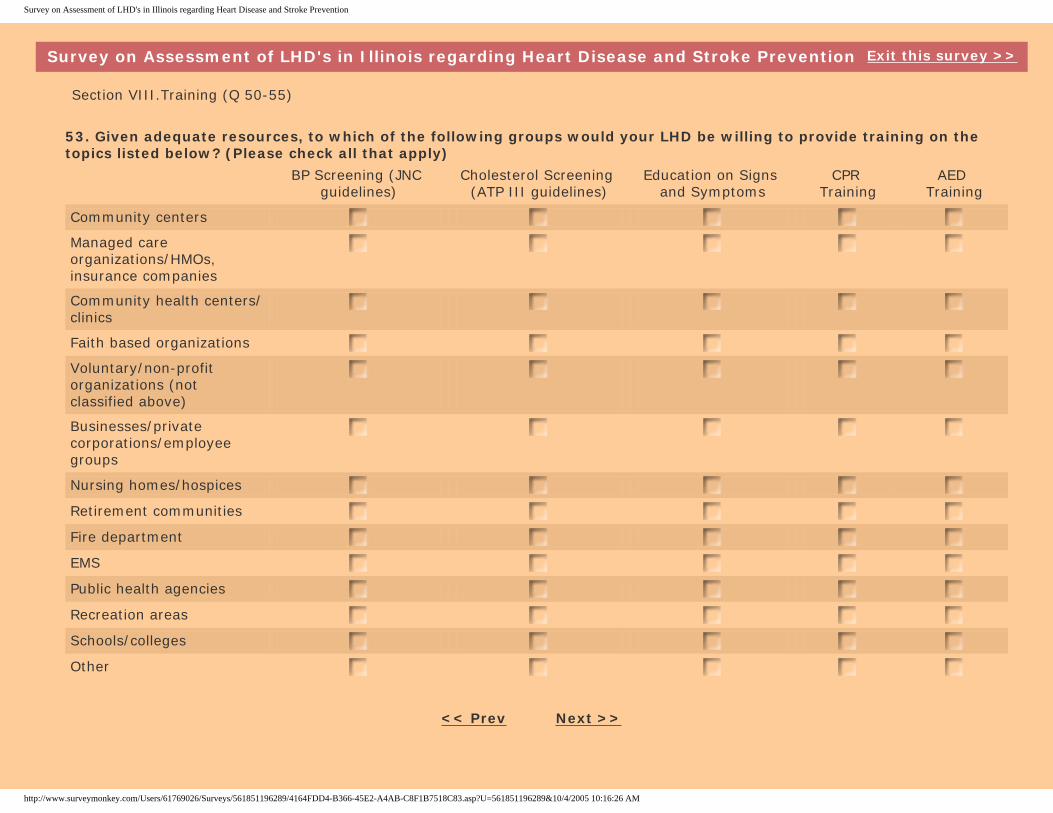
Survey on Assessment of LHD's in Illinois regarding Heart Disease and Stroke Prevention
Survey on Assessment of LHD's in Illinois regarding Heart Disease and Stroke Prevention Exit this survey >>
Section VIII.Training (Q 50-55)
53. Given adequate resources, to which of the following groups would your LHD be willing to provide training on the topics listed below? (Please check all that apply)
BP Screening (JNC guidelines)
Cholesterol Screening (ATP III guidelines)
Education on Signs and Symptoms
CPR Training
AED Training
Community centers
Managed care organizations/HMOs, insurance companies
Community health centers/clinics
Faith based organizations
Voluntary/non-profit organizations (not classified above)
Businesses/private corporations/employee groups
Nursing homes/hospices
Retirement communities
Fire department
EMS
Public health agencies
Recreation areas
Schools/colleges
Other
<< Prev Next >>
http://www.surveymonkey.com/Users/61769026/Surveys/561851196289/4164FDD4-B366-45E2-A4AB-C8F1B7518C83.asp?U=561851196289&10/4/2005 10:16:26 AM
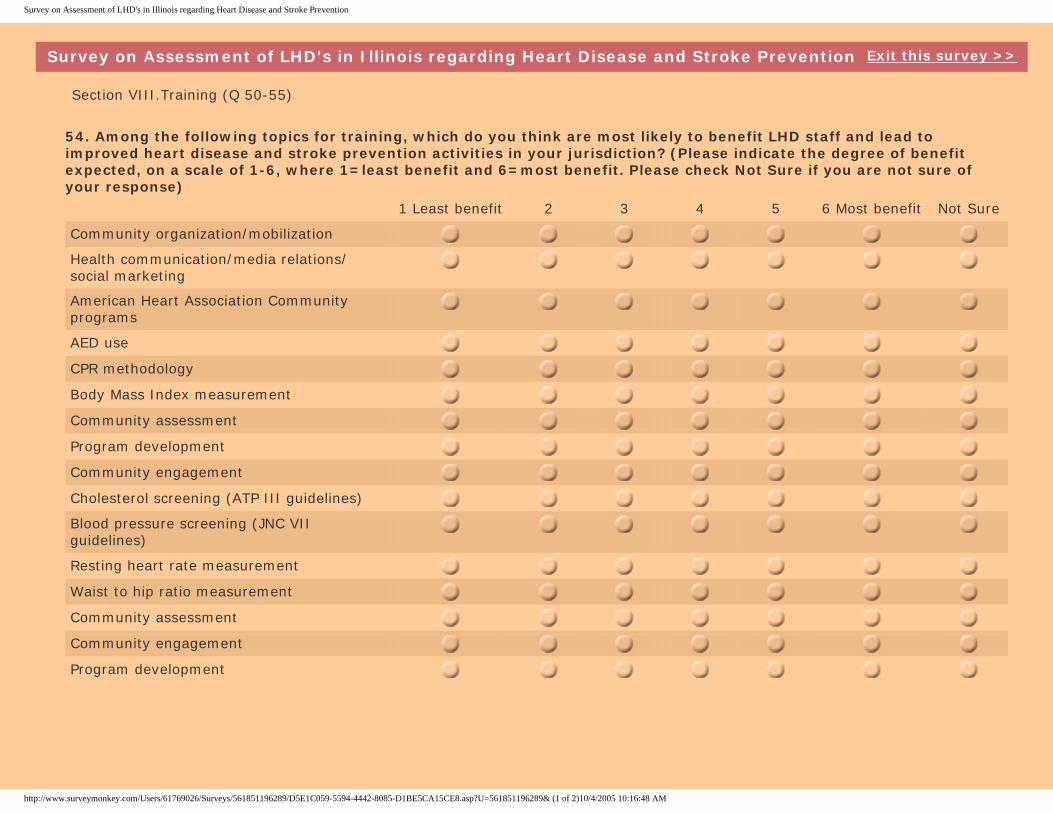
Survey on Assessment of LHD's in Illinois regarding Heart Disease and Stroke Prevention
Survey on Assessment of LHD's in Illinois regarding Heart Disease and Stroke Prevention Exit this survey >>
Section VIII.Training (Q 50-55)
54. Among the following topics for training, which do you think are most likely to benefit LHD staff and lead to improved heart disease and stroke prevention activities in your jurisdiction? (Please indicate the degree of benefit expected, on a scale of 1-6, where 1=least benefit and 6=most benefit. Please check Not Sure if you are not sure of your response) 1 Least benefit 2 3 4 5 6 Most benefit Not Sure
Community organization/mobilization
Health communication/media relations/social marketing
American Heart Association Community programs
AED use
CPR methodology
Body Mass Index measurement
Community assessment
Program development
Community engagement
Cholesterol screening (ATP III guidelines)
Blood pressure screening (JNC VII guidelines)
Resting heart rate measurement
Waist to hip ratio measurement
Community assessment
Community engagement
Program development
http://www.surveymonkey.com/Users/61769026/Surveys/561851196289/D5E1C059-5594-4442-8085-D1BE5CA15CE8.asp?U=561851196289& (1 of 2)10/4/2005 10:16:48 AM
Survey on Assessment of LHD's in Illinois regarding Heart Disease and Stroke Prevention
55. Does your LHD have adequate funding for the staff to attend trainings on the topics listed in the previous question (Q 54)? (Please check one)
No
Don’t Know.
Yes (If you check Yes, please describe sources of funding e.g. federal grants, foundation grants, etc to proceed with the survey)
<< Prev Next >>
http://www.surveymonkey.com/Users/61769026/Surveys/561851196289/D5E1C059-5594-4442-8085-D1BE5CA15CE8.asp?U=561851196289& (2 of 2)10/4/2005 10:16:48 AM
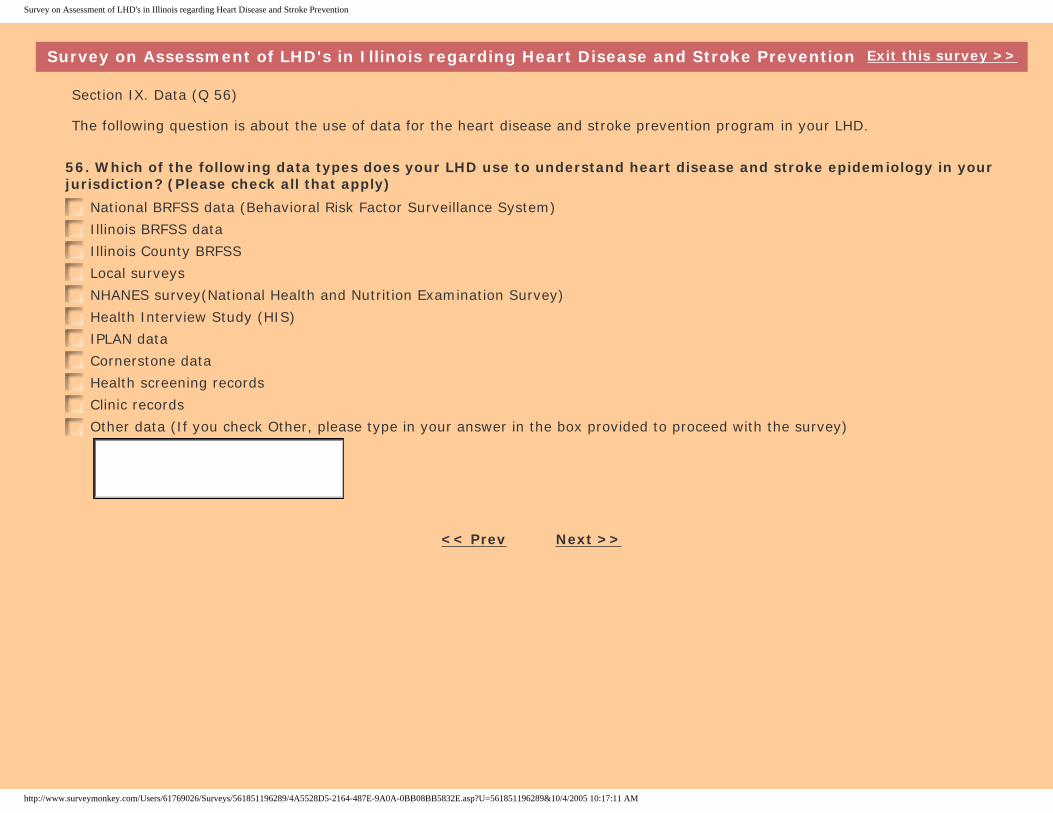
Survey on Assessment of LHD's in Illinois regarding Heart Disease and Stroke Prevention
Survey on Assessment of LHD's in Illinois regarding Heart Disease and Stroke Prevention Exit this survey >>
Section IX. Data (Q 56)
The following question is about the use of data for the heart disease and stroke prevention program in your LHD.
56. Which of the following data types does your LHD use to understand heart disease and stroke epidemiology in your jurisdiction? (Please check all that apply)
National BRFSS data (Behavioral Risk Factor Surveillance System)
Illinois BRFSS data
Illinois County BRFSS
Local surveys
NHANES survey(National Health and Nutrition Examination Survey)
Health Interview Study (HIS)
IPLAN data
Cornerstone data
Health screening records
Clinic records
Other data (If you check Other, please type in your answer in the box provided to proceed with the survey)
<< Prev Next >>
http://www.surveymonkey.com/Users/61769026/Surveys/561851196289/4A5528D5-2164-487E-9A0A-0BB08BB5832E.asp?U=561851196289&10/4/2005 10:17:11 AM
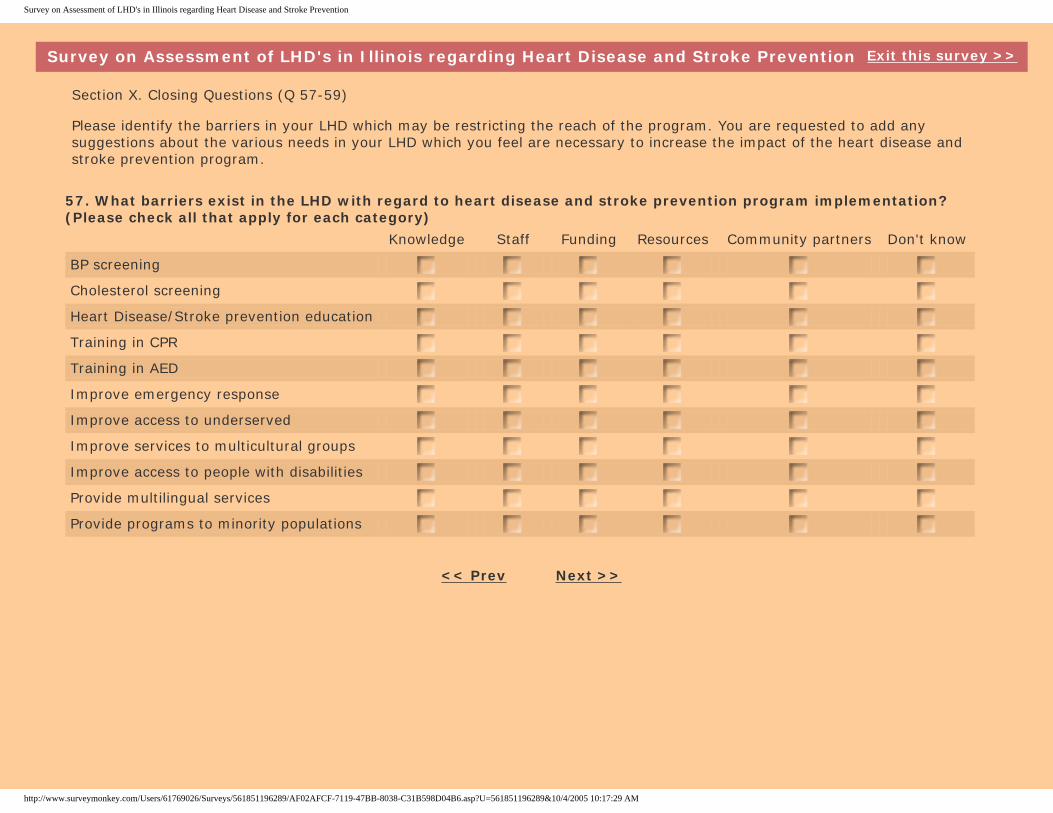
Survey on Assessment of LHD's in Illinois regarding Heart Disease and Stroke Prevention
Survey on Assessment of LHD's in Illinois regarding Heart Disease and Stroke Prevention Exit this survey >>
Section X. Closing Questions (Q 57-59)
Please identify the barriers in your LHD which may be restricting the reach of the program. You are requested to add any suggestions about the various needs in your LHD which you feel are necessary to increase the impact of the heart disease and stroke prevention program.
57. What barriers exist in the LHD with regard to heart disease and stroke prevention program implementation? (Please check all that apply for each category) Knowledge Staff Funding Resources Community partners Don't know
BP screening
Cholesterol screening
Heart Disease/Stroke prevention education
Training in CPR
Training in AED
Improve emergency response
Improve access to underserved
Improve services to multicultural groups
Improve access to people with disabilities
Provide multilingual services
Provide programs to minority populations
<< Prev Next >>
http://www.surveymonkey.com/Users/61769026/Surveys/561851196289/AF02AFCF-7119-47BB-8038-C31B598D04B6.asp?U=561851196289&10/4/2005 10:17:29 AM
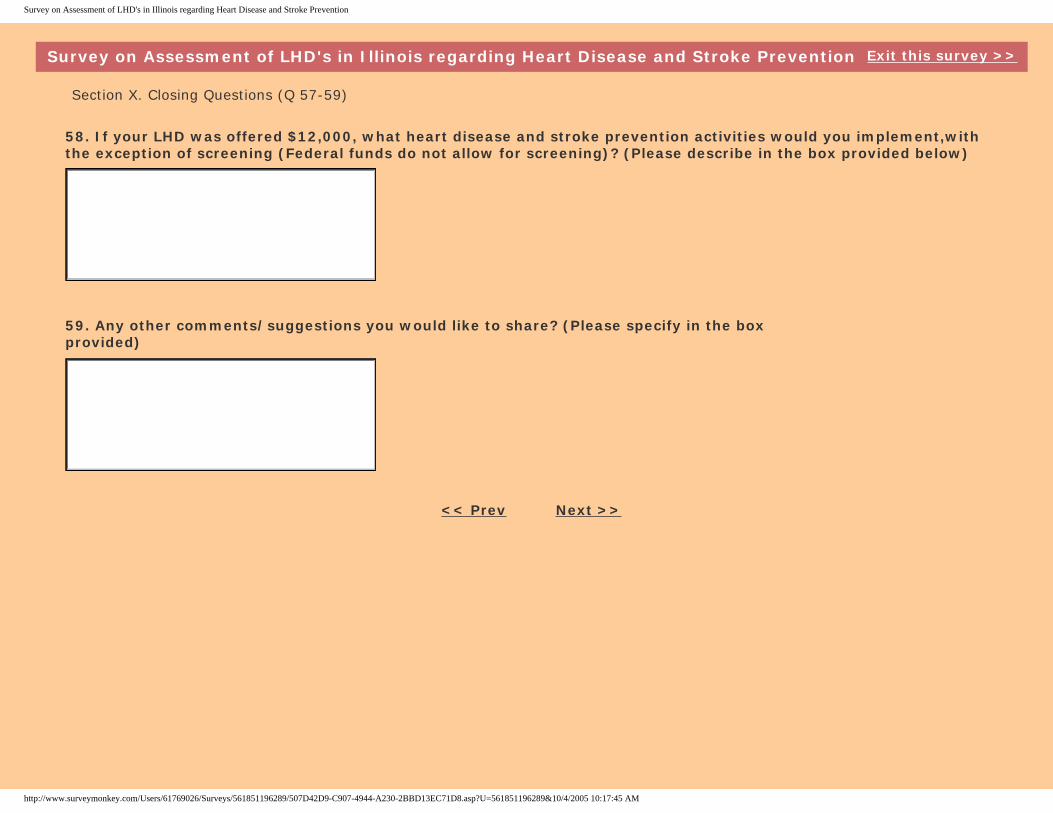
Survey on Assessment of LHD's in Illinois regarding Heart Disease and Stroke Prevention
Survey on Assessment of LHD's in Illinois regarding Heart Disease and Stroke Prevention Exit this survey >>
Section X. Closing Questions (Q 57-59)
58. If your LHD was offered $12,000, what heart disease and stroke prevention activities would you implement,with the exception of screening (Federal funds do not allow for screening)? (Please describe in the box provided below)
59. Any other comments/suggestions you would like to share? (Please specify in the box provided)
<< Prev Next >>
http://www.surveymonkey.com/Users/61769026/Surveys/561851196289/507D42D9-C907-4944-A230-2BBD13EC71D8.asp?U=561851196289&10/4/2005 10:17:45 AM
Survey on Assessment of LHD's in Illinois regarding Heart Disease and Stroke Prevention
Survey on Assessment of LHD's in Illinois regarding Heart Disease and Stroke Prevention Exit this survey >>
THANK YOU!
Please review the questionnaire to make sure all questions to which you weredirected have been answered. Please submit your survey by 5 pm, 08/31/2005 to be eligible for the prize!Click on "Done" when you have finally completed the survey, as you cannot access it for changes after submission.If you have have any questions about the survey, please send an email to:[email protected]@[email protected]
<< Prev Done >>
http://www.surveymonkey.com/Users/61769026/Surveys/561851196289/7DCD4D4C-4724-4D61-A96F-68F42EC1F423.asp?U=561851196289&10/4/2005 10:17:59 AM
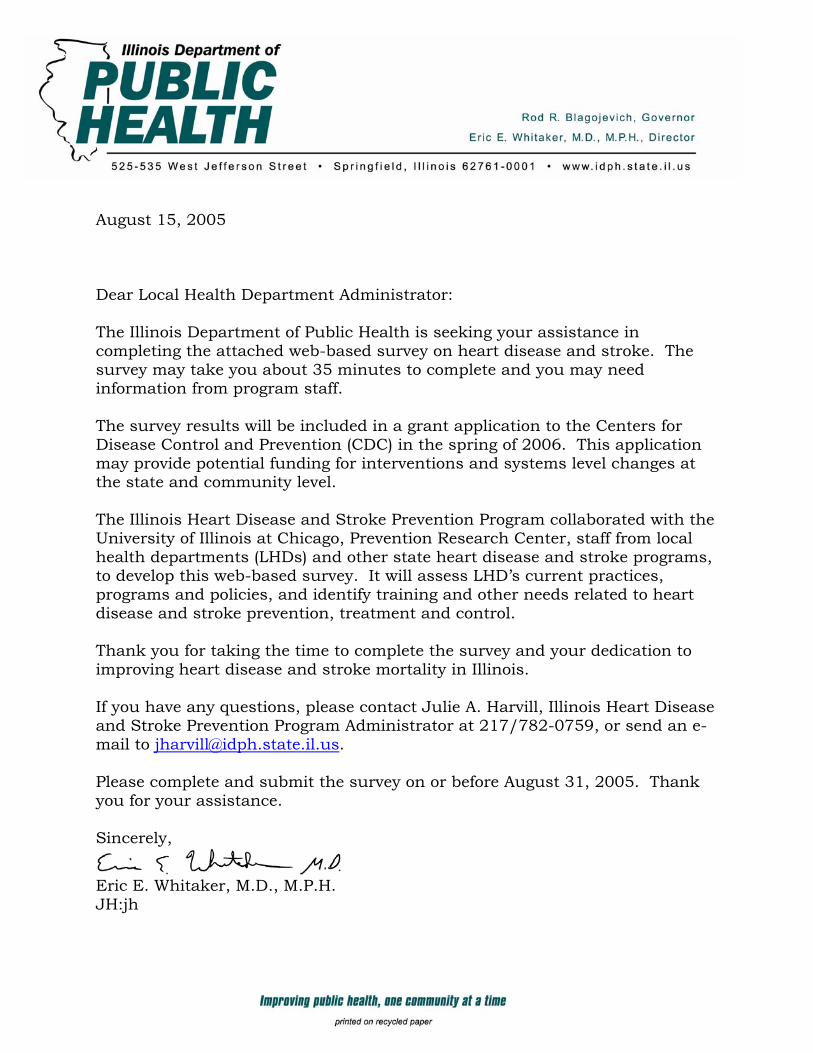
August 15, 2005 Dear Local Health Department Administrator: The Illinois Department of Public Health is seeking your assistance in completing the attached web-based survey on heart disease and stroke. The survey may take you about 35 minutes to complete and you may need information from program staff. The survey results will be included in a grant application to the Centers for Disease Control and Prevention (CDC) in the spring of 2006. This application may provide potential funding for interventions and systems level changes at the state and community level. The Illinois Heart Disease and Stroke Prevention Program collaborated with the University of Illinois at Chicago, Prevention Research Center, staff from local health departments (LHDs) and other state heart disease and stroke programs, to develop this web-based survey. It will assess LHD’s current practices, programs and policies, and identify training and other needs related to heart disease and stroke prevention, treatment and control. Thank you for taking the time to complete the survey and your dedication to improving heart disease and stroke mortality in Illinois. If you have any questions, please contact Julie A. Harvill, Illinois Heart Disease and Stroke Prevention Program Administrator at 217/782-0759, or send an e-mail to [email protected]. Please complete and submit the survey on or before August 31, 2005. Thank you for your assistance. Sincerely,
Eric E. Whitaker, M.D., M.P.H. JH:jh
APPENDIX J: Joint Letter to Participate in the Survey Cover Letter for Survey Dear Local Health Department Administrators: Attached, please find a letter from Dr. Whitaker requesting your cooperation in completing a web-based survey tool. The survey can be accessed by clicking on the following link: : http://www.surveymonkey.com/s.asp?u=561851196289 We are requesting that you and/or others on your staff who are most familiar with heart disease and stroke prevention programming complete the survey. A summary report will be compiled and sent to each local health department. All LHD's that complete the survey will be entered into a drawing for a chance to win one of three prizes. Please complete and submit survey by close of business (5PM) on Wednesday, August 31, 2005, to be eligible for the drawing. If you have any questions or concerns regarding the survey content, please contact Julie A. Harvill at 217/782-0759 or send an e-mail to [email protected]. If you have any technical difficulty accessing, completing or submitting the survey, please contact Karen Peters at 312/413-4944 or emailto: [email protected] or Sunanda Gupta at 312/996-2275 or emailto: [email protected]. We appreciate your assistance by completing this survey. Julie Harvill, Illinois Heart Disease and Stroke Prevention Program, IDPH Karen Peters, Illinois Prevention Research Center
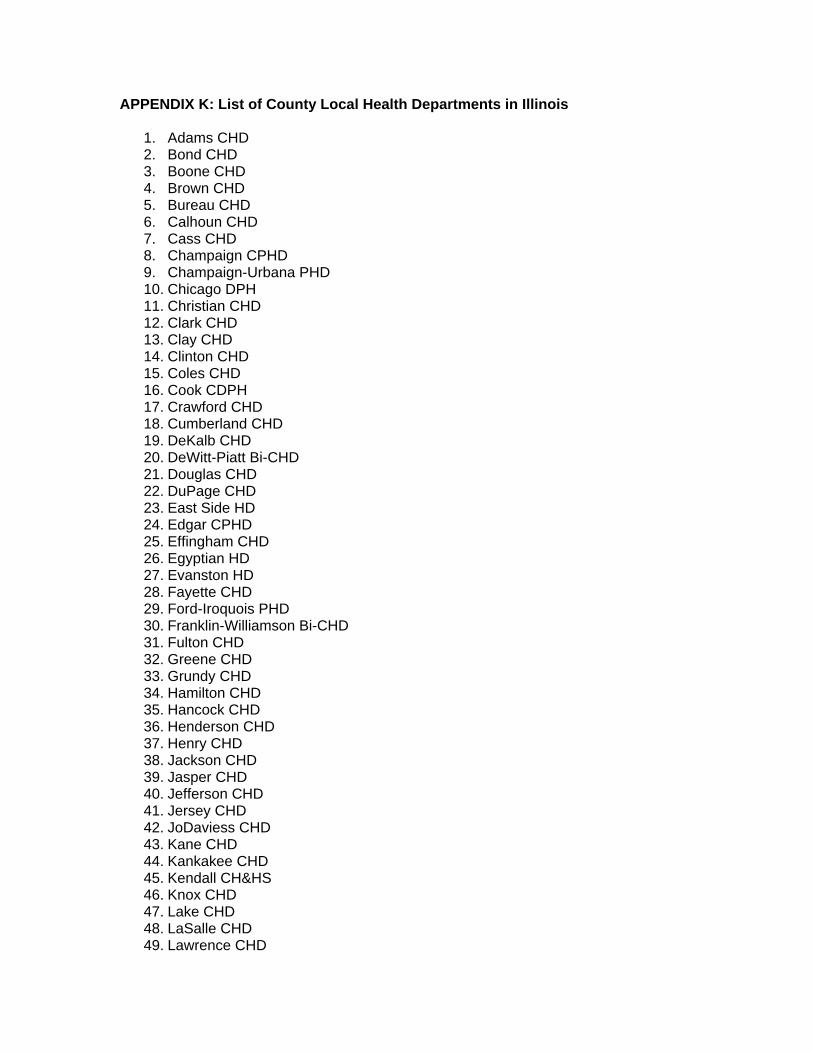
APPENDIX K: List of County Local Health Departments in Illinois
1. Adams CHD 2. Bond CHD 3. Boone CHD 4. Brown CHD 5. Bureau CHD 6. Calhoun CHD 7. Cass CHD 8. Champaign CPHD 9. Champaign-Urbana PHD 10. Chicago DPH 11. Christian CHD 12. Clark CHD 13. Clay CHD 14. Clinton CHD 15. Coles CHD 16. Cook CDPH 17. Crawford CHD 18. Cumberland CHD 19. DeKalb CHD 20. DeWitt-Piatt Bi-CHD 21. Douglas CHD 22. DuPage CHD 23. East Side HD 24. Edgar CPHD 25. Effingham CHD 26. Egyptian HD 27. Evanston HD 28. Fayette CHD 29. Ford-Iroquois PHD 30. Franklin-Williamson Bi-CHD 31. Fulton CHD 32. Greene CHD 33. Grundy CHD 34. Hamilton CHD 35. Hancock CHD 36. Henderson CHD 37. Henry CHD 38. Jackson CHD 39. Jasper CHD 40. Jefferson CHD 41. Jersey CHD 42. JoDaviess CHD 43. Kane CHD 44. Kankakee CHD 45. Kendall CH&HS 46. Knox CHD 47. Lake CHD 48. LaSalle CHD 49. Lawrence CHD

50. Lee CHD 51. Livingston CHD 52. Logan CHD 53. Macon CHD 54. Macoupin CHD 55. Madison CHD 56. Marion CHD 57. Marshall CHD 58. Mason CHD 59. McDonough CHD 60. McHenry CHD 61. McLean CHD 62. Menard CHD 63. Mercer CHD 64. Monroe-Randolph Bi-CHD 65. Montgomery CHD 66. Morgan CHD 67. Moultrie CHD 68. Oak Park DPH 69. Ogle CHD 70. Peoria City/CHD 71. Perry CHD 72. Pike CHD 73. Putnam CHD 74. Rock Island CHD 75. St. Clair CHD 76. Sangamon CDPH 77. Schuyler CHD 78. Scott CHD 79. Shelby CHD 80. Skokie HD 81. Southern Seven HD 82. Springfield DPH 83. Stark CHD 84. Stephenson CHD 85. Stickney Township PHD 86. Tazewell CHD 87. Vermilion CHD 88. Wabash CHD 89. Washington CHD 90. Wayne CHD 91. Whiteside CHD 92. Will CHD 93. Winnebago CHD 94. Woodford CHD
References
1. A Race Against Time: The Challenge of Cardiovascular Disease in Developing Economies,” 2004, Columbia University, New York.
2. American Heart Association Statistical Update 2006 : A Report From the American Heart Association Statistics Committee and Stroke Statistics Subcommittee. Circulation: Volume 113(6), 14 February 2006, pp e85-e151.
3. Bonow RO, Smaha LA, Smith SC Jr, Mensah GA, Lenfant C. World Heart Day 2002: the international burden of cardiovascular disease: responding to the emerging global epidemic. Circulation. 2002; 106:1602–1605. Ovid Full Text Bibliographic Links Library Holdings [Context Link].
4. British Heart Foundation. European Cardiovascular Disease Statistics, 2000 Edition.
5. Cardiovascular Diseases – Prevention and Control. WHO CVD Strategy, 2001-2002.
6. Carroll MD, Lacher DA, Sorlie PD, Cleeman JI, Gordon DJ, Wolz M, Grundy SM, Johnson CL. Trends in serum lipids and lipoproteins of adults, 1960–2002. JAMA. 2005; 294:1773–1781. Bibliographic Links Library Holdings [Context Link].
7. Centers for Disease Control and Prevention (CDC). Disparities in premature deaths from heart disease: 50 states and the District of Columbia, 2001. MMWR Morb Mortal Wkly Rep. 2004; 53:121–125. Bibliographic Links Library Holdings [Context Link].
8. CDC, 2004, National and State Perspectives -Chronic Diseases, Risk Factors, and Preventive Services, Illinois.
9. Centers for Disease Control and Prevention (CDC). Racial/ethnic disparities in prevalence, treatment, and control of hypertension—United States, 1999–2002. MMWR Morb Mortal Wkly Rep. 2005; 54(1):7–9. Bibliographic Links Library Holdings [Context Link].
10. Centers for Disease Control and Prevention (CDC). State-specific cholesterol screening trends–United States, 1991–1999. MMWR. 2000;49:750–755. Bibliographic Links Library Holdings 231. Centers for Disease Control and Prevention (CDC). Trends in cholesterol screening and awareness of high blood cholesterol–United States, 1991-2003. MMWR. 2005; 54; 865–870. Bibliographic Links Library Holdings [Context Link].
11. CDC/NCHS, Vital Health Stat 10. July 2005; No. 225. [Context Link].
12. Chugh SS, Jui J, Gunson K, Stecker EC, John BT, Thompson B, Ilias N, Vickers C, Dogra V, Daya M, Kron J, Zheng ZJ, Mensah G, McAnulty J. Current burden of sudden cardiac death: multiple source surveillance versus retrospective death certificate-based review in a large U.S. community. J Am Coll Cardiol. 2004; 44:1268–1275. Bibliographic Links Library Holdings [Context Link].
13. Cobb LA, Fahrenbruch CE, Olsufka M, Copass MK. Changing incidence of out-of-hospital ventricular fibrillation, 1980–2000. JAMA. 2002; 288:3008–3013. Ovid Full Text Bibliographic Links Library Holdings [Context Link].
14. Daviglus ML, Stamler J, Pirzada A, Yan LL, Garside DB, Liu K, Wang R, Dyer AR, Lloyd-Jones DM, Greenland P. Favorable cardiovascular risk profile in young women and long-term risk of cardiovascular and all-cause mortality. JAMA. 2004; 292:1588–1592. Bibliographic Links Library Holdings [Context Link].
15. Diet, Nutrition and the Prevention of Chronic Diseases. WHO, Geneva, 2003.
16. Executive Summary of the Third Report of the National Cholesterol Education Program
(NCEP) Expert Panel on Detection, Evaluation, and Treatment of High Blood Cholesterol in Adults (Adult Treatment Panel III) Expert Panel on Detection, Evaluation, and Treatment of High Blood Cholesterol in Adults JAMA. 2001; 285:2486-2497.
17. Evenson KR, Rosamond WD, Morris DL. Pre-hospital and in-hospital delays in acute stroke care. Neuroepidemiology. 2001; 20:65–76. Bibliographic Links Library Holdings [Context Link].
18. Ferris A, Robertson RM, Fabunmi R, Mosca L, for the American Heart Association and American Stroke Association. American Heart Association and American Stroke Association national survey of stroke risk awareness among women. Circulation. 2005; 111:1321–1326. Ovid Full Text Bibliographic Links Library Holdings.
19. Fields LE, Burt VL, Cutler JA, Hughes J, Roccella EJ, Sorlie P. The burden of adult hypertension in the United States, 1999–2000: a rising tide. Hypertension. 2004; 44:398–404. Ovid Full Text Bibliographic Links Library Holdings [Context Link].
20. Greenlund KJ, Croft JB, Mensah GA. Prevalence of heart disease and stroke risk factors in persons with prehypertension in the United States, 1999–2000. Arch Intern Med. 2004; 164:2113–2118. Bibliographic Links Library Holdings [Context Link].
21. Greenland P, Knoll MD, Stamler J, Neaton JD, Dyer AR, Garside DB, Wilson PW. Major risk factors as antecedents of fatal and nonfatal coronary heart disease events. JAMA. 2003; 290:891–897. Bibliographic Links Library Holdings [Context Link].
22. Hajjar I, Kotchen TA. Trends in prevalence, awareness, treatment and control of hypertension in the Unites States, 1988–2000. JAMA. 2003; 290:199–206. Bibliographic Links Library Holdings [Context Link].
23. Health Care Financing Review, 2003 Medicare and Medicaid Statistical Supplement. (www.cms.hhs.gov/review/supp/2003 ) [Context Link].
24. Health, United States, 2004; CDC/NCHS.
25. Healthy People 2000. Atlanta, Ga: CDC/NCHS, Jan. 2002. Statistical Notes No. 23.
[Context Link].
26. Hill MD, Yiannakoulias N, Jeerakathil T, Tu JV, Svenson LW, Schopflocher DP. The high risk of stroke immediately after transient ischemic attack: a population-based study. Neurology. 2004; 62:2015–2020. Ovid Full Text Bibliographic Links Library Holdings [Context Link].
27. Hurst W. The Heart, Arteries and Veins. 10th Ed. New York, NY: McGraw-Hill; 2002. [Context Link].
28. IDPH Center for Health Statistics, 2001 NCHS data.
29. Institute of Medicine, Committee on Quality of Health Care in America. Crossing the Quality Chasm: A New Health System for the 21st Century. Washington, DC: National Academy Press; 2001:232. [Context Link].
30. Integrated Management of Cardiovascular Risk. Report of a WHO Meeting, Geneva, July 2002.
31. Kennedy BS, Kasl SV, Brass LM, Vaccarino V. Trends in hospitalized stroke for blacks and whites in the United States, 1980–1999. Neuroepidemiology. 2002; 21:131–141. Bibliographic Links Library Holdings [Context Link].
32. Kothari R, Sauerbeck L, Jauch E, Broderick J, Brott T, Khoury J, Liu T. Patient's awareness of stroke signs, symptoms, and risk factors. Stroke. 1997; 28:1871–1875. Ovid Full Text Bibliographic Links Library Holdings [Context Link].
33. Levy D, Larson MG, Vasan RS, Kannel WB, Ho KK. The progression from hypertension to congestive heart failure. JAMA. 1996; 275:1557–1562. Ovid Full Text Bibliographic Links Library Holdings [Context Link].
34. Lloyd-Jones DM, Evans JC, Levy D. Hypertension in adults across the age spectrum: current outcomes and control in the community. JAMA. 2005; 294:466–472. Bibliographic Links Library Holdings [Context Link].
35. Lloyd-Jones DM, Larson MG, Beiser A, Levy D. Lifetime risk for developing coronary heart disease. Lancet. 1999; 353:89–92. Bibliographic Links Library Holdings [Context Link].

36. MacMahon S, et al. The epidemiological association between blood pressure and stroke: implications for primary and secondary prevention. Hypertens Res. 1994;17(suppl 1):S23–S32 [Context Link].
37. McGinn AP, Rosamond WD, Goff DC Jr, Taylor HA, Miles JS, Chambless L. Trends in prehospital delay time and use of emergency medical services for acute myocardial infarction: experience in 4 US communities from 1987-2000. Am Heart J. 2005; 150:392–400. Buy Now Bibliographic Links Library Holdings [Context Link].
38. Morgenstern LB, Smith MA, Lisabeth LD, Risser JM, Uchino K, Garcia N, Longwell PJ, McFarling DA, Akuwumi O, Al-Wabil A, Al-Senani F, Brown DL, Moye LA. Excess stroke in Mexican Americans compared with non-Hispanic whites: the Brain Attack Surveillance in Corpus Christi Project. Am J Epidemiol. 2004; 160:376–383. Buy Now Bibliographic Links Library Holdings [Context Link].
39. Muntner P, Garrett E, Klag MJ, Coresh J. Trends in stroke prevalence between 1973 and 1991 in the US population 25 to 74 years of age. Stroke. 2002; 33:1209–1213. Ovid Full Text Bibliographic Links Library Holdings [Context Link].
40. Myerburg RJ, Kessler KM, Castellanos A. Sudden cardiac death: epidemiology, transient risk, and intervention assessment. Ann Intern Med. 1993; 119:1187–1197. Ovid Full Text Bibliographic Links Library Holdings [Context Link].
41. National Hospital Discharge Survey. 2001. Annual Summary With Detailed Diagnosis and Procedure Data. NCHS. Vital and Health Statistics. 13(156).2004. [Context Link].
42. National Vital Statistics Report: Deaths: Preliminary Data for 2003 (NVSR, 2005; 53:15, Hyattsville, Md: National Center for Health Statistics, 2005).
43. NHANES 1999–02, CDC/NCHS.
44. Nichol G, Stiell IG, Laupacis A, Pham B, De Maio V, Wells GA. A cumulative meta-analysis of the effectiveness of defibrillator-capable emergency medical services for
victims of out-of-hospital cardiac arrest.;Ann Emerg Med. 1999; 34:517–525. Ovid Full Text Bibliographic Links Library Holdings [Context Link].
45. Psaty BM, Manolio TA, Smith NL, Heckbert SR, Gottdiener JS, Burke GL, Weissfeld J, Enright P, Lumley T, Powe N, Furberg CD, for the Cardiovascular Health Study. Time trends in high blood pressure control and the use of antihypertensive medications in older adults: the Cardiovascular Health Study. Arch Intern Med. 2002; 162:2325–2332. Ovid Full Text Bibliographic Links Library Holdings [Context Link].
46. Stamler J, Stamler R, Neaton JD, Wentworth D, Daviglus ML, Garside D, Dyer AR, Liu K, Greenland P. Low risk-factor profile and long-term cardiovascular and noncardiovascular mortality and life expectancy: findings for 5 large cohorts of young adult and middle-aged men and women. JAMA. 1999; 282:2012–2018. Ovid Full Text Bibliographic Links Library Holdings [Context Link].
47. Seshadri S et al. Lifetime risk of stroke: results from the Framingham study. Stroke. In press. [Context Link].
48. Strong Heart Study Data Book. Washington, DC: NIH, NHLBI; 2001. [Context Link].
49. Taylor TN, Davis PH, Torner JC, Holmes J, Meyer JW, Jacobson MF. Lifetime cost of stroke in the United States. Stroke. 1996; 27:1459–1466. Ovid Full Text Bibliographic Links Library Holdings [Context Link].
50. Third Report of the National Cholesterol Education Program (NCEP) Expert Panel on Detection, Evaluation, and Treatment of High Blood Cholesterol in Adults (Adult Treatment Panel) Final Report. Circulation. 2002; 106:3143–3421. Bibliographic Links Library Holdings [Context Link] 233. Centers for Disease Control and Prevention (CDC). Disparities in screening for and awareness of high blood cholesterol–United States, 1999–2002. MMWR. 2005; 54;117–119. [Context Link].
51. Trivedi AN, Zaslavsky AM, Schneider EC, Ayanian JZ. Trends in the quality of care and racial disparities in Medicare managed care. N Engl J Med. 2005; 353:692–700. Bibliographic Links Library Holdings [Context Link].
52. U.S. Decennial Life Tables for 1989–91, Volume 1, No. 4. September 1999. [Context Link]
53. Vital and Health Statistics. No. 356, April 27, 2005. [Context Link].
54. White H, Boden-Albala B, Wang C, Elkind MS, Rundek T, Wright CB, Sacco RL. Ischemic stroke subtype incidence among whites, blacks, and Hispanics: the Northern Manhattan Study. Circulation. 2005; 111:1327–1331. Ovid Full Text Bibliographic Links Library Holdings [Context Link].
55. Witt BJ, Jacobsen SJ, Weston SA, Killian JM, Meverden RA, Allison TG, Reeder GS, Roger VL Cardiac rehabilitation after myocardial infarction in the community. J Am Coll Cardiol. 2004; 44:988–996. Bibliographic Links Library Holdings [Context Link].
56. WHO STATS.
57. Atlas of Heart Disease and Stroke, WHO, Sept. 2004. 58. WHO World Health Report, 2002.
59. WHO World Health Report, 2003.
60. Winkleby MA, Kraemer HC, Ahn DK, Varady AN. Ethnic and socioeconomic
differences in cardiovascular disease risk factors: findings for women from the Third National Health and Nutrition Examination Survey, 1988–1994.JAMA. 1998;280:356–362. Ovid Full Text Bibliographic Links Library Holdings [Context Link]
61. Thom, Thomas; Haase, Nancy; Rosamond, Wayne PhD; Howard, Virginia J.et al. Heart Disease and Stroke Statistics—2006 Update: A Report From the American Heart Association Statistics Committee and Stroke Statistics Subcommittee. Circulation: Volume 113(6), 14 February 2006, pp e85-e151.
62. Yusuf S, Hawken S, Ounpuu S, Dans T, Avezum A, Lanas F, McQueen M, Budaj A, Pais P, Varigos J, Lisheng L; INTERHEART Study Investigators. Effect of potentially modifiable risk factors associated with myocardial infarction in 52 countries (the INTERHEART study): case-control study. Lancet. 2004; 364:937–952. Bibliographic Links Library Holdings [Context Link]

REPORT APPENDIX Survey on Assessment of Local Health Departments in Illinois Regarding Heart Disease and Stroke Prevention Preliminary DRAFT Report Submitted to the Illinois Department of Public Health, Program in Heart Disease and Stroke Prevention Prepared by: Karen Peters, DrPH William Baldyga, DrPH Sunanda Gupta, MD, MPH Illinois Prevention Research Center Institute for Health Research and Policy School of Public Health University of Illinois at Chicago March 2006
(Preliminary Report: Please do not distribute or cite any portion of this draft report document)
2
ILLINOIS DEPARTMENT OF PUBLIC HEALTH
Survey on Assessment of Local Health Departments in Illinois regarding Heart Disease and Stroke Prevention
MARCH 2006
Table of Contents Page Executive Summary ........................................................................................ 3 Background and Purpose ............................................................................... 3 Review of the Literature ..................................................................... 4 - 12 Methodology .......................................................................................... 12 - 17 Analysis and Dissemination of Findings
1. General Section.............................................................. 17 - 24 2. Screening for High Blood Pressure ............................................ 24 - 29 3. Screening for Cholesterol ............................................................... 29 - 33 4. Know Signs and Symptoms of Heart Attack/Stroke ......................... 33 - 34 5. Improve Emergency Response ........................................................ 34 - 36 6. Improve Quality of Care ................................................................... 36 - 37 7. Disparities......................................................................................... 37 - 39 8. Training ............................................................................................ 39 - 43 9. Data.................................................................................................. 43 - 44 10. Closing Questions ............................................................................ 44 - 45
Recommendations ........................................................................................... 45 - 47 References...................................................................................................... 48 – 54 List of Appendices.................................................................................................... 55 Appendix A: Table of Working Group Members
Appendix B: Letter to Planning Committee Appendix C: Table of Planning Committee Members Appendix D: Table of Other Surveys and Tools Utilized Appendix E: Evaluation Question Instrument Appendix F: Planning Committee Comments on Survey Appendix G: CDC Comments on Survey Appendix H: Survey Instrument (PDF file) Appendix I: Cover Letter from Director Whitaker Appendix J: Cover Letter from Joint Project Directors Appendix K: List of Illinois Local Health Department Counties Appendix L: References Appendix M: Supplementary Report
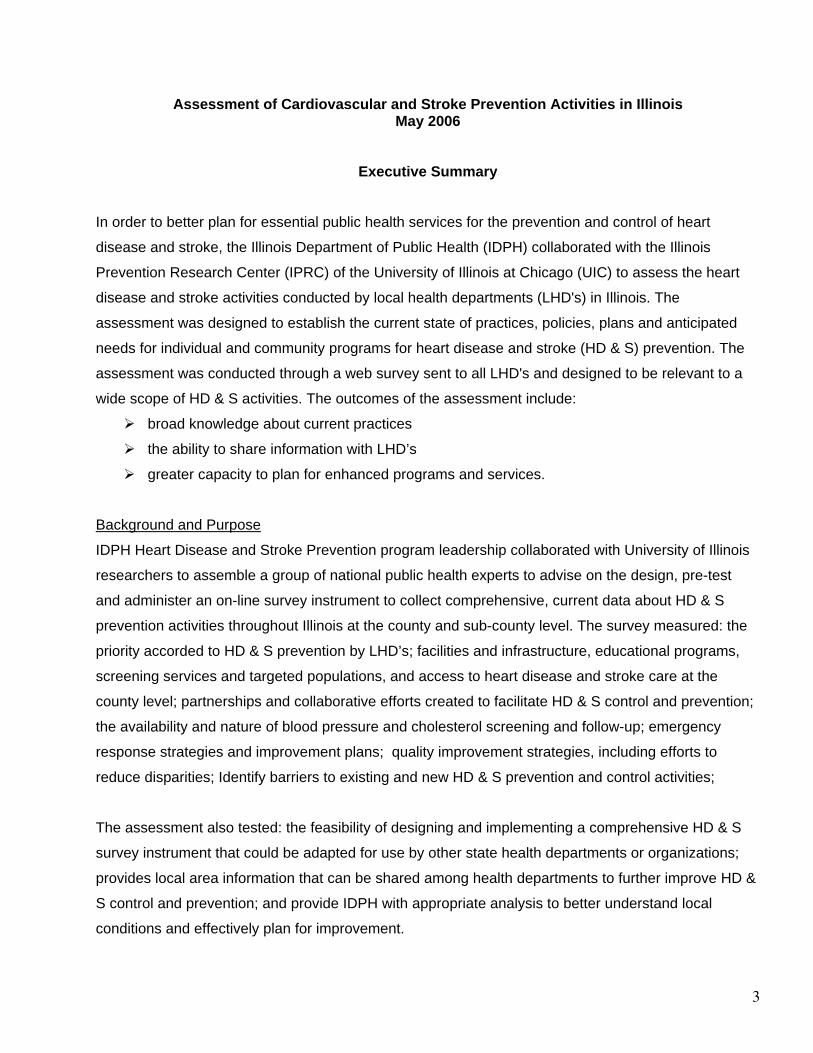
3
Assessment of Cardiovascular and Stroke Prevention Activities in Illinois May 2006
Executive Summary
In order to better plan for essential public health services for the prevention and control of heart
disease and stroke, the Illinois Department of Public Health (IDPH) collaborated with the Illinois
Prevention Research Center (IPRC) of the University of Illinois at Chicago (UIC) to assess the heart
disease and stroke activities conducted by local health departments (LHD's) in Illinois. The
assessment was designed to establish the current state of practices, policies, plans and anticipated
needs for individual and community programs for heart disease and stroke (HD & S) prevention. The
assessment was conducted through a web survey sent to all LHD's and designed to be relevant to a
wide scope of HD & S activities. The outcomes of the assessment include:
broad knowledge about current practices
the ability to share information with LHD’s
greater capacity to plan for enhanced programs and services.
Background and Purpose
IDPH Heart Disease and Stroke Prevention program leadership collaborated with University of Illinois
researchers to assemble a group of national public health experts to advise on the design, pre-test
and administer an on-line survey instrument to collect comprehensive, current data about HD & S
prevention activities throughout Illinois at the county and sub-county level. The survey measured: the
priority accorded to HD & S prevention by LHD’s; facilities and infrastructure, educational programs,
screening services and targeted populations, and access to heart disease and stroke care at the
county level; partnerships and collaborative efforts created to facilitate HD & S control and prevention;
the availability and nature of blood pressure and cholesterol screening and follow-up; emergency
response strategies and improvement plans; quality improvement strategies, including efforts to
reduce disparities; Identify barriers to existing and new HD & S prevention and control activities;
The assessment also tested: the feasibility of designing and implementing a comprehensive HD & S
survey instrument that could be adapted for use by other state health departments or organizations;
provides local area information that can be shared among health departments to further improve HD &
S control and prevention; and provide IDPH with appropriate analysis to better understand local
conditions and effectively plan for improvement.
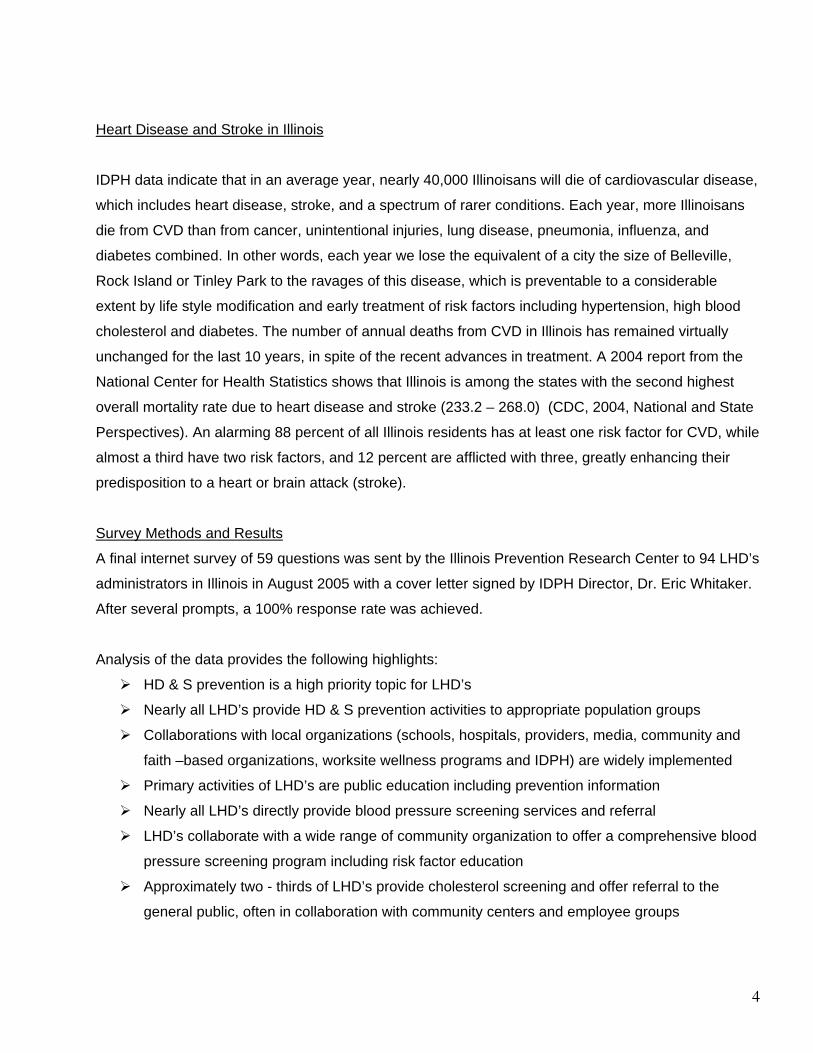
4
Heart Disease and Stroke in Illinois
IDPH data indicate that in an average year, nearly 40,000 Illinoisans will die of cardiovascular disease,
which includes heart disease, stroke, and a spectrum of rarer conditions. Each year, more Illinoisans
die from CVD than from cancer, unintentional injuries, lung disease, pneumonia, influenza, and
diabetes combined. In other words, each year we lose the equivalent of a city the size of Belleville,
Rock Island or Tinley Park to the ravages of this disease, which is preventable to a considerable
extent by life style modification and early treatment of risk factors including hypertension, high blood
cholesterol and diabetes. The number of annual deaths from CVD in Illinois has remained virtually
unchanged for the last 10 years, in spite of the recent advances in treatment. A 2004 report from the
National Center for Health Statistics shows that Illinois is among the states with the second highest
overall mortality rate due to heart disease and stroke (233.2 – 268.0) (CDC, 2004, National and State
Perspectives). An alarming 88 percent of all Illinois residents has at least one risk factor for CVD, while
almost a third have two risk factors, and 12 percent are afflicted with three, greatly enhancing their
predisposition to a heart or brain attack (stroke).
Survey Methods and Results
A final internet survey of 59 questions was sent by the Illinois Prevention Research Center to 94 LHD’s
administrators in Illinois in August 2005 with a cover letter signed by IDPH Director, Dr. Eric Whitaker.
After several prompts, a 100% response rate was achieved.
Analysis of the data provides the following highlights:
HD & S prevention is a high priority topic for LHD’s
Nearly all LHD’s provide HD & S prevention activities to appropriate population groups
Collaborations with local organizations (schools, hospitals, providers, media, community and
faith –based organizations, worksite wellness programs and IDPH) are widely implemented
Primary activities of LHD’s are public education including prevention information
Nearly all LHD’s directly provide blood pressure screening services and referral
LHD’s collaborate with a wide range of community organization to offer a comprehensive blood
pressure screening program including risk factor education
Approximately two - thirds of LHD’s provide cholesterol screening and offer referral to the
general public, often in collaboration with community centers and employee groups
5
Most LHD’s provide general public education and media to increase knowledge about the signs
and symptoms of heart disease and stroke using opportunities available in the community
(outreach events, screening, waiting rooms)
More than half of the LHD’s do not possess an Automated External Defibrillator
About half of the LHD’s report collaborating with appropriate agencies (emergency service
agencies and systems, medical services, fire and police departments and hospitals) to
improve emergency response
More than half of the LHD’s have enhanced 911 services, another one-third basic 911
Most LHD’s do not specifically target underserved groups to reduce disparities
Although significant staff expertise already exists, training needs remain, particularly in data
management and analysis. Funding is a major barrier to increased training
Identified opportunities for additional HD & S prevention training conducted by LHD staff are
available in the community
Low levels of funding, staff, and additional resources constrain LHD progress in HD & S
prevention. Respondents identified stable funding as a prerequisite to increased HD & S
prevention activities.
Recommendations
The LHD’s in the state play a major role in implementing and disseminating public health programs. A
survey of the current capacity of the Heart Disease and Stroke Prevention Program in the 94 LHD’s in
Illinois has revealed significant statewide activity in HD & S prevention. To achieve IDPH and Healthy
People 2010 goals, additional efforts will be required. Analyses of the results of the survey provide
direction and recommendations for strengthening the program. These recommendations can only be
advanced with additional resources.
Move HD & S prevention to one of the two top priorities in all LHD’s
Offer resources to assure all LHD’s can provide basic public health education and blood
pressure and cholesterol screening
Offer communications resources and materials to LHD’s. Develop an evidence based
statewide public information campaign
Improve efforts to reduce health disparities by targeting programs, develop programs to
overcome linguistic and other barriers, and working closely with minority organizations to meet
needs
6
Enhance the already significant partnership activities to be more inclusive of minority serving
organizations, business groups, rehabilitations service providers and other provider
organizations and national program efforts
Increase efforts to implement effective prevention policies at the local level, specifically with
provider organizations, and to increase knowledge about the capacity of local facilities
Enhance collaboration with hospitals to improve response and quality of services provided to
stroke and heart attack victims
Strengthen cholesterol screening efforts by promoting ATP III guidelines, forging alliances with
service providers and improving LHD record keeping and reminder systems
Strengthen blood pressure screening efforts by promoting JNC VII guidelines, improving health
education resources and improving LHD record keeping and reminder systems
Increase efforts to inform provides of linguistic and other barriers to services and providing
resources to overcome barriers and improve disparities
Provide additional training opportunities to LHD staff on identified priority topics
Conclusion
A statewide survey of HD & S prevention program activities was highly successful, attracting a 100%
response and providing rich data for planning and program implementation. The survey should be
repeated in two to three years to measure progress toward state and national goals.
7
Overview of Project on Needs Assessment for Prevention of Heart Disease and Stroke in Local Health Departments (LHD’s) of Illinois In February 2005, the Illinois Department of Public Health (IDPH) developed a collaboration with the
Illinois Prevention Research Center (IPRC) at the Institute for Health Research and Policy (IHRP) of
the University of Illinois at Chicago (UIC) to assess the heart disease and stroke activities conducted
by local health departments (LHD’s) in Illinois. The assessment was designed to establish the current
state of practices, policies, plans and anticipated needs for individual and community programs for
heart disease and stroke prevention. The assessment was based on a web survey sent to all LHD’s
and designed to be relevant to a wide scope of cardiovascular disease (CVD) and stroke activities
conducted by LHD’s. The survey would result in broad knowledge about current practices, the ability to
share information between LHD’s, and greater capacity to plan for enhanced programs and services.
This report describes the background and purpose for the project, provides a brief review of the
literature, discusses the methodology utilized, and provides preliminary analysis and discussion of the
results of the survey. A set of recommendations is also included.
Background and Purpose
IDPH contracted with the IPRC to plan, implement, analyze, and report on a survey of CVD and stroke
plans and actions conducted by LHD’s in Illinois. Led by the CDC, many states are engaged in similar
assessment efforts, and IDPH and IPRC agreed to design an instrument that could be adapted for use
by other states or health departments. The survey is intended to be comprehensive of contemporary
LHD practices, programs, policies, infrastructure, priorities, and plans for the prevention and control of
CVD and stroke in Illinois. The survey measures the activities and plans of organizations, institutions
and communities, including those conducted by or coordinated through LHD’s. The data collected
through the survey will be shared with respondents to enhance knowledge, improve program
dissemination, and more effectively plan for CVD and stroke control and prevention. Survey results will
also allow IDPH to more effectively plan for future programs and services, coordinate existing efforts,
monitor LHD activities, and seek resources for enhanced programs. Specific objectives include:
• Collect comprehensive current information about CVD and stroke prevention activities
throughout Illinois at the county and sub-county level;
• Assess the priority accorded to CVD and stroke prevention by LHD’s;
8
• Measure the availability of facilities and infrastructure, educational programs, screening
services, and access to heart disease and stroke care at the county level;
• Identify partnerships and collaborative efforts created to facilitate CVD and stroke control and
prevention;
• Establish the availability and nature of blood pressure and cholesterol screening and follow-up;
• Understand emergency response strategies and improvement plans;
• Identify quality improvement strategies, including efforts to reduce disparities;
• Assess county-level CVD and stroke educational efforts for policymakers, providers and
community residents;
• Identify barriers to existing and new CVD and stroke prevention and control activities;
• Design and test a comprehensive CVD and stroke survey instrument capable of measuring
current practices, priorities, infrastructure, and needs that could be adapted for use by other
state health departments or organizations;
• Provide local area information about Illinois that can be shared among health departments to
raise awareness of practices and further improve CVD and stroke control and prevention;
• Provide IDPH with appropriate analysis of the data collected to better understand local
conditions and effectively plan for improvement.
Review of the Literature
Global overview of heart disease and stroke
According to the 2004 World Health Organization (WHO) report, 16.7 million people around the globe
die of cardiovascular diseases (CVD) each year. This is about one-third of all deaths worldwide.
By 2020, heart disease and stroke will become the leading cause of both death and disability in the
world , with the number of fatalities projected to increase to more than 20 million a year, and to more
than 24 million a year by 2030. It is projected that by 2020, chronic diseases will account for almost
three fourths of all deaths (WHO, Geneva, 2003). About half of all deaths from CVD are from coronary
heart disease (CHD), and nearly one-third deaths are from stroke (British Heart Foundation, European
Cardiovascular Disease Statistics, 2000 Edition). These diseases are seen in the most productive
years of life, and those afflicted rarely return to full productivity, particularly after a stroke. In the USA,
the number of years of productive life lost to CVD will increase by 20 % from 2000 to 2030 (2004,
9
Columbia University, New York.). In both developed and developing countries, 40 to 75 percent of all
heart attack victims die before reaching the hospital (Integrated Management of Cardiovascular Risk:
Report of a WHO Meeting, Geneva, July 2002). These figures have enormous public health
implications, as it has been well documented that the lack of awareness of signs and symptoms of
high blood pressure, heart attack and stroke, and delay in seeking treatment is the cause of
preventable morbidity and mortality. According to WHO estimates, 15 million people each year suffer
strokes and, of these, 5 million are left permanently disabled (WHO, 2004). Globally, high blood
pressure accounts for approximately 7.1 million deaths, about 13 percent of the total global fatality.
WHO research indicates that about 62 percent of strokes and 49 percent of heart attacks are caused
by high blood pressure (WHO World Health Report, 2002). Internationally, high blood cholesterol is
estimated to cause about 4.4 million deaths (7.9 percent of total deaths).
Enormity of the Problem in United States
Cardiovascular Diseases
Cardiovascular diseases (CVD) are composed of a spectrum of diseases including high blood
pressure (HBP), coronary heart disease (CHD), myocardial infarction (MI or heart attack), heart failure
(HF), stroke, and congenital cardiovascular defects.
Heart disease and stroke are the most commonly seen chronic diseases in the world, as well as in the
US. The most recent statistics reflect the magnitude of the problem of heart disease and stroke in the
US population (AHA Statistical Update, 2006). High blood pressure has been detected in 65,000,000
Americans. Coronary heart disease (CHD), heart attack, chest pain (angina) and heart failure
collectively account for 31,900,000 cases, and there are 5,500,000 people afflicted with stroke in the
nation. It means that 1 in 3 adults have some form of cardiovascular disease (NHANES 1999–02,
CDC/NCHS). Data from the Framingham Heart Study (FHS) indicate that the lifetime risk for CVD is 2
in 3 for men and more than 1 in 2 for women at age 40.
Prevalence
Statistics released in the Vital Health Statistics report of 2005 (CDC/NHS, 2005) reveal the prevalence
of cardiovascular diseases in people aged 18 and over according to race. The reported racial
prevalence of CVD in the USA is as follows:
10
Among whites only, 11.4% have heart disease, 5.9% have CHD, 20.5% have hypertension, and 2.3%
have had a stroke.
Among blacks or African Americans only, 9.9% have heart disease, 5.3% have CHD, 31.6%
have hypertension, and 3.5% have had a stroke.
Among Hispanics or Latinos, 7.7% have heart disease, 4.5% have CHD, 19.0% have
hypertension, and 2.2% have had a stroke.
Among Asians, 5.6% have heart disease, 3.8% have CHD, 16.1% have hypertension, and
1.8% have had a stroke.
Among Native Hawaiians or other Pacific Islanders, 16.6% have heart disease, 4.9% have
CHD, and 18.2% have hypertension.
Among American Indians or Alaska Natives, 13.8% have heart disease, 8.2% have CHD,
23.9% have hypertension, and 3.1% have had a stroke.
It is evident that African Americans have the highest prevalence of HBP and stroke among all races.
The data also indicate that the African Americans and Whites are more at risk compared to Hispanics,
Asians, and American Indians, though the risk for minorities is compounded by the disparity in
available health care (NCHS, 2005).
Mortality for Cardiovascular Diseases (CVD)
Preliminary mortality data for 2003 demonstrate that CVD was the underlying cause of death in 37.3%
of the total 2,440,000 deaths in the United States, or 1 out of every 2.7 deaths. In addition, CVD was a
contributing cause of death in about 58% of all deaths in 2002. Since 1900, CVD has been the number
one killer in the United States, except in 1918. Nearly 2500 Americans die of CVD each day, an
average of 1 death every 35 seconds. Heart disease and stroke together claim more lives each year
than the next four leading causes of death combined, which are cancer, chronic lower respiratory
diseases, accidents, and diabetes mellitus.
The 2003 overall preliminary death rate from CVD was 308.8/100,000. The rates were 359.1 for white
males and 479.6 for black males, and 256.2 for white females and 354.8 for black females. These
figures reflect a distinct racial disparity for blacks.
According to estimates by CDC/NCHS, eliminating all major forms of CVD would increase life
expectancy by almost 7 years compared to a 3-year gain if all cancers were eliminated. In 2002, 32%

11
of deaths from CVD occurred prematurely i.e. before age 75. In 2001, the proportion of premature
deaths (<65 years) from diseases of the heart was greatest among American Indians or Alaska
Natives (36%) and blacks (31.5%), and lowest among Whites (14.7%). Premature death was higher
for Hispanics (23.5%) than non-Hispanics (16.5%) and for males (24%) compared to females (10%).
Role of EMS and CPR
Myerburg (1993) conducted an epidemiological study of sudden cardiac death and concluded that
about two thirds of unexpected cardiac deaths occur without prior recognition of cardiac disease. In a
study on the role of EMS in treating cardiac emergencies, about 60% of unexpected cardiac deaths
were treated by EMS. The same study concluded that the average proportion of cases of out-of-
hospital cardiac arrest that receive bystander CPR is 27.4% (Nichol et al, 1999). The incidence of
EMS-treated out-of-hospital cardiac arrest is 36/100 000–81/100 000 (Chugh, 2004; Cobb, 2002). This
implies that EMS treats about 107,000 to 240,000 cardiac arrests in the United States annually (AHA,
2006). These figures reflect the importance of training the public in resuscitative measures, and how to
access quick emergency care, to reduce the morbidity and mortality of heart disease.
Risk Factors for CVD
Data from the 2003 Behavior Risk Factor Surveillance System (BRFSS) showed that, in adults age 18
and older, the prevalence of those reporting two or more risk factors for heart disease and stroke
increased with increasing age. The prevalence of having two or more risk factors was highest among
blacks (48.7%) and American Indians/Alaska Natives (46.7%), and lowest among Asians (25.9%);
prevalence was similar in women (36.4%) and men (37.8%). Low socioeconomic status has an
important role in prevalence. Persons reporting household income of $50,000 or more had the lowest
prevalence (28.8%), while those reporting $10,000 or less income had the highest prevalence (52.5%)
(Thom, Feb2006).
The results of the Chicago Heart Association Detection Project , which had an average follow-up of 31
years, showed that in younger women (ages 18–39) with favorable levels for all 5 major risk factors
(blood pressure, serum cholesterol, BMI, diabetes and smoking), the future incidence of CHD and
CVD was rare. Long-term and all-cause mortality were much lower compared with those who had
unfavorable or elevated risk factor levels at young ages. Similar findings applied to men in this study
(Daviglus, 2004; Stamler J, 1999).
12
The Burden of Age
The US Census estimates that there will be 40 million Americans age 65 and older in 2010, and this
number is likely to keep rising as the generation of baby boomers enters this age group. . The
increase in longevity will also add to the number of adults 65 and older. The aging of the population
will indisputably result in an increased incidence of chronic diseases, including coronary artery
disease, heart failure and stroke (Bonow, 2002). As these diseases are the major killers in old age,
much can be done to reduce the prevalence by proper public health efforts on risk counseling and
healthy life-style behaviors, beginning at a young age.
What is more significant is the alarming increase in unattended risk factors in the younger generations,
which will continue to fuel the cardiovascular epidemic for years to come.
Economic implications of CVD
The estimated direct and indirect cost of CVD for 2006 in the US is $403.1 billion (AHA, 2006). This
figure includes health expenditures (direct costs, which include the cost of physicians and other
professionals, hospital and nursing home services, the cost of medications, home health care and
other medical durables), and lost productivity resulting from morbidity and mortality (indirect costs). In
2001, $29.3 billion in program payments were made to Medicare beneficiaries discharged from short-
stay hospitals with a principal diagnosis of cardiovascular disease. That was an average of $8,354 per
discharge (Health Care Financing Review, 2003). In a study of National Hospital Discharge Survey
data of 2001, CVD ranked highest among all disease categories in hospital discharges (NCHS, 2004).
Heart Disease
Risks of Developing Heart Disease
The National Heart, Lung and Blood Institute's (NHLBI) Framingham Heart Study (FHS) has a 44-year
follow-up of participants, and a 20-year follow-up of their offspring, measuring the risks of developing
heart disease (Hurst, 2002). The study points out that CHD comprises more than half of all
cardiovascular events in men and women under age 75.The lifetime risk of developing CHD after age
40 is 49% for men and 32% for women (Lloyd-Jones,1999). The incidence of CHD in women lags
13
behind men by 10 years for total CHD, and by 20 years for more serious clinical events such as
myocardial infarction and sudden death.
Mortality and Morbidity from Heart Disease
The latest American Heart Association statistics reveal that CHD caused one of every five deaths in
the United States in 2003. CHD is the single largest killer of American males and females alike. It is
estimated that one American will suffer a coronary event every 26 seconds, and someone will die from
one approximately every minute. About 40% of the people who experience a coronary attack in a
given year will die from it.
From 1993–2003, the death rate from CHD declined 30.2%, but the actual number of deaths declined
only 14.7%, due to an increase in the older adult population. In 2003, the overall CHD death rate was
162.6 per 100,000 population. The death rates were 209.2/100,000 for white males and 241.1 for
black males; for white females, the rate was 125.1 and for black females, it was 160.3. The 2002
death rates for CHD were 138.3 for Hispanics or Latinos, 114.0 for American Indians or Alaska
Natives, and 98.6 for Asians or Pacific Islanders (Health, United States, 2004). These figures highlight
the very high rates of mortality in both male and female American Africans, and indicate the need for
public health efforts to reduce these glaring disparities. Depending on their gender and clinical
outcome, people who survive the acute stage of a heart attack have a chance of illness and death that
is 1.5–15 times higher than that of the general population. The risk of another heart attack, sudden
death, chest pain, heart failure and stroke—for both men and women—is substantial (FHS, NHLBI).
The projected average number of years of life lost due to a heart attack is 14.2 years (NHLBI).
Risk Factors for Heart Disease
The major risk factors for CHD include high total blood cholesterol levels or current medication with
cholesterol-lowering drugs, hypertension or current medication with blood pressure-lowering drugs,
current cigarette use, and clinical report of diabetes (Greenland et al, 2003). Greenland conducted a
study of men and women in three prospective cohort studies, and found that antecedent major CHD
risk factor exposures were very common among those who developed CHD. It was estimated that
about 90% of the CHD patients had prior exposure to at least one of these risk factors.
Rehabilitation
14
A study conducted by the Mayo Clinic found that cardiac rehabilitation after a heart attack is
underused in the community, and particularly by women and the elderly. Women were 55% less likely
than men to participate in cardiac rehabilitation, and older study patients were less likely than younger
participants to receive these services (Witt, 2004).
Emergency response
A recent community surveillance study in four US communities (McGinn et al, 2005) reported pre-
hospital delay time and use of emergency medical services for patients with acute myocardial
infarction (heart attack, MI). It reported that, in 2000, the overall proportion of persons with delays to
hospital arrival, of four or more hour from onset of symptoms of acute MI, was 49.5%. The study also
reported that there was no statistically significant change in the proportion of patients delaying 4 or
more hours from 1987–2000, indicating that there has been little improvement in the speed at which
patients with MI symptoms arrive at the hospital after onset of the attack.
Stroke
Prevalence
Muntner et al (2002) conducted a study on “Trends in stroke prevalence between 1973 and 1991 in
the US population 25 to 74 years of age.” They estimated that the number of non-institutionalized
stroke survivors increased from 1.5 million to 2.4 million. Statistics from CDC for 1979–2003 indicate
that the number of discharges from short-stay in hospitals, with stroke as the first listed diagnosis,
increased by 29% (National Hospital Discharge Survey, CDC/NCHS).
Incidence
On average, someone in the United States has a stroke every 45 seconds. The National Institute of
Neurological Disorders and Stroke (NINDS) estimates that each year, about 46,000 more women than
men have a stroke (AHA, 2006). Blacks have almost twice the risk of first-ever stroke compared with
whites. The age-adjusted stroke incidence rates (per 100,000) for first-ever strokes are 167 for white
females, 138 for white males, 323 for black females and 260 for black males ( AHA, 2006). The
15
preponderance in black male and females is evident, and the extent of disparity indicates the need for
concentrated intervention at all levels to eliminate the difference.
Disparities in Stroke
The Brain Attack Surveillance in Corpus Christi project (BASIC) clearly demonstrated an increased
incidence of stroke among Mexican Americans compared with non Hispanic (NH) whites in this
community (Morgenstern et al, 2004). The crude cumulative incidence was 168/10,000 in Mexican
Americans and 136/10,000 in NH whites.
Similar data from the Northern Manhattan Study showed the age-adjusted incidence of first ischemic
stroke per 100,000 was 88 in whites, 149 in Hispanics and 191 in blacks (White et al, 2005).
Generally, the risk of a stroke hospitalization was more than 70% greater for blacks than for whites.
Both groups were similar in terms of in-hospital mortality rates (Kennedy, 2002). Men, nonwhites, and
those with lower income and fewer years of education were less likely to be knowledgeable about
transient ischemic attacks, which are a prelude to a stroke (Hill, 2004).
Mortality in Stroke
Stroke accounted for about one of every 15 deaths in the United States in 2003, and is the third most
common cause of death overall. About 50% of these deaths occurred out of hospital. On average,
about every three minutes, someone dies of a stroke in the USA (AHA, 2006). The 2003 overall death
rate for stroke was 54.3/100,000. Death rates were 51.9 for white males and 78.8 for black males; for
white females, it was 50.5 and for black females, the rate was 69.1. The mortality rates are much
higher in blacks compared to whites in both sexes.
Blood pressure (BP) is a powerful determinant of stroke risk. Subjects with BP less than 120/80 mm
Hg have about half the lifetime risk of stroke, compared to subjects with hypertension (Seshadhri, in
Press).
Disability and rehabilitation due to stroke
According to CDC, stroke is a leading cause of serious, long-term disability in the United States
(MMWR. 2001; 50:120–125). The length of time to recover from a stroke depends on its severity, and
15-30% are permanently disabled after a stroke. About 50–70% of stroke survivors regain functional
16
independence, while 20% require institutional care three months after the stroke occurs. Rehabilitation
plays a significant role in extent of recovery.
Delay in Emergency Response
The median time from stroke onset to arrival in an emergency room is between 3 and 6 hours,
according to a study of at least 48 unique reports of prehospital delay time for patients with stroke or
stroke-like symptoms (Evenson, 2001). The epidemiological study incorporated data from 17
countries, including the United States. Improved clinical outcome was observed at three months in
patients with acute ischemic stroke, if intravenous thrombolytic treatment was started within three
hours of the onset of symptoms.
Knowledge of the Signs, Symptoms, and Risk Factors of Stroke
Kothari et al (1997) published a study conducted on patients admitted to an emergency department
with possible stroke, to determine patient’s knowledge of the signs, symptoms, and risk factors of
stroke. 39% of the 163 patients who were in a condition to respond, were not aware of a single sign or
symptom. Patients above age 65 were less likely than those under age 65 to know about a sign or
symptom of stroke (47% versus 28%). Overall, forty-three percent did not know a single risk factor for
stroke. The study concluded that, in general, nearly 40% of patients admitted with a possible stroke
did not know the signs, symptoms, and risk factors of stroke.
Economic implications of Stroke
The estimated direct and indirect cost of stroke for 2006 is $57.9 billion (AHA, 2006).In 2001, it was
estimated that $3.7 billion ($6,037 per discharge) was paid to Medicare beneficiaries discharged from
short-stay hospitals for stroke (Health Care Financing Review, 2003).
High Blood Pressure (HBP)
Definition of HBP
HBP is defined as a systolic pressure of 140 mm Hg or higher or diastolic pressure of 90 mm Hg or
higher; taking antihypertensive medicine; or being told at least twice by a physician or other health
professional that you have HBP. “Prehypertension” is a systolic pressure of 120–139 mm Hg, or
17
diastolic pressure of 80–89 mm Hg, and both not taking antihypertensive medication, or not being told
on 2 occasions by a doctor or other health professional that you have hypertension. These people are
at high risk of developing subsequent hypertension, which can be prevented or delayed by timely
preventive measures.
Prevalence
Nearly one in three adults in the US has HBP (Fields et al, 2004) while about 28% of American adults
age 18 and older, or about 59 million people, have “prehypertension” (NHANES 1999–2002,
CDC/NCHS, NHLBI). In a study conducted by Greenlund et al (2004) on prevalence of heart disease
and stroke risk factors in persons with prehypertension in the United States between 1999–2000, they
found only 39% of persons had normal BP. Nearly 31% were prehypertensive, and 29% were
hypertensive. The age-adjusted prevalence of prehypertension was greater in men (39%) than in
women (23.1%). African Americans ages 20–39 had a higher prevalence of prehypertension (37.4%)
than Whites (32.2%) and Mexican Americans (30.9%).
Disparities in HBP
The prevalence of hypertension in blacks in the United States is among the highest in the world.
Compared with whites, blacks develop HBP earlier in life, and their average blood pressures are much
higher. Consequently, blacks have a 1.3-times greater rate of nonfatal stroke, a 1.8-times greater rate
of fatal stroke, a 1.5-times greater rate of heart disease death, and a 4.2-times greater rate of end-
stage kidney disease compared with whites (JNC 5 and 6).
Mortality in HBP
The latest AHA report (2006) shows that from 1993–2003, the age-adjusted death rate from HBP
increased by 29.3%, and the actual number of deaths rose by 56.1%. The 2003 overall death rate
from HBP was 18.1/100,000. Death rates were 14.9 for white males, 49.7 for black males, 14.5 for
white females, and 40.8 for black females. HBP was the cause of death in a much larger proportion of
blacks compared to whites and other races. It was estimated that as many as 30% of all deaths in
hypertensive black men and 20% of all deaths in hypertensive black women may be due to HBP (JNC
5 and 6).
Awareness and Control of HBP
18
Hajjar et al (2004) analyzed the trends in prevalence, awareness, treatment, and control of
hypertension in the United States between 1988–2000. They found that the rates of control in Mexican
Americans (17.7%) were much lower in comparison to non-Hispanic (NH) whites (33.4%) and NH
blacks (28.1%). Data from NHANES for 1999-2000 (Morbidity Mortality Weekly Report (MMWR)
2005:54) showed that of those people suffering from hypertension, 63.4% were aware of their
condition, 45.3% were under current treatment, 29.3% had it under control, and 70.7% did not have it
controlled.
Adverse Consequences of HBP
It has been estimated that approximately 69% of people who have a first heart attack, 77% who have
a first stroke, and 74% who have heart failure have a BP which is higher than 140/90 mm Hg
(AHA,2006). Further, MacMahon et al (1994) studied the epidemiological association between blood
pressure and stroke. They reported that people with systolic BP of 160 mm Hg or higher and/or
diastolic BP of 95 mm Hg or higher have a Relative Risk for stroke about 4 times greater than for
those with normal BP. The development of heart failure is preceded by hypertension in 91% of cases.
HBP is associated with a two–three times greater risk for developing congestive heart failure (FHS,
NHLBI, Levy et al, 1996).
Economic implications of HBP
The estimated direct and indirect cost of HBP for 2006 is $63.5 billion (AHA, 2006). On the economic
front, HBP caused more visits to doctors than any other condition—just a 10 percent decline in the
number of visits would save $478 million each year. It is estimated that HBP and its complications cost
the U.S. economy more than $100 billion each year (AHA, 2006).
High Blood Cholesterol
Cholesterol is a normally present constituent of the body and carries out several important metabolic
functions. However, if the levels increase beyond a certain limit, they predispose to development of
heart disease and stroke due to deposit of plaques in the blood vessels, which narrows their diameter
and interferes with the blood flow to organs. The Adult Treatment Panel III, 2001 (ATP III) update
19
emphasizes that therapeutic lifestyle changes--low saturated fat and low cholesterol diet, physical
activity, and weight control--remain the cornerstone of treatment for patients with heart attack and
stroke, and the best preventive measure.
Normal Parameters of Blood Cholesterol
According to the Third Report of the National Cholesterol Education Program (NCEP) Expert Panel on
Detection, Evaluation, and Treatment of High Blood Cholesterol in Adults (Adult Treatment Panel III,
2001), everyone age 20 and older should have their cholesterol measured at least once every 5 years.
It is best to have a blood test called a “lipoprotein profile” to find out the cholesterol numbers. The
mean level of Low Density Lipoprotein (LDL) cholesterol for American adults age 20 and older is 123
mg/dL. Levels of 130–159 mg/dL are considered borderline high. Levels of 160–189 mg/dL are
classified as high, and levels of 190 mg/dL and higher are very high.
Prevalence of High Cholesterol
It was estimated that 106.9 million Americans age 20 and older have total blood cholesterol levels of
200 milligrams per deciliter (mg/dL) and higher. Of these, 37.7 million have total blood cholesterol
levels of 240 mg/dL or higher. Among white males, 17.8 percent of men have levels of 240 mg/dL or
higher, compared to 10.6 percent of men among African Americans. These estimates are age-
adjusted (NHANES [1999-2000]; Circulation, 2003: 107:2185-2189; Health United States, 2003,
CDC/NCHS).
Cholesterol Screening Prevalence and Awareness
BRFSS data from 1991–2003 showed that the prevalence of cholesterol screening during the
preceding five years increased from 67.3% in 1991 to 73.1% in 2003. The age-adjusted prevalence of
high blood cholesterol awareness among persons screened increased from 25.3% in 1991 to 31.1% in
2003 (MMWR. 2005; 54; 865–870). According to NHANES 1999–2002, there is a uniformly higher
level of cholesterol in women regardless of age or race.
According to CDC, a population-wide decrease of 10% in total cholesterol levels may result in an
estimated 30% reduction in the incidence of CHD (MMWR. 2000; 49:750–755). Data from NHANES
1999–2002 showed that, overall, 63.3% of participants whose test results indicated high blood
20
cholesterol, or who were taking a cholesterol-lowering medication, had been informed by a
professional that they had high cholesterol.
Adherence to Treatment
Based on data from the Third Report of the Expert Panel on Detection, Evaluation, and Treatment of
High Blood Cholesterol in Adults (Adult Treatment Panel Final Report, 2002), it was found that less
than 50% of people who met the criteria for any kind of lipid-modifying treatment for CHD risk
reduction, actually received it. Less than half of even the highest-risk persons, and even those who
had symptomatic CHD, actually received lipid-lowering treatment. Carrol et al (2005) conducted a 40
year study on “Trends in serum lipids and lipoproteins of adults, 1960–2002”.They found that only
about a third of treated patients were achieving their LDL goal; less than 20% of CHD patients were at
their LDL goal.
Quality of Care
The Institute of Medicine defines quality of care as “the degree to which health services for individuals
and populations increase the likelihood of desired health outcomes and are consistent with current
professional knowledge” (IOM, 2001). Trivedi et al (2005) performed a study of data collected over a
seven-year period from all managed care plans administered by Medicare. While clinical performance
improved on all measures for both white and black enrollees, racial disparities did not show a
decrease for glucose control among patients with diabetes, or for cholesterol control among patients
with cardiovascular disorders.
The plethora of statistics, and the consistency of results derived from multiple national and
international studies, including the Framingham Heart Study in USA, give significant evidence of the
need for concerted public health intervention to reduce the prevalence and incidence of morbidity,
mortality, and racial and socioeconomic disparities due to heart disease and stroke.
Heart Disease in Illinois
Data collected from IDPH Center for Health Statistics indicate that, in an average year, 42,540
Illinoisans will die of Cardiovascular Disease (CVD), which includes heart disease, stroke, and a
spectrum of rarer conditions. Each year, more Illinoisans die from CVD than from cancer, unintentional
21
injuries, lung disease, pneumonia, influenza, and diabetes combined. In other words, each year we
lose the equivalent of a city the size of Belleville, Rock Island or Tinley Park to the ravages of this
disease, which is preventable to a considerable extent by life style modification and early treatment of
high risk factors like hypertension, high blood cholesterol and diabetes. The number of annual deaths
from CVD in Illinois has remained virtually unchanged for the last 10 years, in spite of the recent
advances in treatment. The 2004 NCHS report shows that Illinois is among one of the states with a
second highest overall mortality rate due to heart disease and stroke nation wide (233.2 –
268.0/100,000) (CDC, 2004, National and State Perspectives). An alarming 88 percent of all Illinois
residents possess at least one risk factor for CVD, while almost a third have two risk factors, while 12
percent are afflicted with three, greatly enhancing their predisposition to a heart or brain attack
(stroke).
Heart disease as a cause of death in Illinois is 251.5/100,000, which is higher compared to the
national average of 246.8. Similarly, stroke as a cause of death is higher in Illinois state (58.4)
compared to the national average of 57.7(CDC, 2004, National and State Perspectives).
In 2001, heart disease was the most common cause of death in Illinois, accounting for 30,990 deaths
or 29% of all deaths. The rate of death from heart disease was 48% higher among men than among
women. The mortality rate was between 233.2 – 268.0/100,000(2001 NCHS data). According to
figures on deaths due to diseases of the heart in 2001, by race and ethnicity, the mortality rate was
much higher in blacks compared to any other race((CDC, 2004, National and State Perspectives). The
death rate for whites was 245.8/100,000, blacks was 337.4/100,000, Asian /Pacific Islander was
132.5/100,000, Hispanic was 144.1/100,000 , while there were too few deaths (20 or fewer) to
calculate a stable estimate in American Indian/Alaska Natives.
Stroke in Illinois
In 2001, stroke was the cause of 7,230 deaths, or 7% of all deaths in Illinois. The rate of death from
stroke was 35% higher among blacks than among whites. There is a wide disparity among various
ethnic groups, with blacks having the highest rate with 76/100,000, followed by Whites with
56.4/100,000, Asian /Pacific Islander with 43.4/100,000, and Hispanic with a rate of 38.6/100,000.
Risk Factors for Heart Disease and Stroke in Illinois
22
The latest data from CDC (2004) for prevalence of risk factors for heart disease and stroke in Illinois
show a distinct trend towards the higher side. The details for each risk factor are as follows:
High Blood Pressure
In 2001, 32% of blacks, 27% of multiracial persons, 26% of whites, and 13% of Hispanics reported
having high blood pressure.
High Blood Cholesterol
In 2001, 31% of whites, 30% of blacks, and 18% of Hispanics in Illinois reported having high blood
cholesterol. 30.9 % of the US population on average had high cholesterol, while corresponding figures
for Illinois were 59.3%.
Overweight/Obesity
According to self-reported height and weight in 2001, 71% of blacks, 66% of Hispanics, 57% of whites,
and 37% of Asians/Pacific Islanders were overweight. Compared to the national average of 58.7 %
obese in the total population, 59.3% of all Illinoisans are obese
Physical inactivity
No leisure-time physical activity was reported by 47% of Hispanics, 34% of blacks, 26% of
Asians/Pacific Islanders, and 24% of whites. Compared to the national average of no leisure time
physical activity of 25 % in the population, the figures for Illinois were 28.6 %.
Dietary habits
Eating fewer than five servings of fruits and vegetables per day was reported by 83% of men and 76%
of women in Illinois. Compared to the national average of 75.5%, the figures for Illinois were 79.1%.
Cigarette smoking
In 2002, 26% of men and 20% of women in Illinois reported current cigarette smoking. There was a
1.1% higher rate of adult smoking in Illinois compared to the national average.
Economic Burden of CVD and Stroke in Illinois
The cost to Illinois taxpayers under the Medicaid program totaled more than $240 million annually
(Illinois Health Care Cost Containment Council, 1998).Total inpatient hospital charges for CVD
approached $4 billion annually.
Barriers to Prevention
Barriers to prevention of heart attack and stroke as well as its risk factors include cultural norms and
dietary habits; insufficient attention to health education by health care practitioners and lack of
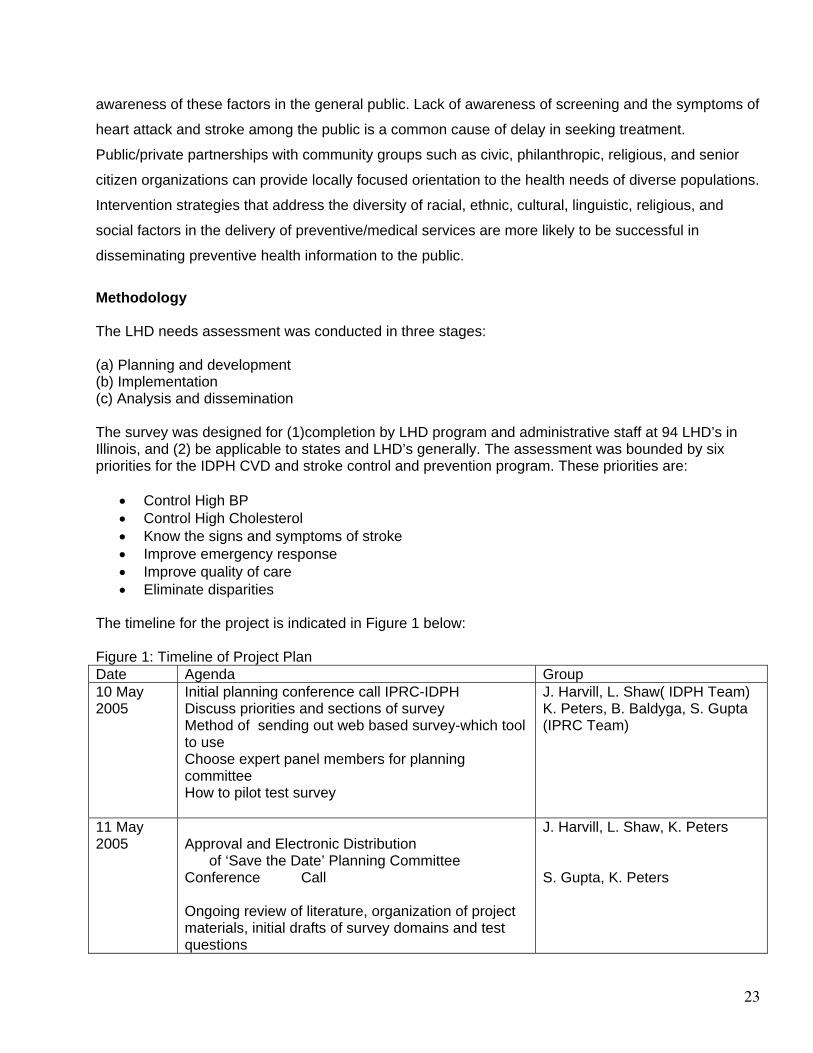
23
awareness of these factors in the general public. Lack of awareness of screening and the symptoms of
heart attack and stroke among the public is a common cause of delay in seeking treatment.
Public/private partnerships with community groups such as civic, philanthropic, religious, and senior
citizen organizations can provide locally focused orientation to the health needs of diverse populations.
Intervention strategies that address the diversity of racial, ethnic, cultural, linguistic, religious, and
social factors in the delivery of preventive/medical services are more likely to be successful in
disseminating preventive health information to the public.
Methodology The LHD needs assessment was conducted in three stages: (a) Planning and development (b) Implementation (c) Analysis and dissemination The survey was designed for (1)completion by LHD program and administrative staff at 94 LHD’s in Illinois, and (2) be applicable to states and LHD’s generally. The assessment was bounded by six priorities for the IDPH CVD and stroke control and prevention program. These priorities are:
• Control High BP • Control High Cholesterol • Know the signs and symptoms of stroke • Improve emergency response • Improve quality of care • Eliminate disparities
The timeline for the project is indicated in Figure 1 below: Figure 1: Timeline of Project Plan Date Agenda Group 10 May 2005
Initial planning conference call IPRC-IDPH Discuss priorities and sections of survey Method of sending out web based survey-which tool to use Choose expert panel members for planning committee How to pilot test survey
J. Harvill, L. Shaw( IDPH Team) K. Peters, B. Baldyga, S. Gupta (IPRC Team)
11 May 2005
Approval and Electronic Distribution of ‘Save the Date’ Planning Committee Conference Call Ongoing review of literature, organization of project materials, initial drafts of survey domains and test questions
J. Harvill, L. Shaw, K. Peters S. Gupta, K. Peters
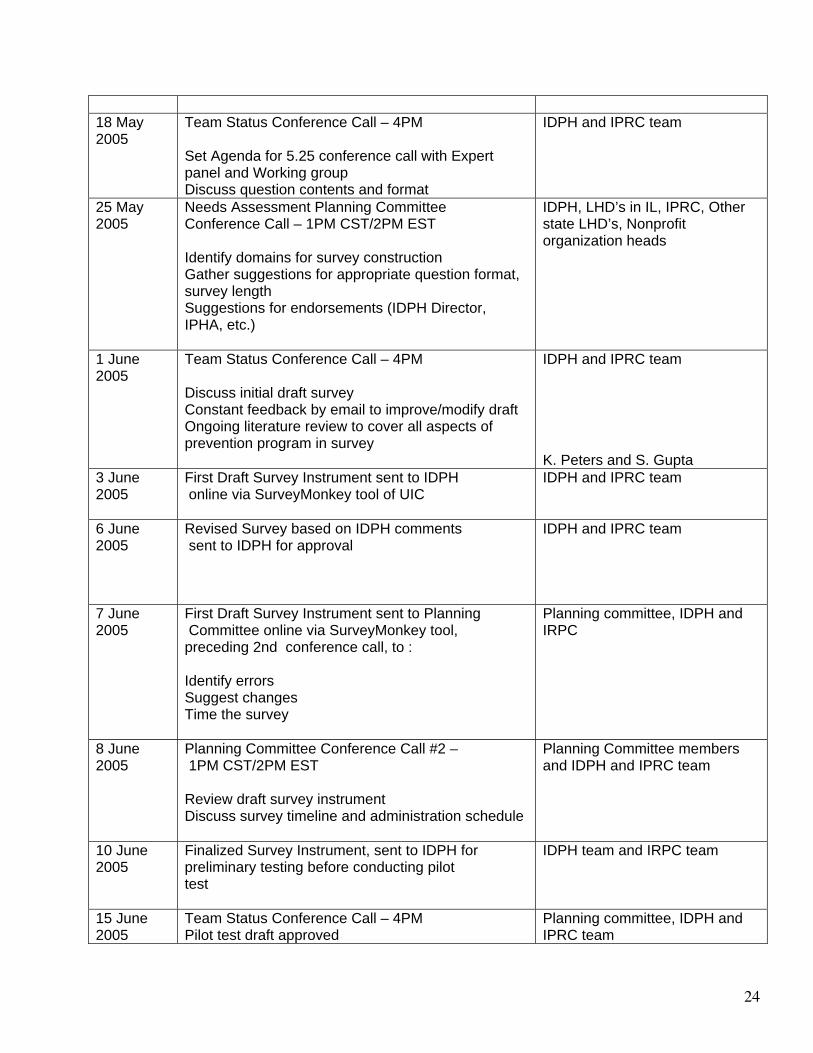
24
18 May 2005
Team Status Conference Call – 4PM Set Agenda for 5.25 conference call with Expert panel and Working group Discuss question contents and format
IDPH and IPRC team
25 May 2005
Needs Assessment Planning Committee Conference Call – 1PM CST/2PM EST Identify domains for survey construction Gather suggestions for appropriate question format, survey length Suggestions for endorsements (IDPH Director, IPHA, etc.)
IDPH, LHD’s in IL, IPRC, Other state LHD’s, Nonprofit organization heads
1 June 2005
Team Status Conference Call – 4PM Discuss initial draft survey Constant feedback by email to improve/modify draft Ongoing literature review to cover all aspects of prevention program in survey
IDPH and IPRC team K. Peters and S. Gupta
3 June 2005
First Draft Survey Instrument sent to IDPH online via SurveyMonkey tool of UIC
IDPH and IPRC team
6 June 2005
Revised Survey based on IDPH comments sent to IDPH for approval
IDPH and IPRC team
7 June 2005
First Draft Survey Instrument sent to Planning Committee online via SurveyMonkey tool, preceding 2nd conference call, to : Identify errors Suggest changes Time the survey
Planning committee, IDPH and IRPC
8 June 2005
Planning Committee Conference Call #2 – 1PM CST/2PM EST Review draft survey instrument Discuss survey timeline and administration schedule
Planning Committee members and IDPH and IPRC team
10 June 2005
Finalized Survey Instrument, sent to IDPH for preliminary testing before conducting pilot test
IDPH team and IRPC team
15 June 2005
Team Status Conference Call – 4PM Pilot test draft approved
Planning committee, IDPH and IPRC team
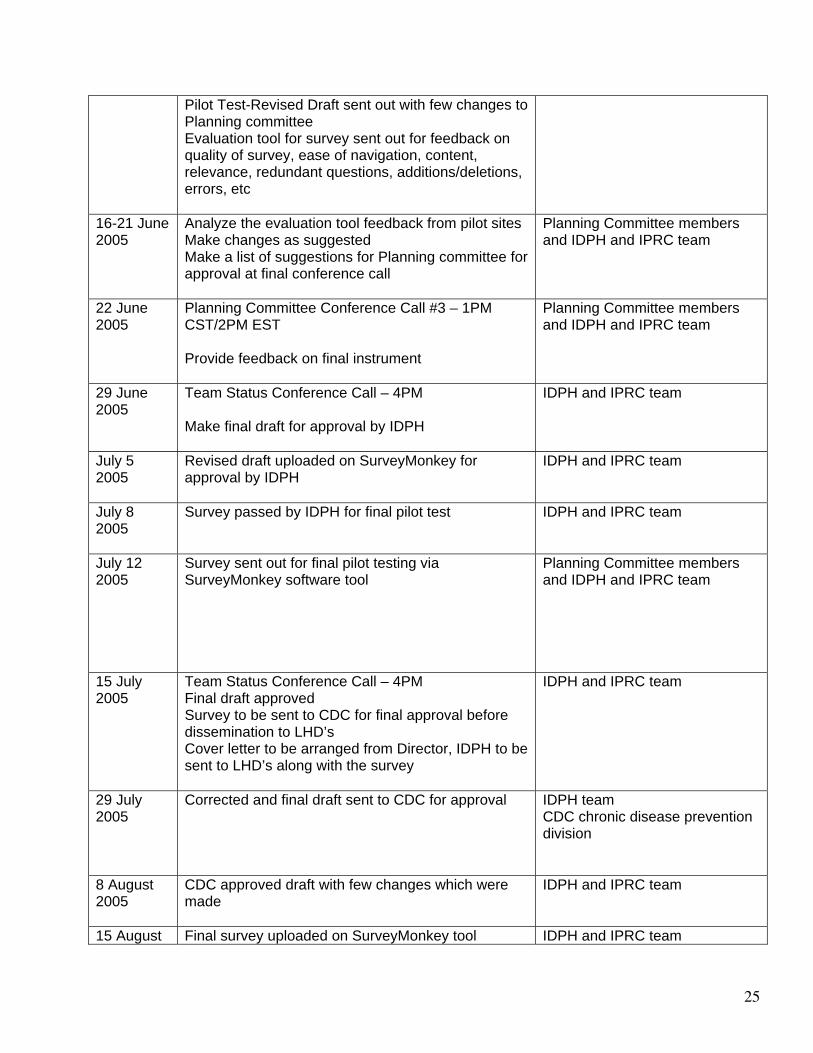
25
Pilot Test-Revised Draft sent out with few changes to Planning committee Evaluation tool for survey sent out for feedback on quality of survey, ease of navigation, content, relevance, redundant questions, additions/deletions, errors, etc
16-21 June 2005
Analyze the evaluation tool feedback from pilot sites Make changes as suggested Make a list of suggestions for Planning committee for approval at final conference call
Planning Committee members and IDPH and IPRC team
22 June 2005
Planning Committee Conference Call #3 – 1PM CST/2PM EST Provide feedback on final instrument
Planning Committee members and IDPH and IPRC team
29 June 2005
Team Status Conference Call – 4PM Make final draft for approval by IDPH
IDPH and IPRC team
July 5 2005
Revised draft uploaded on SurveyMonkey for approval by IDPH
IDPH and IPRC team
July 8 2005
Survey passed by IDPH for final pilot test IDPH and IPRC team
July 12 2005
Survey sent out for final pilot testing via SurveyMonkey software tool
Planning Committee members and IDPH and IPRC team
15 July 2005
Team Status Conference Call – 4PM Final draft approved Survey to be sent to CDC for final approval before dissemination to LHD’s Cover letter to be arranged from Director, IDPH to be sent to LHD’s along with the survey
IDPH and IPRC team
29 July 2005
Corrected and final draft sent to CDC for approval
IDPH team CDC chronic disease prevention division
8 August 2005
CDC approved draft with few changes which were made
IDPH and IPRC team
15 August Final survey uploaded on SurveyMonkey tool IDPH and IPRC team
26
2005 Cover letter from Director, IDPH requesting the LHD’s to complete the survey attached to email Cover letter containing instructions about the survey and the url to access the survey sent out to all 94 LHD’s Early response incentive included in survey to encourage prompt reply
Survey Planning and Development Based on initial discussions between Julie Harvill, Administrator, Illinois Heart Disease and Stroke Prevention Program, Division of Chronic Disease Prevention and Control, Illinois Department of Public Health, and Drs. Peters and Baldyga, IPRC, UIC, a Working Group was organized. The Working Group consisted of those already named, and also included Dr. Sunanda Gupta, Research Specialist, IPRC, UIC, as well as Lynette E. Shaw, Health Educator, and Julie B. Doetsch, Data Analyst, both of the Illinois Heart Disease and Stroke Prevention Program, Division of Chronic Disease Prevention and Control, IDPH, to further develop and monitor the project (Appendix A). The Working Group scheduled weekly calls for project development and monitoring and organized input from additional sources. Initial activities included establishing survey objectives and parameters, reviewing the results of the efforts of other states and CDC, and understanding the intended uses of the survey data. The Working Group identified the need to empanel a Planning Committee to broaden core expertise, assure relevancy of survey approaches and broaden applicability of products. The Working Group established an initial plan for the project, which was modified as appropriate throughout the project. The IPRC staff was responsible for overall planning and for executing production of the plan, including preparation of working drafts of all materials and the final draft for web-based administration. They established and maintained internet communications about the process and interim products to make the material accessible and to encourage broad-based input. A planning committee composed of 22 public health leaders drawn from IDPH, the UIC academic community, CDC, advocacy organizations, and other state CVD/stroke prevention programs was formed (Appendix B). The list of Planning Committee members, with their designations and organizations to which they belong, is attached (Appendix C). The expertise of program leaders from other states who had prior experience conducting CVD and stroke assessments was critical to the evaluation of the validity of questions and pilot testing of the survey. A wide variety of experts and perspectives provided a comprehensive question pool for survey development. Three conference calls with the expert panel were conducted. Confirmatory letters with agendas preceded the calls. Survey development was informed by a literature review and environmental scan of the current public health policies and practices for CVD and stroke prevention and control in Illinois, other states, and at the national and international level. The reviews informed the viewpoints shaping project activities, the understanding of the scope of the issues, identification of survey domains for discussion, and the drafting of initial questions. Of particular importance were questionnaires developed by other states, the World Health Organization [The WHO STEPwise approach to Surveillance of non-communicable diseases (STEPS)], and international agencies like the G8 Promoting Heart Health, Canada consisting of the Consortium of G8 nations. The tools and programs studied to design the survey can be seen in Appendix D. Initially, 120 questions were drafted to explore the six IDPH state prevention and control program priorities and to provide an overview of current program status. Three conference calls were conducted with the Planning Committee to complete a final draft questionnaire:

27
• An initial briefing call to address the charge to the committee, provide background information,
and acquire suggestions for questions and priorities was conducted first. After this call, an initial draft survey instrument was forwarded to participants who were asked to prepare comments for discussion.
• The second call ‘brainstormed’ the draft questions and resulted in multiple deletions, additions, and modifications to the initial draft. A revised survey and evaluation instrument (Appendix E) were prepared and distributed to the Planning Committee for further discussion.
• The final Planning Committee call was convened to discuss the feedback received on the evaluation (Appendix F), and to finalize the questions and organization of the survey.
After this call, the Working Group prepared and reviewed a final draft questionnaire, in an interactive process that culminated in the questionnaire that was administered in the pre-test. Pre-test of Survey Final draft questions were entered in the ‘SurveyMonkey’ website. SurveyMonkey is software available at the UIC website for designing and disseminating online surveys and data collection. It is an excellent tool for gathering, analyzing and exporting data into Excel. It has the advantage of being user friendly, paper free, and has an easy-to-set up interface with excellent back-end reporting functionality. It offers several valuable formats for asking questions: simple dichotomous, multiple choice, simple matrix, multiple matrixes, open-ended and Likert scale. It also permits us to randomize answer choices to eliminate "order bias,” has skip logic, permits compulsory questions, and offers customizing color and font themes. ‘Filter Results’ is a feature that helps to find specific patterns in the results. The URL to the survey, http://www.surveymonkey.com/s.asp?u=561851196289, was emailed to the Working Group and 22 Planning Committee members to complete the survey online and provide comments on the attached evaluation instrument. After two weeks, the comments received were discussed by the Working Group and incorporated, as appropriate, into the final instrument. The final questionnaire was sent to Belinda O. Minta, Public Health Educator, Cardiovascular Health Branch, Centers for Disease Control and Prevention for review and comment with the evaluation instrument (Appendix G). Survey Implementation The final survey consisted of 59 questions. Response choices included dichotomous, multiple choice, response matrices, Likert scales, and open-ended responses. The survey was comprised of 10 sections with the following characteristics:
1. General introductory questions—responses indicate who completed the survey, agency characteristics, agency priorities, collaborators, educational activities, and communication strategies (Q1-13).
2. Screening for High Blood Pressure (HBP)—this section has questions pertaining to the methods and collaborations used to conduct blood pressure screening and follow-up, educational materials used, populations covered, and training received to conduct screening/train others to provide screening (Q14-24).
3. Screening for Cholesterol—this section has questions pertaining to the methods and collaborations used to conduct cholesterol screening and follow-up, educational materials used, populations covered, and training received to conduct screening/train others to provide screening (Q25-34).
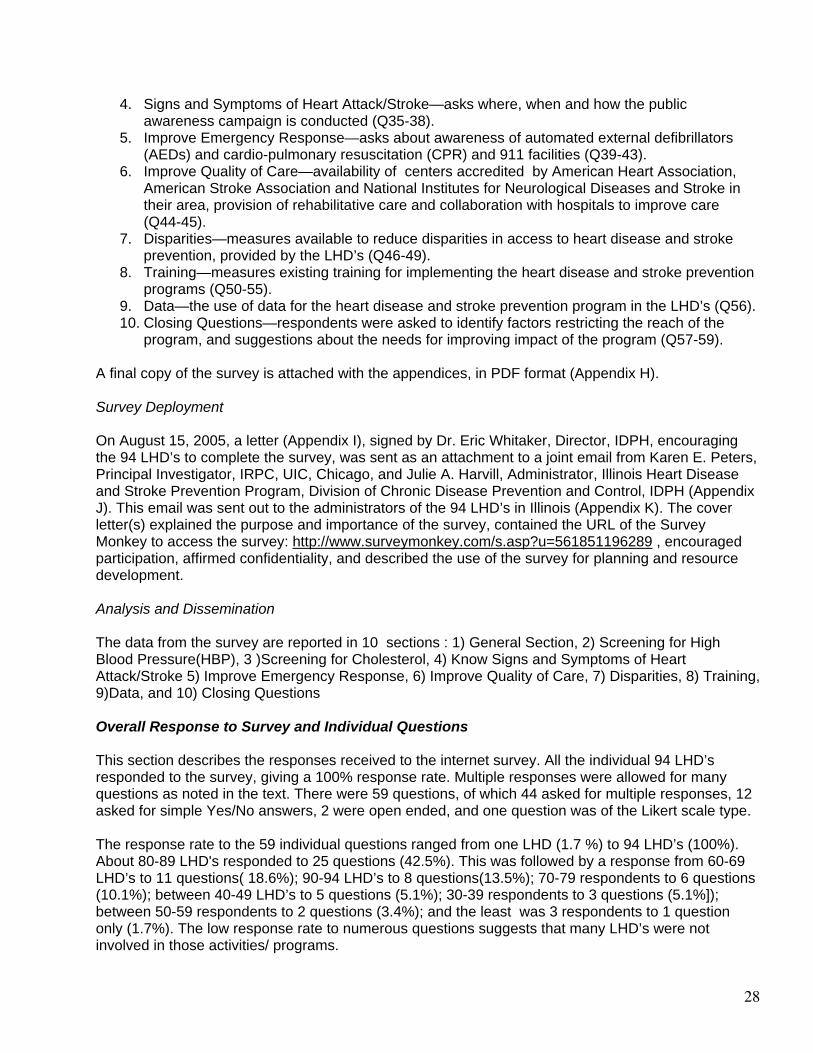
28
4. Signs and Symptoms of Heart Attack/Stroke—asks where, when and how the public awareness campaign is conducted (Q35-38).
5. Improve Emergency Response—asks about awareness of automated external defibrillators (AEDs) and cardio-pulmonary resuscitation (CPR) and 911 facilities (Q39-43).
6. Improve Quality of Care—availability of centers accredited by American Heart Association, American Stroke Association and National Institutes for Neurological Diseases and Stroke in their area, provision of rehabilitative care and collaboration with hospitals to improve care (Q44-45).
7. Disparities—measures available to reduce disparities in access to heart disease and stroke prevention, provided by the LHD’s (Q46-49).
8. Training—measures existing training for implementing the heart disease and stroke prevention programs (Q50-55).
9. Data—the use of data for the heart disease and stroke prevention program in the LHD’s (Q56). 10. Closing Questions—respondents were asked to identify factors restricting the reach of the
program, and suggestions about the needs for improving impact of the program (Q57-59). A final copy of the survey is attached with the appendices, in PDF format (Appendix H). Survey Deployment On August 15, 2005, a letter (Appendix I), signed by Dr. Eric Whitaker, Director, IDPH, encouraging the 94 LHD’s to complete the survey, was sent as an attachment to a joint email from Karen E. Peters, Principal Investigator, IRPC, UIC, Chicago, and Julie A. Harvill, Administrator, Illinois Heart Disease and Stroke Prevention Program, Division of Chronic Disease Prevention and Control, IDPH (Appendix J). This email was sent out to the administrators of the 94 LHD’s in Illinois (Appendix K). The cover letter(s) explained the purpose and importance of the survey, contained the URL of the Survey Monkey to access the survey: http://www.surveymonkey.com/s.asp?u=561851196289 , encouraged participation, affirmed confidentiality, and described the use of the survey for planning and resource development. Analysis and Dissemination The data from the survey are reported in 10 sections : 1) General Section, 2) Screening for High Blood Pressure(HBP), 3 )Screening for Cholesterol, 4) Know Signs and Symptoms of Heart Attack/Stroke 5) Improve Emergency Response, 6) Improve Quality of Care, 7) Disparities, 8) Training, 9)Data, and 10) Closing Questions Overall Response to Survey and Individual Questions This section describes the responses received to the internet survey. All the individual 94 LHD’s responded to the survey, giving a 100% response rate. Multiple responses were allowed for many questions as noted in the text. There were 59 questions, of which 44 asked for multiple responses, 12 asked for simple Yes/No answers, 2 were open ended, and one question was of the Likert scale type. The response rate to the 59 individual questions ranged from one LHD (1.7 %) to 94 LHD’s (100%). About 80-89 LHD's responded to 25 questions (42.5%). This was followed by a response from 60-69 LHD’s to 11 questions( 18.6%); 90-94 LHD’s to 8 questions(13.5%); 70-79 respondents to 6 questions (10.1%); between 40-49 LHD’s to 5 questions (5.1%); 30-39 respondents to 3 questions (5.1%]); between 50-59 respondents to 2 questions (3.4%); and the least was 3 respondents to 1 question only (1.7%). The low response rate to numerous questions suggests that many LHD’s were not involved in those activities/ programs.
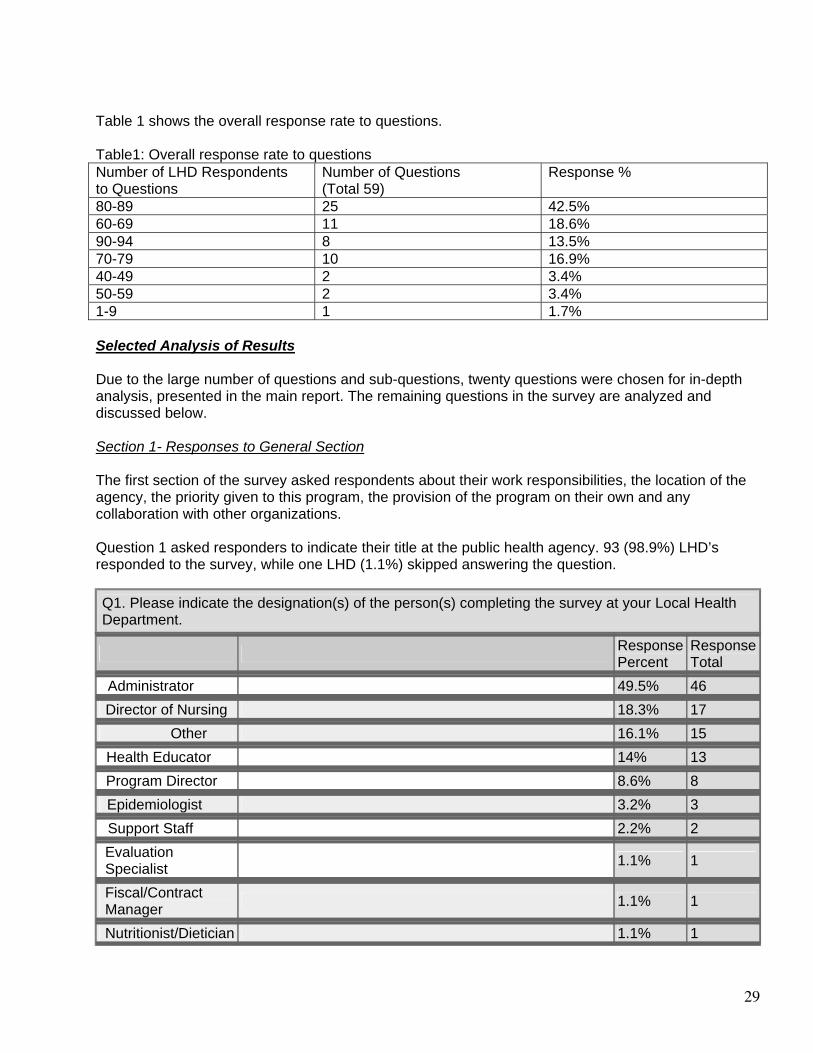
29
Table 1 shows the overall response rate to questions. Table1: Overall response rate to questions Number of LHD Respondents to Questions
Number of Questions (Total 59)
Response %
80-89 25 42.5% 60-69 11 18.6% 90-94 8 13.5% 70-79 10 16.9% 40-49 2 3.4% 50-59 2 3.4% 1-9 1 1.7% Selected Analysis of Results Due to the large number of questions and sub-questions, twenty questions were chosen for in-depth analysis, presented in the main report. The remaining questions in the survey are analyzed and discussed below. Section 1- Responses to General Section The first section of the survey asked respondents about their work responsibilities, the location of the agency, the priority given to this program, the provision of the program on their own and any collaboration with other organizations. Question 1 asked responders to indicate their title at the public health agency. 93 (98.9%) LHD’s responded to the survey, while one LHD (1.1%) skipped answering the question.
Q1. Please indicate the designation(s) of the person(s) completing the survey at your Local Health Department.
Response Percent
Response Total
Administrator 49.5% 46
Director of Nursing 18.3% 17 Other 16.1% 15
Health Educator 14% 13
Program Director 8.6% 8
Epidemiologist 3.2% 3
Support Staff 2.2% 2
Evaluation Specialist
1.1% 1
Fiscal/Contract Manager
1.1% 1
Nutritionist/Dietician 1.1% 1
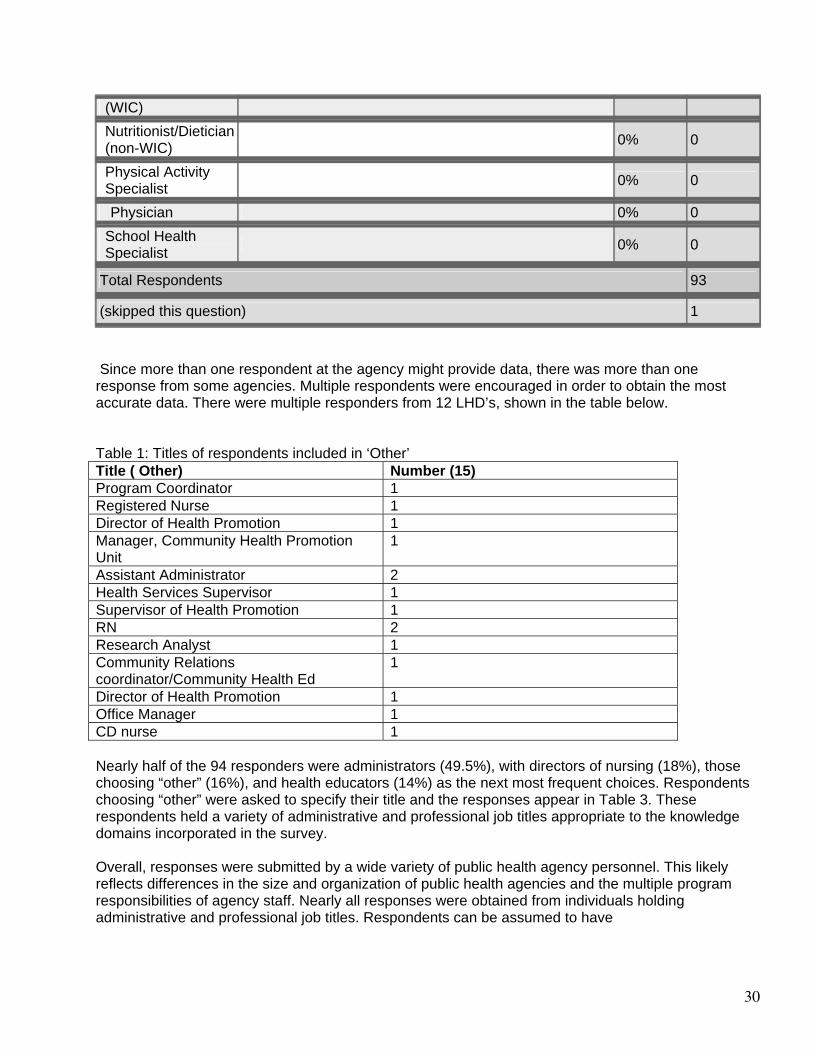
30
(WIC)
Nutritionist/Dietician (non-WIC)
0% 0
Physical Activity Specialist
0% 0
Physician 0% 0
School Health Specialist
0% 0
Total Respondents 93
(skipped this question) 1 Since more than one respondent at the agency might provide data, there was more than one response from some agencies. Multiple respondents were encouraged in order to obtain the most accurate data. There were multiple responders from 12 LHD’s, shown in the table below. Table 1: Titles of respondents included in ‘Other’ Title ( Other) Number (15) Program Coordinator 1 Registered Nurse 1 Director of Health Promotion 1 Manager, Community Health Promotion Unit
1
Assistant Administrator 2 Health Services Supervisor 1 Supervisor of Health Promotion 1 RN 2 Research Analyst 1 Community Relations coordinator/Community Health Ed
1
Director of Health Promotion 1 Office Manager 1 CD nurse 1 Nearly half of the 94 responders were administrators (49.5%), with directors of nursing (18%), those choosing “other” (16%), and health educators (14%) as the next most frequent choices. Respondents choosing “other” were asked to specify their title and the responses appear in Table 3. These respondents held a variety of administrative and professional job titles appropriate to the knowledge domains incorporated in the survey. Overall, responses were submitted by a wide variety of public health agency personnel. This likely reflects differences in the size and organization of public health agencies and the multiple program responsibilities of agency staff. Nearly all responses were obtained from individuals holding administrative and professional job titles. Respondents can be assumed to have
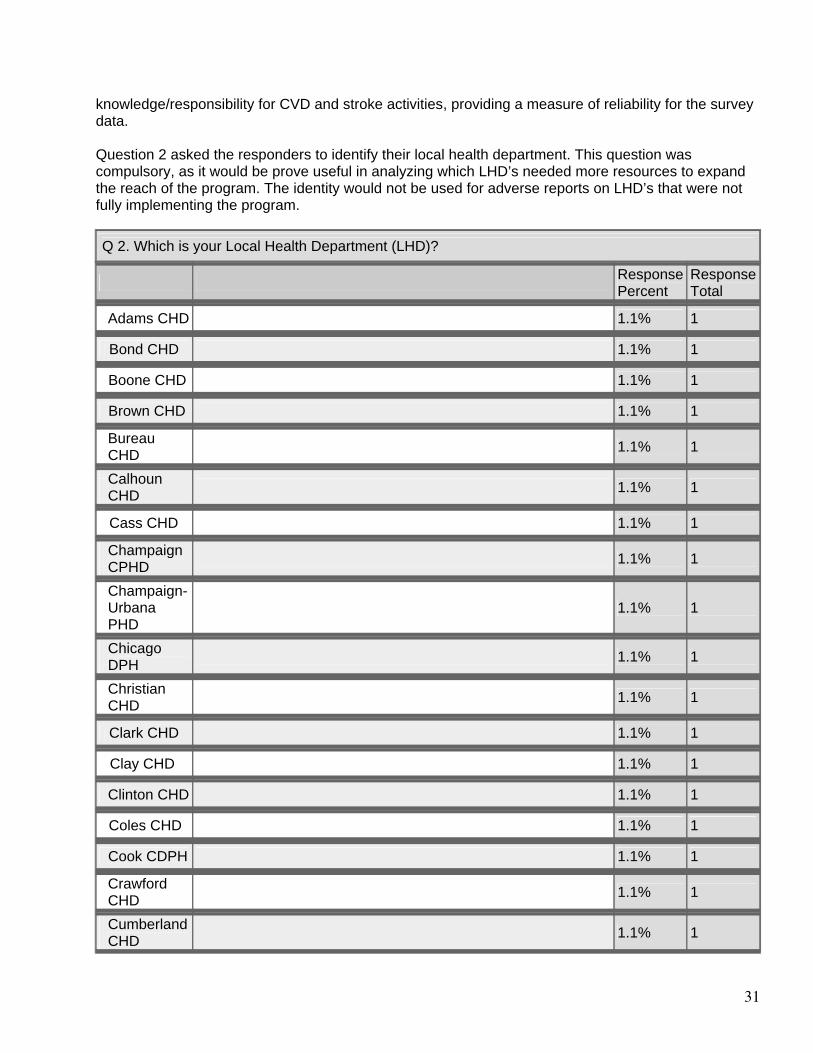
31
knowledge/responsibility for CVD and stroke activities, providing a measure of reliability for the survey data. Question 2 asked the responders to identify their local health department. This question was compulsory, as it would be prove useful in analyzing which LHD’s needed more resources to expand the reach of the program. The identity would not be used for adverse reports on LHD’s that were not fully implementing the program.
Q 2. Which is your Local Health Department (LHD)?
Response Percent
Response Total
Adams CHD 1.1% 1
Bond CHD 1.1% 1
Boone CHD 1.1% 1
Brown CHD 1.1% 1
Bureau CHD
1.1% 1
Calhoun CHD
1.1% 1
Cass CHD 1.1% 1
Champaign CPHD
1.1% 1
Champaign-Urbana PHD
1.1% 1
Chicago DPH
1.1% 1
Christian CHD
1.1% 1
Clark CHD 1.1% 1
Clay CHD 1.1% 1
Clinton CHD 1.1% 1
Coles CHD 1.1% 1
Cook CDPH 1.1% 1
Crawford CHD
1.1% 1
Cumberland CHD
1.1% 1
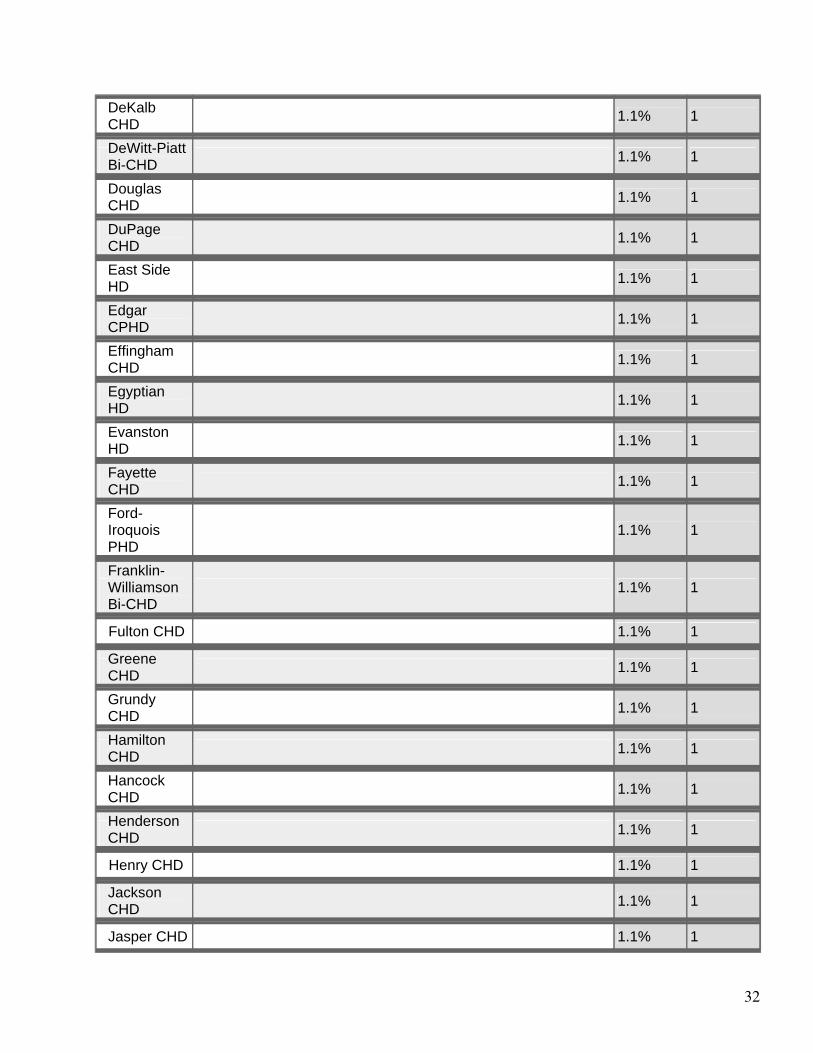
32
DeKalb CHD
1.1% 1
DeWitt-Piatt Bi-CHD
1.1% 1
Douglas CHD
1.1% 1
DuPage CHD
1.1% 1
East Side HD
1.1% 1
Edgar CPHD
1.1% 1
Effingham CHD
1.1% 1
Egyptian HD
1.1% 1
Evanston HD
1.1% 1
Fayette CHD
1.1% 1
Ford-Iroquois PHD
1.1% 1
Franklin-Williamson Bi-CHD
1.1% 1
Fulton CHD 1.1% 1
Greene CHD
1.1% 1
Grundy CHD
1.1% 1
Hamilton CHD
1.1% 1
Hancock CHD
1.1% 1
Henderson CHD
1.1% 1
Henry CHD 1.1% 1
Jackson CHD
1.1% 1
Jasper CHD 1.1% 1
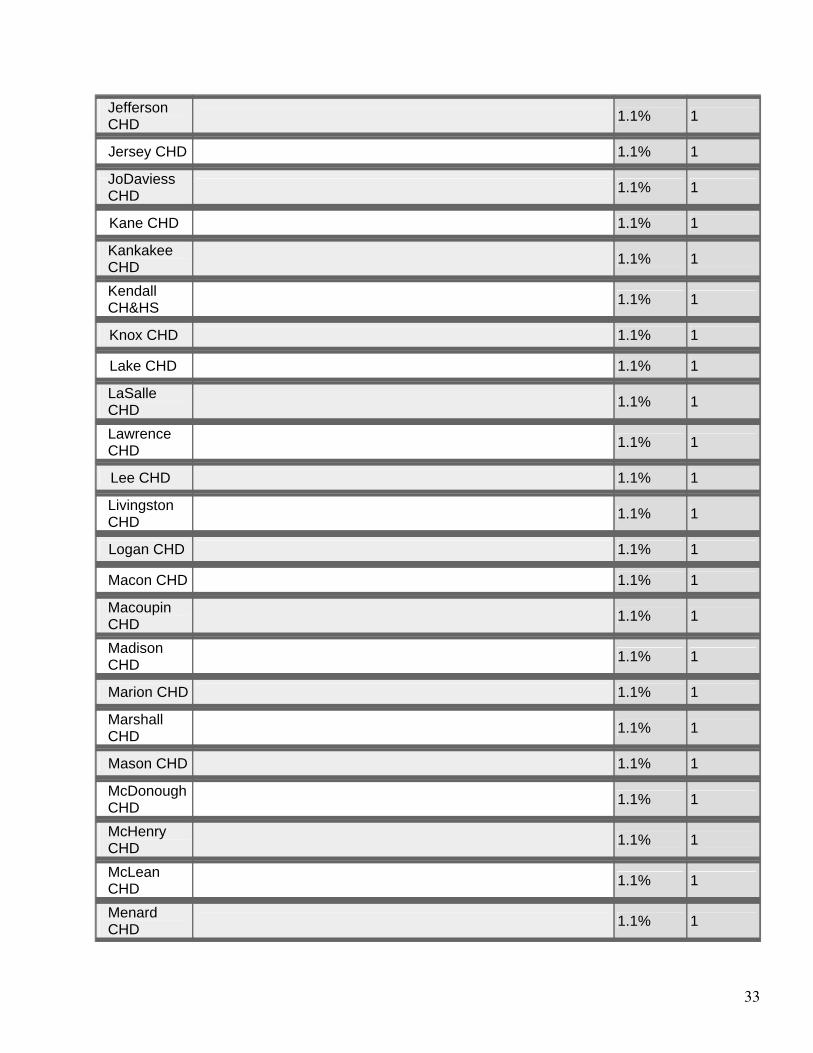
33
Jefferson CHD
1.1% 1
Jersey CHD 1.1% 1
JoDaviess CHD
1.1% 1
Kane CHD 1.1% 1
Kankakee CHD
1.1% 1
Kendall CH&HS
1.1% 1
Knox CHD 1.1% 1
Lake CHD 1.1% 1
LaSalle CHD
1.1% 1
Lawrence CHD
1.1% 1
Lee CHD 1.1% 1
Livingston CHD
1.1% 1
Logan CHD 1.1% 1
Macon CHD 1.1% 1
Macoupin CHD
1.1% 1
Madison CHD
1.1% 1
Marion CHD 1.1% 1
Marshall CHD
1.1% 1
Mason CHD 1.1% 1
McDonough CHD
1.1% 1
McHenry CHD
1.1% 1
McLean CHD
1.1% 1
Menard CHD
1.1% 1
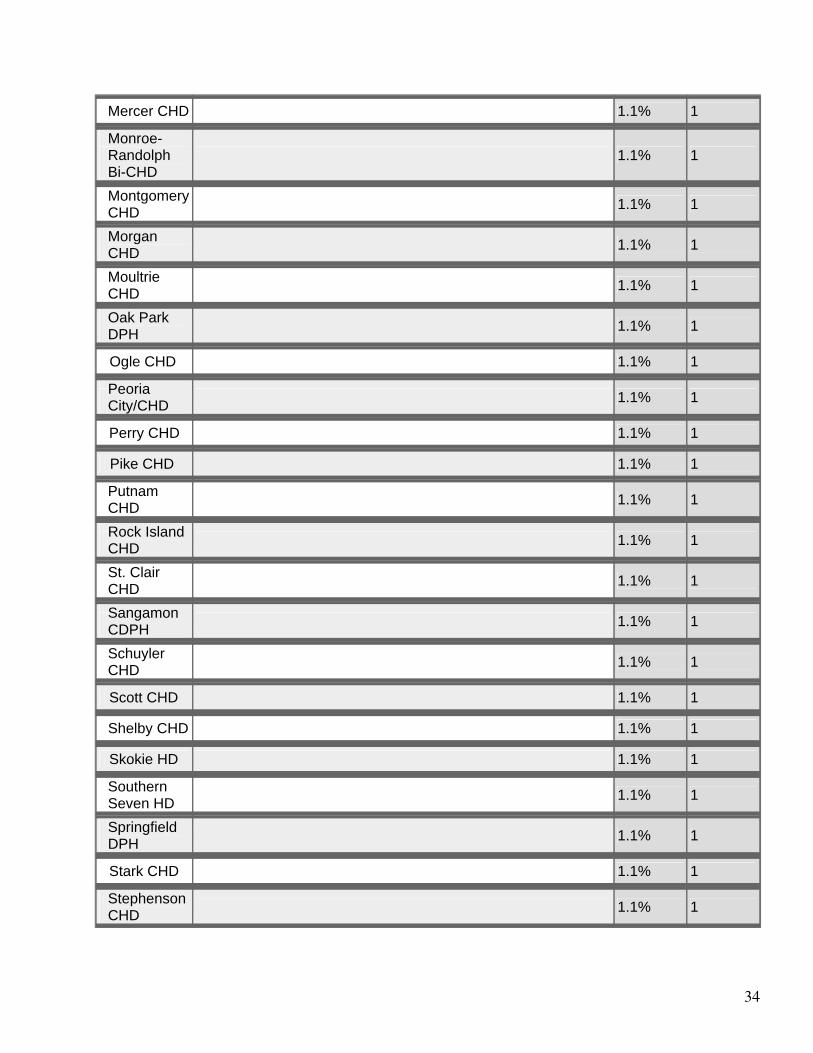
34
Mercer CHD 1.1% 1
Monroe-Randolph Bi-CHD
1.1% 1
Montgomery CHD
1.1% 1
Morgan CHD
1.1% 1
Moultrie CHD
1.1% 1
Oak Park DPH
1.1% 1
Ogle CHD 1.1% 1
Peoria City/CHD
1.1% 1
Perry CHD 1.1% 1
Pike CHD 1.1% 1
Putnam CHD
1.1% 1
Rock Island CHD
1.1% 1
St. Clair CHD
1.1% 1
Sangamon CDPH
1.1% 1
Schuyler CHD
1.1% 1
Scott CHD 1.1% 1
Shelby CHD 1.1% 1
Skokie HD 1.1% 1
Southern Seven HD
1.1% 1
Springfield DPH
1.1% 1
Stark CHD 1.1% 1
Stephenson CHD
1.1% 1
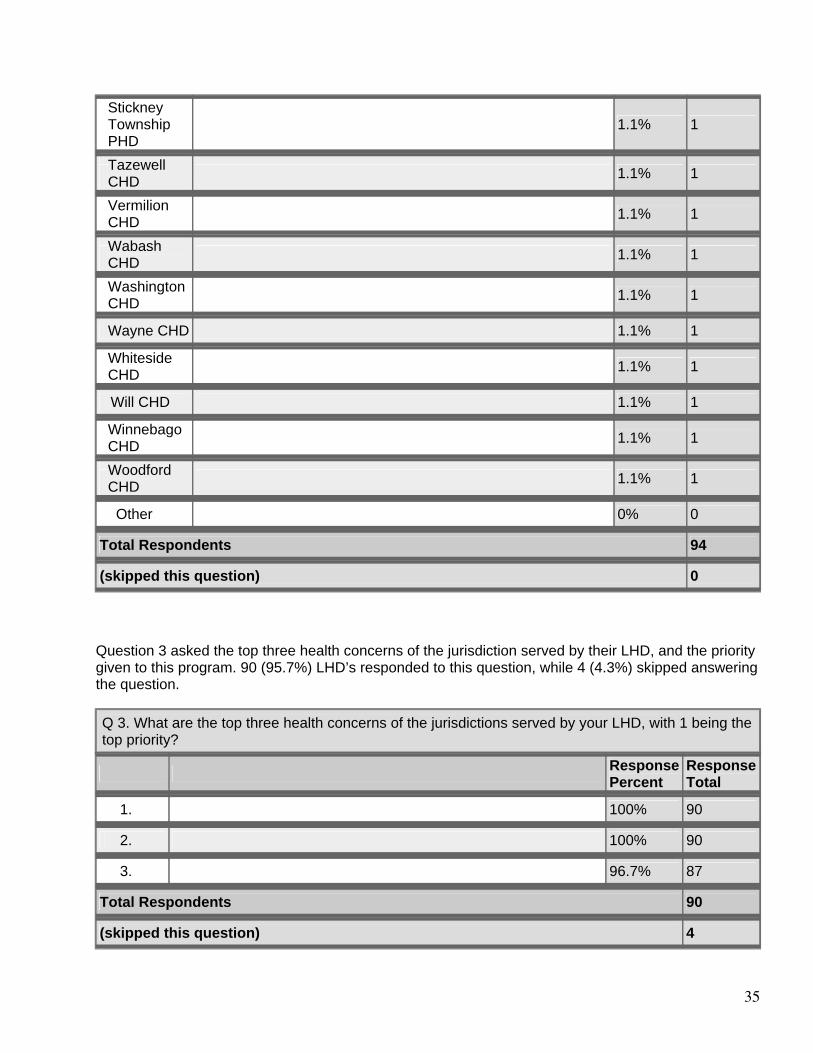
35
Stickney Township PHD
1.1% 1
Tazewell CHD
1.1% 1
Vermilion CHD
1.1% 1
Wabash CHD
1.1% 1
Washington CHD
1.1% 1
Wayne CHD 1.1% 1
Whiteside CHD
1.1% 1
Will CHD 1.1% 1
Winnebago CHD
1.1% 1
Woodford CHD
1.1% 1
Other 0% 0
Total Respondents 94
(skipped this question) 0 Question 3 asked the top three health concerns of the jurisdiction served by their LHD, and the priority given to this program. 90 (95.7%) LHD’s responded to this question, while 4 (4.3%) skipped answering the question.
Q 3. What are the top three health concerns of the jurisdictions served by your LHD, with 1 being the top priority?
Response Percent
Response Total
1. 100% 90
2. 100% 90
3. 96.7% 87
Total Respondents 90
(skipped this question) 4
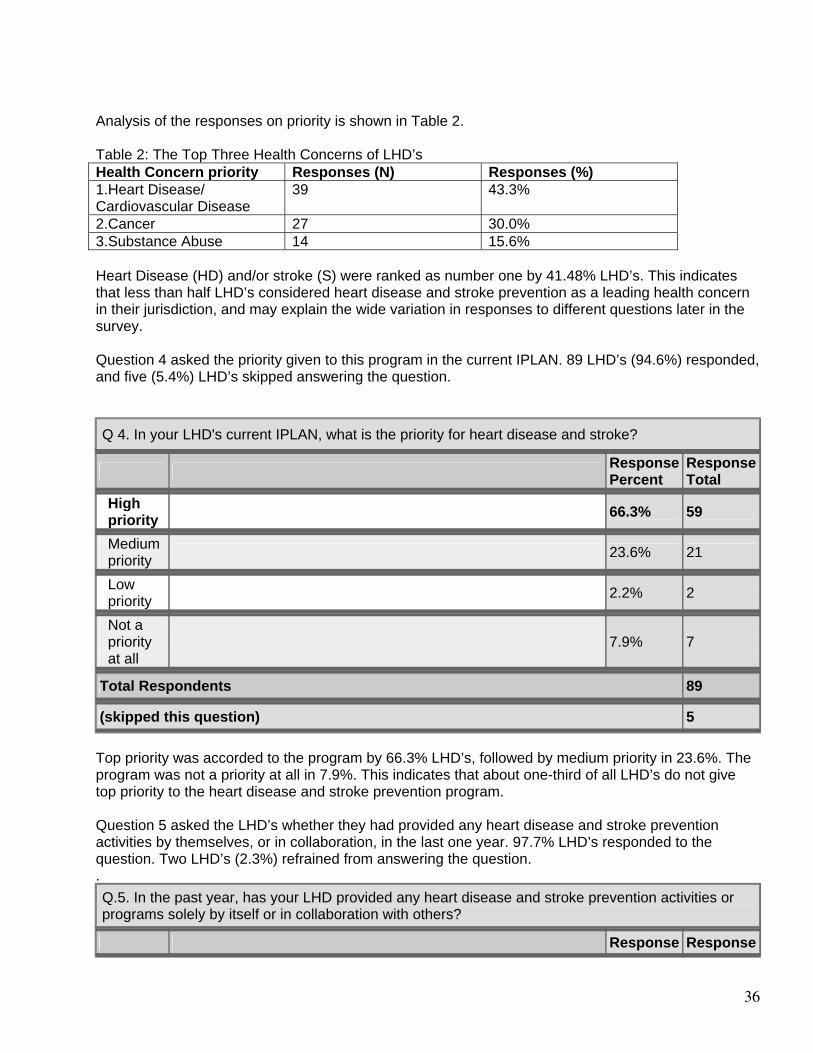
36
Analysis of the responses on priority is shown in Table 2. Table 2: The Top Three Health Concerns of LHD’s Health Concern priority Responses (N) Responses (%) 1.Heart Disease/ Cardiovascular Disease
39 43.3%
2.Cancer 27 30.0% 3.Substance Abuse 14 15.6% Heart Disease (HD) and/or stroke (S) were ranked as number one by 41.48% LHD’s. This indicates that less than half LHD’s considered heart disease and stroke prevention as a leading health concern in their jurisdiction, and may explain the wide variation in responses to different questions later in the survey. Question 4 asked the priority given to this program in the current IPLAN. 89 LHD’s (94.6%) responded, and five (5.4%) LHD’s skipped answering the question.
Q 4. In your LHD's current IPLAN, what is the priority for heart disease and stroke?
Response Percent
Response Total
High priority
66.3% 59
Medium priority
23.6% 21
Low priority
2.2% 2
Not a priority at all
7.9% 7
Total Respondents 89
(skipped this question) 5 Top priority was accorded to the program by 66.3% LHD’s, followed by medium priority in 23.6%. The program was not a priority at all in 7.9%. This indicates that about one-third of all LHD’s do not give top priority to the heart disease and stroke prevention program. Question 5 asked the LHD’s whether they had provided any heart disease and stroke prevention activities by themselves, or in collaboration, in the last one year. 97.7% LHD’s responded to the question. Two LHD’s (2.3%) refrained from answering the question. .
Q.5. In the past year, has your LHD provided any heart disease and stroke prevention activities or programs solely by itself or in collaboration with others?
Response Response
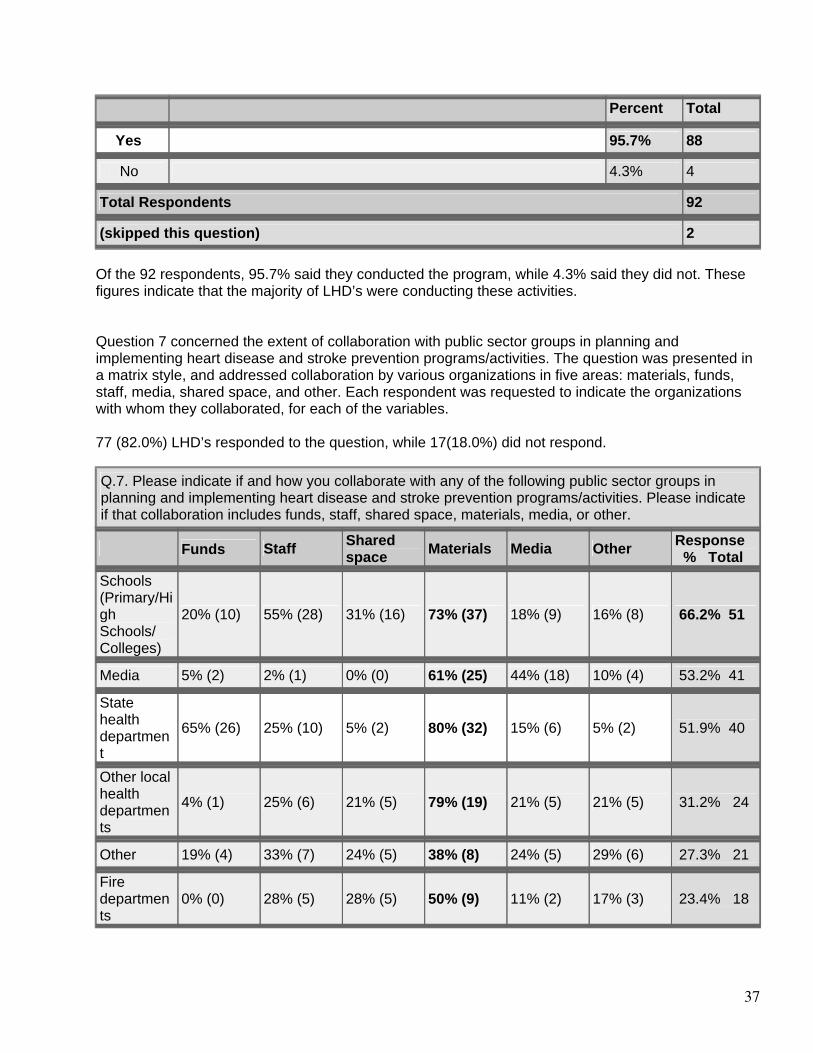
37
Percent Total
Yes 95.7% 88
No 4.3% 4
Total Respondents 92
(skipped this question) 2 Of the 92 respondents, 95.7% said they conducted the program, while 4.3% said they did not. These figures indicate that the majority of LHD’s were conducting these activities. Question 7 concerned the extent of collaboration with public sector groups in planning and implementing heart disease and stroke prevention programs/activities. The question was presented in a matrix style, and addressed collaboration by various organizations in five areas: materials, funds, staff, media, shared space, and other. Each respondent was requested to indicate the organizations with whom they collaborated, for each of the variables. 77 (82.0%) LHD’s responded to the question, while 17(18.0%) did not respond. Q.7. Please indicate if and how you collaborate with any of the following public sector groups in planning and implementing heart disease and stroke prevention programs/activities. Please indicate if that collaboration includes funds, staff, shared space, materials, media, or other.
Funds Staff Shared space Materials Media Other Response
% Total Schools (Primary/High Schools/ Colleges)
20% (10) 55% (28) 31% (16) 73% (37) 18% (9) 16% (8) 66.2% 51
Media 5% (2) 2% (1) 0% (0) 61% (25) 44% (18) 10% (4) 53.2% 41
State health department
65% (26) 25% (10) 5% (2) 80% (32) 15% (6) 5% (2) 51.9% 40
Other local health departments
4% (1) 25% (6) 21% (5) 79% (19) 21% (5) 21% (5) 31.2% 24
Other 19% (4) 33% (7) 24% (5) 38% (8) 24% (5) 29% (6) 27.3% 21
Fire departments
0% (0) 28% (5) 28% (5) 50% (9) 11% (2) 17% (3) 23.4% 18
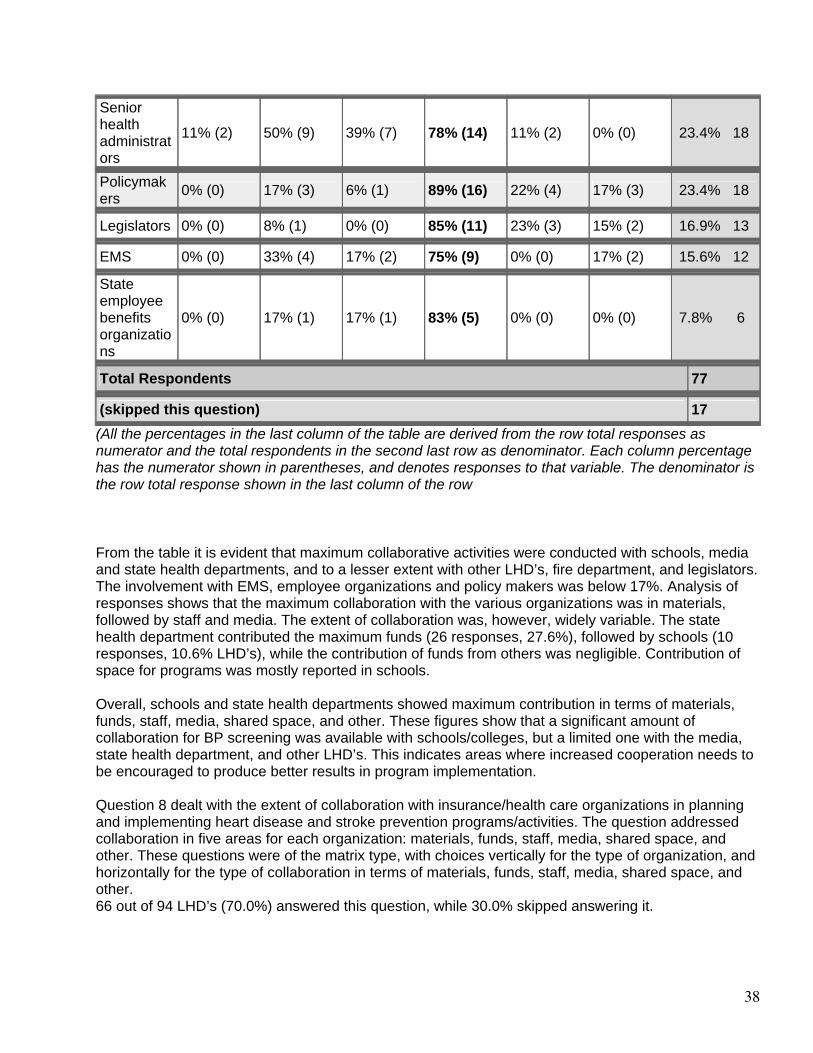
38
Senior health administrators
11% (2) 50% (9) 39% (7) 78% (14) 11% (2) 0% (0) 23.4% 18
Policymakers
0% (0) 17% (3) 6% (1) 89% (16) 22% (4) 17% (3) 23.4% 18
Legislators 0% (0) 8% (1) 0% (0) 85% (11) 23% (3) 15% (2) 16.9% 13
EMS 0% (0) 33% (4) 17% (2) 75% (9) 0% (0) 17% (2) 15.6% 12
State employee benefits organizations
0% (0) 17% (1) 17% (1) 83% (5) 0% (0) 0% (0) 7.8% 6
Total Respondents 77
(skipped this question) 17 (All the percentages in the last column of the table are derived from the row total responses as numerator and the total respondents in the second last row as denominator. Each column percentage has the numerator shown in parentheses, and denotes responses to that variable. The denominator is the row total response shown in the last column of the row
From the table it is evident that maximum collaborative activities were conducted with schools, media and state health departments, and to a lesser extent with other LHD’s, fire department, and legislators. The involvement with EMS, employee organizations and policy makers was below 17%. Analysis of responses shows that the maximum collaboration with the various organizations was in materials, followed by staff and media. The extent of collaboration was, however, widely variable. The state health department contributed the maximum funds (26 responses, 27.6%), followed by schools (10 responses, 10.6% LHD’s), while the contribution of funds from others was negligible. Contribution of space for programs was mostly reported in schools. Overall, schools and state health departments showed maximum contribution in terms of materials, funds, staff, media, shared space, and other. These figures show that a significant amount of collaboration for BP screening was available with schools/colleges, but a limited one with the media, state health department, and other LHD’s. This indicates areas where increased cooperation needs to be encouraged to produce better results in program implementation. Question 8 dealt with the extent of collaboration with insurance/health care organizations in planning and implementing heart disease and stroke prevention programs/activities. The question addressed collaboration in five areas for each organization: materials, funds, staff, media, shared space, and other. These questions were of the matrix type, with choices vertically for the type of organization, and horizontally for the type of collaboration in terms of materials, funds, staff, media, shared space, and other. 66 out of 94 LHD’s (70.0%) answered this question, while 30.0% skipped answering it.
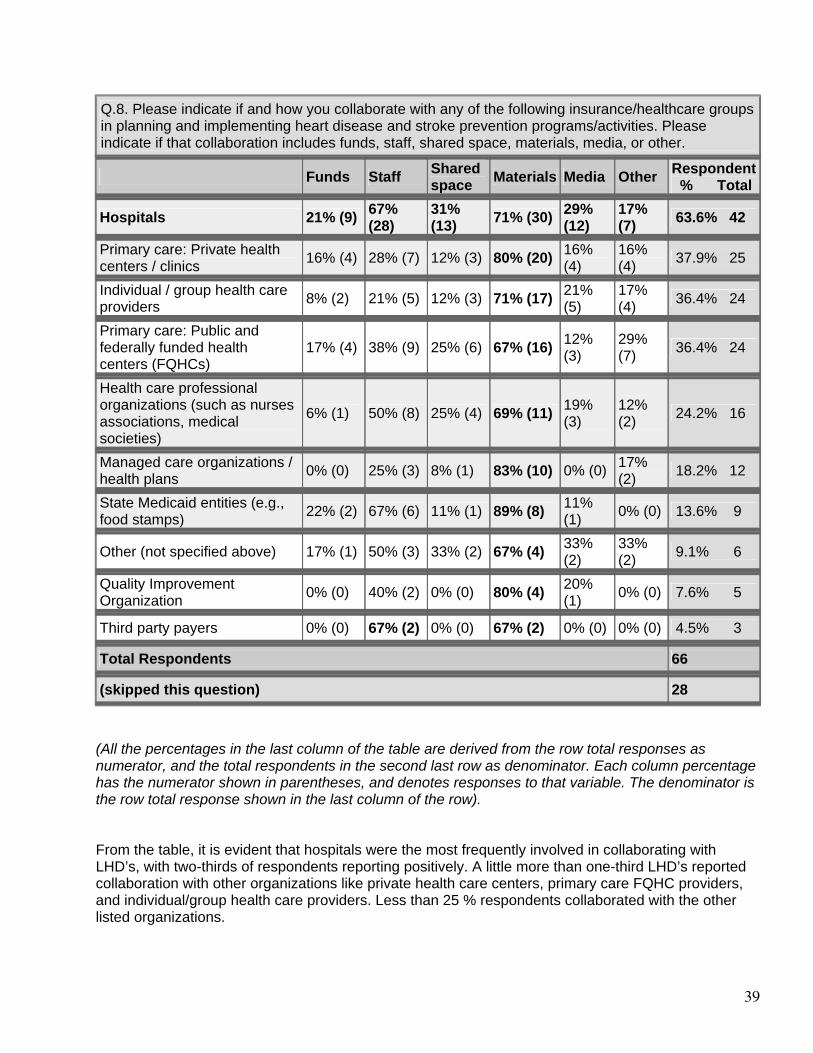
39
Q.8. Please indicate if and how you collaborate with any of the following insurance/healthcare groups in planning and implementing heart disease and stroke prevention programs/activities. Please indicate if that collaboration includes funds, staff, shared space, materials, media, or other.
Funds Staff Shared space Materials Media Other Respondent
% Total
Hospitals 21% (9) 67% (28)
31% (13) 71% (30) 29%
(12) 17% (7) 63.6% 42
Primary care: Private health centers / clinics
16% (4) 28% (7) 12% (3) 80% (20) 16% (4)
16% (4) 37.9% 25
Individual / group health care providers
8% (2) 21% (5) 12% (3) 71% (17) 21% (5)
17% (4) 36.4% 24
Primary care: Public and federally funded health centers (FQHCs)
17% (4) 38% (9) 25% (6) 67% (16) 12% (3)
29% (7) 36.4% 24
Health care professional organizations (such as nurses associations, medical societies)
6% (1) 50% (8) 25% (4) 69% (11) 19% (3)
12% (2) 24.2% 16
Managed care organizations / health plans
0% (0) 25% (3) 8% (1) 83% (10) 0% (0) 17% (2) 18.2% 12
State Medicaid entities (e.g., food stamps)
22% (2) 67% (6) 11% (1) 89% (8) 11% (1) 0% (0) 13.6% 9
Other (not specified above) 17% (1) 50% (3) 33% (2) 67% (4) 33% (2)
33% (2) 9.1% 6
Quality Improvement Organization
0% (0) 40% (2) 0% (0) 80% (4) 20% (1) 0% (0) 7.6% 5
Third party payers 0% (0) 67% (2) 0% (0) 67% (2) 0% (0) 0% (0) 4.5% 3
Total Respondents 66
(skipped this question) 28
(All the percentages in the last column of the table are derived from the row total responses as numerator, and the total respondents in the second last row as denominator. Each column percentage has the numerator shown in parentheses, and denotes responses to that variable. The denominator is the row total response shown in the last column of the row). From the table, it is evident that hospitals were the most frequently involved in collaborating with LHD’s, with two-thirds of respondents reporting positively. A little more than one-third LHD’s reported collaboration with other organizations like private health care centers, primary care FQHC providers, and individual/group health care providers. Less than 25 % respondents collaborated with the other listed organizations.

40
The hospitals provided maximum sharing in all five areas. There was maximum sharing of materials by all organizations, but the extent showed a wide variability between organizations. Shared space was the next most commonly shared resource, followed by staff. The collaboration with media and fund contribution was minimal with all organizations, though some hospitals did provide these resources. Overall, the lack of response from about one-third LHD’s is noteworthy. There was considerable sharing of resources with hospitals, but not with other organizations that can be useful in a program to prevent heart disease and stroke. These sources can be a source of collaborative efforts to increase the reach of the program. Question 9 queried the extent of collaboration with community-based organizations in planning and implementing heart disease and stroke prevention programs/activities. The question addressed collaboration in five areas: materials, funds, staff, media, shared space, and other. There was a response from 70 (74.4%) LHD’s, while 24 (25.5%) LHD’s skipped answering the question.
Q 9. Please indicate if and how you collaborate with any of the following community based organizations in planning and implementing heart disease and stroke prevention programs/activities. Please indicate if that collaboration includes funds, staff, shared space, materials, media, or other.
Funds Staff Shared space Materials Media Other Respondent
Total Community organizations
17% (11) 48% (31) 34% (22) 82% (53) 34% (22) 22% (14) 92.9% 65
Faith based organizations
5% (2) 34% (13) 32% (12) 82% (31) 29% (11) 26% (10) 54.3% 38
Minority advocacy organizations
7% (1) 47% (7) 33% (5) 80% (12) 33% (5) 7% (1) 21.4% 15
Primary Care Association
0% (0) 18% (2) 9% (1) 82% (9) 9% (1) 9% (1) 15.7% 11
Survivor support groups
12% (1) 75% (6) 62% (5) 62% (5) 25% (2) 0% (0) 11.4% 8
Other 0% (0) 25% (2) 25% (2) 50% (4) 38% (3) 38% (3) 11.4% 8
Total Respondents 70
(skipped this question) 24 (All the percentages in the last column of the table are derived from the row total responses as numerator and the total respondents in the second last row as denominator. Each column percentage has the numerator shown in parentheses, and denotes responses to that variable. The denominator is the row total response shown in the last column of the row)
Among the LHD’s which responded, maximum cooperation was with community organizations (92.9%), and faith based groups (54.3%). Less than 25% LHD’s shared resources with other groups.
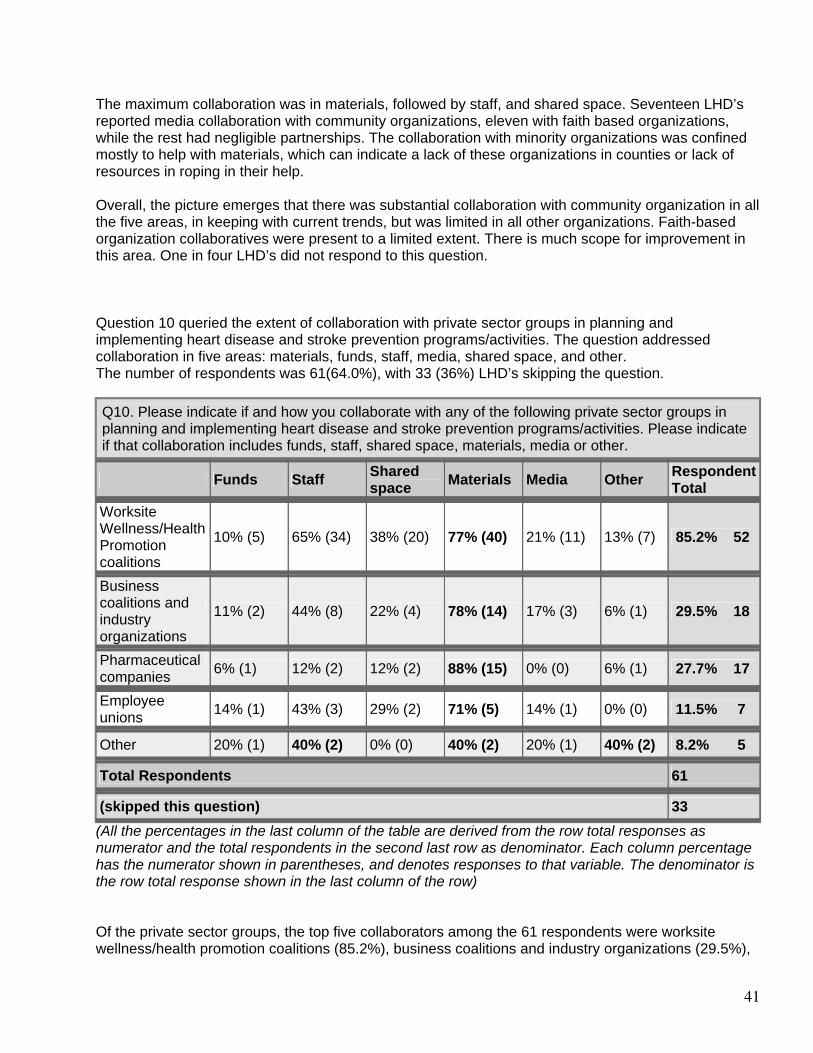
41
The maximum collaboration was in materials, followed by staff, and shared space. Seventeen LHD’s reported media collaboration with community organizations, eleven with faith based organizations, while the rest had negligible partnerships. The collaboration with minority organizations was confined mostly to help with materials, which can indicate a lack of these organizations in counties or lack of resources in roping in their help. Overall, the picture emerges that there was substantial collaboration with community organization in all the five areas, in keeping with current trends, but was limited in all other organizations. Faith-based organization collaboratives were present to a limited extent. There is much scope for improvement in this area. One in four LHD’s did not respond to this question. Question 10 queried the extent of collaboration with private sector groups in planning and implementing heart disease and stroke prevention programs/activities. The question addressed collaboration in five areas: materials, funds, staff, media, shared space, and other. The number of respondents was 61(64.0%), with 33 (36%) LHD’s skipping the question.
Q10. Please indicate if and how you collaborate with any of the following private sector groups in planning and implementing heart disease and stroke prevention programs/activities. Please indicate if that collaboration includes funds, staff, shared space, materials, media or other.
Funds Staff Shared space Materials Media Other Respondent
Total Worksite Wellness/Health Promotion coalitions
10% (5) 65% (34) 38% (20) 77% (40) 21% (11) 13% (7) 85.2% 52
Business coalitions and industry organizations
11% (2) 44% (8) 22% (4) 78% (14) 17% (3) 6% (1) 29.5% 18
Pharmaceutical companies
6% (1) 12% (2) 12% (2) 88% (15) 0% (0) 6% (1) 27.7% 17
Employee unions
14% (1) 43% (3) 29% (2) 71% (5) 14% (1) 0% (0) 11.5% 7
Other 20% (1) 40% (2) 0% (0) 40% (2) 20% (1) 40% (2) 8.2% 5
Total Respondents 61
(skipped this question) 33 (All the percentages in the last column of the table are derived from the row total responses as numerator and the total respondents in the second last row as denominator. Each column percentage has the numerator shown in parentheses, and denotes responses to that variable. The denominator is the row total response shown in the last column of the row) Of the private sector groups, the top five collaborators among the 61 respondents were worksite wellness/health promotion coalitions (85.2%), business coalitions and industry organizations (29.5%),
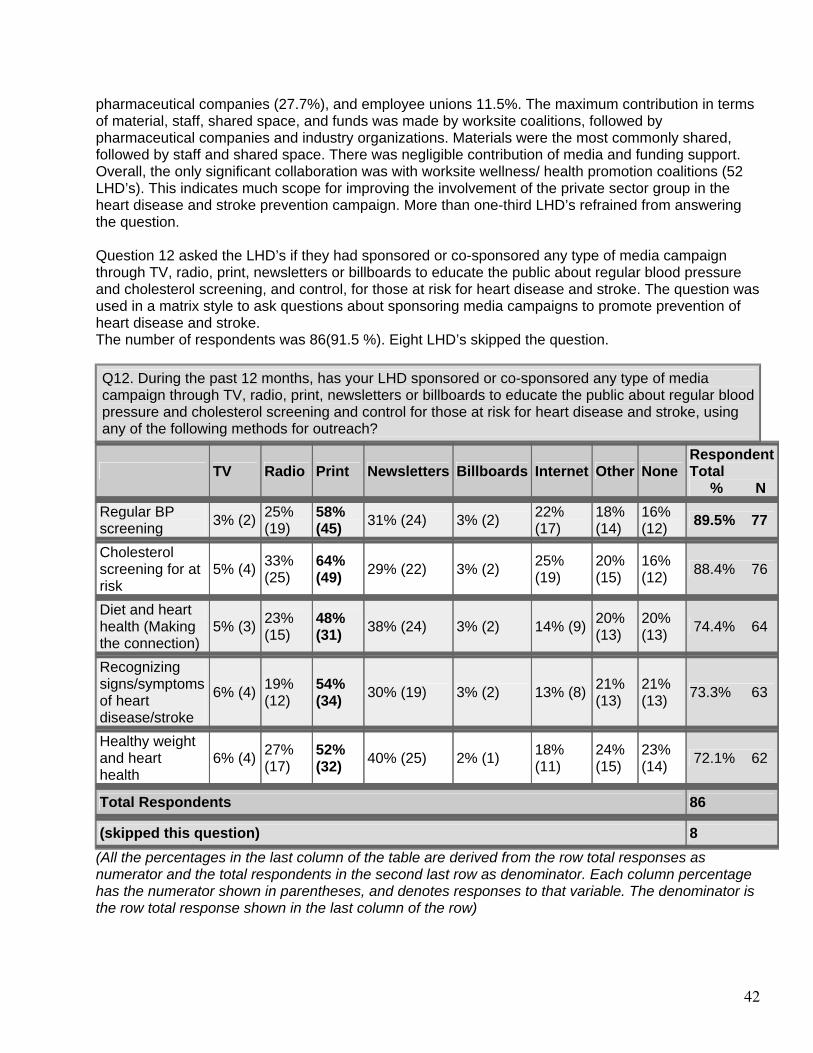
42
pharmaceutical companies (27.7%), and employee unions 11.5%. The maximum contribution in terms of material, staff, shared space, and funds was made by worksite coalitions, followed by pharmaceutical companies and industry organizations. Materials were the most commonly shared, followed by staff and shared space. There was negligible contribution of media and funding support. Overall, the only significant collaboration was with worksite wellness/ health promotion coalitions (52 LHD’s). This indicates much scope for improving the involvement of the private sector group in the heart disease and stroke prevention campaign. More than one-third LHD’s refrained from answering the question. Question 12 asked the LHD’s if they had sponsored or co-sponsored any type of media campaign through TV, radio, print, newsletters or billboards to educate the public about regular blood pressure and cholesterol screening, and control, for those at risk for heart disease and stroke. The question was used in a matrix style to ask questions about sponsoring media campaigns to promote prevention of heart disease and stroke. The number of respondents was 86(91.5 %). Eight LHD’s skipped the question.
Q12. During the past 12 months, has your LHD sponsored or co-sponsored any type of media campaign through TV, radio, print, newsletters or billboards to educate the public about regular blood pressure and cholesterol screening and control for those at risk for heart disease and stroke, using any of the following methods for outreach?
TV Radio Print Newsletters Billboards Internet Other None Respondent Total % N
Regular BP screening
3% (2) 25% (19)
58% (45) 31% (24) 3% (2) 22%
(17) 18% (14)
16% (12) 89.5% 77
Cholesterol screening for at risk
5% (4) 33% (25)
64% (49) 29% (22) 3% (2) 25%
(19) 20% (15)
16% (12) 88.4% 76
Diet and heart health (Making the connection)
5% (3) 23% (15)
48% (31) 38% (24) 3% (2) 14% (9) 20%
(13) 20% (13) 74.4% 64
Recognizing signs/symptoms of heart disease/stroke
6% (4) 19% (12)
54% (34) 30% (19) 3% (2) 13% (8) 21%
(13) 21% (13) 73.3% 63
Healthy weight and heart health
6% (4) 27% (17)
52% (32) 40% (25) 2% (1) 18%
(11) 24% (15)
23% (14) 72.1% 62
Total Respondents 86
(skipped this question) 8 (All the percentages in the last column of the table are derived from the row total responses as numerator and the total respondents in the second last row as denominator. Each column percentage has the numerator shown in parentheses, and denotes responses to that variable. The denominator is the row total response shown in the last column of the row)
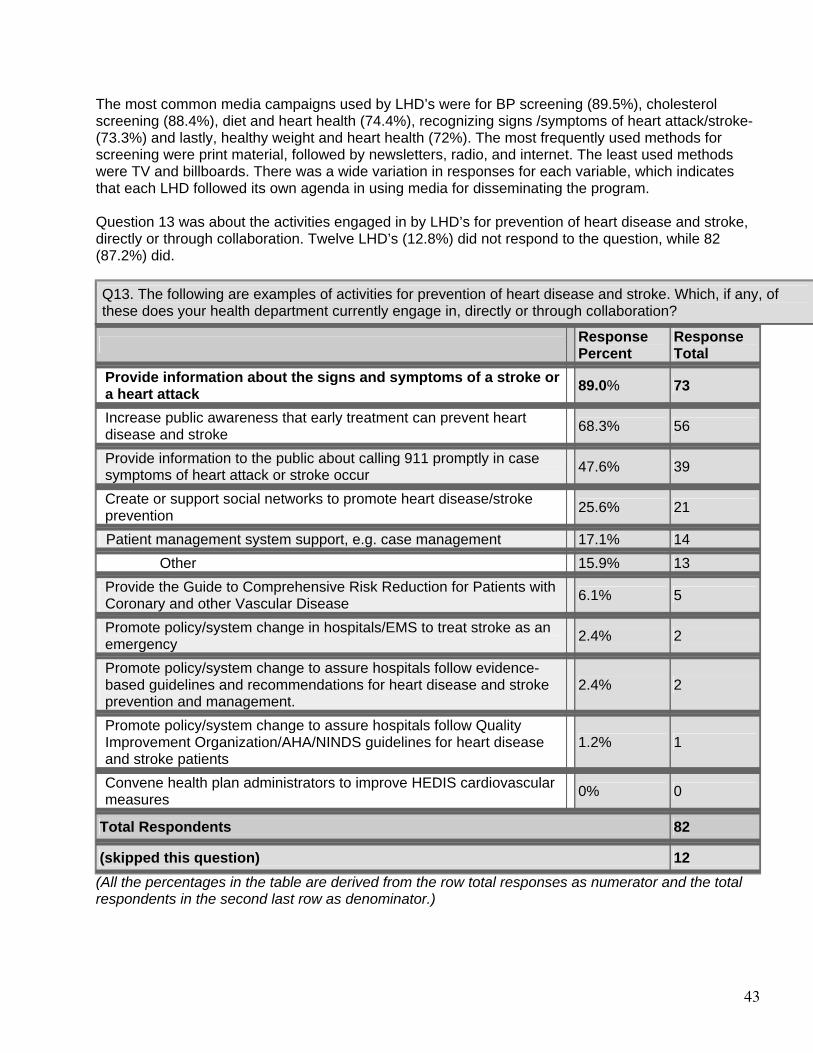
43
The most common media campaigns used by LHD’s were for BP screening (89.5%), cholesterol screening (88.4%), diet and heart health (74.4%), recognizing signs /symptoms of heart attack/stroke-(73.3%) and lastly, healthy weight and heart health (72%). The most frequently used methods for screening were print material, followed by newsletters, radio, and internet. The least used methods were TV and billboards. There was a wide variation in responses for each variable, which indicates that each LHD followed its own agenda in using media for disseminating the program. Question 13 was about the activities engaged in by LHD’s for prevention of heart disease and stroke, directly or through collaboration. Twelve LHD’s (12.8%) did not respond to the question, while 82 (87.2%) did.
Q13. The following are examples of activities for prevention of heart disease and stroke. Which, if any, of these does your health department currently engage in, directly or through collaboration?
Response Percent
Response Total
Provide information about the signs and symptoms of a stroke or a heart attack
89.0% 73
Increase public awareness that early treatment can prevent heart disease and stroke
68.3% 56
Provide information to the public about calling 911 promptly in case symptoms of heart attack or stroke occur
47.6% 39
Create or support social networks to promote heart disease/stroke prevention
25.6% 21
Patient management system support, e.g. case management 17.1% 14 Other 15.9% 13
Provide the Guide to Comprehensive Risk Reduction for Patients with Coronary and other Vascular Disease
6.1% 5
Promote policy/system change in hospitals/EMS to treat stroke as an emergency
2.4% 2
Promote policy/system change to assure hospitals follow evidence-based guidelines and recommendations for heart disease and stroke prevention and management.
2.4% 2
Promote policy/system change to assure hospitals follow Quality Improvement Organization/AHA/NINDS guidelines for heart disease and stroke patients
1.2% 1
Convene health plan administrators to improve HEDIS cardiovascular measures
0% 0
Total Respondents 82
(skipped this question) 12 (All the percentages in the table are derived from the row total responses as numerator and the total respondents in the second last row as denominator.)
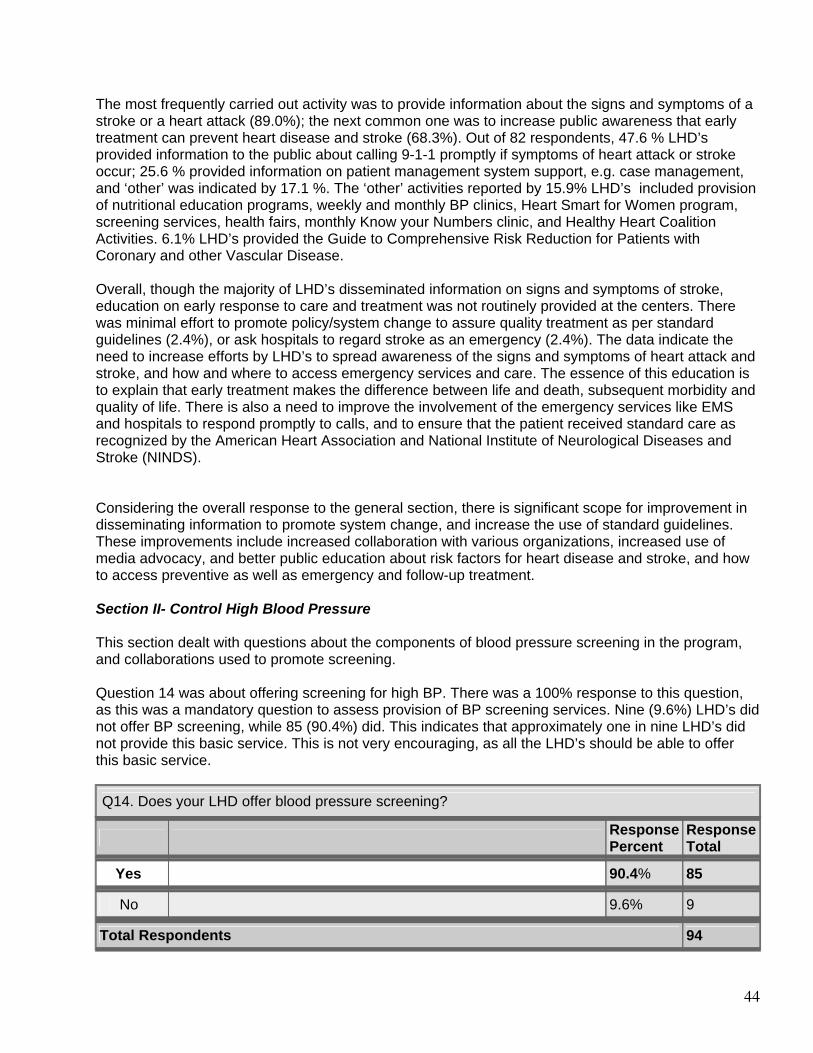
44
The most frequently carried out activity was to provide information about the signs and symptoms of a stroke or a heart attack (89.0%); the next common one was to increase public awareness that early treatment can prevent heart disease and stroke (68.3%). Out of 82 respondents, 47.6 % LHD’s provided information to the public about calling 9-1-1 promptly if symptoms of heart attack or stroke occur; 25.6 % provided information on patient management system support, e.g. case management, and ‘other’ was indicated by 17.1 %. The ‘other’ activities reported by 15.9% LHD’s included provision of nutritional education programs, weekly and monthly BP clinics, Heart Smart for Women program, screening services, health fairs, monthly Know your Numbers clinic, and Healthy Heart Coalition Activities. 6.1% LHD’s provided the Guide to Comprehensive Risk Reduction for Patients with Coronary and other Vascular Disease. Overall, though the majority of LHD’s disseminated information on signs and symptoms of stroke, education on early response to care and treatment was not routinely provided at the centers. There was minimal effort to promote policy/system change to assure quality treatment as per standard guidelines (2.4%), or ask hospitals to regard stroke as an emergency (2.4%). The data indicate the need to increase efforts by LHD’s to spread awareness of the signs and symptoms of heart attack and stroke, and how and where to access emergency services and care. The essence of this education is to explain that early treatment makes the difference between life and death, subsequent morbidity and quality of life. There is also a need to improve the involvement of the emergency services like EMS and hospitals to respond promptly to calls, and to ensure that the patient received standard care as recognized by the American Heart Association and National Institute of Neurological Diseases and Stroke (NINDS). Considering the overall response to the general section, there is significant scope for improvement in disseminating information to promote system change, and increase the use of standard guidelines. These improvements include increased collaboration with various organizations, increased use of media advocacy, and better public education about risk factors for heart disease and stroke, and how to access preventive as well as emergency and follow-up treatment. Section II- Control High Blood Pressure This section dealt with questions about the components of blood pressure screening in the program, and collaborations used to promote screening. Question 14 was about offering screening for high BP. There was a 100% response to this question, as this was a mandatory question to assess provision of BP screening services. Nine (9.6%) LHD’s did not offer BP screening, while 85 (90.4%) did. This indicates that approximately one in nine LHD’s did not provide this basic service. This is not very encouraging, as all the LHD’s should be able to offer this basic service.
Q14. Does your LHD offer blood pressure screening?
Response Percent
Response Total
Yes 90.4% 85
No 9.6% 9
Total Respondents 94
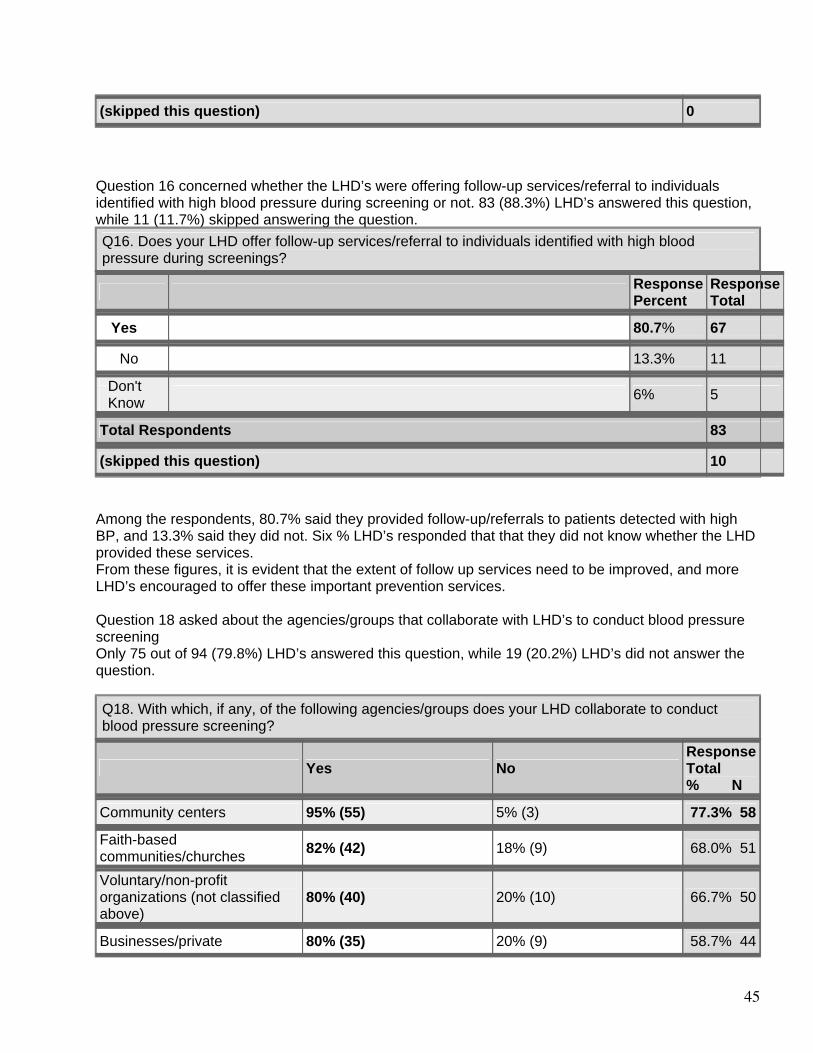
45
(skipped this question) 0 Question 16 concerned whether the LHD’s were offering follow-up services/referral to individuals identified with high blood pressure during screening or not. 83 (88.3%) LHD’s answered this question, while 11 (11.7%) skipped answering the question.
Q16. Does your LHD offer follow-up services/referral to individuals identified with high blood pressure during screenings?
Response Percent
Response Total
Yes 80.7% 67
No 13.3% 11
Don't Know
6% 5
Total Respondents 83
(skipped this question) 10 Among the respondents, 80.7% said they provided follow-up/referrals to patients detected with high BP, and 13.3% said they did not. Six % LHD’s responded that that they did not know whether the LHD provided these services. From these figures, it is evident that the extent of follow up services need to be improved, and more LHD’s encouraged to offer these important prevention services. Question 18 asked about the agencies/groups that collaborate with LHD’s to conduct blood pressure screening Only 75 out of 94 (79.8%) LHD’s answered this question, while 19 (20.2%) LHD’s did not answer the question.
Q18. With which, if any, of the following agencies/groups does your LHD collaborate to conduct blood pressure screening?
Yes No Response Total % N
Community centers 95% (55) 5% (3) 77.3% 58
Faith-based communities/churches
82% (42) 18% (9) 68.0% 51
Voluntary/non-profit organizations (not classified above)
80% (40) 20% (10) 66.7% 50
Businesses/private 80% (35) 20% (9) 58.7% 44
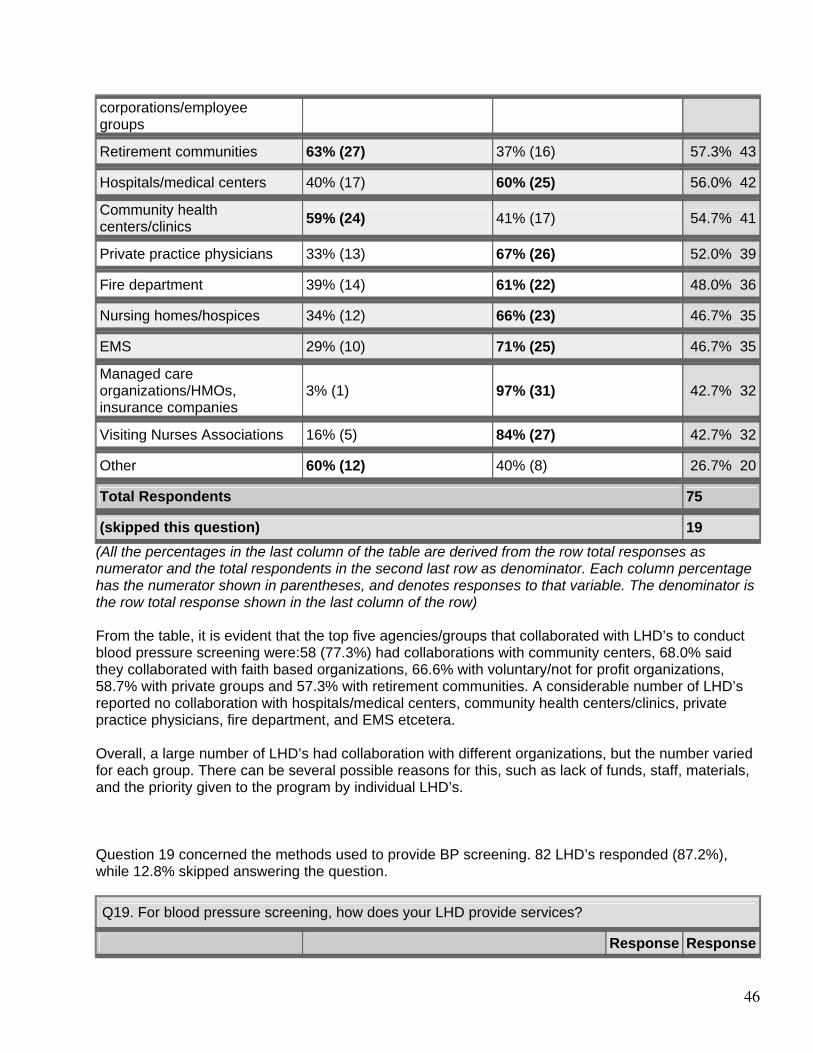
46
corporations/employee groups Retirement communities 63% (27) 37% (16) 57.3% 43
Hospitals/medical centers 40% (17) 60% (25) 56.0% 42
Community health centers/clinics
59% (24) 41% (17) 54.7% 41
Private practice physicians 33% (13) 67% (26) 52.0% 39
Fire department 39% (14) 61% (22) 48.0% 36
Nursing homes/hospices 34% (12) 66% (23) 46.7% 35
EMS 29% (10) 71% (25) 46.7% 35
Managed care organizations/HMOs, insurance companies
3% (1) 97% (31) 42.7% 32
Visiting Nurses Associations 16% (5) 84% (27) 42.7% 32
Other 60% (12) 40% (8) 26.7% 20
Total Respondents 75
(skipped this question) 19 (All the percentages in the last column of the table are derived from the row total responses as numerator and the total respondents in the second last row as denominator. Each column percentage has the numerator shown in parentheses, and denotes responses to that variable. The denominator is the row total response shown in the last column of the row) From the table, it is evident that the top five agencies/groups that collaborated with LHD’s to conduct blood pressure screening were:58 (77.3%) had collaborations with community centers, 68.0% said they collaborated with faith based organizations, 66.6% with voluntary/not for profit organizations, 58.7% with private groups and 57.3% with retirement communities. A considerable number of LHD’s reported no collaboration with hospitals/medical centers, community health centers/clinics, private practice physicians, fire department, and EMS etcetera. Overall, a large number of LHD’s had collaboration with different organizations, but the number varied for each group. There can be several possible reasons for this, such as lack of funds, staff, materials, and the priority given to the program by individual LHD’s. Question 19 concerned the methods used to provide BP screening. 82 LHD’s responded (87.2%), while 12.8% skipped answering the question.
Q19. For blood pressure screening, how does your LHD provide services?
Response Response
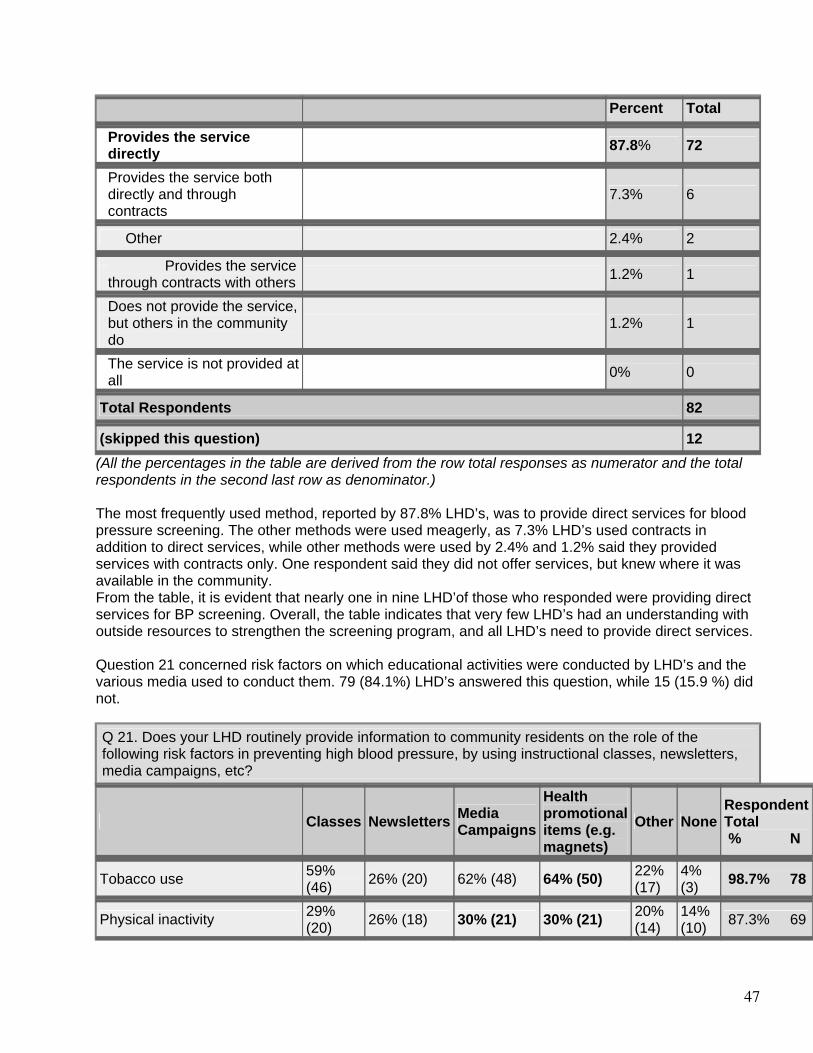
47
Percent Total
Provides the service directly
87.8% 72
Provides the service both directly and through contracts
7.3% 6
Other 2.4% 2
Provides the service through contracts with others
1.2% 1
Does not provide the service, but others in the community do
1.2% 1
The service is not provided at all
0% 0
Total Respondents 82
(skipped this question) 12 (All the percentages in the table are derived from the row total responses as numerator and the total respondents in the second last row as denominator.) The most frequently used method, reported by 87.8% LHD’s, was to provide direct services for blood pressure screening. The other methods were used meagerly, as 7.3% LHD’s used contracts in addition to direct services, while other methods were used by 2.4% and 1.2% said they provided services with contracts only. One respondent said they did not offer services, but knew where it was available in the community. From the table, it is evident that nearly one in nine LHD’of those who responded were providing direct services for BP screening. Overall, the table indicates that very few LHD’s had an understanding with outside resources to strengthen the screening program, and all LHD’s need to provide direct services. Question 21 concerned risk factors on which educational activities were conducted by LHD’s and the various media used to conduct them. 79 (84.1%) LHD’s answered this question, while 15 (15.9 %) did not.
Q 21. Does your LHD routinely provide information to community residents on the role of the following risk factors in preventing high blood pressure, by using instructional classes, newsletters, media campaigns, etc?
Classes Newsletters Media Campaigns
Health promotional items (e.g. magnets)
Other NoneRespondent Total % N
Tobacco use 59% (46) 26% (20) 62% (48) 64% (50) 22%
(17) 4% (3) 98.7% 78
Physical inactivity 29% (20) 26% (18) 30% (21) 30% (21) 20%
(14) 14% (10) 87.3% 69
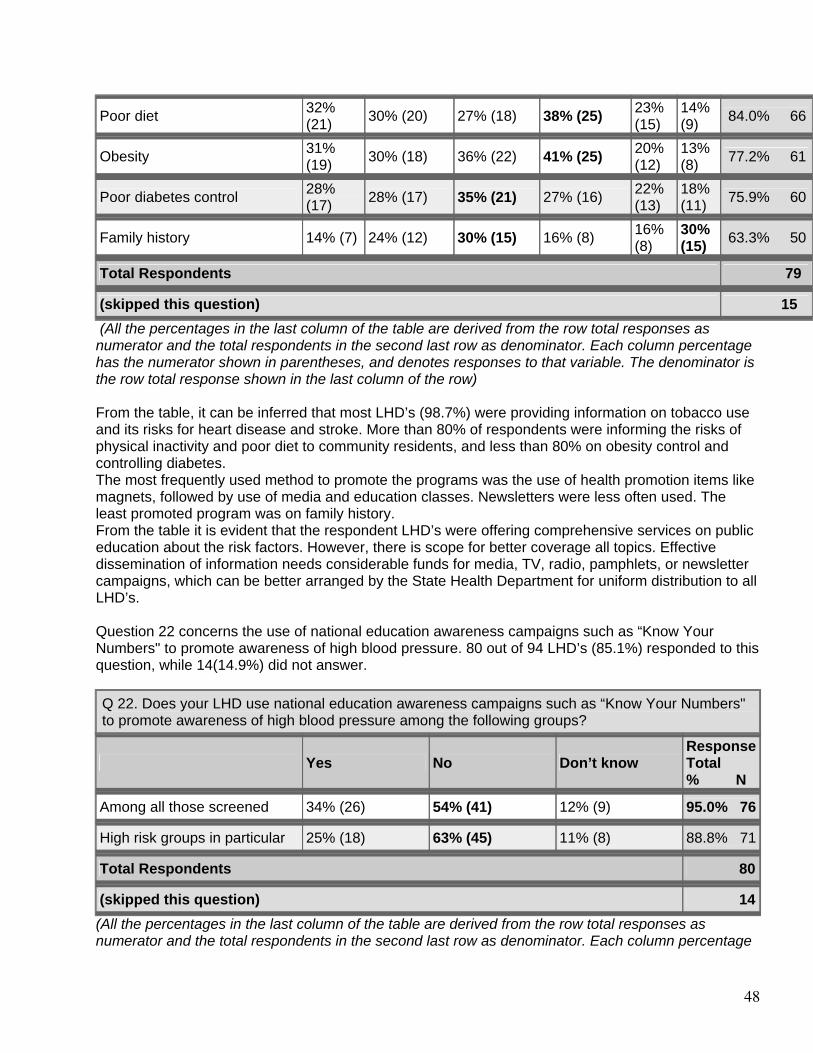
48
Poor diet 32% (21) 30% (20) 27% (18) 38% (25) 23%
(15) 14% (9) 84.0% 66
Obesity 31% (19) 30% (18) 36% (22) 41% (25) 20%
(12) 13% (8) 77.2% 61
Poor diabetes control 28% (17) 28% (17) 35% (21) 27% (16) 22%
(13) 18% (11) 75.9% 60
Family history 14% (7) 24% (12) 30% (15) 16% (8) 16% (8)
30% (15) 63.3% 50
Total Respondents 79
(skipped this question) 15 (All the percentages in the last column of the table are derived from the row total responses as numerator and the total respondents in the second last row as denominator. Each column percentage has the numerator shown in parentheses, and denotes responses to that variable. The denominator is the row total response shown in the last column of the row) From the table, it can be inferred that most LHD’s (98.7%) were providing information on tobacco use and its risks for heart disease and stroke. More than 80% of respondents were informing the risks of physical inactivity and poor diet to community residents, and less than 80% on obesity control and controlling diabetes. The most frequently used method to promote the programs was the use of health promotion items like magnets, followed by use of media and education classes. Newsletters were less often used. The least promoted program was on family history. From the table it is evident that the respondent LHD’s were offering comprehensive services on public education about the risk factors. However, there is scope for better coverage all topics. Effective dissemination of information needs considerable funds for media, TV, radio, pamphlets, or newsletter campaigns, which can be better arranged by the State Health Department for uniform distribution to all LHD’s. Question 22 concerns the use of national education awareness campaigns such as “Know Your Numbers" to promote awareness of high blood pressure. 80 out of 94 LHD’s (85.1%) responded to this question, while 14(14.9%) did not answer.
Q 22. Does your LHD use national education awareness campaigns such as “Know Your Numbers" to promote awareness of high blood pressure among the following groups?
Yes No Don’t know Response Total % N
Among all those screened 34% (26) 54% (41) 12% (9) 95.0% 76
High risk groups in particular 25% (18) 63% (45) 11% (8) 88.8% 71
Total Respondents 80
(skipped this question) 14 (All the percentages in the last column of the table are derived from the row total responses as numerator and the total respondents in the second last row as denominator. Each column percentage
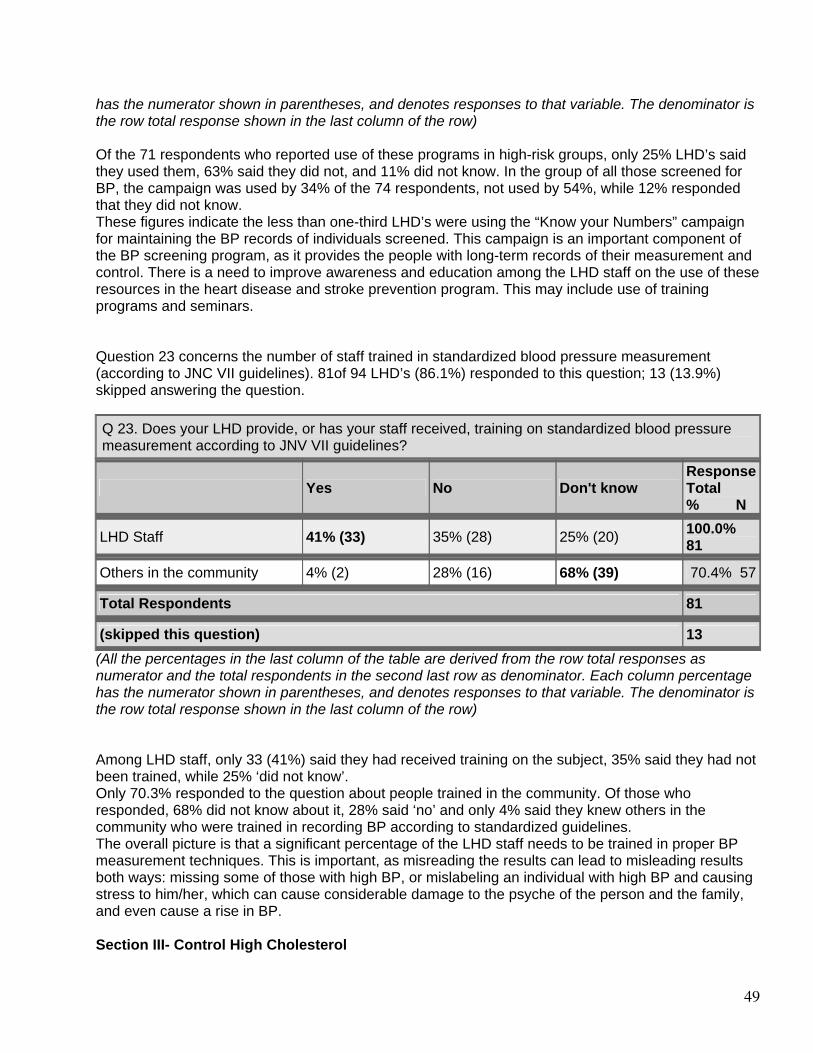
49
has the numerator shown in parentheses, and denotes responses to that variable. The denominator is the row total response shown in the last column of the row) Of the 71 respondents who reported use of these programs in high-risk groups, only 25% LHD’s said they used them, 63% said they did not, and 11% did not know. In the group of all those screened for BP, the campaign was used by 34% of the 74 respondents, not used by 54%, while 12% responded that they did not know. These figures indicate the less than one-third LHD’s were using the “Know your Numbers” campaign for maintaining the BP records of individuals screened. This campaign is an important component of the BP screening program, as it provides the people with long-term records of their measurement and control. There is a need to improve awareness and education among the LHD staff on the use of these resources in the heart disease and stroke prevention program. This may include use of training programs and seminars. Question 23 concerns the number of staff trained in standardized blood pressure measurement (according to JNC VII guidelines). 81of 94 LHD’s (86.1%) responded to this question; 13 (13.9%) skipped answering the question.
Q 23. Does your LHD provide, or has your staff received, training on standardized blood pressure measurement according to JNV VII guidelines?
Yes No Don't know Response Total % N
LHD Staff 41% (33) 35% (28) 25% (20) 100.0% 81
Others in the community 4% (2) 28% (16) 68% (39) 70.4% 57
Total Respondents 81
(skipped this question) 13 (All the percentages in the last column of the table are derived from the row total responses as numerator and the total respondents in the second last row as denominator. Each column percentage has the numerator shown in parentheses, and denotes responses to that variable. The denominator is the row total response shown in the last column of the row) Among LHD staff, only 33 (41%) said they had received training on the subject, 35% said they had not been trained, while 25% ‘did not know’. Only 70.3% responded to the question about people trained in the community. Of those who responded, 68% did not know about it, 28% said ‘no’ and only 4% said they knew others in the community who were trained in recording BP according to standardized guidelines. The overall picture is that a significant percentage of the LHD staff needs to be trained in proper BP measurement techniques. This is important, as misreading the results can lead to misleading results both ways: missing some of those with high BP, or mislabeling an individual with high BP and causing stress to him/her, which can cause considerable damage to the psyche of the person and the family, and even cause a rise in BP. Section III- Control High Cholesterol
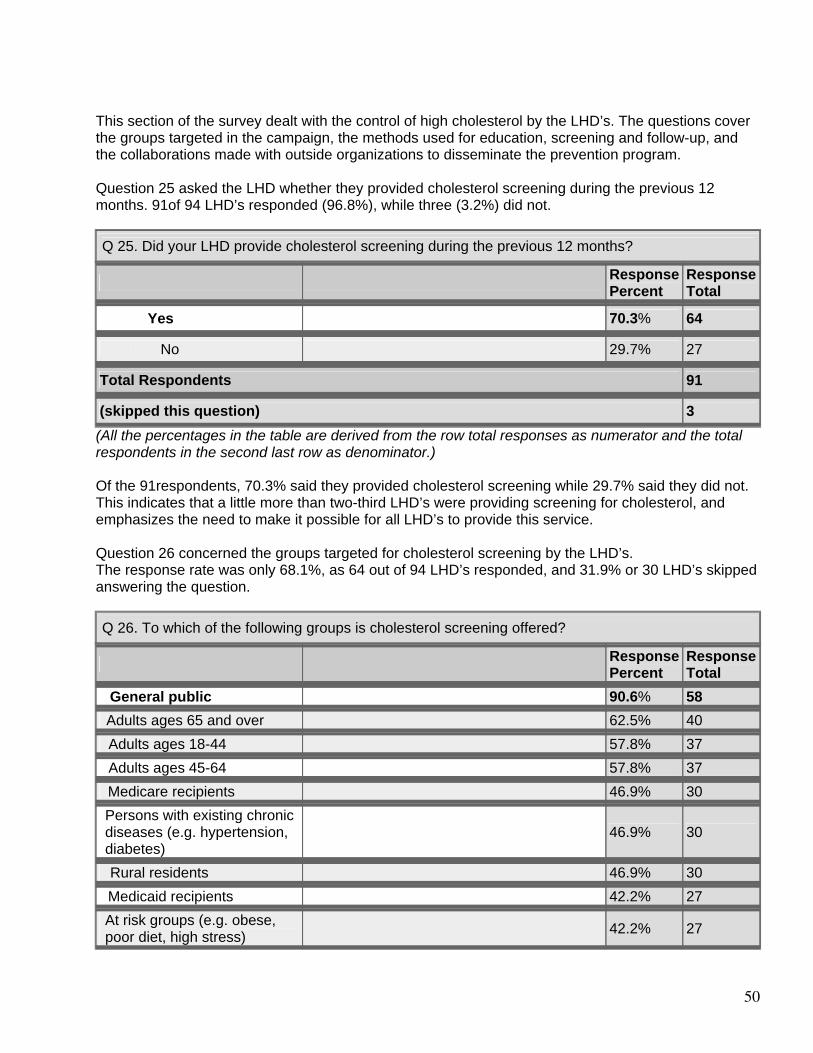
50
This section of the survey dealt with the control of high cholesterol by the LHD’s. The questions cover the groups targeted in the campaign, the methods used for education, screening and follow-up, and the collaborations made with outside organizations to disseminate the prevention program. Question 25 asked the LHD whether they provided cholesterol screening during the previous 12 months. 91of 94 LHD’s responded (96.8%), while three (3.2%) did not.
Q 25. Did your LHD provide cholesterol screening during the previous 12 months?
Response Percent
Response Total
Yes 70.3% 64
No 29.7% 27
Total Respondents 91
(skipped this question) 3 (All the percentages in the table are derived from the row total responses as numerator and the total respondents in the second last row as denominator.) Of the 91respondents, 70.3% said they provided cholesterol screening while 29.7% said they did not. This indicates that a little more than two-third LHD’s were providing screening for cholesterol, and emphasizes the need to make it possible for all LHD’s to provide this service. Question 26 concerned the groups targeted for cholesterol screening by the LHD’s. The response rate was only 68.1%, as 64 out of 94 LHD’s responded, and 31.9% or 30 LHD’s skipped answering the question.
Q 26. To which of the following groups is cholesterol screening offered?
Response Percent
Response Total
General public 90.6% 58
Adults ages 65 and over 62.5% 40
Adults ages 18-44 57.8% 37
Adults ages 45-64 57.8% 37
Medicare recipients 46.9% 30
Persons with existing chronic diseases (e.g. hypertension, diabetes)
46.9% 30
Rural residents 46.9% 30
Medicaid recipients 42.2% 27
At risk groups (e.g. obese, poor diet, high stress)
42.2% 27
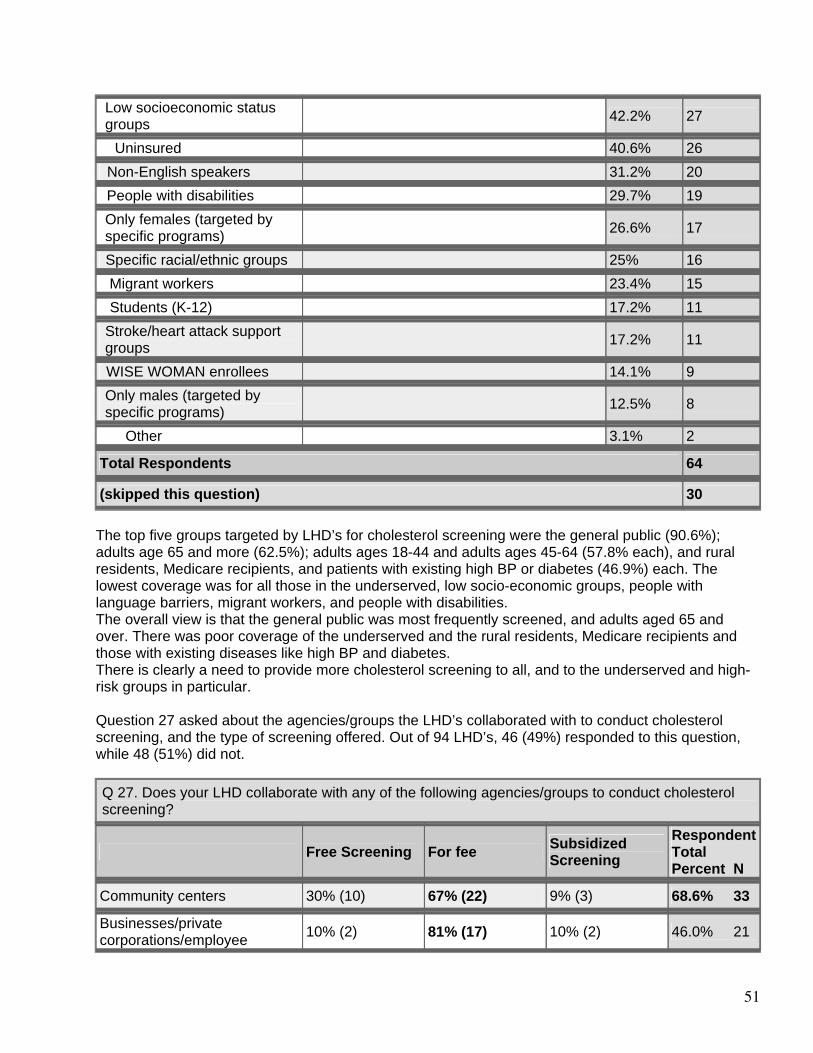
51
Low socioeconomic status groups
42.2% 27
Uninsured 40.6% 26
Non-English speakers 31.2% 20
People with disabilities 29.7% 19
Only females (targeted by specific programs)
26.6% 17
Specific racial/ethnic groups 25% 16
Migrant workers 23.4% 15
Students (K-12) 17.2% 11
Stroke/heart attack support groups
17.2% 11
WISE WOMAN enrollees 14.1% 9
Only males (targeted by specific programs)
12.5% 8
Other 3.1% 2
Total Respondents 64
(skipped this question) 30 The top five groups targeted by LHD’s for cholesterol screening were the general public (90.6%); adults age 65 and more (62.5%); adults ages 18-44 and adults ages 45-64 (57.8% each), and rural residents, Medicare recipients, and patients with existing high BP or diabetes (46.9%) each. The lowest coverage was for all those in the underserved, low socio-economic groups, people with language barriers, migrant workers, and people with disabilities. The overall view is that the general public was most frequently screened, and adults aged 65 and over. There was poor coverage of the underserved and the rural residents, Medicare recipients and those with existing diseases like high BP and diabetes. There is clearly a need to provide more cholesterol screening to all, and to the underserved and high-risk groups in particular. Question 27 asked about the agencies/groups the LHD’s collaborated with to conduct cholesterol screening, and the type of screening offered. Out of 94 LHD’s, 46 (49%) responded to this question, while 48 (51%) did not.
Q 27. Does your LHD collaborate with any of the following agencies/groups to conduct cholesterol screening?
Free Screening For fee Subsidized Screening
Respondent Total Percent N
Community centers 30% (10) 67% (22) 9% (3) 68.6% 33
Businesses/private corporations/employee 10% (2) 81% (17) 10% (2) 46.0% 21
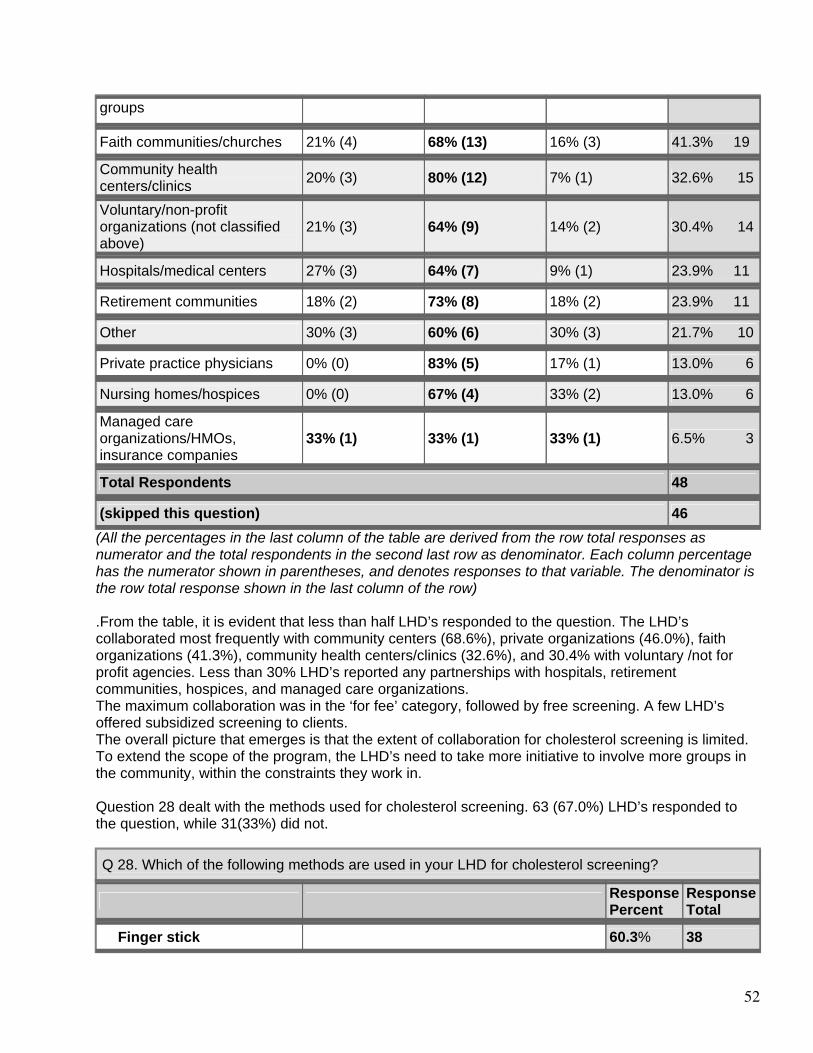
52
groups
Faith communities/churches 21% (4) 68% (13) 16% (3) 41.3% 19
Community health centers/clinics
20% (3) 80% (12) 7% (1) 32.6% 15
Voluntary/non-profit organizations (not classified above)
21% (3) 64% (9) 14% (2) 30.4% 14
Hospitals/medical centers 27% (3) 64% (7) 9% (1) 23.9% 11
Retirement communities 18% (2) 73% (8) 18% (2) 23.9% 11
Other 30% (3) 60% (6) 30% (3) 21.7% 10
Private practice physicians 0% (0) 83% (5) 17% (1) 13.0% 6
Nursing homes/hospices 0% (0) 67% (4) 33% (2) 13.0% 6
Managed care organizations/HMOs, insurance companies
33% (1) 33% (1) 33% (1) 6.5% 3
Total Respondents 48
(skipped this question) 46 (All the percentages in the last column of the table are derived from the row total responses as numerator and the total respondents in the second last row as denominator. Each column percentage has the numerator shown in parentheses, and denotes responses to that variable. The denominator is the row total response shown in the last column of the row) .From the table, it is evident that less than half LHD’s responded to the question. The LHD’s collaborated most frequently with community centers (68.6%), private organizations (46.0%), faith organizations (41.3%), community health centers/clinics (32.6%), and 30.4% with voluntary /not for profit agencies. Less than 30% LHD’s reported any partnerships with hospitals, retirement communities, hospices, and managed care organizations. The maximum collaboration was in the ‘for fee’ category, followed by free screening. A few LHD’s offered subsidized screening to clients. The overall picture that emerges is that the extent of collaboration for cholesterol screening is limited. To extend the scope of the program, the LHD’s need to take more initiative to involve more groups in the community, within the constraints they work in. Question 28 dealt with the methods used for cholesterol screening. 63 (67.0%) LHD’s responded to the question, while 31(33%) did not.
Q 28. Which of the following methods are used in your LHD for cholesterol screening?
Response Percent
Response Total
Finger stick 60.3% 38
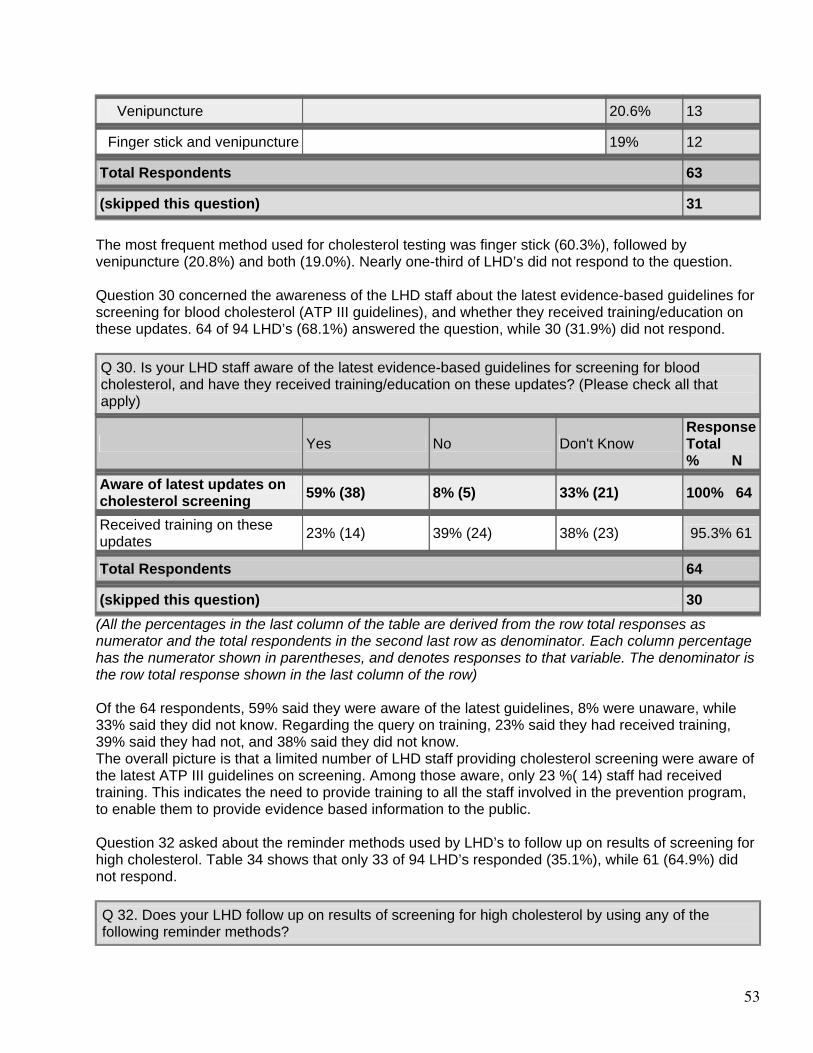
53
Venipuncture 20.6% 13
Finger stick and venipuncture 19% 12
Total Respondents 63
(skipped this question) 31 The most frequent method used for cholesterol testing was finger stick (60.3%), followed by venipuncture (20.8%) and both (19.0%). Nearly one-third of LHD’s did not respond to the question. Question 30 concerned the awareness of the LHD staff about the latest evidence-based guidelines for screening for blood cholesterol (ATP III guidelines), and whether they received training/education on these updates. 64 of 94 LHD’s (68.1%) answered the question, while 30 (31.9%) did not respond. Q 30. Is your LHD staff aware of the latest evidence-based guidelines for screening for blood cholesterol, and have they received training/education on these updates? (Please check all that apply)
Yes No Don't Know Response Total % N
Aware of latest updates on cholesterol screening
59% (38) 8% (5) 33% (21) 100% 64
Received training on these updates
23% (14) 39% (24) 38% (23) 95.3% 61
Total Respondents 64
(skipped this question) 30 (All the percentages in the last column of the table are derived from the row total responses as numerator and the total respondents in the second last row as denominator. Each column percentage has the numerator shown in parentheses, and denotes responses to that variable. The denominator is the row total response shown in the last column of the row) Of the 64 respondents, 59% said they were aware of the latest guidelines, 8% were unaware, while 33% said they did not know. Regarding the query on training, 23% said they had received training, 39% said they had not, and 38% said they did not know. The overall picture is that a limited number of LHD staff providing cholesterol screening were aware of the latest ATP III guidelines on screening. Among those aware, only 23 %( 14) staff had received training. This indicates the need to provide training to all the staff involved in the prevention program, to enable them to provide evidence based information to the public. Question 32 asked about the reminder methods used by LHD’s to follow up on results of screening for high cholesterol. Table 34 shows that only 33 of 94 LHD’s responded (35.1%), while 61 (64.9%) did not respond.
Q 32. Does your LHD follow up on results of screening for high cholesterol by using any of the following reminder methods?
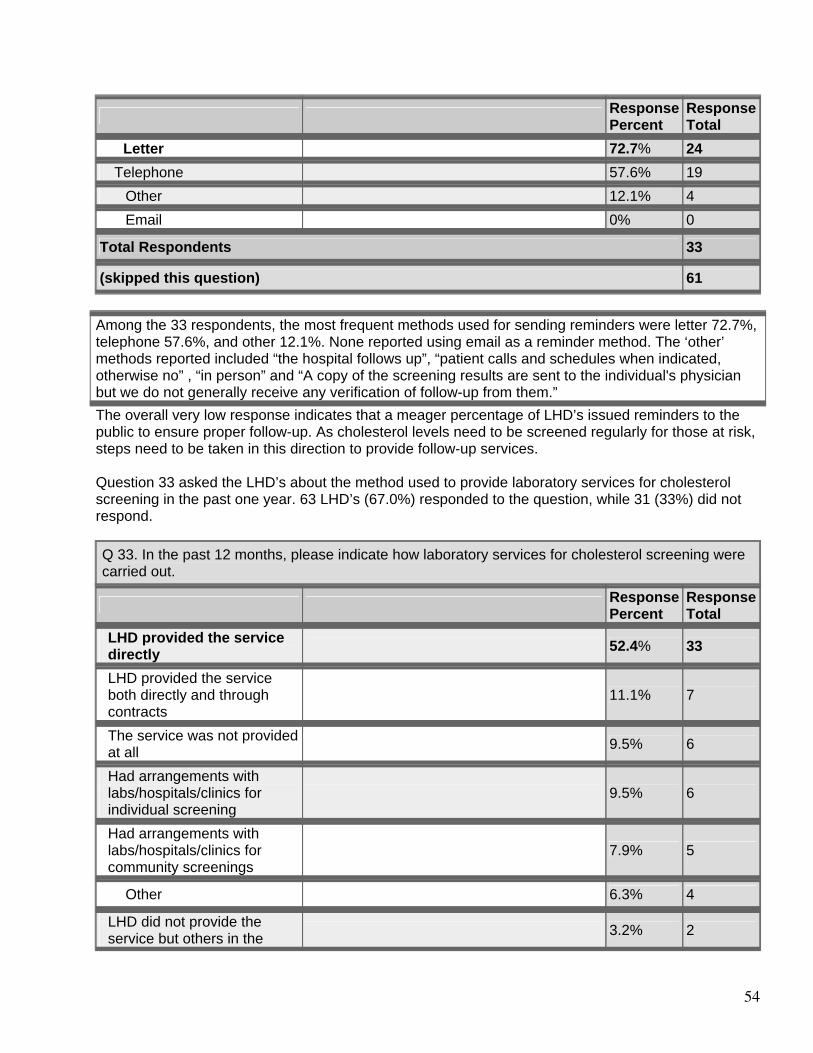
54
Response Percent
Response Total
Letter 72.7% 24
Telephone 57.6% 19 Other 12.1% 4
Email 0% 0
Total Respondents 33
(skipped this question) 61 Among the 33 respondents, the most frequent methods used for sending reminders were letter 72.7%, telephone 57.6%, and other 12.1%. None reported using email as a reminder method. The ‘other’ methods reported included “the hospital follows up”, “patient calls and schedules when indicated, otherwise no” , “in person” and “A copy of the screening results are sent to the individual's physician but we do not generally receive any verification of follow-up from them.” The overall very low response indicates that a meager percentage of LHD’s issued reminders to the public to ensure proper follow-up. As cholesterol levels need to be screened regularly for those at risk, steps need to be taken in this direction to provide follow-up services. Question 33 asked the LHD’s about the method used to provide laboratory services for cholesterol screening in the past one year. 63 LHD’s (67.0%) responded to the question, while 31 (33%) did not respond.
Q 33. In the past 12 months, please indicate how laboratory services for cholesterol screening were carried out.
Response Percent
Response Total
LHD provided the service directly
52.4% 33
LHD provided the service both directly and through contracts
11.1% 7
The service was not provided at all
9.5% 6
Had arrangements with labs/hospitals/clinics for individual screening
9.5% 6
Had arrangements with labs/hospitals/clinics for community screenings
7.9% 5
Other 6.3% 4
LHD did not provide the service but others in the 3.2% 2
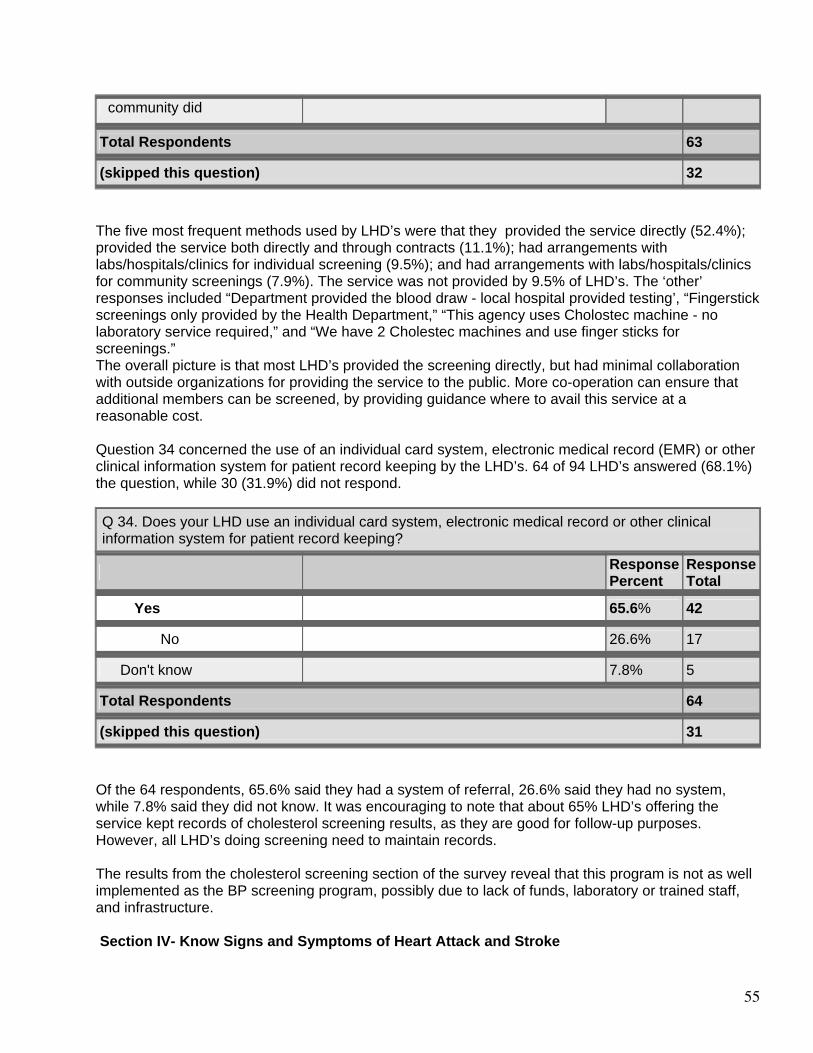
55
community did
Total Respondents 63
(skipped this question) 32 The five most frequent methods used by LHD’s were that they provided the service directly (52.4%); provided the service both directly and through contracts (11.1%); had arrangements with labs/hospitals/clinics for individual screening (9.5%); and had arrangements with labs/hospitals/clinics for community screenings (7.9%). The service was not provided by 9.5% of LHD’s. The ‘other’ responses included “Department provided the blood draw - local hospital provided testing’, “Fingerstick screenings only provided by the Health Department,” “This agency uses Cholostec machine - no laboratory service required,” and “We have 2 Cholestec machines and use finger sticks for screenings.” The overall picture is that most LHD’s provided the screening directly, but had minimal collaboration with outside organizations for providing the service to the public. More co-operation can ensure that additional members can be screened, by providing guidance where to avail this service at a reasonable cost. Question 34 concerned the use of an individual card system, electronic medical record (EMR) or other clinical information system for patient record keeping by the LHD’s. 64 of 94 LHD’s answered (68.1%) the question, while 30 (31.9%) did not respond.
Q 34. Does your LHD use an individual card system, electronic medical record or other clinical information system for patient record keeping?
Response Percent
Response Total
Yes 65.6% 42
No 26.6% 17
Don't know 7.8% 5
Total Respondents 64
(skipped this question) 31 Of the 64 respondents, 65.6% said they had a system of referral, 26.6% said they had no system, while 7.8% said they did not know. It was encouraging to note that about 65% LHD’s offering the service kept records of cholesterol screening results, as they are good for follow-up purposes. However, all LHD’s doing screening need to maintain records. The results from the cholesterol screening section of the survey reveal that this program is not as well implemented as the BP screening program, possibly due to lack of funds, laboratory or trained staff, and infrastructure. Section IV- Know Signs and Symptoms of Heart Attack and Stroke
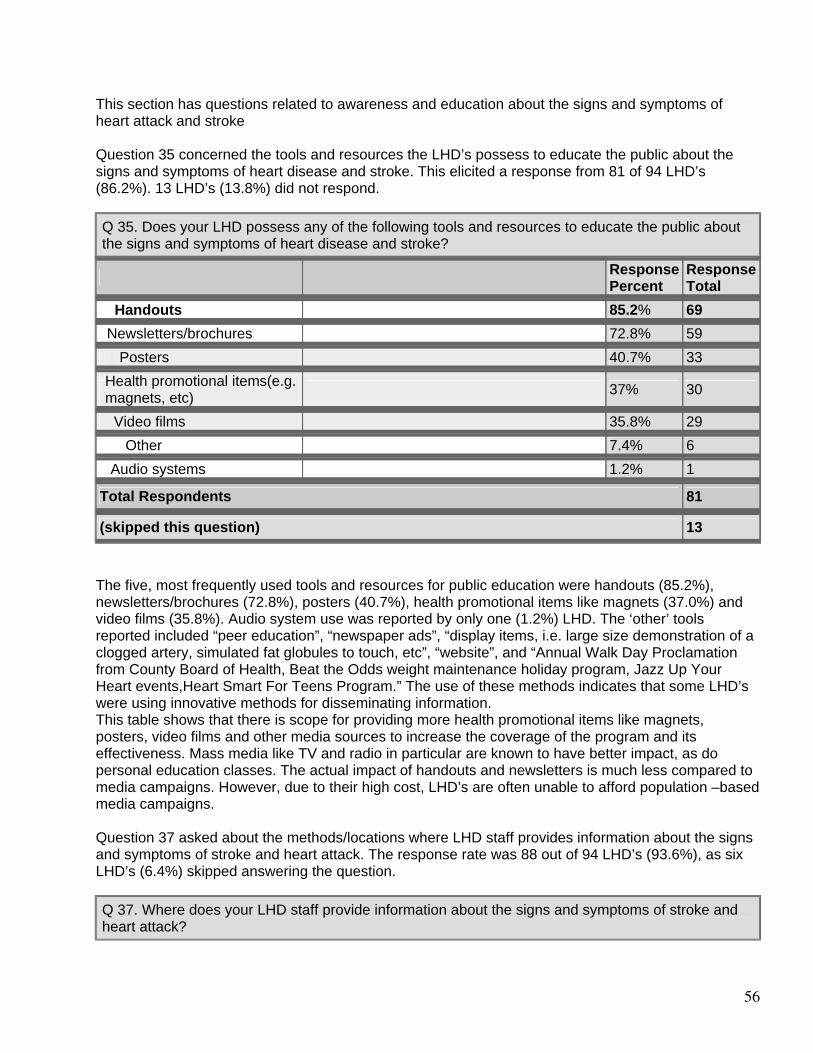
56
This section has questions related to awareness and education about the signs and symptoms of heart attack and stroke Question 35 concerned the tools and resources the LHD’s possess to educate the public about the signs and symptoms of heart disease and stroke. This elicited a response from 81 of 94 LHD’s (86.2%). 13 LHD’s (13.8%) did not respond.
Q 35. Does your LHD possess any of the following tools and resources to educate the public about the signs and symptoms of heart disease and stroke?
Response Percent
Response Total
Handouts 85.2% 69
Newsletters/brochures 72.8% 59
Posters 40.7% 33
Health promotional items(e.g. magnets, etc)
37% 30
Video films 35.8% 29 Other 7.4% 6
Audio systems 1.2% 1
Total Respondents 81
(skipped this question) 13 The five, most frequently used tools and resources for public education were handouts (85.2%), newsletters/brochures (72.8%), posters (40.7%), health promotional items like magnets (37.0%) and video films (35.8%). Audio system use was reported by only one (1.2%) LHD. The ‘other’ tools reported included “peer education”, “newspaper ads”, “display items, i.e. large size demonstration of a clogged artery, simulated fat globules to touch, etc”, “website”, and “Annual Walk Day Proclamation from County Board of Health, Beat the Odds weight maintenance holiday program, Jazz Up Your Heart events,Heart Smart For Teens Program.” The use of these methods indicates that some LHD’s were using innovative methods for disseminating information. This table shows that there is scope for providing more health promotional items like magnets, posters, video films and other media sources to increase the coverage of the program and its effectiveness. Mass media like TV and radio in particular are known to have better impact, as do personal education classes. The actual impact of handouts and newsletters is much less compared to media campaigns. However, due to their high cost, LHD’s are often unable to afford population –based media campaigns. Question 37 asked about the methods/locations where LHD staff provides information about the signs and symptoms of stroke and heart attack. The response rate was 88 out of 94 LHD’s (93.6%), as six LHD’s (6.4%) skipped answering the question.
Q 37. Where does your LHD staff provide information about the signs and symptoms of stroke and heart attack?
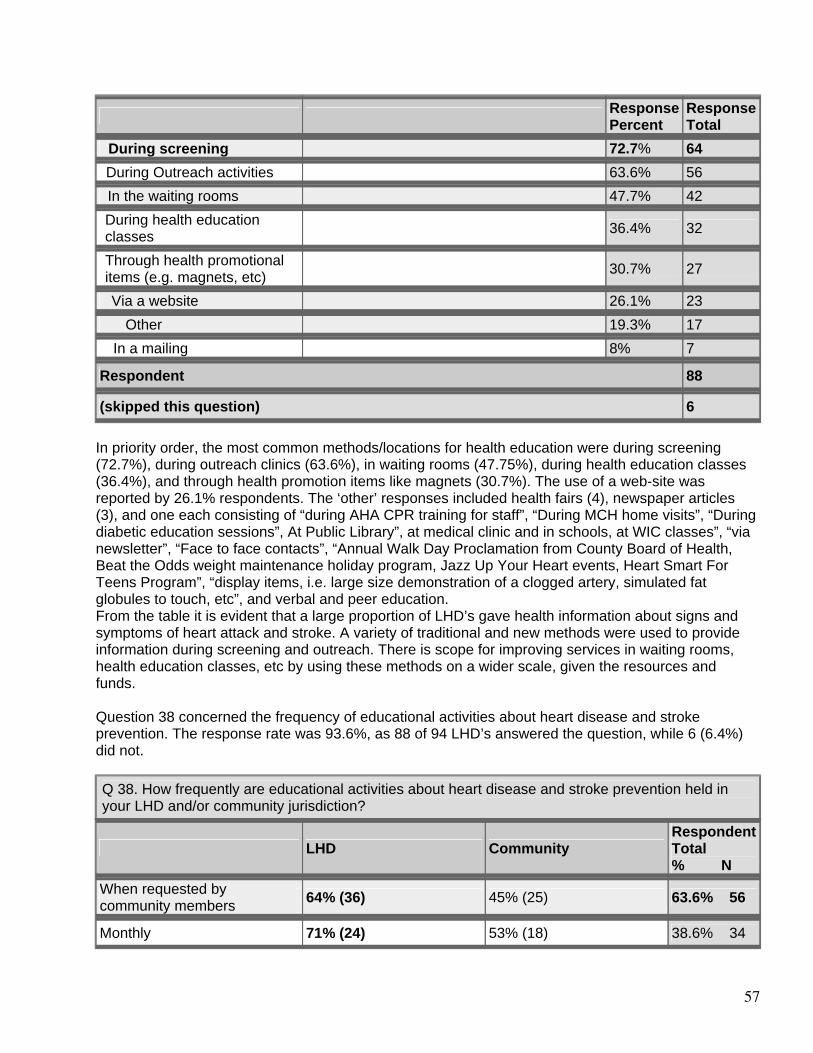
57
Response Percent
Response Total
During screening 72.7% 64
During Outreach activities 63.6% 56
In the waiting rooms 47.7% 42
During health education classes
36.4% 32
Through health promotional items (e.g. magnets, etc)
30.7% 27
Via a website 26.1% 23 Other 19.3% 17
In a mailing 8% 7
Respondent 88
(skipped this question) 6 In priority order, the most common methods/locations for health education were during screening (72.7%), during outreach clinics (63.6%), in waiting rooms (47.75%), during health education classes (36.4%), and through health promotion items like magnets (30.7%). The use of a web-site was reported by 26.1% respondents. The ‘other’ responses included health fairs (4), newspaper articles (3), and one each consisting of “during AHA CPR training for staff”, “During MCH home visits”, “During diabetic education sessions”, At Public Library”, at medical clinic and in schools, at WIC classes”, “via newsletter”, “Face to face contacts”, “Annual Walk Day Proclamation from County Board of Health, Beat the Odds weight maintenance holiday program, Jazz Up Your Heart events, Heart Smart For Teens Program”, “display items, i.e. large size demonstration of a clogged artery, simulated fat globules to touch, etc”, and verbal and peer education. From the table it is evident that a large proportion of LHD’s gave health information about signs and symptoms of heart attack and stroke. A variety of traditional and new methods were used to provide information during screening and outreach. There is scope for improving services in waiting rooms, health education classes, etc by using these methods on a wider scale, given the resources and funds. Question 38 concerned the frequency of educational activities about heart disease and stroke prevention. The response rate was 93.6%, as 88 of 94 LHD’s answered the question, while 6 (6.4%) did not.
Q 38. How frequently are educational activities about heart disease and stroke prevention held in your LHD and/or community jurisdiction?
LHD Community Respondent Total % N
When requested by community members
64% (36) 45% (25) 63.6% 56
Monthly 71% (24) 53% (18) 38.6% 34
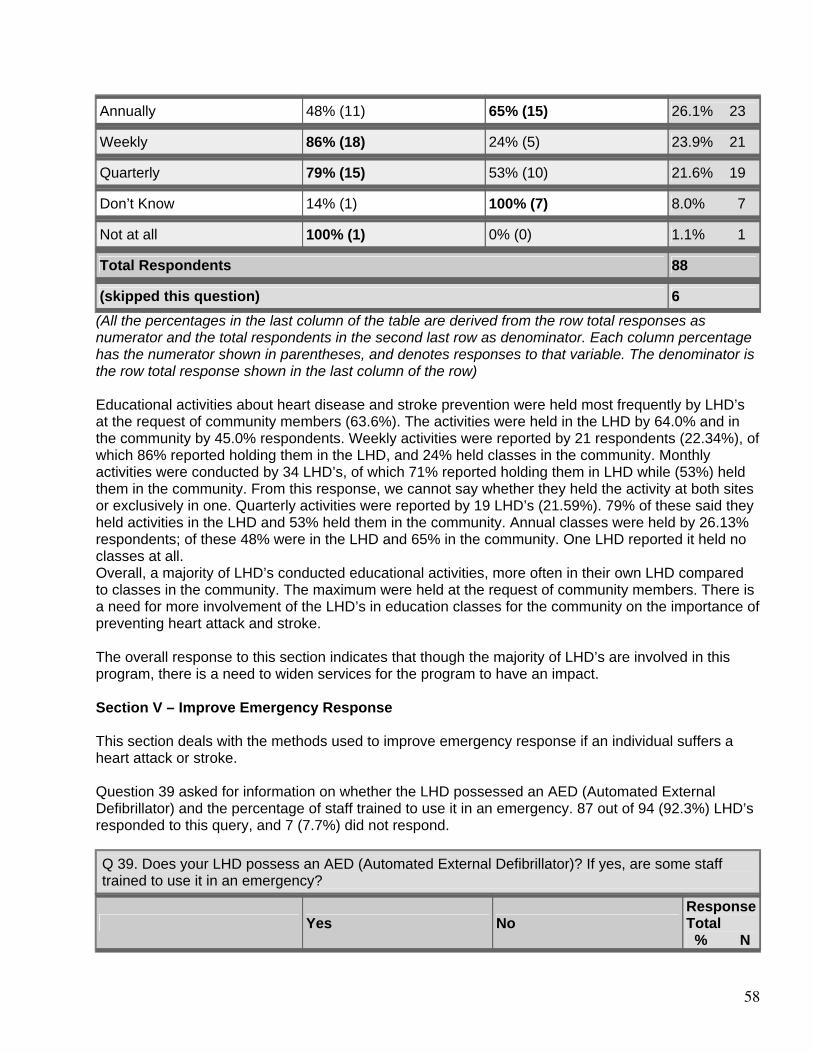
58
Annually 48% (11) 65% (15) 26.1% 23
Weekly 86% (18) 24% (5) 23.9% 21
Quarterly 79% (15) 53% (10) 21.6% 19
Don’t Know 14% (1) 100% (7) 8.0% 7
Not at all 100% (1) 0% (0) 1.1% 1
Total Respondents 88
(skipped this question) 6 (All the percentages in the last column of the table are derived from the row total responses as numerator and the total respondents in the second last row as denominator. Each column percentage has the numerator shown in parentheses, and denotes responses to that variable. The denominator is the row total response shown in the last column of the row) Educational activities about heart disease and stroke prevention were held most frequently by LHD’s at the request of community members (63.6%). The activities were held in the LHD by 64.0% and in the community by 45.0% respondents. Weekly activities were reported by 21 respondents (22.34%), of which 86% reported holding them in the LHD, and 24% held classes in the community. Monthly activities were conducted by 34 LHD’s, of which 71% reported holding them in LHD while (53%) held them in the community. From this response, we cannot say whether they held the activity at both sites or exclusively in one. Quarterly activities were reported by 19 LHD’s (21.59%). 79% of these said they held activities in the LHD and 53% held them in the community. Annual classes were held by 26.13% respondents; of these 48% were in the LHD and 65% in the community. One LHD reported it held no classes at all. Overall, a majority of LHD’s conducted educational activities, more often in their own LHD compared to classes in the community. The maximum were held at the request of community members. There is a need for more involvement of the LHD’s in education classes for the community on the importance of preventing heart attack and stroke. The overall response to this section indicates that though the majority of LHD’s are involved in this program, there is a need to widen services for the program to have an impact. Section V – Improve Emergency Response This section deals with the methods used to improve emergency response if an individual suffers a heart attack or stroke. Question 39 asked for information on whether the LHD possessed an AED (Automated External Defibrillator) and the percentage of staff trained to use it in an emergency. 87 out of 94 (92.3%) LHD’s responded to this query, and 7 (7.7%) did not respond.
Q 39. Does your LHD possess an AED (Automated External Defibrillator)? If yes, are some staff trained to use it in an emergency?
Yes No Response Total % N
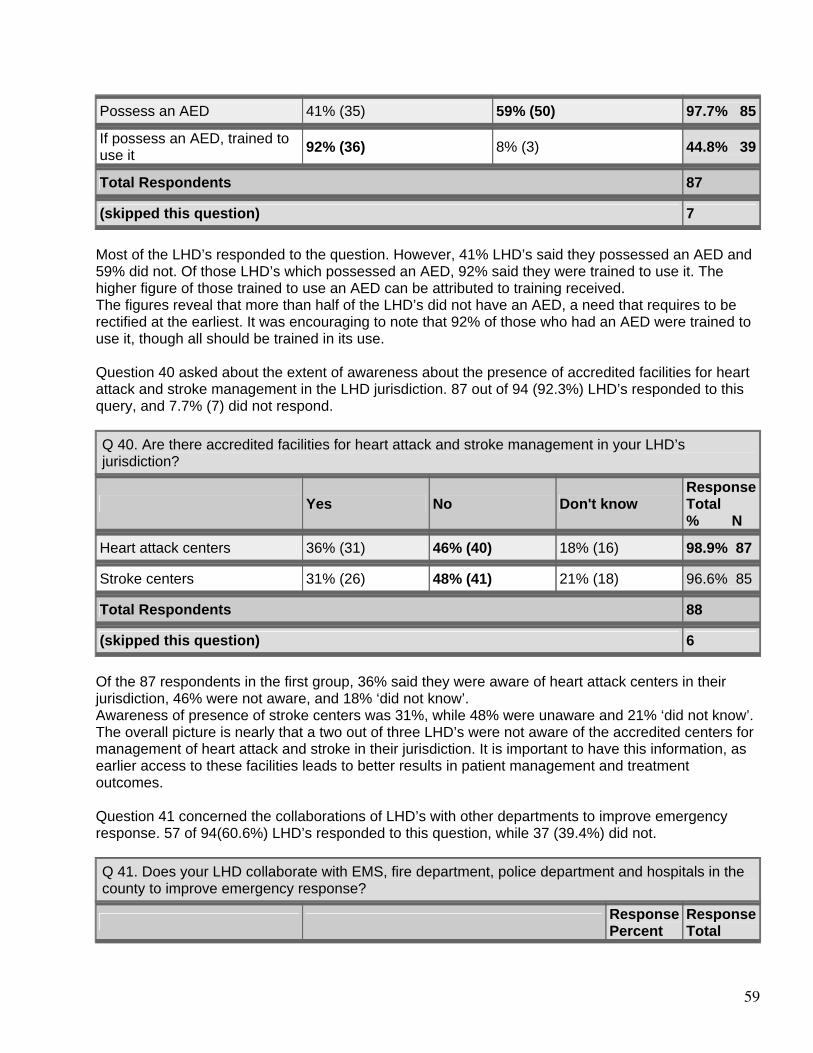
59
Possess an AED 41% (35) 59% (50) 97.7% 85
If possess an AED, trained to use it
92% (36) 8% (3) 44.8% 39
Total Respondents 87
(skipped this question) 7 Most of the LHD’s responded to the question. However, 41% LHD’s said they possessed an AED and 59% did not. Of those LHD’s which possessed an AED, 92% said they were trained to use it. The higher figure of those trained to use an AED can be attributed to training received. The figures reveal that more than half of the LHD’s did not have an AED, a need that requires to be rectified at the earliest. It was encouraging to note that 92% of those who had an AED were trained to use it, though all should be trained in its use. Question 40 asked about the extent of awareness about the presence of accredited facilities for heart attack and stroke management in the LHD jurisdiction. 87 out of 94 (92.3%) LHD’s responded to this query, and 7.7% (7) did not respond.
Q 40. Are there accredited facilities for heart attack and stroke management in your LHD’s jurisdiction?
Yes No Don't know Response Total % N
Heart attack centers 36% (31) 46% (40) 18% (16) 98.9% 87
Stroke centers 31% (26) 48% (41) 21% (18) 96.6% 85
Total Respondents 88
(skipped this question) 6 Of the 87 respondents in the first group, 36% said they were aware of heart attack centers in their jurisdiction, 46% were not aware, and 18% ‘did not know’. Awareness of presence of stroke centers was 31%, while 48% were unaware and 21% ‘did not know’. The overall picture is nearly that a two out of three LHD’s were not aware of the accredited centers for management of heart attack and stroke in their jurisdiction. It is important to have this information, as earlier access to these facilities leads to better results in patient management and treatment outcomes. Question 41 concerned the collaborations of LHD’s with other departments to improve emergency response. 57 of 94(60.6%) LHD’s responded to this question, while 37 (39.4%) did not.
Q 41. Does your LHD collaborate with EMS, fire department, police department and hospitals in the county to improve emergency response?
Response Percent
Response Total
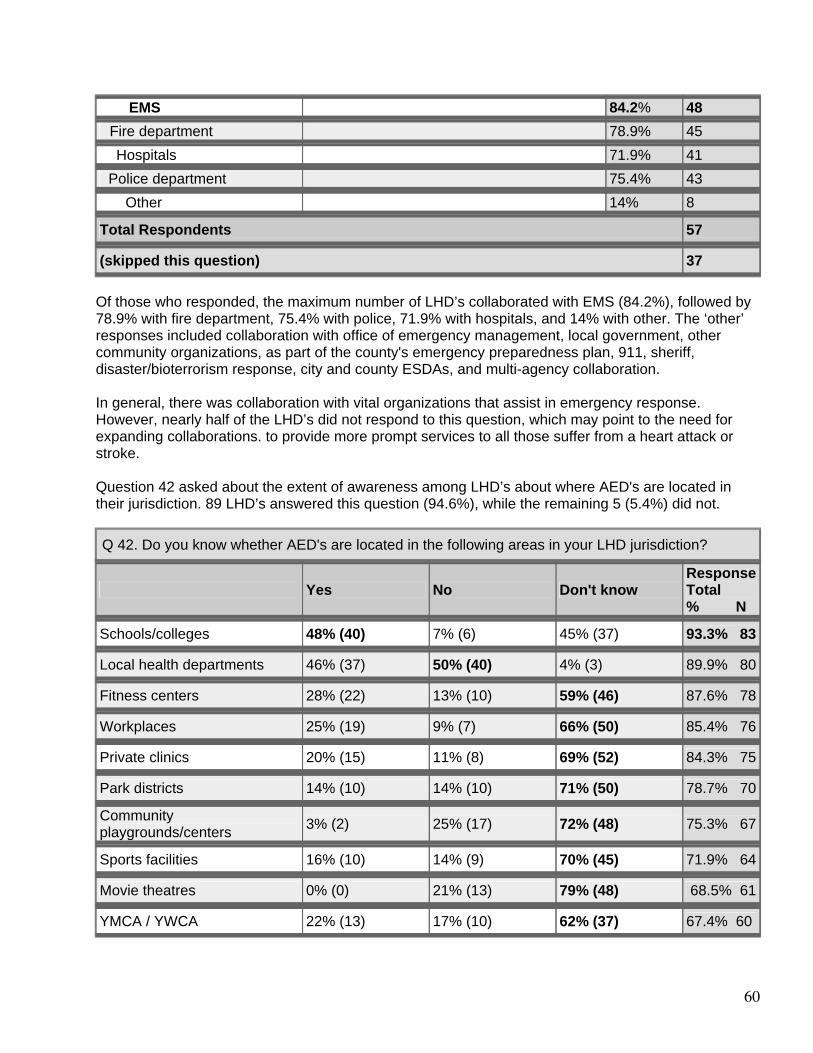
60
EMS 84.2% 48
Fire department 78.9% 45
Hospitals 71.9% 41
Police department 75.4% 43 Other 14% 8
Total Respondents 57
(skipped this question) 37 Of those who responded, the maximum number of LHD’s collaborated with EMS (84.2%), followed by 78.9% with fire department, 75.4% with police, 71.9% with hospitals, and 14% with other. The ‘other’ responses included collaboration with office of emergency management, local government, other community organizations, as part of the county's emergency preparedness plan, 911, sheriff, disaster/bioterrorism response, city and county ESDAs, and multi-agency collaboration. In general, there was collaboration with vital organizations that assist in emergency response. However, nearly half of the LHD’s did not respond to this question, which may point to the need for expanding collaborations. to provide more prompt services to all those suffer from a heart attack or stroke. Question 42 asked about the extent of awareness among LHD’s about where AED's are located in their jurisdiction. 89 LHD’s answered this question (94.6%), while the remaining 5 (5.4%) did not.
Q 42. Do you know whether AED's are located in the following areas in your LHD jurisdiction?
Yes No Don't know Response Total % N
Schools/colleges 48% (40) 7% (6) 45% (37) 93.3% 83
Local health departments 46% (37) 50% (40) 4% (3) 89.9% 80
Fitness centers 28% (22) 13% (10) 59% (46) 87.6% 78
Workplaces 25% (19) 9% (7) 66% (50) 85.4% 76
Private clinics 20% (15) 11% (8) 69% (52) 84.3% 75
Park districts 14% (10) 14% (10) 71% (50) 78.7% 70
Community playgrounds/centers
3% (2) 25% (17) 72% (48) 75.3% 67
Sports facilities 16% (10) 14% (9) 70% (45) 71.9% 64
Movie theatres 0% (0) 21% (13) 79% (48) 68.5% 61
YMCA / YWCA 22% (13) 17% (10) 62% (37) 67.4% 60
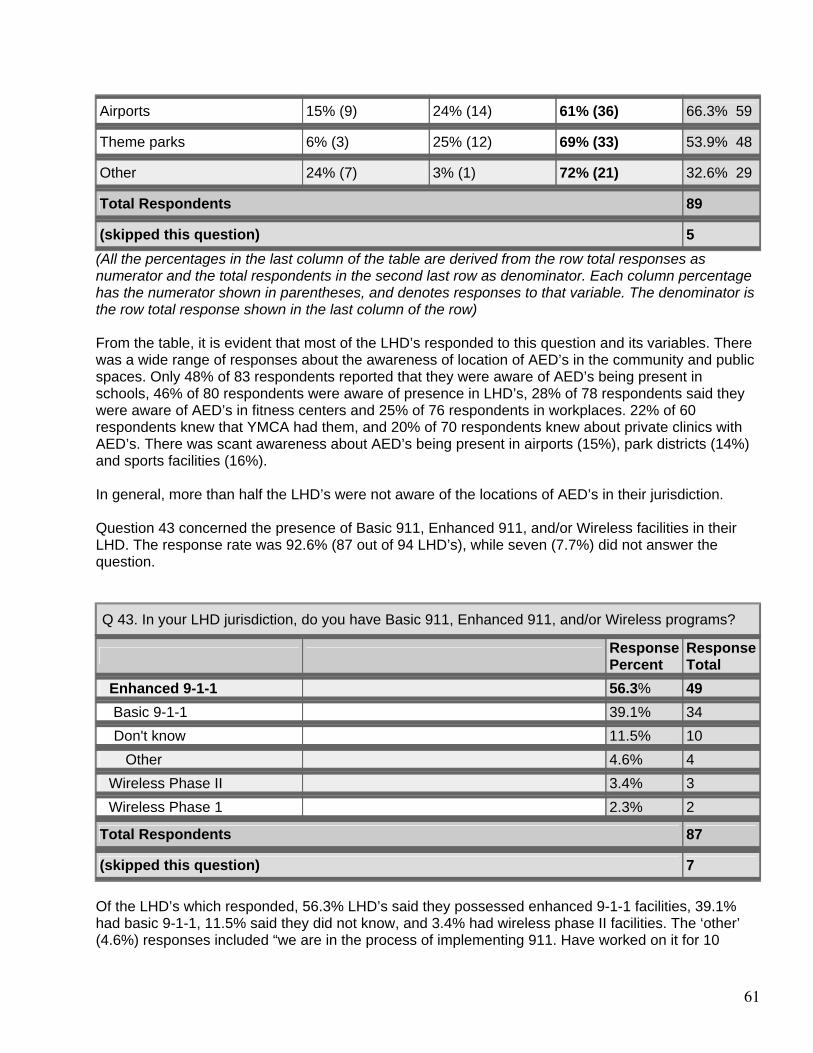
61
Airports 15% (9) 24% (14) 61% (36) 66.3% 59
Theme parks 6% (3) 25% (12) 69% (33) 53.9% 48
Other 24% (7) 3% (1) 72% (21) 32.6% 29
Total Respondents 89
(skipped this question) 5 (All the percentages in the last column of the table are derived from the row total responses as numerator and the total respondents in the second last row as denominator. Each column percentage has the numerator shown in parentheses, and denotes responses to that variable. The denominator is the row total response shown in the last column of the row) From the table, it is evident that most of the LHD’s responded to this question and its variables. There was a wide range of responses about the awareness of location of AED’s in the community and public spaces. Only 48% of 83 respondents reported that they were aware of AED’s being present in schools, 46% of 80 respondents were aware of presence in LHD’s, 28% of 78 respondents said they were aware of AED’s in fitness centers and 25% of 76 respondents in workplaces. 22% of 60 respondents knew that YMCA had them, and 20% of 70 respondents knew about private clinics with AED’s. There was scant awareness about AED’s being present in airports (15%), park districts (14%) and sports facilities (16%). In general, more than half the LHD’s were not aware of the locations of AED’s in their jurisdiction. Question 43 concerned the presence of Basic 911, Enhanced 911, and/or Wireless facilities in their LHD. The response rate was 92.6% (87 out of 94 LHD’s), while seven (7.7%) did not answer the question.
Q 43. In your LHD jurisdiction, do you have Basic 911, Enhanced 911, and/or Wireless programs?
Response Percent
Response Total
Enhanced 9-1-1 56.3% 49
Basic 9-1-1 39.1% 34
Don't know 11.5% 10 Other 4.6% 4
Wireless Phase II 3.4% 3
Wireless Phase 1 2.3% 2
Total Respondents 87
(skipped this question) 7 Of the LHD’s which responded, 56.3% LHD’s said they possessed enhanced 9-1-1 facilities, 39.1% had basic 9-1-1, 11.5% said they did not know, and 3.4% had wireless phase II facilities. The ‘other’ (4.6%) responses included “we are in the process of implementing 911. Have worked on it for 10
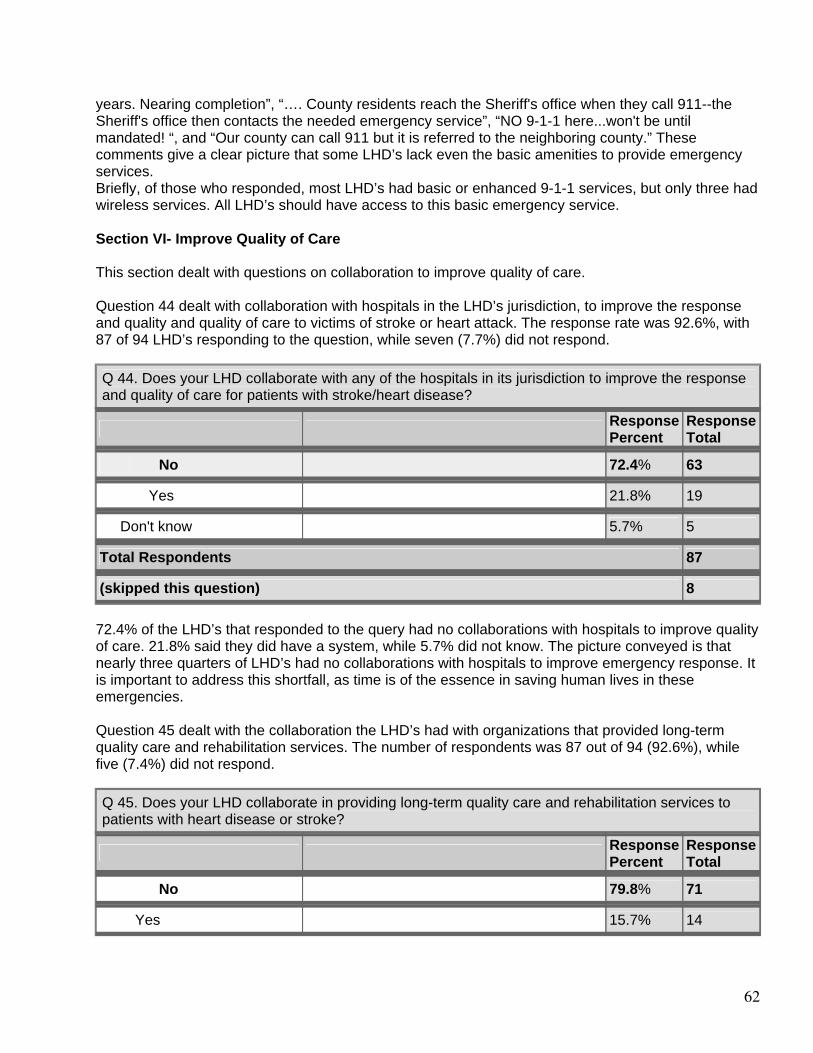
62
years. Nearing completion”, “…. County residents reach the Sheriff's office when they call 911--the Sheriff's office then contacts the needed emergency service”, “NO 9-1-1 here...won't be until mandated! “, and “Our county can call 911 but it is referred to the neighboring county.” These comments give a clear picture that some LHD’s lack even the basic amenities to provide emergency services. Briefly, of those who responded, most LHD’s had basic or enhanced 9-1-1 services, but only three had wireless services. All LHD’s should have access to this basic emergency service. Section VI- Improve Quality of Care This section dealt with questions on collaboration to improve quality of care. Question 44 dealt with collaboration with hospitals in the LHD’s jurisdiction, to improve the response and quality and quality of care to victims of stroke or heart attack. The response rate was 92.6%, with 87 of 94 LHD’s responding to the question, while seven (7.7%) did not respond.
Q 44. Does your LHD collaborate with any of the hospitals in its jurisdiction to improve the response and quality of care for patients with stroke/heart disease?
Response Percent
Response Total
No 72.4% 63
Yes 21.8% 19
Don't know 5.7% 5
Total Respondents 87
(skipped this question) 8 72.4% of the LHD’s that responded to the query had no collaborations with hospitals to improve quality of care. 21.8% said they did have a system, while 5.7% did not know. The picture conveyed is that nearly three quarters of LHD’s had no collaborations with hospitals to improve emergency response. It is important to address this shortfall, as time is of the essence in saving human lives in these emergencies. Question 45 dealt with the collaboration the LHD’s had with organizations that provided long-term quality care and rehabilitation services. The number of respondents was 87 out of 94 (92.6%), while five (7.4%) did not respond.
Q 45. Does your LHD collaborate in providing long-term quality care and rehabilitation services to patients with heart disease or stroke?
Response Percent
Response Total
No 79.8% 71
Yes 15.7% 14
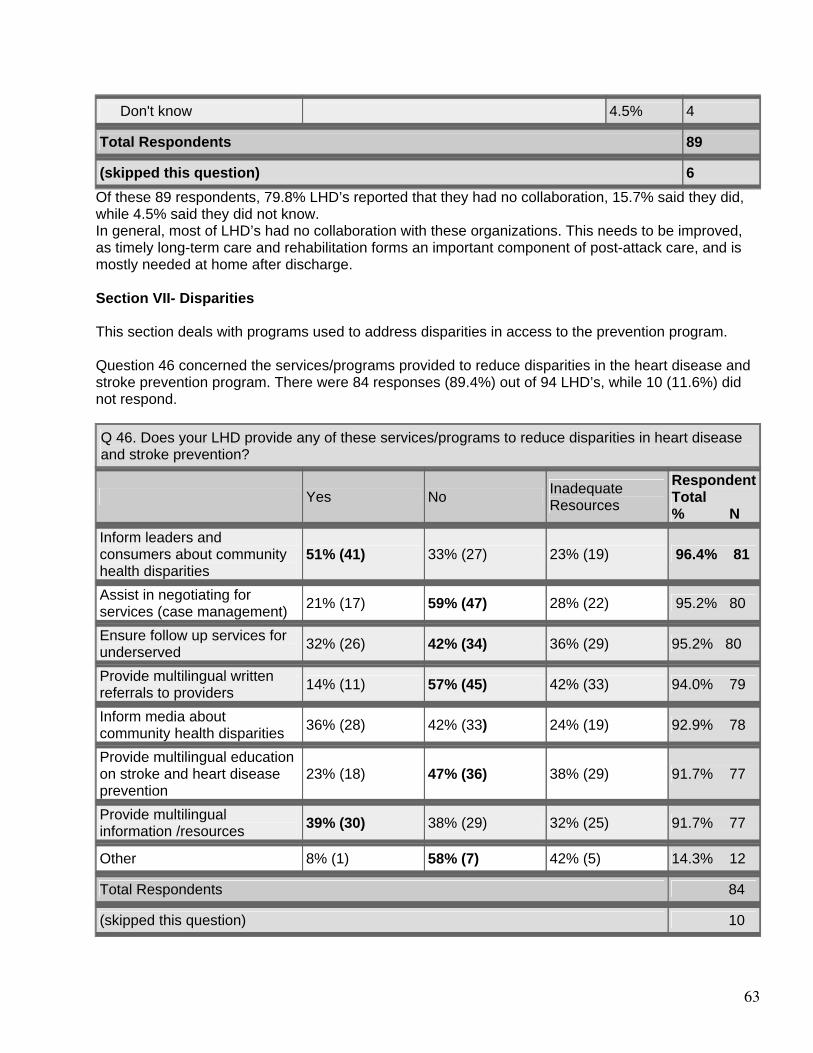
63
Don't know 4.5% 4
Total Respondents 89
(skipped this question) 6 Of these 89 respondents, 79.8% LHD’s reported that they had no collaboration, 15.7% said they did, while 4.5% said they did not know. In general, most of LHD’s had no collaboration with these organizations. This needs to be improved, as timely long-term care and rehabilitation forms an important component of post-attack care, and is mostly needed at home after discharge. Section VII- Disparities This section deals with programs used to address disparities in access to the prevention program. Question 46 concerned the services/programs provided to reduce disparities in the heart disease and stroke prevention program. There were 84 responses (89.4%) out of 94 LHD’s, while 10 (11.6%) did not respond. Q 46. Does your LHD provide any of these services/programs to reduce disparities in heart disease and stroke prevention?
Yes No Inadequate Resources
Respondent Total % N
Inform leaders and consumers about community health disparities
51% (41) 33% (27) 23% (19) 96.4% 81
Assist in negotiating for services (case management)
21% (17) 59% (47) 28% (22) 95.2% 80
Ensure follow up services for underserved
32% (26) 42% (34) 36% (29) 95.2% 80
Provide multilingual written referrals to providers
14% (11) 57% (45) 42% (33) 94.0% 79
Inform media about community health disparities
36% (28) 42% (33) 24% (19) 92.9% 78
Provide multilingual education on stroke and heart disease prevention
23% (18) 47% (36) 38% (29) 91.7% 77
Provide multilingual information /resources
39% (30) 38% (29) 32% (25) 91.7% 77
Other 8% (1) 58% (7) 42% (5) 14.3% 12
Total Respondents 84
(skipped this question) 10
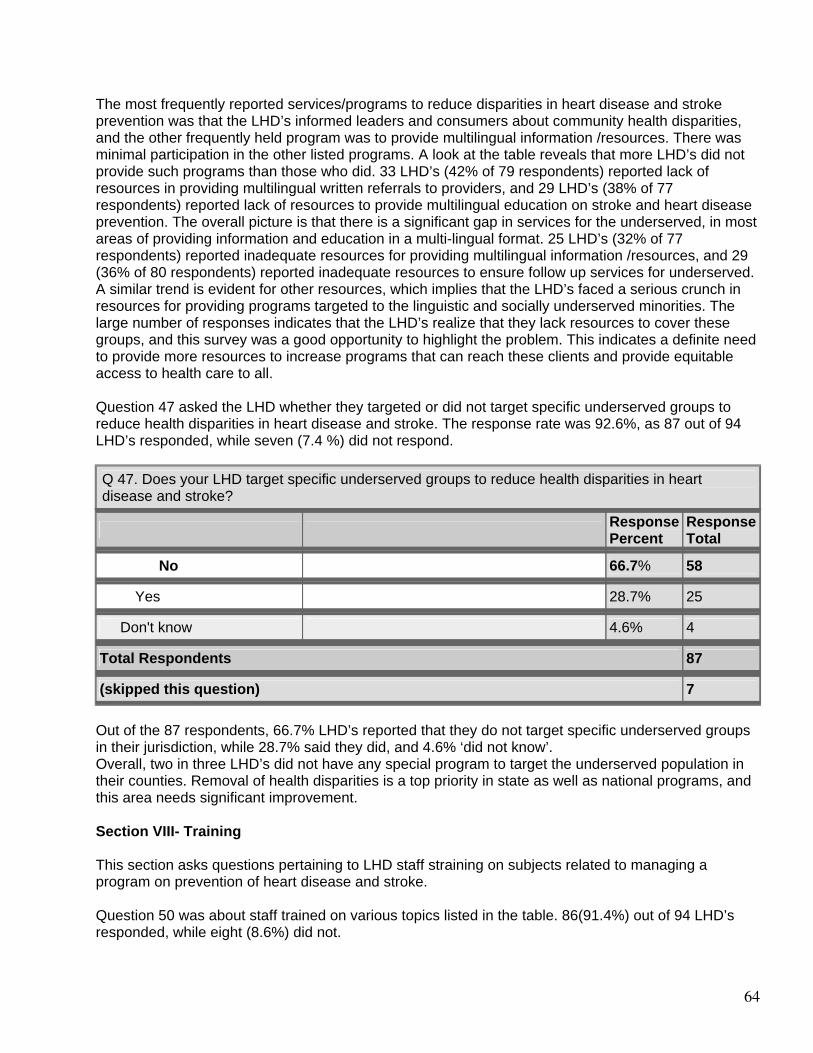
64
The most frequently reported services/programs to reduce disparities in heart disease and stroke prevention was that the LHD’s informed leaders and consumers about community health disparities, and the other frequently held program was to provide multilingual information /resources. There was minimal participation in the other listed programs. A look at the table reveals that more LHD’s did not provide such programs than those who did. 33 LHD’s (42% of 79 respondents) reported lack of resources in providing multilingual written referrals to providers, and 29 LHD’s (38% of 77 respondents) reported lack of resources to provide multilingual education on stroke and heart disease prevention. The overall picture is that there is a significant gap in services for the underserved, in most areas of providing information and education in a multi-lingual format. 25 LHD’s (32% of 77 respondents) reported inadequate resources for providing multilingual information /resources, and 29 (36% of 80 respondents) reported inadequate resources to ensure follow up services for underserved. A similar trend is evident for other resources, which implies that the LHD’s faced a serious crunch in resources for providing programs targeted to the linguistic and socially underserved minorities. The large number of responses indicates that the LHD’s realize that they lack resources to cover these groups, and this survey was a good opportunity to highlight the problem. This indicates a definite need to provide more resources to increase programs that can reach these clients and provide equitable access to health care to all. Question 47 asked the LHD whether they targeted or did not target specific underserved groups to reduce health disparities in heart disease and stroke. The response rate was 92.6%, as 87 out of 94 LHD’s responded, while seven (7.4 %) did not respond.
Q 47. Does your LHD target specific underserved groups to reduce health disparities in heart disease and stroke?
Response Percent
Response Total
No 66.7% 58
Yes 28.7% 25
Don't know 4.6% 4
Total Respondents 87
(skipped this question) 7 Out of the 87 respondents, 66.7% LHD’s reported that they do not target specific underserved groups in their jurisdiction, while 28.7% said they did, and 4.6% ‘did not know’. Overall, two in three LHD’s did not have any special program to target the underserved population in their counties. Removal of health disparities is a top priority in state as well as national programs, and this area needs significant improvement. Section VIII- Training This section asks questions pertaining to LHD staff straining on subjects related to managing a program on prevention of heart disease and stroke. Question 50 was about staff trained on various topics listed in the table. 86(91.4%) out of 94 LHD’s responded, while eight (8.6%) did not.
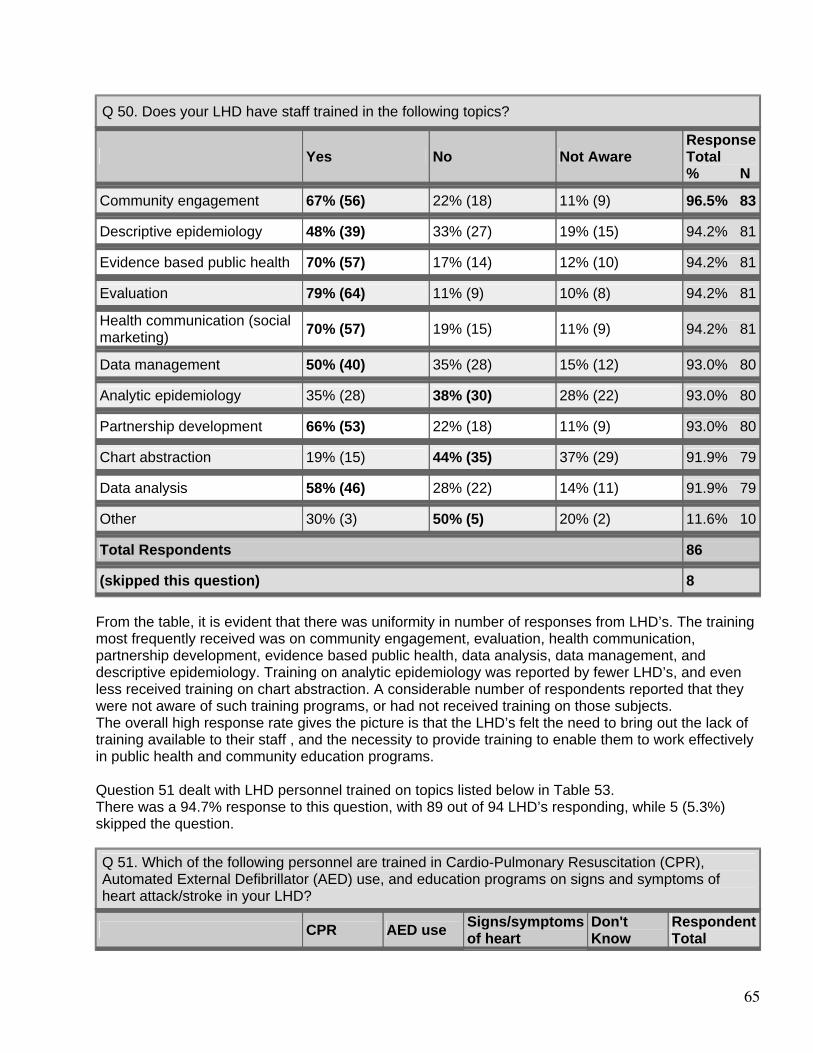
65
Q 50. Does your LHD have staff trained in the following topics?
Yes No Not Aware Response Total % N
Community engagement 67% (56) 22% (18) 11% (9) 96.5% 83
Descriptive epidemiology 48% (39) 33% (27) 19% (15) 94.2% 81
Evidence based public health 70% (57) 17% (14) 12% (10) 94.2% 81
Evaluation 79% (64) 11% (9) 10% (8) 94.2% 81
Health communication (social marketing)
70% (57) 19% (15) 11% (9) 94.2% 81
Data management 50% (40) 35% (28) 15% (12) 93.0% 80
Analytic epidemiology 35% (28) 38% (30) 28% (22) 93.0% 80
Partnership development 66% (53) 22% (18) 11% (9) 93.0% 80
Chart abstraction 19% (15) 44% (35) 37% (29) 91.9% 79
Data analysis 58% (46) 28% (22) 14% (11) 91.9% 79
Other 30% (3) 50% (5) 20% (2) 11.6% 10
Total Respondents 86
(skipped this question) 8 From the table, it is evident that there was uniformity in number of responses from LHD’s. The training most frequently received was on community engagement, evaluation, health communication, partnership development, evidence based public health, data analysis, data management, and descriptive epidemiology. Training on analytic epidemiology was reported by fewer LHD’s, and even less received training on chart abstraction. A considerable number of respondents reported that they were not aware of such training programs, or had not received training on those subjects. The overall high response rate gives the picture is that the LHD’s felt the need to bring out the lack of training available to their staff , and the necessity to provide training to enable them to work effectively in public health and community education programs. Question 51 dealt with LHD personnel trained on topics listed below in Table 53. There was a 94.7% response to this question, with 89 out of 94 LHD’s responding, while 5 (5.3%) skipped the question.
Q 51. Which of the following personnel are trained in Cardio-Pulmonary Resuscitation (CPR), Automated External Defibrillator (AED) use, and education programs on signs and symptoms of heart attack/stroke in your LHD?
CPR AED use Signs/symptoms of heart
Don't Know
Respondent Total
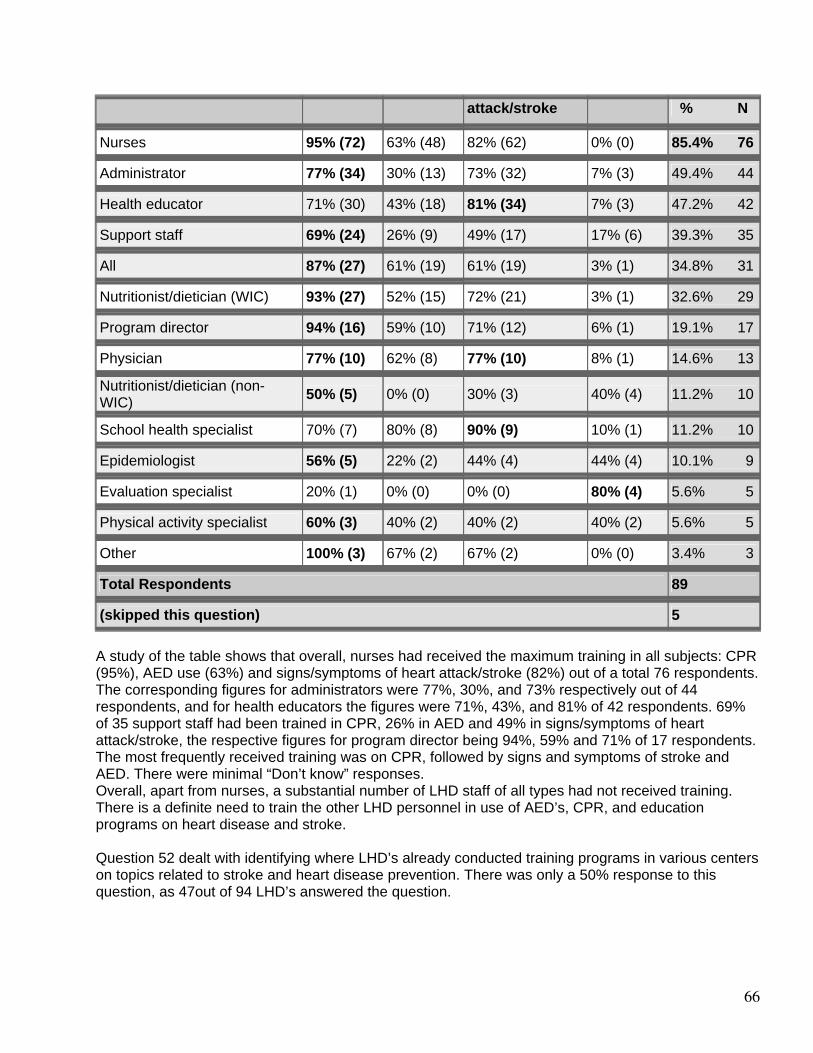
66
attack/stroke % N
Nurses 95% (72) 63% (48) 82% (62) 0% (0) 85.4% 76
Administrator 77% (34) 30% (13) 73% (32) 7% (3) 49.4% 44
Health educator 71% (30) 43% (18) 81% (34) 7% (3) 47.2% 42
Support staff 69% (24) 26% (9) 49% (17) 17% (6) 39.3% 35
All 87% (27) 61% (19) 61% (19) 3% (1) 34.8% 31
Nutritionist/dietician (WIC) 93% (27) 52% (15) 72% (21) 3% (1) 32.6% 29
Program director 94% (16) 59% (10) 71% (12) 6% (1) 19.1% 17
Physician 77% (10) 62% (8) 77% (10) 8% (1) 14.6% 13
Nutritionist/dietician (non-WIC)
50% (5) 0% (0) 30% (3) 40% (4) 11.2% 10
School health specialist 70% (7) 80% (8) 90% (9) 10% (1) 11.2% 10
Epidemiologist 56% (5) 22% (2) 44% (4) 44% (4) 10.1% 9
Evaluation specialist 20% (1) 0% (0) 0% (0) 80% (4) 5.6% 5
Physical activity specialist 60% (3) 40% (2) 40% (2) 40% (2) 5.6% 5
Other 100% (3) 67% (2) 67% (2) 0% (0) 3.4% 3
Total Respondents 89
(skipped this question) 5 A study of the table shows that overall, nurses had received the maximum training in all subjects: CPR (95%), AED use (63%) and signs/symptoms of heart attack/stroke (82%) out of a total 76 respondents. The corresponding figures for administrators were 77%, 30%, and 73% respectively out of 44 respondents, and for health educators the figures were 71%, 43%, and 81% of 42 respondents. 69% of 35 support staff had been trained in CPR, 26% in AED and 49% in signs/symptoms of heart attack/stroke, the respective figures for program director being 94%, 59% and 71% of 17 respondents. The most frequently received training was on CPR, followed by signs and symptoms of stroke and AED. There were minimal “Don’t know” responses. Overall, apart from nurses, a substantial number of LHD staff of all types had not received training. There is a definite need to train the other LHD personnel in use of AED’s, CPR, and education programs on heart disease and stroke. Question 52 dealt with identifying where LHD’s already conducted training programs in various centers on topics related to stroke and heart disease prevention. There was only a 50% response to this question, as 47out of 94 LHD’s answered the question.
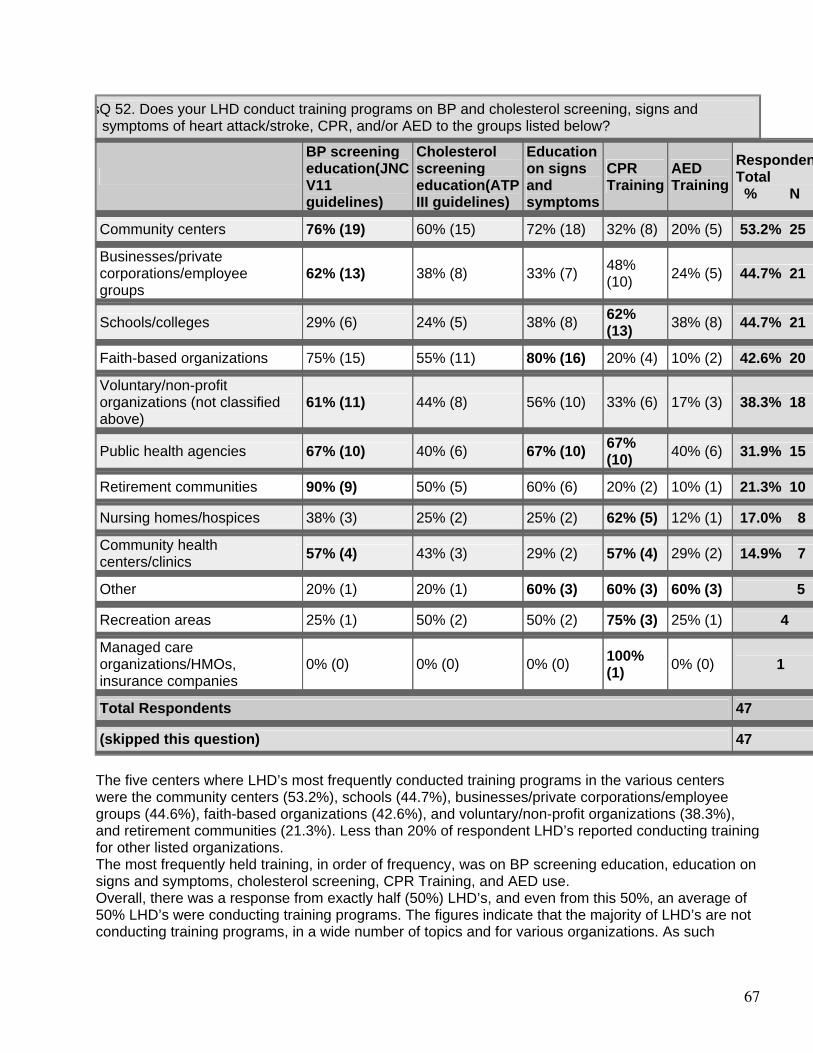
67
sQ 52. Does your LHD conduct training programs on BP and cholesterol screening, signs and
symptoms of heart attack/stroke, CPR, and/or AED to the groups listed below?
BP screening education(JNC V11 guidelines)
Cholesterol screening education(ATP III guidelines)
Education on signs and symptoms
CPR Training
AED Training
RespondenTotal % N
Community centers 76% (19) 60% (15) 72% (18) 32% (8) 20% (5) 53.2% 25
Businesses/private corporations/employee groups
62% (13) 38% (8) 33% (7) 48% (10) 24% (5) 44.7% 21
Schools/colleges 29% (6) 24% (5) 38% (8) 62% (13) 38% (8) 44.7% 21
Faith-based organizations 75% (15) 55% (11) 80% (16) 20% (4) 10% (2) 42.6% 20
Voluntary/non-profit organizations (not classified above)
61% (11) 44% (8) 56% (10) 33% (6) 17% (3) 38.3% 18
Public health agencies 67% (10) 40% (6) 67% (10) 67% (10) 40% (6) 31.9% 15
Retirement communities 90% (9) 50% (5) 60% (6) 20% (2) 10% (1) 21.3% 10
Nursing homes/hospices 38% (3) 25% (2) 25% (2) 62% (5) 12% (1) 17.0% 8
Community health centers/clinics
57% (4) 43% (3) 29% (2) 57% (4) 29% (2) 14.9% 7
Other 20% (1) 20% (1) 60% (3) 60% (3) 60% (3) 5
Recreation areas 25% (1) 50% (2) 50% (2) 75% (3) 25% (1) 4
Managed care organizations/HMOs, insurance companies
0% (0) 0% (0) 0% (0) 100% (1) 0% (0) 1
Total Respondents 47
(skipped this question) 47 The five centers where LHD’s most frequently conducted training programs in the various centers were the community centers (53.2%), schools (44.7%), businesses/private corporations/employee groups (44.6%), faith-based organizations (42.6%), and voluntary/non-profit organizations (38.3%), and retirement communities (21.3%). Less than 20% of respondent LHD’s reported conducting training for other listed organizations. The most frequently held training, in order of frequency, was on BP screening education, education on signs and symptoms, cholesterol screening, CPR Training, and AED use. Overall, there was a response from exactly half (50%) LHD’s, and even from this 50%, an average of 50% LHD’s were conducting training programs. The figures indicate that the majority of LHD’s are not conducting training programs, in a wide number of topics and for various organizations. As such
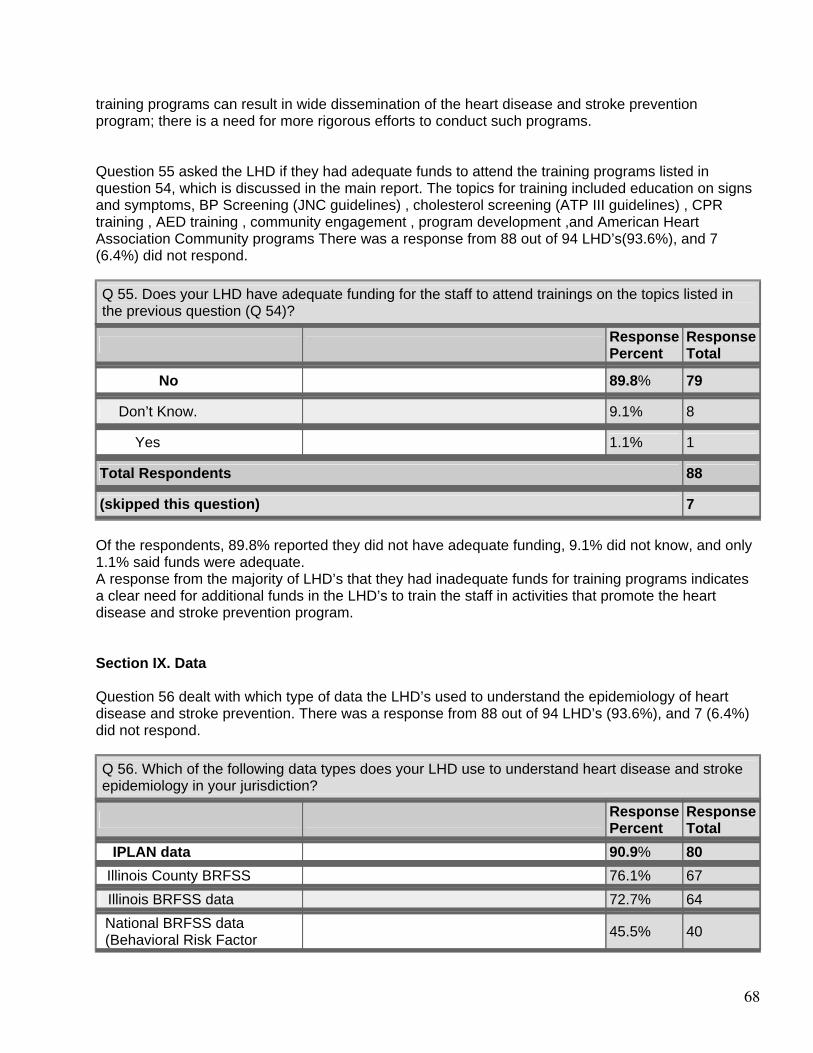
68
training programs can result in wide dissemination of the heart disease and stroke prevention program; there is a need for more rigorous efforts to conduct such programs. Question 55 asked the LHD if they had adequate funds to attend the training programs listed in question 54, which is discussed in the main report. The topics for training included education on signs and symptoms, BP Screening (JNC guidelines) , cholesterol screening (ATP III guidelines) , CPR training , AED training , community engagement , program development ,and American Heart Association Community programs There was a response from 88 out of 94 LHD’s(93.6%), and 7 (6.4%) did not respond.
Q 55. Does your LHD have adequate funding for the staff to attend trainings on the topics listed in the previous question (Q 54)?
Response Percent
Response Total
No 89.8% 79
Don’t Know. 9.1% 8
Yes 1.1% 1
Total Respondents 88
(skipped this question) 7 Of the respondents, 89.8% reported they did not have adequate funding, 9.1% did not know, and only 1.1% said funds were adequate. A response from the majority of LHD’s that they had inadequate funds for training programs indicates a clear need for additional funds in the LHD’s to train the staff in activities that promote the heart disease and stroke prevention program. Section IX. Data Question 56 dealt with which type of data the LHD’s used to understand the epidemiology of heart disease and stroke prevention. There was a response from 88 out of 94 LHD’s (93.6%), and 7 (6.4%) did not respond.
Q 56. Which of the following data types does your LHD use to understand heart disease and stroke epidemiology in your jurisdiction?
Response Percent
Response Total
IPLAN data 90.9% 80
Illinois County BRFSS 76.1% 67
Illinois BRFSS data 72.7% 64
National BRFSS data (Behavioral Risk Factor 45.5% 40
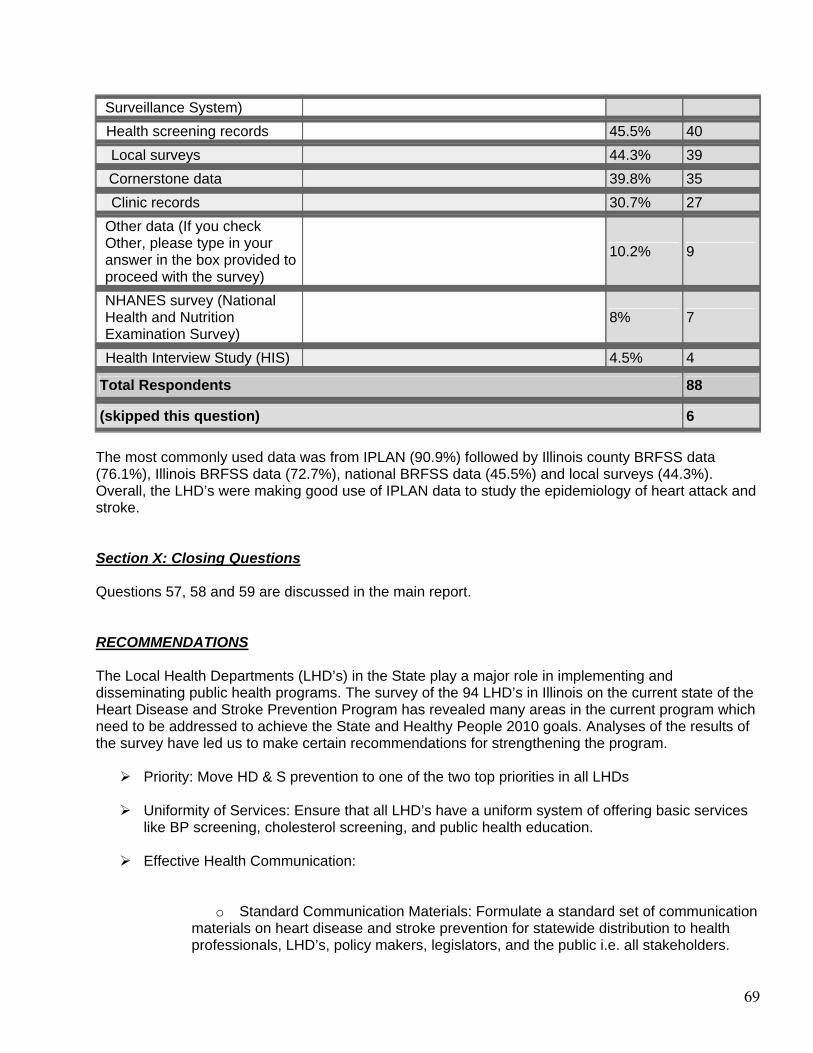
69
Surveillance System) Health screening records 45.5% 40
Local surveys 44.3% 39
Cornerstone data 39.8% 35
Clinic records 30.7% 27
Other data (If you check Other, please type in your answer in the box provided to proceed with the survey)
10.2% 9
NHANES survey (National Health and Nutrition Examination Survey)
8% 7
Health Interview Study (HIS) 4.5% 4
Total Respondents 88
(skipped this question) 6 The most commonly used data was from IPLAN (90.9%) followed by Illinois county BRFSS data (76.1%), Illinois BRFSS data (72.7%), national BRFSS data (45.5%) and local surveys (44.3%). Overall, the LHD’s were making good use of IPLAN data to study the epidemiology of heart attack and stroke. Section X: Closing Questions Questions 57, 58 and 59 are discussed in the main report. RECOMMENDATIONS The Local Health Departments (LHD’s) in the State play a major role in implementing and disseminating public health programs. The survey of the 94 LHD’s in Illinois on the current state of the Heart Disease and Stroke Prevention Program has revealed many areas in the current program which need to be addressed to achieve the State and Healthy People 2010 goals. Analyses of the results of the survey have led us to make certain recommendations for strengthening the program.
Priority: Move HD & S prevention to one of the two top priorities in all LHDs
Uniformity of Services: Ensure that all LHD’s have a uniform system of offering basic services like BP screening, cholesterol screening, and public health education.
Effective Health Communication:
o Standard Communication Materials: Formulate a standard set of communication materials on heart disease and stroke prevention for statewide distribution to health professionals, LHD’s, policy makers, legislators, and the public i.e. all stakeholders.
70
These materials should reflect evidence–based recommendations and be consistent with the current acceptable standards of care.
o Should be consistently available (no photocopies). o Create a Public Information Campaign for statewide dissemination: craft easily
understood messages on cardio-vascular health, its risk factors and consequences of neglect; messages on how to recognize a heart attack or stroke and how and where to access help in an emergency. Assess the feasibility of using mass media like radio and TV to increase reach of the program.
o Long-term dissemination: The strategy needs to be implemented over a period of at least 2-5 years for the impact to be felt. A repetitive or cyclic campaign will be more effective in reaching target populations.
o Sustainability: the campaign should be sustainable to overcome public prejudices and beat the competition from commercial food competitors
Partnerships and Collaborations:
1. National:
o Encourage more collaboration with national organizations like American Heart Association and NINDS,CDC etc for information, materials, and help with screening for BP, cholesterol
2. State:
o Encourage state health departments to promote more inter-LHD partnerships and resource sharing in implementing this program
o Involve other public health agencies like environment and agriculture to promote healthy eating and physical activity initiative.
o Permit some latitude in fund spending when conducting programs
3. Private Sector:
o Promote more involvement at the state level to form collaborations with private organizations like insurance companies and pharmaceutical companies. Collaborations to be forged at headquarters and implemented in counties.
4. Community partnerships:
o Encourage LHD’s to form partnerships by providing resources for such activities e.g. audio-visual aids and education materials, funds, printed education materials.
o Encourage involvement of faith-based organizations, minority groups, schools, local media, primary health centers, hospices, work places. retirement communities, hospitals etc in conducting screening and education activities
o Forge new coalitions to promote the program in the community
5. Public Sector:
71
o Promote partnerships with EMS, police, hospitals to o Improve emergency response
Strengthen Cholesterol Screening:
o Provide all LHD’s with the facility to provide screening per ATP III guidelines o Make official affiliations with outside, certified organizations that provide free or
paid services where individuals can be referred, to ensure accurate results o Provide accurate record keeping and follow up reminder systems in all LHD’s o Provide a list of authorized clinics for referral for treatment/tests o Provide a standard education kit/ talk in all LHD’s to all those screened
Strengthen BP Screening:
o Provide all LHD’s with the facility to provide screening per JNC VII guidelines o Provide facilities for accurate record keeping e.g. EMR’s o Issue timely reminders for follow up BP checks o Provide standard referral to a physician to all people with high BP. The patient
may choose his own physician if he wishes o Provide uniform education about risks/prevention and give standard handouts to
all those screened
Provide Training to LHD Staff:
o On cardiovascular health education/promotion, standardized BP and cholesterol screening, community health partnership promotion strategies, AED and CPR
o Data maintenance o Use their services to train others in the communities o On Developing and maintaining partnerships and coalitions o On Community mobilization for effective action o On using health communications effectively o Defining and identifying the burden and status of chronic o disease o Develop a training module in consultation with clinicians, academia, voluntary
associations, and public health agencies. This module can be disseminated to all local and public health agencies. This will ensure uniformity, topicality, and reliability
Reduce Disparities:
o Increase provision of education materials in Spanish and other languages o Conduct culturally appropriate interventions targeted to
priority populations o Train community volunteers from underserved groups in CVD prevention in
LHD’s and encourage dissemination in communities o Provide multilingual programs in LHD’s o Use media for mass dissemination of messages in Spanish o Provide services to uninsured at LHD’s
72
Increase Funding/Staff to LHD’s:
o Effective social marketing of the program needs material, physical, human, and economic resources. To make a success of the program, more funds and resources need to be allocated to the heart disease and stroke prevention program
Conclusion After analyzing the results of the survey, it is obvious that the heart disease and stroke prevention program of IDPH needs to be improved and strengthened in most areas, to enhance its reach and dissemination, and to achieve 2010 Healthy People goals. It implies concerted efforts at the LHD, State and national level to implement uniform policies for training the staff in public education on the subject; ensure that the LHD’s follow a standardized method of screening; and seek collaborations with all stakeholders in the community and business sector to expand services and share costs. Paucity of funds, material, staff, and training resources, coupled with limited time available to devote exclusively to a single program, are the main reasons for the LHD’s present performance as revealed in the survey. There is a definite call for increased funding to fulfill the needs to make this program a success.
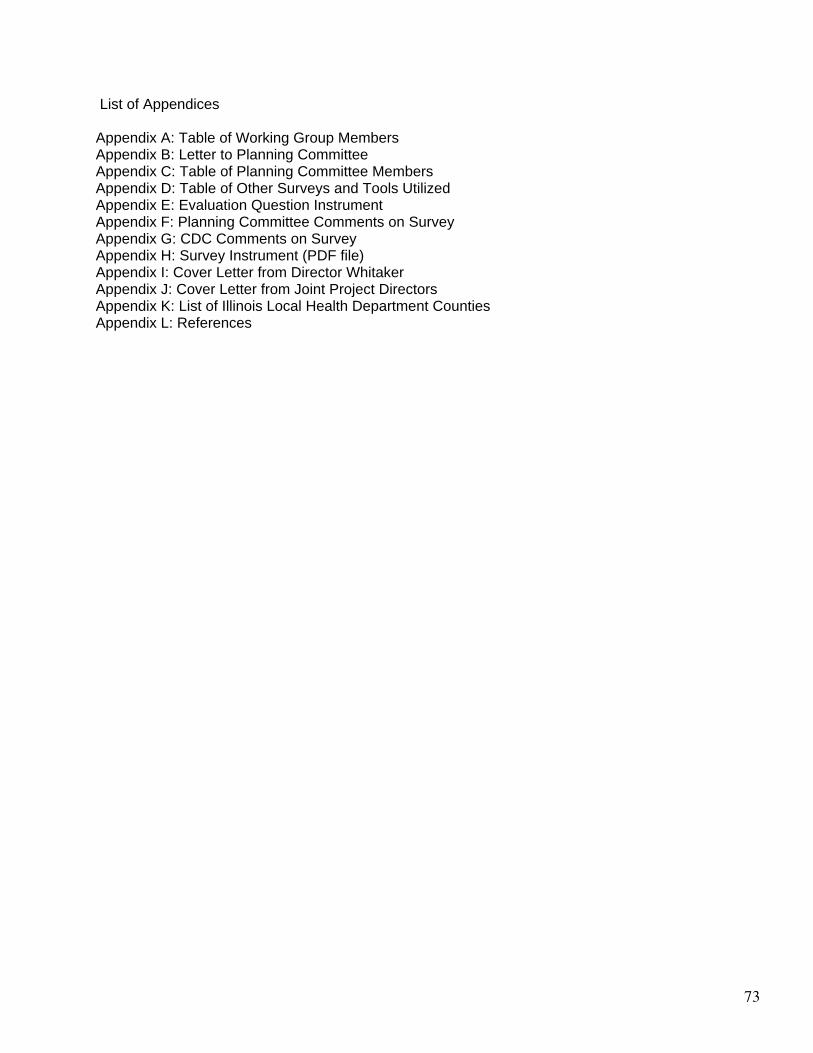
73
List of Appendices Appendix A: Table of Working Group Members Appendix B: Letter to Planning Committee Appendix C: Table of Planning Committee Members Appendix D: Table of Other Surveys and Tools Utilized Appendix E: Evaluation Question Instrument Appendix F: Planning Committee Comments on Survey Appendix G: CDC Comments on Survey Appendix H: Survey Instrument (PDF file) Appendix I: Cover Letter from Director Whitaker Appendix J: Cover Letter from Joint Project Directors Appendix K: List of Illinois Local Health Department Counties Appendix L: References
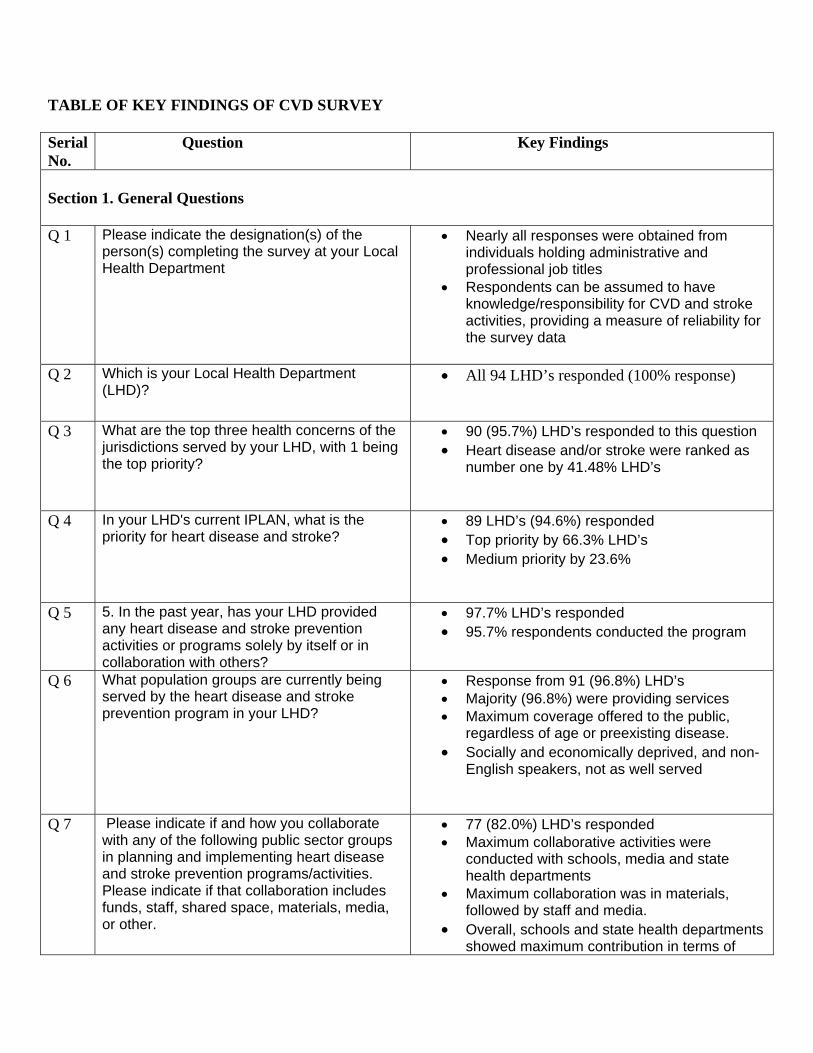
TABLE OF KEY FINDINGS OF CVD SURVEY Serial No.
Question Key Findings
Section 1. General Questions Q 1 Please indicate the designation(s) of the
person(s) completing the survey at your Local Health Department
• Nearly all responses were obtained from individuals holding administrative and professional job titles
• Respondents can be assumed to have knowledge/responsibility for CVD and stroke activities, providing a measure of reliability for the survey data
Q 2 Which is your Local Health Department
(LHD)? • All 94 LHD’s responded (100% response)
Q 3 What are the top three health concerns of the jurisdictions served by your LHD, with 1 being the top priority?
• 90 (95.7%) LHD’s responded to this question • Heart disease and/or stroke were ranked as
number one by 41.48% LHD’s
Q 4 In your LHD's current IPLAN, what is the priority for heart disease and stroke?
• 89 LHD’s (94.6%) responded • Top priority by 66.3% LHD’s • Medium priority by 23.6%
Q 5 5. In the past year, has your LHD provided any heart disease and stroke prevention activities or programs solely by itself or in collaboration with others?
• 97.7% LHD’s responded • 95.7% respondents conducted the program
Q 6 What population groups are currently being served by the heart disease and stroke prevention program in your LHD?
• Response from 91 (96.8%) LHD’s • Majority (96.8%) were providing services • Maximum coverage offered to the public,
regardless of age or preexisting disease. • Socially and economically deprived, and non-
English speakers, not as well served
Q 7 Please indicate if and how you collaborate with any of the following public sector groups in planning and implementing heart disease and stroke prevention programs/activities. Please indicate if that collaboration includes funds, staff, shared space, materials, media, or other.
• 77 (82.0%) LHD’s responded • Maximum collaborative activities were
conducted with schools, media and state health departments
• Maximum collaboration was in materials, followed by staff and media.
• Overall, schools and state health departments showed maximum contribution in terms of
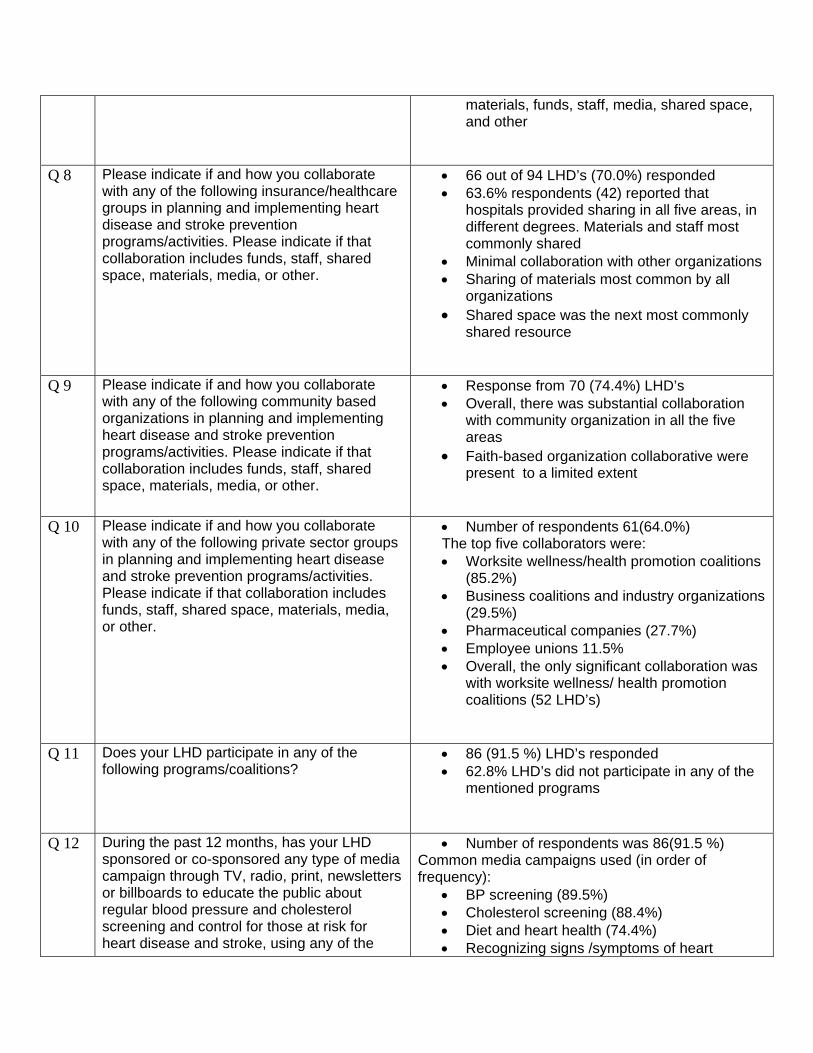
materials, funds, staff, media, shared space, and other
Q 8 Please indicate if and how you collaborate with any of the following insurance/healthcare groups in planning and implementing heart disease and stroke prevention programs/activities. Please indicate if that collaboration includes funds, staff, shared space, materials, media, or other.
• 66 out of 94 LHD’s (70.0%) responded • 63.6% respondents (42) reported that
hospitals provided sharing in all five areas, in different degrees. Materials and staff most commonly shared
• Minimal collaboration with other organizations • Sharing of materials most common by all
organizations • Shared space was the next most commonly
shared resource
Q 9 Please indicate if and how you collaborate with any of the following community based organizations in planning and implementing heart disease and stroke prevention programs/activities. Please indicate if that collaboration includes funds, staff, shared space, materials, media, or other.
• Response from 70 (74.4%) LHD’s • Overall, there was substantial collaboration
with community organization in all the five areas
• Faith-based organization collaborative were present to a limited extent
Q 10 Please indicate if and how you collaborate with any of the following private sector groups in planning and implementing heart disease and stroke prevention programs/activities. Please indicate if that collaboration includes funds, staff, shared space, materials, media, or other.
• Number of respondents 61(64.0%) The top five collaborators were: • Worksite wellness/health promotion coalitions
(85.2%) • Business coalitions and industry organizations
(29.5%) • Pharmaceutical companies (27.7%) • Employee unions 11.5% • Overall, the only significant collaboration was
with worksite wellness/ health promotion coalitions (52 LHD’s)
Q 11 Does your LHD participate in any of the following programs/coalitions?
• 86 (91.5 %) LHD’s responded • 62.8% LHD’s did not participate in any of the
mentioned programs
Q 12 During the past 12 months, has your LHD sponsored or co-sponsored any type of media campaign through TV, radio, print, newsletters or billboards to educate the public about regular blood pressure and cholesterol screening and control for those at risk for heart disease and stroke, using any of the
• Number of respondents was 86(91.5 %) Common media campaigns used (in order of frequency):
• BP screening (89.5%) • Cholesterol screening (88.4%) • Diet and heart health (74.4%) • Recognizing signs /symptoms of heart
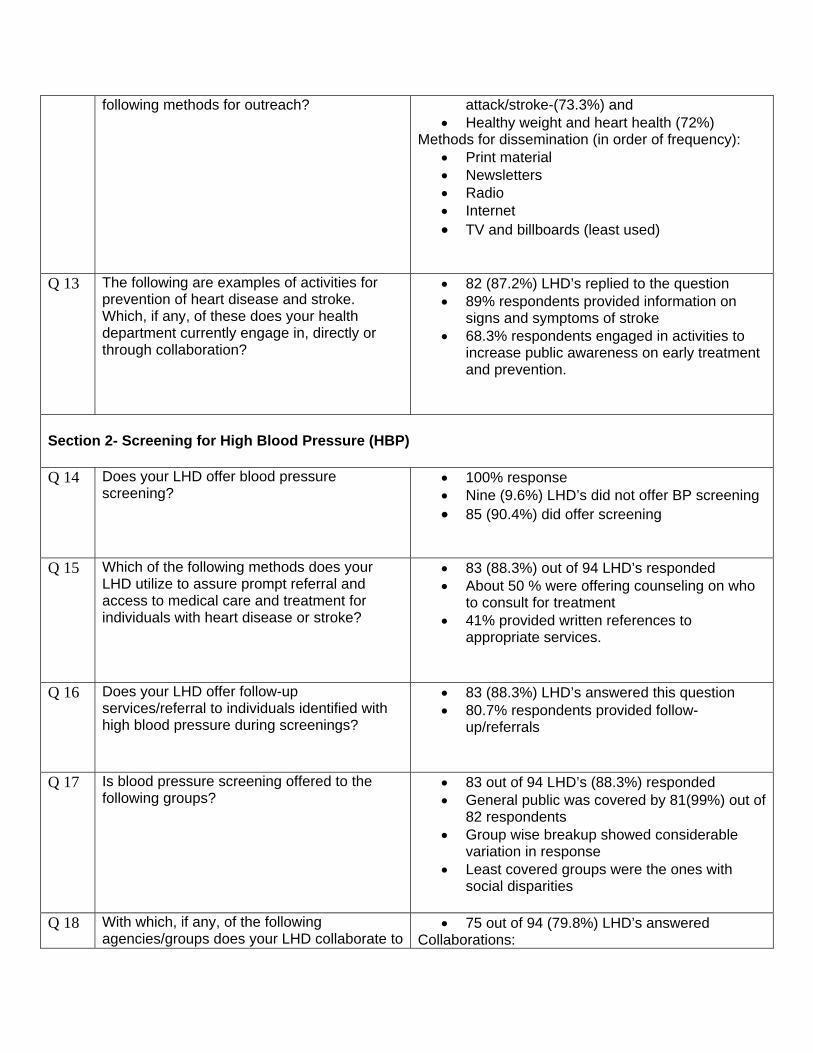
following methods for outreach? attack/stroke-(73.3%) and • Healthy weight and heart health (72%)
Methods for dissemination (in order of frequency): • Print material • Newsletters • Radio • Internet • TV and billboards (least used)
Q 13 The following are examples of activities for prevention of heart disease and stroke. Which, if any, of these does your health department currently engage in, directly or through collaboration?
• 82 (87.2%) LHD’s replied to the question • 89% respondents provided information on
signs and symptoms of stroke • 68.3% respondents engaged in activities to
increase public awareness on early treatment and prevention.
Section 2- Screening for High Blood Pressure (HBP) Q 14 Does your LHD offer blood pressure
screening? • 100% response • Nine (9.6%) LHD’s did not offer BP screening • 85 (90.4%) did offer screening
Q 15 Which of the following methods does your LHD utilize to assure prompt referral and access to medical care and treatment for individuals with heart disease or stroke?
• 83 (88.3%) out of 94 LHD’s responded • About 50 % were offering counseling on who
to consult for treatment • 41% provided written references to
appropriate services.
Q 16 Does your LHD offer follow-up services/referral to individuals identified with high blood pressure during screenings?
• 83 (88.3%) LHD’s answered this question • 80.7% respondents provided follow-
up/referrals
Q 17 Is blood pressure screening offered to the following groups?
• 83 out of 94 LHD’s (88.3%) responded • General public was covered by 81(99%) out of
82 respondents • Group wise breakup showed considerable
variation in response • Least covered groups were the ones with
social disparities
Q 18 With which, if any, of the following agencies/groups does your LHD collaborate to
• 75 out of 94 (79.8%) LHD’s answered Collaborations:
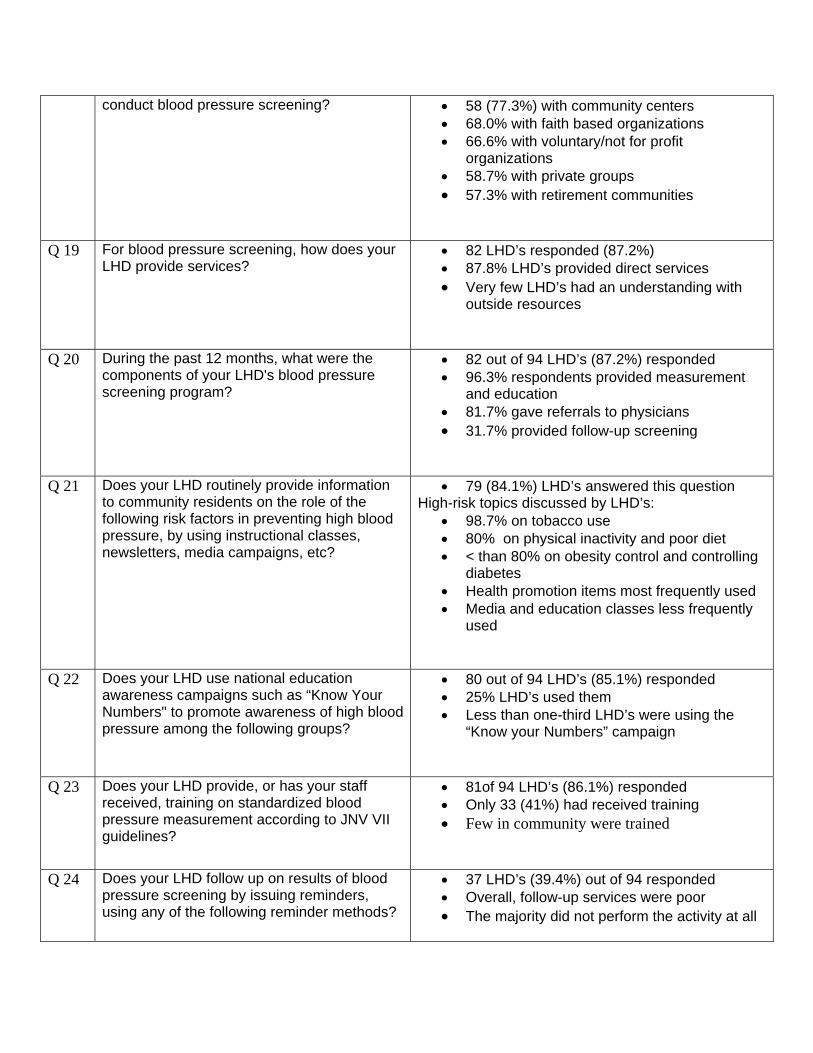
conduct blood pressure screening? • 58 (77.3%) with community centers • 68.0% with faith based organizations • 66.6% with voluntary/not for profit
organizations • 58.7% with private groups • 57.3% with retirement communities
Q 19 For blood pressure screening, how does your LHD provide services?
• 82 LHD’s responded (87.2%) • 87.8% LHD’s provided direct services • Very few LHD’s had an understanding with
outside resources
Q 20 During the past 12 months, what were the components of your LHD's blood pressure screening program?
• 82 out of 94 LHD’s (87.2%) responded • 96.3% respondents provided measurement
and education • 81.7% gave referrals to physicians • 31.7% provided follow-up screening
Q 21 Does your LHD routinely provide information to community residents on the role of the following risk factors in preventing high blood pressure, by using instructional classes, newsletters, media campaigns, etc?
• 79 (84.1%) LHD’s answered this question High-risk topics discussed by LHD’s:
• 98.7% on tobacco use • 80% on physical inactivity and poor diet • < than 80% on obesity control and controlling
diabetes • Health promotion items most frequently used • Media and education classes less frequently
used
Q 22 Does your LHD use national education awareness campaigns such as “Know Your Numbers" to promote awareness of high blood pressure among the following groups?
• 80 out of 94 LHD’s (85.1%) responded • 25% LHD’s used them • Less than one-third LHD’s were using the
“Know your Numbers” campaign
Q 23 Does your LHD provide, or has your staff received, training on standardized blood pressure measurement according to JNV VII guidelines?
• 81of 94 LHD’s (86.1%) responded • Only 33 (41%) had received training • Few in community were trained
Q 24 Does your LHD follow up on results of blood pressure screening by issuing reminders, using any of the following reminder methods?
• 37 LHD’s (39.4%) out of 94 responded • Overall, follow-up services were poor • The majority did not perform the activity at all
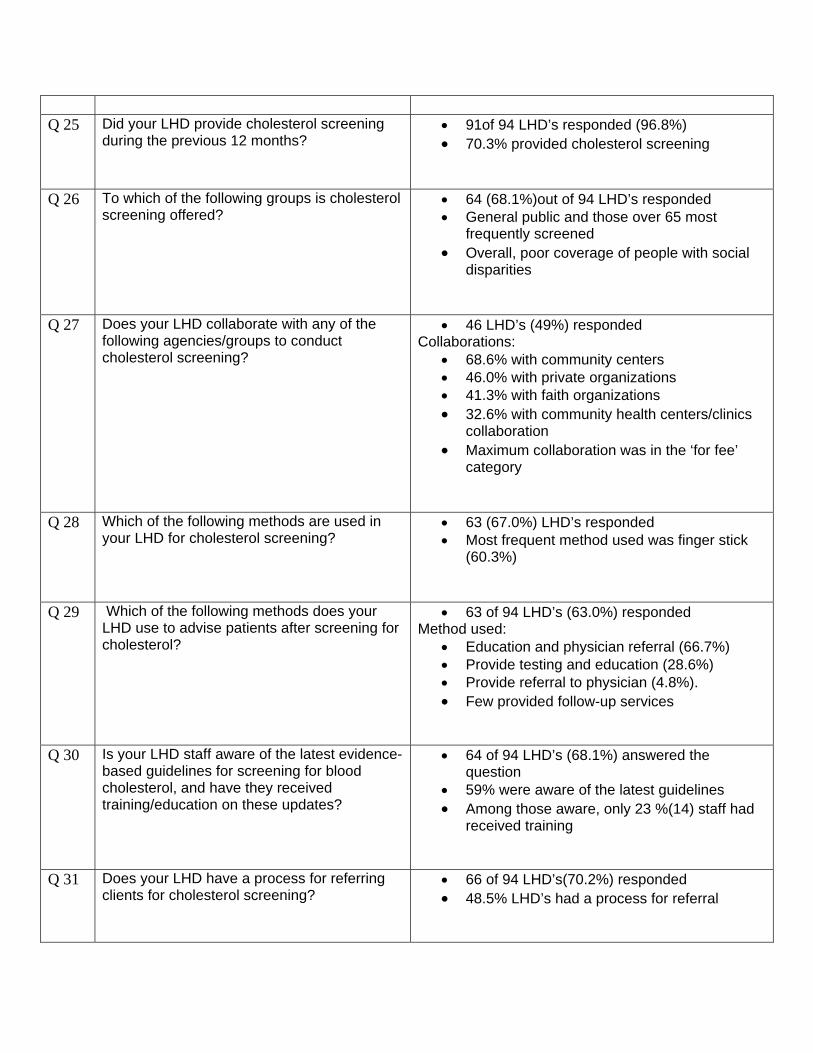
Q 25 Did your LHD provide cholesterol screening
during the previous 12 months?
• 91of 94 LHD’s responded (96.8%) • 70.3% provided cholesterol screening
Q 26 To which of the following groups is cholesterol screening offered?
• 64 (68.1%)out of 94 LHD’s responded • General public and those over 65 most
frequently screened • Overall, poor coverage of people with social
disparities
Q 27 Does your LHD collaborate with any of the following agencies/groups to conduct cholesterol screening?
• 46 LHD’s (49%) responded Collaborations:
• 68.6% with community centers • 46.0% with private organizations • 41.3% with faith organizations • 32.6% with community health centers/clinics
collaboration • Maximum collaboration was in the ‘for fee’
category
Q 28 Which of the following methods are used in your LHD for cholesterol screening?
• 63 (67.0%) LHD’s responded • Most frequent method used was finger stick
(60.3%)
Q 29 Which of the following methods does your LHD use to advise patients after screening for cholesterol?
• 63 of 94 LHD’s (63.0%) responded Method used:
• Education and physician referral (66.7%) • Provide testing and education (28.6%) • Provide referral to physician (4.8%). • Few provided follow-up services
Q 30 Is your LHD staff aware of the latest evidence-based guidelines for screening for blood cholesterol, and have they received training/education on these updates?
• 64 of 94 LHD’s (68.1%) answered the question
• 59% were aware of the latest guidelines • Among those aware, only 23 %(14) staff had
received training
Q 31 Does your LHD have a process for referring clients for cholesterol screening?
• 66 of 94 LHD’s(70.2%) responded • 48.5% LHD’s had a process for referral
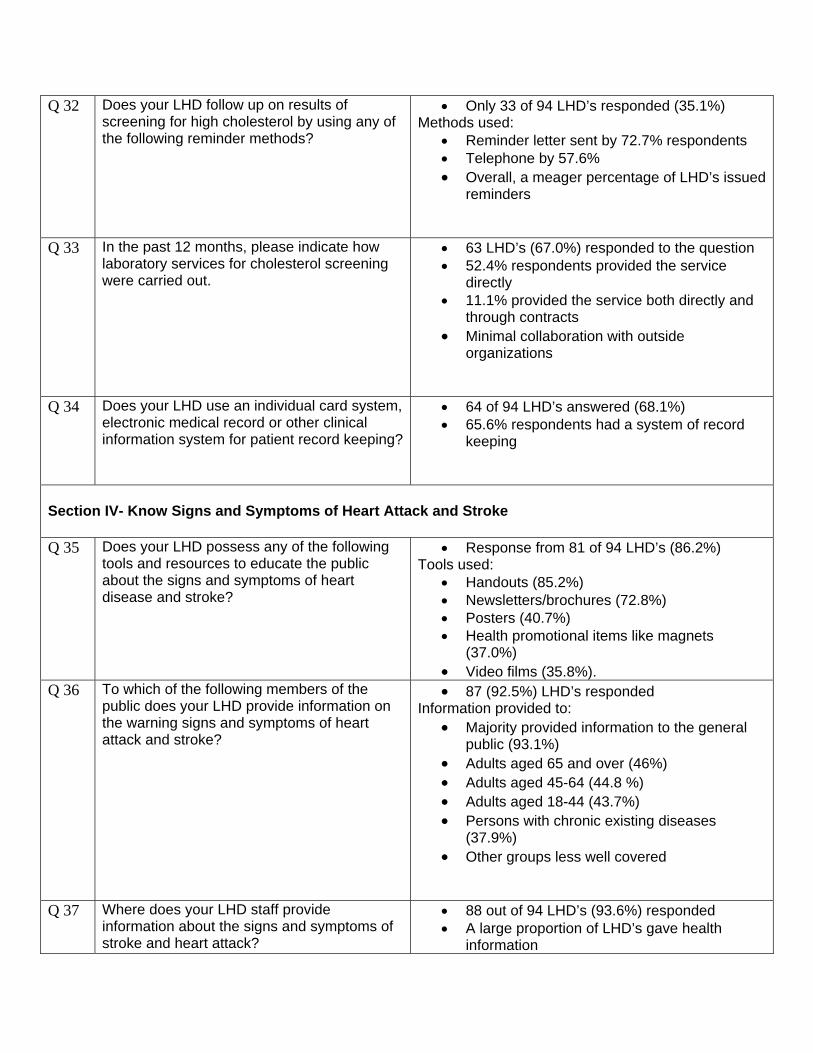
Q 32 Does your LHD follow up on results of screening for high cholesterol by using any of the following reminder methods?
• Only 33 of 94 LHD’s responded (35.1%) Methods used:
• Reminder letter sent by 72.7% respondents • Telephone by 57.6% • Overall, a meager percentage of LHD’s issued
reminders
Q 33 In the past 12 months, please indicate how laboratory services for cholesterol screening were carried out.
• 63 LHD’s (67.0%) responded to the question • 52.4% respondents provided the service
directly • 11.1% provided the service both directly and
through contracts • Minimal collaboration with outside
organizations
Q 34 Does your LHD use an individual card system, electronic medical record or other clinical information system for patient record keeping?
• 64 of 94 LHD’s answered (68.1%) • 65.6% respondents had a system of record
keeping
Section IV- Know Signs and Symptoms of Heart Attack and Stroke Q 35 Does your LHD possess any of the following
tools and resources to educate the public about the signs and symptoms of heart disease and stroke?
• Response from 81 of 94 LHD’s (86.2%) Tools used:
• Handouts (85.2%) • Newsletters/brochures (72.8%) • Posters (40.7%) • Health promotional items like magnets
(37.0%) • Video films (35.8%).
Q 36 To which of the following members of the public does your LHD provide information on the warning signs and symptoms of heart attack and stroke?
• 87 (92.5%) LHD’s responded Information provided to:
• Majority provided information to the general public (93.1%)
• Adults aged 65 and over (46%) • Adults aged 45-64 (44.8 %) • Adults aged 18-44 (43.7%) • Persons with chronic existing diseases
(37.9%) • Other groups less well covered
Q 37 Where does your LHD staff provide information about the signs and symptoms of stroke and heart attack?
• 88 out of 94 LHD’s (93.6%) responded • A large proportion of LHD’s gave health
information
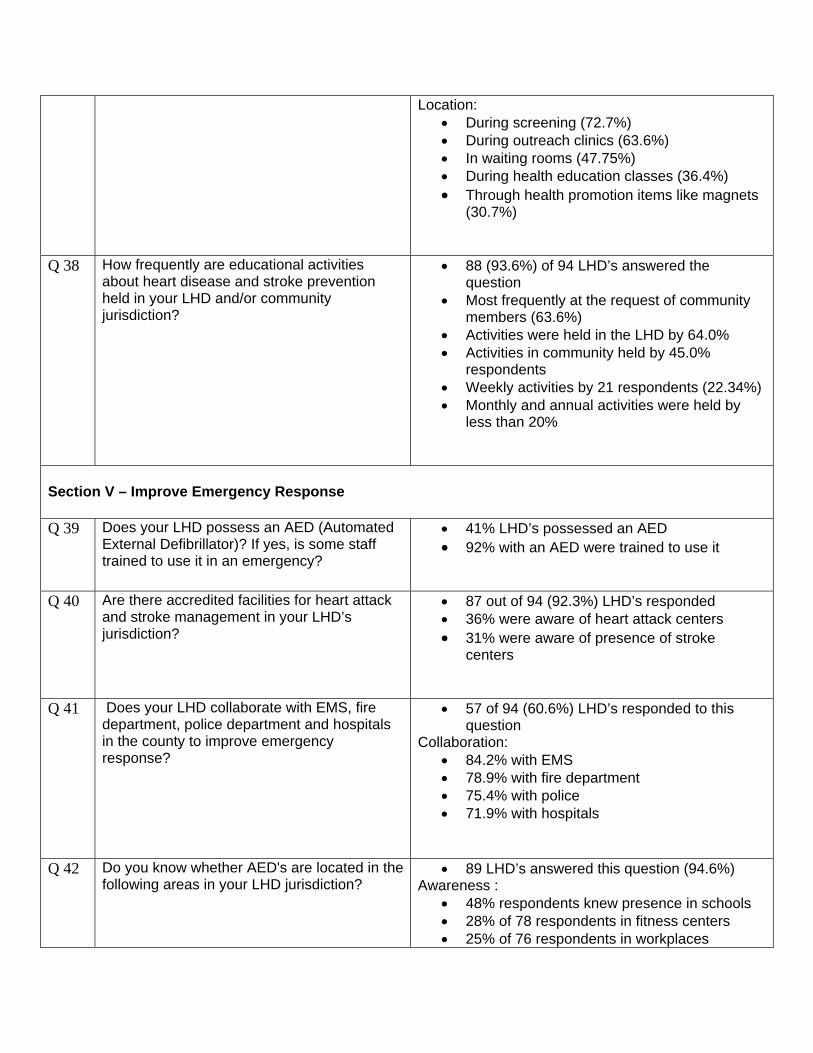
Location: • During screening (72.7%) • During outreach clinics (63.6%) • In waiting rooms (47.75%) • During health education classes (36.4%) • Through health promotion items like magnets
(30.7%)
Q 38 How frequently are educational activities about heart disease and stroke prevention held in your LHD and/or community jurisdiction?
• 88 (93.6%) of 94 LHD’s answered the question
• Most frequently at the request of community members (63.6%)
• Activities were held in the LHD by 64.0% • Activities in community held by 45.0%
respondents • Weekly activities by 21 respondents (22.34%) • Monthly and annual activities were held by
less than 20%
Section V – Improve Emergency Response Q 39 Does your LHD possess an AED (Automated
External Defibrillator)? If yes, is some staff trained to use it in an emergency?
• 41% LHD’s possessed an AED • 92% with an AED were trained to use it
Q 40 Are there accredited facilities for heart attack and stroke management in your LHD’s jurisdiction?
• 87 out of 94 (92.3%) LHD’s responded • 36% were aware of heart attack centers • 31% were aware of presence of stroke
centers
Q 41 Does your LHD collaborate with EMS, fire department, police department and hospitals in the county to improve emergency response?
• 57 of 94 (60.6%) LHD’s responded to this question
Collaboration: • 84.2% with EMS • 78.9% with fire department • 75.4% with police • 71.9% with hospitals
Q 42 Do you know whether AED's are located in the following areas in your LHD jurisdiction?
• 89 LHD’s answered this question (94.6%) Awareness :
• 48% respondents knew presence in schools • 28% of 78 respondents in fitness centers • 25% of 76 respondents in workplaces
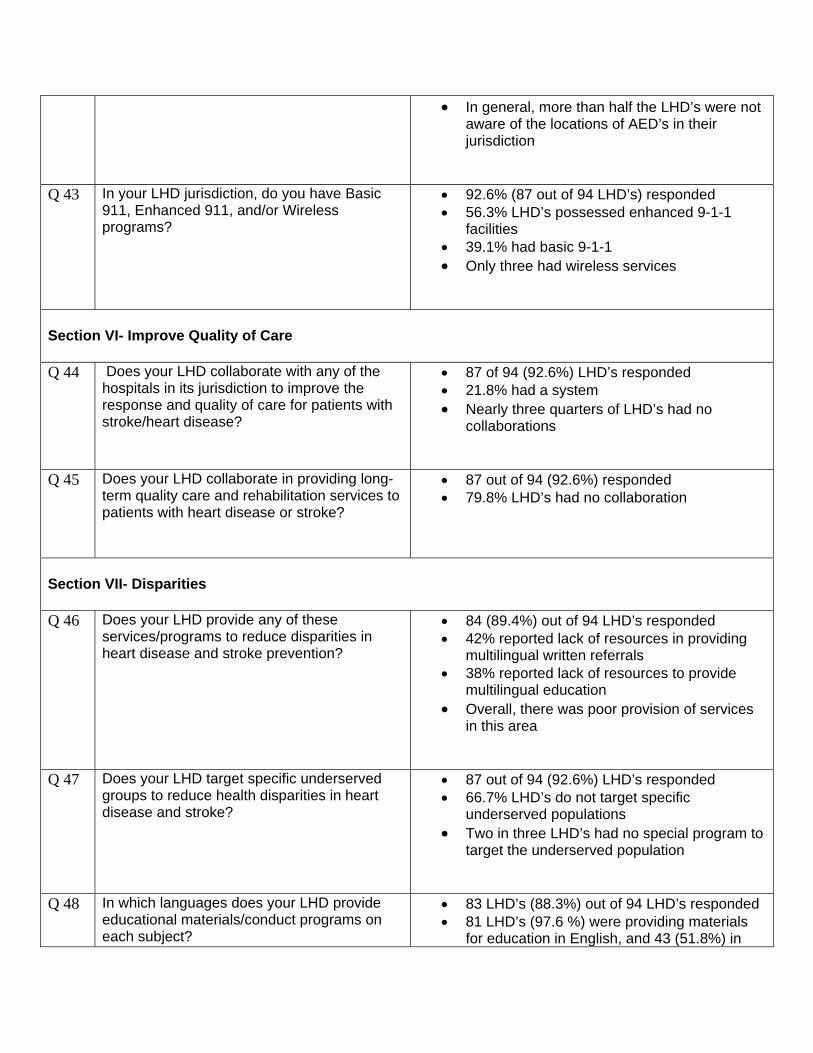
• In general, more than half the LHD’s were not aware of the locations of AED’s in their jurisdiction
Q 43 In your LHD jurisdiction, do you have Basic 911, Enhanced 911, and/or Wireless programs?
• 92.6% (87 out of 94 LHD’s) responded • 56.3% LHD’s possessed enhanced 9-1-1
facilities • 39.1% had basic 9-1-1 • Only three had wireless services
Section VI- Improve Quality of Care Q 44 Does your LHD collaborate with any of the
hospitals in its jurisdiction to improve the response and quality of care for patients with stroke/heart disease?
• 87 of 94 (92.6%) LHD’s responded • 21.8% had a system • Nearly three quarters of LHD’s had no
collaborations
Q 45 Does your LHD collaborate in providing long-term quality care and rehabilitation services to patients with heart disease or stroke?
• 87 out of 94 (92.6%) responded • 79.8% LHD’s had no collaboration
Section VII- Disparities Q 46 Does your LHD provide any of these
services/programs to reduce disparities in heart disease and stroke prevention?
• 84 (89.4%) out of 94 LHD’s responded • 42% reported lack of resources in providing
multilingual written referrals • 38% reported lack of resources to provide
multilingual education • Overall, there was poor provision of services
in this area
Q 47 Does your LHD target specific underserved groups to reduce health disparities in heart disease and stroke?
• 87 out of 94 (92.6%) LHD’s responded • 66.7% LHD’s do not target specific
underserved populations • Two in three LHD’s had no special program to
target the underserved population
Q 48 In which languages does your LHD provide educational materials/conduct programs on each subject?
• 83 LHD’s (88.3%) out of 94 LHD’s responded • 81 LHD’s (97.6 %) were providing materials
for education in English, and 43 (51.8%) in
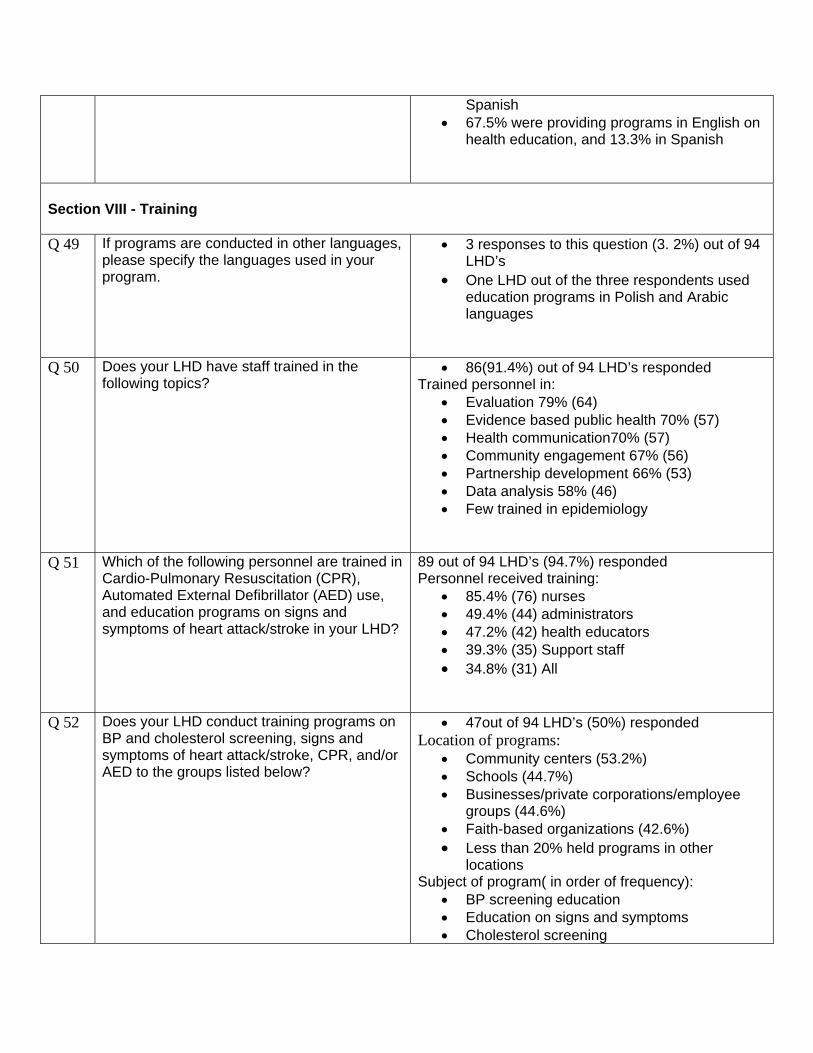
Spanish • 67.5% were providing programs in English on
health education, and 13.3% in Spanish
Section VIII - Training Q 49 If programs are conducted in other languages,
please specify the languages used in your program.
• 3 responses to this question (3. 2%) out of 94 LHD’s
• One LHD out of the three respondents used education programs in Polish and Arabic languages
Q 50 Does your LHD have staff trained in the following topics?
• 86(91.4%) out of 94 LHD’s responded Trained personnel in:
• Evaluation 79% (64) • Evidence based public health 70% (57) • Health communication70% (57) • Community engagement 67% (56) • Partnership development 66% (53) • Data analysis 58% (46) • Few trained in epidemiology
Q 51 Which of the following personnel are trained in Cardio-Pulmonary Resuscitation (CPR), Automated External Defibrillator (AED) use, and education programs on signs and symptoms of heart attack/stroke in your LHD?
89 out of 94 LHD’s (94.7%) responded Personnel received training:
• 85.4% (76) nurses • 49.4% (44) administrators • 47.2% (42) health educators • 39.3% (35) Support staff • 34.8% (31) All
Q 52 Does your LHD conduct training programs on BP and cholesterol screening, signs and symptoms of heart attack/stroke, CPR, and/or AED to the groups listed below?
• 47out of 94 LHD’s (50%) responded Location of programs:
• Community centers (53.2%) • Schools (44.7%) • Businesses/private corporations/employee
groups (44.6%) • Faith-based organizations (42.6%) • Less than 20% held programs in other
locations Subject of program( in order of frequency):
• BP screening education • Education on signs and symptoms • Cholesterol screening
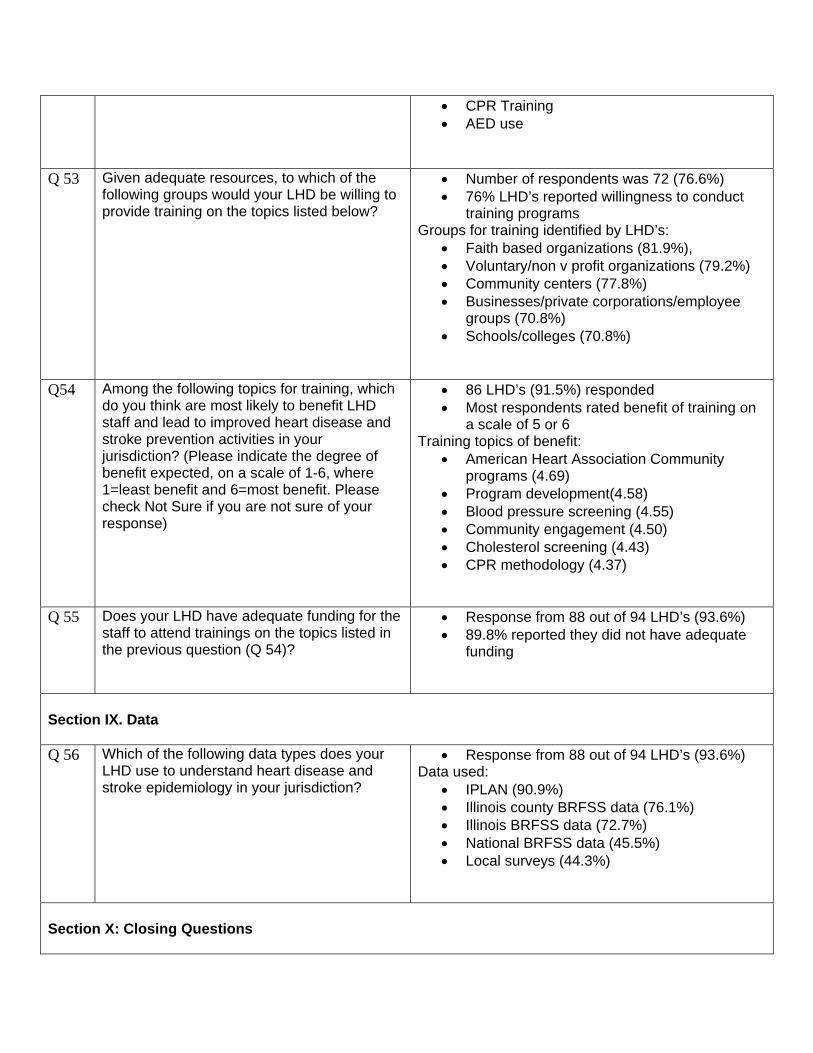
• CPR Training • AED use
Q 53 Given adequate resources, to which of the following groups would your LHD be willing to provide training on the topics listed below?
• Number of respondents was 72 (76.6%) • 76% LHD’s reported willingness to conduct
training programs Groups for training identified by LHD’s:
• Faith based organizations (81.9%), • Voluntary/non v profit organizations (79.2%) • Community centers (77.8%) • Businesses/private corporations/employee
groups (70.8%) • Schools/colleges (70.8%)
Q54 Among the following topics for training, which
do you think are most likely to benefit LHD staff and lead to improved heart disease and stroke prevention activities in your jurisdiction? (Please indicate the degree of benefit expected, on a scale of 1-6, where 1=least benefit and 6=most benefit. Please check Not Sure if you are not sure of your response)
• 86 LHD’s (91.5%) responded • Most respondents rated benefit of training on
a scale of 5 or 6 Training topics of benefit:
• American Heart Association Community programs (4.69)
• Program development(4.58) • Blood pressure screening (4.55) • Community engagement (4.50) • Cholesterol screening (4.43) • CPR methodology (4.37)
Q 55 Does your LHD have adequate funding for the staff to attend trainings on the topics listed in the previous question (Q 54)?
• Response from 88 out of 94 LHD’s (93.6%) • 89.8% reported they did not have adequate
funding
Section IX. Data Q 56 Which of the following data types does your
LHD use to understand heart disease and stroke epidemiology in your jurisdiction?
• Response from 88 out of 94 LHD’s (93.6%) Data used:
• IPLAN (90.9%) • Illinois county BRFSS data (76.1%) • Illinois BRFSS data (72.7%) • National BRFSS data (45.5%) • Local surveys (44.3%)
Section X: Closing Questions
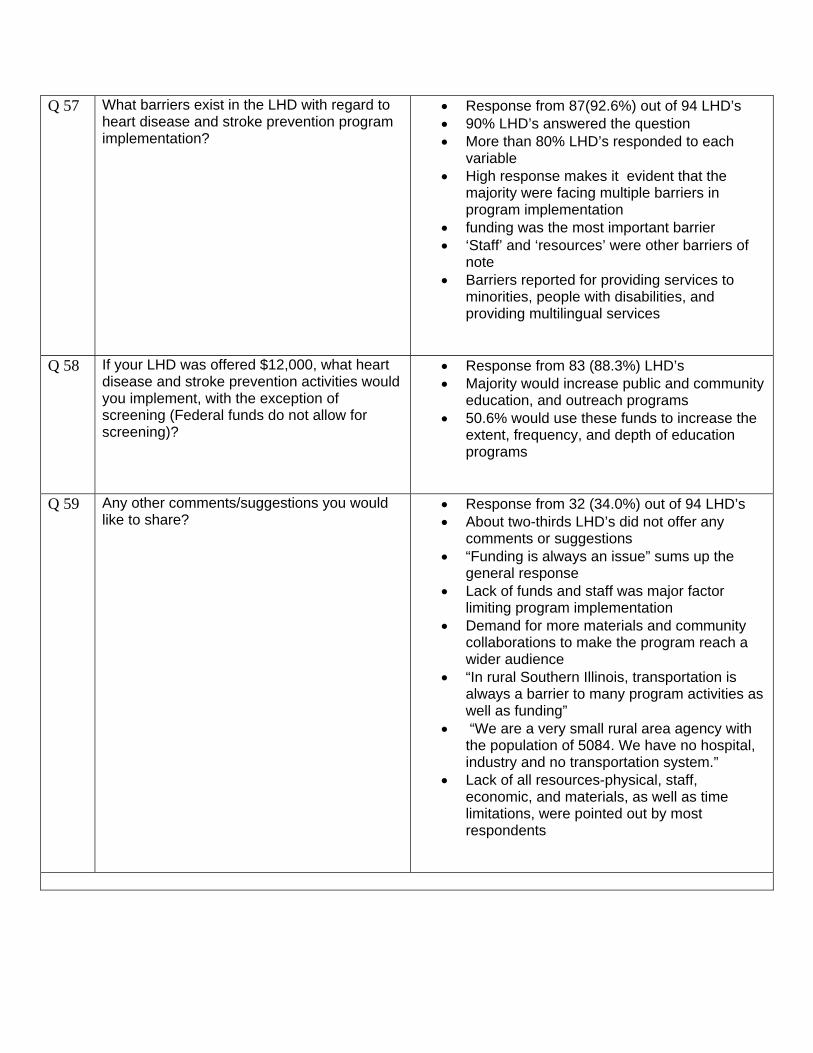
Q 57 What barriers exist in the LHD with regard to heart disease and stroke prevention program implementation?
• Response from 87(92.6%) out of 94 LHD’s • 90% LHD’s answered the question • More than 80% LHD’s responded to each
variable • High response makes it evident that the
majority were facing multiple barriers in program implementation
• funding was the most important barrier • ‘Staff’ and ‘resources’ were other barriers of
note • Barriers reported for providing services to
minorities, people with disabilities, and providing multilingual services
Q 58 If your LHD was offered $12,000, what heart disease and stroke prevention activities would you implement, with the exception of screening (Federal funds do not allow for screening)?
• Response from 83 (88.3%) LHD’s • Majority would increase public and community
education, and outreach programs • 50.6% would use these funds to increase the
extent, frequency, and depth of education programs
Q 59 Any other comments/suggestions you would like to share?
• Response from 32 (34.0%) out of 94 LHD’s • About two-thirds LHD’s did not offer any
comments or suggestions • “Funding is always an issue” sums up the
general response • Lack of funds and staff was major factor
limiting program implementation • Demand for more materials and community
collaborations to make the program reach a wider audience
• “In rural Southern Illinois, transportation is always a barrier to many program activities as well as funding”
• “We are a very small rural area agency with the population of 5084. We have no hospital, industry and no transportation system.”
• Lack of all resources-physical, staff, economic, and materials, as well as time limitations, were pointed out by most respondents
Related Documents