Heap leaching of copper ores – opportunity through science Jochen Petersen

Welcome message from author
This document is posted to help you gain knowledge. Please leave a comment to let me know what you think about it! Share it to your friends and learn new things together.
Transcript
Heap leaching of copper ores –
opportunity through science
Jochen Petersen
2
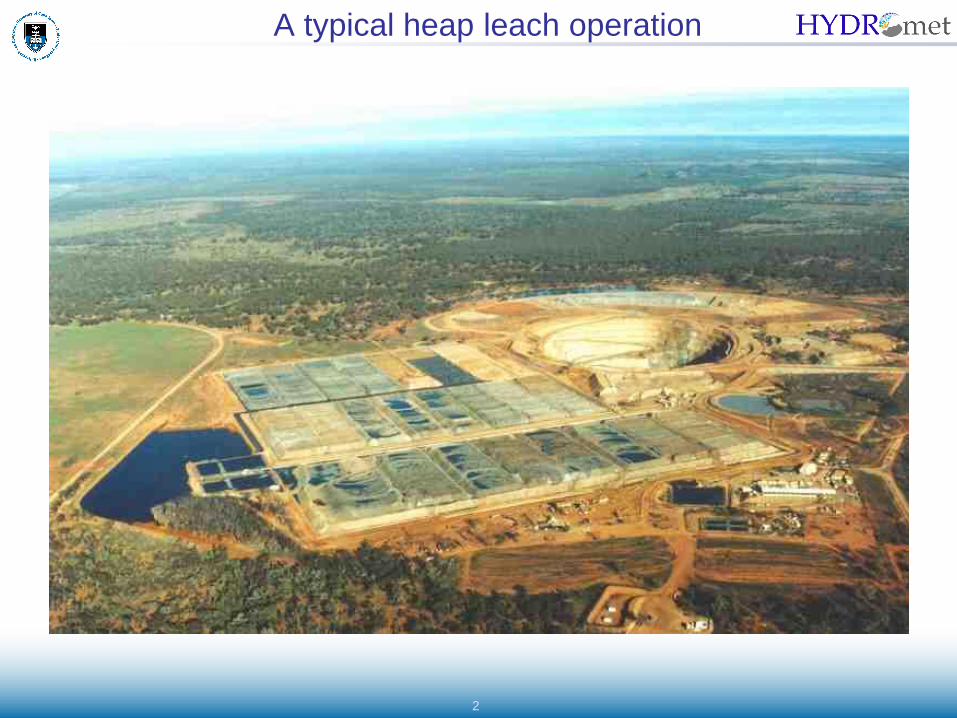
A typical heap leach operation
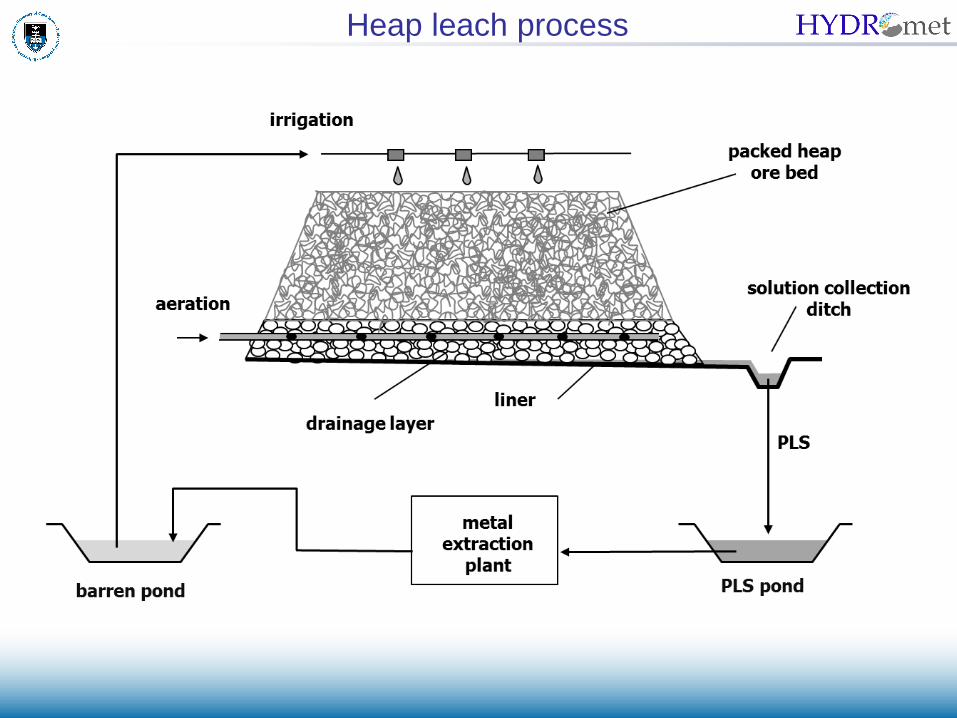
Heap leach process
?
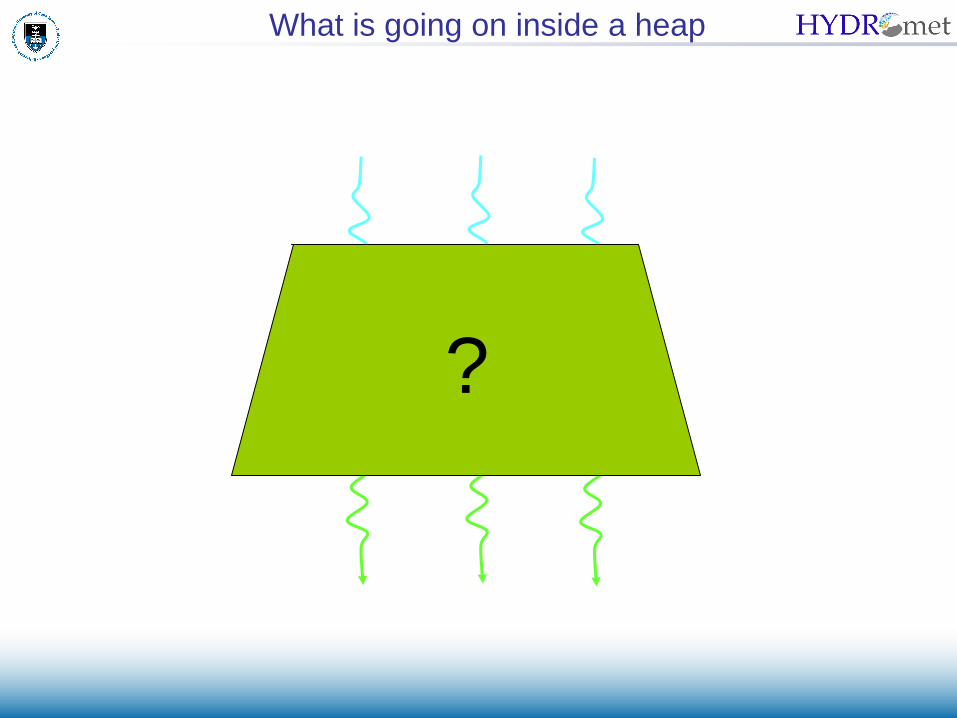
What is going on inside a heap
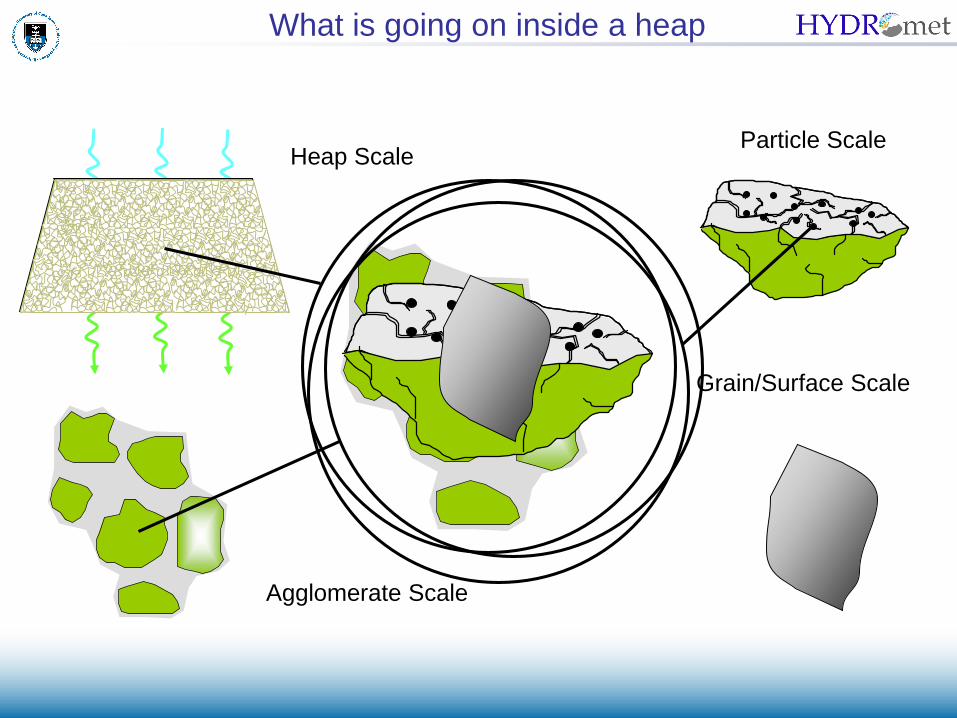
Grain/Surface Scale
Particle Scale
Agglomerate Scale
Heap Scale
What is going on inside a heap
6
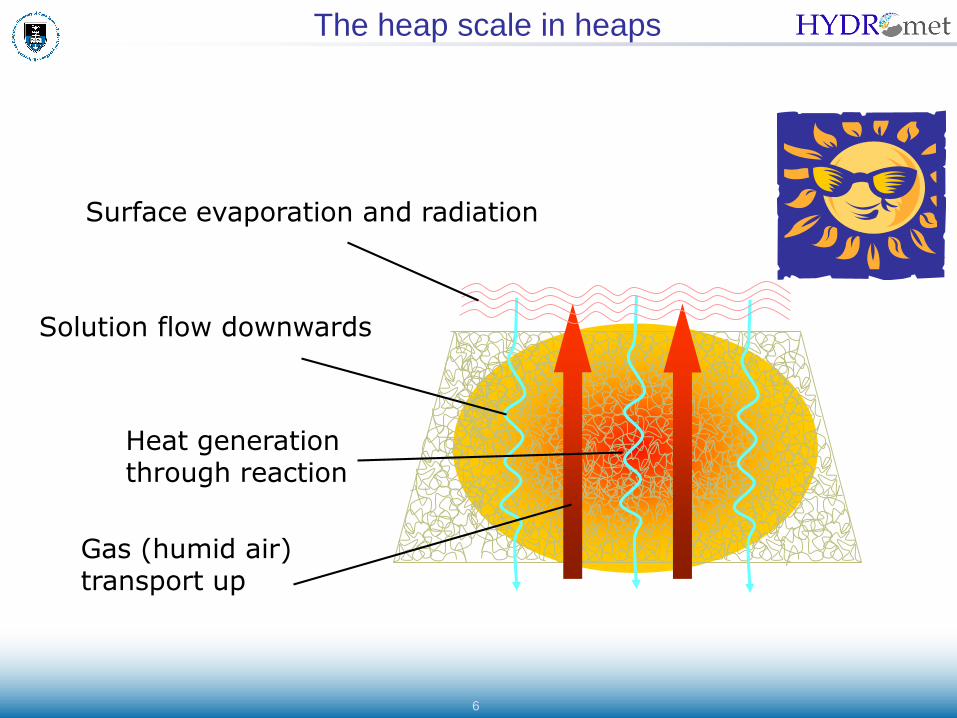
Solution flow downwards
Heat generationthrough reaction
Gas (humid air) transport up
Surface evaporation and radiation
The heap scale in heaps
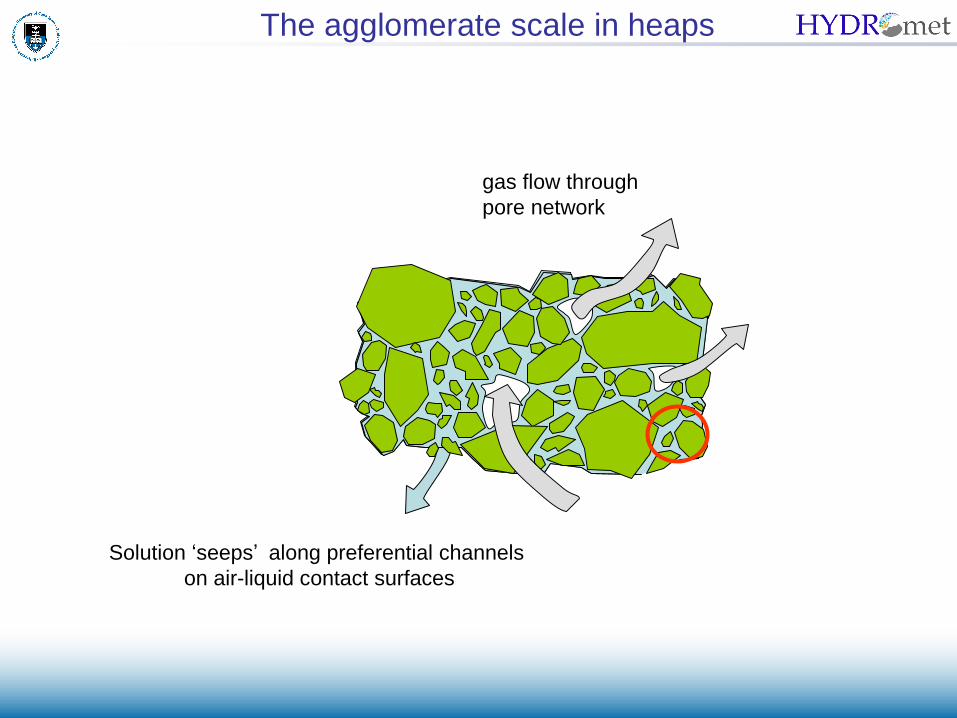
gas flow through
pore network
Solution ‘seeps’ along preferential channels
on air-liquid contact surfaces
The agglomerate scale in heaps

inner particle pores
sessile and planktonic micro-organisms
individual
particle
stagnant solution space
mobile solution space
The particle scale in heaps
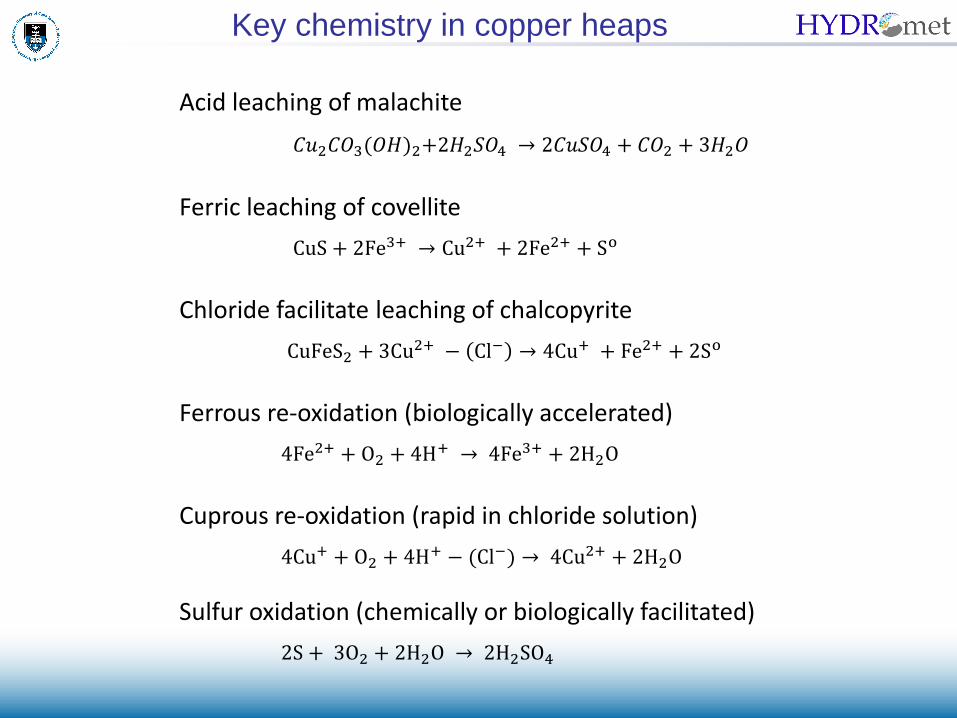
Key chemistry in copper heaps
Acid leaching of malachite
𝐶𝑢2𝐶𝑂3(𝑂𝐻)2+2𝐻2𝑆𝑂4 → 2𝐶𝑢𝑆𝑂4 + 𝐶𝑂2 + 3𝐻2𝑂
Ferric leaching of covellite
CuS + 2Fe3+ → Cu2+ + 2Fe2+ + So
Chloride facilitate leaching of chalcopyrite
CuFeS2 + 3Cu2+ − Cl− → 4Cu+ + Fe2+ + 2So
Ferrous re-oxidation (biologically accelerated)
4Fe2+ + O2 + 4H+ → 4Fe3+ + 2H2O
Cuprous re-oxidation (rapid in chloride solution)
4Cu+ + O2 + 4H+ − (Cl−) → 4Cu2+ + 2H2O
Sulfur oxidation (chemically or biologically facilitated)
2S + 3O2 + 2H2O → 2H2SO4
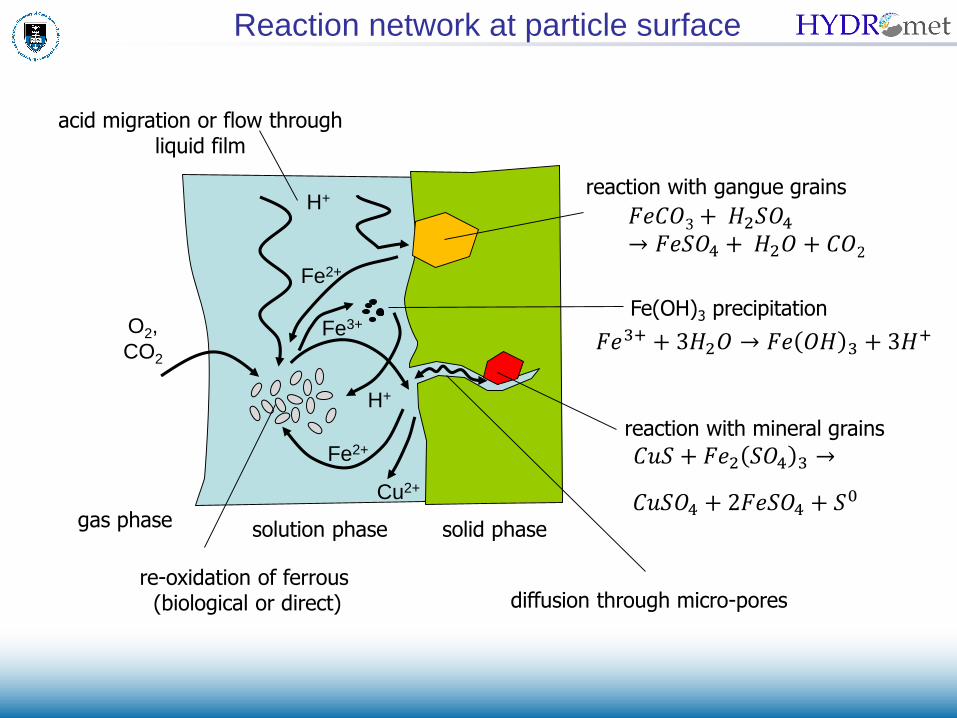
Reaction network at particle surface
Fe2+
Fe3+
H+
O2,
CO2
acid migration or flow throughliquid film
solution phase solid phasegas phase
re-oxidation of ferrous (biological or direct)
Fe2+
Cu2+
reaction with gangue grains
𝐹𝑒𝐶𝑂3+ 𝐻2𝑆𝑂4→ 𝐹𝑒𝑆𝑂4 + 𝐻2𝑂 + 𝐶𝑂2
H+
Fe(OH)3 precipitation
𝐹𝑒3+ + 3𝐻2𝑂 → 𝐹𝑒 𝑂𝐻 3 + 3𝐻+
diffusion through micro-pores
reaction with mineral grains
𝐶𝑢𝑆 + 𝐹𝑒2 𝑆𝑂4 3 →
𝐶𝑢𝑆𝑂4 + 2𝐹𝑒𝑆𝑂4 + 𝑆0

11
Is heap leaching a competitive technology?
• Slow process, residence time of months to years
• Poorer extraction (70-80%)
• Large physical footprint
• Long-term environmental burden uncertain
BUT
• Low energy requirements (crushing instead of milling)
• Simple, low-cost technology, can operate at remote sites
• Spent heaps comparable to tailings dams from minerals processing
Heap Leaching vs. Conventional Processing
12
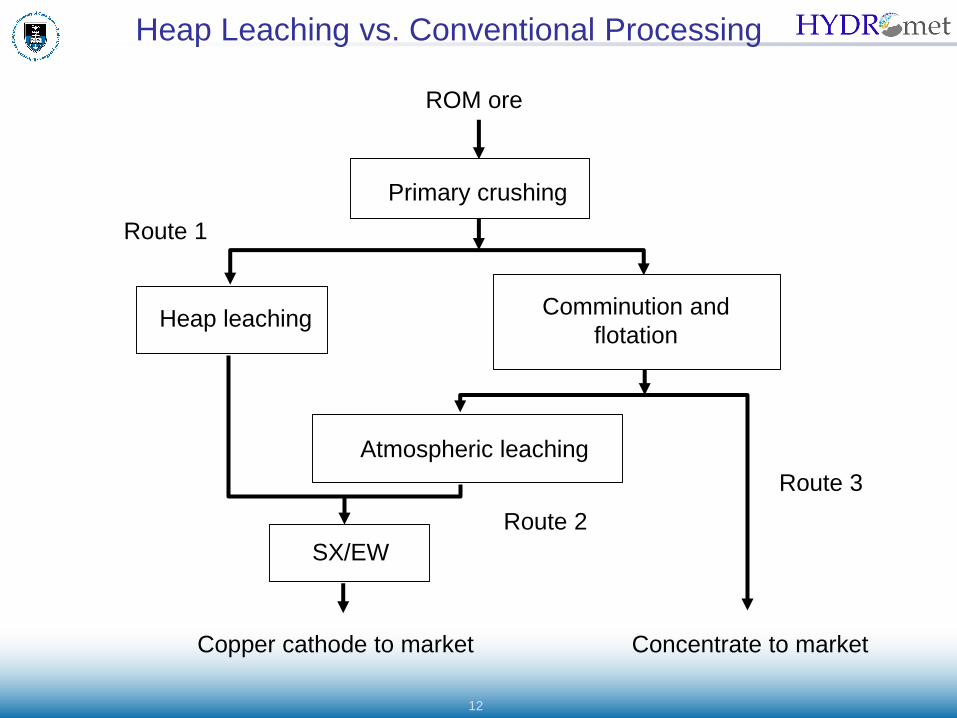
Heap Leaching vs. Conventional Processing
ROM ore
Primary crushing
Heap leachingComminution and
flotation
Atmospheric leaching
SX/EW
Copper cathode to market Concentrate to market
Route 1
Route 3
Route 2
13
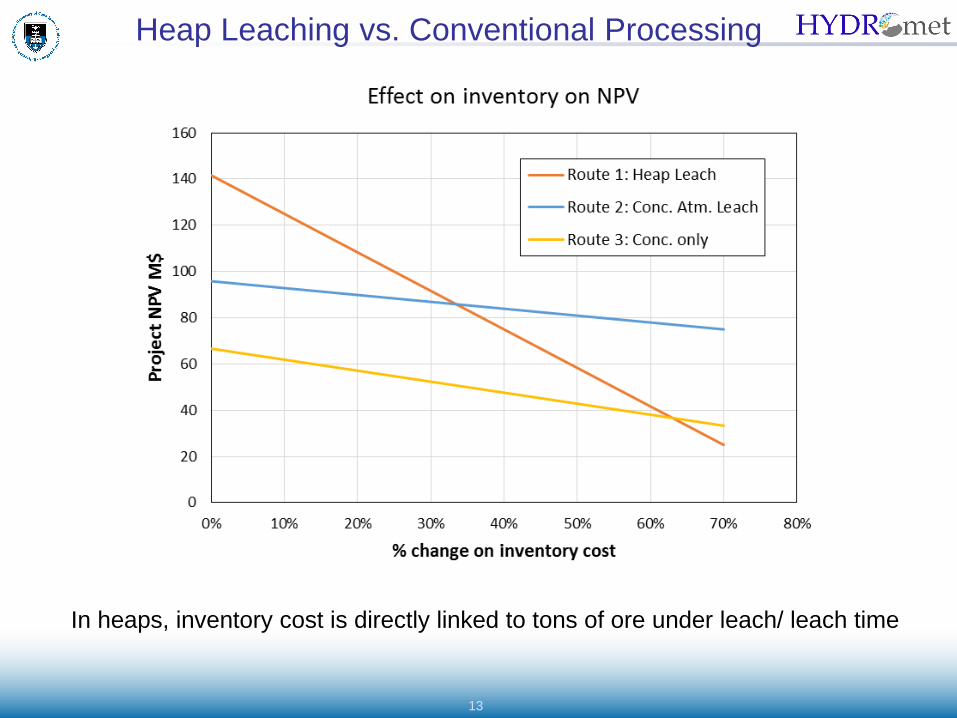
In heaps, inventory cost is directly linked to tons of ore under leach/ leach time
Heap Leaching vs. Conventional Processing
14
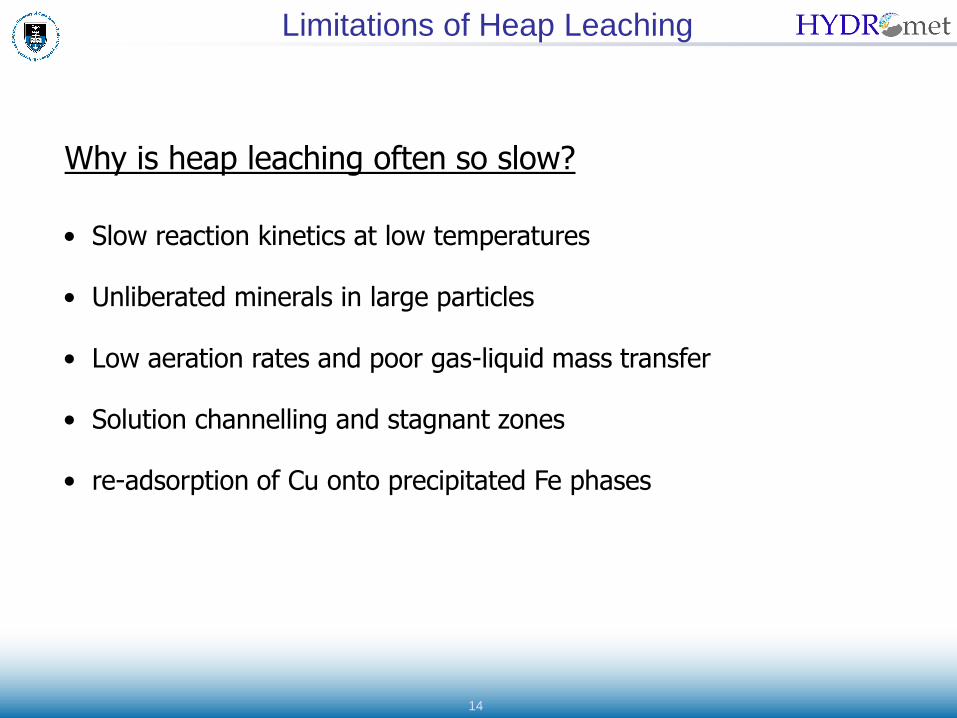
Why is heap leaching often so slow?
• Slow reaction kinetics at low temperatures
• Unliberated minerals in large particles
• Low aeration rates and poor gas-liquid mass transfer
• Solution channelling and stagnant zones
• re-adsorption of Cu onto precipitated Fe phases
Limitations of Heap Leaching

15
Mineral extraction from large particles
• X-ray tomography shows shrinking shell and unreacted core
Limitations of Heap Leaching

16
Gas-liquid mass transfer
• rate limited by low O2 solubility and interfacial area
• O2 solubility limited by temperature, solution salinity and air
pressure
0
2
4
6
8
10
12
14
0 20 40 60 80 100
Temperature ('C)
Ox
yg
en
so
lub
ilit
y [
pp
m]
pure water, dry air
0.15 M salinity, dry air
0.15 M salinity, sat. air
high salinity, high altitude
Limitations of Heap Leaching
17
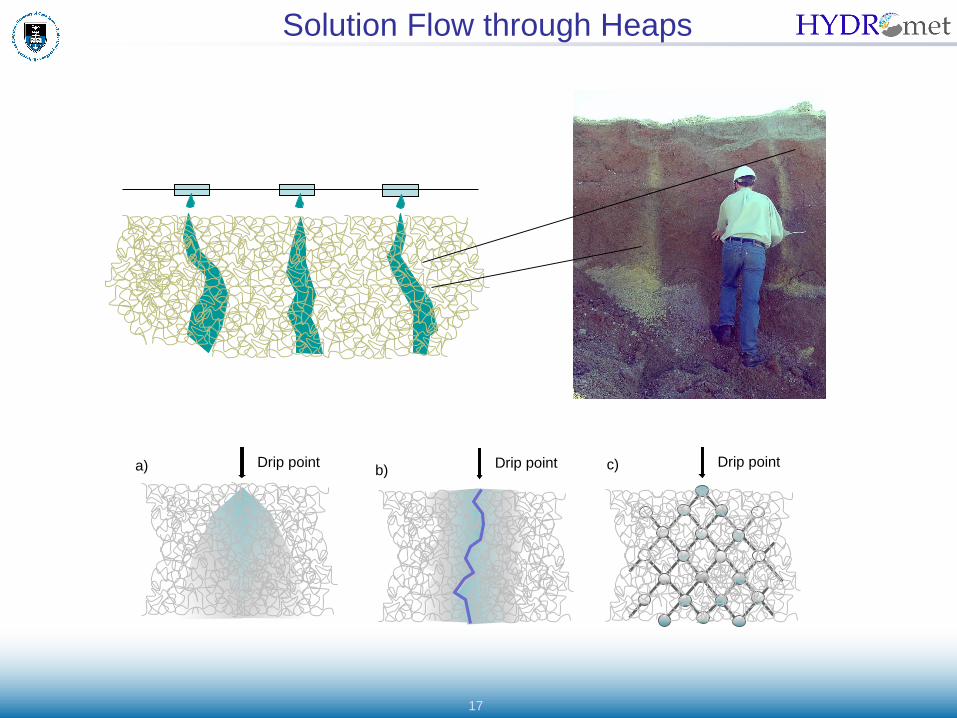
Solution Flow through Heaps
Drip point Drip point Drip pointa) b) c)
18
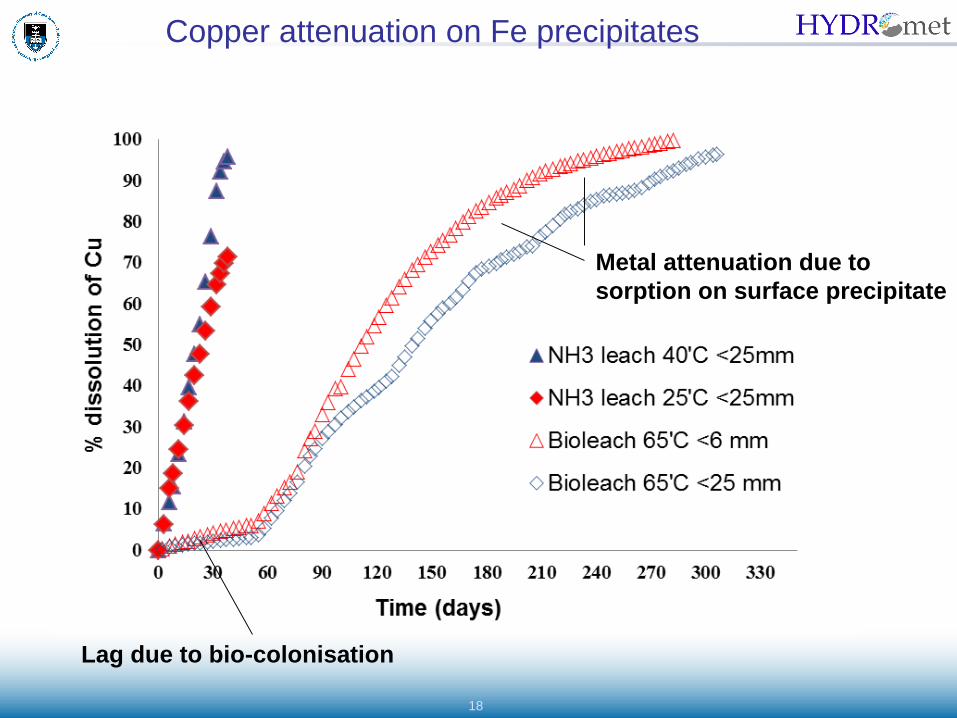
Lag due to bio-colonisation
Metal attenuation due to
sorption on surface precipitate
Copper attenuation on Fe precipitates
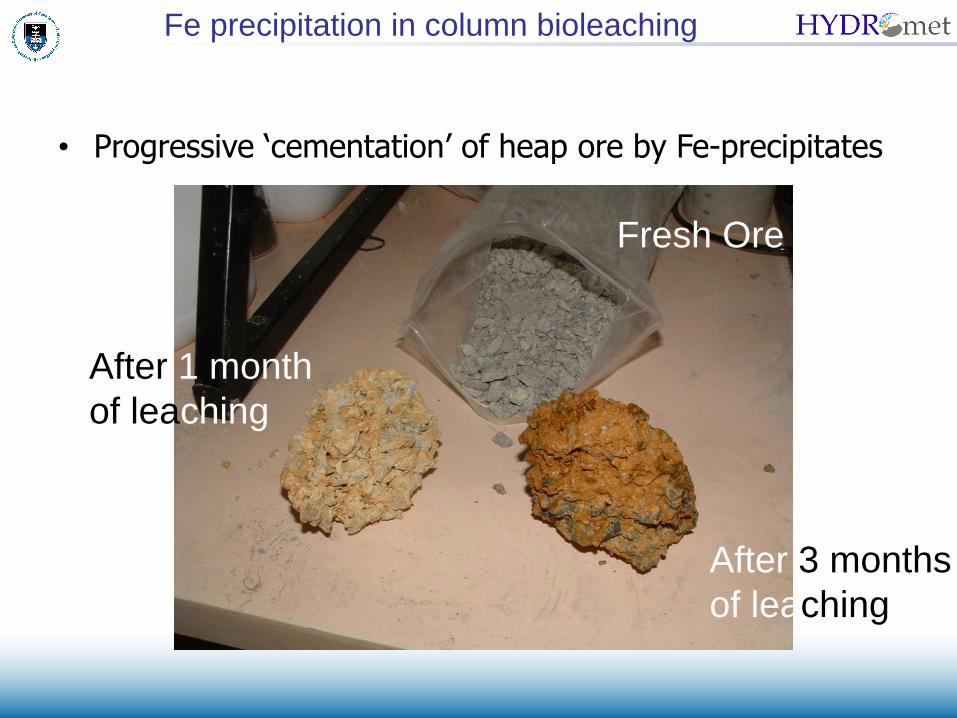
• Progressive ‘cementation’ of heap ore by Fe-precipitates
Fresh Ore
After 1 month
of leaching
After 3 months
of leaching
Fe precipitation in column bioleaching

• Nano SEM studies of freshly precipitated Fe-OH
• Network structure of precipitate offers large surface formetal sorption and inhibits solution flow
Fe precipitation in column bioleaching

21
gas flow throughpore network
Solution ‘seeps’ through open pore spaces as a front
Transport-reaction modelling
Fe2+
Fe3+
Cu2+
H+
O2, CO2
Bulk flow diffusion through
Stagnant pores
Heap Modelling
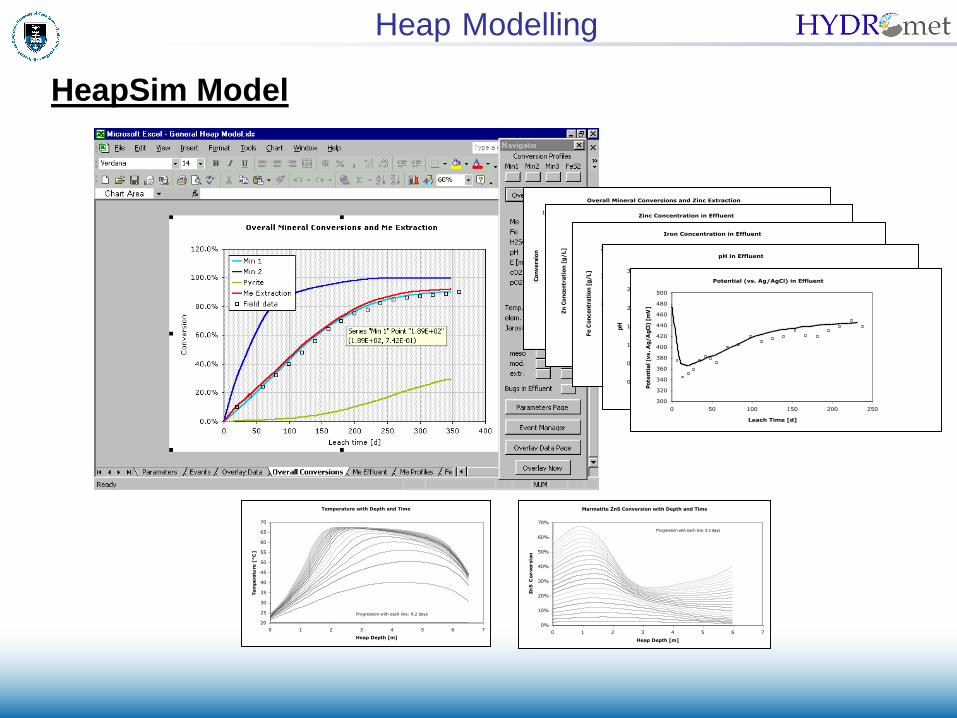
HeapSim Model
Heap Modelling
Overall Mineral Conversions and Zinc Extraction
0%
20%
40%
60%
80%
100%
0 50 100 150 200 250
Leach time [d]
Con
ve
rsio
n
Sphalerite
Galena
Pyrite
Zn Extraction
Col 116 data
Zinc Concentration in Effluent
0
10
20
30
40
50
60
70
0 50 100 150 200 250
Leach Time [d]
Zn C
once
ntr
ati
on [
g/L]
Iron Concentration in Effluent
0
5
10
15
20
0 50 100 150 200 250
Leach Time [d]
Fe C
oncentr
ati
on [
g/L]
pH in Effluent
0.0
0.5
1.0
1.5
2.0
2.5
3.0
0 50 100 150 200 250
Leach Time [d]
pH
Potential (vs. Ag/AgCl) in Effluent
300
320
340
360
380
400
420
440
460
480
500
0 50 100 150 200 250
Leach Time [d]
Pote
nti
al (v
s. A
g/A
gCl)
[m
V]
Temperature with Depth and Time
20
25
30
35
40
45
50
55
60
65
70
0 1 2 3 4 5 6 7
Heap Depth [m]
Tem
pera
ture
[°C
]
Progression with each line: 9.2 days
Marmatite ZnS Conversion with Depth and Time
0%
10%
20%
30%
40%
50%
60%
70%
0 1 2 3 4 5 6 7
Heap Depth [m]
Zn
S C
on
versio
nProgression with each line: 9.2 days

23
Key insights from modelling
• Complex distributions of reagent and heat distribution throughout
heaps determines local rates of leaching;
• Ambient conditions have significant impact on oxidative heap leaching;
• Optimal heap design varies strongly with ore characteristics;
• There are ‘speed limits’ to the maximum rate of leaching:
• Supply rate of acid (rare)
• Reagent distribution through stagnant (diffusion) zones
• Mineral liberation in large particles
• Supply rate of oxidant (air) – gas liquid mass-transfer
• Formation of adsorption buffers
24
Conclusions
• Heap leaching is a technically simple process, but of immense physical
complexity at all scales.
• The interplay of these complexities is difficult to grasp, yet under-
standing them offers opportunities to conduct the process
efficiently.
• Economic analysis indicates if heaps can be made to operate reliably at
their optimum, they would be a serious technology of choice.
• Heaps do have a future!

25
The National Research Foundation (NRF) of South Africa
is acknowledged for funding this research through their
Incentive Funding for Rated Researcher programme.
Thank You
Related Documents