Michael Burgmaier Managing Director o. 508-251-5702 c. 207-232-2480 [email protected] Nicolas McCoy Managing Director o. 508-251-8205 c. 508-954-4931 [email protected] Healthy Living Consumer Products: Industry Update, Deal Review and ‘Hot’ Categories Natural Products Expo West March 2017

Welcome message from author
This document is posted to help you gain knowledge. Please leave a comment to let me know what you think about it! Share it to your friends and learn new things together.
Transcript

Michael BurgmaierManaging Directoro. 508-251-5702c. [email protected]
Nicolas McCoyManaging Directoro. 508-251-8205c. [email protected]
Healthy Living Consumer Products: Industry Update, Deal Review and ‘Hot’ Categories
Natural Products Expo WestMarch 2017

2

3
What the Whipstitch Team Has Been Up To
2016 by the Numbers• Three M&A Transactions
• Four Private Placements
• One Unannounced Deal
• Three New Team Members
• Eight New Associated Industry Experts (Our “Stitching Crew”)
• Ten Speaking Events with Emerging Consumer Companies
• One Stitching Crew Lobster Bake
2017 Transactions• Several transactions expected to close
in first half of 2017, for example:
o Nutrient-dense Superfood Company
o Sports Nutrition and Supplement Company
o Better-for-you Snack Company
Bill Moses Joins the Whipstitch Team as Senior Operating and Strategic Advisor• Former Co-Founder, Chairman/
CEO of KeVita Probiotic Drinks • Founder, angel investor and
strategic advisor to several on-trend functional CPG ventures
• Owner of Casa Barranca Winery• Charity advocate & non-profit
board member

4
Contents
Whipstitch Capital Overview
Healthy Living: Industry Overview and Deal Update / Whipstitch’s Top 11 Healthy Living Consumer Trends
SPINS Market Update: Produced for Whipstitch’s Industry Analysis
Food & Beverage M&A and Private Placement Deal Data

• Participate in over 15 consumer industry events/year
• Lead events such as all-day financing seminars, networking events• The Whipstitch team has completed >50 consumer transactions; select recent deals:
Whipstitch [hwip-stitch]Noun. The stitch that passes over an edge, in joining, finishing, or gathering.
• Launched October 2015 by Nick McCoy and Michael Burgmaier
• Focused exclusively on innovative consumer companies
• Financial Advisory on M&A and institutional private placements
Whipstitch – A Bank Solely Focused on the Healthy Living Market
5

Focus You Get the Top Experience
Whipstitch Differentiation: This is What We Do
6
All we do is consumer; 90%+ food and beverage
We know how to talk about your company –no learning curve
Over twenty years of investment banking experience
High-touch, high-quality
We work with you to develop a strategic plan and execute
100% credibility with investors and strategics
We Are Not the Typical Advisors, Nor Do We Want to Be
Won’t Tell You What You Want to Hear; We Tell You the Truth
Our M.O.: Under-promise and Over-Deliver – Ask Our Former Clients…

Nick McCoy
Michael Burgmaier
20+ years of investment banking experience; co-founder, Silverwood Partners
Investment Banking Group at Gleacher & Co. (First Albany; now Jefferies)
Director of M&A at Allmerica Financial Corp.
Senior Associate, Corporate Development, Wheelabrator Technologies
MBA in Finance from Wake Forest University; BS Business Admin. UNH
15+ years of investment banking, consulting and VC experience
Principal of VC firm CEI Community Ventures
Consultant at Bain & Co., Inc. Frequent author and speaker at BevNet
Live, Expo West, NCN and more MBA from Tuck School of Business at
Dartmouth College; MPP, Duke; BA Economics, Boston College
Whipstitch is Co-Founded and Led by a Seasoned, Highly-Experienced Team
7

A Deeply Experienced Whipstitch Team
8
Senior Associate 3 years consumer IB
experience at Silverwood Partners
Outdoor activity enthusiast Based in San Diego, CA – the
most beautiful place in the country.. (except summers in Maine, says Burgmaier incessantly)
Analyst Experience in PE at New Forest
Capital Avid sports enthusiast; Exercise
Physiology degree from BYU Love of the outdoors, on path
to become future Bear Grills Proud husband and father of
newborn who loves the sound of her own cry
Senior Associate 5 years consumer IB and PE
experience at Silverwood, Kamylon Capital
Happily retired NCAA athlete who has never lost the spirit of competition
Human test subject, just look at his desk drawer full of vitamins and supplements
Consultant to natural and specialty food and beverage companies
Co-Author of Natural Products Field Manual and The Sale’s Manager Handbook
Founder of Campo Verde Solutions providing consulting to natural and organic companies
Private label expertise; previously with Trader Joe’s and Whole Foods
Greg Ucich
Tim Sousa
Taylor Lynch
With Support From the STITCHING CRE
The 24/7 Team
Bob Burke
Kim Greenfeld
Bill Moses
Senior Operating and Strategic Advisor Former Co-Founder, Chairman/
CEO of KeVita Probiotic Drinks; acquired by PepsiCo in 2016
Founder, angel investor and strategic advisor for several on-trend functional CPG ventures
Owner of Casa Barranca Winery; the first certified organic winery in central coast California
Ellis Island Gold Medal of Honor Recipient for humanitarian and business leadership
The Extended Team

Stitching Crew Continued…
9
Kent Pilakowski
Created IGNITE Sales Management in 2007; works with established brands as a national sales force to assist in scaling CPG businesses
Referred to as a “category captain” in the natural and organic space
Former General Mills: Roles included directing sales operations, trade marketing and category management
Rick Antonelli
Majority of professional career dedicated to UNFI; positions included Executive VP, Chief Operating Officer, and President of Distribution
Leadership roles at Harvest Provision and Fairfield Farm Kitchens
Served on Board of Directors for Galaxy Nutritional Foods, Zevia, National Cooperative Grocers Association, Mary’s Gone Crackers and UNFI
Chris Licata
CEO of The Tecnica Group, a winter sport and outdoor brand distributor; brands include Nordica, Tecnica, Blizzard and Rollerblade
Previously President and CEO of Blake’s All Natural Foods; acquired by ConAgra Foods in 2015
In 2014, named the NH Small Business Person of the Year by The United States Business Administration
Jeanne Varley
Founder & CEO of Emerging Brand Strategies, LLC; a consultancy to emerging beverage and consumer goods co’s
Held senior level roles with Diageo, Constellation Brands and FIJI water
Enjoys spending time with young daughter and husband near home in South Florida
MBA from Wharton
Robert Craven
CEO of FoodState; a company that has been mastering the art of whole-food supplements since 1973 through its MegaFood and INNATE Response brands
Previously CEO of Garden of Life; led them to the #14 spot on the Inc. Magazine list of fastest-growing private companies
Founder of The Tim Sperry Group; a consultancy focused on clients selling into the Natural, Organic and Specialty Marketplaces
Previously spent 20 years in purchasing leadership at WFM
Tim Sperry

• The hurt is accelerating for the big CPGs; all eight of the top food and
Strategic Investment Path
Fund/Group Name
Example Investments
Internal group Venturing & Emerging Brands (VEB)
beverage companies experienced sales declines in Q1 2016 vs. 2015
• Despite suffering major losses, 2015 experienced strongest growth in food and beverage spending over the past four years thanks to growth of small and mid-sized CPG companies
• Large CPG companies are acting: Acquiring smaller companies and investing in relatively early-stage, fast-growth companies
• The numbers show that consumers are willing to pay and are spending but their money is flowing away from the CPG giants
• Small CPG companies should consider strategics for capital; entrepreneurs should look for great advisors, ask hard questions and think through all possible scenarios
External Fund (one LP) First Beverage Ventures
Investing NEB/North America Premium Nutrition & Venturing
Investing --
Created Fund Acre Venture Partners NA - launched 2016
External Fund (backed by Mars) Digitalis Ventures
Internal Group 301, Inc.
Internal Group 1894 Ventures NA - launched 2016
--
--
--
Investing
Investing
Investing
Internal Group Cultivate Ventures NA - launched 2016
From a Whipstitch Article Published 9/13/16
Source: http://www.bevnet.com/news/2016/nosh-voices-pressure-heres-big-cpgs-will
Whipstitch in the Press: NOSH Voices: “Under Pressure, Here’s What the Big CPGs Will Do”
10

M&A Advisory: Select Deals Led by the Whipstitch Team
11

Private Placement Advisory: Select Deals Led by the Whipstitch Team
12

13
Contents
Whipstitch Capital Overview
Healthy Living: Industry Overview and Deal Update / Whipstitch’s Top 11 Healthy Living Consumer Trends
SPINS Market Update: Produced for Whipstitch’s Industry Analysis
Food & Beverage M&A and Private Placement Deal Data

14
The Unstoppable Growth in Natural, Organic and Healthy Rolls On
Sales of Natural products continue to rise as consumer seek healthier alternatives
• Let the snowball keep rolling – total US sales of natural products increased 7.7% YoY to $195B• Growth was particularly strong in the natural and organic foods segment – up 8.5% YoY as consumers continue to
seek better-for-you, functions options that are ‘clean-label’ • Natural and organic personal care sales increased 7.5% YoY as the category continues to benefit from the tailwinds
created from the broader healthy-living market
$0
$50
$100
$150
$200
$250
$300
2005 2006 2007 2008 2009 2010 2011 2012 2013 2014 2015 2016 2017E 2018E 2019E 2020E
USD
Billi
ons
Supplements N&O Foods Functional Foods N&O Personal Care
Total US Sales of Natural Products by Category1,2
Annual Dollar Sales
Sources: 1. New Hope 2. Nutrition Business Journal

20%
4%
26%
5%
26%
20%
25%
40%
19%
23%
17% 31%
24%
45%
23%
21%
11% 8% 9%3%
0%
20%
40%
60%
80%
100%
Population* Spending Power Population Spending Power
316M $6,390B 334M $7,753B2013 2020F
Greatest / Silent Gen
Baby Boomers
Gen X
Millennials
Gen Z / iGen
US Discretionary Spending Power by Generation(2013, 2020P)1
Millennials Use of Digital and Mobile Technology Forcing Consumer Brands to Change Marketing Strategies2
PRE-PURCHASE
PURCHASE
POST-PURCHASE
34% use a smartphone in-
store to look at reviews of a product2
READS REVIEW VISITS DEAL SITES
3xmore likely to
visit couponing sites2
COMPARE PRICES
4xmore likely to visit
comparison shopping sites2
SMARTPHONES
RETAIL LOCATION
65%are comfortable making
online purchases with their phones2
53%use their smartphone while waiting in line to purchase something2
VISIT WEBSITE
VISIT STORE
63%shop on their smartphones every day2
53%retail
purchases are made in store2
Purchase Product!
1. UNBOX
2. USE PRODUCT
3. TAKE PHOTOS
SHARES OPINION
• Engage in Discussion regarding retailer and product
• Upload media about product
16%share an item via social
media2
BRAND AWARENESS
Millennials ‘Wag the Tail’ of the CPG Industry – Food Brands Re-inventing Marketing Strategies
15
Millennial generation surpassing Baby Boomer’s shaping how Large CPGs engage with consumers
• Millennials currently largest living generation, projected to hold through 2020
• Will constitute half of workforce and replace Baby Boomers as generation with highest discretionary spending power – responsible for 40%1
Notes: *Years born = Greatest / Silent Gen (before 1946), Baby Boomers (1946-1964), Gen X (1946-1981), Millennials (1982-2000), Gen Z / iGen (after 2000)
Sources: 1. U.S. Census, Technomic, Deloitte Millennial Survey 2014, L.E.K. Analysis2. Alliance Data’s card service business, Conversant, Epsilon and LoyaltyOneGraphics - provided by Flaticon.com
Millennial

16
The Health and Wellness Industry Remains Active Environment for M&A and Private Investments
M&A 2016 2015 2014 2013Retail & Distribution 26 10 11 10
Supplements 15 10 22 11
Ingredients 28 22 22 30
Contract Manufacturing 8 12 8 9
OTC & Personal Care 13 13 11 4
Natural & Organic, Functional Food 102 100 53 69
Others: Tech, Fitness, Pet 59 80 47 27
Total M&A 251 247 174 160
Financings 456 380 209 93
Total Transactions 707 627 383 253
Avg. size of financing ($MM) 15.2 20.8 21.7 9.1
Nutrition and Health & Wellness Industry Transactions: M&A Details 2013 – 20161
• 2016 reaches highest M&A transaction activity to-date, totaling 251 deals
• PEs and strategics continue to provide capital for functional, on-trend food & beverage companies; 102 total transactions in 2016
• Large CPGs such as Mars Inc., Campbell’s, Kellogg’s and Tyson work to compete in growing market by spawning VC funds aimed at capitalizing on early, fast-growing companies
• Supplement, Ingredients and Retail & Distribution categories experience highest transaction growth at 50%, 27% and 160% respectively
Health and wellness categories continue to attract institutional and strategic capital – no signs of stopping
Sources: 1. Nutrition Capital Network

17
Recent Food & Beverage M&A Highlights
Acquirer Target Date Acquirer Target DateAcquirer Target Date
Mar 2016
Apr 2016
Apr 2016
May 2016
May 2016
May 2016
June 2016
July 2016
July 2016*
July 2016
Aug 2016
Sept 2016
Sept 2016
Nov 2016
Nov 2016
Nov 2016
Nov 2016
Dec 2016
Dec 2016
Dec 2016
Jan 2017
Feb 2017
Feb 2017
Feb 2017
* Announced date – transaction

18
Recent Food and Beverage Private Placements
Investor(s) Target Date Investor(s) Target DateInvestor(s) Target Date
Jan 2017
Jan 2017
Jan 2017
Jan 2017
Jan 2017
Jan 2017
Feb 2017
Feb 2017
Feb 2017
& Others
Oct 2016
Oct 2016
Oct 2016
Oct 2016
Oct 2016
Dec 2016
Dec 2016
Jan 2017
& Others
Sept 2016June 2016
June 2016
June 2016
July 2016
July 2016
July 2016
July 2016
Sept 2016
Sept 2016

19
“This Still Goes to 11”: Whipstitch's Top Healthy Living Trends and Truths
1. Shifting Consumer Preferences Prompts Cleaning-up of Unhealthy Categories
2. Flexitarian Lifestyles Driving Success of Plant-based Brands 3. Grass-fed Products Continue to Outgrow their Traditional-beef Peers4. Many Large Grocery Opportunities Remain Brand-less5. Big CPG Accelerates Venture Investing6. Label Transparency and Reliability Warrant More Thorough Attention7. Premium, Natural & Organic Brands Continue to Drive Growth in the
Frozen Set8. Large CPG use M&A to Help Supplant R&D9. Craft Spirits Gain Mainstream Attention 10. Kombucha Growth Leads to Category Sophistication 11. Benefits of Healthy Biome Shifting Consumer Spending

1. Shifting Consumer Preferences Prompts Cleaning-up of Unhealthy Categories
Legacy Brand Better-For-You Brands
• 64% of better-for-you (BFY) snack buyers say taste is important in their decision, more so than any other measured factor
• Consumers continue to look for foods that are both good for them and that taste good
• BFY snacks leading the way in terms of flavor innovation; introducing new BFY snack options will diversify inherent flavor ranges
Sources: 1. Mintel Report, June 2016
65
56
57
40
36
25
22
22
16
12
12
1
1
Taste
Quality
Ingredients
Flavor options
Nutritional profile
Portion size
Brand
Product claims (e.g. organic)
Snack formats
Packaging
Allergens (e.g. gluten, dairy)
Other
None of the above
“Aside from price, when purchasing snacks marketed as healthy, which of the following, if any, are most important to you? Please select up to five.”
20
Most Important Characteristics Consumers Look For in Purchasing Snacks1

21
2. Flexitarian Lifestyles Driving Success of Plant-based Brands
Americans increasing their desire for more plant-based and meat alternative products
• Consumption of plant-based food & beverages now exceeds $4.9 billion in U.S. sales, growing 3.4% YoY in 2016 and outpacing the total food & beverage industry1
• Plant-based ingredient product launches grew at a CAGR of 63% from 2011 to 2015 and show no signs of slowing• Flexitarian approach shifting the protein industry; one in five people have an improved opinion on the healthfulness
of plant protein and many are trying to consumer more
Sources: 1. SPINS, Ending June 2016 2. Innova Market Insights 3. International Food and Information Council Foundations
100
202
295339
656
0
100
200
300
400
500
600
700
2011 2012 2013 2014 2015
Num
ber
of p
rod
uct l
aun
ches
(ind
exed
)*2
011
= b
ase
of 1
00 No change,
54%
Not sure, 16%
More healthful,
21%
Less healthful,
8%
69%
10%22%
28%
42%30%
Yes, I nowconsume more
Yes, I nowcomsume less
No change
Has this change in opinion altered your consumption?
More Healthful Less healthful
Plant-Based Brands Meeting the Demand
Opinion Change: Protein from Plant Sources3New Global Product Launches Tracked with a Plant-Based Claim (indexed*)2

22
3. Grass-fed Products Continue to Outgrow their Traditional-beef Peers
Grass-fed dairy and beef products flourish; opportunities remain for category brand leaders
• Grass-fed beef outgrowing the conventional beef market by a factor of 6x1
• Once considered a luxury item, grass-fed beef is now readily available at many national grocery markets• Grass-fed trend continues to expand in various categories such as butter, ghee, yogurt, cheese, milk protein
powders and dietary supplements
Sources: 1. Nielsen 2. Civil Eats
Grass-Fed Category Leaders
Meat
Yogurt
Milk
Butter
Is Current Grass-Fed Dairy Labeling Transparent Enough?
• Because the new American Grass-Fed Association (AGA) Grass-Fed Dairy seal will not be the product of any government oversight, there is the potential for less credible, grass-fed claims
• Current producers such as Organic Valley, Maple Hill Creamery and Trickling Springs Creamery are working to close the gap catered to a dairy-specific standard
• “We’ve got big players in the organic dairy area who are promoting this... So when consumers start seeing that certification, it’s going to have a lot more impact because it’s on recognized products.” – Marilyn Nobel, AGA’s Communications Director2
6.5%
40.0%
0%
10%
20%
30%
40%
50%
Conventional Beef Grass-Fed Beef
6.2x
Grass-Fed vs. Convention Beef 2016 YoY % Growth1

23
4. Many Large Grocery Opportunities Remain Brand-less
What’s your favorite sushi brand? Exactly.
• The center-of-the-store, known for offering convenient shelf-stable food staples, is no longer as appealing as the fresh produce, dairy, meat, deli and prepared foods sold around store perimeters2
• Perimeter categories outperform center-store sales –center-store sales totaled $205 billion in 2015 and are expected to grow to $216 billion by 2020, perimeter store sales were $296 billion in 2014 and are on pace to reach $364 billion by 20193
• Five out of the 10 top grocery categories consist of grab-and-go, RTD perimeter items1
Sources: 1. Nielsen Answers, Total US All Outlets Combined, period ending 10/1/16, Total Tracked Sales all Outlets Includes: Grocery, drug, mass merchandisers, convenience, select dollar stores, select warehouse clubs and military commissaries (DeCA) – Data reflects UPC-coded items only except where denoted by asterisk (*), which includes UPC + random-weight retailer-assigned price look-up code and system-2 sales volume; volume equivalence will vary respective of each category.
2. Store Brands 3. MintelChart Graphics - provided by Flaticon.com
Top 10 Dollar Growth Categories: Grocery Department1
Annual Dollar Sales >$500 million
Category Dollar % Growth % Growth
Liquid Tea 19.5% 14.4%
Deli Sushi* 16.4% 12.6%
Liquid Coffee 14.6% 13.8%
Lunch Combination 14.4% 13.4%
Vinegar and Cooking Wine 11.8% 6.6%
Cherries* 9.6% 3.3%
Value Added Fruit* 9.4% 3.9%Nutritional (ex. drinks, bars, supplements) 9.3% 2.9%
Value Added Vegetables* 8.9% 6.5%
Meat-Packaged Meals* 8.7% 9.7%
Pioneered the “Intel Inside®” branding of mainstream deli and sandwich shops
What Worked
Frequently found in north-east retailers as the ready-to-serve, branded, offering
Attempt to brand commodity items –inability to resonate as “organic” –whitespace remains

24
5. Big CPG Accelerates Venture Investing
Eighteen94 Capital(Founded, Jun. 2016)
Tyson New Ventures(Founded, Dec. 2016)
Cultivate Ventures(Founded, Nov. 2016)
Manifesto Ventures(Founded, Sep. 2016)
7-Ventures(Founded, 2013)
Acre Venture Partners(Founded, Feb. 2016)
Digitalis Ventures(Founded, Feb. 2016)
Naked Emerging Brands(Founded, 2012)
Unilever Ventures(Founded , 2002)
Big CPG in a race to establish venture funds to gain early exposure to new categories
• Many big CPGs continue to launch venture funds to gain exposure to earlier-stage brands and/or new categories• Provides proof-of-concept testing at a substantially lower cost than M&A – allows targets to operate independently• Target gains strategic capital, advice and (perhaps) distribution – critical issues around negotiating deal terms
Venture & Emerging Brands(Founded, 2007)
301 Inc.(Founded, 2012)
Jan 16 Feb 16 Mar 16 Apr 16 May 16 Jun 16 Jul 16 Aug 16 Sep 16 Oct 16 Nov 16 Dec 162002 – 2015
Date Established

25
6. Label Transparency and Reliability Warrant More Thorough Attention
34% of consumers don’t know what ‘clean label’ is…yet 50% purchase based on nutrition labels1
Defining what ‘HEALTHY’ means The ‘NATURAL’ confusion Kombucha SUGAR content issues
• FDA has issued a guidance for manufactures to follow that will allow more foods to now claim ‘healthy’; currently working to redefine qualifications for the term
• Key change incudes emphasis on types of fat – high healthy fat content a reflection of evidence of the right fats for a healthy diet
• Possible foods affected include avocados, chia seeds, almonds and sunflower seeds1
• High profile lawsuits of large CPG companies such as Danone, Naked Juice and KIND show need to improve understanding of ‘natural’ label claims
• Current FDA guidelines state ‘natural foods’ cannot contain ‘anything artificial or synthetic’ –no stance on GMO or trace elements at this point2
• Industry risks further potential backlash from consumers until improvement in definition
• Recent KeVita study reported that products from five out of eight manufactures tested contained higher levels of sugar than reported on labels
• Study found that the majority of tested products contained 20% more sugar than reported on the label
• Two of those brands contained 291% and 311% more sugar than their labeled amounts……
Sources: 1. New Hope 2. Inside Counsel
• A letter handed down by the FDA warning KIND of their use of ‘healthy’
• Led to industry-wide concern and a citizen petition to the FDA to reconsider the definition
34% of global consumers do not understand the
meaning of ‘clean-label’
Consumer ‘CLEAN-LABEL’ knowledge
45% of US consumers do not understand the
meaning of ‘clean-label’
Labeling issues stem from ‘OUTDATED’ science

26
7. Premium, Natural & Organic Brands Continue to Drive Growth in the Frozen Set
Frozen food category growth driven by brands with premium, better-for-you offerings
• Sales of frozen entrées, pizza, side dishes and appetizer products reached $22B in 2016 – a slight increase over 2015 –proving the category is here-to-stay as other health-centric categories emerge (e.g.) refrigerated1
• 60% of households reported purchasing frozen pizzas and 40% reported purchasing frozen dinners1
• Quality and healthfulness rank paramount in consumers mind when purchasing frozen items as convenience is already perceived1
• Better-for-you brands with high-quality ingredients will continue to out-grow industry peers
30%26%
12%
-6% -8%-13%-20%
-10%
0%
10%
20%
30%
40%
243%
210%
230%
250%
Sources: 1. “Packaged Facts”
9.4%
1.4% 0.4%
-8.8%-13.4%
-15.9%
-31.4%-40%
-30%
-20%
-10%
0%
10%
20%
Premium Frozen Pizza Brands vs Legacy Pizza BrandsIRI Retail Sales – Food – 52 Weeks Ending 01/22/17
Premium Frozen Meal Brands vs. Legacy Meal BrandsIRI Retail Sales – Food – 52 Weeks Ending 01/22/17

2727
8. Large CPG use M&A to Help Supplant R&D
Sources: 1. Boston Consulting Group 2. 10-K Filings from Select CPG Companies with over $5.0 billion in annual sales
0.00.20.40.60.81.01.21.41.61.82.0
Unilever Campbell Soup Company General Mills Pepsico Hershey Hormel Foods
% S
ales
Average Annual R&D Expense at Top CPGs Equals 1.0% of Sales
CPG Brand
2016 R&D Expense(% of Sales)
2016 Sales (YoY % Growth)
Acquiring Authentic Brands
1.9% -1.1%
1.6% -1.5%
1.3% -6.1%
1.2% -0.4%
0.6% -0.4%
0.4% 2.8%
Major CPGs inability to build authentic brands has led to M&A and venture activity
• Since 2011, major CPG brands have lost over $18 billion in market share1 as consumers continue to gravitate towards small, innovative brands with value-additive offerings
• Large CPG attempts to internally create new on-trend brands has largely resulted in minimal success due to an inability to connect authentically with today’s consumers; especially millennials
• As a result, several CPGs are effectively outsourcing new brand development through M&A and venture activity –on average, traditional R&D expense equaled 1.0% of major CPG sales in 20162
• With many large CPG companies holding significant capital on hand, expect M&A activity to remain steady in coming years
Select CPG R&D Expense % of 2016 Sales2

2828
9. Craft Spirits Gain Mainstream Attention
2015
4.9M Cases1
2010
1.5M Cases1
2020P
25.0M Cases2
Annual US Retail Volume
Craft share of US spirit market tripled since 2010
3xIn February 2017, Gruppo Campari announced the acquisition of premium gin company, Bulldog Gin, for $58M
In January 2017, Constellation Brands made investments in Catocin Creek and Bardstown Bourbon
In recent years Pernod Ricard has acquired majority interests in Monkey 47 and Tequila Avión
In 2016, Constellation Brands acquired spirit companies, High West and the Prisoner Wine
In March 2015, Bacardi acquired Angel’s Envy, a bourbon brand
Growth of craft spirits result of alignment with consumer interest in premium offerings
• Following in the foot steps of the craft beer industry, the rapidly growing craft spirts category generates over $2.0 billion in annual sales (4.9 million cases) in the US retail market, representing a CAGR of 27.9% since 20101
• Currently representing 3% of the total US spirit market1, forecasts expect increased mainstream acceptance with annual volumes growing to a projected 25 million cases by 20202
• Consumers increasing interest in craft beverages helping to improve the category’s unit economics – market surveys suggest consumers are willing to pay at least 10% more for craft products3
• Strengthening category performance has led to increased interest from investors and strategics
Category Expected to Build on Recent Success Recent Investment and M&A Activity
Sources: 1. American Craft Spirits Association 2. Fortune 3. Deloitte 4. Harris Poll 5. Mintel
Consumer Interest Driving Growth
28% of US consumers rank spirits as preferred
adult beverage4
55% of US alcohol drinkers say craft brands are of higher quality than
big brands5

29
10. Kombucha Growth Leads to Category Sophistication
0%
10%
20%
30%
40%
50%
Total Conventional Natural Specialty
2016 Retail Sales Totaled$375 Million
Quickly growing Kombucha market faces challenges in achieving mainstream acceptance
• Kombucha represents a nearly $400 million category1
• Sales of the fermented beverage grew by 32% YoY in 2016 with growth occurring across many sales channels1
• Though origins for Kombucha trace back 2000 years, the market for the beverage remains largely underdeveloped – market studies suggest only 4% of US population are aware of and understand Kombucha2
• However, as the category grows, various category issues need attention to gain further mainstream success
• Specifically Kombucha has received questionable press regarding labeling issues surrounding alcohol and sugar content
• The industry’s top brands are actively taking steps to address concerns – for example, the Kombucha Brewers International (KBI) is working with over 100 brands to develop standards for alcohol testing methodology
• Additionally, the entrance of a major CPG brand via Pepsi’s acquisition of KeVita in late 2016 could improve consumer trust and offer increased marketing capital to build category awareness
Sources: 1. SPINS 52 weeks as of 10/2/16 2. Brew Dr Kombucha 3. Grand View Research
& over 100 other Kombucha brands working with KBI to enable category sophistication for continued growth0.0
0.5
1.0
1.5
2.0
2.5
3.0
2014 2015 2016F 2017F 2018F 2019F 2020F 2021F 2022F 2023F 2024F
Sale
s ($B
)
2016 Kombucha Retail Sales Growth %1
US Kombucha Market Revenue Forecast3
30
11. Benefits of Healthy Biome Shifting Consumer Spending
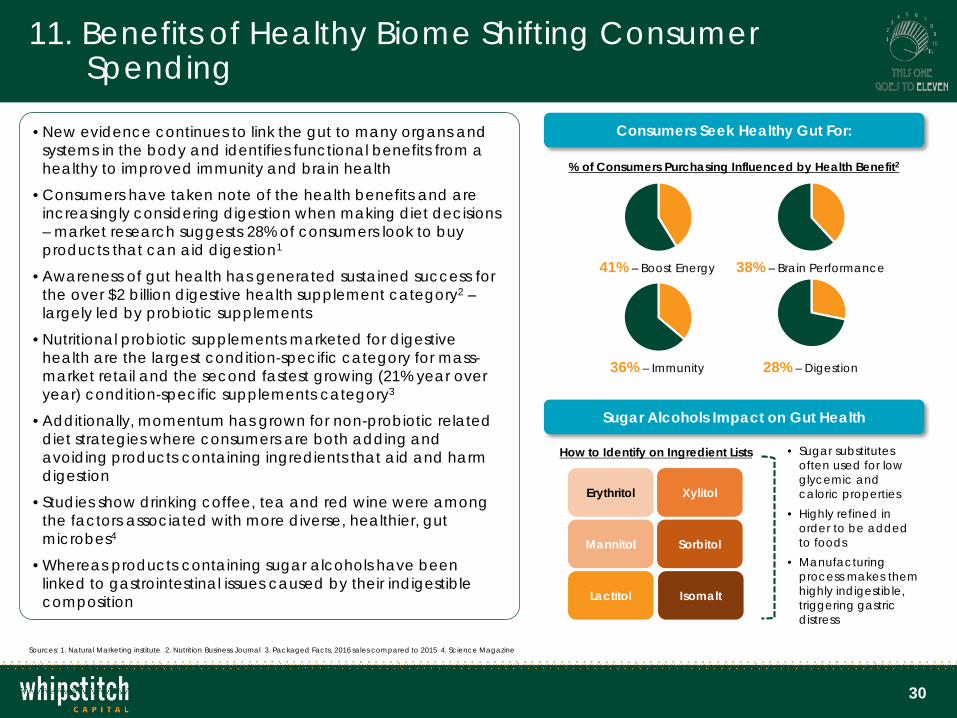
• New evidence continues to link the gut to many organs and systems in the body and identifies functional benefits from a healthy to improved immunity and brain health
• Consumers have taken note of the health benefits and are increasingly considering digestion when making diet decisions – market research suggests 28% of consumers look to buy products that can aid digestion1
• Awareness of gut health has generated sustained success for the over $2 billion digestive health supplement category2 –largely led by probiotic supplements
• Nutritional probiotic supplements marketed for digestive health are the largest condition-specific category for mass-market retail and the second fastest growing (21% year over year) condition-specific supplements category3
• Additionally, momentum has grown for non-probiotic related diet strategies where consumers are both adding and avoiding products containing ingredients that aid and harm digestion
• Studies show drinking coffee, tea and red wine were among the factors associated with more diverse, healthier, gut microbes4
• Whereas products containing sugar alcohols have been linked to gastrointestinal issues caused by their indigestible composition
Sugar Alcohols Impact on Gut Health
Consumers Seek Healthy Gut For:
Erythritol
Mannitol
Lactitol
Xylitol
Sorbitol
Isomalt
How to Identify on Ingredient Lists • Sugar substitutes often used for low glycemic and caloric properties
• Highly refined in order to be added to foods
• Manufacturing process makes them highly indigestible, triggering gastric distress
41% – Boost Energy 38% – Brain Performance
36% – Immunity 28% – Digestion
% of Consumers Purchasing Influenced by Health Benefit2
Sources: 1. Natural Marketing institute 2. Nutrition Business Journal 3. Packaged Facts, 2016 sales compared to 2015 4. Science Magazine

31
Contents
Whipstitch Capital Overview
Healthy Living: Industry Overview and Deal Update / Whipstitch’s Top 11 Healthy Living Consumer Trends
SPINS Market Update: Produced for Whipstitch’s Industry Analysis
Food & Beverage M&A and Private Placement Deal Data
32
Key Trends InThe Natural Products Industry
February 2017

33
SPINS Overview

34
SPINS is the leading provider of retail consumer insights, analytics, and consulting for the Natural, Organic, and Specialty products industries.
WHO IS SPINS?
We transform raw data into intelligent and actionable business solutions.
• Retail Sales Data & Analytics
• Business Intelligence (BI) Tools
• Custom Reports & Consultation
• Brand Growth Solutions
• Consumer Insights & Solutions
• Digital and Mobile Applications
• Thought Leadership & Industry News
Copyright © 2016 SPINS LLC. All Rights Reserved. (312) 281-5100.

35
SPINS tracks retail sales performance across three major channels –Conventional, Natural, and Specialty Gourmet
SPINSscan Specialty Gourmet• Full-format stores with $2 million+ in annual sales with at least 25% of sales from SPINS-defined specialty items.
• High-end stores with a focus on specialty, imported, natural, organic and prepared items.
• ~950 retail locations, representing more than $14.2B, and poised for continued success.
SPINSscan Conventional• Joint service with IRI
• Comprised of ~101,000 retail locations spanning Grocery, Drug, Walmart, Mass, Dollar, Military and some Club.
• Includes reporting in the nation’s leading retailers such as Target, Safeway, Kroger, Wegman’s and Walmart.
• $38B natural/organic market, with overall health and wellness double that size.
SPINSscan Natural• Full-format stores with $2 million+ in annual sales and at least 50%+ of sales from natural/organic products.
• Includes co-ops, associations, independents, large regional chains (excludes Whole Foods).
• Breeds innovation and sustains the level of authenticity and high product standards that define the industry.
• ~1,100 retail locations, $12.4B channel with 28% store increase and 60% volume increase over past 5 years.
Copyright © 2016 SPINS LLC. All Rights Reserved. (312) 281-5100.

36
SPINS Product Library is the industry standard for Health & Wellness information on products
Retail data is segmented in our Product Library. Every product with a barcode is coded for an expansive list of attributes, certifications, ingredient profiles allowing for trillions of nuanced trend insights.
Categoriese.g. Energy Bars, Non-Dairy Beverages,
Meat Alternatives, Homeopathy, Herbal Formulas
Subcategoriese.g. Medicinal Teas, Cheese & Alternatives, Yogurt and Kefir,
Functional Beverages and Kombucha
Attribute TypesSpanning 75 attribute groups such as
Functional Ingredient, Gluten Free, Vegan, Hormone Free, Allergy Free,
Paleo, Sprouted
Certificationse.g. Non GMO Project, NOP Organic, Fair Trade USA, B Corporation, Whole Grain Council
Health Focuse.g. Blood Sugar, Bone, Joint, Cardiovascular, Immune, Digestive, Prenatal, Prostate, Weight
Ingredientse.g. Chia, Fish Oil, Fiber, Plant Sterols, Vitamin D, Probiotics, DHA Products, Protein, Glucosamine
95
489
4675+
10
24
640+
Copyright © 2016 SPINS LLC. All Rights Reserved. (312) 281-5100.

37
What’s New At SPINS?
SPINS RetailPartnership
THE LAUNCH OF NEW KEY ACCOUNTS SPINS continues to expand our partnerships with leading retailers across Natural, Specialty Gourmet, Conventional, and Alternative Channels. We’ve recently launched a number of new key accounts and have a few more in the queue with store level services, including:
SPINS will offer Store-level application services for Target, which operates more than 1700 retail locations and generates over $5.4 billion in annual natural and specialty product sales.
SPINS will continue to offer Kroger Corp, all banners and all divisions, as a Key Account through our partnership with IRI, making Item-level data available for your brands and categories.
Copyright © 2016 SPINS LLC. All Rights Reserved. (312) 281-5100.

38
Through SPINS, Investors can see that Natural Products continue to outpace Total Product sales growth in every channel
Only SPINS: • Tracks retail sales performance across three major channels• Segments total sales by three product segments -- Natural, Specialty, Conventional products
Source: SPINSscan Natural and Specialty Gourmet (proprietary),Conventional Multi Outlet (powered by IRI),52 weeks ending 12/25/2016. UPC coded items only.Natural and Organic defined as SPINS NPI Brand positions
$8.4B Channel Sales
Total Channel
Natural Products
Specialty/Wellness Products
+0%
+2%
+2%
Specialty Gourmet Channel
$8.0B Channel Sales
Total Channel+7%
+7%
+7%
Natural Channel
Natural Products
Specialty/Wellness Products
$684.3B Channel Sales
Total Channel+1%
+10%
+5%
Conventional MULO + Conv
Natural Products
Specialty/Wellness Products
Focus of this document
Copyright © 2016 SPINS LLC. All Rights Reserved. (312) 281-5100.

39
SPINSightsConventional Channel

40
For Whipstitch, SPINS analyzed the dynamics driving Natural Products growth in the Conventional Channel
Product Place Price Promotion
What are the “4Ps dynamics” driving Natural Product Growth?
Copyright © 2016 SPINS LLC. All Rights Reserved. (312) 281-5100.

41
Product
Key Insight: In nearly every Department, Natural & Specialty Products are driving growth
Total U.S. Multi-Outlet and Convenience Channel – Sales Mix and Growth by Department52 Weeks Ending 12/25/16
Grocery $284
General Merchandise $84
Frozen $79
Refrigerated $77
Body Care $41
OTC Medicines $28
Produce - Packaged $26
Vitamins & Supplements $12
Herbs & Homeopathic $2
Total $632
DEPT SALES ($B)
*Excluding Declining Product Groups
Source: Conventional Multi-Outlet and Convenience Channel (powered by IRI), UPCCoded Items only.52 weeks ending 12/25/2016.
2016 SALES MIX % OF $ GROWTH
78%
96%
87%
75%
93%
100%
82%
42%
82%
15%
6%
11%
5%
72%
58%
11%
6%
6%
14%
12%
28%
7%
11%
85%
29%
46%
46%
100%
58%
75%
43%
44%
71%
54%
11%
15%
31%
25%
57%
45%
15%
43%
28%
67%
Natural ProductsConventional Products Specialty Products
1%3%
3%4%
Copyright © 2016 SPINS LLC. All Rights Reserved. (312) 281-5100.

Place
42
Key Insight: While Conventional Products Still Dominate Dollar Sales in Every Channel…
Sales Mix and Growth Rates across Conventional Channels52 Weeks Ending 12/25/16
NPI +9.4% +11.9% +13.7% +7.5% +4.7% +3.1% +2.8%
TPL +0.6% +1.6% +2.8% -0.1% -0.8% +0.3% -4.6%
DollarConvenience MilitaryMassFood Drug Club
$7.7B$79.6B $3.5B$159.8B$316.3B $42.5B $25.8B
76%84%
67%80% 78%
96%
76%
15%10%
30%14% 16% 15%
9% 6% 6% 7% 8%4%3% 1% Natural Products
Specialty Products
Conventional Products
Source: SPINSscan Conventional Multi Outlet and Convenience (powered by IRI), 52 weeks ending 12/25/2016. UPC coded items only. Mass = Target, Walmart, Shopko, K-Mart | Club – BJ’s + Sam’sDollar = Family Dollar + Fred’s Dollar | Military = DeCa + NexcomCopyright © 2016 SPINS LLC. All Rights Reserved. (312) 281-5100.

Place
43
Key Insight: … Natural & Specialty Products Dominate Dollar Growthin Every Channel
Contribution to Growth Mix and Growth Rates across Conventional Channels52 Weeks Ending 12/25/16
Source: SPINSscan Conventional Multi Outlet and Convenience (powered by IRI), 52 weeks ending 12/25/2016. UPC coded items only. Mass = Target, Walmart, Shopko, K-Mart | Club – BJ’s + Sam’sDollar = Family Dollar + Fred’s Dollar | Military = DeCa + Nexcom
Natural Products
Specialty Products
Conventional Products
$0.0B$2.1B $0.0B$2.5B$4.5B $0.3B $0.2B
NPI +9.4% +11.9% +13.7% +7.5% +4.7% +3.1% +2.8%
TPL +0.6% +1.6% +2.8% -0.1% -0.8% +0.3% -4.6%
DollarConvenience MilitaryMassFood Drug Club
22% 24%
46%
39%
63%
31%
60%
96%
60%
54%39%
14%
69%
40%
4%
40%
*Excluding Declining Positioning Groups
Copyright © 2016 SPINS LLC. All Rights Reserved. (312) 281-5100.

Price
44
Key Insight: Looking at “Top 10” categories, Natural Products are selling at a significant Price Premium…
Total U.S. Multi-Outlet and Convenience Channel – Sales Mix and Price by Top 10 Categories52 Weeks Ending 12/25/17
Frozen & Refrigerated Meat Poultry & Seafood $32.7
Bread & Baked Goods $30.0
Shelf Stable Soda & Carbonated Beverages $27.9
Household Products $27.3
Produce $25.7
Shelf Stable Candy $25.4
Household Cleaners & Supplies $24.1
Shelf Stable Chips & Pretzels & Snacks $24.0
Pet Products $20.0
Refrigerated Cheese & Plant Based Cheese $17.6
Category SALES ($B) 2016 SALES MIX
88%
92%
97%
99%
82%
92%
97%
84%
92%
78%
8%
5%
5%
7%
8%
21%
12%
8%
7%
Average Retail Price
Natural Conv-entional Index
$5.65 $4.30
$4.18 $2.29
$2.91 $2.12
$3.67 $4.12
$3.54 $2.88
$2.67 $1.83
$4.78 $4.21
$2.99 $2.24
$6.66 $3.44
$4.65 $3.09
134
194
113
150
146
123
131
182
137
89
2%
2%
1%2%
1%
1%1%
2%1%
3%
4%
Natural ProductsSpecialty ProductsConventional Products
Source: Conventional Multi-Outlet and Convenience Channel (powered byIRI), UPC Coded Items only.52 weeks ending 12/25/2016.
* Alcohol excluded
Copyright © 2016 SPINS LLC. All Rights Reserved. (312) 281-5100.

66
87
65
74
92
96
96
96
54
45
Key Insight: In addition, Natural Products are less reliant on Promotion
Frozen & Refrigerated Meat Poultry & Seafood $32.7
Bread & Baked Goods $30.0
Shelf Stable Soda & Carbonated Beverages $27.9
Household Products $27.3
Produce $25.7
Shelf Stable Candy $25.4
Household Cleaners & Supplies $24.1
Shelf Stable Chips & Pretzels & Snacks $24.0
Pet Products $20.0
Refrigerated Cheese & Plant Based Cheese $17.6
Category SALES ($B) 2016 SALES MIX
88%
92%
97%
99%
82%
92%
97%
84%
92%
78%
8%
5%
5%
7%
8%
21%
12%
8%
7%
Average Retail Price
Natural Conv-entional Index
24.5% 37.2%
29.9% 34.2%
31.3% 48.1%
31.1% 31.1%
34.7% 46.8%
33.1% 36.1%
24.7% 25.6%
42.8% 44.6%
15.7% 16.5%
18.7% 34.6%2%
2%
1%2%
1%
1%1%
2%1%
3%
4%
Natural ProductsSpecialty ProductsConventional Products
Source: Conventional Multi-Outlet and Convenience Channel (powered byIRI), UPC Coded Items only.52 weeks ending 12/25/2016.
Promotion
* Alcohol excluded
100
Total U.S. Retail Dollar Sales & % Growth – Multi-Outlet + Convenience Channel52 Weeks Ending 12/25/17
Copyright © 2016 SPINS LLC. All Rights Reserved. (312) 281-5100.

46
Investor Perspective

47
Investors leverage SPINS to identify the most attractive categories & brands to invest in
What are the Fastest Growing Categories Overall?
Which ones are Heavily Driven by Natural Products?
Based on both of these criteria, what might be the most attractive categories to focus on?
Example use case: What are the fastest growing NPI categories?
Step 1
Step 2
Step 3
Copyright © 2016 SPINS LLC. All Rights Reserved. (312) 281-5100.

48
What are the Fastest Growing Categories Overall?
Step 1 Combined Natural, Specialty and Multi-Outlet Channels – Top 10 Categories by % GrowthCurrent 52 Weeks Ending 12/25/2016
Source: SPINScan Natural Channel; SPINScan Specialty Gourmet Channel;Conventional Multi-Outlet Channel (powered by IRI),52 weeks ending 12/25/2016.
Category Dollars ($M) % Growth
PERFORMANCE NUTRITION $132,619,812 33.3%
HERBAL FORMULAS $1,051,856,619 26.3%
REFRIGERATED PLANT BASED MEAT ALTERNATIVES $124,399,937 12.9%
REFRIGERATED TEA & COFFEE RTD $1,094,805,614 10.8%
PROTEIN SUPPLEMENTS & MEAL REPLACEMENTS $3,326,552,441 10.6%
REFRIGERATED ENTREES $6,507,794,588 10.2%
SHELF STABLE WELLNESS BARS & GELS $2,402,107,396 10.2%
SHELF STABLE TEA & COFFEE RTD $3,090,846,813 9.7%
DIGESTIVE AIDS & ENZYMES $1,454,454,726 9.3%
AMINO ACIDS $51,924,361 8.5%
Other 85 Categories $601,865,534,908 0.8%
Total 95 Categories $621,102,897,216 1.1%
Copyright © 2016 SPINS LLC. All Rights Reserved. (312) 281-5100.

49
Which ones are Heavily Driven by Natural Products?
Step 2 Combined Natural, Specialty and Multi-Outlet Channels – Top 10 Categories by % GrowthCurrent 52 Weeks Ending 12/25/2016
Source: SPINScan Natural Channel; SPINScan Specialty Gourmet Channel;Conventional Multi-Outlet Channel (powered by IRI),52 weeks ending 12/25/2016.
Total Natural Products
Category Dollars ($M) % Growth Dollars ($M) % Growth
PERFORMANCE NUTRITION $132,619,812 33.3% $21,555,124 16.5%
HERBAL FORMULAS $1,051,856,619 26.3% $657,981,641 9.1%
REFRIGERATED PLANT BASED MEAT ALTERNATIVES $124,399,937 12.9% $123,868,714 12.9%
REFRIGERATED TEA & COFFEE RTD $1,094,805,614 10.8% $94,758,953 75.6%
PROTEIN SUPPLEMENTS & MEAL REPLACEMENTS $3,326,552,441 10.6% $330,589,229 28.2%
REFRIGERATED ENTREES $6,507,794,588 10.2% $320,942,225 4.0%
SHELF STABLE WELLNESS BARS & GELS $2,402,107,396 10.2% $1,688,215,434 12.6%
SHELF STABLE TEA & COFFEE RTD $3,090,846,813 9.7% $223,669,736 17.0%
DIGESTIVE AIDS & ENZYMES $1,454,454,726 9.3% $725,045,903 14.1%
AMINO ACIDS $51,924,361 8.5% $43,395,606 5.9%
Other 85 Categories $601,865,534,908 0.8% $47,233,873,710 8.7%
Total 95 Categories $621,102,897,216 1.1% $51,463,898,292 9.1%
Copyright © 2016 SPINS LLC. All Rights Reserved. (312) 281-5100.

Total Natural Products
Category Dollars ($M) % Growth Dollars ($M) % Growth Dollar Change NPI Mix NPI Mix Growth
PERFORMANCE NUTRITION $132,619,812 33.3% $21,555,124 16.5% $3,047,249 16.3% -2.4%
HERBAL FORMULAS $1,051,856,619 26.3% $657,981,641 9.1% $55,069,713 62.6% -9.8%REFRIGERATED PLANT BASED MEAT
ALTERNATIVES $124,399,937 12.9% $123,868,714 12.9% $14,190,169 99.6% 0.0%
REFRIGERATED TEA & COFFEE RTD $1,094,805,614 10.8% $94,758,953 75.6% $40,787,656 8.7% 3.2%PROTEIN SUPPLEMENTS & MEAL
REPLACEMENTS $3,326,552,441 10.6% $330,589,229 28.2% $72,656,977 9.9% 1.4%
REFRIGERATED ENTREES $6,507,794,588 10.2% $320,942,225 4.0% $12,418,712 4.9% -0.3%
SHELF STABLE WELLNESS BARS & GELS $2,402,107,396 10.2% $1,688,215,434 12.6% $189,039,443 70.3% 1.5%
SHELF STABLE TEA & COFFEE RTD $3,090,846,813 9.7% $223,669,736 17.0% $32,534,652 7.2% 0.5%
DIGESTIVE AIDS & ENZYMES $1,454,454,726 9.3% $725,045,903 14.1% $89,622,252 49.9% 2.1%
AMINO ACIDS $51,924,361 8.5% $43,395,606 5.9% $2,421,241 83.6% -2.0%
Other 85 Categories $601,865,534,908 0.8% $47,233,873,710 8.7% $3,788,477,267 7.8% 0.6%
Total 95 Categories $621,102,897,216 1.1% $51,463,898,292 9.1% $4,300,265,329 8.3% 0.6%
50
Which ones are Heavily Driven by Natural Products?
Step 2
Source: SPINScan Natural Channel; SPINScan Specialty Gourmet Channel;Conventional Multi-Outlet Channel (powered by IRI),52 weeks ending 12/25/2016.Copyright © 2016 SPINS LLC. All Rights Reserved. (312) 281-5100.
Combined Natural, Specialty and Multi-Outlet Channels – Top 10 Categories by % GrowthCurrent 52 Weeks Ending 12/25/2016

51
Copyright © 2016 SPINS LLC. All Rights Reserved. (312) 281-5100.
Which ones are Heavily Driven by Natural Products?
Step 3
Source: SPINScan Natural Channel; SPINScan Specialty Gourmet Channel;Conventional Multi-Outlet Channel (powered by IRI),52 weeks ending 12/25/2016.
Category % Growth % NPI Mix Change
Refrigerated Tea & Coffee Rtd 11% 3%
Herbal Singles 5% 3%
Shelf Stable Oils & Vinegars 3% 2%
Digestive Aids & Enzymes 9% 2%
Shelf Stable Water 8% 2%
Refrigerated Condiments 5% 2%
Shelf Stable Jerky & Meat Snacks 6% 2%
Vitamins & Minerals 1% 2%
Refrigerated Plant Based Milk & Creamer 4% 2%
Shelf Stable Wellness Bars & Gels 10% 1%
Other High Potential Categories
% NPI Mix Change
Category (TPL) $ % Change
Combined Natural, Specialty and Multi-Outlet Channels – Category Growth Rate by % NPI Mix GrowthCurrent 52 Weeks Ending 12/25/2016
52
Copyright © 2016 SPINS LLC. All Rights Reserved. (312) 281-5100.
For More Information, Contact SPINS Financial Partners Team
Anu GoelExecutive Vice PresidentClient Growth [email protected]
Edricco ReinaPrincipalFinancial Partners Team [email protected]
• Brand Equity Ventures• McKinsey & Company• Beam Inc.• B.S., University of Pennsylvania• MBA, Harvard Business School
• The Nielsen Company• Anderson Merchandisers• New Market Capital Group• B.B.A., Western Michigan University• MBA, Elmhurst College
Source: SPINScan Natural Channel; SPINScan Specialty Gourmet Channel;Conventional Multi-Outlet Channel (powered by IRI),52 weeks ending 12/25/2016.

53
Contents
Whipstitch Capital Overview
Healthy Living: Industry Overview and Deal Update / Whipstitch’s Top 11 Healthy Living Consumer Trends
SPINS Market Update: Produced for Whipstitch’s Industry Analysis
Food & Beverage M&A and Private Placement Deal Data

54
Select CPG Stock Performance
20
40
60
80
Feb 2015 Feb 2017
Stoc
k Pr
ice
($)
Campbell Soup Company (CPB)
10
20
30
40
50
60
Feb 2015 Feb 2017
Stoc
k Pr
ice
($)
Conagra Brands (CAG)
20
40
60
80
Feb 2015 Feb 2017
Stoc
k Pr
ice
($)
General Mills (GIS)
20
40
60
80
100
120
Feb 2015 Feb 2017
Stoc
k Pr
ice
($)
The Hershey Company (HSY)
10
20
30
40
50
Feb 2015 Feb 2017
Stoc
k Pr
ice
($)
The Coca-Cola Company (KO)
20
40
60
80
Feb 2015 Feb 2017
Stoc
k Pr
ice
($)
Nestlé S.A. (NESN)
20
40
60
80
100
Feb 2015 Feb 2017
Stoc
k Pr
ice
($)
Danone (BN)
20
40
60
80
100
120
Feb 2015 Feb 2017
Stoc
k Pr
ice
($)
Dr Pepper Snapple Group (DPS)
20
40
60
80
100
120
Feb 2015 Feb 2017
Stoc
k Pr
ice
($)
PepsiCo (PEP)
Source: S&P Capital IQ as of 3/1/17

55
Strong Revenue Growth Leads to Top-tier Valuation Multiples
EV/
Sale
s Mul
tiple
Sales % Growth
3.7x EV/Sales
3.6x EV/Sales
3.9x EV/Sales
~4.3x EV/Sales
5.5x EV/Sales
5.0x EV/Sales
4.5x EV/Sales
4.4x EV/Sales
6.9x EV/Sales
N/A EV/Sales
Undisclosed
But we know where it goes…And it’s good…
Source: Capital IQ & Industry Research

56
Selected Consumer M&A
Announced Transaction Enterprise Value /
Date Target Acquirer Value ($ in 000) Revenue EBITDA
2/22/17 Walden Farms PANOS brands, LLC n/a n/a n/a 2/21/17 Lightlife Foods, Inc. Maple Leaf Foods Inc. $140,000 3.5x n/a 2/10/17 Mead Johnson Nutrition Reckitt Benckiser Group 16,700,000 4.5 18.2
2/3/17 Body Plus CCMP Capital Advisors, Jamieson Laboratories , Stockton Road Capital n/a n/a n/a
2/2/17 Bulldog Gin Campari 58,000 n/a n/a2/1/17 Michael Angelo's Gourmet Foods Advent International, Sovos Brands n/a n/a n/a
1/19/17 Mondelez International, Inc., Grocery and Cheese Business in Australia & New Zealand Bega Cheese Limited 347,300 n/a n/a
1/18/17 Brinkhoff & Monoson, Inc. (Red Monkey Foods) San Francisco Equity Partners n/a n/a n/a 1/17/17 Love & Quiches Gourmet AUA Private Equity Partners, Indulge Desserts Holdings n/a n/a n/a1/10/17 Younique Coty 600,000 1.5 n/a1/9/17 Garden Fresh Restaurant Corp. Cerberus Capital Management n/a n/a n/a 1/6/17 Amazing Grass Glanbia n/a n/a n/a1/4/17 Bubbies Homemade Ice Cream & Desserts Kenex Holdings n/a n/a n/a1/3/17 Hill & Valley, Inc. J&J Snack Foods Corp. n/a n/a n/a 12/28/16 Wild Joe's Beef Jerky Simply Unique Snacks, LLC n/a n/a n/a 12/20/16 Sweet Harvest Foods Inc. Natural American Foods, Inc. n/a n/a n/a 12/15/16 Living Proof, Inc Unilever PLC n/a n/a n/a 12/13/16 Beer Business in Central and Eastern Europe (AB InBev) Asahi Group Holdings, Ltd. 7,774,200 4.4 14.812/12/16 Nothing But Nature Inc. (Kiju Organic) GreenSpace Brands Inc. 7,500 1.2 n/a 12/12/16 Maxi Canada Inc. Altamont Capital Partners n/a n/a n/a 12/9/16 Foodpanda GmbH Delivery Hero Holding GmbH n/a n/a n/a 12/9/16 The Wilnah International, LLC (ALO Juice) Long Island Iced Tea Corp. 25 n/a n/a 12/7/16 Nestle (Nutrament Business) Brynwood Partners, Harvest Hill Beverage n/a n/a n/a
12/2/16 Victoria Fine Foods Holding Company and VictoriaFine Foods, LLC B&G Foods, Inc. 70,000 n/a n/a
Source: Capital IQ & Industry Research

57
Selected Consumer M&A
Announced Transaction Enterprise Value /
Date Target Acquirer Value ($ in 000) Revenue EBITDA
11/29/16 Enrico Giotti S.p.A. McCormick & Company $127,300 2.3x n/a 11/28/16 Blue Lake Citrus Products, LLC (Nobel Juice) Sun Orchard, Inc. n/a n/a n/a
11/28/16 Snyder's-Lance, Inc., Diamond of CaliforniaCulinary Nut Business Blue Road Management, L.P. n/a n/a n/a
11/22/16 BAI Brands LLC Dr Pepper Snapple Group, Inc. 1,700,000 4.5 21.5 11/22/16 KeVita, Inc. PepsiCo, Inc. n/a n/a n/a 11/17/16 Bellisio Parent, LLC Charoen Pokphand Foods Public Co. Ltd. 1,075,000 1.8 n/a 11/14/16 Peacock Foods LLC Greencore Group plc 747,500 0.8 15.811/10/16 Mercer Foods Inc. Graham Partners n/a n/a n/a 11/3/16 Angelic Bakehouse, Inc. T. Marzetti Company n/a n/a n/a
10/31/16 Grupo Modelo, S.A.B. de C.V., Brewery Operationin Obregon, Mexico Constellation Brands Inc. 600,000 n/a n/a
10/31/16 Hillside Candy LLC Highlander Partners, L.P. n/a n/a n/a 10/24/16 Stonefire Grill, Inc. Goode Partners LLC n/a n/a n/a 10/17/16 Charles Smith Wines Constellation Brands 120,000 n/a n/a10/17/16 Good Hair Day Coty 552,340 2.4 12.510/14/16 Northern Brewer, Inc. ZX Ventures LLC n/a n/a n/a 10/13/16 Parati S.A. Kellogg Company 430,000 n/a n/a 10/10/16 Allied Specialty Foods, Inc. AdvancePierre Foods Holdings, Inc. 60,000 n/a n/a10/5/16 High West Distillery, LLC Constellation Brands Inc. 160,000 n/a n/a 9/29/16 Gorilly Goods Nature's Path Foods n/a n/a n/a 9/26/16 Red Fork LLC , Packaged Foods Businesses ConAgra Foods, Inc. n/a n/a n/a 9/26/16 Frontera Foods, Inc. ConAgra Foods, Inc. n/a n/a n/a
9/21/16 ACH Food Companies, Inc., Spices and SeasoningsBusiness B&G Foods North America, Inc. 365,000 1.7 9.4
9/19/16 Seventh Generation, Inc. Unilever PLC 700,000 3.5 n/a 9/9/16 Boathouse Beverage, LLC (SpikedSeltzer) Anheuser-Busch InBev SA/NV n/a n/a n/a 9/8/16 Jimmy John's Franchise, LLC Roark Capital Group n/a n/a n/a
Source: Capital IQ & Industry Research

58
Consumer Private Placements
Announced Transaction
Date Target Investor(s) Value ($ in 000)
2/16/17 MealPal Comcast Ventures, Bessemer Venture Partners, Haystack Partners, NextView Ventures $15,000
2/14/17 Tractor Soda AccelFoods n/a
2/14/17 Natural Food Works, LLC Snyder's-Lance, Inc. 1,500
2/7/17 Miyoko's Kitchen, Inc. Obvious Ventures, JMK Consumer Growth Partners, Stray Dog Capital n/a
2/2/17 Ospoto, Inc. (Sun Basket) J.F. Shea Venture Capital, Vulcan Capital, Sapphire Ventures LLC, Accolade Partners, Baseline Ventures, PivotNorth Capital, Relevance Capital, Founders Circle Capital LP 15,000
1/26/17 Hungryroot, Inc. Lightspeed Venture Partners, Lerer Hippeau Ventures, Crosslink Capital 7,700
1/25/17 Kopari L Catterton n/a
1/24/17 Incredible Foods, Inc. Flagship Pioneering, Polaris Partners, Winona Capital Management, LLC n/a
1/23/17 Once Upon a Farm, LLC Harbinger Ventures Group, Inc., S2G Ventures, Cambridge Companies, LLC 3,110
1/20/17 ISS Research, LLC (OhYeah! Nutrition) CAVU Venture Partners n/a
1/18/17 Barnana BFG Partners, Blueberry Ventures, Finn Capital Partners, Trently Advisors 5,300
1/17/17 Rhythm Superfoods, LLC Circleup Growth Capital Fund I, L.P.,Inc., Investment Arm, 301 Inc., Blueberry Ventures 6,000
1/11/17 Pure Growth Organic Foods, LLC Sunrise Strategic Partners, LLC n/a
1/11/17 Kuli Kuli, Inc. InvestEco Capital Corp., S2G Ventures, Eighteen94 Capital, LLC 4,250
12/22/16 Quip Blue Scorpion Investments, L.P., Blue Scorpion Investments n/a
12/19/16 Evoke Healthy Foods Launch NY 50
12/19/16 HelloFresh Baillie Gifford & Co. 88,820
12/14/16 Goddess Garden LLC Renewal2 Management Company 3,000
12/14/16 Lola Products Spark Capital 7,000
12/13/16 Clear Labs, Inc. Khosla Ventures, Felicis Ventures, GV, Tencent Holdings Ltd., Investment Arm, Wing Venture Partners 13,000
12/6/16 Shenandoah Valley Organic, LLC S2G Ventures 4,740
12/6/16 Brandless, Inc. Redpoint Ventures, Cowboy Ventures, Slow Capital and Sherpa Capital 16,000
12/5/16 Snooze, an A.M. Eatery Stripes Group n/a
12/2/16 Oatly AB Verlinvest S.A., China Resources Co., Limited n/a Source: Capital IQ & Industry Research

59
Consumer Private Placements
Announced Transaction
Date Target Investor(s) Value ($ in 000)
12/2/16 Rebbl, Inc. Powerplant Ventures, LLC, Boulder Investment Group Reprise $10,000
11/16/16 MOD Pizza LLC Fidelity Management & Research Company, Perella Weinberg Partners, Investment Arm, PWP Growth Equity 42,000
11/15/16 Zwift, LLC Samchuly Bicycle Co., Ltd, Shasta Ventures, Novator Partners LLP, Waypoint Capital 27,000
11/15/16 &pizza AVALT Holdings 25,000
10/31/16 Crunchsters, Inc. VG Growth Partners LLC n/a
10/28/16 Terra's Kitchen, LLC Kiwi Venture Partners n/a
10/28/16 Habit Food Personalized, LLC Campbell Soup Company 32,000
10/27/16 Luna Pharmaceuticals, Inc. (Premama) River Hallow Partners n/a
10/27/16 Foodstirs, LLC Beechwood Capital, MuckerLab, Mucker Capital, Cambridge Companies, LLC n/a
10/26/16 Veggie Grill Brentwood Associates, Powerplant Ventures 22,000
10/25/16 Vintage Italia Advantage Capital Partners, Emil Capital Partners, Silas Capital 3,000
10/22/16 Maple Hill Creamery, LLC Sunrise Strategic Partners, LLC n/a
10/18/16 UTZ Quality Foods, Inc. C. Dean Metropoulos & Co. 146,000
10/12/16 Joe & the Juice A/S General Atlantic LLC, Valedo Partners n/a
10/10/16 Beyond Meat, Inc. Kleiner Perkins Caufield & Byers, Tyson Foods, Inc., n/a
10/7/16 Del Real Foods Palladium Equity Partners LLC 121,600
10/5/16 Argo Tea Inc. JAB Holdings n/a
10/5/16 Ollie Pet Inc. Canaan Partners, Primary Venture Partners, Lerer Hippeau Ventures 4,400
10/5/16 BEFORE Brands, Inc. Gurnet Point Capital Limited 13,100
9/29/16 Relish Labs LLC (Home Chef) L Catterton 40,000
9/26/16 Fresh Direct, LLC J.P. Morgan Asset Management, Inc., W Capital Partners, AARP Financial Inc., Asset Management Arm, AARP Innovation Fund 189,000
9/21/16 BrightFarms, Inc. Catalyst Investors, NGEN Partners, LLC, WP Global Partners, Inc. 30,100
9/16/16 good culture, LLC 301 Inc., CAVU Venture Partners 3,000
9/13/16 Oath Craft Pizza Breakaway Innovation Group 4,500
Source: Capital IQ & Industry Research

60
Related Documents