West Virginia Health Care Authority Healthcare-Associated Infection Public Reporting Program 2015 Annual Report Earl Ray Tomblin Governor James L. Pitrolo, Board Chair West Virginia Health Care Authority West Virginia Health Care Authority • 100 Dee Drive, Charleston, WV 25311 • Ph: 304-558-7000 • www.hca.wv.gov

Welcome message from author
This document is posted to help you gain knowledge. Please leave a comment to let me know what you think about it! Share it to your friends and learn new things together.
Transcript
West Virginia Health Care
Authority
Healthcare-Associated Infection
Public Reporting Program
2015 Annual Report
Earl Ray Tomblin
Governor
James L. Pitrolo, Board Chair
West Virginia Health Care Authority West Virginia Health Care Authority • 100 Dee Drive, Charleston, WV 25311 • Ph: 304-558-7000 • www.hca.wv.gov
2
West Virginia Health Care Authority Healthcare-Associated Infection Public Reporting Program
2015 Annual Report West Virginia Health Care Authority Board James L. Pitrolo, Jr., Chairman Sonia D. Chambers Marilyn G. White
Healthcare-Associated Infection Control Program Staff Sharon Hill, Director of Clinical Analysis Shelley Baston, MBA, RNC-NIC, CPC Laura Boutwell, DVM, MPH, Epidemiologist Muluken Aseffa, MSHI, Epidemiologist
West Virginia Healthcare-Associated Infection Control Advisory Panel Randy Ashlock, RN, BSB, BSN, CIC Infection Preventionist, HealthSouth Rehabilitation Hospital
Dee Bixler, MD, MPH Director, Division of Infectious Disease Epidemiology, WV Bureau for Public Health
Janet Crigler, MT (ASCP), CIC Infection Preventionist, Fairmont General Hospital
L. Scott Dean, PhD, MBA Senior Biostatistician, Charleston Area Medical Center Health Education and Research Institute
Dianne DeAngelis, RN, ICP, CIC Infection Control Practitioner, West Virginia University Hospital
Brooks Gainer II, MD, FACP, FIDSA, FSHEA Associate Clinical Professor, West Virginia University Section of Infectious Diseases Infectious Disease Society of America Liaison for West Virginia
Sharon Gaston, RN, BSN, MPH, CIC Infection Control Practitioner, Braxton County Memorial Hospital
Loretta Haddy, PhD State Epidemiologist, Office of Epidemiology and Prevention Services, WV Bureau for Public Health
Cynthia Isaacs, RN, BSN, MBA Chief Executive Officer, Cornerstone Healthcare Group, Hospital of Huntington
Rashida Khakoo, MBChB, MACP Professor and Chief of the Section of Infectious Diseases, West Virginia University
Jim Kranz Vice President, Professional Activities, West Virginia Hospital Association
Terrie Lee, RN, MS, MPH, CIC Director, Infection Prevention & Employee Health, Charleston Area Medical Center
Linda Minnich, SM (AAM and ASCP), MS Virologist, Charleston Area Medical Center
Thomas Rushton, MD, FACP, FIDSA, FHSEA Infectious Diseases, Marshall University School of Medicine
Will Wright Medicare/Hospital Program Manager, Office of Health Facility Licensure and Certification, WV Office of Inspector General
3
Table of Contents
Introduction 4
HAI Reporting in West Virginia 5
HAI Surveillance and Reporting Requirements 6
Limitations 7
How to Read the HAI Graphs 9
Data Section
I. Central Line Associated Blood Stream Infection (CLABSI)
a. Key Findings for General Acute Care Hospitals 9
b. Key Findings for Long Term Acute Care Hospitals 11
II. Catheter Associated Urinary Tract Infection (CAUTI)
a. Key Findings for General Acute Care Hospitals 12
b. Key Findings for Long Term Acute Care Hospitals 14
c. Key Findings for Critical Access Hospitals 14
d. Key Findings for Inpatient Rehabilitation Hospitals, Freestanding 16
e. Key Findings for Inpatient Rehabilitation Hospitals, Within Hospital 17
III. Surgical Site Infections (SSI)
a. Key Findings for General Acute Care Hospitals, Colon Procedures 18
b. Key Findings for General Acute Care Hospitals, Abdominal Hysterectomy 20
IV. Inpatient Methicillin-Resistant Staphylococcus aureus (MRSA) Bacteremia
a. Key Findings for General Acute Care Hospitals 22
V. Inpatient Clostridium difficile Infection (CDI)
a. Key Findings for General Acute Care Hospitals 24
VI. Healthcare Personnel Influenza Vaccinations
a. Key Findings by Hospital Type and Healthcare Personnel Population 26
Advisory Panel Accomplishments and Future Directions 36
Technical Notes 38

4
Introduction
Healthcare-associated infections (HAIs) are infections that are acquired by patients when seeking
treatment in a healthcare setting. In 2002, the Centers for Disease Control and Prevention (CDC)
estimated that there were 1.7 million HAIs occurring annually in hospitals in the US, and these
infections were associated with 99,000 deaths.1 In a more recent study, the CDC estimated that
in 2011, approximately 722,000 HAIs occurred nationally, which equated to 4% of inpatients in
US acute care facilities, and were associated with as many as 75,000 deaths.2 While both of these
studies were estimates and with differing methodology, they illustrate the point that potentially
over a million Americans are at risk for contracting a healthcare-associated infection. Of those
infected, tens of thousands of deaths are attributable to HAIs.2 However, these infections are
preventable and therefore, a major public health focus for governments and healthcare facilities.
In order to address this serious problem, many national and state agencies have been working
towards understanding the full extent of HAIs and how to prevent them from occurring. While
elimination of HAIs is a long term goal nationwide, 3 prevention is the focus of short term
intervention strategies. In a joint call to action, the Association of Professionals in Infection
Control and Epidemiology (APIC), the Society for Healthcare Epidemiology of America (SHEA),
and the CDC, along with other public health associations, called for the elimination of HAIs by: 3
Promoting adherence to evidence-based practices through partnering, educating,
implementing, and investing;
Increasing sustainability through the alignment of financial incentives and reinvestment
in successful strategies;
Filling knowledge gaps to respond to emerging threats through basic, translational, and
epidemiological research;
Collecting data to target prevention efforts and to measure progress; and
Sufficient investment underpinning these efforts;3
Because HAIs place a large financial burden on the healthcare system, these key principles call
upon financial and interagency support to be effective. Understanding the prevalence of HAIs
and the potential risk factors for contracting HAIs are the major goals of HAI surveillance and
reporting. This is so that effective control and prevention measures can be designed and
implemented for improving the incidence of HAIs while reducing associated financial burdens on
1 Klevens RM, Edwards JR, Richards CL, Jr., et al. Estimating health care-associated infections and deaths in U.S. hospitals, 2002. Public Health Report. Mar-Apr 2007;122(2):160-166. Available at http://www.cdc.gov/HAI/surveillance/index.html. 2 Magill SS, Edwards JR, Bamberg W, et al. Multistate point-prevalence survey of health care-associated infections. N Engl J Med. Mar 2014;370:1198-208. Doi: 10.1056/NEJMoa1306801. 3 Cardo D, Dennehy PH, Halverson P, et al. Moving towards elimination of healthcare-associated infections: A call to action. Am J Infect Control. 2010;1-5. Doi: 10.1016/j.ajic.2010.09.001.
5
facilities. The costs associated with HAI treatment are substantial, with the annual cost of treating
HAIs in US hospitals estimated to be $28 to $33 billion dollars.4
HAIs are considered preventable, but there is discussion regarding how many of these HAIs are
truly preventable. This has stemmed from the 2008 Medicare decision to stop payment on eight
preventable conditions, three of which are considered “reasonably preventable” HAIs: central
line associated blood stream infection (CLABSI), catheter associated urinary tract infection
(CAUTI), and surgical site infections (SSI).5 There was a systematic review conducted in 2011 to
determine the proportion of HAIs that are preventable under the current intervention practices.
The study determined that up to 70% of CLABSI and CAUTI cases and 55% of SSI cases are
preventable.5 By instituting prevention measures that reduce HAIs by 20%, $5.7 to $6.8 billion
dollars a year in US hospitals would be saved.4
A recent report from the Department of Health and Human Services (HHS) shows similar
outcomes. In a press release published in December 2014, improved patient safety initiatives to
reduce hospital-acquired conditions saved an estimated 50,000 patient lives, preventing 1.3
million hospital acquired infections and saving approximately $12 billion dollars in healthcare
costs between 2010 and 2013, which is a 17% reduction in hospital acquired conditions over that
time period.6
In addition to the financial incentive of instituting prevention measures within hospitals, the
nationwide Hospital-Acquired Condition Reduction Program, instituted in 2010, is a mandatory
pay-for-performance program that penalizes hospitals with the highest rates of infections in the
nation with a 1% loss to every Medicare payment for one year. 7 As of October 2014,
approximately 750 hospitals face over $330 million dollars a year in penalties.7 The growing
pressure of penalties, coupled with the concern over patient safety, place the prevention of
healthcare-associated infections as one of the highest priorities for healthcare facilities across
the nation.
HAI Reporting in West Virginia
In 2008, the West Virginia Legislature created §16-5B-17 to make HAI data available to the public
and to promote quality improvement initiatives to reduce HAIs in West Virginia hospitals. The
legislation mandated hospitals to report HAI data and required the West Virginia Healthcare
4 Scott RD. The direct medical costs of healthcare-associated infections in U.S. hospitals and the benefits of prevention. 5 Umscheid CA, Mitchell MD, Doshi JA, et al. Estimating the Proportion of Healthcare-Associated Infections that are Reasonably Preventable and the Related Mortality and Costs. Infect Control Hosp Epidemiol Feb 2011;32(2):101-114. Doi:10.1086/657912. 6 US Department of Health and Human Services, HHS News (press release). December 2, 2014. Website: http://www.hhs.gov/news/press/2014pres/12/20141202a.html. December 2014. 7 Rau, Jordan. Hospitals to Pay Big Fines for Infections, Avoidable Injuries. NPR News. June 23, 2014. Website: http://www.npr.org/blogs/health/2014/06/23/323998618/hospitals-to-pay-big-fines-for-infections-avoidable-injuries. October 2014.

6
Authority (WVHCA) to create a HAI Control Advisory Panel to assist in performing the following
activities:
Provide guidance to hospitals in their collection of information regarding healthcare-
associated infections;
Provide evidence-based practices in the control and prevention of healthcare-associated
infections;
Establish reasonable goals to reduce the number of healthcare-associated infections;
Develop plans for analyzing infection-related data from hospitals;
Develop healthcare-associated advisories for hospital distribution; and
Determine a manner in which reporting of healthcare-associated infections is made
available to the public in an understandable fashion.
The HAI Control Advisory Panel was initially convened by the WVHCA in January 2009. The Panel
consists of representatives from hospitals, the West Virginia Hospital Association, public health,
professionals with expertise in infectious disease control and prevention, biostatistics,
microbiology, and health policy. The Panel members are listed on page 2.
The WVHCA has been mandated by the West Virginia Legislature to annually summarize and
report progress of the HAI Control Advisory Panel and the results of required reporting to the
Legislative Oversight Committee on Health and Human Resources Accountability.
For the purposes of this report, a hospital has been defined in West Virginia §16-29B-3 as “any
facility subject to licensure as such under the provisions of article five-b of this chapter, and any
acute care facility operated by the state government which is primarily engaged in providing to
inpatients, by or under the supervision of physicians, diagnostic and therapeutic services for
medical diagnosis, treatment and care of injured, disabled or sick persons, and does not include
state mental health facilities or state long-term care facilities.”8 Although the terms hospital and
facility have differing definitions, in this report the use of facility and hospital is used
interchangeably to refer to a hospital as defined previously. In 2013, fifty-nine (59) West Virginia
hospitals fell under that definition and are represented in this report; thirty-one (31) general
acute care hospitals, nineteen (19) critical access hospitals, two (2) long term acute care
hospitals, two (2) psychiatric hospitals, and five (5) rehabilitation hospitals.
HAI Surveillance and Reporting Requirements
Annually, the HAI Control Advisory Panel reviews and updates the hospital HAI public reporting
requirements. When choosing the measures required for reporting, the Panel considers the
impact of HAIs on patient outcomes and ability for hospitals to collect and report the data. Once
reporting guidance is developed, it is distributed to infection control contacts at each hospital.
8 West Virginia Legislature, West Virginia Code §16-29B-3. Website: http://www.legis.state.wv.us/legisdocs/code/16/WVC%2016%20%20-%2029%20B-%20%20%203%20%20.htm. November 2014.
7
As a requirement of WV regulation §16-5B-17, hospitals must submit data to the CDC’s National
Healthcare Safety Network (NHSN), which was developed as a voluntary surveillance system for
hospitals to identify and monitor HAIs, but has evolved as the tool for mandatory HAI reporting
by many states.
West Virginia HAI reporting requirements began in July 2009. In January 2011, the Centers for
Medicare and Medicaid Services (CMS) implemented HAI reporting requirements for hospitals
participating in the Hospital Inpatient Quality Reporting Program. To reduce the reporting burden
on hospitals, the Panel decided to adopt CMS requirements as West Virginia’s reporting
requirements. In addition, the HAI Control Advisory Panel recommended that Critical Access
Hospitals (CAHs) also report State specific HAI since the Hospital Inpatient Quality Reporting
Program is voluntary and not required for CAHs by CMS. Healthcare Personnel Influenza
vaccination data was also required of non-state run psychiatric facilities. These additional
requirements were approved by the WVHCA Board in August 2012. Table 1, page 8, summarizes
the measures required to be submitted for West Virginia’s HAI Public Reporting Program in 2014.
The WVHCA monitors reporting compliance and provides technical assistance to infection control
contacts to ensure timely and accurate data submission. Submitted data are managed and
analyzed by the WVHCA and the results are disseminated to the HAI Control Advisory Panel for
review and approval prior to release.
This report summarizes data reported on central line associated blood stream infections (CLABSI),
catheter associated urinary tract infections (CAUTI), surgical site infections (SSI) for colon
surgeries and abdominal hysterectomies, Methicillin-Resistant Staphylococcus aureus (MRSA)
bacteremia, C. difficile infections, as well as healthcare personnel seasonal influenza vaccinations
for the 2013-2014 reporting period. Due to the data collection and processing schedule, this
report does not include any healthcare-associated infection data submitted in 2014. The 2014
data will be summarized in future reports.
Report Limitations
It is important to note that there are limitations to the data presented. The 2013 data in this
report is pulled directly from NHSN and input by the individual facility following the NHSN
protocol and procedures, now outlined in the West Virginia Healthcare-Association Infection
2014 Reporting Guide (available on the WVHCA website), as well as directly from the CDC’s NHSN
website. The data was not validated, but was analyzed by the WVHCA for completeness.
There is also great variability in the internal surveillance methods used by facilities for HAI
detection and these methods are not standardized across facilities. Finally, the actual case
definition for these HAI events changes on an almost annual basis, so a comparison of different
years of data should be interpreted with these changes in mind. The 2015 reporting changes for
NHSN will be outlined in the “Advisory Panel Accomplishments and Future Directions” section of
this report.
8
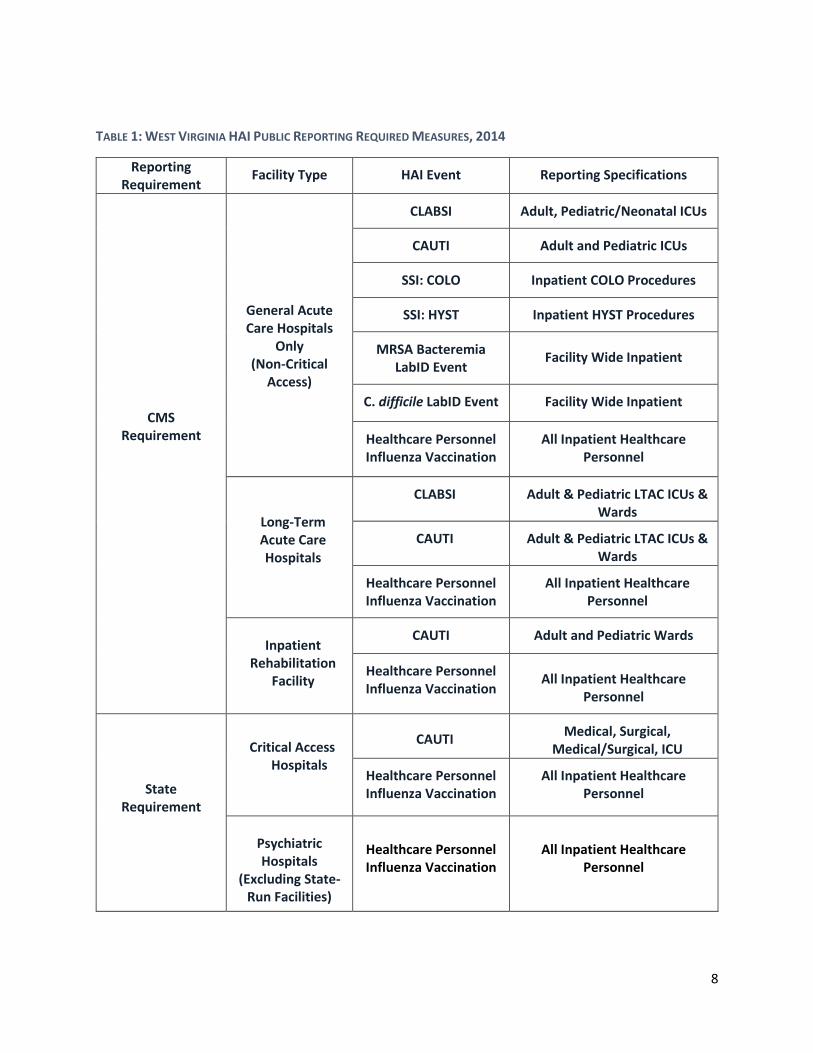
TABLE 1: WEST VIRGINIA HAI PUBLIC REPORTING REQUIRED MEASURES, 2014
Reporting Requirement
Facility Type HAI Event Reporting Specifications
CMS Requirement
General Acute Care Hospitals
Only (Non-Critical
Access)
CLABSI Adult, Pediatric/Neonatal ICUs
CAUTI Adult and Pediatric ICUs
SSI: COLO Inpatient COLO Procedures
SSI: HYST Inpatient HYST Procedures
MRSA Bacteremia LabID Event
Facility Wide Inpatient
C. difficile LabID Event Facility Wide Inpatient
Healthcare Personnel Influenza Vaccination
All Inpatient Healthcare Personnel
Long-Term Acute Care Hospitals
CLABSI Adult & Pediatric LTAC ICUs & Wards
CAUTI Adult & Pediatric LTAC ICUs & Wards
Healthcare Personnel Influenza Vaccination
All Inpatient Healthcare Personnel
Inpatient
Rehabilitation Facility
CAUTI Adult and Pediatric Wards
Healthcare Personnel Influenza Vaccination
All Inpatient Healthcare Personnel
State Requirement
Critical Access Hospitals
CAUTI Medical, Surgical,
Medical/Surgical, ICU
Healthcare Personnel Influenza Vaccination
All Inpatient Healthcare Personnel
Psychiatric Hospitals
(Excluding State-Run Facilities)
Healthcare Personnel Influenza Vaccination
All Inpatient Healthcare Personnel
9
How to Read the HAI Report Graphs
The outcome of each hospital is depicted and coded based on performance. Those hospitals that
exceeded the national baseline (i.e. performed better than expected) are noted with a green
checkmark. Those hospitals that met expectations are noted with the yellow “equal” sign, and
those that performed worse than expected are noted with a red “yield” sign. Some hospitals do
not have enough data available to calculate standardized infection ratio (SIR) accurately and are
noted with the “N/R” symbol and the reporting measure is indicated as “Too Small to Calculate”.
I. Central Line Associated Blood Stream Infections (CLABSI)
A central line, also known as a central catheter, is a tube that is inserted into a large vein, usually
in the neck, chest, arm, or groin and is commonly used to administer fluids and medications as
well as draw blood. Depending on its use in the patient, it may be left in place for days to weeks
in order to help facilitate treatment. Central line-associated blood stream infections occur when
microorganisms, like bacteria, enter into the blood stream via the tube.
In a multistate survey of HAIs, the CDC estimates that there were approximately 15,600 CLABIs
in the US for non-neonatal intensive care units in 2011,2 which can lead to serious complications
including an increased number of inpatient stays, increased costs and increased risk of death.
The aggregate attributable patient hospital cost of CLASBI is estimated to be between $7,000 and
$29,000 per patient.4 CLABSIs can often be prevented by adherence to evidence-based guidelines
for the insertion, use, and maintenance of central lines.
Since January 2011, West Virginia General Acute Care Hospitals have been required to report
data on CLABSIs that occur among patients in all ICUs. Beginning in October 2012, Long Term
Acute Care Hospitals have also been required to report facility data on CLABSIs.
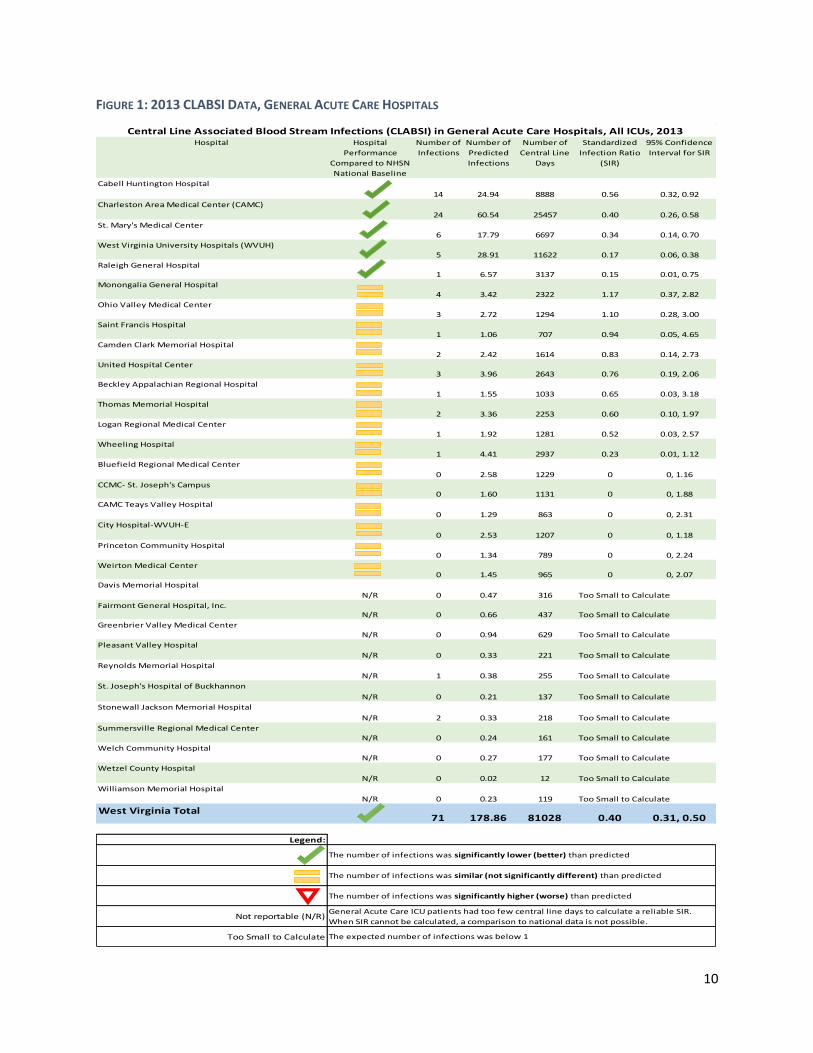
Key Findings for CLABSI: General Acute Care Hospitals (Figure 1)
In 2013, 71 CLABSIs were reported in all ICUs in West Virginia General Acute Care
Hospitals.
Significantly fewer CLABSIs occurred in these units in West Virginia General Acute Care
Hospitals than were expected based on national baseline set by NHSN. The West Virginia
SIR* was 0.40, indicating that 60% fewer CLABSI events occurred than the NHSN baseline
expected.
Of those facilities that had a sufficient number of central line days to calculate a reliable
SIR, all West Virginia General Acute Care Hospitals met or exceeded national standards of
CLABSI events by having as many or fewer events than expected.
West Virginia’s 2013 SIR of 0.40 falls below the 2013 national SIR target of 0.50.9
9 US Department of Health and Human Services, National Targets and Metrics, Website: http://www.health.gov/hai/prevent_hai.asp#hai_measures. November 2014. * See Technical Notes Section on page 38 for detailed explanation of Standard Infection Ratio (SIR)
10
FIGURE 1: 2013 CLABSI DATA, GENERAL ACUTE CARE HOSPITALS
Hospital Hospital
Performance
Compared to NHSN
National Baseline
Number of
Infections
Number of
Predicted
Infections
Number of
Central Line
Days
Standardized
Infection Ratio
(SIR)
95% Confidence
Interval for SIR
Cabell Huntington Hospital
14 24.94 8888 0.56 0.32, 0.92
Charleston Area Medical Center (CAMC)
24 60.54 25457 0.40 0.26, 0.58
St. Mary's Medical Center
6 17.79 6697 0.34 0.14, 0.70
West Virginia University Hospitals (WVUH)
5 28.91 11622 0.17 0.06, 0.38
Raleigh General Hospital1 6.57 3137 0.15 0.01, 0.75
Monongalia General Hospital
4 3.42 2322 1.17 0.37, 2.82
Ohio Valley Medical Center
3 2.72 1294 1.10 0.28, 3.00
Saint Francis Hospital
1 1.06 707 0.94 0.05, 4.65
Camden Clark Memorial Hospital
2 2.42 1614 0.83 0.14, 2.73
United Hospital Center3 3.96 2643 0.76 0.19, 2.06
Beckley Appalachian Regional Hospital
1 1.55 1033 0.65 0.03, 3.18
Thomas Memorial Hospital
2 3.36 2253 0.60 0.10, 1.97
Logan Regional Medical Center
1 1.92 1281 0.52 0.03, 2.57
Wheeling Hospital
1 4.41 2937 0.23 0.01, 1.12
Bluefield Regional Medical Center
0 2.58 1229 0 0, 1.16
CCMC- St. Joseph's Campus0 1.60 1131 0 0, 1.88
CAMC Teays Valley Hospital
0 1.29 863 0 0, 2.31
City Hospital-WVUH-E
0 2.53 1207 0 0, 1.18
Princeton Community Hospital
0 1.34 789 0 0, 2.24
Weirton Medical Center0 1.45 965 0 0, 2.07
Davis Memorial Hospital
N/R 0 0.47 316
Fairmont General Hospital, Inc.N/R 0 0.66 437
Greenbrier Valley Medical Center
N/R 0 0.94 629
Pleasant Valley Hospital
N/R 0 0.33 221
Reynolds Memorial Hospital
N/R 1 0.38 255
St. Joseph's Hospital of Buckhannon
N/R 0 0.21 137
Stonewall Jackson Memorial Hospital
N/R 2 0.33 218
Summersville Regional Medical Center
N/R 0 0.24 161
Welch Community Hospital
N/R 0 0.27 177
Wetzel County Hospital
N/R 0 0.02 12
Williamson Memorial Hospital
N/R 0 0.23 119
West Virginia Total71 178.86 81028 0.40 0.31, 0.50
Legend:
Not reportable (N/R)
Too Small to Calculate
The number of infections was significantly lower (better) than predicted
The number of infections was similar (not significantly different) than predicted
The number of infections was significantly higher (worse) than predicted
General Acute Care ICU patients had too few central line days to calculate a reliable SIR.
When SIR cannot be calculated, a comparison to national data is not possible.
The expected number of infections was below 1
Central Line Associated Blood Stream Infections (CLABSI) in General Acute Care Hospitals, All ICUs, 2013
Too Small to Calculate
Too Small to Calculate
Too Small to Calculate
Too Small to Calculate
Too Small to Calculate
Too Small to Calculate
Too Small to Calculate
Too Small to Calculate
Too Small to Calculate
Too Small to Calculate
Too Small to Calculate
11
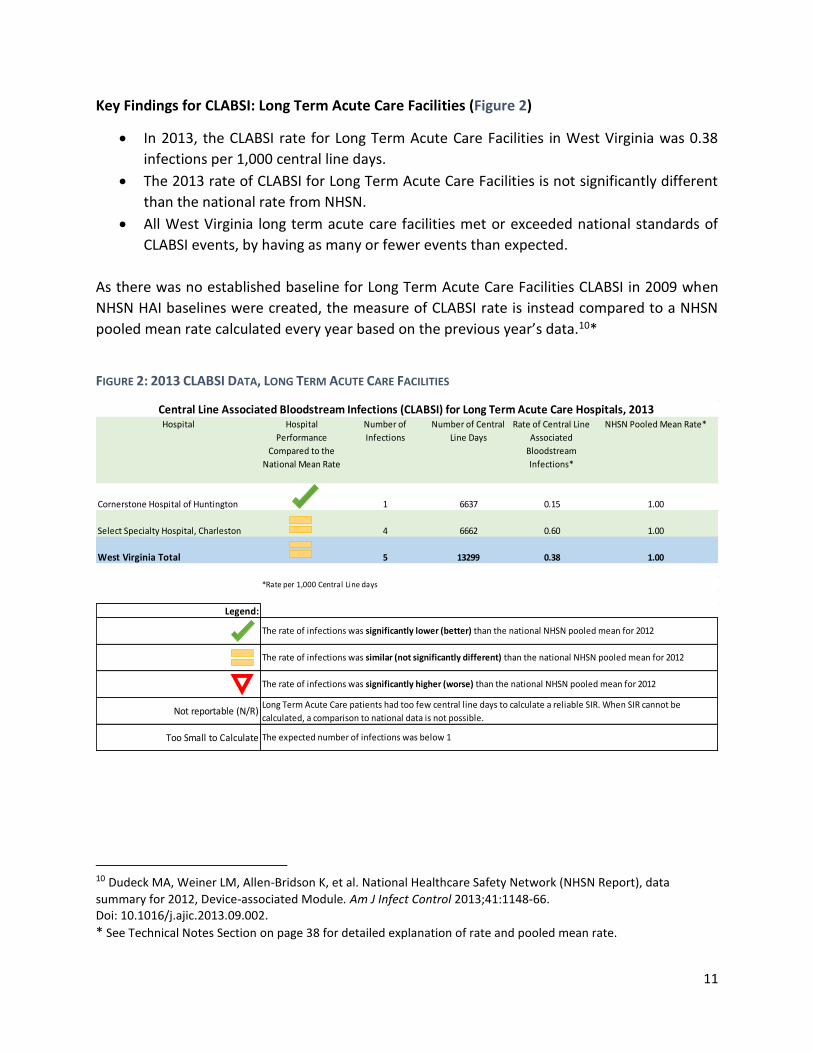
Key Findings for CLABSI: Long Term Acute Care Facilities (Figure 2)
In 2013, the CLABSI rate for Long Term Acute Care Facilities in West Virginia was 0.38
infections per 1,000 central line days.
The 2013 rate of CLABSI for Long Term Acute Care Facilities is not significantly different
than the national rate from NHSN.
All West Virginia long term acute care facilities met or exceeded national standards of
CLABSI events, by having as many or fewer events than expected.
As there was no established baseline for Long Term Acute Care Facilities CLABSI in 2009 when
NHSN HAI baselines were created, the measure of CLABSI rate is instead compared to a NHSN
pooled mean rate calculated every year based on the previous year’s data.10*
FIGURE 2: 2013 CLABSI DATA, LONG TERM ACUTE CARE FACILITIES
10 Dudeck MA, Weiner LM, Allen-Bridson K, et al. National Healthcare Safety Network (NHSN Report), data
summary for 2012, Device-associated Module. Am J Infect Control 2013;41:1148-66. Doi: 10.1016/j.ajic.2013.09.002.
* See Technical Notes Section on page 38 for detailed explanation of rate and pooled mean rate.
Hospital Hospital
Performance
Compared to the
National Mean Rate
Number of
Infections
Number of Central
Line Days
Rate of Central Line
Associated
Bloodstream
Infections*
Cornerstone Hospital of Huntington 1 6637 0.15
Select Specialty Hospital, Charleston 4 6662 0.60
Legend:
Not reportable (N/R)
Too Small to Calculate
The rate of infections was significantly higher (worse) than the national NHSN pooled mean for 2012
Long Term Acute Care patients had too few central line days to calculate a reliable SIR. When SIR cannot be
calculated, a comparison to national data is not possible.
NHSN Pooled Mean Rate*
1.00
1.00
1.00
The expected number of infections was below 1
Central Line Associated Bloodstream Infections (CLABSI) for Long Term Acute Care Hospitals, 2013
*Rate per 1,000 Central Line days
The rate of infections was significantly lower (better) than the national NHSN pooled mean for 2012
The rate of infections was similar (not significantly different) than the national NHSN pooled mean for 2012
West Virginia Total 5 13299 0.38

12
II. Catheter Associated Urinary Tract Infection (CAUTI)
Urinary tract infections are infections of any part of the urinary system, which includes the
bladder and the kidneys. Catheter associated urinary tract infections (CAUTI) arise in those
hospitalized patients who have had a urinary catheter placed, which is a tube that is inserted into
the bladder to drain urine into a connected bag. In the same way that central lines can introduce
microorganisms, urinary catheters provide an access point for these infections to spread into the
body, in this case the urinary tract. CAUTIs are much more common than CLABSIs, with the CDC
estimating approximately 35,600 CAUTI events in 2011.2 The aggregate attributable patient
hospital cost of CAUTIs is between $800 and $1000 per patient.4 CAUTIs can also often be
prevented using evidence-based guidelines for insertion, use, and maintenance, just as with all
other HAIs.
Since January 2012, all general acute care hospitals and critical access hospitals with an ICU were
required to report CAUTI for all adult and pediatric ICUs. Those general acute care hospitals and
critical access hospitals without an ICU were required to report CAUTI for Inpatient Medical
Wards. Because of CMS’ differing reporting cycles, long term acute care hospitals and inpatient
rehabilitation facilities began reporting CAUTI in October 2012.
In 2013, Inpatient Medical/Surgical Wards for both general acute care hospitals and critical
access hospitals were required to report CAUTI events as well.
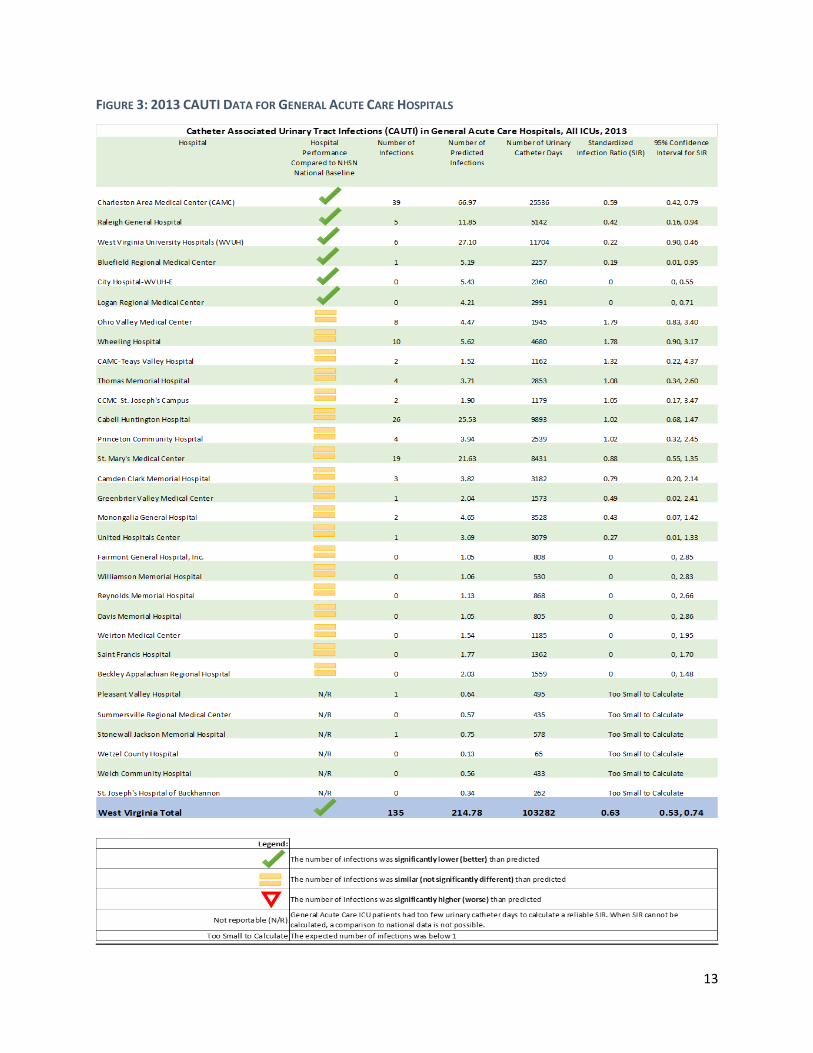
Key Findings for CAUTI: General Acute Care Facilities (Figure 3)
In 2013, there were 135 CAUTIs reported for all West Virginia General Acute Care
Hospitals.
Significantly fewer CAUTIs occurred in West Virginia General Acute Care Hospitals than
were expected based on the national baseline set by NHSN. The West Virginia SIR was
0.63, indicating that 37% fewer CAUTIs occurred than were expected.
Of those facilities that had a sufficient number of urinary catheter days to calculate a
reliable SIR, national standards were met or exceeded.
West Virginia’s 2013 SIR of 0.63 falls below the 2013 national reduction target of 0.75.9
13
FIGURE 3: 2013 CAUTI DATA FOR GENERAL ACUTE CARE HOSPITALS
14
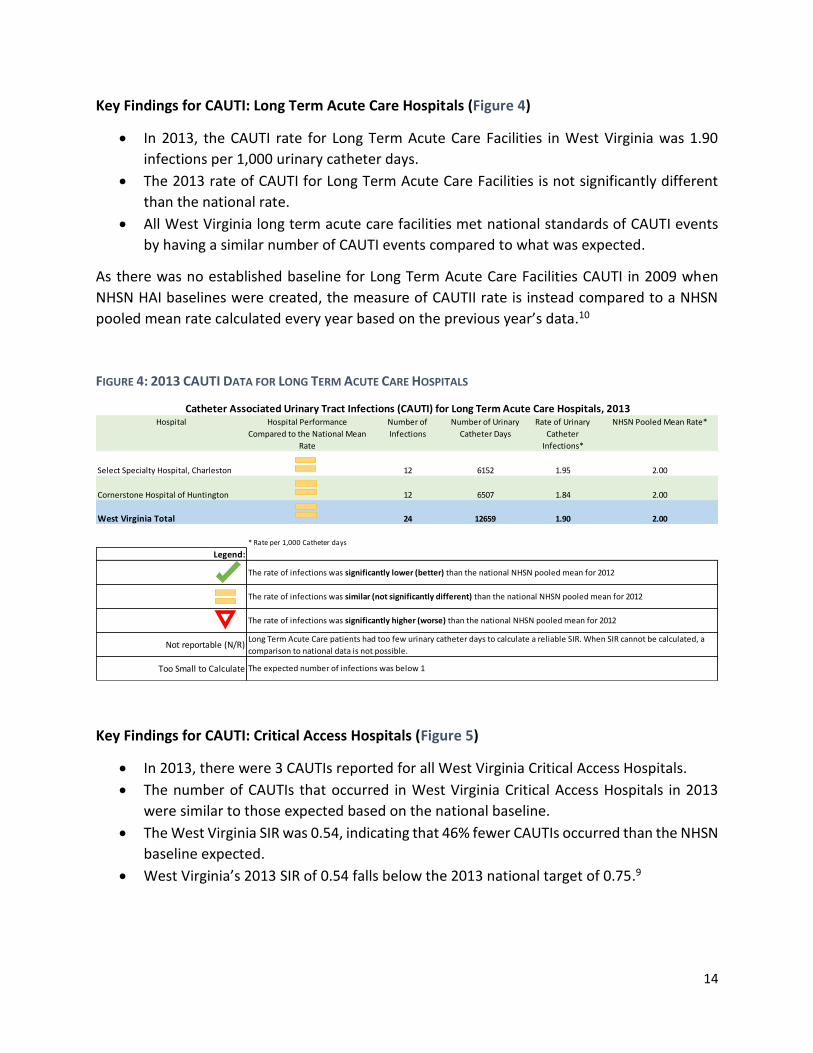
Key Findings for CAUTI: Long Term Acute Care Hospitals (Figure 4)
In 2013, the CAUTI rate for Long Term Acute Care Facilities in West Virginia was 1.90
infections per 1,000 urinary catheter days.
The 2013 rate of CAUTI for Long Term Acute Care Facilities is not significantly different
than the national rate.
All West Virginia long term acute care facilities met national standards of CAUTI events
by having a similar number of CAUTI events compared to what was expected.
As there was no established baseline for Long Term Acute Care Facilities CAUTI in 2009 when
NHSN HAI baselines were created, the measure of CAUTII rate is instead compared to a NHSN
pooled mean rate calculated every year based on the previous year’s data.10
FIGURE 4: 2013 CAUTI DATA FOR LONG TERM ACUTE CARE HOSPITALS
Key Findings for CAUTI: Critical Access Hospitals (Figure 5)
In 2013, there were 3 CAUTIs reported for all West Virginia Critical Access Hospitals.
The number of CAUTIs that occurred in West Virginia Critical Access Hospitals in 2013
were similar to those expected based on the national baseline.
The West Virginia SIR was 0.54, indicating that 46% fewer CAUTIs occurred than the NHSN
baseline expected.
West Virginia’s 2013 SIR of 0.54 falls below the 2013 national target of 0.75.9
Hospital Hospital Performance
Compared to the National Mean
Rate
Number of
Infections
Number of Urinary
Catheter Days
Rate of Urinary
Catheter
Infections*
Select Specialty Hospital, Charleston 12 6152 1.95
Cornerstone Hospital of Huntington 12 6507 1.84
Legend:
Not reportable (N/R)
Too Small to Calculate
2.0024 12659 1.90
Catheter Associated Urinary Tract Infections (CAUTI) for Long Term Acute Care Hospitals, 2013
West Virginia Total
NHSN Pooled Mean Rate*
2.00
2.00
The expected number of infections was below 1
Long Term Acute Care patients had too few urinary catheter days to calculate a reliable SIR. When SIR cannot be calculated, a
comparison to national data is not possible.
The rate of infections was significantly higher (worse) than the national NHSN pooled mean for 2012
The rate of infections was similar (not significantly different) than the national NHSN pooled mean for 2012
The rate of infections was significantly lower (better) than the national NHSN pooled mean for 2012
* Rate per 1,000 Catheter days

15
FIGURE 5: 2013 CAUTI DATA FOR CRITICAL ACCESS HOSPITALS
*Note that Sistersville General Hospital, Montgomery General Hospital, War Memorial Hospital,
and Webster County Memorial Hospital data is not yet available because either the facility has
not granted the WVHCA permission rights to view, the facility has not submitted the data, or the
data cannot be viewed by the WVHCA at this time.
Hospital Hospital Performance
Compared to NHSN National
Baseline
Number of
Infections
Number of Urinary
Catheter Days
Number of
Predicted Infections
Standardized
Infection Ratio (SIR)
95% Confidence
Interval for SIR
Summers County ARH 0 654 1.24 0 0, 2.41
Braxton County Memorial Hospital N/R 0 266 0.43
Preston Memorial Hospital N/R 0 45 0.06
Roane General Hospital N/R 1 47 0.08
Minnie Hamilton Health System N/R 0 214 0.34
Potomac Valley Hospital N/R 0 125 0.25
Jackson General Hospital N/R 0 190 0.25
Plateau Medical Center N/R 0 283 0.37
Jefferson Memorial Hospital N/R 1 197 0.26
Grant Memorial Hospital N/R 0 290 0.38
Hampshire Memorial Hospital N/R 1 328 0.62
Pocahontas Memorial Hospital N/R 0 126 0.20
Grafton City Hospital N/R 0 62 0.11
Boone Memorial Hospital N/R 0 211 0.34
Broaddus Hospital N/R 0 251 0.48
Sistersville General Hospital ~ ~ ~ ~ ~ ~
Montgomery General Hospital ~ ~ ~ ~ ~ ~
War Memorial Hospital ~ ~ ~ ~ ~ ~
Webster County Memorial Hospital ~ ~ ~ ~ ~ ~
West Virginia Total 3 3385 5.52 0.54 0.14, 1.48
Legend:
Not reportable (N/R)
Too Small to Calculate
The number of infections was significantly lower (better) than predicted
The number of infections was similar (not significantly different) than predicted
The number of infections was significantly higher (worse) than predicted
Critical Access patients had too few urinary catheter days to calculate a reliable SIR. When SIR cannot be calculated, a comparison to
national data is not possible.
The expected number of infections was below 1
Too Small To Calculate
Catheter Associated Urinary Tract Infections, Critical Access Hospitals, 2013
Too Small To Calculate
Too Small To Calculate
Too Small To Calculate
Too Small To Calculate
Too Small To Calculate
Too Small To Calculate
Too Small To Calculate
Too Small To Calculate
Too Small To Calculate
Too Small To Calculate
Too Small To Calculate
Too Small To Calculate
Too Small To Calculate
16
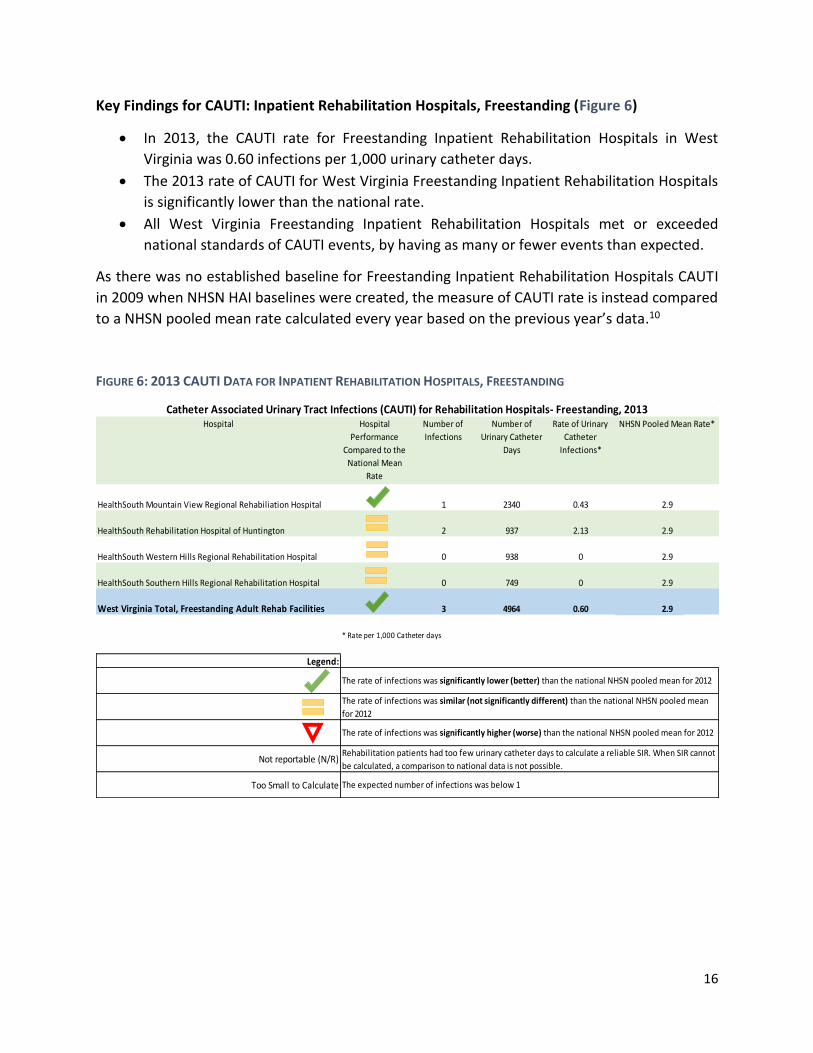
Key Findings for CAUTI: Inpatient Rehabilitation Hospitals, Freestanding (Figure 6)
In 2013, the CAUTI rate for Freestanding Inpatient Rehabilitation Hospitals in West
Virginia was 0.60 infections per 1,000 urinary catheter days.
The 2013 rate of CAUTI for West Virginia Freestanding Inpatient Rehabilitation Hospitals
is significantly lower than the national rate.
All West Virginia Freestanding Inpatient Rehabilitation Hospitals met or exceeded
national standards of CAUTI events, by having as many or fewer events than expected.
As there was no established baseline for Freestanding Inpatient Rehabilitation Hospitals CAUTI
in 2009 when NHSN HAI baselines were created, the measure of CAUTI rate is instead compared
to a NHSN pooled mean rate calculated every year based on the previous year’s data.10
FIGURE 6: 2013 CAUTI DATA FOR INPATIENT REHABILITATION HOSPITALS, FREESTANDING
Hospital Hospital
Performance
Compared to the
National Mean
Rate
Number of
Infections
Number of
Urinary Catheter
Days
Rate of Urinary
Catheter
Infections*
HealthSouth Mountain View Regional Rehabiliation Hospital 1 2340 0.43
HealthSouth Rehabilitation Hospital of Huntington 2 937 2.13
HealthSouth Western Hills Regional Rehabilitation Hospital 0 938 0
HealthSouth Southern Hills Regional Rehabilitation Hospital 0 749 0
West Virginia Total, Freestanding Adult Rehab Facilities 3 4964 0.60
Legend:
Not reportable (N/R)
Too Small to Calculate
2.9
2.9
2.9
2.9
The rate of infections was significantly higher (worse) than the national NHSN pooled mean for 2012
Rehabilitation patients had too few urinary catheter days to calculate a reliable SIR. When SIR cannot
be calculated, a comparison to national data is not possible.
The expected number of infections was below 1
Catheter Associated Urinary Tract Infections (CAUTI) for Rehabilitation Hospitals- Freestanding, 2013
* Rate per 1,000 Catheter days
The rate of infections was significantly lower (better) than the national NHSN pooled mean for 2012
The rate of infections was similar (not significantly different) than the national NHSN pooled mean
for 2012
NHSN Pooled Mean Rate*
2.9
17
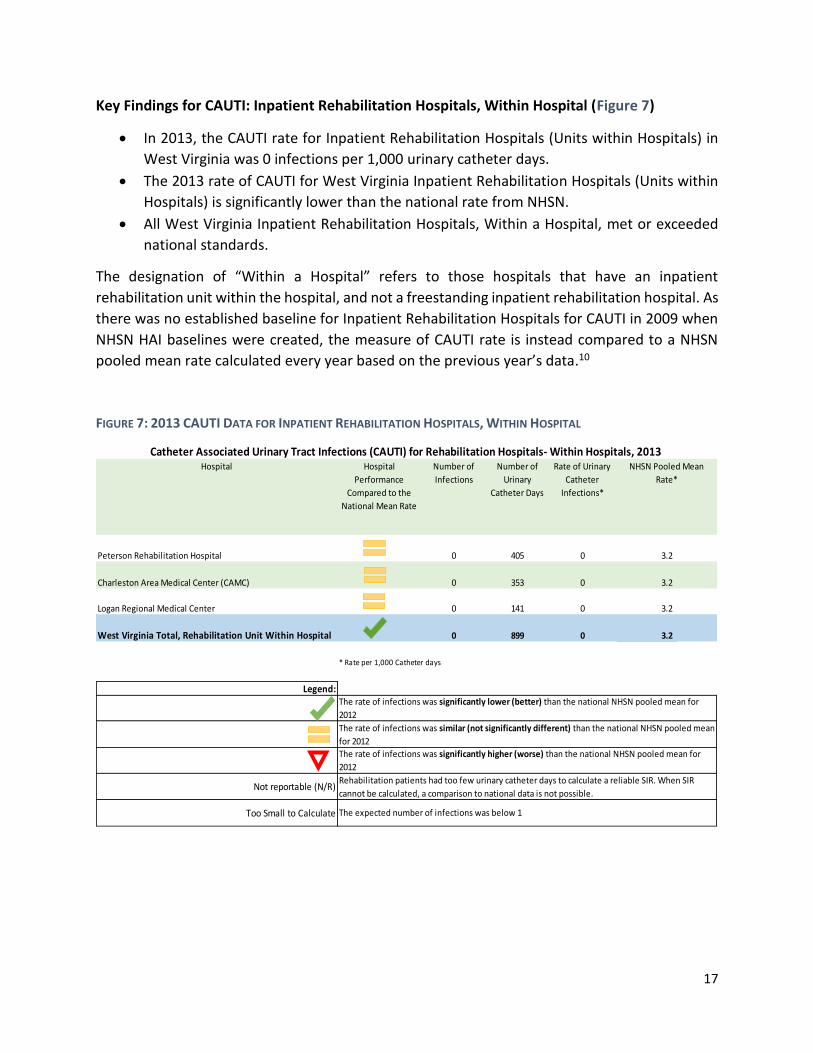
Key Findings for CAUTI: Inpatient Rehabilitation Hospitals, Within Hospital (Figure 7)
In 2013, the CAUTI rate for Inpatient Rehabilitation Hospitals (Units within Hospitals) in
West Virginia was 0 infections per 1,000 urinary catheter days.
The 2013 rate of CAUTI for West Virginia Inpatient Rehabilitation Hospitals (Units within
Hospitals) is significantly lower than the national rate from NHSN.
All West Virginia Inpatient Rehabilitation Hospitals, Within a Hospital, met or exceeded
national standards.
The designation of “Within a Hospital” refers to those hospitals that have an inpatient
rehabilitation unit within the hospital, and not a freestanding inpatient rehabilitation hospital. As
there was no established baseline for Inpatient Rehabilitation Hospitals for CAUTI in 2009 when
NHSN HAI baselines were created, the measure of CAUTI rate is instead compared to a NHSN
pooled mean rate calculated every year based on the previous year’s data.10
FIGURE 7: 2013 CAUTI DATA FOR INPATIENT REHABILITATION HOSPITALS, WITHIN HOSPITAL
Hospital Hospital
Performance
Compared to the
National Mean Rate
Number of
Infections
Number of
Urinary
Catheter Days
Rate of Urinary
Catheter
Infections*
Peterson Rehabilitation Hospital 0 405 0
Charleston Area Medical Center (CAMC) 0 353 0
Logan Regional Medical Center 0 141 0
West Virginia Total, Rehabilitation Unit Within Hospital 0 899 0
Legend:
Not reportable (N/R)
Too Small to Calculate
3.2
3.2
Rehabilitation patients had too few urinary catheter days to calculate a reliable SIR. When SIR
cannot be calculated, a comparison to national data is not possible.
The expected number of infections was below 1
Catheter Associated Urinary Tract Infections (CAUTI) for Rehabilitation Hospitals- Within Hospitals, 2013
* Rate per 1,000 Catheter days
The rate of infections was significantly lower (better) than the national NHSN pooled mean for
2012
The rate of infections was similar (not significantly different) than the national NHSN pooled mean
for 2012
The rate of infections was significantly higher (worse) than the national NHSN pooled mean for
2012
NHSN Pooled Mean
Rate*
3.2
3.2
18
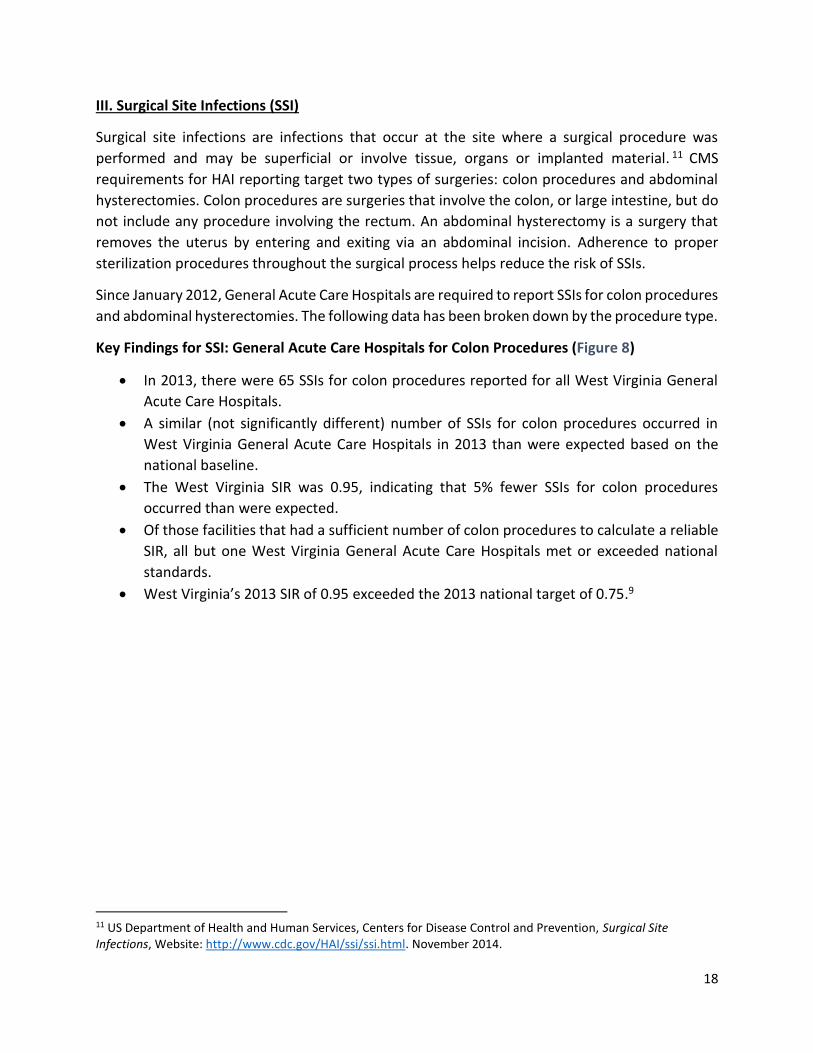
III. Surgical Site Infections (SSI)
Surgical site infections are infections that occur at the site where a surgical procedure was
performed and may be superficial or involve tissue, organs or implanted material. 11 CMS
requirements for HAI reporting target two types of surgeries: colon procedures and abdominal
hysterectomies. Colon procedures are surgeries that involve the colon, or large intestine, but do
not include any procedure involving the rectum. An abdominal hysterectomy is a surgery that
removes the uterus by entering and exiting via an abdominal incision. Adherence to proper
sterilization procedures throughout the surgical process helps reduce the risk of SSIs.
Since January 2012, General Acute Care Hospitals are required to report SSIs for colon procedures
and abdominal hysterectomies. The following data has been broken down by the procedure type.
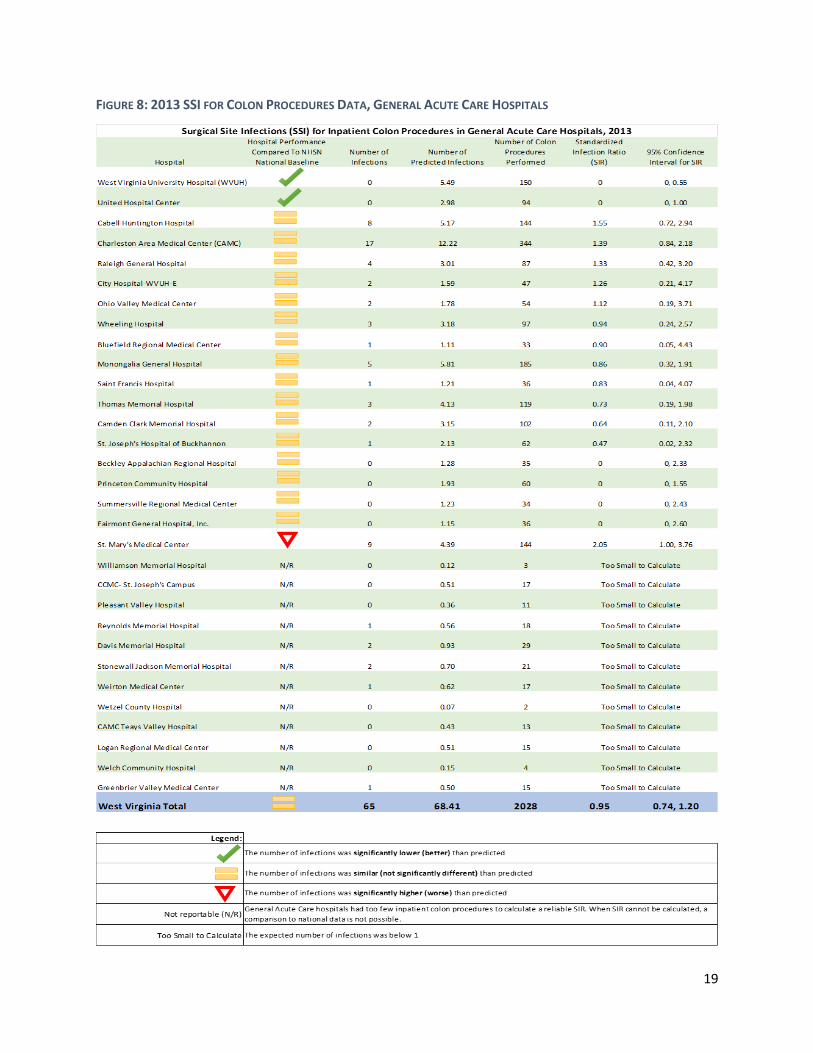
Key Findings for SSI: General Acute Care Hospitals for Colon Procedures (Figure 8)
In 2013, there were 65 SSIs for colon procedures reported for all West Virginia General
Acute Care Hospitals.
A similar (not significantly different) number of SSIs for colon procedures occurred in
West Virginia General Acute Care Hospitals in 2013 than were expected based on the
national baseline.
The West Virginia SIR was 0.95, indicating that 5% fewer SSIs for colon procedures
occurred than were expected.
Of those facilities that had a sufficient number of colon procedures to calculate a reliable
SIR, all but one West Virginia General Acute Care Hospitals met or exceeded national
standards.
West Virginia’s 2013 SIR of 0.95 exceeded the 2013 national target of 0.75.9
11 US Department of Health and Human Services, Centers for Disease Control and Prevention, Surgical Site Infections, Website: http://www.cdc.gov/HAI/ssi/ssi.html. November 2014.
19
FIGURE 8: 2013 SSI FOR COLON PROCEDURES DATA, GENERAL ACUTE CARE HOSPITALS
20
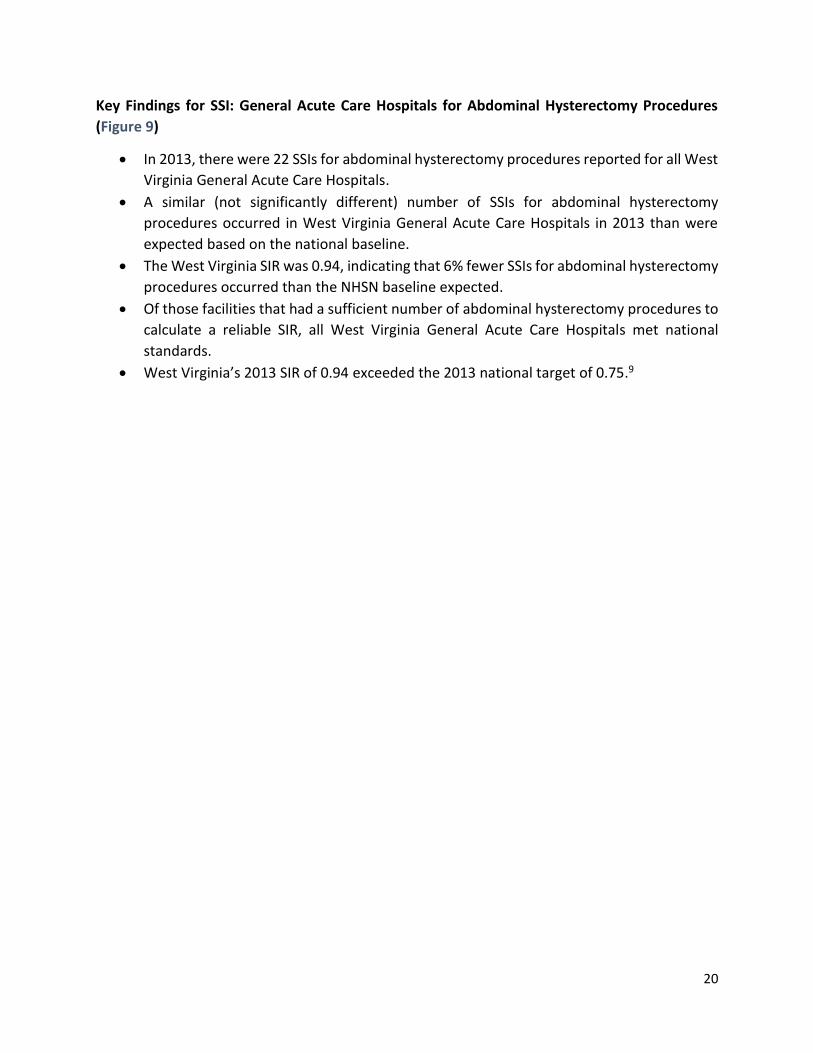
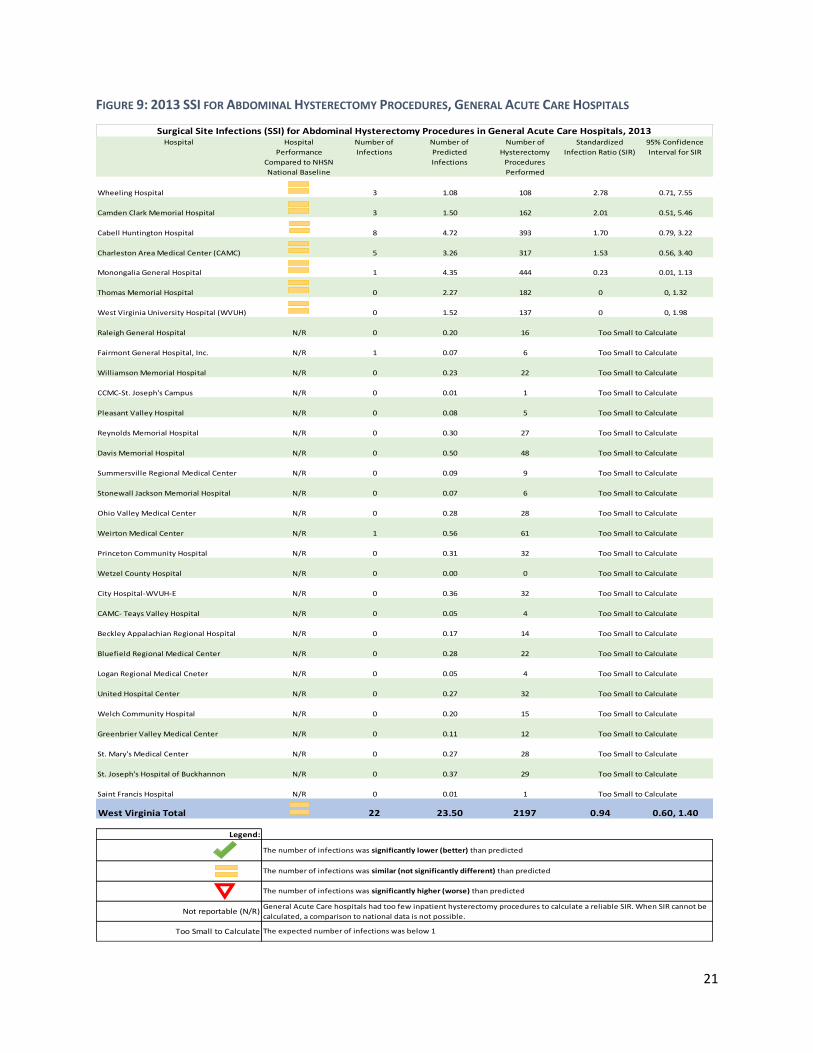
Key Findings for SSI: General Acute Care Hospitals for Abdominal Hysterectomy Procedures
(Figure 9)
In 2013, there were 22 SSIs for abdominal hysterectomy procedures reported for all West
Virginia General Acute Care Hospitals.
A similar (not significantly different) number of SSIs for abdominal hysterectomy
procedures occurred in West Virginia General Acute Care Hospitals in 2013 than were
expected based on the national baseline.
The West Virginia SIR was 0.94, indicating that 6% fewer SSIs for abdominal hysterectomy
procedures occurred than the NHSN baseline expected.
Of those facilities that had a sufficient number of abdominal hysterectomy procedures to
calculate a reliable SIR, all West Virginia General Acute Care Hospitals met national
standards.
West Virginia’s 2013 SIR of 0.94 exceeded the 2013 national target of 0.75.9
21
FIGURE 9: 2013 SSI FOR ABDOMINAL HYSTERECTOMY PROCEDURES, GENERAL ACUTE CARE HOSPITALS
Hospital Hospital
Performance
Compared to NHSN
National Baseline
Number of
Infections
Number of
Predicted
Infections
Number of
Hysterectomy
Procedures
Performed
Standardized
Infection Ratio (SIR)
95% Confidence
Interval for SIR
Wheeling Hospital 3 1.08 108 2.78 0.71, 7.55
Camden Clark Memorial Hospital 3 1.50 162 2.01 0.51, 5.46
Cabell Huntington Hospital 8 4.72 393 1.70 0.79, 3.22
Charleston Area Medical Center (CAMC) 5 3.26 317 1.53 0.56, 3.40
Monongalia General Hospital 1 4.35 444 0.23 0.01, 1.13
Thomas Memorial Hospital 0 2.27 182 0 0, 1.32
West Virginia University Hospital (WVUH) 0 1.52 137 0 0, 1.98
Raleigh General Hospital N/R 0 0.20 16
Fairmont General Hospital, Inc. N/R 1 0.07 6
Williamson Memorial Hospital N/R 0 0.23 22
CCMC-St. Joseph's Campus N/R 0 0.01 1
Pleasant Valley Hospital N/R 0 0.08 5
Reynolds Memorial Hospital N/R 0 0.30 27
Davis Memorial Hospital N/R 0 0.50 48
Summersville Regional Medical Center N/R 0 0.09 9
Stonewall Jackson Memorial Hospital N/R 0 0.07 6
Ohio Valley Medical Center N/R 0 0.28 28
Weirton Medical Center N/R 1 0.56 61
Princeton Community Hospital N/R 0 0.31 32
Wetzel County Hospital N/R 0 0.00 0
City Hospital-WVUH-E N/R 0 0.36 32
CAMC- Teays Valley Hospital N/R 0 0.05 4
Beckley Appalachian Regional Hospital N/R 0 0.17 14
Bluefield Regional Medical Center N/R 0 0.28 22
Logan Regional Medical Cneter N/R 0 0.05 4
United Hospital Center N/R 0 0.27 32
Welch Community Hospital N/R 0 0.20 15
Greenbrier Valley Medical Center N/R 0 0.11 12
St. Mary's Medical Center N/R 0 0.27 28
St. Joseph's Hospital of Buckhannon N/R 0 0.37 29
Saint Francis Hospital N/R 0 0.01 1
West Virginia Total 22 23.50 2197 0.94 0.60, 1.40
Legend:
Not reportable (N/R)
Too Small to Calculate
General Acute Care hospitals had too few inpatient hysterectomy procedures to calculate a reliable SIR. When SIR cannot be
calculated, a comparison to national data is not possible.
The expected number of infections was below 1
Too Small to Calculate
Too Small to Calculate
Too Small to Calculate
The number of infections was significantly lower (better) than predicted
The number of infections was similar (not significantly different) than predicted
The number of infections was significantly higher (worse) than predicted
Too Small to Calculate
Too Small to Calculate
Too Small to Calculate
Too Small to Calculate
Too Small to Calculate
Too Small to Calculate
Too Small to Calculate
Too Small to Calculate
Too Small to Calculate
Too Small to Calculate
Too Small to Calculate
Too Small to Calculate
Too Small to Calculate
Too Small to Calculate
Surgical Site Infections (SSI) for Abdominal Hysterectomy Procedures in General Acute Care Hospitals, 2013
Too Small to Calculate
Too Small to Calculate
Too Small to Calculate
Too Small to Calculate
Too Small to Calculate
Too Small to Calculate
Too Small to Calculate

22
IV. Inpatient Methicillin-Resistant Staphylococcus aureus (MRSA) Bacteremia
While Staphylococcus aureus is a common bacteria found both in the environment and on
humans, it normally does not affect them. MRSA, however, is a variant of the bacteria that is
resistant to antibiotics. MRSA is spread via direct contact and can cause serious complications,
including wound infections or blood stream infections (bacteremia), which makes hospitals and
other healthcare facilities at a high risk of spreading the infection to patients and healthcare
workers.12
Beginning January 2013, West Virginia general acute care hospitals were required to report MRSA
Bacteremia LabID events for facility-wide inpatient areas. LabID events are those that are positive
or meet positive guidelines using either standard susceptibility testing or other Food and Drug
Administration (FDA) approved testing.13
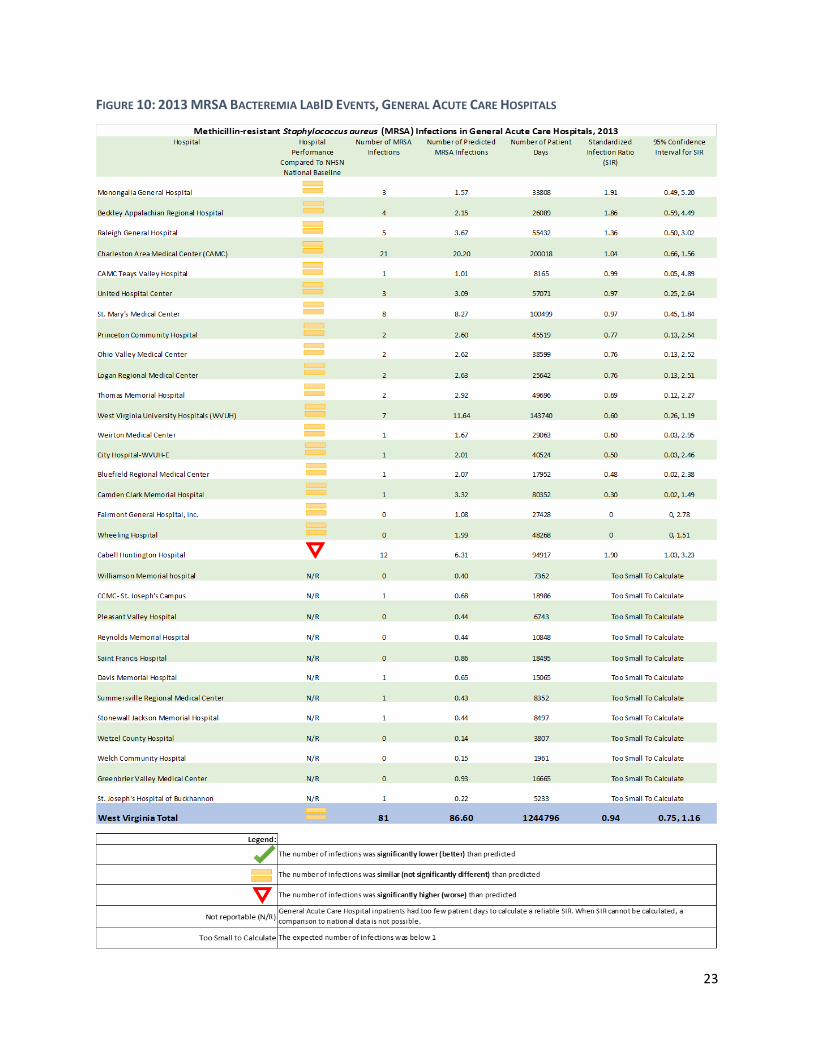
Key Findings for MRSA Bacteremia LabID Events: General Acute Care Hospitals (Figure 10)
In 2013, there were 81 MRSA Bacteremia LabID events reported for all West Virginia
General Acute Care Hospitals.
A similar (not significantly different) number of MRSA Bacteremia LabID events occurred
in West Virginia General Acute Care Hospitals in 2013 than were expected based on the
national baseline.
The West Virginia SIR was 0.94, indicating that 6% fewer MRSA Bacteremia LabID events
occurred than the NHSN baseline expected.
Of those facilities that had a sufficient number of patient days to calculate a reliable SIR,
all but one West Virginia General Acute Care Hospitals met national standards.
West Virginia’s 2013 SIR of 0.94 exceeded the 2013 national target of 0.75.9
12 US Department of Health and Human Services, Centers for Disease Control and Prevention, Methicillin-Resistant Staphylococcus aureus (MRSA) Infections, Website: http://www.cdc.gov/mrsa/healthcare/index.html. November 2014. 13 US Department of Health and Human Services, Centers for Disease Control and Prevention, Multi-drug Resistant Organism & Clostridium difficile Infection (MDRO/CDI) Module, Website: http://www.cdc.gov/nhsn/PDFs/pscManual/12pscMDRO_CDADcurrent.pdf. November 2014.
23
FIGURE 10: 2013 MRSA BACTEREMIA LABID EVENTS, GENERAL ACUTE CARE HOSPITALS
24
V. Inpatient Clostridium difficile Infection (CDI)
Clostridium difficile (CDI) is a bacteria that can cause diarrhea and large intestine inflammation,
usually in those patients with a recent history of antibiotic use. CDI is spread through direct
contact with contaminated surfaces and can live outside the body in a hardy spore form for a
long time.11 Therefore, environmental control in healthcare settings is one of the most critical
forms of prevention, along with proper hygiene and adherence to evidence-based practices.14
Beginning in January 2013, all general acute care hospitals were required to report facility wide,
inpatient CDI LabID Events. As with MRSA, LabID events are those that are positive or meet
positive guidelines using either standard susceptibility testing or other Food and Drug
Administration (FDA) approved testing.13
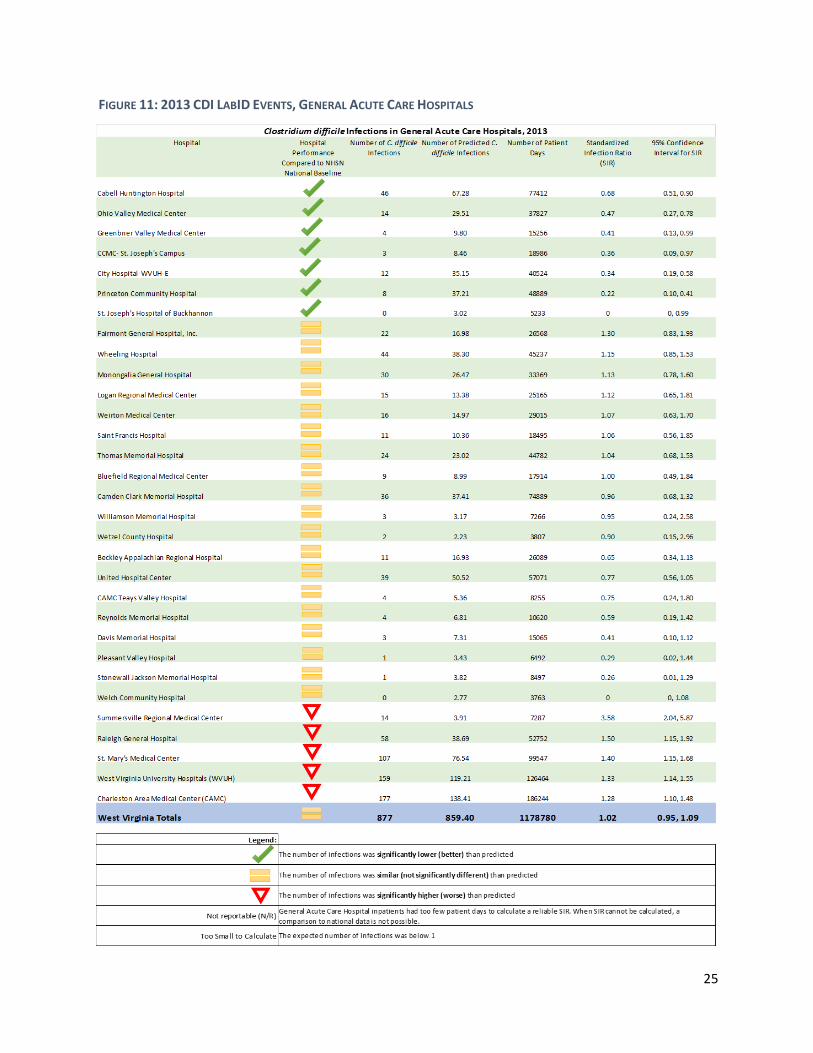
Key Findings for CDI LabID Events: General Acute Care Hospitals (Figure 11)
In 2013, there were 877 CDI LabID events reported for all West Virginia General Acute
Care Hospitals.
A similar (not significantly different) number of CDI LabID events occurred in West Virginia
General Acute Care Hospitals in 2013 than were expected based on the national baseline.
The West Virginia SIR was 1.02, indicating that 2% more CDI LabID events occurred than
the NHSN baseline expected.
Of those facilities that had a sufficient number of patient days to calculate a reliable SIR,
all but five West Virginia General Acute Care Hospitals met or exceeded national
standards.
West Virginia’s 2013 SIR of 1.02 exceeded the 2013 national target of 0.75.9
14 US Department of Health and Human Services, Centers for Disease Control and Prevention, Healthcare-Associated Infections: Frequently Asked Questions about Clostridium difficile for Healthcare Providers. Website: http://www.cdc.gov/HAI/organisms/cdiff/Cdiff_faqs_HCP.html. November 2014.
25
FIGURE 11: 2013 CDI LABID EVENTS, GENERAL ACUTE CARE HOSPITALS
26
VI. Healthcare Personnel Influenza Vaccinations
Influenza vaccinations are important for healthcare personnel as they not only safeguard the
individual, they also help protect patients from becoming infected. The CDC, the Advisory
Committee on Immunization Practices (ACIP), and the Healthcare Infection Control Practices
Advisory Committee (HICPAC) recommends that all healthcare workers receive a seasonal
influenza vaccination.15
Hospitals are required to report the number of personnel, including employees, licensed
independent practitioners, and student volunteers, who received vaccination during the
influenza season (October to March). All 59 West Virginia hospitals (general acute care, critical
access, long term acute care, non-state run psychiatric hospitals, and rehabilitation hospitals)
that were required to report, did so for the 2013-2014 influenza season.
Beginning January 2012, all non-federal hospitals (excluding state run psychiatric facilities) were
required to report personnel vaccination status. Beginning October 2014, all non-federal
hospitals (excluding state-run psychiatric facilities) are required to report personnel that work in
outpatient departments as well as inpatient departments, who have worked in the healthcare
facility for at least one day during the reporting season.
For the 2013-2014 influenza season, the percent of personnel vaccinated was split into two
population categories, hospital employees (paid by the facility) and all healthcare workers (which
includes employees, licensed independent practitioners, and student volunteers). Now,
individual facilities can determine how many non-employee workers in the healthcare facility did
not receive a vaccination, potentially putting patients at risk for contracting influenza while
receiving care. By separating employees from non-employees working in the facility, hospitals
can see their progress from year to year.
A two year, side-by-side comparison was also completed for each hospital, and for each
population group, to show changes in vaccination percentages and trends over time for each
facility, which is useful to monitor if a facility institutes new policies or guidelines regarding
influenza vaccination.
Key Findings for Healthcare Personnel Influenza Vaccinations, by hospital type and healthcare
personnel population (Figures 12-21)
76.9% of all healthcare workers in all West Virginia hospitals (including employees,
licensed independent practitioners, and student volunteers) received a seasonal influenza
vaccination during the 2013-2014 influenza season, up from 74.3% from last year.
15 US Department of Health and Human Services, Centers for Disease Control and Prevention, Influenza Vaccination Information for Health Care Workers. Website: http://www.cdc.gov/flu/healthcareworkers.htm. November 2014.
27
That percentage is higher than the 2013-2014 national average for influenza vaccination
of healthcare workers of 75.2%.12
The percentage of all healthcare workers in West Virginia (including employees, licensed
independent practitioners, and student volunteers) that received a seasonal influenza
vaccination ranged from a low of 38% to a high of 100% by facility for the 2013-2014
season.
The percentage of healthcare employees in West Virginia that received a seasonal
influenza vaccination ranged from a low of 40% to a high of 100% by facility for the 2013-
2014 season.
In the federally run program Healthy People 2020, which gives health related goals for
the nation to meet by the year 2020, the goal for healthcare worker influenza vaccination
is 90% in each facility. In the 2013-2014 season, 13 of 59 (22%) of West Virginia hospitals
have exceeded this goal.16
28 of 59 (47.5%) of West Virginia hospitals had a higher vaccination percentage of all
healthcare workers (including employees, licensed independent practitioners, and
student volunteers) in 2013-2014 than the national average of 75.2%.
16 US Department of Health and Human Services, Healthy People 2020, Immunization and Infectious Disease. Goal IID-12.13. Website: https://www.healthypeople.gov/2020/topics-objectives/topic/immunization-and-infectious-diseases/objectives. November 2014.
28
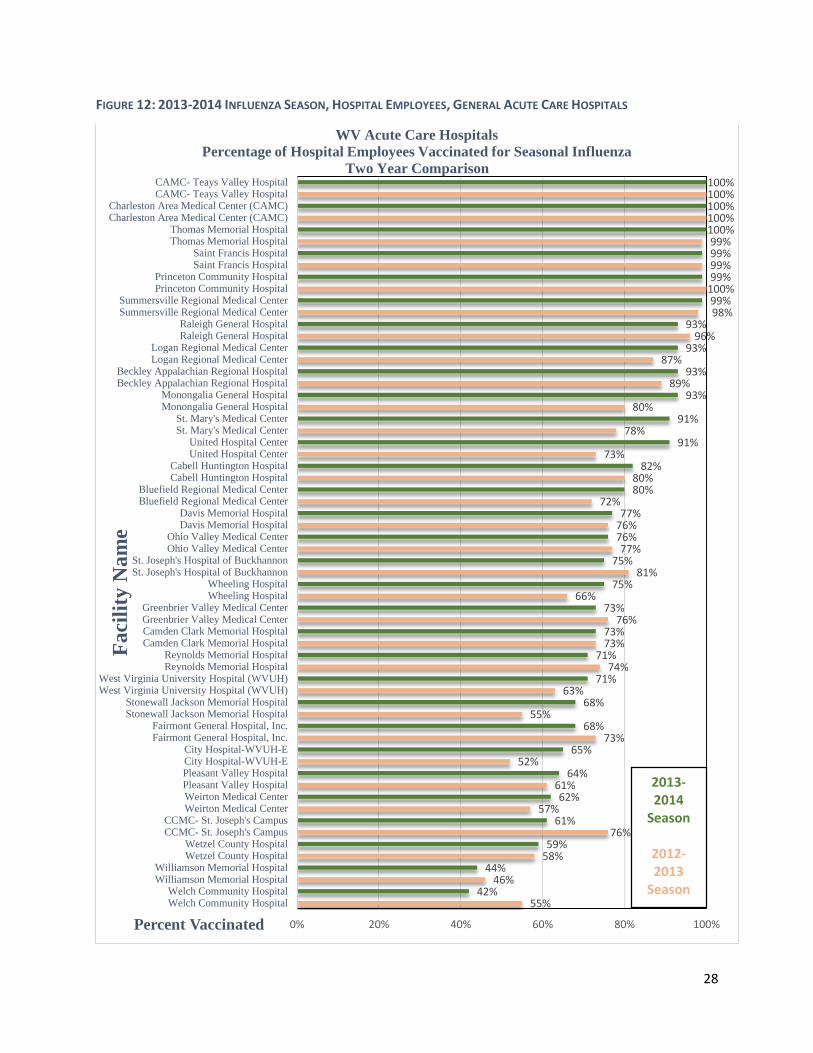
FIGURE 12: 2013-2014 INFLUENZA SEASON, HOSPITAL EMPLOYEES, GENERAL ACUTE CARE HOSPITALS
55%42%
46%44%
58%59%
76%61%
57%62%
61%64%
52%65%
73%68%
55%68%
63%71%
74%71%
73%73%
76%73%
66%75%
81%75%
77%76%76%77%
72%80%80%
82%73%
91%78%
91%80%
93%89%
93%87%
93%96%
93%98%99%
100%99%99%99%99%
100%100%100%100%100%
0% 20% 40% 60% 80% 100%
Welch Community HospitalWelch Community Hospital
Williamson Memorial HospitalWilliamson Memorial Hospital
Wetzel County HospitalWetzel County Hospital
CCMC- St. Joseph's CampusCCMC- St. Joseph's Campus
Weirton Medical CenterWeirton Medical CenterPleasant Valley HospitalPleasant Valley HospitalCity Hospital-WVUH-ECity Hospital-WVUH-E
Fairmont General Hospital, Inc.Fairmont General Hospital, Inc.
Stonewall Jackson Memorial HospitalStonewall Jackson Memorial Hospital
West Virginia University Hospital (WVUH)West Virginia University Hospital (WVUH)
Reynolds Memorial HospitalReynolds Memorial Hospital
Camden Clark Memorial HospitalCamden Clark Memorial HospitalGreenbrier Valley Medical CenterGreenbrier Valley Medical Center
Wheeling HospitalWheeling Hospital
St. Joseph's Hospital of BuckhannonSt. Joseph's Hospital of Buckhannon
Ohio Valley Medical CenterOhio Valley Medical Center
Davis Memorial HospitalDavis Memorial Hospital
Bluefield Regional Medical CenterBluefield Regional Medical Center
Cabell Huntington HospitalCabell Huntington Hospital
United Hospital CenterUnited Hospital Center
St. Mary's Medical CenterSt. Mary's Medical Center
Monongalia General HospitalMonongalia General Hospital
Beckley Appalachian Regional HospitalBeckley Appalachian Regional Hospital
Logan Regional Medical CenterLogan Regional Medical Center
Raleigh General HospitalRaleigh General Hospital
Summersville Regional Medical CenterSummersville Regional Medical Center
Princeton Community HospitalPrinceton Community Hospital
Saint Francis HospitalSaint Francis Hospital
Thomas Memorial HospitalThomas Memorial Hospital
Charleston Area Medical Center (CAMC)Charleston Area Medical Center (CAMC)
CAMC- Teays Valley HospitalCAMC- Teays Valley Hospital
Percent Vaccinated
Fa
cili
ty N
am
eWV Acute Care Hospitals
Percentage of Hospital Employees Vaccinated for Seasonal Influenza
Two Year Comparison
2013-2014
Season
2012-2013
Season

29
FIGURE 13: 2013-2014 INFLUENZA SEASON, ALL HOSPITAL WORKERS, GENERAL ACUTE CARE HOSPITALS
47%43%
45%52%52%
55%59%
58%76%
61%60%
62%60%
65%64%
66%58%
66%75%
69%55%
69%71%
69%75%
71%75%
71%75%
74%80%
77%76%
78%72%
78%78%79%
69%80%
85%82%
81%83%
90%89%
63%90%
92%92%
89%93%
92%93%
96%95%96%97%97%97%
0% 20% 40% 60% 80% 100%
Williamson Memorial HospitalWilliamson Memorial Hospital
City Hospital-WVUH-ECity Hospital-WVUH-EWeirton Medical CenterWeirton Medical CenterWetzel County HospitalWetzel County Hospital
CCMC- St. Joseph's CampusCCMC- St. Joseph's Campus
Pleasant Valley HospitalPleasant Valley Hospital
West Virginia University Hospital (WVUH)West Virginia University Hospital (WVUH)
Camden Clark Memorial HospitalCamden Clark Memorial Hospital
Wheeling HospitalWheeling Hospital
Greenbrier Valley Medical CenterGreenbrier Valley Medical Center
Stonewall Jackson Memorial HospitalStonewall Jackson Memorial Hospital
Fairmont General Hospital, Inc.Fairmont General Hospital, Inc.
Ohio Valley Medical CenterOhio Valley Medical Center
Reynolds Memorial HospitalReynolds Memorial Hospital
Cabell Huntington HospitalCabell Huntington Hospital
St. Joseph's Hospital of BuckhannonSt. Joseph's Hospital of Buckhannon
Davis Memorial HospitalDavis Memorial Hospital
St. Mary's Medical CenterSt. Mary's Medical Center
Monongalia General HospitalMonongalia General Hospital
Bluefield Regional Medical CenterBluefield Regional Medical Center
Thomas Memorial HospitalThomas Memorial Hospital
CAMC- Teays Valley HospitalCAMC- Teays Valley Hospital
Raleigh General HospitalRaleigh General Hospital
United Hospital CenterUnited Hospital Center
Beckley Appalachian Regional HospitalBeckley Appalachian Regional Hospital
Logan Regional Medical CenterLogan Regional Medical Center
Saint Francis HospitalSaint Francis Hospital
Summersville Regional Medical CenterSummersville Regional Medical Center
Princeton Community HospitalPrinceton Community Hospital
Charleston Area Medical Center (CAMC)Charleston Area Medical Center (CAMC)
Percent Vaccinated
Fa
cili
ty N
am
eWV Acute Care Hospitals
Percentage of All Hospital Workers (Including Licensed Independent Practitioners,
Employees, and Student Volunteers) Vaccinated for Seasonal Influenza
Two Year Comparison
2013-2014
Season
2012-2013
Season
30
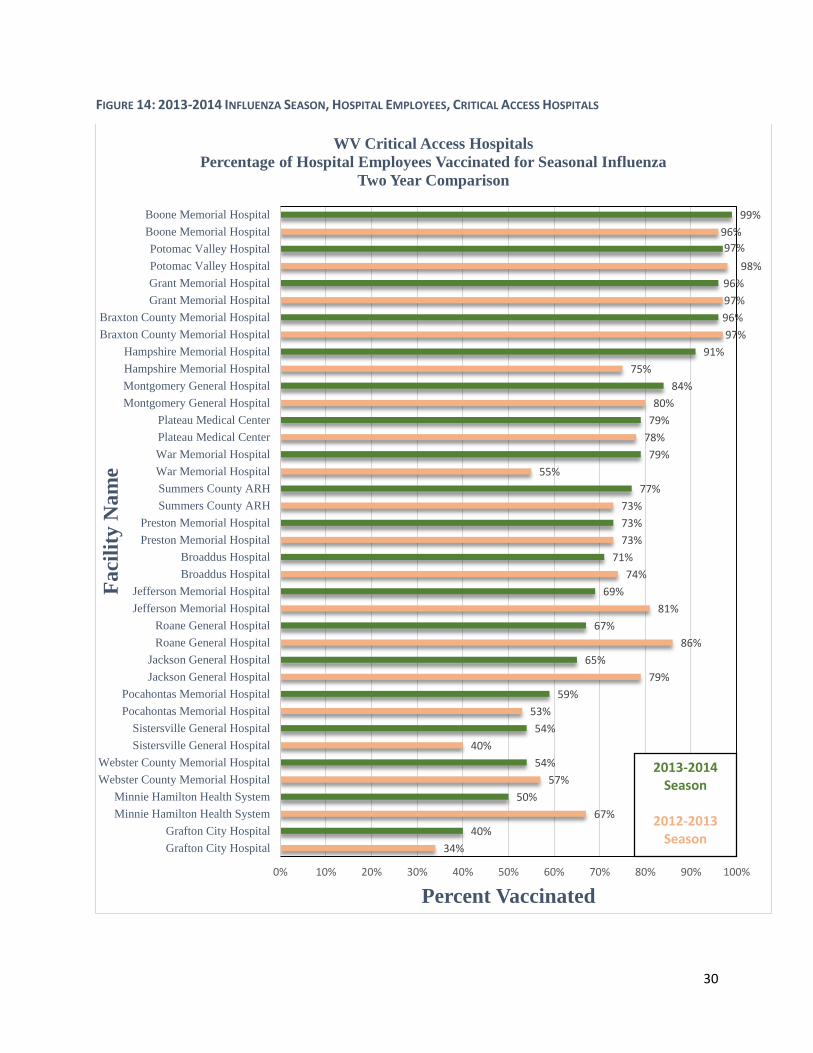
FIGURE 14: 2013-2014 INFLUENZA SEASON, HOSPITAL EMPLOYEES, CRITICAL ACCESS HOSPITALS
34%
40%
67%
50%
57%
54%
40%
54%
53%
59%
79%
65%
86%
67%
81%
69%
74%
71%
73%
73%
73%
77%
55%
79%
78%
79%
80%
84%
75%
91%
97%
96%
97%
96%
98%
97%
96%
99%
0% 10% 20% 30% 40% 50% 60% 70% 80% 90% 100%
Grafton City Hospital
Grafton City Hospital
Minnie Hamilton Health System
Minnie Hamilton Health System
Webster County Memorial Hospital
Webster County Memorial Hospital
Sistersville General Hospital
Sistersville General Hospital
Pocahontas Memorial Hospital
Pocahontas Memorial Hospital
Jackson General Hospital
Jackson General Hospital
Roane General Hospital
Roane General Hospital
Jefferson Memorial Hospital
Jefferson Memorial Hospital
Broaddus Hospital
Broaddus Hospital
Preston Memorial Hospital
Preston Memorial Hospital
Summers County ARH
Summers County ARH
War Memorial Hospital
War Memorial Hospital
Plateau Medical Center
Plateau Medical Center
Montgomery General Hospital
Montgomery General Hospital
Hampshire Memorial Hospital
Hampshire Memorial Hospital
Braxton County Memorial Hospital
Braxton County Memorial Hospital
Grant Memorial Hospital
Grant Memorial Hospital
Potomac Valley Hospital
Potomac Valley Hospital
Boone Memorial Hospital
Boone Memorial Hospital
Percent Vaccinated
Fa
cili
ty N
am
e
WV Critical Access Hospitals
Percentage of Hospital Employees Vaccinated for Seasonal Influenza
Two Year Comparison
2013-2014 Season
2012-2013Season
31
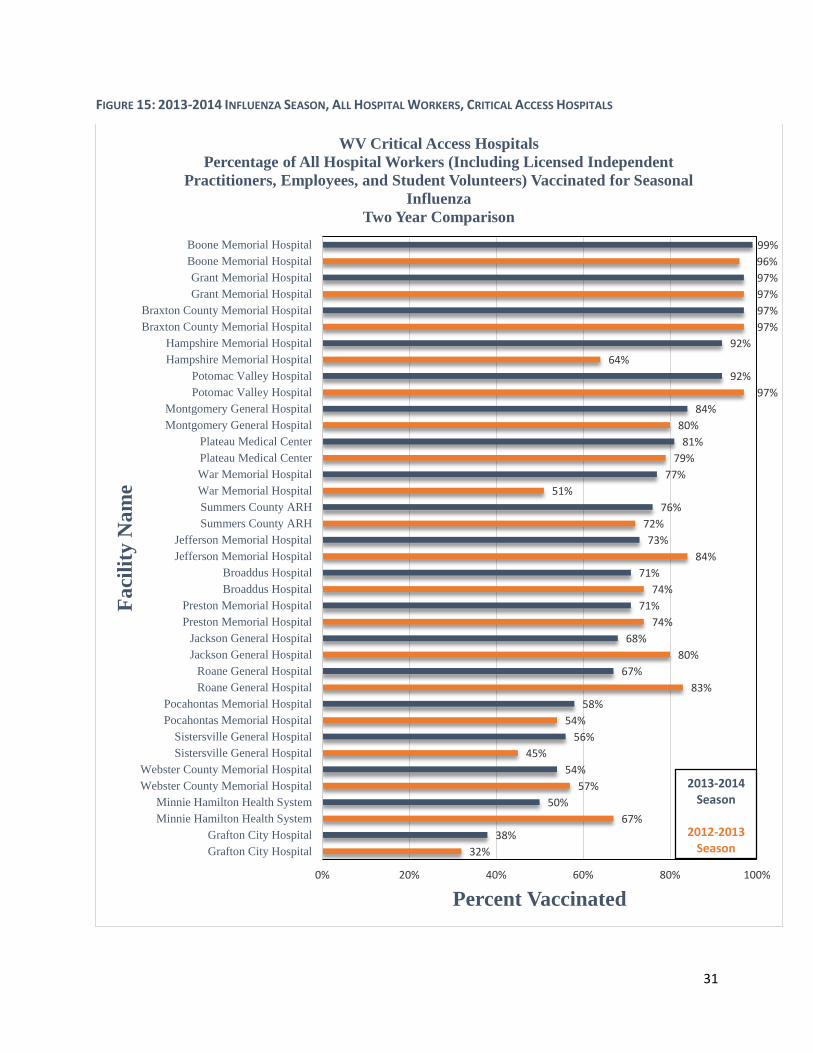
FIGURE 15: 2013-2014 INFLUENZA SEASON, ALL HOSPITAL WORKERS, CRITICAL ACCESS HOSPITALS
32%
38%
67%
50%
57%
54%
45%
56%
54%
58%
83%
67%
80%
68%
74%
71%
74%
71%
84%
73%
72%
76%
51%
77%
79%
81%
80%
84%
97%
92%
64%
92%
97%
97%
97%
97%
96%
99%
0% 20% 40% 60% 80% 100%
Grafton City Hospital
Grafton City Hospital
Minnie Hamilton Health System
Minnie Hamilton Health System
Webster County Memorial Hospital
Webster County Memorial Hospital
Sistersville General Hospital
Sistersville General Hospital
Pocahontas Memorial Hospital
Pocahontas Memorial Hospital
Roane General Hospital
Roane General Hospital
Jackson General Hospital
Jackson General Hospital
Preston Memorial Hospital
Preston Memorial Hospital
Broaddus Hospital
Broaddus Hospital
Jefferson Memorial Hospital
Jefferson Memorial Hospital
Summers County ARH
Summers County ARH
War Memorial Hospital
War Memorial Hospital
Plateau Medical Center
Plateau Medical Center
Montgomery General Hospital
Montgomery General Hospital
Potomac Valley Hospital
Potomac Valley Hospital
Hampshire Memorial Hospital
Hampshire Memorial Hospital
Braxton County Memorial Hospital
Braxton County Memorial Hospital
Grant Memorial Hospital
Grant Memorial Hospital
Boone Memorial Hospital
Boone Memorial Hospital
Percent Vaccinated
Fa
cili
ty N
am
eWV Critical Access Hospitals
Percentage of All Hospital Workers (Including Licensed Independent
Practitioners, Employees, and Student Volunteers) Vaccinated for Seasonal
Influenza
Two Year Comparison
2013-2014Season
2012-2013 Season
32
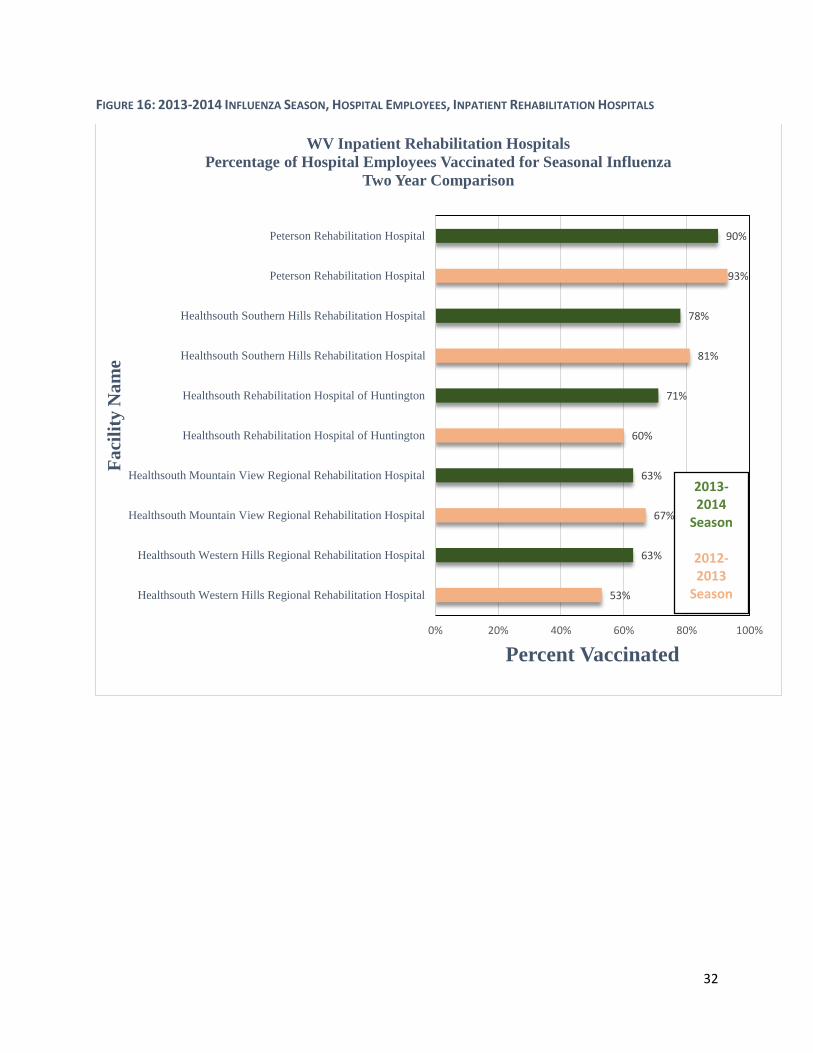
FIGURE 16: 2013-2014 INFLUENZA SEASON, HOSPITAL EMPLOYEES, INPATIENT REHABILITATION HOSPITALS
53%
63%
67%
63%
60%
71%
81%
78%
93%
90%
0% 20% 40% 60% 80% 100%
Healthsouth Western Hills Regional Rehabilitation Hospital
Healthsouth Western Hills Regional Rehabilitation Hospital
Healthsouth Mountain View Regional Rehabilitation Hospital
Healthsouth Mountain View Regional Rehabilitation Hospital
Healthsouth Rehabilitation Hospital of Huntington
Healthsouth Rehabilitation Hospital of Huntington
Healthsouth Southern Hills Rehabilitation Hospital
Healthsouth Southern Hills Rehabilitation Hospital
Peterson Rehabilitation Hospital
Peterson Rehabilitation Hospital
Percent Vaccinated
Fa
cili
ty N
am
e
WV Inpatient Rehabilitation Hospitals
Percentage of Hospital Employees Vaccinated for Seasonal Influenza
Two Year Comparison
2013-2014
Season
2012-2013
Season
33
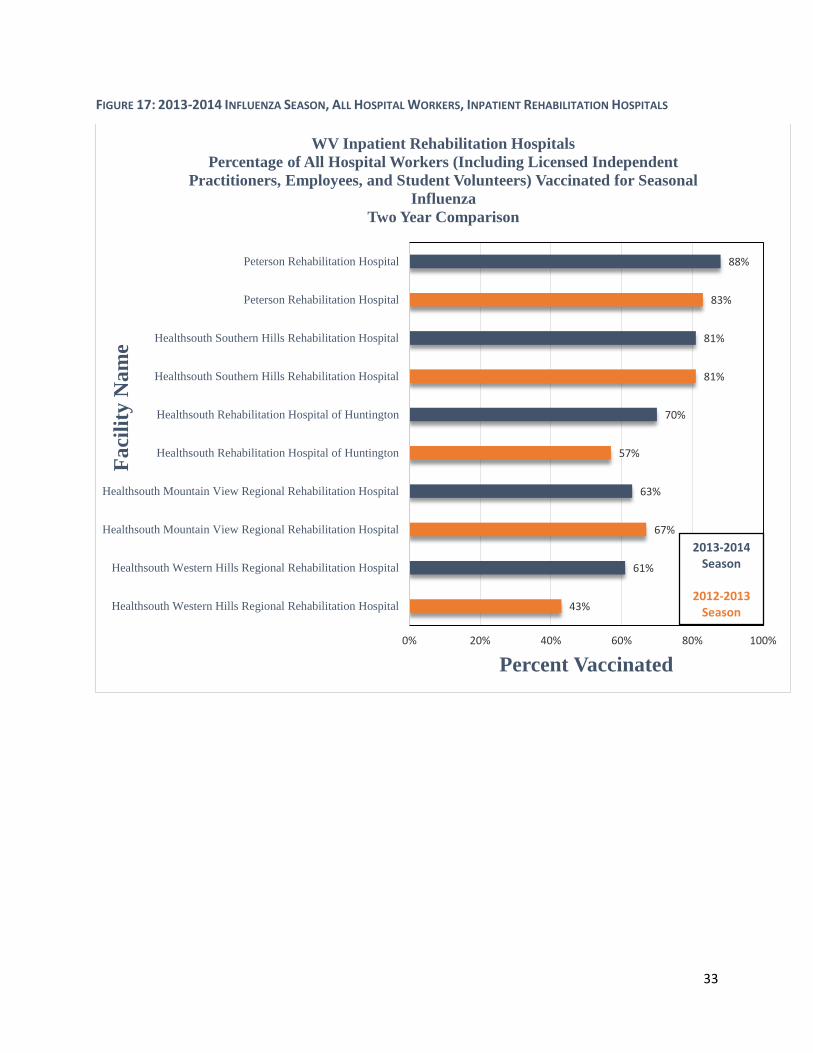
FIGURE 17: 2013-2014 INFLUENZA SEASON, ALL HOSPITAL WORKERS, INPATIENT REHABILITATION HOSPITALS
43%
61%
67%
63%
57%
70%
81%
81%
83%
88%
0% 20% 40% 60% 80% 100%
Healthsouth Western Hills Regional Rehabilitation Hospital
Healthsouth Western Hills Regional Rehabilitation Hospital
Healthsouth Mountain View Regional Rehabilitation Hospital
Healthsouth Mountain View Regional Rehabilitation Hospital
Healthsouth Rehabilitation Hospital of Huntington
Healthsouth Rehabilitation Hospital of Huntington
Healthsouth Southern Hills Rehabilitation Hospital
Healthsouth Southern Hills Rehabilitation Hospital
Peterson Rehabilitation Hospital
Peterson Rehabilitation Hospital
Percent Vaccinated
Fa
cili
ty N
am
eWV Inpatient Rehabilitation Hospitals
Percentage of All Hospital Workers (Including Licensed Independent
Practitioners, Employees, and Student Volunteers) Vaccinated for Seasonal
Influenza
Two Year Comparison
2013-2014Season
2012-2013 Season

34
FIGURE 18 2013-2014 INFLUENZA SEASON, HOSPITAL EMPLOYEES, PSYCHIATRIC HOSPITALS
FIGURE 19: 2013-2014 INFLUENZA SEASON, ALL HOSPITAL WORKERS, PSYCHIATRIC HOSPITALS
57%
51%
99%
99%
0% 10% 20% 30% 40% 50% 60% 70% 80% 90% 100%
River Park Hospital
River Park Hospital
Highland Hospital
Highland Hospital
Percent Vaccinated
Fa
cili
ty N
am
eWV Psychiatric Hospitals
Percentage of Hospital Employees Vaccinated for Seasonal Influenza
Two Year Comparison
2013-2014 Season
2012-2013 Season
58%
52%
99%
100%
0% 10% 20% 30% 40% 50% 60% 70% 80% 90% 100%
River Park Hospital
River Park Hospital
Highland Hospital
Highland Hospital
Percent Vaccinated
Faci
lity
Na
me
WV Pyschiatric Hospitals
Percentage of All Hospital Workers (Including Licensed Independent
Practitioners, Employees, and Student Volunteers) Vaccinated for Seasonal
Influenza
Two Year Comparison
2013-2014Season
2012-2013 Season
35
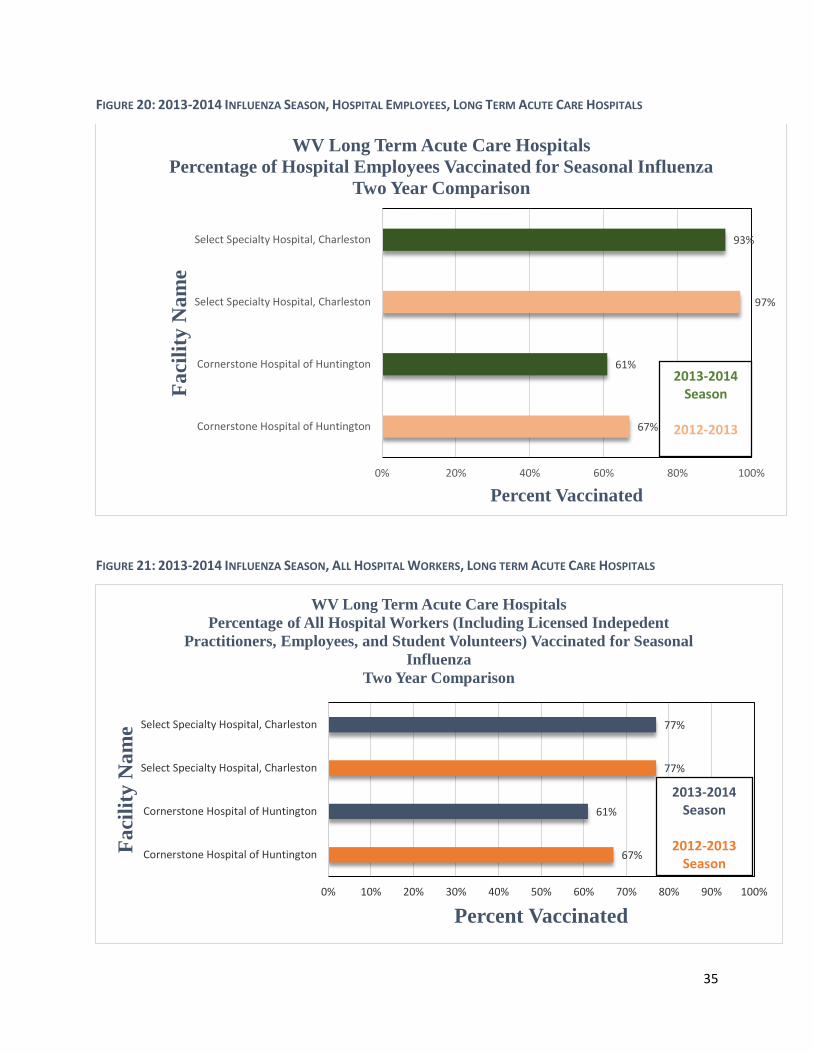
FIGURE 20: 2013-2014 INFLUENZA SEASON, HOSPITAL EMPLOYEES, LONG TERM ACUTE CARE HOSPITALS
FIGURE 21: 2013-2014 INFLUENZA SEASON, ALL HOSPITAL WORKERS, LONG TERM ACUTE CARE HOSPITALS
67%
61%
97%
93%
0% 20% 40% 60% 80% 100%
Cornerstone Hospital of Huntington
Cornerstone Hospital of Huntington
Select Specialty Hospital, Charleston
Select Specialty Hospital, Charleston
Percent Vaccinated
Fa
cili
ty N
am
e
WV Long Term Acute Care Hospitals
Percentage of Hospital Employees Vaccinated for Seasonal Influenza
Two Year Comparison
2013-2014 Season
2012-2013
67%
61%
77%
77%
0% 10% 20% 30% 40% 50% 60% 70% 80% 90% 100%
Cornerstone Hospital of Huntington
Cornerstone Hospital of Huntington
Select Specialty Hospital, Charleston
Select Specialty Hospital, Charleston
Percent Vaccinated
Faci
lity
Na
me
WV Long Term Acute Care Hospitals
Percentage of All Hospital Workers (Including Licensed Indepedent
Practitioners, Employees, and Student Volunteers) Vaccinated for Seasonal
Influenza
Two Year Comparison
2013-2014Season
2012-2013 Season
36
Advisory Panel Accomplishments and Future Directions
The HAI Control Advisory Panel has made some changes to published hospital reporting by
redesigning and simplifying the HAI reports, including the addition of color-coded SIR and rate
graphs.
In order to assist hospitals in meeting reporting requirements, the HAI Control Advisory Panel
developed the HAI Data Submission Quality Review Schedule and Procedure, which provided
hospitals with data submission deadlines that may assist in avoiding state penalties, and
potentially, federal penalties.
In order to further interagency partnerships, the West Virginia Bureau of Public Health (BPH) was
provided access to the NHSN system as well as training per the recommendation of the HAI
Control Advisory Panel. This was implemented to help further the BPH’s role in hospital oversight,
epidemiology, and disease surveillance programs.
Continued surveillance and reporting of HAIs is imperative for implementing control and
prevention strategies to ensure the safety of patients in healthcare facilities. As such, the HAI
Control Advisory Panel and the WVHCA are committed to continually improving reporting
strategies, interagency communication, and data quality reviews. In the 2013 HAI Report, a set
of future HAI initiatives were proposed; in 2014, each goal was met. Below is a description of the
goals and how they were met:
2013 HAI Report Goals 2014 HAI Actions Continue the collection and quality review of
HAI data Continued to collect and review HAI data, as
well as created a data quality review schedule and procedure to help healthcare facilities with
timely submission of data and to avoid state penalties
Develop guidelines for the public release of data
Revised the annual report to include more detailed HAI data as well as develop simplified
reports for public use
Revise reporting requirements as necessary to align with state and national priorities
Reporting requirements were reviewed and the HAI Control Advisory Panel advised to continue following CMS reporting requirements into the next data year. In addition, a reporting guide
was developed to outline reporting requirements
Collaborate with the Bureau for Public Health (BPH), Office of Epidemiology and Prevention Service’s HAI Program by providing data for
consideration in hospital oversight, epidemiology, and surveillance programs
Bureau of Public Health (BPH) was provided access to the NHSN system as well as training per the recommendation of the HAI Control
Advisory Panel to further interagency cooperation and communication and assist with hospital oversight, epidemiology, and
surveillance programs
37
While these goals were met, the HAI Control Advisory Panel continues to work on improving
procedures and lowering the rates of HAIs in West Virginia hospitals. As hospitals move into a
new data collection year, the goals for 2015 have been updated as follows:
Continue to revise and update the data quality review schedule and procedure to ensure
timely data submission
Continue to assist healthcare facilities regarding data submission and technical concerns
regarding NHSN
Revise reporting requirements and update reporting guide as needed to align with state
and national priorities as directed by the HAI Control Advisory Panel and WVHCA Board
of Directors
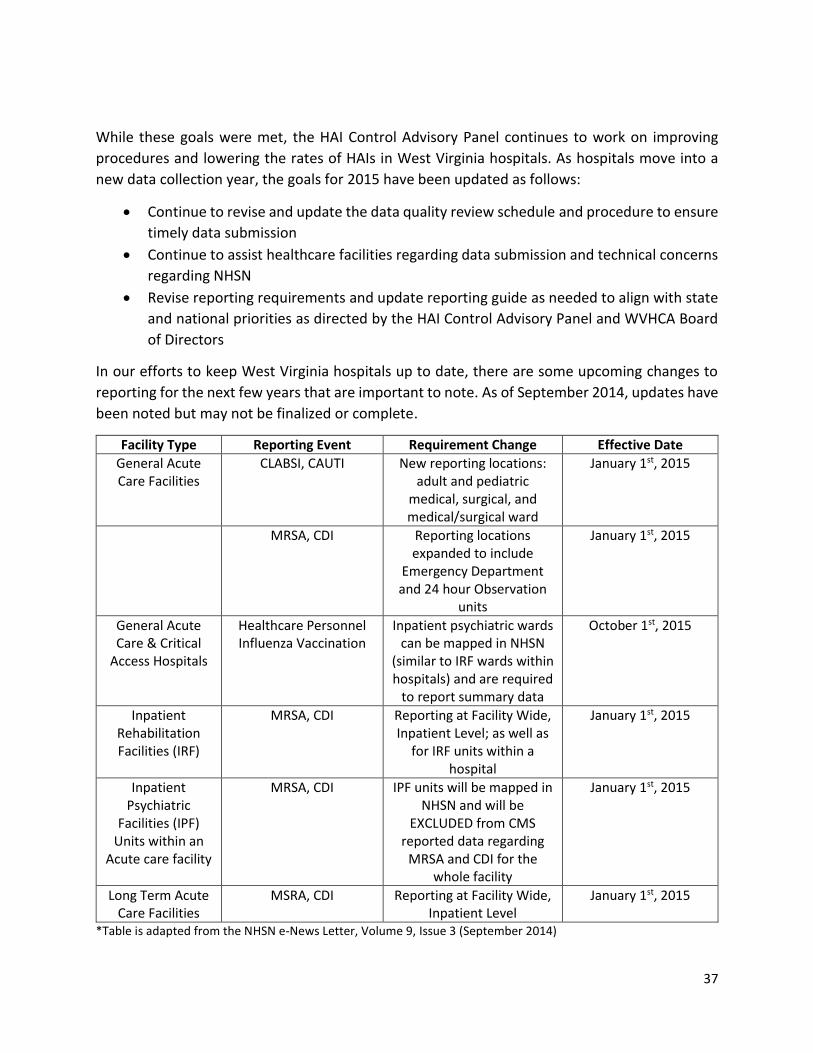
In our efforts to keep West Virginia hospitals up to date, there are some upcoming changes to
reporting for the next few years that are important to note. As of September 2014, updates have
been noted but may not be finalized or complete.
Facility Type Reporting Event Requirement Change Effective Date
General Acute Care Facilities
CLABSI, CAUTI New reporting locations: adult and pediatric
medical, surgical, and medical/surgical ward
January 1st, 2015
MRSA, CDI Reporting locations expanded to include
Emergency Department and 24 hour Observation
units
January 1st, 2015
General Acute Care & Critical
Access Hospitals
Healthcare Personnel Influenza Vaccination
Inpatient psychiatric wards can be mapped in NHSN
(similar to IRF wards within hospitals) and are required
to report summary data
October 1st, 2015
Inpatient Rehabilitation Facilities (IRF)
MRSA, CDI Reporting at Facility Wide, Inpatient Level; as well as
for IRF units within a hospital
January 1st, 2015
Inpatient Psychiatric
Facilities (IPF) Units within an
Acute care facility
MRSA, CDI IPF units will be mapped in NHSN and will be
EXCLUDED from CMS reported data regarding
MRSA and CDI for the whole facility
January 1st, 2015
Long Term Acute Care Facilities
MSRA, CDI Reporting at Facility Wide, Inpatient Level
January 1st, 2015
*Table is adapted from the NHSN e-News Letter, Volume 9, Issue 3 (September 2014)

38
Additionally, national baselines are being updated for both long term acute care facilities and
inpatient rehabilitation facilities in 2015, and reporting will move from pooled mean rate to SIR.
There were no changes to critical access hospital reporting for next year, and they will continue
to report CAUTI events and healthcare personnel influenza vaccinations; however, CMS is
reviewing critical access hospital mandatory reporting for future years. Psychiatric hospitals,
excluding state-run facilities, are still only required to report healthcare personnel vaccinations
as well.
Technical Notes
Standardized Infection Ratio (SIR)
There are various statistics that can be used to summarize and report HAI data at a national,
state, or local level. The standardized infection ratio (SIR) is a commonly reported summary
measure because it adjusts for patients of varying risk within each facility, which allows for valid
comparisons between facilities. The SIR compares the actual number of infections reported by
the hospital to the national baseline (from the National Healthcare Safety Network (NHSN)
aggregate data), adjusting for several risk factors that have been significantly associated with
differences in infection incidence. A SIR greater than 1.0 indicates that more infections occurred
in the hospital than were expected based on national averages for hospitals of that type and size.
Conversely, a SIR less than 1.0 indicates that fewer infections occur than expected.17 For example,
a SIR of 1.20 indicates that the hospital had 20% more infections than expected; a SIR of 0.80
indicates that the hospital had 20% fewer infections than expected. When the number of
expected infections are <1, the number of procedures performed is too low to calculate a precise
SIR and comparative statistics.
Rate and Pooled Mean Rate
Another summary measure that is used to report HAI data is the rate. The rate is the measure of
the number of events that occurred in a certain population in a specified time period. When
reporting for large populations and/or rare events, the rate is often reported as a function of
units of populations, chosen to present the rate in a simpler numeric form. For example, if an
event occurs in 1 out of every 1000 patients, the rate is 0.001. However, if the rate is defined as
being out of 1000 patients, the rate becomes 1. In this report, the rate and pooled mean rate is
defined as being out of 1000 patients. The pooled mean rate is how NHSN defines data from
hospitals across the country of similar type and size and pools the rates to develop the mean.
This process of developing a pooled mean rate is completed every year by NHSN, which becomes
the baseline for next year’s data. Therefore, the pooled mean rates in this report are from
national 2012 data collected by NHSN.
17 Centers for Disease Control and Prevention. NHSN e-News: SIRs Special Edition. October 2010 (updated December 2010);1.
Related Documents