Health, Work and Wellbeing Defining the priorities: Workplace Health Needs Assessment for Employers February 2012

Welcome message from author
This document is posted to help you gain knowledge. Please leave a comment to let me know what you think about it! Share it to your friends and learn new things together.
Transcript

Health, Work and Wellbeing
Defining the priorities:
Workplace Health Needs Assessment for
Employers
February 2012

Contents
Methods and tools 2
Carrying out the survey 9
Health Needs Assessment questionnaire 11
Appendix 1 - How to analyse the survey results 17
Appendix 2 - Step-by-step: creating a healthy workplace 34
Appendix 3 - Useful information 35
Carol Davies, Public Health Analyst
East Midlands Public Health Observatory
Mandy Wardle, Specialist in Public Health/Health Work & Wellbeing Coordinator
Directorate of Public Health and Social Care - East Midlands [email protected]

2
Carrying out a Health Needs Assessment in the
workplace – where do I start:
Methods and tools
Introduction
Research shows that good work is good for health and that better employee health is good for business.
“Our conclusion from the evidence available … is that the correlation between engagement, wellbeing and
performance is repeated too often for it to be a coincidence” (Macleod & Clarke)1. Most employers
recognise the contribution that protecting and improving the health of their workforce can make to their
business, recognising that employees are their most valuable asset. This tool provides employers with a
survey tool and examples of guidance on good practice to identify priorities and action aimed at ensuring
you get the maximum impact for your employees and your business. Each year around 140 – 150 million
working days are lost due to sickness absence; upwards of one fifth of this is longer term and can lead to
people falling out of work. Over 300,000 people move from work to claiming incapacity benefits each
year.2 The Chartered Institute of Personnel Development survey reports that the average cost of absence is
£692 per employee per year. Dame Carol Black’s 2008 review of the health of Britain’s working age
population3 estimated that the overall costs of working-age ill-health in the UK exceed £100billion every
year.
The review recognised the beneficial impact that work can have on an individual’s state of health, and that
work is generally good for both physical and mental health. It identified the importance of healthy
workplaces designed to protect and promote good health and the central role that such workplaces play in
preventing illness and supporting people to stay in work.
In order to improve and protect the health of your employees and maximize the benefit to your
organisation, you need to identify where you should target action, and define the priorities – you can do
this in a number of ways. Firstly, you can look at your sickness absence levels and trends. Secondly, you
can assess the health of your workforce by providing a health check, or by asking them to assess their own
health. A health check can provide you with a snapshot of the physical and mental health of your staff.
However, using a robust tool to seek your staff’s assessment of their own health is a good way of
identifying what you should prioritise, and consulting staff on what interventions and action you should
1 Engaging for Success: enhancing performance through employee engagement. A report to Government by David Macleod and Nita Clarke
2 Health at work – an understanding of sickness absence, DWP, Dame Carol Black and David Frost CBE (November 2011)
3 Department for Work and Pensions and Department of Health (2008). Working for a Healthier Tomorrow. Dame Carol Black’s review of the health
of Britain’s working age population. http://www.dwp.gov.uk/docs/hwwb-working-for-a-healthier-tomorrow.pdf

3
take. These approaches complement each other and provide an opportunity to engage your staff in the
process. Evidence suggests that staff engagement increases productivity by 12%.
The employee level Health Needs Assessment survey here provides a systematic way to plan workplace
health initiatives, while also giving an opportunity to engage staff and helping to emphasise employer
commitment.
The questions recommended here are questions that have been validated and piloted. They are aimed at
providing information on your staff’s reported behaviour which matches their actual behaviour well, and
which can be compared with national data, so you know how your workforce compares. They have also
been shown to be a good measure of the topic area they cover, so they are a ’short cut’ to getting good
evidence on the topics covered. The section at the end provides you with an opportunity to seek staff’s
views on your ‘offer’: the action you are proposing to take. The length of a questionnaire is a key factor
influencing response rates, with shorter questionnaires tending to obtain better response rates. For this
reason, the recommended core questionnaire here uses brief tools and questions. However for employers
who wish to look at particular issues in more detail there is a more detailed set of questions available for
each issue.4 There is also a wide variety of help available including guidelines and tools for those who want
to take action (see Appendix 3).
Having used a robust method for assessing priorities for health in your organisation it is recognised that you
will want any action to be as cost effective as possible and to have maximum impact. A step-by-step
recommended process for undertaking health in the workplace starting with the needs assessment is
outlined at Appendix 2. It includes suggested key guidance and examples of best practice, along with
exemplars of tools and services to address the priorities you identify effectively. This process uses the
needs assessment questionnaire as part of an audit cycle. This means that by using the survey as a
benchmark before intervention, you can repeat it later as part of assessing the impact on your employees
and your business. If you want to assess the status of your organisation as a whole in relation to workplace
wellbeing, see www.wellbeingcharter.org.uk.
4 EMPHO HWWB Health Needs Assessment – Methods and Tools http://www.empho.org.uk/viewResource.aspx?id=12479.

4
What topics are included in the survey and why are they important to
employers
General health and mental wellbeing
Why is this important to employers and what can they do about it?
The HNA includes the questions on limiting long term illness and general health used in the UK
Census, and also four questions on more general wellbeing developed for use in another large
national survey. These will give an overview of your workforce that you can compare with the
wider population.
The cost of mental ill health to employers in the UK is estimated at £28.3 billion at 2009 pay levels,
and evidence suggests that investment in healthy workplaces and practices along with the health
and wellbeing of employees increases productivity and is cost-effective for business and wider
society.5 It is estimated that 17% of the working population think that their job is extremely or very
stressful.6
A cost-benefit analysis conducted as part of the Foresight Project: Mental Capital and Wellbeing
Project7 suggests that certain components of organisation-wide approaches to promoting mental
wellbeing (such as carrying out an annual stress and wellbeing audit and integrating occupational
health professionals with primary care) can produce important economic benefits.
Smoking
Why is this important to employers and what can they do about it?
Smoking is the single most preventable cause of premature death and illness in England. Nationally,
one fifth of all UK deaths (112,000 per year) are caused by smoking. One in two regular smokers is
killed by tobacco, with half dying before the age of 70 (losing an average of 21 years of life).
Evidence suggests that employers who provide smoking cessation support could benefit from
reduced sickness absence and increased productivity, whilst promoting healthy living and non
5 NICE (2009). Promoting mental wellbeing at work. Business Case. Implementing NICE Guidance. NICE Public Health Guidance 22. London: NICE
6 Webster, S and Buckley, P. (2008) Psychosocial Working Conditions in Britain in 2008. London: Health and Safety Executive
7 Foresight (2008). Mental Capital and Wellbeing Project Final Project Report. London: The Government Office for Science

5
smoking within society.8 A review of workplace interventions for smoking cessation conducted to
inform the development of NICE intervention guidance8 identified evidence that a key way for
employers to encourage smokers to quit is by offering smoking cessation support. A recent
Cochrane review9 found strong evidence that interventions for smoking cessation, including
individual and group counselling, are equally effective when offered in the workplace. Modelling of
the net financial benefits to employers of a range of smoking cessation interventions delivered in
the workplace found that all interventions taken into consideration were successful in reducing the
number of employees who smoked which in turn led to increased productivity compared to ‘no
intervention’. Most interventions began to produce a net financial benefit after two years (the cost
of the intervention subtracted from the productivity benefits) and some of the cheaper
interventions reviewed, such as brief advice, led to a net financial benefit after just one year.
What are the recommended HNA questions?
As a minimum, it is important to know how many employees are current smokers. Other questions
are available to explore in more detail, for example, the quantity smoked and intentions to quit.
Alcohol
Why is this important to employers and what can they do about it?
All employers will be familiar with the threat to health and safety that alcohol can present in the
workplace. The government’s 2004 alcohol harm-reduction strategy10
concluded that alcohol
misuse leads to loss of productivity for the country and loss of employment opportunities for the
individual. Alcohol misuse among employees costs up to £6.4bn in lost productivity through
increased absenteeism, unemployment and premature death. It can also lead to unemployment
and loss of quality of life for individual problem drinkers, who tend to stay in jobs for shorter
periods than employees who do not misuse alcohol. A survey carried out in December 2007 for
Norwich Union Healthcare found a third of employees admitting to having been to work with a
hangover and 15% reported having been drunk at work. The majority (77%) of employers
interviewed for this survey identified alcohol as a major threat to employee wellbeing and a factor
encouraging sickness absence.11
8 NICE (2007). Workplace health promotion: how to help employees stop smoking. Public Health Intervention Guidance 5.
http://guidance.nice.org.uk/PH5 9 Cahill K, Moher M and Lancaster T (2008). Workplace interventions for smoking cessation. The Cochrane Database of Systematic Reviews. Issue 4
10 Strategy Unit (2004) Alcohol harm reduction strategy for England. London: Prime Minister’s Strategy Unit, Cabinet Office.
www.strategy.gov.uk/files/pdf/al04SU.pdf 11
Findings from a report compiled from research carried out by Vanson Bourne and YouGov, commissioned by Norwich Union Healthcare in 2007

6
It has been argued that the workplace can be an effective setting within which to influence patterns
of alcohol consumption and reduce alcohol-related problems. Interventions are likely to be
beneficial when placed in the context of a workplace alcohol policy covering drinking at the
workplace, workplace discipline, recognition and help for those with alcohol-related problems, and
alcohol education. Brief interventions may work well in this setting.12
75% of employers report
absences due to alcohol and 60% poor performance. Brief advice can reduce weekly drinking by
between 13% and 14%13
. Occupational Health, welfare or personnel staff have been suggested as
appropriate people to provide brief advice in the workplace.
What are the recommended HNA questions?
To estimate alcohol consumption it is important to know what has been drunk, as different drinks
have different strengths. These questions are designed to address the variation in different drinks,
measures and sizes of glass, to get an accurate picture of alcohol consumed. More detailed
questions are available on binge drinking, and attitudes and knowledge.
Healthy eating and healthy weight
Why is this important to employers?
There is a clear link between unhealthy diet and poor health and premature death.14
This not only
has increasing social costs in England, but is placing a financial burden of more than £2 billion on
the NHS. 15
It is estimated that in 2050 50% of women and 60% of men will be obese. In 2008 it
was estimated that 71% of the population were already either overweight or obese. Overweight
and obesity increase the risk of a number of health conditions, including cardiovascular disease and
type II diabetes, which impact on people’s ability to stay in work and the support they may need to
do so.
12 HDA (2004), Choosing Health: Workplace interventions: alcohol and diet http://www.nice.org.uk/nicemedia/documents/CHB19-alcohol_diet-14-
7.pdf 13
Whitlock et al 2004 14
Cabinet Office (2008). Food: An analysis of the issues Revision B. http://www.cabinetoffice.gov.uk/strategy/work_areas/food_policy.aspx 15
National Audit Office (2006). Tackling Childhood Obesity. London.

7
What can employers do about it?
Research studies16
have shown positive effects of healthy-eating interventions in the workplace,
with decreases in blood cholesterol of between 2.5 and 10%. A Health Education Authority review
of the effectiveness of health-promotion interventions in the workplace identified a number of
studies showing positive effects including improvements in dietary habits.17
Change for Life (C4L)
provides suggestions for change including ‘swaps’ and guidance for employers.18
What are the recommended HNA questions?
The National Obesity Observatory (2011)19
identified a shortlist of practical and validated
questionnaires for assessing diet based on best available evidence. Each of these had strengths
and weaknesses. The two item food frequency questionnaire used here was developed as a brief
tool to estimate intake of fruit and vegetables. The questions are short and completed quickly, so
they are recommended for inclusion in a brief workplace questionnaire, where their length might
prove a barrier to completion not necessarily balanced by the greater spread and depth of
alternatives. These can be seen in the longer version of this tool at
http://www.empho.org.uk/viewResource.aspx?id=12479
Physical activity
Why is this important to employers and what can they do about it?
Only 6% of men and 4% of women meet the recommended levels of physical activity each week (150
minutes’ moderate exercise a week20
) and the cost of this physical inactivity in England has been estimated
at £8.2 billion a year.21
Physically active employees are less likely to suffer from major health problems, less
likely to take sickness leave and less likely to have an accident at work. Physical activity in the workplace
reduces sickness absence by up to 20%22
. ‘Workplace health promotion: how to encourage employees to
be physically active’ (NICE Public Health Guidance 13) provides a useful guide to what works, including a
business case. In addition, the British Heart Foundation offers support on healthy workplaces, including
physical activity.
16 HDA (2002), Choosing Health: Workplace interventions: alcohol and diet http://www.nice.org.uk/nicemedia/documents/CHB19-alcohol_diet-14-
7.pdf 17
For more information see HDA (2002) Cancer Prevention. A resource to support local action in delivering The NHS Cancer Plan. 18
Department of Health: http://www.dh.gov.uk/en/Publichealth/Change4Life/index.htm 19
NOO (2011) Measuring diet and physical activity in weight management interventions. Oxford. National Obesity Observatory 20
HSE 2008 21
Guidelines on physical activity for adults 18-65 CMO (July 2011) London Department of Health 22
Department for Work and Pensions and Department of Health (2008).Working for a Healthier Tomorrow. Dame Carol Black’s review of the health
of Britain’s working age population. http://www.dwp.gov.uk/docs/hwwb-working-for-a-healthier-tomorrow.pdf
8
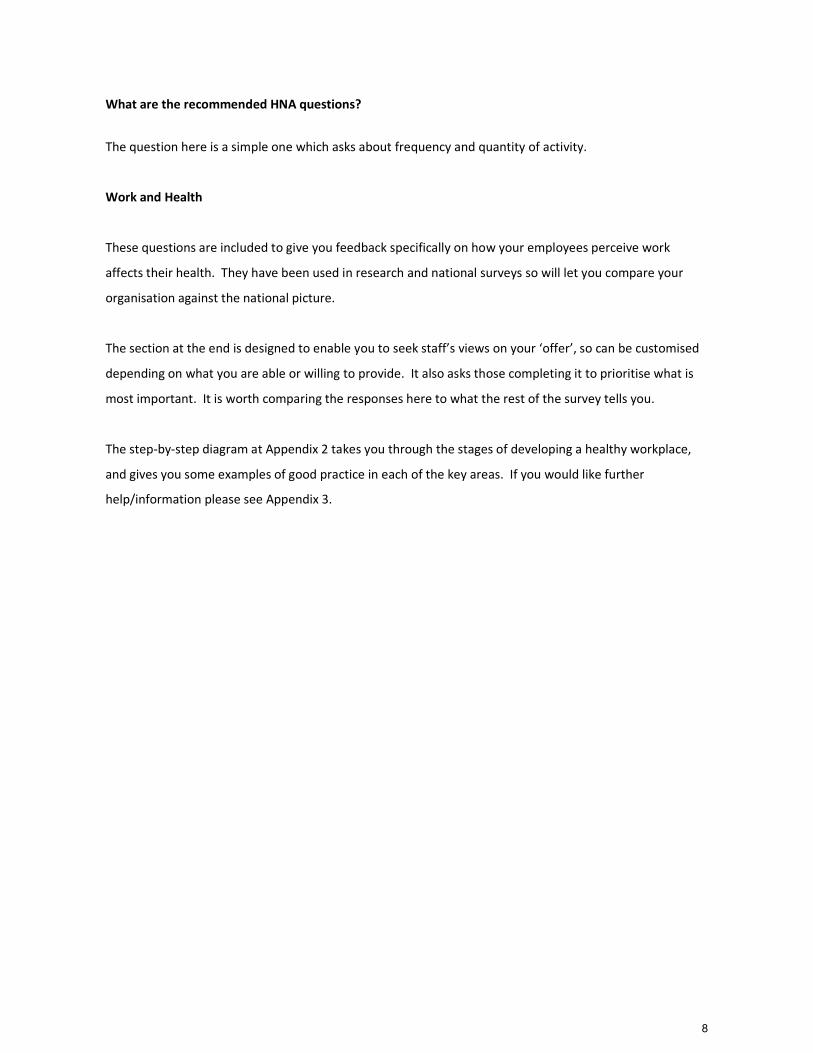
What are the recommended HNA questions?
The question here is a simple one which asks about frequency and quantity of activity.
Work and Health
These questions are included to give you feedback specifically on how your employees perceive work
affects their health. They have been used in research and national surveys so will let you compare your
organisation against the national picture.
The section at the end is designed to enable you to seek staff’s views on your ‘offer’, so can be customised
depending on what you are able or willing to provide. It also asks those completing it to prioritise what is
most important. It is worth comparing the responses here to what the rest of the survey tells you.
The step-by-step diagram at Appendix 2 takes you through the stages of developing a healthy workplace,
and gives you some examples of good practice in each of the key areas. If you would like further
help/information please see Appendix 3.

9
Workplace Health Needs Assessment:
Carrying out the survey
To ensure you get the best possible response your planning and cover note should include:
• Who is collecting the information – include relevant logos etc
• Why the information is being collected
• What will be done with the information (i.e. how will it help to develop/prioritise workplace health
initiatives). How will the results be publicised (e.g. website/staff newsletter?)
• What are the timescales for completion of the questionnaire and when will the results and
outcomes be circulated?
• Assurance of confidentiality – no names or other identifying information collected
• Participation is voluntary – choosing not to complete a questionnaire will not affect access to
services/resources
• Details of any incentive or reward (e.g. a prize draw usually increases return/response rate, but
take care not to compromise confidentiality) for completed questionnaires.
• Instructions for completion (i.e. read questions carefully and tick relevant boxes)
• Details of how and to whom to return the questionnaire if you are doing it in hard copy or by email
• If you want to add additional questions to get more information on a particular issue , we strongly
recommend you consider using the validated questions in the more detailed version at
http://www.empho.org.uk/viewResource.aspx?id=12479

10
11
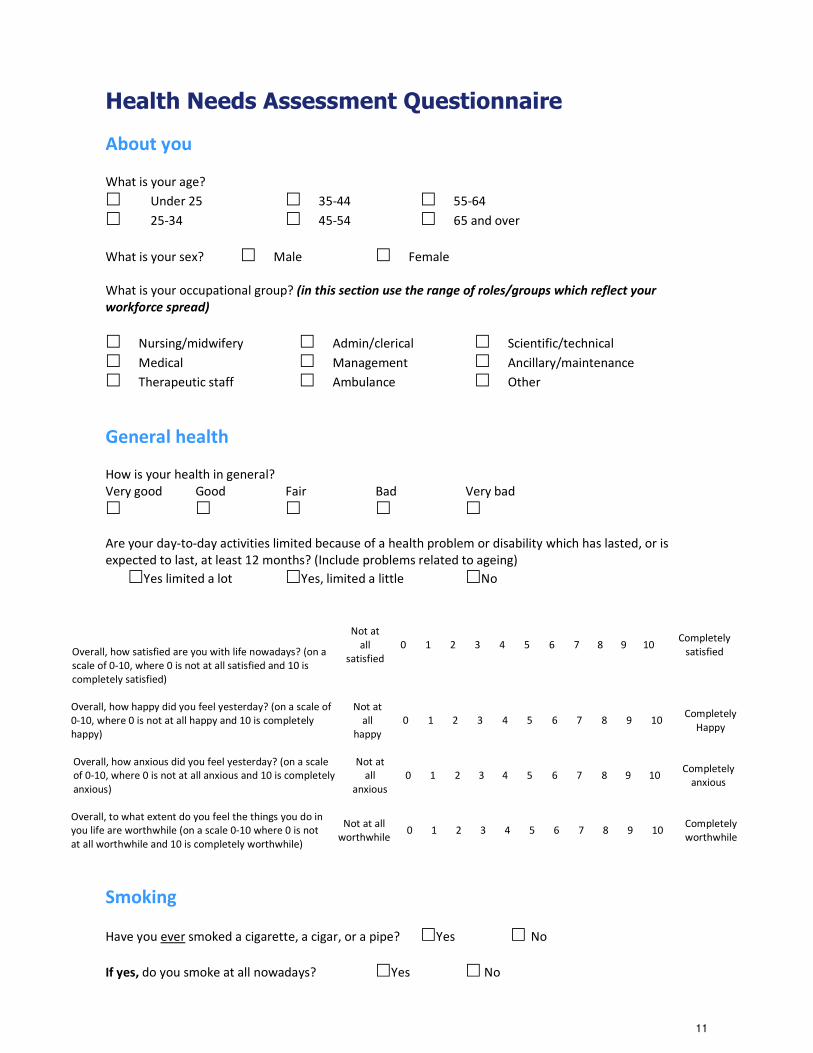
Health Needs Assessment Questionnaire
About you
What is your age?
� Under 25 � 35-44 � 55-64
� 25-34 � 45-54 � 65 and over
What is your sex? � Male � Female
What is your occupational group? (in this section use the range of roles/groups which reflect your
workforce spread)
� Nursing/midwifery � Admin/clerical � Scientific/technical
� Medical � Management � Ancillary/maintenance
� Therapeutic staff � Ambulance � Other
General health
How is your health in general?
Very good Good Fair Bad Very bad
� � � � �
Are your day-to-day activities limited because of a health problem or disability which has lasted, or is
expected to last, at least 12 months? (Include problems related to ageing)
�Yes limited a lot �Yes, limited a little �No
Overall, how satisfied are you with life nowadays? (on a
scale of 0-10, where 0 is not at all satisfied and 10 is
completely satisfied)
Not at
all
satisfied
0 1 2 3 4 5 6 7 8 9 10 Completely
satisfied
Overall, how happy did you feel yesterday? (on a scale of
0-10, where 0 is not at all happy and 10 is completely
happy)
Not at
all
happy
0 1 2 3 4 5 6 7 8 9 10 Completely
Happy
Overall, how anxious did you feel yesterday? (on a scale
of 0-10, where 0 is not at all anxious and 10 is completely
anxious)
Not at
all
anxious
0 1 2 3 4 5 6 7 8 9 10 Completely
anxious
Overall, to what extent do you feel the things you do in
you life are worthwhile (on a scale 0-10 where 0 is not
at all worthwhile and 10 is completely worthwhile)
Not at all
worthwhile 0 1 2 3 4 5 6 7 8 9 10
Completely
worthwhile
Smoking
Have you ever smoked a cigarette, a cigar, or a pipe? �Yes � No
If yes, do you smoke at all nowadays? �Yes � No

12
Healthy eating
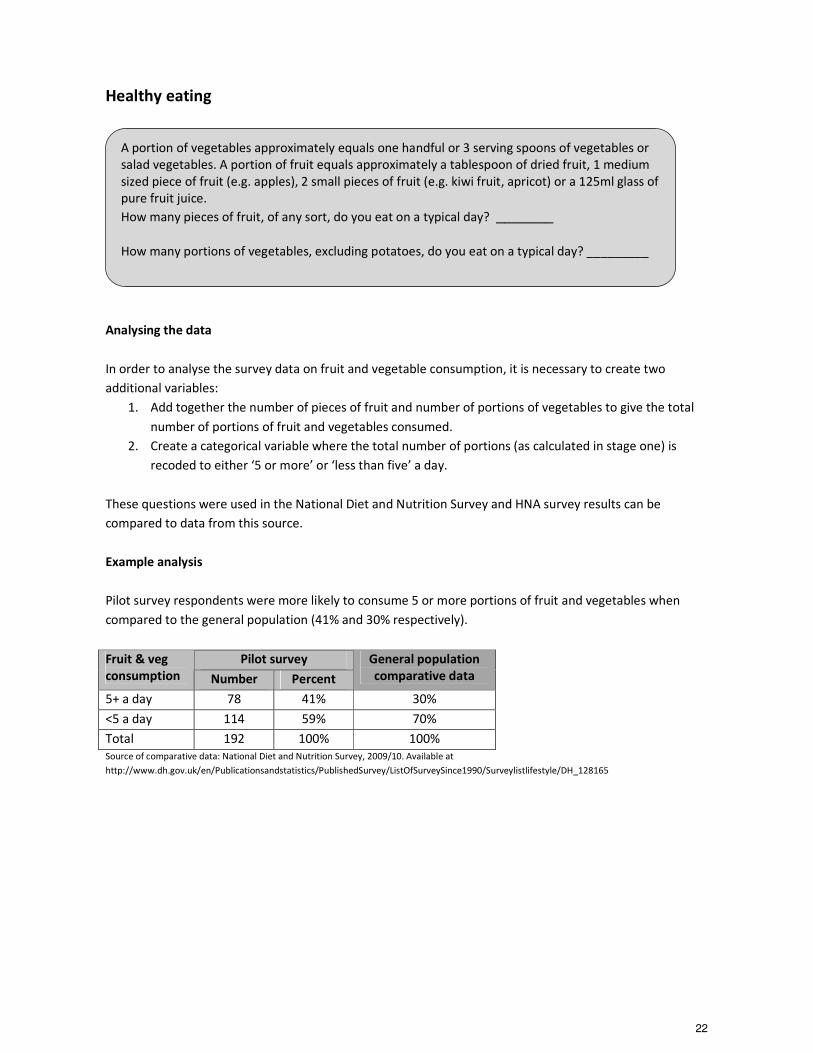
A portion of vegetables approximately equals one handful or 3 serving spoons of vegetables or salad
vegetables. A portion of fruit equals approximately a tablespoon of dried fruit, 1 medium sized piece of
fruit (e.g. apples), 2 small pieces of fruit (e.g. kiwi fruit, apricot) or a 125ml glass of pure fruit juice.
How many pieces of fruit, of any sort, do you eat on a typical day? _______
How many portions of vegetables, excluding potatoes, do you eat on a typical day? _________
Alcohol
Thinking about all kinds of drinks, how often have you had an alcoholic drink of any kind during the last 12
months? PLEASE CHOOSE ONE
� Almost every day
� 5 or 6 days a week
� 3 or 4 days a week
� Once or twice a week
� Once or twice a month
� Once every couple of months
� Once or twice a year
� Not at all in the past 12 months
Have you had an alcoholic drink in the seven days ending yesterday? � Yes � No
If yes, how many of each of these types of drink have you had during the last seven days? Please include
drinks that are drunk in or out of the home.
No. of drinks
in last 7 days
Pints or bottles of normal strength beer, bitter, lager or cider
Pints or bottles of extra strong beer, bitter, lager or cider
Single measures of spirits or liqueur such as whisky, gin,
vodka, etc.
Standard glasses of wine (175ml)
Single glasses of martini, sherry or port (not wine)
Bottles of Alcopops/designer drinks or alcoholic lemonade
such as Red, Reef, Hooch, Bacardi Breezer, Smirnoff Ice, etc.
Other alcoholic drinks
Low/non alcohol drinks

13
Physical activity
In the past week, on how many days have you done a total of 30 minutes or more of moderate or intensive
physical activity? This includes any activities done to the point where you were slightly sweaty, breathing
faster than usual and your heart was beating faster than usual, and which can be done in sessions of 10
minutes or more.
�0 �1 �2 �3 �4 �5 �6 �7
Work and health
Very good Good Bad Very bad
Taking everything into account, do you think paid work
is generally good or bad for physical health
� � � �
Taking everything into account, do you think paid work
is generally good or bad for mental health
� � � �
In general, how satisfied are you with: (please tick one box in each row)
Very
dissatisfied
Quite
dissatisfied
Neither
satisfied nor
dissatisfied
Quite
satisfied
Very
satisfied
a. your job � � � � �
b. the social environment at work � � � � �
c. the physical environment at work � � � � �
Within the last 12 months have you suffered from any illness, disability or other physical or mental problem
that was caused or made worse by your job or by work you have done in the past?
� Yes �No
In general, how do you find your job?
� not at all stressful
� mildly stressful
� moderately stressful
� very stressful
� extremely stressful

14
How interested would you be in taking part in each of the following programmes if they were offered to
you at work? (Here you insert details of your ‘offer’ to your workforce e.g. a list of the options you are
considering for intervention to help improve their health)
Examples:
Extremely
interested
Fairly
interested
Not
interested
Undecided/
not
applicable
a) Health checks/know your numbers � � � �
b) Healthy eating/weight management � � � �
c) Smoking cessation � � � �
d) Physical activity � � � �
e) Aches and pains � � � �
f) Alcohol/drugs � � � �
g) Stress & mental well-being (emotional resilience) � � � �
h) Other: (Please state.)
_________________________________
� � � �
Which three of these programmes would you be most interested in? (please write the relevant letters)
1st ………… 2nd ………… 3rd …………

15
If there was one thing in your workplace that would improve your health, what would it be?

16

17
Appendix 1
Employee Health Needs Assessment:
How to analyse the survey results – what do the
answers tell you?
The aim of this section is to provide guidance on how to analyse the information obtained from the Health
Work and Wellbeing Health Needs Assessment questionnaire, so that you can summarise and interpret
what the survey results tell you. This enables you to turn the information you have collected into action.
Once the survey data have been collected they should be entered to a database - in most cases simple
entry to a spreadsheet application such as Excel will be sufficient. Data entry methods are not covered
here, but many guides are available online.23
If more complex analysis is required it is recommended that a
specialised analytical tool such as SPSS should be used, if available.
Once the data have been entered to a database, a plan should be drawn up to outline what analysis is
required. Relevant questions to inform the plan include:
• Who will read or use the data?
• What types of analysis will they want – what will be of most interest?
• Is simple (frequency) analysis sufficient, or is more complex analysis/statistical testing needed?
(frequency = the number of times something occurs e.g. six people between the ages of 20-25)
The data can be used to carry out exploratory analysis. for example, examine whether there is any
difference in employees’ health and lifestyle by age, sex or occupational group. It is also useful to compare
the survey findings with results that have been obtained using the same questions in other settings. Most
of the questions in the core survey tool were chosen because they have been widely used and so extensive
comparative data are available, which will enable you to see how your workforce compares for example to
the national picture.
The first section focuses on how to obtain basic summary analysis of each of the questions included in the
core questions. In many cases this will consist of a simple frequency table. [total of xxxx in a group or
category] Frequency tables show the possible answers to a question, and the total number and
percentage of people who selected each answer. Frequency tables are useful to gain an overview of the
data. In other cases, where the data are continuous, summary measures such as average or median will be
used. For some variables the data need to be transformed before summary information can be obtained
(for example, a calculation has to be made to obtain overall alcohol consumption information from the
survey responses). These techniques will be described. Where available, sources of comparative data will
be given. In addition, data obtained from a pilot study with an NHS organisation within the East Midlands
will be used for illustrative purposes. The final section briefly describes the process for sub group analysis
using cross comparison.
23 A useful guide to creating a survey database in Excel is at http://learningstore.uwex.edu/assets/pdfs/G3658-14.pdf

18
1. Basic summary analysis
About you
Analysing the data
Each of the three questions included in this section can be analysed using simple frequency tables, without
any transformation of the data. As well as giving information about the profile of survey respondents,
these data have two further important uses:
• It is useful to compare the profile of survey respondents with the profile of individuals within the
survey population (usually workforce in this context) as a whole. This allows assessment of
whether the survey appears to be representative of the workforce (in terms of age, sex and
occupational group) and therefore whether the results are likely to be generalisable. See example
analysis below.
• These variables can be cross tabulated against other survey questions to find out whether results
vary by sub group (for example, does smoking prevalence vary by occupational group). This may be
especially useful in helping to target interventions in the workplace. More details of such analysis
are included at the end of this paper.
Example analysis
A simple frequency count of the sex variable within the pilot HNA survey showed that respondents were
predominantly female (79%). This is broadly in line with this organisation’s workforce as a whole where
77% of staff are female. The survey therefore appears to be broadly representative of the workforce in
terms of sex. Similar analysis was also carried out for age and occupational group.
Pilot survey Sex
Number Percent
Workforce
percent
Male 34 21% 23%
Female 129 79% 77%
Total 163 100% 100%
What is your age?
� Under 25 � 35-44 � 55-64
� 25-34 � 45-54 � 65 and over
What is your sex? � Male � Female
What is your occupational group? (Note: categories require amendment depending on setting)
� Nursing/midwifery � Admin/clerical � Scientific/technical
� Medical � Management � Ancillary/maintenance
� Therapeutic staff � Ambulance � Other

19
General health
Analysing the data
Both of these general health questions can be analysed using simple frequency tables, without any
transformation of the data. Both questions have been used extensively in national surveys including, most
notably, the Census and the General Lifestyle Survey. HNA survey results can be compared against data
from these sources to assess whether survey respondents have better or worse general health when
compared to the England population as a whole.
Example analysis
When asked to rate their health in general, pilot survey respondents were much less likely to report being
in ‘very good’ health compared to the general population as a whole. However, the proportion reporting a
limiting long term illness was similar across both groups.
Pilot survey Health in general
is …. Number Percent
General population
comparative data
Very good 33 17% 40%
Good 118 60% 39%
Fair 42 21% 15%
Bad 4 2% 5%
Very bad 0 0% 1%
Total 197 100% 100%
Source of comparative data: General Lifestyle Survey 2009 (www.ons.gov.uk)
Pilot survey Limiting long term
illness Number Percent
General population
comparative data
Yes limited a lot 3 2%
Yes limited a little 38 20% 18%
Not limited 148 78% 82%
Total 189 100% 100%
Source of comparative data: General Lifestyle Survey 2009 (www.ons.gov.uk)
How is your health in general?
Very good Good Fair Bad Very bad
� � � � �
Are your day-to-day activities limited because of a health problem or disability which has lasted,
or is expected to last, at least 12 months? (Include problems related to ageing)
�Yes, limited a lot �Yes, limited a little �No
20
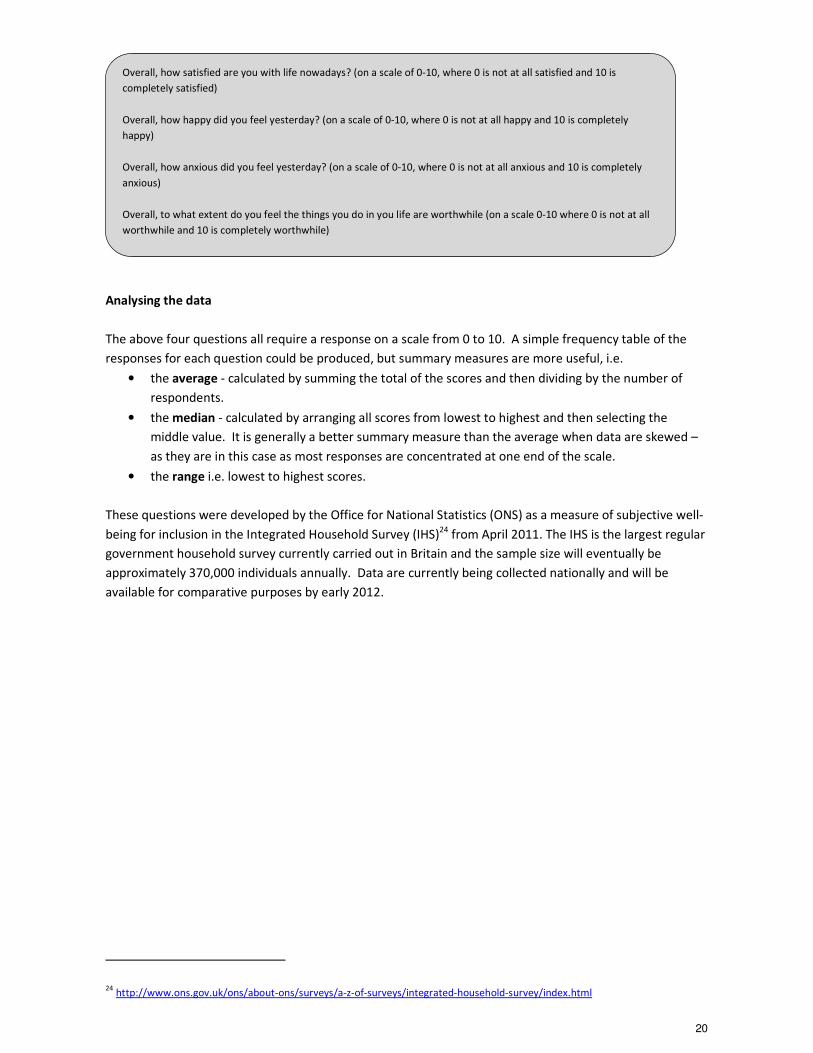
Analysing the data
The above four questions all require a response on a scale from 0 to 10. A simple frequency table of the
responses for each question could be produced, but summary measures are more useful, i.e.
• the average - calculated by summing the total of the scores and then dividing by the number of
respondents.
• the median - calculated by arranging all scores from lowest to highest and then selecting the
middle value. It is generally a better summary measure than the average when data are skewed –
as they are in this case as most responses are concentrated at one end of the scale.
• the range i.e. lowest to highest scores.
These questions were developed by the Office for National Statistics (ONS) as a measure of subjective well-
being for inclusion in the Integrated Household Survey (IHS)24
from April 2011. The IHS is the largest regular
government household survey currently carried out in Britain and the sample size will eventually be
approximately 370,000 individuals annually. Data are currently being collected nationally and will be
available for comparative purposes by early 2012.
24 http://www.ons.gov.uk/ons/about-ons/surveys/a-z-of-surveys/integrated-household-survey/index.html
Overall, how satisfied are you with life nowadays? (on a scale of 0-10, where 0 is not at all satisfied and 10 is
completely satisfied)
Overall, how happy did you feel yesterday? (on a scale of 0-10, where 0 is not at all happy and 10 is completely
happy)
Overall, how anxious did you feel yesterday? (on a scale of 0-10, where 0 is not at all anxious and 10 is completely
anxious)
Overall, to what extent do you feel the things you do in you life are worthwhile (on a scale 0-10 where 0 is not at all
worthwhile and 10 is completely worthwhile)

21
Example analysis
Analysis of the pilot survey results is shown in the table below. It should be noted that scores for the third
question (on anxiety) reverse those for the other three questions i.e. for this question higher scores
indicate a negative response (higher levels of anxiety) whereas for the others higher scores indicate a more
positive response.
For all questions responses were skewed towards positive scores, although all showed a wide range. For
example the median score for satisfaction with life was 7.0, but scores ranged from 2 to 10.
Pilot survey
Average Median Range
Satisfaction with life
0=not at all, 10=completely
7.0 7.0 2 – 10
Happiness yesterday
0=not at all, 10=completely
6.8 7.0 0 – 10
Anxious yesterday
0=not at all, 10=completely
3.7 3.0 0 – 10
Things do in life are worthwhile
0=not at all, 10=completely
7.4 8.0 2 – 10
22
Healthy eating
Analysing the data
In order to analyse the survey data on fruit and vegetable consumption, it is necessary to create two
additional variables:
1. Add together the number of pieces of fruit and number of portions of vegetables to give the total
number of portions of fruit and vegetables consumed.
2. Create a categorical variable where the total number of portions (as calculated in stage one) is
recoded to either ‘5 or more’ or ‘less than five’ a day.
These questions were used in the National Diet and Nutrition Survey and HNA survey results can be
compared to data from this source.
Example analysis
Pilot survey respondents were more likely to consume 5 or more portions of fruit and vegetables when
compared to the general population (41% and 30% respectively).
Pilot survey Fruit & veg
consumption Number Percent
General population
comparative data
5+ a day 78 41% 30%
<5 a day 114 59% 70%
Total 192 100% 100%
Source of comparative data: National Diet and Nutrition Survey, 2009/10. Available at
http://www.dh.gov.uk/en/Publicationsandstatistics/PublishedSurvey/ListOfSurveySince1990/Surveylistlifestyle/DH_128165
A portion of vegetables approximately equals one handful or 3 serving spoons of vegetables or
salad vegetables. A portion of fruit equals approximately a tablespoon of dried fruit, 1 medium
sized piece of fruit (e.g. apples), 2 small pieces of fruit (e.g. kiwi fruit, apricot) or a 125ml glass of
pure fruit juice. How many pieces of fruit, of any sort, do you eat on a typical day? _______
How many portions of vegetables, excluding potatoes, do you eat on a typical day? _________

23
Smoking
Analysing the data
It is necessary to create one additional variable to allow analysis of smoking status. The variable should
contain three categories defined as follows:
1. Current smoker, where ever smoked = yes AND nowadays smoke = yes.
2. Ex smoker, where ever smoked = yes AND nowadays smoke = no.
3. Never smoker, where ever smoker = no/both [?]
Note that ever smoker = no plus nowadays smoke = yes is invalid and any such responses should be marked
as missing data.
These are the same definitions as used in the IHS survey, and comparative data are available from this
source.
Example analysis
The prevalence of current smoking was lower among the pilot survey cohort than among the general
population. However, 16% (approximately one in six) of pilot survey respondents currently smoke and
therefore might benefit from advice and/or intervention.
Pilot survey Ever smoked
Number Percent
General population
comparative data
Current smoker 31 16% 21%
Ex smoker 58 30% 33%
Never smoker 105 54% 46%
Total 194 100% 100%
Source of comparative data: Integrated Household Survey 2010/11. Available at http://www.ons.gov.uk/ons/about-ons/surveys/a-z-of-
surveys/integrated-household-survey/index.html
Have you ever smoked a cigarette, a cigar, or a pipe? �Yes � No
If yes, do you smoke at all nowadays? �Yes � No

24
Physical activity
Analysing the data
UK guidance published by the Department of Health in July 2011 states that adults should aim to be active
daily. Over a week, activity should add up to at least 150 minutes (2½ hours) of moderate intensity activity
in bouts of 10 minutes or more.25
Previously, National Indicator 8 recommended participation in sports and
recreation of at least moderate intensity activity three times a week, for at least 30 minutes.26
The above question is an amended version of that used in the Outdoor Health Questionnaire. The Outdoor
Health Questionnaire asked only about outdoor sport and recreational activities whereas the HNA survey
question includes all types of moderate or intensive physical activity. For this reason, HNA survey results
cannot be directly compared with Outdoor Health Survey results.
Data can be analysed using a simple frequency table or, for clarity, summary categories can be created to
group the data e.g. 0-2 days, 3-5 days, 6-7 days.
Example analysis
Analysis showed that almost half (46%) of pilot survey respondents reported doing a total of 30 minutes or
more of moderate or intensive physical activity on less than three days a week.
Pilot survey No. days 30 mins or more moderate
or intensive physical activity Number Percent
0 – 2 days 89 46%
3 – 5 days 81 42%
6 – 7 days 22 12%
Total 192 100%
25 UK Physical Activity Guidelines. Available at:
http://www.dh.gov.uk/en/Publicationsandstatistics/Publications/PublicationsPolicyAndGuidance/DH_127931 26
http://www.sportengland.org/research/active_people_survey/national_indicator_8.aspx
In the past week, on how many days have you done a total of 30 minutes or more of moderate
or intensive physical activity? This includes any activities done to the point where you were
slightly sweaty, breathing faster than usual and your heart was beating faster than usual.
�0 �1 �2 �3 �4 �5 �6 �7

25
Alcohol
Analysing the data
The alcohol questions are those used in national surveys such as the General Lifestyle Survey and the
Health Survey for England. The first two questions can be analysed using simple frequency tables.
However, it is necessary to convert the consumption grid responses to numbers of alcohol units consumed.
This is done by multiplying the number of drinks consumed by ‘conversion factors’ to give number of units.
Estimates of alcohol consumption in surveys are derived from assumptions about the average alcohol
content of different types of drink, combined with information from the respondent about the volume
drunk. Because alcoholic drinks vary widely in their alcohol content, what people drink has to be converted
into equivalent standard units. When drinking surveys were first carried out in the 1970s, the assumption
that one unit was found in a half pint of beer, a glass of table wine, a small glass of fortified wine, and a
single measure of spirits was reasonable. Since then, however, and particularly in recent years, new types
of alcoholic drink have been introduced (such as alcopops), the alcohol content of some drinks has
Thinking about all kinds of drinks, how often have you had an alcoholic drink of any kind
during the last 12 months? PLEASE CHOOSE ONE
� Almost every day
� 5 or 6 days a week
� 3 or 4 days a week
� Once or twice a week
� Once or twice a month
� Once every couple of months
� Once or twice a year
� Not at all in the past 12 months
Have you had an alcoholic drink in the seven days ending yesterday? � Yes � No
If yes, how many of each of these types of drink have you had during the last seven days?
Please include drinks that are drunk in or out of the home.
No. of drinks
in last 7 days
Pints or bottles of normal strength beer, bitter, lager or cider
Pints or bottles of extra strong beer, bitter, lager or cider
Single measures of spirits or liqueur such as whisky, gin,
vodka, etc.
Standard glasses of wine (175ml)
Single glasses of martini, sherry or port (not wine)
Bottles of Alcopops/designer drinks or alcoholic lemonade
such as Red, Reef, Hooch, Bacardi Breezer, Smirnoff Ice, etc.

26
increased, and alcoholic drinks are now sold in more variable quantities than used to be the case. Methods
have therefore been published for converting the information provided by survey respondents into
standard alcohol units. These estimate average alcoholic strength for different types of drink, and take
account of volumes drunk. A recent update to the conversion methodology
reconsidered the assumptions made in obtaining estimates of alcohol consumption by taking into account
increases in the size of glass in which wine is served on licensed premises; the increased average alcoholic
strength of wine; and revised estimates of the average alcoholic strengths of beers, lagers and ciders. 27
Current conversion factors are:
Pints or bottles of normal strength beer, bitter, lager or cider 2.0
Pints or bottles of extra strong beer, bitter, lager or cider 4.0
Single measures of spirits or liqueur such as whisky, gin, vodka, etc. 1.0
Standard glasses of wine (175ml) 2.0
Single glasses of martini, sherry or port (not wine) 1.0
Bottles of Alcopops/designer drinks or alcoholic lemonade 1.5
In order to obtain number of units consumed for each survey respondent, the number of drinks given in
each category should be multiplied by the conversion factor given above. An additional variable should
then be created by adding together all the units consumed to give an overall total.
This overall total field could be analysed using summary measures such as mean, median and range.
However, more usually, the number of units consumed is grouped into categories representing different
levels of alcohol consumption. These categories vary for men and women (see tables below). Until
recently it was advised that men should drink no more than 21 units per week, and women no more than
14. More recent guidance has focused on advised daily (rather than weekly) consumption levels. It is
recommended that an additional variable should be added to the survey database, grouping the continuous
number of units consumed into categories, filtered by whether the respondent was male or female.
27 Office for National Statistics. National Statistics Methodological Series No. 37. Estimating alcohol consumption from survey
data: updated method of converting volumes to units. December 2007. Available at http://www.ons.gov.uk/ons/guide-
method/method-quality/specific/gss-methodology-series/index.html
27
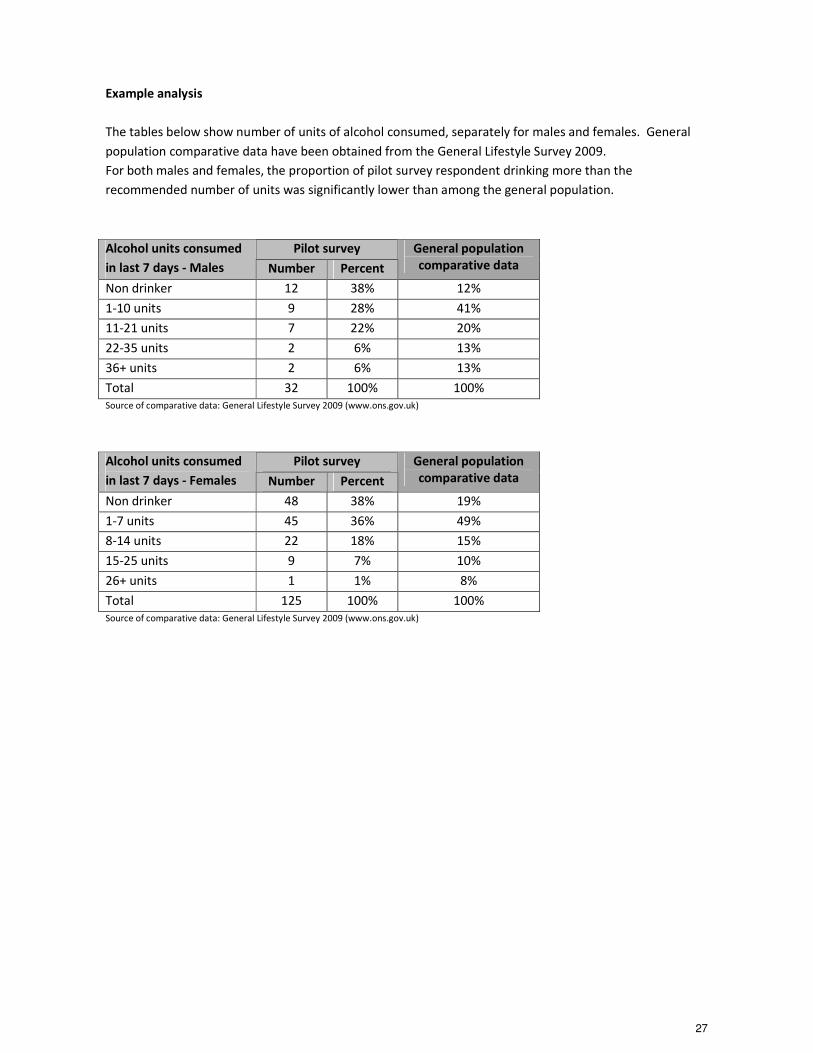
Example analysis
The tables below show number of units of alcohol consumed, separately for males and females. General
population comparative data have been obtained from the General Lifestyle Survey 2009.
For both males and females, the proportion of pilot survey respondent drinking more than the
recommended number of units was significantly lower than among the general population.
Pilot survey Alcohol units consumed
in last 7 days - Males Number Percent
General population
comparative data
Non drinker 12 38% 12%
1-10 units 9 28% 41%
11-21 units 7 22% 20%
22-35 units 2 6% 13%
36+ units 2 6% 13%
Total 32 100% 100%
Source of comparative data: General Lifestyle Survey 2009 (www.ons.gov.uk)
Pilot survey Alcohol units consumed
in last 7 days - Females Number Percent
General population
comparative data
Non drinker 48 38% 19%
1-7 units 45 36% 49%
8-14 units 22 18% 15%
15-25 units 9 7% 10%
26+ units 1 1% 8%
Total 125 100% 100%
Source of comparative data: General Lifestyle Survey 2009 (www.ons.gov.uk)

28
Work and health
Analysing the data
Both of the above questions were answered on a four-point scale (very good/good/bad/very bad) and can
be analysed using simple frequency tables. The questions were used in the ‘Attitudes to health and work
among the working age population’ survey and these HNA survey results can be compared against results
from that source.
Example analysis
The majority of pilot survey respondents reported that that they thought paid work was generally either
good or very good for physical and mental health. Findings were broadly similar to the national survey
results.
Pilot survey Taking everything into account, do you
think paid work is generally good or
bad for physical health
Number Percent
General population
comparative data
Very good 41 21% 27%
Good 132 68% 67%
Bad 20 10% 6%
Very bad 1 <1% 0%
Total 194 100% 100%
Source of comparative data: Attitudes to health and work amongst the working age population survey. Available at
http://research.dwp.gov.uk/asd/asd5/report_abstracts/rr_abstracts/rra_763.asp
Pilot survey Taking everything into account, do you
think paid work is generally good or
bad for mental health
Number Percent
General population
comparative data
Very good 41 21% 26%
Good 131 68% 67%
Bad 20 10% 6%
Very bad 0 0% 1%
Total 192 100% 100%
Source of comparative data: Attitudes to health and work amongst the working age population survey. Available at
http://research.dwp.gov.uk/asd/asd5/report_abstracts/rr_abstracts/rra_763.asp
Taking everything into account, do you think paid work is generally good or bad for physical
health
Taking everything into account, do you think paid work is generally good or bad for mental
health
29
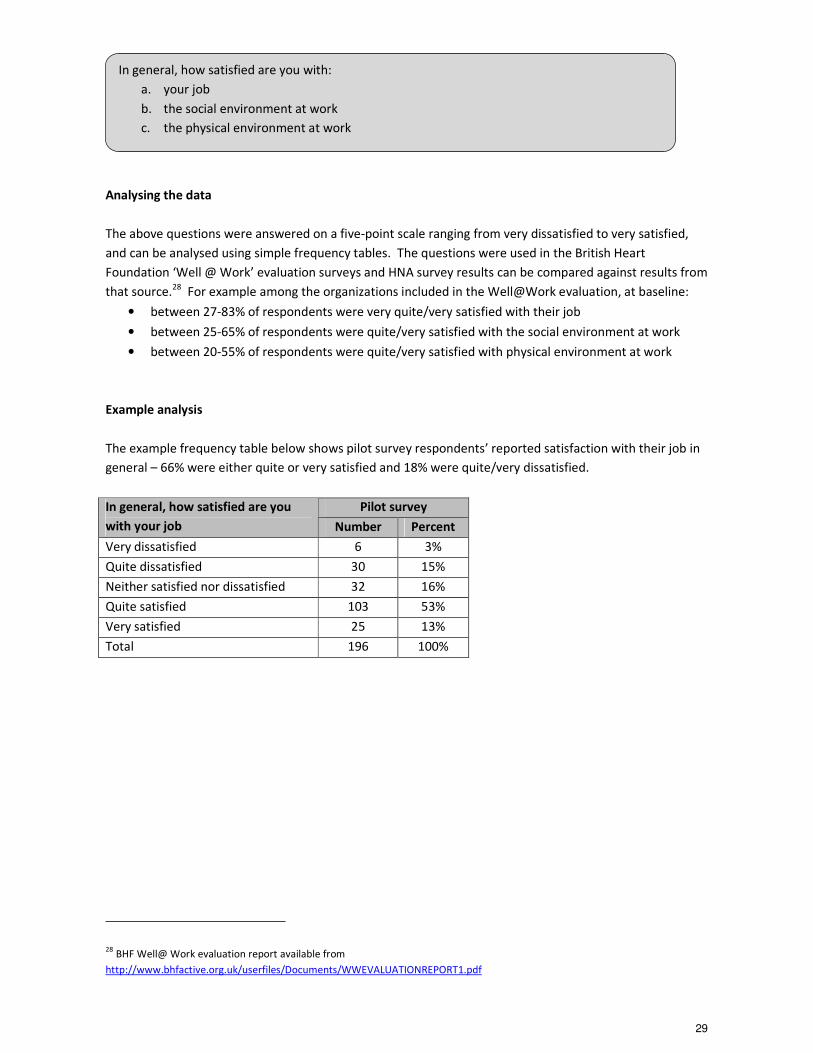
Analysing the data
The above questions were answered on a five-point scale ranging from very dissatisfied to very satisfied,
and can be analysed using simple frequency tables. The questions were used in the British Heart
Foundation ‘Well @ Work’ evaluation surveys and HNA survey results can be compared against results from
that source.28
For example among the organizations included in the Well@Work evaluation, at baseline:
• between 27-83% of respondents were very quite/very satisfied with their job
• between 25-65% of respondents were quite/very satisfied with the social environment at work
• between 20-55% of respondents were quite/very satisfied with physical environment at work
Example analysis
The example frequency table below shows pilot survey respondents’ reported satisfaction with their job in
general – 66% were either quite or very satisfied and 18% were quite/very dissatisfied.
Pilot survey In general, how satisfied are you
with your job Number Percent
Very dissatisfied 6 3%
Quite dissatisfied 30 15%
Neither satisfied nor dissatisfied 32 16%
Quite satisfied 103 53%
Very satisfied 25 13%
Total 196 100%
28 BHF Well@ Work evaluation report available from
http://www.bhfactive.org.uk/userfiles/Documents/WWEVALUATIONREPORT1.pdf
In general, how satisfied are you with:
a. your job
b. the social environment at work
c. the physical environment at work

30
Analysing the data
The above question has been used in the Labour Force Survey and is analysed by simple frequency table of
‘yes’ and ‘no’ responses.
Example analysis
One in five (20%) pilot survey respondents reported that within the last 12 months they had suffered from
illness, disability or other physical or mental problem caused or made worse by their job or by work they
done in the past. This is significantly higher than the proportion reported in the HSE Labour Force survey
(2%), and the reasons for large difference this are under investigation by the pilot survey organisation.
Pilot survey Problem
Number Percent
General population
comparative data
Yes 39 20% 2%
No 159 80% 98%
Total 198 100% 100%
Source of comparative data: HSE Labour Force Survey 2008/9. Available at http://www.hse.gov.uk/statistics/lfs/0809/hubresults.htm
Analysing the data
The above question was used in the 2009 Psychosocial Working Conditions in Britain Survey and is analysed
by simple frequency table of the five possible responses.
In general, how do you find your job? � Not at all stressful � Mildly stressful
� Moderately stressful � Very stressful � Extremely stressful
Within the last 12 months have you suffered from any illness, disability or other physical or
mental problem that was caused or made worse by your job or by work you have done in the
past? � Yes �No

31
Example analysis
A total of 17% of pilot survey respondents said they found their job either very or extremely stressful, the
same proportion as found in the Psychosocial Working Conditions in Britain Survey. However, only 6% of
pilot survey respondents said their job was not at all stressful compared to 17% in the national survey.
Pilot survey In general, how stressful do you find
your job?
Number Percent
General population
comparative data
Not at all stressful 11 6% 17%
Mildly stressful 66 33% 30%
Moderately stressful 86 44% 36%
Very stressful 30 15% 13%
Extremely stressful 4 2% 4%
Total 197 100% 100%
Source of comparative data: Psychosocial Working Conditions in Britain survey, 2009. Available at
http://www.hse.gov.uk/statistics/pdf/pwc2009.pdf
A range of options were listed (e.g. physical activity sessions, stress-buster sessions etc) and responses
were given on a five-point scale ranging from extremely likely to extremely unlikely. It is recommended
that this question should be customised by organizations to include locally relevant activities/ programmes.
The data can be analysed by simple frequency table, counting responses to each option.
The aim of this question is to assess likely demand for workplace-based initiatives, and the data can be
analysed by simple frequency table.
If there was one thing in your workplace that would improve your health, what would it be?
Which of the following changes (if any) are you interested in making over the next 12 months?
(please tick all that apply)
� Stop smoking
� Increase physical activity levels
� Eat a more balanced diet
� Drink less alcohol
� Reduce stress
� Other (please specify) _______________________________________________
How likely are you to take part in each of the following programmes if they were offered to you
at work?

32
This is an open ended question inviting respondents to comment on one thing that they would like in their
workplace to improve their health. The preferred method of analysis will depend on the number and
nature of responses. However, it is likely that it will be necessary to code responses. As a first step,
responses should be transcribed. Usually, the text will be brief
and suitable for entry into the same database as the quantitative (numeric) data. Longer responses may
have to be transcribed using word processing software.
Once the responses have been transcribed, codes should be assigned to identify the most common groups
or themes. Depending on the nature of the data use either a pre-determined coding list (for example
based on the previous question regarding interest in changes) or assign codes based on themes emerging
from the data. Usually it is good practice not to include too many coding categories, otherwise the data
become unmanageable. Once codes have been applied, the data can be analysed using simple frequency
tables to count the number of occurrences of each theme.
If required, it may also be useful to extract direct qualitative quotes from the actual text to illustrate and
elaborate on points drawn from the quantitative analysis of the remainder of the questionnaire.

33
2. Sub group analysis
Cross tabulations are a good way to compare two or more subgroups of information. Cross tabulations
allow comparison of data from two questions to determine if there is a relationship between them. Like
frequency tables, cross tabulations appear as a table of data showing answers to one question as a series of
rows and answers to another question as a series of columns. The intersections of the various columns and
rows, commonly called cells, are the percentages of people who answered each of the responses.
Cross tabulations include a dependent variable and an independent variable. For example, smoking
prevalence could be analysed by age group. In this example age group is the independent variable. The
independent is expected to affect the dependent variable (in this case smoking prevalence). Age group
cannot be the dependent variable as it would not be sensible to hypothesise that age depends on smoking
(rather, smoking may depend on age).
Analysing variation in survey results by sub group may be especially useful in helping to target interventions
in the workplace.
Cross tabulations are easy to calculate in database packages – for example by using the crosstabs command
in SPSS and by using pivot tables in Excel.
Example analysis
The table below shows variation in current smoking by age group among pilot survey respondents i.e. 35%
of people aged under 25 years reported currently smoking compared to only 8% of people aged 55-64
years. The statistical significance of such variations can be formally tested (using chi2 test) but that is
outside the scope of this paper.
Pilot survey - smoking prevalence Age group
Current smoker Ex or never smoker Total
Under25 7 (35%) 13 (65%) 20 (100%)
25 – 34 4 (14%) 24 (86%) 28 (100%)
35 – 44 5 (11%) 40 (89%) 45 (100%)
45 – 54 12 (18%) 56 (82%) 68 (100%)
55 – 64 3 (8%) 33 (92%) 36 (100%)
Total 31 (16%) 166 (84%) 197 (100%)

APPENDIX 2 - STEP BY STEP: CREATING A HEALTHY WORKPLACE
34
Define problem and identify priorities
Health Needs Assessment: > identify priorities > engage organization and workforce: health champion top level support staff involvement
1 SICKNESS ABSENCE Tools eg: www.businesslink.gov.uk/workingforhealth
2 HEALTH STATUS Self-assessed: ▪ Validated self-assessment questionnaire - DH/EMPHO HNA tool, focus groups Assessed: ▪ Health checks – individual health checks, eg: “How are you doing” NHS 40-70 yr olds ▪ NHS Choices – Health Check
▪ Sickness Absence policy/review ▪ Organisational development/leadership group ▪ Recruitment/ retention & rehab ▪ Occupational health services ▪ Keeping or getting more active → ▪ Help to Stop Smoking → ▪ Mental Health → ▪ Alcohol & substance use →
▪ Health & Safety → ▪ Food & Health →
STAGE 1 STAGE 2 STAGE 3
·Review action plan\strategy
↓ ·Reduced staff turnover ? ·increase in productivity ?
↓ ·Changes in sickness absence levels/trends
↓ · Staff surveys
↓ ·Evaluate the outcomes from all interventions eg increase in P/A reported, quitters, organisation change
↓ ·Regularly review progress & impact; continue to gather evidence to prove it works
↓ ·Cost/benefits analysis
↓ ·Re-run health assessments in Stage 1 to evaluate impact/success of actions
↓ ·Agree continuing activity/new activities/ sustain activity
Action on priority areas identified
Implementation/ review
Priority areas Guidance eg: Tools/Services eg: Evaluate impact & outcomes/ next steps
▪ Workplace Wellbeing Charter ▪ NHS Health & Wellbeing Improvement Framework ▪ ACAS www.seqohs.org ▪ NICE guidance PH 13 NICE guidance: ▪ PH1, PH5 ▪ PH22 ▪ HSE Stress Management Standards ▪ HSE ▪ NICE CG43
www.wellbeingcharter.org.uk ▪ Fit for Work Services: www.leicesterfit4work.org.uk www.nottsfitforwork.org.uk ▪ Derby CAB/GP ▪ Occupational Health Adviceline: 0800 077 8844
▪ Think Fit: www.bhf.org.uk/HealthAtWork/getting-active-at-work.aspx www.promotingactivity.com ▪ Physical Activity Networks in all areas
▪ NHS/local smoking cessation services ▪ Mindful Employer www.mindfulemployer.net www.hse.gov.uk/alcoholdrugs
▪ Change 4 Life ▪ Commissioning Healthy Catering guide: www.regional platform.org.uk

35
Appendix 3
Useful Information
Health Work and Wellbeing Coordinators
Donna Burnett (Scotland) [email protected]
Kirstie Haines (North West) [email protected]
Matt Downton (Wales) [email protected]
NICE – published public health guidance Provides guidance on best practice based on review of the evidence
PH24 Alcohol - use disorders – preventing harmful drinking Jun 2010
PH6 Behaviour Change Oct 2007
PH1 Brief interventions and referral for smoking cessation Mar 2006
PH19 Management of long-term sickness and incapacity for work Mar 2009
PH8 Physical activity and the environment Jan 2008
PH22 Promoting mental wellbeing at work Nov 2009
PH13 Promoting physical activity in the workplace May 2008
PH32 Skin cancer prevention: information, resources and environmental changes Jan 2011
PH10 Smoking cessation services Feb 2008
PH5 Workplace interventions to promote smoking cessation Apr 2007
CG43 Obesity: the prevention, identification, assessment and management of
overweight and obesity in adults and children
Dec 2006
36
Useful contacts/websites
Health, Work and Wellbeing www.dwp.gov.uk/health-work-and-wellbeing
Health and Safety Executive www.hse.gov.uk
Equality Act 2010 www.equalityhumanrights.com
Health for Work Adviceline 0800 0 77 88 44 www.health4work.nhs.uk
Business Link www.businesslink.org.uk
Mindful Employer www.mindfulemployer.net
Bullying at Work www.banbullyingatwork.com
Institute for Employment Studies www.employment-studies.co.uk
Department of Health www.responsibilitydeal.dh.gov.uk
NHS Plus www.nhsplus.nhs.uk
Faculty of Public Health www.fph.org.uk
Health at Work www.bhf.org.uk/HEALTHATWORK
Federation of Small Businesses www.fsb.org.uk
Chambers of Commerce www.britishchambers.org.uk
ACAS (Advisory, Conciliation and Arbitration Service) www.acas.org.uk
Chartered Institute of Environmental Health www.cieh.org
Workplace Wellbeing Charter http://wellbeingcharter.org.uk/index.php?page=Downloads-Tools
East Midlands Public Health Observatory www.empho.org.uk
NHS Choices www.nhs.uk
Fit for Work Services
Leicestershire Fit for Work Service
Tel: 0116 285 1710
Fax: 0016 285 1716
Email: [email protected]
http://www.leicesterfit4work.org.uk
Nottinghamshire Fit for Work Service
Tel: 0115 934 9540
Email: [email protected]
http://www.nottsfitforwork.org.uk/

37

Health, Work and Wellbeing
Defining the priorities:
Workplace Health Needs Assessment for Employers
February 2012
Related Documents