HEALTH WEALTH CAREER ALLOCATION METHODOLOGY OPTIONS FOR FLORIDA RYAN WHITE PART B AND MATCHING STATE FUNDS NOVEMBER 21, 2018 Florida Department of Health Division of Disease Control and Health Protection Bureau of Communicable Diseases HIV/AIDS Section

Welcome message from author
This document is posted to help you gain knowledge. Please leave a comment to let me know what you think about it! Share it to your friends and learn new things together.
Transcript

H E A L T H W E A L T H C A R E E R
ALLOCATION METHODOLOGY OPTIONS FOR FLORIDA RYAN WHITE PART B AND MATCHING STATE FUNDS
NOVEMBER 21, 2018
Florida Department of Health
Division of Disease Control and Health Protection
Bureau of Communicable Diseases
HIV/AIDS Section

A L L O C A T I O N M E T H O D O L O G Y O P T I O N S F O R F L O R I D A R Y A N W H I T E P A R T B A N D M A T C H I N G S T A T E
F L O R I D A D E P A R T M E N T O F H E A L T H
i
C O N T E N T S
1. Introduction ................................................................................................................................. 1
2. Background and Project Approach .............................................................................................. 2
• Part B of Ryan White ............................................................................................................. 2
• Project Approach ................................................................................................................... 4
3. Guiding Principles ....................................................................................................................... 5
4. Review Historical Methodologies and Allocation Approaches ...................................................... 7
• Lead Agencies ...................................................................................................................... 7
• Current Allocation Development ............................................................................................ 8
• Historical Allocation Development ......................................................................................... 9
• Observations Regarding Current Methodology .................................................................... 12
5. Methodology Options ................................................................................................................ 13
• Foundational Analyses ........................................................................................................ 13
• Allocation methodology options ........................................................................................... 20
6. Recommendations for Allocation Methodology and Transition Plan .......................................... 33
• Implementation Timing ........................................................................................................ 33
A L L O C A T I O N M E T H O D O L O G Y O P T I O N S F O R F L O R I D A R Y A N W H I T E P A R T B A N D M A T C H I N G S T A T E
F L O R I D A D E P A R T M E N T O F H E A L T H
1
1 INTRODUCTION
The Ryan White HIV/AIDS Treatment Extension Act of 2009 (Public Law 111-87) authorizes the
Health Resources and Services Administration (HRSA) to administer the Ryan White program,
which provides a system of care for underinsured or uninsured individuals living with HIV. Under
Part B of the Ryan White program, HRSA provides grants to states and territories to provide these
services and supports to individuals living with HIV. In the State of Florida (State), the Bureau of
Communicable Diseases, HIV/AIDS Section within the Department of Health (DOH) is responsible
for administration of the Part B grants and the associated state matching funds under the Patient
Care Network program. DOH currently contracts with 14 lead agencies to provide Part B services
and supports and is responsible for determining the amount of grant funding to each lead agency.
DOH contracted with Mercer Government Human Services Consulting (Mercer), part of Mercer
Health & Benefits LLC, to review the current methodology and develop options for allocating Ryan
White Part B and state matching funds. This report includes a summary of the work Mercer
conducted, the options considered and recommended approaches for updating the current
approach.
A L L O C A T I O N M E T H O D O L O G Y O P T I O N S F O R F L O R I D A R Y A N W H I T E P A R T B A N D M A T C H I N G S T A T E
F L O R I D A D E P A R T M E N T O F H E A L T H
2
2 BACKGROUND AND PROJECT APPROACH
P A R T B O F R Y A N W H I T E
Part B of the Ryan White HIV/AIDS Program (RWHAP) provides grants to states and territories to
improve the quality, availability and organization of HIV health care and support services. This
project addresses the Ryan White Part B base grant for core medical and support services as well
as the associated matching state funds. Below is a description of the core medical and support
services.
Core Medical Services
Each state and territory determines the specific allowable outpatient services it funds based on its
assessed need and availability of funding. Core medical services include:
T A B L E 1
C O R E M E D I C A L S E R V I C E S
Outpatient and Ambulatory Health
Services
AIDS Drug Assistance Program
(ADAP)
AIDS Pharmaceutical Assistance
Oral Health Care Early Intervention Services Health Insurance Premium and
Cost-Sharing Assistance
Home Health Care Medical Nutrition Therapy Hospice Services
Home And Community-Based
Health Services
Mental Health Services Outpatient Substance Abuse Care
Medical Case Management,
Including Treatment-Adherence
Services
Support Services
Each state and territory also determines the allowable outpatient support services it offers based on
assessed needs and funding availability. Support services must be linked to medical outcomes and
may include the following:

A L L O C A T I O N M E T H O D O L O G Y O P T I O N S F O R F L O R I D A R Y A N W H I T E P A R T B A N D M A T C H I N G S T A T E
F L O R I D A D E P A R T M E N T O F H E A L T H
3
T A B L E 2
S U P P O R T S E R V I C E S
Outreach Medical Transportation
Linguistic Services Respite Care for Caregivers of People with HIV/AIDS
Referrals for Health Care and Other Support
Services
Non-Medical Case Management
Residential Substance Abuse Treatment Services
At least 75% of Part B grant funds must be spent on core medical services and no more than 25%
can be spent on support services.
Services Not Covered by Ryan White Part B
Ryan White Part B funds cannot be used to provide services or supports covered by third party
payers, including Medicaid, Medicare or private insurance. Providers must pursue payment from
third parties first if covered services are provided to individuals who have third-party coverage. Ryan
White Part B programs must also pursue enrollment in available health coverage options for eligible
clients. However, in cases where other HIV/AIDS funding is available (e.g., Part A, Housing
Opportunities for People with AIDS (HOPWA)), these funding sources do not need to be exhausted
prior to accessing Part B. Ryan White Part B funds cannot be spent on inpatient care or other
federally prohibited services and costs.
Ryan White Rebate Dollars
Florida ADAP is a direct purchase program. Manufacturers pay DOH rebates for medications
purchased by the ADAP program. The State portion of Ryan White ADAP rebates can be utilized as
state match for Ryan White federal funds. In historic cases where rebate funds exceeded those
needed for state match, the Department had a plan for the use of rebate funding, which included
expanding direct client services and infrastructure support.1 The rebate funds currently are utilized
to support the ADAP and Epidemic Intelligence Service (EIS) programs directly.
General Revenue
Florida General Revenue (GR) can be used as state match for Ryan White Federal funds, but must
follow Part B expenditure rules. However, General Revenue that is not used for matching Part B
federal funds may be utilized for inpatient care and other services that are federally prohibited under
Ryan White but are allowable under Florida law.
1http://www.theaidsinstitute.org/sites/default/files/attachments/Laura%20Reeves%20FCPN%20May%202017%20HIV%20
Update_r.pdf
A L L O C A T I O N M E T H O D O L O G Y O P T I O N S F O R F L O R I D A R Y A N W H I T E P A R T B A N D M A T C H I N G S T A T E
F L O R I D A D E P A R T M E N T O F H E A L T H
4
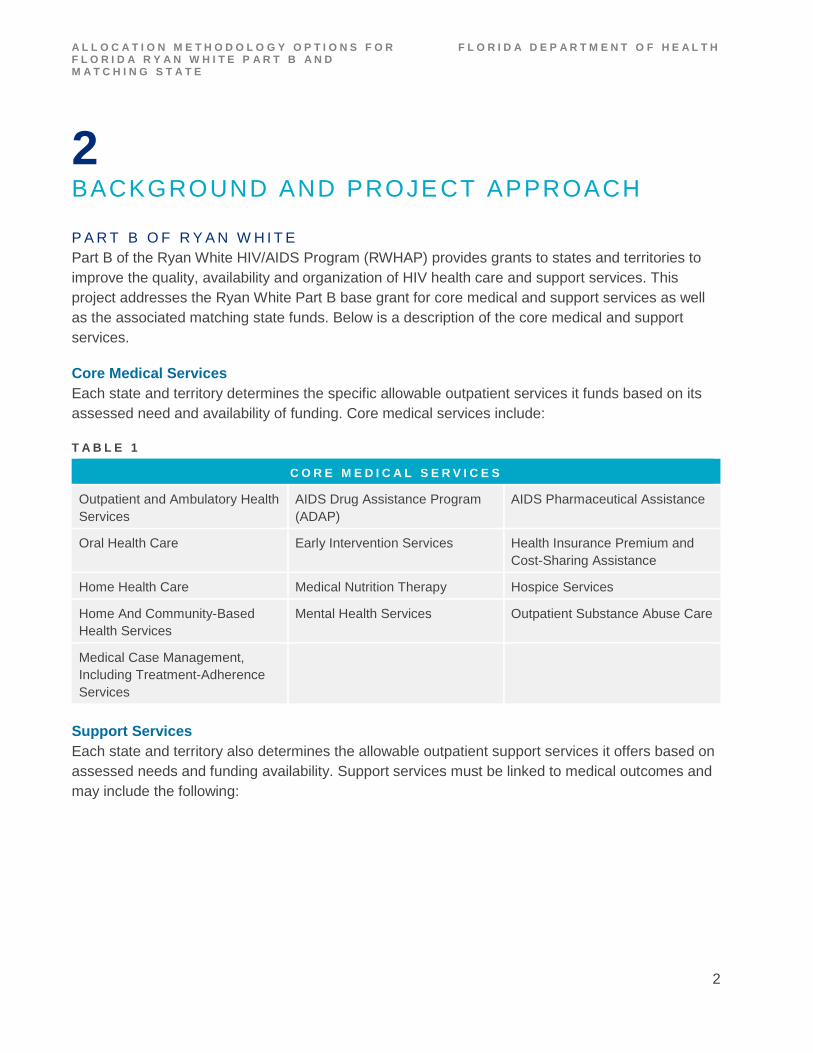
P R O J E C T A P P R O A C H
As the RWHAP Part B grantee, DOH must determine how to allocate funding across the state. DOH
contracted with Mercer to assist in the evaluation of the current allocation approach and the
development of options to revise this approach, as needed. Mercer established the following steps
for completion of this project.
F I G U R E 1
The remainder of this report describes each of the project steps in detail.
Work with DOH to establish guiding principles for the allocation methodology
Review and evaluate historical methodologies and allocation approaches
Develop alternative methodology options
Recommend potential methodology options
Develop implementation steps

A L L O C A T I O N M E T H O D O L O G Y O P T I O N S F O R F L O R I D A R Y A N W H I T E P A R T B A N D M A T C H I N G S T A T E
F L O R I D A D E P A R T M E N T O F H E A L T H
5
3 GUIDING PRINCIPLES
The first step in the project was for Mercer to understand DOH’s goals for the project and establish
principles to guide the process. Based on discussions with DOH, the following guiding principles
were outlined for the completion of this work.
The Department wants the new methodology to distribute Ryan White Part B and state matching
funds across the state in a manner that provides equitable access to the services and supports
available under State HIV programs.
Stakeholders are critical partners in ensuring the success of this project. The Department is
committed to ensuring the stakeholder community provides input into the methodology and its
implementation. Once the methodology is developed, the Department wants to ensure the
methodology and its implementation are clearly communicated and well-understood by the
stakeholder community.
As the steward of both state and federal funds, the Department must ensure those funds are used
efficiently and maximize the quantity and quality of services provided to participants.
The Department wants to ensure the allocation methodology is flexible enough to accommodate
changes over time.
Fairness
Transparency
Efficiency
Flexibility

A L L O C A T I O N M E T H O D O L O G Y O P T I O N S F O R F L O R I D A R Y A N W H I T E P A R T B A N D M A T C H I N G S T A T E
F L O R I D A D E P A R T M E N T O F H E A L T H
6
The allocation methodology should align programs with statewide goals and provide appropriate
motivation to maximize program resources across the state for the individuals served. Agencies will
be accountable for the effectiveness of services delivered.
Because funding is limited, the allocation methodology will distribute funds in a cost-neutral manner.
Effectiveness
Budget Neutrality

A L L O C A T I O N M E T H O D O L O G Y O P T I O N S F O R F L O R I D A R Y A N W H I T E P A R T B A N D M A T C H I N G S T A T E
F L O R I D A D E P A R T M E N T O F H E A L T H
7
4 REVIEW HISTORICAL METHODOLOGIES AND ALLOCATION APPROACHES
Prior to making recommendations for a new allocation methodology, Mercer wanted to better
understand the context of the current allocation methodology and approach for distributing funds.
DOH provided key historical documents and context through several meetings, as well as arranged
for a meeting of several stakeholders who have participated in the development of prior
methodologies and/or who are currently participating in Florida’s Ryan White Part B program. In
addition, the stakeholder group provided valuable feedback for consideration in the development of
a new allocation methodology.
L E A D A G E N C I E S
Current allocations for Ryan White Part B and state matching funds are distributed through two
separate processes based on the type of the lead agency receiving the funding. The Ryan White
grant funding timeframe is April 1 through March 31.
Non-Governmental (Contract) Lead Agencies
Non-governmental lead agencies have a three-year contract with DOH and receive a fixed
aggregate amount of Part B funds for the area based on historic funding levels. The lead agency is
paid a set portion of the allocation to support its own activities. The remaining allocation is budgeted
to each county within its area and set aside for subcontracts with health care and service providers.
The lead agency invoices DOH monthly for the services and supports delivered to eligible
individuals in the area. Patient care contracts are on a grant year (July 1 through June 30) using
funding allocation percentages of 25%/75% (25% is distributed April 1 through June 30 and 75% is
distributed July 1 through March 31). The lead agency may request an advance of up to one-twelfth
of the total annual contract. Recoupment is made by reducing the monthly invoice payment for the
last three months of the year by one-third of the advance payment amount. All other monthly invoice
payments are for the actual costs. Data regarding expenditures is submitted to DOH through the
CareWare process.
Governmental Lead Agencies (County Health Departments)
Governmental Lead Agencies are county health departments (CHDs), which are part of DOH. The
lead agency develops budgets for each county in its area. Funds are then distributed directly from
DOH to each county in the area through the Schedule C process, as well as funding provider
contracts that are not affiliated with county health departments. The program office begins reviewing
allocations for CHDs beginning December 1 with final funding allocations entered into the Schedule
C system by March 31. Data regarding expenditures is submitted to the Department through the
CareWare process. All lead agencies and county health departments provide budgets annually.

A L L O C A T I O N M E T H O D O L O G Y O P T I O N S F O R F L O R I D A R Y A N W H I T E P A R T B A N D M A T C H I N G S T A T E
F L O R I D A D E P A R T M E N T O F H E A L T H
8
C U R R E N T A L L O C A T I O N D E V E L O P M E N T
The HIV/AIDS Section establishes allocation amounts primarily based on historic allocation levels to
ensure stability of funding. These historical allocation amounts reflect adjustments to the base
amounts established under a 2002 methodology, which is described further below. However, DOH
has undertaken continuous efforts to achieve a more equitable distribution of HIV/AIDS funding
statewide. For example, in cases where allocation adjustments have been requested, DOH has
considered the following factors in determining whether to approve adjustments: guidance in
cooperative agreements with federal partners, comprehensive planning and priority setting at the
local level, data on disease incidence, local needs/requests and utilization of existing funds and
other funding available in the area.
Monitoring
The lead agencies are responsible for monitoring the expenditure of funds, ensuring they are spent
on allowable services and supports and are expended at an appropriate rate. DOH also has a
responsibility to ensure that funds are spent in a timely manner and that any excess funds are
expended appropriately.
Unspent Funds
The lead agency works with the consortia, which have responsibility in ensuring funds are spent
most efficiently and assist in redeploying services to best meet the needs of the local community. If
an area is not expending funds at the projected level, DOH can reallocate funds across areas
through a contract amendment process (non-governmental lead agencies) or through a revision to
Schedule C (governmental providers).
The HIV/AIDS Section of DOH monitors the expenditure dollars compared to allocated dollars
regularly throughout each grant year. DOH has set a target for each area to spend 99% of its
allocation. DOH has identified a need to develop a more efficient process to ensure that unspent
funds are reallocated in a timely and efficient fashion.
The table below illustrates the Part B and GR amounts allocated to and expended by each area in
Fiscal Year (FY) 2017–2018.
T A B L E 3
2 0 1 7 / 2 0 1 8 G E N E R A L R E V E N U E A N D P A R T B
A L L O C A T I O N S V S E X P E N D I T U R E S
Area Allocations Expenditures % of Allocated Money
Spent
Pensacola (Area 1) $1,585,236 $1,442,196 91%
Panama City (Area 2A) $632,276 $594,153 94%
Tallahassee (Area 2B) $1,255,177 $1,251,002 100%

A L L O C A T I O N M E T H O D O L O G Y O P T I O N S F O R F L O R I D A R Y A N W H I T E P A R T B A N D M A T C H I N G S T A T E
F L O R I D A D E P A R T M E N T O F H E A L T H
9
2 0 1 7 / 2 0 1 8 G E N E R A L R E V E N U E A N D P A R T B
A L L O C A T I O N S V S E X P E N D I T U R E S
Gainesville (Area 3/13) $3,450,601 $2,982,855 86%
Jacksonville (Area 4) $2,135,681 $1,787,122 84%
Tampa (Area 5/6/14) $4,936,419 $4,252,457 86%
Orlando (Area 7) $2,364,310 $1,936,881 82%
Ft. Myers (Area 8) $2,727,412 $2,658,493 97%
Palm Beach (Area 9) $2,159,782 $1,919,378 89%
Ft. Lauderdale (Area 10) $3,481,929 $3,354,574 96%
Miami (Area 11A) $988,944 $422,607 43%
Key West (Area 11B) $1,110,868 $737,159 66%
Daytona Beach (Area 12) $2,034,598 $1,658,167 81%
Ft. Pierce (Area 15) $2,924,167 $2,621,317 90%
Statewide Total $31,787,400 $27,618,358 87%
*Source: Allocations and expenditures provided by the Florida Department of Health.
*General revenue represents CAT 050028 funding only, and is on a state fiscal year basis.
*Part B funds are PTC and PTO funds, and reported expenditures are on a grant year basis.
As can be seen in the table above, 13 out of 14 areas did not spend at least 99% of their allocation
by the end of the year. It is possible that timing differences account for some portion of unspent
funds, but these results suggest some opportunity for process improvement to ensure that available
funds are used to provide needed services.
Excess Funds
In FY 2017–2018, there were excess funds available at the departmental level related to higher than
anticipated drug rebates that were carried forward from the previous year. In this case, DOH asked
the consortia to prepare proposals to request additional funds that could be used to support
recurring and non-recurring activities. The excess funds were then allocated to the consortia based
on those requests. DOH has identified a need to develop a more efficient process to ensure that
excess funds are spent in a timely manner.
H I S T O R I C A L A L L O C A T I O N D E V E L O P M E N T
As noted above, the current methodology relies heavily on adjusting prior allocation amounts, which
were established many years ago. In 2002, a group of stakeholders presented DOH with a
proposed methodology for determining the allocation of Ryan White Part B and state matching
A L L O C A T I O N M E T H O D O L O G Y O P T I O N S F O R F L O R I D A R Y A N W H I T E P A R T B A N D M A T C H I N G S T A T E
F L O R I D A D E P A R T M E N T O F H E A L T H
10
funds to address funding disparities among regions.2 Under this approach, the amount of HIV/AIDS
funding from various sources — including Ryan White Title I (now Part A), Title II (now Part B), Title
III (now Part C), Title IV (now Part D), Emerging Communities, Minority AIDS Initiative and ADAP,
as well as related general revenue funding — was calculated for each area. An average amount per
person in each area was calculated by dividing the total HIV/AIDS funding by the number of
individuals living with HIV or living with HIV/AIDS. This average amount per person for each area
was compared to identify disparities in funding across areas. This parity analysis informed the
allocation of future funds that were in excess of the prior year’s funding. Namely, each area received
the same amount of Ryan White Part B/state matching funds as in the prior year. In addition, each
area received an additional allocation of $45,000. The excess funds left after distributing the
$45,000 were allocated to the areas with disproportionately low per-person averages to improve
their comparability in per-person funding statewide. Table 4 on the following page illustrates the
original parity analysis.
2 Please note: in 2002, Ryan White Part B funds were referred to as Ryan White Title II.

A L L O C A T I O N M E T H O D O L O G Y O P T I O N S F O R F L O R I D A R Y A N W H I T E P A R T B A N D M A T C H I N G S T A T E
F L O R I D A D E P A R T M E N T O F H E A L T H
11
T A B L E 4
A R E A C U M U L A T I V E
L I V I N G
H I V / A I D S
C A S E S T H R U
1 / 3 1 / 2 0 0 2
% O F
C A S E S
2 0 0 1 - 2 0 0 2
C U R R E N T
T O T A L S
A M O U N T
O F 2 0 0 2 –
2 0 0 3
I N C R E A S E
2 0 0 2 - 2 0 0 3
A L L O C A T I O N
% O F
F U N D I N G
% O F
P A R I T Y
A C H I E V E D
2 0 0 3 - 2 0 0 4
A L L O C A T I O N
% O F
F U N D I N G
Pensacola 977 1.63% $2,650,356 $219,414 $2,869,770 1.39% 86% $2,869,770 1.39%
Panama City 254 0.42% $903,081 $45,000 $984,081 0.46% 109% $948,081 0.46%
Tallahassee 576 0.96% $2,126,055 $45,000 $2,171,055 1.05% 110% $2,171,055 1.05%
Gainesville 1,341 2.23% $4,383,548 $45,000 $4,428,548 2.15% 96% $4,428,548 2.15%
Jacksonville 3,662 6.10% $12,682,338 $45,000 $12,727,338 6.17% 101% $12,727,338 6.17%
Tampa 7,976 13.29% $26,959,112 $45,000 $27,004,112 13.10% 99% $27,004,112 13.10%
Orlando 6,164 10.27% $18,147,369 $55,849 $18,203,218 8.83% 86% $18,203,218 8.83%
Ft. Myers 2,348 3.91% $7,040,979 $45,000 $7,085,979 3.44% 88% $7,085,979 3.44%
Palm Beach 5,718 9.53% $20,924,329 $45,000 $20,969,329 10.17% 107% $20,969,329 10.17%
Ft. Lauderdale 10,022 16.70% $40,179,981 $45,000 $40,224,981 19.51% 117% $40,224,981 19.51%
Miami 17,720 29.53% $59,914,259 $45,000 $59,959,259 29.09% 98% $59,959,259 29.09%
Key West 662 1.10% $2,165,562 $75,000 $2,210,562 1.07% 97% $2,210,562 1.07%
Daytona Beach 946 1.58% $2,000,698 $521,270 $2,521,968 1.22% 78% $2,778,713 1.35%
Ft. Pierce 1,640 2.73% $4,720,498 $96,722 $4,817,220 2.34% 86% $4,817,220 2.34%
2001–2002
Total
60,006 100.0% $204,798,165 $1,373,255 $206,141,420 100.0% 100% $206,398,165 100.12%
WITH 2002–2003 INCREASE $206,398,165

A L L O C A T I O N M E T H O D O L O G Y O P T I O N S F O R F L O R I D A R Y A N W H I T E P A R T B A N D M A T C H I N G S T A T E
F L O R I D A D E P A R T M E N T O F H E A L T H
12
The following narrative further describes the workgroup’s recommendation for the methodology.
2002 Allocation Recommendations:
– Every area receives a minimum of $45,000.
– Remaining balance is distributed to bring the greatest amount of parity to all areas.
– After parity distribution, any remaining funds will be given to Area 7 — Orlando on a
recurring basis ($10,849).
– Any area eligible for more than $245,000 has their allocation pro-rated to 8 months for FY
2002–2003 with the full amount allocated in FY 2003–2004. (This applies only to Area 12 —
Daytona Beach. That area will receive $521,270 in FY 2002–2003 and $778,015 in FY
2003–2004).
– The Bureau of HIV/AIDS will present its recommendation of where to allocate the balance
remaining from the prorated allocation before (missing word). via conference call prior to the
August FCPG meeting. ($256,745 from Area 12 — Daytona Beach)
The workgroup also discussed priorities in determining how to revise allocation amounts in the
event of funding reductions, which included activities such as limiting new client entry and
increasing efforts to pursue payments from third-party insurers.
O B S E R V A T I O N S R E G A R D I N G C U R R E N T M E T H O D O L O G Y
The current allocation methodology has, to a large extent, carried forward results from the analysis
conducted many years ago. While the stakeholder community worked diligently to develop and
agree to the methodology, the state of the disease was very different at that time and
epidemiological data was not as robust as it is today. Given these changes, it is valuable to assess
whether other allocation approaches or updated information may lead to more equitable distribution
of Part B and state matching funds.

A L L O C A T I O N M E T H O D O L O G Y O P T I O N S F O R F L O R I D A R Y A N W H I T E P A R T B A N D M A T C H I N G S T A T E
F L O R I D A D E P A R T M E N T O F H E A L T H
13
5 METHODOLOGY OPTIONS
Through review and analysis of the available data, Mercer identified methodology options for
consideration. We assessed these options relative to the goals defined by DOH, as well as
feedback received from stakeholders. This section describes the options considered and their
potential strengths and challenges. As presented, the options provide conceptual frameworks
illustrated by the best programmatic data available at the time of Mercer’s analysis. The values
shown throughout this section should not be interpreted as specific recommended allocations, as
more recent data may be available to support the development of final allocation amounts for
upcoming periods; however, the data as presented here illustrate the range of different results
produced by various options.
F O U N D A T I O N A L A N A L Y S E S
To understand the context of the current allocation process and to support the development of
methodology options, Mercer conducted several foundational analyses. First, Mercer replicated the
2002 historical allocation methodology described in Section 4 of this report with more recent data
and information. Second, Mercer developed a multi-year comparison of expenditures and
allocations for the Ryan White Part B and state matching funds.
Replication of Historical Allocation Methodology
In Section 4 of this report, Mercer described the methodology originally developed for allocating Part
B and associated state matching funds (referred to as the parity analysis). Mercer replicated this
historical methodology but updated the analysis with more current data and information. Specifically,
in the original methodology, available funding in each area was compared to the number of
individuals living with HIV or living with HIV/AIDS in that area. Since that time, the availability and
effectiveness of HIV/AIDS treatments have changed substantially and more robust epidemiological
data is also available. Given these changes, Mercer updated the parity analysis with more current
data, but modified the approach somewhat. Specifically, Mercer updated the numerator in the parity
analysis to reflect a more recent time period for the same or equivalent funding sources as were
used in the original parity analysis; however, we changed the denominator to reflect the most
recently available number of people living with HIV (PLWH) in each area.
Table 6 on the following page illustrates the amount of HIV funding available per person in each
area for FY 2017–2018 including the same funding sources utilized in the original methodology
including Ryan White Part A, Part B, Part C, Part D, Emerging Communities, Minority AIDS Initiative
and ADAP, as well as related general revenue funding. Note: ADAP funds used to directly
reimburse providers by the State office and the remaining funds are distributed to local agencies to
reimburse providers or to provide services directly.

A L L O C A T I O N M E T H O D O L O G Y O P T I O N S F O R F L O R I D A R Y A N W H I T E P A R T B A N D M A T C H I N G S T A T E
F L O R I D A D E P A R T M E N T O F H E A L T H
14
T A B L E 5 : P A R I T Y M O D E L U P D A T E D F O R 2 0 1 7 – 2 0 1 8
A R E A
P E R S O N S
L I V I N G
W I T H H I V
( P L W H )
% O F
C A S E S
T O T A L
F U N D S
( P A R T S
A – D , G R )
% O F
F U N D I N G
A M O U N T
P E R
P L W H
% O F
P A R I T Y
A C H I E V E D
Pensacola
(Area 1)
2,215 1.89% $3,870,686 1.78% $1,747.49 94%
Panama City
(Area 2A)
1,233 1.05% $1,401,275 0.65% $1,136.48 61%
Tallahassee
(Area 2B)
2,255 1.93% $3,652,105 1.68% $1,619.56 87%
Gainesville
(Area 3/13)
5,183 4.43% $8,418,583 3.88% $1,624.27 88%
Jacksonville
(Area 4)
7,446 6.37% $12,533,771 5.78% $1,683.29 91%
Tampa (Area
5/6/14)
17,598 15.05% $30,856,714 14.22% $1,753.42 94%
Orlando (Area
7)
13,531 11.57% $20,318,589 9.36% $1,501.63 81%
Ft. Myers (Area
8)
5,030 4.30% $7,640,043 3.52% $1,518.90 82%
Palm Beach
(Area 9)
8,488 7.26% $16,718,627 7.70% $1,969.68 106%
Ft. Lauderdale
(Area 10)
20,661 17.67% $49,485,851 22.80% $2,395.13 129%
Miami (Area
11A)
27,969 23.92% $51,174,869 23.58% $1,829.70 99%
Key West (Area
11B)
648 0.55% $2,953,835 1.36% $4,558.39 246%
Daytona Beach
(Area 12)
2,059 1.76% $3,441,171 1.59% $1,671.28 90%
Ft. Pierce (Area
15)
2,628 2.25% $4,554,648 2.10% $1,733.12 93%
Statewide
Total
116,944 100.00% $217,020,766 100.00% $1,855.77 100%
*Source: Data provided by the Florida Department of Health and the U.S. Department of Health and Human Services Health Resources and Services Administration (HRSA). *General revenue figures include CAT 050028 (Patient Care) and CAT 050329 (Prevention and Surveillance). *Part B PTO & PTC, Emerging Communities, and MAI fund allocations provided by DOH. Part B ADAP funds are the HRSA 2017 total for Florida, allocated based on the proportion of ADAP enrollees receiving copay assistance, as provided by DOH.

A L L O C A T I O N M E T H O D O L O G Y O P T I O N S F O R F L O R I D A R Y A N W H I T E P A R T B A N D M A T C H I N G S T A T E
F L O R I D A D E P A R T M E N T O F H E A L T H
15
As can be seen in this table, funding per area ranges from $1,136 per person in Area 2A to $4,558
in Area 11B with the average reimbursement per person of $1,855.77. Three regions were 15% or
more below the statewide average while two regions were greater than 15% above the average. In
the original parity analysis in 2001–2002, new funds were available and used to improve funding for
the lowest funding areas. As a point of comparison, Mercer calculated that funding a floor of total
allocation per PLWH of $1,600 (86% of statewide average) would require approximately $2.3 million
annually and result in increased funding for three areas. Bringing all regions lower than the average
up to the statewide average, however, would require approximately $13.9 million annually and
increase funding for 11 areas. In an environment without new funding availability, improved funding
for the areas with the lowest per capita funding requires shifting funds from other areas.
Historical Allocations Versus Expenditures
In addition to updating the parity analysis, Mercer compared Part B and GR Patient Care (matching
funds) expenditure and allocation data across the areas for the two years for which data were
readily available. This analysis identified areas in which most allocated dollars were expended as
well as where expenditures were notably less than allocations. It is possible that timing differences
account for some portion of unspent funds, but these results suggest that areas that have
historically not spent their full allocation may provide a source of funds to mitigate observed parity
differences.

A L L O C A T I O N M E T H O D O L O G Y O P T I O N S F O R F L O R I D A R Y A N W H I T E P A R T B A N D M A T C H I N G S T A T E
F L O R I D A D E P A R T M E N T O F H E A L T H
16
T A B L E 6 : P A T I E N T C A R E G E N E R A L R E V E N U E A N D P A R T B P T O & P T C F U N D I N G
C O M P A R I S O N O F E X P E N D I T U R E S T O A L L O C A T I O N
Area
Allocation
2016–2017
Expenditures
2016–2017
2016–2017
% Allocation
Spent
Allocation
2017–2018
Expenditures
2017–2018
2017–2018
% Allocation
Spent
Average
Annual
Allocation
Average
Annual
Expenditures
% of
Allocation
Spent Over 2
Years
Difference
(Areas < 99%)
Pensacola
(Area 1)
$1,592,736 $1,399,435 88% $1,585,236 $1,442,196 91% $1,588,986 $1,420,815 89.4% $168,171
Panama City
(Area 2A)
$658,276 $635,175 96% $632,276 $594,153 94% $645,276 $614,664 95.3% $30,612
Tallahassee
(Area 2B)
$1,290,177 $1,252,118 97% $1,255,177 $1,251,002 100% $1,272,677 $1,251,560 98.3% $21,117
Gainesville
(Area 3/13)
$3,450,601 $3,071,111 89% $3,450,601 $2,982,855 86% $3,450,601 $3,026,983 87.7% $423,618
Jacksonville
(Area 4)
$2,183,336 $1,942,205 89% $2,135,681 $1,787,122 84% $2,159,509 $1,864,663 86.3% $294,845
Tampa (Area
5/6/14)
$4,547,060 $4,268,741 94% $4,936,419 $4,252,457 86% $4,741,740 $4,260,599 89.9% $481,141
Orlando
(Area 7)
$2,364,310 $1,984,203 84% $2,364,310 $1,936,881 82% $2,364,310 $1,960,542 82.9% $403,768
Ft. Myers
(Area 8)
$2,727,423 $2,368,769 87% $2,727,412 $2,658,493 97% $2,727,418 $2,513,631 92.2% $213,787
Palm Beach
(Area 9)
$2,160,089 $ 1,988,263 92% $2,159,782 $1,919,378 89% $2,159,936 $1,953,821 90.5% $206,115

A L L O C A T I O N M E T H O D O L O G Y O P T I O N S F O R F L O R I D A R Y A N W H I T E P A R T B A N D M A T C H I N G S T A T E
F L O R I D A D E P A R T M E N T O F H E A L T H
17
C O M P A R I S O N O F E X P E N D I T U R E S T O A L L O C A T I O N
Area
Allocation
2016–2017
Expenditures
2016–2017
2016–2017
% Allocation
Spent
Allocation
2017–2018
Expenditures
2017–2018
2017–2018
% Allocation
Spent
Average
Annual
Allocation
Average
Annual
Expenditures
% of
Allocation
Spent Over 2
Years
Difference
(Areas < 99%)
Ft.
Lauderdale
(Area 10)
$3,481,929 $3,389,546 97% $3,481,929 $3,354,574 96% $ 3,481,929 $3,372,060 96.8% $109,869
Miami (Area
11A)
$947,972 $820,043 87% $988,944 $422,607 43% $968,458 $621,325 64.2% $347,133
Key West
(Area 11B)
$1,110,868 $1,105,787 100% $1,110,868 $737,159 66% $1,110,868 $921,473 83.0% $189,395
Daytona
Beach (Area
12)
$2,034,597 $1,455,469 72% $2,034,598 $1,658,167 81% $2,034,598 $1,556,818 76.5% $477,780
Ft. Pierce
(Area 15)
$3,091,243 $2,880,461 93% $2,924,167 $2,621,317 90% $3,007,705 $2,750,889 91.5% $256,816
Statewide
Total
$31,640,617 $28,561,324 90% $31,787,400 $27,618,358 87% $31,714,009 $28,089,841 88.6% $3,624,167
*Source: Allocations and expenditures provided by the Florida Department of Health. *General revenue represents CAT 050028 funding only, and is on a state fiscal year basis. *Part B funds are PTC and PTO funds, and reported expenditures are on a grant year basis

A L L O C A T I O N M E T H O D O L O G Y O P T I O N S F O R F L O R I D A R Y A N W H I T E P A R T B A N D M A T C H I N G S T A T E
F L O R I D A D E P A R T M E N T O F H E A L T H
18
T A B L E 7 - P A T I E N T C A R E G E N E R A L R E V E N U E A N D P A R T B P T O & P T C F U N D I N G
C O M P A R I S O N O F E X P E N D I T U R E S T O A L L O C A T I O N
Area
Allocation
2016–2017
Expenditures
2016–2017
2016–2017
% Allocation
Spent
Allocation
2017–2018
Expenditures
2017–2018
2017–2018
% Allocation
Spent
Average
Annual
Allocation
Average
Annual
Expenditures
% of
Allocation
Spent Over 2
Years
Difference
(Areas < 99%)
Pensacola
(Area 1)
$1,592,736 $1,399,435 88% $1,585,236 $1,442,196 91% $1,588,986 $1,420,815 89.4% $168,171
Panama City
(Area 2A)
$658,276 $635,175 96% $632,276 $594,153 94% $645,276 $614,664 95.3% $30,612
Tallahassee
(Area 2B)
$1,290,177 $1,252,118 97% $1,255,177 $1,251,002 100% $1,272,677 $1,251,560 98.3% $21,117
Gainesville
(Area 3/13)
$3,450,601 $3,071,111 89% $3,450,601 $2,982,855 86% $3,450,601 $3,026,983 87.7% $423,618
Jacksonville
(Area 4)
$2,183,336 $1,942,205 89% $2,135,681 $1,787,122 84% $2,159,509 $1,864,663 86.3% $294,845
Tampa (Area
5/6/14)
$4,547,060 $4,268,741 94% $4,936,419 $4,252,457 86% $4,741,740 $4,260,599 89.9% $481,141
Orlando (Area
7)
$2,364,310 $1,984,203 84% $2,364,310 $1,936,881 82% $2,364,310 $1,960,542 82.9% $403,768
Ft. Myers
(Area 8)
$2,727,423 $2,368,769 87% $2,727,412 $2,658,493 97% $2,727,418 $2,513,631 92.2% $213,787
Palm Beach
(Area 9)
$2,160,089 $ 1,988,263 92% $2,159,782 $1,919,378 89% $2,159,936 $1,953,821 90.5% $206,115
Ft.
Lauderdale
(Area 10)
$3,481,929 $3,389,546 97% $3,481,929 $3,354,574 96% $ 3,481,929 $3,372,060 96.8% $109,869

A L L O C A T I O N M E T H O D O L O G Y O P T I O N S F O R F L O R I D A R Y A N W H I T E P A R T B A N D M A T C H I N G S T A T E
F L O R I D A D E P A R T M E N T O F H E A L T H
19
C O M P A R I S O N O F E X P E N D I T U R E S T O A L L O C A T I O N
Area
Allocation
2016–2017
Expenditures
2016–2017
2016–2017
% Allocation
Spent
Allocation
2017–2018
Expenditures
2017–2018
2017–2018
% Allocation
Spent
Average
Annual
Allocation
Average
Annual
Expenditures
% of
Allocation
Spent Over 2
Years
Difference
(Areas < 99%)
Miami (Area
11A)
$947,972 $820,043 87% $988,944 $422,607 43% $968,458 $621,325 64.2% $347,133
Key West
(Area 11B)
$1,110,868 $1,105,787 100% $1,110,868 $737,159 66% $1,110,868 $921,473 83.0% $189,395
Daytona
Beach (Area
12)
$2,034,597 $1,455,469 72% $2,034,598 $1,658,167 81% $2,034,598 $1,556,818 76.5% $477,780
Ft. Pierce
(Area 15)
$3,091,243 $2,880,461 93% $2,924,167 $2,621,317 90% $3,007,705 $2,750,889 91.5% $256,816
Statewide
Total
$31,640,617 $28,561,324 90% $31,787,400 $27,618,358 87% $31,714,009 $28,089,841 88.6% $3,624,167
*Source: Allocations and expenditures provided by the Florida Department of Health. *General revenue represents CAT 050028 funding only, and is on a state fiscal year basis. *Part B funds are PTC and PTO funds, and reported expenditures are on a grant year basis.

A L L O C A T I O N M E T H O D O L O G Y O P T I O N S F O R F L O R I D A R Y A N W H I T E P A R T B A N D M A T C H I N G S T A T E
F L O R I D A D E P A R T M E N T O F H E A L T H
20
In the most recent year, 9 of the areas spent less than 90% of their annual allocation. Results were
similar when Mercer examined general revenue and Part B separately, although the mix of areas
below 90% varies somewhat by funding source. It should be noted that there is overlap between the
areas with the lowest per-person allocation and the areas with the lowest expenditure versus
allocation. The three lowest-funded areas shown in Table 7 are Areas 2A, 7, and 8. Of those three,
none spent 99% of the GR and Part B funds allocated, and Area 7 spent below 90% in both years
examined.
A L L O C A T I O N M E T H O D O L O G Y O P T I O N S
Based on the findings of the analyses described above, Mercer presents several methodology
options for consideration.
• Option 1: Allocate Funds Based on Number of PLWH in Each Area
• Option 2: Allocate Funds Based on Historical Expenditures and Parity
• Option 3: Allocate Funds Based on Historical Expenditures, Parity and Performance
Each option has strengths and potential challenges, which we have highlighted in each section.
Option 1: Allocate Funds Based on Number of PLWH in Each Area
To calculate the amount of Part B dollars for each state, HRSA’s methodology allocates funds
based on the number of PLWH in each state. Mercer evaluated the option of using a parallel
methodology and distributing Part B and associated state matching funds by the number of PLWH
in each area.
The following table illustrates how allocation amounts in FY 2018–2019 would change if the funds
were allocated based on PLWH in each area.
T A B L E 8
O P T I O N 1 : A L L O C A T E B Y P L W H D I S T R I B U T I O N
Includes Patient Care General Revenue + Ryan White Part B PTC and PTO Funds
Alt Local
Area
2017–2018
Allocation
2017 PLWH Allocation
per PLWH
Proportional
Allocation
Proportional
Allocation
per PLWH
Change
from Current
— Dollars
Change
from Current
—
Percentage
Pensacola
(Area 1)
$1,585,236 2,215 $716 $602,075 $272 -$983,161 -62.0%
Panama City
(Area 2A)
$632,276 1,233 $513 $335,151 $272 -$297,125 -47.0%

A L L O C A T I O N M E T H O D O L O G Y O P T I O N S F O R F L O R I D A R Y A N W H I T E P A R T B A N D M A T C H I N G S T A T E
F L O R I D A D E P A R T M E N T O F H E A L T H
21
O P T I O N 1 : A L L O C A T E B Y P L W H D I S T R I B U T I O N
Includes Patient Care General Revenue + Ryan White Part B PTC and PTO Funds
Alt Local
Area
2017–2018
Allocation
2017 PLWH Allocation
per PLWH
Proportional
Allocation
Proportional
Allocation
per PLWH
Change
from Current
— Dollars
Change
from Current
—
Percentage
Tallahassee
(Area 2B)
$1,255,177 2,255 $557 $612,948 $272 -$642,229 -51.2%
Gainesville
(Area 3/13)
$3,450,601 5,183 $666 $1,408,829 $272 -$2,041,772 -59.2%
Jacksonville
(Area 4)
$2,135,681 7,446 $287 $2,023,951 $272 -$111,730 -5.2%
Tampa (Area
5/6/14)
$4,936,419 17,598 $281 $4,783,440 $272 -$152,979 -3.1%
Orlando
(Area 7)
$2,364,310 13,531 $175 $3,677,960 $272 $1,313,650 55.6%
Ft. Myers
(Area 8)
$2,727,412 5,030 $542 $1,367,241 $272 -$1,360,171 -49.9%
Palm Beach
(Area 9)
$2,159,782 8,488 $254 $2,307,185 $272 $147,403 6.8%
Ft.
Lauderdale
(Area 10)
$3,481,929 20,661 $169 $5,616,017 $272 $2,134,088 61.3%
Miami (Area
11A)
$988,944 27,969 $35 $7,602,458 $272 $6,613,514 668.7%
Key West
(Area 11B)
$1,110,868 648 $1,714 $176,138 $272 -$934,730 -84.1%
Daytona
Beach (Area
12)
$2,034,598 2,059 $988 $559,672 $272 -$1,474,926 -72.5%
Ft. Pierce
(Area 15)
$2,924,167 2,628 $1,113 $714,336 $272 -$2,209,831 -75.6%
Statewide
Total
$31,787,400 116,944 $272 $31,787,400 $272 $0 0.0%
*Source: Mercer analysis of data provided by Florida DOH
As illustrated above, allocating funds solely based on the number of PLWH in each area results in
significant changes in funding per areas.

A L L O C A T I O N M E T H O D O L O G Y O P T I O N S F O R F L O R I D A R Y A N W H I T E P A R T B A N D M A T C H I N G S T A T E
F L O R I D A D E P A R T M E N T O F H E A L T H
22
Potential Strengths of Option 1
Option 1 is the most straightforward calculation and is consistent with the approach used by HRSA
in allocating Part B funds to the states. In this way, Option 1 meets DOH’s goal of transparency.
This approach is also budget neutral and would be flexible in adapting to changes in overall funding,
as any additional funds would be allocated proportionately based on the number of PLWH in each
area.
Potential Challenges of Option 1
This approach has several key potential challenges. As demonstrated in the table above, the
approach significantly changes allocations across the areas. Significant changes in funding across
areas will impact the business practices and staffing levels in each area. For example, areas
experiencing significant reductions in funding may need to lay off staff or reduce available programs
and services. There are, however, options for mitigating more significant changes through a phase-
in of the new methodology over time, if this approach were implemented.
While the Option 1 approach is straightforward, it does not consider the availability of other funding
sources when distributing Part B dollars. Most significantly, this methodology concentrates Part B
funding in major metropolitan areas because the population of PLWH is greater; however, these
areas also receive significant Ryan White Part A funding that is not available in non-metropolitan
areas. Using the methodology of distributing funds solely based on the number of PLWH, the
following table demonstrates a widening of the disparity between Part A and non-Part A areas.
T A B L E 9
2 0 1 7 - 1 8 P A R I T Y A N A L Y S I S W I T H P R O P O R T I O N A L ( P L W H ) D I S T R I B U T I O N O F P A T I E N T
C A R E G E N E R A L R E V E N U E A N D P A R T B P T O A N D P T C F U N D S
Area 2017–2018
Allocation
GR + Parts
A-D
2017 PLWH Total Funds
per PLWH
% of Parity
Achieved
Proportional
Allocation
Proportional
Allocation
per PLWH
% of Parity
Achieved
Pensacola
(Area 1)
$3,870,686 2,215 $1,747.49 94.20% $2,887,525 $1,303.62 70.20%
Panama City
(Area 2A)
$1,401,275 1,233 $1,136.48 61.20% $1,104,150 $895.50 48.30%
Tallahassee
(Area 2B)
$3,652,105 2,255 $1,619.56 87.30% $3,009,876 $1,334.76 71.90%
Gainesville
(Area 3/13)
$8,418,583 5,183 $1,624.27 87.50% $6,376,811 $1,230.33 66.30%
Jacksonville
(Area 4)
$12,533,771 7,446 $1,683.29 90.70% $12,422,041 $1,668.28 89.90%
A L L O C A T I O N M E T H O D O L O G Y O P T I O N S F O R F L O R I D A R Y A N W H I T E P A R T B A N D M A T C H I N G S T A T E
F L O R I D A D E P A R T M E N T O F H E A L T H
23
2 0 1 7 - 1 8 P A R I T Y A N A L Y S I S W I T H P R O P O R T I O N A L ( P L W H ) D I S T R I B U T I O N O F P A T I E N T
C A R E G E N E R A L R E V E N U E A N D P A R T B P T O A N D P T C F U N D S
Area 2017–2018
Allocation
GR + Parts
A-D
2017 PLWH Total Funds
per PLWH
% of Parity
Achieved
Proportional
Allocation
Proportional
Allocation
per PLWH
% of Parity
Achieved
Tampa (Area
5/6/14)
$30,856,714 17,598 $1,753.42 94.50% $30,703,735 $1,744.73 94.00%
Orlando (Area
7)
$20,318,589 13,531 $1,501.63 80.90% $21,632,239 $1,598.72 86.10%
Ft. Myers
(Area 8)
$7,640,043 5,030 $1,518.90 81.80% $6,279,872 $1,248.48 67.30%
Palm Beach
(Area 9)
$16,718,627 8,488 $1,969.68 106.10% $16,866,030 $1,987.04 107.10%
Ft. Lauderdale
(Area 10)
$49,485,851 20,661 $2,395.13 129.10% $51,619,939 $2,498.42 134.60%
Miami (Area
11A)
$51,174,869 27,969 $1,829.70 98.60% $57,788,383 $2,066.16 111.30%
Key West
(Area 11B)
$2,953,835 648 $4,558.39 245.60% $2,019,104 $3,115.90 167.90%
Daytona Beach
(Area 12)
$3,441,171 2,059 $1,671.28 90.10% $1,966,245 $954.95 51.50%
Ft. Pierce
(Area 15)
$4,554,648 2,628 $1,733.12 93.40% $2,344,817 $892.24 48.10%
Statewide
Total
$217,020,766 116,944 $1,855.77 100.00% $217,020,766 $1,855.77 100.00%
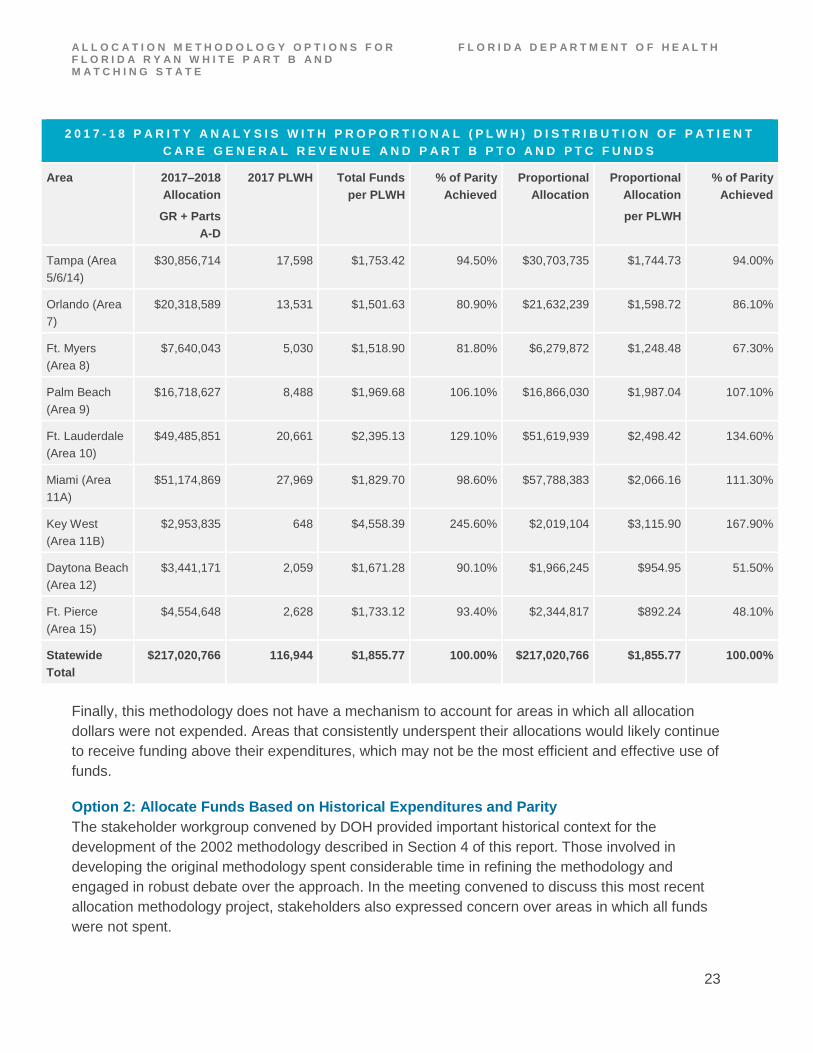
Finally, this methodology does not have a mechanism to account for areas in which all allocation
dollars were not expended. Areas that consistently underspent their allocations would likely continue
to receive funding above their expenditures, which may not be the most efficient and effective use of
funds.
Option 2: Allocate Funds Based on Historical Expenditures and Parity
The stakeholder workgroup convened by DOH provided important historical context for the
development of the 2002 methodology described in Section 4 of this report. Those involved in
developing the original methodology spent considerable time in refining the methodology and
engaged in robust debate over the approach. In the meeting convened to discuss this most recent
allocation methodology project, stakeholders also expressed concern over areas in which all funds
were not spent.

A L L O C A T I O N M E T H O D O L O G Y O P T I O N S F O R F L O R I D A R Y A N W H I T E P A R T B A N D M A T C H I N G S T A T E
F L O R I D A D E P A R T M E N T O F H E A L T H
24
Given the time and thoughtfulness dedicated to the original process and the most recent concerns
regarding unspent funds, Mercer analyzed an option of replicating the original parity analysis with
more recent data and information and using that analysis to allocate historically unspent funds and
any new funds, as applicable.
Under this approach, DOH would first calculate each area’s three-year average expenditures versus
allocations. (Mercer recommends a three-year average to provide consideration for areas that may
have had anomalous results in any one year.) DOH has an established benchmark of 99%,
meaning each area should spend 99% of its allocation. For those areas in which the three-year
average expenditure-to-allocation ratio is less than 99%, amounts under the benchmark are set
aside for reallocation in the next step. Please note, however, that no area would receive an
allocation less than the prior year’s expenditure.
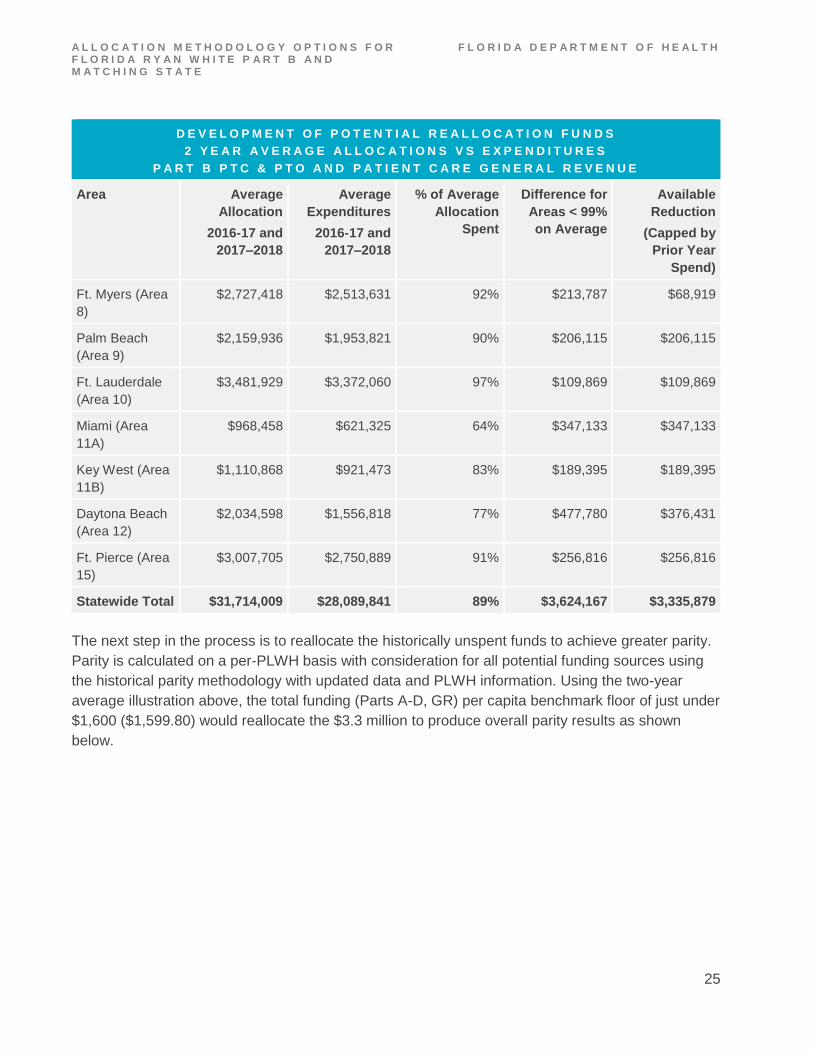
The following table includes a comparison of Part B and GR allocations and expenditures in 2016–
2017 and 2017–2018 illustrating this approach with a two-year average to reflect data that were
readily available at the time of this analysis.
T A B L E 1 0
D E V E L O P M E N T O F P O T E N T I A L R E A L L O C A T I O N F U N D S
2 Y E A R A V E R A G E A L L O C A T I O N S V S E X P E N D I T U R E S
P A R T B P T C & P T O A N D P A T I E N T C A R E G E N E R A L R E V E N U E
Area Average
Allocation
2016-17 and
2017–2018
Average
Expenditures
2016-17 and
2017–2018
% of Average
Allocation
Spent
Difference for
Areas < 99%
on Average
Available
Reduction
(Capped by
Prior Year
Spend)
Pensacola (Area
1)
$1,588,986 $1,420,815 89% $168,171 $143,040
Panama City
(Area 2A)
$645,276 $614,664 95% $30,612 $30,612
Tallahassee
(Area 2B)
$1,272,677 $1,251,560 98% $21,117 $4,175
Gainesville
(Area 3/13)
$3,450,601 $3,026,983 88% $423,618 $423,618
Jacksonville
(Area 4)
$2,159,509 $1,864,663 86% $294,845 $294,845
Tampa (Area
5/6/14)
$4,741,740 $4,260,599 90% $481,141 $481,141
Orlando (Area
7)
$2,364,310 $1,960,542 83% $403,768 $403,768
A L L O C A T I O N M E T H O D O L O G Y O P T I O N S F O R F L O R I D A R Y A N W H I T E P A R T B A N D M A T C H I N G S T A T E
F L O R I D A D E P A R T M E N T O F H E A L T H
25
D E V E L O P M E N T O F P O T E N T I A L R E A L L O C A T I O N F U N D S
2 Y E A R A V E R A G E A L L O C A T I O N S V S E X P E N D I T U R E S
P A R T B P T C & P T O A N D P A T I E N T C A R E G E N E R A L R E V E N U E
Area Average
Allocation
2016-17 and
2017–2018
Average
Expenditures
2016-17 and
2017–2018
% of Average
Allocation
Spent
Difference for
Areas < 99%
on Average
Available
Reduction
(Capped by
Prior Year
Spend)
Ft. Myers (Area
8)
$2,727,418 $2,513,631 92% $213,787 $68,919
Palm Beach
(Area 9)
$2,159,936 $1,953,821 90% $206,115 $206,115
Ft. Lauderdale
(Area 10)
$3,481,929 $3,372,060 97% $109,869 $109,869
Miami (Area
11A)
$968,458 $621,325 64% $347,133 $347,133
Key West (Area
11B)
$1,110,868 $921,473 83% $189,395 $189,395
Daytona Beach
(Area 12)
$2,034,598 $1,556,818 77% $477,780 $376,431
Ft. Pierce (Area
15)
$3,007,705 $2,750,889 91% $256,816 $256,816
Statewide Total $31,714,009 $28,089,841 89% $3,624,167 $3,335,879
The next step in the process is to reallocate the historically unspent funds to achieve greater parity.
Parity is calculated on a per-PLWH basis with consideration for all potential funding sources using
the historical parity methodology with updated data and PLWH information. Using the two-year
average illustration above, the total funding (Parts A-D, GR) per capita benchmark floor of just under
$1,600 ($1,599.80) would reallocate the $3.3 million to produce overall parity results as shown
below.

A L L O C A T I O N M E T H O D O L O G Y O P T I O N S F O R F L O R I D A R Y A N W H I T E P A R T B A N D M A T C H I N G S T A T E
F L O R I D A D E P A R T M E N T O F H E A L T H
26
T A B L E 1 1
2 0 1 7 – 2 0 1 8 P A R I T Y A N A L Y S I S W I T H R E A L L O C A T I O N O F P A T I E N T C A R E G E N E R A L
R E V E N U E A N D P A R T B P T O A N D P T C F U N D S T O B A L A N C E U N D E R S P E N D I N G A N D
P A R I T Y
Area 2017-18
Allocation
GR + Parts A-
D
2017 PLWH Total
Funds per
PLWH
% of
Parity
Achieved
Option 2
Reallocation
Total
Funds per
PLWH
% of Parity
Achieved
Pensacola (Area
1)
$3,870,686 2,215 $1,747.49 94.20% $3,727,646 $1,682.91 90.70%
Panama City
(Area 2A)
$1,401,275 1,233 $1,136.48 61.20% $1,972,553 $1,599.80 86.20%
Tallahassee (Area
2B)
$3,652,105 2,255 $1,619.56 87.30% $3,647,929 $1,617.71 87.20%
Gainesville (Area
3/13)
$8,418,583 5,183 $1,624.27 87.50% $8,291,763 $1,599.80 86.20%
Jacksonville (Area
4)
$12,533,771 7,446 $1,683.29 90.70% $12,238,926 $1,643.69 88.60%
Tampa (Area
5/6/14)
$30,856,714 17,598 $1,753.42 94.50% $30,375,573 $1,726.08 93.00%
Orlando (Area 7) $20,318,589 13,531 $1,501.63 80.90% $21,646,893 $1,599.80 86.20%
Ft. Myers (Area 8) $7,640,043 5,030 $1,518.90 81.80% $8,046,994 $1,599.80 86.20%
Palm Beach (Area
9)
$16,718,627 8,488 $1,969.68 106.10% $16,512,512 $1,945.39 104.80%
Ft. Lauderdale
(Area 10)
$49,485,851 20,661 $2,395.13 129.10% $49,375,982 $2,389.82
128.80%
Miami (Area 11A) $51,174,869 27,969 $1,829.70 98.60% $50,827,736 $1,817.29 97.90%
Key West (Area
11B)
$2,953,835 648 $4,558.39 245.60% $2,764,440 $4,266.11 229.90%
Daytona Beach
(Area 12)
$3,441,171 2,059 $1,671.28 90.10% $3,293,988 $1,599.80 86.20%
Ft. Pierce (Area
15)
$4,554,648 2,628 $1,733.12 93.40% $4,297,832 $1,635.40 88.10%
Statewide Total $217,020,766 116,944 $1,855.77 100.00% $217,020,766 $1,855.77 100.00%

A L L O C A T I O N M E T H O D O L O G Y O P T I O N S F O R F L O R I D A R Y A N W H I T E P A R T B A N D M A T C H I N G S T A T E
F L O R I D A D E P A R T M E N T O F H E A L T H
27
Under this approach, areas 2A, 7, and 8 would receive additional funds to achieve greater parity,
while other areas would give up funds that had been underspent. However, no area would receive a
GR and Part B allocation lower than its prior year expenditures, and all areas would receive total
funding per capita at or above the benchmark. In years where additional funding was available, the
methodology would continue to direct additional funds towards areas where per-person allocations
were historically lower. In addition, reductions in funding could be reflected through a proportional
reduction in allocations.
Potential Strengths of Option 2
Because the parity methodology, which is the core of this approach, was extensively debated and
eventually adopted by DOH, the approach would meet DOH’s goal of transparency. It also
addresses stakeholder concerns regarding historically unspent funds, which should lead to more
efficient use of the funds. This methodology is also budget neutral, and it can be easily adapted if
overall funding decreases by proportional funding reductions.
Potential Challenges of Option 2
While this approach meets DOH’s goals of transparency and budget neutrality, there is opportunity
to increase accountability for effective use of the allocated funds. This approach lacks a mechanism
to tie the allocation directly to performance.
Option 3: Allocate Funds Based on Historical Expenditures, Parity and Performance
Another option Mercer considered for allocating funds is to set up a system that prioritizes the
allocation of funds based on:
1. Historical expenditures versus allocations
2. Parity across areas
3. Performance on key measures
Option 3 is similar to Option 2 but introduces a component to tie allocations directly to performance
and allows the State to increase funding if there are excess funds that become available.
Priorities
Priority 1: Expenditure Benchmarks
Under this approach, DOH would first calculate each area’s three-year average expenditures versus
allocations. (As with Option 2, Mercer recommends a three-year average to provide consideration
for areas that may have had anomalous results in any one year.) DOH has an established
benchmark of 99%, meaning each area should spend 99% of its allocation. For those areas in which
the three-year average expenditure-to-allocation ratio is less than 99%, amounts under the
benchmark are set aside for reallocation in the subsequent years. Please note, however, that no
area would receive an allocation less than the prior year’s expenditure. Priority 1, then, starts with
A L L O C A T I O N M E T H O D O L O G Y O P T I O N S F O R F L O R I D A R Y A N W H I T E P A R T B A N D M A T C H I N G S T A T E
F L O R I D A D E P A R T M E N T O F H E A L T H
28
the same first step as in Option 2. See Table 10 in Option 2 for an illustration using a two-year
average from 2016-17 and 2017-18.
As illustrated there, no areas reached the 99% expenditure benchmark. With this methodology,
funding under the benchmark would be reallocated in future years, as long as no area’s allocation
was reduced to less than the prior year’s expenditure.
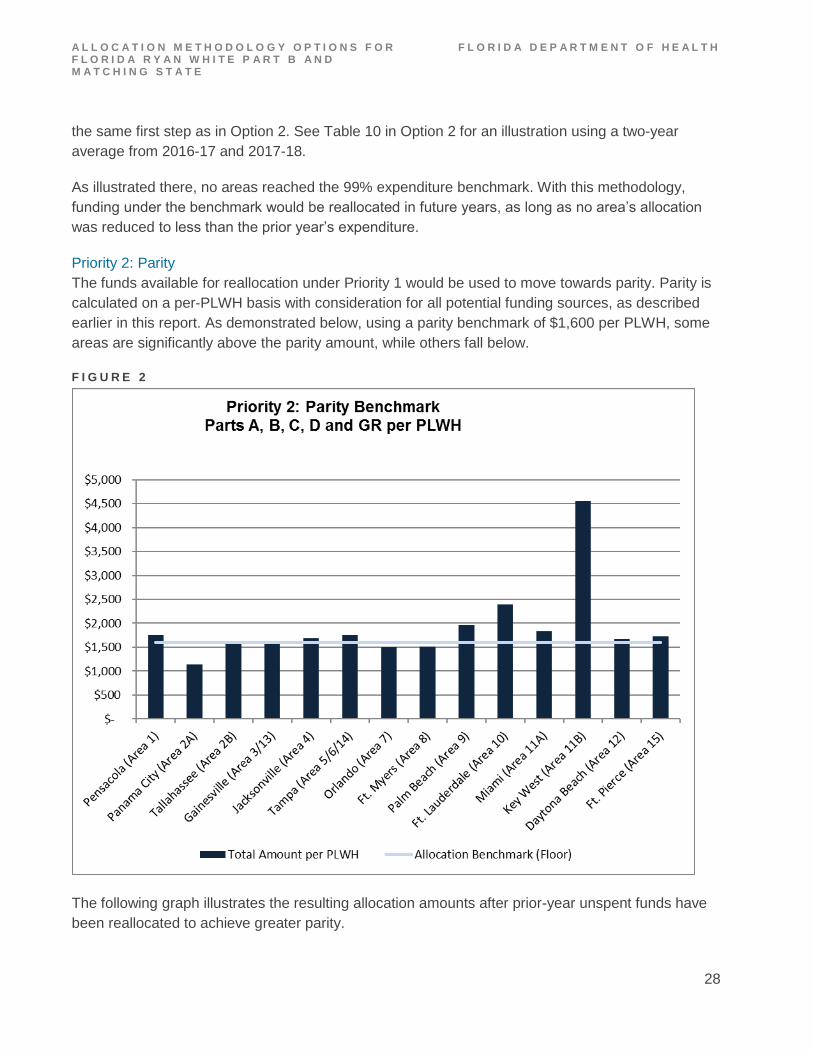
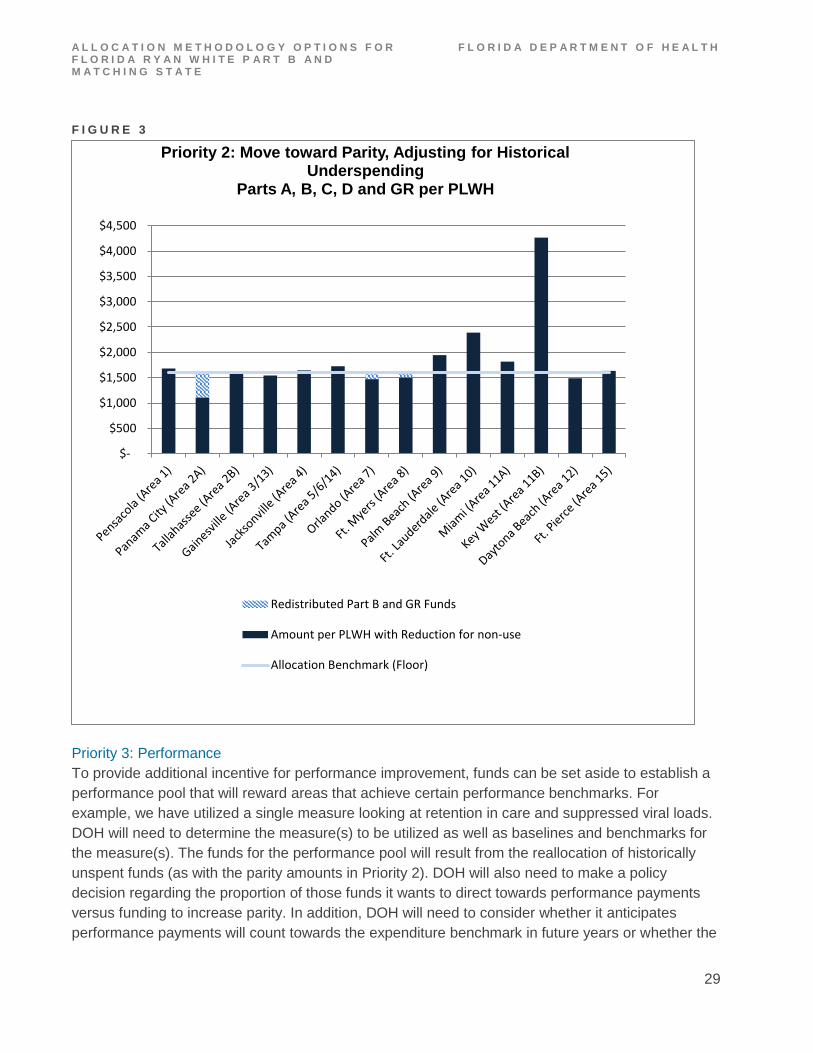
Priority 2: Parity
The funds available for reallocation under Priority 1 would be used to move towards parity. Parity is
calculated on a per-PLWH basis with consideration for all potential funding sources, as described
earlier in this report. As demonstrated below, using a parity benchmark of $1,600 per PLWH, some
areas are significantly above the parity amount, while others fall below.
F I G U R E 2
The following graph illustrates the resulting allocation amounts after prior-year unspent funds have
been reallocated to achieve greater parity.
A L L O C A T I O N M E T H O D O L O G Y O P T I O N S F O R F L O R I D A R Y A N W H I T E P A R T B A N D M A T C H I N G S T A T E
F L O R I D A D E P A R T M E N T O F H E A L T H
29
F I G U R E 3
Priority 3: Performance
To provide additional incentive for performance improvement, funds can be set aside to establish a
performance pool that will reward areas that achieve certain performance benchmarks. For
example, we have utilized a single measure looking at retention in care and suppressed viral loads.
DOH will need to determine the measure(s) to be utilized as well as baselines and benchmarks for
the measure(s). The funds for the performance pool will result from the reallocation of historically
unspent funds (as with the parity amounts in Priority 2). DOH will also need to make a policy
decision regarding the proportion of those funds it wants to direct towards performance payments
versus funding to increase parity. In addition, DOH will need to consider whether it anticipates
performance payments will count towards the expenditure benchmark in future years or whether the
$-
$500
$1,000
$1,500
$2,000
$2,500
$3,000
$3,500
$4,000
$4,500
Priority 2: Move toward Parity, Adjusting for Historical Underspending
Parts A, B, C, D and GR per PLWH
Redistributed Part B and GR Funds
Amount per PLWH with Reduction for non-use
Allocation Benchmark (Floor)

A L L O C A T I O N M E T H O D O L O G Y O P T I O N S F O R F L O R I D A R Y A N W H I T E P A R T B A N D M A T C H I N G S T A T E
F L O R I D A D E P A R T M E N T O F H E A L T H
30
amounts spent from the performance pool should be considered one-time expenditures. If DOH has
new funds or excess funds, the performance pool or a higher parity benchmark can be used to
distribute those funds.
The chart below demonstrates how performance amounts may contribute to overall funding by area.
To illustrate this concept with the spending levels and parity benchmark shown in previous exhibits,
Mercer uses a performance measure of the proportion of PLWH retained in care with a suppressed
viral load. Areas that score at or above 65% have been allocated an additional $50 per PLWH.
F I G U R E 4
The next figure demonstrates what these allocation components might look like as a function of the
funds DOH is responsible for allocating: the Patient Care general revenue and the Part B base and
$-
$500
$1,000
$1,500
$2,000
$2,500
$3,000
$3,500
$4,000
$4,500
Priority 3: Move toward Parity, Adjusting for Historical Underspending and Performance Incentives
Parts A, B, C, D and GR per PLWH
Incentive Funds
Redistributed Part B and GR Funds
Amount per PLWH with Reduction for non-use
Allocation Benchmark (Floor)

A L L O C A T I O N M E T H O D O L O G Y O P T I O N S F O R F L O R I D A R Y A N W H I T E P A R T B A N D M A T C H I N G S T A T E
F L O R I D A D E P A R T M E N T O F H E A L T H
31
consortia funds only. Note that uneven bar heights in Figure 5 are not indicative of disparity, as the
GR and Part B funds are only pieces of the total set of funding streams considered in the parity
analysis. However, it provides a clearer picture of the relative size and distribution of the three
methodology components within the allocations.
F I G U R E 5
Potential Strengths of Option 3
Option 3 offers DOH the opportunity to prioritize several key objectives to ensure funds are
distributed efficiently and effectively. Option 3 first makes adjustments to the allocations for areas in
which historical average expenditures were not at the targeted benchmark of 99%. Option 3 also
incorporates the historical parity analysis that was developed through significant stakeholder input.
Option 3 also allows DOH to provide incentives to improve performance. This approach is also
budget neutral, as no additional funds are required. Finally, Option 3 provides a mechanism for
DOH to distribute new or excess funds in the future.
$0.00
$200.00
$400.00
$600.00
$800.00
$1,000.00
$1,200.00
$1,400.00
$1,600.00
Components of the Part B and GR Only AllocationBase Adjusted for Underspending, Parity Adjustment and
Performance Incentiveper PLWH
Incentive Funds
Redistributed Part B and GR Funds
Part B and GR Allocation by PLWH

A L L O C A T I O N M E T H O D O L O G Y O P T I O N S F O R F L O R I D A R Y A N W H I T E P A R T B A N D M A T C H I N G S T A T E
F L O R I D A D E P A R T M E N T O F H E A L T H
32
Potential Challenges of Option 3
Given the multiple components in this methodology, DOH will need to ensure clear and careful
communication of the methodology to stakeholders. While it uses the historical parity analysis,
which is familiar to many stakeholders, the approach is not identical to the 2002 approach. In
addition, DOH has not previously tied performance metrics to the allocation process. As such, the
Department may want to consider increasing the level of expected performance over time.
A L L O C A T I O N M E T H O D O L O G Y O P T I O N S F O R F L O R I D A R Y A N W H I T E P A R T B A N D M A T C H I N G S T A T E
F L O R I D A D E P A R T M E N T O F H E A L T H
33
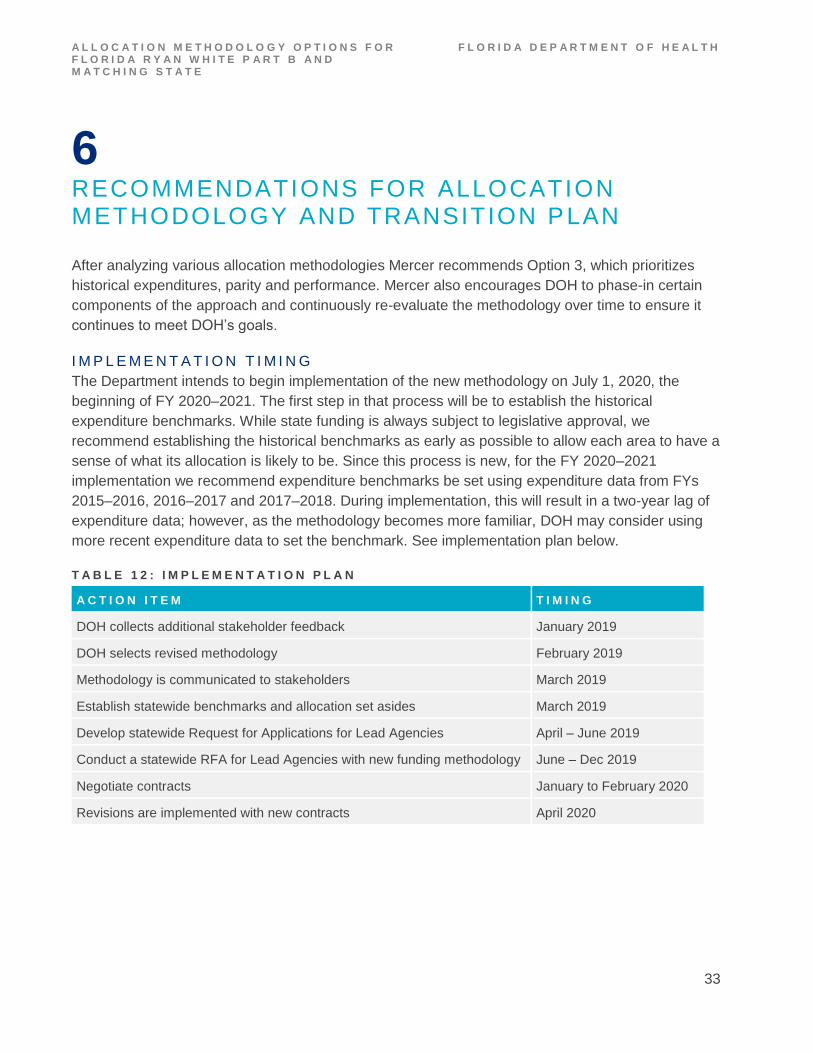
6 RECOMMENDATIONS FOR ALLOCATION METHODOLOGY AND TRANSITION PLAN
After analyzing various allocation methodologies Mercer recommends Option 3, which prioritizes
historical expenditures, parity and performance. Mercer also encourages DOH to phase-in certain
components of the approach and continuously re-evaluate the methodology over time to ensure it
continues to meet DOH’s goals.
I M P L E M E N T A T I O N T I M I N G
The Department intends to begin implementation of the new methodology on July 1, 2020, the
beginning of FY 2020–2021. The first step in that process will be to establish the historical
expenditure benchmarks. While state funding is always subject to legislative approval, we
recommend establishing the historical benchmarks as early as possible to allow each area to have a
sense of what its allocation is likely to be. Since this process is new, for the FY 2020–2021
implementation we recommend expenditure benchmarks be set using expenditure data from FYs
2015–2016, 2016–2017 and 2017–2018. During implementation, this will result in a two-year lag of
expenditure data; however, as the methodology becomes more familiar, DOH may consider using
more recent expenditure data to set the benchmark. See implementation plan below.
T A B L E 1 2 : I M P L E M E N T A T I O N P L A N
A C T I O N I T E M T I M I N G
DOH collects additional stakeholder feedback January 2019
DOH selects revised methodology February 2019
Methodology is communicated to stakeholders March 2019
Establish statewide benchmarks and allocation set asides March 2019
Develop statewide Request for Applications for Lead Agencies April – June 2019
Conduct a statewide RFA for Lead Agencies with new funding methodology June – Dec 2019
Negotiate contracts January to February 2020
Revisions are implemented with new contracts April 2020

A L L O C A T I O N M E T H O D O L O G Y O P T I O N S F O R F L O R I D A R Y A N W H I T E P A R T B A N D M A T C H I N G S T A T E
F L O R I D A D E P A R T M E N T O F H E A L T H
34
Once the historical average expenditures have been set, they will be compared to prior year
expenditures to ensure no area is allocated a base amount less than its prior year’s expenditures.3
After the prior-year floor is set, expenditure amounts will be compared to the allocation data from the
same time periods to determine the percentage of the allocation spent versus the expenditure
benchmark of 99%. The amount from each area below the expenditure benchmark will then be set
aside for redistribution through the parity analysis and performance pool.
As noted earlier, DOH will need to determine the proportion of the pool that will be dedicated to
increasing parity and the proportion that will be set aside to reward performance. Also, Mercer
recommends DOH consider increasing performance expectations over time as the areas become
accustomed to the process of tying performance to allocations. For example, the threshold for
meeting the performance target can be set relatively low in FY 2020–2021 such that most areas can
reasonably be expected to achieve the target. In FY 2021–2022, the bar can be set higher to
provide greater incentive to the areas to achieve higher targets. Finally, the Department will want to
consider whether it sets a single performance target for all areas to achieve or whether it sets a
percentage of performance improvement for each area.
Mercer also suggests DOH consider soliciting stakeholder feedback on the components of this
process where policy choices need to be made.
3 Please note that Ryan White Part B funds are allocated based on an April 1 to March 31 fiscal year, so allocation data
will be to be adjusted to reflect the July 1 to June 30 timing.

M E R C E R ( U S ) I N C . 333 South 7th Street, Suite 1400 Minneapolis, MN 55402 www.mercer.com
Related Documents