Health United States -2019-

Welcome message from author
This document is posted to help you gain knowledge. Please leave a comment to let me know what you think about it! Share it to your friends and learn new things together.
Transcript

Health United States
-2019-

Copyright information
Permission has been obtained from the copyright holders to reproduce certain quoted material in this report. Further reproduction of this material is prohibited without specific permission of the copyright holder. All other material contained in this report is in the public domain, and may be used and reprinted without special permission; source citation, however, is appreciated.
Suggested citation
National Center for Health Statistics. Health, United States, 2019. Hyattsville, MD. 2021. DOI: https://dx.doi.org/10.15620/cdc:100685.
U.S. Department of Health and Human Services
Norris Cochran Acting Secretary
Centers for Disease Control and Prevention
Rochelle P. Walensky, M.D., M.P.H.Director
National Center for Health Statistics
Brian C. Moyer, Ph.D.Director
Jennifer H. Madans, Ph.D.Acting Deputy Director

Health, United States, 2019 iii
Preface
Health, United States, 2019 is the 43rd report on the health status of the nation and is submitted by the Secretary of Health and Human Services to the President and the Congress of the United States in compliance with Section 308 of the Public Health Service Act. This report was compiled by the National Center for Health Statistics (NCHS) of the Centers for Disease Control and Prevention.
The Health, United States series presents an annual overview of national trends in key health indicators. The 2019 report presents current information and trends on selected measures of morbidity, mortality, health care utilization and access, health risk factors, prevention, health insurance, and personal health care expenditures in a 20-figure Chartbook.
The Health, United States, 2019 Chartbook is supplemented by several other products, including Trend Tables, an At-a-glance Table, Appendixes, and Spotlight Infographics available for download from the Health, United States website at: https://www.cdc.gov/nchs/hus/index.htm.
2019 EditionThe Health, United States, 2019 Chartbook contains 20
figures and associated data tables on health and health care in the United States. Examining trends in health informs the development, implementation, and evaluation of health policies and programs. The first section (Figures 1–13) focuses on health status and determinants: life expectancy, infant mortality, selected causes of death, drug overdose deaths, suicide, maternal mortality, teen births, preterm singleton births, use of tobacco products, current asthma among children, hypertension, heart disease and cancer, and functional limitation. The second section (Figures 14 and 15) presents trends in health care utilization: use of mammography and colorectal tests and procedures, and unmet need due to cost. The third section (Figures 16 and 17) focuses on health care resources—supply of dentists and physicians. The fourth section (Figures 18–20) describes trends in personal health care expenditures, health insurance coverage, and supplemental insurance among Medicare beneficiaries. The Highlights section summarizes major findings from the Chartbook.
Supplementary Materials Available on the Web
Trend TablesWith the release of Health, United States, 2019, detailed
Trend Tables are available for download from: https://www.cdc.gov/nchs/hus/contents2019.htm. These 49 detailed Trend Tables highlight major trends in key health indicators in four areas: health status and determinants, health care utilization, health care resources, and health care expenditures. An important criterion used in selecting Trend Tables for the Health, United States series is the availability of comparable national data over several years. Trend Tables included in the online supplement provide data on indicators featured in the Chartbook or on the NCHS FastStats site. FastStats provides quick access to statistics on topics of public health importance and is available from: https://www.cdc.gov/nchs/fastats/default.htm.
The At-a-glance Table summarizes major findings from the Trend Tables and is available for download from: https://www.cdc.gov/nchs/hus/ataglance.htm.
AppendixesAppendix I, Data Sources describes each data source
used in Health, United States, 2019 and provides references for further information about the sources. Data sources are listed alphabetically within two broad categories: Government Sources, and Private and Global Sources.
Appendix II, Definitions and Methods includes selected terms used in Health, United States, 2019. It also contains information on the statistical methodologies used in the report.
The Appendixes for Health, United States, 2019 are available for download from: https://www.cdc.gov/nchs/hus/appendix.htm.
Spotlight InfographicsThe Health, United States Spotlight is an infographic
series that explores topics of public health importance using trend data from Health, United States. Spotlights are published throughout the year and feature the most current data available at the time of publication.
The Spotlight infographics are available for download from: https://www.cdc.gov/nchs/hus/hus_infographic.htm.

iv Health, United States, 2019
Data FinderThe Data Finder is a useful tool on the Health,
United States website for locating data by topic. Using the Data Finder, users may narrow down the list of tables and charts by health topic and populations of interest. Topics include areas such as drug overdose, prescription drug use, and functional limitation. Populations include groups such as age, sex, race and Hispanic origin, and geographic region. See the Health, United States website at: https://www.cdc.gov/nchs/hus/contents2019.htm.
Data Considerations
Racial and Ethnic DataSome tables in Health, United States present data
according to race and Hispanic origin, consistent with a department-wide emphasis on ensuring that health data on racial and ethnic minority populations are presented whenever possible. Trend data on race and ethnicity are presented in the greatest detail possible considering the quality of the data, the amount of missing data, and the number of observations. These issues significantly affect the availability of reportable data for certain populations, such as the Native Hawaiian or Other Pacific Islander and the American Indian or Alaska Native populations.
Starting with data year 1999, most NCHS survey estimates by race are presented based on the 1997 Office of Management and Budget’s “Revisions to the Standards for the Classification of Federal Data on Race and Ethnicity.” Vital statistics systems, however, transitioned to the 1997 standards over time as states adopted the 2003 revision of the U.S. Standard Certificates of Live Birth and Death, which contained the 1997 standards. The 2003 revisions were not adopted by all states until 2016 for the natality file and 2018 for the mortality file. During this transition, it was necessary to make vital records data by race comparable across states. This was done by bridging the race information collected under the 1997 standards to be consistent with data collected under the 1977 standards (1). Natality data for race groups for 2016 and subsequent years, as well as mortality data for race groups for 2018 and subsequent years, are not completely comparable with the earlier bridged data. Figures and trend tables affected by the adoption of the latest race categories have this change indicated in the footnotes. Standards for the classification of federal data on race and ethnicity are described in Technical Notes, Racial and Ethnic Data; Appendix I, Population Census and Population Estimates, Bridged-race Population Estimates; and Appendix II, Race.
Education and Income DataSome tables in Health, United States present data
according to socioeconomic status, using education and family income as proxy measures. Education and
income data are generally obtained directly from survey respondents and are not usually available from records-based data collection systems. (See Appendix II, Education; Family income; Poverty.)
Statistical SignificanceAll statements in the text describing differences, or
the lack thereof, between estimates or across time indicate that statistical testing was performed. Differences between two point estimates were determined to be statistically significant at the 0.05 level using two-sided significance tests (z tests) without correction for multiple comparisons. Terms such as “similar” and “no difference” indicate that the statistics being compared were not significantly different. For data sources with no standard errors, relative differences greater than 10% are generally discussed in the text. Trends are tested using regression analysis. The specific approaches used to analyze trends over time depend on the data source, type of dependent variable, and number of data points (2). Terms such as “stable” and “no clear trend” indicate that the slope of the trend line was not significantly different from zero. Chartbook data tables and Trend Tables include point estimates and standard errors, when available, for users who would like to perform statistical tests. Additional information on statistical reliability and testing can be found in the Technical Notes, which follows the Chartbook.
Accessing Health, United StatesThe Health, United States, 2019 Chartbook can be
accessed from: https://www.cdc.gov/nchs/hus/index.htm. The Chartbook figures are also available individually for download as PowerPoint slides. Trend Tables and Chartbook data tables are available for download as Excel and PDF files. Excel Trend Table files include additional years of data not shown in the PDF files, along with standard errors where available. Files may be downloaded from the Health, United States website at: https://www.cdc.gov/nchs/hus/contents2019.htm.
Visitors to the website can join the Health, United States e-mail distribution list (https://www.cdc.gov/nchs/hus/hus_electronic_mailing.htm) to receive announcements about release dates and notices of updates. Previous editions of Health, United States and its Chartbooks can also be accessed from the website.
Printed copies of Health, United States can be purchased from the U.S. Government Publishing Office at: https://bookstore.gpo.gov.

Health, United States, 2019 v
Questions?If you have questions about Health, United States or
related data products, contact:Office of Information ServicesInformation Dissemination StaffNational Center for Health StatisticsCenters for Disease Control and Prevention3311 Toledo RoadHyattsville, MD 20782–2064Phone: 1–800–CDC–INFO (1–800–232–4636)TTY: 1–888–232–6348E-mail: [email protected] request form: https://www.cdc.gov/cdc-info/requestform.html
For e-mail updates on NCHS publication releases, subscribe online at: https://www.cdc.gov/nchs/ govdelivery.htm.

vi Health, United States, 2019
Health, United States has been published by the National Center for Health Statistics (NCHS) since 1975, and for most of that time, Dr. Jennifer H. Madans has provided her statistical and analytical expertise to the annual report, shaping its development over the years.
Dr. Madans’ leadership in the collection, analysis, and interpretation of federal health and demographic data has had an impact on each edition of Health, United States. In particular, she provided the statistical and epidemiological leadership on how best to implement race and ethnicity standards for statistical systems and measure the effects of these changes on current and trend data. Dr. Madans is also a preeminent researcher in the field of health and disability measurement, and her influential contributions on conceptualizing and evaluating these measures have been incorporated into Health, United States. She has been a tireless champion for quality health data, encouraging the report’s continued focus on providing independent, accurate, and meaningful information on trends to researchers. As Health, United States has evolved over time, Dr. Madans has also guided changes that have ultimately expanded the report’s reach and improved its dissemination.
Dr. Madans is retiring from NCHS after 4 decades of dedicated federal service. Her legacy is reflected in innovations in NCHS data collection programs, improvements in methodological approaches, and dedication to high standards of excellence and data quality—all of which are reflected in Health, United States.
Special Acknowledgment
JENNIFER H. MADANS
Her legacy is reflected in innovations in NCHS data collection programs, improvements in methodological approaches, and dedication to high standards of excellence and data quality—all of which are reflected in Health, United States.

Health, United States, 2019 vii
Acknowledgments
The National Center for Health Statistics’ (NCHS) Division of Analysis and Epidemiology planned and coordinated the content of this volume under the direction of Irma E. Arispe and Renee M. Gindi.
Production of Health, United States, 2019 was coordinated by Sheila J. Franco, Renee M. Gindi, and Ashley M. Woodall. Preparation of the volume, including data, analysis, text for specific charts, highlights, trend tables, and appendixes, was completed by Shilpa Bengeri, Mary Ann Bush, La-Tonya D. Curl, Barnali Das, Sheila J. Franco, Nancy Han, Ji-Eun Kim, Florence C. Lee, Xianfen Li, Zakia C. Nelson, Anita L. Powell, and Ashley M. Woodall.
The staff of the Population Health Reporting and Dissemination Branch would like to give special acknowledgment to Mary Ann Bush and Anita L. Powell, who retired in 2019, for their years of service and dedication to the publication of Health, United States.
Publication assistance was provided by CDC/DDPHSS/NCHS/OD/Office of Information Services, Information Design and Publishing Staff (IDPS). Project management and editing were provided by Jane Sudol, and peer review by Jen Hurlburt. Layout and table design were provided by Kyung M. Park, and figures were designed by Odell D. Eldridge (contractor). Cover design was provided by Liviu Tanase. Overview for IDPS publications and electronic products was provided by Tommy C. Seibert, Jr. Electronic access through the NCHS website was provided by Shilpa Bengeri, Janice Cui, La-Tonya D. Curl, Florence C. Lee, Jennifer A. Moore, and Ashley M. Woodall. Printing was managed by Nathanael Brown (CDC/OD/OADC).
Data and technical assistance were provided by staff of the following NCHS organizations: Division of Analysis and Epidemiology: Ellie Gabriel, Holly Hedegaard, Elizabeth R. Heitz, Kevin C. Heslin, Deepthi Kandi, Ellen A. Kramarow, Michelle Liu, Lisa Mirel, Cheryl V. Rose, Yu Sun, and Julie A. Weeks. Division of Health and Nutrition Examination Surveys: Joseph Afful, Lara J. Akinbami, Margaret D. Carroll, Mark S. Eberhardt, Eleanor B. Fleming, Cheryl D. Fryar, Qiuping Gu, Craig M. Hales, Cynthia L. Ogden, Yechiam Ostchega, and Ryne Paulose-Ram; Division of Health Interview Statistics: Veronica E. Benson, Lindsay I. Black, Debra L. Blackwell, Peter Boersma, Amy Cha, Tainya C. Clarke, Robin A. Cohen, Jacqueline B. Lucas, Tina Norris, Jeannine S. Schiller, Emily P. Terlizzi, and Maria A. Villarroel; Division of Vital Statistics: Robert N. Anderson, Elizabeth Arias, Sally C. Curtin, Anne K. Driscoll, Danielle M. Ely, Elizabeth C.W. Gregory, Brady E. Hamilton, Isabelle Horon, Donna L. Hoyert, Joyce A. Martin, Arialdi M. Miniño, Michelle J.K. Osterman, and Steven J. Steimel; Division of Research and Methodology: Donald J. Malec; and Office of the Center Director: Juan Albertorio, Amy M. Branum, and Francis C. Notzon.
Additional data and technical assistance were provided by the following organizations of the Centers for Disease Control and Prevention: National Center for Chronic Disease Prevention and Health Promotion: Andrea Gentzke; National Center for HIV/AIDS, Viral Hepatitis, STD, and TB Prevention: Melissa A. Habel, Anna Satcher Johnson, Jennifer A. Ludovic, and Azfar-E-Alam Siddiqi; National Center for Immunization and Respiratory Diseases: Laurie D. Elam-Evans, Holly A. Hill, Qian Li, James A. Singleton, and David Yankey; and DDPHSS/CSELS, Division of Health Informatics and Surveillance: Ruth Ann Jajosky and Tara Strine; by the following organizations within the Department of Health and Human Services: Centers for Medicare & Medicaid Services: Aaron C. Catlin, Nathan A. Espinosa, Mary Carol Grzeskiewicz, Anne Martin, and Lekha S. Whittle; Health Resources & Services Administration, National Center for Health Workforce Analysis: Hayden Kepley, Jason Roffenbender, and Michelle Washko; and Substance Abuse and Mental Health Services Administration: Beth Han; and by the following nongovernmental organizations: American Dental Association: Bradley Munson; and American Hospital Association: Diana Culbertson.
We acknowledge the contributions from local, state, and territorial health departments and other sources in the collection and reporting of health indicators.

viii Health, United States, 2019
Contents
Preface . . . . . . . . . . . . . . . . . . . . . . . . . . . . . . . . . . . . . . . . . . . . . . . . . . iii2019 Edition . . . . . . . . . . . . . . . . . . . . . . . . . . . . . . . . . . . . . . . . . . . iiiSupplementary Materials Available on the Web . . . . . . . . iiiData Considerations . . . . . . . . . . . . . . . . . . . . . . . . . . . . . . . . . . . iv
Acknowledgment . . . . . . . . . . . . . . . . . . . . . . . . . . . . . . . . . . . . . . . .viList of Chartbook Figures . . . . . . . . . . . . . . . . . . . . . . . . . . . . . . . . . ixList of Trend Tables . . . . . . . . . . . . . . . . . . . . . . . . . . . . . . . . . . . . . . xHighlights . . . . . . . . . . . . . . . . . . . . . . . . . . . . . . . . . . . . . . . . . . . . . . . 1
Health Status and Determinants . . . . . . . . . . . . . . . . . . . . . . . 1Health Care Access and Utilization . . . . . . . . . . . . . . . . . . . . 3Health Care Resources . . . . . . . . . . . . . . . . . . . . . . . . . . . . . . . . 3Health Care Expenditures and Payers . . . . . . . . . . . . . . . . . . 4
Chartbook . . . . . . . . . . . . . . . . . . . . . . . . . . . . . . . . . . . . . . . . . . . . . . . 5Health Status and Determinants . . . . . . . . . . . . . . . . . . . . . . . . . . 6
Life Expectancy at Birth . . . . . . . . . . . . . . . . . . . . . . . . . . . . . . . 6Infant Mortality . . . . . . . . . . . . . . . . . . . . . . . . . . . . . . . . . . . . . . . 7Selected Causes of Death . . . . . . . . . . . . . . . . . . . . . . . . . . . . . . 8Drug Overdose Deaths . . . . . . . . . . . . . . . . . . . . . . . . . . . . . . . . 9Suicide . . . . . . . . . . . . . . . . . . . . . . . . . . . . . . . . . . . . . . . . . . . . . . 10Maternal Mortality . . . . . . . . . . . . . . . . . . . . . . . . . . . . . . . . . . . 11Teen Births . . . . . . . . . . . . . . . . . . . . . . . . . . . . . . . . . . . . . . . . . . 12Preterm Singleton Births . . . . . . . . . . . . . . . . . . . . . . . . . . . . . 13Use of Tobacco Products . . . . . . . . . . . . . . . . . . . . . . . . . . . . . 14Current Asthma Among Children . . . . . . . . . . . . . . . . . . . . . 15Hypertension . . . . . . . . . . . . . . . . . . . . . . . . . . . . . . . . . . . . . . . . 16Heart Disease and Cancer . . . . . . . . . . . . . . . . . . . . . . . . . . . . 17Functional Limitation . . . . . . . . . . . . . . . . . . . . . . . . . . . . . . . . 18
Health Care Access and Utilization . . . . . . . . . . . . . . . . . . . . . . 19Use of Mammography and Colorectal Tests and
Procedures . . . . . . . . . . . . . . . . . . . . . . . . . . . . . . . . . . . . . . . . . 19Unmet Need Due to Cost . . . . . . . . . . . . . . . . . . . . . . . . . . . . . 20
Health Care Resources . . . . . . . . . . . . . . . . . . . . . . . . . . . . . . . . . . 21Physicians . . . . . . . . . . . . . . . . . . . . . . . . . . . . . . . . . . . . . . . . . . . . 21Dentists . . . . . . . . . . . . . . . . . . . . . . . . . . . . . . . . . . . . . . . . . . . . . 22
Health Care Expenditures and Payers . . . . . . . . . . . . . . . . . . . . 23Personal Health Care Expenditures . . . . . . . . . . . . . . . . . . . 23Health Insurance Coverage . . . . . . . . . . . . . . . . . . . . . . . . . . 24Supplemental Insurance Among
Medicare Beneficiaries . . . . . . . . . . . . . . . . . . . . . . . . . . . . . . 25Chartbook Data Tables . . . . . . . . . . . . . . . . . . . . . . . . . . . . . . . . . . 26Technical Notes . . . . . . . . . . . . . . . . . . . . . . . . . . . . . . . . . . . . . . . . 52
Data Sources . . . . . . . . . . . . . . . . . . . . . . . . . . . . . . . . . . . . . . . . 52Data Presentation . . . . . . . . . . . . . . . . . . . . . . . . . . . . . . . . . . . . 52Racial and Ethnic Data . . . . . . . . . . . . . . . . . . . . . . . . . . . . . . . . 52Statistical Reliability of Estimates . . . . . . . . . . . . . . . . . . . . . 53Statistical Testing . . . . . . . . . . . . . . . . . . . . . . . . . . . . . . . . . . . . 53
References . . . . . . . . . . . . . . . . . . . . . . . . . . . . . . . . . . . . . . . . . . . . . . 55

Health, United States, 2019 ix
List of Chartbook Figures
Life Expectancy at BirthFigure 1. Life expectancy at birth, by sex and race and Hispanic origin: United States, 2008–2018
Infant MortalityFigure 2. Infant mortality rates, by race and Hispanic origin of mother and selected leading causes of death: United States, 2008–2018
Selected Causes of DeathFigure 3. Age-adjusted death rates for selected causes of death for all ages, by sex: United States, 2008–2018
Drug Overdose DeathsFigure 4. Drug overdose death rates among persons aged 15 years and over, by sex and age: United States, 2008–2018
SuicideFigure 5. Suicide, by sex and means: United States, 2008–2018
Maternal MortalityFigure 6. Maternal mortality, by age and race and Hispanic origin: United States, 2018
Teen BirthsFigure 7. Teen births among females aged 15–19 years, by race and Hispanic origin: United States, 2008–2018
Preterm Singleton BirthsFigure 8. Preterm singleton births, by gestational age and race and Hispanic origin of mother: United States, 2008–2018
Use of Tobacco ProductsFigure 9. Cigarette smoking among adults aged 18 and over, by age, and tobacco use among adolescents in grades 9–12, by type of product: United States, 2008–2018
Current Asthma Among ChildrenFigure 10. Current asthma among children under age 18 years, by age and race and Hispanic origin: United States, 2008–2018
HypertensionFigure 11. Hypertension among adults aged 20 and over, by age: United States, 1999–2000 through 2017–2018
Heart Disease and CancerFigure 12. Heart disease and cancer among adults aged 18 and over, by sex and age: United States, 2008–2018
Functional LimitationFigure 13. Functional limitation among adults aged 18 and over, by age and level of difficulty: United States, 2010–2018
Use of Mammography and Colorectal Tests and ProceduresFigure 14. Use of mammography among women aged 40–74 and use of colorectal cancer testing among adults aged 50–75, by race and Hispanic origin: United States, 2008–2018
Unmet Need Due to CostFigure 15. Delay or nonreceipt of needed medical care in the past 12 months due to cost, by age: United States, 2008–2018
PhysiciansFigure 16. Number of physicians in patient care per 100,000 resident population, by state: United States, 2018
DentistsFigure 17. Number of dentists per 100,000 resident population, by state: United States, 2019
Personal Health Care ExpendituresFigure 18. Personal health care expenditures, by source of funds and type of expenditure: United States, 2008–2018
Health Insurance Coverage Figure 19. Health insurance coverage, by age and type of coverage: United States, 2008–2018
Supplemental Insurance Among Medicare BeneficiariesFigure 20. Supplemental insurance coverage among adults aged 65 and over with Medicare coverage, by type of supplemental coverage: United States, 2010–2018

x Health, United States, 2019
With the release of Health, United States, 2019, 49 detailed Trend Tables are available as online-only supplements. They are available for download from: https://www.cdc.gov/nchs/hus/contents2019.htm.
List of Trend Tables Table 1. Crude birth rates, fertility rates, and birth rates, by age, race, and Hispanic origin of mother: United States, selected years 1950–2018
Table 2. Infant, neonatal, postneonatal, fetal, and perinatal mortality rates, by detailed race and Hispanic origin of mother: United States, selected years 1983–2018
Table 3. Infant mortality rates, by race: United States, selected years 1950–2018
Table 4. Life expectancy at birth, at age 65, and at age 75, by sex, race, and Hispanic origin: United States, selected years 1900–2018
Table 5. Age-adjusted death rates for selected causes of death, by sex, race, and Hispanic origin: United States, selected years 1950–2018
Table 6. Leading causes of death and numbers of deaths, by sex, race, and Hispanic origin: United States, 1980 and 2018
Table 7. Leading causes of death and numbers of deaths, by age: United States, 1980 and 2018
Table 8. Drug overdose death rates, by drug type, sex, age, race, and Hispanic origin: United States, selected years 1999–2018
Table 9. Death rates for suicide, by sex, race, Hispanic origin, and age: United States, selected years 1950–2018
Table 10. Selected nationally notifiable disease rates and number of new cases: United States, selected years 1950–2018
Table 11. Human immunodeficiency virus (HIV) diagnoses, by year of diagnosis and selected characteristics: United States, 2013–2018
Table 12. Health conditions among children under age 18, by selected characteristics: United States, average annual, selected years 1997–1999 through 2016–2018
Table 13. Respondent-reported prevalence of heart disease, cancer, and stroke among adults aged 18 and over, by selected characteristics: United States, average annual, selected years 1997–1998 through 2017–2018
Table 14. Diabetes prevalence and glycemic control among adults aged 20 and over, by sex, age, and race and Hispanic origin: United States, selected years 1988–1994 through 2015–2018
Table 15. Functional limitation among adults aged 18 and over, by selected characteristics: United States, selected years 2010–2018
Table 16. Respondent-assessed fair or poor health status, by selected characteristics: United States, selected years 1991–2018
Table 17. Current cigarette smoking among adults aged 18 and over, by sex, race, and age: United States, selected years 1965–2018
Table 18. Age-adjusted prevalence of current cigarette smoking among adults aged 25 and over, by sex, race, and education level: United States, selected years 1974–2018
Table 19. Current cigarette smoking among adults aged 18 and over, by selected characteristics: United States, average annual, selected years 1990–1992 through 2016–2018
Table 20. Use of selected substances in the past month among persons aged 12 years and over, by age, sex, and race and Hispanic origin: United States, selected years 2002–2018
Table 21. Selected health conditions and risk factors, by age: United States, selected years 1988–1994 through 2017–2018
Table 22. Hypertension among adults aged 20 and over, by selected characteristics: United States, selected years 1988–1994 through 2015–2018
Table 23. Cholesterol among adults aged 20 and over, by selected characteristics: United States, selected years 1988–1994 through 2015–2018
Table 24. Mean macronutrient intake among adults aged 20 and over, by sex and age: United States, selected years 1988–1994 through 2013–2016
Table 25. Participation in leisure-time aerobic and muscle-strengthening activities that meet the federal 2008 Physical Activity Guidelines for Americans among adults aged 18 and over, by selected characteristics: United States, selected years 1998–2018
Table 26. Normal weight, overweight, and obesity among adults aged 20 and over, by selected characteristics: United States, selected years 1988–1994 through 2015–2018
Table 27. Obesity among children and adolescents aged 2–19 years, by selected characteristics: United States, selected years 1988–1994 through 2015–2018
Table 28. Untreated dental caries, by selected characteristics: United States, selected years 1988–1994 through 2015–2018
Table 29. Delay or nonreceipt of needed medical care, nonreceipt of needed prescription drugs, and nonreceipt of needed dental care during the past 12 months due to cost, by selected characteristics: United States, selected years 1997–2018

Health, United States, 2019 xi
Table 30. Health care visits to doctor offices, emergency departments, and home visits within the past 12 months, by selected characteristics: United States, selected years 1997–2018
Table 31. Vaccination coverage for selected diseases by age 24 months, by race and Hispanic origin, poverty level, and location of residence: United States, birth years 2010–2015
Table 32. Vaccination coverage for selected diseases among adolescents aged 13–17 years, by selected characteristics: United States, selected years 2008–2018
Table 33. Use of mammography among women aged 40 and over, by selected characteristics: United States, selected years 1987–2018
Table 34. Use of Pap smear among women aged 18 and over, by selected characteristics: United States, selected years 1987–2018
Table 35. Use of colorectal tests or procedures among adults aged 50–75, by selected characteristics: United States, selected years 2000–2018
Table 36. Emergency department visits within the past 12 months among children under age 18, by selected characteristics: United States, selected years 1997–2018
Table 37. Emergency department visits within the past 12 months among adults aged 18 and over, by selected characteristics: United States, selected years 1997–2018
Table 38. Dental visits in the past year, by selected characteristics: United States, selected years 1997–2018
Table 39. Prescription drug use in the past 30 days, by sex, race and Hispanic origin, and age: United States, selected years 1988–1994 through 2015–2018
Table 40. Persons with hospital stays in the past year, by selected characteristics: United States, selected years 1997–2018
Table 41. Active physicians and physicians in patient care, by state: United States, selected years 1975–2018
Table 42. Active dentists, by state: United States, selected years 2001–2019
Table 43. Community hospital beds and average annual percent change, by state: United States, selected years 1980–2018
Table 44. Gross domestic product, national health expenditures, per capita amounts, percent distribution, and average annual percent change: United States, selected years 1960–2018
Table 45. National health expenditures, average annual percent change, and percent distribution, by type of expenditure: United States, selected years 1960–2018
Table 46. Personal health care expenditures, by source of funds and type of expenditure: United States, selected years 1960–2018
Table 47. Private health insurance coverage among persons under age 65, by selected characteristics: United States, selected years 1984–2018
Table 48. Medicaid coverage among persons under age 65, by selected characteristics: United States, selected years 1984–2018
Table 49. No health insurance coverage among persons under age 65, by selected characteristics: United States, selected years 1984–2018

Health, United States, 2019 1
Highlights
This Highlights section focuses on the report subject areas referred to in Section 308 of the Public Health Service Act—health status and determinants, health care access and utilization, health care resources, and health care expenditures and payers. The section presents trends for the recent 10-year period or examines information for the most recent data year on topics of public health interest. When 10 years of data are not available, the analyses cover a time period as close as possible to 10 years given the constraints of the data source. In the Highlights section, estimates are for the total resident population when based on vital or other administrative or provider records, and for the civilian noninstitutionalized population when based on surveys. Each highlight includes a reference to the figure, where definitions of terms and additional data can be obtained.
Health Status and Determinants
Life Expectancy at Birth
• Life expectancy at birth in the United States for the total population was 78.7 years in 2018, 0.2 year lower than in 2014. Despite the lower life expectancy over the 5-year period, life expectancy at birth increased 0.1 year from 2017 to 2018 (Figure 1).
• In 2018, life expectancy at birth was 76.2 years for males and 81.2 years for females—a difference of 5.0 years (Figure 1).
• From 2008 to 2018, life expectancy at birth increased for Hispanic, non-Hispanic white, and non-Hispanic black persons. In 2018, life expectancy at birth for Hispanic persons was 81.8 years—3.2 years higher than for non-Hispanic white persons (78.6 years) and 7.1 years higher than for non-Hispanic black persons (74.7 years) (Figure 1).
• Between 2008 and 2018, life expectancy at birth increased more for non-Hispanic black persons than for non-Hispanic white persons, narrowing the gap in life expectancy between the two groups. In 2008, life expectancy at birth for non-Hispanic white persons (78.4 years) was 4.5 years higher than for non-Hispanic black persons (73.9 years); by 2018, the difference had narrowed to 3.9 years (Figure 1).
Infant Mortality
• The infant mortality rate in 2018 was 5.67 deaths per 1,000 live births, 14% lower than in 2008 (Figure 2).
• In 2018, the infant mortality rate was higher among non-Hispanic black (10.75 deaths per 1,000 live births), non-Hispanic Native Hawaiian or Other Pacific Islander (9.39), and non-Hispanic American Indian or Alaska Native (8.15) women than among Hispanic (4.86), non-Hispanic white (4.63), and non-Hispanic Asian (3.63) women (Figure 2).
• In 2018, 56.1% of infant deaths were attributable to five leading causes of death: congenital malformations, preterm births and low birth weight, sudden infant death syndrome (SIDS), maternal complications of pregnancy, and unintentional injuries (accidents) (Figure 2).
Selected Causes of Death
• In 2018, the age-adjusted all-cause death rate among males was 7% lower than in 2008 (855.5 deaths per 100,000 population compared with 918.8). Similarly, the age-adjusted all-cause death rate among females was 7% lower in 2018 than in 2008 (611.3 deaths per 100,000 population compared with 659.9) (Figure 3).
• In 2018, the leading causes of death for all ages were heart disease, cancer, unintentional injuries (accidents), chronic lower respiratory diseases, cerebrovascular disease (including stroke), Alzheimer’s disease, and diabetes (Figure 3).
• From 2008 to 2018, the age-adjusted death rate for diabetes decreased among females from 19.1 deaths per 100,000 population to 16.8. By contrast, over the same period, the age-adjusted death rate for diabetes increased among males from 25.9 deaths per 100,000 population to 26.9 (Figure 3).
Drug Overdose Deaths
• The age-adjusted drug overdose death rate was 11.9 deaths per 100,000 in 2008, with a stable trend through 2013 before it increased to 20.7 in 2018. However, from 2017 to 2018, the drug overdose death rate decreased 4.6% (Figure 4).
• In 2018, drug overdose death rates among males aged 15 and over were lowest among those aged 65 and over (10.2 deaths per 100,000) and highest among those aged 35–44 (52.4) (Figure 4).
• In 2018, drug overdose death rates among females aged 15 and over were lowest among those aged 65 and over (5.5 deaths per 100,000) and highest among those aged 35–44 and 45–54 (24.2 and 24.8, respectively) (Figure 4).
2 Health, United States, 2019
Suicide
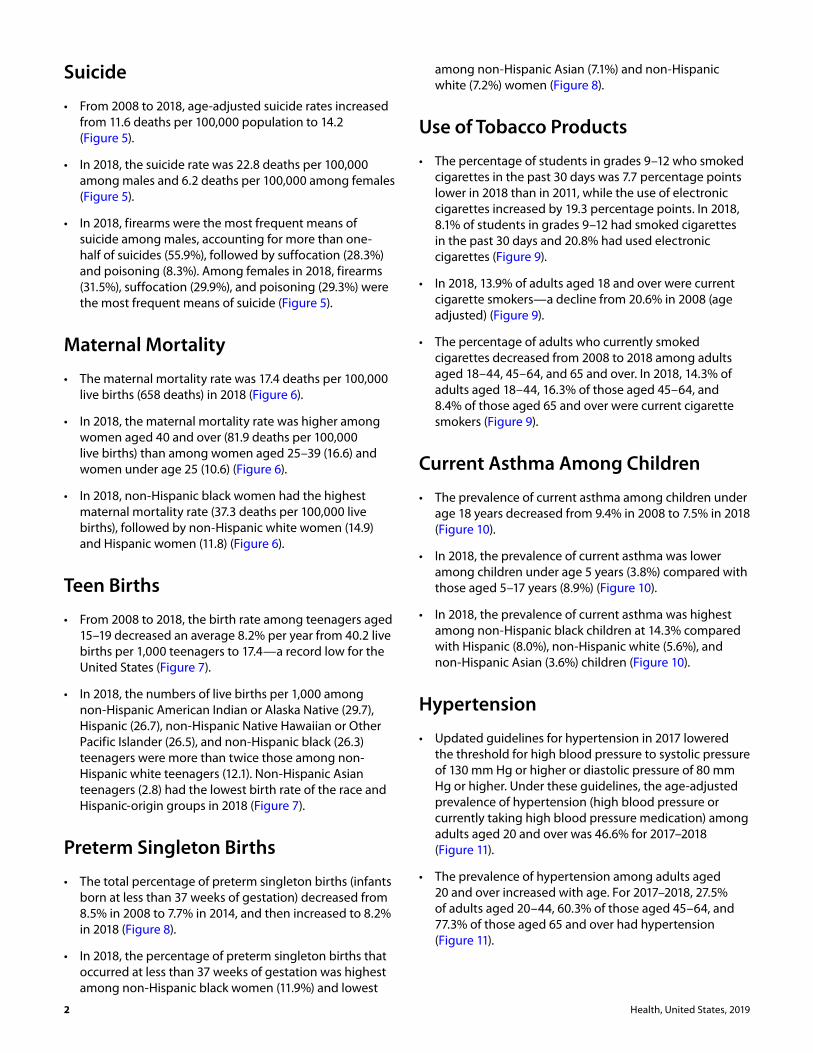
• From 2008 to 2018, age-adjusted suicide rates increased from 11.6 deaths per 100,000 population to 14.2 (Figure 5).
• In 2018, the suicide rate was 22.8 deaths per 100,000 among males and 6.2 deaths per 100,000 among females (Figure 5).
• In 2018, firearms were the most frequent means of suicide among males, accounting for more than one-half of suicides (55.9%), followed by suffocation (28.3%) and poisoning (8.3%). Among females in 2018, firearms (31.5%), suffocation (29.9%), and poisoning (29.3%) were the most frequent means of suicide (Figure 5).
Maternal Mortality
• The maternal mortality rate was 17.4 deaths per 100,000 live births (658 deaths) in 2018 (Figure 6).
• In 2018, the maternal mortality rate was higher among women aged 40 and over (81.9 deaths per 100,000 live births) than among women aged 25–39 (16.6) and women under age 25 (10.6) (Figure 6).
• In 2018, non-Hispanic black women had the highest maternal mortality rate (37.3 deaths per 100,000 live births), followed by non-Hispanic white women (14.9) and Hispanic women (11.8) (Figure 6).
Teen Births
• From 2008 to 2018, the birth rate among teenagers aged 15–19 decreased an average 8.2% per year from 40.2 live births per 1,000 teenagers to 17.4—a record low for the United States (Figure 7).
• In 2018, the numbers of live births per 1,000 among non-Hispanic American Indian or Alaska Native (29.7), Hispanic (26.7), non-Hispanic Native Hawaiian or Other Pacific Islander (26.5), and non-Hispanic black (26.3) teenagers were more than twice those among non-Hispanic white teenagers (12.1). Non-Hispanic Asian teenagers (2.8) had the lowest birth rate of the race and Hispanic-origin groups in 2018 (Figure 7).
Preterm Singleton Births
• The total percentage of preterm singleton births (infants born at less than 37 weeks of gestation) decreased from 8.5% in 2008 to 7.7% in 2014, and then increased to 8.2% in 2018 (Figure 8).
• In 2018, the percentage of preterm singleton births that occurred at less than 37 weeks of gestation was highest among non-Hispanic black women (11.9%) and lowest
among non-Hispanic Asian (7.1%) and non-Hispanic white (7.2%) women (Figure 8).
Use of Tobacco Products
• The percentage of students in grades 9–12 who smoked cigarettes in the past 30 days was 7.7 percentage points lower in 2018 than in 2011, while the use of electronic cigarettes increased by 19.3 percentage points. In 2018, 8.1% of students in grades 9–12 had smoked cigarettes in the past 30 days and 20.8% had used electronic cigarettes (Figure 9).
• In 2018, 13.9% of adults aged 18 and over were current cigarette smokers—a decline from 20.6% in 2008 (age adjusted) (Figure 9).
• The percentage of adults who currently smoked cigarettes decreased from 2008 to 2018 among adults aged 18–44, 45–64, and 65 and over. In 2018, 14.3% of adults aged 18–44, 16.3% of those aged 45–64, and 8.4% of those aged 65 and over were current cigarette smokers (Figure 9).
Current Asthma Among Children
• The prevalence of current asthma among children under age 18 years decreased from 9.4% in 2008 to 7.5% in 2018 (Figure 10).
• In 2018, the prevalence of current asthma was lower among children under age 5 years (3.8%) compared with those aged 5–17 years (8.9%) (Figure 10).
• In 2018, the prevalence of current asthma was highest among non-Hispanic black children at 14.3% compared with Hispanic (8.0%), non-Hispanic white (5.6%), and non-Hispanic Asian (3.6%) children (Figure 10).
Hypertension
• Updated guidelines for hypertension in 2017 lowered the threshold for high blood pressure to systolic pressure of 130 mm Hg or higher or diastolic pressure of 80 mm Hg or higher. Under these guidelines, the age-adjusted prevalence of hypertension (high blood pressure or currently taking high blood pressure medication) among adults aged 20 and over was 46.6% for 2017–2018 (Figure 11).
• The prevalence of hypertension among adults aged 20 and over increased with age. For 2017–2018, 27.5% of adults aged 20–44, 60.3% of those aged 45–64, and 77.3% of those aged 65 and over had hypertension (Figure 11).

Health, United States, 2019 3
Heart Disease Prevalence and History of Cancer
• From 2008 to 2018, the self-reported prevalence of heart disease was similar between men and women aged 18–44. In 2018, 4.6% of men and 5.0% of women aged 18–44 reported having heart disease. Among adults aged 45–64 and 65 and over, the prevalence was generally higher among men than women. In 2018, 13.3% of men and 10.4% of women aged 45–64, and 34.9% of men and 24.5% of women aged 65 and over, reported having heart disease (Figure 12).
• Among adults aged 18–44 and 45–64, women were more likely than men to report a history of cancer from 2008 to 2018. In 2018, 2.0% of women and 0.8% of men aged 18–44, and 8.8% of women and 4.8% of men aged 45–64, reported a history of cancer. Among those aged 65 and over, the percentages were similar for women (19.5%) and men (19.6%) (Figure 12).
Functional Limitation
• Functional limitation is defined by the reported level of difficulty (no difficulty, some difficulty, a lot of difficulty, or cannot do at all/unable to do) in any of six core functioning domains: seeing, hearing, mobility, communication, cognition, and self-care.
• In 2018, the age-adjusted percentage of adults aged 18–64 who reported having any level of difficulty in functioning was 36.1%, with 29.4% reporting “some difficulty” and another 6.7% reporting “a lot of difficulty or cannot do at all” (Figure 13).
• In 2018, the age-adjusted percentage of adults aged 65 and over who reported having any level of difficulty in functioning was 68.6%, with 45.6% reporting “some difficulty” and another 23.0% reporting “a lot of difficulty or cannot do at all” (Figure 13).
• From 2010 to 2018, the age-adjusted percentage of adults reporting “a lot of difficulty or cannot do at all” was stable for those aged 18–64 and 65 and over. During the same period, the age-adjusted percentage of adults reporting “some difficulty” increased for those aged 18–64 and 65 and over (Figure 13).
Health Care Access and Utilization
Use of Mammography and Colorectal Tests and Procedures
• The percentage of women aged 40–74 who had a mammogram in the past 2 years was stable from 2008 (69.3%) to 2018 (69.4%) (Figure 14).
• In 2018, non-Hispanic white (71.2%) and non-Hispanic black (70.5%) women were more likely to have had a mammogram in the past 2 years than Hispanic (64.0%) or non-Hispanic Asian (62.6%) women (Figure 14).
• The percentage of adults aged 50–75 who met colorectal cancer screening recommendations increased from 51.6% in 2008 to 67.2% in 2018 (Figure 14).
• In 2018, non-Hispanic white adults aged 50–75 reported the highest percentage of colorectal cancer screening (69.9%) compared with non-Hispanic black (65.2%), non-Hispanic Asian (58.2%), and Hispanic (57.9%) adults in the same age group (Figure 14).
Unmet Need Due to Cost
• In 2018, the percentage of people who reported delaying or not receiving needed medical care due to cost was highest among adults aged 26–64 (11.7%), followed by adults aged 19–25 (8.6%), those aged 65 and over (5.3%), and persons under age 19 (2.9%) (Figure 15).
• Among adults aged 19–25, the percentage who delayed or did not receive needed medical care due to cost was stable from 2008 to 2010, decreased from 2010 (14.8%) to 2015 (8.4%), and then was stable through 2018 (Figure 15).
Health Care Resources
Physicians
• In 2018, the supply of professionally active physicians in patient care per 100,000 resident population was lowest in Idaho (188.43), Mississippi (194.14), and Wyoming (196.37), and highest in the District of Columbia (672.22), Massachusetts (435.38), and Rhode Island (407.47). In general, states in the West South Central and Mountain areas had the fewest professionally active physicians in patient care per population, while states in the Middle Atlantic and New England areas had the most (Figure 16).
Dentists
• In 2019, the number of professionally active dentists in the United States was 61.06 per 100,000 resident population (Figure 17).
• In 2019, the supply of professionally active dentists per 100,000 resident population was lowest in Alabama (40.97), Arkansas (41.82), and Mississippi (42.91), and highest in the District of Columbia (104.00), Massachusetts (83.38), and Alaska (80.51). In general, states in the East and West South Central census divisions had the fewest professionally active dentists

4 Health, United States, 2019
per population, while states in the Middle Atlantic and Pacific census divisions had the most (Figure 17).
Health Care Expenditures and Payers
Personal Health Care Expenditures
• In 2018, personal health care expenditures in the United States totaled $3.08 trillion—a 4.1% increase from 2017. Expenditures for hospital care (38.8%), physician and clinical services (23.6%), and prescription drugs (10.9%) accounted for nearly three-quarters of total personal health care expenditures in 2018 (Figure 18).
• In 2018, 35.1% ($1.08 trillion) of the $3.08 trillion in personal health care expenditures was paid for by private health insurance, 22.7% ($0.70 trillion) by Medicare, 17.3% ($0.53 trillion) by Medicaid, and 12.2% ($0.38 trillion) by consumers out of pocket. The remaining expenditures were paid by other types of insurance, payers, and programs (Figure 18).
Health Insurance Coverage
• In 2018, the percentage of children under age 18 years who were uninsured was 5.2%, compared with 36.6% who had Medicaid coverage and 54.9% who had private health insurance (Figure 19).
• The percentage of children under age 18 years who were uninsured decreased from 2008 (9.0%) to 2015 (4.5%) and then was stable through 2018 (5.2%) (Figure 19).
• In 2018, the percentage of adults aged 18–64 who were uninsured was 13.2%, compared with 13.0% who had Medicaid coverage and 69.2% who had private health insurance (Figure 19).
• The percentage of adults aged 18–64 who were uninsured increased from 2008 (19.9%) to 2012 (20.9%), decreased from 2012 to 2015 (13.0%), and then was stable through 2018 (13.2%) (Figure 19).
Supplemental Insurance Among Medicare Beneficiaries
• From 2010 to 2018, about four out of every five Medicare beneficiaries aged 65 and over had some form of health insurance coverage to supplement Medicare, while one in five had traditional Medicare alone (Figure 20).
• The percentage with traditional Medicare alone was stable from 2010 to 2015 and then decreased an average 0.7 percentage points per year from 19.6% in 2015 to 17.3% in 2018 (Figure 20).
• In 2018, among Medicare beneficiaries aged 65 and over, 7.3% had Medicaid coverage, 39.9% had Medigap or a union- or employer-sponsored private plan, 26.5% were enrolled in Medicare Advantage, 8.7% had military coverage, and 17.3% had no supplemental coverage (Figure 20).

Health, United States, 2019 5
Chartbook

6 Health, United States, 2019
Health Status and DeterminantsLife Expectancy at Birth
Life expectancy at birth is the age to which a newborn is expected to live given current age-specific death rates. It summarizes patterns in mortality across all age groups in a given year, demonstrating the long-term impacts of age-specific death rates (3).
In the United States, life expectancy at birth was 78.7 years in 2018, 0.5 year higher than in 2008 (data table for Figure 1). Despite the overall increase in life expectancy at birth over the period, life expectancy declined 0.2 year from 2014 to 2017, then increased 0.1 year in 2018 (data table for Figure 1). Increases in mortality from unintentional injuries, Alzheimer’s disease, and suicide have contributed to the recent decreases in life expectancy (4).
Life expectancy at birth for males decreased 0.2 year from 76.5 in 2014 to 76.3 years in 2015, decreased another 0.1 year in 2016, and decreased again by 0.1 year to 76.1 years in 2017. From 2017 to 2018, life expectancy at birth for males increased 0.1 year to 76.2 years. Life expectancy at birth for females decreased 0.2 year from 81.3 in 2014 to
81.1 years in 2015, remained at 81.1 years through 2017, and then increased 0.1 year to 81.2 years in 2018. From 2008 to 2018, life expectancy for females was higher than for males, continuing a long-term pattern (5). In 2018, life expectancy at birth for females was 5.0 years higher than that for males.
From 2008 to 2018, life expectancy increased for Hispanic, non-Hispanic white, and non-Hispanic black persons. Throughout the period, life expectancy at birth was higher for Hispanic persons than for non-Hispanic white and non-Hispanic black persons. In 2008, the difference between the groups with the highest (Hispanic) and lowest (non-Hispanic black) life expectancy at birth was 6.9 years. In 2018, this difference increased to 7.1 years. However, the difference between non-Hispanic white and non-Hispanic black persons decreased over the period, from 4.5 years in 2008 to 3.9 years in 2018. In 2018, life expectancy at birth was 81.8 years for Hispanic persons, 78.6 years for non-Hispanic white persons, and 74.7 years for non-Hispanic black persons.
Hispanic
Black, not Hispanic
White, not Hispanic
Life
exp
ecta
ncy
(yea
rs)
0
60
80
100
201820080 20 40 60 80 100
Female
Male
Total
2014
2015
2016
2017
2018
Life expectancy (years)
Life expectancy at birth, by sex: 2014–2018
Life expectancy at birth, by race andHispanic origin: 2008–2018
78.978.778.7
78.778.6
76.576.3
76.2
76.276.1
81.381.181.181.181.2
Figure 1. Life expectancy at birth, by sex and race and Hispanic origin: United States, 2008–2018
NOTES: Starting with 2018 data, race-specific estimates (dashed lines) are tabulated according to the 1997 “Revisions to the Standards for the Classification of Federal Data on Race and Ethnicity” and are not completely comparable with estimates for earlier years. Persons of Hispanic origin may be of any race. See Technical Notes; Appendix II, Hispanic origin; Life expectancy; Race. See data table for Figure 1.SOURCE: NCHS, National Vital Statistics System (NVSS), Mortality. Excel and PowerPoint: https://www.cdc.gov/nchs/hus/contents2019.htm#Figure-001

Health, United States, 2019 7
Health Status and DeterminantsInfant Mortality
Infant mortality, the death of a baby before his or her first birthday, is a public health measure that reflects the health of the whole population, including living conditions, illness rates, access to health care, and maternal health (6,7).
From 2008 to 2010, the infant mortality rate decreased an average 3.9% per year from 6.61 to 6.14 infant deaths per 1,000 live births, and then decreased an average 0.9% per year to 5.67 in 2018. Among infants of non-Hispanic white women, the rate decreased an average 1.5% per year from 2008 to 2018. Among infants of non-Hispanic black women, the mortality rate decreased an average 5.3% per year from 2008 to 2010 and then decreased an average 0.7% per year through 2018. Among Hispanic women, the infant mortality rate decreased an average 1.0% per year from 2008 to 2018. Among infants of non-Hispanic American Indian or Alaska Native women, the mortality rate showed no clear trend from 2008 to 2018. Starting with 2017 data, estimates for non-Hispanic Asian and non-Hispanic Native Hawaiian or Other Pacific Islander groups are shown separately. It is still possible to look at longer-term trends among the combined group of non-Hispanic Asian or Pacific Islander women using bridged-race estimates. The infant mortality rate for this combined group decreased an average 1.1% per year from 2008 to 2018.
In 2018, infant deaths per 1,000 live births was 10.75 among non-Hispanic black women, 8.15 among non-Hispanic American Indian or Alaska Native women, 9.39 among non-Hispanic Native Hawaiian or Other Pacific Islander women, 4.86 among Hispanic women, 4.63 among non-Hispanic white women, and 3.63 among non-Hispanic Asian women. (See Technical Notes, Racial and Ethnic Data, for a discussion of changes in the presentation of estimates by race and Hispanic origin.)
In 2018, 56.1% of infant deaths were attributable to: congenital malformations, preterm births and low birth weight, sudden infant death syndrome (SIDS), maternal complications of pregnancy, and unintentional injuries. From 2008 to 2018, the number of infant deaths per 100,000 live births decreased for deaths due to congenital malformations (from 133.74 to 118.71), preterm births and low birth weight (from 112.00 to 97.12), SIDS (from 55.33 to 35.11), and maternal complications of pregnancy (from 41.80 to 36.17). The rates of infant deaths from unintentional injuries in 2008 and 2018 were similar (30.92 and 30.83 infant deaths per 100,000 live births, respectively).
Figure 2. Infant mortality rates, by race and Hispanic origin of mother and selected leading causes of death: United States, 2008–2018
NOTES: Congenital malformations is congenital malformations, deformations and chromosomal abnormalities. SIDS is sudden infant death syndrome. Unintentional injuries is another term for accidents. Starting with 2017 data, race-specific estimates (dashed lines) are tabulated according to the 1997 “Revisions to the Standards for the Classification of Federal Data on Race and Ethnicity” and are not completely comparable with estimates for earlier years. In 2017, the Asian or Pacific Islander group was split into two different race groups: Asian and Native Hawaiian or Other Pacific Islander. To look at longer trends, bridged-race estimates for the combined Asian or Pacific Islander group are also presented. Persons of Hispanic origin may be of any race. See Technical Notes; Appendix II, Hispanic origin; Race. See data table for Figure 2. SOURCE: NCHS, National Vital Statistics System (NVSS), Linked Birth/Infant Death Data Set. Excel and PowerPoint: https://www.cdc.gov/nchs/hus/contents2019.htm#Figure-002
Infa
nt d
eath
s pe
r 1,0
00 li
ve b
irths
Infa
nt d
eath
s pe
r 100
,000
live
birt
hs
0
2
4
6
8
10
12
14
Asian or Pacific Islander, not Hispanic
American Indian or AlaskaNative, not Hispanic
Hispanic
Black, not Hispanic
White, not Hispanic
Total
Race and Hispanic origin of mother
Native Hawaiian or OtherPacific Islander, not Hispanic
Asian, notHispanic
20182008
Selected leading causes of death:
2008 and 2018
0
20
40
60
80
100
120
140
Unintentionalinjuries
Maternalcomplicationsof pregnancy
SIDSPreterm birthand low
birthweight
Congenitalmalformations
2008 2018
133.7
118.7112.0
97.1
55.3
35.1 41.8 36.230.9 30.8

8 Health, United States, 2019
Health Status and DeterminantsSelected Causes of Death
Death rates are an important measure of population health. In 2018, 2,839,205 deaths were registered in the United States (5). The age-adjusted all-cause death rate was 723.6 deaths per 100,000 population in 2018, down from 774.9 in 2008.
From 2008 to 2018, heart disease and cancer remained the top two leading causes of death. Throughout the period, age-adjusted death rates decreased for heart disease and cancer, although the decline slowed for heart disease from 2011 to 2018. In 2018, age-adjusted deaths per 100,000 population for heart disease were 207.5 among males and 127.9 among females, and age-adjusted death rates for cancer were 176.8 among males and 128.6 among females.
The age-adjusted death rate for unintentional injuries—which includes unintentional drug overdoses (8)—was stable among males from 2008 to 2013, and then increased an average 5.5% per year from 53.1 in 2013 to 65.9 in 2018. The rate among females increased an average 2.6% per year from 25.4 in 2008 to 31.0 in 2018.
Age-adjusted deaths per 100,000 population for chronic lower respiratory disease decreased for both males and females from 2008 to 2018, by an average 1.5% per year
among males (from 52.3 in 2008 to 43.7 in 2018) and 0.4% per year among females (from 39.8 in 2008 to 36.8 in 2018). Age-adjusted death rates for stroke decreased for both males and females from 2008 to 2012—by an average 3.1% per year among males and 3.3% per year among females—and then were stable through 2018. In 2018, age-adjusted rates for stroke were 37.6 among males and 36.1 among females.
Age-adjusted death rates for Alzheimer’s disease were stable from 2008 to the early 2010s among both males and females, and then increased through 2018—by an average 5.2% per year among males (from 19.3 in 2013 to 24.5 in 2018) and 5.5% per year among females (from 26.1 in 2012 to 34.2 in 2018). From 2008 to 2018, the age-adjusted death rate for diabetes decreased among females an average 1.0% per year from 19.1 in 2008 to 16.8 in 2018. The age-adjusted rate for diabetes among males increased an average 0.6% per year from 25.9 in 2008 to 26.9 in 2018.
In 2018, age-adjusted deaths per 100,000 population were higher among males than females for all selected causes of death except Alzheimer’s disease, which was higher among females (34.2) than males (24.5).
Figure 3. Age-adjusted death rates for selected causes of death for all ages, by sex: United States, 2008–2018
10
100
1,000
10,000
2008 2018
Dea
ths
per
100
,000
pop
ulat
ion
(log
scal
e)
Male
Alzheimer’s disease
Diabetes
All causes
CLRD
Heart disease
Stroke
Cancer
Unintentional injuries
Alzheimer’s diseaseDiabetes
CLRDStroke
Female
All causes
Heart disease
Cancer
Unintentional injuries
2008 2018
NOTES: CLRD is chronic lower respiratory disease. Unintentional injuries is another term for accidents. Stroke is the major component of cerebrovascular disease. See data table for Figure 3.SOURCE: NCHS, National Vital Statistics System (NVSS), Mortality. Excel and PowerPoint: https://www.cdc.gov/nchs/hus/contents2019.htm#Figure-003

Health, United States, 2019 9
Health Status and DeterminantsDrug Overdose Deaths
Drug overdose deaths remain a public health concern in the United States. In 2018, there were 67,367 drug overdose deaths nationwide—fewer than in 2017 (70,237 deaths) but more than in 2008 (36,450 deaths) (8). In 2018, most drug overdose deaths involved an opioid (69.5%), as this category continued its pattern of driving changes in the overall drug overdose death rate in recent years (8,9).
The age-adjusted drug overdose death rate was stable from 2008 (11.9 deaths per 100,000) to 2013 and then increased to 20.7 in 2018. However, from 2017 to 2018, a 4.6% decrease occurred in the drug overdose death rate (8) (data table for Figure 4).
Among males, the age-adjusted drug overdose death rate was higher in 2018 (27.9 deaths per 100,000) compared with 2008 (14.9) (data table for Figure 4). The age-adjusted drug overdose death rate remained stable from 2008 to 2013 and then increased an average 12.5% per year through 2018. Among the age groups shown, drug overdose death rates among males increased from 2008 to 2018 among those aged 15–24, 25–34, and 55–64, and increased at different rates from 2008 to 2018 among those aged 65 and over. Among males aged 35–44 and 45–54, death rates were stable from 2008 to 2013 and then increased to 2018.
In 2018, drug overdose death rates among males were lowest among those aged 65 and over (10.2) and highest among those aged 35–44 (52.4).
Among females, the age-adjusted drug overdose death rate was higher in 2018 (13.6) compared with 2008 (8.9). The rate increased by an average 5.0% per year from 2008 to 2018. Drug overdose death rates among females increased from 2008 to 2018 among those aged 15–24, 25–34, 35–44, 45–54, and 65 and over. Among those aged 55–64, death rates increased from 2008 to 2016 and then were stable through 2018. In 2018, drug overdose death rates among women were lowest among those aged 65 and over (5.5) and highest among those aged 35–44 and 45–54 (24.2 and 24.8, respectively). In 2018, for all age groups shown, drug overdose death rates were higher among males than females.
Despite overall increases in drug overdose death rate trends, death rates decreased for this cause from 2017 to 2018 among males and females aged 15–24, 25–34, and 45–54. Among men and women aged 35–44 and 55–64, and women aged 65 and over, drug overdose death rates did not change from 2017 to 2018.
Dea
ths
per 1
00,0
00 p
opul
atio
n
20182008
0
10
20
30
40
50
60
45–54
35–44
25–34
55–6415–24
65 and over
Male Female
20182008
45–54
35–44
25–3455–64
15–24
65 and over
Figure 4. Drug overdose death rates among persons aged 15 years and over, by sex and age: United States, 2008–2018
NOTES: Drug overdose deaths are identified using International Classification of Diseases, 10th Revision (ICD–10) underlying cause of death codes X40–X44 (unintentional drug poisoning), X60–X64 (suicide by drug poisoning), X85 (homicide by drug poisoning), and Y10–Y14 (drug poisoning of undetermined intent). See data table for Figure 4.SOURCE: NCHS, National Vital Statistics System (NVSS), Mortality. Excel and PowerPoint: https://www.cdc.gov/nchs/hus/contents2019.htm#Figure-004

10 Health, United States, 2019
Health Status and DeterminantsSuicide
The age-adjusted suicide rate in the United States has increased steadily since 1999 (10–12). Since 2008, suicide has been the 10th leading cause of death (13,14).
From 2008 to 2018, the age-adjusted suicide rate increased an average 2.0% per year from 11.6 to 14.2 deaths per 100,000 population. The age-adjusted rate among males increased an average 1.4% per year from 19.0 in 2008 to 21.4 in 2016 and then increased an average 3.5% per year to 22.8 in 2018. The age-adjusted rate among females increased an average 3.4% per year from 4.8 in 2008 to 6.0 in 2015, and then showed no clear trend through 2018 (6.2 deaths per 100,000). In each year from 2008 to 2018, the age-adjusted suicide rate was higher among males than females.
Among males, the percentage of suicides involving firearms was stable from 2008 to 2018. The percentage of suicides involving suffocation increased by 0.3 percentage point per year over the period. The percentage of suicides involving poisoning declined during the period, although at varying rates. In 2018, firearms were the most frequent means of suicide among males, accounting for more than one-half of suicides (55.9%). Suicide by suffocation was the next most common (28.3%), followed by poisoning (8.3%). Among females, the percentage of suicides involving poisoning declined during the period, although at varying rates. From 2008 to 2018, the percentage of suicides involving firearms showed no clear trend. The percentage of suicides involving suffocation increased an average 0.8 percentage point per year over the period. In 2018, firearms (31.5%), suffocation (29.9%), and poisoning (29.3%) were the most frequent means of suicide among females.
Figure 5. Suicide, by sex and means: United States, 2008–2018
NOTES: Suicide deaths are identified using International Classification of Diseases, 10th Revision (ICD–10) underlying cause of death codes U03, X60–X84, and Y87.0. Estimates may not sum to 100% due to rounding. See data table for Figure 5. SOURCE: NCHS, National Vital Statistics System (NVSS), Mortality. Excel and PowerPoint: https://www.cdc.gov/nchs/hus/contents2019.htm#Figure-005
20182008
Dea
ths
per 1
00,0
00 p
opul
atio
n (a
ge a
djus
ted)
Perc
ent d
istr
ibut
ion
0
10
20
30
Total
Female
Male
0
20
40
60
80
100Other
Poisoning
Suffocation
Firearm
2018200820182008
Deaths from suicide, by sex and means:
2008 and 2018
Male Female
7.3 7.5 9.5 9.3
29.3
29.9
31.5
21.0
30.2
39.3
8.3
28.3
55.9
12.2
24.6
56.0

Health, United States, 2019 11
Health Status and DeterminantsMaternal Mortality
Maternal mortality is defined by the World Health Organization as the death of a woman while pregnant or within 42 days of being pregnant from any cause related to or aggravated by the pregnancy or its management, but not from accidental or incidental causes (15). Maternal mortality estimates have not been reported since 2007 due to the staggered implementation of the 2003 U.S. Standard Certificate of Death between 2003 and 2018, which added a checkbox to determine pregnancy status at the time of death (16–18). An extensive review determined that the most accurate measurement of maternal mortality used the information from the pregnancy checkbox for women aged 44 and under and did not use this information for women aged 45 and over (16).
In 2018, the maternal mortality rate for women of all ages was 17.4 deaths per 100,000 live births (658 deaths). Women aged 40 and over (81.9 deaths per 100,000 live births) had a higher maternal mortality rate than women aged 25–39 (16.6 deaths per 100,000 live births) and women under age 25 (10.6 deaths per 100,000 live births). Among
the three race and Hispanic-origin groups shown, maternal deaths per 100,000 live births among non-Hispanic black women (37.3) were more than twice the rate among non-Hispanic white women (14.9) and more than three times the rate among Hispanic women (11.8).
The disparities in maternal mortality by race and Hispanic origin found for all ages were also found within certain age groups. In 2018, among women aged 25–39 and 40 and over, non-Hispanic black women had higher maternal mortality rates than non-Hispanic white and Hispanic women. Among women under age 25, maternal deaths per 100,000 live births were 15.3 for non-Hispanic black women, 10.5 for non-Hispanic white women, and 7.6 for Hispanic women. Among women aged 25–39, maternal deaths per 100,000 live births were 38.2 for non-Hispanic black women, 13.8 for non-Hispanic white women, and 12.4 for Hispanic women. Among women aged 40 and over, maternal deaths per 100,000 live births were 239.9 for non-Hispanic black women, more than three times the rate for non-Hispanic white women (72.0).
Deaths per 100,000 live births
*
0 50 100 150 200 250
HispanicBlack, not Hispanic
White, not Hispanic40 and over
HispanicBlack, not Hispanic
White, not Hispanic25–39
Hispanic Black, not Hispanic
White, not HispanicUnder 25
HispanicBlack, not Hispanic
White, not HispanicAll ages 17.4
14.937.3
11.8
10.610.5
15.37.6
16.613.8
38.212.4
81.972.0
239.9
Figure 6. Maternal mortality, by age and race and Hispanic origin: United States, 2018
* Estimate is considered unreliable; rate not shown is based on fewer than 20 deaths in the numerator.NOTES: Maternal deaths are defined by the World Health Organization as the death of a woman while pregnant or within 42 days of termination of pregnancy, regardless of the duration and the site of the pregnancy, from any cause related to or aggravated by the pregnancy or its management. Deaths resulting from accidents, homicides, and suicides are excluded. Race-specific estimates are tabulated according to the 1997 “Revisions to the Standards for the Classification of Federal Data on Race and Ethnicity.” Estimates by race may differ from other estimates based on the same data and presented elsewhere if race groups are defined differently. Persons of Hispanic origin may be of any race. For more information, see Appendix II, Hispanic origin; Maternal death; Race. See data table for Figure 6.SOURCE: NCHS, National Vital Statistics System (NVSS), Mortality. Excel and PowerPoint: https://www.cdc.gov/nchs/hus/contents2019.htm#Figure-006

12 Health, United States, 2019
Health Status and DeterminantsTeen Births
Teen births—births to females under age 20—may carry negative social and health consequences for the mother and baby (19). Infants born to teen mothers are at increased risk of low birth weight and preterm birth, which, in turn, puts them at risk of infant morbidity and mortality (20).
In 2018, a total of 179,871 babies were born to teenagers aged 15–19. From 2008 to 2018, birth rates among teenagers decreased an average 8.2% per year, from 40.2 to 17.4 live births per 1,000 females. Teen birth rates decreased among each race and Hispanic-origin group from 2008 to 2018, although the percentage decrease varied by group. Birth rates decreased an average 8.5% per year among non-Hispanic black teenagers and 7.6% per year among non-Hispanic American Indian or Alaska Native teenagers from 2008 to 2018. Among non-Hispanic white teenagers, the birth rate decreased an average 6.7% per year from 2008 to 2012, and then decreased more rapidly by an average 8.4% per year through 2018. Among Hispanic teenagers, the birth rate decreased an average 10.9% per year from 2008 to 2011, and then decreased more slowly
by an average 8.6% per year through 2018. Estimates for non-Hispanic Asian and non-Hispanic Native Hawaiian or Other Pacific Islander groups are shown separately. It is still possible to look at longer-term trends among the combined group of non-Hispanic Asian or Pacific Islander women using bridged-race estimates. The birth rate for this combined group decreased an average 9.0% per year from 2008 to 2013, and then decreased more rapidly by an average 12.0% per year through 2018.
In 2018, live births per 1,000 females among non-Hispanic American Indian or Alaska Native (29.7), Hispanic (26.7), non-Hispanic Native Hawaiian or Other Pacific Islander (26.5), and non-Hispanic black (26.3) teenagers were more than twice those among non-Hispanic white teenagers (12.1). Non-Hispanic Asian teenagers had the lowest birth rate (2.8) of the race and Hispanic-origin groups in 2018. (See Technical Notes, Racial and Ethnic Data, for a discussion of changes to the presentation of estimates by race and Hispanic origin.)
Live
birt
hs p
er 1
,000
fem
ales
age
d 15
–19
year
s
Asian or Pacific Islander, not Hispanic
American Indian or AlaskaNative, not Hispanic
Hispanic
Black, not Hispanic
White, not Hispanic
Total
0
20
40
60
80
100
Native Hawaiian or OtherPacific Islander, not Hispanic
Asian, not Hispanic
20182008
Figure 7. Teen births among females aged 15–19 years, by race and Hispanic origin: United States, 2008–2018
NOTES: Starting with 2016 data, race-specific estimates (dashed lines) are tabulated according to the 1997 “Revisions to the Standards for the Classification of Federal Data on Race and Ethnicity” and are not completely comparable with estimates for earlier years. In 2016, the Asian or Pacific Islander group was split into two different race groups: Asian and Native Hawaiian or Other Pacific Islander. To look at longer trends, bridged-race estimates for the combined Asian or Pacific Islander group are also presented. Persons of Hispanic origin may be of any race. See Technical Notes; Appendix II, Hispanic origin; Race. See data table for Figure 7. SOURCE: NCHS, National Vital Statistics System (NVSS), Natality. Excel and PowerPoint: https://www.cdc.gov/nchs/hus/contents2019.htm#Figure-007

Health, United States, 2019 13
Health Status and DeterminantsPreterm Singleton Births
Gestational age is an important predictor of an infant’s survival and subsequent health (21–25). Preterm births, defined as births delivered at less than 37 completed weeks of gestation, is a leading cause of infant death in the United States (Figure 2). Infants delivered at less than 32 completed weeks of gestation (early preterm births) are at the greatest risk of death during infancy compared with infants born with longer gestational ages (26). Preterm births are more likely to occur in twin or higher-order pregnancies. In Health, United States, preterm births are examined among singleton births only.
The total percentage of singleton births that were preterm decreased an average 1.4% per year from 8.5% in 2008 to 7.7% in 2014, and then increased an average 1.8% per year to 8.2% in 2018, driven by changes in late preterm births (27). The percentage of births that were early preterm decreased an average 0.6% per year from 2008 to 2015 and
then was stable through 2018. The percentage of births that were moderate preterm (32–33 weeks) decreased an average 0.7% per year from 2008 to 2014, and then increased an average 1.1% per year through 2018. The percentage of births that were late preterm (34–36 weeks) decreased an average 1.7% per year from 2008 to 2014, and then increased an average 2.3% per year through 2018.
In 2018, non-Hispanic black women had the highest percentage of preterm births (11.9%), while non-Hispanic Asian (7.1%) and non-Hispanic white (7.2%) women had the lowest. Across each of the three gestational age groups, non-Hispanic black, non-Hispanic Native Hawaiian or Other Pacific Islander, and non-Hispanic American Indian or Alaska Native women were more likely to have a preterm birth than Hispanic, non-Hispanic white, and non-Hispanic Asian women in 2018.
Figure 8. Preterm singleton births, by gestational age and race and Hispanic origin of mother: United States, 2008–2018
NOTES: Preterm singleton births are based on the obstetric estimate of gestational age and limited to singleton births. Singleton births refer to single births, in contrast with multiple or higher-order births, such as twins or triplets. Starting with 2016 data, race-specific estimates are tabulated according to the 1997 “Revisions to the Standards for the Classification of Federal Data on Race and Ethnicity” and are not completely comparable with estimates for earlier years. In 2016, the Asian or Pacific Islander group was split into two different race groups: Asian and Native Hawaiian or Other Pacific Islander. Persons of Hispanic origin may be of any race. Estimates may not sum to total percentage due to rounding. See Appendix II, Hispanic origin; Race. See data table for Figure 8.SOURCE: NCHS, National Vital Statistics System (NVSS), Natality. Excel and PowerPoint: https://www.cdc.gov/nchs/hus/contents2019.htm#Figure-008
Perc
ent o
f liv
e si
ngle
ton
birt
hs th
at w
ere
pret
erm
Less than 32 weeks32–33 weeks
34–36 weeks
Total (less than 37 weeks)
0
5
10
15
20182008
2018
10.3
7.5
1.2
1.7
10.2
7.6
1.2
1.3
0.9
8.4
6.3
1.2
7.2
5.6
0.7
0.9
7.1
5.4
0.7
1.0
11.9
1.4
2.6
7.9
Asian, notHispanic
White, notHispanic
Hispanicor Latina
AmericanIndian or
AlaskaNative, not
Hispanic
Native Hawaiian or Other
Pacific Islander,not Hispanic
Black, notHispanic
34–36 weeks
32–33 weeks
Less than 32 weeks

14 Health, United States, 2019
Health Status and DeterminantsUse of Tobacco Products
Cigarette smoking causes several diseases, including coronary heart disease, stroke, chronic obstructive pulmonary disease, and cancer (28). Of risk factors evaluated by the U.S. Burden of Disease Collaborators for 2016, tobacco use was the second-leading risk factor for death in the United States (29).
Overall, the age-adjusted percentage of adults aged 18 and over who currently smoked cigarettes decreased an average 0.7 percentage point per year from 20.6% in 2008 to 13.9% in 2018. From 2008 to 2018, the percentage of adults who currently smoked cigarettes decreased among adults aged 18–44, 45–64, and 65 and over. Among adults aged 18–44, current cigarette smoking decreased an average 1.0 percentage point per year from 23.1% in 2008 to 14.3% in 2018. Among adults aged 45–64, current cigarette smoking decreased an average 0.7 percentage point per year from 22.6% in 2008 to 16.3% in 2018. Among adults aged 65 and over, current cigarette smoking decreased an average 0.1 percentage point per year from 9.3% in 2008 to 8.4% in 2018.
From 2008 to 2015, the percentage of adults who currently smoked cigarettes did not differ among those
aged 18–44 and those aged 45–64; however, from 2016 to 2018, the percentage was higher among adults aged 45–64. Current cigarette smoking remained the lowest among adults aged 65 and over throughout the period.
Electronic cigarettes (e-cigarettes) were introduced in the United States around 2007 (30). These battery-powered tobacco products typically deliver nicotine and other chemicals, such as propylene glycol and flavorings, in the form of an aerosol (31). Increases in e-cigarette use contributed to the increase in any tobacco product use among high school students during 2017–2018, erasing the decrease in any tobacco product use observed since 2011 (32,33).
The use of any tobacco product in the past 30 days among students in grades 9–12 did not differ in 2018 compared with 2011. While the use of most individual products—cigarettes, cigars, smokeless tobacco, and pipe tobacco—decreased over this period, use of e-cigarettes in the past 30 days increased from 1.5% in 2011 to 20.8% in 2018. From 2017 to 2018, e-cigarette use among students in grades 9–12 increased by 77.8%, from 11.7% to 20.8% (data table for Figure 9).
20182008
Perc
ent
0
5
10
15
20
25
30
65 and over
Total (age adjusted)45–64
18–44
Current cigarette smoking among adults aged 18 and over
Percent
Tobacco use in the past 30 days among adolescents in grades 9–12: 2011 and 2018
0 5 10 15 20 25 30
Hookah
Smokelesstobacco
Cigar
Cigarette
Electroniccigarette
Anytobaccoproduct
2011
24.227.1
20.8
2018
1.5
15.88.1
11.67.6
7.95.9
4.14.1
Figure 9. Cigarette smoking among adults aged 18 and over, by age, and tobacco use among adolescents in grades 9–12, by type of product: United States, 2008–2018
NOTES: Current cigarette smoking by adults is defined as ever smoking 100 cigarettes in their lifetime and smoking now every day or some days. Use of tobacco products by high school students in grades 9–12 is defined as having used the product on one or more days during the past 30 days. Data on pipe tobacco can be found in the data table. See data table for Figure 9. Data for the 2019 National Youth Tobacco Survey (NYTS) are available but not shown. Changes made to the 2019 NYTS could result in higher estimates of tobacco use and therefore are not directly comparable with estimates from prior years. For 2019 estimates, see https://www.cdc.gov/mmwr/volumes/68/ss/ss6812a1.htm. SOURCE: NCHS, National Health Interview Survey (NHIS) (Current cigarette smoking chart); and CDC, National Youth Tobacco Survey (NYTS) (Tobacco use chart). Excel and PowerPoint: https://www.cdc.gov/nchs/hus/contents2019.htm#Figure-009

Health, United States, 2019 15
Health Status and DeterminantsCurrent Asthma Among Children
Asthma is a chronic lung disease that inflames and narrows the airways, causing recurring periods of wheezing, chest tightness, shortness of breath, and coughing (34).
The prevalence of current asthma among children under age 18 years decreased an average 0.2 percentage point per year from 9.4% in 2008 to 7.5% in 2018. From 2008 to 2018, the prevalence of current asthma among children under age 5 years decreased an average 0.3 percentage point per year from 6.2% to 3.8%, and the prevalence among children aged 5–17 years decreased an average 0.2 percentage point per year from 10.7% to 8.9%. From
2008 to 2018, the prevalence of asthma was lower among children under age 5 years compared with children aged 5–17 years. In 2018, the prevalence of asthma among children aged 5–17 years was about twice as high as among children under age 5 years.
In 2018, the prevalence of current asthma among children under age 18 years varied across race and Hispanic-origin groups. The prevalence was highest among non-Hispanic black children (14.3%) compared with Hispanic (8.0%), non-Hispanic white (5.6%), and non-Hispanic Asian (3.6%) children.
Perc
ent
Under 5 years
Total
5–17 years
20182008
0
5
10
15
20Age group
Asian, notHispanic
Black, notHispanic
White, notHispanic
Hispanic
Race and Hispanic origin: 2018
8.0
5.6
14.3
3.6
Figure 10. Current asthma among children under age 18 years, by age and race and Hispanic origin: United States, 2008–2018
NOTES: Current asthma is based on a parent or knowledgeable adult responding yes to both questions, "Has a doctor or other health professional ever told you that your child had asthma?" and "Does your child still have asthma?" See data table for Figure 10. SOURCE: NCHS, National Health Interview Survey (NHIS). Excel and PowerPoint: https://www.cdc.gov/nchs/hus/contents2019.htm#Figure-010

16 Health, United States, 2019
Health Status and DeterminantsHypertension
Hypertension is a risk factor for cardiovascular disease, stroke, and other health conditions (35,36), and a leading preventable cause of cardiovascular deaths in the United States (37–39). In 2017, the American College of Cardiology and the American Heart Association Task Force recommended adopting lower thresholds of high blood pressure. For systolic blood pressure, the threshold was lowered from 140 mm Hg to 130 mm Hg, and for diastolic blood pressure, from 90 mm Hg to 80 mm Hg (35,36).
Starting with this year’s Health, United States, hypertension is defined as having measured high blood pressure using the 2017 guidelines (systolic blood pressure of at least 130 mm Hg or diastolic blood pressure of at least 80 mm Hg) or currently taking high blood pressure medication. Using this definition, the prevalence of age-adjusted hypertension among adults aged 20 and over decreased from 48.4% in 1999–2000 to 43.0% in 2013–2014, and then increased to 46.6% in 2017–2018. The prevalence of hypertension among adults aged 20–44 decreased from 28.6% in 1999–2000 to 22.8% in 2013–2014, and
then increased to 27.5% in 2017–2018. The prevalence of hypertension among adults aged 45–64 decreased from 61.4% in 1999–2000 to 55.2% in 2009–2010, and then was stable through 2017–2018 (60.3%). From 1999–2000 to 2017–2018, the prevalence of hypertension among adults aged 65 and over decreased from 82.3% to 77.3%. Throughout the period, the prevalence of hypertension increased with age. In 2017–2018, the prevalence of hypertension among adults aged 65 and over was 2.8 times that among adults aged 20–44.
Compared with the former guidelines for hypertension (35), the 2017 revised guidelines (36) resulted in a higher percentage of the population aged 20 and over being categorized as having hypertension—46.6% instead of 31.0% (age adjusted) in 2017–2018. Implementation of the revised 2017 hypertension guidelines resulted in increases in prevalence among all adult age groups (aged 20 and over). The impact was greatest among adults aged 20–44, where the 2017–2018 prevalence more than doubled from 10.5% to 27.5% (data table for Figure 11).
0
20
40
60
80
100
Total (age adjusted)
65 and over
45–64
20–44
2017–20181999–2000
Perc
ent
Figure 11. Hypertension among adults aged 20 and over, by age: United States, 1999–2000 through 2017–2018
NOTES: Hypertension is defined as having measured high blood pressure (systolic pressure of at least 130 mm Hg or diastolic pressure of at least 80 mm Hg) or taking high blood pressure medication. Overall estimates are age adjusted; age-specific estimates are crude. For more information, see Appendix II, Hypertension; Table VI. See data table for Figure 11.SOURCE: NCHS, National Health and Nutrition Examination Survey (NHANES). Excel and PowerPoint: https://www.cdc.gov/nchs/hus/contents2019.htm#Figure-011

Health, United States, 2019 17
Health Status and DeterminantsHeart Disease and Cancer
Heart disease and cancer are the top two causes of death in the United States, accounting for 44.2% of all deaths in 2018 (Table 6). Heart disease and cancer mortality have decreased over the past several decades, although the decrease in heart disease mortality has slowed recently (14,40).
From 2008 to 2018, the self-reported prevalence of heart disease was stable among men aged 18–44 and 45–64. Among men aged 65 and over, the prevalence decreased an average 0.3 percentage point per year from 37.3% in 2008 to 34.9% in 2018. Among women aged 18–44, the prevalence of heart disease decreased an average 0.3 percentage point per year from 5.0% in 2008 to 3.7% in 2012, and then increased an average 0.1 percentage point per year to 5.0% in 2018. Among women aged 45–64, the prevalence decreased an average 0.1 percentage point per year from 11.5% in 2008 to 10.4% in 2018. Among women aged 65 and over, the prevalence decreased an average 0.4 percentage point per year from 28.9% in 2008 to 24.5% in 2018.
Among both men and women, the prevalence of heart disease was higher in the older age groups compared with the youngest age group. From 2008 to 2018, the
prevalence among adults aged 18–44 was similar among men and women. Among those aged 45–64 and 65 and over, the prevalence was generally higher among men than women during the period. In 2018, 13.3% of men and 10.4% of women aged 45–64, and 34.9% of men and 24.5% of women aged 65 and over, reported having heart disease.
From 2008 to 2018, the percentage of men reporting a history of cancer was stable among all age groups. Among women, the percentage reporting a history of cancer decreased an average 0.1 percentage point per year from 2.8% in 2008 to 2.0% in 2018 among those aged 18–44, was stable for those aged 45–64, and increased an average 0.2 percentage point per year from 17.9% in 2008 to 19.5% in 2018 for those aged 65 and over.
The percentages of both men and women who reported a history of cancer was higher in the older age groups compared with the youngest age group. Among adults aged 18–44 and 45–64, women were more likely than men to report a history of cancer from 2008 to 2018. In 2018, a history of cancer was reported by 0.8% of men and 2.0% of women aged 18–44, and by 4.8% of men and 8.8% of women aged 45–64. Percentages were similar among men (19.6%) and women (19.5%) aged 65 and over.
Perc
ent
0
10
20
30
40
50
Women, 65 and over
Women, 45–64Women, 18–44
Men, 65 and over
Men, 45–64
Men, 18–44
20182008
CancerHeart disease
20182008
Women, 65 and over
Women, 45–64
Women, 18–44
Men, 65 and over
Men, 45–64
Men, 18–44
Figure 12. Heart disease and cancer among adults aged 18 and over, by sex and age: United States, 2008–2018
NOTES: Heart disease is based on self-reported responses to questions about whether respondents had ever been told by a doctor or other health professional that they had coronary heart disease, angina (angina pectoris), a heart attack (myocardial infarction), or any other kind of heart disease or heart condition. Cancer is based on self-reported responses to a question about whether respondents had ever been told by a doctor or other health professional that they had cancer or a malignancy of any kind (excluding squamous cell and basal cell carcinomas). See data table for Figure 12. SOURCE: NCHS, National Health Interview Survey (NHIS). Excel and PowerPoint: https://www.cdc.gov/nchs/hus/contents2019.htm#Figure-012

18 Health, United States, 2019
Health Status and DeterminantsFunctional Limitation
Limitations in functioning may be a result of physical or mental impairments and can result in lower levels of educational attainment, employment, and participation in other daily activities (41). Functional limitation is defined by the reported level of difficulty (no difficulty, some difficulty, a lot of difficulty, or cannot do at all/unable to do) in six core functioning domains: seeing, hearing, mobility, communication, cognition, and self-care. Adults who reported having “some difficulty” or “a lot of difficulty or cannot do at all” to at least one core domain were classified as having difficulty in functioning. Adults reporting “a lot of difficulty or cannot do at all” to at least one domain of functioning are considered to have disability.
The age-adjusted percentage of adults aged 18–64 who reported having “a lot of difficulty or cannot do at all” in at least one of the six functioning domains showed no clear trend from 2010 to 2018. From 2010 to 2018, the age-adjusted percentage of adults aged 18–64 who reported having “some difficulty” in at least one domain, but not reporting “a lot of difficulty or cannot do at all” in
any domain, increased an average 0.4 percentage point per year. In 2018, the age-adjusted percentage of adults aged 18–64 who reported having any difficulty was 36.1%, with 29.4% reporting “some difficulty” and another 6.7% reporting “a lot of difficulty or cannot do at all.”
From 2010 to 2018, adults aged 65 and over were more likely to report having any level of difficulty when compared with adults aged 18–64 (data table for Figure 13). The age-adjusted percentage of adults aged 65 and over who reported having “a lot of difficulty or cannot do at all” in at least one of the six functioning domains showed no clear trend from 2010 to 2018. From 2010 to 2018, the age-adjusted percentage of adults aged 65 and over who reported having “some difficulty” in at least one domain, but not reporting “a lot of difficulty or cannot do at all” in any domain, increased by an average 0.3 percentage point per year. In 2018, the age-adjusted percentage of adults aged 65 and over who reported having any difficulty was 68.6%, with 45.6% reporting “some difficulty” and another 23.0% reporting “a lot of difficulty or cannot do at all.”
Figure 13. Functional limitation among adults aged 18 and over, by age and level of difficulty: United States, 2010–2018
NOTES: Functional limitation is defined by the reported level of difficulty in six domains of functioning: seeing (even if wearing glasses), hearing (even if wearing hearing aids), mobility (walking or climbing stairs), communication (understanding or being understood by others), cognition (remembering or concentrating), and self-care (such as washing all over or dressing). Adults who respond “a lot of difficulty” or “cannot do at all/unable to do” to at least one question are classified in the “a lot of difficulty or cannot do at all” category. Of the remaining respondents, adults who respond “some difficulty” to at least one question are classified in the “some difficulty” category, and adults who respond “no difficulty” to all questions are classified in the “no difficulty” category. Estimates are age adjusted and may not sum to 100% due to rounding. See data table for Figure 13. SOURCE: NCHS, National Health Interview Survey (NHIS). Excel and PowerPoint: https://www.cdc.gov/nchs/hus/contents2019.htm#Figure-013
2010
Perc
ent d
istr
ibut
ion
0
20
40
60
80
100
Some difficulty
No difficulty
A lot of difficulty or cannot do at all
2018
65 and over18–64
Some difficulty
No difficulty
A lot of difficulty or cannot do at all
20182010

Health, United States, 2019 19
Health Care Access and Utilization Use of Mammography and Colorectal Tests and Procedures
Cancer screening tests aim to detect cancers at early or precancerous stages, when cancer may be easier to treat successfully (42). Although breast cancer and colorectal cancer remain among the leading causes of cancer deaths in the United States, advancements in and increased use of cancer screening tests have contributed to decreasing cancer death rates (43–45). The definitions of breast and colorectal cancer screening presented in Health, United States are consistent with the recommendations of the U.S. Preventive Services Task Force (46–48) at the time the data were collected (Appendix II, Colorectal tests or procedures; Mammography).
From 2008 to 2018, the percentage of women aged 40–74 who had a mammogram in the past 2 years was
stable for all race and Hispanic-origin groups. In 2018, non-Hispanic white (71.2%) and non-Hispanic black (70.5%) women were more likely to have had a mammogram in the past 2 years than Hispanic (64.0%) or non-Hispanic Asian (62.6%) women.
The percentage of adults aged 50–75 who reported meeting colorectal cancer screening recommendations increased from 2008 to 2018 for all race and Hispanic-origin groups. Even with increases in all groups, screening use differed by race and Hispanic origin. In 2018, non-Hispanic white adults aged 50–75 reported the highest percentage of colorectal cancer screening (69.9%), compared with non-Hispanic black (65.2%), non-Hispanic Asian (58.2%), and Hispanic (57.9%) adults in the same age group.
Perc
ent
0
20
40
60
80
100
Hispanic
Use of mammography amongwomen aged 40–74
White, not Hispanic
20182015201320102008
2009 USPSTFrecommendations
2016 USPSTFrecommen-dations
Black, not Hispanic
Asian, not Hispanic
20182015201320102008
White, not HispanicBlack, not Hispanic
2008 USPSTFrecommendations
2016 USPSTFrecommen-dations
Hispanic
Asian, not Hispanic
Use of colorectal cancer test or procedure among adults aged 50–75
Figure 14. Use of mammography among women aged 40–74 and use of colorectal cancer testing among adults aged 50–75, by race and Hispanic origin: United States, 2008–2018
NOTES: USPSTF is U.S. Preventive Services Task Force. Data on cancer screening are collected intermittently, not annually. Use of mammography is defined as reporting a mammogram within the past 2 years. For 2008–2013 estimates, use of a colorectal cancer test was defined as reporting a fecal occult blood test (FOBT) in the past year, sigmoidoscopy in the past 5 years with FOBT in the past 3 years, or colonoscopy in the past 10 years. For 2015 estimates, fecal immunochemical test (FIT) in the past year was included in the definition of colorectal cancer testing. For 2018 estimates, use of a colorectal cancer test is defined as FOBT or FIT test in the past year, FIT-DNA test in the past 3 years, sigmoidoscopy in the past 5 years, computed tomography or CT colonography in the past 5 years, or colonoscopy in the past 10 years. Race-specific estimates are limited to those reporting only one racial group and tabulated according to the 1997 “Revisions to the Standards for the Classification of Federal Data on Race and Ethnicity.” Persons of Hispanic origin may be of any race. See data table for Figure 14.SOURCE: NCHS, National Health Interview Survey (NHIS). Excel and PowerPoint: https://www.cdc.gov/nchs/hus/contents2019.htm#Figure-014

20 Health, United States, 2019
Health Care Access and Utilization Unmet Need Due to Cost
Out-of-pocket costs may be a barrier to obtaining health care (49,50). Persons without health insurance coverage are more likely to delay or forego needed medical care due to cost than are those with insurance coverage (51). In the United States, eligibility for health insurance coverage changes across a person’s lifespan. For example, children and young adults may be covered by the Children’s Health Insurance Program, adults aged 19–25 may be able to obtain insurance coverage under their parents’ plan, and adults aged 65 and over are generally eligible for Medicare (Appendix II, Health insurance) (52–54).
Among persons under age 19, the percentage who delayed or did not receive needed medical care due to cost decreased an average 0.6 percentage point per year from 5.4% in 2008 to 3.4% in 2012, decreased an average 0.2 percentage point per year to 2.6% in 2016, and then was stable through 2018. Among adults aged 19–25, the percentage who delayed or did not receive needed medical
care due to cost was stable from 2008 to 2010, decreased an average 1.3 percentage points per year from 14.8% in 2010 to 8.4% in 2015, and then was stable through 2018. Among adults aged 26–64, the percentage who had unmet need due to cost increased an average 0.7 percentage point per year from 13.7% in 2008 to 14.8% in 2010, decreased an average 0.9 percentage point per year to 10.2% in 2016, and then increased again an average 0.8 percentage point per year to 11.7% in 2018. Among adults aged 65 and over, the percentage who had unmet need decreased an average 0.1 percentage point per year from 4.5% in 2008 to 3.8% in 2016, and then increased an average 0.7 percentage point per year to 5.3% in 2018. In 2018, the percentage who reported delaying or not receiving needed medical care due to cost was highest for adults aged 26–64 (11.7%), followed by adults aged 19–25 (8.6%), adults aged 65 and over (5.3%), and persons under age 19 (2.9%).
NOTES: Delay or nonreceipt of needed medical care is based on responses to the questions, "During the past 12 months, was there any time when [person] needed medical care but did not get it because [person] couldn't afford it?" and "During the past 12 months, has medical care been delayed because of worry about the cost?“ See data table for Figure 15.SOURCE: NCHS, National Health Interview Survey (NHIS). Excel and PowerPoint: https://www.cdc.gov/nchs/hus/contents2019.htm#Figure-015
Perc
ent
0
5
10
15
20
65 and over
26–64
19–25
Under age 19
20182008
Figure 15. Delay or nonreceipt of needed medical care in the past 12 months due to cost, by age: United States, 2008–2018

Health, United States, 2019 21
Health Care Resources Physicians
An adequate supply of physicians is needed to help ensure access to affordable and quality health care (55). In addition to the number of physicians, geographic distribution and specialty mix affect the adequacy of the supply (55). A shortage of physicians in a geographic area can increase travel time to see a physician and may discourage or prevent timely and appropriate health care (55,56). A shortage of physicians can also lead to higher caseloads and, consequently, increased wait times both to receive an appointment and to see the provider at the appointment time (55,56).
The supply of professionally active physicians in patient care per 100,000 resident population in the United States was 256.63 in 2008 and 278.49 in 2018 (Table 41), an increase of 8.5%. By state, the supply of professionally active physicians in patient care per 100,000 resident population in 2018 was lowest in Idaho (188.43), Mississippi (194.14), and Wyoming (196.37), and highest in the District of Columbia (672.22), Massachusetts (435.38), and Rhode Island (407.47). In general, states in the West South Central and Mountain census divisions had the fewest physicians in patient care per population, while states in the Middle Atlantic and New England census divisions had the most (Appendix II, Geographic region).
NOTES: Data on the number of physicians in patient care per 100,000 resident population are calculated using 2010-based postcensal estimates. Data include professionally active doctors of medicine (M.D.s) and doctors of osteopathy (D.O.s) only. Data are displayed by a modified Jenks classification for the 50 states and District of Columbia, which creates categories that minimize within-group variation and maximize between-group variation. See data table for Figure 16. SOURCE: American Medical Association (AMA) Physician Masterfile. (Copyright 2020 American Medical Association. Reprinted with permission. All rights reserved.) Excel and PowerPoint: https://www.cdc.gov/nchs/hus/contents2019.htm#Figure-016
OR
CA
AZ
AK
HI
NM
TX LA
MS AL GA
OH
FL
AR
MO
TN
KY
NE
OK
KS
NV
UTCO
WA
ID
MT ND
WY
SD WI
MI
ME
NH
MACTRI
NJ
DE
VT
NY
PA
WVVA
MD
NC
SC
INIL
MN
IA
DC
188.43–252.75252.76–328.25
328.26–435.38
435.39–672.22
U.S. rate: 278.49
Rate
Figure 16. Number of physicians in patient care per 100,000 resident population, by state: United States, 2018

22 Health, United States, 2019
Health Care Resources Dentists
Professional dental treatment and preventive services are key to preventing and treating tooth decay, gum disease, and other oral diseases (57–59). The health of the teeth, mouth, and surrounding skull and facial structures are essential to a person’s overall health and well-being (57). Despite having 200,419 professionally active dentists in the United States in 2019 (Table 42), the Health Resources and Services Administration notes that as of December 2019, more than 57 million Americans live in areas designated as having a shortage of dental health professionals (60).
The number of professionally active dentists per 100,000 resident population in the United States was 59.13 in 2009 and 61.06 in 2019 (61) (Table 42), an increase of 3.3%. By state, the supply of dentists per 100,000 resident population in 2019 was lowest in Alabama (40.97), Arkansas (41.82), and Mississippi (42.91), and highest in District of Columbia (104.00), Massachusetts (83.38), and Alaska (80.51). In general, states in the East and West South Central census divisions had the fewest professionally active dentists per population, while states in the Middle Atlantic and Pacific census divisions had the most (Appendix II, Geographic region).
NOTES: Data on the number of dentists per 100,000 resident population are calculated using 2010-based postcensal estimates. Data include professionally active dentists only. Data are displayed by a modified Jenks classification for the 50 states and District of Columbia, which creates categories that minimize within-group variation and maximize between-group variation. See data table for Figure 17. SOURCE: American Dental Association, Health Policy Institute. Supply of Dentists in the U.S.: 2001–2019. (Copyright 2020 American Dental Association. Reprinted with permission. All rights reserved.) Excel and PowerPoint: https://www.cdc.gov/nchs/hus/contents2019.htm#Figure-017
OR
CA
AZ
AK
HI
NM
TX LA
MS AL GA
OH
FL
AR
MO
TN
KY
NE
OK
KS
NVUT
CO
WA
ID
MT ND
WY
SD WI
MI
ME
NH
MACTRI
NJ
DE
VT
NY
PA
WVVA
MD
NC
SC
INIL
MN
IA
DC
40.97–52.5652.57–64.3164.32–83.3883.39–104.00
U.S. rate: 61.06
Rate
Figure 17. Number of dentists per 100,000 resident population, by state: United States, 2019

Health, United States, 2019 23
Health Care Expenditures and PayersPersonal Health Care Expenditures
Health care spending accounted for almost 18% of the U.S. economy in 2018 (62). Expenditures for personal health care (PHC) include goods and services relating directly to patient care, such as hospital care, physicians’ services, dentists’ services, drugs, eyeglasses, and nursing home care. In 2018, PHC expenditures comprised 84% of national health care expenditures (62).
From 2008 to 2018, total PHC expenditures grew from $2.01 trillion to $3.08 trillion, an average annual growth of 4.4% (data table for Figure 18). The average annual growth in PHC expenditures by source was 5.8% for Medicaid (federal), 4.7% for Medicare, 4.5% for Medicaid (state and local), 4.4% for private health insurance, and 2.4% for out-of-pocket spending (data table for Figure 18). In 2018, private health insurance was the largest source of PHC spending at $1.08 trillion, followed by Medicare ($697.2 billion), total Medicaid ($532.8 billion), and out-of-pocket spending ($375.6 billion). All other sources of expenditures, which include the Children's Health Insurance Program
(CHIP), Department of Defense and Department of Veterans Affairs insurance, and other programs, accounted for the remaining $391.1 billion in expenditures (data table for Figure 18).
In 2018, spending for hospital care was the largest proportion of PHC spending by type of expenditure (38.8%), followed by physician and clinical services (23.6%), prescription drugs (10.9%), nursing care facilities and continuing care retirement communities (5.5%), dental services (4.4%), and home health care (3.3%). All other types of expenditures, such as other health, residential, and personal care; durable medical equipment; and other nondurable medical products, accounted for the remaining 13.6% of PHC spending. From 2008 to 2018, the proportion of PHC spending decreased for prescription drugs, nursing care facilities and continuing care retirement communities, and dental and physician and clinical services, while increasing for hospitals and home health care.
NOTES: Personal health care expenditures are outlays for goods and services relating directly to patient care. Expenditures are in current dollars and not adjusted for inflation. Numbers may not sum to total because of rounding. See data table for Figure 18. SOURCE: Centers for Medicare & Medicaid Services, National Health Expenditure Accounts (NHEA). Excel and PowerPoint: https://www.cdc.gov/nchs/hus/contents2019.htm#Figure-018
Dol
lars
(bill
ions
)
0
200
400
600
800
1,000
1,200
Medicaid (total)
Medicaid (state and local)
Out of pocket
Medicaid (federal)
Medicare
Private health insurance
20182008
Source of funds
Nursing care facilities andcontinuing care retirementcommunities
Perc
ent d
istr
ibut
ion
0
20
40
60
80
100
Other
Home health care
Prescription drugs
Physician and clinical
20182008 (Total: $2,009
billion) (Total: $3,076
billion)
13.2
3.1
6.55.1
11.9
24.0
36.1
13.6
3.3
5.54.4
10.9
23.6
38.8
Type of expenditure
Hospital
Dental
Figure 18. Personal health care expenditures, by source of funds and type of expenditure: United States, 2008–2018

24 Health, United States, 2019
Health Care Expenditures and PayersHealth Insurance Coverage
Health insurance eases access to the health care system. Children with health insurance are more likely to have access to health care, a usual source of care, and a recent health care visit than those who are uninsured (63,64). Research suggests that many health outcomes are better for adults with health insurance, especially among those with chronic illnesses such as congestive heart disease and hypertension (65). Historically, children have been more likely than adults to have health insurance coverage, primarily because they are more likely to be eligible for Medicaid, the Children’s Health Insurance Program (CHIP), or other public programs (52,66,67).
The percentage of children under age 18 years who were uninsured decreased an average 0.6 percentage point per year from 2008 to 2015, and then was stable through 2018. The percentage of children with Medicaid coverage, which includes those with CHIP or other state-sponsored health programs, increased an average 2.3 percentage points per year from 2008 to 2011, was stable to 2015, and then decreased an average 0.7 percentage point per year to 2018. The percentage of children with private health insurance coverage decreased an average 2.2 percentage points per year from 2008 to 2010, was stable to 2013, and
then increased an average 0.4 percentage point per year to 2018. In 2018, the percentage of children under age 18 years who were uninsured was 5.2%, compared with 36.6% who had Medicaid coverage and 54.9% who had private health insurance.
The percentage of adults aged 18–64 who were uninsured increased an average 0.4 percentage point per year from 2008 to 2012, then decreased an average 3.0 percentage points per year to 2015, followed by no clear trend through 2018. Medicaid coverage increased from 2008 to 2016 at varying rates, and then decreased an average 0.4 percentage point per year to 2018. The percentage of adults aged 18–64 with private health insurance coverage decreased an average 0.9 percentage point per year from 2008 to 2012, then increased an average 1.9 percentage points per year to 2015 before remaining stable through 2018. In 2018, the percentage of adults aged 18–64 who were uninsured was 13.2%, compared with 13.0% who reported Medicaid coverage and 69.2% who reported private health insurance.
Perc
ent
0
20
40
60
80
100
Uninsured
Medicaid
Private
20182008
Adults aged 18–64Children under age 18 years
Uninsured
Medicaid
Private
20182008
Figure 19. Health insurance coverage, by age and type of coverage: United States, 2008–2018
NOTES: Health insurance categories are mutually exclusive. A small percentage of children and adults (less than 5%) are covered by Medicare, military plans, or other plans; estimates for these groups are not shown. See data table for Figure 19.SOURCE: NCHS, National Health Interview Survey (NHIS). Excel and PowerPoint: https://www.cdc.gov/nchs/hus/contents2019.htm#Figure-019

Health, United States, 2019 25
Health Care Expenditures and PayersSupplemental Insurance Among Medicare Beneficiaries
Medicare is a nationwide program providing health insurance coverage to selected groups, including most adults aged 65 and over. Some services, such as dental care, prescription drugs, and long-term care services, are not covered by traditional Medicare (Appendix II, Medicare) (68). While traditional Medicare often requires copayments and other cost sharing, many people with Medicare have supplemental insurance coverage that may cover Medicare cost sharing or provide additional benefits (69). For example, beneficiaries may enroll in managed-care plans known as Medicare Advantage, which can include other benefits such as dental and prescription drug benefits (68,70). Other Medicare beneficiaries with Medicaid, employer- or union-sponsored plans, private Medigap policies, or military coverage also receive additional benefits (68,69).
From 2010 to 2018, about four of every five Medicare beneficiaries aged 65 and over had some form of supplemental coverage, while one in five had traditional Medicare alone (data table for Figure 20). The percentage of Medicare beneficiaries with Medicaid coverage was stable
from 2010 to 2018 (7.3%). The percentage with Medigap or employer- or union-sponsored private coverage decreased an average 1.6 percentage points per year from 48.1% in 2010 to 40.1% in 2015, and then was stable through 2018. The percentage of Medicare beneficiaries enrolled in a Medicare Advantage plan increased an average 1.2 percentage points per year from 19.6% in 2010 to 26.5% in 2016, and then was stable through 2018. The percentage of Medicare beneficiaries with military coverage increased an average 0.1 percentage point per year from 5.4% in 2010 to 6.1% in 2017. Military coverage increased to 8.7% in 2018, due in part to improved collection of information on Veterans Health Administration health care (71). The percentage with traditional Medicare only was stable from 2010 to 2015 (19.6%), and then decreased an average 0.7 percentage point per year to 17.3% in 2018. In 2018, among Medicare beneficiaries aged 65 and over, 7.3% had Medicaid coverage, 39.9% had Medigap or a union- or employer-sponsored private plan, 26.5% were enrolled in Medicare Advantage, 8.7% had military coverage, and 17.3% had no supplemental coverage.
Perc
ent
0
10
20
30
40
50
No supplemental coverage
Military
Medigap, employer or union sponsored
Medicaid
Medicare Advantage
20182010
Figure 20. Supplemental insurance coverage among adults aged 65 and over with Medicare coverage, by type of supplemental coverage: United States, 2010–2018
NOTES: No supplemental coverage means the beneficiaries had traditional fee-for-service Medicare only. A small percentage of Medicare beneficiaries (less than 1%) had traditional Medicare and a state or local plan; this group is not shown. Categories are mutually exclusive and hierarchical. Responses were first categorized as: Medigap, employer or union sponsored; Medicaid; military; or Medicare only. Those in either the Medigap, employer or union sponsored, or Medicare only categories were further classified as Medigap, employer or union sponsored; Medicare Advantage; or no supplemental coverage. In 2018, the percentage of military coverage increased due in part to improved collection of information on Veterans Health Administration health care. See data table for Figure 20. SOURCE: NCHS, National Health Interview Survey (NHIS). Excel and PowerPoint: https://www.cdc.gov/nchs/hus/contents2019.htm#Figure-020
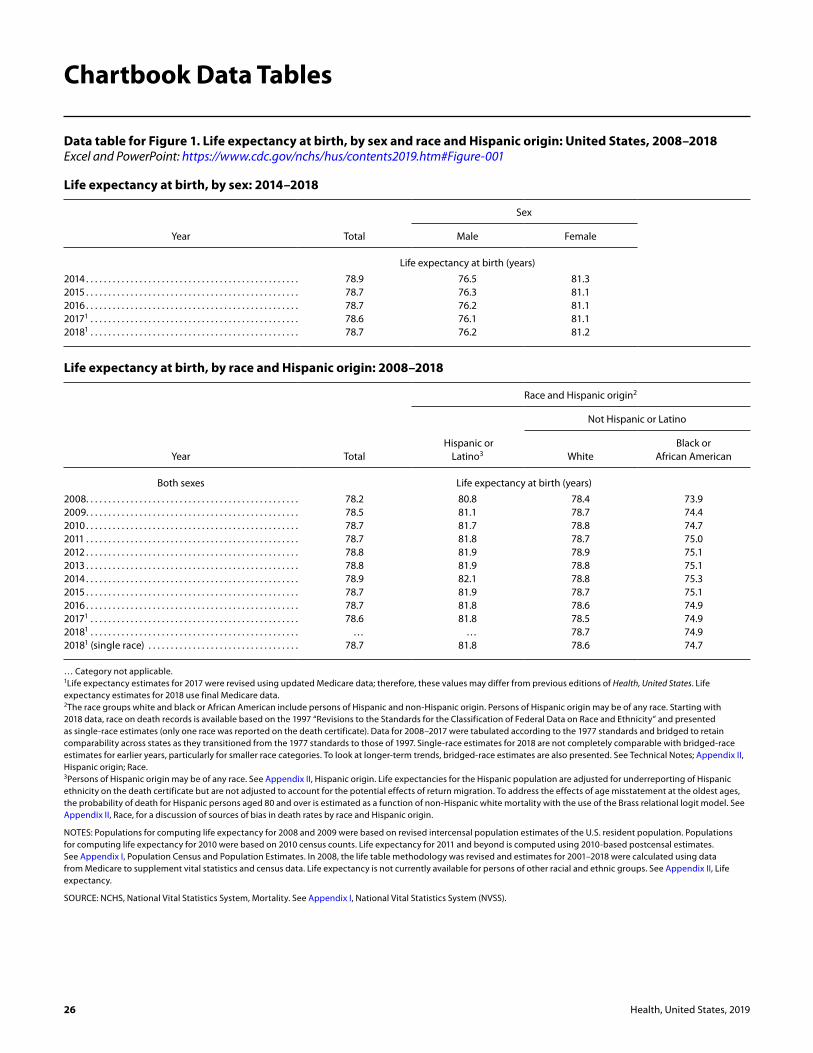
26 Health, United States, 2019
Data table for Figure 1. Life expectancy at birth, by sex and race and Hispanic origin: United States, 2008–2018Excel and PowerPoint: https://www.cdc.gov/nchs/hus/contents2019.htm#Figure-001
Life expectancy at birth, by sex: 2014–2018
Year Total
Sex
Male Female
Life expectancy at birth (years)
2014 . . . . . . . . . . . . . . . . . . . . . . . . . . . . . . . . . . . . . . . . . . . . . . . . 78.9 76.5 81.32015 . . . . . . . . . . . . . . . . . . . . . . . . . . . . . . . . . . . . . . . . . . . . . . . . 78.7 76.3 81.12016 . . . . . . . . . . . . . . . . . . . . . . . . . . . . . . . . . . . . . . . . . . . . . . . . 78.7 76.2 81.120171 . . . . . . . . . . . . . . . . . . . . . . . . . . . . . . . . . . . . . . . . . . . . . . . 78.6 76.1 81.120181 . . . . . . . . . . . . . . . . . . . . . . . . . . . . . . . . . . . . . . . . . . . . . . . 78.7 76.2 81.2
Life expectancy at birth, by race and Hispanic origin: 2008–2018
Year Total
Race and Hispanic origin2
Hispanic or Latino3
Not Hispanic or Latino
WhiteBlack or
African American
Both sexes Life expectancy at birth (years)
2008 . . . . . . . . . . . . . . . . . . . . . . . . . . . . . . . . . . . . . . . . . . . . . . . . 78.2 80.8 78.4 73.92009 . . . . . . . . . . . . . . . . . . . . . . . . . . . . . . . . . . . . . . . . . . . . . . . . 78.5 81.1 78.7 74.42010 . . . . . . . . . . . . . . . . . . . . . . . . . . . . . . . . . . . . . . . . . . . . . . . . 78.7 81.7 78.8 74.72011 . . . . . . . . . . . . . . . . . . . . . . . . . . . . . . . . . . . . . . . . . . . . . . . . 78.7 81.8 78.7 75.02012 . . . . . . . . . . . . . . . . . . . . . . . . . . . . . . . . . . . . . . . . . . . . . . . . 78.8 81.9 78.9 75.12013 . . . . . . . . . . . . . . . . . . . . . . . . . . . . . . . . . . . . . . . . . . . . . . . . 78.8 81.9 78.8 75.12014 . . . . . . . . . . . . . . . . . . . . . . . . . . . . . . . . . . . . . . . . . . . . . . . . 78.9 82.1 78.8 75.32015 . . . . . . . . . . . . . . . . . . . . . . . . . . . . . . . . . . . . . . . . . . . . . . . . 78.7 81.9 78.7 75.12016 . . . . . . . . . . . . . . . . . . . . . . . . . . . . . . . . . . . . . . . . . . . . . . . . 78.7 81.8 78.6 74.920171 . . . . . . . . . . . . . . . . . . . . . . . . . . . . . . . . . . . . . . . . . . . . . . . 78.6 81.8 78.5 74.920181 . . . . . . . . . . . . . . . . . . . . . . . . . . . . . . . . . . . . . . . . . . . . . . . … … 78.7 74.920181 (single race) . . . . . . . . . . . . . . . . . . . . . . . . . . . . . . . . . . 78.7 81.8 78.6 74.7
… Category not applicable. 1Life expectancy estimates for 2017 were revised using updated Medicare data; therefore, these values may differ from previous editions of Health, United States. Life expectancy estimates for 2018 use final Medicare data. 2The race groups white and black or African American include persons of Hispanic and non-Hispanic origin. Persons of Hispanic origin may be of any race. Starting with 2018 data, race on death records is available based on the 1997 “Revisions to the Standards for the Classification of Federal Data on Race and Ethnicity” and presented as single-race estimates (only one race was reported on the death certificate). Data for 2008–2017 were tabulated according to the 1977 standards and bridged to retain comparability across states as they transitioned from the 1977 standards to those of 1997. Single-race estimates for 2018 are not completely comparable with bridged-race estimates for earlier years, particularly for smaller race categories. To look at longer-term trends, bridged-race estimates are also presented. See Technical Notes; Appendix II, Hispanic origin; Race. 3Persons of Hispanic origin may be of any race. See Appendix II, Hispanic origin. Life expectancies for the Hispanic population are adjusted for underreporting of Hispanic ethnicity on the death certificate but are not adjusted to account for the potential effects of return migration. To address the effects of age misstatement at the oldest ages, the probability of death for Hispanic persons aged 80 and over is estimated as a function of non-Hispanic white mortality with the use of the Brass relational logit model. See Appendix II, Race, for a discussion of sources of bias in death rates by race and Hispanic origin.
NOTES: Populations for computing life expectancy for 2008 and 2009 were based on revised intercensal population estimates of the U.S. resident population. Populations for computing life expectancy for 2010 were based on 2010 census counts. Life expectancy for 2011 and beyond is computed using 2010-based postcensal estimates. See Appendix I, Population Census and Population Estimates. In 2008, the life table methodology was revised and estimates for 2001–2018 were calculated using data from Medicare to supplement vital statistics and census data. Life expectancy is not currently available for persons of other racial and ethnic groups. See Appendix II, Life expectancy.
SOURCE: NCHS, National Vital Statistics System, Mortality. See Appendix I, National Vital Statistics System (NVSS).
Chartbook Data Tables

Health, United States, 2019 27
See footnotes at end of table.
Data table for Figure 2. Infant mortality rates, by race and Hispanic origin of mother and selected leading causes of death: United States, 2008–2018Excel and PowerPoint: https://www.cdc.gov/nchs/hus/contents2019.htm#Figure-002
Infant mortality rates, by race and Hispanic origin of mother: 2008–2018
Year All mothers
Race and Hispanic origin of mother1
Hispanic or Latina
Not Hispanic or Latina
White
Black or African
American Asian or
Pacific Islander Asian
Native Hawaiian or Other Pacific
Islander
American Indian or
Alaska Native
Infant deaths per 1,000 live births
2008 . . . . . . . . . . . . . . . . . . . . . . . . . 6.61 5.59 5.52 12.67 4.39 … … 8.672009 . . . . . . . . . . . . . . . . . . . . . . . . . 6.39 5.29 5.33 12.40 4.27 … … 9.172010 . . . . . . . . . . . . . . . . . . . . . . . . . 6.14 5.25 5.18 11.46 4.18 … … 8.642011 . . . . . . . . . . . . . . . . . . . . . . . . . 6.07 5.15 5.07 11.45 4.18 … … 8.522012 . . . . . . . . . . . . . . . . . . . . . . . . . 5.98 5.11 5.04 11.19 3.96 … … 8.732013 . . . . . . . . . . . . . . . . . . . . . . . . . 5.96 5.00 5.06 11.11 3.90 … … 7.722014 . . . . . . . . . . . . . . . . . . . . . . . . . 5.82 5.01 4.89 10.93 3.68 … … 7.662015 . . . . . . . . . . . . . . . . . . . . . . . . . 5.90 4.96 4.90 11.25 4.08 … … 8.582016 . . . . . . . . . . . . . . . . . . . . . . . . . 5.87 4.96 4.87 11.21 3.83 … … 8.812017 . . . . . . . . . . . . . . . . . . . . . . . . . … … 4.69 10.88 4.03 … … 8.902017 (single race) . . . . . . . . . . . . 5.79 5.10 4.67 10.97 … 3.78 7.64 9.212018 . . . . . . . . . . . . . . . . . . . . . . . . . … … 4.68 10.62 3.87 … … 8.132018 (single race) . . . . . . . . . . . . 5.67 4.86 4.63 10.75 … 3.63 9.39 8.15
Standard error
2008 . . . . . . . . . . . . . . . . . . . . . . . . . 0.04 0.07 0.05 0.14 0.14 … … 0.452009 . . . . . . . . . . . . . . . . . . . . . . . . . 0.04 0.07 0.05 0.14 0.13 … … 0.472010 . . . . . . . . . . . . . . . . . . . . . . . . . 0.04 0.07 0.05 0.14 0.13 … … 0.472011 . . . . . . . . . . . . . . . . . . . . . . . . . 0.04 0.08 0.05 0.14 0.13 … … 0.472012 . . . . . . . . . . . . . . . . . . . . . . . . . 0.04 0.08 0.05 0.14 0.12 … … 0.482013 . . . . . . . . . . . . . . . . . . . . . . . . . 0.04 0.07 0.05 0.14 0.12 … … 0.452014 . . . . . . . . . . . . . . . . . . . . . . . . . 0.04 0.07 0.05 0.14 0.12 … … 0.452015 . . . . . . . . . . . . . . . . . . . . . . . . . 0.04 0.07 0.05 0.14 0.12 … … 0.482016 . . . . . . . . . . . . . . . . . . . . . . . . . 0.04 0.07 0.05 0.14 0.12 … … 0.502017 . . . . . . . . . . . . . . . . . . . . . . . . . … … 0.05 0.14 0.12 … … 0.512017 (single race) . . . . . . . . . . . . 0.04 0.08 0.05 0.14 … 0.12 0.90 0.562018 . . . . . . . . . . . . . . . . . . . . . . . . . … … 0.05 0.14 0.12 … … 0.492018 (single race) . . . . . . . . . . . . 0.04 0.07 0.05 0.14 … 0.12 1.00 0.53

28 Health, United States, 2019
Data table for Figure 2. Infant mortality rates, by race and Hispanic origin of mother and selected leading causes of death: United States, 2008–2018—Con.Excel and PowerPoint: https://www.cdc.gov/nchs/hus/contents2019.htm#Figure-002
Infant mortality rates, by selected leading causes of death: 2008–2018
Year
Selected leading causes of death2
Congenital malformations
Preterm birth and low birthweight
Sudden infant death syndrome
Maternal complications of
pregnancyUnintentional
injuries (accidents)
Infant deaths per 100,000 live births
2008 . . . . . . . . . . . . . . . . . . . . . . . . . . . . . . . . . . . . . . 133.74 112.00 55.33 41.80 30.922009 . . . . . . . . . . . . . . . . . . . . . . . . . . . . . . . . . . . . . . 129.71 109.62 54.01 39.07 28.382010 . . . . . . . . . . . . . . . . . . . . . . . . . . . . . . . . . . . . . . 127.89 103.80 51.46 39.07 27.682011 . . . . . . . . . . . . . . . . . . . . . . . . . . . . . . . . . . . . . . 126.87 104.08 48.18 40.42 29.512012 . . . . . . . . . . . . . . . . . . . . . . . . . . . . . . . . . . . . . . 125.66 106.60 42.39 38.41 29.412013 . . . . . . . . . . . . . . . . . . . . . . . . . . . . . . . . . . . . . . 121.51 107.13 39.70 40.63 29.262014 . . . . . . . . . . . . . . . . . . . . . . . . . . . . . . . . . . . . . . 119.20 104.62 38.64 39.63 29.162015 . . . . . . . . . . . . . . . . . . . . . . . . . . . . . . . . . . . . . . 121.84 102.73 39.39 38.37 32.392016 . . . . . . . . . . . . . . . . . . . . . . . . . . . . . . . . . . . . . . 122.23 99.49 37.96 35.66 30.832017 . . . . . . . . . . . . . . . . . . . . . . . . . . . . . . . . . . . . . . 119.19 97.45 35.27 37.24 34.062018 . . . . . . . . . . . . . . . . . . . . . . . . . . . . . . . . . . . . . . 118.71 97.12 35.11 36.17 30.83
Standard error
2008 . . . . . . . . . . . . . . . . . . . . . . . . . . . . . . . . . . . . . . 1.78 1.62 1.14 0.99 0.852009 . . . . . . . . . . . . . . . . . . . . . . . . . . . . . . . . . . . . . . 1.77 1.63 1.14 0.97 0.832010 . . . . . . . . . . . . . . . . . . . . . . . . . . . . . . . . . . . . . . 1.79 1.61 1.13 0.99 0.832011 . . . . . . . . . . . . . . . . . . . . . . . . . . . . . . . . . . . . . . 1.79 1.62 1.10 1.01 0.862012 . . . . . . . . . . . . . . . . . . . . . . . . . . . . . . . . . . . . . . 1.78 1.64 1.04 0.99 0.862013 . . . . . . . . . . . . . . . . . . . . . . . . . . . . . . . . . . . . . . 1.76 1.65 1.00 1.02 0.862014 . . . . . . . . . . . . . . . . . . . . . . . . . . . . . . . . . . . . . . 1.73 1.62 0.98 1.00 0.862015 . . . . . . . . . . . . . . . . . . . . . . . . . . . . . . . . . . . . . . 1.75 1.61 1.00 0.98 0.902016 . . . . . . . . . . . . . . . . . . . . . . . . . . . . . . . . . . . . . . 1.76 1.59 0.98 0.95 0.882017 . . . . . . . . . . . . . . . . . . . . . . . . . . . . . . . . . . . . . . 1.76 1.59 0.96 0.98 0.942018 . . . . . . . . . . . . . . . . . . . . . . . . . . . . . . . . . . . . . . 1.77 1.60 0.96 0.98 0.90
… Category not applicable. 1The race groups white, black or African American, American Indian or Alaska Native, Asian, and Native Hawaiian or Other Pacific Islander include persons of Hispanic and non-Hispanic origin. Persons of Hispanic origin may be of any race. Starting with 2017 data, race on birth records used to calculate infant mortality is available based on the 1997 “Revisions to the Standards for the Classification of Federal Data on Race and Ethnicity” and presented as single-race estimates (only one race was reported on the birth certificate). These estimates include separate estimates for non-Hispanic Asian and non-Hispanic Native Hawaiian or Other Pacific Islander groups. Data for 2003–2016 were tabulated according to the 1977 standards and bridged to retain comparability across states as they transitioned from the 1977 standards to those of 1997. Single-race estimates for 2017 and beyond are not completely comparable with bridged-race estimates for earlier years, particularly for smaller race categories. To look at longer-term trends, bridged-race estimates are also presented. The combined group of non-Hispanic Asian or Pacific Islander women is also shown. See Technical Notes; Appendix II, Hispanic origin; Race. 2The leading causes of death were selected based on the rates in 2018. Deaths are identified using the International Classification of Diseases, 10th Revision (ICD–10). The codes are: Congenital malformations, deformations and chromosomal abnormalities (Q00–Q99); Disorders related to preterm births (short gestation) and low birthweight, not elsewhere classified (P07); Sudden infant death syndrome (R95); Newborn affected by maternal complications of pregnancy (P01); and Unintentional injuries (accidents) (V01–X59). The cause of death called Newborn affected by maternal complications of pregnancy includes any of the following conditions: incompetent cervix, premature rupture of membranes, ectopic pregnancy, malpresentation before labor, amniotic fluid disorders, multiple pregnancy, maternal death, and other unspecified maternal complications. See Appendix II, Cause of death; International Classification of Diseases (ICD); Table IV.
NOTES: Infants are defined as under age 1 year. Rates are based on the number of deaths from the mortality file and the number of births from the natality file. Rates by race and Hispanic origin are from the Linked Birth/Infant Death data set. See Appendix II, Cause of death; Table IV; Hispanic origin; Race.
SOURCE: NCHS, National Vital Statistics System, Linked Birth/Infant Death Data Set. See Appendix I, National Vital Statistics System (NVSS).

Health, United States, 2019 29
Data table for Figure 3. Age-adjusted death rates for selected causes of death for all ages, by sex: United States, 2008–2018Excel and PowerPoint: https://www.cdc.gov/nchs/hus/contents2019.htm#Figure-003
Sex and year All causes
Cause of death1
Heart disease Cancer Unintentional
injuries2 CLRD3 Stroke4Alzheimer’s
disease Diabetes5
All persons Age-adjusted deaths per 100,000 population6
2008 . . . . . . . . . . . . . . . . . . . . . 774.9 192.1 176.4 39.2 44.7 42.1 25.8 22.02009 . . . . . . . . . . . . . . . . . . . . . 749.6 182.8 173.5 37.5 42.7 39.6 24.2 21.02010 . . . . . . . . . . . . . . . . . . . . . 747.0 179.1 172.8 38.0 42.2 39.1 25.1 20.82011 . . . . . . . . . . . . . . . . . . . . . 741.3 173.7 169.0 39.1 42.5 37.9 24.7 21.62012 . . . . . . . . . . . . . . . . . . . . . 732.8 170.5 166.5 39.1 41.5 36.9 23.8 21.22013 . . . . . . . . . . . . . . . . . . . . . 731.9 169.8 163.2 39.4 42.1 36.2 23.5 21.22014 . . . . . . . . . . . . . . . . . . . . . 724.6 167.0 161.2 40.5 40.5 36.5 25.4 20.92015 . . . . . . . . . . . . . . . . . . . . . 733.1 168.5 158.5 43.2 41.6 37.6 29.4 21.32016 . . . . . . . . . . . . . . . . . . . . . 728.8 165.5 155.8 47.4 40.6 37.3 30.3 21.02017 . . . . . . . . . . . . . . . . . . . . . 731.9 165.0 152.5 49.4 40.9 37.6 31.0 21.52018 . . . . . . . . . . . . . . . . . . . . . 723.6 163.6 149.1 48.0 39.7 37.1 30.5 21.4
Male
2008 . . . . . . . . . . . . . . . . . . . . . 918.8 238.5 214.9 54.3 52.3 42.2 21.3 25.92009 . . . . . . . . . . . . . . . . . . . . . 890.9 229.4 210.9 51.4 49.5 39.9 20.2 25.02010 . . . . . . . . . . . . . . . . . . . . . 887.1 225.1 209.9 51.5 48.7 39.3 21.0 24.92011 . . . . . . . . . . . . . . . . . . . . . 875.3 218.1 204.0 52.8 48.6 37.9 20.4 26.02012 . . . . . . . . . . . . . . . . . . . . . 865.1 214.7 200.3 52.6 47.2 37.1 19.8 25.52013 . . . . . . . . . . . . . . . . . . . . . 863.6 214.5 196.0 53.1 47.5 36.7 19.3 25.62014 . . . . . . . . . . . . . . . . . . . . . 855.1 210.9 192.9 54.6 45.4 36.9 20.6 25.62015 . . . . . . . . . . . . . . . . . . . . . 863.2 211.8 189.2 58.7 46.0 37.8 23.7 26.22016 . . . . . . . . . . . . . . . . . . . . . 861.0 209.1 185.4 65.0 45.1 37.5 24.3 26.02017 . . . . . . . . . . . . . . . . . . . . . 864.5 209.0 181.1 67.8 45.0 38.0 24.9 26.82018 . . . . . . . . . . . . . . . . . . . . . 855.5 207.5 176.8 65.9 43.7 37.6 24.5 26.9
Female
2008 . . . . . . . . . . . . . . . . . . . . . 659.9 155.9 149.6 25.4 39.8 41.4 28.2 19.12009 . . . . . . . . . . . . . . . . . . . . . 636.8 146.6 147.4 24.8 38.3 38.8 26.3 17.92010 . . . . . . . . . . . . . . . . . . . . . 634.9 143.3 146.7 25.6 38.0 38.3 27.3 17.62011 . . . . . . . . . . . . . . . . . . . . . 632.4 138.7 144.0 26.5 38.5 37.2 27.1 18.22012 . . . . . . . . . . . . . . . . . . . . . 624.7 135.5 142.1 26.4 37.8 36.1 26.1 17.72013 . . . . . . . . . . . . . . . . . . . . . 623.5 134.3 139.5 26.6 38.5 35.2 25.9 17.62014 . . . . . . . . . . . . . . . . . . . . . 616.7 131.8 138.1 27.3 37.1 35.6 28.3 17.22015 . . . . . . . . . . . . . . . . . . . . . 624.2 133.6 135.9 28.7 38.6 36.9 32.8 17.32016 . . . . . . . . . . . . . . . . . . . . . 617.5 130.4 134.0 30.8 37.4 36.5 33.9 16.92017 . . . . . . . . . . . . . . . . . . . . . 619.7 129.6 131.4 32.0 38.1 36.6 34.8 17.12018 . . . . . . . . . . . . . . . . . . . . . 611.3 127.9 128.6 31.0 36.8 36.1 34.2 16.8
See footnotes at end of table.

30 Health, United States, 2019
Data table for Figure 3. Age-adjusted death rates for selected causes of death for all ages, by sex: United States, 2008–2018—Con.Excel and PowerPoint: https://www.cdc.gov/nchs/hus/contents2019.htm#Figure-003
Sex and year All causes
Cause of death1
Heart disease Cancer Unintentional
injuries2 CLRD3 Stroke4Alzheimer’s
disease Diabetes5
All persons Standard error
2008 . . . . . . . . . . . . . . . . . . . . . 0.50 0.25 0.24 0.11 0.12 0.12 0.09 0.082009 . . . . . . . . . . . . . . . . . . . . . 0.48 0.24 0.23 0.11 0.12 0.11 0.09 0.082010 . . . . . . . . . . . . . . . . . . . . . 0.48 0.23 0.23 0.11 0.11 0.11 0.09 0.082011 . . . . . . . . . . . . . . . . . . . . . 0.47 0.23 0.22 0.11 0.11 0.11 0.09 0.082012 . . . . . . . . . . . . . . . . . . . . . 0.46 0.22 0.22 0.11 0.11 0.10 0.08 0.082013 . . . . . . . . . . . . . . . . . . . . . 0.46 0.22 0.22 0.11 0.11 0.10 0.08 0.082014 . . . . . . . . . . . . . . . . . . . . . 0.45 0.22 0.21 0.11 0.11 0.10 0.08 0.082015 . . . . . . . . . . . . . . . . . . . . . 0.45 0.21 0.21 0.11 0.11 0.10 0.09 0.082016 . . . . . . . . . . . . . . . . . . . . . 0.45 0.21 0.20 0.12 0.10 0.10 0.09 0.082017 . . . . . . . . . . . . . . . . . . . . . 0.44 0.21 0.20 0.12 0.10 0.10 0.09 0.082018 . . . . . . . . . . . . . . . . . . . . . 0.44 0.20 0.20 0.12 0.10 0.10 0.09 0.07
Male
2008 . . . . . . . . . . . . . . . . . . . . . 0.84 0.43 0.40 0.20 0.20 0.18 0.14 0.142009 . . . . . . . . . . . . . . . . . . . . . 0.82 0.42 0.39 0.19 0.20 0.18 0.13 0.142010 . . . . . . . . . . . . . . . . . . . . . 0.81 0.41 0.39 0.19 0.19 0.17 0.13 0.132011 . . . . . . . . . . . . . . . . . . . . . 0.79 0.40 0.38 0.19 0.19 0.17 0.13 0.142012 . . . . . . . . . . . . . . . . . . . . . 0.78 0.39 0.37 0.19 0.18 0.16 0.12 0.132013 . . . . . . . . . . . . . . . . . . . . . 0.77 0.38 0.36 0.19 0.18 0.16 0.12 0.132014 . . . . . . . . . . . . . . . . . . . . . 0.75 0.38 0.35 0.19 0.18 0.16 0.12 0.132015 . . . . . . . . . . . . . . . . . . . . . 0.75 0.37 0.34 0.20 0.17 0.16 0.13 0.132016 . . . . . . . . . . . . . . . . . . . . . 0.74 0.37 0.34 0.21 0.17 0.16 0.13 0.132017 . . . . . . . . . . . . . . . . . . . . . 0.73 0.36 0.33 0.21 0.17 0.16 0.13 0.132018 . . . . . . . . . . . . . . . . . . . . . 0.72 0.35 0.32 0.20 0.16 0.15 0.13 0.13
Female
2008 . . . . . . . . . . . . . . . . . . . . . 0.60 0.29 0.29 0.12 0.15 0.15 0.12 0.102009 . . . . . . . . . . . . . . . . . . . . . 0.59 0.27 0.29 0.12 0.14 0.14 0.11 0.102010 . . . . . . . . . . . . . . . . . . . . . 0.58 0.27 0.28 0.12 0.14 0.14 0.11 0.102011 . . . . . . . . . . . . . . . . . . . . . 0.57 0.26 0.28 0.12 0.14 0.14 0.11 0.102012 . . . . . . . . . . . . . . . . . . . . . 0.57 0.26 0.27 0.12 0.14 0.13 0.11 0.102013 . . . . . . . . . . . . . . . . . . . . . 0.56 0.25 0.27 0.12 0.14 0.13 0.11 0.092014 . . . . . . . . . . . . . . . . . . . . . 0.55 0.25 0.27 0.13 0.14 0.13 0.11 0.092015 . . . . . . . . . . . . . . . . . . . . . 0.55 0.25 0.26 0.13 0.14 0.13 0.12 0.092016 . . . . . . . . . . . . . . . . . . . . . 0.55 0.24 0.26 0.13 0.13 0.13 0.12 0.092017 . . . . . . . . . . . . . . . . . . . . . 0.54 0.24 0.25 0.13 0.13 0.13 0.12 0.092018 . . . . . . . . . . . . . . . . . . . . . 0.53 0.24 0.25 0.13 0.13 0.13 0.12 0.09
1Underlying causes of death are based on the International Classification of Diseases, 10th Revision (ICD–10). See Appendix II, International Classification of Diseases (ICD), Table IV. 2Also known as accidents. 3Chronic lower respiratory disease. 4The major component of cerebrovascular disease. 5Starting with 2011 data, the rules for selecting renal failure as the underlying cause of death were changed, resulting in an increase in the number of deaths for Diabetes mellitus. Therefore, data for diabetes before and after 2011 are not directly comparable. For more information, see Technical Notes in “Deaths: Final data for 2011,” available from: https://www.cdc.gov/nchs/data/nvsr/nvsr63/nvsr63_03.pdf. 6Estimates are age-adjusted to the year 2000 standard population with unrounded population numbers. See Appendix II, Age adjustment.
NOTE: See Appendix II, Cause of death; Cause-of-death ranking; Table IV.
SOURCE: NCHS, National Vital Statistics System, Mortality. See Appendix I, National Vital Statistics System (NVSS).

Health, United States, 2019 31
Data table for Figure 4. Drug overdose death rates, by sex and age: United States, 2008–2018Excel and PowerPoint: https://www.cdc.gov/nchs/hus/contents2019.htm#Figure-004
Sex and year
All ages Age group (years)
Total (age adjusted)1 Total (crude) 15–24 25–34 35–44 45–54 55–64 65 and over
All persons Deaths per 100,000 population
2008 . . . . . . . . . . . . . . . . . . . . . . . . 11.9 12.0 8.0 16.8 21.1 25.2 12.9 4.12009 . . . . . . . . . . . . . . . . . . . . . . . . 11.9 12.1 7.7 17.2 20.5 25.4 13.7 4.32010 . . . . . . . . . . . . . . . . . . . . . . . . 12.3 12.4 8.2 18.4 20.8 25.1 15.0 4.32011 . . . . . . . . . . . . . . . . . . . . . . . . 13.2 13.3 8.6 20.2 22.5 26.7 15.9 4.62012 . . . . . . . . . . . . . . . . . . . . . . . . 13.1 13.2 8.0 20.1 22.1 26.9 16.6 4.92013 . . . . . . . . . . . . . . . . . . . . . . . . 13.8 13.9 8.3 20.9 23.0 27.5 19.2 5.22014 . . . . . . . . . . . . . . . . . . . . . . . . 14.7 14.8 8.6 23.1 25.0 28.2 20.3 5.62015 . . . . . . . . . . . . . . . . . . . . . . . . 16.3 16.3 9.7 26.9 28.3 30.0 21.8 5.82016 . . . . . . . . . . . . . . . . . . . . . . . . 19.8 19.7 12.4 34.6 35.0 34.5 25.6 6.22017 . . . . . . . . . . . . . . . . . . . . . . . . 21.7 21.6 12.6 38.4 39.0 37.7 28.0 6.92018 . . . . . . . . . . . . . . . . . . . . . . . . 20.7 20.6 10.8 35.5 38.3 35.3 28.3 7.6
Male
2008 . . . . . . . . . . . . . . . . . . . . . . . . 14.9 15.0 11.9 23.6 25.6 29.6 14.8 4.22009 . . . . . . . . . . . . . . . . . . . . . . . . 14.8 15.0 11.3 24.0 25.2 29.1 16.0 4.42010 . . . . . . . . . . . . . . . . . . . . . . . . 15.0 15.2 11.6 25.0 24.9 28.5 17.3 4.32011 . . . . . . . . . . . . . . . . . . . . . . . . 16.1 16.3 12.4 27.5 26.8 30.4 18.5 4.72012 . . . . . . . . . . . . . . . . . . . . . . . . 16.1 16.3 11.4 27.0 27.1 30.4 19.4 5.22013 . . . . . . . . . . . . . . . . . . . . . . . . 17.0 17.2 11.7 28.6 28.1 31.5 22.7 5.92014 . . . . . . . . . . . . . . . . . . . . . . . . 18.3 18.4 12.1 31.9 30.8 32.9 23.5 6.02015 . . . . . . . . . . . . . . . . . . . . . . . . 20.8 20.8 13.3 37.9 36.3 35.3 26.2 6.82016 . . . . . . . . . . . . . . . . . . . . . . . . 26.2 26.1 17.5 48.9 46.9 42.5 32.2 7.62017 . . . . . . . . . . . . . . . . . . . . . . . . 29.1 29.0 17.1 54.3 53.0 48.3 36.2 8.72018 . . . . . . . . . . . . . . . . . . . . . . . . 27.9 27.9 14.3 49.6 52.4 46.1 37.2 10.2
Female
2008 . . . . . . . . . . . . . . . . . . . . . . . . 8.9 9.0 4.0 9.9 16.5 21.0 11.1 4.02009 . . . . . . . . . . . . . . . . . . . . . . . . 9.1 9.2 4.1 10.4 16.0 21.8 11.6 4.32010 . . . . . . . . . . . . . . . . . . . . . . . . 9.6 9.8 4.6 11.9 16.8 21.8 12.9 4.32011 . . . . . . . . . . . . . . . . . . . . . . . . 10.2 10.3 4.6 12.8 18.2 23.1 13.5 4.52012 . . . . . . . . . . . . . . . . . . . . . . . . 10.2 10.3 4.4 13.1 17.1 23.4 14.0 4.62013 . . . . . . . . . . . . . . . . . . . . . . . . 10.6 10.7 4.8 13.0 18.0 23.6 15.9 4.82014 . . . . . . . . . . . . . . . . . . . . . . . . 11.1 11.3 5.0 14.1 19.2 23.7 17.2 5.22015 . . . . . . . . . . . . . . . . . . . . . . . . 11.8 11.9 5.9 15.7 20.5 24.9 17.6 5.02016 . . . . . . . . . . . . . . . . . . . . . . . . 13.4 13.5 7.0 19.9 23.3 26.7 19.5 5.12017 . . . . . . . . . . . . . . . . . . . . . . . . 14.4 14.3 7.9 22.0 25.1 27.5 20.3 5.52018 . . . . . . . . . . . . . . . . . . . . . . . . 13.6 13.5 7.1 20.8 24.2 24.8 19.9 5.5
See footnotes at end of table.

32 Health, United States, 2019
Data table for Figure 4. Drug overdose death rates, by sex and age: United States, 2008–2018—Con.Excel and PowerPoint: https://www.cdc.gov/nchs/hus/contents2019.htm#Figure-004
Sex and year
All ages Age group (years)
Total (age adjusted)1 Total (crude) 15–24 25–34 35–44 45–54 55–64 65 and over
All persons Standard error
2008 . . . . . . . . . . . . . . . . . . . . . . . . 0.06 0.06 0.14 0.20 0.22 0.24 0.19 0.102009 . . . . . . . . . . . . . . . . . . . . . . . . 0.06 0.06 0.13 0.21 0.22 0.24 0.20 0.102010 . . . . . . . . . . . . . . . . . . . . . . . . 0.06 0.06 0.14 0.21 0.23 0.24 0.20 0.102011 . . . . . . . . . . . . . . . . . . . . . . . . 0.07 0.07 0.14 0.22 0.24 0.24 0.20 0.112012 . . . . . . . . . . . . . . . . . . . . . . . . 0.07 0.06 0.13 0.22 0.23 0.25 0.21 0.112013 . . . . . . . . . . . . . . . . . . . . . . . . 0.07 0.07 0.14 0.22 0.24 0.25 0.22 0.112014 . . . . . . . . . . . . . . . . . . . . . . . . 0.07 0.07 0.14 0.23 0.25 0.25 0.22 0.112015 . . . . . . . . . . . . . . . . . . . . . . . . 0.07 0.07 0.15 0.25 0.26 0.26 0.23 0.112016 . . . . . . . . . . . . . . . . . . . . . . . . 0.08 0.08 0.17 0.28 0.29 0.28 0.25 0.112017 . . . . . . . . . . . . . . . . . . . . . . . . 0.08 0.08 0.17 0.29 0.31 0.30 0.26 0.122018 . . . . . . . . . . . . . . . . . . . . . . . . 0.08 0.08 0.16 0.28 0.30 0.29 0.26 0.12
Male
2008 . . . . . . . . . . . . . . . . . . . . . . . . 0.10 0.10 0.23 0.34 0.35 0.37 0.30 0.162009 . . . . . . . . . . . . . . . . . . . . . . . . 0.10 0.10 0.22 0.34 0.35 0.36 0.31 0.162010 . . . . . . . . . . . . . . . . . . . . . . . . 0.10 0.10 0.23 0.35 0.35 0.36 0.31 0.162011 . . . . . . . . . . . . . . . . . . . . . . . . 0.10 0.10 0.23 0.36 0.36 0.37 0.32 0.162012 . . . . . . . . . . . . . . . . . . . . . . . . 0.10 0.10 0.23 0.36 0.37 0.37 0.32 0.172013 . . . . . . . . . . . . . . . . . . . . . . . . 0.11 0.11 0.23 0.36 0.37 0.38 0.35 0.172014 . . . . . . . . . . . . . . . . . . . . . . . . 0.11 0.11 0.23 0.38 0.39 0.39 0.35 0.172015 . . . . . . . . . . . . . . . . . . . . . . . . 0.12 0.11 0.24 0.41 0.42 0.41 0.36 0.182016 . . . . . . . . . . . . . . . . . . . . . . . . 0.13 0.13 0.28 0.47 0.48 0.45 0.40 0.192017 . . . . . . . . . . . . . . . . . . . . . . . . 0.14 0.13 0.28 0.49 0.51 0.48 0.42 0.202018 . . . . . . . . . . . . . . . . . . . . . . . . 0.13 0.13 0.26 0.46 0.50 0.47 0.43 0.21
Female
2008 . . . . . . . . . . . . . . . . . . . . . . . . 0.08 0.08 0.14 0.22 0.28 0.31 0.25 0.132009 . . . . . . . . . . . . . . . . . . . . . . . . 0.08 0.08 0.14 0.23 0.28 0.31 0.25 0.142010 . . . . . . . . . . . . . . . . . . . . . . . . 0.08 0.08 0.15 0.24 0.29 0.31 0.26 0.142011 . . . . . . . . . . . . . . . . . . . . . . . . 0.08 0.08 0.15 0.25 0.30 0.32 0.26 0.142012 . . . . . . . . . . . . . . . . . . . . . . . . 0.08 0.08 0.14 0.25 0.29 0.32 0.27 0.142013 . . . . . . . . . . . . . . . . . . . . . . . . 0.08 0.08 0.15 0.25 0.30 0.33 0.28 0.142014 . . . . . . . . . . . . . . . . . . . . . . . . 0.08 0.08 0.15 0.26 0.31 0.33 0.29 0.142015 . . . . . . . . . . . . . . . . . . . . . . . . 0.09 0.09 0.17 0.27 0.32 0.34 0.29 0.142016 . . . . . . . . . . . . . . . . . . . . . . . . 0.09 0.09 0.18 0.30 0.34 0.35 0.30 0.142017 . . . . . . . . . . . . . . . . . . . . . . . . 0.10 0.09 0.19 0.31 0.35 0.36 0.31 0.142018 . . . . . . . . . . . . . . . . . . . . . . . . 0.09 0.09 0.18 0.30 0.34 0.34 0.30 0.14
1Estimates are age adjusted to the year 2000 standard population with unrounded population numbers. See Appendix II, Age adjustment.
NOTES: Drug overdose deaths are identified using International Classification of Diseases, 10th Revision (ICD–10) underlying cause of death codes X40–X44 (unintentional drug poisoning), X60–X64 (suicide by drug poisoning), X85 (homicide by drug poisoning), and Y10–Y14 (drug poisoning of undetermined intent). See Appendix II, Cause of death; International Classification of Diseases (ICD); Table IV.
SOURCE: NCHS, National Vital Statistics System, Mortality. See Appendix I, National Vital Statistics System (NVSS).

Health, United States, 2019 33
Data table for Figure 5. Suicide, by sex and means: United States, 2008–2018Excel and PowerPoint: https://www.cdc.gov/nchs/hus/contents2019.htm#Figure-005
Death rates for suicide, by sex: 2008–2018
Year Total SE Male SE Female SE
Age-adjusted deaths per 100,000 population1
2008 . . . . . . . . . . . . . . . . . . . . . . . . 11.6 0.06 19.0 0.11 4.8 0.062009 . . . . . . . . . . . . . . . . . . . . . . . . 11.8 0.06 19.2 0.11 4.9 0.062010 . . . . . . . . . . . . . . . . . . . . . . . . 12.1 0.06 19.8 0.12 5.0 0.062011 . . . . . . . . . . . . . . . . . . . . . . . . 12.3 0.06 20.0 0.12 5.2 0.062012 . . . . . . . . . . . . . . . . . . . . . . . . 12.6 0.06 20.4 0.12 5.4 0.062013 . . . . . . . . . . . . . . . . . . . . . . . . 12.6 0.06 20.3 0.11 5.5 0.062014 . . . . . . . . . . . . . . . . . . . . . . . . 13.0 0.06 20.7 0.12 5.8 0.062015 . . . . . . . . . . . . . . . . . . . . . . . . 13.3 0.06 21.1 0.12 6.0 0.062016 . . . . . . . . . . . . . . . . . . . . . . . . 13.5 0.06 21.4 0.12 6.0 0.062017 . . . . . . . . . . . . . . . . . . . . . . . . 14.0 0.07 22.4 0.12 6.1 0.062018 . . . . . . . . . . . . . . . . . . . . . . . . 14.2 0.07 22.8 0.12 6.2 0.06
Deaths from suicide, by sex and means: 2008–2018
Sex and year Firearm SE Suffocation SE Poisoning SE Other SE
Male Percent distribution
2008 . . . . . . . . . . . . . . . . . . . . . . . . 56.0 0.29 24.6 0.26 12.2 0.19 7.3 0.152009 . . . . . . . . . . . . . . . . . . . . . . . . 56.1 0.29 25.1 0.25 11.8 0.19 7.0 0.152010 . . . . . . . . . . . . . . . . . . . . . . . . 56.0 0.29 25.1 0.25 11.8 0.19 7.1 0.152011 . . . . . . . . . . . . . . . . . . . . . . . . 55.9 0.28 25.6 0.25 11.1 0.18 7.4 0.152012 . . . . . . . . . . . . . . . . . . . . . . . . 56.4 0.28 25.2 0.24 11.1 0.18 7.3 0.152013 . . . . . . . . . . . . . . . . . . . . . . . . 56.9 0.28 24.7 0.24 10.8 0.17 7.6 0.152014 . . . . . . . . . . . . . . . . . . . . . . . . 55.4 0.27 26.8 0.24 10.6 0.17 7.2 0.142015 . . . . . . . . . . . . . . . . . . . . . . . . 55.6 0.27 26.9 0.24 10.0 0.16 7.5 0.142016 . . . . . . . . . . . . . . . . . . . . . . . . 56.6 0.27 26.1 0.24 9.5 0.16 7.8 0.142017 . . . . . . . . . . . . . . . . . . . . . . . . 56.0 0.26 27.7 0.23 9.0 0.15 7.3 0.142018 . . . . . . . . . . . . . . . . . . . . . . . . 55.9 0.26 28.3 0.23 8.3 0.14 7.5 0.14
Female
2008 . . . . . . . . . . . . . . . . . . . . . . . . 30.2 0.53 21.0 0.47 39.3 0.56 9.5 0.342009 . . . . . . . . . . . . . . . . . . . . . . . . 31.0 0.52 21.7 0.47 37.9 0.55 9.3 0.332010 . . . . . . . . . . . . . . . . . . . . . . . . 30.0 0.51 23.5 0.47 37.4 0.54 9.0 0.322011 . . . . . . . . . . . . . . . . . . . . . . . . 31.4 0.50 23.3 0.46 36.5 0.52 8.8 0.312012 . . . . . . . . . . . . . . . . . . . . . . . . 31.2 0.49 23.5 0.45 36.2 0.51 9.1 0.312013 . . . . . . . . . . . . . . . . . . . . . . . . 32.3 0.49 23.7 0.45 34.8 0.50 9.3 0.302014 . . . . . . . . . . . . . . . . . . . . . . . . 31.1 0.47 26.2 0.45 34.1 0.48 8.6 0.292015 . . . . . . . . . . . . . . . . . . . . . . . . 30.5 0.46 26.7 0.44 33.4 0.47 9.4 0.292016 . . . . . . . . . . . . . . . . . . . . . . . . 32.1 0.46 25.3 0.43 33.0 0.46 9.5 0.292017 . . . . . . . . . . . . . . . . . . . . . . . . 31.2 0.45 27.9 0.44 31.4 0.46 9.6 0.292018 . . . . . . . . . . . . . . . . . . . . . . . . 31.5 0.45 29.9 0.44 29.3 0.44 9.3 0.28
1Estimates are age adjusted to the year 2000 standard population with unrounded population numbers. See Appendix II, Age adjustment.
NOTES: SE is standard error. Suicide deaths are identified using International Classification of Diseases, 10th Revision (ICD–10) underlying cause of death codes U03, X60–X84, and Y87.0. Other means include such causes as cutting and piercing, falls and jumping, burns from fire and hot substances or liquids, and transportation. See Appendix II, Cause of death; International Classification of Diseases (ICD); Table IV.
SOURCE: NCHS, National Vital Statistics System, Mortality. See Appendix I, National Vital Statistics System (NVSS).

34 Health, United States, 2019
Data table for Figure 6. Maternal mortality, by age and race and Hispanic origin: United States, 2018Excel and PowerPoint: https://www.cdc.gov/nchs/hus/contents2019.htm#Figure-006
Characteristic Number of deaths
Deaths per 100,000 live births
Rate Standard error
All women
Total1 . . . . . . . . . . . . . . . . . . . . . . . . . . . . . . . . . . . . . . . . . . . . . . . . . . . . 658 17.4 0.7
Age group (years)
Under 25 . . . . . . . . . . . . . . . . . . . . . . . . . . . . . . . . . . . . . . . . . . . . . . . . 96 10.6 1.125–39 . . . . . . . . . . . . . . . . . . . . . . . . . . . . . . . . . . . . . . . . . . . . . . . . . . . 458 16.6 0.840 and over . . . . . . . . . . . . . . . . . . . . . . . . . . . . . . . . . . . . . . . . . . . . . . 104 81.9 8.0
Race and Hispanic origin and age group (years)2
White, non-Hispanic . . . . . . . . . . . . . . . . . . . . . . . . . . . . . . . . . . . . . 291 14.9 0.9Under 25 . . . . . . . . . . . . . . . . . . . . . . . . . . . . . . . . . . . . . . . . . . . . . . 41 10.5 1.625–39 . . . . . . . . . . . . . . . . . . . . . . . . . . . . . . . . . . . . . . . . . . . . . . . . . 207 13.8 1.040 and over . . . . . . . . . . . . . . . . . . . . . . . . . . . . . . . . . . . . . . . . . . . . 43 72.0 11.0
Black, non-Hispanic . . . . . . . . . . . . . . . . . . . . . . . . . . . . . . . . . . . . . . 206 37.3 2.6Under 25 . . . . . . . . . . . . . . . . . . . . . . . . . . . . . . . . . . . . . . . . . . . . . . 27 15.3 2.925–39 . . . . . . . . . . . . . . . . . . . . . . . . . . . . . . . . . . . . . . . . . . . . . . . . . 137 38.2 3.340 and over . . . . . . . . . . . . . . . . . . . . . . . . . . . . . . . . . . . . . . . . . . . . 42 239.9 37.0
Hispanic . . . . . . . . . . . . . . . . . . . . . . . . . . . . . . . . . . . . . . . . . . . . . . . . . 105 11.8 1.2Under 25 . . . . . . . . . . . . . . . . . . . . . . . . . . . . . . . . . . . . . . . . . . . . . . 21 7.6 1.725–39 . . . . . . . . . . . . . . . . . . . . . . . . . . . . . . . . . . . . . . . . . . . . . . . . . 72 12.4 1.540 and over . . . . . . . . . . . . . . . . . . . . . . . . . . . . . . . . . . . . . . . . . . . . 12 * *
* Estimates are considered unreliable; rate not shown is based on fewer than 20 deaths in the numerator. 1Includes race and Hispanic-origin groups not shown separately, including persons who identify more than one race. 2Estimates by race and Hispanic origin are tabulated according to the Office of Management and Budget’s 1997 “Revisions to the Standards for the Classification of Federal Data on Race and Ethnicity.” Race categories are single race (only one race was reported on the death certificate). Due to smaller population counts for some race groups, data are shown only for maternal deaths among non-Hispanic white, non-Hispanic black, and Hispanic women. Race estimates may differ from other race estimates based on the same data and presented elsewhere if race groups are defined differently. Persons of Hispanic origin may be of any race. See Appendix II, Hispanic origin; Race.
NOTES: Maternal deaths are defined by the World Health Organization as the death of a woman while pregnant or within 42 days of termination of pregnancy, regardless of the duration and the site of the pregnancy, from any cause related to or aggravated by the pregnancy or its management. Deaths resulting from accidents, homicides, and suicides are excluded. Maternal deaths are identified using International Classification of Diseases, 10th Revision (ICD–10) underlying cause-of-death codes A34, O00–O95, and O98–O99. Maternal causes of death were assessed using the 2018 coding method. This method, the most accurate measurement of maternal mortality, uses information from the pregnancy checkbox for women aged 44 and under. The checkbox is not used for women aged 45 and over. For more information, see: Hoyert DL, Miniño AM. Maternal mortality in the United States: Changes in coding, publication, and data release, 2018. National Vital Statistics Reports; vol 69 no 2. Hyattsville, MD: National Center for Health Statistics. 2020. Available from: https://www.cdc.gov/nchs/data/nvsr/nvsr69/nvsr69-02-508.pdf. See also Appendix II, International Classification of Diseases (ICD); Maternal death; Rate.
SOURCE: NCHS, National Vital Statistics System, Mortality. See Appendix I, National Vital Statistics System (NVSS).

Health, United States, 2019 35
Data table for Figure 7. Teen births among females aged 15–19 years, by race and Hispanic origin: United States, 2008–2018Excel and PowerPoint: https://www.cdc.gov/nchs/hus/contents2019.htm#Figure-007
Year Total
Race and Hispanic origin of mother
Hispanic or Latina
Not Hispanic or Latina
White
Black or African
American Asian or
Pacific Islander Asian
Native Hawaiian or Other Pacific
Islander
American Indian or
Alaska Native
Live births per 1,000 females aged 15–19 years
2008 . . . . . . . . . . . . . . . . . . . . . . . . . 40.2 70.3 26.7 60.4 12.4 … … 65.02009 . . . . . . . . . . . . . . . . . . . . . . . . . 37.9 63.6 25.7 56.8 11.3 … … 62.02010 . . . . . . . . . . . . . . . . . . . . . . . . . 34.2 55.7 23.5 51.5 9.9 … … 55.52011 . . . . . . . . . . . . . . . . . . . . . . . . . 31.3 49.6 21.7 47.3 9.0 … … 52.62012 . . . . . . . . . . . . . . . . . . . . . . . . . 29.4 46.3 20.5 43.9 8.5 … … 51.22013 . . . . . . . . . . . . . . . . . . . . . . . . . 26.5 41.7 18.6 39.0 7.8 … … 44.92014 . . . . . . . . . . . . . . . . . . . . . . . . . 24.2 38.0 17.3 34.9 6.8 … … 39.32015 . . . . . . . . . . . . . . . . . . . . . . . . . 22.3 34.9 16.0 31.8 6.0 … … 37.62016 . . . . . . . . . . . . . . . . . . . . . . . . . … … 14.4 29.3 5.2 … … 34.72016 (single race) . . . . . . . . . . . . 20.3 31.9 14.3 29.3 … 3.9 28.6 35.12017 . . . . . . . . . . . . . . . . . . . . . . . . . … … 13.4 27.6 4.6 … … 32.22017 (single race) . . . . . . . . . . . . 18.8 28.9 13.2 27.5 … 3.3 25.5 32.92018 . . . . . . . . . . . . . . . . . . . . . . . . . … … 12.2 26.2 4.0 … … 29.42018 (single race) . . . . . . . . . . . . 17.4 26.7 12.1 26.3 … 2.8 26.5 29.7
Standard error
2008 . . . . . . . . . . . . . . . . . . . . . . . . . 0.06 0.18 0.06 0.19 0.16 … … 0.742009 . . . . . . . . . . . . . . . . . . . . . . . . . 0.06 0.17 0.06 0.18 0.15 … … 0.732010 . . . . . . . . . . . . . . . . . . . . . . . . . 0.06 0.16 0.06 0.17 0.14 … … 0.702011 . . . . . . . . . . . . . . . . . . . . . . . . . 0.05 0.15 0.06 0.17 0.13 … … 0.692012 . . . . . . . . . . . . . . . . . . . . . . . . . 0.05 0.14 0.06 0.16 0.13 … … 0.692013 . . . . . . . . . . . . . . . . . . . . . . . . . 0.05 0.14 0.06 0.16 0.12 … … 0.652014 . . . . . . . . . . . . . . . . . . . . . . . . . 0.05 0.13 0.05 0.15 0.11 … … 0.612015 . . . . . . . . . . . . . . . . . . . . . . . . . 0.05 0.12 0.05 0.14 0.10 … … 0.602016 . . . . . . . . . . . . . . . . . . . . . . . . . … … 0.05 0.14 0.09 … … 0.582016 (single race) . . . . . . . . . . . . 0.04 0.12 0.05 0.14 … 0.09 1.21 0.632017 . . . . . . . . . . . . . . . . . . . . . . . . . … … 0.05 0.13 0.09 … … 0.562017 (single race) . . . . . . . . . . . . 0.04 0.11 0.05 0.14 … 0.08 1.13 0.612018 . . . . . . . . . . . . . . . . . . . . . . . . . … … 0.05 0.13 0.08 … … 0.542018 (single race) . . . . . . . . . . . . 0.04 0.10 0.05 0.13 … 0.07 1.15 0.58
… Category not applicable.
NOTES: The race groups white, black or African American, American Indian or Alaska Native, Asian, and Native Hawaiian or Other Pacific Islander include persons of Hispanic and non-Hispanic origin. Persons of Hispanic origin may be of any race. Starting with 2016 data, race on birth records is available based on the 1997 “Revisions to the Standards for the Classification of Federal Data on Race and Ethnicity” and presented as single-race estimates (only one race was reported on the birth certificate). These estimates include separate estimates for non-Hispanic Asian and non-Hispanic Native Hawaiian or Other Pacific Islander groups. Data for 2008–2015 were tabulated according to the 1977 standards and bridged to retain comparability across states as they transitioned from the 1977 standards to those of 1997. Single-race estimates for 2016 and beyond are not completely comparable with bridged-race estimates for earlier years, particularly for smaller race categories. To look at longer-term trends, bridged-race estimates are also presented. The combined group of non-Hispanic Asian or Pacific Islander women is also shown. See Technical Notes; Appendix II, Hispanic origin; Race.
SOURCE: NCHS, National Vital Statistics System, Natality. See Appendix I, National Vital Statistics System (NVSS).

36 Health, United States, 2019
Data table for Figure 8. Preterm singleton births, by gestational age and race and Hispanic origin of mother: United States, 2008–2018Excel and PowerPoint: https://www.cdc.gov/nchs/hus/contents2019.htm#Figure-008
Preterm singleton births, by gestational age: 2008–2018
Gestational age (weeks)1 2008 2009 2010 2011 2012 2013 2014 2015 2016 2017 2018
Percent of live singleton births that were preterm
Total (less than 37) . . . . . . 8.5 8.2 8.1 8.0 8.0 7.8 7.7 7.8 8.0 8.1 8.234–36 . . . . . . . . . . . . . . . . 6.3 6.1 6.0 5.9 5.8 5.7 5.7 5.7 5.9 6.0 6.132–33 . . . . . . . . . . . . . . . . 0.9 0.9 0.9 0.9 0.9 0.9 0.8 0.9 0.9 0.9 0.9Less than 32 . . . . . . . . . . 1.3 1.3 1.3 1.3 1.3 1.2 1.2 1.2 1.2 1.2 1.2
Standard error
Total (less than 37) . . . . . . 0.01 0.01 0.01 0.01 0.01 0.01 0.01 0.01 0.01 0.01 0.0134–36 . . . . . . . . . . . . . . . . 0.01 0.01 0.01 0.01 0.01 0.01 0.01 0.01 0.01 0.01 0.0132–33 . . . . . . . . . . . . . . . . 0.00 0.00 0.00 0.00 0.00 0.00 0.00 0.00 0.00 0.00 0.00Less than 32 . . . . . . . . . . 0.01 0.01 0.01 0.01 0.01 0.01 0.01 0.01 0.01 0.01 0.01
Preterm singleton births, by gestational age and race and Hispanic origin of mother: 2018
Gestational age (weeks)1 Total2
Race and Hispanic origin of mother3
Hispanic or Latina
Not Hispanic or Latina
White Black or African
American Asian
Native Hawaiian or Other Pacific
Islander
American Indian or
Alaska Native
Percent of live singleton births that were preterm
Total (less than 37) . . . . . . . . . . . . . . . . . . . . 8.2 8.4 7.2 11.9 7.1 10.3 10.234–36 . . . . . . . . . . . . . . . . . . . . . . . . . . . . . . 6.1 6.3 5.6 7.9 5.4 7.5 7.632–33 . . . . . . . . . . . . . . . . . . . . . . . . . . . . . . 0.9 0.9 0.7 1.4 0.7 1.2 1.2Less than 32 . . . . . . . . . . . . . . . . . . . . . . . . 1.2 1.2 0.9 2.6 1.0 1.7 1.3
Standard error
Total (less than 37) . . . . . . . . . . . . . . . . . . . . 0.01 0.03 0.02 0.04 0.05 0.32 0.1834–36 . . . . . . . . . . . . . . . . . . . . . . . . . . . . . . 0.01 0.03 0.02 0.04 0.05 0.27 0.1632–33 . . . . . . . . . . . . . . . . . . . . . . . . . . . . . . 0.00 0.01 0.01 0.02 0.02 0.11 0.07Less than 32 . . . . . . . . . . . . . . . . . . . . . . . . 0.01 0.01 0.01 0.02 0.02 0.13 0.07
0.00 Quantity more than zero but less than 0.005. 1Preterm births are based on the obstetric estimate of gestational age and limited to singleton births. Singleton births refer to single births, in contrast with multiple or higher-order births, such as twins or triplets. Percentages for gestational age categories may not sum to the total percentage of live singleton births that occurred less than 37 weeks of gestation due to rounding. For more information on the obstetric estimates, see Appendix II, Gestation, and: Martin JA, Osterman MJK, Kirmeyer SE, Gregory ECW. Measuring gestational age in vital statistics data: Transitioning to the obstetric estimate. National Vital Statistics Reports; vol 64 no 5. Hyattsville, MD: National Center for Health Statistics. 2015. Available from: https://www.cdc.gov/nchs/data/nvsr/nvsr64/nvsr64_05.pdf. 2Includes preterm births for mothers of all other races and Hispanic-origin groups not shown separately, including multiple-race groups. 3The race groups white, black or African American, American Indian or Alaska Native, Asian, and Native Hawaiian or Other Pacific Islander include persons of Hispanic and non-Hispanic origin. Persons of Hispanic origin may be of any race. Starting with 2016 data, race on birth records is available based on the 1997 “Revisions to the Standards for the Classification of Federal Data on Race and Ethnicity” and presented as single-race estimates (only one race was reported on the birth certificate). These estimates include separate estimates for non-Hispanic Asian and non-Hispanic Native Hawaiian or Other Pacific Islander groups. Data for 2003–2015 were tabulated according to the 1977 standards and bridged to retain comparability across states as they transitioned from the 1977 standards to those of 1997. See Technical Notes; Appendix II, Hispanic origin; Race.
SOURCE: NCHS, National Vital Statistics System, Natality. See Appendix I, National Vital Statistics System (NVSS).

Health, United States, 2019 37
Data table for Figure 9. Cigarette smoking among adults aged 18 and over, by age, and tobacco use among adolescents in grades 9–12, by type of product: United States, 2008–2018Excel and PowerPoint: https://www.cdc.gov/nchs/hus/contents2019.htm#Figure-009
Current cigarette smoking among adults aged 18 and over, by age: 2008–2018
Year
18 and over 18–44 45–64 65 and over
Percent (age adjusted)1 SE
Percent (crude) SE Percent SE Percent SE Percent SE
2008 . . . . . . . . . . . . . . . . . . 20.6 0.4 20.6 0.4 23.1 0.6 22.6 0.6 9.3 0.52009 . . . . . . . . . . . . . . . . . . 20.6 0.4 20.6 0.4 23.4 0.5 21.9 0.6 9.5 0.52010 . . . . . . . . . . . . . . . . . . 19.3 0.3 19.3 0.3 21.5 0.5 21.1 0.5 9.5 0.52011 . . . . . . . . . . . . . . . . . . 19.0 0.3 19.0 0.3 21.2 0.5 21.4 0.5 7.9 0.42012 . . . . . . . . . . . . . . . . . . 18.2 0.3 18.1 0.3 20.4 0.5 19.5 0.5 8.9 0.42013 . . . . . . . . . . . . . . . . . . 17.9 0.3 17.8 0.3 19.7 0.5 19.9 0.5 8.8 0.42014 . . . . . . . . . . . . . . . . . . 17.0 0.3 16.8 0.3 19.1 0.5 18.0 0.5 8.5 0.42015 . . . . . . . . . . . . . . . . . . 15.3 0.3 15.1 0.3 16.5 0.5 17.0 0.5 8.4 0.42016 . . . . . . . . . . . . . . . . . . 15.7 0.3 15.5 0.3 16.4 0.5 18.0 0.5 8.8 0.42017 . . . . . . . . . . . . . . . . . . 14.1 0.3 14.0 0.3 14.6 0.4 16.5 0.5 8.2 0.42018 . . . . . . . . . . . . . . . . . . 13.9 0.3 13.7 0.3 14.3 0.5 16.3 0.5 8.4 0.4
Tobacco use in the past 30 days among adolescents in grades 9–12, by type of product: 2011–2018
YearAny tobacco
product2,3Electronic cigarette4 Cigarette5 Cigar6
Smokeless tobacco7 Hookah8 Pipe tobacco9
Percent
2011 . . . . . . . . . . . . . . . . . . 24.2 1.5 15.8 11.6 7.9 4.1 4.02012 . . . . . . . . . . . . . . . . . . 23.3 2.8 14.0 12.6 7.3 5.4 4.52013 . . . . . . . . . . . . . . . . . . 22.9 4.5 12.7 11.9 6.2 5.2 4.12014 . . . . . . . . . . . . . . . . . . 24.6 13.4 9.2 8.2 6.3 9.4 1.52015 . . . . . . . . . . . . . . . . . . 25.3 16.0 9.3 8.6 6.0 7.2 1.02016 . . . . . . . . . . . . . . . . . . 20.2 11.3 8.0 7.7 5.8 4.8 1.42017 . . . . . . . . . . . . . . . . . . 19.6 11.7 7.6 7.7 5.5 3.3 0.82018 . . . . . . . . . . . . . . . . . . 27.1 20.8 8.1 7.6 5.9 4.1 1.1
Standard error
2011 . . . . . . . . . . . . . . . . . . 1.2 0.2 1.1 0.6 0.8 0.4 0.32012 . . . . . . . . . . . . . . . . . . 0.9 0.3 0.8 0.6 0.6 0.4 0.32013 . . . . . . . . . . . . . . . . . . 0.9 0.4 0.7 0.6 0.7 0.4 0.32014 . . . . . . . . . . . . . . . . . . 1.0 1.2 0.6 0.5 0.6 0.6 0.22015 . . . . . . . . . . . . . . . . . . 1.1 1.0 0.8 0.5 0.7 0.5 0.22016 . . . . . . . . . . . . . . . . . . 1.0 0.8 0.7 0.6 0.6 0.4 0.12017 . . . . . . . . . . . . . . . . . . 1.3 1.1 0.6 0.6 0.7 0.3 0.12018 . . . . . . . . . . . . . . . . . . 0.9 1.0 0.6 0.5 0.5 0.3 0.1
See footnotes at end of table.

38 Health, United States, 2019
Data table for Figure 9. Cigarette smoking among adults aged 18 and over, by age, and tobacco use among adolescents in grades 9–12, by type of product: United States, 2008–2018—Con.Excel and PowerPoint: https://www.cdc.gov/nchs/hus/contents2019.htm#Figure-009
1Estimates are age adjusted to the year 2000 standard population using five age groups: 18–24, 25–34, 35–44, 45–64, and 65 and over. Age-adjusted estimates may differ from other age-adjusted estimates based on the same data and presented elsewhere if different age groups are used in the adjustment procedure. See Appendix II, Age adjustment. 2Use of any tobacco product (electronic cigarette, cigarette, cigar/cigarillo/little cigar, smokeless tobacco [including chewing tobacco/snuff/dip, snus, or dissolvable tobacco], hookah, pipe tobacco, or bidi) on at least 1 day in the past 30 days. 3In 2018, bidi use was assessed by the question, “In the past 30 days, which of the following tobacco products have you used on at least one day?” and the response option, “Bidis (small brown cigarettes wrapped in a leaf ).” Prevalence estimates are not provided for bidis individually; however, use of bidis is captured in the composite measure “any tobacco product.” 4In 2018, past 30-day use of electronic cigarettes was determined by asking, “During the past 30 days, on how many days did you use electronic cigarettes or e-cigarettes?” 5Past 30-day use of cigarettes was determined by asking, “During the past 30 days, on how many days did you smoke cigarettes?” 6Past 30-day use of cigars was determined by asking, “During the past 30 days, on how many days did you smoke cigars, cigarillos, or little cigars?” 7Defined as use of chewing tobacco, snuff, dip, snus, or dissolvable tobacco products. Past 30-day use of smokeless tobacco was determined by combining the responses to two questions: “During the past 30 days, on how many days did you use chewing tobacco, snuff, or dip?” followed by, “In the past 30 days, which of the following products did you use on at least one day?” Response options included: “Snus, such as Camel, Marlboro, or General Snus; Dissolvable tobacco products such as Ariva, Stonewall, Camel orbs, Camel sticks, Marlboro sticks, or Camel strips.” Beginning in 2015, the definition of smokeless tobacco includes chewing tobacco/snuff/dip, snus, and dissolvable tobacco products, due to a limited sample size for individual products (snus, dissolvable). This definition of smokeless tobacco is applied across all years presented (2011–2018) for comparability purposes. Previously published reports using 2014 and earlier National Youth Tobacco Survey (NYTS) data used a definition of smokeless tobacco that included only chewing tobacco, snuff, and dip; therefore, estimates from those reports may not be comparable to those presented here. 8Past 30-day use of hookah was determined by asking, “During the past 30 days, on how many days did you smoke tobacco in a hookah or waterpipe?” 9Past 30-day use of pipe tobacco was determined by asking, “In the past 30 days, which of the following products have you used on at least one day?” and the response option, “Pipes filled with tobacco (not waterpipe).”
NOTES: SE is standard error. Data are for the civilian noninstitutionalized population. Current cigarette smoking by adults is defined as ever smoking 100 cigarettes in their lifetime and smoking now every day or some days. Use of tobacco products by students in grades 9–12 is defined as having used the product on one or more days during the past 30 days. Data for the 2019 NYTS are available but not shown. Changes made to the 2019 survey—shifting to electronic administration of questionnaires, inclusion of tobacco product images, and descriptions in the preamble before each product-specific section—could result in higher estimates of tobacco use. Therefore, the 2019 estimates are not directly comparable with estimates from prior years. For the 2019 estimates, see https://www.cdc.gov/mmwr/volumes/68/ss/ss6812a1.htm. See Appendix II, Tobacco use.
SOURCE: NCHS, National Health Interview Survey, and CDC, National Youth Tobacco Survey. See Appendix I, National Health Interview Survey (NHIS) and National Youth Tobacco Survey (NYTS).

Health, United States, 2019 39
Data table for Figure 10. Current asthma among children under age 18 years, by age and race and Hispanic origin: United States, 2008–2018Excel and PowerPoint: https://www.cdc.gov/nchs/hus/contents2019.htm#Figure-010
Current asthma among children under age 18 years, by age: 2008–2018
Year
Total Under 5 years 5–17 years
Percent SE Percent SE Percent SE
2008 . . . . . . . . . . . . . . . . . . . . . . . . . . 9.4 0.4 6.2 0.6 10.7 0.52009 . . . . . . . . . . . . . . . . . . . . . . . . . . 9.6 0.4 6.3 0.6 11.0 0.52010 . . . . . . . . . . . . . . . . . . . . . . . . . . 9.4 0.3 6.0 0.5 10.7 0.42011 . . . . . . . . . . . . . . . . . . . . . . . . . . 9.5 0.3 6.9 0.5 10.6 0.42012 . . . . . . . . . . . . . . . . . . . . . . . . . . 9.3 0.3 5.4 0.5 10.7 0.42013 . . . . . . . . . . . . . . . . . . . . . . . . . . 8.3 0.3 4.2 0.4 9.9 0.42014 . . . . . . . . . . . . . . . . . . . . . . . . . . 8.6 0.3 4.3 0.5 10.2 0.42015 . . . . . . . . . . . . . . . . . . . . . . . . . . 8.4 0.3 4.7 0.5 9.8 0.42016 . . . . . . . . . . . . . . . . . . . . . . . . . . 8.3 0.3 3.8 0.5 10.0 0.42017 . . . . . . . . . . . . . . . . . . . . . . . . . . 8.4 0.4 4.4 0.6 9.9 0.52018 . . . . . . . . . . . . . . . . . . . . . . . . . . 7.5 0.4 3.8 0.5 8.9 0.5
Current asthma among children under age 18 years, by race and Hispanic origin: 2018
Year
Hispanic
Not Hispanic or Latino
White Black Asian
Percent SE Percent SE Percent SE Percent SE
2018 . . . . . . . . . . . . . . . . . . . . . . . . . . 8.0 0.8 5.6 0.4 14.3 1.5 3.6 0.9
NOTES: SE is standard error. Data are for the civilian noninstitutionalized population. Based on a parent or knowledgeable adult responding yes to both questions, “Has a doctor or other health professional ever told you that your child had asthma?” and “Does your child still have asthma?” Children of Hispanic origin may be of any race. Race-specific estimates are tabulated according to the 1997 “Revisions to the Standards for the Classification of Federal Data on Race and Ethnicity.” See Appendix II, Hispanic origin; Race.
SOURCE: NCHS, National Health Interview Survey. See Appendix I, National Health Interview Survey (NHIS).

40 Health, United States, 2019
Data table for Figure 11. Hypertension among adults aged 20 and over, by age: United States, 1999–2000 through 2017–2018Excel and PowerPoint: https://www.cdc.gov/nchs/hus/contents2019.htm#Figure-011
Hypertension among adults aged 20 and over, by age: 1999–2000 through 2017–2018
Age group (years)
Hypertension1
1999– 2000
2001– 2002
2003– 2004
2005– 2006
2007– 2008
2009– 2010
2011– 2012
2013– 2014
2015– 2016
2017– 2018
Percent
20 and over, age adjusted2 . . . . . . . . . . . . . 48.4 47.3 46.5 44.9 44.5 43.4 45.4 43.0 44.7 46.6
20 and over, crude . . . . . . . . . . 47.2 46.7 46.7 46.0 45.6 45.1 47.4 45.4 47.4 49.620–44 . . . . . . . . . . . . . . . . . . . . 28.6 28.5 25.5 24.9 24.7 23.6 26.6 22.8 25.0 27.545–64 . . . . . . . . . . . . . . . . . . . . 61.4 58.4 61.2 58.8 56.1 55.2 57.7 56.2 58.6 60.365 and over . . . . . . . . . . . . . . . 82.3 81.0 80.2 77.5 80.1 79.7 78.0 79.2 74.7 77.3
Standard error
20 and over, age adjusted2 . . . . . . . . . . . . . 1.5 1.3 1.3 1.3 0.8 1.2 0.9 0.8 1.2 1.5
20 and over, crude . . . . . . . . . . 1.5 1.3 1.5 0.8 1.1 1.4 1.6 0.9 1.0 1.320–44 . . . . . . . . . . . . . . . . . . . . 1.9 1.4 1.2 1.9 1.2 0.8 1.7 0.9 1.6 1.145–64 . . . . . . . . . . . . . . . . . . . . 2.3 2.1 2.6 1.6 1.5 2.7 1.3 1.6 1.8 2.065 and over . . . . . . . . . . . . . . . 2.3 1.8 1.5 1.7 1.8 1.6 1.4 1.2 2.5 2.3
Hypertension among adults aged 20 and over based on the 2007 standard, by age: 2017–2018
Age group (years)
Hypertension3
Percent Standard error
20 and over, age adjusted2 . . . . . . . . . . . . . 31.0 1.4
20 and over, crude . . . . . . . . . . 34.9 1.620–44 . . . . . . . . . . . . . . . . . . . . 10.5 1.045–64 . . . . . . . . . . . . . . . . . . . . 45.0 2.765 and over . . . . . . . . . . . . . . . 68.4 2.0
1Defined as having measured high blood pressure (measured systolic blood pressure of at least 130 mm Hg or diastolic blood pressure of at least 80 mm Hg) or taking high blood pressure medication. For more information, see Appendix II, Hypertension; Table VI. 2Estimates are age adjusted to the year 2000 standard population using five age groups: 20–34, 35–44, 45–54, 55–64, and 65 and over. See Appendix II, Age adjustment. 3Formerly defined as having measured high blood pressure (measured systolic blood pressure of at least 140 mm Hg or diastolic blood pressure of at least 90 mm Hg) or taking high blood pressure medication. For more information, including a comparison of high blood pressure estimates based on the former and revised standards, see Appendix II, Hypertension; Table VI.
NOTES: Data are for the civilian noninstitutionalized population. In 2017, the American College of Cardiology and the American Heart Association Task Force recommended adopting lower thresholds of high blood pressure. For systolic blood pressure, the threshold was lowered from 140 mm Hg to 130 mm Hg and for diastolic blood pressure, from 90 mm Hg to 80 mm Hg. For more information, including a comparison of hypertension estimates based on the former and revised standards, see Appendix II, Hypertension; Table VI.
SOURCE: NCHS, National Health and Nutrition Examination Survey. See Appendix I, National Health and Nutrition Examination Survey (NHANES).

Health, United States, 2019 41
See footnotes at end of table.
Data table for Figure 12. Heart disease and cancer among adults aged 18 and over, by sex and age: United States, 2008–2018Excel and PowerPoint: https://www.cdc.gov/nchs/hus/contents2019.htm#Figure-012
Heart disease, by sex and age: 2008–2018
Sex and year
Age group (years)
18–44 45–64 65 and over
Percent SE Percent SE Percent SE
Men
2008 . . . . . . . . . . . . . . . . . . . . . . . . . . . . . . . . . . . . 4.2 0.4 13.0 0.7 37.3 1.32009 . . . . . . . . . . . . . . . . . . . . . . . . . . . . . . . . . . . . 4.5 0.4 14.5 0.7 37.4 1.32010 . . . . . . . . . . . . . . . . . . . . . . . . . . . . . . . . . . . . 4.1 0.3 13.8 0.6 36.3 1.22011 . . . . . . . . . . . . . . . . . . . . . . . . . . . . . . . . . . . . 3.3 0.2 13.8 0.6 37.4 1.12012 . . . . . . . . . . . . . . . . . . . . . . . . . . . . . . . . . . . . 3.8 0.3 13.5 0.6 34.5 1.12013 . . . . . . . . . . . . . . . . . . . . . . . . . . . . . . . . . . . . 3.7 0.3 13.6 0.6 34.8 1.12014 . . . . . . . . . . . . . . . . . . . . . . . . . . . . . . . . . . . . 4.2 0.3 12.8 0.6 35.2 1.12015 . . . . . . . . . . . . . . . . . . . . . . . . . . . . . . . . . . . . 4.3 0.4 12.6 0.6 35.1 1.12016 . . . . . . . . . . . . . . . . . . . . . . . . . . . . . . . . . . . . 3.3 0.3 13.3 0.6 33.9 1.02017 . . . . . . . . . . . . . . . . . . . . . . . . . . . . . . . . . . . . 3.8 0.4 13.0 0.6 33.7 1.02018 . . . . . . . . . . . . . . . . . . . . . . . . . . . . . . . . . . . . 4.6 0.4 13.3 0.6 34.9 1.0
Women
2008 . . . . . . . . . . . . . . . . . . . . . . . . . . . . . . . . . . . . 5.0 0.3 11.5 0.6 28.9 1.02009 . . . . . . . . . . . . . . . . . . . . . . . . . . . . . . . . . . . . 4.3 0.3 11.7 0.6 25.8 1.02010 . . . . . . . . . . . . . . . . . . . . . . . . . . . . . . . . . . . . 4.8 0.3 12.6 0.5 25.3 0.92011 . . . . . . . . . . . . . . . . . . . . . . . . . . . . . . . . . . . . 3.8 0.3 11.8 0.5 25.7 0.82012 . . . . . . . . . . . . . . . . . . . . . . . . . . . . . . . . . . . . 3.7 0.2 10.8 0.5 26.1 0.92013 . . . . . . . . . . . . . . . . . . . . . . . . . . . . . . . . . . . . 3.8 0.3 10.7 0.5 25.9 0.92014 . . . . . . . . . . . . . . . . . . . . . . . . . . . . . . . . . . . . 4.4 0.3 11.2 0.5 23.9 0.82015 . . . . . . . . . . . . . . . . . . . . . . . . . . . . . . . . . . . . 4.4 0.3 11.1 0.5 25.1 0.92016 . . . . . . . . . . . . . . . . . . . . . . . . . . . . . . . . . . . . 4.3 0.3 11.2 0.5 23.6 0.82017 . . . . . . . . . . . . . . . . . . . . . . . . . . . . . . . . . . . . 4.2 0.3 10.8 0.6 23.2 0.82018 . . . . . . . . . . . . . . . . . . . . . . . . . . . . . . . . . . . . 5.0 0.4 10.4 0.5 24.5 0.8

42 Health, United States, 2019
Data table for Figure 12. Heart disease and cancer among adults aged 18 and over, by sex and age: United States, 2008–2018—Con.Excel and PowerPoint: https://www.cdc.gov/nchs/hus/contents2019.htm#Figure-012
Cancer, by sex and age: 2008–2018
Sex and year
Age group (years)
18–44 45–64 65 and over
Percent SE Percent SE Percent SE
Men
2008 . . . . . . . . . . . . . . . . . . . . . . . . . . . . . . . . . . . . 0.8 0.2 4.5 0.4 16.9 1.02009 . . . . . . . . . . . . . . . . . . . . . . . . . . . . . . . . . . . . 0.7 0.1 4.8 0.4 20.5 1.02010 . . . . . . . . . . . . . . . . . . . . . . . . . . . . . . . . . . . . 1.0 0.1 5.7 0.5 20.7 1.02011 . . . . . . . . . . . . . . . . . . . . . . . . . . . . . . . . . . . . 0.8 0.1 4.5 0.3 20.7 0.92012 . . . . . . . . . . . . . . . . . . . . . . . . . . . . . . . . . . . . 0.9 0.1 5.1 0.4 20.0 0.92013 . . . . . . . . . . . . . . . . . . . . . . . . . . . . . . . . . . . . 0.5 0.1 5.6 0.4 20.4 1.02014 . . . . . . . . . . . . . . . . . . . . . . . . . . . . . . . . . . . . 0.9 0.1 5.2 0.4 18.7 0.92015 . . . . . . . . . . . . . . . . . . . . . . . . . . . . . . . . . . . . 0.9 0.2 4.7 0.4 19.3 0.92016 . . . . . . . . . . . . . . . . . . . . . . . . . . . . . . . . . . . . 1.0 0.1 5.2 0.4 20.7 0.92017 . . . . . . . . . . . . . . . . . . . . . . . . . . . . . . . . . . . . 1.0 0.2 6.0 0.4 20.5 0.92018 . . . . . . . . . . . . . . . . . . . . . . . . . . . . . . . . . . . . 0.8 0.2 4.8 0.4 19.6 0.8
Women
2008 . . . . . . . . . . . . . . . . . . . . . . . . . . . . . . . . . . . . 2.8 0.3 8.7 0.5 17.9 0.92009 . . . . . . . . . . . . . . . . . . . . . . . . . . . . . . . . . . . . 2.2 0.2 8.7 0.5 16.1 0.82010 . . . . . . . . . . . . . . . . . . . . . . . . . . . . . . . . . . . . 2.6 0.2 8.9 0.4 16.3 0.72011 . . . . . . . . . . . . . . . . . . . . . . . . . . . . . . . . . . . . 2.3 0.2 8.3 0.4 17.2 0.72012 . . . . . . . . . . . . . . . . . . . . . . . . . . . . . . . . . . . . 2.3 0.2 7.9 0.4 17.1 0.72013 . . . . . . . . . . . . . . . . . . . . . . . . . . . . . . . . . . . . 2.4 0.2 8.2 0.4 17.0 0.72014 . . . . . . . . . . . . . . . . . . . . . . . . . . . . . . . . . . . . 2.4 0.2 7.7 0.4 17.2 0.72015 . . . . . . . . . . . . . . . . . . . . . . . . . . . . . . . . . . . . 2.1 0.2 8.4 0.5 18.6 0.82016 . . . . . . . . . . . . . . . . . . . . . . . . . . . . . . . . . . . . 2.3 0.2 9.7 0.5 18.5 0.72017 . . . . . . . . . . . . . . . . . . . . . . . . . . . . . . . . . . . . 2.4 0.2 8.5 0.5 18.1 0.72018 . . . . . . . . . . . . . . . . . . . . . . . . . . . . . . . . . . . . 2.0 0.2 8.8 0.5 19.5 0.7
NOTES: SE is standard error. Data are for the civilian noninstitutionalized population. Heart disease is based on self-reported responses to questions about whether respondents had ever been told by a doctor or other health professional that they had coronary heart disease, angina (angina pectoris), a heart attack (myocardial infarction), or any other kind of heart disease or heart condition. Cancer is based on self-reported responses to a question about whether respondents had ever been told by a doctor or other health professional that they had cancer or a malignancy of any kind (excluding squamous cell and basal cell carcinomas).
SOURCE: NCHS, National Health Interview Survey. See Appendix I, National Health Interview Survey (NHIS).

Health, United States, 2019 43
Data table for Figure 13. Functional limitation among adults aged 18 and over, by age and level of difficulty: United States, 2010–2018Excel and PowerPoint: https://www.cdc.gov/nchs/hus/contents2019.htm#Figure-013
Functional limitation among adults aged 18–64, by level of difficulty: 2010–2018
Year
Level of difficulty
No difficulty Some difficulty A lot of difficulty or cannot do at all
Crude Age adjusted Crude Age adjusted Crude Age adjusted
Percent
2010 . . . . . . . . . . . . . . . . . . . . . . . . . . . . . 67.2 68.2 26.7 26.1 6.2 5.72011 . . . . . . . . . . . . . . . . . . . . . . . . . . . . . 72.5 73.6 21.5 20.9 6.0 5.52012 . . . . . . . . . . . . . . . . . . . . . . . . . . . . . 66.1 67.6 28.2 27.1 5.7 5.32013 . . . . . . . . . . . . . . . . . . . . . . . . . . . . . 63.5 64.9 29.7 28.9 6.8 6.22014 . . . . . . . . . . . . . . . . . . . . . . . . . . . . . 63.9 65.2 28.9 28.1 7.2 6.72015 . . . . . . . . . . . . . . . . . . . . . . . . . . . . . 67.3 68.7 26.1 25.1 6.6 6.12016 . . . . . . . . . . . . . . . . . . . . . . . . . . . . . 67.3 68.3 26.5 25.9 6.2 5.82017 . . . . . . . . . . . . . . . . . . . . . . . . . . . . . 66.3 67.6 27.8 26.9 5.9 5.52018 . . . . . . . . . . . . . . . . . . . . . . . . . . . . . 62.6 63.9 30.2 29.4 7.2 6.7
Standard error
2010 . . . . . . . . . . . . . . . . . . . . . . . . . . . . . 0.8 0.8 0.8 0.8 0.4 0.42011 . . . . . . . . . . . . . . . . . . . . . . . . . . . . . 0.5 0.5 0.4 0.4 0.3 0.22012 . . . . . . . . . . . . . . . . . . . . . . . . . . . . . 0.8 0.8 0.7 0.7 0.4 0.42013 . . . . . . . . . . . . . . . . . . . . . . . . . . . . . 0.6 0.6 0.6 0.5 0.3 0.32014 . . . . . . . . . . . . . . . . . . . . . . . . . . . . . 0.6 0.6 0.6 0.6 0.3 0.32015 . . . . . . . . . . . . . . . . . . . . . . . . . . . . . 0.6 0.6 0.6 0.6 0.3 0.32016 . . . . . . . . . . . . . . . . . . . . . . . . . . . . . 0.7 0.7 0.6 0.6 0.3 0.32017 . . . . . . . . . . . . . . . . . . . . . . . . . . . . . 0.7 0.6 0.6 0.6 0.3 0.32018 . . . . . . . . . . . . . . . . . . . . . . . . . . . . . 0.5 0.5 0.4 0.5 0.2 0.2
Functional limitation among adults aged 65 and over, by level of difficulty: 2010–2018
Year
Level of difficulty
No difficulty Some difficulty A lot of difficulty or cannot do at all
Crude Age adjusted Crude Age adjusted Crude Age adjusted
Percent
2010 . . . . . . . . . . . . . . . . . . . . . . . . . . . . . 35.4 35.0 42.0 42.0 22.6 23.12011 . . . . . . . . . . . . . . . . . . . . . . . . . . . . . 40.3 39.8 39.1 39.3 20.7 21.02012 . . . . . . . . . . . . . . . . . . . . . . . . . . . . . 40.4 39.7 41.7 41.9 17.9 18.52013 . . . . . . . . . . . . . . . . . . . . . . . . . . . . . 33.8 32.7 44.3 44.6 21.9 22.72014 . . . . . . . . . . . . . . . . . . . . . . . . . . . . . 33.6 32.6 44.7 45.0 21.6 22.32015 . . . . . . . . . . . . . . . . . . . . . . . . . . . . . 36.1 34.5 42.4 42.8 21.6 22.72016 . . . . . . . . . . . . . . . . . . . . . . . . . . . . . 39.9 38.6 42.0 42.2 18.2 19.22017 . . . . . . . . . . . . . . . . . . . . . . . . . . . . . 38.9 37.7 41.6 41.8 19.5 20.62018 . . . . . . . . . . . . . . . . . . . . . . . . . . . . . 32.7 31.4 45.4 45.6 21.9 23.0
Standard error
2010 . . . . . . . . . . . . . . . . . . . . . . . . . . . . . 1.7 1.6 1.7 1.7 1.4 1.42011 . . . . . . . . . . . . . . . . . . . . . . . . . . . . . 1.0 1.0 1.0 1.0 0.9 0.92012 . . . . . . . . . . . . . . . . . . . . . . . . . . . . . 1.5 1.5 1.4 1.4 1.1 1.12013 . . . . . . . . . . . . . . . . . . . . . . . . . . . . . 1.0 0.9 1.1 1.1 0.9 0.92014 . . . . . . . . . . . . . . . . . . . . . . . . . . . . . 1.0 1.0 1.0 1.0 0.9 0.92015 . . . . . . . . . . . . . . . . . . . . . . . . . . . . . 1.1 1.0 1.1 1.1 0.9 1.02016 . . . . . . . . . . . . . . . . . . . . . . . . . . . . . 1.0 1.0 1.0 1.0 0.7 0.72017 . . . . . . . . . . . . . . . . . . . . . . . . . . . . . 1.0 1.0 1.0 1.0 0.8 0.92018 . . . . . . . . . . . . . . . . . . . . . . . . . . . . . 0.7 0.7 0.7 0.7 0.6 0.6
See footnotes at end of table.

44 Health, United States, 2019
Data table for Figure 13. Functional limitation among adults aged 18 and over, by age and level of difficulty: United States, 2010–2018—Con.Excel and PowerPoint: https://www.cdc.gov/nchs/hus/contents2019.htm#Figure-013
NOTES: Data are for the civilian noninstitutionalized population. Functional limitation is defined by the reported level of difficulty in six functioning domains: seeing (even if wearing glasses), hearing (even if wearing hearing aids), mobility (walking or climbing stairs), communication (understanding or being understood by others), cognition (remembering or concentrating), and self-care (such as washing all over or dressing). Respondents with answers to one or more of the six questions are included in one of three mutually exclusive categories. Adults who respond “a lot of difficulty” or “cannot do at all/unable to do” to at least one question are classified in the “a lot of difficulty or cannot do at all” category. Of the remaining respondents, adults who respond “some difficulty” to all questions are classified in the “some difficulty” category, and adults who respond “no difficulty” to all questions are classified in the “no difficulty” category. Adults who respond “don’t know” or “refused” to all six questions are excluded. During 2010–2018, 1%–8% of respondents were missing data and excluded. Estimates are age adjusted to the year 2000 standard population using five age groups: 18–44, 45–54, and 55–64 for age group 18–64 estimates, and 65–74 and 75 and over for age group 65 and over estimates. Estimates may not sum to 100% due to rounding. See Appendix II, Age adjustment; Functional limitation.
SOURCE: NCHS, National Health Interview Survey. See Appendix I, National Health Interview Survey (NHIS).

Health, United States, 2019 45
Data table for Figure 14. Use of mammography among women aged 40–74 and use of colorectal cancer testing among adults aged 50–75, by race and Hispanic origin: United States, 2008–2018Excel and PowerPoint: https://www.cdc.gov/nchs/hus/contents2019.htm#Figure-014
Use of mammography in the past 2 years among women aged 40–74, by race and Hispanic origin: 2008–2018
Year
Total2
Race and Hispanic origin1
Hispanic
Not Hispanic or Latino
White Black Asian
Percent SE Percent SE Percent SE Percent SE Percent SE
Percent of women having a mammogram within the past 2 years3
2008 . . . . . . . . . . . . . . . . . . . . 69.3 0.7 61.7 2.2 70.5 0.9 70.1 1.8 69.0 3.22010 . . . . . . . . . . . . . . . . . . . . 68.9 0.7 65.2 1.7 69.9 0.9 69.5 1.5 64.1 2.72013 . . . . . . . . . . . . . . . . . . . . 68.4 0.6 62.1 1.5 69.6 0.8 68.1 1.7 70.4 2.42015 . . . . . . . . . . . . . . . . . . . . 67.5 0.7 62.8 1.7 68.2 0.8 72.3 1.6 62.7 3.02018 . . . . . . . . . . . . . . . . . . . . 69.4 0.6 64.0 1.9 71.2 0.7 70.5 2.0 62.6 3.1
Use of colorectal cancer test or procedure among adults aged 50–75, by race and Hispanic origin: 2008–2018
Year
Total2
Race and Hispanic origin1
Hispanic
Not Hispanic or Latino
White Black Asian
Percent SE Percent SE Percent SE Percent SE Percent SE
Percent of adults having a colorectal cancer test or procedure4
2008 . . . . . . . . . . . . . . . . . . . . 51.6 0.7 34.0 2.0 54.8 0.8 47.4 2.0 47.3 3.52010 . . . . . . . . . . . . . . . . . . . . 58.7 0.7 46.5 1.9 61.3 0.8 55.3 1.6 46.6 2.92013 . . . . . . . . . . . . . . . . . . . . 57.8 0.6 41.5 1.7 60.4 0.7 58.2 1.5 51.2 2.72015 . . . . . . . . . . . . . . . . . . . . 62.4 0.6 47.4 1.8 65.6 0.8 60.3 1.5 52.1 2.82018 . . . . . . . . . . . . . . . . . . . . 67.2 0.6 57.9 2.0 69.9 0.7 65.2 1.6 58.2 3.1
1Race-specific estimates are tabulated according to the 1997 “Revisions to the Standards for the Classification of Federal Data on Race and Ethnicity.” Estimates shown are for persons who reported only one racial group. Persons of Hispanic origin may be of any race. See Appendix II, Hispanic origin; Race. 2Includes all other races not shown separately. 3Questions concerning use of mammography differ slightly on the National Health Interview Survey across survey years. Use of a mammography is defined as reporting a mammogram in the past 2 years and using current U.S. Preventive Services Task Force (USPSTF) recommendations for breast cancer screening. For more information, see https://www.uspreventiveservicestaskforce.org/uspstf/recommendation/breast-cancer-screening. See Appendix II, Mammography. 4Questions concerning colorectal cancer testing differ slightly on the National Health Interview Survey across survey years. For 2008–2013 estimates, use of a colorectal cancer test was defined as reporting a fecal occult blood test (FOBT) in the past year, sigmoidoscopy in the past 5 years with FOBT in the past 3 years, or colonoscopy in the past 10 years. For 2015 estimates, fecal immunochemical test (FIT) in the past year was included in the definition of colorectal cancer testing. For 2018 estimates, use of a colorectal cancer test is defined as FOBT or FIT test in the past year, FIT-DNA test in the past 3 years, sigmoidoscopy in the past 5 years, computed tomography or CT colonography in the past 5 years, or colonoscopy in the past 10 years. Use of colorectal cancer testing is defined by current USPSTF recommendations for colorectal cancer screening. For more information, see https://www.uspreventiveservicestaskforce.org/uspstf/recommendation/colorectal-cancer-screening#tab. See Appendix II, Colorectal tests or procedures.
NOTES: SE is standard error. Data are for the civilian noninstitutionalized population. Data on cancer screening are collected intermittently, not annually. See Appendix II, Hispanic origin; Race.
SOURCE: NCHS, National Health Interview Survey. See Appendix I, National Health Interview Survey (NHIS).
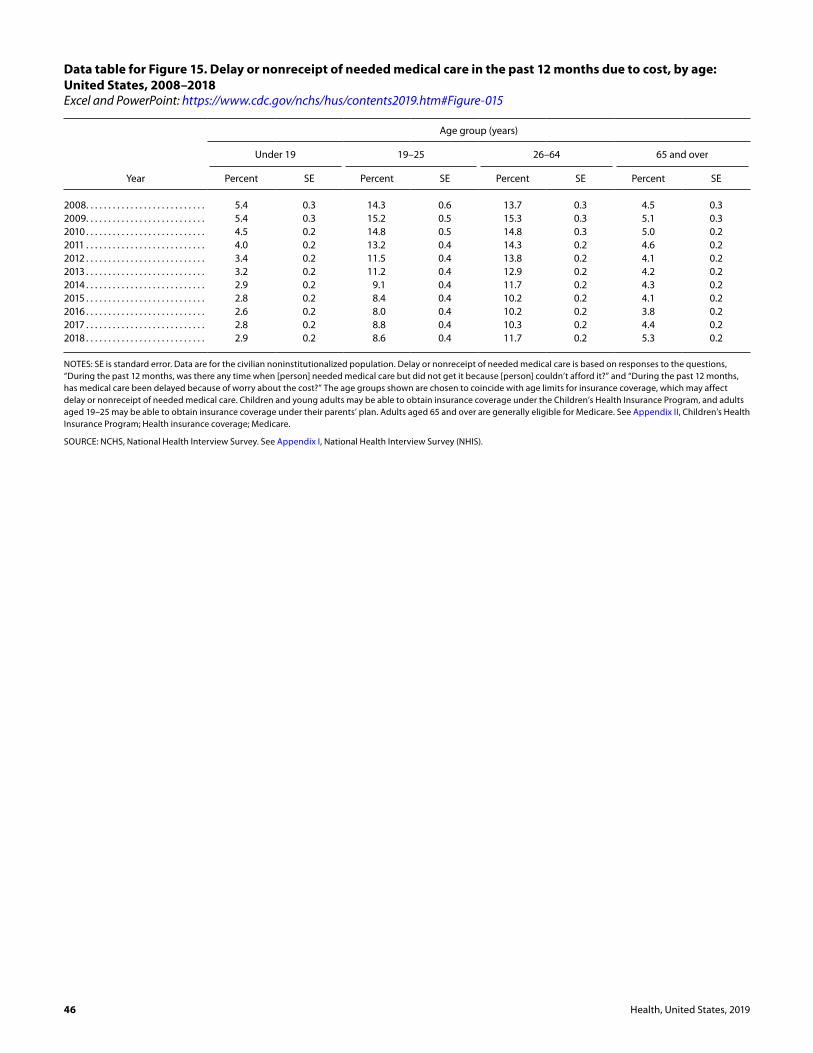
46 Health, United States, 2019
Data table for Figure 15. Delay or nonreceipt of needed medical care in the past 12 months due to cost, by age: United States, 2008–2018Excel and PowerPoint: https://www.cdc.gov/nchs/hus/contents2019.htm#Figure-015
Year
Age group (years)
Under 19 19–25 26–64 65 and over
Percent SE Percent SE Percent SE Percent SE
2008 . . . . . . . . . . . . . . . . . . . . . . . . . . . 5.4 0.3 14.3 0.6 13.7 0.3 4.5 0.32009 . . . . . . . . . . . . . . . . . . . . . . . . . . . 5.4 0.3 15.2 0.5 15.3 0.3 5.1 0.32010 . . . . . . . . . . . . . . . . . . . . . . . . . . . 4.5 0.2 14.8 0.5 14.8 0.3 5.0 0.22011 . . . . . . . . . . . . . . . . . . . . . . . . . . . 4.0 0.2 13.2 0.4 14.3 0.2 4.6 0.22012 . . . . . . . . . . . . . . . . . . . . . . . . . . . 3.4 0.2 11.5 0.4 13.8 0.2 4.1 0.22013 . . . . . . . . . . . . . . . . . . . . . . . . . . . 3.2 0.2 11.2 0.4 12.9 0.2 4.2 0.22014 . . . . . . . . . . . . . . . . . . . . . . . . . . . 2.9 0.2 9.1 0.4 11.7 0.2 4.3 0.22015 . . . . . . . . . . . . . . . . . . . . . . . . . . . 2.8 0.2 8.4 0.4 10.2 0.2 4.1 0.22016 . . . . . . . . . . . . . . . . . . . . . . . . . . . 2.6 0.2 8.0 0.4 10.2 0.2 3.8 0.22017 . . . . . . . . . . . . . . . . . . . . . . . . . . . 2.8 0.2 8.8 0.4 10.3 0.2 4.4 0.22018 . . . . . . . . . . . . . . . . . . . . . . . . . . . 2.9 0.2 8.6 0.4 11.7 0.2 5.3 0.2
NOTES: SE is standard error. Data are for the civilian noninstitutionalized population. Delay or nonreceipt of needed medical care is based on responses to the questions, “During the past 12 months, was there any time when [person] needed medical care but did not get it because [person] couldn’t afford it?” and “During the past 12 months, has medical care been delayed because of worry about the cost?” The age groups shown are chosen to coincide with age limits for insurance coverage, which may affect delay or nonreceipt of needed medical care. Children and young adults may be able to obtain insurance coverage under the Children’s Health Insurance Program, and adults aged 19–25 may be able to obtain insurance coverage under their parents’ plan. Adults aged 65 and over are generally eligible for Medicare. See Appendix II, Children’s Health Insurance Program; Health insurance coverage; Medicare.
SOURCE: NCHS, National Health Interview Survey. See Appendix I, National Health Interview Survey (NHIS).

Health, United States, 2019 47
Data table for Figure 16. Number of physicians in patient care per 100,000 resident population, by state: United States, 2018Excel and PowerPoint: https://www.cdc.gov/nchs/hus/contents2019.htm#Figure-016
AreaNumber per 100,000 resident population
United States . . . . . . . . . . . . . . . . . . . . . . . . . . . . . . . 278.49Alabama. . . . . . . . . . . . . . . . . . . . . . . . . . . . . . . . . . 223.32Alaska . . . . . . . . . . . . . . . . . . . . . . . . . . . . . . . . . . . . 259.16Arizona . . . . . . . . . . . . . . . . . . . . . . . . . . . . . . . . . . . 245.76Arkansas . . . . . . . . . . . . . . . . . . . . . . . . . . . . . . . . . 212.61California . . . . . . . . . . . . . . . . . . . . . . . . . . . . . . . . . 273.41Colorado . . . . . . . . . . . . . . . . . . . . . . . . . . . . . . . . . 288.57Connecticut . . . . . . . . . . . . . . . . . . . . . . . . . . . . . . 360.73Delaware . . . . . . . . . . . . . . . . . . . . . . . . . . . . . . . . . 257.70District of Columbia . . . . . . . . . . . . . . . . . . . . . . 672.22Florida . . . . . . . . . . . . . . . . . . . . . . . . . . . . . . . . . . . 264.63
Georgia . . . . . . . . . . . . . . . . . . . . . . . . . . . . . . . . . . 226.70Hawaii . . . . . . . . . . . . . . . . . . . . . . . . . . . . . . . . . . . . 300.92Idaho . . . . . . . . . . . . . . . . . . . . . . . . . . . . . . . . . . . . . 188.43Illinois . . . . . . . . . . . . . . . . . . . . . . . . . . . . . . . . . . . . 287.09Indiana . . . . . . . . . . . . . . . . . . . . . . . . . . . . . . . . . . . 227.39Iowa . . . . . . . . . . . . . . . . . . . . . . . . . . . . . . . . . . . . . . 215.30Kansas. . . . . . . . . . . . . . . . . . . . . . . . . . . . . . . . . . . . 252.75Kentucky . . . . . . . . . . . . . . . . . . . . . . . . . . . . . . . . . 241.20Louisiana . . . . . . . . . . . . . . . . . . . . . . . . . . . . . . . . . 276.63Maine . . . . . . . . . . . . . . . . . . . . . . . . . . . . . . . . . . . . 325.49
Maryland . . . . . . . . . . . . . . . . . . . . . . . . . . . . . . . . . 363.63Massachusetts . . . . . . . . . . . . . . . . . . . . . . . . . . . . 435.38Michigan . . . . . . . . . . . . . . . . . . . . . . . . . . . . . . . . . 303.71Minnesota . . . . . . . . . . . . . . . . . . . . . . . . . . . . . . . . 307.13Mississippi . . . . . . . . . . . . . . . . . . . . . . . . . . . . . . . . 194.14Missouri . . . . . . . . . . . . . . . . . . . . . . . . . . . . . . . . . . 276.54Montana . . . . . . . . . . . . . . . . . . . . . . . . . . . . . . . . . 243.31Nebraska . . . . . . . . . . . . . . . . . . . . . . . . . . . . . . . . . 255.83Nevada . . . . . . . . . . . . . . . . . . . . . . . . . . . . . . . . . . . 203.99New Hampshire . . . . . . . . . . . . . . . . . . . . . . . . . . 313.64
AreaNumber per 100,000 resident population
New Jersey . . . . . . . . . . . . . . . . . . . . . . . . . . . . . . . 317.42New Mexico . . . . . . . . . . . . . . . . . . . . . . . . . . . . . . 239.67New York . . . . . . . . . . . . . . . . . . . . . . . . . . . . . . . . . 369.76North Carolina . . . . . . . . . . . . . . . . . . . . . . . . . . . . 257.87North Dakota . . . . . . . . . . . . . . . . . . . . . . . . . . . . . 240.53Ohio. . . . . . . . . . . . . . . . . . . . . . . . . . . . . . . . . . . . . . 297.29Oklahoma . . . . . . . . . . . . . . . . . . . . . . . . . . . . . . . . 209.56Oregon . . . . . . . . . . . . . . . . . . . . . . . . . . . . . . . . . . . 296.04Pennsylvania . . . . . . . . . . . . . . . . . . . . . . . . . . . . . 328.25Rhode Island . . . . . . . . . . . . . . . . . . . . . . . . . . . . . 407.47
South Carolina . . . . . . . . . . . . . . . . . . . . . . . . . . . . 234.15South Dakota . . . . . . . . . . . . . . . . . . . . . . . . . . . . . 241.50Tennessee . . . . . . . . . . . . . . . . . . . . . . . . . . . . . . . . 263.69Texas . . . . . . . . . . . . . . . . . . . . . . . . . . . . . . . . . . . . . 228.35Utah . . . . . . . . . . . . . . . . . . . . . . . . . . . . . . . . . . . . . . 226.04Vermont . . . . . . . . . . . . . . . . . . . . . . . . . . . . . . . . . . 382.43Virginia . . . . . . . . . . . . . . . . . . . . . . . . . . . . . . . . . . . 268.53Washington . . . . . . . . . . . . . . . . . . . . . . . . . . . . . . 270.70West Virginia . . . . . . . . . . . . . . . . . . . . . . . . . . . . . 261.02Wisconsin . . . . . . . . . . . . . . . . . . . . . . . . . . . . . . . . 266.39Wyoming . . . . . . . . . . . . . . . . . . . . . . . . . . . . . . . . . 196.37
NOTES: Data on the number of physicians in patient care per 100,000 resident population are calculated using 2010-based postcensal estimates. Data include professionally active doctors of medicine (M.D.s) and doctors of osteopathy (D.O.s) only. Data exclude physicians in medical teaching, administration, research, and other nonpatient care activities but include physicians in residency. Map data are displayed by a modified Jenks classification for the 50 states and District of Columbia, which creates categories that minimize within-group variation and maximize between-group variation. See Technical Notes for more information on Jenks classification.
SOURCE: American Medical Association (AMA). Physician Masterfile. (Copyright 2020 American Medical Association. Reprinted with permission. All rights reserved.)

48 Health, United States, 2019
AreaNumber per 100,000 resident population
United States . . . . . . . . . . . . . . . . . . . . . . . . . . . . . . . 61.06Alabama. . . . . . . . . . . . . . . . . . . . . . . . . . . . . . . . . . 40.97Alaska . . . . . . . . . . . . . . . . . . . . . . . . . . . . . . . . . . . . 80.51Arizona . . . . . . . . . . . . . . . . . . . . . . . . . . . . . . . . . . . 55.12Arkansas . . . . . . . . . . . . . . . . . . . . . . . . . . . . . . . . . 41.82California . . . . . . . . . . . . . . . . . . . . . . . . . . . . . . . . . 77.88Colorado . . . . . . . . . . . . . . . . . . . . . . . . . . . . . . . . . 68.77Connecticut . . . . . . . . . . . . . . . . . . . . . . . . . . . . . . 72.64Delaware . . . . . . . . . . . . . . . . . . . . . . . . . . . . . . . . . 43.95District of Columbia . . . . . . . . . . . . . . . . . . . . . . 104.00Florida . . . . . . . . . . . . . . . . . . . . . . . . . . . . . . . . . . . 51.88
Georgia . . . . . . . . . . . . . . . . . . . . . . . . . . . . . . . . . . 46.83Hawaii . . . . . . . . . . . . . . . . . . . . . . . . . . . . . . . . . . . . 78.33Idaho . . . . . . . . . . . . . . . . . . . . . . . . . . . . . . . . . . . . . 54.22Illinois . . . . . . . . . . . . . . . . . . . . . . . . . . . . . . . . . . . . 67.58Indiana . . . . . . . . . . . . . . . . . . . . . . . . . . . . . . . . . . . 47.95Iowa . . . . . . . . . . . . . . . . . . . . . . . . . . . . . . . . . . . . . . 54.01Kansas. . . . . . . . . . . . . . . . . . . . . . . . . . . . . . . . . . . . 50.66Kentucky . . . . . . . . . . . . . . . . . . . . . . . . . . . . . . . . . 57.03Louisiana . . . . . . . . . . . . . . . . . . . . . . . . . . . . . . . . . 48.72Maine . . . . . . . . . . . . . . . . . . . . . . . . . . . . . . . . . . . . 54.83
Maryland . . . . . . . . . . . . . . . . . . . . . . . . . . . . . . . . . 70.56Massachusetts . . . . . . . . . . . . . . . . . . . . . . . . . . . . 83.38Michigan . . . . . . . . . . . . . . . . . . . . . . . . . . . . . . . . . 58.91Minnesota . . . . . . . . . . . . . . . . . . . . . . . . . . . . . . . . 58.78Mississippi . . . . . . . . . . . . . . . . . . . . . . . . . . . . . . . . 42.91Missouri . . . . . . . . . . . . . . . . . . . . . . . . . . . . . . . . . . 50.53Montana . . . . . . . . . . . . . . . . . . . . . . . . . . . . . . . . . 60.26Nebraska . . . . . . . . . . . . . . . . . . . . . . . . . . . . . . . . . 64.31Nevada . . . . . . . . . . . . . . . . . . . . . . . . . . . . . . . . . . . 55.26New Hampshire . . . . . . . . . . . . . . . . . . . . . . . . . . 63.47
Data table for Figure 17. Number of dentists per 100,000 resident population, by state: United States, 2019Excel and PowerPoint: https://www.cdc.gov/nchs/hus/contents2019.htm#Figure-017
AreaNumber per 100,000 resident population
New Jersey . . . . . . . . . . . . . . . . . . . . . . . . . . . . . . . 79.47New Mexico . . . . . . . . . . . . . . . . . . . . . . . . . . . . . . 51.51New York . . . . . . . . . . . . . . . . . . . . . . . . . . . . . . . . . 75.32North Carolina . . . . . . . . . . . . . . . . . . . . . . . . . . . . 52.55North Dakota . . . . . . . . . . . . . . . . . . . . . . . . . . . . . 55.11Ohio. . . . . . . . . . . . . . . . . . . . . . . . . . . . . . . . . . . . . . 53.20Oklahoma . . . . . . . . . . . . . . . . . . . . . . . . . . . . . . . . 49.56Oregon . . . . . . . . . . . . . . . . . . . . . . . . . . . . . . . . . . . 67.22Pennsylvania . . . . . . . . . . . . . . . . . . . . . . . . . . . . . 59.44Rhode Island . . . . . . . . . . . . . . . . . . . . . . . . . . . . . 53.81
South Carolina . . . . . . . . . . . . . . . . . . . . . . . . . . . . 47.16South Dakota . . . . . . . . . . . . . . . . . . . . . . . . . . . . . 50.75Tennessee . . . . . . . . . . . . . . . . . . . . . . . . . . . . . . . . 47.43Texas . . . . . . . . . . . . . . . . . . . . . . . . . . . . . . . . . . . . . 53.81Utah . . . . . . . . . . . . . . . . . . . . . . . . . . . . . . . . . . . . . . 60.95Vermont . . . . . . . . . . . . . . . . . . . . . . . . . . . . . . . . . . 59.94Virginia . . . . . . . . . . . . . . . . . . . . . . . . . . . . . . . . . . . 63.19Washington . . . . . . . . . . . . . . . . . . . . . . . . . . . . . . 70.41West Virginia . . . . . . . . . . . . . . . . . . . . . . . . . . . . . 47.88Wisconsin . . . . . . . . . . . . . . . . . . . . . . . . . . . . . . . . 58.07Wyoming . . . . . . . . . . . . . . . . . . . . . . . . . . . . . . . . . 55.12
NOTES: Data on the number of dentists per 100,000 resident population are calculated using 2010-based postcensal estimates. Data include professionally active dentists who are listed in the American Dental Association Masterfile as licensed, not retired, living in the 50 states or District of Columbia (D.C.), and having a primary occupation of private practice (full- or part-time), dental school/faculty staff member, armed forces, other federal services (i.e., Veterans Affairs or Public Health Service), state or local government employee, hospital staff dentist, graduate student/intern/resident, or other health or dental organization staff member. Map data are displayed by a modified Jenks classification for the 50 states and D.C., which creates categories that minimize within-group variation and maximize between-group variation. See Technical Notes for more information on Jenks classification.
SOURCE: American Dental Association, Health Policy Institute. Supply of Dentists in the U.S.: 2001–2019. (Copyright 2020 American Dental Association. Reprinted with permission. All rights reserved.)

Health, United States, 2019 49
Data table for Figure 18. Personal health care expenditures, by source of funds and type of expenditure: United States, 2008–2018Excel and PowerPoint: https://www.cdc.gov/nchs/hus/contents2019.htm#Figure-018
Personal health care expenditures, by source of funds: 2008–2018
Year
Personal health care
expenditures
Source of funds
Private health insurance Medicare
Medicaid (total)
Medicaid (federal)
Medicaid (state and local)
Out of pocket
All other sources1
Dollars (billions)
2008 . . . . . . . . . . . . . . . . . . . . . . . . 2,008.8 698.5 442.0 317.9 188.3 129.6 295.6 254.82009 . . . . . . . . . . . . . . . . . . . . . . . . 2,111.4 730.8 470.3 346.4 230.7 115.6 294.2 269.72010 . . . . . . . . . . . . . . . . . . . . . . . . 2,191.4 750.8 489.1 365.8 247.3 118.5 300.2 285.62011 . . . . . . . . . . . . . . . . . . . . . . . . 2,267.3 780.0 512.0 373.7 228.2 145.5 310.4 291.12012 . . . . . . . . . . . . . . . . . . . . . . . . 2,361.1 809.8 533.8 388.4 223.9 164.6 319.2 309.92013 . . . . . . . . . . . . . . . . . . . . . . . . 2,431.2 824.2 553.6 405.9 234.4 171.5 326.9 320.62014 . . . . . . . . . . . . . . . . . . . . . . . . 2,556.0 869.5 580.5 446.6 274.1 172.5 331.8 327.72015 . . . . . . . . . . . . . . . . . . . . . . . . 2,710.2 936.5 607.1 484.1 304.5 179.7 341.7 340.82016 . . . . . . . . . . . . . . . . . . . . . . . . 2,838.3 989.7 629.9 504.0 318.3 185.7 357.2 357.52017 . . . . . . . . . . . . . . . . . . . . . . . . 2,954.5 1,032.4 659.4 519.6 322.9 196.8 365.2 377.82018 . . . . . . . . . . . . . . . . . . . . . . . . 3,075.5 1,078.7 697.2 532.8 330.8 202.0 375.6 391.1
Average annual percent change
2008–2018 . . . . . . . . . . . . . . . . . 4.4 4.4 4.7 5.3 5.8 4.5 2.4 4.4
Personal health care expenditures, by type of expenditure: 2008 and 2018
Type of expenditure 2008 2018
Percent distribution
All expenditure types . . . . . . . . . . . . . . . . . . . . . 100.0 100.0Hospital . . . . . . . . . . . . . . . . . . . . . . . . . . . . . . . . . . . 36.1 38.8Physician and clinical . . . . . . . . . . . . . . . . . . . . . . 24.0 23.6Prescription drugs . . . . . . . . . . . . . . . . . . . . . . . . . 11.9 10.9Dental . . . . . . . . . . . . . . . . . . . . . . . . . . . . . . . . . . . . . 5.1 4.4Nursing care facilities and continuing care
retirement communities . . . . . . . . . . . . . . . . . . 6.5 5.5Home health care . . . . . . . . . . . . . . . . . . . . . . . . . . 3.1 3.3All other expenditure types2 . . . . . . . . . . . . . . . 13.2 13.6
1Includes Children’s Health Insurance Program (CHIP), including Medicaid CHIP expansions; other health insurance programs, including Department of Defense and Department of Veterans Affairs; and other third-party payers and programs, including worksite health care, other private revenues, Indian Health Service, Substance Abuse and Mental Health Services Administration, workers’ compensation, general assistance, maternal and child health, vocational rehabilitation, other federal programs, other state and local programs, and school health programs. 2Includes other professional services; other health, residential, and personal care; durable medical equipment; and other nondurable medical products.
NOTES: Personal health care expenditures are outlays for goods and services relating directly to patient care. Expenditures are in current dollars and not adjusted for inflation. Numbers may not sum to total due to rounding. See Appendix II, Health expenditures, national.
SOURCE: Centers for Medicare & Medicaid Services, National Health Expenditure Accounts. See Appendix I, National Health Expenditure Accounts (NHEA).

50 Health, United States, 2019
Data table for Figure 19. Health insurance coverage, by age and type of coverage: United States, 2008–2018 Excel and PowerPoint: https://www.cdc.gov/nchs/hus/contents2019.htm#Figure-019
Health insurance coverage among children under age 18 years, by type of coverage: 2008–2018
Year
Private1 Medicaid2 Uninsured3
Percent SE Percent SE Percent SE
2008 . . . . . . . . . . . . . . . . . . . . . . . . . . . . . . 58.4 0.7 30.1 0.7 9.0 0.42009 . . . . . . . . . . . . . . . . . . . . . . . . . . . . . . 55.8 0.8 33.1 0.7 8.2 0.42010 . . . . . . . . . . . . . . . . . . . . . . . . . . . . . . 54.1 0.7 35.2 0.6 7.8 0.32011 . . . . . . . . . . . . . . . . . . . . . . . . . . . . . . 53.7 0.7 37.0 0.7 7.0 0.32012 . . . . . . . . . . . . . . . . . . . . . . . . . . . . . . 53.4 0.6 37.6 0.6 6.6 0.32013 . . . . . . . . . . . . . . . . . . . . . . . . . . . . . . 53.2 0.7 37.7 0.6 6.6 0.32014 . . . . . . . . . . . . . . . . . . . . . . . . . . . . . . 53.7 0.6 38.1 0.6 5.4 0.22015 . . . . . . . . . . . . . . . . . . . . . . . . . . . . . . 54.6 0.7 38.7 0.7 4.5 0.22016 . . . . . . . . . . . . . . . . . . . . . . . . . . . . . . 54.3 0.7 37.8 0.7 5.2 0.32017 . . . . . . . . . . . . . . . . . . . . . . . . . . . . . . 55.2 0.7 36.7 0.7 5.0 0.32018 . . . . . . . . . . . . . . . . . . . . . . . . . . . . . . 54.9 0.8 36.6 0.8 5.2 0.3
Health insurance coverage among adults aged 18–64, by type of coverage: 2008–2018
Year
Private1 Medicaid2 Uninsured3
Percent SE Percent SE Percent SE
2008 . . . . . . . . . . . . . . . . . . . . . . . . . . . . . . 68.5 0.4 7.8 0.2 19.9 0.32009 . . . . . . . . . . . . . . . . . . . . . . . . . . . . . . 66.2 0.4 8.6 0.2 21.2 0.32010 . . . . . . . . . . . . . . . . . . . . . . . . . . . . . . 64.7 0.4 9.0 0.2 22.3 0.32011 . . . . . . . . . . . . . . . . . . . . . . . . . . . . . . 65.0 0.4 9.5 0.2 21.2 0.32012 . . . . . . . . . . . . . . . . . . . . . . . . . . . . . . 65.1 0.4 9.8 0.2 20.9 0.32013 . . . . . . . . . . . . . . . . . . . . . . . . . . . . . . 65.1 0.4 10.0 0.2 20.5 0.32014 . . . . . . . . . . . . . . . . . . . . . . . . . . . . . . 67.4 0.4 11.8 0.2 16.3 0.32015 . . . . . . . . . . . . . . . . . . . . . . . . . . . . . . 69.7 0.4 12.9 0.3 13.0 0.22016 . . . . . . . . . . . . . . . . . . . . . . . . . . . . . . 69.9 0.4 13.6 0.3 12.2 0.32017 . . . . . . . . . . . . . . . . . . . . . . . . . . . . . . 69.6 0.4 13.2 0.3 12.8 0.32018 . . . . . . . . . . . . . . . . . . . . . . . . . . . . . . 69.2 0.4 13.0 0.3 13.2 0.3
1Includes plans obtained through an employer, purchased directly, or purchased through the Health Insurance Marketplace or a state-based exchange. Private coverage also includes managed care, such as health maintenance organizations (HMOs). The category excludes plans that paid for only one type of specialized service, such as accidents or dental care. 2Includes persons who had Medicaid or other state-sponsored health plans, including the Children’s Health Insurance Program (CHIP).3Persons not covered by private insurance, Medicaid, CHIP, state-sponsored or other government-sponsored health plans, Medicare, or military plans are considered to have no health insurance coverage. Persons with only Indian Health Service coverage or plans that cover only one type of service such as dental care or long-term care are also considered to have no health insurance coverage.
NOTES: SE is standard error. Data are for the civilian noninstitutionalized population. Health insurance coverage is at the time of interview. Health insurance categories are mutually exclusive. A small percentage of children and adults (less than 5%) are covered by Medicare or other public plans, military plans, or other plans; estimates for this group are not shown. See Appendix II, Health insurance coverage; Medicaid; Uninsured.
SOURCE: NCHS, National Health Interview Survey. See Appendix I, National Health Interview Survey (NHIS).

Health, United States, 2019 51
Data table for Figure 20. Supplemental insurance coverage among adults aged 65 and over with Medicare coverage, by type of supplemental coverage: United States, 2010–2018Excel and PowerPoint: https://www.cdc.gov/nchs/hus/contents2019.htm#Figure-020
Year
Type of supplemental coverage
No supplemental coverageMedicaid
Medigap, employer or union sponsored
Medicare Advantage Military
Percent SE Percent SE Percent SE Percent SE Percent SE
2010 . . . . . . . . . . . . . . . . . 7.1 0.3 48.1 0.8 19.6 0.6 5.4 0.3 19.6 0.62011 . . . . . . . . . . . . . . . . . 7.1 0.3 46.8 0.7 21.1 0.5 5.8 0.3 19.0 0.52012 . . . . . . . . . . . . . . . . . 6.7 0.3 44.3 0.7 22.6 0.6 6.3 0.3 19.9 0.62013 . . . . . . . . . . . . . . . . . 7.6 0.3 42.9 0.7 23.4 0.6 5.8 0.3 20.1 0.62014 . . . . . . . . . . . . . . . . . 7.1 0.3 42.0 0.7 24.9 0.6 6.6 0.3 19.2 0.52015 . . . . . . . . . . . . . . . . . 7.6 0.3 40.1 0.8 25.8 0.6 6.7 0.4 19.6 0.62016 . . . . . . . . . . . . . . . . . 7.1 0.3 40.6 0.7 26.5 0.6 6.8 0.3 18.7 0.52017 . . . . . . . . . . . . . . . . . 7.7 0.4 39.1 0.7 28.2 0.6 6.1 0.3 18.8 0.52018 . . . . . . . . . . . . . . . . . 7.3 0.3 39.9 0.7 26.5 0.6 8.7 0.4 17.3 0.5
NOTES: SE is standard error. Data are for the civilian noninstitutionalized population. Supplemental coverage is determined by NCHS insurance experts using plan information from respondents. Categories are mutually exclusive and hierarchical. Responses were first categorized as: Medigap, employer or union sponsored; Medicaid; military; or Medicare only. Those in either the Medigap, employer or union sponsored, or Medicare only categories were further classified as Medigap, employer or union sponsored; Medicare Advantage; or no supplemental coverage. No supplemental coverage means the beneficiaries had traditional fee-for-service Medicare only. Military includes Tricare, CHAMPUS, and Veterans Health Administration (VHA). In 2018, the percentage of military coverage increased due in part to improved collection of information on VHA health care. A small percentage of Medicare beneficiaries (less than 1%) had traditional Medicare and a state or local plan; this group is not shown. Adults aged 65 and over who did not have Medicare coverage (6%–7%) are excluded.
SOURCE: NCHS, National Health Interview Survey. See Appendix I, National Health Interview Survey (NHIS).

52 Health, United States, 2019
Technical Notes
Data Sources Data in the Health, United States, 2019 Chartbook come
from many surveys and data systems and cover a broad range of years. Most figures show trends over 10 years, ending with the most recent data available. When 10 years of data are not available, the figures cover a period as close as possible to 10 years given the constraints of the data source. Some figures show estimates for the most recent data year by demographic variables of interest. Detailed descriptions of the data sources included in the Chartbook are provided in Appendix I, Data Sources. Additional information on the data is included in the data table notes and in Appendix II, Definitions and Methods.
Data PresentationMost figures in the Chartbook show trends over time,
while some focus on differences in estimates among population subgroups for the most recent period available.
Many measures in the Chartbook are shown for people in specific age groups because of the strong effect of age on most health outcomes. In some cases, age-adjusted measures are computed to eliminate differences in observed estimates that result from differences in the age structure of the population over time or across groups (see Appendix II, Age adjustment). For example, death rates are often age adjusted to remove the effects of changing age distributions over time or across groups (40). Age-adjusted rates and age-adjusted percentages are noted in the text; rates and percentages without this notation are crude rates and percentages.
For some charts, data from multiple years are combined to increase the sample size and the statistical reliability of the pooled point estimates.
Two charts show geographic differences in health resources by state. Data in the state maps are categorized using a modification of the Jenks natural breaks classification method. The Jenks method clusters data into groups that minimize the within-group variance and maximize the between-group variance (72). The modification rounds the data cut points to assist map reading by a general audience.
Trends are generally shown on a linear scale to emphasize absolute differences over time. However, when the range of rates is broad, trends may be shown on the logarithmic (log) scale so that all rates can be shown on the same chart. For example, the Selected Causes of Death chart presents rates on the log scale.
Point estimates and standard errors for Chartbook figures are available in the Chartbook data tables that
follow the figures. Chartbook data tables may include additional data that are not found in the figures.
Racial and Ethnic DataIn 1997, the Office of Management and Budget (OMB)
issued “Revisions to the Standards for the Classification of Federal Data on Race and Ethnicity.” Starting with data year 1999, most National Center for Health Statistics (NCHS) survey estimates by race are presented based on the 1997 standards. Vital statistics systems, however, transitioned to the 1997 standards over time as states adopted the 2003 revision of the U.S. Standard Certificates of Live Birth and Death, which contained the 1997 standards. The 2003 revisions were not adopted by all states until 2016 for births and 2018 for deaths. Prior to full adoption of the 2003 standard certificates, most race data for vital statistics used the 1977 standards. During this transition, it was necessary to make vital records data by race comparable across states. This was done by bridging the race information collected under the 1997 standards to be consistent with data collected under the 1977 standards (1). For more information, see Appendix I, Population Census and Population Estimates, Bridged-race Population Estimates, and Appendix II, Race.
The 1997 standards offer respondents an opportunity to select more than one race group, leading to five single-race categories and many possible multiple-race categories. According to U.S. Census Bureau data, a small percentage of people reported two or more races (2.8% in 2019) (73). There are two basic ways of defining a race group when respondents have the option of reporting multiple races. A group such as black may be defined as those who reported black and no other race (the “race alone” or “single-race” concept) or those who reported black regardless of whether they also reported another race (the “race alone or in combination” concept). In this report, data are shown using the first approach (single race). Use of the single-race population does not imply that it is the preferred method of presenting or analyzing data.
Recent vital statistics data in this report are generally shown for the following six race and Hispanic-origin groups under the 1997 OMB standards: non-Hispanic American Indian or Alaska Native; non-Hispanic Asian; non-Hispanic black or African American; non-Hispanic Native Hawaiian or Other Pacific Islander; non-Hispanic white; and Hispanic or Latino. Life expectancy and survey estimates by race and Hispanic origin are generally shown for fewer race and Hispanic-origin groups due to sample size and reliability issues. Data on race and Hispanic origin are collected separately. Persons of Hispanic origin may be of any race. Estimates for race groups using the 1997 standard are not

Health, United States, 2019 53
completely comparable with data based on the earlier 1977 standards. To allow for analysis of longer trends, selected charts using vital statistics data may include the combined non-Hispanic Asian or Pacific Islander group.
Statistical Reliability of EstimatesEstimates for the total population generally have
relatively small sampling errors and high precision, but estimates for certain population subgroups may be based on small numbers of respondents or events and have relatively large sampling errors or low precision (74). Numbers of deaths obtained from the National Vital Statistics System (NVSS) used in the Chartbook represent complete counts and are not subject to sampling error. They are, however, subject to random variation, and standard errors were calculated to account for this variation in statistical testing. When the number of events and the probability of such an event are small, estimates may be unreliable.
Estimates that are unreliable because of large sampling errors, low precision, small denominators, or small numbers of events are noted with an asterisk (*). The criteria used to designate or suppress statistically unreliable estimates are indicated in the notes of the applicable tables or charts.
For NCHS surveys, point estimates and their corresponding sampling variances were calculated using the SUDAAN software package, which takes into consideration the complex survey design (75). Standard errors for other surveys or data sets were computed using the methodology recommended by the programs providing the data or were provided directly by those programs. In Health, United States, 2019, the reliability of survey percentage estimates was assessed based on a minimum denominator sample size and the absolute and relative width of the Clopper–Pearson confidence interval (adapted for complex surveys by Korn and Graubard), which determines if the estimate is unreliable and should be suppressed (74).
In the online-only supplementary Trend Tables, this approach has been applied specifically to estimates from the National Health and Nutrition Examination Survey (NHANES) beginning with the 2013–2014 cycle, and to estimates from the National Health Interview Survey (NHIS) beginning with 2016. The reliability of estimates for prior years was evaluated based on relative standard errors. For more information on each approach, see Appendix II, Data presentation standards for proportions; Relative standard error (RSE).
Statistical TestingStatistical trends can be analyzed in many ways. The
approaches used in this Chartbook to analyze trends in health measures over time depend primarily on the data source (i.e., NCHS surveys, vital statistics, and other data sources) but also consider the type of dependent variable
and the number of data points (2). With a sufficient number of data points, statistical analyses can detect not only whether an increase or decrease has occurred but also a change in trend. Some trends are analyzed using the weighted least squares regression method in the National Cancer Institute's Joinpoint software version 4.6.0.0, which identifies the number and location of joinpoints (i.e., inflection points) when changes in trend have occurred (76). For more information on Joinpoint, see: https://surveillance. cancer.gov/joinpoint.
Trends in NCHS survey data, including NHANES and NHIS (Figures 9, 10, 12–15, 19, and 20), are based on record-level data and generally follow the steps laid out in the NCHS trends analysis guidelines (2). The presence of a nonlinear trend is first assessed using polynomial regression (SUDAAN PROC REGRESS). Linear, quadratic, and cubic trends are tested in separate regression models covering the entire period shown in the figure. Quadratic trends are tested with both linear and quadratic terms in the model, and cubic trends are tested with linear, quadratic, and cubic terms in the model.
If a quadratic or cubic trend is statistically significant and the analysis included at least 11 time points, Joinpoint software is used to search for up to two inflection points with as few as two observed time points allowed in the beginning, middle, and ending line segments (not counting the inflection points). Although this exceeds the software default of one inflection point for analyses using 11 time points, the NCHS trends analysis guidelines state this is not a problem for the analysis of record-level survey data because appropriate survey analysis software is used as a follow-up to the Joinpoint software analysis (2, p. 18). If a quadratic trend is statistically significant and the analysis included at least seven time points, Joinpoint is used to search for one inflection point in the trend. In each case, an overall p value of 0.05 and the grid search method are used. If neither a cubic nor quadratic trend is statistically significant—that is, there is no inflection point—then Joinpoint is not used for further analysis. If a quadratic trend is statistically significant and the analysis included three to six time points, pairwise differences between percentages are tested using two-sided significance tests (z tests) to obtain additional information regarding changes in the trend.
In all Joinpoint analyses of survey data, the Bayesian information criterion (BIC) model is used because it increases the sensitivity to detect potential inflection points. Because Joinpoint is not able to fully account for the complex survey design, inflection points are verified in SUDAAN, which properly accounts for survey design. The difference in slopes between the two segments on either side of an inflection point is assessed using piecewise linear regression (SUDAAN PROC REGRESS). To conduct piecewise linear regression of age-adjusted estimates, survey weights are adjusted for age (77).
Trend analyses of birth data, infant mortality, and death rates using vital statistics data from NVSS (Figures 1–8) also follow the NCHS trends analysis guidelines (2)

54 Health, United States, 2019
and use aggregated point estimates and their standard errors rather than record-level data. Increases or decreases in the estimates during the entire time period shown are assessed using Joinpoint with an overall p value of 0.05 and the grid search method. In analyses with fewer than 10 time points, BIC is used to select the model. In analyses with 10 or more time points, the permutation test is used to select the model. The maximum number of joinpoints searched is limited to 1, the software default when 11 time points occur in any analysis. The NCHS trends analysis guidelines recommend against specifying a maximum number of joinpoints to search that exceeds the default for vital statistics, because this increases the likelihood of estimation issues (2, p. 18). As few as two observed time points are allowed in beginning and ending line segments (not counting the inflection points). Trend analyses using Joinpoint are carried out on the log scale for birth, infant mortality, and death rates so that results provide estimates of average annual percent change.
Note that all calculations described in this section are performed on the most accurate, actual, unrounded values available while using SAS, SUDAAN, or Joinpoint to ensure the most accurate results. Where possible, estimates and standard errors are to five or more decimal places. The final figures in the data tables have been rounded for presentation purposes. Using these rounded figures to reproduce calculations may lead to slightly different results.
For other data sources, the difference between two points is assessed for statistical significance using either z tests or the statistical testing methods recommended by the data systems. For analyses that show two time points, the differences between the two points are assessed for statistical significance at the 0.05 level using z tests without correction for multiple comparisons. For data sources with no standard errors, relative differences greater than 10% are generally discussed in the text. For life expectancy, changes of 0.1 year or greater are usually discussed.
Terms such as “similar,” “no difference,” stable,” and “no clear trend” indicate that the statistics being compared are not significantly different or that the slope of the trend line is not significantly different from zero. Unless otherwise noted in the text, differences that are described are statistically significant at the 0.05 level. However, lack of comment regarding the difference between statistics does not necessarily suggest that the difference was tested and found not significant. Chartbook data tables include point estimates and standard errors, when available, for data users who would like to perform additional statistical tests.
Statistical significance of differences or trends is partly a function of sample size (the larger the sample, the smaller the change that can be detected), and statistical significance does not always indicate public health significance (78). Moreover, a small sample size may result in statistically nonsignificant results despite the existence of potentially meaningful differences (79).

Health, United States, 2019 55
References
1. Ingram DD, Parker JD, Schenker N, Weed JA, Hamilton B, Arias E, Madans JH. United States Census 2000 population with bridged race categories. Vital Health Stat 2(135). 2003.
2. Ingram DD, Malec DJ, Makuc DM, Kruszon-Moran D, Gindi RM, Albert M, et al. National Center for Health Statistics guidelines for analysis of trends. National Center for Health Statistics. Vital Health Stat 2(179). 2018.
3. World Health Organization. Global Health Observatory (GHO) data: Life expectancy and healthy life expectancy: Life expectancy at birth (years). Available from: https://www.who.int/data/gho/data/themes/topics/indicator-groups/indicator-group-details/GHO/life-expectancy-and-healthy-life-expectancy.
4. Kochanek KD, Anderson RN, Arias E. Changes in life expectancy at birth, 2010–2018. NCHS Health E-Stat. 2020.
5. Murphy SL, Xu JQ, Kochanek KD, Arias E, Tejada-Vera B. Deaths: Final data for 2018. National Vital Statistics Reports; vol 69 no 13. Hyattsville, MD: National Center for Health Statistics. 2021. Available from: https://www.cdc.gov/nchs/products/nvsr.htm.
6. Reidpath DD, Allotey P. Infant mortality rate as an indicator of population health. J Epidemiol Community Health 57(5):344–6. 2003.
7. Ely DM, Driscoll AK. Infant mortality in the United States, 2017: Data from the period linked birth/infant death file. National Vital Statistics Reports; vol 68 no 10. Hyattsville, MD: National Center for Health Statistics. 2019.
8. Hedegaard H, Miniño AM, Warner M. Drug overdose deaths in the United States, 1999–2018. NCHS Data Brief, no 356. Hyattsville, MD: National Center for Health Statistics. 2020.
9. Wilson N, Kariisa M, Seth P, Smith H IV, Davis NL. Drug and opioid-involved overdose deaths—United States, 2017–2018. MMWR Morb Mortal Wkly Rep 69(11):290–7. 2020.
10. Hu G, Wilcox HC, Wissow L, Baker SP. Mid-life suicide: An increasing problem in U.S. whites, 1999–2005. Am J Prev Med 35(6):589–93. 2008.
11. Hedegaard H, Curtin SC, Warner M. Increase in suicide mortality in the United States, 1999–2018. NCHS Data Brief, no 362. Hyattsville, MD: National Center for Health Statistics. 2020.
12. Phillips JA, Robin AV, Nugent CN, Idler EL. Understanding recent changes in suicide rates among the middle-aged: Period or cohort effects? Public Health Rep 125(5):680–8. 2010.
13. Centers for Disease Control and Prevention. WISQARS: Leading causes of death reports, 1981–2018. Available from: https://webappa.cdc.gov/sasweb/ncipc/leadcause.html.
14. Xu JQ, Murphy SL, Kochanek KD, Arias E. Mortality in the United States, 2018. NCHS Data Brief, no 355. Hyattsville, MD: National Center for Health Statistics. 2020.
15. Maternal Mortality Estimation Inter-Agency Group, Alkema L, Zhang S, Gemmill A. Trends in maternal mortality: 1990 to 2015: Estimates by WHO, UNICEF, UNFPA, World Bank Group and the United Nations Population Division. Geneva, Switzerland: World Health Organization. 2015.
16. Rossen LM, Womack LS, Hoyert DL, Anderson RN, Uddin SFG. The impact of the pregnancy checkbox and misclassification on maternal mortality trends in the United States, 1999–2017. National Center for Health Statistics. Vital Health Stat 3(44). 2020.
17. Hoyert DL, Miniño AM. Maternal mortality in the United States: Changes in coding, publication, and data release, 2018. National Vital Statistics Reports; vol 69 no 2. Hyattsville, MD: National Center for Health Statistics. 2020.
18. Hoyert DL, Uddin SFG, Miniño AM. Evaluation of the pregnancy status checkbox on the identification of maternal deaths. National Vital Statistics Reports; vol 69 no 1. Hyattsville, MD: National Center for Health Statistics. 2020.
19. Martinez G, Copen CE, Abma JC. Teenagers in the United States: Sexual activity, contraceptive use, and childbearing, 2006–2010 National Survey of Family Growth. National Center for Health Statistics. Vital Health Stat 23(31). 2011.
20. Ventura SJ, Hamilton BE, Mathews TJ. National and state patterns of teen births in the United States, 1940–2013. National Vital Statistics Reports; vol 63 no 4. Hyattsville, MD: National Center for Health Statistics. 2014.
21. Chang HH, Larson J, Blencowe H, Spong CY, Howson CP, Cairns-Smith S, et al. Preventing preterm births: Analysis of trends and potential reductions with interventions in 39 countries with very high human development index. Lancet 381(9862):223–34. 2013.
22. Ancel PY, Goffinet F, EPIPAGE-2 Writing Group, Kuhn P, Langer B, Matis J, et al. Survival and morbidity of preterm children born at 22 through 34 weeks' gestation in France in 2011: Results of the EPIPAGE-2 cohort study. JAMA Pediatr 169(3):230–8. 2015.
23. Adams JN, Feldman HM, Huffman LC, Loe IM. Sensory processing in preterm preschoolers and its association with executive function. Early Hum Dev 91(3):227–33. 2015.
24. Brown L, Burns YR, Watter P, Gibbons KS, Gray PH. Motor performance, postural stability and behaviour of non-disabled extremely preterm or extremely low birth weight children at four to five years of age. Early Hum Dev 91(5):309–15. 2015.

56 Health, United States, 2019
25. van der Pal-de Bruin KM, van der Pal SM, Verloove-Vanhorick SP, Walther FJ. Profiling the preterm or VLBW born adolescent; implications of the Dutch POPS cohort follow-up studies. Early Hum Dev 91(2):97–102. 2015.
26. MacDorman MF, Mathews TJ. Understanding racial and ethnic disparities in U.S. infant mortality rates. NCHS Data Brief, no 74. Hyattsville, MD: National Center for Health Statistics. 2011.
27. Martin JA, Hamilton BE, Osterman MJK, Driscoll AK. Births: Final data for 2018. National Vital Statistics Reports; vol 68 no 13. Hyattsville, MD: National Center for Health Statistics. 2019.
28. U.S. Department of Health and Human Services. The health consequences of smoking—50 years of progress: A report of the Surgeon General. Rockville, MD: Office of the Surgeon General. 2014.
29. Benjamin EJ, Muntner P, Alonso A, Bittencourt MS, Callaway CW, Carson AP, et al. Heart disease and stroke statistics—2019 update: A report from the American Heart Association. Circulation 139(10):e56–e528. 2019.
30. Regan AK, Promoff G, Dube SR, Arrazola R. Electronic nicotine delivery systems: Adult use and awareness of the 'e-cigarette' in the USA. Tob Control 22(1):19–23. 2013.
31. DeVito EE, Krishnan-Sarin S. E-cigarettes: Impact of e-liquid components and device characteristics on nicotine exposure. Curr Neuropharmacol 16(4):438–59. 2018.
32. Gentzke AS, Creamer M, Cullen KA, Ambrose BK, Willis G, Jamal A, King BA. Vital signs: Tobacco product use among middle and high school students—United States, 2011–2018. MMWR Morb Mortal Wkly Rep 68(6):157–64. 2019.
33. Cullen KA, Gentzke AS, Sawdey MD, Chang JT, Anic GM, Wang TW, et al. E-cigarette use among youth in the United States, 2019. JAMA 322(21):2095–103. 2019.
34. National Heart, Lung, and Blood Institute. Expert panel report 3: Guidelines for the diagnosis and management of asthma. NIH pub no 07–4051. Bethesda, MD: National Institutes of Health. 2007.
35. National Heart, Lung, and Blood Institute. The seventh report of the Joint National Committee on Prevention, Detection, Evaluation, and Treatment of High Blood Pressure. Bethesda, MD: National Institutes of Health. 2004.
36. Whelton PK, Carey RM, Aronow WS, Casey DE Jr, Collins KJ, Dennison Himmelfarb C, et al. 2017 ACC/AHA/AAPA/ABC/ACPM/AGS/APhA/ASH/ASPC/NMA/PCNA guideline for the prevention, detection, evaluation, and management of high blood pressure in adults: A report of the American College of Cardiology/American Heart Association task force on clinical practice guidelines. Hypertension 71(6):e13–e115. 2018.
37. Patel SA, Winkel M, Ali MK, Narayan KM, Mehta NK. Cardiovascular mortality associated with 5 leading risk factors: National and state preventable fractions
estimated from survey data. Ann Intern Med 163(4):245–53. 2015.
38. Danaei G, Ding EL, Mozaffarian D, Taylor B, Rehm J, Murray CJL, Ezzati M. The preventable causes of death in the United States: Comparative risk assessment of dietary, lifestyle, and metabolic risk factors. PLoS Med 6(4):e1000058. 2009.
39. García MC, Bastian B, Rossen LM, Anderson R, Miniño A, Yoon PW, et al. Potentially preventable deaths among the five leading causes of death—United States, 2010 and 2014. MMWR Morb Mortal Wkly Rep 65(45):1245–55. 2016.
40. Hoyert DL. 75 years of mortality in the United States, 1935–2010. NCHS Data Brief, no 88. Hyattsville, MD: National Center for Health Statistics. 2012.
41. World Health Organization. International classification of functioning, disability and health (ICF). 2001. Available from: https://www.who.int/classifications/ icf/en/.
42. Pinsky PF. Principles of cancer screening. Surg Clin North Am 95(5):953–66. 2015.
43. Zauber AG. The impact of screening on colorectal cancer mortality and incidence: Has it really made a difference? Dig Dis Sci 60(3):681–91. 2015.
44. Siegel RL, Miller KD, Jemal A. Cancer statistics, 2018. CA Cancer J Clin 68(1):7–30. 2018.
45. Nelson HD, Fu R, Cantor A, Pappas M, Daeges M, Humphrey L. Effectiveness of breast cancer screening: Systematic review and meta-analysis to update the 2009 U.S. Preventive Services Task Force recommendation. Ann Intern Med 164(4):244–55. 2016.
46. Siu AL, U.S. Preventive Services Task Force. Screening for breast cancer: U.S. Preventive Services Task Force recommendation statement. Ann Intern Med 164(4):279–96. 2016.
47. U.S. Preventive Services Task Force, Bibbins-Domingo K, Grossman DC, Curry SJ, Davidson KW, Epling JW Jr, et al. Screening for colorectal cancer: US Preventive Services Task Force recommendation statement. JAMA 315(23):2564–75. 2016.
48. U.S. Preventive Services Task Force. Screening for colorectal cancer: U.S. Preventive Services Task Force recommendation statement. Ann Intern Med 149(9):627–37. 2008.
49. Chernew ME, Newhouse JP. What does the RAND health insurance experiment tell us about the impact of patient cost sharing on health outcomes? Am J Manag Care 14(7):412–4. 2008.
50. Allen EM, Call KT, Beebe TJ, McAlpine DD, Johnson PJ. Barriers to care and health care utilization among the publicly insured. Med care 55(3):207–14. 2017.
51. Kaiser Commission on Medicaid and the Uninsured. The uninsured and the difference health insurance makes. Washington, DC: Kaiser Family Foundation. 2012.
52. Social Security Act. Title XXI: State Children's Health Insurance Program. 42 USC 1397aa–1397mm. 1997.
53. Patient Protection and Affordable Care Act. Pub L No 111–148, 124 Stat 119. 2010.

Health, United States, 2019 57
54. Social Security Act. Title XVIII: Health insurance for the aged and disabled. 42 USC 1395–1395lll. 1965.
55. Health Resources and Services Administration. The physician workforce: Projections and research into current issues affecting supply and demand. Rockville, MD: U.S. Department of Health and Human Services. 2008.
56. Douthit N, Kiv S, Dwolatzky T, Biswas S. Exposing some important barriers to health care access in the rural USA. Public Health 129(6):611–20. 2015.
57. U.S. Department of Health and Human Services. Oral health in America: A report of the Surgeon General. Rockville, MD: Office of the Surgeon General. 2000.
58. Dye BA, Thornton-Evans G, Li X, Iafolla TJ. Dental caries and tooth loss in adults in the United States, 2011–2012. NCHS Data Brief, no 197. Hyattsville, MD: National Center for Health Statistics. 2015.
59. Fleming E, Afful J. Prevalence of total and untreated dental caries among youth: United States, 2015–2016. NCHS Data Brief, no 307. Hyattsville, MD: National Center for Health Statistics. 2018.
60. Health Resources and Services Administration. First quarter of fiscal year 2020 designated HPSA quarterly summary. Rockville, MD: U.S. Department of Health and Human Services. 2019.
61. American Dental Association. Supply and profile of dentists: Supply of dentists in the U.S.: 2001–2019. 2020. Available from: https://www.ada.org/en/science-research/health-policy-institute/data-center/supply-and-profile-of-dentists.
62. Hartman M, Martin AB, Benson J, Catlin A, National Health Expenditure Accounts Team. National health care spending in 2018: Growth driven by accelerations in Medicare and private insurance spending. Health Aff 39(1):8–17. 2019.
63. Larson K, Cull WL, Racine AD, Olson LM. Trends in access to health care services for US children: 2000–2014. Pediatrics 138(6):e20162176. 2016.
64. Dubay L, Kenney GM. Health care access and use among low-income children: Who fares best? Health Aff (Millwood) 20(1):112–21. 2001.
65. McWilliams JM. Health consequences of uninsurance among adults in the United States: Recent evidence and implications. Milbank Q 87(2):443–94. 2009.
66. Social Security Act. Title XIX: Medicaid. 42 USC 1396 et seq. 1965.
67. Institute of Medicine. America’s uninsured crisis: Consequences for health and health care. Washington, DC: National Academies Press. 2009.
68. Medicare Payment Advisory Commission. Report to the Congress: Medicare payment policy. Washington, DC. 2019.
69. Meyers DJ, Trivedi AN, Mor V. Limited Medigap consumer protections are associated with higher reenrollment in Medicare advantage plans. Health Aff (Millwood) 38(5):782–7. 2019.
70. Neuman P, Jacobson GA. Medicare advantage checkup. N Engl J Med 379(22):2163–72. 2018.
71. National Center for Health Statistics. 2018 National Health Interview Survey (NHIS) public use data release: Survey description. 2019. Available from: https://ftp.cdc.gov/pub/Health_Statistics/NCHS/Dataset_Documentation/NHIS/2018/srvydesc.pdf.
72. Brewer CA, Pickle L. Evaluation of methods for classifying epidemiological data on choropleth maps in series. Ann Assoc Am Geogr 92(4):662–81. 2002.
73. U.S. Census Bureau. Quickfacts: United States population estimates, July 1, 2019, (vintage year 2019). Available from: https://www.census.gov/quickfacts/fact/table/US/PST045219.
74. Parker JD, Talih M, Malec DJ, Beresovsky V, Carroll M, Gonzalez JF Jr, et al. National Center for Health Statistics data presentation standards for proportions. National Center for Health Statistics. Vital Health Stat 2(175). 2017.
75. RTI International. SUDAAN (Version 11.0) [computer software]. 2012.
76. National Cancer Institute. Joinpoint trend analysis (Version 4.6.0.0) [computer software]. 2018.
77. Li X, Bush MA. Approaches for performing age-adjustment in trend analysis. Proceedings of JSM 2019 of the American Statistical Association: 741–50. Denver, CO. 2019.
78. National Center for HIV/AIDS, Viral Hepatitis, STD, and TB Prevention, Youth Risk Behavior Surveillance System (YRBSS). Interpretation of YRBS trend data. Atlanta, GA: Centers for Disease Control and Prevention. 2016.
79. Wasserstein RL, Lazar NA. The ASA's statement on p-values: Context, process, and purpose. Am Stat 70(2): 129–33. 2016.
Related Documents