OECD Health Working Papers No. 68 Health Spending Continues to Stagnate in Many OECD Countries David Morgan, Roberto Astolfi https://dx.doi.org/10.1787/5jz5sq5qnwf5-en

Welcome message from author
This document is posted to help you gain knowledge. Please leave a comment to let me know what you think about it! Share it to your friends and learn new things together.
Transcript
OECD Health Working Papers No. 68
Health Spending Continuesto Stagnate in Many OECD
Countries
David Morgan,Roberto Astolfi
https://dx.doi.org/10.1787/5jz5sq5qnwf5-en
Unclassified DELSA/HEA/WD/HWP(2014)1 Organisation de Coopération et de Développement Économiques Organisation for Economic Co-operation and Development
___________________________________________________________________________________________
_____________ English text only DIRECTORATE FOR EMPLOYMENT, LABOUR AND SOCIAL AFFAIRS
HEALTH COMMITTEE
Health Working Papers
OECD Health Working Paper No. 68
HEALTH SPENDING CONTINUES TO STAGNATE IN MANY OECD COUNTRIES
David Morgan and Roberto Astolfi
JEL Classification: H51; I12; I18
Authorised for publication by Stefano Scarpetta, Director, Directorate for Employment, Labour and Social
Affairs
All Health Working Papers are now available through OECD's Internet website at
http://www.oecd.org/health/workingpapers
Complete document available on OLIS in its original format
This document and any map included herein are without prejudice to the status of or sovereignty over any territory, to the delimitation of
international frontiers and boundaries and to the name of any territory, city or area.
DE
LS
A/H
EA
/WD
/HW
P(2
01
4)1
Un
classified
En
glish
text o
nly
Cancels & replaces the same document of 11 February 2014
DELSA/HEA/WD/HWP(2014)1
2
DIRECTORATE FOR EMPLOYMENT, LABOUR AND SOCIAL AFFAIRS
www.oecd.org/els
OECD HEALTH WORKING PAPERS
http://www.oecd.org/health/workingpapers
OECD Working Papers should not be reported as representing the official views of the OECD or of its
member countries. The opinions expressed and arguments employed are those of the author(s).
Working Papers describe preliminary results or research in progress by the author(s) and are
published to stimulate discussion on a broad range of issues on which the OECD works. Comments on
Working Papers are welcomed, and may be sent to the Directorate for Employment, Labour and Social
Affairs OECD, 2 rue André-Pascal, 75775 Paris Cedex 16, France.
This series is designed to make available to a wider readership selected labour market, social policy
and migration studies prepared for use within the OECD. Authorship is usually collective, but principal
writers are named. The papers are generally available only in their original language – English or French –
with a summary in the other.
The statistical data for Israel are supplied by and under the responsibility of the relevant Israeli
authorities. The use of such data by the OECD is without prejudice to the status of the Golan Heights, East
Jerusalem and Israeli settlements in the West Bank under the terms of international law.
Applications for permission to reproduce or translate
all or part of this material should be made to:
Head of Publications Service
OECD
2, rue André-Pascal
75775 Paris, CEDEX 16
France
Copyright OECD 2014

DELSA/HEA/WD/HWP(2014)1
3
ACKNOWLEDGEMENTS
The authors thank Anne Durand, Michael Mueller and Mark Pearson from the OECD Health Division
for their comments and suggestions.
DELSA/HEA/WD/HWP(2014)1
4
EXECUTIVE SUMMARY
The global economic crisis which began in 2008 has had a dramatic effect on health spending across
OECD countries. Estimates of expenditure on health released back in 2012 showed that, for the first time,
health spending had slowed markedly or fallen across many OECD countries after years of continuous
growth. As a result, close to zero growth in health expenditure was recorded on average in 2010.
Preliminary estimates suggested that the low or negative growth in health spending was set to continue in
many OECD countries in following years.
This paper updates the previous report1 to cover the most recent trends in health spending based on
the 2013 Health Accounts joint data collection. In a continuing effort to improve the timeliness of the
available spending data, an increased number of countries were also able to provide preliminary estimates
of more recent health spending to give an initial insight of the likely spending patterns that occurred in
2012 ahead of the 2014 collection.
Following the significant downturn in 2010, average health spending growth across OECD countries
continued to stagnate in 2011, with a likely continuation in 2012. That said, there is large variability in the
observed growth rates between countries. As in last year’s paper, this update provides a more detailed
analysis to give a picture of which countries continue to be most affected, and across which types of
financing and sectors of the health system.
Based on the analysis, the following conclusions can be made:
Preliminary spending estimates for 2012 for a sub-set of OECD countries suggest that the low
growth of health spending observed in 2010 and 2011 has continued;
Almost all OECD countries have seen the growth in health spending fall since 2009, albeit to
varying degrees;
Reductions in government spending have continued to drive down growth in health spending
overall;
For social health insurance financing systems, there is some evidence of a reduction in the share
coming from wage-based contributions;
All sectors of the healthcare system have seen significant reductions since 2009; spending on
pharmaceuticals and on public health and prevention services has seen the greatest reductions, on
average.
1 Health Working Paper No. 60 (Morgan and Astolfi, 2013).
DELSA/HEA/WD/HWP(2014)1
5
RESUME
La crise économique mondiale qui a débuté en 2008 a profondément modifié l'évolution des dépenses
de santé des pays de l’OCDE. Les estimations publiées en 2012 ont montré que, pour la première fois après
des années de croissance ininterrompue, les dépenses de santé avaient sensiblement ralenti, voire diminué,
dans de nombreux pays. Ainsi, leur taux de croissance moyen s’établissait autour de zéro en 2010 et,
d’après les premières estimations, il serait resté faible ou négatif dans de nombreux pays en 2011.
Le présent document est une mise à jour d'un précédent rapport2 ayant pour but de présenter les
tendances les plus récentes des dépenses de santé, telles qu'elles ressortent de la collecte conjointe de
données sur les comptes de la santé réalisée en 2013. Dans un effort constant pour actualiser les données
disponibles sur les dépenses de santé, les pays ont été plus nombreux cette année à fournir des estimations
préliminaires qui donnent une idée de l’évolution probable de ces dépenses en 2012.
Après le fléchissement marqué de l’activité en 2010, la croissance moyenne des dépenses de santé
dans les pays de l’OCDE a continué de stagner en 2011, et il en a probablement été de même en 2012. Cela
dit, on observe de grandes disparités entre les pays. Comme dans le document de l’an dernier, on trouvera
ci-après une analyse plus détaillée la situation montrant quels sont les pays, les types de financement et les
secteurs du système de santé qui continuent d'être les plus touchés.
Les conclusions de cette analyse sont les suivantes :
D'après les premières estimations pour un sous-ensemble de pays de l’OCDE, la faible croissance
des dépenses de santé observée en 2010 et en 2011 s’est poursuivie en 2012 ;
la quasi-totalité des pays de l’OCDE ont vu leurs dépenses de santé diminuer de façon plus ou
moins marquée depuis 2009 ;
la réduction des dépenses publiques a globalement continué de peser sur la croissance des
dépenses de santé ;
Dans les systèmes d’assurance-maladie, il semble que la part de financement des cotisations sur
les salaires a diminué;
tous les secteurs du système de santé affichent un net repli depuis 2009, mais ce sont les dépenses
en produits pharmaceutiques et les dépenses de prévention et de santé publique qui ont en
moyenne le plus diminué.
2 Health Working Paper No. 60 (Morgan and Astolfi, 2013).
DELSA/HEA/WD/HWP(2014)1
6
TABLE OF CONTENTS
ACKNOWLEDGEMENTS ............................................................................................................................ 3
EXECUTIVE SUMMARY ............................................................................................................................. 4
RESUME ......................................................................................................................................................... 5
INTRODUCTION ........................................................................................................................................... 7
DATA SOURCES AND LIMITATIONS ....................................................................................................... 8
OVERVIEW OF RECENT HEALTH SPENDING TRENDS ....................................................................... 8
Large variability in growth rates across OECD countries ........................................................................ 9 Preliminary estimates suggest that overall health spending growth remains sluggish ........................... 10 Cuts in public spending on health .......................................................................................................... 11 Adjusting the level of financial resources .............................................................................................. 12 Cuts in public spending on pharmaceutical and prevention ................................................................... 16 Amending the cost of care ...................................................................................................................... 18
CONCLUSIONS ........................................................................................................................................... 20
BIBLIOGRAPHY ......................................................................................................................................... 21
Tables
Table 1. Preliminary estimates of 2012 health spending growth rate (in real terms) compared with 201111
Figures
Figure 1. Average OECD health expenditure growth rates from 2000 to 2011, public and total ................ 9 Figure 2. Average annual growth in health spending across OECD countries, 2000-2011 ....................... 10 Figure 3. Average annual growth in health spending by financing, 2008-2011 ........................................ 12 Figure 4. Fiscal Options legally available and implemented in health financing and budgeting............... 13 Figure 5. Average public expenditure on health growth rates from 2000 to 2011 by dominant financing
system. ....................................................................................................................................................... 14 Figure 6. Change in the financing of public expenditure on health from private sources in social health
insurance systems, 2008-2011 ................................................................................................................... 15 Figure 7. Average growth by main function of health care for selected OECD countries, public
expenditure, 2008-2011 ............................................................................................................................. 16 Figure 8. Share of generics (value) in the total pharmaceutical market, 2008 and 2012 ........................... 17 Figure 9. Growth in government spending on prevention and public health services, 2010/11 ................ 18
DELSA/HEA/WD/HWP(2014)1
7
INTRODUCTION
1. In June 2012, attention was first drawn to the fact that in 2010 health spending growth, in real
terms, was around zero across the OECD area. This had followed many years of continuous growth in
health spending above the rate of overall economic growth leading to an increase in the share of GDP
allocated to health care. Health Working Paper No. 60 (Morgan and Astolfi, 2013) provided further details
as to where the greatest falls in expenditure had taken place, both with respect to OECD countries and
sectors of health care spending. In addition, using preliminary data for 2011 and more recent measures
taken, the paper tried to assess the short term prospects for health spending trends.
2. With a further year of spending data now available as a result of the 2013 annual health accounts
data collection and with an increased number of countries able to provide preliminary data for 2012, there
is a clearer picture of the on-going effect of the crisis within Europe and the slowdown in economic growth
across the OECD as a whole and according to the type of financing and sectors of the health care system.
3. Reflecting the differences in health care systems across the OECD and the extent to which a
country is affected by the economic downturn, a vast range of policy instruments have been implemented
since the onset of the crisis. Given that public funds account for around three-quarters of total spending on
health on average across the OECD, and in the context of reducing public deficits, governments have
adopted various measures to increase efficiency or adjust the resource allocations to health coming from
the public budget. Information on the various measures that are legally available to countries to, for
example, control inputs, set caps to budgets, or freeze prices have been collected as part of the 2012 OECD
Health System Characteristics Survey and are discussed later in this paper. The tools have been utilised to
varying degrees over time and across countries.
4. In some cases, countries were relatively unaffected or made commitments to ring-fence existing
health spending - at least initially. In other cases planned reforms were accelerated or intensified in the face
of a worsening fiscal situation. A broad categorisation of the different policy instruments to control public
health care spending has been proposed (OECD, 2010 and Mladovksy et al, 2012). These can be generally
described as:
Adjusting the level of financial resources, or making changes to public spending;
Regulating the demand for services primarily through making changes to health care coverage;
Controlling the cost of care, or trying to do more with the same or less.
5. This paper restricts itself to identifying the latest trends in health expenditure between countries
and across sectors and does not discuss the effectiveness of policy responses to the crisis or indeed the
effect of such policies on the health status of the population. A separate fast-track paper on the impact of
the financial crisis on health responds to that request by exploring the empirical links between worsening
employment conditions, health expenditure and health outcomes [DELSA/HEA(2013)18].
DELSA/HEA/WD/HWP(2014)1
8
DATA SOURCES AND LIMITATIONS
6. The following analysis makes extensive use of the available data – both expenditure and
non-expenditure - from OECD Health Statistics 2013. However, this does impose certain limitations in so
far as most recent health expenditure data for a majority of OECD countries refers to 2011 and preliminary
data for 2012 are only available for a subset of countries. Thus, only the effects of policy measures taken
between 2008 and 2010 are likely reflected, whereas additional measures may have been taken or have
come into force subsequently as economic conditions continued to be challenging in many OECD
countries. Moreover, there is a limited level of detail available typically for some of the countries most
affected and those imposing cuts in public spending.3
7. The analysis of the financial resources that countries use to fund health spending is limited in the
sense that few countries currently provide such information. Similarly, little information is available for the
cost structure of the supply side (essentially this is limited to salaries). Finally, the lack of a specific health
deflator does not allow a clear separation of the price from the volume effects. Available information is
therefore limited to the consumption of health good and services essentially in nominal terms which can
only be deflated using the GDP deflator. That said, efforts are being made to fill some of these data gaps.
For example, the implementation of SHA 2011 will allow a much better tracking of the flow of revenues to
the various health financing schemes, such as the social insurance contributions or internal government
transfers (from taxes), and work on health-specific PPPs is well advanced.
OVERVIEW OF RECENT HEALTH SPENDING TRENDS
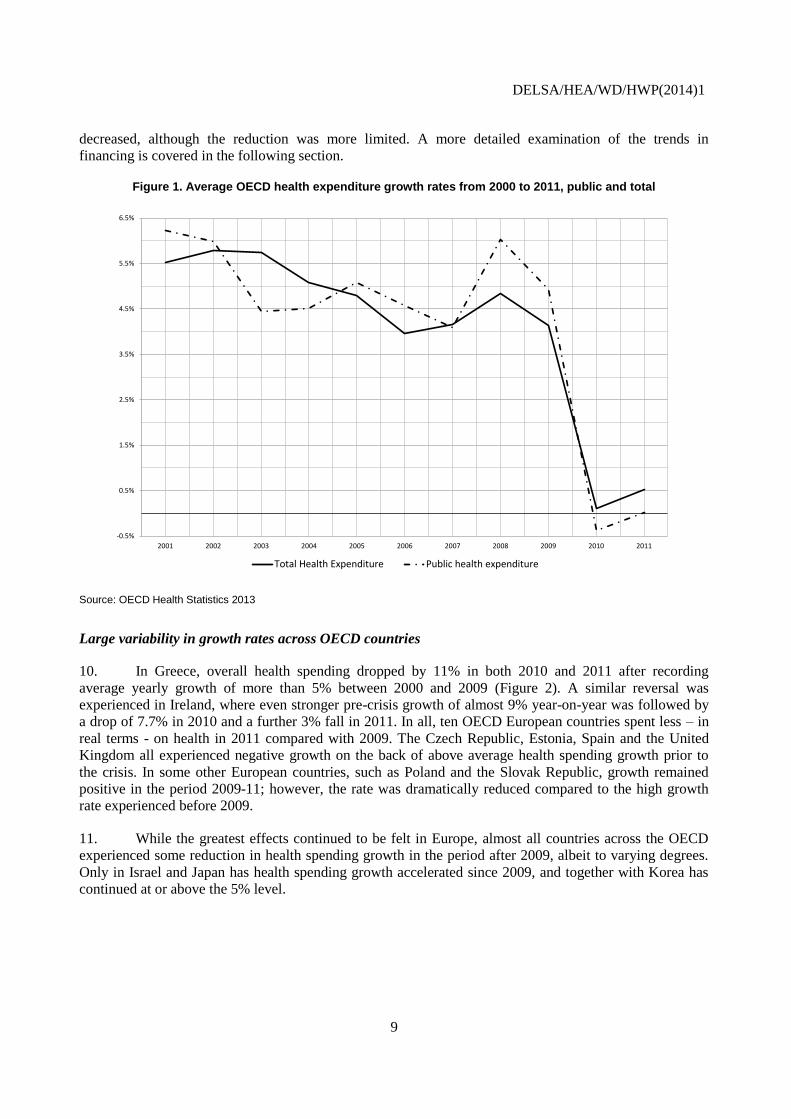
8. In 2011, health spending grew by around 0.5% in real terms, on average, across OECD countries.
This followed growth of only 0.1% the previous year. Since the start of the financial and economic crisis,
the growth in health spending has slowed markedly in almost all OECD countries. The close to zero
growth rate, in real terms, in 2010 and 2011 compares with health spending growth of 4.1% in 2009 and
annual growth of close to 5% in the pre-crisis period, 2000-2009 (Figure 1). Over this period health
spending continually outpaced economic growth resulting in an ever-increasing share of GDP. As a result
of the minimal growth in health spending across OECD countries in 2010 and 2011, the percentage of
GDP devoted to health declined slightly in most countries.4 Health spending accounted for 9.3% of GDP
on average across OECD countries in 2011, compared with 9.5% in 2010 and 9.6% in 2009, when a
sudden jump in the ratio occurred as overall economic conditions deteriorated.
9. The drop in the rate of growth since 2009 has been primarily driven by a collapse in the growth
of government health spending – recording below zero growth on average in both 2010 and 2011. Private
health spending also slowed in many countries in 2010 and 2011 as household incomes remained flat or
3. Notably, Ireland, Italy and the United Kingdom currently do not produce detailed health accounts
according to SHA.
4. For comparison, GDP growth in real terms averaged 3.0% across the OECD for the period 2000 to 2008
and 0.0% in the period 2008 to 2011.
DELSA/HEA/WD/HWP(2014)1
9
decreased, although the reduction was more limited. A more detailed examination of the trends in
financing is covered in the following section.
Figure 1. Average OECD health expenditure growth rates from 2000 to 2011, public and total
Source: OECD Health Statistics 2013
Large variability in growth rates across OECD countries
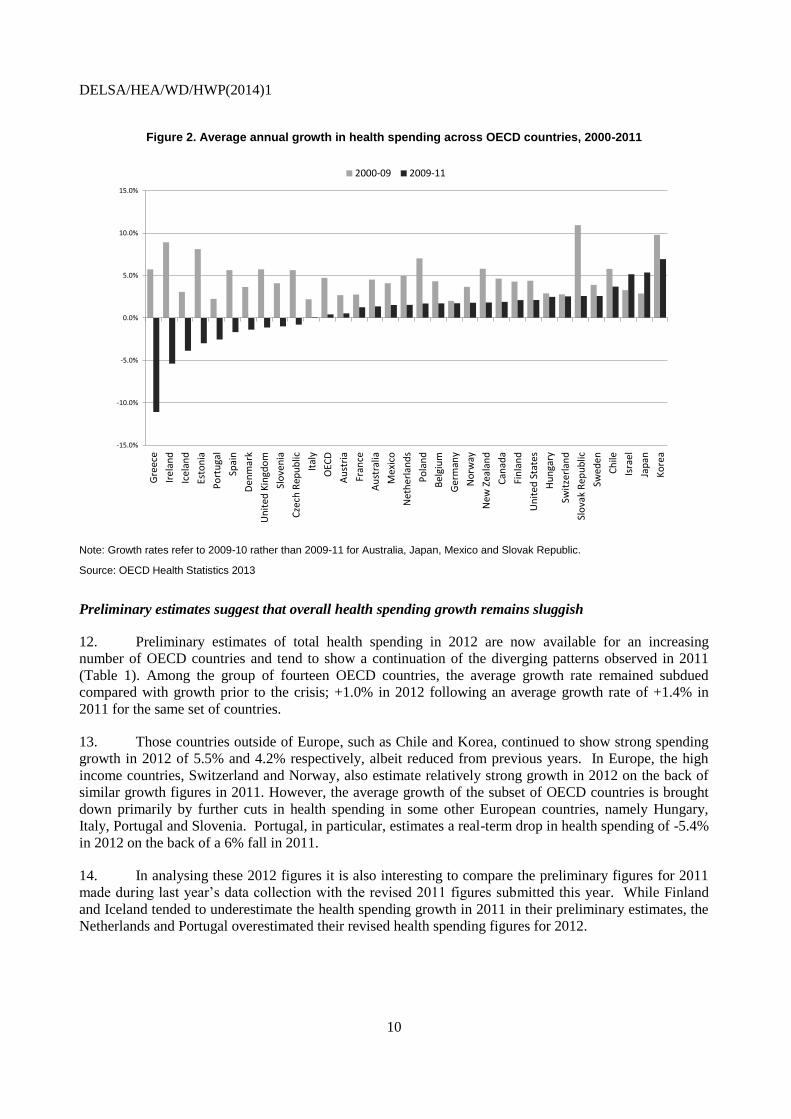
10. In Greece, overall health spending dropped by 11% in both 2010 and 2011 after recording
average yearly growth of more than 5% between 2000 and 2009 (Figure 2). A similar reversal was
experienced in Ireland, where even stronger pre-crisis growth of almost 9% year-on-year was followed by
a drop of 7.7% in 2010 and a further 3% fall in 2011. In all, ten OECD European countries spent less – in
real terms - on health in 2011 compared with 2009. The Czech Republic, Estonia, Spain and the United
Kingdom all experienced negative growth on the back of above average health spending growth prior to
the crisis. In some other European countries, such as Poland and the Slovak Republic, growth remained
positive in the period 2009-11; however, the rate was dramatically reduced compared to the high growth
rate experienced before 2009.
11. While the greatest effects continued to be felt in Europe, almost all countries across the OECD
experienced some reduction in health spending growth in the period after 2009, albeit to varying degrees.
Only in Israel and Japan has health spending growth accelerated since 2009, and together with Korea has
continued at or above the 5% level.
-0.5%
0.5%
1.5%
2.5%
3.5%
4.5%
5.5%
6.5%
2001 2002 2003 2004 2005 2006 2007 2008 2009 2010 2011
Total Health Expenditure Public health expenditure
DELSA/HEA/WD/HWP(2014)1
10
Figure 2. Average annual growth in health spending across OECD countries, 2000-2011
Note: Growth rates refer to 2009-10 rather than 2009-11 for Australia, Japan, Mexico and Slovak Republic.
Source: OECD Health Statistics 2013
Preliminary estimates suggest that overall health spending growth remains sluggish
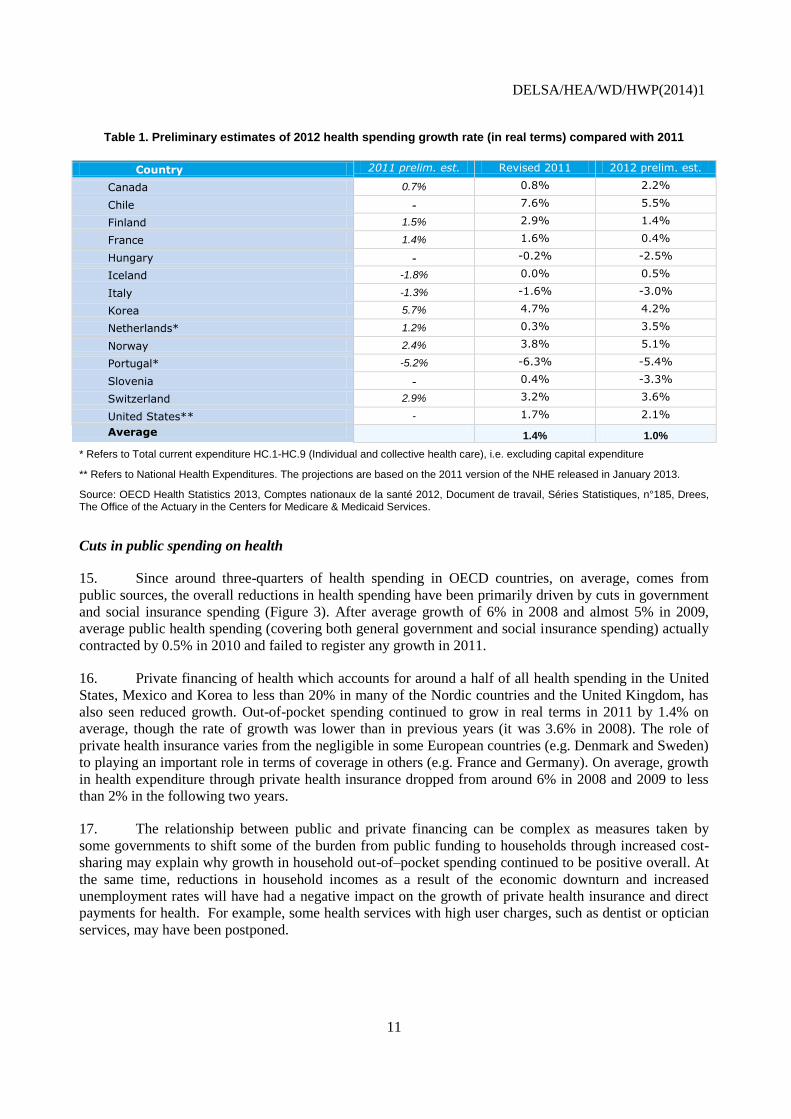
12. Preliminary estimates of total health spending in 2012 are now available for an increasing
number of OECD countries and tend to show a continuation of the diverging patterns observed in 2011
(Table 1). Among the group of fourteen OECD countries, the average growth rate remained subdued
compared with growth prior to the crisis; +1.0% in 2012 following an average growth rate of +1.4% in
2011 for the same set of countries.
13. Those countries outside of Europe, such as Chile and Korea, continued to show strong spending
growth in 2012 of 5.5% and 4.2% respectively, albeit reduced from previous years. In Europe, the high
income countries, Switzerland and Norway, also estimate relatively strong growth in 2012 on the back of
similar growth figures in 2011. However, the average growth of the subset of OECD countries is brought
down primarily by further cuts in health spending in some other European countries, namely Hungary,
Italy, Portugal and Slovenia. Portugal, in particular, estimates a real-term drop in health spending of -5.4%
in 2012 on the back of a 6% fall in 2011.
14. In analysing these 2012 figures it is also interesting to compare the preliminary figures for 2011
made during last year’s data collection with the revised 2011 figures submitted this year. While Finland
and Iceland tended to underestimate the health spending growth in 2011 in their preliminary estimates, the
Netherlands and Portugal overestimated their revised health spending figures for 2012.
-15.0%
-10.0%
-5.0%
0.0%
5.0%
10.0%
15.0%
Gre
ece
Irel
and
Icel
and
Esto
nia
Po
rtu
gal
Spai
n
Den
mar
k
Un
ited
Kin
gdo
m
Slo
ven
ia
Cze
ch R
epu
blic
Ital
y
OEC
D
Au
stri
a
Fran
ce
Au
stra
lia
Mex
ico
Net
her
lan
ds
Po
lan
d
Be
lgiu
m
Ger
man
y
No
rway
New
Zea
lan
d
Can
ada
Fin
lan
d
Un
ited
Sta
tes
Hu
nga
ry
Swit
zerl
and
Slo
vak
Rep
ub
lic
Swed
en
Ch
ile
Isra
el
Jap
an
Ko
rea
2000-09 2009-11
DELSA/HEA/WD/HWP(2014)1
11
Table 1. Preliminary estimates of 2012 health spending growth rate (in real terms) compared with 2011
Country 2011 prelim. est. Revised 2011 2012 prelim. est.
Canada 0.7% 0.8% 2.2%
Chile - 7.6% 5.5%
Finland 1.5% 2.9% 1.4%
France 1.4% 1.6% 0.4%
Hungary - -0.2% -2.5%
Iceland -1.8% 0.0% 0.5%
Italy -1.3% -1.6% -3.0%
Korea 5.7% 4.7% 4.2%
Netherlands* 1.2% 0.3% 3.5%
Norway 2.4% 3.8% 5.1%
Portugal* -5.2% -6.3% -5.4%
Slovenia - 0.4% -3.3%
Switzerland 2.9% 3.2% 3.6%
United States** - 1.7% 2.1%
Average 1.4% 1.0%
* Refers to Total current expenditure HC.1-HC.9 (Individual and collective health care), i.e. excluding capital expenditure
** Refers to National Health Expenditures. The projections are based on the 2011 version of the NHE released in January 2013.
Source: OECD Health Statistics 2013, Comptes nationaux de la santé 2012, Document de travail, Séries Statistiques, n°185, Drees, The Office of the Actuary in the Centers for Medicare & Medicaid Services.
Cuts in public spending on health
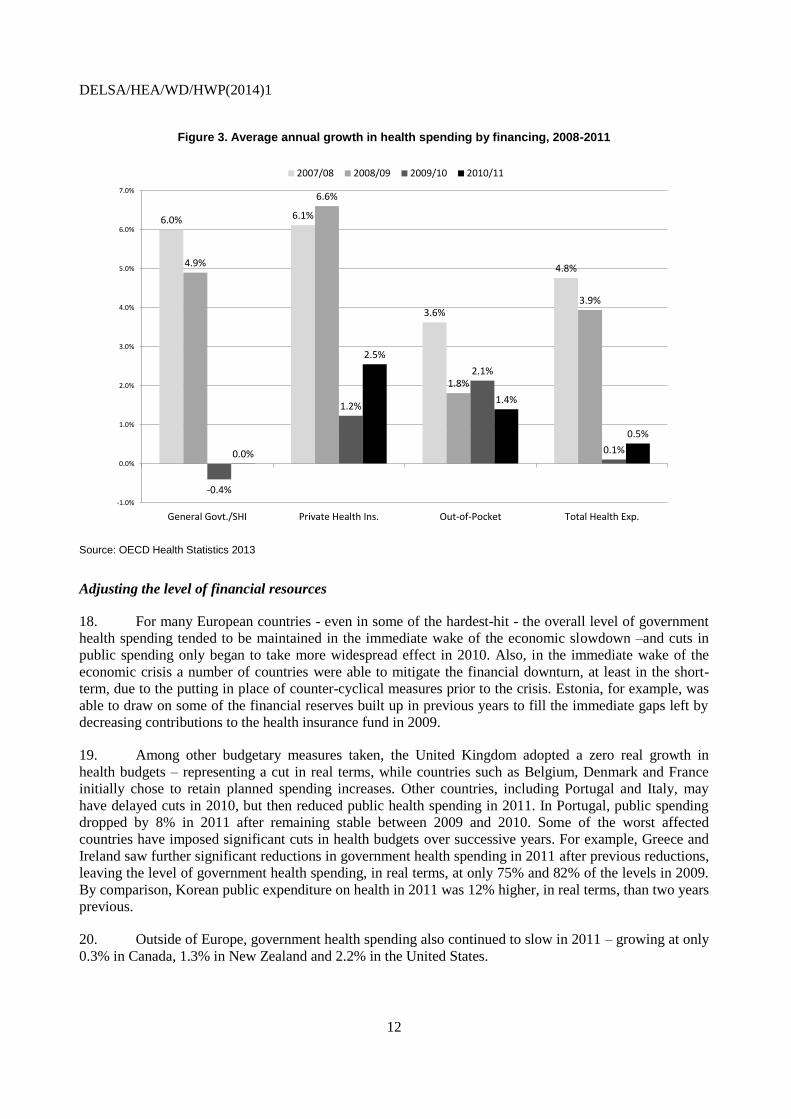
15. Since around three-quarters of health spending in OECD countries, on average, comes from
public sources, the overall reductions in health spending have been primarily driven by cuts in government
and social insurance spending (Figure 3). After average growth of 6% in 2008 and almost 5% in 2009,
average public health spending (covering both general government and social insurance spending) actually
contracted by 0.5% in 2010 and failed to register any growth in 2011.
16. Private financing of health which accounts for around a half of all health spending in the United
States, Mexico and Korea to less than 20% in many of the Nordic countries and the United Kingdom, has
also seen reduced growth. Out-of-pocket spending continued to grow in real terms in 2011 by 1.4% on
average, though the rate of growth was lower than in previous years (it was 3.6% in 2008). The role of
private health insurance varies from the negligible in some European countries (e.g. Denmark and Sweden)
to playing an important role in terms of coverage in others (e.g. France and Germany). On average, growth
in health expenditure through private health insurance dropped from around 6% in 2008 and 2009 to less
than 2% in the following two years.
17. The relationship between public and private financing can be complex as measures taken by
some governments to shift some of the burden from public funding to households through increased cost-
sharing may explain why growth in household out-of–pocket spending continued to be positive overall. At
the same time, reductions in household incomes as a result of the economic downturn and increased
unemployment rates will have had a negative impact on the growth of private health insurance and direct
payments for health. For example, some health services with high user charges, such as dentist or optician
services, may have been postponed.
DELSA/HEA/WD/HWP(2014)1
12
Figure 3. Average annual growth in health spending by financing, 2008-2011
Source: OECD Health Statistics 2013
Adjusting the level of financial resources
18. For many European countries - even in some of the hardest-hit - the overall level of government
health spending tended to be maintained in the immediate wake of the economic slowdown –and cuts in
public spending only began to take more widespread effect in 2010. Also, in the immediate wake of the
economic crisis a number of countries were able to mitigate the financial downturn, at least in the short-
term, due to the putting in place of counter-cyclical measures prior to the crisis. Estonia, for example, was
able to draw on some of the financial reserves built up in previous years to fill the immediate gaps left by
decreasing contributions to the health insurance fund in 2009.
19. Among other budgetary measures taken, the United Kingdom adopted a zero real growth in
health budgets – representing a cut in real terms, while countries such as Belgium, Denmark and France
initially chose to retain planned spending increases. Other countries, including Portugal and Italy, may
have delayed cuts in 2010, but then reduced public health spending in 2011. In Portugal, public spending
dropped by 8% in 2011 after remaining stable between 2009 and 2010. Some of the worst affected
countries have imposed significant cuts in health budgets over successive years. For example, Greece and
Ireland saw further significant reductions in government health spending in 2011 after previous reductions,
leaving the level of government health spending, in real terms, at only 75% and 82% of the levels in 2009.
By comparison, Korean public expenditure on health in 2011 was 12% higher, in real terms, than two years
previous.
20. Outside of Europe, government health spending also continued to slow in 2011 – growing at only
0.3% in Canada, 1.3% in New Zealand and 2.2% in the United States.
6.0% 6.1%
3.6%
4.8%4.9%
6.6%
1.8%
3.9%
-0.4%
1.2%
2.1%
0.1%0.0%
2.5%
1.4%
0.5%
-1.0%
0.0%
1.0%
2.0%
3.0%
4.0%
5.0%
6.0%
7.0%
General Govt./SHI Private Health Ins. Out-of-Pocket Total Health Exp.
2007/08 2008/09 2009/10 2010/11
DELSA/HEA/WD/HWP(2014)1
13
21. The timing and extent of the reduction in public spending has varied depending on the type of
health financing system and therefore the range of tools available. OECD health financing systems can be
grouped as those funded through general taxation, those with a social health insurance scheme funded by
social contributions, and others more mixed with a greater role of private financing.5 Most countries with
social health insurance (SHI) systems are in fact reliant to a varying extent on part of the financing of the
social health insurance coming from government transfers and are therefore not solely reliant on the
revenues from contributions. Although the differences between SHI and general taxation systems can be
exaggerated if these transfers are not considered, there nevertheless are significant differences between the
two types of systems. In particular, while the SHI system generally has a stable budget based on the
mandatory contributions of employees and employers, the allocations to health under a general taxation
system will rely on priorities of the government in competition with other areas of government spending.
The flexibility and the range of tools available to adjust and react to fiscal shocks can therefore be quite
different, and it is a reasonable to hypothesise that spending in SHI systems will generally vary less as
general economic conditions vary. This hypothesis is explored in further detail below.
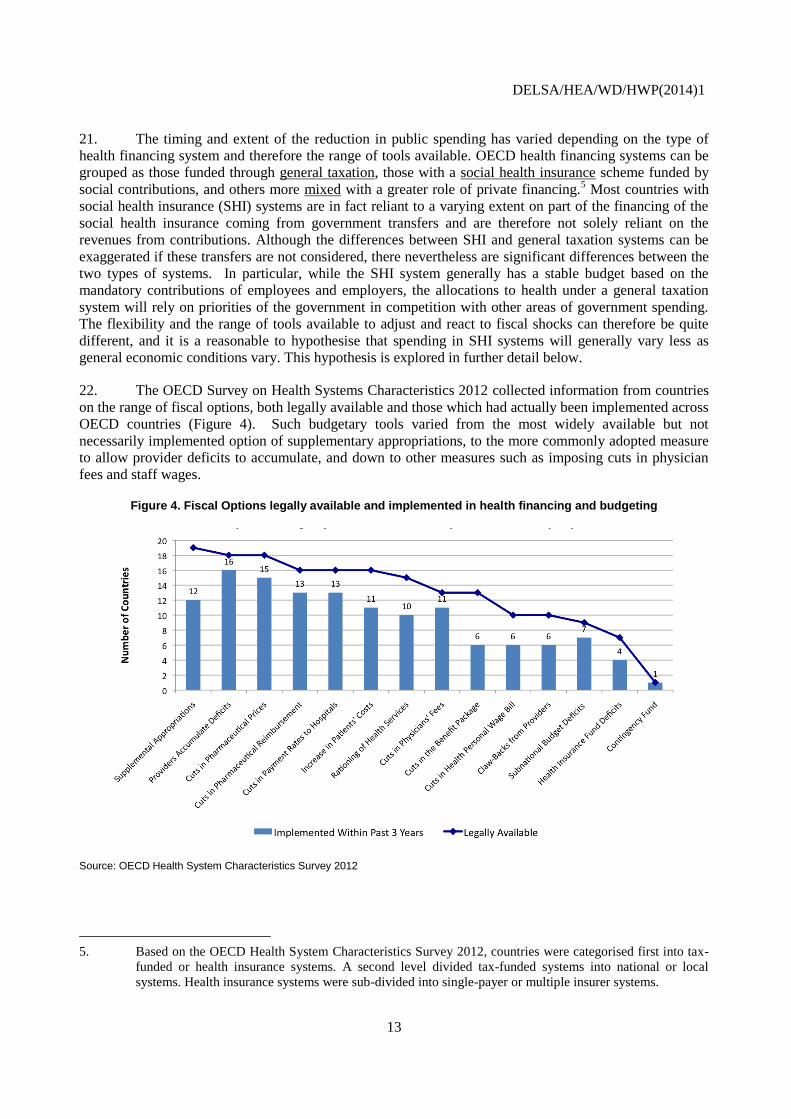
22. The OECD Survey on Health Systems Characteristics 2012 collected information from countries
on the range of fiscal options, both legally available and those which had actually been implemented across
OECD countries (Figure 4). Such budgetary tools varied from the most widely available but not
necessarily implemented option of supplementary appropriations, to the more commonly adopted measure
to allow provider deficits to accumulate, and down to other measures such as imposing cuts in physician
fees and staff wages.
Figure 4. Fiscal Options legally available and implemented in health financing and budgeting
Source: OECD Health System Characteristics Survey 2012
5. Based on the OECD Health System Characteristics Survey 2012, countries were categorised first into tax-
funded or health insurance systems. A second level divided tax-funded systems into national or local
systems. Health insurance systems were sub-divided into single-payer or multiple insurer systems.
DELSA/HEA/WD/HWP(2014)1
14
23. A widespread measure has been the increase (or introduction) of user charges for health services,
or in some cases, the removal of eligibility for a proportion of the population for some health services. This
has resulted in a certain shift of financing burden from public to private sources. Many of the co-payment
measures were planned to come into force in 2011 and 2012.
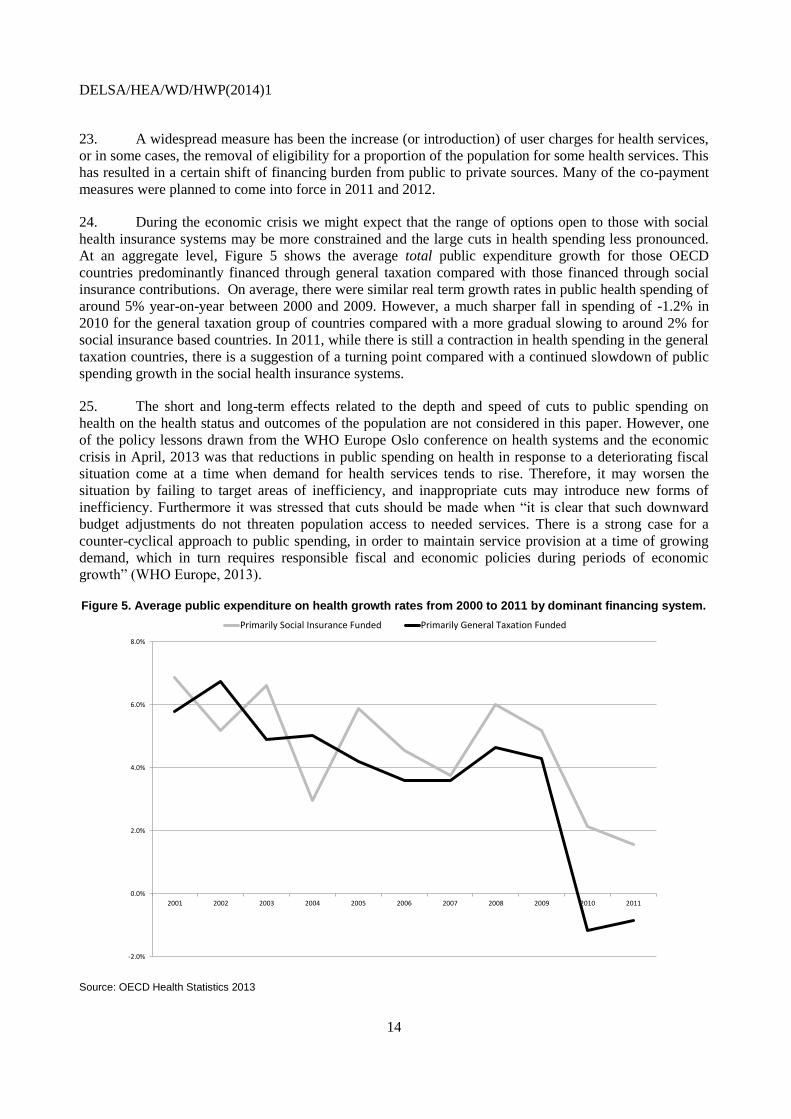
24. During the economic crisis we might expect that the range of options open to those with social
health insurance systems may be more constrained and the large cuts in health spending less pronounced.
At an aggregate level, Figure 5 shows the average total public expenditure growth for those OECD
countries predominantly financed through general taxation compared with those financed through social
insurance contributions. On average, there were similar real term growth rates in public health spending of
around 5% year-on-year between 2000 and 2009. However, a much sharper fall in spending of -1.2% in
2010 for the general taxation group of countries compared with a more gradual slowing to around 2% for
social insurance based countries. In 2011, while there is still a contraction in health spending in the general
taxation countries, there is a suggestion of a turning point compared with a continued slowdown of public
spending growth in the social health insurance systems.
25. The short and long-term effects related to the depth and speed of cuts to public spending on
health on the health status and outcomes of the population are not considered in this paper. However, one
of the policy lessons drawn from the WHO Europe Oslo conference on health systems and the economic
crisis in April, 2013 was that reductions in public spending on health in response to a deteriorating fiscal
situation come at a time when demand for health services tends to rise. Therefore, it may worsen the
situation by failing to target areas of inefficiency, and inappropriate cuts may introduce new forms of
inefficiency. Furthermore it was stressed that cuts should be made when “it is clear that such downward
budget adjustments do not threaten population access to needed services. There is a strong case for a
counter-cyclical approach to public spending, in order to maintain service provision at a time of growing
demand, which in turn requires responsible fiscal and economic policies during periods of economic
growth” (WHO Europe, 2013).
Figure 5. Average public expenditure on health growth rates from 2000 to 2011 by dominant financing system.
Source: OECD Health Statistics 2013
-2.0%
0.0%
2.0%
4.0%
6.0%
8.0%
2001 2002 2003 2004 2005 2006 2007 2008 2009 2010 2011
Primarily Social Insurance Funded Primarily General Taxation Funded
DELSA/HEA/WD/HWP(2014)1
15
26. In exploring further, one study suggests that during a crisis the components of health spending
are sensitive to the health financing system, pointing to an increase in pharmaceutical spending and
medical consultations in social health insurance schemes (Portela and Thomas, 2013). Analysing the latest
OECD health expenditure figures does suggest that that while pharmaceutical spending growth dropped in
both groups, the decrease was far less abrupt in the social health insurance funded countries and overall
spending on pharmaceuticals did continue to increase on average, albeit much reduced.
27. Countries primarily financed through social health insurance and relying on the labour market to
finance health care face the problem of a reduction in revenues. Close to half OECD countries rely on
wage-based contributions as their predominant financing source. In the face of changing demographics and
falls in workforce participation that finance health spending, there has been a longer term need to look at
mechanisms to reduce the reliance on wage-based contributions and increase the transfers by central
government to counter the shortfall. In the case of Hungary, in order to compensate the loss of revenues in
the National Health Insurance Fund, the funding mechanism was shifted significantly in 2009 with a
reduction in the employers’ contribution rate (as a means to stimulate the labour market) being
compensated by an increase in government transfers from general tax revenues (Gaál et al, 2011).
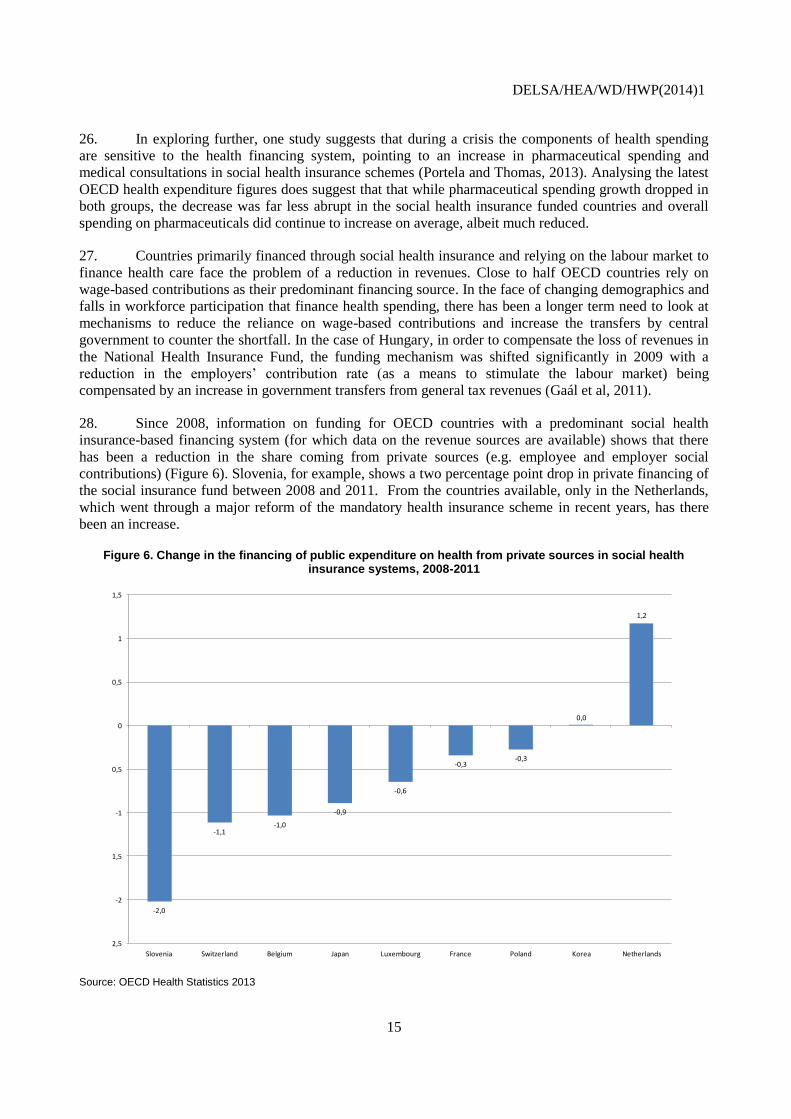
28. Since 2008, information on funding for OECD countries with a predominant social health
insurance-based financing system (for which data on the revenue sources are available) shows that there
has been a reduction in the share coming from private sources (e.g. employee and employer social
contributions) (Figure 6). Slovenia, for example, shows a two percentage point drop in private financing of
the social insurance fund between 2008 and 2011. From the countries available, only in the Netherlands,
which went through a major reform of the mandatory health insurance scheme in recent years, has there
been an increase.
Figure 6. Change in the financing of public expenditure on health from private sources in social health insurance systems, 2008-2011
Source: OECD Health Statistics 2013
-2,0
-1,1-1,0
-0,9
-0,6
-0,3-0,3
0,0
1,2
-2,5
-2
-1,5
-1
-0,5
0
0,5
1
1,5
Slovenia Switzerland Belgium Japan Luxembourg France Poland Korea Netherlands
DELSA/HEA/WD/HWP(2014)1
16
Cuts in public spending on pharmaceutical and prevention
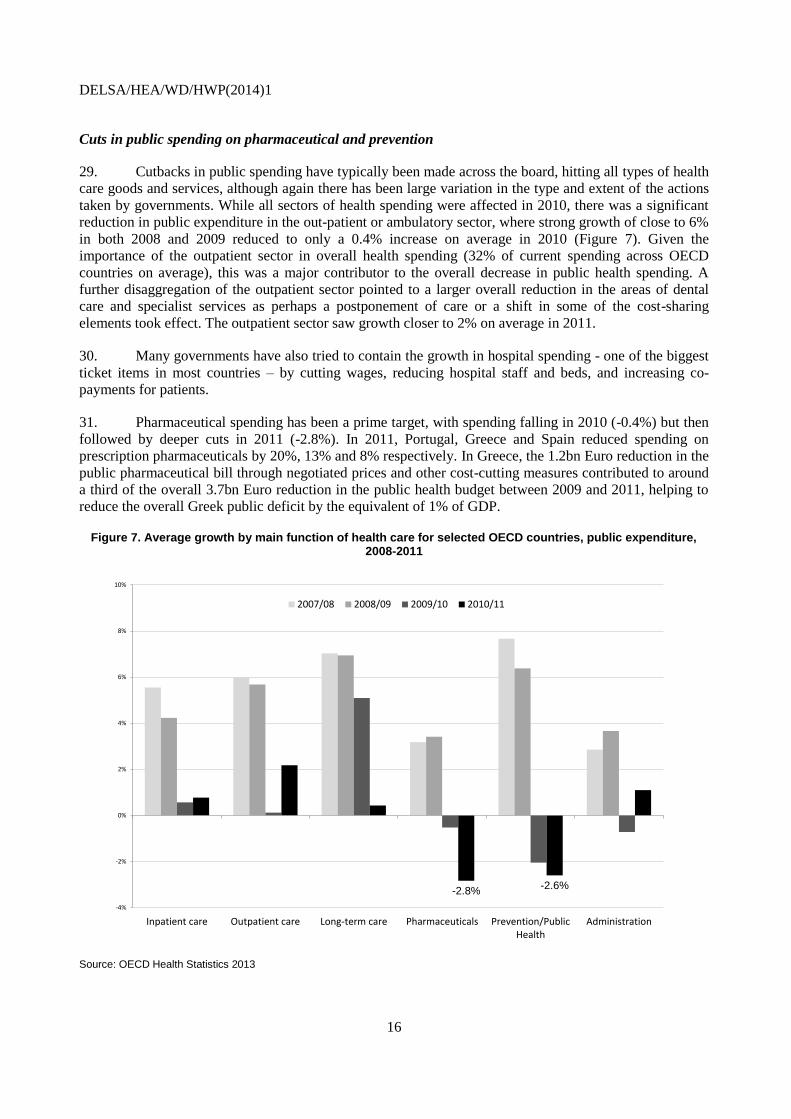
29. Cutbacks in public spending have typically been made across the board, hitting all types of health
care goods and services, although again there has been large variation in the type and extent of the actions
taken by governments. While all sectors of health spending were affected in 2010, there was a significant
reduction in public expenditure in the out-patient or ambulatory sector, where strong growth of close to 6%
in both 2008 and 2009 reduced to only a 0.4% increase on average in 2010 (Figure 7). Given the
importance of the outpatient sector in overall health spending (32% of current spending across OECD
countries on average), this was a major contributor to the overall decrease in public health spending. A
further disaggregation of the outpatient sector pointed to a larger overall reduction in the areas of dental
care and specialist services as perhaps a postponement of care or a shift in some of the cost-sharing
elements took effect. The outpatient sector saw growth closer to 2% on average in 2011.
30. Many governments have also tried to contain the growth in hospital spending - one of the biggest
ticket items in most countries – by cutting wages, reducing hospital staff and beds, and increasing co-
payments for patients.
31. Pharmaceutical spending has been a prime target, with spending falling in 2010 (-0.4%) but then
followed by deeper cuts in 2011 (-2.8%). In 2011, Portugal, Greece and Spain reduced spending on
prescription pharmaceuticals by 20%, 13% and 8% respectively. In Greece, the 1.2bn Euro reduction in the
public pharmaceutical bill through negotiated prices and other cost-cutting measures contributed to around
a third of the overall 3.7bn Euro reduction in the public health budget between 2009 and 2011, helping to
reduce the overall Greek public deficit by the equivalent of 1% of GDP.
Figure 7. Average growth by main function of health care for selected OECD countries, public expenditure, 2008-2011
Source: OECD Health Statistics 2013
-2.8%-2.6%
-4%
-2%
0%
2%
4%
6%
8%
10%
Inpatient care Outpatient care Long-term care Pharmaceuticals Prevention/PublicHealth
Administration
2007/08 2008/09 2009/10 2010/11
DELSA/HEA/WD/HWP(2014)1
17
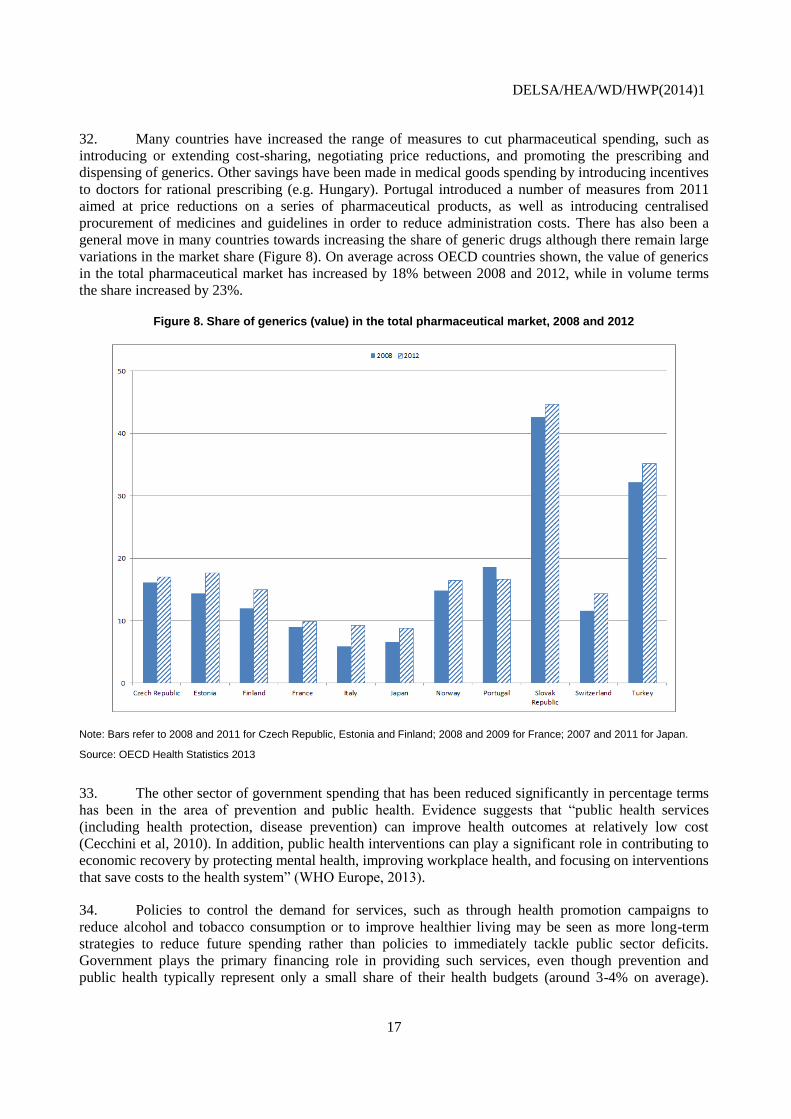
32. Many countries have increased the range of measures to cut pharmaceutical spending, such as
introducing or extending cost-sharing, negotiating price reductions, and promoting the prescribing and
dispensing of generics. Other savings have been made in medical goods spending by introducing incentives
to doctors for rational prescribing (e.g. Hungary). Portugal introduced a number of measures from 2011
aimed at price reductions on a series of pharmaceutical products, as well as introducing centralised
procurement of medicines and guidelines in order to reduce administration costs. There has also been a
general move in many countries towards increasing the share of generic drugs although there remain large
variations in the market share (Figure 8). On average across OECD countries shown, the value of generics
in the total pharmaceutical market has increased by 18% between 2008 and 2012, while in volume terms
the share increased by 23%.
Figure 8. Share of generics (value) in the total pharmaceutical market, 2008 and 2012
Note: Bars refer to 2008 and 2011 for Czech Republic, Estonia and Finland; 2008 and 2009 for France; 2007 and 2011 for Japan.
Source: OECD Health Statistics 2013
33. The other sector of government spending that has been reduced significantly in percentage terms
has been in the area of prevention and public health. Evidence suggests that “public health services
(including health protection, disease prevention) can improve health outcomes at relatively low cost
(Cecchini et al, 2010). In addition, public health interventions can play a significant role in contributing to
economic recovery by protecting mental health, improving workplace health, and focusing on interventions
that save costs to the health system” (WHO Europe, 2013).
34. Policies to control the demand for services, such as through health promotion campaigns to
reduce alcohol and tobacco consumption or to improve healthier living may be seen as more long-term
strategies to reduce future spending rather than policies to immediately tackle public sector deficits.
Government plays the primary financing role in providing such services, even though prevention and
public health typically represent only a small share of their health budgets (around 3-4% on average).
DELSA/HEA/WD/HWP(2014)1
18
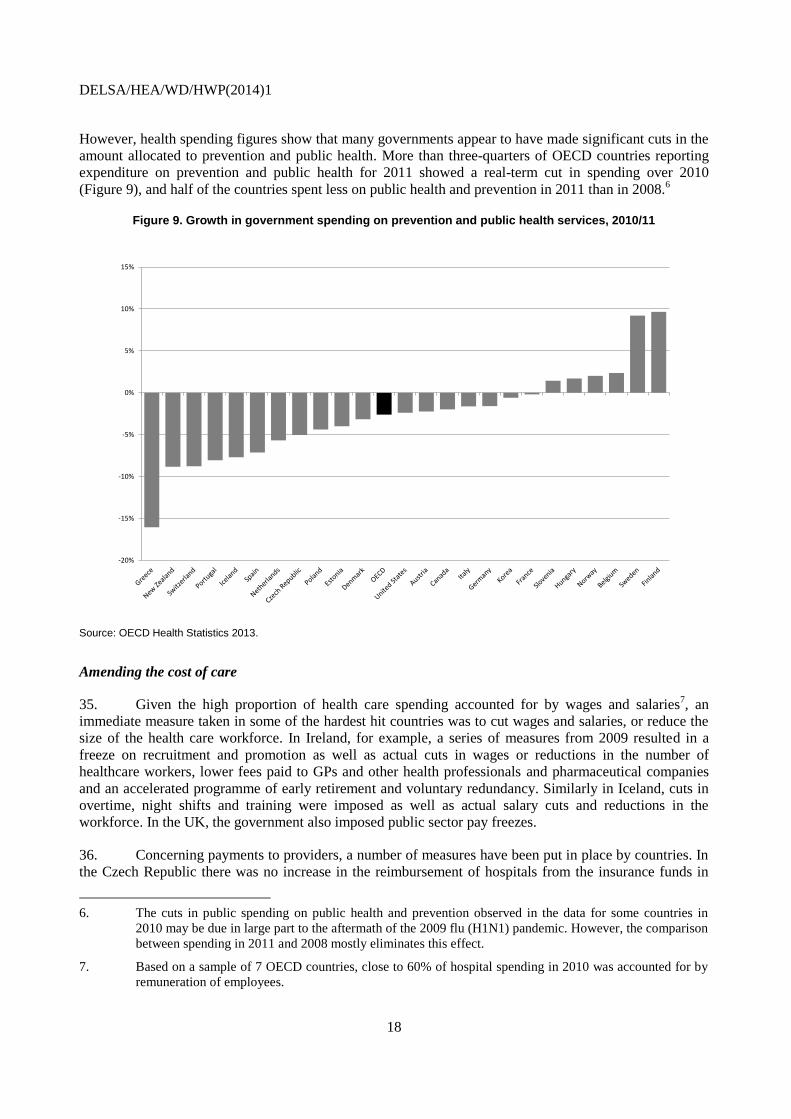
However, health spending figures show that many governments appear to have made significant cuts in the
amount allocated to prevention and public health. More than three-quarters of OECD countries reporting
expenditure on prevention and public health for 2011 showed a real-term cut in spending over 2010
(Figure 9), and half of the countries spent less on public health and prevention in 2011 than in 2008.6
Figure 9. Growth in government spending on prevention and public health services, 2010/11
Source: OECD Health Statistics 2013.
Amending the cost of care
35. Given the high proportion of health care spending accounted for by wages and salaries7, an
immediate measure taken in some of the hardest hit countries was to cut wages and salaries, or reduce the
size of the health care workforce. In Ireland, for example, a series of measures from 2009 resulted in a
freeze on recruitment and promotion as well as actual cuts in wages or reductions in the number of
healthcare workers, lower fees paid to GPs and other health professionals and pharmaceutical companies
and an accelerated programme of early retirement and voluntary redundancy. Similarly in Iceland, cuts in
overtime, night shifts and training were imposed as well as actual salary cuts and reductions in the
workforce. In the UK, the government also imposed public sector pay freezes.
36. Concerning payments to providers, a number of measures have been put in place by countries. In
the Czech Republic there was no increase in the reimbursement of hospitals from the insurance funds in
6. The cuts in public spending on public health and prevention observed in the data for some countries in
2010 may be due in large part to the aftermath of the 2009 flu (H1N1) pandemic. However, the comparison
between spending in 2011 and 2008 mostly eliminates this effect.
7. Based on a sample of 7 OECD countries, close to 60% of hospital spending in 2010 was accounted for by
remuneration of employees.
-20%
-15%
-10%
-5%
0%
5%
10%
15%
========
DELSA/HEA/WD/HWP(2014)1
19
2010. There is also a change towards DRG-based payments planned this year. Estonia targeted the
payments to the health care providers by reducing the prices of health care services by 6% from 2009,
following rapidly increasing prices before the crisis. Prices in primary care saw a lower reduction of
around 3%. In England, the government imposed real term cuts in the DRG-type tariff that hospitals are
paid as part of efforts to incentivise greater productivity.
37. As mentioned above, Ireland introduced a significant reduction in fees to health professionals,
imposing an 8% cut in 2009 with further cuts of 5% in 2010 and 2011. Similarly, Slovenia introduced price
reductions of 2.5% on health services with related penalties for those health care providers breaching the
contracts.
DELSA/HEA/WD/HWP(2014)1
20
CONCLUSIONS
38. Following the global financial crisis and after years of strong growth and an increasing share of
GDP being accounted for healthcare, the growth in health spending slowed abruptly in 2010 and has since
remained minimal. Almost all OECD countries have seen health spending growth fall since 2009, although
there remains significant variation as to the extent of the slowdown.
39. Preliminary data for an increasing number of OECD countries suggests that the trend in low
spending growth overall is likely to have continued through 2012.
40. The decrease in health expenditure growth has to a large extent been driven by reductions in
public spending through the introduction of various measures or acceleration of reforms. There may be
some evidence of a shift to private financing of health care through cost-sharing measures although private
spending has also seen slower growth since 2009. It appears that all main sectors of public spending on
health have been reduced to varying degrees. Spending on pharmaceuticals and public health and
prevention services has seen the greatest reductions on average.
41. The analysis of health expenditure trends by country, sector and type of health system financing
gives a basis to further explore the effects of the various policy measures put in place and ultimately the
impact on health status and outcomes.
DELSA/HEA/WD/HWP(2014)1
21
BIBLIOGRAPHY
Cecchini M, F. Sassi, J.A. Lauer, Y.Y. Lee, V. Guajardo-Barron, D. Chisholm (2010) Tackling of
unhealthy diets, physical inactivity, and obesity: health eff ects and cost-eff ectiveness. Lancet 2010;
376: 1775–84.
Gaál P, S Szigeti, M Csere, M Gaskins, D Panteli (2011), “Hungary: Health system review. Health
Systems in Transition, 2011”, 13(5):1–266, WHO, Copengahen.
Mladovsky P, D Srivastava, J Cylus, M Karanikolos, T Evetovits, S Thomson and M McKee (2012),
“Health policy responses to the financial crisis in Europe”, Policy summary 5, WHO, Copenhagen.
Morgan, D. and R. Astolfi (2013), "Health Spending Growth at Zero: Which Countries, Which Sectors Are
Most Affected?", OECD Health Working Papers, No. 60, OECD Publishing.
OECD (2010), “Value for Money in Health Spending”, OECD Health Policy Studies, OECD, Paris.
OECD (2013), OECD Health Statistics 2013, OECD, Paris.
Portela, C and S. Thomas (2013), “Impact of the economic crisis on healthcare resources: An European
approach”, International Journal of Healthcare Management, Vol. 6,No. 2, June 2013 , pp. 104-
113(10).
WHO Europe (2013), “Health systems in times of global economic crisis: an update of the situation in the
WHO European Region” Report of Meeting Oslo, Norway, 17–18 April 2013, WHO, Copenhagen.
DELSA/HEA/WD/HWP(2014)1
22
OECD HEALTH WORKING PAPERS
A full list of the papers in this series can be found on the OECD website: http://www.oecd.org/health/workingpapers
No. 67 MEASURING AND COMPARING WAITING TIMES IN OECD COUNTRIES (2013)
Michael Borowitz, Valerie Moran and Luigi Sicialini
No. 66 THE ROLE OF FISCAL POLICIES IN HEALTH PROMOTION (2013) Franco Sassi
No. 65 ALCOHOL CONSUMPTION AND HARMFUL DRINKING: TRENDS AND SOCIAL
DISPARIETIES IN OECD COUNTRIES (2013) Franco Sassi (Forthcoming)
No. 64 MANAGING HOSPITAL VOLUMES: GERMANY AND EXPERIENCES FROM OECD
COUNTRIES (2013) Michael Schoenstein and Ankit Kumar
No. 63 VALUE IN PHARMACEUTICAL PRICING (2013) Valérie Paris, Annalisa Belloni
No. 62 HEALTH WORKFORCE PLANNING IN OECD COUNTRIES: A REVIEW OF 26 PROJECTION
MODELS FROM 18 COUNTRIES (2013) Tomoko Ono, Gaetan Lafortune and Michael
Schoenstein
No. 61 INTERNATIONAL VARIATIONS IN A SELECTED NUMBER OF SURGICAL PROCEDURES
(2013) Klim McPherson, Giorgia Gon, Maggie Scott
No. 60 HEALTH SPENDING GROWTH AT ZERO: WHICH COUNTRIES, WHICH SECTORS ARE
MOST AFFECTED? (2013) David Morgan and Roberto Astolfi
No. 59 A COMPARATIVE ANALYSIS OF HEALTH FORECASTING METHODS (2012) Roberto
Astolfi, Luca Lorenzoni, Jillian Oderkirk
No. 58 INCOME-RELATED INEQUALITIES IN HEALTH SERVICE UTILISATION IN 19 OECD
COUNTRIES, 2008-09 (2012) Marion Devaux and Michael de Looper
No. 57 THE IMPACT OF PAY INCREASES ON NURSES’ LABOUR MARKET: A REVIEW OF
EVIDENCE FROM FOUR OECD COUNTRIES (2011) James Buchan and Steven Black
No. 56 DESCRIPTION OF ALTERNATIVE APPROACHES TO MEASURE AND PLACE A VALUE ON
HOSPITAL PRODUCTS IN SEVEN OECD COUNTRIES (2011) Luca Lorenzoni and Mark
Pearson
No. 55 MORTALITY AMENABLE TO HEALTH CARE IN 31 OECD COUNTRIES: ESTIMATES AND
METHODOLOGICAL ISSUES (2011) Juan G. Gay, Valerie Paris, Marion Devaux,
Michael de Looper
No. 54 NURSES IN ADVANCED ROLES: A DESCRIPTION AND EVALUATION OF EXPERIENCES
IN 12 DEVELOPED COUNTRIES (2010) Marie-Laure Delamaire and Gaetan Lafortune
No. 53 COMPARING PRICE LEVELS OF HOSPITAL SERVICE ACROSS COUNTRIES: RESULTS OF
A PILOT STUDY (2010) Luca Lorenzoni
DELSA/HEA/WD/HWP(2014)1
23
No. 52 GUIDELINES FOR IMPROVING THE COMPARABILITY AND AVAILABILITY OF PRIVATE
HEALTH EXPENDITURES UNDER THE SYSTEM OF HEALTH ACCOUNTS FRAMEWORK
(2010) Ravi P. Rannan-Eliya and Luca Lorenzoni
No. 51 EFFECTIVE WAYS TO REALISE POLICY REFORMS IN HEALTH SYSTEMS (2010)
Jeremy Hurst
No. 50 HEALTH SYSTEMS INSTITUTIONAL CHARACTERISTICS A SURVEY OF 29 OECD
COUNTRIES (2010) Valerie Paris, Marion Devaux and Lihan Wei
No. 49 THE CHALLENGE OF FINANCING HEALTH CARE IN THE CURRENT CRISIS (2010) Peter
Scherer, Marion Devaux
No. 48 IMPROVING LIFESTYLES, TACKLING OBESITY: THE HEALTH AND ECONOMIC IMPACT
OF PREVENTION STRATEGIES (2009) Franco Sassi, Michele Cecchini, Jeremy Lauer and Dan
Chisholm
No. 47 HEALTH CARE QUALITY INDICATORS PROJECT: PATIENT SAFETY INDICATORS
REPORT 2009 (2009) Saskia Drösler, Patrick Romano, Lihan Wei; and
ANNEX Saskia Drösler
No. 46 EDUCATION AND OBESITY IN FOUR OECD COUNTRIES (2009) Franco Sassi, Marion
Devaux, Jody Church, Michele Cecchini and Francesca Borgonovi
No. 45 THE OBESITY EPIDEMIC: ANALYSIS OF PAST AND PROJECTED FUTURE TRENDS IN
SELECTED OECD COUNTRIES (2009) Franco Sassi, Marion Devaux, Michele Cecchini and
Elena Rusticelli
No. 44 THE LONG-TERM CARE WORKFORCE: OVERVIEW AND STRATEGIES TO ADAPT SUPPLY
TO A GROWING DEMAND (2009) Rie Fujisawa and Francesca Colombo
No. 43 MEASURING DISPARITIES IN HEALTH STATUS AND IN ACCESS AND USE OF HEALTH
CARE IN OECD COUNTRIES (2009) Michael de Looper and Gaetan Lafortune
No. 42 POLICIES FOR HEALTHY AGEING: AN OVERVIEW (2009) Howard Oxley
No. 41 THE REMUNERATION OF GENERAL PRACTITIONERS AND SPECIALISTS IN 14 OECD
COUNTRIES: WHAT ARE THE FACTORS EXPLAINING VARIATIONS ACROSS
COUNTRIES? (2008) Rie Fujisawa and Gaetan Lafortune
No. 40 INTERNATIONAL MOBILITY OF HEALTH PROFESSIONALS AND HEALTH WORKFORCE
MANAGEMENT IN CANADA: MYTHS AND REALITIES (2008) Jean-Christophe Dumont,
Pascal Zurn, Jody Church and Christine Le Thi
No. 39 PHARMACEUTICAL PRICING & REIMBURSEMENT POLICIES IN GERMANY (2008) Valérie
Paris and Elizabeth Docteur
No. 38 MIGRATION OF HEALTH WORKERS: THE UK PERSPECTIVE TO 2006 (2008) James
Buchan, Susanna Baldwin and Miranda Munro
No. 37 THE US PHYSICIAN WORKFORCE: WHERE DO WE STAND? (2008) Richard A. Cooper
DELSA/HEA/WD/HWP(2014)1
24
RECENT RELATED OECD PUBLICATIONS
MENTAL HEALTH AND WORK: SWITZERLAND (2014)
MENTAL HEALTH AND WORK: UNITED KINGDOM (2014)
CANCER CARE – ASSURING QUALITY TO IMPROVE SURVIVAL (2013)
ICTs AND THE HEALTH SECTOR – TOWARDS SMARTER HEALTH AND WELLNESS MODELS (2013)
A GOOD LIFE IN OLD AGE? MONITORING AND IMPROVING QUALITY IN LONG-TERM CARE
(2013)
STRENGTHENING HEALTH INFORMATION INFRASTRUCTURE FOR HEALTH CARE QUALITY
GOVERNANCE (2013)
WAITING TIME POLICIES IN THE HEALTH SECTOR, WHAT WORKS? (2013)
OECD REVIEWS OF HEALTH CARE QUALITY – DENMARK (2013)
HEALTH AT A GLANCE 2013: OECD INDICATORS (2013)
See http://www.oecd.org/health/healthataglance for more information
OECD HEALTH DATA 2013
(Database available from http://www.oecd.org/els/health-systems/oecdhealthdata.htm)
HEALTH AT A GLANCE: ASIA/PACIFIC (2012)
HEALTH AT A GLANCE: EUROPE (2012)
OECD REVIEWS OF HEALTH SYSTEMS - RUSSIAN FEDERATION (2012)
OECD REVIEWS OF HEALTH CARE QUALITY – KOREA (2012)
OECD REVIEWS OF HEALTH CARE QUALITY – ISRAEL (2012)
SICK ON THE JOB? MYTHS AND REALITIES ABOUT MENTAL HEALTH AND WORK (2011)
OECD REVIEWS OF HEALTH SYSTEMS - SWITZERLAND (2011)
HEALTH REFORM: MEETING THE CHALLENGE OF AGEING AND MULTIPLE MORBIDITIES
(2011)
A SYSTEM OF HEALTH ACCOUNTS (2011)
HELP WANTED? PROVIDING AND PAYING FOR LONG-TERM CARE (2011)
IMPROVING VALUE IN HEALTH CARE: MEASURING QUALITY (2010)
VALUE FOR MONEY IN HEALTH SPENDING (2010)
OBESITY AND THE ECONOMICS OF PREVENTION: FIT NOT FAT (2010)
For a full list, consult the OECD On-Line Bookstore at www.oecd.org,
or write for a free written catalogue to the following address:
OECD Publications Service
2, rue André-Pascal, 75775 PARIS CEDEX 16, or to the OECD Distributor in your country
Related Documents


![STAGNATE TO STUNNING [INBOUND 2014]](https://static.cupdf.com/doc/110x72/557c25ebd8b42aa77f8b49b8/stagnate-to-stunning-inbound-2014.jpg)


