The business of sustainability Health Risk Assessment Longwarry Cattle Saleyard 6 July 2020 Project No.: 0554561

Welcome message from author
This document is posted to help you gain knowledge. Please leave a comment to let me know what you think about it! Share it to your friends and learn new things together.
Transcript

The business of sustainability
Health Risk Assessment Longwarry Cattle Saleyard
6 July 2020
Project No.: 0554561
www.erm.com Version: Final Project No.: 0554561 Client: Longwarry Saleyard 6 July 2020
Document details
Document title Health risk Assessment Longwarry Cattle Saleyard
Document subtitle
Project No. 0554561
Date 6 July 2020
Version Final
Author Dr Lyn Denison, Monica Esposito, Dr Alison Radford, Patricia Thorpe
Client Name Longwarry Saleyard
Document history
ERM approval to issue
Version Revision Author Reviewed by Name Date Comments
Draft 01 Lyn Denison, Monica Esposito
Ken Kiefer Darren Reedy
03.07.2020
Final Lyn Denison, Monica Esposito
Darren Reedy
06.07.2020

www.erm.com Version: Final Project No.: 0554561 Client: Longwarry Saleyard 6 July 2020
Signature Page
06 July 2020
Health Risk Assessment Longwarry Cattle Saleyard
Dr Lyn Denison Technical Director
Darren Reedy Partner
Environmental Resources Management Australia Pty Ltd Citic House Level 6, 99 King Street Melbourne VIC 3000
© Copyright 2020 by ERM Worldwide Group Ltd and / or its affiliates (“ERM”). All rights reserved. No part of this work may be reproduced or transmitted in any form, or by any means, without the prior written permission of ERM

www.erm.com Version: Final Project No.: 0554561 Client: Longwarry Saleyard 6 July 2020 Page i
HEALTH RISK ASSESSMENT LONGWARRY CATTLE SALEYARD
CONTENTS
EXECUTIVE SUMMARY ....................................................................................................................... III
1. INTRODUCTION .......................................................................................................................... 1
2. BACKGROUND ............................................................................................................................ 2 2.1 Site Description .............................................................................................................................. 2 2.2 Surrounding Area ........................................................................................................................... 2
3. METHODOLOGY ......................................................................................................................... 3
4. POPULATION PROFILE .............................................................................................................. 4 4.1 Age Profile ..................................................................................................................................... 4 4.2 Health Profile ................................................................................................................................. 4
5. HEALTH RISK ASSESSMENT .................................................................................................... 6 5.1 Issues Identification ....................................................................................................................... 6 5.2 PM10 ............................................................................................................................................... 6
5.2.1 Hazard Assessment ...................................................................................................... 6 5.2.2 Exposure Assessment .................................................................................................. 7 5.2.3 Risk Characterisation .................................................................................................. 11 5.2.4 Conclusion .................................................................................................................. 14
5.3 E.Coli and Salmonella ................................................................................................................. 15 5.3.1 Hazard Assessment .................................................................................................... 15 5.3.2 Exposure Assessment ................................................................................................ 17 5.3.3 Risk Characterisation .................................................................................................. 21 5.3.4 Conclusion .................................................................................................................. 22
5.4 Q Fever ........................................................................................................................................ 22 5.4.1 Hazard Assessment .................................................................................................... 22 5.4.2 Exposure Assessment ................................................................................................ 24 5.4.3 Risk Characterisation .................................................................................................. 25 5.4.4 Conclusion .................................................................................................................. 27
5.5 Noise ........................................................................................................................................... 27 5.5.1 Hazard Assessment .................................................................................................... 28 5.5.2 Exposure Assessment ................................................................................................ 29 5.5.3 Risk Characterisation .................................................................................................. 31 5.5.4 Conclusion .................................................................................................................. 31
6. CONCLUSIONS ......................................................................................................................... 32
7. REFERENCES ........................................................................................................................... 33
8. STATEMENT OF LIMITATIONS ................................................................................................ 36
APPENDIX A AIR QUALITY ASSESSMENT APPENDIX B SLR NOISE REPORT

www.erm.com Version: Final Project No.: 0554561 Client: Longwarry Saleyard 6 July 2020 Page ii
HEALTH RISK ASSESSMENT LONGWARRY CATTLE SALEYARD
CONTENTS
List of Tables Table 2.1 Site Particulars ........................................................................................................................ 2 Table 4.1 Population profile – Longwarry Census 2016 ......................................................................... 4 Table 4.2 Health conditions reported for Baw Baw LGA. ....................................................................... 4 Table 5.1 Exposure Response Functions for PM10 Selected Health Outcomes (Taken from EPHC, 2011; HEI, 2009) ................................................................................................................................... 12 Table 5.2 Predicted increase in Risk Attributable to PM10 from Saleyard Operations (all sources) ..... 13 Table 5.3 Predicted increase in Risk Attributable to PM10 from Saleyard Operations (no laneways) .. 14 Table 5.4 Solid waste, estimated quantity and disposal ....................................................................... 18 Table 5.5 Background Noise Levels in Project Area ............................................................................ 30 Table 5.6 Predicted Noise Levels at Sensitive Receptors .................................................................... 30 Table 5.7 Hazard Quotients for Noise Associated with Proposed Saleyard ......................................... 31
List of Figures Figure 4.1: Location of Sensitive Receptors .......................................................................................... 5 Figure 5.1: 24-hour Average PM10 from All Sources at Sensitive Receptors ......................................... 8 Figure 5.2: 24-hour Average PM10 at Sensitive Receptors (Laneways excluded) .................................. 9 Figure 5.3: Maximum PM10 Concentrations all Sources ...................................................................... 10 Figure 5.4: Maximum Monthly TSP Deposition from All Sources ......................................................... 19 Figure 5.5: Maximum Monthly TSP Deposition minus Laneways ......................................................... 20

www.erm.com Version: Final Project No.: 0554561 Client: Longwarry Saleyard 6 July 2020 Page iii
HEALTH RISK ASSESSMENT LONGWARRY CATTLE SALEYARD
EXECUTIVE SUMMARY
EXECUTIVE SUMMARY
Environmental Resources Management Australia Pty Ltd (ERM) was engaged by Auld Planning and Projects to prepare a health risk assessment (HRA) for the proposed Longwarry Cattle Saleyard in Victoria located at 85 Thornell Road, Longwarry. It is understood that the HRA is a requirement of EPA Victoria as part of their Works Approval process under a Section 22 notice. This risk assessment aims to assess the potential health impacts in the surrounding community associated with the proposed Saleyard operations.
The risk assessment is based on potential off-site impacts of dust and associated risks with Escherichia coli (E. Coli) and Q fever (caused by bacterium Coxiella burnetii (C. burnetti). Additionally, effects of noise generated by the operation of the proposed Saleyard has been also considered in the risk assessment. The risk assessment has been conducted considering sensitive receptors outside the site boundary and are representative of the most potentially affected community locations.
The HRA has been conducted in accordance with the enHealth Guidelines (2012) Health Risk Assessment: Guidelines for Assessing Risks from Environmental Hazards. Air dispersion modelling has been undertaken to inform the risk assessments for PM10, E.Coli, Salmonella, and Q Fever. The noise modelling prepared for the Works Approval and adapted by SLR Australia Consulting Pty Ltd (SLR) for the HRA has been used to inform the noise risk assessment. The biosecurity management plan and risk assessment prepared for the Works Approval application has been utilised in the Q Fever risk assessment.
The risk assessment for PM10 has shown that the risk to the surrounding community is low and within acceptable risk levels adopted by enHealth (2012). Based on the low levels of PM10 that have been predicted and the low survival rate of E.Coli in air, the risk of infection from E.Coli and Salmonella by inhalation is also low and within acceptable levels.
To consider the risk of E. Coli and Salmonella through potential contamination of rainwater tanks, the results of dust deposition modelling have been used. The predicted deposited dust concentrations at all sensitive receptors is minimal and would not be measurable within these areas. Therefore, the risk of contamination of the rainwater tanks from potentially infected dust would also be minimal.
Based on the findings of the biosecurity risk assessment conducted for the Saleyard and the biosecurity management plan, the fact that the cattle will only be present on the site for less than 24 hours and the management practices proposed for the site, the levels of C. burnetti that may be present in the dust sources on the site are low and acceptable. The predicted PM10 levels from the operations on the site that are likely to be contaminated with C .burnetti, management of the stockpiles and soft bedding, are low and acceptable at all offsite receptors. Based on predicted levels of PM10 and the low likelihood for presence of C. burnetti in the waste, the potential risk of Q Fever to the local community from the proposed operations at the Saleyard is low and acceptable. Implementation of the management measures in the Biosecurity Risk Management Plan will minimise the risk of infection both onsite and offsite.
The risk assessment for noise has been conducted to assess the potential impact of noise from the proposed operations on sleep disturbance and increases in cardiovascular disease in accordance with the enHealth guidelines (2018) The Health Effects of Environmental Noise. Based on the noise levels predicted by SLR (2020) that, with the inclusion of the proposed noise walls around the site, the risk levels are within acceptable levels established by enHealth (2012).
The results of this HRA have shown that the risks arising from the operations of the proposed Saleyard are low and all resulting risks are within acceptable risk criteria established by enHealth.
This report must be read in conjunction with the Statement of Limitations included as Section 8.
www.erm.com Version: Final Project No.: 0554561 Client: Longwarry Saleyard 6 July 2020 Page 1
HEALTH RISK ASSESSMENT LONGWARRY CATTLE SALEYARD
INTRODUCTION
1. INTRODUCTION
Environmental Resources Management Australia Pty Ltd (ERM) was engaged by Auld Planning and Projects (Auld) to prepare a health risk assessment (HRA) for the proposed Longwarry Cattle Saleyard in Victoria located at 85 Thornell Road, Longwarry (the site). It is understood that the HRA is a requirement of EPA Victoria as part of their Works Approval process under a Section 22 notice.
This HRA aims to assess the potential health impacts in the surrounding community associated with the proposed Saleyard operations.
The risk assessment is based on potential off-site impacts of dust and associated risks with Escherichia coli (E. Coli) and Q fever (caused by bacterium Coxiella burnetii). Additionally, effects of noise generated by the operation of the proposed saleyard has been also considered in the risk assessment.
The risk assessment has been conducted considering sensitive receptors outside the site boundary and are representative of the most potentially affected community locations. The results of this HRA will inform the need for any additional management practices to be implemented on the site.

www.erm.com Version: Final Project No.: 0554561 Client: Longwarry Saleyard 6 July 2020 Page 2
HEALTH RISK ASSESSMENT LONGWARRY CATTLE SALEYARD
BACKGROUND
2. BACKGROUND
2.1 Site Description Longwarry Saleyards Pty Ltd propose to construct a Cattle Saleyard at 85 Thornell Road, Longwarry. Pertinent site details are provided in Table 2-1 below.
Table 2.1 Site Particulars
Item Detail
Current land use zoning Farming zone
Proposed use Saleyard
Site address 85 Thornell Road, Longwarry
Title Details 1 on PS133048 (Volume 10540 Folio 002) 2 on PS133048 (Volume 12150 Folio 874)
Municipality Baw Baw local government area (LGA).
Site Area Approx. 22.8 hectares
According to the Longwarry Saleyard Works Approval Report (Auld, 2019), the Saleyard will accommodate a throughput of up to 132,000 cattle per annum in a purpose built facility. Of those, 120,000 will be cattle and 12,000 bobby calves.
A number of 146 sales per annum is proposed using the following schedule:
Mondays (fat cattle & calves sales);
Tuesdays (cows & bulls & calves sales);
Every second Thursday (store sales); and
First and third Friday of the month, plus additional special sales if required (dairy sales).
Cattle sales are generally highest during summer period and lowest in June and July. The sales hours will be generally scheduled between 8am to 2pm. Loading, unloading and the sorting of cattle and calves would typically occur prior and following sale times. The facility requires unrestricted (i.e. 24/7) access and late deliveries may occur. However, the delivery of cattle in the site will be expected to occur in the afternoon prior to the sale and calves at the morning of the sale day. Cattle and calves will be removed from the site by the purchaser at the conclusion of the sale (i.e. not kept at site overnight).
2.2 Surrounding Area The site is located in Longwarry within the Shire of Baw Baw local government area.
The area surrounding the site is predominantly used for agricultural purposes. Rural dwellings are located on land surrounding with a number of residential buildings within 500m from the site.

www.erm.com Version: Final Project No.: 0554561 Client: Longwarry Saleyard 6 July 2020 Page 3
HEALTH RISK ASSESSMENT LONGWARRY CATTLE SALEYARD
METHODOLOGY
3. METHODOLOGY
A Health Risk Assessment (HRA) aims to quantify the potential health effects arising from exposure to, in this case, environmental factors. Risk assessments are often conducted by considering possible or theoretical community exposures predicted from air dispersion modelling or noise modelling or using environmental concentrations that have been measured in the potentially affected population. Conservative safety margins are built into a risk assessment analysis to provide increased factors of safety for protection of public health. Consideration of the most vulnerable subgroups within the population is part of the risk characterisation process.
For air quality risk assessments, the key health effects that are considered include increases in mortality and morbidity (e.g. hospital admissions for respiratory disease) which have been associated with exposure to air pollution in population based epidemiological studies. For noise, the main health effects that are considered are sleep disturbance and increases in ischaemic heart disease (enHealth, 2018). These outcomes have been considered in this HRA.
The Australian guidance for conducting HRAs is set out in the enHealth Guidelines (2012). The enHealth Guidelines – Assessing the Health Effects from Environmental Noise (2018) establishes the Australian guidance for the risk assessment.
For the assessment of health risks from air pollution, the National Health and Medical Research Council (NHMRC) Approach to Hazard Assessment for Air Quality, 2006 and the National Environment Protection Council (NEPC) Methodology for Setting Air Quality Standards in Australia, 2011 provide detailed frameworks to assess health risks associated with air pollution.
The risk assessment process detailed in the enHealth HRA Guidelines comprises five components as outlined below:
1. Issue Identification – Identifies issues that can be assessed through a risk assessment and assists in establishing a context for the risk assessment.
2. Hazard Assessment – Identifies hazards and health endpoints associated with exposure to hazardous agents and provides a review of the current understanding of the toxicity and risk relationship of the exposure of humans to the hazards.
3. Exposure Assessment – Identifies the groups of people who may be exposed to hazardous agents and quantifies the exposure concentrations.
4. Risk Characterisation – Provides the qualitative evaluation of potential risks to human health. The characterisation of risk is based on the review of concentration response relationship and the assessment of the magnitude of exposure.
5. Uncertainty Assessment – Identifies potential sources of uncertainty and qualitative discussion of the magnitude of uncertainty and expected effects on risk estimates.
This process has been followed to assess the risks to the local community from air quality (PM10), Q Fever, E Coli and noise from the operations from the proposed Saleyard at Longwarry and components 2 through 5 are presented individually for each in Section 5.

www.erm.com Version: Final Project No.: 0554561 Client: Longwarry Saleyard 6 July 2020 Page 4
HEALTH RISK ASSESSMENT LONGWARRY CATTLE SALEYARD
POPULATION PROFILE
4. POPULATION PROFILE
This section provides a profile of the local Longwarry community potentially affected by the proposed cattle Saleyard operations.
4.1 Age Profile Review of the most recent census (2016) from the Australian Bureau of Statistics indicates that Longwarry had a total population of 2,004 people in 2016. Of those, 48% were male and 52% were female. The median age of people in Longwarry was 34 years. Children aged between 0 to 14 years made up 23% of the population and people aged 65 years and over made up 13% of the population. The age group details is summarized in the Table 4-1 below:
Table 4.1 Population profile – Longwarry Census 2016
Population (Age Group) Longwarry (persons counts)
0 – 4 years 163
5 – 14 years 302
15 – 64 years 1283
Over 65 266
Source: Australian Bureau of Statistics – 2016 Census. (https://quickstats.censusdata.abs.gov.au/census_services/getproduct/census/2016/quickstat/SSC2152)
4.2 Health Profile A review of the baseline health profile (Department of Health, 2012) of the Baw Baw Shire was undertaken to assess whether there were any conditions that would make the local population more vulnerable to the pollutants under consideration in this HRA. As data was not available for Longwarry specifically, the data for the Baw Baw Shire as a whole was used to reflect the community of Longwarry. Table 4-2 summarizes the health conditions and the relevant LGA and state measures. The data is Table 4.2 indicates that the baseline health status of the Longwarry is similar to that of the rest of Victoria
Table 4.2 Health conditions reported for Baw Baw LGA.
Health Conditions LGA measure State measure
People reporting asthma 8% 11%
People reporting type 2 diabetes 4.1% 5.0%
People reporting heart disease 6.6% 6.9%
People reporting being obese 18% 17%
Cancer incidence per 100,000 population 100 101
Notifications of influenza per 1,000 population 1.6 1.1
Source: Gippsland Public Health Network: Brief Population Health Profile Gippsland Snapshot May 2016 Figure 4.1 shows the location of the nearest sensitive receptors that have been considered in this HRA. These are the nearest residential properties and represent the highest potential exposure from the contaminants of

www.erm.com Version: Final Project No.: 0554561 Client: Longwarry Saleyard 6 July 2020 Page 5
HEALTH RISK ASSESSMENT LONGWARRY CATTLE SALEYARD
POPULATION PROFILE
potential concern considered in this HRA.
Figure 4.1: Location of Sensitive Receptors

www.erm.com Version: Final Project No.: 0554561 Client: Longwarry Saleyard 6 July 2020 Page 6
HEALTH RISK ASSESSMENT LONGWARRY CATTLE SALEYARD HEALTH RISK ASSESSMENT
5. HEALTH RISK ASSESSMENT
5.1 Issues Identification During the consultation on the Works Approval Application concerns were raised by submitters about the potential health risk from dust and pathogens, such as E.Coli and Coxiella Burnetti (bacteria that causes Q Fever) in the surrounding community. This HRA has been undertaken to assess these issues and to assess the need, if any, for the implementation of potential additional management measures that may be required on the site to further reduce potential risk.
This health risk assessment addresses the potential risk to the local community from exposure to dust (as PM10), Coxiella burnetti (C Burnetti, the bacteria that causes Q Fever), EColi and Noise.
PM10 has been chosen as the indicator for health risk from particles as the main source of particles from the operations at the Saleyard is dust from the bedding, stockpiles and non-paved areas including laneways for cattle movement rather than combustion sources. Combustion sources are the main source of PM2.5 however, the operations at the proposed Saleyard do not have many combustion sources apart from vehicles. These are only a small component of the total particle emissions from the site (refer Appendix A for details). Therefore the main dust issue that may affect health for this site will be PM10.
The C burnetti and EColi pathogens are primarily attached to dust. The main source of exposure is through the inhalation of dust particles containing the bacteria. Both larger particle sizes (<100 µm in diameter – the inhalable fraction) and the smaller PM10 which are known as thoracic particles can carry the bacteria and can be inhaled. The larger particles can also be deposited on surfaces such as roofs which may lead to potential contamination of rainwater tanks. Both size fractions and exposure pathways have been considered in this HRA.
As part of the assessment of the Works Approval Application (WAA), EPA raised the question of the potential health risks from the wastewater treatment system, in particular the potential for aerosol formation during the aeration of the wastewater ponds. Subsequent to the WAA, Auld has advised ERM that the design of the wastewater treatment plant has changed and will now a fully enclosed Sequencing Batch Reactor (SBR) plant system. As such there will be no open effluent ponds on the site and no aerosol formation. On this basis, the health risk from aerosol formation has not been assessed in this HRA.
5.2 PM10
5.2.1 Hazard Assessment The health effects of particles linked to ambient exposures have been well studied and reviewed by international agencies (NEPC, 2010; USEPA, 2004, 2009, 2012; WHO, 2013, 2006; OEHHA, 2000). Most information comes from population-based epidemiological studies that find increases in daily mortality, as well as morbidity outcomes such as increases in hospital admissions and emergency room attendances, and exacerbation of asthma associated with daily changes in ambient particle levels. In recent years, there has been an increasing focus on the association between exposure to particles and cardiovascular outcomes. In addition to studies on the various size metrics for particles, recent research has also investigated the role of particle composition in the observed health effects.
Several studies conducted in Australia also show adverse effects of PM10 on mortality and morbidity outcomes (Simpson et al., 2005a, b; Barnett et al., 2005; 2006) similar to those observed in overseas studies. The effects observed in the Australian studies appear to be greater per 1 µg/m increase in PM than those observed in the US and Europe but comparable to the results of Canadian studies.
Associations have also been found with birth outcomes such as low birth weights. Reductions in lung function in children, which is a potential indicator of chronic lung disease later in life, have also been observed. These short-term health effects have been observed in many locations worldwide even in
www.erm.com Version: Final Project No.: 0554561 Client: Longwarry Saleyard 6 July 2020 Page 7
HEALTH RISK ASSESSMENT LONGWARRY CATTLE SALEYARD
HEALTH RISK ASSESSMENT
locations with relatively good air quality. The groups within the population who are most susceptible to short term exposures to PM10 include children, people older than 65 years of age, people with existing heart and lung disease, pregnant women and the foetus.
Long term health effects, arising from exposures lasting 1 year or longer, include premature deaths from respiratory disease, lung cancer and cardiovascular disease, increases in hospitalizations for respiratory and cardiovascular diseases and adverse birth outcomes. Increases in the incidence of cancer and asthma have also been linked with long-term exposure to PM10 indicating that these pollutants are involved in the causation of these diseases rather than exacerbation of existing disease. Long-term exposures have been shown to impact on healthy populations as well as people with existing disease. Short-term exposures impact primarily on people with pre-existing disease.
Recent studies have highlighted the large contribution of agriculture to fine particulate matter air pollution, and the public health impact that may result from agricultural emissions. Livestock farming is considered as a significant source of air pollution (Liu, 2020), consisting of a mixture of gases, such as ammonia (NH3) and hydrogen sulfide (H2S), and PM contaminated with microorganisms and toxins, such as endotoxins.
Endotoxin-contaminated organic dust is considered as the most important respiratory hazard within livestock activities. Endotoxins are predominantly absorbed onto coarse particulate matter such as PM10 which is able to enter the tracheobronchial and alveolar regions of the respiratory tract and associated with adverse health effects. Hazards and associated risks to bacteria-contaminated organic dusts are addressed further in Sections 5.2 and 5.3. PM10 exposure may lead to an increased morbidity and mortality from respiratory and cardiovascular diseases (Rooij et al., 2017).
PM10 concentrations can be high inside livestock operations and when emitted to the environment may lead to an increase in PM10 concentrations in ambient air around farms (Rooij et al., 2017). While Australian Air Quality Standard establishes a concentration of 50 µg/m³ averaged over a 24-hour period for particles as PM10, a study found ambient PM10 levels ranging from 9.6 to 54.0 µg/m3 (week-average values) with a median PM10 level of 18.9 mg/m3 obtained from air monitoring stations located around low and high farm density areas in the Netherlands. Furthermore, this study suggested that air pollutant emissions from livestock farms are associated with a reduced lung function level in non-farming residents of a rural area (Borlee et al., 2017). Health effects associated with wheezing and difficulty in breathing, and lower lung function with increased livestock exposures in residents near farms were also reported by Schulze et al., 2011.
Sources of primary particles in livestock farm operations include feed, bedding material, the animals themselves and their faeces. Among others processes and activities, animal activities may cause dust deposited on surface to become airborne and be emitted to the outside air. Weather conditions also play an important role in the contribution of PM emissions such as humidity, temperature and wind speed (Papanastasiou et al., 2011).
5.2.2 Exposure Assessment Annual average and 24-hour PM10 has been modelled to inform this HRA. Appendix A presents the air quality modelling that was undertaken to generate data for this HRA. Figure 5.1 shows the 24 hour averages for the sensitive receptors in the surrounding area. It should be noted that the air dispersion modelling did not take into account the roof of the Saleyard, the noise walls and vegetation screening. These would all act as barriers to dust leaving the site meaning that the actual levels of dust would be lower than those predicted in the air dispersion modelling.

www.erm.com Version: Final Project No.: 0554561 Client: Longwarry Saleyard 6 July 2020 Page 8
HEALTH RISK ASSESSMENT LONGWARRY CATTLE SALEYARD
HEALTH RISK ASSESSMENT
Figure 5.1: 24-hour Average PM10 from All Sources at Sensitive Receptors The data in Figure 5.1 shows that the most affected receptors are R4, R5, R7, R13 and R14 as shown in Figure 4.1. The PM10 data shown in Figure 5.1 has been used to calculate the risk of adverse health outcomes associated with exposure to PM10 from all sources at the proposed Saleyard. This includes the laneways where cattle moved to and from the pens, the stockpiles and soft flooring as well as vehicle movements to and from the site.
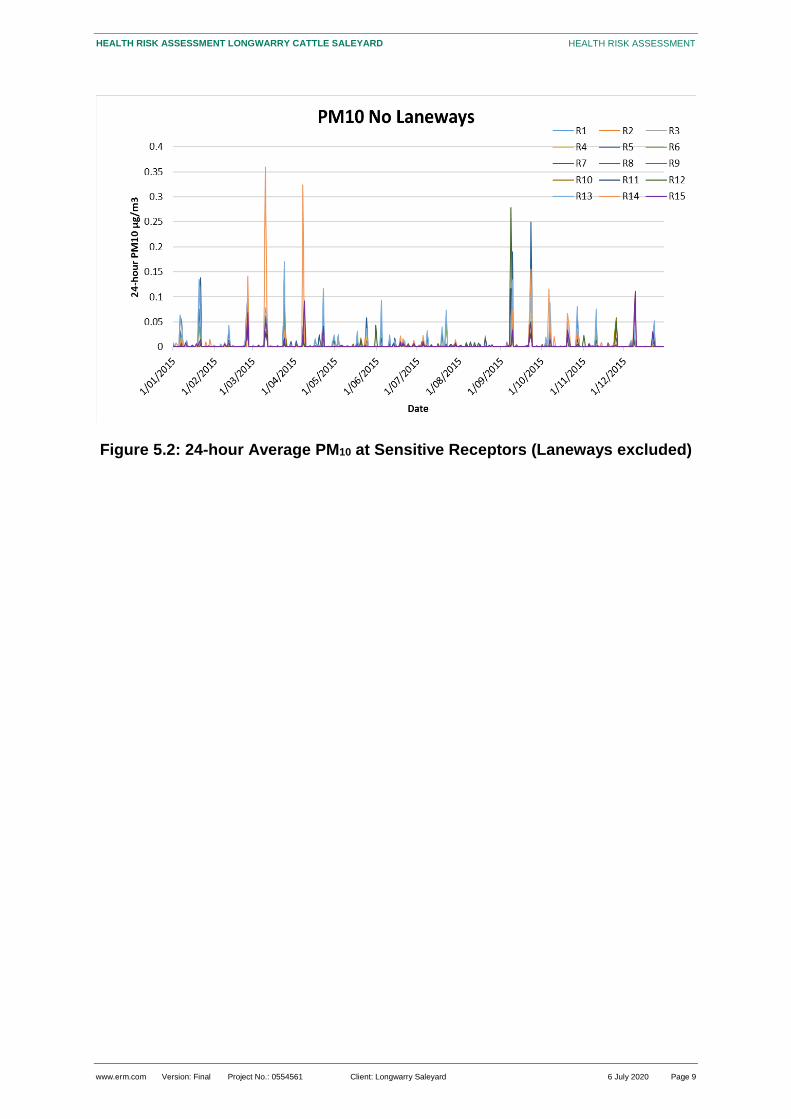
Figure 5.2 shows the 24-hour PM10 concentrations for each sensitive receptor for all sources except the laneways where the cattle are moved. These predicted concentrations provide an estimate of the PM10 that are likely to contain the highest concentrations of pathogens such as EColi and the bacteria that causes Q Fever, Coxiella burnetii (C.Burnetti). The data shown in Figure 5.2 has been used to calculate the risk from exposure to PM10 from these sources.
The levels of PM10 as shown in Figure 5.2 are much lower than those shown in Figure 5.1. The maximum concentration without dust from the laneways included (Figure 3) is approximately 7 times lower than when the laneways are included (Figure 5.1). The most affected receptors with emissions from the laneways excluded are R4, R7, R12, R13 and R14 as shown in Figure 4.1.
www.erm.com Version: Final Project No.: 0554561 Client: Longwarry Saleyard 6 July 2020 Page 9
HEALTH RISK ASSESSMENT LONGWARRY CATTLE SALEYARD
HEALTH RISK ASSESSMENT
Figure 5.2: 24-hour Average PM10 at Sensitive Receptors (Laneways excluded)
www.erm.com Version: Final Project No.: 0554561 Client: Longwarry Saleyard 6 July 2020 Page 10
HEALTH RISK ASSESSMENT LONGWARRY CATTLE SALEYARD
HEALTH RISK ASSESSMENT
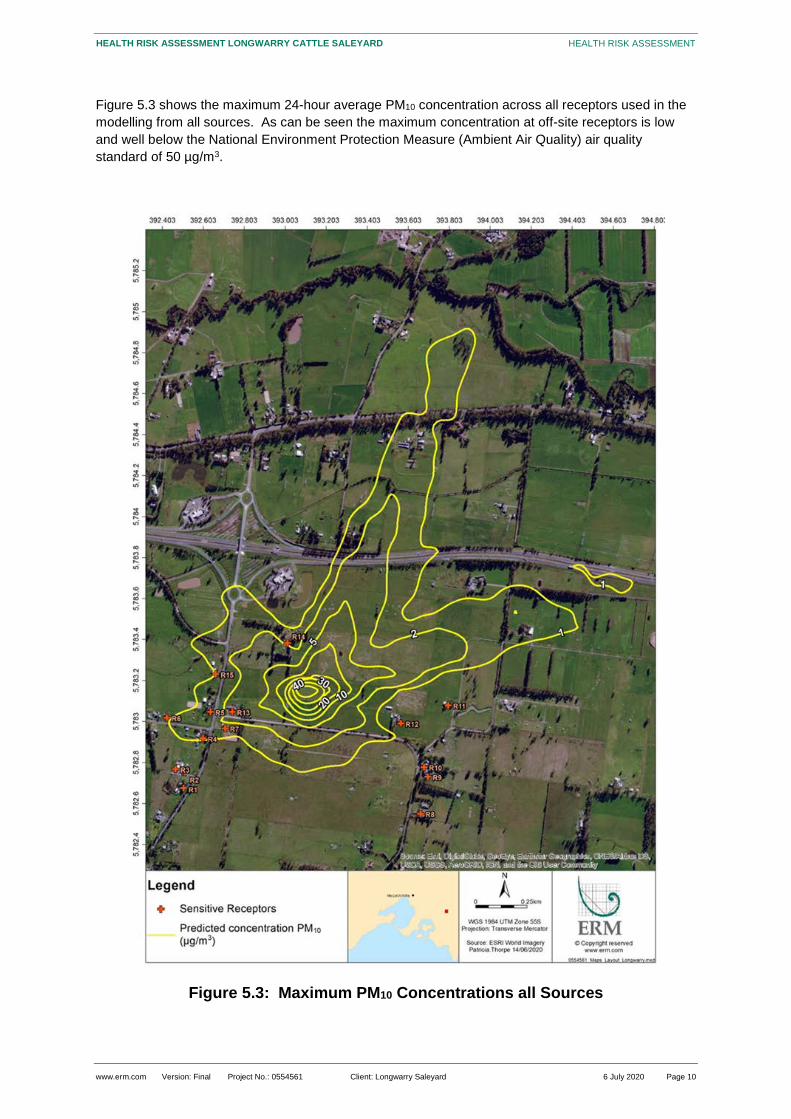
Figure 5.3 shows the maximum 24-hour average PM10 concentration across all receptors used in the modelling from all sources. As can be seen the maximum concentration at off-site receptors is low and well below the National Environment Protection Measure (Ambient Air Quality) air quality standard of 50 µg/m3.
Figure 5.3: Maximum PM10 Concentrations all Sources

www.erm.com Version: Final Project No.: 0554561 Client: Longwarry Saleyard 6 July 2020 Page 11
HEALTH RISK ASSESSMENT LONGWARRY CATTLE SALEYARD
HEALTH RISK ASSESSMENT
5.2.3 Risk Characterisation The results of epidemiological studies have shown that a wide range of health effects are associated with exposure to PM10. Australian studies (NEPC, 2012; EPHC 2006) have found associations between PM10 levels currently experienced in Australian cities and the following health outcomes:
Increases in daily mortality;
Hospital Admissions;
- Respiratory disease;
- Cardiovascular disease;
- Cardiac disease;
- Pneumonia and bronchitis; and
Emergency room attendances asthma.
These health outcomes have been assessed in this health risk assessment for the relevant age groups.
Although no studies investigating the long term effects of exposure to PM10 on health have been conducted in Australia, there have been several international studies that have shown strong associations between long-term exposure to PM10 and increases in mortality. On the basis of the findings of these international studies, long-term mortality has also been assessed.
There are several groups within the general population that have been identified as being more vulnerable to the effects of air pollution. These include:
Elderly;
People with existing cardiovascular and respiratory disease;
People with asthma;
Low socio-economic groups; and
Children.
Compared to healthy adults, children are generally more sensitive to air pollutants as their exposure is generally higher. The reasons for this are that children inhale more air per minute and have a larger contact lung surface area relative to their size compared to adults. Other factors that increase the potential for exposure in children are that children generally spend more time outdoors and more time exercising.
Recent studies have shown that people who have a low socioeconomic status (SES) also form a group within the population that is particularly vulnerable to the effects of air pollution. This is largely due to the fact that people within these groups usually have poorer health status than people within higher SES groups. They may also have poorer access to medical care. In addition, they usually live in areas that are more polluted (e.g., near major roads or near industry) as property is generally cheaper in these areas.
To calculate the number of people that might be impacted by air pollution exposure-response functions for each outcome being assessed are required. These functions are a measure of the change in the health outcome within the population for a given change in PM10 or PM2.5 concentration.
The exposure-response functions in Table 5.1 have been taken from Australian studies and in particular two multicity meta-analyses (Simpson et al., 2005; EPHC, 2011). The use of Australian meta-analyses is consistent with the NHMRC (2006) and NEPC (2011) recommendations for selecting exposure response functions for risk assessments for air pollution.

www.erm.com Version: Final Project No.: 0554561 Client: Longwarry Saleyard 6 July 2020 Page 12
HEALTH RISK ASSESSMENT LONGWARRY CATTLE SALEYARD
HEALTH RISK ASSESSMENT
The exposure-response functions for long-term exposure to PM10 and PM2.5 have been taken from the American Cancer Society study (HEI, 2009). This study is considered by the WHO as the most reliable study to assess long-term effects of air pollution. The use of this value is also consistent with the recommendations made by NHMRC (2006) and NEPC (2011).
Table 5.1 Exposure Response Functions for PM10 Selected Health Outcomes (Taken from EPHC, 2011; HEI, 2009)
Outcome Averaging Period
Exposure Response Function per 1 µg/m3 increase in PM10
Annual all-cause mortality (non-accidental) 30+ years
Annual Average 0.004
Daily all-cause mortality(non-accidental) - all ages
24 hours 0.002
Daily mortality cardiovascular disease - all ages
24 hours 0.002
Hospital Admissions respiratory disease 65+ years
24 hours 0.003
Hospital Admissions cardiac disease 65+ years
24 hours 0.002
Hospital Admissions respiratory disease 15-64 years
24 hours 0.003
ED Visits Asthma 1-14 years
24 hours 0.015
Using the predicted annual average and 24 hour average PM10 concentrations for the sensitive receptors from the air dispersion modelling done as part of the air quality modelling and the exposure response function in Table 5.1, the health effects attributable to PM10 have been calculated using the following equation:
∆y= Δx.(RR-1).yo
Where ∆y = change in risk, Δx = change in pollutant concentration, RR = relative risk, RR-1 = exposure response function, yo = baseline health incidence.
The baseline health statistics for Melbourne were used in this assessment as baseline health data for the local area wasn’t available. The increase in risk attributable to PM10 from all sources from the Saleyard operations is shown in Table 5.2. For the risk characterisation, these risk levels were compared acceptable risk levels established by enHealth (2012) and international agencies such as WHO and US EPA of 1x10⁻⁵.

www.erm.com Version: Final Project No.: 0554561 Client: Longwarry Saleyard 6 July 2020 Page 13
HEALTH RISK ASSESSMENT LONGWARRY CATTLE SALEYARD
HEALTH RISK ASSESSMENT
Table 5.2 Predicted increase in Risk Attributable to PM10 from Saleyard Operations (all sources)
RECEPTOR Annual
Mortality 30+ years
Daily Mortality all causes - all ages
Daily Mortality Cardiovascular Disease -all ages
Hospital Admissions Respiratory Disease 65+ years
Hospital Admissions Cardiac Disease 65+ years
Hospital Admissions Respiratory Disease 15-64 years
Emergency Department Visits 0-14 years
R1 3x10⁻⁷ 9x10⁻⁸ 3x10⁻⁸ 1x10⁻⁶ 1x10⁻⁶ 2x10⁻⁷ 1x10⁻⁷
R2 3x10⁻⁷ 1x10⁻⁷ 3x10⁻⁸ 1x10⁻⁶ 1x10⁻⁶ 2x10⁻⁷ 1x10⁻⁷
R3 1x10⁻⁷ 9x10⁻⁸ 3x10⁻⁸ 1x10⁻⁶ 1x10⁻⁶ 2x10⁻⁷ 1x10⁻⁷
R4 8x10⁻⁷ 2x10⁻⁷ 7x10⁻⁸ 3x10⁻⁶ 3x10⁻⁶ 6x10⁻⁷ 3x10⁻⁷
R5 1x10⁻⁶ 4x10⁻⁷ 1x10⁻⁷ 5x10⁻⁶ 5x10⁻⁶ 1x10⁻⁶ 6x10⁻⁷
R6 8x10⁻⁷ 2x10⁻⁷ 7x10⁻⁸ 3x10⁻⁶ 3x10⁻⁶ 6x10⁻⁷ 3x10⁻⁷
R7 1x10⁻⁶ 4x10⁻⁷ 1x10⁻⁷ 5x10⁻⁶ 5x10⁻⁶ 10x10-7 6x10⁻⁷
R8 3x10⁻⁷ 8x10⁻⁸ 2x10⁻⁸ 10x10-7 9x10⁻⁷ 2x10⁻⁷ 1x10⁻⁷
R9 3x10⁻⁷ 1x10⁻⁷ 3x10⁻⁸ 1x10⁻⁶ 1x10⁻⁶ 2x10⁻⁷ 1x10⁻⁷
R10 4x10⁻⁷ 1x10⁻⁷ 4x10⁻⁸ 1x10⁻⁶ 1x10⁻⁶ 3x10⁻⁷ 2x10⁻⁷
R11 3x10⁻⁷ 1x10⁻⁷ 3x10⁻⁸ 1x10⁻⁶ 1x10⁻⁶ 2x10⁻⁷ 1x10⁻⁷
R12 7x10⁻⁷ 2x10⁻⁷ 7x10⁻⁸ 3x10⁻⁶ 2x10⁻⁶ 5x10⁻⁷ 3x10⁻⁷
R13 2x10⁻⁶ 7x10⁻⁷ 2x10⁻⁷ 8x10⁻⁶ 8x10⁻⁶ 2x10⁻⁶ 9x10⁻⁷
R14 1x10⁻⁶ 5x10⁻⁷ 1x10⁻⁷ 6x10⁻⁶ 5x10⁻⁶ 1x10⁻⁶ 6x10⁻⁷
R15 8x10⁻⁷ 2x10⁻⁷ 8x10⁻⁸ 3x10⁻⁶ 3x10⁻⁶ 6x10⁻⁷ 3x10⁻⁷
As can be seen from Table 5.2 the increased risk from PM10 from operations are below the acceptable risk levels established by enHealth (2012) and international agencies such as WHO and US EPA of 1x10⁻⁵.
The highest risk attributable to PM10 from the proposed Saleyard operations is for hospital admissions for respiratory and cardiac diseases in people over 65 years of age. Predicted risks for other health outcomes are lower than that predicted for hospital admissions. The risks in Table 5.2 show an increase of between 3x10⁻⁸ and 6x10⁻⁶ in the health outcomes assessed for this HRA associated with PM10 arising from the proposed operations at the Saleyard.
Table 5.3 shows the attributable risk from PM10 from the proposed operations excluding the laneway emissions.

www.erm.com Version: Final Project No.: 0554561 Client: Longwarry Saleyard 6 July 2020 Page 14
HEALTH RISK ASSESSMENT LONGWARRY CATTLE SALEYARD
HEALTH RISK ASSESSMENT
Table 5.3 Predicted increase in Risk Attributable to PM10 from Saleyard Operations (no laneways)
RECEPTOR Annual Mortality 30+ years
Daily Mortality all causes - all ages
Daily Mortality Cardiovascular Disease - all ages
Hospital Admissions Respiratory Disease 65+ years
Hospital Admissions Cardiac Disease 65+ years
Hospital Admissions Respiratory Disease 15-64 years
Emergency Department Visits 0-14 years
R1 3x10⁻⁸ 1x10⁻⁸ 3x10⁻⁹ 1x10⁻⁷ 1x10⁻⁷ 2x10⁻⁸ 1x10⁻⁸
R2 4x10⁻⁸ 1x10⁻⁸ 4x10⁻⁹ 1x10⁻⁷ 1x10⁻⁷ 3x10⁻⁸ 2x10⁻⁸
R3 2x10⁻⁸ 1x10⁻⁸ 4x10⁻⁹ 2x10⁻⁷ 2x10⁻⁷ 3x10⁻⁸ 2x10⁻⁸
R4 1x10⁻⁷ 3x10⁻⁸ 1x10⁻⁸ 4x10⁻⁷ 4x10⁻⁷ 8x10⁻⁸ 4x10⁻⁸
R5 2x10⁻⁷ 5x10⁻⁸ 1x10⁻⁸ 6x10⁻⁷ 5x10⁻⁷ 1x10⁻⁷ 6x10⁻⁸
R6 9x10⁻⁸ 3x10⁻⁸ 8x10⁻⁹ 3x10⁻⁷ 3x10⁻⁷ 6x10⁻⁸ 4x10⁻⁸
R7 2x10⁻⁷ 6x10⁻⁸ 2x10⁻⁸ 7x10⁻⁷ 6x10⁻⁷ 1x10⁻⁷ 7x10⁻⁸
R8 3x10⁻⁸ 10x10-9 3x10⁻⁹ 1x10⁻⁷ 1x10⁻⁷ 2x10⁻⁸ 1x10⁻⁸
R9 4x10⁻⁸ 1x10⁻⁸ 4x10⁻⁹ 2x10⁻⁷ 1x10⁻⁷ 3x10⁻⁸ 2x10⁻⁸
R10 5x10⁻⁸ 2x10⁻⁸ 5x10⁻⁹ 2x10⁻⁷ 2x10⁻⁷ 4x10⁻⁸ 2x10⁻⁸
R11 5x10⁻⁸ 1x10⁻⁸ 4x10⁻⁹ 2x10⁻⁷ 2x10⁻⁷ 3x10⁻⁸ 2x10⁻⁸
R12 1x10⁻⁷ 3x10⁻⁸ 1x10⁻⁸ 4x10⁻⁷ 4x10⁻⁷ 8x10⁻⁸ 4x10⁻⁸
R13 2x10⁻⁷ 8x10⁻⁸ 2x10⁻⁸ 9x10⁻⁷ 9x10⁻⁷ 2x10⁻⁷ 1x10⁻⁷
R14 2x10⁻⁷ 7x10⁻⁸ 2x10⁻⁸ 8x10⁻⁷ 7x10⁻⁷ 2x10⁻⁷ 9x10⁻⁸
R15 9x10⁻⁸ 3x10⁻⁸ 9x10⁻⁹ 3x10⁻⁷ 3x10⁻⁷ 7x10⁻⁸ 4x10⁻⁸
The results shown in Table 5.3 show that the increased risk from PM10 from operations, excluding laneway emissions, are much lower than those attributable to PM10 from all sources. The highest risk attributable to PM10 are again for hospital admissions for respiratory and cardiac diseases in people over 65 years of age. Predicted risks for other health outcomes are lower than that predicted for hospital admissions. The risks in Table 5.3 show an increase of between 3x10⁻⁹ and 9x10⁻⁷ in the health outcomes assessed for this HRA associated with PM10 arising from the proposed operations at the Saleyard. These risk levels are below the acceptable risk levels established by enHealth (2012) and international agencies such as WHO and US EPA of 1x10⁻⁵.
5.2.4 Conclusion The air modelling that has been conducted to inform this HRA (Appendix A) has predicted that the PM10 concentrations arising from the proposed Saleyard operations are low and well below national air quality standards as shown in Figures 2 and 3. The risk to the health of the surrounding population from the predicted PM10 concentrations are low and within the acceptable risk criteria adopted by enHealth and international agencies such as WHO and US EPA.
www.erm.com Version: Final Project No.: 0554561 Client: Longwarry Saleyard 6 July 2020 Page 15
HEALTH RISK ASSESSMENT LONGWARRY CATTLE SALEYARD
HEALTH RISK ASSESSMENT
5.3 E.Coli and Salmonella
5.3.1 Hazard Assessment
5.3.1.1 E.Coli Escherichia coli (E. coli) are a large and diverse group of bacteria that is commonly found in the gut of humans and warm-blooded animals. Although most of E. coli are harmless some are pathogenic and can cause illnesses like diarrhoea, urinary tract infections, pneumonia and other clinical disease. The serotype of E. coli that is linked to cattle is E. coli O157, which is naturally found in the intestine of the animal, hence not pathogenic in animals, but can cause human illness. Along with other livestock animals such as goats and sheep, cattle is one of the major reservoirs of E. coli O157.
Transmission to humans primarily occurs through consumption of contaminated food such as raw or undercooked ground meat products, raw milk, raw vegetables and contaminated water. E. coli O157 can also be transmitted from both direct animal contact and from one person to another. Symptoms of E.coli O157 infection include mild to severe illness and life-threatening. Children and elderly people have been identified among the most vulnerable group to acquire severe symptoms and complications, such as hemolytic uremic syndrome (HUS), which is a type of kidney failure as a result of E. coli O157 infection. For instance, an outbreak that occurred in Pennsylvania in 2001, registered 16% of the 51 cases, primarily among children, with HUS involving kidney failure after contact with infected cattle (CDC, 2011).
Human infection with E coli O157 have been reported from over 30 countries with annual diagnosed cases of eight per 100,000 population, with some regions presenting higher rate (SRP, 2011). A study conducted by Heiman et al. (2015) identified 390 outbreaks of E. coli O157 (associated with Shiga toxin-producing bacterium) in the period of 2003 and 2012 in the United Stated, involving nearly 5,000 illnesses, over 1,200 hospitalizations, and about 30 deaths. Many sources were associated with those outbreaks, mores specifically, 65% (255 outbreaks) were by food, followed by 10% by person to person contact (39 outbreaks) and 10% indirect or direct contact with animals (39 outbreaks), 15% through water (15 outbreaks), and with 11% of those had another or unknown mode of transmission (42 outbreaks). A summary of the E. coli O157 outbreaks by transmission in the United Stated (2003-2012) is summarized below:
Of the 255 foodborne disease outbreak reported, 16 were associated with dairy. Of those, over 80% (13 cases) were related to unpasteurized milk.
Of the 39 outbreaks transmitted by animal contact, 24 reported contact with a least one animal type including cattle (15), goats (12) and sheep (8).
Of the 15 waterborne disease outbreaks, 10 were linked to recreational water (3 treated, 7 untreated), 3 to drinking water, 1 possibly to wastewater, 1 unknown source.
The major source of foodborne E. coli outbreaks is associated with food contamination by the pathogens present in the animal faeces. Many factors likely contributed to the contamination cycle in the food-producing animals, such as ingestion of contaminated feeds and water by cattle, contamination of equipment and personnel, airborne spread and survival in environment. Cattle water troughs are considered reservoirs of E. coli O157:H7. Studies demonstrated that the pathogenic bacteria can survive in water trough sediments for at least 4 months with higher rate of reproduction in warmer weather conditions.

www.erm.com Version: Final Project No.: 0554561 Client: Longwarry Saleyard 6 July 2020 Page 16
HEALTH RISK ASSESSMENT LONGWARRY CATTLE SALEYARD
HEALTH RISK ASSESSMENT
Similar to water contamination, feed can also be contaminated by the animal saliva and be a source of E. coli O157:H7 to cattle. As cattle are ruminants they return rumen contents to their mouths to be chewed again and further digested and this may be the most probable source of these pathogen in the animals’ mouths. As such, implementation of management measures that minimize the faecal – oral spread play an important role in preventing the E. coli contamination in livestock. Vaccines are available and appears to reduce the shedding of the pathogen in cattle. Furthermore, studies have demonstrated that breaking down the bacteria cycle through implementation of both pre- and post-harvest measures is a successful strategy to prevent spread of the E. coli in cattle farms (Soon et al., 2011).
Environmental persistence of E. coli O157 has been reported in many outbreaks. In a 2001 Ohio outbreak at a fair facility where farm animals were exhibited during the previous week E. coli was still recovered from multiple environmental sources (including sawdust on the floor and dust on the rafters) fourteen and forty-two weeks after the fair. A total of 23 people acquired E. coli infection. In addition, persistence of this pathogen was also reported in a 2003 outbreak from an agricultural fair in Texas with a total of 25 people infected. E coli was recovered in fair environmental samples over 45 days after the fair lasted (CDC, 2011).
Due to their persistence in the environment, E. coli can be found in water supplies and may make the water unsuitable for drinking and/or bathing. For instance, pollution of rainwater by microorganism pathogens has raised concerns, especially because, in Australia, there has been an increase in the use of roof-harvested rain water as an alternative water source for potable and non-potable uses.
The presence of E.coli in water tanks generally indicates faecal contamination and the possible presence of pathogenic microorganisms. The Australian Drinking Water Guidelines state that no E. coli should be present in any 100mL water sample.
Public health risks associated with pathogens in rainwater tanks have been evaluated by a number of studies. In Queensland, a study involving the quantification of microorganisms of faecal origin in rainwater found that from a total of 100 rainwater tank samples tested 58% were found positive for E. coli strains with results ranging from <1 to 3060 ± 456 CFU 100 mL. None of these samples were positive for E. coli O157 (for 4 genes testes) (Ahmed et al., 2010). Likewise, research conducted by a scientific collaboration between the Queensland Government, CSIRO, The University of Queensland and Griffith University (2012) found that 70% of a total of 80 rainwater tanks detected faecal indicator bacteria including E. coli strains. The research associated the high numbers of E coli detected in rainwater tanks to animal faecal matter. Of the positive samples for E coli, 54% were linked to faeces from birds and possums. The remaining sources were not determined and no contribution from cattle was reported.
Similarly, a study investigating the rainwater quality in South Australia found the prevalence of E. coli in over 30% of the 974 samples analysed. The counts of E coli ranged from 0 to 2400. Of those, 33.5% had counts of 1 E. coli per 100 mL, 29.6% had counts of >1 – 10 E. coli per 100 mL, while 36.9% had levels of >10 E. coli per 100mL. Of the E. coli positive samples tested from rainwater over 15% were positive for one or more virulence genes (pathogenic genes). In addition, highest bacterial contamination during winter conditions and an increase in microbial levels following a rainfall event were highlighted in the research (Rodrigo et al., 2009). When comparing with international studies, higher levels of E. coli were obtained in a study conducted in New Zealand in which 36% of the rainwater tank samples had counts of up to 10 E. coli per 100 mL, while 64% had levels of >10 E. coli per 100mL. A total of 560 roof-collected rainwater tank samples were analysed (Abbott et al., 2007).
It is noted that faecal matter containing pathogens can be also carried with dust and windstorms and be deposited on rainwater catchment systems and components (e.g. the rooftops). In this context, excretion of E. coli O157:H7 by cattle potentially represents a potential source of contamination of rainwater tanks.

www.erm.com Version: Final Project No.: 0554561 Client: Longwarry Saleyard 6 July 2020 Page 17
HEALTH RISK ASSESSMENT LONGWARRY CATTLE SALEYARD
HEALTH RISK ASSESSMENT
5.3.1.2 Salmonella Occurrence of Salmonella in cattle manure has been reported in the literature (Semenov et al., 2009, Chen et al., 2019). This pathogen sheds in cattle faeces and can be transmitted through contaminated water, grass and soil. Infected cattle have been reported to excrete Salmonella and E. coli O157:H7 at a rate of 103–107 colony forming unit (CFU) per gram faeces. Salmonella can persist in manure slurries and in soil for over 8 months (Nyberg et al., 2018), with higher prevalence and levels of Salmonella reported at surface samples of manure piles than subsurface samples (Semenov et al., 2009). Implementation of proper management practices for handling and storage of manure can significantly reduce the amount of human pathogens, such as Salmonella (Strom el al., 2018).
Salmonellosis commonly presents as an acute gastroenteritis with fever, vomiting, nausea, abdominal pain, headache and diarrhoea. Dehydration may occur, especially among infants and the elderly. Infection may also present as septicaemia, and occasionally may be localised in other body tissues, resulting in endocarditis (inflammation of the internal lining of the heart and heart valves), pneumonia, septic arthritis, cholecystitis (inflammation of the gall bladder) and abscesses. Symptoms usually last 3–5 days.
The majority of Salmonella outbreaks are related to food contamination. Environmental outbreaks non-food related are less common and mainly due to contamination of water supplies through animal faeces. A number of studies have investigated the link between Salmonella outbreaks and proximity to livestock farms including cattle farms. A study by Graziani et al., (2015) found no relation between an outbreak of Salmonella (due to the Salmonella serovar Napoli) and proximity to livestock farms. The risk of S. Napoli infection was not associated with the number of livestock farms in the municipality of residence. This held true regardless of the species reared. The only exception was a weak inverse association between the risk of infection and the number of dairy-cattle farms (OR = 0.99, 95%CI = 0.99–1.00).
A study by Funke et al (2017) investigated the association between Salmonella serovar Dublin and cattle farms in Denmark. The authors geocoded residential and cattle farm addresses and mapped their incidence by region, province and municipality. They used linear correlation and spatial autocorrelation analysis at the municipality level and calculated the direct network distance from the nearest farm to the residential address of cases and 20,000 randomly selected citizens representing the background population. The results of the study found no correlation between Salmonella outbreaks in the community from the serovar Dublin and distance to cattle farms.
5.3.2 Exposure Assessment The main potential source of E.Coli and Salmonella from the Saleyard operations is from the solids removed from the effluent treatment systems and soft flooring from the cattle pavilion. The soft flooring of the cattle pavilion will contain faeces from the cattle. According to the “Water Cycle and Waste Management” report (Premise, 2019), solid wastes generally generated from the Longwarry Saleyards operations are summarize in Table 5-4 below:

www.erm.com Version: Final Project No.: 0554561 Client: Longwarry Saleyard 6 July 2020 Page 18
HEALTH RISK ASSESSMENT LONGWARRY CATTLE SALEYARD
HEALTH RISK ASSESSMENT
Table 5.4 Solid waste, estimated quantity and disposal
Solid Waste Estimated Quantity Disposal
Solids removed from the effluent treatment system (manure and organic matter from the solids separation system)
1.5 – 2 m3/day Offsite – Licensed waste facility
or composting facility.
General waste and refuse One small skip bin a
week Offsite –Licensed waste facility.
Stock mortalities Not mentioned Offsite – Licensed waste facility.
Soft floor (woodchip/sawdust or similar) from the cattle pavilion when replaced
Typically removed in rows. One run of pens
would be approximately 140 m3 soft floor
Offsite – Licensed waste facility or composting facility.
Source: Water Cycle and Waste Management report (Premise, 2019).
According to Premise (2019), solid organic waste will not be used on site and disposal will be a licensed waste facility or composting facility. Solids removed from the solids separation system, soft floor material and solids from the SBR plant will be temporarily stockpiled on a sealed pad, within a controlled drainage area, with runoff draining back to the separation system collection sump. The stockpiling area (a minimum area of 670 m2) will be uncovered to allow the solids to dry and when dried the material will be disposal off site.
The estimated waste solid volume of 112 m3 removed from the solids separation system would be stockpiled for up to 8 weeks prior to offsite disposal. Solids removed from the SBR plant (if required); and soft floor material would remain on the stockpile area for up to 4 weeks. It is noted by Premise (2019) that these timing was indicative and based on operational experience from other sites.
Based on the information contained in Premise (2019) the main source of potential off-site community exposure is from the dust from the flooring of the cattle pavilion and the waste stockpiles.
As discussed above the main exposure pathway for E.Coli is from aerosol and dust. The bacteria is associated with larger dust particles (inhalable fraction < 100µm). To enable of the assessment of risk of E.Coli in the surrounding community from the operations at the proposed Saleyard, air dispersion modelling was conducted to predict the concentration of total suspended particles (TSP) and PM10. TSP was modelled for particles <30 µm based on site specific measurements take at the Mortlake Saleyard (see Appendix A for details on the dispersion modelling).
TSP was modelled for ambient concentrations as well as dust deposition. Dust deposition is important as it represents the potential exposure pathway for contamination of rainwater tanks via deposition onto roofs that can then be washed into the rainwater tank during rainfall. Figure 5.4 shows that maximum monthly deposition of TSP from all modelled sources of dust from the proposed Saleyard operations. This includes the dust from the laneways where cattle are moved.

www.erm.com Version: Final Project No.: 0554561 Client: Longwarry Saleyard 6 July 2020 Page 19
HEALTH RISK ASSESSMENT LONGWARRY CATTLE SALEYARD
HEALTH RISK ASSESSMENT
Figure 5.4: Maximum Monthly TSP Deposition from All Sources As can be seen from Figure 5.4, the deposition of dust from all sources from the Saleyard operations is low with the maximum concentration being less than 0.01 g/month at all sensitive receptors considered in this assessment.
Figure 5.5 shows the maximum monthly deposition from all sources minus the laneways. This includes the soft flooring and waste stockpiles which are the major potential sources of E.Coli and Salmonella at the Saleyard and assume that all waste products including urine and faeces will be collected as part of these materials and will be stored in the stockpiles.

www.erm.com Version: Final Project No.: 0554561 Client: Longwarry Saleyard 6 July 2020 Page 20
HEALTH RISK ASSESSMENT LONGWARRY CATTLE SALEYARD
HEALTH RISK ASSESSMENT
Figure 5.5: Maximum Monthly TSP Deposition minus Laneways From Figure 5.5 it is clear that all deposition greater than 0.01 g/m2/month (10 milligrams/m2/month) is contained on the proposed site of the Saleyard. All modelled deposition at sensitive receptors will be less than this.

www.erm.com Version: Final Project No.: 0554561 Client: Longwarry Saleyard 6 July 2020 Page 21
HEALTH RISK ASSESSMENT LONGWARRY CATTLE SALEYARD
HEALTH RISK ASSESSMENT
The data in Figure 5.2 shows the 24-hour PM10 concentrations from the stockpiles and the soft flooring at the cattle pavilion. The data shows that the PM10 levels are low at all receptors. The PM10 shown in Figure 5.2 has been used to evaluate the risk of E.Coli transmission via inhalation in the following section.
5.3.3 Risk Characterisation As discussed in Section 5.2.2, the main source of potential exposure of the community to E.Coli and Salmonella is through aerosols and the dust from the stockpiles on site and soft flooring of the cattle pavilion. The exposure pathways include inhalation and deposition onto roofs where any contaminated dust can be washed into rainwater tanks. In assessing the potential risk to the local community via these exposure pathways the survival of these bacteria in the air environment needs to considered.
There have been a number of studies that have shown that microorganisms, such as E.Coli and Salmonella, transmitted in the air undergo physical and biological decay. The physical decay largely depends on their size, and the biological decay is mainly determined by environmental factors, such as humidity, temperature, radiation, and toxic gases. A study by Wathes et al (1986) found that E.Coli does not survive as an aerosol for a significant period of time. There was a rapid death within 1 min with an exponential death following. At low humidities (<50%) the half-life of E.Coli in aerosols was 30 mins at 15oC and 3 mins at 30oC. At higher humidity the half-life was 83 mins at 15oC and 14 mins at 30oC. This indicates that the survival of E.Coli in air is low and therefore the potential exposure and subsequent risk through inhalation is also low.
The main dust generating activities on site excluding the laneways are:
Turning or removal of the waste stockpiles. Turning of the waste stockpiles will be undertaken on an as-needs basis and removal from site is likely to occur every 3-4 weeks.
Turning of the soft floor which will occur after every sale, as an odour management measure to move the urine and manure through the soft floor material. Turning will only occur to areas disturbed by the sale.
These are the activities that are most likely to generate dust containing E.Coli and Salmonella. From figure 5.2 the maximum concentration of PM10 at any of the off-site sensitive receptors from these sources is predicted to be 0.36 µg/m3 and the maximum annual average is 0.007 µg/m3. These concentrations are low compared to NEPM standard and below existing air quality standards of 50 µg/m3 24 hour average and 20 µg/m3 annual average. Given these low predicted concentrations of PM10 and the low survival rate of E.Coli in the air environment, the risk to the health of the local community from inhalation of E.Coli contaminated dust from the proposed Saleyard operations is considered negligible.
The other source of potential exposure of the local community to E.Coli and Salmonella from the proposed Saleyard operations is the deposition of contaminated dust onto roofs that can be washed into rainwater tanks that might be used as a source of drinking water. As discussed in Section 5.2.1.1 the presence of E.Coli in water obtained from rainwater tanks is common and it thought to be due to a range of sources including:
Faeces from birds, possums, reptiles and other animals that is deposited directly onto the roof or in gutters that provide water into the tank;
The presence of dead animals or reptiles that have entered the tank; and
Underground tanks where contaminated soil and water run-off can enter the tank if not properly sealed.
www.erm.com Version: Final Project No.: 0554561 Client: Longwarry Saleyard 6 July 2020 Page 22
HEALTH RISK ASSESSMENT LONGWARRY CATTLE SALEYARD
HEALTH RISK ASSESSMENT
Entry by small animals and birds to rainwater tanks can lead to direct faecal contamination, even if the animals escape from the tank (enHealth, 2010). In some cases, animals become trapped in tanks and drown, leading to higher levels of contamination. In the case of larger animals, such as possums and cats, this will almost certainly have a distinctive impact on the taste and odour of the water.
The main source of potential contamination of the rainwater tanks from the operations at the proposed Saleyard is from the deposition of contaminated dust onto roofs and into gutters that can be washed into the tank when it rains. The dust deposition from the stockpiles and soft floor management was modelled and is shown in Figure 5.5. It can be seen from Figure 5.5 that the dust deposition greater than 0.01 g/m2/month is confined within the site boundary. The maximum monthly dust deposition obtained from the dispersion modelling at any sensitive receptor was 0.0006 g/m2/month or 0.6 mg/m2/month. The maximum deposition over a 12 month period is 0.003 g/m2 or 3 mg/m2. Even if all the dust deposited contained E.Coli the low levels of dust deposited would deposit negligible amounts of E.Coli onto roofs which would be further diluted when washed into the rainwater tank. The low survival rate of E.Coli on dust would further minimise the risk from this source.
The potential exposure from Salmonella contaminated dust is also minimal. As with E.Coli, the dust deposition levels predicted at sensitive receptors is negligible. There is very little information in the literature about Salmonella risk from cattle farms. Although Salmonella has been identified in cattle manure, there were no studies identified that found an association between proximity to cattle farms and community Salmonella outbreaks. Given the low dust deposition rates at sensitive receptors the potential risk from exposure to Salmonella is considered to be minimal.
5.3.4 Conclusion The potential health risks arising from exposure to dust from the proposed Saleyard that may be contaminated by E.Coli and Salmonella have been assessed. Both E.Coli and Salmonella may be present in the dust arising from stockpiles and soft flooring that may contain urine and faeces from the cattle. The results of the air dispersion modelling (Appendix A) from these sources show low levels of both PM10 and deposited dust at all sensitive receptors. The inhalation risk from exposure to PM10 that may be contaminated with E.Coli is minimal due to the low PM10 levels predicted and the low survival rate of E.Coli in air. Dust deposition is a potential source of contamination of rainwater tanks. Based on the air dispersion modelling which shows negligible dust deposition at all sensitive receptors, the potential risk of contamination of rainwater tanks from E.Coli or Salmonella associated with the dust from the proposed Saleyard operations is considered to be minimal.
5.4 Q Fever
5.4.1 Hazard Assessment Q fever is a zoonotic disease caused by the bacteria Coxiella burnetii (C. burnetti) which has been identified in a diverse range of wild and domestic animals (infections in animals are termed coxiellosis). Domestic livestock (especially cattle, sheep and goats) are considered to be the main source for human infection. C. burnetii has been found in urine, faeces, milk, and mostly from infected birth products. Transmission to humans occurs primarily through inhalation of aerosols or dust generated from infected animals or products. Infection can also occasionally be from ingestion of unpasteurized dairy products. The important feature of the bacteria is its ability to withstand harsh environmental conditions; resisting heating, drying and sunlight to survive for more than a year at 4oC in a dried state. The organism dried on wool has been shown to remain infective for 7 to 9 months at 15oC to 20oC and for 12 to 16 months at 4oC to 6oC.

www.erm.com Version: Final Project No.: 0554561 Client: Longwarry Saleyard 6 July 2020 Page 23
HEALTH RISK ASSESSMENT LONGWARRY CATTLE SALEYARD
HEALTH RISK ASSESSMENT
Q fever cases present a range of symptoms, from a mild influenza-like illness to an acute or chronic conditions including hepatitis, endocarditis (an infection of the inner lining of the heart and heart valves), pneumonia and neurological manifestations. However, the majority of human cases remains asymptomatic (Clark et al., 2018). Although, Q fever exhibits a low fatality rate of less than 1%, with higher rates reported in some outbreaks (WHO, 2004), this organism has a low infectious dose (approximately 10 to 15 organisms for humans) and can remain in the soil and dust for years. Furthermore, Q fever can be spread over kilometres by the wind (NSW, 2019). Given C. burnetii is emitted to the environment attached to dust particles, it has been suggested that the risk of infection in humans with Q fever is associated with environmental conditions such as dust production and deposition, which increases with warm weather, dry soils and wind speed (Hunink et al., 2010).
The majority of published studies related to Q fever outbreaks in the community have mostly been associated with goat and sheep livestock, with limited evidence of major contributions from cattle. However, cattle have always been considered as one the major reservoirs of C. burnetii and a number of studies have shown the presence of C. burnetii in up to 84% of the cattle tested (McCaughey et al., 2010). One study indicated that cattle farms were the main source of five recognised Q fever outbreaks in Poland during 2005 and 2011 (Chmielewski et al., 2013). A total of 67 people tested positive for Q fever with the following symptoms: myalgia [muscle pain] (71%), arthralgia [joint pain] (58%), headache (45%), cough (38%), asthenia [lack or loss of strength] (38%), and rarely observed: rigors, perspirations, and stomach ache. Besides the main route of transmission being inhalation of contaminated aerosols, consumption of raw milk was also considered a risk factor of the infection. It was suggested by the authors of this study that the number of Q fever cases diagnosed during the Poland outbreaks were not fully diagnosed and were therefore underestimated. For example, in one study patients with serious cardiologic disorder associated with heart transplant had positive C. burnetii tests in their valves and myocardium (Chmielewski et al., 2013).
The largest outbreak of Q fever has been reported in the Netherlands and was linked to infected goat farms. This outbreak was associated with urban areas with over 4,000 human cases notified between 2007 and 2010 (Karagiannis et al., 2009). Proximity to farm and contact with infected animals or their birth products were considered to be the most important factor for human infections. The 2007 outbreak was identified due to a significant and unusual number of atypical pneumonia cases reported in the local community. In a further study that investigated the risk factors involved in the 2007 outbreak in Netherlands, blood samples from 433 local habitants were used for C. burnetii screening tests. From those, 25.1% were positive being 8.6% identified with past infections and 16.5% presented signs of recently infection. The symptoms reported included severe fatigue, headache, general malaise, fever, shortness of breath and few cases of hospitalization (about 1.5%) (Karagiannis et al., 2009).
Inhalation of contaminated aerosols or dust is considered the main route of Q fever transmission. A recent paper investigating the potential geographical dispersal of C. burnetii from infected livestock facilities to local communities found that the highest infection risk generally occurs within 5 to 10 km in rural areas (Clark et al., 2018). While in urban outbreaks the highest risk was within 2 to 4 km of sources. Wind (2m/s) was identified as the main environmental contributor factor to the spread of the C. burnetii bacterium in the Netherlands outbreak. In the 1989 outbreak that occurred in the United Kingdom Q fever cases were reported up to 18 km away from the source with 147 cases identified. Of those 125 were males and 112 aged 16 to 64 years (Clark et al., 2018). Another study investigated the presence of C. burnetii in airborne dust samples collected in infected goat farms including upwind and downwind of the farm land considering 20 to 70m. Results demonstrated C. burnetii can be detected in inhalable dust (<100µm diameter) and PM10, being more frequently found in larger dust particles (Hogerwerf et al., 2012).

www.erm.com Version: Final Project No.: 0554561 Client: Longwarry Saleyard 6 July 2020 Page 24
HEALTH RISK ASSESSMENT LONGWARRY CATTLE SALEYARD
HEALTH RISK ASSESSMENT
Although consumption of raw milk and unpasteurized dairy products is a less common route of Q fever transmission, a recent study indicated that it represents a potential human infection source which cannot be considered negligible (Pexara et al., 2018). This study reported that among food products originated from infected livestock (cattle, sheep and goats), raw milk was identified as the most significant source of Q fever transmission. Presence of C. burnetii was detected in up to 95% of raw milk samples from several published studies conducted in a number of countries worldwide (Pexara et al., 2018). The presence of this pathogen was also observed in 9 of 21 (42.9%) raw milk samples tested in a study conduct to investigate detection of C. burnetii in commercial raw milk in the United States. Further tests conducted in mice with positive inoculated samples showed C. burnetii infection in 6 of 9 samples (Loftis et al., 2010). Another study reported a cluster of 5 individuals infected with Q fever related to raw milk consumption from a cattle farm in Michigan in 2011 (Signs et al., 2012).
In Australia, Q fever is considered the most commonly reported zoonotic disease. The majority of diagnosed cases have been reported in Queensland with 6.3 per 100,000 population per annum, followed by New South Wales with a rate of 3.1 and 1.1 in South Australia. Other states and territories have less than 1 case per 100,000 per annum. Those rates may be higher due to the number of undiagnosed cases (Eastwood et al., 2018). In the United States, the number of Q fever cases increased from 19 reported in 2000 to around 200 (considering acute and chronic Q fever infections) in 2017. Older people, especially men have been identified as the major cases notified (CDC, 2019).
Studies have shown a number of preventive and control measures reduce the risk of spread Q fever to local communities, including:
Indoor parturition and safe disposal of parturition material;
Management of soil properties to minimize dust generation (eg. increasing soil moisture and concreting surface);
Placement of high vegetation barrier around animal holdings;
Medical and sanitary measures within the farm (eg. vaccination and on-farm hygiene practices). For example, Australia’s national Q fever vaccination program reduced notification rates by over 50% between 2002 and 2006 (Giddin et al., 2009).
The bacteria, Coxiella burnetii, is excreted in the urine, faeces and milk of infected animals and, in high concentrations in the birth fluids, placenta, on the foetus and newly born and in the uterine discharges following the birth of young. Organisms in the placenta are particularly concentrated; one gram of placental tissue may contain one billion organisms. The important feature of the organism is its ability to withstand harsh environmental conditions; resisting heating, drying and sunlight to survive for more than a year at 4oC in a dried state. The organism dried on wool has been shown to remain infective for 7 to 9 months at 15oC to 20oC and for 12 to 16 months at 4oC to 6oC.
5.4.2 Exposure Assessment Most Q Fever infections occur from occupational exposures where close contact with infected animals can occur. There have been a number of community Q Fever outbreaks mainly associated with goat farms and to a lesser extent sheep farms. Infection in humans can occur via skin abrasions and splashes of infected material into the eye. The consumption of unpasteurized milk from infected cows and goats has accounted for small numbers of Q Fever cases. Human to human infection is very uncommon as is infection from tick bites. Inhalation of the organism C. burnetti, as a result of direct or indirect exposure to contaminated aerosols, is the most common mechanism of human infection.

www.erm.com Version: Final Project No.: 0554561 Client: Longwarry Saleyard 6 July 2020 Page 25
HEALTH RISK ASSESSMENT LONGWARRY CATTLE SALEYARD
HEALTH RISK ASSESSMENT
Humans may inhale infected dust, formed from contaminated droplets and the organism-laden products from an infected animal, when it is blown (possibly for a kilometre or more) in dry and windy weather. The organism can be released into the air when handling materials, working within areas or on structures that have been contaminated by infective dust. This dust may have collected during wind borne dissemination or as the result of direct contamination with infected products that have dried to form a dust. Moving animals in the yards, pens or holding paddocks and stock transport trucks can also raise infective dusts (https://www.qfever.org/aboutqfever).
The C. burnetti organism can endure harsh conditions for many months in a dried state either in the ground or attached to buildings, machinery, stock transport vehicles, straw, wool, hides or work clothing. Infected dust and dried matter may also be transported on these materials and later, released into the air, exposing individuals outside of the occupational setting to infection.
The larger droplets and released infected matter can collect on the animal's hide, hair or fleece and heavily contaminate the ground or floor, surrounding area, nearby structures or machinery and such materials as straw and clothing. The lighter smaller droplets freely disperse into the air, and may be disseminated for some distance, before settling. These contaminated droplets and matter then dry to form a highly infectious dust.
The main source of exposure of the local community from the proposed Saleyard operations is through inhalation of contaminated dust from the stockpiles and management of the soft flooring. There is also the potential for the consumption of raw, unpasteurised milk collected on the days when dairy cattle are sold.
PM10 concentrations arising from the stockpiles and management of the soft flooring have been modelled and are shown in Figure 5.2. This data has been used to estimate the risk of potential Q Fever in the local community arising from this source. In addition a review of the practices to manage milk collected on the site has been undertaken to assess the potential risk of infection from this source.
5.4.3 Risk Characterisation
5.4.3.1 Inhalation of Contaminated Dust A biosecurity risk assessment and biosecurity management plan have been developed for the Longwarry site (Wilks, 2019). According to the management plan, it is expected that a small proportion of the cattle entering the saleyards will be pregnant and, if infected, could potentially be a source of infection. It is also possible that a cow may give birth while at the saleyards or may abort. People coming into contact with livestock giving birth, that have recently given birth, or that have aborted are most at risk of infection (Wilks, 2019). The management plan recommends that as birth fluids, foetal and placental material are high risk they should be handled only by personnel who are vaccinated or are immune due to prior infection and who use appropriate PPE.
According to the biosecurity management plan, Q fever risk at the proposed Saleyard would be mitigated by implementing the following measures (Wilks, 2019):
only healthy cattle are accepted into the saleyard for sale;
holding of stock is transient; it is not a permanent husbandry facility such as a farm or feedlot;
in the event that an animal gives birth or aborts while at the saleyard, there is a strict protocol in operation for the safe removal and disposal of birth products;
C. burnetti contamination levels in manure and yard floor waste materials will be very low, and waste management/dust suppression procedures further reduce risk of airborne spread.
www.erm.com Version: Final Project No.: 0554561 Client: Longwarry Saleyard 6 July 2020 Page 26
HEALTH RISK ASSESSMENT LONGWARRY CATTLE SALEYARD
HEALTH RISK ASSESSMENT
The biosecurity management plan concluded that the primary health risk from the Q Fever arising from the Saleyard operations would be to personnel working closely with stock and that could be mitigated through vaccination.
According to the biosecurity risk assessment (Wilks, 2019), C. burnetii is most commonly associated in Australia with goats, occasionally sheep and uncommonly with cattle. It is transmitted by aerosol and this may occur, at least in overseas experience, over considerable distances by windborne dispersal. In Victoria, infection in cattle appears to be rare although data for its prevalence and geographic distribution are limited (Wilks, 2019). Non-pregnant cattle would be the least risk of being a source of infection to other animals and humans but there is the potential for pregnant cattle to be present in the Saleyards that may give birth or abort while there. If such an animal is carrying C. burnetii then there is the possibility of highly infectious material being expelled along with the newborn or foetus and associated fluids. In such a case the immediate risk is to persons in the immediate vicinity and those handling the clean-up (Wilks, 2019).
The biosecurity risk assessments noted that should the infected discharges be allowed to dry and to become airborne then there is the potential for wider spread of the infectious agent. The potential risk of an infected cow giving birth or aborting, while small, can be further mitigated by ensuring segregation of the aborting or parturient cow, prompt clean up and disinfection of the site, and safe disposal of the placenta, membranes, foetus and associated materials (Wilks, 2019).
It was further noted that non-pregnant animals that happen to be infected may be shedding small amounts of the infectious agent in faeces, urine and milk for a limited time and that would be addressed by the standard ongoing clean up and disinfection practices proposed for the site. The risk assessment concluded that even if some C. burnetii survived beyond the clean-up and disinfection, the measures in place to avoid dust and wind dispersal at the site provided a further level of mitigation of potential impacts (Wilks, 2019).
As shown in Table 5.4 solid waste from the site will be disposed of off-site. Stockpiles of waste soft flooring and solids from the sediment ponds will be stockpiled before removal for off-site disposal. These are potential sources of infected dust. According to the biosecurity risk assessment the risk of infectious waste from faeces and urine is low. The stockpiles have been included in the air dispersion modelling conducted as part of this risk assessment. The results have shown low levels of dust in the inhalable fraction and deposited dust to be low. The data shown in Figure 5.2 shows that the level of PM10 predicted at the sensitive receptors is low with the highest 24-hour concentration of 0.36 µg/m3 and annual average of 0.007 µg/m3.
Given that the main source of Q Fever infection is through inhalation of infected aerosol or dust, the predicted PM10 levels can be used to assess the potential risk to the offsite sensitive receptors. The low predicted levels of PM10 at the sensitive receptors means that the potential exposure of the local community is low. From the biosecurity risk assessment, based on the numbers and types of cattle that would be present at the Saleyard and the fact that they are not kept on site for extended periods of time, the level of C. burnetti is predicted to be low (Wilks, 2019). Based on these predictions, the exposure of the local community to potentially infected dust and the potential risk arising from that exposure is low and acceptable. It should be noted that the air dispersion modelling did not take into account the roof of the Saleyard, the noise walls and vegetation screening which would all act as barriers to dust leaving the site, meaning that the actual levels of dust would be lower than those predicted in the air dispersion modelling.
www.erm.com Version: Final Project No.: 0554561 Client: Longwarry Saleyard 6 July 2020 Page 27
HEALTH RISK ASSESSMENT LONGWARRY CATTLE SALEYARD
HEALTH RISK ASSESSMENT
5.4.3.2 Consumption of Milk Collected on Site A second source of community exposure to the C. burnetti bacteria could be through the consumption of raw, unpasteurised milk collected on the site. Dairy cows may need to be milked while on the site. However, based on the information provided by Auld, no milk collected on site would be available to the local community or made available for human consumption. All milk will be removed from site by the contractor engaged to conduct the milking and either used for the feeding of calves offsite or disposed of. Therefore there will be no human consumption of the milk and therefore no risk of Q Fever from this source.
Based on information provided by Auld, the procedure for on-site handling and disposal of milk is as follows:
Dairy sales will occur on the first and third Friday of each month, plus additional special sales as required. The majority of milking dairy cattle arrive on-site at the Saleyards between 8am and 10am on the day of the sale, with a small number arriving the night before a sale. Sales will commence at 11am. Dairy cattle will be milked following the sale.
A contractor will be engaged by the Saleyard operators to undertake any milking activities. After the dairy cattle are sold, they will be milked by a contractor in a 4-unit herringbone dairy that will be purpose built as part of the Saleyard facility. The dairy consists of a vacuum pump, stainless steel vacuum line, milk pump, stainless steel milk line and 4 sets of claws and milk cups.
The contractor will provide a mobile milk storage trailer, which the milk is pumped directly into. Milk will be removed from site the same day as the sale. There will be no milk processing, pasteurizing or storage (except while milking activities are occurring) of milk on-site.
The contractor will be responsible for removing milk off-site. This milk is typically used for agricultural purposes, such as feeding calves. The contractors will be knowledgeable regarding the risks of human consumption of unpasteurized milk.
At the completion of milking activities, the teat cups, claws, milk line and milk pump are washed thoroughly with soap detergent and water and rinsed with fresh water.
5.4.4 Conclusion The main risk of Q Fever in the surrounding community is through the inhalation of dust or aerosols infected with the C. burnetti bacteria. The biosecurity risk assessment conducted for the Saleyard has concluded that, based on the fact that the cattle will only be present on the site for less than 24 hours and the management practices proposed for the site that the levels of C. burnetti that may be present in the dust sources on the site are very low. The predicted PM10 levels from the operations on the site that are likely to be contaminated with C .burnetti, management of the stockpiles and soft bedding, are very low at all offsite receptors. Based on predicted levels of PM10 and the low likelihood for presence of C. burnetti in the waste, the potential risk of Q Fever to the local community from the proposed operations at the Saleyard is low. Implementation of the management measures in the Biosecurity Risk Management Plan will minimise the risk of infection both onsite and offsite.
5.5 Noise The health risk assessment for noise has been undertaken in accordance with the enHealth Guidelines – The Health Effects of Environmental Noise (2018). The enHealth Guidelines review the evidence for the health effects of environmental noise and recommend noise guidelines to protect against two health endpoints for which the Australian health sector has determined that there is sufficient evidence to identify a causal link between exposure and the health outcome. The noise indicators used for the health risk assessment differ from those that are used to assess amenity impacts. The noise indicators required for the HRA are:
55 dBA Leq 8h (10 pm to 6 am average); and
60 dBA Leq 16h (6 am to 10 pm average)

www.erm.com Version: Final Project No.: 0554561 Client: Longwarry Saleyard 6 July 2020 Page 28
HEALTH RISK ASSESSMENT LONGWARRY CATTLE SALEYARD
HEALTH RISK ASSESSMENT
The enHealth noise guidelines are required to account for all noise generated and associated with the proposal, including truck and traffic pass-bys to impacted receivers on Sand Road.
A noise assessment was undertaken as part of the Works Approval Application (SLR, 2019). This assessment assessed compliance with the EPA Publication 1411 - Noise from Industry in Regional Victoria. To generate the data required to undertake the HRA, SLR has adjusted the predicted noise levels generated
5.5.1 Hazard Assessment In recent years, evidence has accumulated regarding the health effects of environmental noise. Epidemiological studies have found that cardiovascular diseases are consistently associated with exposure to environmental noise. The WHO has released four reports on the health effects of environmental noise: Guidelines for Community Noise (1999), Night Noise Guidelines (2009) and the Burden of Disease from Environmental Noise (2011) and (2018). In these documents, the main health effects associated with environmental noise are:
Annoyance;
Sleep disturbance;
Cardiovascular disease;
Cognitive impairment; and
Psychological effects.
Annoyance is the most prevalent community response in a population exposed to environmental noise. It is not in itself considered to be a health effect (WHO, 2009; enHealth, 2004). The term annoyance is used to describe negative reactions to noise such as disturbance, irritation, dissatisfaction and nuisance (Guski, 1999). Annoyance can also be accompanied by stress-related symptoms, leading to changes in heart rate and blood pressure. Acoustic factors, such as the noise source and sound level, account for only a small to moderate amount of annoyance responses: other factors such as the fear associated with the noise source, interference with activities, ability to cope, noise sensitivity, expectations, anger, attitudes to the source – both positive or negative, and beliefs about whether noise could be reduced by those responsible, all influence annoyance responses (WHO, 2000).
Possible effects of noise on sleep are generally grouped into three categories:
The immediate effects of noise on sleep (sleep disturbance and physiological effects);
The secondary effects of sleep disturbances (morning after effects); and
Long term health effects.
Sleep disturbance is defined as any deviation, measurable or subjectively perceived, from an individual’s habitual or desired sleep behaviour. This may include awakenings, sleep quality, medication use to control sleep, total sleep time, time spent in slow wave sleep (see Table 1), arousals and time spent in rapid eye movement sleep (WHO, 2009).
The WHO estimated sleep disturbance to be the most adverse non-auditory effect of environmental noise exposure (Basner et al., 2014; WHO, 2011). Undisturbed sleep of a sufficient number of hours is needed for alertness and performance during the day, for quality of life, and for health (Basner et al., 2014). Humans exposed to sound whilst asleep still have physiological reactions to the noise which do not adapt over time including changes in breathing, body movements, heart rate, as well as awakenings (Basner et al., 2014). The elderly, shift-workers, children and those with poor health are thought to be at risk for sleep disturbance by noise (Muzet, 2007).

www.erm.com Version: Final Project No.: 0554561 Client: Longwarry Saleyard 6 July 2020 Page 29
HEALTH RISK ASSESSMENT LONGWARRY CATTLE SALEYARD
HEALTH RISK ASSESSMENT
There are a number of studies that have shown associations between environmental noise and cardiovascular disease (WHO, 2018; enHealth, 2018). According to Babisch (2014) it is biologically plausible that long-term exposure to environmental noise might influence cardiovascular health. The proposed pathways between environmental noise exposure and cardiovascular diseases (enHealth, 2018; Babisch, 2014) include increased stress associated with noise exposure that might cause physiological stress reactions in an individual, which in turn can lead to increases in established cardiovascular disease risk factors such as blood pressure, blood glucose concentrations, and blood lipids (blood fats). These risk factors lead to increased risk of high blood pressure (hypertension) and arteriosclerosis (e.g. narrowing of arteries due to fat deposits) and are related to serious events such as heart attacks and strokes (Babisch, 2014; Basner et al., 2014). The stress that triggers this pathway can operate directly via sleep disturbance or indirectly via interference with activities and annoyance.
Children may be particularly vulnerable to the effects of noise because they may have less cognitive capacity to understand environmental issues and anticipate stressors and they may lack appropriate coping strategies to deal with noise. Additionally, noise may interfere with learning at a critical developmental stage. The impact of environmental noise on children’s learning and memory has been known for many years. Epidemiological studies show effects of chronic noise exposure on tasks involving central processing and language, such as reading, comprehension, memory and attention. Experimental studies investigating acute (short-term) exposures have found similar effects. Exposure during critical periods of learning at school could potentially impair development and have a lifelong effect on educational attainment. Most of these studies have been associated with road and aircraft noise with little evidence of an association with any other sources of environmental noise (WHO, 2018; enHealth, 2018).
EnHealth (2018) conducted an extensive review of the epidemiological studies examining the association between exposure to environmental noise and adverse health outcomes and concluded that there is sufficient evidence of a causal relationship between environmental noise and both sleep disturbance and cardiovascular disease.
5.5.2 Exposure Assessment In order to provide an appropriate calculated estimate of the 16 h and 8 h noise levels the SLR modelling has considered all sources of noise, including:
All site commercial activity noise (loading/unloading, truck wash, general truck movements and activities on site).
Noise from cattle lowing.
Noise from associated trucks and vehicles on Sand Road associated with the Saleyard operations.
In adapting the previous modelling to generate the relevant health noise indicators, SLR has made the following assumptions (SLR, 2020)
That the level of activity used to generate the highest 30 min noise levels used for the NIRV compliance would occur for half of the day and night periods.
For the remainder of the time period, noise generation from the site would be at least 5 dBA below the peak activity periods.
Cattle lowing noise would occur for half of the day period and for the entire night period.
Truck traffic accessing the site, based on the traffic noise report, in the order of 80-90 heavy vehicle movements during the day period during a peak sale event, and approximately 6 heavy vehicle movements during the night.
There would be 600 standard / light vehicles accessing the site predominantly during the day (the traffic report indicates this represents peak sale collection day volume).

www.erm.com Version: Final Project No.: 0554561 Client: Longwarry Saleyard 6 July 2020 Page 30
HEALTH RISK ASSESSMENT LONGWARRY CATTLE SALEYARD
HEALTH RISK ASSESSMENT
A -3 dB correction to account for non-sales event days (there are 146 sales events per year), and the fact that the majority of sales events are for approximately half of the peak sales events cattle numbers.
As part of the Noise Assessment done as part of the Works Approval Application, SLR conducted monitoring of existing noise levels in the proposed project area. The details of the noise monitoring are document in the SLR Noise Report (2019). The ‘north boundary’ logger location was used as an indicative representation of existing environmental noise in the area, and the average 16 h day and 8 h night results (for all non-weather affected days) used as a basis. SLR note that actual noise levels at each and every receiver would vary, and depend on specific site exposure to road and other environmental noise sources (see Attachment 2). Therefore, SLR has concluded that it is highly impractical to quantify existing environmental noise accurately at every receiver. The noise logging results include contribution from existing traffic, insects / animals and other general environmental noise in the area. SLR note that night period noise levels were slightly higher than day period likely due to contribution of insects / animals.
The noise modelling includes the presence of a 3.8m noise wall between the proposed saleyard and the sensitive receptors. The noise impacts have been assessed for the nearest affected sensitive receptors. The sensitive receptors and the background noise levels as monitored by SLR are shown in Table 5.4:
Table 5.5 Background Noise Levels in Project Area
Location Estimated background 16 h noise level, LAeq (day/evening)
(from monitoring)
Estimated background 8h noise level, LAeq (night) (from
monitoring)
235 Sand Road 52 53
255 Sand Road 52 53
280 Sand Road 52 53
5 Thornell Road 52 53
All other receptors 52 53
The predicted noise levels from the proposed saleyard operations are shown in Table 5.5 with and without existing background included:
Table 5.6 Predicted Noise Levels at Sensitive Receptors Location Predicted 16 hour
noise level, LAeq (day/evening) (dB)
(Saleyard operations only)
Combined 16 hour noise level, LAeq (day/evening) (dB)
(Saleyard operations plus
background)
Predicted 8 hour noise level, LAeq (night) (dB) (Saleyard
operations only)
Combined 8 hour noise level, LAeq
(night) (dB) (Saleyard
operations plus background)
235 Sand Road 48 53 42 53 255 Sand Road 52 55 42 53 280 Sand Road 49 54 43 53 5 Thornell Road 50 54 41 53 All other receptors <50 <54 <41 53

www.erm.com Version: Final Project No.: 0554561 Client: Longwarry Saleyard 6 July 2020 Page 31
HEALTH RISK ASSESSMENT LONGWARRY CATTLE SALEYARD
HEALTH RISK ASSESSMENT
As can be seen from the data in Table 5.6 the combined noise levels are dominated by existing background noise levels. This includes traffic noise from the Princes Highway. The combined noise levels shown in Table 5.6 have been used to calculate the risk to health of the local community from noise arising from the proposed saleyard operations.
5.5.3 Risk Characterisation As discussed in Section 5.5.1, enHealth concluded that there was sufficient evidence of a causal relationship between environmental noise and both sleep disturbance and cardiovascular disease and the strength of this evidence warranted the development of health based limits for residential land uses. EnHealth has recommended the following noise limits to protect the public from sleep disturbance and cardiovascular disease arising from exposure to environmental noise:
During the night-time, an evidence based limit of 55 dB(A) at the facade of the building using the Leq,night, or similar metric and eight-hour night-time period is recommended.
During the day-time, an evidence based limit of 60 dB(A) outside measured using the Leq,day, or similar metric and a 16 hour day-time period is recommended.
The purpose of the risk characterization is to estimate potential risks associated with exposure to noise from the proposed saleyard. For the assessment of health effects where there is a known threshold for effect, the predicted noise level for each averaging period is compared to the health based guideline values. The ratio of the predicted level to the guideline is termed the hazard quotient (HQ) (enHealth, 2012):
HQ = predicted noise level / health based guideline
The hazard quotients are estimated for each of the averaging periods relevant to the guidelines. The enHealth guidelines apply to total noise, including background, not just the increment from a particular source.
Table 5.7 shows that resultant Hazard Quotients for operational noise plus background associated with the proposed saleyard.
Table 5.7 Hazard Quotients for Noise Associated with Proposed Saleyard
Location Combined 16 hour noise level, LAeq
(day/evening) (dB)
Hazard Quotient
Combined 8 hour noise level, LAeq
(night) (dB)
Hazard Quotient
235 Sand Road 53 0.88 53 0.96 255 Sand Road 55 0.92 53 0.96 280 Sand Road 54 0.9 53 0.96 5 Thornell Road 54 0.9 53 0.96 All other receptors <54 <0.9 53 0.96
As can be seen from Table 5.7, all hazard quotients are below 1 and within acceptable risk levels adopted by enHealth (2012).
5.5.4 Conclusion A health risk assessment has been undertaken to assess the potential health risks associated with noise from the proposed Longwarry Saleyard. The HRA has been undertaken in accordance with the enHealth guidelines for environmental noise (2018). The results of the HRA show that the predicted noise levels for combined existing background noise levels and the predicted noise levels from the saleyard operations are below the enHealth recommended noise guidelines derived to protect against sleep disturbance and cardiovascular impacts. Based on the noise modelling and monitoring conducted by SLR, the combined noise levels are within acceptable risk levels.

www.erm.com Version: Final Project No.: 0554561 Client: Longwarry Saleyard 6 July 2020 Page 32
HEALTH RISK ASSESSMENT LONGWARRY CATTLE SALEYARD
CONCLUSIONS
6. CONCLUSIONS
A health risk assessment (HRA) has been undertaken to assess the potential risks to the health of the local community from the proposed Longwarry Cattle Saleyards. The HRA has considered potential risks from exposure to PM10, E.Coli, Salmonella, Q Fever and noise. Air dispersion modelling has been undertaken to inform the risk assessments for PM10, E.Coli, Salmonella, and Q Fever. The noise modelling prepared for the Works Approval and adapted by SLR for the HRA has been used to inform the noise risk assessment. The biosecurity management plan and risk assessment prepared for the Works Approval application have been utilised in the Q Fever risk assessment.
The risk assessment for PM10 has shown that the risk to the surrounding community is low and within acceptable risk levels adopted by enHealth (2012). Based on the low levels of PM10 that have been predicted and the low survival rate of E.Coli in air, the risk of infection from E.Coli and Salmonella by inhalation is very low.
To consider the risk of E. Coli and Salmonella through potential contamination of rainwater tanks, the results of dust deposition modelling have been used. The predicted deposited dust concentrations at all sensitive receptors is minimal and would not be measurable within these areas. Therefore, the risk of contamination of the rainwater tanks from potentially infected dust would also be minimal.
Based on the findings of the biosecurity risk assessment conducted for the Saleyard, the fact that the cattle will only be present on the site for less than 24 hours and the management practices proposed for the site the levels of C. burnetti that may be present in the dust sources on the site are very low. The predicted PM10 levels from the operations on the site that are likely to be contaminated with C .burnetti, management of the stockpiles and soft bedding, are low at all modelled offsite receptors. Based on predicted levels of PM10 and the low likelihood for presence of C. burnetti in the waste, the potential risk of Q Fever to the local community from the proposed operations at the Saleyard is very low. Implementation of the management measures in the Biosecurity Risk Management Plan will minimise the risk of infection both onsite and offsite.
The risk assessment for noise has been conducted to assess the potential impact of noise from the proposed operations on sleep disturbance and increases in cardiovascular disease in accordance with the enHealth guidelines (2018). Based on the noise levels predicted by SLR (2020) that, with the inclusion of the proposed noise walls around the site, the risk levels are within acceptable levels established by enHealth (2012).
The results of this HRA have shown that the risks arising from the operations of the proposed Saleyard are low and all resulting risks are within acceptable risk criteria established by enHealth.

www.erm.com Version: Final Project No.: 0554561 Client: Longwarry Saleyard 6 July 2020 Page 33
HEALTH RISK ASSESSMENT LONGWARRY CATTLE SALEYARD
REFERENCES
7. REFERENCES
Abbott, S., Caughley, B., & Douwes, J. (2007). The microbiological quality of roof-collected rainwater of private dwellings in New Zealand. Rainwater and Urban Design 2007, 9.
Ahmed, W., Goonetilleke, A., & Gardner, T. (2010). Implications of faecal indicator bacteria for the microbiological assessment of roof-harvested rainwater quality in Southeast Queensland, Australia. Canadian Journal of Microbiology, 56(6), 471-479.
Ahmed, W., Hodgers, L., Sidhu, J., Gardner, T., Richardson, K., Palmer, A., & Toze, S. (2012). Health risk assessment of roof-captured rainwater. Urban Water Security Research Alliance. Barnett, A. G., Williams, G. M., Schwartz, J., Best, T. L., Neller, A. H., Petroeschevsky, A. L. & Simpson, R. W. (2006) The Effects Of Air Pollution On Hospitalizations For Cardiovascular Disease In Elderly People In Australian And New Zealand Cities. Environmental Health Perspectives, 114, 1018-23. Barnett, A. G., Williams, G. M., Schwartz, J., Neller, A. H., Best, T. L., Petroeschevsky, A. L. & Simpson, R. W. (2005) Air Pollution And Child Respiratory Health: A Case-Crossover Study In Australia And New Zealand. American Journal of Respiratory & Critical Care Medicine, 171, 1272-8
Borlée, F., Yzermans, C. J., Aalders, B., Rooijackers, J., Krop, E., Maassen, C. B., ... & Smit, L. A. (2017). Air pollution from livestock farms is associated with airway obstruction in neighboring residents. American journal of respiratory and critical care medicine, 196(9), 1152-1161.
CDC (2011). Centers for Disease Control and Prevention, National Center for Emerging and Zoonotic Infectious Diseases (NCEZID). Compendium of Measures to Prevent Disease Associated with Animals in Public Settings, 2011: National Association of State Public Health Veterinarians, Inc. (NASPHV). Available at https://www.cdc.gov/mmwr/preview/mmwrhtml/rr6004a1.htm. Accessed on 5/05/2020
CDC (2019). Centers for Disease Control and Prevention, National Center for Emerging and Zoonotic Infectious Diseases (NCEZID), Division of Vector-Borne Diseases (DVBD), 2019. Available at https://www.cdc.gov/qfever/stats/index.html. Accessed on 1/05/2020.
Chen, Z., Biswas, S., Aminabadi, P., Stackhouse, J. W., Jay‐Russell, M. T., & Pandey, P. K. (2019). Prevalence of Escherichia coli O157 and Salmonella spp. in solid bovine manure in California using real‐time quantitative PCR. Letters in applied microbiology, 69(1), 23-29.
Chmielewski, T., & Tylewska-Wierzbanowska, S. (2013). Q fever outbreaks in Poland during 2005–2011. Medical science monitor: international medical journal of experimental and clinical research, 19, 1073.
Clark, N. J., & Magalhães, R. J. S. (2018). Airborne geographical dispersal of Q fever from livestock holdings to human communities: a systematic review and critical appraisal of evidence. BMC infectious diseases, 18(1), 218.
D'Ugo, E., Sdanganelli, M., Grasso, C., Magurano, F., Marcheggiani, S., Boots, B., ... & Mancini, L. (2017). Detection of Coxiella burnetii in Urban River Water. Vector-Borne and Zoonotic Diseases, 17(7), 514-516.
Eastwood, K., Graves, S. R., Massey, P. D., Bosward, K., & Hutchinson, P. (2018). Q fever: A rural disease with potential urban consequences. Australian journal of general practice, 47(3), 112. enHealth (2004) Health Effects of Environmental Noise other than Hearing Loss. Department of Health and Ageing and enHealth Council, Commonwealth of Australia. enHealth (2010), Guidance on the Use of Rainwater Tanks, Commonwealth Department of Health

www.erm.com Version: Final Project No.: 0554561 Client: Longwarry Saleyard 6 July 2020 Page 34
HEALTH RISK ASSESSMENT LONGWARRY CATTLE SALEYARD
REFERENCES
enHealth (2012) Environmental Health Risk Assessment: Guidelines for Assessing Human Health Risks from Environmental Hazards. Department of Health and Ageing and enHealth Council, Commonwealth of Australia enHealth (2018), Health Effects of Environmental Noise: Commonwealth Department of Health. Environment Protection and Heritage Council (2006), Multicity Mortality and Morbidity Study, report to EPHC, available at www.ephc.gov.au/air/research
Gidding, H. F., Wallace, C., Lawrence, G. L., & McIntyre, P. B. (2009). Australia's national Q fever vaccination program. Vaccine, 27(14), 2037-2041. Guski, R. (1999). Personal and social variables as co-determinants of noise annoyance. Noise and Health, 1, 45-56.
Heiman, K. E., Mody, R. K., Johnson, S. D., Griffin, P. M., & Gould, L. H. (2015). Escherichia coli O157 outbreaks in the United States, 2003–2012. Emerging infectious diseases, 21(8), 1293.
Hogerwerf, L., Borlée, F., Still, K., Heederik, D., van Rotterdam, B., de Bruin, A., ... & Wouters, I. M. (2012). Detection of Coxiella burnetii DNA in inhalable airborne dust samples from goat farms after mandatory culling. Appl. Environ. Microbiol., 78(15), 5410-5412.
Hunink, J. E., Veenstra, T., van der Hoek, W., & Droogers, P. Q fever transmission to humans and local environmental conditions. 2010. Wageningen (the Netherlands): Report Future-Water, 90.
Karagiannis, I., Schimmer, B., Van Lier, A., Timen, A., Schneeberger, P., Van Rotterdam, B., ... & Van Duynhoven, Y. (2009). Investigation of a Q fever outbreak in a rural area of The Netherlands. Epidemiology & Infection, 137(9), 1283-1294.
Liu, D., Wagner, J. G., Harkema, J. R., Gerlofs-Nijland, M. E., Pinelli, E., Folkerts, G., ... & Cassee, F. R. (2020). Livestock farm particulate matter enhances airway inflammation in mice with or without allergic airway disease. World Allergy Organization Journal, 13(4), 100114.
McCaughey, C., Murray, L. J., McKenna, J. P., Menzies, F. D., McCullough, S. J., O'neill, H. J., ... & Coyle, P. V. (2010). Coxiella burnetii (Q fever) seroprevalence in cattle. Epidemiology & Infection, 138(1), 21-27. NEPC, (2011), Review of the Ambient Air Quality NEPM. Available at www.nepc.gov.au
NSW Ministry of Health (2019). Q fever and farms Fact Sheet, February, 2019.
Nyberg, K. A., Andersson, G. M., & Elving, J. (2019). Long‐term survival of Escherichia coli O157: H7 and Salmonella Typhimurium in cowpats on pasture. Journal of applied microbiology, 126(2), 651-660.
Papanastasiou, D. K., Fidaros, D., Bartzanas, T., & Kittas, C. (2011). Monitoring particulate matter levels and climate conditions in a Greek sheep and goat livestock building. Environmental monitoring and assessment, 183(1-4), 285-296.
Pexara, A., Solomakos, N., & Govaris, A. (2018). Q fever and prevalence of Coxiella burnetii in milk. Trends in Food Science & Technology, 71, 65-72.
Rodrigo, S., Sinclair, M. I., & Leder, K. S. (2009). Quality of stored rainwater used for drinking in metropolitan South Australia.
Rooij, M. M., Heederik, D. J., Borlée, F., Hoek, G., & Wouters, I. M. (2017). Spatial and temporal variation in endotoxin and PM10 concentrations in ambient air in a livestock dense area. Environmental research, 153, 161-1
Schulze, A., Römmelt, H., Ehrenstein, V., van Strien, R., Praml, G., Küchenhoff, H., ... & Radon, K. (2011). Effects on pulmonary health of neighboring residents of concentrated animal feeding

www.erm.com Version: Final Project No.: 0554561 Client: Longwarry Saleyard 6 July 2020 Page 35
HEALTH RISK ASSESSMENT LONGWARRY CATTLE SALEYARD
REFERENCES
operations: exposure assessed using optimized estimation technique. Archives of environmental & occupational health, 66(3), 146-154.
Semenov, A. V., Van Overbeek, L., & Van Bruggen, A. H. (2009). Percolation and survival of Escherichia coli O157: H7 and Salmonella enterica serovar Typhimurium in soil amended with contaminated dairy manure or slurry. Applied and Environmental Microbiology, 75(10), 3206-3215.
Signs, K. A., Stobierski, M. G., & Gandhi, T. N. (2012). Q fever cluster among raw milk drinkers in Michigan, 2011. Clinical infectious diseases, 55(10), 1387-1389. Simpson R, Williams G, Petroeschevsky A, Best T, Morgan G, Denison L, Hinwood A, Neville G, Neller A. (2005a) The short-term effects of air pollution on daily mortality in four Australian cities. Aust N Z J Public Health 29(3):205-12. Simpson R, Williams G, Petroeschevsky A, Best T, Morgan G, Denison L, Hinwood A, Neville G. (2005b) The short-term effects of air pollution on hospital admissions in four Australian cities. Aust N Z J Public Health 29(3):213-21.
Soon, J. M., Chadd, S. A., & Baines, R. N. (2011). Escherichia coli O157: H7 in beef cattle: on farm contamination and pre-slaughter control methods. Animal Health Research Reviews, 12(2), 197-211.
SRP Technology (2011). A Guide to E. coli O157 in Cattle. Pfizer animal health.
Ström, G., Albihn, A., Jinnerot, T., Boqvist, S., Andersson-Djurfeldt, A., Sokerya, S., ... & Magnusson, U. (2018). Manure management and public health: Sanitary and socio-economic aspects among urban livestock-keepers in Cambodia. Science of the Total Environment, 621, 193-200.
USEPA (2004) Air Quality Criteria for Particulate Matter. Research Triangle Park, NC USEPA (2012), Provisional Assessment of Recent Studies on Health Effects of Particulate Matter Exposure, National Centre for Environmental Assessment RTP Division Office of Research and Development U.S. Environmental Protection Agency Research Triangle Park, NC 27711, December 2012, EPA/600/R-12/056F
USEPA, 2009 Integrated Science Assessment of Particulate Matter. U.S. Environmental Protection Agency, Washington, DC. EPA/600/R-08/139F
WHO (2006) Air Quality Guidelines. Global Update. 2005. Particulate Matter, Ozone, Nitrogen Dioxide and Sulfur Dioxide Copenhagen, WHO Regional Office for Europe WHO (2013) Review of Evidence of Health Effects of Air Pollution Project: REVIHAPP, WHO Regional Office for Europe.
WHO (2014). Health Aspects of Chemical and Biological Weapons, 2nd ed. Geneva, World Health Organization, 2004.
WHO (2018) Environmental Noise Guidelines for the European Region. Geneva: World Health Organization WHO. (1999). Guidelines for Community Noise. Geneva: World Health Organization Europe. WHO. (2009). Night Noise Guidelines for Europe. World Health Organization Europe. WHO. (2011). Burden of Disease from Environmental Noise

www.erm.com Version: Final Project No.: 0554561 Client: Longwarry Saleyard 6 July 2020 Page 36
HEALTH RISK ASSESSMENT LONGWARRY CATTLE SALEYARD
STATEMENT OF LIMITATIONS
8. STATEMENT OF LIMITATIONS
IMPORTANT LIMITATIONS AND CONTEXT
1. This report is based solely on the scope of work described in ERMs Proposal for Health Risk Assessment for Proposed Longwarry Cattle Saleyard dated 22 April 2020 setting out ERM’s scope (Scope of Work) and performed by ERM Australia Pty Ltd (ERM) for Auld Projects and Planning (the Client). The Scope of Work was governed by a contract between ERM and the Client (Contract).
2. No limitation, qualification or caveat set out below is intended to derogate from the rights and obligations of ERM and the Client under the Contract.
3. The findings of this report are solely based on, and the information provided in this report is strictly limited to that required by, the Scope of Work. Except to the extent stated otherwise, in preparing this report ERM has not considered any question, nor provides any information, beyond that required by the Scope of Work.
4. This report was prepared between 11 May 2020 and 3 July 2020 and is based on conditions encountered and information reviewed at the time of preparation. The report does not, and cannot, take into account changes in law, factual circumstances, applicable regulatory instruments or any other future matter. ERM does not, and will not, provide any on-going advice on the impact of any future matters unless it has agreed with the Client to amend the Scope of Work or has entered into a new engagement to provide a further report.
5. Unless this report expressly states to the contrary, ERM’s Scope of Work was limited strictly to identifying typical environmental conditions associated with the subject site(s) and does not evaluate the condition of any structure on the subject site nor any other issues. Although normal standards of professional practice have been applied, the absence of any identified hazardous or toxic materials or any identified impacted soil or groundwater on the site(s) should not be interpreted as a guarantee that such materials or impacts do not exist.
6. This report is based on one or more site inspections conducted by ERM personnel, the sampling and analyses described in the report, and information provided by the Client or third parties (including regulatory agencies). All conclusions and recommendations made in the report are the professional opinions of the ERM personnel involved. Whilst normal checking of data accuracy was undertaken, except to the extent expressly set out in this report ERM:
a) did not, nor was able to, make further enquiries to assess the reliability of the information or independently verify information provided by;
b) assumes no responsibility or liability for errors in data obtained from,
the Client, any third parties or external sources (including regulatory agencies). 7. Although the data that has been used in compiling this report is generally based on actual circumstances,
if the report refers to hypothetical examples those examples may, or may not, represent actual existing circumstances.
8. Only the environmental conditions and or potential contaminants specifically referred to in this report have been considered. To the extent permitted by law and except as is specifically stated in this report, ERM makes no warranty or representation about:
a) the suitability of the site(s) for any purpose or the permissibility of any use;
b) the presence, absence or otherwise of any environmental conditions or contaminants at the site(s) or elsewhere; or

www.erm.com Version: Final Project No.: 0554561 Client: Longwarry Saleyard 6 July 2020 Page 37
HEALTH RISK ASSESSMENT LONGWARRY CATTLE SALEYARD
STATEMENT OF LIMITATIONS
c) the presence, absence or otherwise of asbestos, asbestos containing materials or any hazardous materials on the site(s).
9. Use of the site for any purpose may require planning and other approvals and, in some cases, environmental regulator and accredited site auditor approvals. ERM offers no opinion as to the likelihood of obtaining any such approvals, or the conditions and obligations which such approvals may impose, which may include the requirement for additional environment works.
10. The ongoing use of the site or use of the site for a different purpose may require the management of or remediation of site conditions, such as contamination and other conditions, including but not limited to conditions referred to in this report.
11. This report should be read in full and no excerpts are to be taken as representative of the whole report. To ensure its contextual integrity, the report is not to be copied, distributed or referred to in part only. No responsibility or liability is accepted by ERM for use of any part of this report in any other context.
12. Except to the extent that ERM has agreed otherwise with the Client in the Scope of Work or the Contract, this report:
a) has been prepared and is intended only for the exclusive use of the Client;
b) must not to be relied upon or used by any other party;
c) has not been prepared nor is intended for the purpose of advertising, sales, promoting or endorsing any Client interests including raising investment capital, recommending investment decisions, or other publicity purposes;
d) does not purport to recommend or induce a decision to make (or not make) any purchase, disposal, investment, divestment, financial commitment or otherwise in or in relation to the site(s); and
e) does not purport to provide, nor should be construed as, legal advice.

APPENDIX A AIR QUALITY ASSESSMENT

The business of sustainability
Air Quality Assessment for HRA Longwarry Saleyards Pty Ltd
06 July 2020
Project No.: 0554561
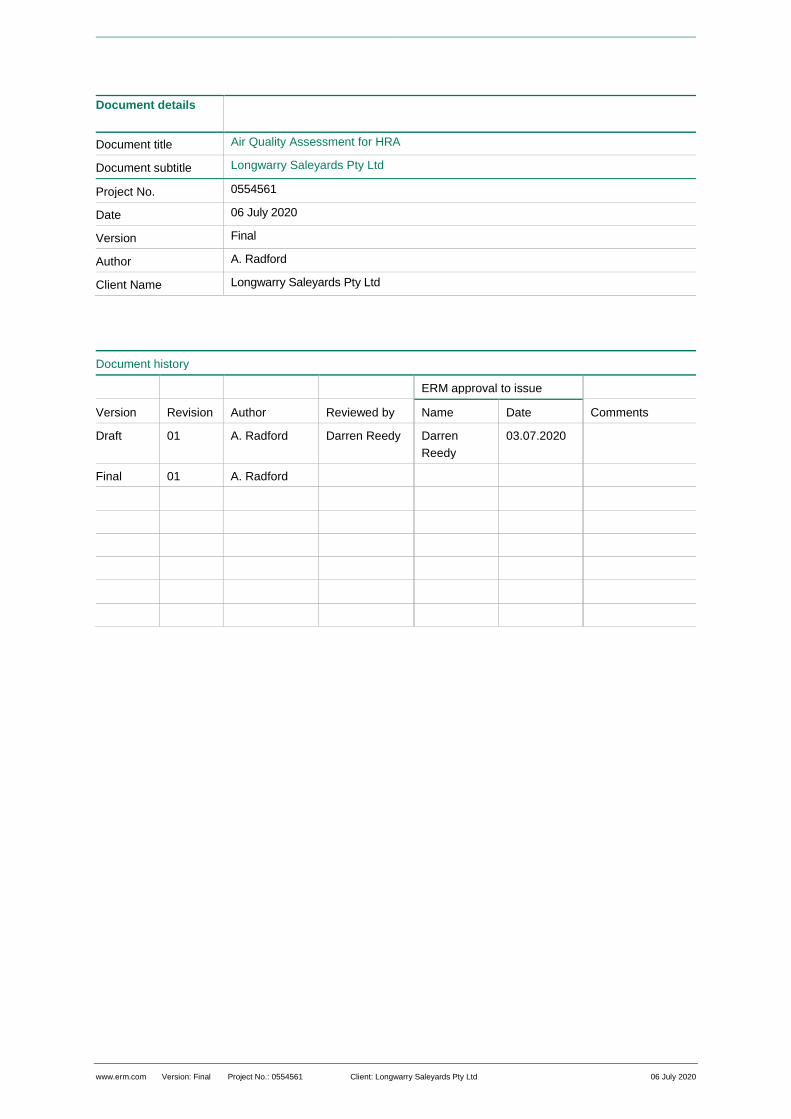
www.erm.com Version: Final Project No.: 0554561 Client: Longwarry Saleyards Pty Ltd 06 July 2020
Document details
Document title Air Quality Assessment for HRA
Document subtitle Longwarry Saleyards Pty Ltd
Project No. 0554561
Date 06 July 2020
Version Final
Author A. Radford
Client Name Longwarry Saleyards Pty Ltd
Document history
ERM approval to issue
Version Revision Author Reviewed by Name Date Comments
Draft 01 A. Radford Darren Reedy Darren Reedy
03.07.2020
Final 01 A. Radford

www.erm.com Version: Final Project No.: 0554561 Client: Longwarry Saleyards Pty Ltd 06 July 2020
Signature Page
06 July 2020
Air Quality Assessment for HRA Longwarry Saleyards Pty Ltd
Dr Alison Radford Senior Air Quality Scientist
Patricia Thorpe Environmental Consultant
Dr Iain Cowan Technical Director
Darren Reedy Partner
Environmental Resources Management Australia Pty Ltd Level 6 99 King Street Melbourne Vic 3005
© Copyright 2020 by ERM Worldwide Group Ltd and/or its affiliates (“ERM”). All rights reserved. No part of this work may be reproduced or transmitted in any form, or by any means, without the prior written permission of ERM.
www.erm.com Version: Final Project No.: 0554561 Client: Longwarry Saleyards Pty Ltd 06 July 2020
AIR QUALITY ASSESSMENT FOR HRA Longwarry Saleyards Pty Ltd
CONTENTS
CONTENTS
1. INTRODUCTION .......................................................................................................................... 1 1.1 Site Location and Description ........................................................................................................ 1 1.2 Scope of Work ............................................................................................................................... 1 1.3 Site Operations .............................................................................................................................. 3
1.3.1 Soft floor and waste stockpile dust suppression ........................................................... 3 1.4 Assessment against Air Quality Criteria ......................................................................................... 3
2. SITE VISIT TO A SIMILAR FACILITY ......................................................................................... 4 2.1.1 Laneways ...................................................................................................................... 4 2.1.2 Sale Pens ..................................................................................................................... 5 2.1.3 Waste Stockpiles .......................................................................................................... 5
3. EMISSIONS INVENTORY ............................................................................................................ 6 3.1 Emissions Summary ...................................................................................................................... 6 3.2 Emission Rates .............................................................................................................................. 6
3.2.1 Cattle Movement in Laneways and Sale/Delivery Pens ................................................ 6 3.2.2 Waste Stockpiles and Soft Floor ................................................................................... 8
3.3 Summary of Emission Rates used in this Assessment ................................................................ 10 3.3.1 Emission Rate Assumptions ....................................................................................... 11
3.4 Source Parameters ...................................................................................................................... 11
4. MODELLING METHODOLOGY ................................................................................................. 12 4.1 Meteorological Modelling ............................................................................................................. 12
4.1.1 WRF Setup ................................................................................................................. 13 4.1.2 Observed Meteorological Data.................................................................................... 15 4.1.3 WRF Post Processing ................................................................................................. 16
4.2 Predicted Wind Roses ................................................................................................................. 16 4.3 Dispersion Modelling ................................................................................................................... 18
4.3.1 Modelling Assumptions ............................................................................................... 21 4.3.2 Particle Size Distribution ............................................................................................. 21 4.3.3 Discrete Receptors ..................................................................................................... 22
5. RESULTS ................................................................................................................................... 23 5.1 Scenario 1.................................................................................................................................... 23 5.2 Scenario 2.................................................................................................................................... 23 5.3 Contour Plots ............................................................................................................................... 25
6. CONCLUSIONS ......................................................................................................................... 27
7. REFERENCES ........................................................................................................................... 28
8. STATEMENT OF LIMITATIONS ................................................................................................ 29

www.erm.com Version: Final Project No.: 0554561 Client: Longwarry Saleyards Pty Ltd 06 July 2020
AIR QUALITY ASSESSMENT FOR HRA Longwarry Saleyards Pty Ltd
CONTENTS
List of Tables Table 3.1: Sources of dust emissions at site .......................................................................................... 6 Table 3.2: Laneway Dusttrak monitoring data ........................................................................................ 7 Table 3.3: Sale/Delivery pen Dusttrak monitoring data .......................................................................... 8 Table 3.4: Site specific emission factors ................................................................................................. 8 Table 3.5: Moisture content of site samples ........................................................................................... 9 Table 3.6: Emission rates used in this Assessment ............................................................................. 10 Table 3.7: Source parameters .............................................................................................................. 11 Table 4.1: WRF modelling parameters ................................................................................................. 12 Table 4.2: WRF options selected .......................................................................................................... 14 Table 4.3: Dispersion modelling scenarios ........................................................................................... 18 Table 4.4: Scenario 2: Reduction in hours of operation/number of pens ............................................. 20 Table 4.5: Particle size distribution ....................................................................................................... 21 Table 4.6: Sensitive receptors .............................................................................................................. 22 Table 5.1: Maximum 24 hour average PM10 concentrations 2015-2019 .............................................. 23 Table 5.2: Scenario 2 - Predicted PM10 concentrations in 2015 ........................................................... 24 Table 5.3: Scenario 2 – Predicted TSP concentrations and dust deposition in 2015 ........................... 24
List of Figures
Figure 1.1: Site boundary and sensitive receptors ................................................................................. 2 Figure 3.1: Example of sieve analysis output ....................................................................................... 10 Figure 4.1: Wind roses .......................................................................................................................... 17 Figure 5.1: Scenario 2: Maximum 24-hour average PM10 concentrations (µg/m3) ............................... 25 Figure 5.2: Scenario 2: Maximum monthly dust deposition (g/m2/month) ............................................ 26

www.erm.com Version: Final Project No.: 0554561 Client: Longwarry Saleyards Pty Ltd 06 July 2020 Page 1
AIR QUALITY ASSESSMENT FOR HRA Longwarry Saleyards Pty Ltd
INTRODUCTION
1. INTRODUCTION
Environmental Resources Management Australia Pty Ltd (ERM) was engaged by Auld Planning & Projects (AULD) to undertake a health risk assessment (HRA) for the proposed Longwarry Cattle Saleyard at, 85 Thornell Road, Longwarry, Victoria. As no quantitative air quality assessment of dust emissions from the operations has been conducted as part of the Works Approval application (WAA), this assessment seeks to provide modelling of the dust emissions to inform the HRA. The potential off-site risks from Q Fever and E. coli associated with dust emissions arising from the site have been assessed in the HRA.
1.1 Site Location and Description
The proposed site is located to the south of the Princes Freeway / Sand Road interchange at 85 Thornell Road, Longwarry. The subject site comprises approximately 228,000 m2 of existing farm land located in a predominantly agricultural area and it is surrounded by a number of rural dwellings as it can be seen in Figure 1.1. It is proposed to develop the land for the purpose of a saleyard.
The proposal includes the following:
A fully roofed saleyard with holding pens, sale pens, drafting and loading/unloading facilities;
A central office building with offices, amenities and a café;
Parking for trucks and cars;
A three-bay truck wash;
A maintenance and truck driver amenity shed;
A surface water wetland;
Rainwater tanks;
A sequencing batch reactor plant; and
Landscaping, and signage.
1.2 Scope of Work
The scope of works completed in this assessment involved the following:
Site visit to an equivalent saleyard to obtain sampling for emission estimates;
Meteorological modelling;
Emission factor for specific activity at cattle saleyard;
Emissions estimation;
Air dispersion modelling; and
Output for risk assessment.

www.erm.com Version: Final Project No.: 0554561 Client: Longwarry Saleyards Pty Ltd 06 July 2020 Page 2
AIR QUALITY ASSESSMENT FOR HRA Longwarry Saleyards Pty Ltd
INTRODUCTION
Figure 1.1: Site boundary and sensitive receptors
www.erm.com Version: Final Project No.: 0554561 Client: Longwarry Saleyards Pty Ltd 06 July 2020 Page 3
AIR QUALITY ASSESSMENT FOR HRA Longwarry Saleyards Pty Ltd
INTRODUCTION
1.3 Site Operations
Annual throughput at the proposed Longwarry saleyard is expected to be up to 132,000 cattle. The facility is expected to host an average of 146 sales per annum including:
One fat cattle sale per week (total of 50 per annum);
One cows & calves sale per week (total of 50 per annum);
One store cattle sale per fortnight (24 per annum); and
Two dairy cattle sales per fortnight (total of 22 per annum plus special sales as required by market conditions).
Store cattle sales are the largest sale events and they occur fortnightly. The larger sale events, with a maximum of 2,000 head per sale, will occur from September to April. It is anticipated there may be 10 sales from September to April that achieve 2,000 head per sale. It is proposed that the Longwarry saleyard will host both calf and dairy sales. Both calves and dairy cattle will arrive and depart the day of the sale (ie are not kept on-site overnight).
Sale times will generally be scheduled between 8am – 2pm. Cattle typically arrive the afternoon before the sale and are removed by the purchaser at the conclusion of the sale. A 10pm curfew for the delivery of cattle the night before a sale will be in place.
Vehicular access to the site is proposed via Sand Road. All access roads and on-site areas are sealed, except for an overflow carpark (to be used during large sale events).
Three sections of noise barriers are proposed:
290m section to the south-west.
120m section to the west.
310m section to the north.
The proposed noise barriers will be 3.8 metres in height and constructed to acoustic specifications.
A 10-metre-wide perimeter landscape buffer will be provided. The landscape buffer will be planted in a shelter belt style arrangement, utilising a mix of indigenous trees, shrubs and plants.
1.3.1 Soft floor and waste stockpile dust suppression Watering of the entire soft floor area within the cattle yard would take place prior to each sale, as required. It is likely that watering for dust suppression purposes would not be required in the cooler months. Water used for dust suppression would be distributed through sprinklers and/or hand watering. The dust suppression system would allow coverage of the entire cattle yard soft floor area.
It is unlikely dust suppression would be required at the solids stockpile area due to the moisture contained in the solids. However, water connection points will be available at this location so that stockpiles could be watered if required.
1.4 Assessment against Air Quality Criteria
This assessment has been undertaken to inform the human health risk assessment (HRA) and as such the results have not been compared to any air quality criteria.

www.erm.com Version: Final Project No.: 0554561 Client: Longwarry Saleyards Pty Ltd 06 July 2020 Page 4
AIR QUALITY ASSESSMENT FOR HRA Longwarry Saleyards Pty Ltd
SITE VISIT TO A SIMILAR FACILITY
2. SITE VISIT TO A SIMILAR FACILITY
A site visit to the Western Victoria Livestock Exchange (WVLX) in Mortlake was undertaken on 11 May 2020. No published dust emission factors could be sourced for the movement of cattle within a saleyard and, in addition, specific information regarding the particle size distribution and moisture of the floor covering and the waste piles was required for the emission estimation and dispersion modelling. The intent of the site visit was therefore to collect ambient measurements and samples which could be used to derive the emission rates and accurately describe the sources within the model. The main emission sources monitored were:
movement of cattle along the laneways, which may represent:
- from the delivery point into the sale pens (pre-sale);
- from the sale pens to the main sale ring (on a sale day);
- from the main sale ring to the delivery pens (post-sale); and
movement of cattle in the sale or delivery pens.
In addition, the following samples were collected for analysis of particle size distribution and moisture content:
the soft floor from the laneways and sale/delivery pens; and
the waste stockpile.
The waste stockpile samples were subjected to sieve analysis to calculate the threshold friction velocity used to assess wind erosion from stockpiles.
2.1.1 Laneways Two Dusttrak II aerosol monitors were located upwind and downwind of a laneway within the cattle yard at Mortlake. The wind direction was north-westerly throughout the monitoring period. Monitoring commenced at 9.10 am, however each laneway was only used to move the cattle from the sale pens immediately to the east of each laneway and so cattle did not move past the monitors until 10.18 am. Prior to this, cattle were moving down the laneways to the north of the monitors. A GoPro Camera was situated on top of the upwind monitor to enable the number of cattle and horse movements to be counted. Cattle movements continued past the monitors until 10.53 am, allowing 35 minutes of movements to be recorded.
The monitors were set up to record a 1 minute average PM10 concentration in mg/m3. The monitoring results are presented in Table 3.2. From the GoPro footage, it can be seen that on average cattle from one sale pen moved past the monitors over a period of a minute, with the remainder of the time period including horse and rider driving the cattle down the laneway and then returning for the next pen. The one minute period also includes time when no animal movements are occurring.
The soft floor material in the laneways had been watered prior to the sale, according to the usual site operation. A sample of the laneways was collected, in duplicate, for analysis of particle size distribution and moisture content.
Usual operation of WVLX at Mortlake would see cattle sold from individual sale pens, with prospective buyers and auctioneers travelling along the raised access ways from pen to pen. Due to Covid-19 related restrictions, when monitoring was undertaken, Mortlake were herding all cattle from the sale pens to a central sale ring to allow for physical distancing requirements to be met. It is unclear how long these measures will be in place, however, this method of operation is likely to represent worst case emissions.
The monitoring data was input into Wind Trax, along with 1 minute meteorological data from the Bureau of Meteorology (BoM), to back calculate an emission rate for the laneways.

www.erm.com Version: Final Project No.: 0554561 Client: Longwarry Saleyards Pty Ltd 06 July 2020 Page 5
AIR QUALITY ASSESSMENT FOR HRA Longwarry Saleyards Pty Ltd
SITE VISIT TO A SIMILAR FACILITY
2.1.2 Sale Pens Two Dusttrak II aerosol monitors were located upwind and downwind of a sale/delivery pen within the cattle yard at Mortlake. The wind direction was north-westerly throughout the monitoring period. Wind speeds were slightly higher as it was later in the morning. Monitoring commenced at 11.58 am on a pen containing 19 cattle. Unlike other pens, the cattle had plenty of room to move around, and this most likely represented worst case emissions from a pen. Monitoring was delayed by cattle movements down the laneway on one side of the pen. The monitoring period was shortened prematurely as staff entered the pen and shifted the cattle into half the pen, and away from the downwind monitor. Shortly after, five (5) cattle were removed from the pen. Given the heavy movement around the monitors and the increased distance of the cattle from the downwind monitor, monitoring was stopped after 15 minutes.
The monitors were set up to record a 1 minute average PM10 concentration in mg/m3. The monitoring results are presented in Table 3.3.
The soft floor material in the pens is not watered, however, animal urine and excrement increase the moisture content of the floor material. A sample of the sale pens was collected, in duplicate, for analysis of particle size distribution and moisture content.
The monitoring data was input into Wind Trax, along with 1 minute meteorological data from the Bureau of Meteorology (BoM), to back calculate an emission rate for the sale pens.
2.1.3 Waste Stockpiles Solid waste material from the solids separation system and soft floor material removed from the laneways and pens will be stockpiled on-site before transportation off-site. The material will remain on-site until sufficient drying has occurred and then it will be removed off-site to a licensed waste facility or composting facility (Premise, 2019).
Samples of the waste stockpile were collected, in duplicate, for analysis of particle size distribution, moisture content, and sieve analysis.

www.erm.com Version: Final Project No.: 0554561 Client: Longwarry Saleyards Pty Ltd 06 July 2020 Page 6
AIR QUALITY ASSESSMENT FOR HRA Longwarry Saleyards Pty Ltd
EMISSIONS INVENTORY
3. EMISSIONS INVENTORY
3.1 Emissions Summary
Table 3.1 provides a summary of the sources of dust emissions on-site, the means of emission rate calculation and any assumptions or comments regarding these calculations.
Table 3.1: Sources of dust emissions at site
Emission Source Emission Rate Calculation Assumptions/Comments
Cattle movements in laneways Estimated in WindTrax Section 3.2
Cattle movements in sale pens and delivery pens
Estimated in WindTrax Section 3.2
Handling of waste stockpiles (turning and removal) and turning of laneways.
Calculated using AP-42 Emission Estimation Manual 13.2.4 Aggregate Handling And Storage Piles, page 4.
Lab analysis shows high moisture content of samples, falling out of the moisture range of AP-42 manual. The maximum moisture content in the expected range (4.8%) was used, with a control factor of 50% to account for the high moisture content.
Wind blown emissions from waste stockpiles
Calculated using US EPA AP-42 Chapter 13.2.5 Industrial Wind Erosion, equations 2, 3, and 4.
Threshold friction velocity was determined from sieve analysis to determine the wind erosion emission factor (Table 13.2.5-1). However there were no emissions for the calculated threshold velocity.
3.2 Emission Rates
3.2.1 Cattle Movement in Laneways and Sale/Delivery Pens Windtrax was used to back calculate emission factors from cattle movement in sale/delivery pens and through the laneways.
Monitoring data from Dusttrak aerosol monitors set up at a sale pen and a laneway was inserted into the Windtrax model and resulted in the emission factors presented in Table 3.4.
The 1-minute wind speed component was sourced from the Bureau of Meteorology (BoM) at Mortlake Racecourse, which is located next door to the WVLX. Wind speed was recalculated to account for the change in height between the anemometer (10 m) and the monitor (1.5 m), and for the increase in surface roughness at the anemometer location (0.1) compared to the conditions inside the WVLX shed (0.4).

www.erm.com Version: Final Project No.: 0554561 Client: Longwarry Saleyards Pty Ltd 06 July 2020 Page 7
AIR QUALITY ASSESSMENT FOR HRA Longwarry Saleyards Pty Ltd
EMISSIONS INVENTORY
Table 3.2: Laneway Dusttrak monitoring data
Time (hh:mm)
Upwind PM10 (µg/m3)
Downwind PM10 (µg/m3)
Number of Animals
Wind Speed (m/s)
Wind Direction (degrees)
WS at 10 m using power law1
WS at 1.5 m using power law1
WS Ratio (WSR)1
Recalculated WS (m/s)1
10:18 9 12 4 6.4 301 73.7 3.29 0.04 0.29 10:19 14 14 5 4.8 304 55.3 3.15 0.06 0.27 10:20 19 20 7 5.6 308 64.5 3.22 0.05 0.28 10:21 11 16 5 6.1 310 70.2 3.26 0.05 0.28 10:22 9 14 11 4.8 305 55.3 3.15 0.06 0.27 10:23 9 22 6 5.2 302 59.9 3.19 0.05 0.28 10:24 9 21 8 4.8 308 55.3 3.15 0.06 0.27 10:25 9 14 7 4.6 300 53.0 3.13 0.06 0.27 10:26 10 15 10 5.6 302 64.5 3.22 0.05 0.28 10:27 9 18 1 5.4 303 62.2 3.21 0.05 0.28 10:28 9 11 8 5.3 307 61.0 3.20 0.05 0.28 10:29 9 12 6 6.2 307 71.4 3.27 0.05 0.28 10:30 9 15 4 6.0 309 69.1 3.25 0.05 0.28 10:31 9 13 6 5.5 306 63.3 3.21 0.05 0.28 10:32 9 16 8 6.1 306 70.2 3.26 0.05 0.28 10:33 9 15 6 6.1 319 70.2 3.26 0.05 0.28 10:34 9 36 7 6.6 318 76.0 3.30 0.04 0.29 10:35 9 14 3 6.3 307 72.5 3.28 0.05 0.28 10:36 9 13 9 7.0 304 80.6 3.33 0.04 0.29 10:37 9 15 11 6.3 308 72.5 3.28 0.05 0.28 10:38 9 11 4 6.3 304 72.5 3.28 0.05 0.28 10:39 10 10 0 6.9 302 79.4 3.32 0.04 0.29 10:40 9 17 3 7.0 307 80.6 3.33 0.04 0.29 10:41 9 17 0 5.3 307 61.0 3.20 0.05 0.28 10:42 9 20 4 4.9 313 56.4 3.16 0.06 0.27 10:43 9 16 5 5.4 314 62.2 3.21 0.05 0.28 10:44 9 21 10 5.4 316 62.2 3.21 0.05 0.28 10:45 9 20 4 5.9 317 67.9 3.25 0.05 0.28 10:46 9 19 9 6.4 305 73.7 3.29 0.04 0.29 10:47 9 15 6 5.6 310 64.5 3.22 0.05 0.28 10:48 10 23 20 5.6 310 64.5 3.22 0.05 0.28 10:49 9 15 5 6.6 313 76.0 3.30 0.04 0.29 10:50 9 24 12 5.7 314 65.6 3.23 0.05 0.28 10:51 10 17 6 5.6 315 64.5 3.22 0.05 0.28 10:52 10 15 9 7.2 314 82.9 3.34 0.04 0.29 10:53 10 15 13 7.1 311 81.7 3.33 0.04 0.29
Notes: 1. (Chang Xu, 22 August 2018)

www.erm.com Version: Final Project No.: 0554561 Client: Longwarry Saleyards Pty Ltd 06 July 2020 Page 8
AIR QUALITY ASSESSMENT FOR HRA Longwarry Saleyards Pty Ltd
EMISSIONS INVENTORY
Table 3.3: Sale/Delivery pen Dusttrak monitoring data
Time (hh:mm)
Upwind PM10 (µg/m3)
Downwind PM10 (µg/m3)
Wind Speed (m/s)
Wind Direction (degrees)
WS at 10 m using power law1
WS at 1.5 m using power law1
WS Ratio (WSR)1
Recalculated WS (m/s)1
11:58 4 65 6.0 306 69.1 3.25 0.05 0.28 11:59 4 47 4.8 308 55.3 3.15 0.06 0.27 12:00 4 21 4.7 312 54.1 3.14 0.06 0.27 12:01 6 21 6.5 316 74.8 3.29 0.04 0.29 12:02 4 22 5.7 311 65.6 3.23 0.05 0.28 12:03 4 34 5.5 307 63.3 3.21 0.05 0.28 12:04 4 31 4.7 305 54.1 3.14 0.06 0.27 12:05 4 27 4.2 297 48.4 3.09 0.06 0.27 12:06 4 48 4.2 311 48.4 3.09 0.06 0.27 12:07 4 27 4.0 301 46.1 3.07 0.07 0.27 12:08 4 17 5.3 307 61.0 3.20 0.05 0.28 12:09 4 28 4.8 311 55.3 3.15 0.06 0.27 12:10 4 31 5.5 310 63.3 3.21 0.05 0.28 12:11 6 49 6.2 291 71.4 3.27 0.05 0.28 12:12 4 81 6.1 297 70.2 3.26 0.05 0.28
Notes: 1. (Chang Xu, 22 August 2018)
Table 3.4: Site specific emission factors Source Emission factor units
TSP1 PM10
Laneway 0.000204 0.0001267 g/m2/s
Sale/delivery pen 0.0000024 0.0000015 g/m2/s Notes 1. TSP calculated by assuming PM10 is 61% of TSP (Galvin, Skerman, & Gallagher, 2005)
3.2.2 Waste Stockpiles and Soft Floor
3.2.2.1 Turning and Removal There may be emissions of dust from the waste stockpiles when they are turned or removed from site. Turning of the waste stockpiles will be undertaken on an as-needs basis and removal from site is likely to occur every 3-4 weeks. Turning of the soft floor will occur after every sale, as an odour management measure to move the urine and manure through the soft floor material. However, turning will only occur to areas disturbed by the sale.
The turning of the soft floor and turning and/or removal of the waste stockpile were calculated using the AP-42 Emission Estimation Manual 13.2.4 Aggregate Handling and Storage Piles (US EPA, 2006), equation for materials handling (Equation 1).
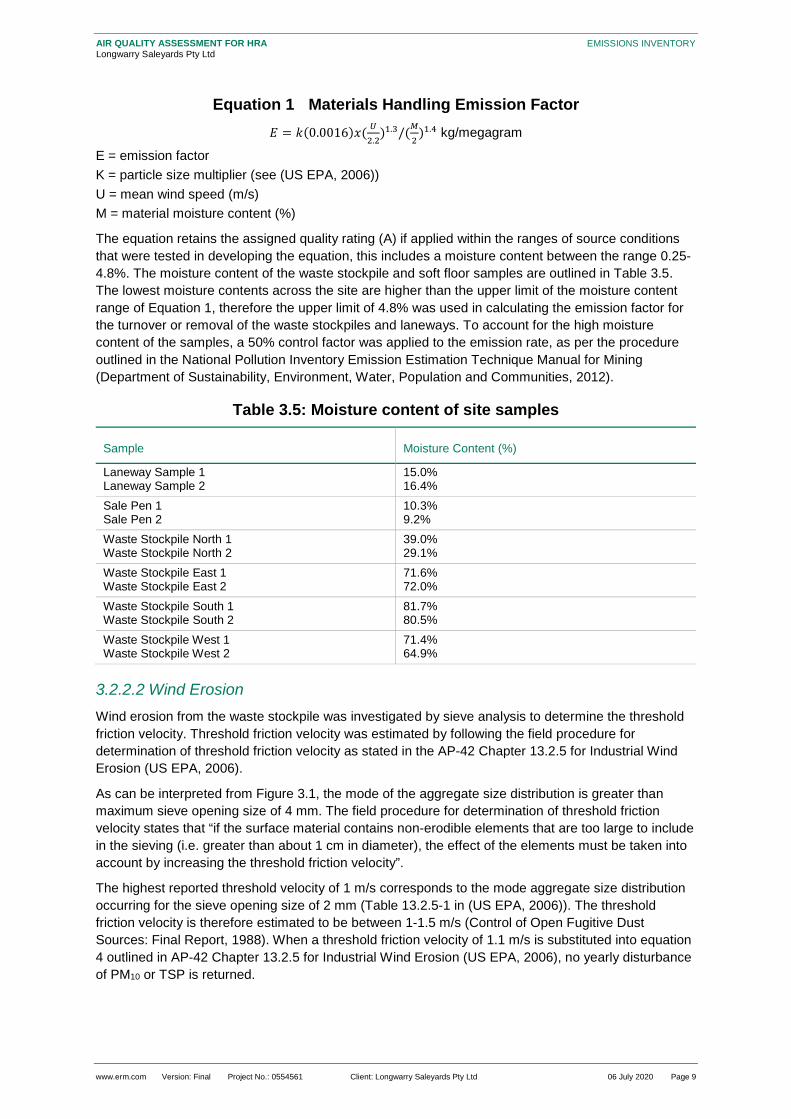
www.erm.com Version: Final Project No.: 0554561 Client: Longwarry Saleyards Pty Ltd 06 July 2020 Page 9
AIR QUALITY ASSESSMENT FOR HRA Longwarry Saleyards Pty Ltd
EMISSIONS INVENTORY
Equation 1 Materials Handling Emission Factor 𝐸𝐸 = 𝑘𝑘(0.0016)𝑥𝑥( 𝑈𝑈
2.2)1.3/(𝑀𝑀
2)1.4 kg/megagram
E = emission factor K = particle size multiplier (see (US EPA, 2006)) U = mean wind speed (m/s) M = material moisture content (%)
The equation retains the assigned quality rating (A) if applied within the ranges of source conditions that were tested in developing the equation, this includes a moisture content between the range 0.25-4.8%. The moisture content of the waste stockpile and soft floor samples are outlined in Table 3.5. The lowest moisture contents across the site are higher than the upper limit of the moisture content range of Equation 1, therefore the upper limit of 4.8% was used in calculating the emission factor for the turnover or removal of the waste stockpiles and laneways. To account for the high moisture content of the samples, a 50% control factor was applied to the emission rate, as per the procedure outlined in the National Pollution Inventory Emission Estimation Technique Manual for Mining (Department of Sustainability, Environment, Water, Population and Communities, 2012).
Table 3.5: Moisture content of site samples
Sample Moisture Content (%)
Laneway Sample 1 Laneway Sample 2
15.0% 16.4%
Sale Pen 1 Sale Pen 2
10.3% 9.2%
Waste Stockpile North 1 Waste Stockpile North 2
39.0% 29.1%
Waste Stockpile East 1 Waste Stockpile East 2
71.6% 72.0%
Waste Stockpile South 1 Waste Stockpile South 2
81.7% 80.5%
Waste Stockpile West 1 Waste Stockpile West 2
71.4% 64.9%
3.2.2.2 Wind Erosion Wind erosion from the waste stockpile was investigated by sieve analysis to determine the threshold friction velocity. Threshold friction velocity was estimated by following the field procedure for determination of threshold friction velocity as stated in the AP-42 Chapter 13.2.5 for Industrial Wind Erosion (US EPA, 2006).
As can be interpreted from Figure 3.1, the mode of the aggregate size distribution is greater than maximum sieve opening size of 4 mm. The field procedure for determination of threshold friction velocity states that “if the surface material contains non-erodible elements that are too large to include in the sieving (i.e. greater than about 1 cm in diameter), the effect of the elements must be taken into account by increasing the threshold friction velocity”.
The highest reported threshold velocity of 1 m/s corresponds to the mode aggregate size distribution occurring for the sieve opening size of 2 mm (Table 13.2.5-1 in (US EPA, 2006)). The threshold friction velocity is therefore estimated to be between 1-1.5 m/s (Control of Open Fugitive Dust Sources: Final Report, 1988). When a threshold friction velocity of 1.1 m/s is substituted into equation 4 outlined in AP-42 Chapter 13.2.5 for Industrial Wind Erosion (US EPA, 2006), no yearly disturbance of PM10 or TSP is returned.

www.erm.com Version: Final Project No.: 0554561 Client: Longwarry Saleyards Pty Ltd 06 July 2020 Page 10
AIR QUALITY ASSESSMENT FOR HRA Longwarry Saleyards Pty Ltd
EMISSIONS INVENTORY
Therefore, wind erosion was not deemed to be a source of emission from the stockpiles due to the high moisture content (Section 3.2.2.1) and large diameter of the non-erodible elements of the material.
Figure 3.1: Example of sieve analysis output
3.3 Summary of Emission Rates used in this Assessment
A summary of all the emission rates used in the modelling scenarios is presented in Table 3.6.
Table 3.6: Emission rates used in this Assessment Source Emission Factor Units Source
Area (m2)
Turned material
(t/y)
Emission Rate Units
TSP PM10 TSP PM10
Laneway – arrival to sale pen
0.000204 0.0001267 g/m2/s 429 0.087 0.0543 g/s
Laneway – sale pen to delivery
0.000204 0.0001267 g/m2/s 200 0.041 0.0253 g/s
Sale/delivery pens 0.0000024 0.0000015 g/m2/s 5000 0.012 0.0074 g/s
Waste stockpile 5.2x10-04 2.4x10-04 kg/t 311 2.54x10-06 1.20x10-06 g/s
Soft floor 5.2x10-04 2.4x10-04 kg/t 266 2.17x10-06 1.03x10-06 g/s

www.erm.com Version: Final Project No.: 0554561 Client: Longwarry Saleyards Pty Ltd 06 July 2020 Page 11
AIR QUALITY ASSESSMENT FOR HRA Longwarry Saleyards Pty Ltd
EMISSIONS INVENTORY
3.3.1 Emission Rate Assumptions The assumptions included in the modelling are further outlined in Section 4.3.1. The assumptions outlined below relate to how the emission rates have been derived from the on-site monitoring.
Sale pen: the emission rate derived from the monitoring involved cattle moving in the pens (ie daytime/disrupted movement, no sleeping/resting occurred during the monitoring period). Therefore, this emission rate does not apply to night time periods where the cattle are resting. Given the emission rate of cattle moving about the pens is so low, it was considered appropriate not to include an emission rate during hours when the cattle are resting.
Laneways: the emission rate derived from monitoring includes periods of cattle movement down the laneways, horse movements and the time between animal movements. The emission rate therefore can be applied to all time periods when the laneways are being used to move cattle assuming a rate of approximately 7 animals per minute.
3.4 Source Parameters
All sources of dust emissions on-site have been modelled in AERMOD as volume sources. The release height of the plume and the dimensions of the initial vertical and horizontal spread of the plume for each source are outlined in Table 3.7. The sources in the dispersion model have been set up in the actual position of the laneways and sale pens on site, to represent the animal activity where it takes place (i.e. near approximate centre of the site).
Table 3.7: Source parameters
Source Release Height (m)
Initial Vertical Spread Initial Horizontal Spread
Laneway – arrival to sale pen 0.01 1.16 0.23
Laneway – sale pen to delivery 0.01 1.16 0.23
Sale/delivery pens 0.01 4.65 0.23
Waste stockpile 1.5 2.33 0.7
Soft floor 0.5 4.65 0.23

www.erm.com Version: Final Project No.: 0554561 Client: Longwarry Saleyards Pty Ltd 06 July 2020 Page 12
AIR QUALITY ASSESSMENT FOR HRA Longwarry Saleyards Pty Ltd
MODELLING METHODOLOGY
4. MODELLING METHODOLOGY
4.1 Meteorological Modelling
In accordance with EPA Publication 1551, atmospheric dispersion modelling with the regulatory dispersion model requires a five year meteorological dataset. EPA Publication 1550 considers that in order of preference, meteorological data is to be obtained from on–site measurement, from a nearby Bureau of Meteorology station within 5 km of the site or using prognostic modelling using TAPM or MM5.
Meteorological data is not collected at the site and there is no BoM or EPA observation station within a 5 km radius of the site. Consequently, prognostic modelling was adopted to generate the required meteorological dataset.
EPA Publication 1550 suggests the use of TAPM or MM5 as the prognostic model. It should be noted that the TAPM model is no longer being developed by CSIRO and the MM5 model was replaced by the Weather Research and Forecasting Model (WRF). To provide a meteorological file developed using the latest understanding of the science, prognostic modelling was completed using WRF.
WRF (Version 4.0) is a widely-used three-dimensional numerical meteorological model which contains non-hydrostatic dynamics, and a variety of physics options for parameterizing cumulus clouds, microphysics, the planetary boundary layer, and atmospheric radiation. WRF is also used to generate three dimensional gridded meteorological data (such as hourly wind and temperature fields) in the modelling domain through the treatment and assimilation of available surface/upper air/precipitation observations. WRF provides surface level and vertical profiles of parameters that can be used within air dispersion modelling, when passed through the CALWRF or MMIF processing programs to generate suitable meteorological files for CALMET or AERMOD respectively.
In accordance with the requirements of EPA Publication 1550, WRF modelling has, to date, been conducted for the five year period (2015-2019 inclusive) to simulate meteorological conditions at the project site. The process of developing the WRF datasets involved a nested approach centred on the Site. Table 4.1 describes the resolution and extent of each grid. The WRF prognostic model, incorporated available observational data from surrounding observation stations for the period 2015 to 2019 inclusive down to a resolution of 1 km (as required by EPA Publication 1550 for locations with non-complex terrain). The output from the prognostic modelling was processed through the USEPA processing tool MMIF to translate the output into a format compatible with AERMOD (Table 4.1).
Table 4.1: WRF modelling parameters
Grid Resolution Extent
1 27 km 2700 km X 2700 km
2 9 km 1080 km X 1080 km
3 3 km 216 km X 216 km
4 1 km 72 km X 72 km

www.erm.com Version: Final Project No.: 0554561 Client: Longwarry Saleyards Pty Ltd 06 July 2020 Page 13
AIR QUALITY ASSESSMENT FOR HRA Longwarry Saleyards Pty Ltd
MODELLING METHODOLOGY
4.1.1 WRF Setup
4.1.1.1 Initialisation Datasets WRF meteorological datasets were developed for the period 2015 to 2019 inclusive using data from the European Centre for Medium Weather Forecasts global reanalysis dataset, known as ERA5. Data from the ERA5 dataset is available for the globe once every 3 hours on a 31 km grid.
The ERA5 dataset provides information both for the surface conditions and 137 mandatory vertical levels. There are over 25 different variables including geopotential height, temperature, relative humidity, u- and v- wind components, etc.
The ERA5 dataset assimilates a great deal of observational data, including surface pressure, sea level pressure, geopotential height, temperature, sea surface temperature, soil values, ice cover, relative humidity, u and v wind components, vertical motion, vorticity, winds and in-situ data such as moisture from radiosondes and pressure from surface observations. Also included in these datasets are additional precipitation data, profiler data, dropsondes, pilot balloons, aircraft temperatures and winds, land surface and moisture data and cloud drift winds from geostationary satellites. To assist in improving the performance of the WRF simulation, the ERA5 dataset was provided to the WRF Preprocessing System (WPS) stage to provide WRF with more initial guess data both spatially and temporally at the start of the simulation.
Geospatial WRF Inputs for the 36/12 km Grids WRF geospatial inputs are available from the US National Center for Atmospheric Research (NCAR) with default sets of static data for terrain, vegetation/land use and soil type. NCAR distributes various resolutions of global terrain and land-use data bases to support WRF simulations. The data bases are:
5-minute (about 9.25 km in mid-latitudes);
2-minute (about 4.00 km in mid-latitudes);
30-sec (about 0.900 km in mid-latitudes); and
15-sec (about 0.450 km in mid-latitudes), which is only available for MODIS land use category.
These data were assigned to ERM’s WRF simulations based on the resolution of the simulation domain.
In addition to the above inputs, finer resolution inputs were derived for land use and terrain using local datasets to provide better representation of landuse to the model.
Geospatial WRF Inputs for Finer Grids The conventional approach among the air quality modelling community is that WRF’s highest resolution simulations are performed at 1 km gridded resolution with terrain and land use datasets at 30 arc seconds (approx. 900 m) resolution. WRF simulations are not conventionally performed at less than 1 km gridded resolution because of the difficulty in utilizing higher resolution datasets in WRF. Executing WRF at resolutions less than 1 km with the default datasets will not result in an analysis that is inherently more refined, since the input terrain and land use data resolution is coarser than the resolution being output by WRF. Therefore, there is no benefit in performing the simulation at finer resolutions without providing higher resolution geospatial datasets.
Land Use For this study, an approach to utilise locally sourced land use at 1 km resolution for grids 2, 3 and 4 (10 km, 3km and 1km). Land use inputs to the WRF model were obtained from Australian Collaborative Land Use and Management Program (ACLUMP). These landuse datasets were then translated into the MODIS 21 category as required by WRF.
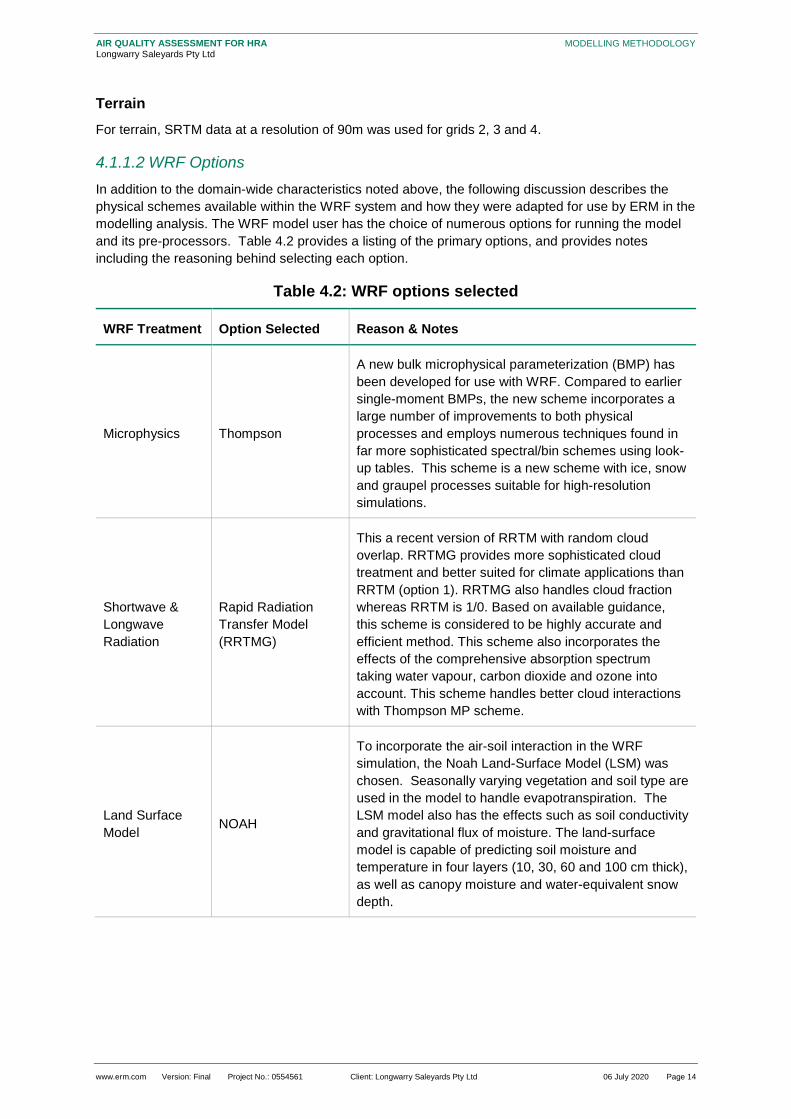
www.erm.com Version: Final Project No.: 0554561 Client: Longwarry Saleyards Pty Ltd 06 July 2020 Page 14
AIR QUALITY ASSESSMENT FOR HRA Longwarry Saleyards Pty Ltd
MODELLING METHODOLOGY
Terrain For terrain, SRTM data at a resolution of 90m was used for grids 2, 3 and 4.
4.1.1.2 WRF Options In addition to the domain-wide characteristics noted above, the following discussion describes the physical schemes available within the WRF system and how they were adapted for use by ERM in the modelling analysis. The WRF model user has the choice of numerous options for running the model and its pre-processors. Table 4.2 provides a listing of the primary options, and provides notes including the reasoning behind selecting each option.
Table 4.2: WRF options selected
WRF Treatment Option Selected Reason & Notes
Microphysics Thompson
A new bulk microphysical parameterization (BMP) has been developed for use with WRF. Compared to earlier single-moment BMPs, the new scheme incorporates a large number of improvements to both physical processes and employs numerous techniques found in far more sophisticated spectral/bin schemes using look-up tables. This scheme is a new scheme with ice, snow and graupel processes suitable for high-resolution simulations.
Shortwave & Longwave Radiation
Rapid Radiation Transfer Model (RRTMG)
This a recent version of RRTM with random cloud overlap. RRTMG provides more sophisticated cloud treatment and better suited for climate applications than RRTM (option 1). RRTMG also handles cloud fraction whereas RRTM is 1/0. Based on available guidance, this scheme is considered to be highly accurate and efficient method. This scheme also incorporates the effects of the comprehensive absorption spectrum taking water vapour, carbon dioxide and ozone into account. This scheme handles better cloud interactions with Thompson MP scheme.
Land Surface Model NOAH
To incorporate the air-soil interaction in the WRF simulation, the Noah Land-Surface Model (LSM) was chosen. Seasonally varying vegetation and soil type are used in the model to handle evapotranspiration. The LSM model also has the effects such as soil conductivity and gravitational flux of moisture. The land-surface model is capable of predicting soil moisture and temperature in four layers (10, 30, 60 and 100 cm thick), as well as canopy moisture and water-equivalent snow depth.

www.erm.com Version: Final Project No.: 0554561 Client: Longwarry Saleyards Pty Ltd 06 July 2020 Page 15
AIR QUALITY ASSESSMENT FOR HRA Longwarry Saleyards Pty Ltd
MODELLING METHODOLOGY
WRF Treatment Option Selected Reason & Notes
Planetary Boundary Layer (PBL)
Yonsei University (YSU)
This scheme has the enhanced stable boundary layer diffusion algorithm is also devised that allows deeper mixing in windier conditions. It has the ability to predict & simulates vertical mixing. This scheme also seems to show better performance during stable conditions. This scheme was used for WRF analyses with resolutions less than 1.33 km grid resolution.
Cumulus Parameterization
Kain-Fritsch in 36 km, 12 km, 4km
This scheme generally focuses on column moisture, temperature tendencies and surface convective rainfall. It is recommended that cumulus parameterization should not be used at grid sizes < 5-10 km, as the smaller grid size is sufficient to resolve updrafts and downdrafts. Therefore, this scheme was used for WRF analyses with resolutions less than 4 km grid resolution.
FDDA
Analysis nudging was applied to winds, temperature & moisture in the 36 & 12 km domains; Temp & moisture nudging was turned off within the PBL; Obs-nudging was used for the 4-km resolution WRF analysis.
FDDA is a method of performing WRF simulations with the full-physics model while blending local observations. By doing so, model equations maintain dynamic consistency while at the same time restraining the model’s solutions from deviating too strongly from observations or from a gridded analysis and make up for errors and gaps in the initial analysis and deficiencies in model physics. There are two types of nudging in WRF:
Analysis nudging – gently forces the model solution toward gridded fields and also make use of three-dimensional analyses and surface analyses.
Observation nudging (“obs nudging”) - gently forces the model solution toward individual observations, with the influence of the observations spread in space and time.
4.1.2 Observed Meteorological Data Meteorological observations from both upper air and surface were included in the WRF FDDA simulation.
Upper Air Observational Weather Data are composed of weather reports from radiosondes, pibals and aircraft reports from the Global Telecommunications System (GTS) and satellite data from the National Environmental Satellite Data and Information Service (NESDIS) (UCAR, 2018). This dataset includes pressure, geopotential height, air temperature, dew point temperature, wind direction and speed. Data may be available at up to 20 mandatory levels from 1000 hPa to 1 hPa, plus a few significant levels. Report intervals range from hourly to every twelve hours.
Surface meteorological data (UCAR, 2018) include variables like pressure, air temperature, dew point temperature, wind direction and speed at the ground level. Report intervals range from hourly to every three hours.

www.erm.com Version: Final Project No.: 0554561 Client: Longwarry Saleyards Pty Ltd 06 July 2020 Page 16
AIR QUALITY ASSESSMENT FOR HRA Longwarry Saleyards Pty Ltd
MODELLING METHODOLOGY
4.1.3 WRF Post Processing The USEPA MMIF program was used to translate WRF output into AERMOD compatible surface and upper air files. The default settings in the MMIF program were used in this process.
4.2 Predicted Wind Roses
To assess if the meteorological data provided by the dispersion model represents the likely conditions surrounding the site, wind roses were extracted for the site. The results are shown in Figure 4.1.
Longwarry is located on the western edge of the La Trobe Valley. The high frequency of easterly winds is the result of funnelling of the easterly flows along the La Trobe Valley. An easterly sea breeze is found to regularly penetrate over 100 km up the east-west-oriented valley.

www.erm.com Version: Final Project No.: 0554561 Client: Longwarry Saleyards Pty Ltd 06 July 2020 Page 17
AIR QUALITY ASSESSMENT FOR HRA Longwarry Saleyards Pty Ltd
MODELLING METHODOLOGY
All years
2015
2016
2017
2018
2019
Year Average Wind Speed (m/s)
Calms (%)
All years (2015 – 2019) 3.1 5.0
2015 3.0 5.5
2016 3.2 5.0
2017 3.0 5.8
2018 3.1 5.0
2019 3.2 4.7
Figure 4.1: Wind roses

www.erm.com Version: Final Project No.: 0554561 Client: Longwarry Saleyards Pty Ltd 06 July 2020 Page 18
AIR QUALITY ASSESSMENT FOR HRA Longwarry Saleyards Pty Ltd
MODELLING METHODOLOGY
4.3 Dispersion Modelling
Dispersion modelling of dust emissions estimated from the Longwarry saleyard was undertaken using AERMOD version 18081.
The surrounding trees and noise walls were not included or represented in the model (ie by changing surface roughness or terrain height) as these modifications are not capably handled by this dispersion model. The exclusion of the trees and noise walls provides additional conservatism in the model outputs, as they are likely to aid in the reducing emissions at nearby sensitive receptors. The presence of the roof has been included, in part, by the dimensions of the initial plume.
Two modelling scenarios were run in AERMOD to capture the emissions of dust from the site, they are described by:
Scenario 1 – Worst case: conservative emissions applied to maximum hours per day (assume a sale every day) to provide 24 hour maximum PM10 concentrations to determine the year with the most impacted receptor; and
Scenario 2 – Realistic case: conservative emissions applied to actual hours per day (146 sale days per year) to provide 24 hour average concentrations at receptors in timeseries, and annual averages of PM10, PM10 for E. coli, total solid particulates (TSP), and dust deposition.
To provide an appropriate output for sources likely to contribute to E. coli, PM10 concentrations were output for all sources except the laneways. Cattle are rarely present for sufficient time in the laneways to excrete waste that might contribute to the presence of E. coli in the PM10 fraction.
Table 4.3: Dispersion modelling scenarios
Scenario Sources Maximum Hours of Operation
Days Applied
Scenario 1:
Sale day every day of year
actual emissions for actual hours per day applied to every day of year
Laneway – arrival to sale pen
2pm to 10pm Every day of year
Laneway – sale pen to delivery
8am to 6pm Every day of year
Sale/delivery pens 8am to 10pm Every day of year
Waste stockpile 8am to 6pm Every day of year
Soft floor 2pm to 6pm Every day of year
Scenario 2:
146 sale days per year
Store sales with a max 2000 head/sale occur every second Thursday during September to April.
All “other” or non-max sales are, at a minimum, the annual average of 699 head per sale.
Laneway – arrival to sale pen
2pm to 10pm Sunday Monday Every second Wednesday
Laneway – sale pen to delivery
8am to 6pm Monday Tuesday Every second Thursday 1st and 3rd Friday of the month
Sale/delivery pens (described as a max of 25 pens)
2pm to 10pm Sunday Every second Wednesday
8am to 10pm Monday Tuesday Every second Thursday 1st and 3rd Friday of the month
Waste stockpile 8am to 6pm Weekdays
Soft floor 2pm to 6pm Weekdays

www.erm.com Version: Final Project No.: 0554561 Client: Longwarry Saleyards Pty Ltd 06 July 2020 Page 19
AIR QUALITY ASSESSMENT FOR HRA Longwarry Saleyards Pty Ltd
MODELLING METHODOLOGY
For Scenario 2, a variable emission file was generated that varied the following factors:
Maximum sales:
- between September and April, it was assumed that of the stock sales that occur every second Thursday, two per month would sell a maximum of 2000 head of cattle.
- The maximum hours of operation of the laneways and sale/delivery pens were applied.
- The maximum number of sale/delivery pens were occupied each sale (described as 25 pens in total, these represent the area of 170 selling pens).
Average sales:
- between May and August, all the sales (including the stock sales) would, at a minimum, sell the annual average of 699 cattle per sale.
- The hours of operation of the laneways and sale/delivery pens were reduced according to the cattle sold (ie 699/2000 x hours of operation), to give the reduced hours of operation in Table 4.4.
- Likewise, the number of sale/delivery pens were occupied each sale were reduced according to the cattle sold.
Table 4.4 gives a breakdown of the head of cattle estimated to be sold in any month of the year. When the two 2000 head store sales per month are removed from the month, and the number of remaining sales are adjusted to match the number of sale days (Mondays, Tuesdays, every second Thursdays, and 1st and 3rd Fridays) in the month for the model year 2015, the average cattle per sale for the remaining sale days was calculated. If the cattle per sale is below the annual average cattle per sale of 699 in any month, then the annual average cattle per sale was used in preference for conservatism. This leads to an additional 12% (an additional 15,456 for a total of 147,426 above the projected 131,970) of cattle per year through the site. From the adjusted average head of cattle per other sales, the reduction in hours for each of the sources can be calculated. The number of sale pens has also be revised to account for the reduction in cattle onsite for these sales.
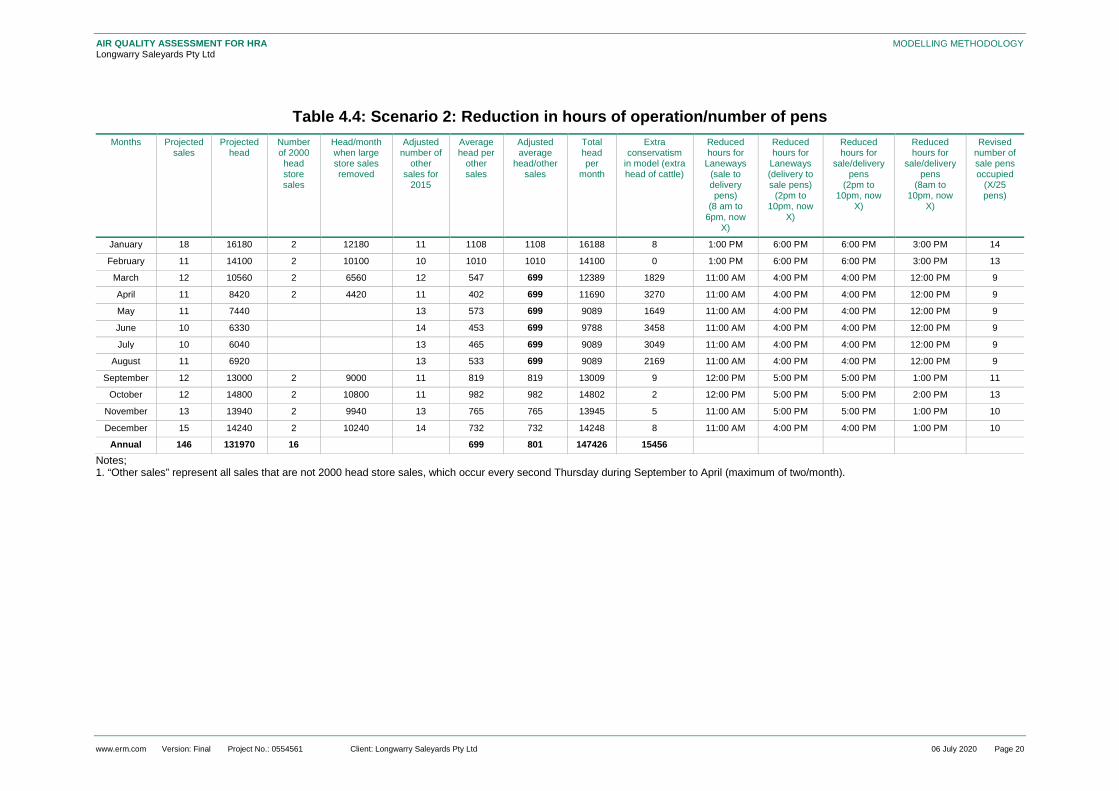
www.erm.com Version: Final Project No.: 0554561 Client: Longwarry Saleyards Pty Ltd 06 July 2020 Page 20
AIR QUALITY ASSESSMENT FOR HRA Longwarry Saleyards Pty Ltd
MODELLING METHODOLOGY
Table 4.4: Scenario 2: Reduction in hours of operation/number of pens Months Projected
sales Projected
head Number of 2000 head store sales
Head/month when large store sales removed
Adjusted number of
other sales for
2015
Average head per
other sales
Adjusted average
head/other sales
Total head per
month
Extra conservatism
in model (extra head of cattle)
Reduced hours for
Laneways (sale to delivery pens)
(8 am to 6pm, now
X)
Reduced hours for
Laneways (delivery to sale pens)
(2pm to 10pm, now
X)
Reduced hours for
sale/delivery pens
(2pm to 10pm, now
X)
Reduced hours for
sale/delivery pens
(8am to 10pm, now
X)
Revised number of sale pens occupied
(X/25 pens)
January 18 16180 2 12180 11 1108 1108 16188 8 1:00 PM 6:00 PM 6:00 PM 3:00 PM 14
February 11 14100 2 10100 10 1010 1010 14100 0 1:00 PM 6:00 PM 6:00 PM 3:00 PM 13
March 12 10560 2 6560 12 547 699 12389 1829 11:00 AM 4:00 PM 4:00 PM 12:00 PM 9
April 11 8420 2 4420 11 402 699 11690 3270 11:00 AM 4:00 PM 4:00 PM 12:00 PM 9
May 11 7440 13 573 699 9089 1649 11:00 AM 4:00 PM 4:00 PM 12:00 PM 9
June 10 6330 14 453 699 9788 3458 11:00 AM 4:00 PM 4:00 PM 12:00 PM 9
July 10 6040 13 465 699 9089 3049 11:00 AM 4:00 PM 4:00 PM 12:00 PM 9
August 11 6920 13 533 699 9089 2169 11:00 AM 4:00 PM 4:00 PM 12:00 PM 9
September 12 13000 2 9000 11 819 819 13009 9 12:00 PM 5:00 PM 5:00 PM 1:00 PM 11
October 12 14800 2 10800 11 982 982 14802 2 12:00 PM 5:00 PM 5:00 PM 2:00 PM 13
November 13 13940 2 9940 13 765 765 13945 5 11:00 AM 5:00 PM 5:00 PM 1:00 PM 10
December 15 14240 2 10240 14 732 732 14248 8 11:00 AM 4:00 PM 4:00 PM 1:00 PM 10
Annual 146 131970 16 699 801 147426 15456 Notes; 1. “Other sales” represent all sales that are not 2000 head store sales, which occur every second Thursday during September to April (maximum of two/month).

www.erm.com Version: Final Project No.: 0554561 Client: Longwarry Saleyards Pty Ltd 06 July 2020 Page 21
AIR QUALITY ASSESSMENT FOR HRA Longwarry Saleyards Pty Ltd
MODELLING METHODOLOGY
4.3.1 Modelling Assumptions The modelling of Scenario 2 includes many assumptions, including the following:
Additional cattle per sale than projected are included in Scenario 2 between March – August.
There are expected to be approximately ten sales per year of the maximum of 2000 cattle per sale would occur on a Thursday. Scenario 2 assumes that 16 of these maximum sales occur throughout the year between September and April.
The reduced hours and pens occupied calculated in Table 4.4 have been rounded up (ie if a partial hour/pen is calculated then the whole hour/pen is added).
When there are less than 25 pens occupied, the selected pens have been spread out across all possible pens in a random fashion.
The emission rate for one area of the laneway that was monitored has been applied to the entire length. This emission rate relates to the movement of approximately 7 animals per minute past each area.
Movement along the laneways has been assumed to be the same rate of movement of cattle along the laneway as during the monitoring undertaken (7 animals per minute).
Cattle movement in pens will occur during the active movement of cattle (during unloading into pens, and during the day time) but not when cattle are resting at night. No emission rates have been applied to the sale/delivery pens overnight.
All sale/delivery pens are full for two stock sales per month (2000 cattle/sale), otherwise the number of pens occupied has been reduced (but rounded up) according to the number of cattle.
Stockpiles won’t be turned over or removed during every hour of operation, but these emissions may occur in these hours and so have been applied to all possible hours they may occur.
Soft floor emissions are only likely to occur on the hours immediately after a sale, however they have been applied to all possible post-sale hours of operation (ie 2 to 6 pm weekdays).
4.3.2 Particle Size Distribution Specific particle size distribution was applied when modelling the particulate matter deposition for laneways, sale/delivery pens and the waste stockpile. Samples were collected and laser analysed down to 0.212 mm.
Table 4.5: Particle size distribution Particle Diameter (μm) Mass Fraction
Laneways Sale/Delivery Pen Waste Stockpile1
1.66 0.02 0.02 0.00
2.51 0.05 0.04 0.00
3.80 0.06 0.06 0.08
5.01 0.05 0.05 0.06
6.61 0.05 0.06 0.06
10.00 0.11 0.11 0.11
15.14 0.16 0.17 0.20
19.95 0.15 0.16 0.20
30.20 0.35 0.33 0.29
Total 1.0 1.0 1.0
Notes: 1. The sample taken from the northern side of the stockpile was assessed for particle size distribution as it was the driest
sample (Table 3.5).
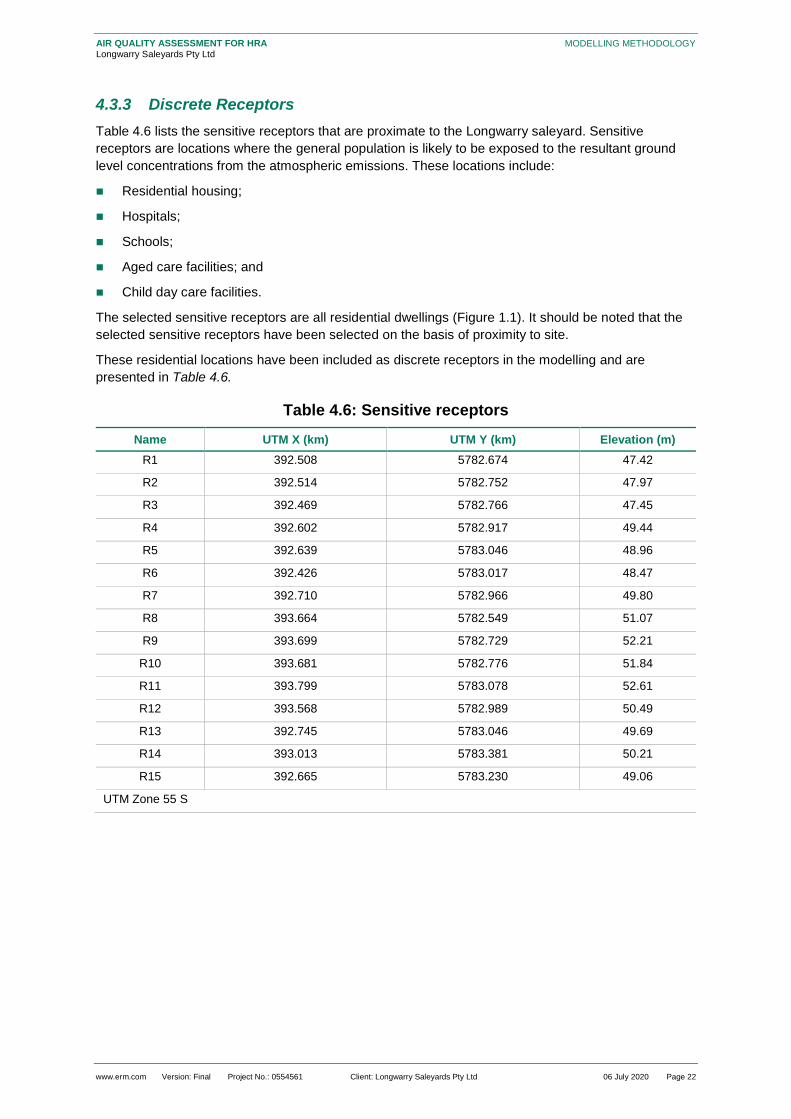
www.erm.com Version: Final Project No.: 0554561 Client: Longwarry Saleyards Pty Ltd 06 July 2020 Page 22
AIR QUALITY ASSESSMENT FOR HRA Longwarry Saleyards Pty Ltd
MODELLING METHODOLOGY
4.3.3 Discrete Receptors Table 4.6 lists the sensitive receptors that are proximate to the Longwarry saleyard. Sensitive receptors are locations where the general population is likely to be exposed to the resultant ground level concentrations from the atmospheric emissions. These locations include:
Residential housing;
Hospitals;
Schools;
Aged care facilities; and
Child day care facilities.
The selected sensitive receptors are all residential dwellings (Figure 1.1). It should be noted that the selected sensitive receptors have been selected on the basis of proximity to site.
These residential locations have been included as discrete receptors in the modelling and are presented in Table 4.6.
Table 4.6: Sensitive receptors Name UTM X (km) UTM Y (km) Elevation (m)
R1 392.508 5782.674 47.42
R2 392.514 5782.752 47.97
R3 392.469 5782.766 47.45
R4 392.602 5782.917 49.44
R5 392.639 5783.046 48.96
R6 392.426 5783.017 48.47
R7 392.710 5782.966 49.80
R8 393.664 5782.549 51.07
R9 393.699 5782.729 52.21
R10 393.681 5782.776 51.84
R11 393.799 5783.078 52.61
R12 393.568 5782.989 50.49
R13 392.745 5783.046 49.69
R14 393.013 5783.381 50.21
R15 392.665 5783.230 49.06
UTM Zone 55 S

www.erm.com Version: Final Project No.: 0554561 Client: Longwarry Saleyards Pty Ltd 06 July 2020 Page 23
AIR QUALITY ASSESSMENT FOR HRA Longwarry Saleyards Pty Ltd
RESULTS
5. RESULTS
This assessment has been undertaken to inform the human health risk assessment (HRA) and as such the results have not been compared to any air quality criteria.
5.1 Scenario 1
Maximum 24 hour PM10 concentrations were predicted at the receptors for 2015-2019, under the worst case emissions described by Scenario 1 (Table 5.1). The highest maximum 24 hour average PM10 concentration was predicted at receptor 14 in 2015. Therefore, 2015 was the meteorological year used to predict concentrations under Scenario 2 conditions.
Table 5.1: Maximum 24 hour average PM10 concentrations 2015-2019 Receptor Maximum 24-hour Average PM10 Concentrations (µg/m3)
2015 2016 2017 2018 2019
1 4.1 2.0 2.2 1.7 3.0
2 5.0 1.7 3.1 2.6 3.3
3 5.2 2.8 3.3 3.6 3.7
4 3.9 4.4 6.0 12.6 3.4
5 8.0 14.2 8.5 6.7 7.0
6 5.0 8.8 5.1 4.1 4.5
7 5.5 5.8 9.2 16.3 5.2
8 1.5 3.7 6.5 4.9 2.4
9 3.9 3.4 5.0 4.2 3.1
10 4.0 4.2 6.7 3.5 2.7
11 4.6 2.8 5.3 1.9 3.1
12 4.9 9.9 10.6 6.0 3.0
13 9.3 14.7 8.8 8.0 8.3
14 17.8 8.6 14.3 10.9 11.1
15 4.2 4.6 10.1 7.2 5.4
5.2 Scenario 2
Table 5.2 and Table 5.3 present a summary of the results predicted using the Scenario 2 emissions profile in the meteorological year 2015. Annual averages have been provided for both PM10 concentrations and PM10 for E. coli (which is PM10 for all sources except movement along the laneways). Maximum 24 hour PM10 and TSP concentrations and maximum monthly dust deposition have been provided for interest. 24 hour averages for each receptor for the entire year (ie timeseries) for PM10 and TSP concentrations were provided as input to the HRA, along with monthly dust deposition at each receptor.

www.erm.com Version: Final Project No.: 0554561 Client: Longwarry Saleyards Pty Ltd 06 July 2020 Page 24
AIR QUALITY ASSESSMENT FOR HRA Longwarry Saleyards Pty Ltd
RESULTS
Table 5.2: Scenario 2 - Predicted PM10 concentrations in 2015 Receptors Annual Average
PM10 Concentrations (µg/m3)
Annual Average PM10 Concentrations
for E. coli (µg/m3)
Maximum 24-hour PM10 Concentrations
(µg/m3)
Maximum 24-hour PM10 Concentrations
for E. coli (µg/m3)
R1 0.008 0.0009 0.49 0.03
R2 0.009 0.0012 0.41 0.09
R3 0.009 0.0013 0.29 0.14
R4 0.021 0.0029 1.02 0.18
R5 0.038 0.0043 1.62 0.12
R6 0.022 0.0024 0.94 0.07
R7 0.038 0.0051 1.63 0.25
R8 0.007 0.0009 0.25 0.03
R9 0.009 0.0012 0.31 0.04
R10 0.011 0.0014 0.35 0.06
R11 0.009 0.0013 0.34 0.12
R12 0.020 0.0030 0.60 0.28
R13 0.062 0.0069 2.65 0.17
R14 0.042 0.0059 1.69 0.36
R15 0.023 0.0025 0.96 0.11
Table 5.3: Scenario 2 – Predicted TSP concentrations and dust deposition in 2015
Receptors Maximum 24-hour TSP Concentrations (µg/m3)
Maximum Monthly Dust Deposition (g/m2/month)
R1 0.06 0.0004
R2 0.04 0.0003
R3 0.03 0.0002
R4 0.11 0.0008
R5 0.22 0.0017
R6 0.13 0.0010
R7 0.20 0.0015
R8 0.04 0.0006
R9 0.04 0.0011
R10 0.05 0.0016
R11 0.04 0.0008
R12 0.08 0.0027
R13 0.35 0.0027
R14 0.13 0.0028
R15 0.12 0.0029

www.erm.com Version: Final Project No.: 0554561 Client: Longwarry Saleyards Pty Ltd 06 July 2020 Page 25
AIR QUALITY ASSESSMENT FOR HRA Longwarry Saleyards Pty Ltd
RESULTS
5.3 Contour Plots A predicted maximum 24-hour average PM10 concentrations for Scenario 2 are presented in Figure 5.1. This plot represents the maximum modelled concentration over one year for all locations in one plot. This figure does not indicate that these levels of PM10 will occur all the time, but will occur in at least one 24 hour period over one year in each location.
The maximum monthly dust deposition for Scenario 2 is presented in Figure 5.2.
Figure 5.1: Scenario 2: Maximum 24-hour average PM10 concentrations (µg/m3)

www.erm.com Version: Final Project No.: 0554561 Client: Longwarry Saleyards Pty Ltd 06 July 2020 Page 26
AIR QUALITY ASSESSMENT FOR HRA Longwarry Saleyards Pty Ltd
RESULTS
Figure 5.2: Scenario 2: Maximum monthly dust deposition (g/m2/month)

www.erm.com Version: Final Project No.: 0554561 Client: Longwarry Saleyards Pty Ltd 06 July 2020 Page 27
AIR QUALITY ASSESSMENT FOR HRA Longwarry Saleyards Pty Ltd
CONCLUSIONS
6. CONCLUSIONS
This assessment has been undertaken to inform the human health risk assessment (HRA). Emissions of PM10, TSP and dust from the site have been adequately captured by Scenario 2 and modelled in AERMOD to provide a prediction of ground level concentrations of each species at the sensitive receptors.

www.erm.com Version: Final Project No.: 0554561 Client: Longwarry Saleyards Pty Ltd 06 July 2020 Page 28
AIR QUALITY ASSESSMENT FOR HRA Longwarry Saleyards Pty Ltd
REFERENCES
7. REFERENCES
Chang Xu, C. H. (22 August 2018). Evaluation of the Power-Law Wind-Speed Extrapolation Method with Atmospheric Stability Classification Methods for Flows over Different Terrain Types. Applied Sciences, 1429.
Control of Open Fugitive Dust Sources: Final Report. (1988, September). Retrieved from US EPA National Service Center for Environmental Publications (NSCEP): https://nepis.epa.gov/Exe/tiff2png.cgi/91010T7O.PNG?-r+75+-g+7+D%3A%5CZYFILES%5CINDEX%20DATA%5C86THRU90%5CTIFF%5C00002622%5C91010T7O.TIF
Department of Sustainability, Environment, Water, Population and Communities. (2012). National Poluttion Inventory Emission Estimation Technique Manual for Mining Version 3.1. Canberra: Commonwealth of Australia.
Galvin, G., Skerman, A., & Gallagher, E. (2005, March). Dust emissions from a beef cattle feedlot on the Darling Downs. Meat & Livestock Australia ABN 39 081 678 364.
Premise. (2019, December 19). Water Cycle and Waste Management. UCAR. (2018). Research Data Archive . Retrieved from Computational & Information Systems Lab:
https://rda.ucar.edu/ US EPA. (2006). Chapter 13.2.4 Aggregate Handling and Storage Piles. US EPA AP-42 Fifth Edition
Volume 1 Chapter 13: Miscellaneous Sources. US EPA. (2006). Chapter 13.2.5 Industrial Wind Erosion. US EPA AP-42 Fifth Edition Volume 1
Chapter 13: Miscellaneous Sources.

www.erm.com Version: Final Project No.: 0554561 Client: Longwarry Saleyards Pty Ltd 06 July 2020 Page 29
AIR QUALITY ASSESSMENT FOR HRA Longwarry Saleyards Pty Ltd
STATEMENT OF LIMITATIONS
8. STATEMENT OF LIMITATIONS
IMPORTANT LIMITATIONS AND CONTEXT 1. This report is based solely on the scope of work described in ERMs Proposal for Health Risk Assessment
for Proposed Longwarry Cattle Saleyard dated 22 April 2020 setting out ERM’s scope (Scope of Work) and performed by ERM Australia Pty Ltd (ERM) for Auld Projects and Planning (the Client). The Scope of Work was governed by a contract between ERM and the Client (Contract).
2. No limitation, qualification or caveat set out below is intended to derogate from the rights and obligations of ERM and the Client under the Contract.
3. The findings of this report are solely based on, and the information provided in this report is strictly limited to that required by, the Scope of Work. Except to the extent stated otherwise, in preparing this report ERM has not considered any question, nor provides any information, beyond that required by the Scope of Work.
4. This report was prepared between 11 May 2020 and 3 July 2020 and is based on conditions encountered and information reviewed at the time of preparation. The report does not, and cannot, take into account changes in law, factual circumstances, applicable regulatory instruments or any other future matter. ERM does not, and will not, provide any on-going advice on the impact of any future matters unless it has agreed with the Client to amend the Scope of Work or has entered into a new engagement to provide a further report.
5. Unless this report expressly states to the contrary, ERM’s Scope of Work was limited strictly to identifying typical environmental conditions associated with the subject site(s) and does not evaluate the condition of any structure on the subject site nor any other issues. Although normal standards of professional practice have been applied, the absence of any identified hazardous or toxic materials or any identified impacted soil or groundwater on the site(s) should not be interpreted as a guarantee that such materials or impacts do not exist.
6. This report is based on one or more site inspections conducted by ERM personnel, the sampling and analyses described in the report, and information provided by the Client or third parties (including regulatory agencies). All conclusions and recommendations made in the report are the professional opinions of the ERM personnel involved. Whilst normal checking of data accuracy was undertaken, except to the extent expressly set out in this report ERM:
a) did not, nor was able to, make further enquiries to assess the reliability of the information or independently verify information provided by;
b) assumes no responsibility or liability for errors in data obtained from, the Client, any third parties or external sources (including regulatory agencies).
7. Although the data that has been used in compiling this report is generally based on actual circumstances, if the report refers to hypothetical examples those examples may, or may not, represent actual existing circumstances.
8. Only the environmental conditions and or potential contaminants specifically referred to in this report have been considered. To the extent permitted by law and except as is specifically stated in this report, ERM makes no warranty or representation about:
a) the suitability of the site(s) for any purpose or the permissibility of any use;
b) the presence, absence or otherwise of any environmental conditions or contaminants at the site(s) or elsewhere; or
www.erm.com Version: Final Project No.: 0554561 Client: Longwarry Saleyards Pty Ltd 06 July 2020 Page 30
AIR QUALITY ASSESSMENT FOR HRA Longwarry Saleyards Pty Ltd
STATEMENT OF LIMITATIONS
c) the presence, absence or otherwise of asbestos, asbestos containing materials or any hazardous materials on the site(s).
9. Use of the site for any purpose may require planning and other approvals and, in some cases, environmental regulator and accredited site auditor approvals. ERM offers no opinion as to the likelihood of obtaining any such approvals, or the conditions and obligations which such approvals may impose, which may include the requirement for additional environment works.
10. The ongoing use of the site or use of the site for a different purpose may require the management of or remediation of site conditions, such as contamination and other conditions, including but not limited to conditions referred to in this report.
11. This report should be read in full and no excerpts are to be taken as representative of the whole report. To ensure its contextual integrity, the report is not to be copied, distributed or referred to in part only. No responsibility or liability is accepted by ERM for use of any part of this report in any other context.
12. Except to the extent that ERM has agreed otherwise with the Client in the Scope of Work or the Contract, this report:
a) has been prepared and is intended only for the exclusive use of the Client;
b) must not to be relied upon or used by any other party;
c) has not been prepared nor is intended for the purpose of advertising, sales, promoting or endorsing any Client interests including raising investment capital, recommending investment decisions, or other publicity purposes;
d) does not purport to recommend or induce a decision to make (or not make) any purchase, disposal, investment, divestment, financial commitment or otherwise in or in relation to the site(s); and
e) does not purport to provide, nor should be construed as, legal advice.

The business of sustainability
ERM has over 160 offices across the following countries and territories worldwide
Argentina Australia Belgium Brazil Canada Chile China Colombia France Germany Ghana Guyana Hong Kong India Indonesia Ireland Italy Japan Kazakhstan Kenya Malaysia Mexico Mozambique Myanmar
The Netherlands New Zealand Norway Panama Peru Poland Portugal Puerto Rico Romania Russia Senegal Singapore South Africa South Korea Spain Sweden Switzerland Taiwan Tanzania Thailand UAE UK US Vietnam
ERM’s Melbourne Office
Level 6, 99 King Street
Melbourne
Australia
VIC 3000
T: +61 3 9696 8011
www.erm.com
APPENDIX B SLR NOISE REPORT

Memorandum
To: Sarah Auld At: Auld Consulting
From: Jim Antonopoulos At: SLR Consulting Australia Pty Ltd
Date: 11 June 2020 Ref: 640.11771-M02-v1.0.docx
Subject: Longwarry Saleyard
enHealth Assessment Inputs
CONFIDENTIALITY
This document is confidential and may contain legally privileged information. If you are not a named or authorised recipient you must not read, copy, distribute or act in reliance on it. If you have received this document in error, please telephone our operator immediately and return the document by mail.
SLR Consulting Australia Pty Ltd Level 11, 176 Wellington Parade East Melbourne VIC 3002 Australia
T: +61 3 9249 9400 E: [email protected]
www.slrconsulting.com ABN 29 001 584 612
Sarah,
SLR have been retained to provide inputs into the health impact assessment associated with the proposed Longwarry Saleyards.
Specifically, inputs are required in relation to the enHealth standard, which requires assessment to both a night and day averaged noise level as follows:
• 55 dBA Leq 8h (10 pm to 6 am average)
• 60 dBA Leq 16h (6 am to 10 pm average)
The above noise levels are required to be determined for all noise generated and associated with the proposal, including truck and traffic pass-bys to impacted receivers on Sand Road.
Methodology
An environmental noise assessment has been previously prepared by SLR and presented in our report 640.11771-R01. This report provided predictions and assessment of noise in accordance with Victorian EPA noise legislation and assessed commercial activity from the site.
The EPA noise policy is typically based on an assessment over the noisiest 30 minute period. The enHealth guidelines are based on a daily (longer term) averaged noise level.
In order to provide an appropriate calculated estimate of the 16 h and 8 h noise levels we have:
• Considered all sources of noise, including:
• All site commercial activity noise (loading/unloading, truck wash, general truck movements and activities on site).
• Noise from cattle lowing.
• Noise from associated trucks and vehicles on Sand Road as generated by the use.
• Existing ambient noise in the area.

Longwarry Saleyard enHealth Assessment Inputs
SLR Ref: 640.11771-M02-v1.0.docx Date: 11 June 2020
Page 2
• In order to determine the 16 h and 8 h noise levels for site activity noise we have:
• Adopted our previously predicted worst case 30 minute noise levels for peak operations during the day and night periods, and assumed this level of activity would occur for half of the day and night periods.
• For the remainder of the time period, we have assumed noise generation from the site would be at least 5 dBA below the peak activity periods.
• In relation to cattle lowing noise, we have assumed that occurs for half of the day period and for the entire night period.
• In relation to truck traffic accessing the site, we have referred to the traffic noise report which indicates in the order of 80-90 heavy vehicle movements during the day period during a peak sale event, and approximately 6 heavy vehicle movements during the night. We have calculated the 16 h and 8 h contribution to the nearest affected dwellings based on this data, and their respective setbacks from the road.
• We have also allowed for approximately 600 standard / light vehicles accessing the site predominantly during the day (the traffic report indicates this represents peak sale collection day volume)
• The results have included a further -3 dB correction to account for non-sales event days (there are 146 sales events per year), and the fact that the majority of sales events are for approximately half of the peak sales events cattle numbers.
• The enHealth assessment requires consideration of all environmental noise in the area. In order to account for existing environmental noise, we have referred to logging results as collected and presented in our report 640.11771-R01. The ‘north boundary’ logger location was used as an indicative representation of existing environmental noise in the area, and the average 16 h day and 8 h night results (for all non-weather affected days) used as a basis. Note that actual noise levels at each and every receiver would vary, and depend on specific site exposure to road and other environmental noise sources. It is highly impractical to quantify existing environmental noise accurately at every receiver. The noise logging results include contribution from existing traffic, insects / animals and other general environmental noise in the area. It was noted that night period noise levels were slightly higher than day period likely due to contribution of insects / animals.
Findings
We have calculated the 16 h and 8 h noise levels to the nearest and most affected receivers. The predicted noise levels based on the above methodology are presented below.
We have split the results to show the noise emissions from the new facility alone, and with the contribution of existing environmental noise, as well as the final cumulative noise level. It is noted that the existing noise levels were found to be typically higher than those predicted from the facility and as such these drive the 16 h and 8 h final values.

Longwarry Saleyard enHealth Assessment Inputs
SLR Ref: 640.11771-M02-v1.0.docx Date: 11 June 2020
Page 3
Location Predicted 16 h noise level, LAeq
Proposed Facility Only
Existing estimated 16 h noise level, LAeq
(from logging)
Combined / cumulative 16 h noise level at receivers
Predicted 8 h noise level, LAeq
Proposed Facility Only
Existing estimated 8h noise level, LAeq
(from logging)
Combined / cumulative 8 h noise level at receivers
235 Sand Road
48 52 53 42 53 53
255 Sand Road
52 52 55 42 53 53
280 Sand Road
49 52 54 43 53 53
5 Thornell Road
50 52 54 41 53 53
All other receivers in area
< 50 52 <54 < 41 53 53
Prepared by:
Jim Antonopoulos BAppSc MAAS Principal - Acoustics
Checked: GR

The business of sustainability
ERM has over 160 offices across the following countries and territories worldwide
Argentina Australia Belgium Brazil Canada Chile China Colombia France Germany Hong Kong India Indonesia Ireland Italy Japan Kazakhstan Kenya Malaysia Mexico Mozambique Myanmar
The Netherlands New Zealand Norway Panama Peru Poland Portugal Puerto Rico Romania Russia Singapore South Africa South Korea Spain Sweden Switzerland Taiwan Thailand UAE UK US Vietnam
ERM’s Melbourne Office Citic House Level 6, 99 King Street Melbourne VIC 3000 PO BOX 266 South Melbourne VIC 3205 T: +61 3 9696 8011 F: +61 3 9696 8022 www.erm.com
Related Documents