
Welcome message from author
This document is posted to help you gain knowledge. Please leave a comment to let me know what you think about it! Share it to your friends and learn new things together.
Transcript
7/30/2019 Health Report Final
http://slidepdf.com/reader/full/health-report-final 1/34
7/30/2019 Health Report Final
http://slidepdf.com/reader/full/health-report-final 2/34
Amhara National Regional State (ANRS)
Development Studies Associates (DSA) & Shawel Consult International (SCI) b
7/30/2019 Health Report Final
http://slidepdf.com/reader/full/health-report-final 3/34

7/30/2019 Health Report Final
http://slidepdf.com/reader/full/health-report-final 4/34
Amhara National Regional State (ANRS)
Table 7: Health Manpower Development Achievement during the SPM
period .............................................................................................................19
Table 8: Health Facility and manpower GA P (Existing)................................21
List of Annexes
Development Studies Associates (DSA) & Shawel Consult International (SCI) b

7/30/2019 Health Report Final
http://slidepdf.com/reader/full/health-report-final 5/34

7/30/2019 Health Report Final
http://slidepdf.com/reader/full/health-report-final 6/34
Amhara National Regional State (ANRS)
I. GENERAL
1.1. Purpose of the study
The health study is part of the over all study initiated by the investment officeof the ANRS to assess the resource potential of the region and to "Identifyopportunities for investment and to enhance the participation of private sector in the region's economy".
The study is focused on and intends to assess the overall health profile andthe health service in the Amhara Regional State and examines thesignificance of the health sector as:
• an essential prerequisite for economic development and
• a market for the private sector investment
1.2. Review methodology
The methodology is based on the analysis of data generated from primaryand secondary sources: More specifically it consisted of:
• Document Review
• Discussions with purposefully selected stakeholders during a working
visit to Bahr Dar that include the GO sector, nonpublic sector includingthe private, NGOs and professionals (see annex for the list of
contacted people and documents reviewed.)• Site visit to service providers (see annex)
7/30/2019 Health Report Final
http://slidepdf.com/reader/full/health-report-final 7/34
Amhara National Regional State (ANRS)
II. GENERAL PROFILE OF THE REGION
The Amhara regional state is located in the NW part of the country. TheRegion shares boundaries with Tigray in the North, Afar in the East, Oromiyain the South, Benshangul-Gumz in the Southwest and the Sudan in the West .
It is the third largest regional state covering an area of 170,152 km2 or 15 %of the country.
There are three agro-climatic zones, Dega (mountainous and cold); WoynaDega (temperate) and kola (lowland) comprising 25 %, 44% and 31 %respectively
Its altitude ranges between 500-4620 meters above sea level (asl.) Theaverage annual rainfall ranges from 400- 900 mm in the lowlands to 1200-2200 mm in the temperate zones and over 2200mm/yr in the highlands. Thetemperature varies from 20-30 degree C in the lowlands to 16-21 in thetemperate zones and from<7-15 in the highlands. Administratively the regional state is organized in 11 Zones, 113 /118Woredasand 3171 /3229kebeles.
In 2005 the population of the region was estimated to be 18.7 million in2005while the annual growth rate was 2.7%. . The Population density ranges
from 5-281 inhabitants per km2, (average 125). The majority of the population(80% are followers of the Ethiopian Orthodox Church, 18 % Muslims and 2 %
protestants and others. Over 90% are Amhara. About 89 % of the populationlive in the rural areas and is engaged mainly in agriculture. The total fertilityrate per women in 2005 is erstimated to be 5.4 The IMR stands as 114.7/1000and the U5 mortality at 192.5/1000. (Development indicators of the AmharaRegion).

7/30/2019 Health Report Final
http://slidepdf.com/reader/full/health-report-final 8/34
Amhara National Regional State (ANRS)
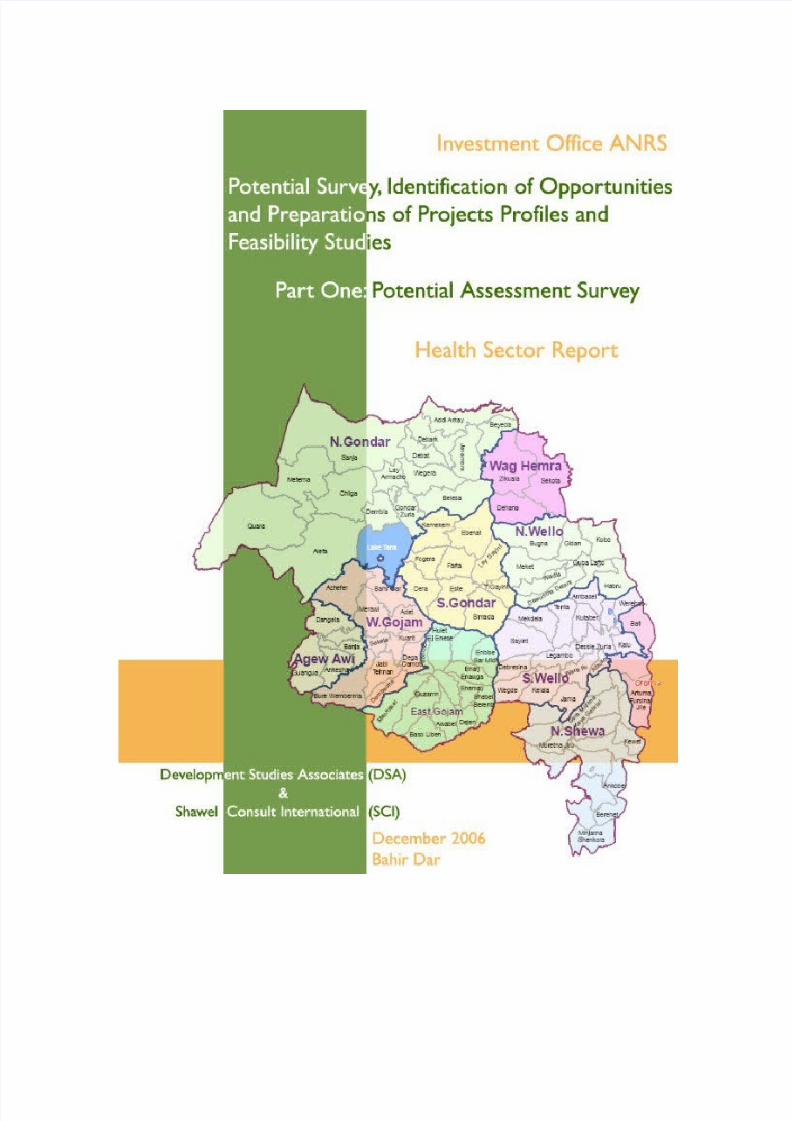
Administrative Map of the Region
The male to female ratio is almost equal (49.97:50.03). About 7.8 million or over 46 % of the population is under 15 years of age and only 3.32 % above64
The population in the age group of 15-64 or the active age group makes up53.58 %. About 90 % of the people reside in the rural areas and only 10 %live in the few roadside urban centers. Annually there are about 717,075 new
born. The Infant Mortality rate is estimated at116/1000, and that of the Under 5 at.170/1000. The average life expectancy is estimated at 50.8 (lower thanthe national average of 53. Agriculture is the main stay of the economy onwhich close 90 % of the population make their livelihood.
The annual per capita income, which is around USD100, is much lower thanthe national average. About 42% of the population live under the poverty lineand are chronically food insecure. Domestic food production is far below thefood requirement resulting in perpetual food deficit /shortage. More than 52 %of the children are stunted, 9.2% wasted and 44 per cent are under weight. in2004 the adult illiteracy rate was estimated to be close to 69 per cent. The
net enrolment ratio for primary level in 2004 was 36 per cent while that of secondary level was 12 per cent. The rural infrastructure is poorly developed.

7/30/2019 Health Report Final
http://slidepdf.com/reader/full/health-report-final 9/34
Amhara National Regional State (ANRS)
Main and feeder roads are short. The coverage of electric and telephoneservice is limited to few roadside urban towns.
The number of people migrating out of the region mainly the active age group(as coping mechanism to come out of food shortage.) is growing from time to
time predisposing them to risky coping mechanisms including unsafe sexpractices.
7/30/2019 Health Report Final
http://slidepdf.com/reader/full/health-report-final 10/34
Amhara National Regional State (ANRS)
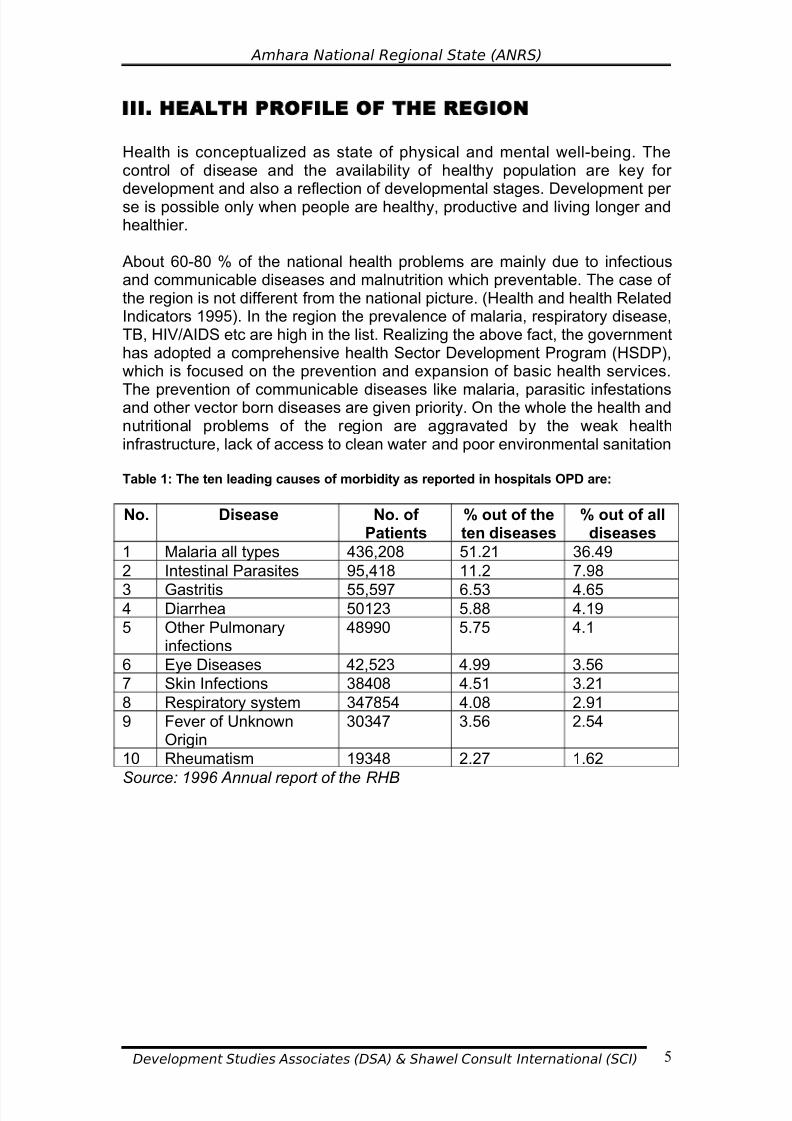
III. HEALTH PROFILE OF THE REGION
Health is conceptualized as state of physical and mental well-being. Thecontrol of disease and the availability of healthy population are key for
development and also a reflection of developmental stages. Development per se is possible only when people are healthy, productive and living longer andhealthier.
About 60-80 % of the national health problems are mainly due to infectiousand communicable diseases and malnutrition which preventable. The case of the region is not different from the national picture. (Health and health RelatedIndicators 1995). In the region the prevalence of malaria, respiratory disease,TB, HIV/AIDS etc are high in the list. Realizing the above fact, the governmenthas adopted a comprehensive health Sector Development Program (HSDP),which is focused on the prevention and expansion of basic health services.
The prevention of communicable diseases like malaria, parasitic infestationsand other vector born diseases are given priority. On the whole the health andnutritional problems of the region are aggravated by the weak healthinfrastructure, lack of access to clean water and poor environmental sanitation
Table 1: The ten leading causes of morbidity as reported in hospitals OPD are:
No. Disease No. of Patients
% out of theten diseases
% out of alldiseases
1 Malaria all types 436,208 51.21 36.49
2 Intestinal Parasites 95,418 11.2 7.98
3 Gastritis 55,597 6.53 4.654 Diarrhea 50123 5.88 4.19
5 Other Pulmonaryinfections
48990 5.75 4.1
6 Eye Diseases 42,523 4.99 3.56
7 Skin Infections 38408 4.51 3.21
8 Respiratory system 347854 4.08 2.91
9 Fever of UnknownOrigin
30347 3.56 2.54
10 Rheumatism 19348 2.27 1.62
Source: 1996 Annual report of the RHB

7/30/2019 Health Report Final
http://slidepdf.com/reader/full/health-report-final 11/34
Amhara National Regional State (ANRS)
Table 2: :The ten leading causes of hospital admissions are:
Disease No. of Patients
% out of theten diseases
% out of alldiseases
1 Malaria all types 6633 44.2 22.16
2 Delivery 2099 13.99 7.013 Pneumonia 1659 12.39 6.21
4 Eye Problems 1100 7.33 3.67
5 Injuries due toaccidents
747 4.98 2.5
6 Fever of UnknownOrigin
583 3.89 1.95
7 Problems associatedwith Pregnancy
572 3.81 1.91
8 Abortion 564 3.76 1.88
9 Urinary Tract Infection 472 3.15 1.58
10 Hypertension 370 2.47 1.24
Source: 1996 Annual report of the RHB
7/30/2019 Health Report Final
http://slidepdf.com/reader/full/health-report-final 12/34
Amhara National Regional State (ANRS)
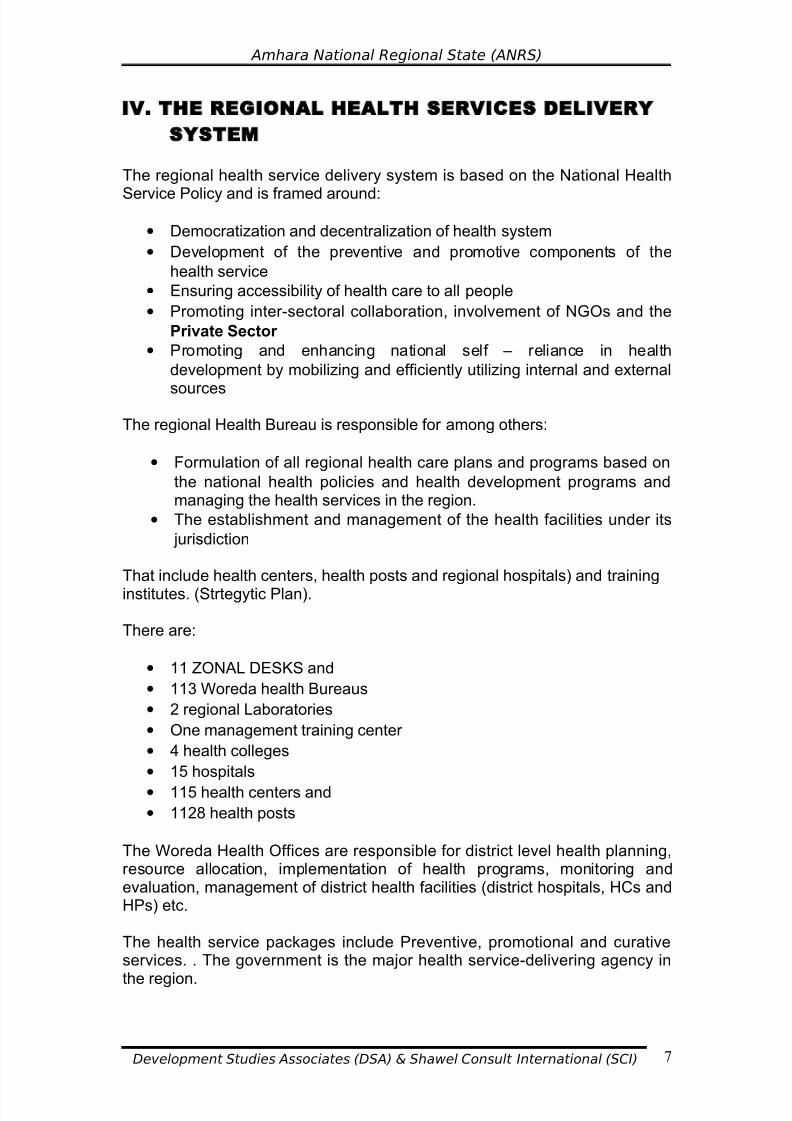
IV. THE REGIONAL HEALTH SERVICES DELIVERY
SYSTEM
The regional health service delivery system is based on the National Health
Service Policy and is framed around:
• Democratization and decentralization of health system
• Development of the preventive and promotive components of the
health service
• Ensuring accessibility of health care to all people
• Promoting inter-sectoral collaboration, involvement of NGOs and the
Private Sector
• Promoting and enhancing national self – reliance in health
development by mobilizing and efficiently utilizing internal and external
sources
The regional Health Bureau is responsible for among others:
• Formulation of all regional health care plans and programs based on
the national health policies and health development programs andmanaging the health services in the region.
• The establishment and management of the health facilities under its
jurisdiction
That include health centers, health posts and regional hospitals) and training
institutes. (Strtegytic Plan).
There are:
• 11 ZONAL DESKS and
• 113 Woreda health Bureaus
• 2 regional Laboratories
• One management training center
• 4 health colleges
• 15 hospitals
• 115 health centers and
• 1128 health posts
The Woreda Health Offices are responsible for district level health planning,resource allocation, implementation of health programs, monitoring andevaluation, management of district health facilities (district hospitals, HCs andHPs) etc.
The health service packages include Preventive, promotional and curativeservices. . The government is the major health service-delivering agency in
the region.

7/30/2019 Health Report Final
http://slidepdf.com/reader/full/health-report-final 13/34
Amhara National Regional State (ANRS)
The health delivery system is organized in a four-tier system
• At the base of the system is the Primary Health Care delivery Unit
comprising of health posts and health centers followed by
• District hospital
• Referral/zonal hospital
• Specialized referral hospital
The health service coverage including that of basic health services is about47-51 %.
The Coverage of essential services by targets like Family Planning (FP) %, Anti natal clinic (ANC) Institutional delivery at less than U5 health servicecoverage, immunization has markedly increased over the past years. Thecoverage of Antenatal Service, which in 1990 was 21.5%, has increased to
33. % In1996, the delivery service from 7,7% to 8%, Postanatal service from3.6% to 7.6%Family Planning from 8.4 to 25 % during the same period.However it has to be noted that the coverage is still very low.

7/30/2019 Health Report Final
http://slidepdf.com/reader/full/health-report-final 14/34
Amhara National Regional State (ANRS)
V. SITUATION OF MALARIA AND HIV/AIDS IN
THE REGION
5.1. Situation of Malaria In the Region
Over 80 % of the land is malarious and about 75% of the population is at risk.Reported number of malaria cases per annum ranges between 0.5 - 1.2million and hence malaria is the leading cause of outpatient morbidity, hospitaladmissions and hospital deaths. It is the cause for:
• 10 - 80 % of outpatient consultations
• 15-40 % of the total hospital admissions
• 7- 30 % of total hospital deaths and
• 10 - 25% case fatality rate (Anti Malaria Association Report )
The Malaria Epidemic occurs in the lowland, temperate and highland areastoo. The peak epidemic season is usually after the major rain (Sep-Nov) andduring the dry season (March – July).
Poor surveillance leading to late detection and late reporting, expansions tohighlands and increased settlement areas, irrigations and water harvest thatare associated with rural development are the major challenges. (PowerPointReport Anti Malaria Association Report)The epidemic is now causing a serious problem for rural envelopment efforts,
In addition to the interventions by the government, the people of the regionare actively involved and participating in the management of the epidemicthrough the Anti Malaria Association.
The major strategies designed for the disease management include:
5.1.1 Early diagnosis and prompt treatment
This strategy is focused on accessing cases to simple laboratory test andtreatment. However it is only 20-30% of cases that have access to laboratorydiagnosis. About 70-80 of cases are diagnosed and treated only on clinical
basis without laboratory confirmation. Drug resistance, shortage of drugs andhealth workers still pose main challenges
5.1.2 Selective vector control
This strategy focuses on Insecticide Treated Nets /ITNs/, EnvironmentalManagement and Indoor Residual Spraying/IRS/
5.1.2.1 Distributing Insecticide Treated Nets/ITNs/
The distribution scheme is Community based. Up to the end of 1996 EFY About 14,000 nets are distributed. (1100 from WHO and 2606 by AMA). The

7/30/2019 Health Report Final
http://slidepdf.com/reader/full/health-report-final 15/34
Amhara National Regional State (ANRS)
ITN coverage though increasing through time is still very low. The price stillremains as a major constraint
5.1.2.2 Environmental Management
This include drainage and larval control using abate chemicals. Drainage isintensively carried out in all areas as a regular activity during the transmissionseason.
Larval control using abate chemical is carried out in urban areas. Lack of abates chemical, limited involvement of other sectors and targeting breedingsites are some of the major constraints.
5.1.2.3 Indoor Residual Spraying/IRS/
Only 14 % of the Malarious kebeles are receiving regular spraying. Shortage
of spray pump, technicians, operational fund and chemicals still pose achallenge.
5.2. HIV/AIDS Situation in the Region
The HIV/AIDS pandemic has established itself as one of the major national aswell as regional socio- economic problems.
Amhara region is one of the most affected regions in the country. The overall
regional HIV/AIDS adult prevalence rate, which is 6.1 %, is higher than thenational average of 4.4 %. The national adult HIV incidence rate is 0.68 %while that of the region is 1.02 %. The adult prevalence rate in the regionalcapital of Bahir Dar is 24.3 %. Highest rates are observed in North Shoa,(15.5%) Eastern Gojjam (17.95%) Bahir Dar zone (15.47), Northern Gondar 16.3%) (1996 annual report)
The estimated number of PLWHA in the region is 528,000 or more than athird of the national figure of 1.5 million. Almost 90% of these are within theage group of 15-49. Out of the national total 539,000 AIDS orphans about179,000 are found in the region. Nation-wide there are about 245,000 HIV
positive persons needing Anti Retroviral Treatment (ART). Out of these83,000 or a third are found in the region. (AIDS in Ethiopia 5th Report). The limited health service facilities are overburdened by HIV/AIDS and relatedillnesses like TB. The regional response to fight the epidemic was initiatedimmediately following the national program. Currently there is one regionalcoordinating office (RHAPCO), 11 zonal and 67 woreda coordinating offices(WHAPCOs). NGOs, Faith Based organization and Community basedorganizations like Anti- AIDS Clubs, Associations of PLWHA, Idirs, Women’sand Youth Associations are actively participating in the control and care andsupport services
7/30/2019 Health Report Final
http://slidepdf.com/reader/full/health-report-final 16/34
Amhara National Regional State (ANRS)
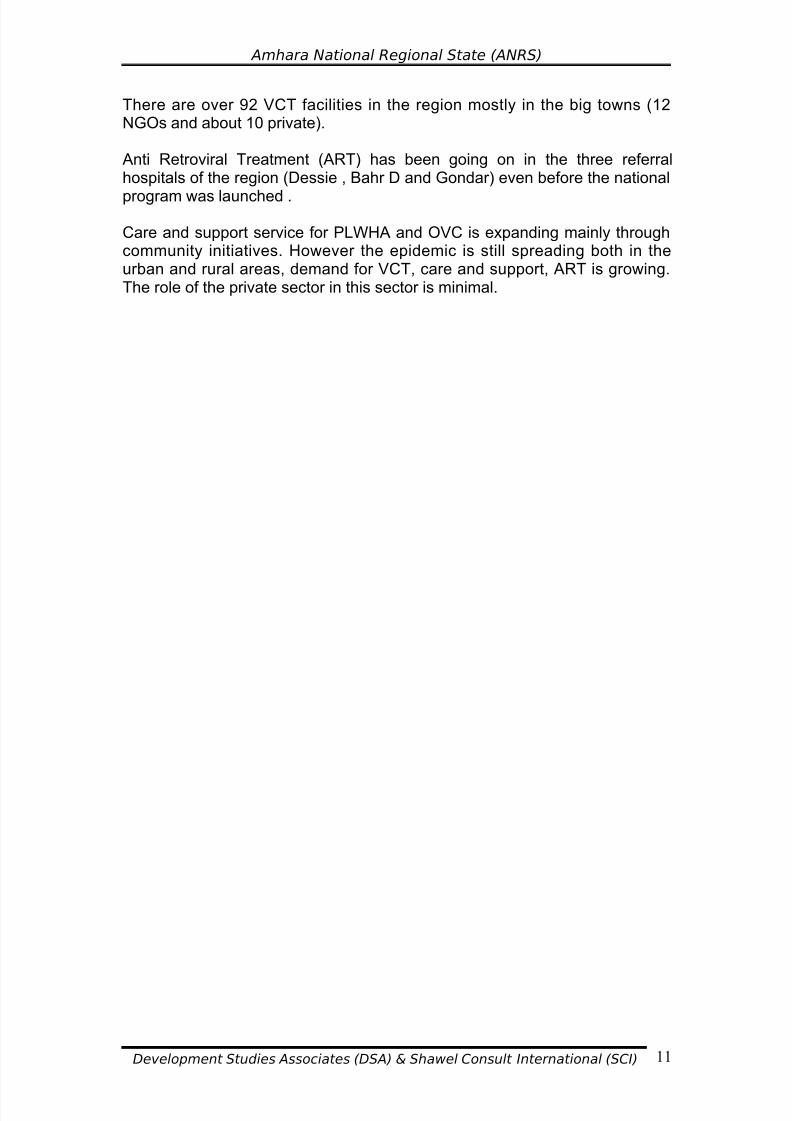
There are over 92 VCT facilities in the region mostly in the big towns (12NGOs and about 10 private).
Anti Retroviral Treatment (ART) has been going on in the three referralhospitals of the region (Dessie , Bahr D and Gondar) even before the national
program was launched .
Care and support service for PLWHA and OVC is expanding mainly throughcommunity initiatives. However the epidemic is still spreading both in theurban and rural areas, demand for VCT, care and support, ART is growing.The role of the private sector in this sector is minimal.

7/30/2019 Health Report Final
http://slidepdf.com/reader/full/health-report-final 17/34
Amhara National Regional State (ANRS)
VI. EXISTING HEALTH SERVICE FACILITIES AND
SERVICE COVERAGE
There are 16 hospitals (one is the Teaching Hospital of Gondar University),
115 Health centers, 1128 Health posts and five regional Health trainingColleges The health service coverage including that of basic health services isaround 60 % (Regional Bureau annual Performance Report 1996 EFY)
6.1. Facilities
Table 3: Health institution to population ratio (Regional)
Type of Facility AvailableNumber
Ratio MoHStandard
Remark
Health post 1128 1:16,099 1:5,000
Health center 115 1:157,913 1: 25,000 The current nationalratio is 1; 247,000
District Hospitals 9 1:2,017,777 1: 250,000 The currentnationalratio1:1,655,70
Zonal Hospital 4 1:4,540,000 1:1,000,000
Referral Hospital 3 1:9,080,000 1:5,000,000 Gondar is a teachinhospital
The zonal hospitals are located in the four zonal towns of DebreMarkos.,DebreTabor, Woldia and DebreBerhan .The two referral Hospitalsare located in Dessie and Bahir Dar. The Gondar Hospital is a teachinghospital.
All of the hospitals are government owned. There is no any private hospitalcurrently operating in the whole region (Two are under the process of establishment).
The Bahir Dar referral Hospital`s catchments area goes beyond its territorial
boundary and is serving Benishangul and part of Oromiya.
From the above table it can be observed that the regional Health facility topopulation ratio is much lower than the current national average which againis much lower than the target set by the MOH.
6.2. Health Manpower to Population Ratio
The MoH has set a standardized staffing pattern of professionals for differenthierarchy of health services i.e. Health. Posts, health Centers, districthospitals, zonal referral and specialized referral hospitals (annex 1). This is
linked to professional/population ratio. The following analysis is based on theabove mentioned standard.

7/30/2019 Health Report Final
http://slidepdf.com/reader/full/health-report-final 18/34
Amhara National Regional State (ANRS)
Table 4: The Health Manpower currently available in the region
Profession WHOStandard
Currentnational
ratio
Currentlyavailable in the
Regional
Regional Ratio
Physicians 1:10,000 1:25,958 138/ 1:131,646
Surgeon 1:598,000 6 1:3 million
Internist 1:900,000 3 1:6 million
Ophthalmologist 3 1:6 million
Pediatrician 1:700,000 2 1:4 million
Gynecologist 7 1:1.2 million
Dental Surgeon 1 1:18 million
(HO) 114 407,000
Nurses 1:5000 4882 1645 1:11,083
Health Assistants
1:5000 1220 1: 14,890
Lab. Technician 1:69,075
Pharmac/tech 4 1:125,289
San 1:64,194
Shortage of all types of health humanpower is observed across allprofessions. The professional to population ratio is much lower than the
current national ratio, which again is much lower than the standardrecommended by WHO.
6.3. HOSPITAL/ HEALTH CENTER BEDS IN THE REGION
• Total Number of beds (Hospital and (HC)…….....1564
• Bed to Population Ratio…………………….....1:10,869
• National Ratio ……………………………………1:5180
• Tigray No. Of Beds……………………….…..…...1322
• Tigrai Bed: population ratio…………….……....1:3038
The regional bed to population ratio is much lower than the national and other regions.
During the fiscal year while it was planned to provide inpatient services for 64,976 patients, the actual performance was 69,358 and much higher thanthe capacity (106%)
(Annual Report) Most of the cases that require admission at times have towait for long appointments. Certain emergencies are admitted in the hospitalcorridors and at times stay for days on stretchers. This indicates the need for
the expansion of inpatient services

7/30/2019 Health Report Final
http://slidepdf.com/reader/full/health-report-final 19/34
Amhara National Regional State (ANRS)
6.4. Performance in selected Health services packages
The regional health Bureau has set and performed an elaborated preventionprogram targeted at vaccination and environmental health services. Thevaccination package includes BCG, DPT, TT for pregnant mothers, measles,
polio.
MCH
The MCH service includes Family Planning Service, Ante Natal Service,Delivery and Postnatal service. The service coverage and quality has shownmarked improvement
TB Control
TB is now one of the major and serious regional health problems. The
epidemic is now more and more expanding due to HIV/AIDS. The TBcontrol service includes training human power, strengthening the healthservice delivery including laboratory services, DOT and follow up. During1966 it was possible to provide the comprehensive service for 16,001 (M 8562F 7469) and to follow-up 12, 821 cases. Out of these 80.1% are cured, 6.76%dead, 0.27% failure, 5.53 % discontinued and 7.37 % unaccounted
The 1996 plan performance was 67.1%. The accomplishment iscommendable .
6.5. Specialized Services
Dental service
There is only one dental surgeon for the whole region (Bahr Dar Hospital) andit is overburdened. (Annual performance 141 % of the plan). Other thanmedical treatment for dental problems the only type of dental surgicalintervention is “Tooth Extraction”. Other Cases including filling etc are referredto Addis Ababa
Ophthalmology
There are only three government owned ophthalmic services sites (Bahr Dar,Boru and Gondar) for the whole region .The work load in Bahr Dar Hospital isso high that appointment lines go for more than 3 months. (No better than thenational referral Menelik Hospital).
There are no specialist services like ENT, neurology, dermatology, psychiatryand pathology. There is no any sub-specialty service in the region (e.g.,Cardiology, nephrology etc).
7/30/2019 Health Report Final
http://slidepdf.com/reader/full/health-report-final 20/34
Amhara National Regional State (ANRS)
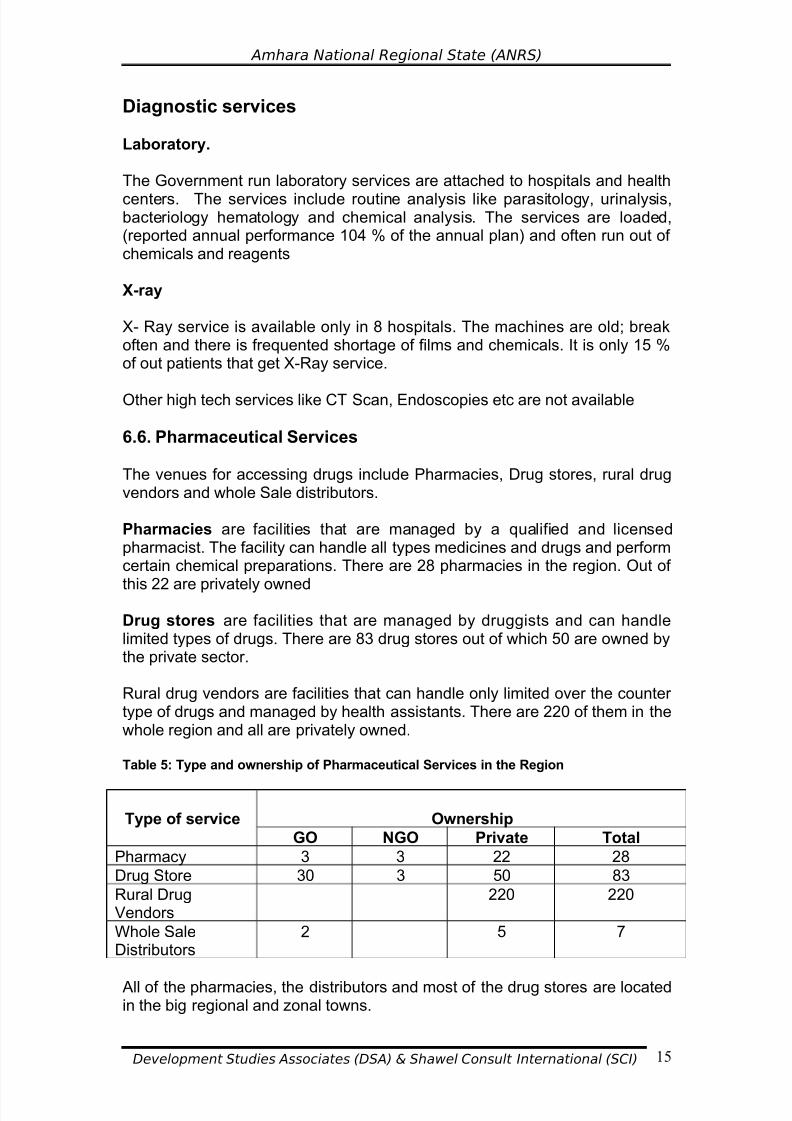
Diagnostic services
Laboratory.
The Government run laboratory services are attached to hospitals and health
centers. The services include routine analysis like parasitology, urinalysis,bacteriology hematology and chemical analysis. The services are loaded,(reported annual performance 104 % of the annual plan) and often run out of chemicals and reagents
X-ray
X- Ray service is available only in 8 hospitals. The machines are old; breakoften and there is frequented shortage of films and chemicals. It is only 15 %of out patients that get X-Ray service.
Other high tech services like CT Scan, Endoscopies etc are not available
6.6. Pharmaceutical Services
The venues for accessing drugs include Pharmacies, Drug stores, rural drugvendors and whole Sale distributors.
Pharmacies are facilities that are managed by a qualified and licensedpharmacist. The facility can handle all types medicines and drugs and performcertain chemical preparations. There are 28 pharmacies in the region. Out of
this 22 are privately owned
Drug stores are facilities that are managed by druggists and can handlelimited types of drugs. There are 83 drug stores out of which 50 are owned bythe private sector.
Rural drug vendors are facilities that can handle only limited over the counter type of drugs and managed by health assistants. There are 220 of them in thewhole region and all are privately owned.
Table 5: Type and ownership of Pharmaceutical Services in the Region
Type of service Ownership
GO NGO Private Total
Pharmacy 3 3 22 28
Drug Store 30 3 50 83
Rural DrugVendors
220 220
Whole SaleDistributors
2 5 7
All of the pharmacies, the distributors and most of the drug stores are locatedin the big regional and zonal towns.

7/30/2019 Health Report Final
http://slidepdf.com/reader/full/health-report-final 21/34
7/30/2019 Health Report Final
http://slidepdf.com/reader/full/health-report-final 22/34
Amhara National Regional State (ANRS)
Besides satisfying the carrier development of the professionals the schemehas contributed to the improvement of the quality of the service and retentionof the professionals.
6.8. Health Budget Allocation and Expenditure
The recurrent health budget allocated for the region during 1995 was Birr 178,900,000.0, out which only Birr 91,600,000.0 or 51.2 % was expended.(Annual Report)
The capital health budget allocation for the same period was Birr 84,800,000.0 out of which only Birr 1, 900,000.0 or 2.2 % was utilized. Theperformance is much lower than the national average of 57.5 % and the leastfrom all the other regions. The health expenditure per capita, is Birr 5.3,(national average of Birr 11.9.)(Annual Report)
7/30/2019 Health Report Final
http://slidepdf.com/reader/full/health-report-final 23/34
Amhara National Regional State (ANRS)
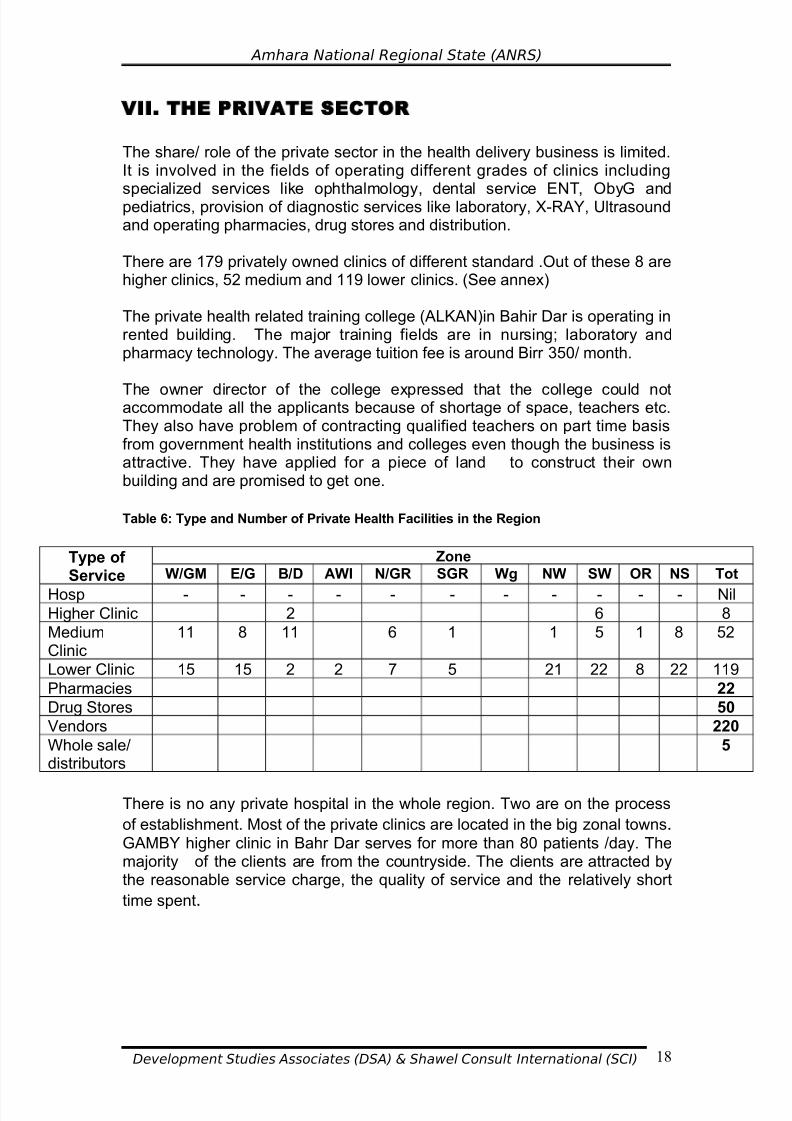
VII. THE PRIVATE SECTOR
The share/ role of the private sector in the health delivery business is limited.It is involved in the fields of operating different grades of clinics including
specialized services like ophthalmology, dental service ENT, ObyG andpediatrics, provision of diagnostic services like laboratory, X-RAY, Ultrasoundand operating pharmacies, drug stores and distribution.
There are 179 privately owned clinics of different standard .Out of these 8 arehigher clinics, 52 medium and 119 lower clinics. (See annex)
The private health related training college (ALKAN)in Bahir Dar is operating inrented building. The major training fields are in nursing; laboratory andpharmacy technology. The average tuition fee is around Birr 350/ month.
The owner director of the college expressed that the college could notaccommodate all the applicants because of shortage of space, teachers etc.They also have problem of contracting qualified teachers on part time basisfrom government health institutions and colleges even though the business isattractive. They have applied for a piece of land to construct their ownbuilding and are promised to get one.
Table 6: Type and Number of Private Health Facilities in the Region
Type of Service
Zone
W/GM E/G B/D AWI N/GR SGR Wg NW SW OR NS Tot
Hosp - - - - - - - - - - - NilHigher Clinic 2 6 8
MediumClinic
11 8 11 6 1 1 5 1 8 52
Lower Clinic 15 15 2 2 7 5 21 22 8 22 119
Pharmacies 22
Drug Stores 50
Vendors 220
Whole sale/distributors
5
There is no any private hospital in the whole region. Two are on the process
of establishment. Most of the private clinics are located in the big zonal towns.GAMBY higher clinic in Bahr Dar serves for more than 80 patients /day. Themajority of the clients are from the countryside. The clients are attracted bythe reasonable service charge, the quality of service and the relatively short
time spent.

7/30/2019 Health Report Final
http://slidepdf.com/reader/full/health-report-final 24/34
Amhara National Regional State (ANRS)
VIII.REGIONAL GOVERNMENT'S HEALTH SERVICE
EXPANSION PLAN AND PERFROMANCE
The regional Health Bureau is guiding its activities on the basis of a five year
Strategic Plan that was issued in EFY 1992 and expected to be over by theend of 1997. On the basis of the SPM the Bureau issues annual plan andbudget. The annual plan is framed around the principles of prevention andexpansion of basic health services mainly through health extension package.
As per the 1997 mid – year report the achievement and performance level inkey areas is reported as follows.
Table 7: Health Manpower Development Achievement during the SPM period
Profession Targeted
for 1997
Currently
available
Performance
level in %
Gap
Physicians 176 138 78.4 38
Surgeon 13 6 46 7
Internist 6 3 59 3
Ophthalmologist 5 1 20 4
Pediatrician 9 1 11 8
Gynecologist 6 5 83 1
Dental Surgeon 1
(HO) 172 114 66,2 58
Radiologist; 7 2 28,5 5
Anesthesiologist 5 1 20 4
Nurses 2058 1645 80 413
Pharmacist 53 4 7.5 49
During the plan period it has been possible to achieve the targets of only 7.5% for pharmacists 11 % for pediatricians 20 % for ophthalmologists andanesthesiologists,28 % for radiologists etc..
Though the planned target was modest and did not attempt to catch up with
the national standard, the above data clearly shows that the performance of the regional government in manpower development is far below the set target.
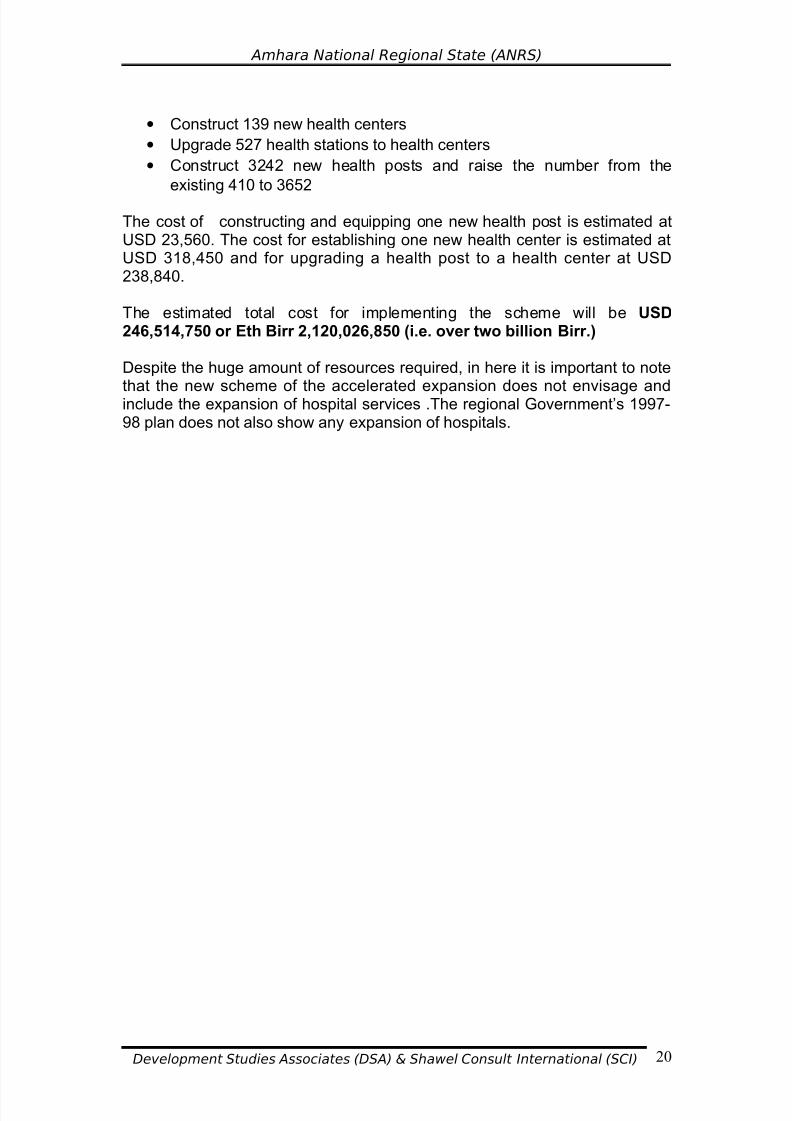
The new Accelerated expansion of primary health care coverage plan for Ethiopia targets universal coverage by 2009. To achieve the countrywidetarget it is required to:
• Construct and equip 563 new health centers
• Upgrade 2167 health stations to health centers.
• Construct 12, 249 new health posts
The implementation of the scheme within the region will require to:
7/30/2019 Health Report Final
http://slidepdf.com/reader/full/health-report-final 25/34
Amhara National Regional State (ANRS)
• Construct 139 new health centers
• Upgrade 527 health stations to health centers
• Construct 3242 new health posts and raise the number from the
existing 410 to 3652
The cost of constructing and equipping one new health post is estimated atUSD 23,560. The cost for establishing one new health center is estimated atUSD 318,450 and for upgrading a health post to a health center at USD238,840.
The estimated total cost for implementing the scheme will be USD246,514,750 or Eth Birr 2,120,026,850 (i.e. over two billion Birr.)
Despite the huge amount of resources required, in here it is important to note
that the new scheme of the accelerated expansion does not envisage andinclude the expansion of hospital services .The regional Government’s 1997-98 plan does not also show any expansion of hospitals.

7/30/2019 Health Report Final
http://slidepdf.com/reader/full/health-report-final 26/34
Amhara National Regional State (ANRS)
IX. HEALTH SERVICE (FACILITY MANPOWER) GAP-
ANALYSIS
It has been earlier observed that the regional expansion rate of health
services both in health service facilities and manpower is much lower than theplanned target.
The gap analysis both for the service facilities and human power which isbased on the standard set by the Federal Ministry of Health (Annex) revealsthe following picture. .
Table 8: Health Facility and manpower GA P (Existing)
Facility/ Profession MoH /WHOStandard
CurrentRegional
requirement
Currentlyexisting
GAP
FacilityDistrict Hospital 1:250,000 68 9 59 (86.7%)
Zonal Hospital 1:1,000,000 17 4 13 (76.5%)
Referral Hospital 1:5,000,000 4 2 2 (50%)
Health Center 25,000 680 112 568 (83.5%)
Health Manpower
Specialist 170 26 144 (84.7%0
Physicians 1:25,000 748 138/ 610 (81.5%)
Nurses 1:5000 3482 1645 1837(52.7%)
Health Assistants 1686 1220 460 (27.2%)
Pharmac/tech 53 4 49 (92.4%)
The shortage of facilities and manpower is observed across the board in alltypes of service facilities and manpower. The health manpower gap/shortageis getting worse by the high attrition of physicians and nurses.
N.B The analysis does not include the private facilities

7/30/2019 Health Report Final
http://slidepdf.com/reader/full/health-report-final 27/34
Amhara National Regional State (ANRS)
X. HEALTH FACILITY AND MANPOWER
DEMAND PROJECTION FOR THE COMING TEN YEARS
The existing gap of both health service facilities and manpower is clearlyobserved in the preceding table. Based on projected annual population growththe health service demand for the coming ten years may look like as follows.
Year 1998 1999 2000 2001 2002 2003 2004 2005 2006 2007
Population. 18.7 19.2 19.75 20.3 20.9 21.5 22.1 22.76 23.3 24.0
DistrictHospital
75 77 79 81 84 86 88 91 93 96
ZonalHospital
18 19 20 20 21 21 22 23 23 24
ReferralHospital
4 4 4 4 4 4 4 5 5 5
HealthCenter
748 768 788 812 836 860 884 908 932 960
Physicians 748 768 788 812 836 860 884 908 932 960
Nurses 3740 3840 3950 4060 4180 4300 4420 4552 4660 4800
Given the current expansion capacity of the government, the projectionindicates that the service gap will progressively get wider and wider and thedemand could never be met by the efforts of the government which calls for the expanded participation of the private sector .
7/30/2019 Health Report Final
http://slidepdf.com/reader/full/health-report-final 28/34

7/30/2019 Health Report Final
http://slidepdf.com/reader/full/health-report-final 29/34

7/30/2019 Health Report Final
http://slidepdf.com/reader/full/health-report-final 30/34
Amhara National Regional State (ANRS)
XIII. RECOMMENDATIONS
13.1 Create favorable and attractive working environment,
•
Encourage and attract the private sector to participate in the healthhuman power development and health service delivery expansionincluding basic health services
• Encourage the sector to get involved in prevention activities
(malaria controlHIV /AIDS prevention etc)
• It will be desirable to devise means and ways to attract experienced
and qualified professionals including from outside the region andenable them to provide specialized services. This will includeamong others:
• Simplifying licensing system• Encouraging Specialists working in GO facilities to have their
own license to open and practice private services
• Facilitate for health workers to use GO health facilities for their
private practices out of working hours.
• Facilitate for highly specialized manpower to serve as visiting
practitioners
• Encourage and ensure the professional carrier of private
practitioners
• Create conducive working relationship with private practice by
involving them in health policy, program development andevaluation undertakings
• PROVIDE PROFESIONALS GUIDANCE
13.2. POLICY/ STRATEGY REVIEW/RECONSIDERATION
• The accelerated expansion of Basic Health Services does not in any
way mention the need for the expansion of hospital services. This willhave serious implication on the development of the health manpower and the overall health policy. The regional government should therefore
make its position on the issue clear and plan on this for the public andthe private sector
• Establish a joint Government and private sector Forum / network for
joint consultation regarding planning, development and evaluation of health services in the region.
7/30/2019 Health Report Final
http://slidepdf.com/reader/full/health-report-final 31/34
Amhara National Regional State (ANRS)
XIV. POTENTIAL AREAS FOR THE INVOLVEMENT
OF THE PRIVATE SECTOR
• Establishment and operation of Small and Medium Hospitals
• Training of Medium Level Health manpower (Nursing, Lab Tech,pharmacy tech, X-ray etc).
• Specialized services (Dentistry, Ophthalmology, pediatrics and
subspecialties like Cardiology and nephrology)
• Specialized Diagnostic Services
• Repair and maintenance of medical equipment and instruments
• Laboratory reagent preparation
• Pharmaceutical and drug production, repackaging retail /whole sale
etc
• Prevention and control services (malaria, HIV/AIDS etc)
• Expansion of Basic health services
7/30/2019 Health Report Final
http://slidepdf.com/reader/full/health-report-final 32/34
Amhara National Regional State (ANRS)
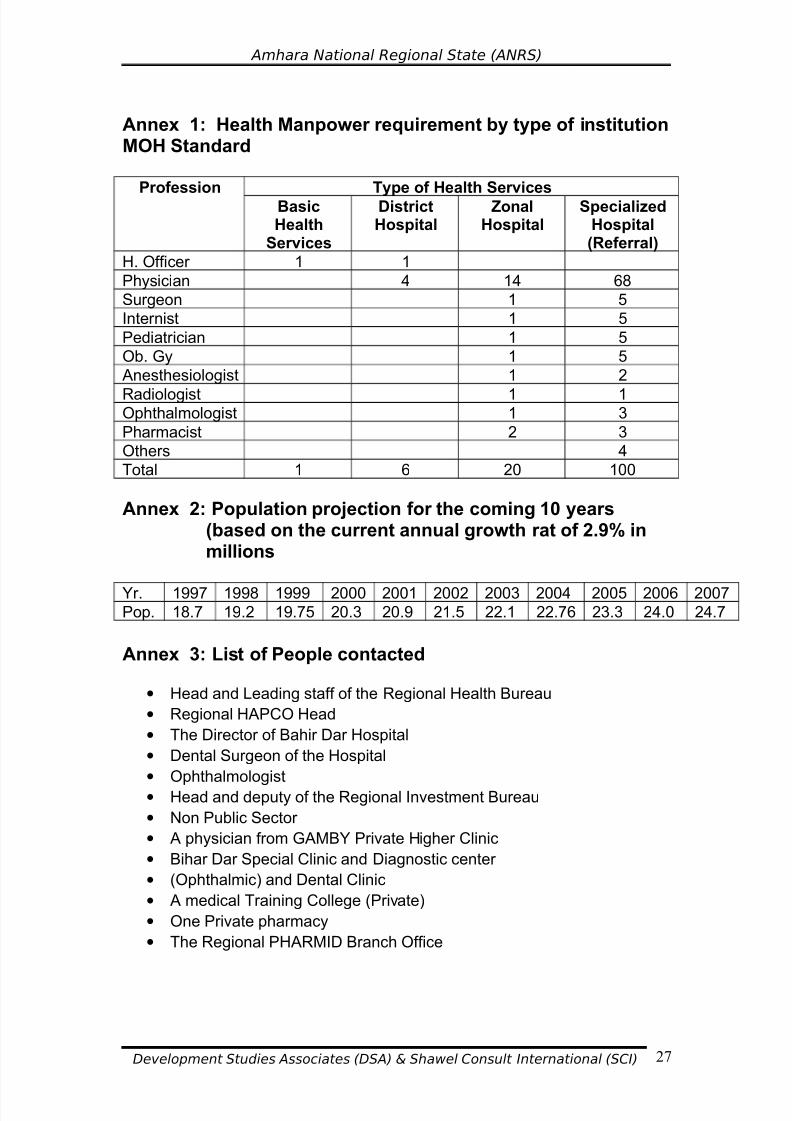
Annex 1: Health Manpower requirement by type of institutionMOH Standard
Profession Type of Health Services
BasicHealth
Services
DistrictHospital
ZonalHospital
SpecializedHospital(Referral)
H. Officer 1 1
Physician 4 14 68
Surgeon 1 5
Internist 1 5
Pediatrician 1 5
Ob. Gy 1 5
Anesthesiologist 1 2
Radiologist 1 1Ophthalmologist 1 3
Pharmacist 2 3
Others 4
Total 1 6 20 100
Annex 2: Population projection for the coming 10 years(based on the current annual growth rat of 2.9% inmillions
Yr. 1997 1998 1999 2000 2001 2002 2003 2004 2005 2006 2007Pop. 18.7 19.2 19.75 20.3 20.9 21.5 22.1 22.76 23.3 24.0 24.7
Annex 3: List of People contacted
• Head and Leading staff of the Regional Health Bureau
• Regional HAPCO Head
• The Director of Bahir Dar Hospital
• Dental Surgeon of the Hospital
• Ophthalmologist
• Head and deputy of the Regional Investment Bureau
• Non Public Sector
• A physician from GAMBY Private Higher Clinic
• Bihar Dar Special Clinic and Diagnostic center
• (Ophthalmic) and Dental Clinic
• A medical Training College (Private)
• One Private pharmacy
• The Regional PHARMID Branch Office
7/30/2019 Health Report Final
http://slidepdf.com/reader/full/health-report-final 33/34
Amhara National Regional State (ANRS)
Annex 4: Documents Reviewed
• Accelerated Expansion of Primary Health Care Coverage in Ethiopia
(FDRE MoH) Nov. 2004
• Ethiopian Multi-sectoral Strategic Plan to Combat HIV/AIDS. Dec. 2004
• Annual Reports of Anti Malaria Association (AMA)• DHS for 2002 CSO
• Development Indicators of Amhara Region: August 2004. Bureau of
Finance and Economic Development
• Health and healthy Related Indicators: FMoH 1995.
• Five Year Strategic Plan of the Amahara Regional State 1992-1997
(Amharic Version)
• Annual Report of the Amhara Regional Health Bureau for 1996( Amharic
Version)
• Second Quarter Report for 1997 (Amharic Version)
• The Regional Annual Operational Plan and Budget for 1997( AmharicVersion)
Development Studies Associates (DSA) & Shawel Consult International (SCI) 28

7/30/2019 Health Report Final
http://slidepdf.com/reader/full/health-report-final 34/34
Amhara National Regional State (ANRS)
REFERENCES
1. Transitional Government of Ethiopia, Population Policy of Ethiopia Addis Ababa, 1993.
2. Ministry of Finance and Economic Development, FDRE. Population andDevelopment of Ethiopia: A Decades Overview Addis Ababa, January2004.
3. MoFED, Ethiopia: Building on Progress: A plan for Accelerated andSustained Development to end Poverty, Addis Ababa, 2005/06-2009/10
4. BOFED, ANRS, Population Mainstreaming Bahir Dar, January, 2005.
5. __________ Development Indicators of Amhara Region, 2004
6. Central Statistica Agency, Welfare Monitoring Survyey 2004, Addis Ababa
7. P. Demeny and G. Mcnicoll, Population and Development, EarthscanPublication Ltd, UK, 1998
8. Robert Cliquet & K. Thienpont. Population and Development A messagefrom Cairo, Kluwer Academic Publishers, The Netherlands, 1995.
9. M. P Todaro & S.C. Smith; Economic Development 8ed Peerson Education Asia, Delihi, 2003.
Related Documents


