2013 COST TRENDS REPORT PURSUANT TO M.G.L. C. 6D, § 8(D) ANNUAL REPORT JANUARY 8, 2013 COMMONWEALTH OF MASSACHUSETTS HEALTH POLICY COMMISSION

Health Policy Commission Cost Trends Report 2013
Nov 28, 2015
The Massachusetts Health Policy commission released a new report on health care cost trends.
Welcome message from author
This document is posted to help you gain knowledge. Please leave a comment to let me know what you think about it! Share it to your friends and learn new things together.
Transcript
2013 Cost trends report
pursuant to M.G.L. C. 6d, § 8(d)
annuaL reportJanuary 8, 2013
Commonwealth of massaChusetts
health PoliCy Commission
Spending Levels Spending Trends Delivery System Quality Performance and Access
2 Health Policy Commission
Per capita health care spending in Massachuse! s is
the highest of any state in the United States, with higher
spending than the national average across all payer types.
Massachuse! s devoted 16.6 percent of its economy to per-
sonal health care expenditures in 2012, compared with
15.1 percent for the nation. Higher spending results from
higher utilization and higher prices, and is concentrated in
two categories of service: hospital care and long-term care
and home health.
Over the past decade, Massachuse! s health care spend-
ing has grown much faster than the national average, driv-
en primarily by faster growth in commercial prices. While
spending growth in Massachuse! s since 2009 has slowed
in line with slower national growth, sustaining lower
growth rates will require concerted eff ort. Past periods of
slow health care growth in Massachuse! s and the United
States, such as the 1990s, have been followed by sustained
periods of higher growth.
Massachuse! s has be! er overall health care quality
performance and off ers be! er access to care than many
other states. However, considerable opportunities remain
to further improve quality and access as well as popula-
tion health.
Signifi cant trends are occurring in the provider and
payer market. For providers, the delivery system is grow-
ing increasingly concentrated in several large systems,
with a larger proportion of discharges occurring from ma-
jor teaching hospitals and hospitals in their systems. Fur-
ther, many provider organizations seek to re-orient care
delivery around patient-centered, accountable care mod-
els, though signifi cant challenges such as misaligned pay-
ment incentives, persistent barriers to behavioral health
integration, and limited data and resources remain.
In the payer market, insurance companies are off ering
and purchasers are increasingly selecting products intend-
ed to involve consumers in making higher-value decisions,
such as choosing high-quality, lower-priced providers and
avoiding unnecessary services. With these changes, the pro-
portion of costs covered by insurance benefi ts has declined.
In addition, public and commercial payers are increas-
ingly developing alternative payment methods that aim to
alter supply-side incentives. However, there are signifi cant
challenges in implementation, including wide variation in
these types of contracts covering Massachuse! s provid-
ers, both within and across payers, as budget levels, risk
adjustments, and other terms are negotiated. In addition,
behavioral health services are often excluded from glob-
al budgets. Finally, an increasing shift in the commercial
market to PPO products, which currently do not support
alternative payment methods, presents an obstacle to the
continued adoption and potential eff ectiveness of these
payment methods.
To identify potential opportunities for savings in Mas-
sachuse! s, we reviewed three cost drivers in depth: hospi-
tal operating expenses, wasteful spending, and high-cost
patients.
Hospital opera� ng expenses
There are major opportunities to improve operating ef-
fi ciency in Massachuse! s hospitals. The operating expens-
es that hospitals incur for inpatient care diff er by thou-
sands of dollars per discharge, even after adjusting for
regional wages and the complexity of care provided. Some
hospitals deliver high-quality care with lower operating
expenses, while many higher-expense hospitals achieve
lower quality performance.
Operating expenses are driven in part by market dy-
namics. Hospitals that are able to negotiate high commer-
cial rates have high operating expenses and cover losses
they may experience on public payer business with income
from their higher commercial revenue, while hospitals
with more limited revenue must maintain lower expenses.
Hospitals can follow various strategies to reduce operat-
ing expenses, such as adopting “lean” management prin-
ciples and improving their procurement and supply-chain
management processes.
Execu� ve Summary
Hospital Operating Expenses Wasteful Spending High-Cost Patients Conclusion
2013 Annual Cost Trends Report 3
Wasteful spending
An estimated 21 to 39 percent ($14.7 to $26.9 billion in
2012) of health care expenditures in Massachuse! s could
be considered wasteful. There are specifi c examples of
wasteful spending that payers and providers can address,
either in the current fee-for-service system or under alter-
native payment methods. Large opportunities across care
se! ings include $700 million in preventable acute hospital
readmissions and $550 million in unnecessary emergency
department visits. Hospitals could reduce health care-as-
sociated infections, estimated at $10 to $18 million. Finally,
there are a number of opportunities addressable by indi-
vidual physicians and patients, such as early elective in-
ductions ($3 to $8 million) and inappropriate imaging for
lower back pain ($1 to $2 million).
High-cost pa! ents
Five percent of patients account for nearly half of all
spending among the Medicare and commercial popula-
tions in Massachuse! s. Signifi cant savings can be captured
by focusing on a subset of the population with identifi able
and predictable characteristics. Certain clinical conditions,
regions of residence, and demographic characteristics dif-
fer between high-cost patients and the rest of the popula-
tion. A number of conditions occurred more often among
high-cost patients, and high-cost patients generally had
more clinical conditions than the rest of the population. The
presence of multiple conditions, such as behavioral health
and chronic medical conditions, increased spending more
than the combined eff ects of individual conditions, illus-
trating the complexity of managing multiple conditions si-
multaneously. There was modest regional variation in the
concentration of high-cost patients. Socioeconomic factors
were also important, as lower zip code income correlated
with being high-cost among the commercial population.
Persistently high-cost patients – those who remain
high-cost over multiple years – are easier to identify for
care improvement and be! er health outcomes. These pa-
tients represent 29 percent of high-cost patients and make
up 15 to 20 percent of Medicare and commercial spending
in Massachuse! s. Interventions that have been shown to
improve the effi ciency of care for high-cost patients in-
clude: prevention of conditions that often lead to expen-
sive health crises; process and operational improvements
that reduce the cost of episodes that are common among
high-cost patients; and care management resources to
support patients to manage their care more eff ectively and
be! er coordinate care for patients across multiple provider
se! ings.
Spending Levels Spending Trends Delivery System Quality Performance and Access
4 Health Policy Commission
Introduc� on
Massachuse! s is a nation-
al leader in innovative and
high-quality health care, but
the rising costs of the current
system pose an increasing bur-
den for households, businesses,
and the state economy. Nation-
ally, health care spending has
grown faster than the economy
nearly every year over the last
four decades. In Massachuse! s,
the growth has been even more
pronounced, with spending on
personal health care services in-
creasing from 12.8 percent of the
state economy in 2001 to 16.6
percent in 2012.
This level of growth creates
an unsustainable crowding-out
eff ect for households, businesses,
and government, reducing resources available to spend on
other priorities. Households have faced a growing fi nan-
cial burden, with employee contributions for family health
insurance plans increasing seven percent annually from
2005 to 2011, while household income rose by only 1.6 per-
cent annually during that same time period.1,2,3 For busi-
nesses, even with the increased shift of costs to employees,
a 2012 survey found that 98 percent of Massachuse! s com-
panies cited health insurance as their top benefi t concern.4
The rising cost of health benefi ts places signifi cant pres-
sure on businesses and impedes job and wage growth.5 For
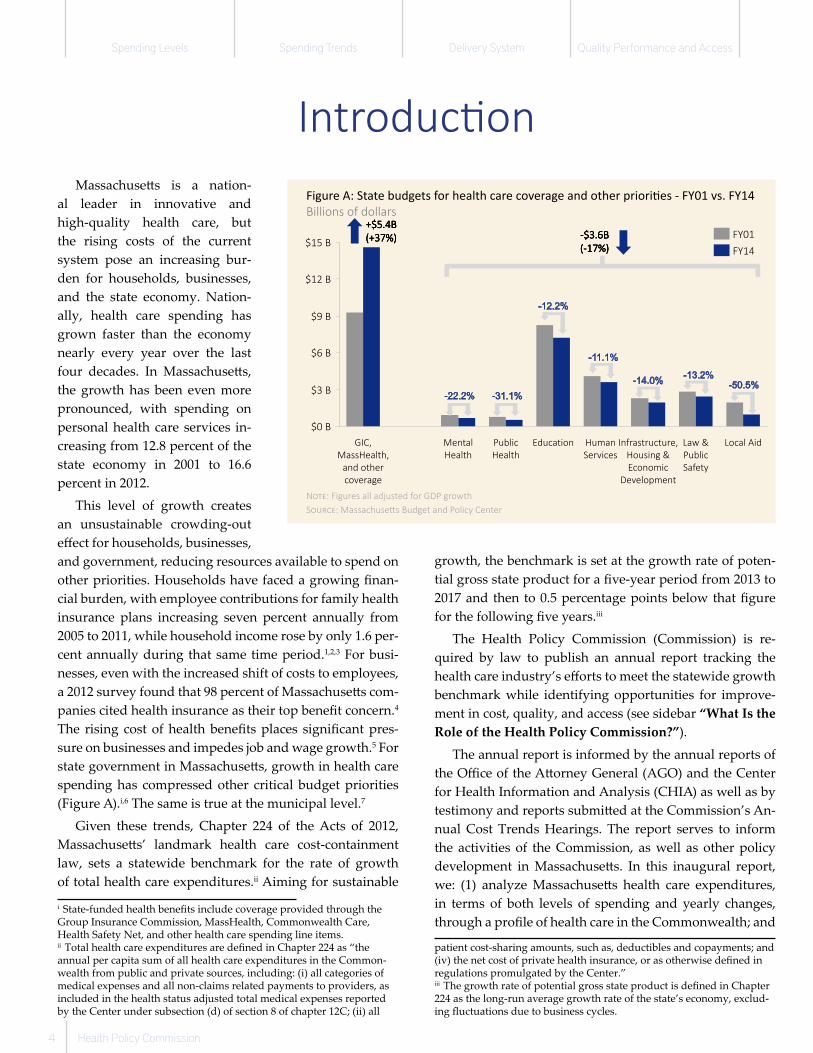
state government in Massachuse! s, growth in health care
spending has compressed other critical budget priorities
(Figure A).i,6 The same is true at the municipal level.7
Given these trends, Chapter 224 of the Acts of 2012,
Massachuse! s’ landmark health care cost-containment
law, sets a statewide benchmark for the rate of growth
of total health care expenditures.ii Aiming for sustainable
i State-funded health benefi ts include coverage provided through the Group Insurance Commission, MassHealth, Commonwealth Care, Health Safety Net, and other health care spending line items.ii Total health care expenditures are defi ned in Chapter 224 as “the annual per capita sum of all health care expenditures in the Common-wealth from public and private sources, including: (i) all categories of medical expenses and all non-claims related payments to providers, as included in the health status adjusted total medical expenses reported by the Center under subsection (d) of section 8 of chapter 12C; (ii) all
growth, the benchmark is set at the growth rate of poten-
tial gross state product for a fi ve-year period from 2013 to
2017 and then to 0.5 percentage points below that fi gure
for the following fi ve years.iii
The Health Policy Commission (Commission) is re-
quired by law to publish an annual report tracking the
health care industry’s eff orts to meet the statewide growth
benchmark while identifying opportunities for improve-
ment in cost, quality, and access (see sidebar “What Is the
Role of the Health Policy Commission?”).
The annual report is informed by the annual reports of
the Offi ce of the A! orney General (AGO) and the Center
for Health Information and Analysis (CHIA) as well as by
testimony and reports submi! ed at the Commission’s An-
nual Cost Trends Hearings. The report serves to inform
the activities of the Commission, as well as other policy
development in Massachuse! s. In this inaugural report,
we: (1) analyze Massachuse! s health care expenditures,
in terms of both levels of spending and yearly changes,
through a profi le of health care in the Commonwealth; and
patient cost-sharing amounts, such as, deductibles and copayments; and (iv) the net cost of private health insurance, or as otherwise defi ned in regulations promulgated by the Center.”iii The growth rate of potential gross state product is defi ned in Chapter 224 as the long-run average growth rate of the state’s economy, exclud-ing fl uctuations due to business cycles.
����
����
�� ��
��!��
�"��
����
#�����$��#�%�&�
'������
�����(
)�� �� ���� �*�
+�����&�
,����-���
.������-���
+�-���
�� ����
,��������'������
+�����
/������
+�����
0)1*�
/�+�����*�
�������� �
���� ��
����
����2�2�2�2� ��� ��� ��� ���
32�45632�45632�45632�456 ������������������������
3333�����456�456�456�456
Figure A: State budgets for health care coverage and other priori� es - FY01 vs. FY14
Billions of dollars
N!"#: Figures all adjusted for GDP growth
S!$%&#: Massachuse' s Budget and Policy Center
Hospital Operating Expenses Wasteful Spending High-Cost Patients Conclusion
2013 Annual Cost Trends Report 5
(2) review signifi cant drivers of cost growth and identify
interventions, innovations, and policies that can moderate
these drivers. The necessary data to examine the growth
in total health care expenditures between 2012 and 2013
will not be available until mid-2014 and therefore we will
not examine health care spending growth relative to the
benchmark in this year’s report.
W��� I� ��� R�!� �" ��� H��!�� P�!#$% C�&&#��#�'?
The Health Policy Commission was established in 2012 through Massachuse� s’ landmark health care cost-containment law,
Chapter 224: “An Act Improving the Quality of Health Care and Reducing Costs through Increased Transparency, Effi ciency, and
Innova� on.” The Commission is an independent state agency governed by an 11-member board with diverse experience in
health care.
Chapter 224 sets the ambi� ous goal of bringing health care spending growth in line with growth in the state’s overall economy.
The Commission is working to advance this goal by:
▪ Fostering reforms to the health care payment system that aim to reward quality care, improve health outcomes, and more
effi ciently spend health care dollars;
▪ Promo� ng innova� ve delivery models that will enhance care coordina� on, advance integra� on of behavioral and physical
health services, and encourage eff ec� ve pa� ent-centered care;
▪ Inves� ng in community hospitals and other providers to support the transi� on to new payment methods and care delivery
models;
▪ Increasing the transparency of provider organiza� ons and assessing the impact of health care market changes on the cost,
quality, and access of health care services in Massachuse� s;
▪ Analyzing and repor� ng of cost trends through data examina� on and an annual public hearing process to provide account-
ability of the health care cost-containment goals set forth in Chapter 224;
▪ Enhancing accountability through the implementa� on of performance-improvement plans for certain providers and payers
that threaten the ability of the state to meet the cost growth benchmark;
▪ Evalua� ng the prevalence and performance of ini� a� ves aimed at health system transforma� on;
▪ Engaging consumers and businesses on health care cost and quality ini� a� ves; and
▪ Partnering with a wide range of stakeholders to promote informed dialogue, recommend evidence-based policies, and iden� fy
collabora� ve solu� ons.
References
1 Center for Health Informa� on and Analysis. Massachuse� s House-
hold and Employer Insurance Surveys: Results from 2011. Boston
(MA): Center for Health Informa� on and Analysis; 2013 Jan.
2 United States Census Bureau. 2005 American Community Survey
1-Year Es� mates. Washington (DC): United State Census Bureau.
3 United States Census Bureau. 2011 American Community Survey
1-Year Es� mates. Washington (DC): United States Census Bureau.
4 Associated Industries of Massachuse� s. Trends and Prac� ces Among
Massachuse� s Employers: 2012 Benefi ts Report. Boston (MA): As-
sociated Industries of Massachuse� s; 2012.
5 Baicker K, Chandra A. The Labor Market Eff ects of Rising Health In-
surance Premiums. Journal of Labor Economics. 2006;24(3):609-
634.
6 Massachuse� s Budget and Policy Center. Massachuse� s Budget
Browser [Internet]. Boston (MA): Massachuse� s Budget and Policy
Center; [cited 2013 Dec 18]. Available from: h� p://www.massbud-
get.org/browser/index.php.
7 Massachuse� s Taxpayers Founda� on. Municipal Financial Data,
43rd Edi� on. Boston (MA): Massachuse� s Taxpayers Founda� on;
2013 Dec.

Spending Levels Spending Trends Delivery System Quality Performance and Access
6 Health Policy Commission
In this chapter, we present an overview of the Massa-
chuse! s health care system, examine spending levels and
spending trend, and identify factors contributing to cost
growth. With a focus on Chapter 224’s cost containment
goal, which relates the growth of health care spending to
that of the state’s economy, we examine how health care
spending as a percent of the state economy has grown over
time compared to the same measure for the United States
(Figure 1.1).
Comparing Massachuse! s with the United States and
reviewing trends over time raises several important ques-
tions that we address in this chapter:
▪ What explains the diff erence in Massachuse! s spend-
ing compared with the U.S. average?
▪ What contributed to the growth in Massachuse! s
health care spending over the past two decades?
▪ How do the characteristics of the state’s health care
system contribute to spending levels and trends?
▪ How does Massachuse! s perform compared with
the U.S. on measures of quality and access?
In this report, we often compare Massachuse! s with
the United States. In doing so, we do not suggest that the
U.S. average is the appropriate benchmark for Massachu-
1. Profi le of the Massachuse� s
Health Care System
Figure 1.1: Personal health care expenditures* rela� ve to size of economy
Percent of respec! ve economy†
*Personal health care expenditures (PHC) are a subset of na! onal health expenditures. PHC excludes administra! on and the net cost of private insurance, public health ac-
! vity, and investment in research, structures and equipment.†Measured as gross domes! c product (GDP) for the U.S. and gross state product (GSP) for Massachuse� s.‡CMS state-level personal health care expenditure data have only been published through 2009. 2010-2012 MA fi gures were es! mated based on 2009-2012 expenditure
data provided by CMS for Medicare, ANF budget informa! on statements and expenditure data from MassHealth, and CHIA TME reports for commercial payers.
S"#$%&: Centers for Medicare & Medicaid Services; Bureau of Economic Analysis; Center for Health Informa! on and Analysis; MassHealth; Census Bureau; HPC analysis
**** �%)������+ ���!������!���������� ����,--.��,-�-+,-�,�%/���������0��������������!����� ��
()
%/����������� ****
%/���%)�1�2
�,.3
�453�443
�6�3
��63
�-3
��3
�,3
�73
�83
�63
�43
�93
�53
�.3
,-3
�..- �.., �..8 �..4 �..5 ,--- ,--, ,--8 ,--4 ,--5 ,-�- ,-�,
�6,3
�,73
�,53
Hospital Operating Expenses Wasteful Spending High-Cost Patients Conclusion
2013 Annual Cost Trends Report 7
se! s’ health care spending, nor that it is a standard for ef-
fi ciency. Indeed, studies have demonstrated that U.S. per
capita spending far exceeds the average spending of other
nations and that a large proportion of U.S. spending on
health care is unnecessary and wasteful.1,2,3 Furthermore,
there are unique benefi ts that Massachuse! s derives from
its level of health care spending that should be preserved.
Rather, we make these comparisons to highlight potential
areas of challenges and opportunities for reducing spend-
ing growth in Massachuse! s. Although national or even
state-to-state comparisons can be instructive, the goal of
Chapter 224 is to keep health care spending in line with
the long-term growth rate of the state economy.
This report relies on a number of nationally recognized
data sources, including the National Health Expenditure
Accounts from the Centers for Medicare & Medicaid Ser-
vices (CMS), the Medical Expenditure Panel Survey (MEPS)
from the Agency for Healthcare Research and Quality
(AHRQ), the Behavioral Risk Factor Surveillance Survey
(BRFSS) from the Centers for Disease Control and Preven-
tion (CDC), the Annual Survey of the American Hospital
Association (AHA), and the State Health Facts published
by the Kaiser Family Foundation (KFF) (for more informa-
tion, see Technical Appendix B1: Data sources). We also
use data sets collected by Massachuse! s state agencies,
such as the Center for Health Information and Analysis
(CHIA), the Offi ce of the A! orney General (AGO), and the
Department of Public Health (DPH). In addition, we use
the Massachuse! s All-Payer Claims Database (APCD), a
detailed transaction history of all payments from major
Massachuse! s payers to providers (see sidebar “What is
the APCD and how do we use its data?”). Although the
scope of our APCD analyses is limited in this year’s report,
over time the data will enable us to examine health care
spending at a granular level for particular populations of
interest in future reports (for example, focused analyses of
racial and socioeconomic disparities in health care).
W��� �� ��� APCD �!" �#$ "# $� %�� ��� "���?
The Massachuse� s All-Payer Claims Database (APCD) is an essen� al resource with which researchers can examine health care
spending and the evolu� on of health care and health insurance markets. The APCD contains medical, pharmacy, and dental
claims from all payers that insure Massachuse� s residents, as well as informa� on about member, insurance product, and pro-
vider characteris� cs. It does not include payments that occur outside of the claims system, such as supplemental payments re-
lated to quality incen� ves or alterna� ve payment methods, nor does it include self-pay spending that consumers incur outside
of their insurance coverage.
For this report, we used a sample that consists of claims for the state’s three largest commercial payers – Blue Cross Blue Shield
of Massachuse� s (BCBS), Harvard Pilgrim Health Care (HPHC), and Tu� s Health Plan (THP) – and Medicare Fee-For-Service. Our
analyses incorporated claims-based medical expenditures for Medicare and commercial payers, but not pharmacy spending,
payments made outside the claims system, or MassHealth spending.i The Commission engaged the Lewin Group, a na� onally
recognized health policy research fi rm with Massachuse� s APCD experience, to examine the APCD, assess its validity for use in
cost trends analysis, validate the quality of its data, and propose methods to achieve our analy� c objec� ves.
Analysis of the APCD has allowed us to understand medical spending as the product of two factors:
1. The quan& ty of services delivered, which may be divided into the number of units and the quan� ty of services per unit.
2. The price paid for those services, which may be divided into unit price (the price paid per unit of service by par� cular payers
to par� cular providers), and provider mix (whether services are obtained in higher-priced or lower-priced se! ngs), and
payer mix.
In some analyses, we employ a third factor if useful:
3. The medical need or average risk level of the popula� on. If this factor is included, then medical spending is the product of
three factors: risk, quan� ty adjusted for risk, and price paid.
The APCD’s rich detail enables us to deconstruct trends into its components of quan� ty, price paid, and risk level, and also allows
for episode-level and person-level analyses such as the study of high-cost pa� ents in Chapter 4. In future reports, refi nements
of our analysis may also isolate the impact of changes in benefi t design, service mix, and provider mix on expenditure growth.
i The three commercial payers we focus on – BCBS, HPHC, and THP – represent nearly 80 percent of the commercial market. Medicare claims analyses do not include expenditures by Medicare Advantage plans. Examination of APCD data from MassHealth is ongoing, and MassHealth claims analyses will be included in future work by the Commission.

Spending Levels Spending Trends Delivery System Quality Performance and Access
8 Health Policy Commission
According to national data, spending per Massachu-
se! s resident averaged $9,278 on personal health care ex-
penditures in 2009,ii which was 36 percent (or $2,463) more
than the U.S. average of $6,815 (Figure 1.2). This level of
spending made Massachuse! s the highest-spending U.S.
state on a per capita basis (excluding the District of Colum-
bia), although it is not the highest state when ranked by
health care spending as a proportion of economic output.iii
As a percentage of the economy, Massachuse! s spent 16.8
percent on health care, compared with the U.S. average of
15.0 percent.
Massachuse! s per capita spending remains higher than
the U.S. average even after adjusting for certain diff erences
in the state’s profi le. Research suggests that certain aspects
of Massachuse! s, including its older population, higher in-
ii 2009 is the most recent year for which personal health care expendi-tures (PHC) data is available.iii Massachuse! s spent signifi cantly more than other states that are relatively wealthy or other states in the Northeast. Per capita spending in Massachuse! s was 11 percent higher than in New York, 49 percent higher than in California, and nine percent higher than in Maine, the highest-spending neighboring state.
put costs,iv and broader insurance coverage, likely contrib-
ute to higher health care spending.4,5 These factors account
for 16 percentage points of the diff erence, leaving a 20 per-
centage point diff erence between Massachuse! s and the
U.S. average beyond these factors (see Technical Appendix
A1: Profi le of Massachuse" s for more information).
1.1.1 Spending levels by category of service
One way to analyze diff erences in spending levels is
to break down spending into categories of service (Fig-
ure 1.3). In 2009, nearly three-quarters of the diff erence in
spending between Massachuse! s and the U.S. was in two
categories: hospital care (which includes inpatient and out-
patient care) and long-term care and home health (which
includes both institutional nursing and rehabilitative ser-
vices and skilled nursing services provided in the home).
iv By input costs we mean costs associated with providing services. Our analysis used the Medicare Geographic Adjustment Factor (GAF), which adjusts for wages, offi ce rents, supplies, and medical malpractice insurance premiums.
1.1 Spending LevelsIn 2009, Massachuse� s spent 36 percent more on health care per resident than the
U.S. average, with higher spending across all payer types. This higher spending was
concentrated in hospital care and long-term care and home health.
( �������������������������� ��
�������������
����� ��(
-./0+
1���2
���#� ����
������#��
������&
-.33�
��������
���
-.�$++
4��� ���
��������
-./
)�����
����������
#��� ���
���2
��������
-.33
���������
������� ����
���������������������������
.,$*30
.5$0�/
46��
7�����������������7�����������������7�����������������7����������������� 46�������������46�������������46�������������46������������� ��������������������������������������������������������
���� ������
�������� �
��� ���������� ���������� ���������� �������
������������������������
�������� ��������� ��������� ��������� �
8*98*98*98*9 �9�9�9�9 *89*89*89*89 9999 :�9:�9:�9:�9
Figure 1.3: Per capita personal health care expenditures*
by category of service compared to U.S.
Dollars, 2009
*Personal health care expenditures (PHC) are a subset of na! onal health ex-
penditures. PHC excludes administra! on and the net cost of private insurance,
public health ac! vity, and investment in research, structures and equipment.†Includes nursing home care, home health care, and other health, residen! al,
and professional care.‡Includes physician and clinical services, dental services, and other professional services.
S"#$%&: Centers for Medicare & Medicaid Services; HPC analysis
Figure 1.2: Per capita personal health care expenditures*
compared to U.S. and other states
Dollars, 2009
*Personal health care expenditures (PHC) are a subset of na! onal health expen-
ditures. PHC excludes administra! on and the net cost of private insurance, pub-
lic health ac! vity, and investment in research, structures and equipment.
S"#$%&: Centers for Medicare & Medicaid Services; Bureau of Economic Analy-
sis; HPC analysis
./#-0.1#23
.1#4/1.4#,41.4#42,
.3#20�
.-#43
.1#3�/
56565656�*�*�*�*787878789�9�9�9��*�*�*�*:;:;:;:;&*&*&*&*��������

Hospital Operating Expenses Wasteful Spending High-Cost Patients Conclusion
2013 Annual Cost Trends Report 9
1.1.2 Spending levels by payer type
There are multiple insurers or “payers” – both pub-
lic and commercial – in the U.S. health care market. In
Massachuse! s, approximately one-third of the popula-
tion receives coverage from public payers (Medicare and
MassHealth) and roughly two-thirds through commercial
health insurance.6 We examine how Massachuse! s expen-
ditures compared to U.S. levels within each of these seg-
ments.
For each type of payer, Massachuse! s had a higher per
member or per benefi ciary spending level than the nation-
al average in 2009, with diff erences ranging from nine per-
cent to 21 percent (Figure 1.4). In addition to having higher
spending levels for each payer type, Massachuse! s had a
higher proportion of its population enrolled in Medicare
and Medicaid.6 Generally across the U.S., the Medicare
and Medicaid populations have greater health care needs
and spending levels than those in commercial insurance.7
As described in Section 1.1.1, for Massachuse! s’ to-
tal expenditures across public and commercial spending,
hospital care along with long-term care and home health
comprise three-fourths of spending above the U.S. aver-
age, with the remainder driven primarily by spending on
professional services. These categories constitute an even
larger proportion of spending above the U.S. average
for Medicare and MassHealth (Table 1.1). For Medicare,
W!"# $% &' ('") *+ “!'",#! -"/' '03')$4#5/'6”?
The term “health care expenditures” (or health care spending) refers to the total spending of a popula� on on those ac� vi� es
related to maintaining and improving both physical and behavioral health.
In this report, we use several es� mates of health care dollars spent on the care of individuals. These es� mates exclude spending
on public health programs, administra� ve costs for payers, and investments in research, buildings, and equipment. The three
measures we use are personal health care expenditures, total medical expenses, and claims-based medical expenditures. Diff er-
ences between these measures are explained below.
1. Personal health care expenditures (PHC) are measured by the CMS based on surveys of households, payers, and health care
providers. PHC covers all spending by public and commercial payers as well as consumer out-of-pocket spending. This includes
spending on services that are not covered by insurance benefi ts.
2. Total medical expenses (TME) are measured by the CHIA based on data reported by the 10 largest commercial payers in Mas-
sachuse� s.v TME excludes services that are not covered by commercial insurance benefi ts (for example, nursing-home care
that is paid in full by a consumer).
3. Claims-based medical expenditures are calculated by the Commission in our analysis of the APCD. Health care claims are sub-
mi� ed by providers to payers in order to receive payment for services, and this transac� on history represents a rich data set
for analysis (for more informa� on, including data limita� ons, see sidebar “What is the APCD and how do we use the data?”).
Although these three measures are useful indicators of health care spending, it is important to note that the benchmark for health
care cost growth in Chapter 224 is linked to another measure, Total Health Care Expenditures (THCE), which are defi ned and cal-
culated by CHIA, with the fi rst formal determina� on in the autumn of 2014. Under the statute, THCE includes:
▪ All medical expenses paid to providers by public and commercial payers,
▪ All pa� ent cost-sharing amounts (for example, deduc� bles and co-payments), and
▪ The net cost of private insurance (for example, administra� ve expenses and opera� ng margins for commercial payers).
v The 10 largest commercial health care payers represent approximately 95 percent of the commercial health care market in Massachuse! s.
%!&"%
�#!'%(
&!")&
��!"))
*�������*�������
*+��
Figure 1.4: Per member/benefi ciary personal health care
expenditures* by payer type compared to U.S.
Dollars, 2009
* Personal health care expenditures (PHC) are a subset of na! onal health ex-
penditures. PHC excludes administra! on and the net cost of private insurance,
public health ac! vity, and investment in research, structures and equipment.
S"#$%&: Centers for Medicare & Medicaid Services; HPC analysis
Spending Levels Spending Trends Delivery System Quality Performance and Access
10 Health Policy Commission
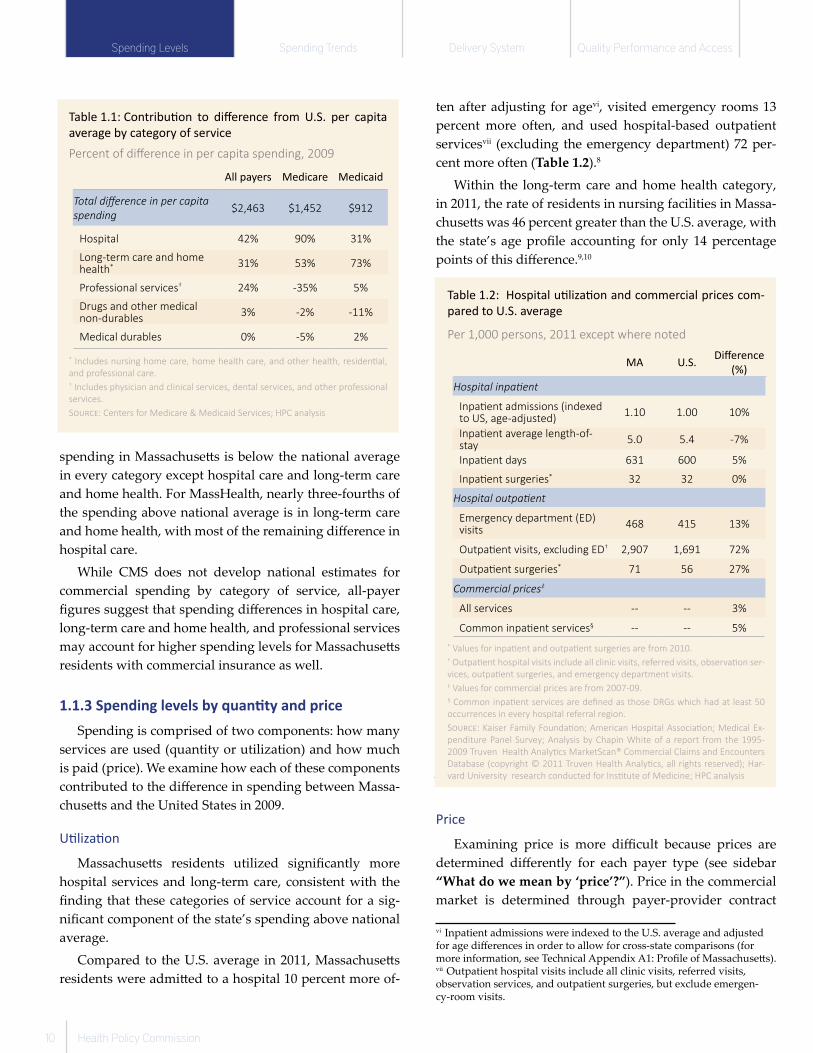
spending in Massachuse! s is below the national average
in every category except hospital care and long-term care
and home health. For MassHealth, nearly three-fourths of
the spending above national average is in long-term care
and home health, with most of the remaining diff erence in
hospital care.
While CMS does not develop national estimates for
commercial spending by category of service, all-payer
fi gures suggest that spending diff erences in hospital care,
long-term care and home health, and professional services
may account for higher spending levels for Massachuse! s
residents with commercial insurance as well.
1.1.3 Spending levels by quan� ty and price
Spending is comprised of two components: how many
services are used (quantity or utilization) and how much
is paid (price). We examine how each of these components
contributed to the diff erence in spending between Massa-
chuse! s and the United States in 2009.
U� liza� on
Massachuse! s residents utilized signifi cantly more
hospital services and long-term care, consistent with the
fi nding that these categories of service account for a sig-
nifi cant component of the state’s spending above national
average.
Compared to the U.S. average in 2011, Massachuse! s
residents were admi! ed to a hospital 10 percent more of-
ten after adjusting for agevi, visited emergency rooms 13
percent more often, and used hospital-based outpatient
servicesvii (excluding the emergency department) 72 per-
cent more often (Table 1.2).8
Within the long-term care and home health category,
in 2011, the rate of residents in nursing facilities in Massa-
chuse! s was 46 percent greater than the U.S. average, with
the state’s age profi le accounting for only 14 percentage
points of this diff erence.9,10
Price
Examining price is more diffi cult because prices are
determined diff erently for each payer type (see sidebar
“What do we mean by ‘price’?”). Price in the commercial
market is determined through payer-provider contract
vi Inpatient admissions were indexed to the U.S. average and adjusted for age diff erences in order to allow for cross-state comparisons (for more information, see Technical Appendix A1: Profi le of Massachuse! s).vii Outpatient hospital visits include all clinic visits, referred visits, observation services, and outpatient surgeries, but exclude emergen-cy-room visits.
Table 1.1: Contribu� on to diff erence from U.S. per capita
average by category of service
Percent of diff erence in per capita spending, 2009
All payers Medicare Medicaid
Total diff erence in per capita
spending$2,463 $1,452 $912
Hospital 42% 90% 31%
Long-term care and home health* 31% 53% 73%
Professional services† 24% -35% 5%
Drugs and other medical non-durables
3% -2% -11%
Medical durables 0% -5% 2%
* Includes nursing home care, home health care, and other health, residen! al,
and professional care.† Includes physician and clinical services, dental services, and other professional
services.
S"#&'(: Centers for Medicare & Medicaid Services; HPC analysis
Table 1.2: Hospital u� liza� on and commercial prices com-
pared to U.S. average
Per 1,000 persons, 2011 except where noted
MA U.S.Diff erence
(%)
Hospital inpa! ent
Inpa! ent admissions (indexed to US, age-adjusted)
1.10 1.00 10%
Inpa! ent average length-of-stay
5.0 5.4 -7%
Inpa! ent days 631 600 5%
Inpa! ent surgeries* 32 32 0%
Hospital outpa! ent
Emergency department (ED) visits
468 415 13%
Outpa! ent visits, excluding ED† 2,907 1,691 72%
Outpa! ent surgeries* 71 56 27%
Commercial prices‡
All services -- -- 3%
Common inpa! ent services§ -- -- 5%
* Values for inpa! ent and outpa! ent surgeries are from 2010.† Outpa! ent hospital visits include all clinic visits, referred visits, observa! on ser-
vices, outpa! ent surgeries, and emergency department visits.‡ Values for commercial prices are from 2007-09.§ Common inpa! ent services are defi ned as those DRGs which had at least 50
occurrences in every hospital referral region.
S"#&'(: Kaiser Family Founda! on; American Hospital Associa! on; Medical Ex-
penditure Panel Survey; Analysis by Chapin White of a report from the 1995-
2009 Truven Health Analy! cs MarketScan® Commercial Claims and Encounters
Database (copyright © 2011 Truven Health Analy! cs, all rights reserved); Har-
vard University research conducted for Ins! tute of Medicine; HPC analysis

Hospital Operating Expenses Wasteful Spending High-Cost Patients Conclusion
2013 Annual Cost Trends Report 11
negotiations. National data sets on commercial price lev-
els are limited, making state-by-state comparisons chal-
lenging.viii Available data are often limited to a subset of
participating data contributors, such as large multi-state
employers or individual national payers. These employers
and payers may have an insurance product mix that does
not necessarily refl ect the mix of a particular state, so these
data may not provide a complete view of price levels in
local markets.
Two recent analyses based on data capturing roughly
one-third of the national commercial market suggest that
prices in Massachuse! s are approximately three to fi ve
percent higher than the U.S. average.11,12 In both of these
studies, price diff erences observed included the impact
of higher unit prices and of residents using higher-priced
providers (also known as provider mix).
Recent reports by the AGO and CHIA have highlighted
the importance of provider mix in understanding spend-
ing levels.13,14,15 For example, there is two- to three-fold
variation in the prices paid from lower-priced to high-
er-priced hospitals that cannot be explained by diff erences
in the types of patients cared for or the quality of outcomes
achieved.16 Moreover, the eff ect of these diff erences is am-
plifi ed by the fact that Massachuse! s residents receive
more of their care from these higher-cost se! ings; 51 per-
cent of all commercial payments by the top 10 largest pay-
ers are made to top-quartile priced hospitals, compared
with six percent to the lowest priced quartile.13
In Medicare, prices are set by the federal government,
which establishes a standard fee schedule and makes ad-
justments for regional input costs, cost of graduate medi-
cal education, and the cost of treating a disproportionate
share of low-income patients. A CMS analysis showed that
in 2009 one percentage point of higher spending in the
Medicare fee-for-service program in Massachuse! s was
due to utilization. This suggests that most of the nine per-
cent diff erence between Massachuse! s and the U.S. was
due to price, both unit price and provider mix.ix,17
In Medicaid, prices are set by state Medicaid programs
and managed care organizations, resulting in signifi cant
state-to-state variation. In 2009, spending per benefi ciary
was 21 percent greater in Massachuse! s compared with
the U.S. average. Factoring in both higher per benefi ciary
viii Although Massachuse! s has taken a number of steps to increase the transparency and public availability of price information, other states have not taken similar steps.ix The measure of Medicare utilization uses a composite of all paid ser-vices, including hospital and non-hospital institutional claims, profes-sional services, pharmacy, and other categories.
spending and greater enrollment, Medicaid expenditures
per resident are 49 percent higher than the national aver-
age. This is likely driven by both price and utilization fac-
tors. One review of prices paid by Medicaid for physician
services in 2008 showed that MassHealth paid 30 percent
more than the average state Medicaid program.x,18 More-
over, Massachuse! s has had a long-standing commitment
to provide broad access to coverage that includes a range of
needed services. MassHealth has more inclusive eligibility
criteria and higher benefi t levels for enrollees compared to
many states. Income thresholds for Medicaid eligibility in
Massachuse! s are higher than the national average, and
a larger proportion of Medicaid spending in the state is
devoted to benefi ts that extend beyond those mandated by
federal law.19 Thus, while higher Medicaid prices contrib-
ute to higher spending per benefi ciary in Massachuse! s,
the diff erence in spending between Massachuse! s and the
U.S. is also infl uenced by several other policy choices.
x In 2012, MassHealth paid 21 percent more for physician services.
W��� �� �! "!�# $% “&'()!”?
Defi ning “price” in health care can be complex because
the total amount, or price, that is paid to a provider for
health care services o� en derives from mul� ple sources,
including the consumer’s out-of-pocket payment to the
provider and payments from the consumer’s insurer. In
this report, we defi ne “price” as the total amount paid
to a provider for a unit of service, including both the
amount paid by the payer and the amount paid by the
consumer through a co-payment or deduc� ble.
It is worth no� ng that this defi ni� on of price diff ers from
the “charges” that may appear on hospital bills. Typically,
hospitals have a “charge master” that contains listed fees
for each procedure. In prac� ce, commercial and public
payers do not pay the charges listed in the charge master,
but rather pay a nego� ated price (in the case of commer-
cial payers) or a pre-set fee schedule (in the case of Medi-
care and MassHealth). Our work focuses on amounts
paid rather than amounts listed in the charge master.
Spending Levels Spending Trends Delivery System Quality Performance and Access
12 Health Policy Commission
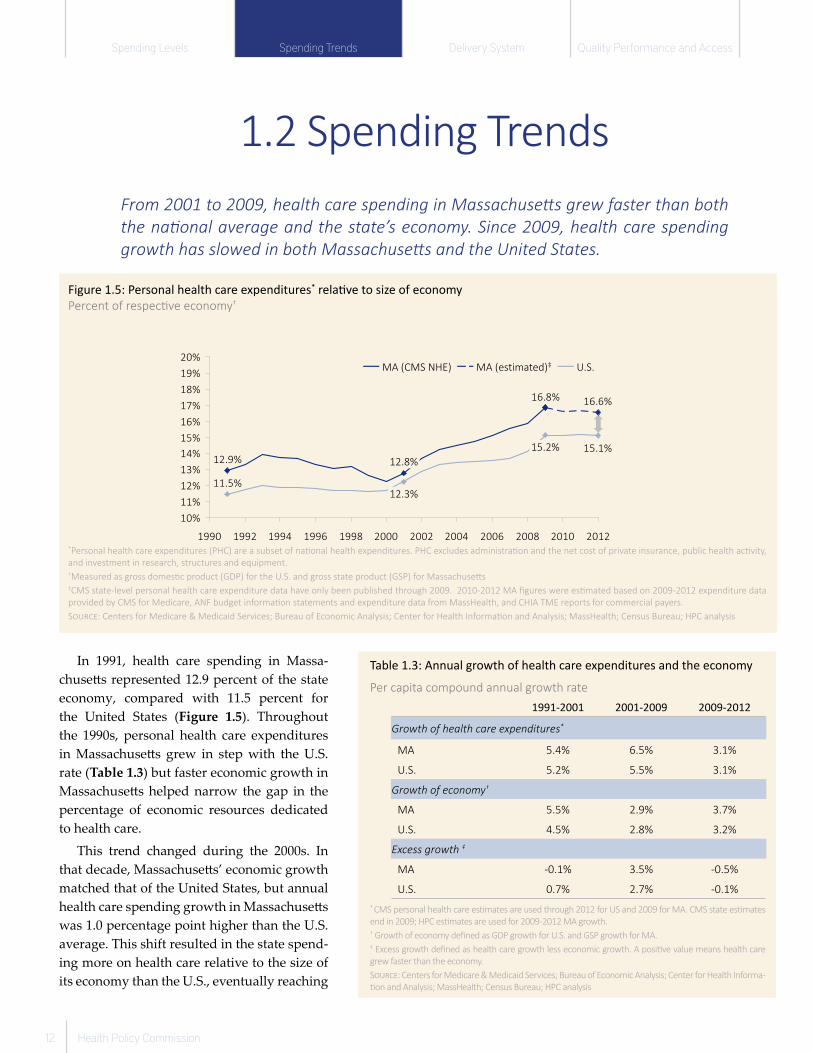
In 1991, health care spending in Massa-
chuse! s represented 12.9 percent of the state
economy, compared with 11.5 percent for
the United States (Figure 1.5). Throughout
the 1990s, personal health care expenditures
in Massachuse! s grew in step with the U.S.
rate (Table 1.3) but faster economic growth in
Massachuse! s helped narrow the gap in the
percentage of economic resources dedicated
to health care.
This trend changed during the 2000s. In
that decade, Massachuse! s’ economic growth
matched that of the United States, but annual
health care spending growth in Massachuse! s
was 1.0 percentage point higher than the U.S.
average. This shift resulted in the state spend-
ing more on health care relative to the size of
its economy than the U.S., eventually reaching
Table 1.3: Annual growth of health care expenditures and the economy
Per capita compound annual growth rate
1991-2001 2001-2009 2009-2012
Growth of health care expenditures*
MA 5.4% 6.5% 3.1%
U.S. 5.2% 5.5% 3.1%
Growth of economy†
MA 5.5% 2.9% 3.7%
U.S. 4.5% 2.8% 3.2%
Excess growth ‡
MA -0.1% 3.5% -0.5%
U.S. 0.7% 2.7% -0.1%
* CMS personal health care es! mates are used through 2012 for US and 2009 for MA. CMS state es! mates
end in 2009; HPC es! mates are used for 2009-2012 MA growth.† Growth of economy defi ned as GDP growth for U.S. and GSP growth for MA.‡ Excess growth defi ned as health care growth less economic growth. A posi! ve value means health care
grew faster than the economy.
S#$&'(: Centers for Medicare & Medicaid Services; Bureau of Economic Analysis; Center for Health Informa-
! on and Analysis; MassHealth; Census Bureau; HPC analysis
++++ &*� ����, ���"������"�� ������������-../��-.�.,-.�-�&0������� �1����� ��������"� ������
)*&0��� �������!++++&0�� &*�2�3!
�456
�-/6
�446
��6
��6
�.6
��6
�-6
�76
�86
�6
�46
�96
�56
�/6
-.6
�//. �//- �//8 �//4 �//5 -... -..- -..8 -..4 -..5 -.�. -.�-
�-6
�-76
�-56
Figure 1.5: Personal health care expenditures* rela! ve to size of economy
Percent of respec! ve economy†
*Personal health care expenditures (PHC) are a subset of na! onal health expenditures. PHC excludes administra! on and the net cost of private insurance, public health ac! vity,
and investment in research, structures and equipment.†Measured as gross domes! c product (GDP) for the U.S. and gross state product (GSP) for Massachuse< s‡CMS state-level personal health care expenditure data have only been published through 2009. 2010-2012 MA fi gures were es! mated based on 2009-2012 expenditure data
provided by CMS for Medicare, ANF budget informa! on statements and expenditure data from MassHealth, and CHIA TME reports for commercial payers.
S#$&'(: Centers for Medicare & Medicaid Services; Bureau of Economic Analysis; Center for Health Informa! on and Analysis; MassHealth; Census Bureau; HPC analysis
1.2 Spending Trends
From 2001 to 2009, health care spending in Massachuse! s grew faster than both
the na" onal average and the state’s economy. Since 2009, health care spending
growth has slowed in both Massachuse! s and the United States.
Hospital Operating Expenses Wasteful Spending High-Cost Patients Conclusion
2013 Annual Cost Trends Report 13
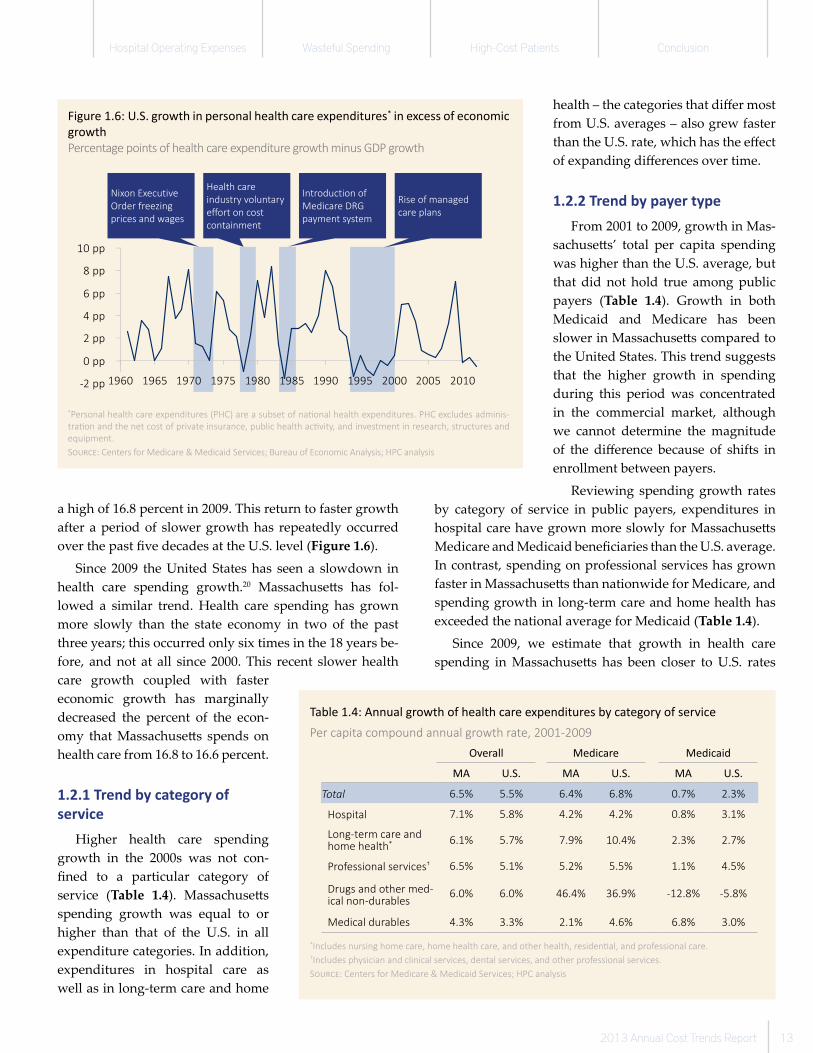
a high of 16.8 percent in 2009. This return to faster growth
after a period of slower growth has repeatedly occurred
over the past fi ve decades at the U.S. level (Figure 1.6).
Since 2009 the United States has seen a slowdown in
health care spending growth.20 Massachuse! s has fol-
lowed a similar trend. Health care spending has grown
more slowly than the state economy in two of the past
three years; this occurred only six times in the 18 years be-
fore, and not at all since 2000. This recent slower health
care growth coupled with faster
economic growth has marginally
decreased the percent of the econ-
omy that Massachuse! s spends on
health care from 16.8 to 16.6 percent.
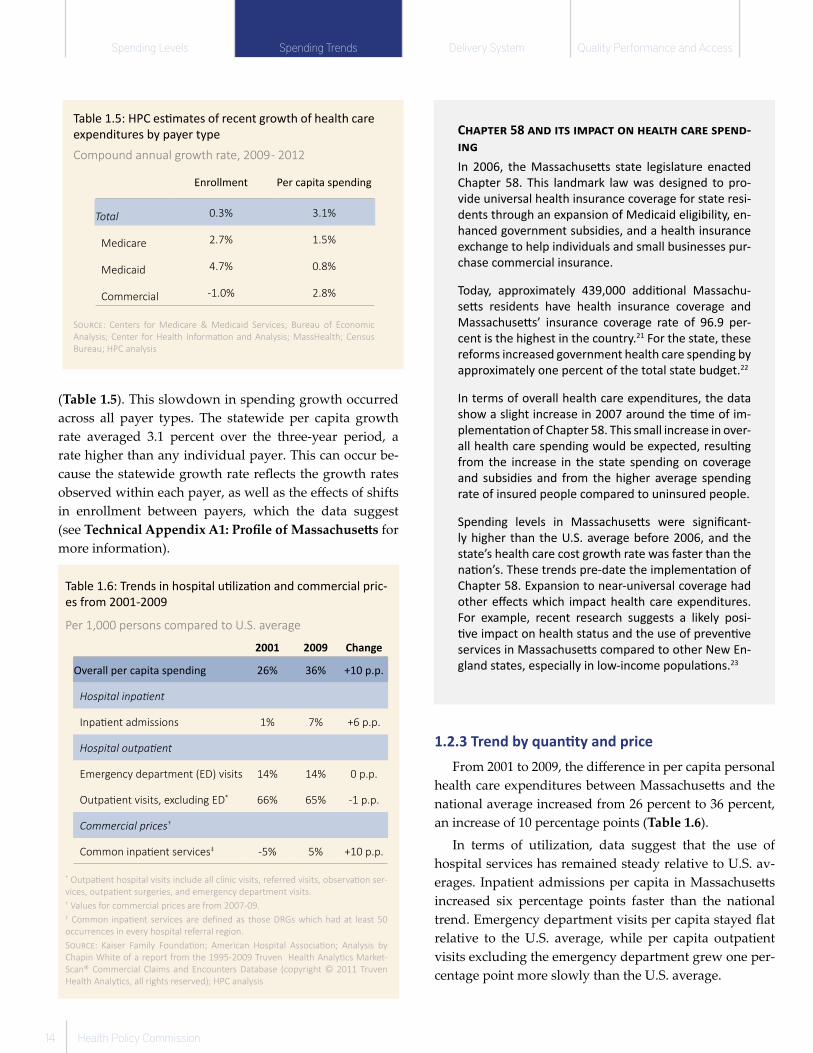
1.2.1 Trend by category of
service
Higher health care spending
growth in the 2000s was not con-
fi ned to a particular category of
service (Table 1.4). Massachuse! s
spending growth was equal to or
higher than that of the U.S. in all
expenditure categories. In addition,
expenditures in hospital care as
well as in long-term care and home
health – the categories that diff er most
from U.S. averages – also grew faster
than the U.S. rate, which has the eff ect
of expanding diff erences over time.
1.2.2 Trend by payer type
From 2001 to 2009, growth in Mas-
sachuse! s’ total per capita spending
was higher than the U.S. average, but
that did not hold true among public
payers (Table 1.4). Growth in both
Medicaid and Medicare has been
slower in Massachuse! s compared to
the United States. This trend suggests
that the higher growth in spending
during this period was concentrated
in the commercial market, although
we cannot determine the magnitude
of the diff erence because of shifts in
enrollment between payers.
Reviewing spending growth rates
by category of service in public payers, expenditures in
hospital care have grown more slowly for Massachuse! s
Medicare and Medicaid benefi ciaries than the U.S. average.
In contrast, spending on professional services has grown
faster in Massachuse! s than nationwide for Medicare, and
spending growth in long-term care and home health has
exceeded the national average for Medicaid (Table 1.4).
Since 2009, we estimate that growth in health care
spending in Massachuse! s has been closer to U.S. rates
�������
������
������
������
������
������
������
�� �� �� �� �� �� � � ���� ���� ���
6� ���4 �����-��
7�!���"���8����
���������!������
)�����������
��!����/�-�������/�
�""������������
�������#���
9����!��������"�
1�!������':&�
��/#�����/���#
:�����"�#�����!�
����������
Figure 1.6: U.S. growth in personal health care expenditures* in excess of economic
growth
Percentage points of health care expenditure growth minus GDP growth
*Personal health care expenditures (PHC) are a subset of na! onal health expenditures. PHC excludes adminis-
tra! on and the net cost of private insurance, public health ac! vity, and investment in research, structures and
equipment.
S"#$%&: Centers for Medicare & Medicaid Services; Bureau of Economic Analysis; HPC analysis
Table 1.4: Annual growth of health care expenditures by category of service
Per capita compound annual growth rate, 2001-2009
Overall Medicare Medicaid
MA U.S. MA U.S. MA U.S.
Total 6.5% 5.5% 6.4% 6.8% 0.7% 2.3%
Hospital 7.1% 5.8% 4.2% 4.2% 0.8% 3.1%
Long-term care and home health* 6.1% 5.7% 7.9% 10.4% 2.3% 2.7%
Professional services† 6.5% 5.1% 5.2% 5.5% 1.1% 4.5%
Drugs and other med-ical non-durables
6.0% 6.0% 46.4% 36.9% -12.8% -5.8%
Medical durables 4.3% 3.3% 2.1% 4.6% 6.8% 3.0%
*Includes nursing home care, home health care, and other health, residen! al, and professional care.†Includes physician and clinical services, dental services, and other professional services.
S"#$%&: Centers for Medicare & Medicaid Services; HPC analysis
Spending Levels Spending Trends Delivery System Quality Performance and Access
14 Health Policy Commission
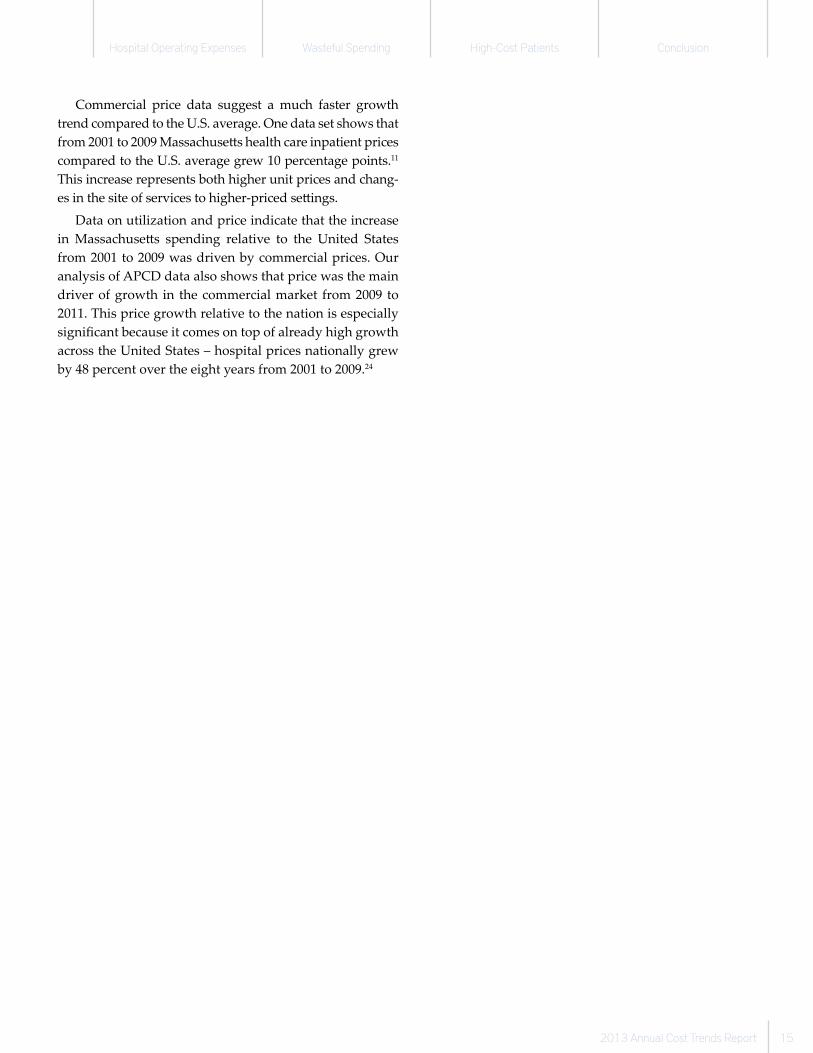
(Table 1.5). This slowdown in spending growth occurred
across all payer types. The statewide per capita growth
rate averaged 3.1 percent over the three-year period, a
rate higher than any individual payer. This can occur be-
cause the statewide growth rate refl ects the growth rates
observed within each payer, as well as the eff ects of shifts
in enrollment between payers, which the data suggest
(see Technical Appendix A1: Profi le of Massachuse" s for
more information).
1.2.3 Trend by quan� ty and price
From 2001 to 2009, the diff erence in per capita personal
health care expenditures between Massachuse! s and the
national average increased from 26 percent to 36 percent,
an increase of 10 percentage points (Table 1.6).
In terms of utilization, data suggest that the use of
hospital services has remained steady relative to U.S. av-
erages. Inpatient admissions per capita in Massachuse! s
increased six percentage points faster than the national
trend. Emergency department visits per capita stayed fl at
relative to the U.S. average, while per capita outpatient
visits excluding the emergency department grew one per-
centage point more slowly than the U.S. average.
Table 1.5: HPC es! mates of recent growth of health care
expenditures by payer type
Compound annual growth rate, 2009 - 2012
Enrollment Per capita spending
Total 0.3% 3.1%
Medicare 2.7% 1.5%
Medicaid 4.7% 0.8%
Commercial -1.0% 2.8%
S!"#$&: Centers for Medicare & Medicaid Services; Bureau of Economic
Analysis; Center for Health Informa( on and Analysis; MassHealth; Census
Bureau; HPC analysis
Table 1.6: Trends in hospital u! liza! on and commercial pric-
es from 2001-2009
Per 1,000 persons compared to U.S. average
2001 2009 Change
Overall per capita spending 26% 36% +10 p.p.
Hospital inpa! ent
Inpa( ent admissions 1% 7% +6 p.p.
Hospital outpa! ent
Emergency department (ED) visits 14% 14% 0 p.p.
Outpa( ent visits, excluding ED* 66% 65% -1 p.p.
Commercial prices†
Common inpa( ent services‡ -5% 5% +10 p.p.
* Outpa( ent hospital visits include all clinic visits, referred visits, observa( on ser-
vices, outpa( ent surgeries, and emergency department visits.† Values for commercial prices are from 2007-09.‡ Common inpa( ent services are defi ned as those DRGs which had at least 50
occurrences in every hospital referral region.
S!"#$&: Kaiser Family Founda( on; American Hospital Associa( on; Analysis by
Chapin White of a report from the 1995-2009 Truven Health Analy( cs Market-
Scan® Commercial Claims and Encounters Database (copyright © 2011 Truven
Health Analy( cs, all rights reserved); HPC analysis
C!"#$%& 58 "'( )$* )+#",$ -' !%"/$! ,"&% *#%'(-
)'6
In 2006, the Massachuse" s state legislature enacted
Chapter 58. This landmark law was designed to pro-
vide universal health insurance coverage for state resi-
dents through an expansion of Medicaid eligibility, en-
hanced government subsidies, and a health insurance
exchange to help individuals and small businesses pur-
chase commercial insurance.
Today, approximately 439,000 addi! onal Massachu-
se" s residents have health insurance coverage and
Massachuse" s’ insurance coverage rate of 96.9 per-
cent is the highest in the country.21 For the state, these
reforms increased government health care spending by
approximately one percent of the total state budget.22
In terms of overall health care expenditures, the data
show a slight increase in 2007 around the ! me of im-
plementa! on of Chapter 58. This small increase in over-
all health care spending would be expected, resul! ng
from the increase in the state spending on coverage
and subsidies and from the higher average spending
rate of insured people compared to uninsured people.
Spending levels in Massachuse" s were signifi cant-
ly higher than the U.S. average before 2006, and the
state’s health care cost growth rate was faster than the
na! on’s. These trends pre-date the implementa! on of
Chapter 58. Expansion to near-universal coverage had
other eff ects which impact health care expenditures.
For example, recent research suggests a likely posi-
! ve impact on health status and the use of preven! ve
services in Massachuse" s compared to other New En-
gland states, especially in low-income popula! ons.23
Hospital Operating Expenses Wasteful Spending High-Cost Patients Conclusion
2013 Annual Cost Trends Report 15
Commercial price data suggest a much faster growth
trend compared to the U.S. average. One data set shows that
from 2001 to 2009 Massachuse! s health care inpatient prices
compared to the U.S. average grew 10 percentage points.11
This increase represents both higher unit prices and chang-
es in the site of services to higher-priced se! ings.
Data on utilization and price indicate that the increase
in Massachuse! s spending relative to the United States
from 2001 to 2009 was driven by commercial prices. Our
analysis of APCD data also shows that price was the main
driver of growth in the commercial market from 2009 to
2011. This price growth relative to the nation is especially
signifi cant because it comes on top of already high growth
across the United States – hospital prices nationally grew
by 48 percent over the eight years from 2001 to 2009.24

Spending Levels Spending Trends Delivery System Quality Performance and Access
16 Health Policy Commission
1.3.1 Provider market overview
In this section, we describe the Massachuse! s provid-
er market, with a particular focus on hospitals and phy-
sicians, recognizing the large diff erence in hospital care
spending between Massachuse! s and the U.S. and the
state’s higher utilization of hospital outpatient services.
The Massachuse! s health care delivery system is charac-
terized by a greater proportion of hospital beds in major
teaching facilities and a greater concentration of not-for-
profi t hospitals as compared to the nation overall (Table
1.7). Analyses of provider price variation in Massachuse! s
have shown that the average prices paid for equivalent
services at teaching hospitals is higher than at community
hospitals.25
Massachuse! s also has a large health care workforce
relative to its population. Although the state has fewer
hospital beds per 1,000 persons than the national average,
its labor workforce exceeds national averages (Table 1.8).
From 2001 to 2009, the number of health care practitionersxi
in the state grew at an annual rate of 2.6 percent, and their
mean salary grew by 5.0 percent annually. Nationwide,
the number of practitioners grew by 2.1 percent and mean
salaries by 4.3 percent over the same time period.26
xi “Health care practitioners” are defi ned based on the Bureau of Labor Statistics (BLS) occupational code 29-0000. This group includes dentists, nurses, nurse practitioners, pharmacists, physicians, physician assis-tants, physical and occupational therapists, technicians, and other health care workers.
Two trends among providers have been observed in re-
cent years. One trend is growing corporate consolidation
of provider organizations, including acquisitions of com-
munity hospitals and hospital employment of indepen-
dent physicians. This consolidation has increased the mar-
ket share of a number of large systems, including those
anchored by major teaching hospitals. At the same time,
provider organizations are pursuing a variety of innova-
tive care delivery models, such as patient-centered med-
ical homes (PCMHs) and accountable care organizations
(ACOs), with an aim towards more coordinated, high-
er-quality care delivery. These two trends can be related,
as some provider organizations contend that scale and cor-
porate integration are required to achieve more effi cient,
eff ective, and coordinated care delivery, while others have
demonstrated success providing integrated, accountable
care on a smaller scale.27,28
Trend number 1: Provider mix and consolida� on
Provider consolidation is a well-documented trend in
the United States and in Massachuse! s. Eighty percent of
current acute hospitals in Massachuse! s were involved in
a merger, acquisition, or other form of contractual or cor-
porate affi liation between 1990 and today.29 Alignments,
including acquisitions and affi liations, have continued at a
1.3 Delivery System Overview
The Massachuse� s provider market is growing increasingly concentrated, and
provider organiza� ons are exploring innova� ve care delivery models. Payers are
shi� ing to product structures promo� ng value-based consumer choices and to
alterna� ve payment methods such as global budgets.
Table 1.7: Hospital composi� on compared to U.S.
Percent of acute hospitals, 2011
MA U.S.
Major teaching hospitals 23% 5%
Cri! cal access hospitals 4% 27%
By profi t status
For-profi t hospitals 17% 21%
Not-for-profi t hospitals 81% 58%
Public hospitals 3% 21%
S#$&'(: Medicare Payment Advisory Commission; Kaiser Family Founda! on; HPC
Massachuse) s acute hospital list
Table 1.8: Health care system capacity compared to U.S.
Per 1,000 persons, 2011
MA U.S. Diff erence
Number of acute hospitals 0.012 0.016 -26%
Hospital beds 2.4 2.6 -8%
Health care prac! ! oners and technical occupa! ons
34.6 24.1 +43%
S#$&'(: Kaiser Family Founda! on; American Hospital Associa! on; Bureau of
Labor Sta! s! cs Occupa! onal Employment Sta! s! cs Survey; American Commu-
nity Survey; HPC analysis
Hospital Operating Expenses Wasteful Spending High-Cost Patients Conclusion
2013 Annual Cost Trends Report 17
varying pace concurrently with other
trends in the health care market, such
as the growth of health maintenance
organizations (HMOs) and capita-
tion in the 1990s, deregulation of the
hospital industry after legislation in
1991, and the increased adoption of
accountable care delivery models and
payment methods in recent years.
Growing concentration in provider
markets raises concerns, as evidence
has demonstrated that such consolida-
tion often decreases competition and
increases the prices of health care ser-
vices.30,31,32,33,34 Within Massachuse! s,
provider organization size and market
leverage are correlated with higher
prices, both for fee-for-service pay-
ments and for risk contract payments.
These higher prices are not explained
by be! er quality performance.14,16
Moreover, higher-priced provider sys-
tems have grown their market share at
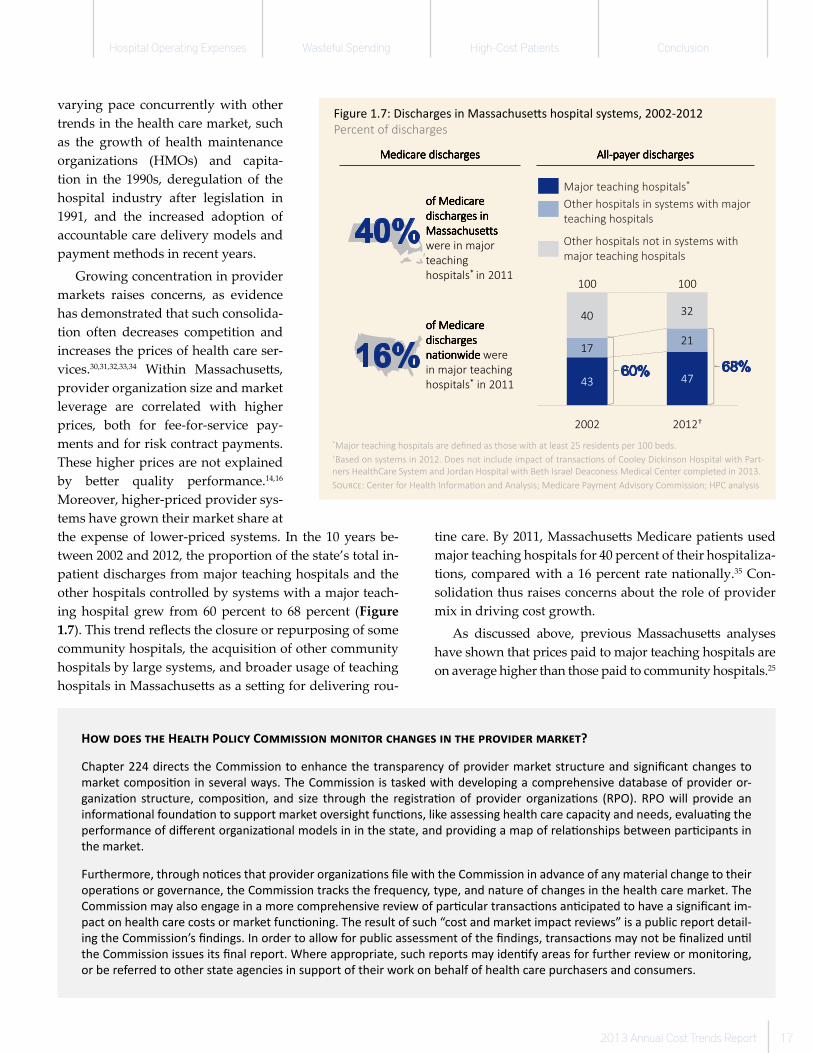
the expense of lower-priced systems. In the 10 years be-
tween 2002 and 2012, the proportion of the state’s total in-
patient discharges from major teaching hospitals and the
other hospitals controlled by systems with a major teach-
ing hospital grew from 60 percent to 68 percent (Figure
1.7). This trend refl ects the closure or repurposing of some
community hospitals, the acquisition of other community
hospitals by large systems, and broader usage of teaching
hospitals in Massachuse! s as a se! ing for delivering rou-
tine care. By 2011, Massachuse! s Medicare patients used
major teaching hospitals for 40 percent of their hospitaliza-
tions, compared with a 16 percent rate nationally.35 Con-
solidation thus raises concerns about the role of provider
mix in driving cost growth.
As discussed above, previous Massachuse! s analyses
have shown that prices paid to major teaching hospitals are
on average higher than those paid to community hospitals.25
���
3� -�
����$$$$
���
3
����
���
3-
� ����������� ����������� ����������� ����������
�� ������ ������ ������ ������ ������ ������ ������ ����
�� ���� ��� ��� ���� ��� ��� ���� ��� ��� ���� ��� �
!�������������
���������
�� ����� ���������
� ����������� ����������� ����������� ����������
�� ������ ��� ������ ��� ������ ��� ������ �
������!����������!����������!����������!����!����
������������������
�� ����� � �������
����������� ������ ����������� ������ ����������� ������ ����������� ������ 0��0��0��0�������������� ������ �������� ������ �������� ������ �������� ������
����������������� ����� �
4������� ����� ���� � ��� �!����������
����������� �����
4������� ����� �������� � ��� �!����
����������������� �����
H�� ���� �!� H�"#�! P�#$%& C�''$��$�( '�($��) %!"(*�� $( �!� +)�,$��) '")-��?
Chapter 224 directs the Commission to enhance the transparency of provider market structure and signifi cant changes to
market composi� on in several ways. The Commission is tasked with developing a comprehensive database of provider or-
ganiza� on structure, composi� on, and size through the registra� on of provider organiza� ons (RPO). RPO will provide an
informa� onal founda� on to support market oversight func� ons, like assessing health care capacity and needs, evalua� ng the
performance of diff erent organiza� onal models in in the state, and providing a map of rela� onships between par� cipants in
the market.
Furthermore, through no� ces that provider organiza� ons fi le with the Commission in advance of any material change to their
opera� ons or governance, the Commission tracks the frequency, type, and nature of changes in the health care market. The
Commission may also engage in a more comprehensive review of par� cular transac� ons an� cipated to have a signifi cant im-
pact on health care costs or market func� oning. The result of such “cost and market impact reviews” is a public report detail-
ing the Commission’s fi ndings. In order to allow for public assessment of the fi ndings, transac� ons may not be fi nalized un� l
the Commission issues its fi nal report. Where appropriate, such reports may iden� fy areas for further review or monitoring,
or be referred to other state agencies in support of their work on behalf of health care purchasers and consumers.
Figure 1.7: Discharges in Massachuse! s hospital systems, 2002-2012
Percent of discharges
*Major teaching hospitals are defi ned as those with at least 25 residents per 100 beds.†Based on systems in 2012. Does not include impact of transac" ons of Cooley Dickinson Hospital with Part-
ners HealthCare System and Jordan Hospital with Beth Israel Deaconess Medical Center completed in 2013.
S#$%&': Center for Health Informa" on and Analysis; Medicare Payment Advisory Commission; HPC analysis
Spending Levels Spending Trends Delivery System Quality Performance and Access
18 Health Policy Commission
As provider organizations contend that additional scale
and corporate integration are necessary to achieve more
effi cient, eff ective, and coordinated care, the potential cost
and quality benefi ts of a transaction should be balanced
against the concerns of increased market leverage and the
weakening of lower-priced alternatives. For example, the
growing market share of higher-priced systems can reduce
the viability of lower-priced options for consumers. This
can reduce the eff ectiveness of value-based innovations
such as tiered and limited network products, which de-
pend on the availability of lower-priced alternatives for
their operation.36
Massachuse! s providers have pursued delivery system
innovation through a variety of organizational models.
These approaches include relatively small, physician-based
models that off er high-quality, coordinated care without
ownership by a hospital or hospital system.37 Where hos-
pitals align with one another and with physicians, there
are also alternative approaches to corporate ownership,
including contractual alignments around shared popula-
tion health management goals.38,39 This spectrum of care
delivery models in the state bears further examination as
health care stakeholders consider the degree of corporate
integration necessary and desirable to improve access to
high-quality, cost-eff ective care.
Trend number 2: Delivery system innova� on
Innovation in accountable care models is another trend
in the Massachuse! s delivery system in recent years. Un-
der these models, networks of physicians and other health
care providers are held accountable for cost and quality
across a continuum of care for their patients. The 2008
Massachuse! s Special Commission on the Health Care
Payment System recommended a shift away from the fee-
for-service payment system, which rewards volume rather
than outcomes or effi ciency, toward the increased adop-
tion of global budget-based alternative payment methods
(APMs), which have since gained momentum in Massa-
chuse! s.40 Providers are moving to adopt care delivery
models that deliver coordinated, patient-centered care, in-
tegrating physical and behavioral health care and shifting
toward a focus on population health management.41 These
models are designed not only to reduce expenditures, but
also to improve quality of care.
Today, all of the major payer types in Massachuse! s
are actively pursuing alternatives to traditional fee-for-
service payments with incentives to improve coordination
and quality performance in the delivery system (for more
information, see Section 1.3.2). Further, many provider
organizations in Massachuse! s have agreed to enter into
these types of arrangements with payers. Of the 32 orga-
nizations nationally that participated in the Medicare Pio-
neer ACO model, fi ve were based in Massachuse! s: Atrius
Health, Beth Israel Deaconess Care Organization, Mount
Auburn Cambridge Independent Practice Association,
Partners HealthCare System, and Steward Health Care
System. In this fi nancial arrangement, the savings were
shared between Medicare and the ACO. First-year results
show that four out of the fi ve Massachuse! s Pioneer ACOs
were able to keep growth of their Medicare costs under the
budgeted amount.28 Moreover, 13 Massachuse! s provider
organizations have participated as Medicare Shared Sav-
ings Program ACOs.42 Evidence from other ACO demon-
strations suggest that providers who have entered risk-
based contracts covering a portion of their patient panels
are investing in care delivery reforms for their full patient
populations in response to the new payment methods.43
Still, challenges remain with these models. Risk-based
contracts to support accountable care have been limited in
the commercial insurance market by the shift toward pre-
ferred provider organization (PPO) insurance products,
whose members are not currently covered by APMs.27 Pro-
viders have also noted that constraints on the availabili-
ty of data about their patient populations, especially for
care delivered in other systems, have limited their ability
to eff ectively manage and integrate care.27 Furthermore,
certain important services such as behavioral health care
continue to face challenges.27 There are a number of per-
sistent barriers to behavioral health integration, including
numerous reimbursement issues and limited provider
capacity to treat behavioral health patients.44 While these
types of challenges have led to mixed results nationwide,
the early success of four of the fi ve Massachuse! s Pioneer
ACOs shows potential for Massachuse! s provider organi-
zations.45,46,47
At the practice level, many organizations are engaging
in accountable care innovation through the development of
PCMH models.xii More recently, 30 primary care practices
have elected to participate in MassHealth’s Primary Care
Payment Reform (PCPR), a PCMH-based program. The
PCPR program is supported by funding through a State
Innovation Model (SIM) Testing grant awarded to Massa-
chuse! s by CMS to support these types of transformations.
xii Currently, 149 practices are accredited. This fi gure includes accred-itation by the National Commi! ee for Quality Assurance (NCQA), the Joint Commission (JC), and/or the Accreditation Association for Ambu-latory Health Care (AAAHC).

Hospital Operating Expenses Wasteful Spending High-Cost Patients Conclusion
2013 Annual Cost Trends Report 19
Under Chapter 224, the Commission is responsible for
developing certifi cation programs for PCMHs and ACOs.
The Commission is also responsible for administering the
Community Hospital Acceleration, Revitalization, and
Transformation (CHART) investment initiative, which is a
competitive program with nearly $120 million to be distrib-
uted to select community hospitals to promote effi cient, ef-
fective, and coordinated care delivery while reducing costs.
CHART investments will also work to support these hospi-
tals in developing the capabilities needed to become ACOs,
to advance the adoption of health information technology,
and to increase organizations’ readiness to adopt APMs that
involve bearing risk for their performance.
1.3.2 Payer market overview
Nearly all of Massachuse! s residents have health in-
surance. Residents in Massachuse! s receive their health
insurance from public payers – Medicare and MassHealth
primarily – and from various commercial sources, includ-
ing those provided by employers or purchased by indi-
viduals (Table 1.9). Approximately 63 percent of residents
receive commercial health insurance, either through their
employer or purchased through the individual market.6
Self-insured employers make up nearly half of the com-
mercial market.13
The Massachuse! s commercial market is highly con-
centrated, with approximately 45 percent of members
represented by one payer, BCBS. BCBS and the second-
and third-largest commercial payers, HPHC and THP,
represent 79 percent of the market.13 Massachuse! s plans
achieve high performance by national accreditation bod-
ies of clinical performance and member satisfaction, with
the three largest payers in the state among the 10 highest
ranked plans by the National Commi! ee for Quality As-
surance (NCQA).48
In recent years, the Massachuse! s commercial health in-
surance market has experienced signifi cant reform eff orts
to improve both demand-side and supply-side incentives.
Within the demand-side reforms, purchasers and individ-
ual consumers are called upon to play a more active role
in ensuring they receive high-value care through a shift in
fi nancial incentives. Within the supply-side reforms, pay-
ers contract with provider groups to manage the care of
their members through APMs that aim to reward provid-
ers based on the outcomes and cost effi ciency they achieve.
Demand-side trends: Product design
Over the past few years, consumers have seen the
growth of insurance products that encourage them to make
value-based choices about their care. These include prod-
ucts that increase the level of cost-sharing that consumers
are expected to pay out of pocket, such as high-deductible
health plans (HDHP), as well as tiered or limited network
products that off er reduced co-payments if a higher-qual-
ity/lower-cost provider group is chosen. Employers may
off er these HDHPs and tiered or limited network plans
because of the potential for lower premiums, which de-
rive from greater use of more effi cient providers.xiii For
demand-side incentives like these to work, markets must
provide consumers with information on prices and quality
to empower them as informed purchasers of health care.
While the availability of such information has been limited
in the past, Chapter 224 institutes new requirements for
payers and providers to make the prices of health care ser-
vices more transparent (see sidebar “What is Massachu-
se" s doing on price transparency?”).
HDHPs as well as tiered or limited network plans
have grown signifi cantly in recent years, though at vary-
ing rates. For example, BCBS reports that the share of its
commercial members enrolled in HDHPs increased from
19 percent to 25 percent between 2009 and 2012.27 Each of
the three largest payers has seen an incremental 5 to 11
percent of its membership shift to tiered or limited net-
work products over the last three years.27 Part of this is due
to Chapter 288 of the Acts of 2010 which required health
xiii For more information, see the Commission’s report on CDHPs available at h! p://www.mass.gov/anf/docs/hpc/health-policy-commis-sion-section-263-report-vfi nal.pdf.
Table 1.9: Health insurance coverage by insurance type
compared to U.S.
Percent of popula� on, 2011
MA U.S.
Employer 58% 49%
Individual 5% 5%
Medicaid 16% 13%
Medicare 13% 13%
Dual-eligible 4% 3%
Other Public <1% 1%
Uninsured 3% 16%
S!"#$&: Kaiser Family Founda� on; Center for Health Informa� on and Anal-
ysis; HPC analysis
Spending Levels Spending Trends Delivery System Quality Performance and Access
20 Health Policy Commission
or limited network health insurance products plans to
off er tiered with premiums at least 12 percent lower
than comparable products without a selective network
of providers. Chapter 224 furthers the development of
these products, increasing the required pricing diff er-
ential to 14 percent. These products are generally de-
signed to create fi nancial incentives for consumers to
make value-based health care decisions such as choos-
ing high-quality, lower-priced providers and avoid-
ing unnecessary services. It is important to monitor
the impact of such products to ensure that specifi c product
designs do not inhibit or otherwise discourage consumers
from seeking necessary care.
Alongside the growth in plans that promote consumer
engagement, there has also been a shift away from insur-
ance product structures that require members to designate
a primary care provider (PCP). Historically, Massachuse! s
residents have chosen HMO insurance products, which re-
quire PCP designation, at a higher rate than the national
average.xiv,50 In recent years, however, the commercial in-
xiv In our analysis, we primarily distinguish between insurance products based on whether they require identifi cation of a primary care provider. HMO and point-of-service (POS) product types require designation of a PCP, while preferred provider organization and indemnity product types do not. In this section, our discussion of HMO products also ap-plies to POS products, and our discussion of PPO products also applies to indemnity products.
surance market has experienced a shift away from HMOs
and toward PPO products. From 2009 to 2012, the share
of members in PPO products grew for the three largest
commercial payers from 29 percent to 37 percent of their
total membership.27 Open questions remain as to wheth-
er this trend is driven by payer, employer, or individual
preferences around premium price or breadth of choice of
providers.
Supply-side trends: Alterna� ve payment methods
Commercial and public payers have also been work-
ing to support delivery system reform through APMs. In
the past few years, Medicare and many of the commer-
cial payers in Massachuse! s have increasingly adopted
APMs that establish a global budget for provider orga-
nizations. In these models, payers establish an expected
level of spending (called the global budget) for members
managed by the provider organization, typically based
on spending in previous years with various adjustments.
If the provider organization keeps costs below the global
budget, it receives a share of the savings. If costs exceed
the global budget, the provider organization may be re-
sponsible for covering a portion of the excess costs. Ex-
amples of these models include Medicare’s Pioneer ACO
program and BCBS’s Alternative Quality Contract. Other
major commercial payers, including THP, HPHC, and
Fallon Community Health Plan (FCHP), also have global
budget payment methods, and, as described above, Mass-
Health recently launched its PCPR program. These types
of global budget payment methods are not unprecedent-
ed – several provider organizations in Massachuse! s have
had risk-based contracts with payers since the 1990s, when
capitation was prevalent – but they have experienced a re-
surgence in recent years through eff orts to shift away from
traditional fee-for-service payment methods.
Although many payers have implemented some form
of APMs, a number of challenges persist. Considerable
variation exists among payers in terms of the proportion
of their enrollees covered, as well as the fi nancial incen-
tives for providers. In 2012, 35 percent of members across
the top 10 commercial payers had PCPs who were paid
for managing their care under a global budget payment
method.51 For public payers, only a minority of Medicare
benefi ciaries are included in the Medicare ACO programs,
and MassHealth only recently launched its PCPR program
in late 2013. Even for patients whose care is managed un-
der these payment methods, most providers are paid ini-
tially in the traditional fee-for-service method and supple-
W��� �� M������!�"��� #$�%& $% '(��" �(�%�'�(-
"%�)?
Recent ar� cles in the na� onal press have called a! en� on
to the lack of transparency around prices in health care.49
Massachuse! s has been at the forefront of eff orts to en-
hance price transparency, fi rst in Chapter 58 of the Acts
of 2006 with the establishment of a website with com-
para� ve cost and quality informa� on (MyHealthCareOp-
� ons), and con� nuing in Chapter 288 of the Acts of 2010
with required annual repor� ng of rela� ve prices. Chapter
224 improves on this by ins� tu� ng price transparency re-
quirements for both payers and providers. As of October
2013, insurance companies are required to provide es� -
mates of expected costs for a given service at a par� cular
provider to consumers reques� ng the informa� on online
or over the phone. These es� mates must be tailored to a
consumer’s own insurance product, so that a consumer
can understand the expected out-of-pocket cost given his
or her deduc� ble and other cost-sharing policies. Chap-
ter 224 also requires insurance companies to off er this
price informa� on to providers who are looking to refer
their pa� ents. Beginning in 2014, providers will also be
required to provide price informa� on to consumers who
request it.

Hospital Operating Expenses Wasteful Spending High-Cost Patients Conclusion
2013 Annual Cost Trends Report 21
mental payments or adjustments are made at the end of a
performance period to create quality and cost incentives.
Moreover, providers have testifi ed that the design of these
models varies signifi cantly by payer, including the nature
of incentives and the level of payment.27 For a particular
payer’s model, the negotiated supplemental payments and
incentives diff er signifi cantly between provider organiza-
tions. Payment levels are based on historic levels of pay-
ment, which can perpetuate disparities in payment levels
between provider organizations.14 Finally, some services,
such as behavioral health, are often reimbursed through
separate funding models leading to misaligned incentives.
Another potential obstacle to the continued adoption
of APMs is the signifi cant shift in the market from HMO
products to PPO products discussed previously (see De-
mand-side trends: Product design). To date, commer-
cial payers have only structured global budget payment
contracts for members under HMO products because
these methods rely on members identifying a PCP who
is deemed accountable for their care. Thus, global budget
payment contracts cover the majority of the HMO market,
but none of the PPO market.51 The commercial payers have
not established an APM that may be applied to growing
PPO products, in which members are not required to iden-
tify a PCP. Medicare has implemented its Pioneer ACO
program without requiring benefi ciaries to identify a PCP.
Instead an algorithm is used to “a! ribute” benefi ciaries
to the provider organization that was responsible for the
preponderance of their primary care in a particular time
period. In the commercial market, payers are investigating
similar a! ribution models but they have not yet been im-
plemented.
In testimony at the Commission’s 2013 cost trends hear-
ing, several provider organizations noted the challenges in
investing in care delivery transformation while signifi cant
proportions of their patient panels switch to PPO products
that do not have risk-based payment methods. These pro-
vider organizations highlighted the importance of APMs
in supporting care delivery transformation and encour-
aged their faster adoption in PPO insurance products.27
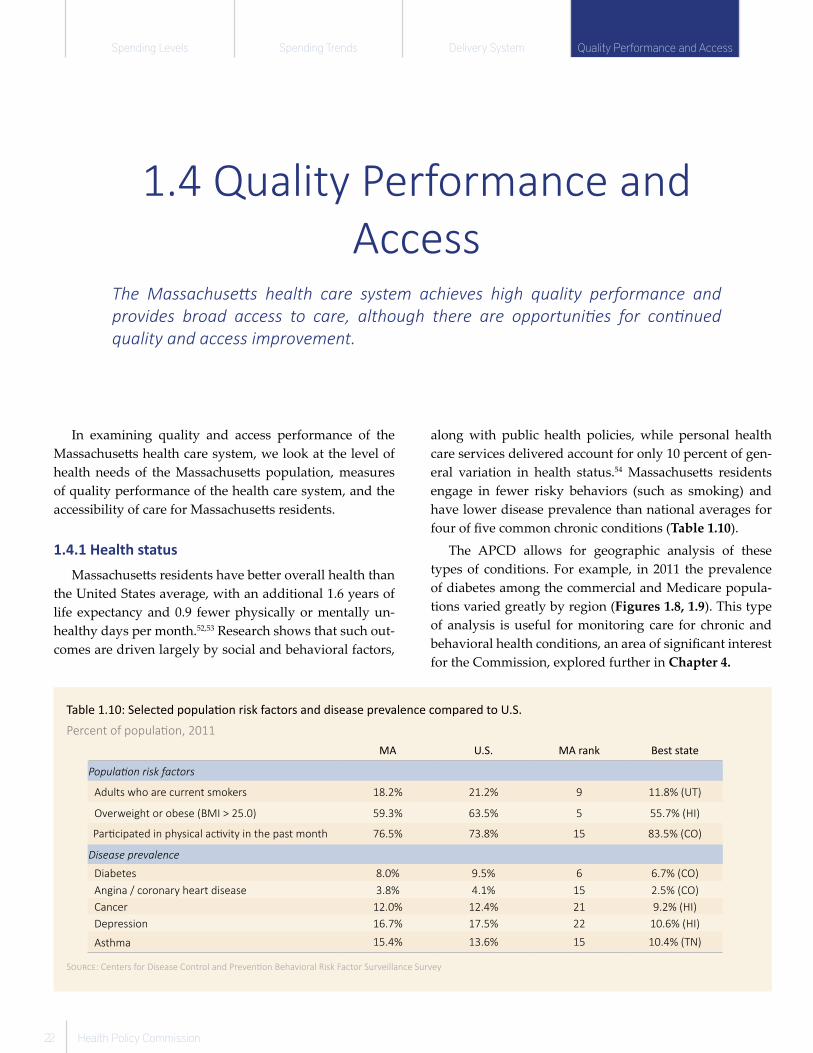
Spending Levels Spending Trends Delivery System Quality Performance and Access
22 Health Policy Commission
In examining quality and access performance of the
Massachuse! s health care system, we look at the level of
health needs of the Massachuse! s population, measures
of quality performance of the health care system, and the
accessibility of care for Massachuse! s residents.
1.4.1 Health status
Massachuse! s residents have be! er overall health than
the United States average, with an additional 1.6 years of
life expectancy and 0.9 fewer physically or mentally un-
healthy days per month.52,53 Research shows that such out-
comes are driven largely by social and behavioral factors,
along with public health policies, while personal health
care services delivered account for only 10 percent of gen-
eral variation in health status.54 Massachuse! s residents
engage in fewer risky behaviors (such as smoking) and
have lower disease prevalence than national averages for
four of fi ve common chronic conditions (Table 1.10).
The APCD allows for geographic analysis of these
types of conditions. For example, in 2011 the prevalence
of diabetes among the commercial and Medicare popula-
tions varied greatly by region (Figures 1.8, 1.9). This type
of analysis is useful for monitoring care for chronic and
behavioral health conditions, an area of signifi cant interest
for the Commission, explored further in Chapter 4.
1.4 Quality Performance and
AccessThe Massachuse� s health care system achieves high quality performance and
provides broad access to care, although there are opportuni� es for con� nued
quality and access improvement.
Table 1.10: Selected popula! on risk factors and disease prevalence compared to U.S.
Percent of popula! on, 2011
MA U.S. MA rank Best state
Popula� on risk factors
Adults who are current smokers 18.2% 21.2% 9 11.8% (UT)
Overweight or obese (BMI > 25.0) 59.3% 63.5% 5 55.7% (HI)
Par! cipated in physical ac! vity in the past month 76.5% 73.8% 15 83.5% (CO)
Disease prevalence
Diabetes 8.0% 9.5% 6 6.7% (CO)
Angina / coronary heart disease 3.8% 4.1% 15 2.5% (CO)
Cancer 12.0% 12.4% 21 9.2% (HI)
Depression 16.7% 17.5% 22 10.6% (HI)
Asthma 15.4% 13.6% 15 10.4% (TN)
S"#$&': Centers for Disease Control and Preven! on Behavioral Risk Factor Surveillance Survey
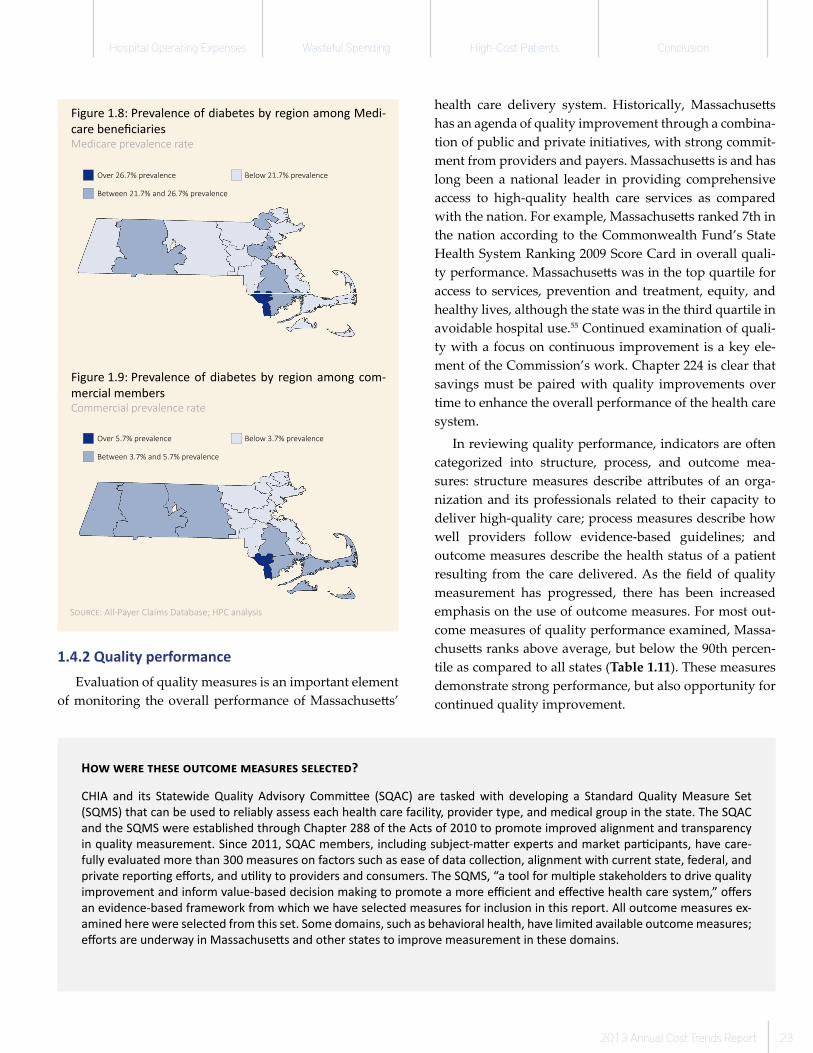
Hospital Operating Expenses Wasteful Spending High-Cost Patients Conclusion
2013 Annual Cost Trends Report 23
1.4.2 Quality performance
Evaluation of quality measures is an important element
of monitoring the overall performance of Massachuse! s’
health care delivery system. Historically, Massachuse! s
has an agenda of quality improvement through a combina-
tion of public and private initiatives, with strong commit-
ment from providers and payers. Massachuse! s is and has
long been a national leader in providing comprehensive
access to high-quality health care services as compared
with the nation. For example, Massachuse! s ranked 7th in
the nation according to the Commonwealth Fund’s State
Health System Ranking 2009 Score Card in overall quali-
ty performance. Massachuse! s was in the top quartile for
access to services, prevention and treatment, equity, and
healthy lives, although the state was in the third quartile in
avoidable hospital use.55 Continued examination of quali-
ty with a focus on continuous improvement is a key ele-
ment of the Commission’s work. Chapter 224 is clear that
savings must be paired with quality improvements over
time to enhance the overall performance of the health care
system.
In reviewing quality performance, indicators are often
categorized into structure, process, and outcome mea-
sures: structure measures describe a! ributes of an orga-
nization and its professionals related to their capacity to
deliver high-quality care; process measures describe how
well providers follow evidence-based guidelines; and
outcome measures describe the health status of a patient
resulting from the care delivered. As the fi eld of quality
measurement has progressed, there has been increased
emphasis on the use of outcome measures. For most out-
come measures of quality performance examined, Massa-
chuse! s ranks above average, but below the 90th percen-
tile as compared to all states (Table 1.11). These measures
demonstrate strong performance, but also opportunity for
continued quality improvement.
H!" "#$# %&#'# !(%)!*# *#+'($#' '#,#)%#-?
CHIA and its Statewide Quality Advisory Commi� ee (SQAC) are tasked with developing a Standard Quality Measure Set
(SQMS) that can be used to reliably assess each health care facility, provider type, and medical group in the state. The SQAC
and the SQMS were established through Chapter 288 of the Acts of 2010 to promote improved alignment and transparency
in quality measurement. Since 2011, SQAC members, including subject-ma� er experts and market par� cipants, have care-
fully evaluated more than 300 measures on factors such as ease of data collec� on, alignment with current state, federal, and
private repor� ng eff orts, and u� lity to providers and consumers. The SQMS, “a tool for mul� ple stakeholders to drive quality
improvement and inform value-based decision making to promote a more effi cient and eff ec� ve health care system,” off ers
an evidence-based framework from which we have selected measures for inclusion in this report. All outcome measures ex-
amined here were selected from this set. Some domains, such as behavioral health, have limited available outcome measures;
eff orts are underway in Massachuse� s and other states to improve measurement in these domains.
Figure 1.8: Prevalence of diabetes by region among Medi-
care benefi ciariesMedicare prevalence rate
Figure 1.9: Prevalence of diabetes by region among com-
mercial membersCommercial prevalence rate
S!"#$%: All-Payer Claims Database; HPC analysis
! ���"#$�%�� ������
&��'����(#$�����"#$�%�� ������
&���'�(#$�%�� ������
" ���#$%&�'�� ������
(��)����#�%&�����#$%&�'�� ������
(���)�#�%&�'�� ������
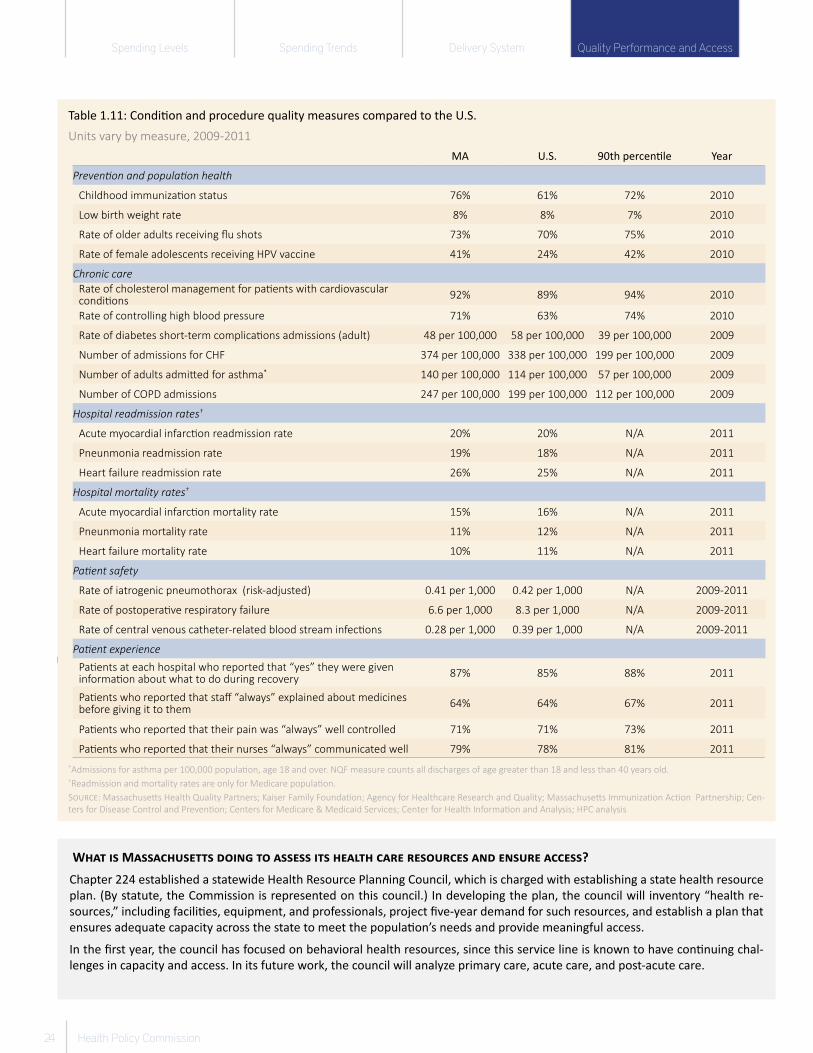
Spending Levels Spending Trends Delivery System Quality Performance and Access
24 Health Policy Commission
W��� �� M������!�"��� #$�%& �$ ���"�� ��� �"�'�� ��(" ("�$!(�"� �%# "%�!(" ���"��?
Chapter 224 established a statewide Health Resource Planning Council, which is charged with establishing a state health resource
plan. (By statute, the Commission is represented on this council.) In developing the plan, the council will inventory “health re-
sources,” including facili� es, equipment, and professionals, project fi ve-year demand for such resources, and establish a plan that
ensures adequate capacity across the state to meet the popula� on’s needs and provide meaningful access.
In the fi rst year, the council has focused on behavioral health resources, since this service line is known to have con� nuing chal-
lenges in capacity and access. In its future work, the council will analyze primary care, acute care, and post-acute care.
Table 1.11: Condi� on and procedure quality measures compared to the U.S.
Units vary by measure, 2009-2011
MA U.S. 90th percen� le Year
Preven� on and popula� on health
Childhood immuniza! on status 76% 61% 72% 2010
Low birth weight rate 8% 8% 7% 2010
Rate of older adults receiving fl u shots 73% 70% 75% 2010
Rate of female adolescents receiving HPV vaccine 41% 24% 42% 2010
Chronic care
Rate of cholesterol management for pa! ents with cardiovascular condi! ons
92% 89% 94% 2010
Rate of controlling high blood pressure 71% 63% 74% 2010
Rate of diabetes short-term complica! ons admissions (adult) 48 per 100,000 58 per 100,000 39 per 100,000 2009
Number of admissions for CHF 374 per 100,000 338 per 100,000 199 per 100,000 2009
Number of adults admi# ed for asthma* 140 per 100,000 114 per 100,000 57 per 100,000 2009
Number of COPD admissions 247 per 100,000 199 per 100,000 112 per 100,000 2009
Hospital readmission rates†
Acute myocardial infarc! on readmission rate 20% 20% N/A 2011
Pneunmonia readmission rate 19% 18% N/A 2011
Heart failure readmission rate 26% 25% N/A 2011
Hospital mortality rates†
Acute myocardial infarc! on mortality rate 15% 16% N/A 2011
Pneunmonia mortality rate 11% 12% N/A 2011
Heart failure mortality rate 10% 11% N/A 2011
Pa� ent safety
Rate of iatrogenic pneumothorax (risk-adjusted) 0.41 per 1,000 0.42 per 1,000 N/A 2009-2011
Rate of postopera! ve respiratory failure 6.6 per 1,000 8.3 per 1,000 N/A 2009-2011
Rate of central venous catheter-related blood stream infec! ons 0.28 per 1,000 0.39 per 1,000 N/A 2009-2011
Pa� ent experience
Pa! ents at each hospital who reported that “yes” they were given informa! on about what to do during recovery
87% 85% 88% 2011
Pa! ents who reported that staff “always” explained about medicines before giving it to them
64% 64% 67% 2011
Pa! ents who reported that their pain was “always” well controlled 71% 71% 73% 2011
Pa! ents who reported that their nurses “always” communicated well 79% 78% 81% 2011
*Admissions for asthma per 100,000 popula! on, age 18 and over. NQF measure counts all discharges of age greater than 18 and less than 40 years old.†Readmission and mortality rates are only for Medicare popula! on.
S&'+:;: Massachuse# s Health Quality Partners; Kaiser Family Founda! on; Agency for Healthcare Research and Quality; Massachuse# s Immuniza! on Ac! on Partnership; Cen-
ters for Disease Control and Preven! on; Centers for Medicare & Medicaid Services; Center for Health Informa! on and Analysis; HPC analysis
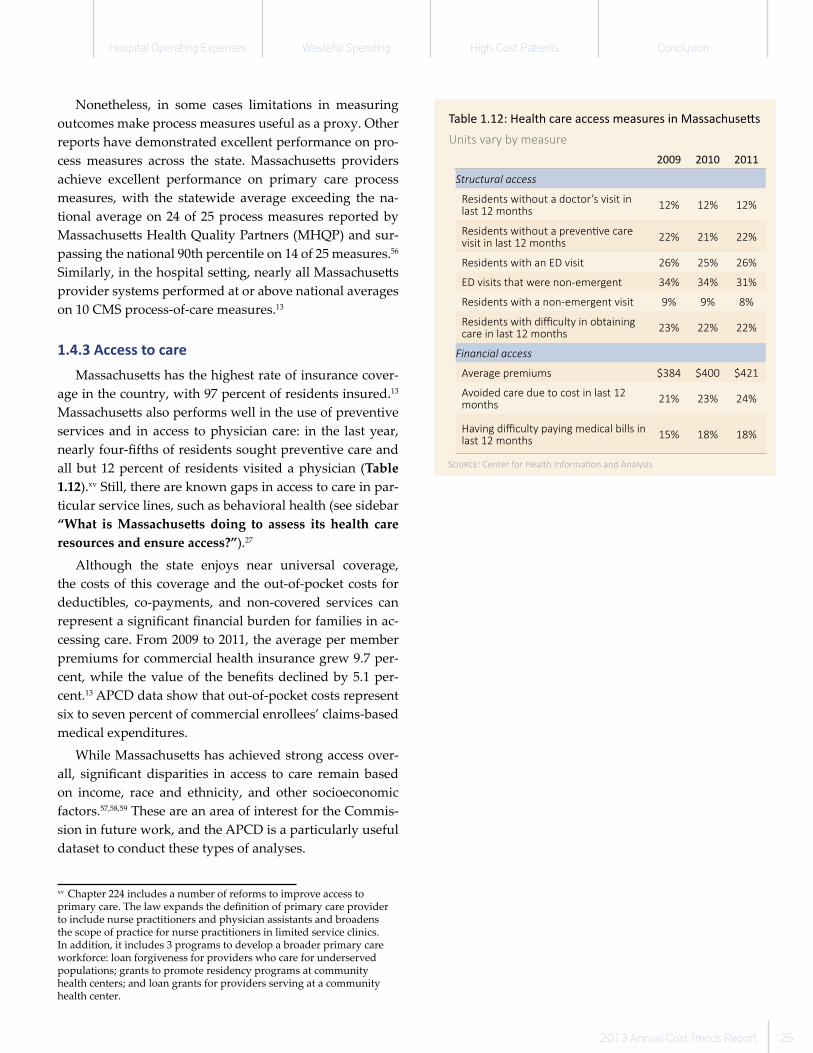
Hospital Operating Expenses Wasteful Spending High-Cost Patients Conclusion
2013 Annual Cost Trends Report 25
Nonetheless, in some cases limitations in measuring
outcomes make process measures useful as a proxy. Other
reports have demonstrated excellent performance on pro-
cess measures across the state. Massachuse! s providers
achieve excellent performance on primary care process
measures, with the statewide average exceeding the na-
tional average on 24 of 25 process measures reported by
Massachuse! s Health Quality Partners (MHQP) and sur-
passing the national 90th percentile on 14 of 25 measures.56
Similarly, in the hospital se! ing, nearly all Massachuse! s
provider systems performed at or above national averages
on 10 CMS process-of-care measures.13
1.4.3 Access to care
Massachuse! s has the highest rate of insurance cover-
age in the country, with 97 percent of residents insured.13
Massachuse! s also performs well in the use of preventive
services and in access to physician care: in the last year,
nearly four-fi fths of residents sought preventive care and
all but 12 percent of residents visited a physician (Table
1.12).xv Still, there are known gaps in access to care in par-
ticular service lines, such as behavioral health (see sidebar
“What is Massachuse" s doing to assess its health care
resources and ensure access?”).27
Although the state enjoys near universal coverage,
the costs of this coverage and the out-of-pocket costs for
deductibles, co-payments, and non-covered services can
represent a signifi cant fi nancial burden for families in ac-
cessing care. From 2009 to 2011, the average per member
premiums for commercial health insurance grew 9.7 per-
cent, while the value of the benefi ts declined by 5.1 per-
cent.13 APCD data show that out-of-pocket costs represent
six to seven percent of commercial enrollees’ claims-based
medical expenditures.
While Massachuse! s has achieved strong access over-
all, signifi cant disparities in access to care remain based
on income, race and ethnicity, and other socioeconomic
factors.57,58,59 These are an area of interest for the Commis-
sion in future work, and the APCD is a particularly useful
dataset to conduct these types of analyses.
xv Chapter 224 includes a number of reforms to improve access to primary care. The law expands the defi nition of primary care provider to include nurse practitioners and physician assistants and broadens the scope of practice for nurse practitioners in limited service clinics. In addition, it includes 3 programs to develop a broader primary care workforce: loan forgiveness for providers who care for underserved populations; grants to promote residency programs at community health centers; and loan grants for providers serving at a community health center.
Table 1.12: Health care access measures in Massachuse� s
Units vary by measure
2009 2010 2011
Structural access
Residents without a doctor’s visit in last 12 months
12% 12% 12%
Residents without a preven! ve care visit in last 12 months
22% 21% 22%
Residents with an ED visit 26% 25% 26%
ED visits that were non-emergent 34% 34% 31%
Residents with a non-emergent visit 9% 9% 8%
Residents with diffi culty in obtaining care in last 12 months
23% 22% 22%
Financial access
Average premiums $384 $400 $421
Avoided care due to cost in last 12 months
21% 23% 24%
Having diffi culty paying medical bills in last 12 months
15% 18% 18%
S#&'(): Center for Health Informa! on and Analysis

Spending Levels Spending Trends Delivery System Quality Performance and Access
26 Health Policy Commission
Per capita health care spending in Massachuse! s is the
highest of any state, 36 percent above the United States
average in 2009. Massachuse! s devoted 16.6 percent of
its economy to personal health care expenditures in 2012,
compared with 15.1 percent for the nation. Higher spend-
ing results from higher utilization and higher prices, and
is concentrated in two categories of service: hospital care
and long-term care and home health. This higher per capi-
ta spending is consistent across all payer types.
Between 2001 and 2009, per capita health care spending
in Massachuse! s grew at an accelerated rate, increasing
the diff erence between Massachuse! s and the U.S. aver-
age from 26 percent to 36 percent. This increased diff er-
ence was driven primarily by faster growth in commercial
prices, as hospital utilization levels compared to the U.S.
average were relatively stable over that time period.
In recent years, spending growth in Massachuse! s has
slowed in line with slower national growth. This recent
slower health care growth coupled with faster economic
growth has marginally decreased the proportion of the
economy that Massachuse! s spends on health care. How-
ever, historic evidence suggests sustaining lower growth
rates will require concerted eff ort. Past periods of slow
health care growth in Massachuse! s, such as the 1990s,
have been followed by periods of higher growth.
Massachuse! s achieves high quality performance on
most measures, although opportunities for improvement
remain. There is broad overall access to care, with low un-
insured rates and a high proportion of residents who have
visited a health care provider in the past year.
Signifi cant trends are occurring in the provider and pay-
er market. For providers, the delivery system is growing
increasingly concentrated in several large systems, with a
larger proportion of discharges occurring from major teach-
ing hospitals and hospitals in their systems. Many provider
organizations seek to re-orient care delivery around new
models for patient-centered, accountable care through a
variety of organizational structures. Still, misaligned pay-
ment incentives, persistent barriers to behavioral health
integration, and limited data and resources are signifi cant
challenges.
In the payer market, commercial payers are pursuing
demand-side innovation through products like high-de-
ductible health plans and tiered or limited network plans
intended to involve consumers in making value-based
decisions. In addition, public and commercial payers are
increasingly implementing provider contracts that aim to
alter supply-side incentives through alternative payment
methods. These methods, in contrast to fee-for-service
payments, are designed to support and fi nancially reward
providers for delivering high-quality care while holding
them accountable for slowing future health care spending
increases. However, there are signifi cant challenges in im-
plementation, including a shift in the commercial market to
PPO products, which currently do not feature alternative
payment methods, and wide variation in contracts across
payers and across providers.
1.5 Conclusion
Hospital Operating Expenses Wasteful Spending High-Cost Patients Conclusion
2013 Annual Cost Trends Report 27
References
1 McKinsey Center for U.S. Health System Reform. Accoun� ng for
the Cost of U.S. Health Care: Pre-reform Trends and the Impact of
the Recession. New York (NY): McKinsey & Company; 2011 Dec.
2 Fisher ES, Wennberg DE, Stukel TA, Go� lieb DJ, Lucas FL, Pinder
EL. The Implica� ons of Regional Varia� on in Medicare Spending.
Part 1: The Content, Quality, and Accessibility of Care. Annals of
Internal Medicine. 2003;138(4):273-287.
3 Young PL, Olsen L. The Healthcare Impera� ve: Lowering Costs and
Improving Outcomes: Workshop Series Summary. Washington
(DC): Ins� tute of Medicine; 2010.
4 Smith S, Newhouse JP, and Freeland MS. Income, Insurance,
and Technology: Why Does Health Spending Outpace Economic
Growth? Health Aff airs. 2009; 28(5):1276-1284.
5 Hadley J, Holahan J. How Much Medical Care Do the Uninsured
Use, and Who Pays for It? Health Aff airs. 2003:W3-66 – W3-81.
6 The Henry J. Kaiser Family Founda� on. State Health Facts: Health In-
surance Coverage of the Total Popula� on [Internet]. Menlo Park (CA):
The Henry J. Kaiser Family Founda� on; [cited 2013 Dec 18]. Available
from: h� p://kff .org/other/state-indicator/total-popula� on/.
7 Centers for Medicare & Medicaid Services. Na� onal Health Expen-
diture Accounts. Washington (DC): Centers for Medicare & Medic-
aid Services.
8 Hanchate AD, Kapoor A, Rosen J, McCormick D, D’Amore MM,
Kressin NR. Massachuse� s Reform and Dispari� es in Inpa� ent
Care U� liza� on. Medical Care. 2012;50(7):569-577.
9 The Henry J. Kaiser Family Founda� on. Overview of Nursing Facility
Capacity, Financing, and Ownership in the United States in 2011.
Washington (DC): The Kaiser Commission on Medicaid and the Un-
insured; 2013 Jun.
10 Na� onal Nursing Home Survey. 2004 Current Resident Tables – Es-
� mates [Internet]. Washington (DC): Centers for Disease Control
and Preven� on; [cited 2013 Dec 18]. Available from: h� p://www.
cdc.gov/nchs/nnhs/resident_tables_es� mates.htm#Demograph-
ics.
11 Analysis by Chapin White of a report from the 1995 to 2009 Truven
Health Analy� cs MarketScan® Commercial Claims and Encounters
Database (copyright © 2011 Truven Health Analy� cs, all rights re-
served).
12 Ins� tute of Medicine. Varia� on in Health Care Spending: Target
Decision Making, Not Geography. Washington (DC): Ins� tute of
Medicine; 2013 Jul 24.
13 Center for Health Informa� on and Analysis. Annual Report on Mas-
sachuse� s Health Care Market. Boston (MA): Center for Health In-
forma� on and Analysis; 2013 Aug.
14 Offi ce of the A� orney General. Annual Report on Health Care Cost
Trends and Cost Drivers. Boston (MA): Offi ce of the A� orney Gen-
eral; 2013 Apr 24.
15 Offi ce of the A� orney General. Annual Report on Health Care Cost
Trends and Cost Drivers. Boston (MA): Offi ce of the A� orney Gen-
eral; 2011 Jun 22.
16 Offi ce of the A� orney General. Annual Report on Health Care Cost
Trends and Cost Drivers. Boston (MA): Offi ce of the A� orney Gen-
eral; 2010 Mar 16.
17 Centers for Medicare & Medicaid Services, Offi ce of Informa-
� on Products and Data Analy� cs. Geographic Varia� on in Stan-
dardized Medicare Spending, 2011 [Internet]. Washington (DC):
Centers for Medicare & Medicaid Services; 2013 Jun [cited 2013
Dec 18]. Available from: h� p://www.cms.gov/Research-Sta� s-
� cs-Data-and-Systems/Sta� s� cs-Trends-and-Reports/Dashboard/
CMS-Dashboard-Geographic-Varia� on-Dashboard.html.
18 Zuckerman S, Goin D. How Much Will Medicaid Physician Fees for
Primary Care Rise in 2013? Evidence from a 2012 Survey of Med-
icaid Physician Fees. Washington (DC): Urban Ins� tute and Kaiser
Commission on Medicaid and the Uninsured; 2012 Dec.
19 Snyder L, Rudowitz R, Garfi eld R, Gordon T. Why Does Medicaid
Spending Vary Across States: A Chartbook of Factors Driving State
Spending. Washington (DC): Kaiser Commission on Medicaid and
the Uninsured; 2012 Nov.
20 Cutler DM, Sahni NR. If Slow Rate of Health Care Spending Per-
sists, Projec� ons May Be Off By $770 Billion. Health Aff airs.
2013;32(5):841-850.
21 Blue Cross Blue Shield Founda� on of Massachuse� s. Health Re-
form in Massachuse� s: Assessing the Results. Boston (MA): Blue
Cross Blue Shield Founda� on of Massachuse� s; 2013 Mar.
22 Massachuse� s Taxpayers Founda� on. Massachuse� s Health Reform
Spending, 2006-2011: An Update on the “Budget Buster” Myth.
Boston (MA): Massachuse� s Taxpayers Founda� on; 2012 Apr.
23 Van der Wees PJ, Zaslavsky AM, and Ayanian JZ. Improvements in
Health Status a" er Massachuse� s Health Reform. Milbank Quar-
terly. 2013 Dec;91(4):663-689.
24 Bureau of Labor Sta� s� cs. Producer Price Indexes Databases [Inter-
net]. Washington (DC): Bureau of Labor Sta� s� cs; [cited 2013 Dec
18]. Available from: h� p://www.bls.gov/ppi/data.htm.
25 Center for Health Informa� on and Analysis. Health Care Provider Price
Varia� on in the Massachuse� s Commercial Market: Results from 2011.
Boston (MA): Center for Health Informa� on and Analysis; 2013 Feb.
26 Bureau of Labor Sta� s� cs. Occupa� onal Employment Sta� s� cs:
May 2009 Na� onal Occupa� onal Employment and Wage Es� mates
[Internet]. Washington (DC): Bureau of Labor Sta� s� cs; [cited 2013
Dec 18]. Available from: h� p://www.bls.gov/oes/2009/may/oes_
nat.htm; Massachuse� s es� mates available from: h� p://www.bls.
gov/oes/2009/may/oes_ma.htm.
27 Health Policy Commission. Pre-fi led Tes� mony from Witnesses
[Internet]. Boston (MA): Health Policy Commission; [cited 2013
Dec 18]. Available from: h� p://www.mass.gov/anf/budget-tax-
es-and-procurement/oversight-agencies/health-policy-commis-
sion/annual-cost-trends-hearing/testimony-and-presentations/
pre-fi led-tes� mony-from-witnesses.html.

Spending Levels Spending Trends Delivery System Quality Performance and Access
28 Health Policy Commission
28 Patel K, Lieberman S. Taking Stock Of Ini� al Year One Results For Pi-
oneer ACOs [Internet]. Washington (DC): The Brookings Ins� tute;
[cited 2013 Dec 28]. Available from: h� p://www.brookings.edu/
research/opinions/2013/07/25-assessing-pioneer-acos-patel#.
29 Massachuse� s Hospital Associa� on. Massachuse� s Hospitals:
Closures, Mergers, Acquisi� ons, and Affi lia� ons [Internet]. Burl-
ington (MA): Massachuse� s Hospital Associa� on; [cited 2013 Dec
18]. Available from: h� p://www.mhalink.org/Content/Naviga� on-
Menu/AboutMHA/HospitalDirectory/HospitalClosuresMergersAc-
quisi� onsandAffi lia� ons/default.htm.
30 Haas-Wilson D, Garmon C. Hospital Mergers and Compe� � ve Ef-
fects: Two Retrospec� ve Analyses. Interna� onal Journal of the
Economics of Business. 2011;18(1):17-32.
31 Vogt WB, Town RJ. How has Hospital Consolida� on Aff ected the
Price and Quality of Hospital Care? Research Synthesis Report 9.
Princeton (NJ): Robert Wood Johnson Founda� on; 2006.
32 Tenn S. The Price Eff ects of Hospital Mergers: A Case Study of the
Su� er-Summit Transac� on. Interna� onal Journal of the Economics
of Business. 2011;18(1):65-82.
33 Gaynor M, Town RJ. Compe� � on in Health Care Markets. Hand-
book of Health Economics. 2012; 2: 499-637.
34 Gaynor M, Town RJ. Policy Brief No. 9: The Impact of Hospital
Consolida� on – Update [Internet]. Princeton (NJ): Robert Wood
Johnson Founda� on; [cited 2013 Dec 18]. Available from: h� p://
www.rwjf.org/content/dam/farm/reports/issue_briefs/2012/
rwjf73261.
35 Medicare Payment Advisory Commission. A Data Book: Health Care
Spending and the Medicare Program. Washington (DC): Medicare
Payment Advisory Commission; 2013 Jun.
36 Gaynor M. Health Care Industry Consolida� on: Statement before
the Commi� ee on Ways and Means Health Subcommi� ee. Wash-
ington (DC). 2011 Sep 9.
37 Health Policy Commission. Pre-fi led Tes� mony from Witnesses,
Pre-Filed Wri� en Tes� mony of Acton Medical Associates [Inter-
net]. Boston (MA): Health Policy Commission; [cited 2013 Dec 18].
Available from: h� p://www.mass.gov/anf/budget-taxes-and-pro-
curement/oversight-agencies/health-policy-commission/annu-
al-cost-trends-hearing/tes� mony-and-presenta� ons/pre-fi led-tes-
� mony-from-witnesses.html.
38 Health Policy Commission. Pre-fi led Tes� mony from Witnesses,
Pre-Filed Wri� en Tes� mony of BIDCO, Response to Exhibit B [Inter-
net]. Boston (MA): Health Policy Commission; [cited 2013 Dec 18].
Available from: h� p://www.mass.gov/anf/docs/hpc/bidco-writ-
ten-tes� mony-response-exhibit-c-9-27-13.pdf.
39 Health Policy Commission. Pre-fi led Tes� mony from Witnesses,
Pre-Filed Wri� en Tes� mony of NEQCA, Response to Exhibit B [In-
ternet]. Boston (MA): Health Policy Commission; [cited 2013 Dec
18]. Available from: h� p://www.mass.gov/anf/docs/hpc/neq-
ca-exhibit-b.pdf.
40 Massachuse� s Special Commission on the Health Care Payment
System. Recommenda� ons of the Special Commission on the
Health Care Payment System. Boston (MA): Massachuse� s Special
Commission on the Health Care Payment System; 2009 Jul 16.
41 Care Con� nuum Alliance. Implementa� on and Evalua� on: A Pop-
ula� on Health Guide for Primary Care Models. Washington (DC):
Care Con� nuum Alliance; 2012 Oct.
42 Centers for Medicare & Medicaid Services. Program News and
Announcements. [Internet]. Washington (DC): Centers for Medi-
care & Medicaid Services; 2013 [cited 2014 Jan 5]. Available from:
http://www.cms.gov/Medicare/Medicare-Fee-for-Service-Pay-
ment/sharedsavingsprogram/News.html.
43 Muhlestein DB, Croshaw AA, Merrill TP. Risk Bearing and Use of
Fee-For-Service Billing Among Accountable Care Organiza� ons.
The American Journal of Managed Care. 2013;19(7):589-592.
44 Behavioral Health Integra� on Task Force. Report to the Legislature
and the Health Policy Commission. Boston (MA): Behavioral Health
Integra� on Task Force; 2013 Jul.
45 Newman D. Accountable Care Organiza� ons and the Medicare
Shared Savings Program. Washington (DC): Congressional Re-
search Service; 2011 Apr 25.
46 Nelson L. Working Paper Series: Lessons from Medicare’s Demon-
stra� on Projects on Disease Management and Care Coordina� on.
Washington (DC): Congressional Budget Offi ce; 2012 Jan.
47 Jackson GL, Powers BJ, Cha� erjee R, Be� ger JP, Kemper AR, Has-
selblad V, Dolor RJ, Irvine RJ, Heidenfelder BL, Kendrick AS, Gray
R, Williams JW. The Pa� ent-Centered Medical Home: A Systema� c
Review. Annals of Internal Medicine. 2013;158(3):169-178.
48 Na� onal Commi� ee for Quality Assurance. NCQA Health Insurance
Plan Rankings 2013-2014 – Summary Report [Internet]. Washing-
ton (DC): Na� onal Commi� ee for Quality Assurance; 2013 [cited
2013 Dec 29]. Available from: h� p://healthplanrankings.ncqa.org/
default.aspx.
49 Brill S. Bi� er Pill: Why Medical Bills are Killing Us: How Outrageous
Pricing and Egregious Profi ts are Destroying Our Health Care. TIME
Magazine. 2013 Mar 4.
50 The Henry J. Kaiser Family Founda� on. State Health Facts: State
HMO Penetra� on Rate [Internet]. Menlo Park (CA): The Henry J.
Kaiser Family Founda� on; [cited 2013 Dec 20]. Available from:
h� p://kff .org/other/state-indicator/hmo-penetra� on-rate/.
51 Center for Health Informa� on and Analysis. Alterna� ve Payment
Methods in the Massachuse� s Commercial Market: Baseline Re-
port (2012 Data). Boston (MA): Center for Health Informa� on and
Analysis; 2013 Dec.
52 The Henry J. Kaiser Family Founda� on. Life Expectancy at Birth
(in years) [Internet]. Menlo Park (CA): The Henry J. Kaiser Family
Founda� on; [cited 2013 Dec 20]. Available from: h� p://kff .org/
other/state-indicator/life-expectancy/.
Hospital Operating Expenses Wasteful Spending High-Cost Patients Conclusion
2013 Annual Cost Trends Report 29
53 Health Indicators Warehouse. Physically or Mentally Unhealthy
Days: Adults (days) [Internet]. Hya� sville (MD): Health Indica-
tors Warehouse; [cited 2013 Dec 20]. Available from: h� p://
healthindicators.gov/Indicators/Physically-or-mentally-un-
healthy-days-adults-days_75/Profi le.
54 McGinnis JM, Williams-Russo P, Knickman JR. The Case For More
Ac� ve Policy A� en� on To Health Promo� on. Health Aff airs.
2002;21(2):78-93.
55 The Commonwealth Fund. Massachuse� s - State Health System
Ranking – Health Systems Data Center [Internet]. New York (NY):
The Commonwealth Fund; [cited 2013 Dec 28]. Available from:
http://datacenter.commonwealthfund.org/scorecard/state/23/
massachuse� s/.
56 Massachuse� s Health Quality Partners. Quality Insights: Clinical
Quality in Primary Care - Massachuse� s Statewide Rates and Na-
� onal Benchmarks [Internet]. Boston (MA): Massachuse� s Health
Quality Partners; [cited 2013 Dec 18]. Available from: h� p://mhqp.
org/quality/clinical/cqMASumm.asp?nav=032400.
57 The Massachuse� s Health Dispari� es Council. Dispari� es in Health
2011. Boston (MA): The Massachuse� s Health Dispari� es Council;
2012 Jan 25.
58 Massachuse� s Department of Public Health. Racial and Ethnic
Health Dispari� es by EOHHS Regions in Massachuse� s. Boston
(MA): Massachuse� s Department of Public Health; 2007 Nov.
59 University of Massachuse� s Boston, John W. McCormack Graduate
School of Policy and Global Studies, The Center for Social Policy.
Closing the Gap on Health Care Dispari� es. Boston (MA): Universi-
ty of Massachuse� s Boston; 2012 Dec.

Spending Levels Spending Trends Delivery System Quality Performance and Access
30 Health Policy Commission
Hospitals face signifi cant operating expenses in deliv-
ering care. Improving the operating effi ciency of hospitals
enables them to deliver care more aff ordably. If hospitals
with higher expense structures could successfully imple-
ment strategies to reduce operating expenses, then the
overall health care system could maintain equal or be! er
quality of care while reducing total expenditures.
To this point, our focus has been on payer and con-
sumer payments to providers for delivering health care
services. In this chapter we shift to an examination of the
expenses of acute hospitalsi in providing those services,
or operating expenses. We fi rst compare hospital operat-
ing effi ciency by examining diff erences in expenses and
quality performance (see sidebar “What does operating
effi ciency mean for hospitals?”). We then examine the dif-
ferent margins hospitals earn from public and commercial
payers and the variation of these margins across hospitals.
Finally, we examine the composition of hospital operating
expenses and discuss strategies that hospitals may use to
improve their effi ciency.
2.1 Varia� on in hospital opera� ng effi ciency
Operating expenses vary greatly by hospital. Analysis
of cost reports submi! ed by Massachuse! s hospitals illus-
i Those hospitals licensed under MGL Chapter 111, section 51, for whom a majority of beds are medical-surgical, pediatric, obstetric, or maternity.
trates this variationii (see Technical Appendix B1: Data
sources for discussion of the hospital cost reports data set).
Even after adjusting for the varying complexity of needs of
patients treated by each hospital and for diff erent regional
wage levels, hospitals with higher levels of operating ex-
penses spent 23 percent more to provide the same services
than those with lower levels of operating expenses (Figure
2.1).iii This diff erence represented thousands of dollars in
additional expenses per hospitalization for those hospitals
with higher expense structures.
One oft-cited theory for the cause of this variation is
that certain types of hospitals, such as those that teach
physician residents and fellows, must incur additional ex-
penses to support their mission.iv However, the diff erence
in median expenses per discharge between teaching hospi-
tals and all hospitals ($1,030) was less than the diff erence
between individual teaching hospitals ($3,107 between the
75th percentile and 25th percentile teaching hospitals).v
Moreover, there were a number of teaching hospitals that
incurred fewer expenses per discharge than the statewide
all-hospital median of approximately $9,000 per discharge
(Figures 2.1, 2.2). A similar analysis for disproportionate
share hospitals (DSH)vi found that these hospitals had a
median operating expense level comparable to the median
for all hospitals ($9,055 compared with $9,053), but that
there was broad variation between DSH hospitals ($2,060
between the 75th percentile and 25th percentile).
Evaluating effi ciency also requires understanding the
impact of operating expense level on the quality of care
ii While hospital cost reports have known limitations and accounting approaches diff er from hospital to hospital, these data represent the best information available at a statewide level for analysis of hospital operat-ing expenses. Analyses presented here describe general trends and are not intended to characterize the performance of individual institutions.iii In describing the degree of variation, we used the 25th and 75th percen-tile hospitals to exclude outliers.iv Medicare provides graduate medical education (GME) funding to support resident training expenses.v We defi ne teaching hospitals based on the Medicare Payment Ad-visory Commission (MedPAC) defi nition of major teaching hospital. Major teaching hospitals are those that train at least 25 residents per 100 hospital beds.vi DSH refers to hospitals with 63% or more of patient charges a! ributed to Medicare, Medicaid, and other government payers, including Com-monwealth Care and Health Safety Net.
2. Hospital Opera� ng Expenses Hospitals in Massachuse� s vary greatly in their level of opera� ng effi ciency, with some
capable of delivering high-quality care with lower opera� ng expenses.
W!"# $%&' %(&)"#*+, &--*/*&+/0 3&"+ -%)
!%'(*#"4'?
We use opera� ng effi ciency in this chapter to describe
how produc� vely hospitals make use of their input re-
sources – such as facili� es, labor, and supplies – to deliver
care. We describe a hospital that is able to deliver sim-
ilar services at equivalent quality while incurring fewer
expenses than another hospital as being rela� vely effi -
cient. There are many prac� ces that hospitals may use to
reduce opera� ng expenses and improve effi ciency (see
sidebar “What types of strategies are hospitals pursuing
to reduce their opera� ng expenses?”).
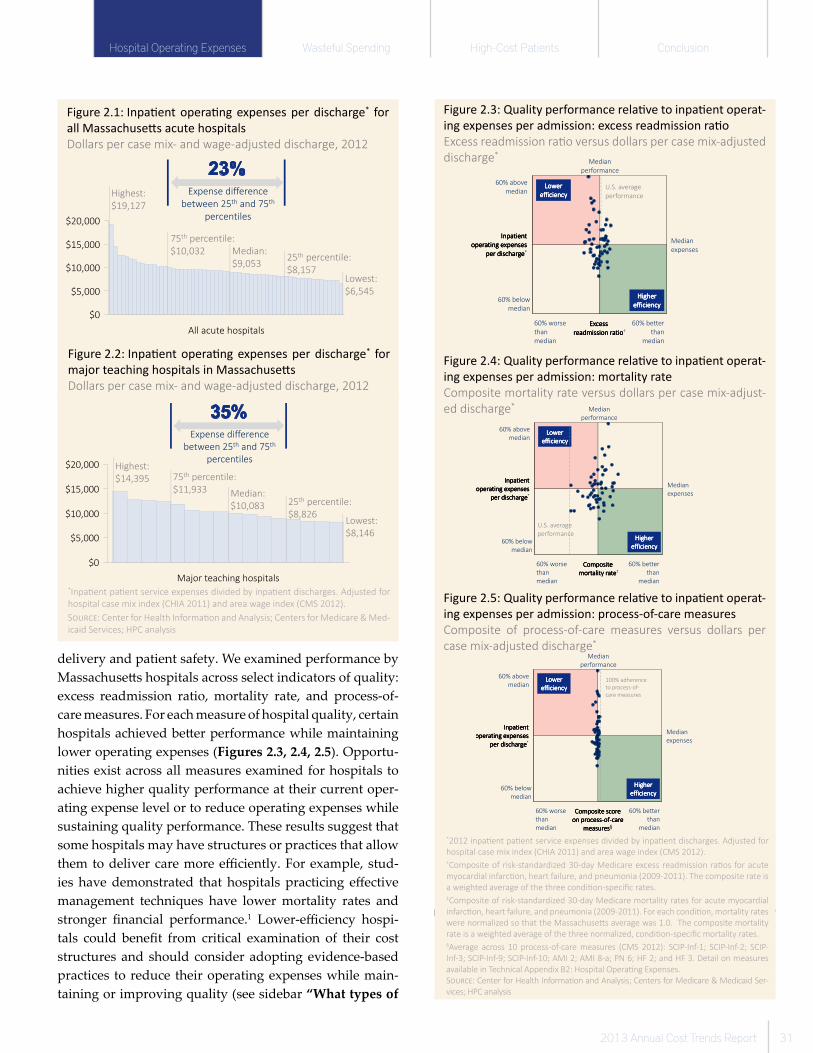
Hospital Operating Expenses Wasteful Spending High-Cost Patients Conclusion
2013 Annual Cost Trends Report 31
delivery and patient safety. We examined performance by
Massachuse! s hospitals across select indicators of quality:
excess readmission ratio, mortality rate, and process-of-
care measures. For each measure of hospital quality, certain
hospitals achieved be! er performance while maintaining
lower operating expenses (Figures 2.3, 2.4, 2.5). Opportu-
nities exist across all measures examined for hospitals to
achieve higher quality performance at their current oper-
ating expense level or to reduce operating expenses while
sustaining quality performance. These results suggest that
some hospitals may have structures or practices that allow
them to deliver care more effi ciently. For example, stud-
ies have demonstrated that hospitals practicing eff ective
management techniques have lower mortality rates and
stronger fi nancial performance.1 Lower-effi ciency hospi-
tals could benefi t from critical examination of their cost
structures and should consider adopting evidence-based
practices to reduce their operating expenses while main-
taining or improving quality (see sidebar “What types of
�������
�����
��� ������ ������ ������ ���
����������������������������������������
������������������������
����������������������������������������
(�������(�������(�������(�������
��������������������������������������������������������
������ ���������� ���������� ���������� ����
5����5����5����5����
������������������������������������������������������������+6!7������
� ����
������
6!7�#������
� ���
������
6!7�#�����
������
�������
����������
8�*����������
����������
6!7��#����
������
����������������������������
����������������������������
� ����� ����� ����� ����
����������������������������
����������������������������
��������������� ��������������� ��������������� ���������������
������������������������������������������������*
�� ����� �� ����� �� ����� �� �����
� ������������� ������������� ������������� ������������!6#7�� ����
�����
�����
6#7�%������
����
�����
6#7�%�� ��
�����
*�����
���� ����
8�+����������
���� ����
6#7��% ���
�����
*�����
�������
����������������������������
����������������������������
� ����� ����� ����� ����
����������������������������
������ ������ ������ ������
��������������� ��������������� ��������������� ���������������
������������������������������������������������*
! �� ������ ��! �� ������ ��! �� ������ ��! �� ������ ��
��� ��� ��� ��� ��� ��� ��� ������� � � � �����������������
���������������������������������
3#6�� ����
�����
�����
3#6�%������
����
�����
3#6�%�� ��
�����
*�����
�������
*�����
���� ����
$##6���������
� ��� ���� ��
������������
3#6��% ���
�����
Figure 2.5: Quality performance rela! ve to inpa! ent operat-
ing expenses per admission: process-of-care measures
Composite of process-of-care measures versus dollars per
case mix-adjusted discharge*
*2012 inpa! ent pa! ent service expenses divided by inpa! ent discharges. Adjusted for
hospital case mix index (CHIA 2011) and area wage index (CMS 2012).†Composite of risk-standardized 30-day Medicare excess readmission ra! os for acute
myocardial infarc! on, heart failure, and pneumonia (2009-2011). The composite rate is
a weighted average of the three condi! on-specifi c rates. ‡Composite of risk-standardized 30-day Medicare mortality rates for acute myocardial
infarc! on, heart failure, and pneumonia (2009-2011). For each condi! on, mortality rates
were normalized so that the Massachuse# s average was 1.0. The composite mortality
rate is a weighted average of the three normalized, condi! on-specifi c mortality rates.§Average across 10 process-of-care measures (CMS 2012): SCIP-Inf-1; SCIP-Inf-2; SCIP-
Inf-3; SCIP-Inf-9; SCIP-Inf-10; AMI 2; AMI 8-a; PN 6; HF 2; and HF 3. Detail on measures
available in Technical Appendix B2: Hospital Opera! ng Expenses.
S$%&'+: Center for Health Informa! on and Analysis; Centers for Medicare & Medicaid Ser-
vices; HPC analysis
Figure 2.3: Quality performance rela! ve to inpa! ent operat-
ing expenses per admission: excess readmission ra! o
Excess readmission ra! o versus dollars per case mix-adjusted
discharge*
Figure 2.4: Quality performance rela! ve to inpa! ent operat-
ing expenses per admission: mortality rate
Composite mortality rate versus dollars per case mix-adjust-
ed discharge*
Figure 2.1: Inpa! ent opera! ng expenses per discharge* for
all Massachuse" s acute hospitals
Dollars per case mix- and wage-adjusted discharge, 2012
��
������
������
������
�������
�������������������
��� ����� �����
����!� ����� �
�"���!���� ����� �����
�#�� $�%����
�&��'�
(�������
�"��
7��� ���������� ���
*��%�� ����� � �� ���
����� �����
Figure 2.2: Inpa! ent opera! ng expenses per discharge* for
major teaching hospitals in Massachuse" s
Dollars per case mix- and wage-adjusted discharge, 2012
*Inpa! ent pa! ent service expenses divided by inpa! ent discharges. Adjusted for
hospital case mix index (CHIA 2011) and area wage index (CMS 2012).
S$%&'+: Center for Health Informa! on and Analysis; Centers for Medicare & Med-
icaid Services; HPC analysis
��
������
�������
�������
�������
���� ������������ ���
!� � ������ ����
����"## �������
�����$# �� � ������ ����
�$�$�%&'�� �
�$��(%
)����� �
��(�#"�
7������������������
+� '������ � ����!� �
������ ����

Spending Levels Spending Trends Delivery System Quality Performance and Access
32 Health Policy Commission
strategies are hospitals pursuing to reduce their operat-
ing expenses?”).
2.2 Opera� ng margins by payer and hospital
market posi� on
Hospitals’ operating expenses and operating margins
are infl uenced by market dynamics and the level of pay-
ments they receive from public and commercial payers.
Diff erences in the level of payments made to hospitals by
commercial payers compared with those paid by the pub-
lic payers (Medicare and Medicaid) have been well-docu-
mented. Nationally, hospitals have typically made money
on their commercial business while losing money on their
Medicare and Medicaid business (Figure 2.6).
Massachuse! s hospitals experience similar diff erenc-
es, but operating margins vary materially by hospital for
both commercial and public payer business. Diff erences
in the operating margins between hospitals can be driv-
en by diff erences in the revenues they receive for services,
by diff erences in the expenses they incur to deliver those
services, or by both factors (Figure 2.7). For public payers,
price levels are comparable across hospitals because Med-
icaid and Medicare set fee schedules based on established
formulas.vii As a result, diff erences in operating margins
between hospitals for public payers are largely driven by
diff erences in expenses.
For commercial payers, the diff erences in margins include
large diff erences in prices paid. CHIA’s relative price report-
ing and analyses by the AGO have demonstrated a wide vari-
ation in commercial prices paid to Massachuse! s hospitals. 2,3
vii These formulas account for factors like regional wages, costs asso-ciated with a teaching mission, and the case mix of patients using the hospital.
Hospital cost reports suggest that some Massachuse! s
hospitals earn positive margins from public payers, while
others lose more than 30 cents per dollar of revenue on the
same payers.viii Similarly, some hospitals earn more than
30 cents per dollar of revenue on commercial payers, while
others earn just a fraction of that. In Massachuse! s, when
grouped by expense levels, the groups of hospitals that
earn the largest margins on revenue from commercial pay-
ers often report the largest losses on revenue from public
payers (Figure 2.8).
viii This is on a fully allocated expense basis determined by average costs, factoring in indirect expenses and overhead. In some cases where negative margins are reported on a fully allocated expenses basis, Medi-care and Medicaid payments may exceed direct care expenses.
* Medicaid and Medicare fi gures include dispropor� onate share payments.
S����!: Avalere Health analysis of American Hospital Associa� on Annual Survey
data, 2011, for community hospitals
Figure 2.6: Aggregate U.S. hospital payment-to-cost ra� os
for commercial payers, Medicare, and Medicaid*
Percent of total expenses, 2011
�� !
���!
�"�!
��#!
��#!
�"�!
� $#!
� %!
� $ !
&
"&
�&
&&
&
�&
$&
'&
��& ��� ��' ��% ��" �&&& �&&� �&&' �&&% �&&" �& & �& �
(������� �
����� ��
����� ��
Figure 2.7: Illustra� ve examples of margin diff erences driven
by prices and opera� ng expenses
��������������� ����� ������� � ���� ������ �� � �
��������������� ��� ������ �� � ������� � ������ �
,-
.
/�
0
/�
�
/
.
�
/
.
�
���)�� �$�� ��'��
�"$�'���
� ���'� ���)�� �$�� ��'��
�"$�'���
� ���'�
���)�� �$�� ��'��
�"$�'���
� ���'� ���)�� �$�� ��'��
�"$�'���
� ���'�
Figure 2.8: Opera� ng margins by payer type for hospitals at
diff erent opera� ng expense levels
Opera� ng income as propor� on of net pa� ent service reve-
nue,* 2012
*Opera� ng income defi ned as total net pa� ent service revenue less total pa� ent
service expenses. Payer-specifi c expenses are es� mated by applying hospital-spe-
cifi c cost-to-charge ra� os to hospital’s charges by payer.†2012 inpa� ent pa� ent service expenses divided by inpa� ent discharges. Adjust-
ed for hospital case mix index (CHIA 2011) and area wage index (CMS 2012).
S����!: Center for Health Informa� on and Analysis; HPC analyss
"*+
" +
,+-+-+
�-+
+��+
+ -+
&�������
.��������
� ��������
�� �����
/���
.�������
0���
.�������
����
.�������
1�2����
.���������
� ��������
�� �����
%���������
3�������
4-�,, 4*��*- 4�� 4�*- 4 ����
� ��������
�� ������ ���
���������5
Hospital Operating Expenses Wasteful Spending High-Cost Patients Conclusion
2013 Annual Cost Trends Report 33
W��� ����! "# !�$���%&�! �$� �"!�&��'! �($!(&)% �" $�*(+� ���&$ "��$��&)% �,��)!�!?
Hospitals in Massachuse� s and around the na� on are implemen� ng various eff orts to improve their opera� onal effi ciency
with the goal of delivering high-quality care while incurring lower expenses. Below we discuss three examples of strategies
that have been successfully implemented at certain hospitals. For a par� cular hospital, opportuni� es may be diff erent than
those described below, but these examples demonstrate the range of levers that are available to hospitals to improve their
opera� ng effi ciency.
P�������� ! # $ %�&&'( �)#* �# #+��� !
Hospitals purchase a large variety and volume of goods, materials, and equipment. Purchased items range from surgical
gloves to drugs, imaging machines, and major surgical implants. The procurement of these items is o! en encumbered by
various forms of ineffi ciency, including4:
▪ Lack of coordina� on across hospitals in a system, with duplica� ve purchasing and materials management departments
that fail to leverage system scale to nego� ate lower prices,
▪ Lack of alignment across clinicians in a department, resul� ng in orders of similar products from diff erent companies,
thereby missing opportuni� es to save through bulk-volume purchasing, and
▪ Ineff ec� ve inventory management, resul� ng in stock-outs or delays for some items and large inventory levels for others.
Reducing ineffi ciencies in procurement can substan� ally reduce the expenses of delivering care. Orthopedic and cardiac im-
plants, for instance, can represent 50 to 80 percent of the total expenses of an acute procedure.5 Through improved man-
agement, hospitals can poten� ally reduce the spending across their en� re supply chains by an es� mated fi ve to 15 percent.6
L�# �# #+��� !
“Lean” management principles are most widely associated with the Toyota Produc� on System, which seeks to reduce waste
in the produc� on process to increase value for the customer. Over the past decade, a number of organiza� ons have translated
the same lean principles to the hospital se# ng. The benefi ts of lean processes – including fewer medica� on errors, a decrease
in health care-associated infec� ons, less nursing � me away from the bedside, faster opera� ng room turnover, improved care-
team communica� on about pa� ents, and faster response � me for emergency cases – not only improve pa� ent care but also
increase employee engagement, labor produc� vity, and opera� ng margins.7 Successful implementa� ons of lean programs in
hospital systems outside Massachuse� s have shown signifi cant improvements in effi ciency, with one hospital system report-
ing savings equivalent to three to fi ve percent of its annual revenue within three years and another achieving a 36 percent
improvement in labor produc� vity.8,9
S� ll, the literature contains many cases of (and explana� ons for) hospitals’ failures in implemen� ng lean principles, and sta-
� s� cally rigorous evidence of the poten� al impact is limited.10,11 Some systems that have achieved great success in improving
effi ciency in their core markets have encountered diffi cul� es in trying to scale their approach to new markets.12 Although
eff orts to adopt lean principles do not guarantee success, with careful implementa� on Massachuse� s hospitals may realize
effi ciencies through established successful lean programs.
C�%! #���� !* +
In their eff orts to reduce opera� ng expenses, hospitals are o! en limited by the informa� on available from their established
cost accoun� ng prac� ces. Many Massachuse� s hospitals have not implemented detailed cost accoun� ng systems, and thus
the opera� ng expenses associated with a par� cular procedure are o! en not measured directly.13 Rather, the hospitals cal-
culate a hospital- or department-wide ra� o of total expenses to total charges and then mul� ply this ra� o by the amount
billed for that procedure to obtain an expense value. Some hospitals a� empt a more accurate alloca� on by using internally
developed rela� ve value units based on the complexity of the procedure, but such alloca� on methods introduce other mea-
surement errors. Without direct measurement of expenses in delivering care, hospitals encounter diffi cul� es in managing and
improving their expenses. To remedy these problems, several health systems have been pursuing more rigorous approaches
to expense measurement, using actual data on the � me spent by clinicians and support personnel, and also of the space,
equipment, and supplies used to treat pa� ents for a specifi c condi� on.14,15
In the future, improved accoun� ng prac� ces will become increasingly important as hospitals seek to reduce their per-pro-
cedure opera� ng expenses to enable more aff ordable care delivery. Benchmarking data available through state repor� ng
programs or provider data consor� ums can also support opera� onal improvement eff orts.

Spending Levels Spending Trends Delivery System Quality Performance and Access
34 Health Policy Commission
Some hospitals seek to negotiate greater payments
from commercial payers to make up for these public payer
shortfalls. Previous analyses have shown that hospitals are
not uniformly successful in realizing this shift in source
of revenue (often referred to as “cost-shifting”), as Mas-
sachuse! s hospitals with high public payer mix on aver-
age receive lower relative commercial prices than hospitals
with low public payer mix.2 Whether a hospital is able to
negotiate higher commercial prices when it faces a decline
in public payer revenue is most closely linked to the hospi-
tal’s relative market leverage, not its relative mix of public
payer reimbursement.16
This impacts operating expenses over time as hospitals
with stronger market leverage can earn higher revenues
from commercial payers and therefore have less pressure
to constrain their expenses.17,18 Meanwhile, hospitals with
limited market leverage receive lower rates of commercial
payer reimbursement and, under greater fi nancial pres-
sure, tend to be more aggressive at maintaining lower
operating expenses.ix Nationally, hospitals with lower ex-
pense structures fare be! er at Medicare and Medicaid lev-
els of reimbursement. Analysis of the hospital cost reports
in Massachuse! s shows consistent results. These fi ndings
reinforce the importance of monitoring overall market
performance and competitiveness.
2.3 Composi� on of hospital opera� ng expenses
In 2012, spending on labor constituted more than half
of all operating expenses for Massachuse! s hospitals (Fig-
ure 2.9).x In some hospitals, the staff is directly paid for by
the hospital in the form of salaries and benefi ts; in others,
hospitals outsource certain roles to companies and pay for
the labor through a purchased services contract.
It is important to be! er understand the relationship of
labor expenses, supply expenses, and other operating ex-
penses with quality of care in order to assess how hospitals
can become more effi cient. Current information, however,
is limited for conducting such an analysis. Available cost
reports contain only spending within a hospital, excluding
expenses incurred through affi liated provider organiza-
tions in the hiring of medical staff and other personnel.n
ix Some reductions in operating expenses may refl ect effi ciency improve-ments, while others may be of potential concern. For example, hospi-tals with limited revenue may maintain lower operating expenses by deferring investment in facilities and equipment, which could deepen competitive disadvantages over time.x Labor expenses shown here include direct spending on salaries and benefi ts, spending on purchased services, and spending on physician compensation that is paid directly by the hospital, rather than a separate physician organization.
the current structure, hospitals report similar expenses
diff erently. Moreover, available data on hospital capital
expenses are limited. Improved data are needed to further
analyze high-effi ciency models and best practices, which
could support provider organization improvement eff orts
through actionable benchmarks. In the future, we will
continue to examine this area as improved data become
available through CHIA data collection eff orts and other
programs.
2.4 Conclusion
Hospitals vary greatly in their level of operating effi -
ciency, with some capable of delivering high-quality care
with lower expenses. These diff erences between higher-
and lower-expense hospitals amount to several thousand
dollars per discharge. There are multiple strategies to re-
duce operating expenses that are being explored around
the country, which, if adopted, could enable Massachu-
se! s hospitals to deliver high-quality care at more aff ord-
able prices.
References
1 Carter K, Dorgan S, Layton D. Why Hospital Management Ma� ers.
New York (NY): McKinsey & Company; 2011.
2 Center for Health Informa� on and Analysis. Health Care Provider
Price Varia� on in the Massachuse� s Commercial Market. Boston
(MA): Center for Health Informa� on and Analysis; 2013 Feb.
3 Offi ce of the A� orney General. Annual Report on Health Care Cost
Trends and Cost Drivers. Boston (MA): Offi ce of the A� orney Gen-
eral; 2010 Mar 16.
4 Schwar� ng D, Bitar J, Arya Y, Pfeiff er T. The Transforma� ve Hospital
Supply Chain. New York (NY): Booz & Company; 2010.
,�
" ���!
&�������
-������ �����
��� #����. ����
��
/0
/
* Labor expense category is composed of salaries and benefi ts, physician compen-
sa� on paid directly by hospitals, and purchased services.
S����!: Center for Health Informa� on and Analysis; HPC analysis
Figure 2.9: Breakdown of hospital opera� ng expenses
Percent of direct expenses by category, 2012
Hospital Operating Expenses Wasteful Spending High-Cost Patients Conclusion
2013 Annual Cost Trends Report 35
5 Global Health Exchange Inc. Applying Supply Chain Best Prac� ces
from Other Industries to Healthcare. Louisville (CO): Global Health
Exchange Inc; 2011.
6 Dominy M, O’Daff er E. Supply Chain Consultants and Outsourcing
Providers for Healthcare Delivery Organiza� ons. Stamford (CT):
Gartner Inc.; 2011 Jul.
7 Toussaint JS, Berry LL. The Promise of Lean in Health Care. Mayo
Clinic Proceedings. 2013;88(1):74-82.
8 Toussaint J. Wri� ng the New Playbook for U.S. Health Care: Les-
sons from Wisconsin. Health Aff airs. 2009;28(5):1343-1350.
9 Ins� tute for Healthcare Improvement. Innova� on Series: Going
Lean in Health Care. Cambridge (MA): Ins� tute for Healthcare Im-
provement; 2005.
10 Rodak S. 4 Common Mistakes of Hospitals Implemen� ng Lean
Management [Internet]. Chicago (IL): Becker’s Hospital Review;
2012 Sep 18 [cited 2013 Dec 18]. Available from: h� p://www.
beckershospitalreview.com/strategic-planning/4-common-mis-
takes-of-hospitals-implemen� ng-lean-management.html.
11 Vest JR, Gamm LD. A Cri� cal Review of the Research Literature on
Six Sigma, Lean and StuderGroup’s Hardwiring Excellence in the
United States: The Need to Demonstrate and Communicate the
Eff ec� veness of Transforma� on Strategies in Healthcare [Internet].
College Sta� on (TX): Texas A&M Health Science Center, School of
Rural Public Health, Department of Health Policy and Manage-
ment; 2009 Jul [cited 2013 Dec 18]. Available from: h� p://www.
implementa� onscience.com/content/4/1/35.
12 Cutler DM. NBER Working Paper Series: Where are the Health Care
Entrepreneurs? The Failure of Organiza� onal Innova� on in Health
Care. Cambridge (MA): Na� onal Bureau of Economic Research.
2010 May.
13 Offi ce of the A� orney General. Annual Report on Health Care Cost
Trends and Cost Drivers. Boston (MA): Offi ce of the A� orney Gen-
eral; 2010 Mar 16.
14 Kaplan RS, Porter ME. The Big Idea: How to Solve the Cost Crisis
in Health Care [Internet]. Cambridge (MA): Harvard Business Re-
view; 2011 Sep [cited 2013 Dec 18]. Available from: h� p://hbr.
org/2011/09/how-to-solve-the-cost-crisis-in-health-care/ar/1.
15 French KE, Albright HW, Frenzel JC, Incalcaterra JR, Rubio AC, Jones
JF, Feeley TW. Measuring the Value of Process Improvement Ini-
� a� ves in a Preopera� ve Assessment Center Using Time-Driven
Ac� vity-Based Cos� ng. Healthcare. 2013;1(3-4):136-142.
16 Robinson J. Hospitals Respond to Medicare Payment Shor� alls by
Both Shi! ing Costs and Cu" ng Them, Based on Market Concentra-
� on. Health Aff airs. 2011; 30(7):1265-1271.
17 Stensland J, Gaumer ZR, Miller ME. Private-Payer Profi ts Can In-
duce Nega� ve Medicare Margins. Health Aff airs. 2010; 29(5):1045-
1051.
18 Medicare Payment Advisory Commission. Report to the Congress:
Medicare Payment Policy. Washington (DC): Medicare Payment
Advisory Commission; 2009 Mar.

Spending Levels Spending Trends Delivery System Quality Performance and Access
36 Health Policy Commission
Wasteful spending in health care is important because
it represents spending that does not return value and in
some cases causes harm. According to the Organization
for Economic Co-operation and Development (OECD), the
United States spends approximately two-and-half times as
much on health care per capita as other industrialized na-
tions without a corresponding gain in outcomes. 1
Experts defi ne “wasteful spending” in many ways. In
this chapter, we defi ne wasteful spending as spending in
the provision of health services that could be eliminated
without harming consumers or reducing the quality of
care people receive.
We fi rst estimate the proportion of health care spend-
ing that can be considered wasteful. The results off er a
sense of the magnitude of potential savings that could be
achieved without any decrease in the quality of care. We
then examine a number of specifi c wasteful spending ar-
eas and for each provide an estimate of the dollars wasted.
3.1 Es� mate of wasteful spending in the system
A variety of approaches have been used to estimate
how much spending is wasteful in the U.S. health care sys-
tem (Table 3.1).2,3,4,5,6,7 The various approaches all estimate
several categories of waste: spending on services that lack
evidence of producing be! er health outcomes compared
with less-expensive alternatives; the provision of duplica-
tive or unnecessary health care goods and services; the un-
deruse of preventive care; and spending to treat avoidable
medical injuries and illnesses.
Using a similar approach, we estimate that waste-
ful spending in Massachuse! s was $14.7 to $26.9 billion
in 2012, representing 21 to 39 percent of total health care
spending (see Technical Appendix A3: Wasteful Spend-
3. Wasteful SpendingOf total health care spending in Massachuse� s, an es� mated 21 to 39 percent
($14.7 to $26.9 billion in 2012) could be considered wasteful.
Table 3.1: Es� mates of wasteful spending in the U.S. health care system
Percent of U.S. health care spending in year of es! mate
YearEs� -
mateTypes of wasteful spending examined Approach
PricewaterhouseCoo-pers
2005 54% Behavioral, clinical, and opera! onal ineffi -ciencies
Literature review, interviews with health in-dustry execu! ves and government offi cials, and survey of 1,000 US consumers
RAND Corpora! on 2008 50% Administra! ve, opera! onal, and clinical Meta-analysis of research on waste
McKinsey Global Ins! -tute
2008 31% Spending in excess of expected level of spending based on na! onal wealth
Comparison of health care spending and in-come by country
Ins! tute of Medicine 2012 30%
Unnecessary services, delivery ineffi ciencies, high prices, unnecessary administra! ve costs, missed preven! on opportuni! es, and fraud and abuse
Meta-analysis of literature; expert interviews
Berwick and Hackbarth JAMA ar! cle
2011 27%Overtreatment, failures of care delivery, fail-ures of care coordina! on, pricing failures, ad-ministra! ve complexity, and fraud and abuse
Meta-analysis of literature
NEHI 2008 27%
Emergency department overuse, an! bio! c overuse, pa! ent medica! on non-adherence, vaccine underuse, hospital readmissions, hospital admissions for ambulatory care sen-si! ve condi! ons, and medical errors
Meta-analysis of expert interviews, case stud-ies, and a review of relevant literature
S#$&'(: PricewaterhouseCoopers; RAND Corpora! on; McKinsey & Company; Ins! tute of Medicine; Journal of the American Medical Associa! on; NEHI; HPC analysis
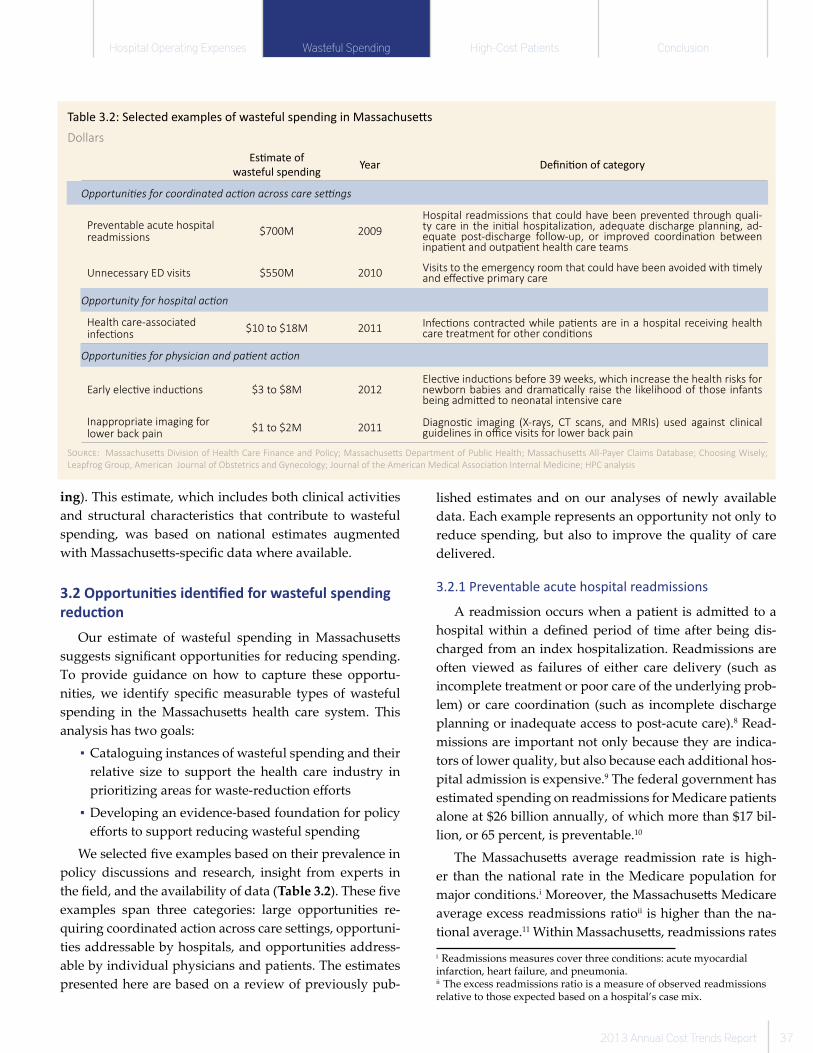
Hospital Operating Expenses Wasteful Spending High-Cost Patients Conclusion
2013 Annual Cost Trends Report 37
ing). This estimate, which includes both clinical activities
and structural characteristics that contribute to wasteful
spending, was based on national estimates augmented
with Massachuse! s-specifi c data where available.
3.2 Opportuni� es iden� fi ed for wasteful spending
reduc� on
Our estimate of wasteful spending in Massachuse! s
suggests signifi cant opportunities for reducing spending.
To provide guidance on how to capture these opportu-
nities, we identify specifi c measurable types of wasteful
spending in the Massachuse! s health care system. This
analysis has two goals:
▪ Cataloguing instances of wasteful spending and their
relative size to support the health care industry in
prioritizing areas for waste-reduction eff orts
▪ Developing an evidence-based foundation for policy
eff orts to support reducing wasteful spending
We selected fi ve examples based on their prevalence in
policy discussions and research, insight from experts in
the fi eld, and the availability of data (Table 3.2). These fi ve
examples span three categories: large opportunities re-
quiring coordinated action across care se! ings, opportuni-
ties addressable by hospitals, and opportunities address-
able by individual physicians and patients. The estimates
presented here are based on a review of previously pub-
lished estimates and on our analyses of newly available
data. Each example represents an opportunity not only to
reduce spending, but also to improve the quality of care
delivered.
3.2.1 Preventable acute hospital readmissions
A readmission occurs when a patient is admi! ed to a
hospital within a defi ned period of time after being dis-
charged from an index hospitalization. Readmissions are
often viewed as failures of either care delivery (such as
incomplete treatment or poor care of the underlying prob-
lem) or care coordination (such as incomplete discharge
planning or inadequate access to post-acute care).8 Read-
missions are important not only because they are indica-
tors of lower quality, but also because each additional hos-
pital admission is expensive.9 The federal government has
estimated spending on readmissions for Medicare patients
alone at $26 billion annually, of which more than $17 bil-
lion, or 65 percent, is preventable. 10
The Massachuse! s average readmission rate is high-
er than the national rate in the Medicare population for
major conditions.i Moreover, the Massachuse! s Medicare
average excess readmissions ratioii is higher than the na-
tional average.11 Within Massachuse! s, readmissions rates
i Readmissions measures cover three conditions: acute myocardial infarction, heart failure, and pneumonia.ii The excess readmissions ratio is a measure of observed readmissions relative to those expected based on a hospital’s case mix.
Table 3.2: Selected examples of wasteful spending in Massachuse! s
Dollars
Es" mate of
wasteful spendingYear Defi ni" on of category
Opportuni� es for coordinated ac� on across care se� ngs
Preventable acute hospital readmissions
$700M 2009
Hospital readmissions that could have been prevented through quali-ty care in the ini! al hospitaliza! on, adequate discharge planning, ad-equate post -discharge follow-up, or improved coordina! on between inpa! ent and outpa! ent health care teams
Unnecessary ED visits $550M 2010 Visits to the emergency room that could have been avoided with ! mely and eff ec! ve primary care
Opportunity for hospital ac� on
Health care-associated infec! ons
$10 to $18M 2011 Infec! ons contracted while pa! ents are in a hospital receiving health care treatment for other condi! ons
Opportuni� es for physician and pa� ent ac� on
Early elec! ve induc! ons $3 to $8M 2012Elec! ve induc! ons before 39 weeks, which increase the health risks for newborn babies and drama! cally raise the likelihood of those infants being admi# ed to neonatal intensive care
Inappropriate imaging for lower back pain
$1 to $2M 2011 Diagnos! c imaging (X-rays, CT scans, and MRIs) used against clinical guidelines in offi ce visits for lower back pain
S&'*+.: Massachuse# s Division of Health Care Finance and Policy; Massachuse# s Department of Public Health; Massachuse# s All-Payer Claims Database; Choosing Wisely;
Leapfrog Group, American Journal of Obstetrics and Gynecology; Journal of the American Medical Associa! on Internal Medicine; HPC analysis
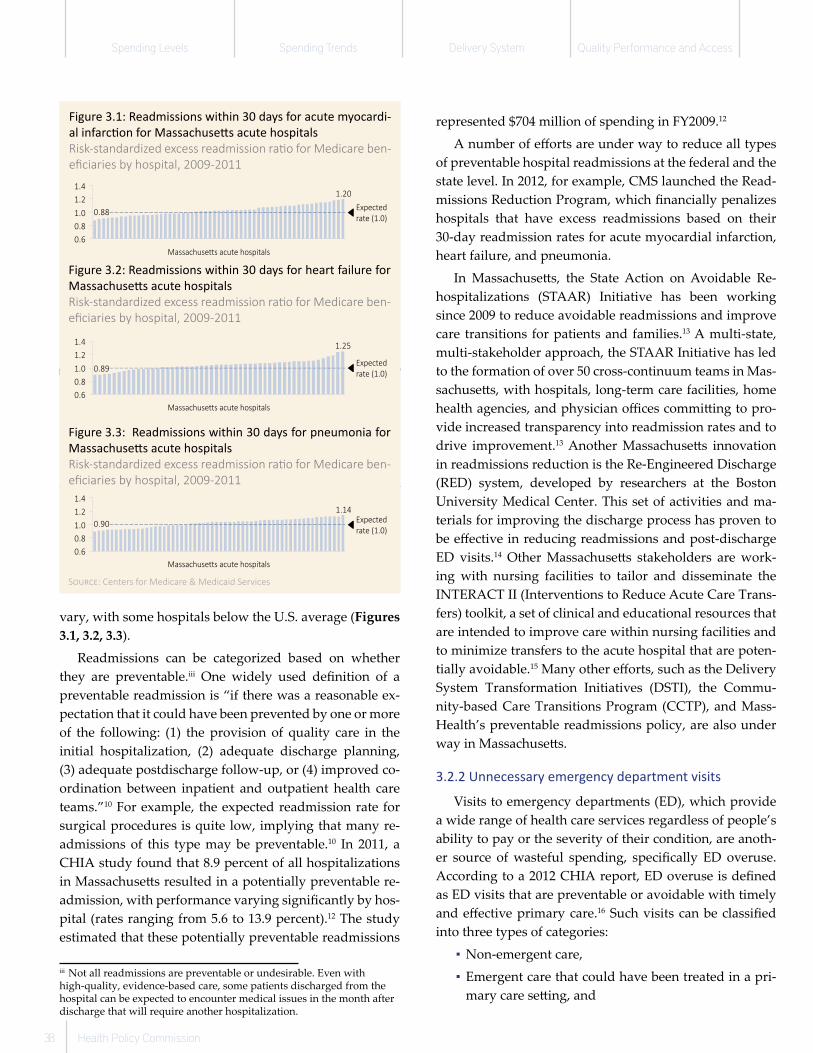
Spending Levels Spending Trends Delivery System Quality Performance and Access
38 Health Policy Commission
vary, with some hospitals below the U.S. average (Figures
3.1, 3.2, 3.3).
Readmissions can be categorized based on whether
they are preventable.iii One widely used defi nition of a
preventable readmission is “if there was a reasonable ex-
pectation that it could have been prevented by one or more
of the following: (1) the provision of quality care in the
initial hospitalization, (2) adequate discharge planning,
(3) adequate post discharge follow-up, or (4) improved co-
ordination between inpatient and outpatient health care
teams.”10 For example, the expected readmission rate for
surgical procedures is quite low, implying that many re-
admissions of this type may be preventable.10 In 2011, a
CHIA study found that 8.9 percent of all hospitalizations
in Massachuse! s resulted in a potentially preventable re-
admission, with performance varying signifi cantly by hos-
pital (rates ranging from 5.6 to 13.9 percent). 12 The study
estimated that these potentially preventable readmissions
iii Not all readmissions are preventable or undesirable. Even with high-quality, evidence-based care, some patients discharged from the hospital can be expected to encounter medical issues in the month after discharge that will require another hospitalization.
represented $704 million of spending in FY2009.12
A number of eff orts are under way to reduce all types
of preventable hospital readmissions at the federal and the
state level. In 2012, for example, CMS launched the Read-
missions Reduction Program, which fi nancially penalizes
hospitals that have excess readmissions based on their
30-day readmission rates for acute myocardial infarction,
heart failure, and pneumonia.
In Massachuse! s, the State Action on Avoidable Re-
hospitalizations (STAAR) Initiative has been working
since 2009 to reduce avoidable readmissions and improve
care transitions for patients and families. 13 A multi-state,
multi-stakeholder approach, the STAAR Initiative has led
to the formation of over 50 cross-continuum teams in Mas-
sachuse! s, with hospitals, long-term care facilities, home
health agencies, and physician offi ces commi! ing to pro-
vide increased transparency into readmission rates and to
drive improvement.13 Another Massachuse! s innovation
in readmissions reduction is the Re-Engineered Discharge
(RED) system, developed by researchers at the Boston
University Medical Center. This set of activities and ma-
terials for improving the discharge process has proven to
be eff ective in reducing readmissions and post-discharge
ED visits.14 Other Massachuse! s stakeholders are work-
ing with nursing facilities to tailor and disseminate the
INTERACT II (Interventions to Reduce Acute Care Trans-
fers) toolkit, a set of clinical and educational resources that
are intended to improve care within nursing facilities and
to minimize transfers to the acute hospital that are poten-
tially avoidable.15 Many other eff orts, such as the Delivery
System Transformation Initiatives (DSTI), the Commu-
nity-based Care Transitions Program (CCTP), and Mass-
Health’s preventable readmissions policy, are also under
way in Massachuse! s.
3.2.2 Unnecessary emergency department visits
Visits to emergency departments (ED), which provide
a wide range of health care services regardless of people’s
ability to pay or the severity of their condition, are anoth-
er source of wasteful spending, specifi cally ED overuse.
According to a 2012 CHIA report, ED overuse is defi ned
as ED visits that are preventable or avoidable with timely
and eff ective primary care. 16 Such visits can be classifi ed
into three types of categories:
▪ Non-emergent care,
▪ Emergent care that could have been treated in a pri-
mary care se! ing, and
Figure 3.1: Readmissions within 30 days for acute myocardi-
al infarc! on for Massachuse" s acute hospitals
Risk-standardized excess readmission ra� o for Medicare ben-
efi ciaries by hospital, 2009-2011
���
���
��
��
��
��
�
�����������������������������
!"�����
�����#��$
��
��
�!
��
�
�
"
� �� ��������� ����������� ��
#$������
� ���%�&
���
���
�
�!
��
�
��
� �� ��������� ����������� ��
"#������
� ���$��%
S!"#$%: Centers for Medicare & Medicaid Services
Figure 3.3: Readmissions within 30 days for pneumonia for
Massachuse" s acute hospitals
Risk-standardized excess readmission ra� o for Medicare ben-
efi ciaries by hospital, 2009-2011
Figure 3.2: Readmissions within 30 days for heart failure for
Massachuse" s acute hospitals
Risk-standardized excess readmission ra� o for Medicare ben-
efi ciaries by hospital, 2009-2011
Hospital Operating Expenses Wasteful Spending High-Cost Patients Conclusion
2013 Annual Cost Trends Report 39
▪ Emergent care that requires an ED se! ing but that
could have been prevented or avoided through earli-
er intervention.
These three categories of overuse account for approxi-
mately half of the total ED visits in Massachuse! s. Eff ec-
tive interventions are needed to reduce the estimated $558
million in spending associated with preventable ED visits
in Massachuse! s in 2012.16
A number of potential interventions may reduce un-
necessary ED utilization. Some of these involve increased
access to primary care, through eff orts like scope of prac-
tice changes, expansion of limited service clinics, work-
force development, and development of patient-centered
medical homes.iv Other interventions involve be! er man-
agement of those with chronic conditions who experience
acute exacerbations requiring urgent a! ention. Account-
able care models that promote be! er population health
management, reward care coordination, and provide for
be! er transitions of care have the potential to reduce this
segment of ED use.
3.2.3 Health care-associated infec� ons
Patients can sometimes contract an infection while they
are in a hospital receiving health care treatment for oth-
er conditions – often referred to as nosocomial or health
care-associated infections (HAIs). 17 In the United States, an
estimated 1.7 million hospital patients – 4.5 out of every
100 admissions – experience HAIs, which cause or contrib-
ute to the deaths of nearly 100,000 people annually.17 The
most frequent type of HAI in the United States is urinary
tract infection (36 percent of all HAIs), followed by surgi-
cal site infection (20 percent), and central line-associated
bloodstream infection and ventilator-associated pneumo-
nia (both 11 percent).17 These HAIs can greatly harm the
health of patients, sometimes requiring years of follow-up
treatment, multiple surgeries, and permanent disability.
The ideal benchmark for HAIs is zero. While reduction
eff orts have successfully brought the occurrences of HAIs
in Massachuse! s down over the past few years, hundreds
of these infections are still reported annually.18 We es-
iv Chapter 224 includes a number of reforms to improve access to primary care. The law expands the defi nition of primary care provider to include nurse practitioners and physician assistants and broadens the scope of practice for nurse practitioners in limited service clinics. In addition, it includes three programs to develop a broader primary care workforce: loan forgiveness for providers who care for underserved populations; grants to promote residency programs at community health centers; and grants for providers serving at a community health center. Chapter 224 also charges the Commission with the certifi cation of patient-centered medical homes.
timate that these HAIs represented $10 to $18 million of
wasteful spending in 2011.
3.2.4 Elec� ve induc� on of labor before 39 weeks
When a woman is nearing the end of a pregnancy, she
may have her labor induced rather than waiting for it to
begin on its own. Labor induction is indicated when there
are health concerns for the mother and/or child. But when
the reason is non-medical, such as ma! ers of convenience
or preference, it is an elective labor induction. Evidence
shows that elective inductions before 39 weeks increase
the health risks for newborn babies and dramatically raise
the likelihood of those infants being admi! ed to neona-
tal intensive care. In addition to these health concerns,
early elective inductions also generate higher medical ex-
penditures due to increased rates of costly Cesarean sec-
tions (C-sections) and neonatal intensive care unit (NICU)
stays.19
5.9 percent of all births in Massachuse! s were early
elective inductions in 2012.20 Although this rate is signifi -
cantly improved from prior performance due to concerted
eff orts around the nation and in Massachuse! s, there is
still further room for improvement. We estimate that re-
ducing this rate could save $3 to $8 million per year from a
corresponding decrease in NICU stays.
Evidence from interventions piloted in certain hospitals
suggests lower rates are feasible. A 2010 study of hospitals
that implemented programs to reduce elective inductions
found it possible to achieve rates of 1.7 to 4.3 percent,
depending on whether the hospital implemented a “soft
stop” policy –- in which physicians were discouraged
from elective inductions, but compliance was not enforced
– or a “hard stop” policy barring any elective induction. 21
3.2.5 Overuse of diagnos� c imaging for acute lower back
pain
Nationally, acute lower back pain is the second-most
common symptomatic reason for offi ce visits to prima-
ry care physicians, and it is the most common reason for
offi ce visits to orthopedic surgeons, neurosurgeons, and
occupational medicine physicians.22 In many of these vis-
its, patients receive an x-ray, CT scan, or MRI to diagnose
the issue. But evidence shows that, within six weeks, 90
percent of episodes will resolve eff ectively regardless of
whether patients receive an imaging test. Furthermore,
these tests often trigger unnecessary interventions and
lead to additional procedures that complicate recovery.23

Spending Levels Spending Trends Delivery System Quality Performance and Access
40 Health Policy Commission
Our analysis of claims data shows that 21 percent of
Massachuse! s patients with uncomplicated lower back
pain received imaging studies against guidelines.v Inap-
propriate imaging studies for these diagnoses represent
$1 to $2 million in annual spending. The cost of unneces-
sary care that can follow an imaging study may generate
additional wasteful spending. Moreover, inappropriate
imaging for other conditions may represent additional op-
portunities.
3.3 Conclusion
Analysis of wasteful spending in Massachuse! s sug-
gests that the magnitude of waste is 21 to 39 percent of per-
sonal health care expenditures, or $14.9 to $27.5 billion in
2012. Reducing wasteful spending represents an import-
ant opportunity to slow the growth in health care expen-
ditures for Massachuse! s residents. Already, many eff orts
are under way across the nation to identify and address
specifi c areas of clinical waste.vi As these eff orts take shape,
it will be important to ensure that investments made gen-
erate a suffi cient return in the form of lower spending and
that the savings generated translate into lower premiums,
shared with the households and businesses that purchase
health care.
References
1 Organiza� on of Economic Coopera� on and Development. OECD
Health Data 2013: How Does the United States Compare. Paris
(FR): Organiza� on of Economic Coopera� on and Development;
2013 Jun.
2 PricewaterhouseCooper Health Research Ins� tute. The Price of
Excess: Iden� fying Waste in Healthcare Spending. New York (NY):
PricewaterhouseCoopers; 2010.
3 Bentley TG, Eff ros RM, Palar K, Keeler EB. Waste in the U.S. Health
Care System: A Conceptual Framework. Milbank Quarterly. 2008
Dec;86(4):629-659.
4 Farrell D, Jenson E, Kocher B, Lovegrove N, Melham F, Mendonca
L, Parish B. Accoun� ng for the Cost of US Health Care: A New Look
at Why Americans Spend More. New York (NY): McKinsey Global
Ins� tute, McKinsey & Company; 2008 Dec.
v Based on analysis of Medicare and commercial claims in the All-Payer Claims Database. Inappropriate imaging for lower back pain was identi-fi ed using Optum’s Evidence-Based Medicine (EBM) algorithms.vi Examples include eff orts led by the National Priorities Partnership, the ABIM Choosing Wisely Campaign, the Institute for Clinical Systems Improvement (ICSI), and the Institute for Healthcare Improvement (IHI). These groups produce guidelines and lists of medical services and treatments that do not represent evidence-based practice.
5 Young PL, Olsen L. The Healthcare Impera� ve: Lowering Costs and
Improving Outcomes: Workshop Series Summary. Washington
(DC): Ins� tute of Medicine; 2010.
6 Berwick DM, Hackbarth AD. Elimina� ng Waste in U.S. Health Care.
Journal of the American Medical Associa� on. 2012;307(14):1513-
1516.
7 NEHI. How Many More Studies Will It Take? Cambridge (MA):
NEHI; 2008 Nov 25.
8 Halfon P, Eggli Y, Pretre-Rohrbach I, Meylan D, Marazzi A, Bernard
B. Valida� on of the Poten� ally Avoidable Hospital Readmission
Rate as a Rou� ne Indicator of the Quality Of Hospital Care. Med
Care. 2006;44(11):972-981.
9 Anderson GF, Steinberg EP. Hospital Readmissions in the Medicare
Popula� on. New England Journal of Medicine. 1984;311(21):1349-
1353.
10 Goldfi eld NI, McCullough EC, Hughes JS, Tang AM, Eastman B, Raw-
lins LK, Averill RF. Iden� fying Poten� ally Avoidable Preventable Re-
admissions. Health Care Financing Review. 2008;30(1):75-91.
11 Centers for Medicare & Medicaid Services. Hospital Compare [In-
ternet]. Washington (DC): Centers for Medicare & Medicaid Ser-
vices; [cited 2013 Dec 18]. Available from: h" p://www.medicare.
gov/hospitalcompare/search.html.
12 Massachuse" s Division of Health Care Finance and Policy. Chal-
lenges in Coordina� on of Health Care Services [Internet]. Boston
(MA): Massachuse" s Division of Health Care Finance and Policy;
2011 Jun 30 [cited 2013 Dec 18]. Available from: h" p://www.
mass.gov/chia/docs/cost-trend-docs/cost-trends-docs-2011/ec-
cleston-stacey-june-30.pdf.
13 Massachuse" s Coali� on for the Preven� on of Medical Errors and
the Massachuse" s Hospital Associa� on. Reducing Readmissions:
Highlights from Massachuse" s STAAR Cross-Con� nuum Teams
[Internet]. Boston (MA): Massachuse" s Coali� on for the Preven-
� on of Medical Errors and the Massachuse" s Hospital Associa-
� on; [cited 2013 Dec 18]. Available from: h" p://www.macoali� on.
org/Ini� a� ves/ma-staar2012/STAAR-CCT%20Storybook%20High-
lights%202012.pdf.
14 Jack B, Paasche-Orlow M, Mitchell S, Forsythe S, Mar� n J, Brach
C. Re-Engineered Discharge (RED) Toolkit [Internet]. Boston (MA)
and Washington (DC): Agency for Healthcare Research and Quali-
ty; [cited 2013 Dec 18]. Available from: h" p://www.ahrq.gov/pro-
fessionals/systems/hospital/toolkit/.
15 Massachuse" s Senior Care Founda� on. Studies in Progress: Inter-
ven� ons to Reduce Acute Care Transfers (INTERACT II) [Internet].
Boston (MA): Massachuse" s Senior Care Founda� on; [cited 2013
Dec 18]. Available from: h" p://www.maseniorcarefounda� on.
org/research/studies_in_progress.aspx.
16 Massachuse" s Division of Health Care Finance and Policy. Massa-
chuse" s Health Care Cost Trends: Effi ciency of Emergency Depart-
ment U� liza� on in Massachuse" s. Boston (MA): Massachuse" s
Division of Health Care Finance and Policy; 2012 Aug.
Hospital Operating Expenses Wasteful Spending High-Cost Patients Conclusion
2013 Annual Cost Trends Report 41
17 Ins� tute for Healthcare Improvement. What Zero Looks Like: Elimi-
na� ng Hospital-Acquired Infec� ons [Internet]. Cambridge (MA): In-
s� tute for Healthcare Improvement; [cited 2013 Dec 18]. Available
from: h� p://www.ihi.org/knowledge/Pages/ImprovementStories/
WhatZeroLooksLikeElimina� ngHospitalAcquiredInfec� ons.aspx.
18 Massachuse� s Department of Public Health. Massachuse� s 2012
HAI Data Update: Statewide Hospitals Summary. Boston (MA):
Massachuse� s Department of Public Health; 2013 Jun.
19 Osterman M, Mar� n J. Na� onal Center for Health Sta� s� cs Data
Brief: Changes in Cesarean Delivery Rates by Gesta� onal Age: Unit-
ed States, 1996–2011. Washington (DC): Centers for Disease Con-
trol and Preven� on; 2013 Jun.
20 The Leapfrog Group. Hospital Rates of Early Scheduled Deliveries
[Internet]. Washington (DC): The Leapfrog Group; [cited 2013 Dec
18]. Available from: h� p://www.leapfroggroup.org/tooearlydeliv-
eries.
21 Clark ST, Frye DR, Meyers JA, Belfort MA, Dildy GA, Koff ord S,
Englebright J, Perlin JA. Reduc� on in Elec� ve Delivery at <39
Weeks of Gesta� on: Compara� ve Eff ec� veness of 3 Approaches
to Change and the Impact on Neonatal Intensive Care Admission
and S� llbirth. American Journal of Obstetrics and Gynecology.
2010;203(5):449.e1-6.
22 Chiodo AE, Alvarez DJ, Graziano GP, Haig AJ, Van Harrison R, Park
P, Standiford CJ, Wasserman RA. Acute Low Back Pain: Guidelines
for Clinical Care. Ann Arbor (MI): University of Michigan Quality
Management Program – Faculty Group Prac� ce; 2010 Jan.
23 Goertz M, Thorson D, Bonte B, Campbell R, Haake B, Johnson K,
Kramer C, Mueller B, Peterson S, Se� erlund L, Timming R. Health
Care Guideline: Adult Acute and Subacute Low Back Pain [Inter-
net]. Bloomington (IN): Ins� tute for Clinical Systems Improvement;
2012 Nov [cited 2013 Dec 18]. Available from: h� ps://www.icsi.
org/_asset/bjvqrj/LBP.pdf.

Spending Levels Spending Trends Delivery System Quality Performance and Access
42 Health Policy Commission
One-fourth of all patients represent over 85 percent
of total expenditures in the U.S. health care system.1 This
group includes many medically complex patients, for
whom improved management may yield be! er outcomes
at lower costs. Accurately identifying and focusing inter-
ventions for this population has the potential to produce
savings and quality returns on investment. For example,
reducing the spending for this population by 3.5 percent
would save an equivalent amount as a 20 percent reduc-
tion for the other three-fourths of the population.
In this chapter, we defi ne “high-cost patients” as the
top fi ve percent of patients in our sample by spending in
a given year and “persistently high-cost patients” as high-
cost patients who remain in the top fi ve percent the follow-
ing year.i,ii Since their costs recur in multiple years, per-
sistently high-cost patients may be easier to identify and
their high costs present a larger savings opportunity.
The sample for this analysis covers patients enrolled
with Medicare and with the three largest commercial Mas-
sachuse! s payers. This sample does not include Medicaid
or pharmacy costs due to current data limitations. Given
the known concentration of Medicaid spending among
certain groups of benefi ciaries, such as disabled adults and
seniors, future analysis of Medicaid data is of particular
interest to the Commission.2
In this chapter, we fi rst analyze the concentration of
spending in Massachuse! s, the persistence of spending
i We defi ne high-cost based on level of spending in claims-based medical expenditures. Higher spending may be due to greater med-ical complexity, higher utilization, or use of higher-priced providers (provider mix).ii The sample was limited to patients who had at least six months of enrollment in both 2010 and 2011 and costs of at least $1 in each year. Figures do not capture pharmacy costs, payments outside the claims system, Medicare cost-sharing, or end-of-life care for patients who died in 2010 or 2011.
among high-cost patients, and the characteristics and pre-
dictors of high-cost and persistently high-cost patients.
Next, we provide examples of interventions and strategies
intended to reduce costs for high-cost and persistently
high-cost patients.
4.1 Concentra� on of spending
In 2010 in Massachuse! s, high-cost patients accounted
for 45 percent of spending among the commercial popula-
tion and 42 percent among the Medicare population (Ta-
ble 4.1). National results for all-payer data show a compa-
rable concentration of spending.1 Spending for the average
high-cost patient in 2010 was 13.8 times greater than the
average for all other patients among the Medicare popula-
tion; the comparable fi gure was 15.6 times greater among
the commercial population.
4. High-Cost Pa� ents
Five percent of pa� ents account for nearly half of all spending among the Medicare
and commercial popula� ons in Massachuse� s. Of these pa� ents, 29 percent
remain in the top fi ve percent by spending the following year.
Table 4.1: Spending concentra! on in Massachuse" s
Claims-based expenditures (excluding pharmacy spending),
dollars, 2010
Medicare Commercial
Expendi-
tures*
Percent
of total
expendi-
tures
Expendi-
tures*
Percent
of total
expendi-
tures
Top 1% $99,600 15.3% $48,900 22.4%
Top 5% $45,800 42.0% $16,500 45.0%
Top 10% $26,900 60.1% $9,600 58.6%
Top 20% $11,000 78.1% $4,900 73.3%
Top 50% $2,600 94.5% $1,600 91.8%
*Minimum expenditures for pa� ent in that group.
S!"#&': All-Payer Claims Database; HPC analysis
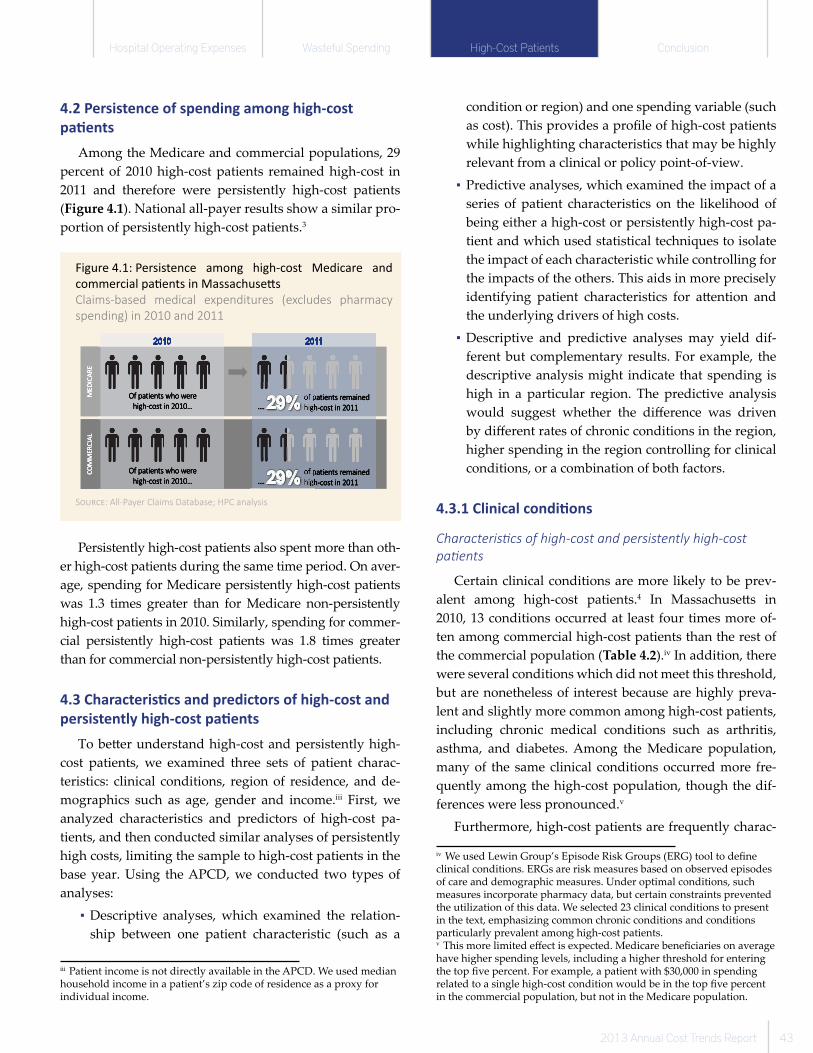
Hospital Operating Expenses Wasteful Spending High-Cost Patients Conclusion
2013 Annual Cost Trends Report 43
4.2 Persistence of spending among high-cost
pa� ents
Among the Medicare and commercial populations, 29
percent of 2010 high-cost patients remained high-cost in
2011 and therefore were persistently high-cost patients
(Figure 4.1). National all-payer results show a similar pro-
portion of persistently high-cost patients.3
Persistently high-cost patients also spent more than oth-
er high-cost patients during the same time period. On aver-
age, spending for Medicare persistently high-cost patients
was 1.3 times greater than for Medicare non-persistently
high-cost patients in 2010. Similarly, spending for commer-
cial persistently high-cost patients was 1.8 times greater
than for commercial non-persistently high-cost patients.
4.3 Characteris� cs and predictors of high-cost and
persistently high-cost pa� ents
To be! er understand high-cost and persistently high-
cost patients, we examined three sets of patient charac-
teristics: clinical conditions, region of residence, and de-
mographics such as age, gender and income.iii First, we
analyzed characteristics and predictors of high-cost pa-
tients, and then conducted similar analyses of persistently
high costs, limiting the sample to high-cost patients in the
base year. Using the APCD, we conducted two types of
analyses:
▪ Descriptive analyses, which examined the relation-
ship between one patient characteristic (such as a
iii Patient income is not directly available in the APCD. We used median household income in a patient’s zip code of residence as a proxy for individual income.
condition or region) and one spending variable (such
as cost). This provides a profi le of high-cost patients
while highlighting characteristics that may be highly
relevant from a clinical or policy point-of-view.
▪ Predictive analyses, which examined the impact of a
series of patient characteristics on the likelihood of
being either a high-cost or persistently high-cost pa-
tient and which used statistical techniques to isolate
the impact of each characteristic while controlling for
the impacts of the others. This aids in more precisely
identifying patient characteristics for a! ention and
the underlying drivers of high costs.
▪ Descriptive and predictive analyses may yield dif-
ferent but complementary results. For example, the
descriptive analysis might indicate that spending is
high in a particular region. The predictive analysis
would suggest whether the diff erence was driven
by diff erent rates of chronic conditions in the region,
higher spending in the region controlling for clinical
conditions, or a combination of both factors.
4.3.1 Clinical condi� ons
Characteris� cs of high-cost and persistently high-cost
pa� ents
Certain clinical conditions are more likely to be prev-
alent among high-cost patients.4 In Massachuse! s in
2010, 13 conditions occurred at least four times more of-
ten among commercial high-cost patients than the rest of
the commercial population (Table 4.2).iv In addition, there
were several conditions which did not meet this threshold,
but are nonetheless of interest because are highly preva-
lent and slightly more common among high-cost patients,
including chronic medical conditions such as arthritis,
asthma, and diabetes. Among the Medicare population,
many of the same clinical conditions occurred more fre-
quently among the high-cost population, though the dif-
ferences were less pronounced.v
Furthermore, high-cost patients are frequently charac-
iv We used Lewin Group’s Episode Risk Groups (ERG) tool to defi ne clinical conditions. ERGs are risk measures based on observed episodes of care and demographic measures. Under optimal conditions, such measures incorporate pharmacy data, but certain constraints prevented the utilization of this data. We selected 23 clinical conditions to present in the text, emphasizing common chronic conditions and conditions particularly prevalent among high-cost patients.v This more limited eff ect is expected. Medicare benefi ciaries on average have higher spending levels, including a higher threshold for entering the top fi ve percent. For example, a patient with $30,000 in spending related to a single high-cost condition would be in the top fi ve percent in the commercial population, but not in the Medicare population.
��������
��������
��������
��������
'���������
'���������
'���������
'���������
�,(-'&.,
�,(-'&.,
�,(-'&.,
�,(-'&.,
'/��,.'-&0
'/��,.'-&0
'/��,.'-&0
'/��,.'-&0
���������� �������������������� �������������������� �������������������� ����������
���������������������� ����� !�� ����� !�� ����� !�� ����� !
���������� �������������������� �������������������� �������������������� ����������
���������������������� ����� !�� ����� !�� ����� !�� ����� !
/��������� ����������/��������� ����������/��������� ����������/��������� ����������
���������������������� ����� !!1�� ����� !!1�� ����� !!1�� ����� !!1
/��������� ����������/��������� ����������/��������� ����������/��������� ����������
���������������������� ����� !!1�� ����� !!1�� ����� !!1�� ����� !!1
1�1�1�1�
1�1�1�1�
S�����: All-Payer Claims Database; HPC analysis
Figure 4.1: Persistence among high-cost Medicare and
commercial pa! ents in Massachuse" s
Claims-based medical expenditures (excludes pharmacy
spending) in 2010 and 2011
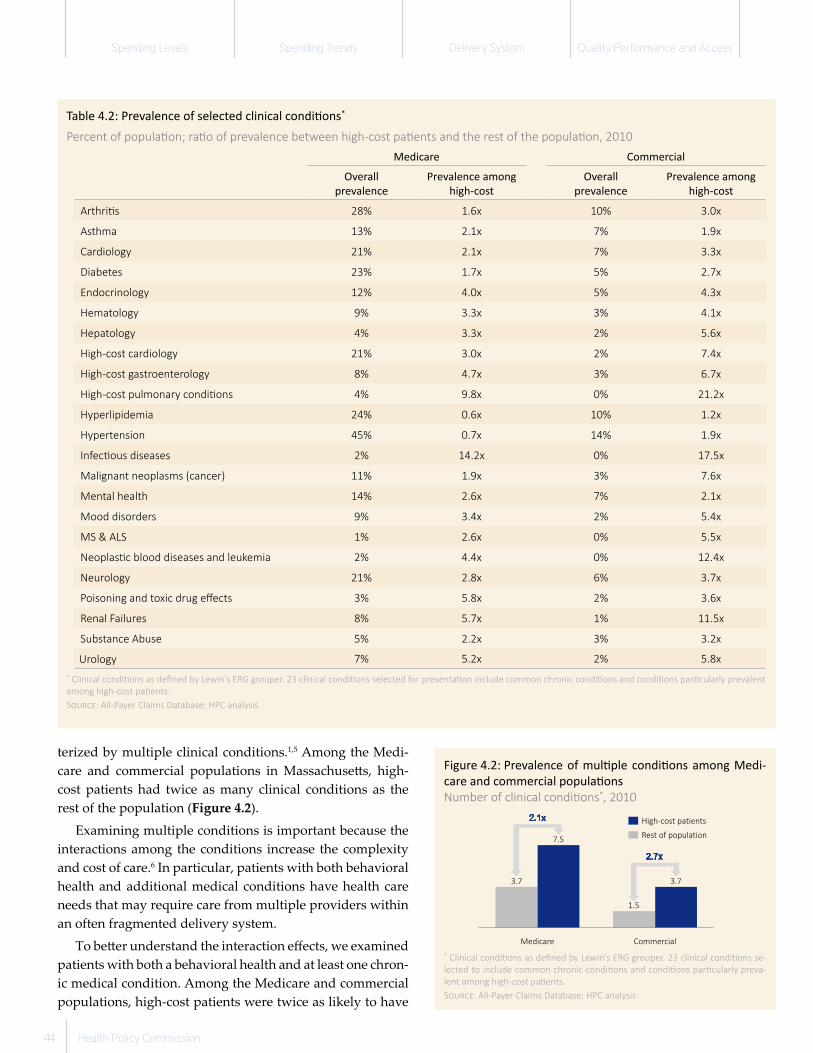
Spending Levels Spending Trends Delivery System Quality Performance and Access
44 Health Policy Commission
Table 4.2: Prevalence of selected clinical condi� ons*
Percent of popula� on; ra� o of prevalence between high-cost pa� ents and the rest of the popula� on, 2010
Medicare Commercial
Overall
prevalence
Prevalence among
high-cost
Overall
prevalence
Prevalence among
high-cost
Arthri� s 28% 1.6x 10% 3.0x
Asthma 13% 2.1x 7% 1.9x
Cardiology 21% 2.1x 7% 3.3x
Diabetes 23% 1.7x 5% 2.7x
Endocrinology 12% 4.0x 5% 4.3x
Hematology 9% 3.3x 3% 4.1x
Hepatology 4% 3.3x 2% 5.6x
High-cost cardiology 21% 3.0x 2% 7.4x
High-cost gastroenterology 8% 4.7x 3% 6.7x
High-cost pulmonary condi� ons 4% 9.8x 0% 21.2x
Hyperlipidemia 24% 0.6x 10% 1.2x
Hypertension 45% 0.7x 14% 1.9x
Infec� ous diseases 2% 14.2x 0% 17.5x
Malignant neoplasms (cancer) 11% 1.9x 3% 7.6x
Mental health 14% 2.6x 7% 2.1x
Mood disorders 9% 3.4x 2% 5.4x
MS & ALS 1% 2.6x 0% 5.5x
Neoplas� c blood diseases and leukemia 2% 4.4x 0% 12.4x
Neurology 21% 2.8x 6% 3.7x
Poisoning and toxic drug eff ects 3% 5.8x 2% 3.6x
Renal Failures 8% 5.7x 1% 11.5x
Substance Abuse 5% 2.2x 3% 3.2x
Urology 7% 5.2x 2% 5.8x
* Clinical condi� ons as defi ned by Lewin’s ERG grouper. 23 clinical condi� ons selected for presenta� on include common chronic condi� ons and condi� ons par� cularly prevalent
among high-cost pa� ents.
S#$'+/: All-Payer Claims Database; HPC analysis
�
!" !"
"
#�����������������
$��%&�������������
'�����������������
* Clinical condi� ons as defi ned by Lewin’s ERG grouper. 23 clinical condi� ons se-
lected to include common chronic condi� ons and condi� ons par� cularly preva-
lent among high-cost pa� ents.
S#$'+/: All-Payer Claims Database; HPC analysis
Figure 4.2: Prevalence of mul� ple condi� ons among Medi-
care and commercial popula� ons
Number of clinical condi� ons*, 2010
terized by multiple clinical conditions.1,5 Among the Medi-
care and commercial populations in Massachuse! s, high-
cost patients had twice as many clinical conditions as the
rest of the population (Figure 4.2).
Examining multiple conditions is important because the
interactions among the conditions increase the complexity
and cost of care.6 In particular, patients with both behavioral
health and additional medical conditions have health care
needs that may require care from multiple providers within
an often fragmented delivery system.
To be! er understand the interaction eff ects, we examined
patients with both a behavioral health and at least one chron-
ic medical condition. Among the Medicare and commercial
populations, high-cost patients were twice as likely to have

Hospital Operating Expenses Wasteful Spending High-Cost Patients Conclusion
2013 Annual Cost Trends Report 45
a both a behavioral health and a chronic medical condi-
tion as the rest of the population. Comparing spending
levels, the simultaneous presence of a behavioral health
and a chronic medical condition was associated with an
increase in spending beyond the simple combination of
the two conditions’ independent eff ects (Figure 4.3).vi This
increase in spending indicates the enhanced complexity
that occurs when dealing with multiple, interacting con-
ditions.vii,7
vi For example, among the Medicare population, a patient with only a behavioral health condition spent 2.2 times the average spending for a patient with no comorbidities, and a patient with only a chronic medical condition 2.8 times. The combination of these would suggest a 2.2 x 2.8 = 6.2 factor for increased spending for those with both types of conditions if there were no interactions among the conditions. Due to interactions, though, patients with both types of conditions had 7.0 times the average spending of patients with neither type of condition.vii This claims-based analysis describes the impact on patients who have been identifi ed and treated for both a behavioral health and a chronic medical condition. In addition, studies have shown that untreated behavioral health disorders lead to complications for physical health care issues and also result in higher spending. Moreover, individuals with serious behavioral health issues live, on average, 25 years less than individuals without behavioral health issues in part due to untreated medical physical medical conditions. The eff ect of the interacting condi-tions in these circumstances is not captured by our analysis.
Predictors of being high-cost and
persistently high-cost pa� ents
There were 13 clinical condi-
tions that more than doubled the
likelihood of being high-cost in
the Medicare population, and 17
conditions that had this large of
an eff ect in the commercial popu-
lation (Table 4.3).viii These clinical
conditions include some with rel-
atively high prevalence rates, such
as arthritis and cardiology, and
others with low prevalence rates,
such as leukemia and cancer.
Moreover, the presence of mul-
tiple conditions increased the like-
lihood of being high-cost even be-
yond the combined eff ects of the
individual conditions. For exam-
ple, the chances that a Medicare
patient with both a behavioral
health and a chronic medical con-
dition was high-cost were 50 per-
cent greater than would be pre-
dicted by the simple combination
of the individual conditions.
While the eff ects were more muted, many of the same
conditions that predicted a patient being high-cost in the
current year also raised the likelihood that the patient
would be high-cost in the next year.
Other than cancers and multiple sclerosis among the
commercial population, no single clinical condition dou-
bled the likelihood of being a persistently high-cost pa-
tient. However, combinations of conditions were powerful
predictors of persistence. For example, for a commercial
high-cost patient with three or more clinical conditions,
the likelihood of being persistently high-cost was 1.4 times
greater than would be expected based on a simple combi-
nation of the individual eff ects.
4.3.2 Region of residence
Loca� on of high-cost and persistently high-cost pa� ents
Descriptive analysis of concentration of high-cost pa-
tients by patient residence showed modest diff erences by
region among both the Medicare and commercial popu-
viii Results control for age, sex, region of residence, income, other clinical conditions, and interactions among conditions.
��������
��������
��������
��������
�������
�������
�������
�������
�� ��������� ��������� ��������� ������� ���� ���� ���� ���� ����
��������������������������������
�� ��� ��� ��� �
����������������������������������������
� ������ ������ ������ �������������������������������������
��������������������������������
������������������� �������������������� �������������������� �������������������� �
���� ��������������� ��������������� ��������������� �����������
��������
��������
��������
��������
���������
���������
���������
���������
"�������������%� �����"������%-%��-�������-������������ ���������/0.0���/0..#�
Figure 4.3: Average spending per pa! ent based on behavioral health and chronic con-
di! on comorbidi! es
Claims-based medical expenditures (excludes pharmacy spending) rela� ve to average
pa� ent with no behavioral health or chronic condi� on comorbidity in 2010
*Behavioral health comorbidity includes child psychology, severe and persistent mental illness, mental health, psychi-
atry, and substance abuse.† Chronic condi� on includes arthri� s, epilepsy, glaucoma, hemophilia, sickle-cell anemia, heart disease, HIV/AIDS,
hyperlipidemia, hypertension, mul� ple sclerosis, renal, asthma, and diabetes.
S!"#$%: All-Payer Claims Database; HPC analysis
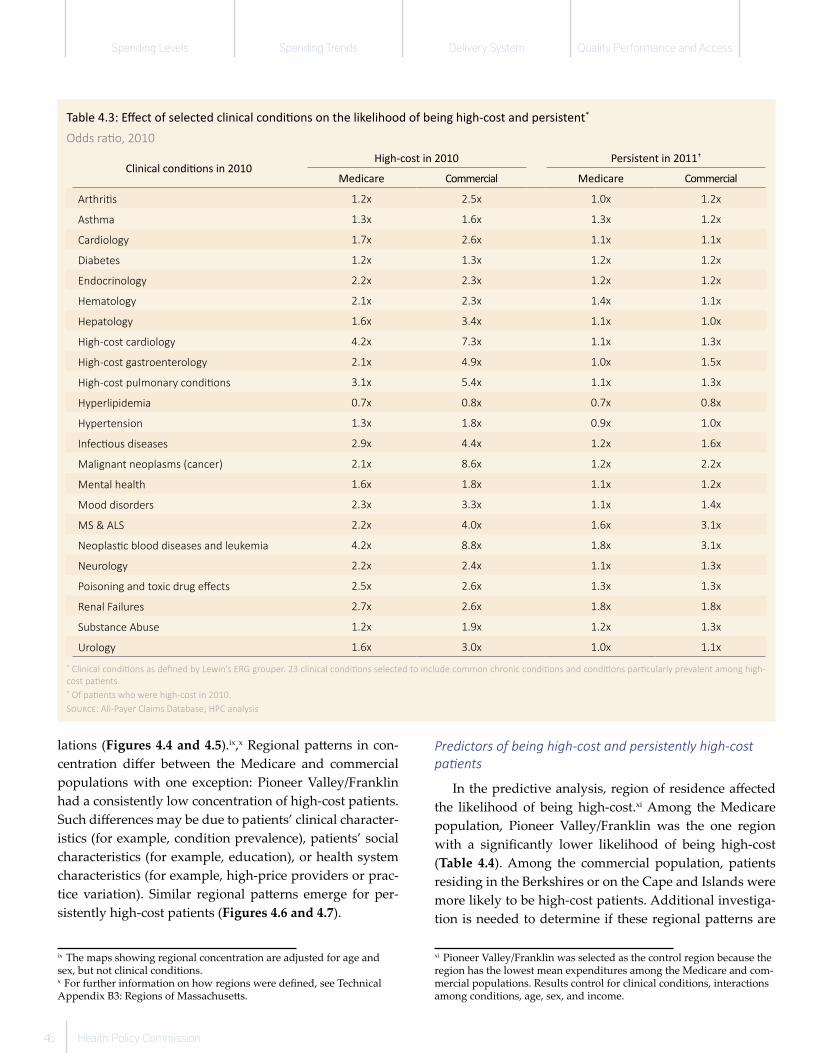
Spending Levels Spending Trends Delivery System Quality Performance and Access
46 Health Policy Commission
lations (Figures 4.4 and 4.5).ix,x Regional pa! erns in con-
centration diff er between the Medicare and commercial
populations with one exception: Pioneer Valley/Franklin
had a consistently low concentration of high-cost patients.
Such diff erences may be due to patients’ clinical character-
istics (for example, condition prevalence), patients’ social
characteristics (for example, education), or health system
characteristics (for example, high-price providers or prac-
tice variation). Similar regional pa! erns emerge for per-
sistently high-cost patients (Figures 4.6 and 4.7).
ix The maps showing regional concentration are adjusted for age and sex, but not clinical conditions.x For further information on how regions were defi ned, see Technical Appendix B3: Regions of Massachuse! s.
Predictors of being high-cost and persistently high-cost
pa� ents
In the predictive analysis, region of residence aff ected
the likelihood of being high-cost.xi Among the Medicare
population, Pioneer Valley/Franklin was the one region
with a signifi cantly lower likelihood of being high-cost
(Table 4.4). Among the commercial population, patients
residing in the Berkshires or on the Cape and Islands were
more likely to be high-cost patients. Additional investiga-
tion is needed to determine if these regional pa! erns are
xi Pioneer Valley/Franklin was selected as the control region because the region has the lowest mean expenditures among the Medicare and com-mercial populations. Results control for clinical conditions, interactions among conditions, age, sex, and income.
Table 4.3: Eff ect of selected clinical condi� ons on the likelihood of being high-cost and persistent*
Odds ra� o, 2010
Clinical condi� ons in 2010 High-cost in 2010 Persistent in 2011†
Medicare Commercial Medicare Commercial
Arthri� s 1.2x 2.5x 1.0x 1.2x
Asthma 1.3x 1.6x 1.3x 1.2x
Cardiology 1.7x 2.6x 1.1x 1.1x
Diabetes 1.2x 1.3x 1.2x 1.2x
Endocrinology 2.2x 2.3x 1.2x 1.2x
Hematology 2.1x 2.3x 1.4x 1.1x
Hepatology 1.6x 3.4x 1.1x 1.0x
High-cost cardiology 4.2x 7.3x 1.1x 1.3x
High-cost gastroenterology 2.1x 4.9x 1.0x 1.5x
High-cost pulmonary condi� ons 3.1x 5.4x 1.1x 1.3x
Hyperlipidemia 0.7x 0.8x 0.7x 0.8x
Hypertension 1.3x 1.8x 0.9x 1.0x
Infec� ous diseases 2.9x 4.4x 1.2x 1.6x
Malignant neoplasms (cancer) 2.1x 8.6x 1.2x 2.2x
Mental health 1.6x 1.8x 1.1x 1.2x
Mood disorders 2.3x 3.3x 1.1x 1.4x
MS & ALS 2.2x 4.0x 1.6x 3.1x
Neoplas� c blood diseases and leukemia 4.2x 8.8x 1.8x 3.1x
Neurology 2.2x 2.4x 1.1x 1.3x
Poisoning and toxic drug eff ects 2.5x 2.6x 1.3x 1.3x
Renal Failures 2.7x 2.6x 1.8x 1.8x
Substance Abuse 1.2x 1.9x 1.2x 1.3x
Urology 1.6x 3.0x 1.0x 1.1x
* Clinical condi� ons as defi ned by Lewin’s ERG grouper. 23 clinical condi� ons selected to include common chronic condi� ons and condi� ons par� cularly prevalent among high-
cost pa� ents.† Of pa� ents who were high-cost in 2010.
S#$%'+: All-Payer Claims Database; HPC analysis
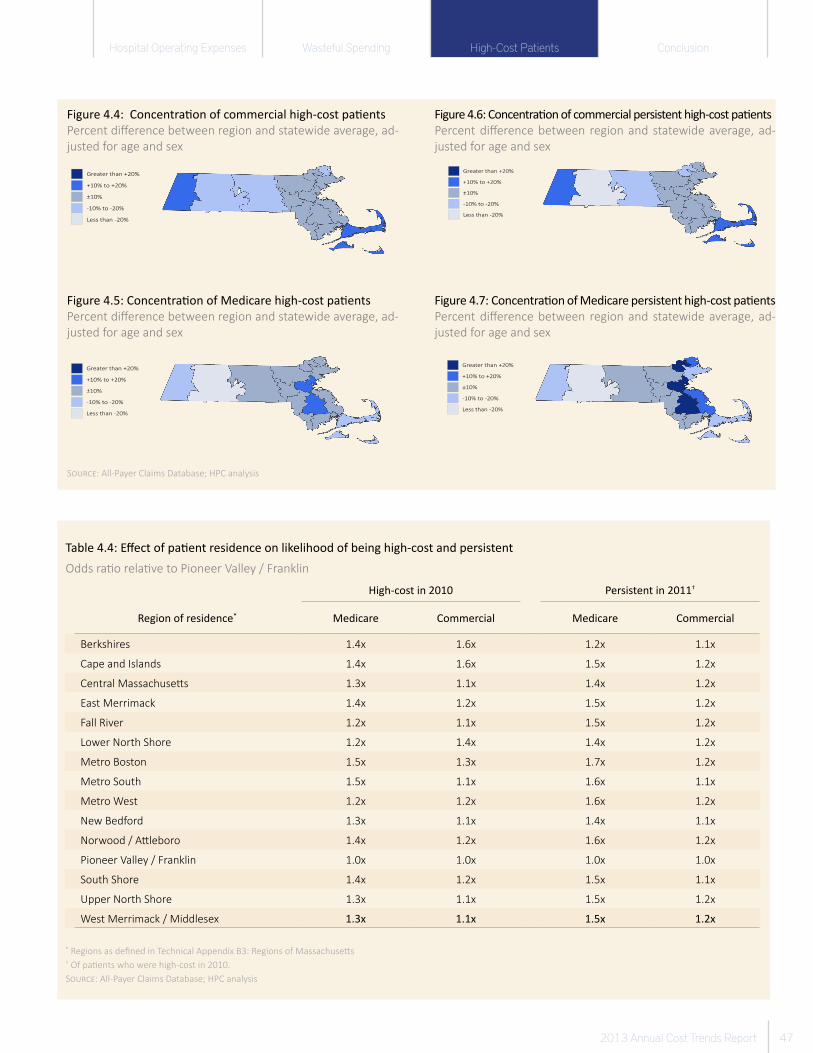
Hospital Operating Expenses Wasteful Spending High-Cost Patients Conclusion
2013 Annual Cost Trends Report 47
�#&0�����%&0
1������� ��%&0
2���������� �3%&0
3#&0����3%&0
4#&0
�%(1�� ��'(1
2����������'(1
3������������4'(1
4%(1�� �4'(1
5%(1
Figure 4.5: Concentra� on of Medicare high-cost pa� ents
Percent diff erence between region and statewide average, ad-
justed for age and sex
Figure 4.4: Concentra� on of commercial high-cost pa� ents
Percent diff erence between region and statewide average, ad-
justed for age and sex
�%(1�� ��'(1
2����������'(1
3������������4'(1
4%(1�� �4'(1
5%(1
Figure 4.6: Concentra� on of commercial persistent high-cost pa� ents
Percent diff erence between region and statewide average, ad-
justed for age and sex
�$'1�� ��&'1
2����������&'1
3������������4&'1
4$'1�� �4&'1
5$'1
Figure 4.7: Concentra� on of Medicare persistent high-cost pa� ents
Percent diff erence between region and statewide average, ad-
justed for age and sex
S!"#$%: All-Payer Claims Database; HPC analysis
Table 4.4: Eff ect of pa� ent residence on likelihood of being high-cost and persistent
Odds ra& o rela& ve to Pioneer Valley / Franklin
High-cost in 2010 Persistent in 2011†
Region of residence* Medicare Commercial Medicare Commercial
Berkshires 1.4x 1.6x 1.2x 1.1x
Cape and Islands 1.4x 1.6x 1.5x 1.2x
Central Massachuse' s 1.3x 1.1x 1.4x 1.2x
East Merrimack 1.4x 1.2x 1.5x 1.2x
Fall River 1.2x 1.1x 1.5x 1.2x
Lower North Shore 1.2x 1.4x 1.4x 1.2x
Metro Boston 1.5x 1.3x 1.7x 1.2x
Metro South 1.5x 1.1x 1.6x 1.1x
Metro West 1.2x 1.2x 1.6x 1.2x
New Bedford 1.3x 1.1x 1.4x 1.1x
Norwood / A' leboro 1.4x 1.2x 1.6x 1.2x
Pioneer Valley / Franklin 1.0x 1.0x 1.0x 1.0x
South Shore 1.4x 1.2x 1.5x 1.1x
Upper North Shore 1.3x 1.1x 1.5x 1.2x
West Merrimack / Middlesex 1.3x 1.1x 1.5x 1.2x
* Regions as defi ned in Technical Appendix B3: Regions of Massachuse' s† Of pa& ents who were high-cost in 2010.
S!"#$%: All-Payer Claims Database; HPC analysis

Spending Levels Spending Trends Delivery System Quality Performance and Access
48 Health Policy Commission
driven by diff erences in health status (beyond the clinical
conditions measured), provider mix, or other factors.
4.3.3 Demographic characteris� cs
Characteris� cs of high-cost and persistently high-cost
pa� ents
On average, high-cost commercial patients were eight
years older than other commercial patients. A greater pro-
portion of these patients were female. Among the Medi-
care population, the diff erences in age and sex were much
less pronounced for high-cost patients. Age and sex did
not diff er materially between persistently and non-per-
sistently high-cost patients for either payer type.
Income appeared to be a signifi cant factor among the
Medicare and commercial population, for which a rel-
atively high concentration of high-cost and persistently
high-cost patients lived in lower income communities (Ta-
ble 4.5). Among the Medicare population, there was not a
consistent pa! ern.
Predictors of being high-cost and persistently high-cost
pa� ents
The predictive analysis confi rmed that among the
commercial population, residing in a higher-income com-
munity was associated with a lower probability of being
high-cost. No systematic relationship was found between
community income and being a persistently high-cost
patient.xii Among the Medicare population, residing in a
high-income (top-quartile) community did increase the
relative probability both of high costs and persistence,
although there was no consistent pa! ern across other in-
come levels. Additional investigation is needed to deter-
mine if these income pa! erns are driven by diff erences in
health status (beyond the clinical conditions measured),
provider mix, or other factors.
4.4 Interven� ons
Many providers and payers are engaged in eff orts to im-
prove the effi ciency of care delivery for high-cost patients.
We reviewed three types of strategies for reducing expen-
ditures for high-cost patients: preventive strategies, process
and operations improvement, and care management.
4.4.1 Preven� ve strategies
Preventive strategies seek to reduce the incidence of
conditions that drive expensive health crises, as many ED
visits and inpatient hospitalizations among high-cost pa-
tients are avoidable.8 The most common conditions tied
to preventable hospitalizations for this population are
congestive heart failure, bacterial pneumonia, chronic ob-
structive pulmonary disease, and long-term diabetes com-
plication.4 In dealing with these types of conditions among
high-cost patients, prevention initiatives that have prov-
en eff ective include targeted, intensive lifestyle interven-
tion, comprehensive medication management, and health
coaching.9
Lifestyle intervention programs focused on diabetes
and hypertension have been developed and implemented
by a number of organizations and payers.10,11 Such lifestyle
management strategies can avert the development of high-
cost and life-threatening cardiovascular conditions.
Comprehensive medication management is another
preventive strategy, where a patient’s medications are
individually and collectively assessed to ensure that the
medications are appropriate, eff ective, safe, and able to be
taken by the patient as intended.12 Poor medication man-
agement is estimated to cause approximately 32 percent of
all hospitalizations and is a key driver of preventable ad-
verse events, adding an estimated more than $200 billion
each year in avoidable hospital spending.13,14 Improved
medication management has signifi cant potential to re-
duce the frequency of high-cost, acute exacerbations of be-
xii Results control for clinical conditions, interactions among conditions, age, sex, and region of residence.
Table 4.5: Concentra� on of high-cost and persistently high-
cost pa� ents by income group
Percent diff erence from statewide average
High-cost in 2010 Persistent in 2011†
Community
income*Medicare Commercial Medicare Commercial
Less than $35,000
3.4% -0.7% 13.7% 0.6%
$35,000 to $50,000
9.5% 5.4% 21.6% 4.2%
$50,000 to $75,000
-0.6% 3.1% -2.9% 4.2%
$75,000 to $100,000
-1.5% -1.2% -5.5% -1.9%
Greater than $100,000
-7.2% -7.0% -12.9% -7.8%
* Pa! ent income is not directly available in the APCD. We used median household
income in a pa! ent’s zip code of residence as a proxy for individual income. † Of pa! ents who were high-cost in 2010.
S"#&'(: All-Payer Claims Database; HPC analysis
Hospital Operating Expenses Wasteful Spending High-Cost Patients Conclusion
2013 Annual Cost Trends Report 49
havioral health and chronic medical conditions.
Health coaching provides high-cost patients with the
ability to understand their conditions and care plan, par-
ticipate in shared decision-making with their providers,
and take on more preventive, self-managed care. For pa-
tients, health coaching has led to signifi cant improvement
in functional status.15
4.4.2 Process and opera� ons improvement
Preventive strategies may reduce, but not eliminate, the
incidence of conditions that drive expenditures for high-
cost patients. When an episode of care occurs, process and
operations improvement aims to optimize the effi ciency
of the episode through sound operational practices and
the adherence to evidence-based guidelines (for more in-
formation, see Chapter 3). For non-persistently high-cost
patients, who often cannot be identifi ed prospectively, the
most promising interventions may be focused operational
improvements that enhance the effi ciency of care for the
conditions most prevalent among this group.
One approach to improving effi ciency is to standardize
care for high-cost episodes. Standardization of inpatient
care via checklists, more systematic applications of pro-
cess engineering tools, and assuring consistent daily mon-
itoring of ICU patients may reduce spending of high-cost
episodes.6 Some hospitals have adopted practices that en-
able structured reviews of process fl ows in order to reduce
waste.16 Alongside process standardization, the promotion
and dispersion of information to support the practice of
evidence-based medicine may improve quality and reduce
costs (for more information, see Chapter 2 and Chapter 3).8
4.4.3 Care management
Care management and care coordination can reduce
spending for high-cost and persistently high-cost. Unco-
ordinated care and social or environmental barriers to ef-
fective care lead to poor outcomes and spiraling costs for
high-cost patients, many of whom require simultaneous
treatment for multiple conditions.
Transitional care focuses on improving care transitions
– such as when a patient is discharged from a hospital
into a post-acute care se! ing – through be! er in-hospital
planning and post–discharge follow-up. Such eff orts tar-
get acute hospital and ED use and health status decline,
emphasizing coordination and close clinical management
among all involved parties.17
Care management activities can also play a role in be! er
coordination of care for high-cost patients across multiple
conditions. In CMS’s Health Homes program, for exam-
ple, provider organizations are responsible for be! er coor-
dination of care for Medicaid benefi ciaries with behavioral
health and chronic medical conditions.18
In addition, other geographically targeted programs
have focused on high-cost patients dealing with socio-
economic challenges.5 This strategy, popularly referred to
as “hot-spo! ing,” often targets patient populations with
interventions that convene providers and community
groups to solve problems in a more holistic manner.
4.5 Conclusion
High-cost patients have clearly identifi able character-
istics and predictable factors. While some of the factors
driving high-costs are clinical, others are socioeconomic,
such as education, and delivery system-related, such as
fragmented care or high-priced providers. As a group,
the high-cost patients are not homogenous – for example,
persistently and non-persistently high-cost patients have
distinct characteristics. In addition to persistence, other
meaningful characteristics can be used to target interven-
tions for particular segments of high-cost patients. The
interventions needed to capture these savings and health
outcome opportunities require strategic investment and
coordinated action from providers and payers, as well as
support from community organizations and government
agencies. As with all interventions, it will be important
to evaluate the return on such investments and to ensure
that a portion of savings are passed along from payers and
providers to purchasers and consumers. Reducing expen-
ditures by 10 percent across the high-cost Medicare and
commercial patients in Massachuse! s would represent
nearly $1.8 billion in annual savings.
References
1 Cohen SB, Uberoi N. Sta� s� cal Brief #421: Diff eren� als in the Con-
centra� on in the Level of Health Expenditures across Popula� on
Subgroups in the U.S., 2010 [Internet]. Washington (DC): Agency
for Healthcare Research and Quality – Medical Expenditure Panel
Survey; 2013 Aug [cited 2013 Dec 18]. Available from: h$ p://meps.
ahrq.gov/mepsweb/data_fi les/publica� ons/st421/stat421.shtml.
2 Seifert R, Anthony S. Fact Sheet: The Basics of MassHealth [Inter-
net]. Boston (MA): Massachuse$ s Medicaid Policy Ins� tute; 2011
Feb [cited 2013 Dec 18]. Available from: h$ ps://www.umassmed.
edu/uploadedFiles/CWM_CHLE/Included_Content/Right_Col-
umn_Content/MassHealth%20Basics%202011-FINAL.pdf.
Spending Levels Spending Trends Delivery System Quality Performance and Access
50 Health Policy Commission
3 Cohen SB. Sta� s� cal Brief #392: The Concentra� on and Persistence
in the Level of Health Expenditures over Time: Es� mates for the
U.S. Popula� on, 2009-2010 [Internet]. Washington (DC): Agency
for Healthcare Research and Quality – Medical Expenditure Pan-
el Survey; 2012 Nov [cited 2013 Dec 18]. Available from: h� p://
meps.ahrq.gov/data_fi les/publica� ons/st392/stat392.pdf.
4 Joynt KE, Gawande AA, Orav EJ, Jha AK. Contribu� on of Prevent-
able Acute Care Spending to Total Spending for High-Cost Medi-
care Pa� ents. The Journal of the American Medical Associa� on.
2013;309(24):2572-2578.
5 Bush H. Health Care’s Costliest 1%. Hospitals & Health Networks;
2012 Sep.
6 Young PL, Olsen L. Workshop Series Summary: The Healthcare Im-
pera� ve: Lowering Costs and Improving Outcomes. Washington
(DC): Ins� tute of Medicine; 2010.
7 Behavioral Health Integra� on Task Force. Report to the Legislature
and the Health Policy Commission. Boston (MA): Behavioral Health
Integra� on Task Force; 2013 Jul.
8 Milstein A, Shortell S. Innova� ons in Care Delivery to Slow Growth
of US Health Spending. The Journal of the American Medical Asso-
cia� on. 2012;308(14):1439-1440.
9 Thorpe KE. Strengthening Medicare for Today and the Future
(statement before the Senate Special Commi� ee on Aging). Wash-
ington (DC): U.S. Senate Special Commi� ee on Aging; 2013 Feb 27.
10 United Health Center for Health Reform and Moderniza� on.
Working Paper 5: The United States of Diabetes: Challenges and
Opportuni� es in the Decade Ahead. Minnetonka (MN): United-
Health Center for Health Reform and Moderniza� on, UnitedHealth
Group; 2010.
11 Partnership for Preven� on. The Community Health Promo� on
Handbook: Ac� on Guides to Improve Community Health: Dia-
betes Self-Management Educa� on (DSME): Establishing a Com-
munity-Based DSME Program for Adults with Type 2 Diabetes to
Improve Glycemic Control – An Ac� on Guide. Washington (DC):
Partnership for Preven� on; 2008.
12 The Pa� ent-Centered Primary Care Collabora� ve. Resource Guide:
The Pa� ent-Centered Medical Home: Integra� ng Comprehensive
Medica� on Management to Op� mize Pa� ent Outcomes; 2012 Jun.
13 Smith M, Bates DW, Bodenheimer T, Cleary PD. Why Pharmacists
Belong in the Medical Home. Health Aff airs. 2010;29(5):906-913.
14 de Oliveria R, Brummel AR, Miller DB. Medica� on Therapy Man-
agement: 10 Years of Experience in a Large Integrated Health Care
System. Journal of Managed Care Pharmacy. 2010;16(3):185-195.
15 Thomas ML, Ellio� JE, Rao SM, Fahey KF, Paul SM, Miaskowski C. A
Randomized, Clinical Trial of Educa� on or Mo� va� onal-interview-
ing-based Coaching Compared to Usual Care to Improve Cancer
Pain Management. Oncology Nursing Forum. 2012;39(1):39-49.
16 Toussaint J. Wri� ng the New Playbook for U.S. Health Care: Les-
sons from Wisconsin. Health Aff airs. 2009;28(5):1343-1350.
17 McGaw J, Conner DA, Delate TM, Chester EA, Barnes CA. A Mul� -
disciplinary Approach to Transi� on Care: A Pa� ent Safety Innova-
� on Study. The Permanente Journal. 2007;11(4):4-9.
18 The Henry J. Kaiser Family Founda� on. Medicaid’s New “Health
Home” Op� on; 2011 Jan.

Hospital Operating Expenses Wasteful Spending High-Cost Patients Conclusion
2013 Annual Cost Trends Report 51
This report highlights key challenges and opportuni-
ties as the Commonwealth seeks to reduce the growth of
health care spending. Although Massachuse! s has seen
a recent slowdown in per capita health care spending
growth similar to national trends, maintaining this slower
rate of growth will require a sustained commitment by all
stakeholders to continue necessary reforms of the health
care payment and delivery systems. Through our cost
trends hearings and examination, the Commission sup-
ports this eff ort by reviewing signifi cant drivers of spend-
ing growth, identifying areas of opportunity, and recom-
mending evidence-based interventions, innovations, and
policies. Our fi rst annual cost trends report builds on pri-
or work and has important implications for our ability to
meet the goals of Chapter 224.
In summary, we fi nd that there are signifi cant opportu-
nities in Massachuse! s to enhance the value of health care,
addressing cost and quality. We identify four primary ar-
eas of opportunity for improving the health care system in
Massachuse! s:
1. Fostering a value-based market in which payers and
providers openly compete to provide services and in
which consumers and employers have the appropri-
ate information and incentives to make high-value
choices for their care and coverage options,
2. Promoting an effi cient, high-quality health care de-
livery system in which providers effi ciently deliver
coordinated, patient-centered, high-quality health
care that integrates behavioral and physical health
and produces be! er outcomes and improved health
status,
3. Advancing alternative payment methods that sup-
port and equitably reward providers for delivering
high-quality care while holding them accountable
for slowing future health care spending increases,
and
4. Enhancing transparency and data availability nec-
essary for providers, payers, purchasers, and poli-
cymakers to successfully implement reforms and
evaluate performance over time.
Our fi ndings and recommendations are summarized
below:
Mee� ng the benchmark
Understanding the complex factors that drive health
care spending trends is important if Massachuse! s is to
meet its cost growth benchmark. Health care spending is a
function of the amount and type of services provided (uti-
lization) and the prices paid for health care services (price),
which includes both the price per service (unit price), and
the se! ing in which those services are provided (provider
mix). We fi nd:
▪ Per capita personal health care services spending
in Massachuse! s is the highest of any state in the
U.S., crowding out other priorities for households,
businesses, and government. This higher per capita
spending is consistent across all payer types. Mas-
sachuse! s residents use more services, especially
hospital care and long-term care and home health,
and are more likely to receive care at more expensive
major teaching hospitals. Prices paid for health care
services are higher in Massachuse! s than the U.S. av-
erage.
▪ Over the past decade, growth in health care spend-
ing in Massachuse! s exceeded the U.S. average and
is driven primarily by growth in commercial prices,
including both higher unit prices and a shift of pa-
tients to higher-priced providers. Commercial prices
vary signifi cantly in Massachuse! s and are associat-
ed with the relative market position of the provider,
not the quality of care provided.
▪ Massachuse! s has be! er overall health care quali-
ty performance and off ers be! er access to care than
many other states. However, considerable opportu-
nities remain to further improve quality and access
as well as population health.
Fostering a value-based market
There is an opportunity in Massachuse! s to improve
health care market functioning by promoting value-based
competition, increasing cost and quality transparency,
Conclusion to 2013 Cost
Trends Report
Spending Levels Spending Trends Delivery System Quality Performance and Access
52 Health Policy Commission
and encouraging both demand-side and supply-side ap-
proaches to drive health care value. We fi nd:
▪ The provider market in Massachuse! s is rapidly
changing with many provider organizations explor-
ing a range of potential affi liations, from corporate to
contractual to clinical. These changes can signifi cant-
ly impact market functioning. It is important to bal-
ance potential cost and quality benefi ts of such trans-
actions with potentially negative eff ects on patient
access to care, prices and total spending, and the abil-
ity of payers to develop viable alternative network
products. The Commission will continue to monitor
these developments through its statutory authority to
review provider material changes and conduct cost
and market impact reviews.
▪ Payers have developed, and employers and con-
sumers have increasingly selected, high-deductible
and tiered or limited network products that provide
greater fi nancial incentives for consumers to make
value-based health care decisions such as choosing
high-quality, lower-priced providers and avoiding
unnecessary services. While payers should continue
to develop value-based products, it is important to
monitor the impact of such products to ensure that
specifi c product designs do not inhibit or otherwise
discourage consumers from seeking necessary care.
▪ As required by Chapter 224, payers and providers
are taking steps to make health care price informa-
tion transparent and available to consumers. In order
to further support value-based decisions, these trans-
parency eff orts should include comparable informa-
tion on provider quality performance and patient
experience.
Promo� ng an effi cient, high-quality health care delivery
system
There is an opportunity in Massachuse! s for providers
to more effi ciently deliver coordinated, patient-centered,
high-quality health care that integrates behavioral and
physical health and produces be! er outcomes and im-
proved health status. We fi nd:
▪ Consistent with national fi ndings, an estimated 21 to
39 percent ($14.9 to $27.5 billion in 2012) of annual
health care spending in Massachuse! s does not re-
turn value and in some cases causes preventable
harm to patients. This “wasteful spending” includes
spending on preventable ED visits, hospitalizations
for ambulatory care-sensitive conditions, and un-
necessary hospital readmissions, among other areas.
Spending in these areas could be reduced by inter-
ventions such as more eff ective care coordination,
adherence to evidence-based guidelines, and clinical
process standardization. The Commission will con-
tinue to work with payers, providers and other stake-
holders to identify and address these and other areas
of wasteful spending.
▪ Consistent with national fi ndings, a small number of
patients account for a signifi cant proportion of the
Commonwealth’s overall health care expenditures.
In part due to ineff ective coordination across a frag-
mented care delivery system, the interaction of mul-
tiple conditions can lead to even higher spending.
There are opportunities to be! er identify and target
interventions to improve health outcomes and reduce
overall expenditures, especially for patients who are
persistently “high-cost” or who have multiple condi-
tions such as behavioral health and chronic medical
conditions.
▪ Operating effi ciency varies greatly from one hospital
to another. Certain hospitals are able to achieve high
levels of quality with lower operating expenses than
other hospitals. Hospitals performing at lower effi -
ciency should critically examine their cost structures
and adopt best practices designed to improve their
effi ciency in delivering high-quality care.
Advancing alterna� ve payment methods
All major payers in Massachuse! s are implementing
forms of alternative payment methods, such as global pay-
ments, which, in contrast to fee-for-service payments, are
designed to support and fi nancially reward providers for
delivering high-quality care while holding them account-
able for slowing future health care spending increases. We
fi nd:
▪ There is wide variation in the types of alternative pay-
ment contracts covering Massachuse! s providers,
both within and across payers, as budget levels, risk
adjustments and other contract terms are negotiated.
In addition, behavioral health services are often ex-
cluded from global budgets. As a result, underlying
payment disparities persist, and providers face chal-
lenges managing patients’ care under diff erent in-
centive structures. The Commission will continue to
evaluate the impact of alternative payment methods
and encourage, where appropriate, the standardiza-
Hospital Operating Expenses Wasteful Spending High-Cost Patients Conclusion
2013 Annual Cost Trends Report 53
tion of such payment methods that responsibly foster
high-quality care and the effi cient use of resources.
▪ Commercial alternative payment contracts currently
apply primarily to patients in HMO products. How-
ever, employers and consumers in Massachuse! s are
increasingly selecting PPO product off erings, which
currently do not feature alternative payment con-
tracts. Payers should accelerate the development of
methodologies and address other barriers so that al-
ternative payment methods can be extended to PPO
products as well. The Commission will continue to
monitor eff ective ways to coordinate patient care and
incentives across multiple forms of product design.
Enhancing transparency and data availability
Readily available data are necessary for providers,
payers, purchasers, and policymakers to successfully im-
plement reforms and evaluate performance over time. We
fi nd:
▪ To eff ectively coordinate and manage care delivery,
including be! er identifying needs of high-cost pa-
tients, providers need access to patient data, even
when care is delivered by another provider or within
a diff erent health system. These data needs include
both current patient data and retrospective informa-
tion on relative performance. Payers should support
providers by making this data more readily accessi-
ble for all patients in all product types. The Commis-
sion supports the continued development of a health
information exchange and an accessible all-payer
claims database as important eff orts to enhance data
accessibility.
▪ Analysis of hospital operating expenses is limited by
variation in hospital cost reporting. There is a need for
improved cost accounting at hospitals and increased
standardization in the allocation of administrative
costs and public reporting of all patient care expens-
es. An improved set of data should be collected by
the Commonwealth, including through the current
CHIA reporting process.
▪ As payers and providers achieve effi ciencies through
these reforms, the Commission will monitor the im-
pact of these eff orts to ensure that employers and
consumers share in the savings in the form of low-
er growth in premiums and consumer out-of-pocket
spending.
In the coming months we intend to update many of the
analyses contained in this report with claims data from
2012, including Medicaid information. In addition, through
our ongoing analysis of the APCD and other data sources,
we intend to continue our analysis of issues that are crit-
ical to the success of the Commonwealth’s cost contain-
ment and quality improvement eff orts. We look forward
to working with the Massachuse! s health care industry,
stakeholders, businesses, and consumers on advancing the
goal of a more aff ordable, eff ective and accountable health
care system in Massachuse! s.
Related Documents