Original Research Health outcomes, utilization, and equity in Chile: an evolution from 1990 to 2015 and the effects of the last health reform A. Nu ´ ~ nez a,* , C.A. Manzano b,c , C. Chi d a Department of Management Control and Information Systems, School of Economics and Business, Universidad de Chile, Diagonal Paraguay 257, Office 2004, Santiago, Chile b Department of Chemistry, Faculty of Science, University of Chile, Las Palmeras 3425, Nunoa, RM, Chile c School of Public Health, San Diego State University, 5500 Campanile Drive, San Diego, CA, USA d College of Public Health and Human Sciences, Oregon State University, 013 Milam Hall, Corvallis, OR, USA article info Article history: Received 27 May 2019 Received in revised form 31 July 2019 Accepted 24 August 2019 Available online 9 October 2019 Keywords: Equity in health access Chile Concentration curves Health reform Nutrition abstract Objective: Chile is an attractive case study because of the deep political changes that it underwent over a short period of time: from a universal health service (60s), through a neoliberal reform (70s) and onto a series of legislative reforms (80se90s). This article aims to explore and assess the evolution of health outcomes, equity, and utilization in Chile through the last period of these reforms (1990e2015). Study design: Standardized health equity analysis. Methods: We conducted a standardized economic analysis on health equity and healthcare utilization using the ADePT software (by the World Bank) and using data from the Chilean National Socio-economic Survey. We evaluated trends of health equity and examined concentration curves of health utilization of healthcare services and health outcomes such as children/elder/pregnant nutritional status, self-reported health, and physical limitations. Results: Health outcomes such as nutritional problems in children and pregnant women were concentrated among the poor, while others such as high-relevance health con- ditions were similar for poorest and richest households. The concentration indexes for health outcomes suggested that income makes the distribution pro-poor. However, the opposite was true for age, in which the probability of health problems among rich individuals increased with age. The concentration curves for utilization of healthcare services showed that dental visits, laboratory exams, specialty visits, and hospitalizations were concentrated on the richest households, while the use of emer- gency services and preventive medicine were highly concentrated among poor individuals. * Corresponding author. Tel.: þ56-29783443. E-mail addresses: [email protected] (A. Nu ´ ~ nez), [email protected] (C.A. Manzano), [email protected] (C. Chi). Available online at www.sciencedirect.com Public Health journal homepage: www.elsevier.com/puhe public health 178 (2020) 38 e48 https://doi.org/10.1016/j.puhe.2019.08.017 0033-3506/© 2019 The Royal Society for Public Health. Published by Elsevier Ltd. All rights reserved.

Welcome message from author
This document is posted to help you gain knowledge. Please leave a comment to let me know what you think about it! Share it to your friends and learn new things together.
Transcript
ww.sciencedirect.com
p u b l i c h e a l t h 1 7 8 ( 2 0 2 0 ) 3 8e4 8
Available online at w
Public Health
journal homepage: www.elsevier .com/puhe
Original Research
Health outcomes, utilization, and equity in Chile:an evolution from 1990 to 2015 and the effects ofthe last health reform
A. Nu~nez a,*, C.A. Manzano b,c, C. Chi d
a Department of Management Control and Information Systems, School of Economics and Business, Universidad de
Chile, Diagonal Paraguay 257, Office 2004, Santiago, Chileb Department of Chemistry, Faculty of Science, University of Chile, Las Palmeras 3425, Nunoa, RM, Chilec School of Public Health, San Diego State University, 5500 Campanile Drive, San Diego, CA, USAd College of Public Health and Human Sciences, Oregon State University, 013 Milam Hall, Corvallis, OR, USA
a r t i c l e i n f o
Article history:
Received 27 May 2019
Received in revised form
31 July 2019
Accepted 24 August 2019
Available online 9 October 2019
Keywords:
Equity in health
access
Chile
Concentration curves
Health reform
Nutrition
* Corresponding author. Tel.: þ56-29783443.E-mail addresses: [email protected] (
https://doi.org/10.1016/j.puhe.2019.08.0170033-3506/© 2019 The Royal Society for Publ
a b s t r a c t
Objective: Chile is an attractive case study because of the deep political changes that it
underwent over a short period of time: from a universal health service (60s), through a
neoliberal reform (70s) and onto a series of legislative reforms (80se90s). This article aims
to explore and assess the evolution of health outcomes, equity, and utilization in Chile
through the last period of these reforms (1990e2015).
Study design: Standardized health equity analysis.
Methods: We conducted a standardized economic analysis on health equity and healthcare
utilization using the ADePT software (by the World Bank) and using data from the Chilean
National Socio-economic Survey. We evaluated trends of health equity and examined
concentration curves of health utilization of healthcare services and health outcomes
such as children/elder/pregnant nutritional status, self-reported health, and physical
limitations.
Results: Health outcomes such as nutritional problems in children and pregnant women
were concentrated among the poor, while others such as high-relevance health con-
ditions were similar for poorest and richest households. The concentration indexes
for health outcomes suggested that income makes the distribution pro-poor. However,
the opposite was true for age, in which the probability of health problems among
rich individuals increased with age. The concentration curves for utilization of
healthcare services showed that dental visits, laboratory exams, specialty visits, and
hospitalizations were concentrated on the richest households, while the use of emer-
gency services and preventive medicine were highly concentrated among poor
individuals.
A. Nu~nez), [email protected] (C.A. Manzano), [email protected] (C. Chi).
ic Health. Published by Elsevier Ltd. All rights reserved.
p u b l i c h e a l t h 1 7 8 ( 2 0 2 0 ) 3 8e4 8 39
Conclusions: Although a positive trend in the increase of healthcare service use among in-
come groups was observed, a significant impact of the latest health reform was not
observed.
© 2019 The Royal Society for Public Health. Published by Elsevier Ltd. All rights reserved.
Introduction
Inequities in healthcare systems are a major concern for
policymakers and stakeholders around the world, as they
can affect healthcare services utilization and access and
therefore affect general health outcomes.1 Inequities have
been defined as those ‘differences which are unnecessary and
avoidable but in addition are considered unfair and unjust’.2
Based on this, equity could be defined as a type of social
justice that is related to the things that one person is entitled
to, such as health.3 Equity in health is therefore closely
associated with social justice and should be pursued by
defining and eliminating health inequities. The Commission
on Social Determinants of Health of the World Health
Organization (WHO) attributed these inequities to the cir-
cumstances in which people are born, grow up, live, work,
and age in, in addition to the healthcare systems established
in their locality.4 Inequities in healthcare systems have
long been a distinguishing feature in Latin American politics
and policymaking, motivating local governments to take
different courses of action to address them.5 Healthcare
systems in Latin American countries have changed at a
similar rate than its political landscape, our study area (i.e.
Chile) is one example of such changes.
The growing economy and the political changes that the
country suffered from the early 1970s to the mid-2010s also
triggered changes in its health system administration. The
Chilean health system, which was primarily state funded
before 1981, was transformed into a publiceprivate mixed
system. However, since its return to democracy in 1989,
several public policies have been developed to promote
socio-economic equity, such as the provision of an
adequate level of healthcare services based on an equal
opportunity perspective.6 Specific programs designed to
promote access to the opportunities available at that time
were developed for vulnerable population groups (e.g.
grouped by social class or other categories) between
1990e2000.6 Between 2000 and 2006 these programs focused
on the improvement of social determinants in health and a
new comprehensive health reform plan was initiated.7 The
new legal framework for health systems was approved by
the Chilean legislative system during 2003e2004, which
guaranteed medical attention for certain health conditions
and defined basic principles of access, quality, opportunity,
and financial protection.8 The Regime of Explicit Health
Guarantees (‘GES’ in Spanish), designed to strengthen
public-sector service provision without replacing the cur-
rent private or public systems, was implemented in 2005.
This reform aimed to ensure the minimum conditions of
access for high-relevance health conditions in its different
stages to the entire population, regardless of age, gender,
economic status, health status, or place of residence, at
non-catastrophic costs.9,10 The GES reform currently in-
cludes a total of 80 health conditions, accounting for over
70% of years of healthy life lost in the Chilean population.10
Additionally, the ‘Steps toward the health equity agenda’,
were implemented by the Chilean Ministry of Health be-
tween 2008 and 2010, which were designed to promote
concrete actions, embodied in health policies and pro-
grams, to reduce inequities in health.6
Today, Chile has a mixed healthcare system, both in
financing and delivery of services. Public and private health
insurance systems share a common financing source that
comes from the mandatory contribution of employees (i.e.
7% monthly payroll tax), and Chileans can choose between
both. The public healthcare system (i.e. National Health
Fund ‘FONASA’, in Spanish) provides access to health care
for everyone, regardless of their ability to pay. It covers 11
million of beneficiaries (i.e. ~78% of population) and is
structured under four levels of income groups (i.e. A-D, from
lower to higher income).11 Private health insurance com-
panies in Chile are associated in a group called ‘ISAPRE’.
There are six open ISAPREs in the country that provide ser-
vices to approximately 15% of the population12,13 and pro-
vide health services in their own facilities or through a
network of providers. ISAPREs can negotiate additional
contributions from its members to improve their service
plans based on age, gender, and family members.14 Both the
public and private system include intrahospital medication.
Primary care medicines do not require copayment in the
public system, while copayment is required in the private
system according to the group or insurance plan.15
The healthcare system historical fragmentation has
created an equity gap between public and private sectors.
Recent studies have focused on analyzing the equity as-
pects of the Chilean healthcare system at different points in
time and have included the analysis of social determinants
of health,16 income related inequalities,17 universal
healthcare coverage,18 system utilization,19 and out-of-
pocket payment.20 The objective of this study was to
assess and explore the evolution of equality in health and
equity in utilization of healthcare services for a selected set
of health outcomes during 1990e2015. The effects of the
latest health reform were evaluated based on this analysis.
Additionally, we explored trends that contributed to in-
equities in health and identified potential factors that may
contribute to achieve a more equitable healthcare system in
the future.

p u b l i c h e a l t h 1 7 8 ( 2 0 2 0 ) 3 8e4 840
Methods
Data collection
Data were obtained from the Chilean National Socio-
economic Survey (CASEN), which is designed to describe the
country's general socio-economic situation and includes a
section on health status with information regarding nutri-
tional status, insurance system, self-assessed health, ill-
nesses/accidents, and access to medical services, among
others.21 Its sampling method is based on a multistage
random sampling with geographical stratification and clus-
tering.21 The CASEN is reported to be representative at the
national, urban national, rural, and regional national level.21
CASEN data from 1990, 1992, 1994, 1996, 1998, 2000, 2003,
2006, 2009, 2011, 2011, 2013, and 2015 were used. The final
sample for each year included ~65,000 households and 260,000
people, with ~49% men and ~51% women.
Data processing
Data were processed inADePT v.5.3 (by theWorld Bank),22 and a
standardized economic annual analysis on health equity and
healthcare utilization was conducted. This software was
developed for the analysis of household surveys, and ADePT'stables are in a standardized format and are based on a set of
methods that are widely accepted in the literature.22 Also,
ADePT Health (the module used for this analysis) allows to
minimize the risk of error given the standardize tables that are
produced.22 Thus, health outcomes were evaluated based on
characteristics reported in CASEN and included geographical
characteristics (i.e. urban, rural, and Chilean region), de-
mographic characteristics (i.e. age and gender), and economic
characteristics (i.e. income expressed as quintiles, private vs
public insurance) (Table 1). Health outcomes were treated as
binary variables, indicating whether the person (i.e. child,
pregnant women, or elder) are underweight or overweight,
whether if individuals in the household suffer from a health
condition, physical limitations, or GES conditions, and how they
self-assess their own health status. Household characteristics
included binary variables indicating urban/rural place of resi-
dence, categorical variables indicating the geographical region
of residence in Chile (i.e. regions I-XV plus the metropolitan
region), and the income quintile per equivalent adult and a
count variable for household size. Descriptive statistics of the
variables selected are available in Online Resource 1.
The statistical analysis presented in this study included
analysis of inequalities in health and healthcare utilization by
household and individual characteristics, standardized con-
centration index for health outcomes, concentration curves of
health outcomes, decomposition of the concentration index
for health outcome, and concentration curves for healthcare
utilization.
Results
The results were assessed by analyzing the health outcomes
selected (Table 1) by characteristics reported in CASEN.
Hereafter, we present themost relevant results based on some
geographic (i.e. urban vs rural areas, Chilean region), de-
mographic (i.e. age and gender), and economic characteristics
(i.e. total income, private vs public insurance). Please refer to
Online Resource 2 for a complete description of the results.
Analysis of correlations
Geographic characteristicsUrban and rural areas showed similar trends overall during
1990e2015 (Fig. 1), including a general tendency to increase
children overweight, physical limitations, and GES conditions.
However, some differences emerged when comparing urban
and rural areas to each other. In general, people in rural areas
reported to have underweight problems (children, pregnant
women, and elder) and less than good health (i.e. variables ‘self-
assessed health’, ‘physical limitations’) (Fig. 1). However, some
of these tendencies reverted in 2000 (overweight children and
pregnant women) and 2015 (underweight children), and further
study is required to determine if they will hold in the future.
Health outcomeswere also assessed based on geographical
location. The probability of having underweight children and
pregnant women decreased in every Chilean region from 1990
to 2015, as well as people reporting less than good health (i.e.
‘self-assessed health’) (Fig. 1). Conversely, a strong increase in
the probability of finding a GES condition was observed for
every region (Fig. 1). These trends were not evident for other
variables such as ‘physical limitations’, ‘elder under/over-
weight’, possibly because this information was collected only
from 2006. Although the geographic regions could be strongly
correlated to the urban vs rural analysis (i.e. most of the
Chilean urban population resides in the V, metropolitan, and
VI regions), some differences were observed particularly be-
tween the northern and southern regions of Chile (Fig. 1).
Children in the southern regions were in general more prone
to have nutritional problems, and more GES conditions were
reported in the south (Fig. 1). The region with the highest
probabilities to find underweight children in the last year
analyzed (i.e. 2015) was the metropolitan region, whereas
people reporting more health problems belonged to the X and
XI region (i.e. southern end of Chile). The variable ‘health
problem’, which showed temporal variability in the urban vs
rural assessment, did not show the same behavior for
geographic regions (Fig. 1).
Demographic characteristicsIn general, women showed worse health outcomes than men.
The probability of reporting health problems or a lower health
status (i.e. ‘self-assessed health’) was higher for women from
1990 to 2015 or the years reported. The prevalence of health
problems in 2015 amount to 19.5% for men and 25.4% for
women. Additionally, some health outcomes showed ex-
pected behavior relative to the respondent age, such as
‘physical limitations’ and ‘GES conditions’, which were
observed to be more correlated with men and women over 50
years old (Fig. 2).
Economic characteristicsHigher income level was observed to be correlated with
better health outcomes overall: better children nutritional
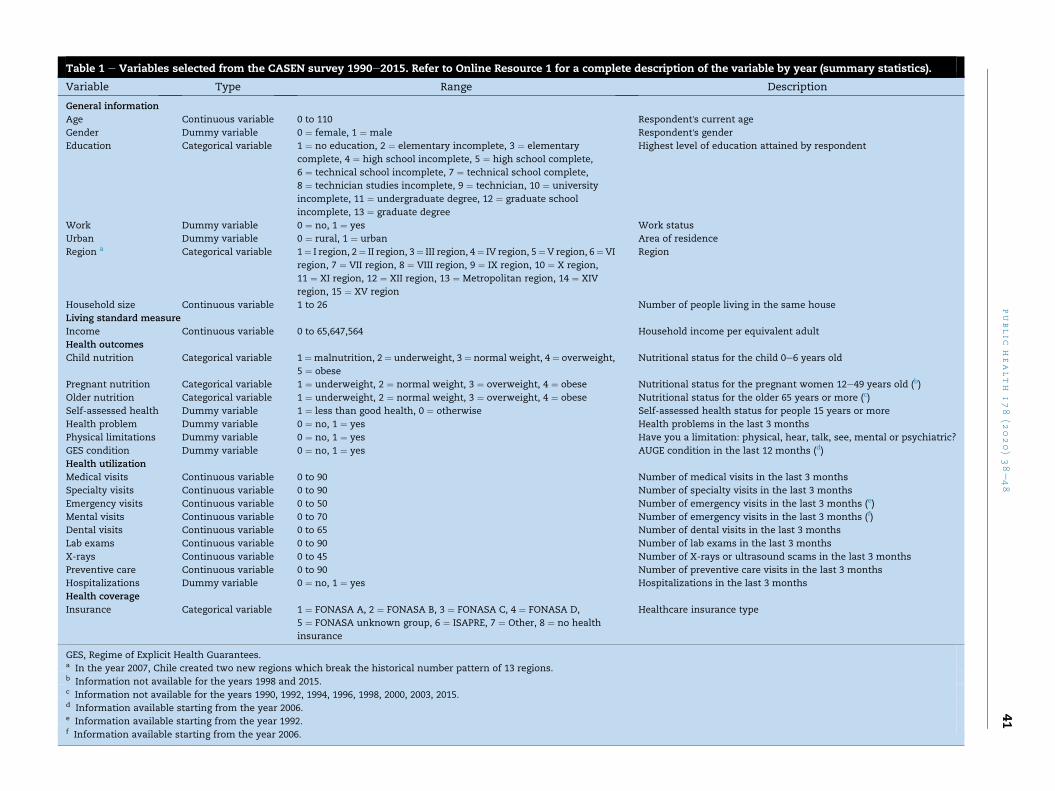
Table 1 e Variables selected from the CASEN survey 1990e2015. Refer to Online Resource 1 for a complete description of the variable by year (summary statistics).
Variable Type Range Description
General information
Age Continuous variable 0 to 110 Respondent's current age
Gender Dummy variable 0 ¼ female, 1 ¼ male Respondent's gender
Education Categorical variable 1 ¼ no education, 2 ¼ elementary incomplete, 3 ¼ elementary
complete, 4 ¼ high school incomplete, 5 ¼ high school complete,
6 ¼ technical school incomplete, 7 ¼ technical school complete,
8 ¼ technician studies incomplete, 9 ¼ technician, 10 ¼ university
incomplete, 11 ¼ undergraduate degree, 12 ¼ graduate school
incomplete, 13 ¼ graduate degree
Highest level of education attained by respondent
Work Dummy variable 0 ¼ no, 1 ¼ yes Work status
Urban Dummy variable 0 ¼ rural, 1 ¼ urban Area of residence
Region a Categorical variable 1¼ I region, 2¼ II region, 3¼ III region, 4¼ IV region, 5¼V region, 6¼VI
region, 7 ¼ VII region, 8 ¼ VIII region, 9 ¼ IX region, 10 ¼ X region,
11 ¼ XI region, 12 ¼ XII region, 13 ¼ Metropolitan region, 14 ¼ XIV
region, 15 ¼ XV region
Region
Household size Continuous variable 1 to 26 Number of people living in the same house
Living standard measure
Income Continuous variable 0 to 65,647,564 Household income per equivalent adult
Health outcomes
Child nutrition Categorical variable 1 ¼malnutrition, 2 ¼ underweight, 3 ¼ normal weight, 4 ¼ overweight,
5 ¼ obese
Nutritional status for the child 0e6 years old
Pregnant nutrition Categorical variable 1 ¼ underweight, 2 ¼ normal weight, 3 ¼ overweight, 4 ¼ obese Nutritional status for the pregnant women 12e49 years old (b)
Older nutrition Categorical variable 1 ¼ underweight, 2 ¼ normal weight, 3 ¼ overweight, 4 ¼ obese Nutritional status for the older 65 years or more (c)
Self-assessed health Dummy variable 1 ¼ less than good health, 0 ¼ otherwise Self-assessed health status for people 15 years or more
Health problem Dummy variable 0 ¼ no, 1 ¼ yes Health problems in the last 3 months
Physical limitations Dummy variable 0 ¼ no, 1 ¼ yes Have you a limitation: physical, hear, talk, see, mental or psychiatric?
GES condition Dummy variable 0 ¼ no, 1 ¼ yes AUGE condition in the last 12 months (d)
Health utilization
Medical visits Continuous variable 0 to 90 Number of medical visits in the last 3 months
Specialty visits Continuous variable 0 to 90 Number of specialty visits in the last 3 months
Emergency visits Continuous variable 0 to 50 Number of emergency visits in the last 3 months (e)
Mental visits Continuous variable 0 to 70 Number of emergency visits in the last 3 months (f)
Dental visits Continuous variable 0 to 65 Number of dental visits in the last 3 months
Lab exams Continuous variable 0 to 90 Number of lab exams in the last 3 months
X-rays Continuous variable 0 to 45 Number of X-rays or ultrasound scams in the last 3 months
Preventive care Continuous variable 0 to 90 Number of preventive care visits in the last 3 months
Hospitalizations Dummy variable 0 ¼ no, 1 ¼ yes Hospitalizations in the last 3 months
Health coverage
Insurance Categorical variable 1 ¼ FONASA A, 2 ¼ FONASA B, 3 ¼ FONASA C, 4 ¼ FONASA D,
5 ¼ FONASA unknown group, 6 ¼ ISAPRE, 7 ¼ Other, 8 ¼ no health
insurance
Healthcare insurance type
GES, Regime of Explicit Health Guarantees.a In the year 2007, Chile created two new regions which break the historical number pattern of 13 regions.b Information not available for the years 1998 and 2015.c Information not available for the years 1990, 1992, 1994, 1996, 1998, 2000, 2003, 2015.d Information available starting from the year 2006.e Information available starting from the year 1992.f Information available starting from the year 2006.
public
health
178
(2020)38e48
41

Fig. 1 e Urban vs rural, and Chilean geographical regions (from north to south) assessment of health outcomes (1990e2015).
The color intensity represents a relative scale of correlation for each variable (darker ¼ higher correlation). The lines
including the Metropolitan, V, and VI regions are expected to have more urban population than the rest of the country.
GES ¼ Regime of Explicit Health Guarantees. (For interpretation of the references to color in this figure legend, the reader is
referred to the Web version of this article.)
p u b l i c h e a l t h 1 7 8 ( 2 0 2 0 ) 3 8e4 842
status, self-assessed health, and lowest elder underweight.
However, the probability of having overweight elder popu-
lation was similar or higher than lower income levels
(Fig. 3). Other outcomes such as ‘pregnant overweight’,
‘health problems’, and ‘GES conditions’ showed no evident
trend among quintiles (Fig. 3). People using public health
insurance programs (i.e. FONASA A-D) showed worse
health outcomes compared with private insurance users
(i.e. ISAPRE), except for ‘health problem’ and ‘GES condition’
which showed no apparent differences among insurance
groups (Fig. 3).
Fig. 2 e Male vs female and age assessment of health outcomes
of correlation for each variable (darker¼ higher correlation). GES
of the references to color in this figure legend, the reader is ref
Concentration curves
Equity analysisThe standard concentration index estimated for several vari-
ables was negative from 1998 to 2015 (Table 2). This suggested
the decrease of health outcomes with increasing income (e.g.
underweight children: �0.1708 for 2015) and reinforced what
was observed in the correlation coefficients. Nutritional
problems, such as children/pregnant overweight and under-
weight were concentrated among the poor during 1990e2015;
while underweight elders followed the same tendency. Elders'
(1990e2015). The color intensity represents a relative scale
¼ Regime of Explicit Health Guarantees. (For interpretation
erred to the Web version of this article.)

Fig. 3 e Public insurance programs (FONASA A-D) vs Private insurance users (ISAPRE), and total income (represented by
quintiles) assessment of health outcomes (1990e2015). The color intensity represents a relative scale of correlation for each
variable (darker ¼ higher correlation). GES ¼ Regime of Explicit Health Guarantees. (For interpretation of the references to
color in this figure legend, the reader is referred to the Web version of this article.)
p u b l i c h e a l t h 1 7 8 ( 2 0 2 0 ) 3 8e4 8 43
overweight showed a tendency to get closer to the equality
line. Table 3 presents the complete information for 2015 with
two additional scenarios that represent a higher aversion to
health inequality and achievement indexes for child nutrition,
self-assessed health, health problems, GES conditions, and
physical limitations when applying the concentration index
weighting (0.0255, 0.1708, 0.1659, 0.2264, 0.2518, and 0.0960
respectively). When comparing to the standard health of the
population, we found that the negativity of the concentration
index (such as in the case of child underweight) is over-
weighting the higher prevalence of the poorest. As a result, the
achievement index of 0.0255 indicates worst health than the
average health (i.e. 0.0218). This means that since aversion to
inequality is increased, the greater weight assigned to the first
Table 2 e Standard concentration index for selected outcome v
Year Childrenunderweight
Childrenoverweight
Self-assehealth
1990 �0.1853 0.0232 NI
1992 �0.2236 �0.0014 NI
1994 �0.1138 �0.0233 NI
1996 0.3090 �0.2864 NI
1998 �0.3180 �0.0679 NI
2000 �0.2762 �0.0963 NI
2003 �0.2520 �0.0170 �0.149
2006 �0.1960 �0.0156 NI
2009 �0.0933 �0.0540 �0.139
2011 �0.0615 �0.1164 �0.136
2013 �0.1672 �0.0608 �0.126
2015 �0.1708 �0.0827 �0.092
CASEN, Chilean National Socio-economic Survey; GES, Regime of Explicit H
quintiles makes average health deteriorate (i.e. underweight
children). Similar interpretation can be drawn from the other
health outcomes, except for ‘GES condition’ and ‘health
problem’, in which richer individuals suffered more from a
GES condition or a health problem, and higher aversion to
inequality makes their achievement index improve. Please
refer to Online Resource 3 for a complete description of the
results.
The concentration curves for most of the health conditions
lay above the 45� line of equality, which confirmed that these
health conditions were more prevalent among the poor. By
contrast, the concentration curve for ‘health problem’ and
‘GES condition’ were very close to the 45� line of equality,
which indicated very little association between these
ariables.
ssed Healthproblems
GEScondition
Physicallimitations
0.0388 NI NI
0.0207 NI NI
�0.0261 NI NI
�0.0077 NI NI
�0.0135 NI NI
�0.0180 NI NI
8 �0.0313 NI �0.1565
�0.0153 �0.0092 �0.1238
7 �0.0073 �0.0225 �0.1254
3 �0.0425 �0.0101 �0.1350
8 �0.0252 �0.0234 �0.1429
9 �0.0014 0.0045 �0.0807
ealth Guarantees; NI, no information collected by the CASEN survey.

Table 3 e Health inequality, unstandardized year 2015.
Childrenunderweight
Childrenoverweight
Self-assessedhealth
Healthproblems
GEScondition
Physicallimitations
Quintiles of income per equivalent adult
Lowest quintile 0.0304 0.1701 0.1725 0.2223 0.2308 0.0969
2 0.0220 0.1942 0.1752 0.2326 0.2646 0.1025
3 0.0226 0.1581 0.1605 0.2270 0.2698 0.0987
4 0.0168 0.1404 0.1488 0.2254 0.2604 0.0834
Highest quintile 0.0098 0.1011 0.1023 0.2232 0.2390 0.0630
Total 0.0218 0.1577 0.1518 0.2261 0.2529 0.0889
Standard concentration index �0.1708 �0.0827 �0.0929 �0.0014 0.0045 �0.0807
Conc. index with inequalityeaversion
parameter ¼ 3
�0.2466 �0.0981 �0.1184 0.0004 0.0220 �0.0985
Conc. index with inequalityeaversion
parameter ¼ 4
�0.2914 �0.0974 �0.1272 0.0035 0.0394 �0.0993
Standard achievement index 0.0255 0.1708 0.1659 0.2264 0.2518 0.0960
Achievement index with inequality
eaversion parameter ¼ 3
0.0272 0.1732 0.1698 0.2260 0.2473 0.0976
Achievement index with inequality
eaversion parameter ¼ 4
0.0282 0.1731 0.1711 0.2253 0.2429 0.0977
GES, Regime of Explicit Health Guarantees.
p u b l i c h e a l t h 1 7 8 ( 2 0 2 0 ) 3 8e4 844
conditions and income, and reinforced what was observed in
the correlation analysis (Fig. 4). Please refer to Online Resource
4 for a complete description of the concentration curves of
health outcomes from 1990 to 2015.
Gender and age were used as standardizing variables for
the decomposition of the concentration index. The results for
the last year studied (i.e. 2015) showed that child underweight
was slightly more concentrated among the poor because of
age (CI: concentration index) (CI: �0.002), while self-assessed
health, health problems, and GES conditions were slightly
more concentrated among the poor because of gender (CI:
�0.001, �0.002, �0.002, respectively). Conversely, self-
assessed health, health problems, GES conditions, and phys-
ical limitations were slightly more concentrated among the
rich because of age (CI: 0.050, 0.015, 0.057, 0.064), and no effect
was observed in child underweight, physical limitation for
gender (CI: 0). The total contribution of age and gender to
income-related inequality in these six health outcomes (Table
Fig. 4 e Concentration cur
4) was �0.002, 0, 0.048, 0.013, 0.055, and 0.064, respectively.
Negative contributions meant that child underweight, for
example, was correlated with age only, and they showed a
pro-poor distribution, while positive contributions showed a
pro-rich distribution.
When wealth index, insurance, and place of residence
were used as control variables the inequality because of the
control variables was CI: �0.162, �0.080, �0.134, �0.014,
�0.048, and �0.139, for the selected health outcomes,
respectively (Table 4). Total inequality for this subset of health
outcomes was CI: �0.171, �0.083, �0.093, �0.001, 0.004, and
�0.081. The related inequity for our control variables was
�0.158, �0.081, �0.142, �0.014, �0.050, and �0.145, respec-
tively. Negative values indicated that inequity favored the
rich. All the information about the decomposition of the
concentration index is available in Online Resource 5.
Age made a positive contribution to ‘self-assessed
health’, reporting a health problem, having a GES condition
ves for selected years.

Table 4 e Decomposition of the concentration index for health outcomes, linear model year 2015.
Childrenunderweight
Childrenoverweight
Self-assessedhealth
Healthproblems
GEScondition
Physicallimitations
Standardizing (demographic) variables
Respondents current age �0.002 0.000 0.050 0.015 0.057 0.064
Gender 0.000 0.000 �0.001 �0.002 �0.002 0.000
Subtotal �0.002 0.000 0.048 0.013 0.055 0.064
Control variables
Urban 0.006 �0.002 0.001 0.004 0.001 0.002
Metropolitan region 0.016 0.000 0.010 �0.002 0.001 0.005
Insurance 0.000 0.001 0.000 0.000 0.000 0.000
Wealth_index ¼ poor 0.016 �0.007 0.010 0.000 0.002 0.009
Wealth_index ¼ middle �0.013 �0.002 0.000 0.000 0.000 0.000
Wealth_index ¼ rich �0.054 �0.014 �0.034 �0.005 �0.013 �0.039
Wealth_index ¼ richest �0.132 �0.056 �0.121 �0.011 �0.038 �0.116
Subtotal �0.162 �0.080 �0.134 �0.014 �0.048 �0.139
Residual: regression error 0.004 �0.001 �0.008 0.000 �0.002 �0.005
Residual: missing data �0.011 �0.002 0.001 0.000 0.000 0.000
Inequality (total) �0.171 �0.083 �0.093 �0.001 0.004 �0.081
Inequity/unjustified
inequality
�0.158 �0.081 �0.142 �0.014 �0.050 �0.145
GES, Regime of Explicit Health Guarantees.
p u b l i c h e a l t h 1 7 8 ( 2 0 2 0 ) 3 8e4 8 45
and a physical limitation (Table 4). Thus, indicating that
these conditions were more frequent among richer in-
dividuals. On the other hand, gender made a small contri-
bution. The poor income quintile made a positive
contribution to the concentration index for child under-
weight, self-assessed health, and physical limitations,
implying that being in the poorest quintile makes these
outcomes more frequent. The middle quintile made the
concentration index more pro-rich for child underweight
and overweight. The rich and richest quintiles made a
negative contribution to the concentration index for all the
health outcomes in the analysis. Therefore, these health
outcomes were more frequent among poor individuals (i.e.
individuals in the higher income quintiles are healthier than
those in the lower quintiles).
Fig. 5 e Concentration curves of
Health utilizationThe concentration curves for health utilization did not show
considerable changes during the time analyzed (1990e2015)
(Fig. 5). Please refer to Online Resource 6 for a complete
description of the results. The concentration curves corre-
sponding to the number of preventive healthcare services and
emergency visits all lay above the 45� line. This meant that
poorer households received more preventive healthcare ser-
vices and emergency visits than the richer (Fig. 5). The con-
centration curve related to number of medical visits has
become very close to the equality line. The concentration
curves for number of specialty visits, number of hospitaliza-
tions, number of X-ray exams, and number of dental visits, all
lay below the equality line, indicating that richer households
benefited much more from this healthcare services (Fig. 5).
utilization year 1990e2015.

p u b l i c h e a l t h 1 7 8 ( 2 0 2 0 ) 3 8e4 846
The evolution of utilization of healthcare services by year
suggested that there was an increase in the use of all type of
healthcare services, except dental care visits in which a
decrease in the utilization of services over the years was
observed (Fig. 6). This may be explained by the relative high
costs of dental services, most of the time not covered by
health insurance systems. See detail in Online Resource 7.
Discussion
The Chilean Ministry of Health has historically been
committed to maternal and child health and has imple-
mented nutrition policies and programs that have beenwidely
accepted as successful in the rehabilitation of malnourished
children and mothers.23 Furthermore, according to studies,
stunting has been practically eliminated in the country.24,25
However, our findings suggest that some additional efforts
are required specially for children, pregnant, and older with
lower income level. Nevertheless, what is notable today is the
increase in overweight and obesity problems with high risks
for chronic diseases.26e28 This showed the need to modify the
nutrition programs and education of the population empha-
sizing the importance of prevention programs and healthier
lifestyles.
Our results indicated that the concentration of people
suffering from a health problem or a GES condition were
similar in the poorest and richest households. Furthermore,
the concentration indexes for health outcomes suggested that
the allocation of income makes the distribution of health
conditions pro-poor. However, the opposite was observed for
age among richer individuals, where the probability of health
problems increased with age. To some extent, this finding
Fig. 6 e Utilization of healt
contradicts the theory that income and wealth support better
health (i.e. richest people can afford the resources that protect
and improve their health). However, advancing age is also
associated with a higher risk of getting age-related diseases
such as Alzheimer's, heart disease, stroke, diabetes, and
cancer, which do not depend on just income level, but also on
diet and other lifestyle characteristics. Additionally, we based
our results on answers from the CASEN survey, and studies
have found that people with lower income are less likely than
theirmore socially advantaged counterparts to agree that they
have a higher risk of ill health and to acknowledge a social
gradient in health.29
When examining the concentration curves for utilization
of healthcare services, we found that the use of dental visits,
laboratory exams, specialty visits, and hospitalizations were
concentrated on the richest households. According to our re-
sults, their use has been increasing over the time (except for
dental visits). This highlighted the importance of strong pre-
ventive programs, especially given the rise in prevalence of
chronic diseases among the Chilean population.30 Social pre-
ventive programs are essential for promoting healthy behav-
iors and preventing the complications of chronic diseases, i.e.
reducing the utilization of other healthcare services.
The use of emergency visits and preventive visits were
highly concentrated among poor individuals, and its use had
also increased in 1990e2015. Medical visits were more equally
distributed among income groups, and their use has increased
over the years of analysis. These patterns can be explained by
current Chilean mixed healthcare system. According to the
latest CASEN survey, 78% of the population is covered by the
public insurance system, and just 15% of the population is
covered by the private insurance system.21 In general, the
richest individuals covered by private insurance systems have
hcare services by year.

p u b l i c h e a l t h 1 7 8 ( 2 0 2 0 ) 3 8e4 8 47
better access to healthcare services, infrastructure, and spe-
cialists. Additionally, dental visits and laboratory exams de-
mand a higher amount of out-of-pocket payment and
increases of emergency visits could be a consequence of the
long waiting times for a specialist in the public sector; many
C5 patients (least urgent or least acute patients) attend
directly to the emergency services.31 These findings are also in
line with what was described by Vasquez et al., who reported
about income-related inequalities in health and healthcare
utilization in Chile.17
The last reform significantly altered the Chilean health
system by introducing a single supplemental benefit plan for
both the publicly insured and the privately insured tied to
social security, in which the quality in healthcare provision
and delivery was highly emphasized. Even though we
observed a positive trend in the increase of medical service
use, no significant impact on improving equity in health after
the implementation of the new health reform was observed.
However, the reform is still underway, and we might observe
its effects in the future.
Limitations
The limitations of this study are related to the use of sec-
ondary data. There was a longer than usual self-reported
recall period of 1 year or 6 months for most of the questions
related to health care in the CASEN survey, which may have
increased recall bias. Also, we are aware that estimates of
healthcare use can suffer from the same recall bias. We also
recognize that self-report bias might exist for variables such
as service utilization and income. Individuals tend to under-
report their income, which may lead to underestimation of
inequalities across income groups. However, service utiliza-
tion can either be under or overreported; therefore, the pre-
sent analysis may be biased, but it is uncertain of the
direction. In addition, we studied healthcare equity based on a
household survey that collects information regarding the
frequency of use of different healthcare services and health
outcomes; however, a more specific survey is required to
assess the different constructs involved in measuring acces-
sibility to healthcare services, which it represents the next
step in this research.
Policy implications
The relevance of this study relies on the need for more
continuous, routine, and systematic assessments of equity
in health over time, as a tool to understand the impact and
implications of policies implemented in the healthcare sys-
tem. We provide evidence on the impact of ‘GES conditions’
and their transversal nature among income levels and
geographical regions. Even though the current reform is still
underway and we may notice its long-term effects later,
there is still a space for improvement to prevent barriers of
access (e.g. shortage of healthcare professionals, waiting
times, elevated cost, preference for self-diagnosis, among
others) that are still faced by the Chilean population. There is
still work that needs to be done to move toward universal
health care.
Author statements
Acknowledgments
The authors acknowledge CONICYT/FONDECYT for funding
this project (CONICYT/FONDECYT #11160150 and CONICYT/
FONDECYT #11180151). This article uses data from the CASEN
survey and the ADEPT software Platform.
Ethics approval
Not applicable. This study does not require ethics approval.
There is no direct human subject involvement in this study.
Consent from the patient is not required, as this study reports
an analysis of secondary population group data from the
CASEN survey. No individual or his/her information can be
identified.
Funding
Support for this research was received from CONICYT/FON-
DECYT #11160150, and CONICYT/FONDECYT #11180151.
Competing interest
The authors declare that they have no competing interests.
Consent for publication
Not applicable.
Availability of data and material
In this manuscript we are reporting data from the CASEN
survey that is publicly accessible in http://observatorio.
ministeriodesarrollosocial.gob.cl/index.php by the Govern-
ment of Chile.
Authors contribution
A.N.M. principal investigator developed the original research
idea and questions, obtained the data for this study, con-
ducted data analysis, interpreted the results, and wrote the
manuscript. C.A.M. contributed with data interpretation (fig-
ures and tables) and writing the manuscript. C.C. contributed
to the original research idea and questions and contributed to
the writing and revisions of the manuscript.
r e f e r e n c e s
1. Wagstaff A, Van Doorslaer E, Watanabe N. On decomposingthe causes of health sector inequalities with an application tomalnutrition inequalities in Vietnam. J Econom2003;112:207e23.
2. Whitehead M. The concept and principles of equity andhealth. Int J Health Serv 1992;22:429e45.
3. Wagstaff A, Van Doorslaer E. Equity in health care financeand delivery. Handb Econom 2000;17:1803e62.

p u b l i c h e a l t h 1 7 8 ( 2 0 2 0 ) 3 8e4 848
4. Commission on Social Determinants of Health. Closing the gapin a generation: health equity through action on the socialdeterminants of health. Final report of the commission on socialdeterminants of health. Geneva: World Health Organization;2008.
5. Monteiro L, Pellegrino A, Solar O, Rıgoli F, Malagon deSalazar L, Castell-Florit P, Gomes K, Swift T, Bravo F, Atun R.Social determinants of health, universal health coverage, andsustainable development:case studies from Latin Americancountries. The Lancet 2015;385:1343e51.
6. Vega J. Enfermo de Pobre. Las Inequidades sociales y la saluden Chile. Revista Universitaria 2001;73:43e56.
7. Missoni E, Solimano G. Towards universal health coverage: theChilean experience. World Health Report. 2010. Background paper4; 2010.
8. MINSAL 2019. Dise~no e Implementaci�on de una Metodologıa deEvaluaci�on, Seguimiento y Acompa~namiento de la Reforma de laSalud de Chile. http://www.paho.org/chi/images/PDFs/resumenejecutivo.pdf?ua¼1, 2019. [Accessed 21 May 2019].
9. Infante A, de Paraje G. Reforma de Salud: Garantıas Exigiblescomo Derecho Ciudadano. In: Larraneaga O, Contreras D,editors. Las Nuevas Polıticas de Protecci�on Social en Chile.Santiago de Chile, Chile: Uqbar Editores; 2010. p. 77e118.
10. Gobierno de Chile. http://www.gobiernodechile.cl, 2009.[Accessed 31 May 2009].
11. FONASA: Tramos y copagos. https://www.fonasa.cl/sites/fonasa/beneficiarios/informacion-general/tramos, 2017.[Accessed 23 January 2017].
12. Superintendencia de Salud. http://www.supersalud.gob.cl/portal/w3-channel.html, 2015. [Accessed 15 December 2015].
13. ISAPRE. http://www.isapresdechile.cl, 2011. [Accessed 5August 2011].
14. Kongstvedt PR. Essentials of managed care. Jones & BartlettLearning; 2007.
15. Zerda A, Vel�asquez G, Tobar F, Vargas J. Health insurancesystems and access to medicines - case studies from: Argentina,Chile, Colombia, Costa Rica. Guatemala and the United States ofAmerica. D.C.: PAHO; 2002.
16. Jadue L, Marın F. Determinantes Sociales de la Salud en Chile: En laPerspectiva de la Equidad. Santiago de Chile: Policy Institute ofEpidemiology and Public Health; 2005.
17. V�asquez F, Paraje G, Estay M. Income-related inequality inhealth and health care utilization in Chile, 2000-2009. RevPanam Salud Public 2013;33:98e106.
18. Frenz P, Delgado I, Kaufman J, Harper S. Achieving effectiveuniversal health coverage with equity: evidence from Chile.Health Policy Plan 2014;29(6):717e31.
19. Nu~nez A, Chi C. Equity in health care utilization in Chile. Int JEquity Health 2013;12:58.
20. Nu~nez A, Chi C. Equity in out-of-pocket payment in Chile. RevSaude Publica 2017;51:44.
21. Encuesta Casen. http://observatorio.ministeriodesarrollosocial.gob.cl/index.php, 2019. [Accessed24 January 2019].
22. ADePT Software Platform. menuPK:7108381~pagePK:64168176~piPK:64168140~theSitePK:7108360,00.html,http://econ.worldbank.org/WBSITE/EXTERNAL/EXTDEC/EXTRESEARCH/EXTPROGRAMS/EXTADEPT/0, 2017. [Accessed9 August 2017].
23. Bossert TJ, Leisewitz T. Innovation and change in the Chileanhealth system. N Engl J Med 2016;374(1):1e5.
24. Athala E, Amigo H, Bustos P. Does Chile's nutritional situationconstitute a double burden? Am J Clin Nutr2013;100(6):1623Se7S.
25. Mardones F, Passi A, Rosso P, Rozowski J, Torres-Robles R,Cantwell J, Olagnero Gm, Fern�andez X. Nutrition and healthof women in Chile. Annal Nutr Food Sci 2017;1(2):1007.
26. Kain J, Galvan M, Taibo M, Corvalan C, Lera L, Uauy R.Evolution of the nutritional status of Chilean children frompreschool to school age: anthropometric results accordingto the source of the data. Arch Latinoam Nutrition2010;60:155e9.
27. Amigo H, Bustos P, Erazo M, Cumsille P, Silva C. Determinantfactors of excess of weight in school children: a multilevelstudy. Rev Med Chile 2007;135:1510e8.
28. Ratner R, Sabal J, Hernandez P, Romero D, Atalah E.Nutritional status and lifestyles of workers from two regionsin Chile. Rev Med Chile 2008;136:1406e14.
29. Macintyre S, McKay L, Ellaway A. Are rich people or poorpeople more likely to be ill? Lay perceptions, by social classand neighbourhood, of inequalities in health. Soc Sci Med2005;60(2):313e7.
30. OECD Reviews of Public Health. Chile: a healthier tomorrow.Assessment and recommendation. https://www.oecd.org/health/health-systems/OECD-Reviews-of-Public-Health-Chile-Assessment-and-recommendations.pdf, 2019. [Accessed 23May 2019].
31. Nu~nez A, Neriz L, Mateo R, Ramis F, Ramaprasad A.Emergency departments key performance indicators: aunified framework and its practice. Int J Health Plan Manag2018;33(4):915e33.
Appendix A. Supplementary data
Supplementary data to this article can be found online at
https://doi.org/10.1016/j.puhe.2019.08.017.
Related Documents