HEALTH INSURANCE COST AND PREMIUM SHARING * Vasilios D. Kosteas Francesco Renna Assistant Professor Associate Professor Department of Economics Department of Economics Cleveland State University The University of Akron [email protected] [email protected] 2121 Euclid Avenue, RT 1712 290 Buchtel Common Cleveland, OH 44115-2214 Akron, OH44325-1908 Abstract: Employees may have heterogeneous preferences with respect to the level of health insurance coverage desired. Hence employers may offer multiple health insurance plans and use employee premium sharing to sort workers according to how they value health insurance. The benefits of sorting workers increase with the cost of heath insurance. We use data from the “Employer Health Benefits Survey”, to analyze the effect of health insurance premiums on premium sharing for firms offering multiple plans, focusing on firms that offer HMO and PPO plans. We find that the worker’s contribution for family coverage increases as the premium rates increases. The contributions for single coverage increase as the own premium rate increases and decrease as the cross premium rate increases. * The authors would like to thank participants at the seminars held by the University of Toledo, Universita` La Sapienza, and Universita` Cattolica del Sacro Cuore. All remaining errors are, of course, our own. We would also like to thank Ben Finder at the Kaiser Family Foundation for helping us to obtain the dataset.

Welcome message from author
This document is posted to help you gain knowledge. Please leave a comment to let me know what you think about it! Share it to your friends and learn new things together.
Transcript
HEALTH INSURANCE COST AND PREMIUM SHARING*
Vasilios D. Kosteas Francesco Renna Assistant Professor Associate Professor Department of Economics Department of Economics Cleveland State University The University of Akron [email protected] [email protected]
2121 Euclid Avenue, RT 1712 290 Buchtel Common Cleveland, OH 44115-2214 Akron, OH44325-1908
Abstract: Employees may have heterogeneous preferences with respect to the level of health insurance coverage desired. Hence employers may offer multiple health insurance plans and use employee premium sharing to sort workers according to how they value health insurance. The benefits of sorting workers increase with the cost of heath insurance. We use data from the “Employer Health Benefits Survey”, to analyze the effect of health insurance premiums on premium sharing for firms offering multiple plans, focusing on firms that offer HMO and PPO plans. We find that the worker’s contribution for family coverage increases as the premium rates increases. The contributions for single coverage increase as the own premium rate increases and decrease as the cross premium rate increases.
* The authors would like to thank participants at the seminars held by the University of Toledo, Universita` La Sapienza, and Universita` Cattolica del Sacro Cuore. All remaining errors are, of course, our own. We would also like to thank Ben Finder at the Kaiser Family Foundation for helping us to obtain the dataset.
1. Introduction
The cost of health insurance relative to payroll increased 34 percent between 1996 and 2005
(Eibner and Marquis, 2008). As health insurance costs continue to rise, researchers have paid
greater attention to issues of access to insurance, particularly through employer sponsored plans.
Most of this attention has focused on the extensive margin of health insurance access, i.e.
whether firms make employer sponsored plans available to their employees. Significantly less
attention has been paid to the intensive margins –how much of the cost of providing health
insurance is paid for by firms or the average quality of these insurance plans. This paper focuses
on the first of these intensive margins, specifically on the question of how the price of health
insurance affects how firms offering multiple health insurance plans determine the worker’s
contribution toward each plan.
Contemporaneously to the rise of health insurance costs, the percentage of firms that offered
health benefits decreased from 69% to 60% from 2000 to 2007, although this drop seems to be
driven primarily by firms employing less than 10 workers (Kaiser/HRET, 2008, Exhibit 2.2). In
fact, the percentage of large firms (i.e. firms that employed more than 200 employees) that
offered health insurance did not change at all during the same period. Large firms almost
universally offer health benefits (99%), and this rate has remained unchanged over the same time
period. This fact is supported by the conclusion in many studies that a firm’s decision to offer
health insurance is price inelastic.1 Although premium size does not seem to have an impact on
large firms’ decision to offer health insurance at the extensive margin, it could be that they affect
the employer’s decision at the intensive margin, i.e. the share of the cost that is passed onto
workers. In fact, the percentage of firms paying for the entire premium of single coverage
decreased dramatically from 32% in 2001 to 20% in 2007, and from 14% in 2001 to 6% in 2007 1 See Table 1 in Marquis and Long (2001) for a summary of the results in the literature.
2
for family coverage (Kaiser/HRET, 2008, Exhibit 6.9). This is a new trend in the economy, as
there is no evidence that before 2001 the percentage of firms that paid for the full price of the
health insurance was sensitive to the price of the premium (Zawacki and Taylor, 2005). In light
of this evidence, the question of how premium sharing between employees and employers
responds to increases of health insurance premiums becomes a pressing one. In fact, Cutler
(2003) shows that most of the recent decrease in employer sponsored health insurance coverage
can be explained by a decrease in take-up rates by employees due to an increase in the cost to
them rather then a decrease in offering rates by employers.
The issue of premium sharing is of particular importance for large firms, since they are the
least likely to drop health insurance from their compensation package. Large firms are also more
likely to offer multiple plans. In 2001, 56.7% of firms with more than 50 employees offered
more than one plan in 2001, while only 12.5% of smaller firms offer multiple plans (Crimmel,
2003). Hence, the question of how the increase in the cost of health insurance affects premium
sharing cannot disregard the fact that large firms offer multiple plans. This paper is the first to
study the effect of health insurance premiums on cost sharing for firms offering multiple plans.
The rest of the paper is organized as follow: next section reviews the literature on this topic.
Section 3 describes the model and section 4 outlines the methodological strategies adopted for
the estimation. Section 4 describes the data while the empirical results are discussed in Section 5.
Finally we conclude with some final remarks on the main finding of this paper.
2. Literature review
Very little is known about the determinants of premium sharing, and even less about the
role played by health insurance premiums. Marquis and Long (2001) estimate the level of
3
employer contribution to the health insurance premium as a function of current labor market
conditions. Among other factors, they found that the employer’s premium share is higher when
the firm operates in tighter labor market condition, when there is greater union penetration and a
greater share of workers are employed in big business. They do not control for insurance
premiums, although they found that state income tax rates, which they believe to best capture
price effects, do not have a significant impact on the employer’s contribution.
Gruber and McKnight (2003) identify four determinants of premium sharing: the tax
subsidies on the employer contribution, the availability of coverage outside the firm, the
penetration of health care, and the size of the health insurance premium. However, since their
data lacks information on both health insurance premiums and premium sharing, they can only
estimate the effect that an increase in health care cost (a proxy for health insurance premium) has
on the odds an employer will pay all/some/none of the premium. Consistent with their
hypothesis, they found that when the cost of health care increases, the probability that an
employer pays the entire insurance premium decreases: for each US$1,000 increase in medical
costs there is a 2.7% reduction in the probability that employers pay all of the cost of health
insurance. They also found evidence that employers use premium sharing to encourage workers
to obtain coverage through alternative forms of coverage. For example, as the proportion of
employees eligible for Medicaid increases, the share of the premium passed on to workers is
higher. This result has been confirmed by other studies (Shore-Sheppard et al., 2000;
Buchmueller et al., 2005). Along the same line, Dranove et al. (2000) and Vistnes et al. (2006)
found that employers raise employee contributions to encourage them to obtain coverage from
their spouses’ employers. Both Dranove et al (2000) and Vistnes et al (2006) control for
premium size. While they found that an increase in the premium leads to an increase in the dollar
4
amount that it is paid by the worker, they found a negative or insignificant effect on the on the
share of the premium that is passed on to workers. However, since premiums also reflect
unmeasured plan quality, their results may be due to endogeneity.
While the cost of health insurance may affect premium sharing, the types of plan offered
by a firm will affect the premiums as well. For example, Feldman et al (1993) found that,
although a Health Maintenance Organizations (HMO) plan may reduce the cost of health care by
reducing the level of health care utilization, offering an HMO increased the weighted average
premium of a firm offering multiple plans. Both Baker and Corts (1995) and Mossirey et al.
(2003) conclude that this increase in the average premium is due to the fact that higher HMO
penetration decreases the premium on HMO plans but it increases the premium in non-HMO
plans, such as Preferred Provider Organization (PPO) or conventional plans.
The existing literature has primarily focused only on the relationship between the cost of
the plan and premium sharing, assuming that firms offer only one plan. Vistnes et al. (2006) is
the only study that runs separate regression for each plan, but the authors limit their analysis to
the effect on the own premium on the “marginal employee premium contribution”, i.e. the
difference between required contributions for individual and family coverage. A comprehensive
study of how the own-price as well as the cost of other health plans offered by a firm affect the
contribution schedule is lacking. This research aims at shedding light on this important issue.
3. Theoretical background
In our simple model, workers need to select a compensation package composed of a wage and
health insurance. Assume a firm offers all employees the same wage (w), but offers two health
insurance plans with different quality levels, QL and QH, and associated premiums PL and PH,
5
with PL > PH. Employees are heterogeneous according to their preferences over the quality of
health insurance. We make the assumption that there are two classes of workers: workers who
demand health insurance and workers who do not demand health insurance. Furthermore, we
assume that there are two types of workers who demand health insurance: type 1 with a weak
preference for health insurance, and type 2 with a strong preference for health insurance.
Workers with high demand are workers who expect a higher health care utilization than workers
with a low demand for health insurance. For example, families with children or individuals with
health problems are more likely to demand more health services.
Some firms would choose not to offer any health insurance plan. Holding the total
compensation package constant, firms that do not offer any plan will pay a higher wage (w*).
When a worker who demands health insurance (high or low quality) is considering a job with a
contract {w, Qi} from a firm that offers multiple health insurance plans, she has the option to
accept another job which pays w* and buy health insurance outside the employer plan. Hence,
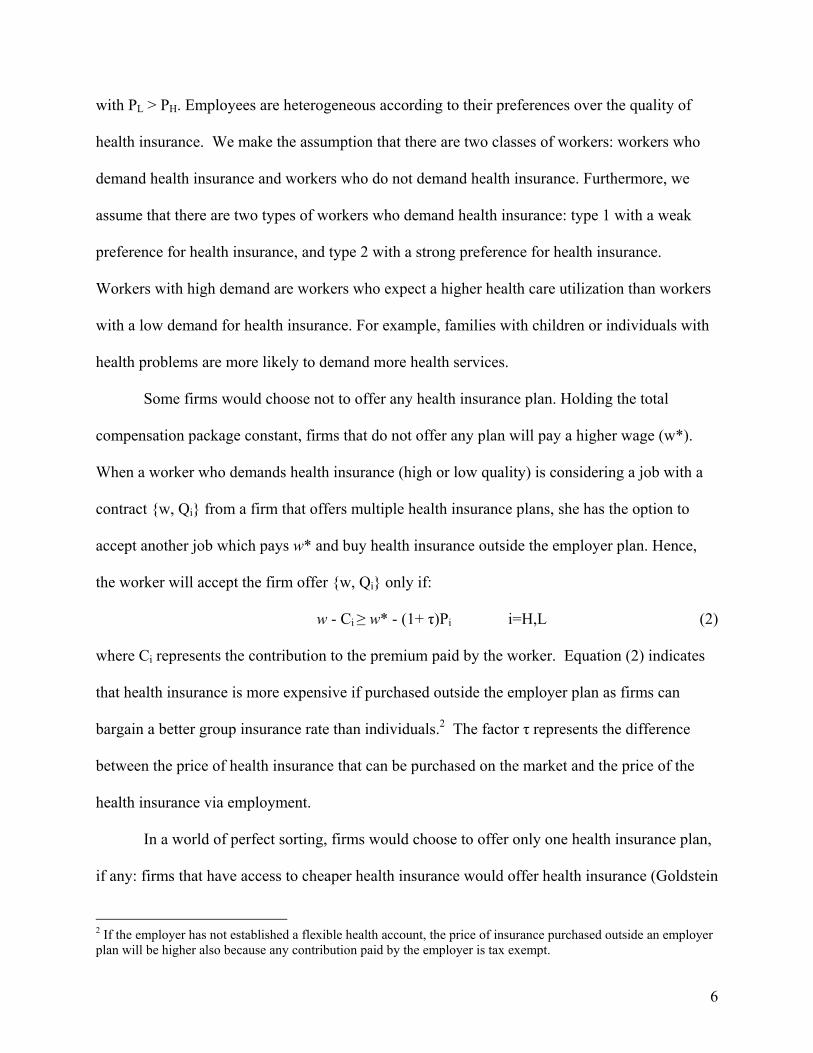
the worker will accept the firm offer {w, Qi} only if:
w - Ci ≥ w* - (1+ τ)Pi i=H,L (2)
where Ci represents the contribution to the premium paid by the worker. Equation (2) indicates
that health insurance is more expensive if purchased outside the employer plan as firms can
bargain a better group insurance rate than individuals.2 The factor τ represents the difference
between the price of health insurance that can be purchased on the market and the price of the
health insurance via employment.
In a world of perfect sorting, firms would choose to offer only one health insurance plan,
if any: firms that have access to cheaper health insurance would offer health insurance (Goldstein
2 If the employer has not established a flexible health account, the price of insurance purchased outside an employer plan will be higher also because any contribution paid by the employer is tax exempt.
6
and Pauly, 1976). Workers will sort themselves across firms according to their preferences for
health insurance coverage versus monetary wages. Some firms will not offer health insurance
and hire only workers that do not demand health insurance; other firms will offer low quality
plans and hire only type 1 workers; and the remaining firms will offer high quality plans and hire
only type 2 workers. In a more realistic model, firms do not necessarily hire workers with
homogeneous preferences with respect to health insurance coverage. Hence, firms may attract
better workers by offering multiple plans to more closely match each worker’s preference. These
firms must choose the employee contribution to each type of health plan, CL and CH, in order to
minimize their overall cost. Cost minimization implies that, type 1 workers choose the low
quality plan and type 2 workers choose the high quality plan. In fact, total expenditure on health
benefits would increase if some type 1 worker actually buys the more expensive plan. In a
separating equilibrium, the contribution to be paid for the low quality plan has to be lower than
the contribution to be paid for the high quality plan, otherwise even the worker with the low
preference for health insurance will buy the more expensive plan:
HL CC < ,
since CL cannot be negative, this implies that CH must always be greater than zero.
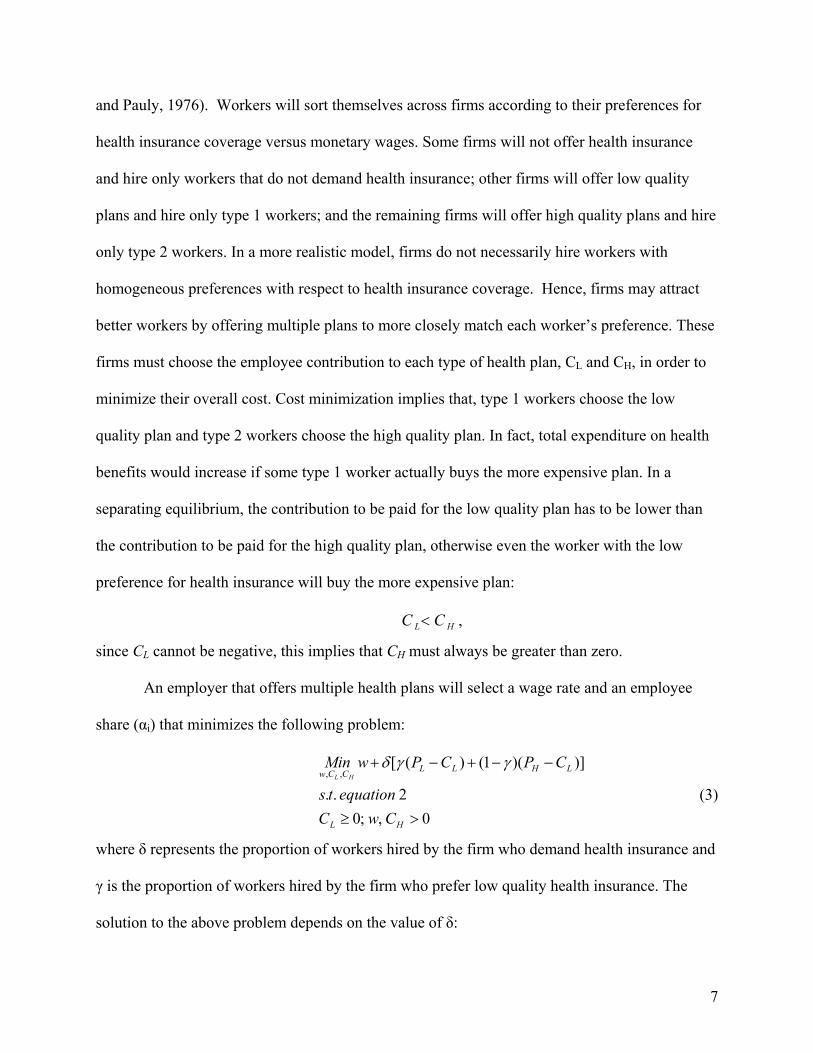
An employer that offers multiple health plans will select a wage rate and an employee
share (αi) that minimizes the following problem:
0,;02..
)])(1()([,,
>≥
−−+−+
HL
LHLLCCw
CwCequationts
CPCPwMinHL
γγδ
(3)
where δ represents the proportion of workers hired by the firm who demand health insurance and
γ is the proportion of workers hired by the firm who prefer low quality health insurance. The
solution to the above problem depends on the value of δ:
7
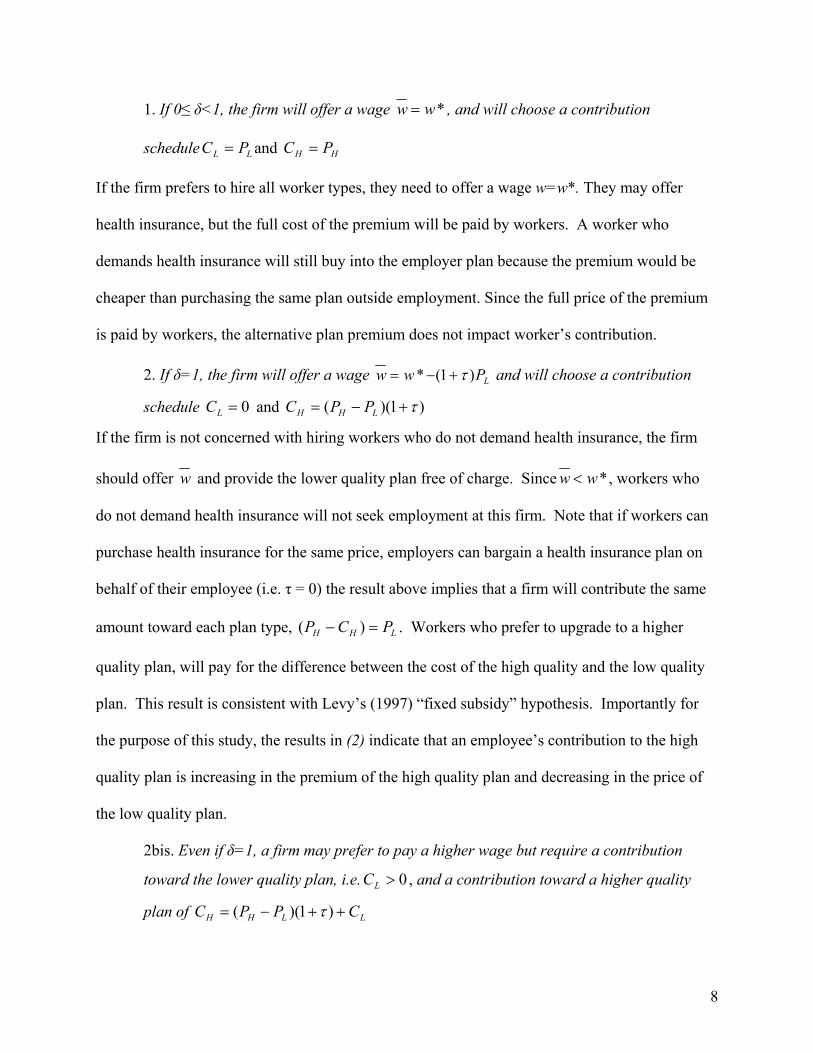
1. If 0≤ δ<1, the firm will offer a wage *ww = , and will choose a contribution
schedule and LL PC = HH PC =
If the firm prefers to hire all worker types, they need to offer a wage w=w*. They may offer
health insurance, but the full cost of the premium will be paid by workers. A worker who
demands health insurance will still buy into the employer plan because the premium would be
cheaper than purchasing the same plan outside employment. Since the full price of the premium
is paid by workers, the alternative plan premium does not impact worker’s contribution.
2. If δ=1, the firm will offer a wage LPww )1(* τ+−= and will choose a contribution
schedule and 0=LC )1)(( τ+−= LHH PPC
If the firm is not concerned with hiring workers who do not demand health insurance, the firm
should offer w and provide the lower quality plan free of charge. Since *ww < , workers who
do not demand health insurance will not seek employment at this firm. Note that if workers can
purchase health insurance for the same price, employers can bargain a health insurance plan on
behalf of their employee (i.e. τ = 0) the result above implies that a firm will contribute the same
amount toward each plan type, LHH PCP =− )( . Workers who prefer to upgrade to a higher
quality plan, will pay for the difference between the cost of the high quality and the low quality
plan. This result is consistent with Levy’s (1997) “fixed subsidy” hypothesis. Importantly for
the purpose of this study, the results in (2) indicate that an employee’s contribution to the high
quality plan is increasing in the premium of the high quality plan and decreasing in the price of
the low quality plan.
2bis. Even if δ=1, a firm may prefer to pay a higher wage but require a contribution
toward the lower quality plan, i.e. , and a contribution toward a higher quality
plan of
0>LC
LLHH CPPC ++−= )1)(( τ
8
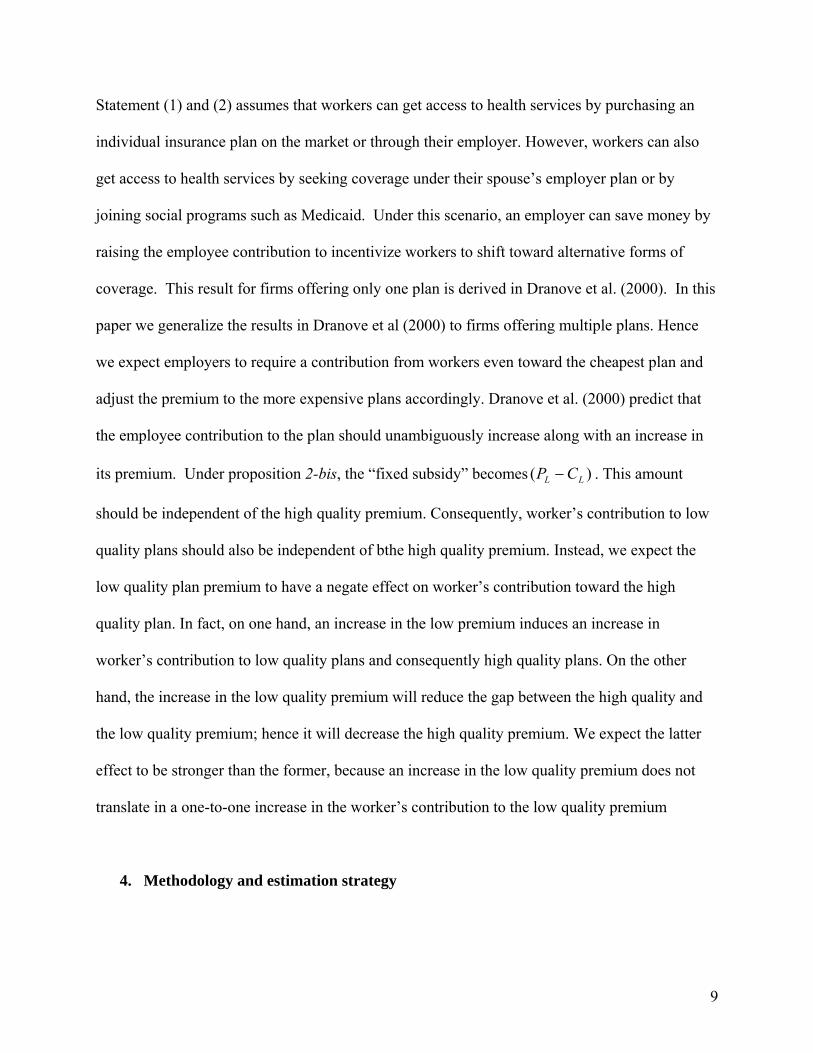
Statement (1) and (2) assumes that workers can get access to health services by purchasing an
individual insurance plan on the market or through their employer. However, workers can also
get access to health services by seeking coverage under their spouse’s employer plan or by
joining social programs such as Medicaid. Under this scenario, an employer can save money by
raising the employee contribution to incentivize workers to shift toward alternative forms of
coverage. This result for firms offering only one plan is derived in Dranove et al. (2000). In this
paper we generalize the results in Dranove et al (2000) to firms offering multiple plans. Hence
we expect employers to require a contribution from workers even toward the cheapest plan and
adjust the premium to the more expensive plans accordingly. Dranove et al. (2000) predict that
the employee contribution to the plan should unambiguously increase along with an increase in
its premium. Under proposition 2-bis, the “fixed subsidy” becomes )( LL CP − . This amount
should be independent of the high quality premium. Consequently, worker’s contribution to low
quality plans should also be independent of bthe high quality premium. Instead, we expect the
low quality plan premium to have a negate effect on worker’s contribution toward the high
quality plan. In fact, on one hand, an increase in the low premium induces an increase in
worker’s contribution to low quality plans and consequently high quality plans. On the other
hand, the increase in the low quality premium will reduce the gap between the high quality and
the low quality premium; hence it will decrease the high quality premium. We expect the latter
effect to be stronger than the former, because an increase in the low quality premium does not
translate in a one-to-one increase in the worker’s contribution to the low quality premium
4. Methodology and estimation strategy
9
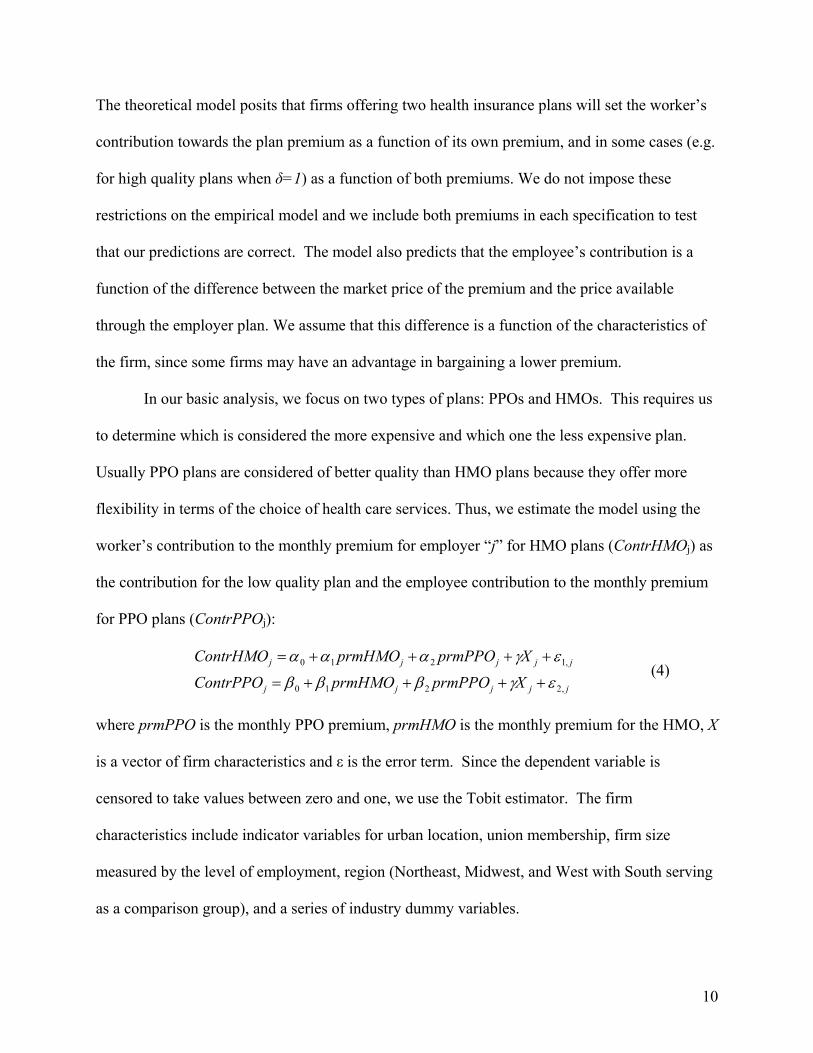
The theoretical model posits that firms offering two health insurance plans will set the worker’s
contribution towards the plan premium as a function of its own premium, and in some cases (e.g.
for high quality plans when δ=1) as a function of both premiums. We do not impose these
restrictions on the empirical model and we include both premiums in each specification to test
that our predictions are correct. The model also predicts that the employee’s contribution is a
function of the difference between the market price of the premium and the price available
through the employer plan. We assume that this difference is a function of the characteristics of
the firm, since some firms may have an advantage in bargaining a lower premium.
In our basic analysis, we focus on two types of plans: PPOs and HMOs. This requires us
to determine which is considered the more expensive and which one the less expensive plan.
Usually PPO plans are considered of better quality than HMO plans because they offer more
flexibility in terms of the choice of health care services. Thus, we estimate the model using the
worker’s contribution to the monthly premium for employer “j” for HMO plans (ContrHMOj) as
the contribution for the low quality plan and the employee contribution to the monthly premium
for PPO plans (ContrPPOj):
jjjjj
jjjjj
XprmPPOprmHMOContrPPO
XprmPPOprmHMOContrHMO
,2210
,1210
εγβββ
εγααα
++++=
++++= (4)
where prmPPO is the monthly PPO premium, prmHMO is the monthly premium for the HMO, X
is a vector of firm characteristics and ε is the error term. Since the dependent variable is
censored to take values between zero and one, we use the Tobit estimator. The firm
characteristics include indicator variables for urban location, union membership, firm size
measured by the level of employment, region (Northeast, Midwest, and West with South serving
as a comparison group), and a series of industry dummy variables.
10
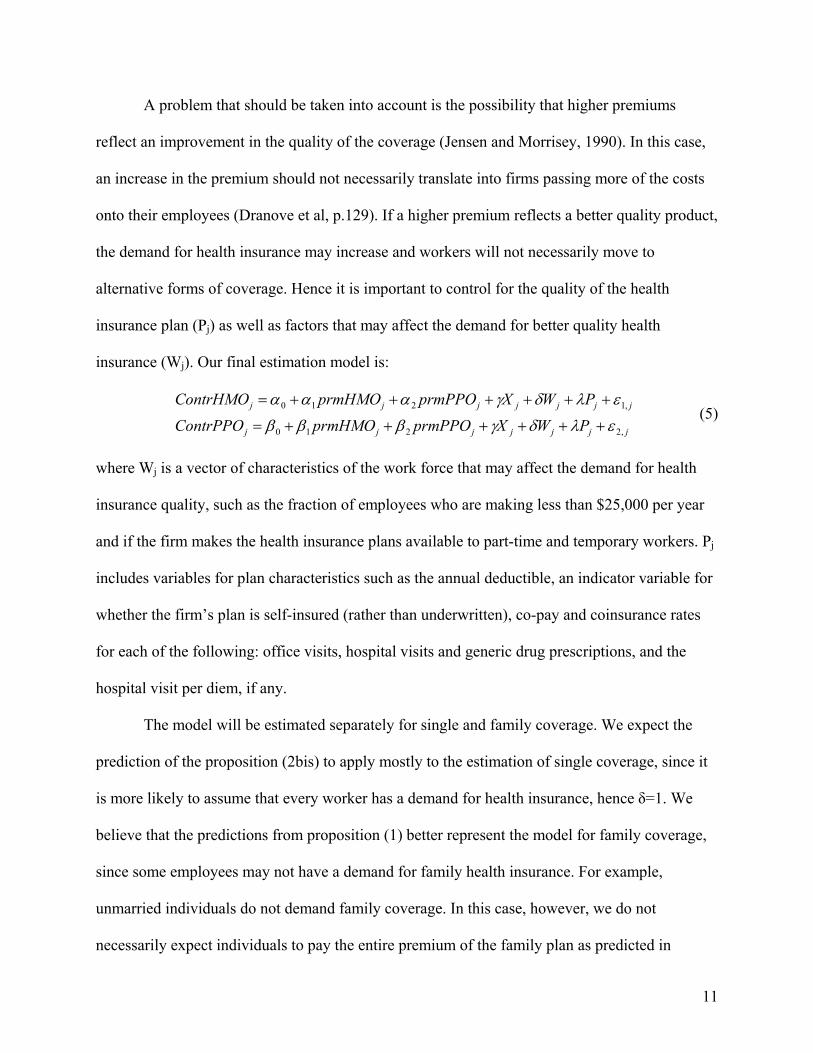
A problem that should be taken into account is the possibility that higher premiums
reflect an improvement in the quality of the coverage (Jensen and Morrisey, 1990). In this case,
an increase in the premium should not necessarily translate into firms passing more of the costs
onto their employees (Dranove et al, p.129). If a higher premium reflects a better quality product,
the demand for health insurance may increase and workers will not necessarily move to
alternative forms of coverage. Hence it is important to control for the quality of the health
insurance plan (Pj) as well as factors that may affect the demand for better quality health
insurance (Wj). Our final estimation model is:
jjjjjjj
jjjjjjj
PWXprmPPOprmHMOContrPPO
PWXprmPPOprmHMOContrHMO
,2210
,1210
ελδγβββ
ελδγααα
++++++=
++++++= (5)
where Wj is a vector of characteristics of the work force that may affect the demand for health
insurance quality, such as the fraction of employees who are making less than $25,000 per year
and if the firm makes the health insurance plans available to part-time and temporary workers. Pj
includes variables for plan characteristics such as the annual deductible, an indicator variable for
whether the firm’s plan is self-insured (rather than underwritten), co-pay and coinsurance rates
for each of the following: office visits, hospital visits and generic drug prescriptions, and the
hospital visit per diem, if any.
The model will be estimated separately for single and family coverage. We expect the
prediction of the proposition (2bis) to apply mostly to the estimation of single coverage, since it
is more likely to assume that every worker has a demand for health insurance, hence δ=1. We
believe that the predictions from proposition (1) better represent the model for family coverage,
since some employees may not have a demand for family health insurance. For example,
unmarried individuals do not demand family coverage. In this case, however, we do not
necessarily expect individuals to pay the entire premium of the family plan as predicted in
11
proposition (1) because the contribution for family plan coverage must be linked to the
contribution to single family coverage. If an employer share the cost of the single coverage
premium with the worker they have to offer a wage below w*(see preposition 2 and 2bis). Given
this level of wages, an individual who demands family insurance would not accept the offer at
the firm unless the employer also contributes toward the family plan as well. Hence, while we
expect the contribution of the premium paid by the worker to be a function of the price of the
specific plan (and not of the alternative plan) as predicted by proposition (1), the coefficient
should not be necessarily equal to one.
The model presented in the previous section defined the firm’s problem in terms of the
level of dollar contributions requested by the employer toward a given health plan. One could
also rewrite the problem in terms on the percentage of the premium that the employer requires
the worker to pay. Hence as robustness check we estimate the model using the employee share of
the premium as dependent variable. In this case, we include the monthly premiums for the PPO
and HMO plans in shares rather than levels. It can be shown that the predictions of the effect of
the PPO and HMO premiums on the percentage share of the PPO premium paid by the workers
are identical to those for the dollar contribution.3 However, the effect of the HMO premium on
the percentage share of the HMO premium paid by the workers is less clear, since Dranove et al
(2000) indicate that an increase in the premium does not necessarily translate in a one for one
increase in the employee’s contribution. The results for the premium share estimates are
available from the authors upon request.
We use a couple of alternative approaches to estimate equations (4) and (5). First, we
exploit the panel nature of the data used for the estimation to control for unobserved
heterogeneity among firms that may be correlated with premium rates. However, our use of the 3 Simply dividing the equation of the PPO contribution by the PPO premium will yield this result.
12
Tobit estimator (to take into consideration that contributions are censored at zero) means we can
only control for firm-level random effects. As a robustness check, we also re-estimate our model
using a selection estimator. In fact, when estimating equations (4) and (5), a firm is only
included in the sample if it offers both a PPO and an HMO plan. However, firms offering
multiple types of plans may have unobservable characteristics which also affect premium
sharing. For example, firms offering multiple plan types may offer more generous compensation
packages in general. To correct for a possible selection problem, we estimate a full maximum
likelihood selection model. Determining the selection equation is not as straightforward in this
case as in other cases of sample selection. Should we control for selection into the type of plan
being analyzed, or into the group of firms offering both an HMO and a PPO plan? We prefer the
latter selection process because it maximizes the number of observations. Additionally, the
former selection process is conditional to the other plan being offered, which may create an
additional selection problem.
5. Data
The estimation employs the 2005-2008 waves of the Employer Health Benefits Survey
collected by the Kaiser Family Foundation and the Health Research and Educational Trust.
These datasets contain rich information on the types of plans offered by firms, key characteristics
for the types of plans offered and key employer information. Completed surveys are available
for 2,013 firms in 2005, 2,122 firms in 2006, 1,997 firms in 2007, and 1,927 firms in 2008
leading to a total sample size of 6,132 firm-year observations. The numbers of observations
reflect a response rate of just under fifty percent in each year. KFF and HRET attempted to
repeat interviews with firms in successive waves of the survey. In order to maintain the general
13
structure of the sample size, non-responding firms were replaced with a firm belonging to the
same industry and size category. The survey identifies ten industry and seven firm size
categories.4 Interviews were also attempted with non-responding firms from the previous year,
so that a firm may be included in the survey in non-consecutive years. The four-year sample
includes 816 firms that participated in two out of the four years, 722 firms that participated in
three out of the four years and 626 firms that participated in all four surveys.
The information contained in the surveys was obtained through interviews with each
firm’s benefits manager or human resources manager. Employers are asked whether they offer
plans grouped into five categories: conventional plans, health maintenance organization (HMO)
plans, preferred provider organization (PPO) plans, point of sale (POS) plans and high-
deductible plans (HDP) linked to either a health retirement or health savings account. If the firm
offers any plans in a particular category, then information is gathered on the largest plan in that
category. Thus, we can not compare premium sharing between plans in the same category, only
between plans across categories.
The estimation in this paper focuses on two categories: HMO and PPO. These two types
of plans represent the most common plans offered by firms. Table 1 shows that roughly 75
percent of firms offer a PPO plan, while more than one-in-three offer an HMO, followed by POS
plans (one-in-four). Also, HMO and PPO plans represent the vast majority of enrollment for the
firms in the sample. In fact, PPO and HMO plans together account for about 80 percent of
enrollees in each year of the survey. Moreover, the statistics in Table 2 show that HMO and PPO
plans are the two plans most likely to be sponsored together by the same firm. Slightly less than
one-third of firms offering a PPO also offer an HMO plan (Table 2), while roughly one-in-eight
4 The industries are: Mining, Construction, Manufacturing, Transportation / Utilities / Communication, Wholesale, Retail, Finance, Service, Government, and Healthcare. The firm size categories are: 3-9 workers, 10-24 workers, 25-49 workers, 50-199 workers, 200-999 workers, 1000-4999 workers, and 5000+ workers.
14
will offer a POS plan along with the PPO plan. Conversely, over 70 percent of firms offering an
HMO also offer a PPO. Thus, focusing on firms which offer both a PPO and an HMO plan
serves as an excellent starting point for the analysis.
Table 3 presents the average premium, worker’s contribution and contribution share for
all four plan types by year, for the estimation sample. All monetary values are deflated using the
CPI and presented in 2005 dollars. The average premium has increased (in constant dollars)
each year for all plans over the period under analysis, although the increase was larger for HMO
plans (13.2 percent for single coverage and 11.4 percent for family coverage) than for PPO plans
(6.7 percent for single coverage and 6.4 percent for family coverage). Together with this increase
in the health insurance premiums, we observe an increase of the size of the worker’s
contribution. However, this increase does not always translate in a higher share of the cost paid
by workers. In fact, worker’s contribution shares seemed to have grown between 2005 and 2006
but decreased afterword.
Table 4 presents summary statistics for the key variables used in the analysis (again, all
monetary values are presented in 2005 dollars). The average monthly premium for single plans
is $390.73 and $336.62 for PPO and HMO plans, respectively. For family plans, the
corresponding figures are $1,066.67 and $964.66. This finding reinforces our assumption that the
HMO is the low quality plan and the PPO is the high quality plan, since the low quality plan has
to be cheaper than the high quality plan. The average employee’s premium share for PPO plans
for single (family) coverage is 19.6 (28.3) percent. For HMO plans, the corresponding figures
are 16.9 (single) and 26.9 (family) percent. On average, workers pay a smaller share of the
premium for HMO plans. We can also see that employees pay a greater share of the premium
for family coverage relative to single coverage. Furthermore, the data show significant variation
15
in plan costs and contribution rates. In PPO plans, the average co-pay for an office visit is
$13.97 while the average hospital visit co-pay is $62.03 and $8.69 for generic drug prescriptions.
Although HMO plans are cheaper, they have higher co-pays: the average co-pay for an office
visit is $14.86 while the average co-pay is $104.41 for a hospital visit and $9.08 for generic drug
prescriptions. These variables provide some indication of the plan’s quality; however it is not
the only indicator. PPO plans offer enrollees greater physician choice, and are less likely to
require referrals from the primary physician in order to see a specialist. Thus, because of these
features, PPO plans are generally considered better by potential enrollees than HMO plans
offering otherwise similar characteristics.
5. Results
Tables 5 and 6 present the results of the Tobit random effects. We estimate both the basic
and extended models for HMO and PPO plans using the employee’s contribution towards the
monthly premium in levels as the dependent variable. We treat the PPO as the higher quality
plan, relative to HMO plans. We predict that family coverage contributions should be in line
with proposition (1) while single coverage contributions are in line with proposition (2.bis).We
include both premiums in each specification even if the theory clearly that both premiums matter
only for the contributions toward single coverage PPO plans when δ<1. We prefer not to impose
any restriction on the estimation and test that our predictions are correct.
The estimates for the empirical models using information on family coverage are
presented in Table 5. These results support our predictions after we control for plan
characteristics. The results show that the worker’s contribution towards the HMO premium is
not a function of the PPO premium (column 1). Also, consistent with the theory, we see that
16
firms facing higher premiums pass on some of the higher cost to their employees. For every
dollar increase in the HMO monthly premium, on average, the worker’s contribution increases
by 22 cents. Thus, firms are still absorbing the majority of the rise in health insurance premiums.
The estimates for the firm characteristic variables show greater variation between the baseline
and the augmented model, indicating that some plan characteristics are correlated with firm
characteristics. Hence we will focus on the augmented model, which includes plan
characteristics. Larger firms tend to require a lower contribution from workers while firms with
a larger fraction of low-income workers tend to require a large contribution towards the
premium. As expected, unionized firms incur a greater share of the costs supporting the
prediction that unions can use their bargaining power to negotiate greater benefits concessions
from employers; on average, workers in unionized firms pay $64.47 less per month than workers
in non-unionized firms with comparable plans. Firms in all three regions: Northeast, Midwest
and West require lower contributions from their workers relative to firms in the South. These
results may reflect differences in labor market tightness between the regions, although the
regions are so broadly defined that they cover areas which are likely to contain significant
internal variation in both labor market conditions and institutional factors such as state laws. The
results do not vary much after controlling for plan characteristics (column 2).
Columns 3-4 present the results for the PPO estimates for the family plans. The results
show that the employees’ dollar contribution increases with the monthly PPO premium and has a
small, negative correlation with the monthly HMO premium for family coverage that becomes
insignificant after controlling for the plan characteristics. A one dollar increase in the PPO
premium is associated with a roughly 30 cent increase in the employee’s contribution. Again,
we see that larger firms require smaller contributions from their employees, while firms with
17
more low-income workers require larger contributions. As with the HMO regressions, unionized
workers contribute less towards the premium. On average, workers in the Northeast, Midwest
and the West all contribute less, ceteris paribus, than workers in the South.
Next, we estimate the models using information on HMO and PPO plans for single
coverage (Table 6). Here, the results show mixed support for our theoretical predictions. The
results for PPO plans (columns 3-4) support the predictions, showing that employee
contributions towards the PPO premium are increasing in the monthly PPO premium, but
decreasing in the HMO premium. A one dollar increase in the PPO (HMO) premium
corresponds to a 22.5 cent increase (4.1 cent decrease) in the workers’ contribution. The results
for HMO plans (columns 1-2) give credit to the hypothesis that employers may ask workers to
contribute toward the cheaper plan to induce some workers to find alternative form of coverage.
In fact, even for HMO plans we found that for one dollar increase in the own premium, employer
raise the worker’s contribution by 16 cents. However, contrary to our prediction we found that
cross-plan price (PPO premium) also affects the contribution toward the HMO plan. Overall
these findings are consistent with the firms taking on the majority of the additional burden as
health insurance costs rise. In contrast to the family coverage estimates, we find that larger firms
require greater contributions towards the monthly premium for single HMO plans, but this effect
is significant only in the HMO equation. Again, we see that employees working in a firm with a
high fraction of low-income workers contribute more towards the monthly premium; however
the effect is economically very small (a ten percentage point increase in the fraction of low-
income workers corresponds to a less than five cent increase in the monthly worker
contribution). As with the family plans, unionized workers also contribute less towards the
18
monthly premium (for both types of plans). For PPO plan, firms in the Northeast require larger
contributions while for both plan types firms in the West require smaller contributions.
Finally, Table 7 presents the results for the full maximum likelihood function selection
estimator. Since we observe several firms multiple times over time, we clustered the error terms
at the single firm level. For the sake of brevity, only the coefficients on the monthly premium
variables are presented. In each case, the extended model is estimated and all models include
industry and year indicators. The selection equation contains the same set of controls as the
outcome equation, thus the system is identified by the non linearity of the inverse Mills ratio.5
The results of the selection model support the results presented in Tables 5 and 6, although the
coefficient of the plan premiums are smaller in the selection model. Workers’ contributions
toward family plans are only a function of their own plan rate, while their contributions toward
single coverage are a function of both premiums. These results do not necessarily coincide with
our theoretical prediction. However, one needs to remember that the theoretical model assumes
that the high quality model is always the more expensive model, while in the empirical
estimation we make the assumption that the high quality model is the PPO plan. While on
average the PPO premiums are higher than the HMO premium (see Table 3), a not trivial number
of observations (23 percent) report a HMO premium higher than a PPO premium, which may
affect our estimation. Moreover, the significance of the coefficient on the PPO premium in the
worker’s contribution toward the single coverage HMO plan may indicate that workers consider
the two plans to be good substitutes to each other. As such, when one plan becomes more
expensive, employers push their employees toward the other plan by decreasing the contribution
toward the alternative plan.
5 We also estimated a model where workers characteristics affect the probability of offering both HMO and PPO plans but not the premium sharing. We found that the results are identical to those reported in Table 7 except for the HMO single coverage equation, where the HMO plan premium is found to have a bigger coefficient (0.142).
19
6. Conclusions
This paper developed a simple model of how firms determine employee contributions
towards health insurance premiums when multiple plans of different quality are offered. The
model predicts two possible scenarios: (1) every employee demand health insurance; (2) some
employees do not demand health insurance. We identify the market for individual coverage as
the scenario in which each agent demands health coverage, while the market for family coverage
as the market in which some individual do not demand coverage.. Our model predicts that when
some individuals do not demand health insurance, the contribution toward each plan should be a
function of the own price. Instead, when every worker demand health insurance, that worker
contributions towards the low cost plan should be increasing in the own-plan price while the
contribution toward the more expensive plan will be increasing in the expensive plan price and
decreasing in the price of the lower-cost plan. The empirical estimation using firm-level data
from 2005-2007 is based on the assumption that HMO plans are low quality plans and PPO plans
are high quality plans. This selection was supported by the fact that PPO plans are on average
more expensive than HMO plans, although for a non trivial number of observation the opposite
is actually true, which may explain why our empirical results do not always follow the
theoretical prediction.
Consistent with the theoretical prediction, estimates show a positive and highly
statistically significant correlation between the worker’s contribution to the family coverage plan
and that plan’s monthly premium. The estimation of the worker contribution to a single
coverage plan is found to increase in the own-plan price and decrease in the other plan price. The
latter result is consistent with the theoretical prediction for the PPO premium sharing but not for
20
the HMO premium sharing. Overall, we notice that despite recent complaints that firms are
pulling back from paying for health benefits, the firm always absorbs the larger share of the
increase in the cost of health insurance. In fact, firms make employees pay always less than half
of the increase in the cost of the premium. However, since there is a trade off between monetary
compensation and fringe benefits, the increase in the cost of health insurance together with a
relative modest increase in the worker’s contribution may explain why nominal salaries have
grown relatively slower than the cost of health insurance over the period under analysis.
21
REFERENCES
Baker, Laurence C., and Kenneth S. Corts (1995). “The Effects of HMOs on Conventional Insurance Premiums: Theory and Evidence”, NBER working paper 5356.
Buchmueller, T., P. Cooper, K. Simon and J. Vistnes (2005). The Effect of SCHIP Expansions on Health Insurance Decisions by Employers, Inquiry, 42(3): 218–231. Crimmel, Beth Levin (2003), “Employee Choice in Employer-Sponsored Health Insurance Plans: 2001”, Center for Financing, Access, and Cost Trends, AHRQ, Medical Expenditure Panel Survey-Insurance Component: Statistical Brief #29 Cutler, David M. (2003), "Employee Costs and the Decline in Health Insurance Coverage," Forum for Health Economics & Policy: Vol. 6: (Frontiers in Health Policy Research), Article 3. http://www.bepress.com/fhep/6/3 Kaiser Family Foundation, and Health Research & Educational Trust, (2007), Employer Health Benefit 2007 Annual Survey, Menlo Park, CA: Henry J. Kaiser Family Foundation Dranove, David, Kathryn E. Spier, Laurence Baker (2000), “Competition among Employers Offering Health Insurance” Journal of Health Economics, Vol.19: 121–140 Eibner, Christine, and M. Susan Marquis (2008), “Employers’ health insurance cost burden, 1996–2005” Monthly Labor Review, June 28-44 Feldman, Roger, Bryan Dowd, and Gregory Gifford (1993) “The Effect of HMOs on Premiums in Employment-Based Health Plans”, Health Services Research, Vol. 27 (6): 779-811 Jensen, Gail A. and Michael A. Morrisey (1990) “Group Health Insurance: A hedonic Price approach”, The Review of Economics and Statistics, 38-44. Lee, Jason (2002), “Are Health Insurance Premiums Higher for Small Firms?”, Robert Wood Johnson Foundation: Research Synthesis Report No. 2 http://www.rwjf.org/files/research/no2researchreport.pdf
Goldstein, Gerald S., and Mark V. Pauly (1976), “Group Health Insurance as a Local Public Good Chapter” in Richard N. Rosett The Role of Health Insurance in the Health Services Sector” , NBER: 73 - 114 Gruber, Jonathan and McKnight Robin (2003), “Why Did Employee Health Insurance Contributions Rise?”, Journal of Health Economics, Vol. 22, No. 6: 1085-1104 Marquis, Susan M. and Stephen H. Long (2001), “Employer Health Insurance and Local Labor Market Conditions”, International Journal of Health Care Finance and Economics, Vol. 1: 273–292.
22
Marquis, Susan M. and Stephen H. Long (2001), “To Offer or Not to Offer: The Role of Price on Employer’s Health Insurance Decisions”, Health Service Research, Vol. 36, No. 5: 935-58. Morrisey, M.A., G.A. Jensen and J. Gabel. (2003). “Managed Care and Employer Premiums.” International Journal of Health Care Finance and Economics 3(2): 95–116. Vistnes, Jessica Primoff, Michael A. Morrisey, and Gail A. Jensen (2006) “Employer choices of family premium sharing”, International Journal of Health Care Finance and Economics, Vol. 6: 25–47. Shore-Sheppard, L., T.C. Buchmueller and G.A. Jensen. (2000). “Medicaid and Crowding Out of Private Insurance: A Re-examination Using Firm Level Data.” Journal of Health Economics, 19 (1): 61–92. Zawacki, Alice M, and Taylor Amy K. “Contributions to Health Insurance Premiums: When Does the Employer Pay 100 Percent?”. Agency for Healthcare Research and Quality Working Paper No. 05009, January 2005, http://www.ahrq.gov.
23
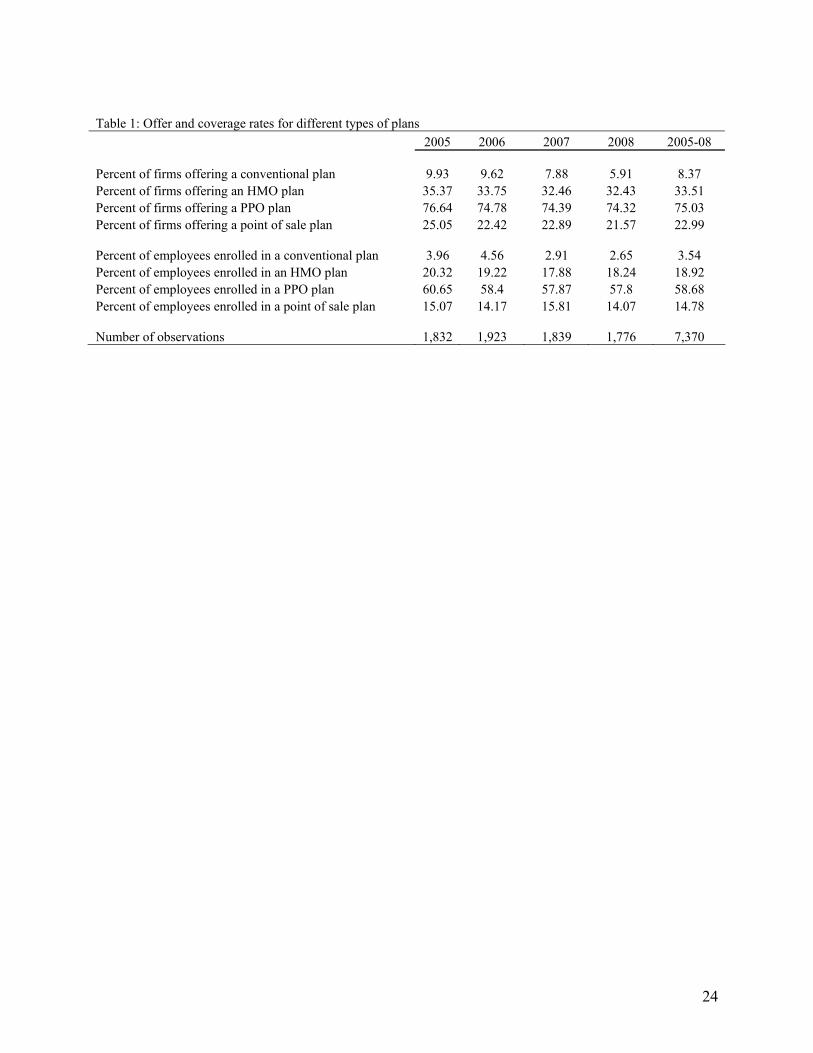
Table 1: Offer and coverage rates for different types of plans 2005 2006 2007 2008 2005-08 Percent of firms offering a conventional plan 9.93 9.62 7.88 5.91 8.37 Percent of firms offering an HMO plan 35.37 33.75 32.46 32.43 33.51 Percent of firms offering a PPO plan 76.64 74.78 74.39 74.32 75.03 Percent of firms offering a point of sale plan 25.05 22.42 22.89 21.57 22.99 Percent of employees enrolled in a conventional plan 3.96 4.56 2.91 2.65 3.54 Percent of employees enrolled in an HMO plan 20.32 19.22 17.88 18.24 18.92 Percent of employees enrolled in a PPO plan 60.65 58.4 57.87 57.8 58.68 Percent of employees enrolled in a point of sale plan 15.07 14.17 15.81 14.07 14.78 Number of observations 1,832 1,923 1,839 1,776 7,370
24
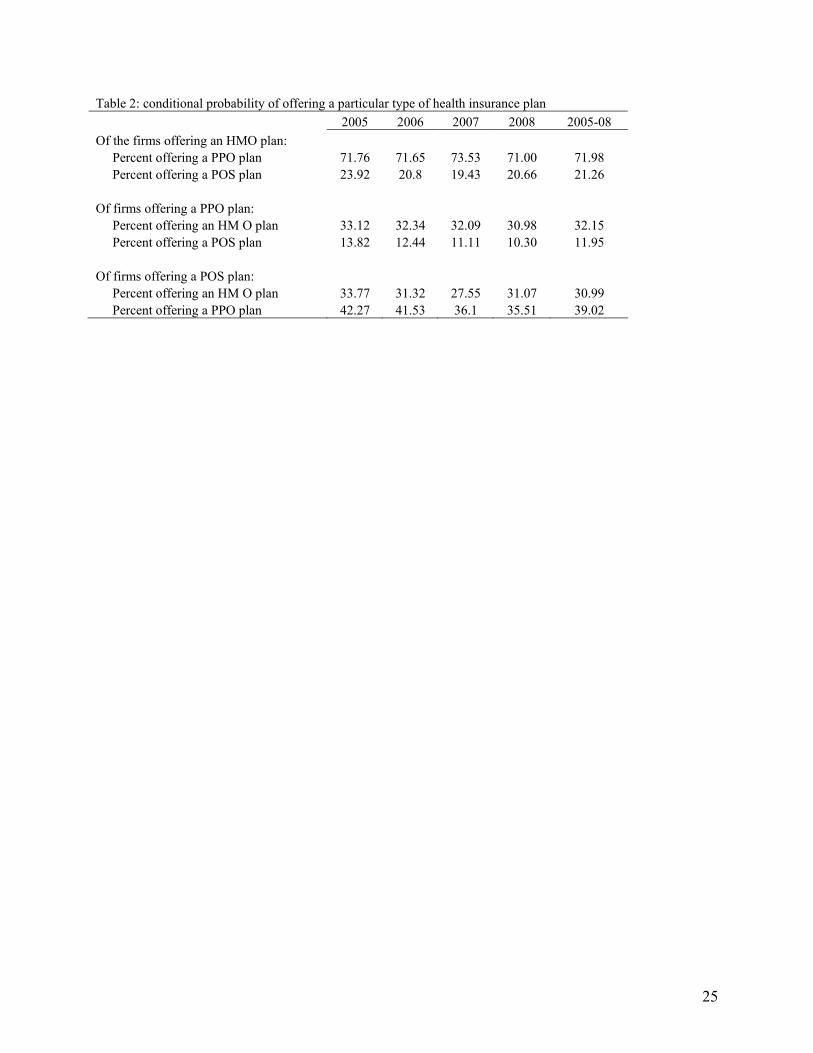
Table 2: conditional probability of offering a particular type of health insurance plan 2005 2006 2007 2008 2005-08 Of the firms offering an HMO plan: Percent offering a PPO plan 71.76 71.65 73.53 71.00 71.98 Percent offering a POS plan 23.92 20.8 19.43 20.66 21.26 Of firms offering a PPO plan: Percent offering an HM O plan 33.12 32.34 32.09 30.98 32.15 Percent offering a POS plan 13.82 12.44 11.11 10.30 11.95 Of firms offering a POS plan: Percent offering an HM O plan 33.77 31.32 27.55 31.07 30.99 Percent offering a PPO plan 42.27 41.53 36.1 35.51 39.02
25
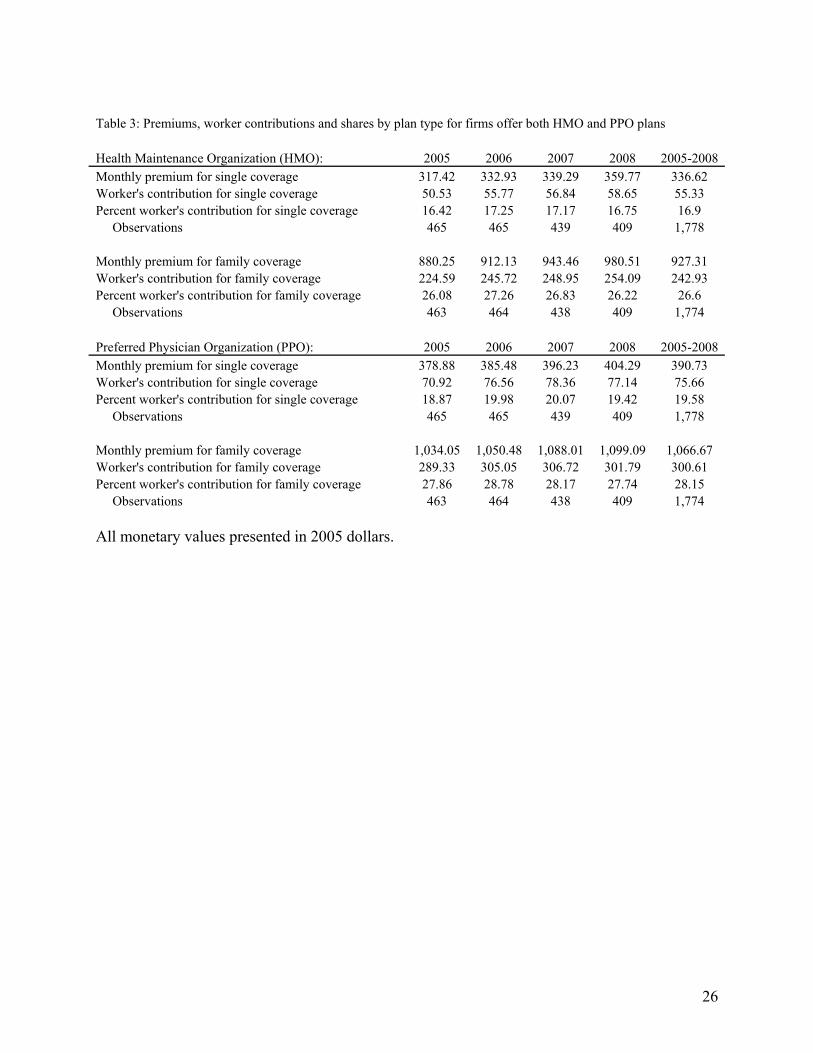
Table 3: Premiums, worker contributions and shares by plan type for firms offer both HMO and PPO plans Health Maintenance Organization (HMO): 2005 2006 2007 2008 2005-2008 Monthly premium for single coverage 317.42 332.93 339.29 359.77 336.62 Worker's contribution for single coverage 50.53 55.77 56.84 58.65 55.33 Percent worker's contribution for single coverage 16.42 17.25 17.17 16.75 16.9 Observations 465 465 439 409 1,778 Monthly premium for family coverage 880.25 912.13 943.46 980.51 927.31 Worker's contribution for family coverage 224.59 245.72 248.95 254.09 242.93 Percent worker's contribution for family coverage 26.08 27.26 26.83 26.22 26.6 Observations 463 464 438 409 1,774 Preferred Physician Organization (PPO): 2005 2006 2007 2008 2005-2008 Monthly premium for single coverage 378.88 385.48 396.23 404.29 390.73 Worker's contribution for single coverage 70.92 76.56 78.36 77.14 75.66 Percent worker's contribution for single coverage 18.87 19.98 20.07 19.42 19.58 Observations 465 465 439 409 1,778 Monthly premium for family coverage 1,034.05 1,050.48 1,088.01 1,099.09 1,066.67 Worker's contribution for family coverage 289.33 305.05 306.72 301.79 300.61 Percent worker's contribution for family coverage 27.86 28.78 28.17 27.74 28.15 Observations 463 464 438 409 1,774 All monetary values presented in 2005 dollars.
26
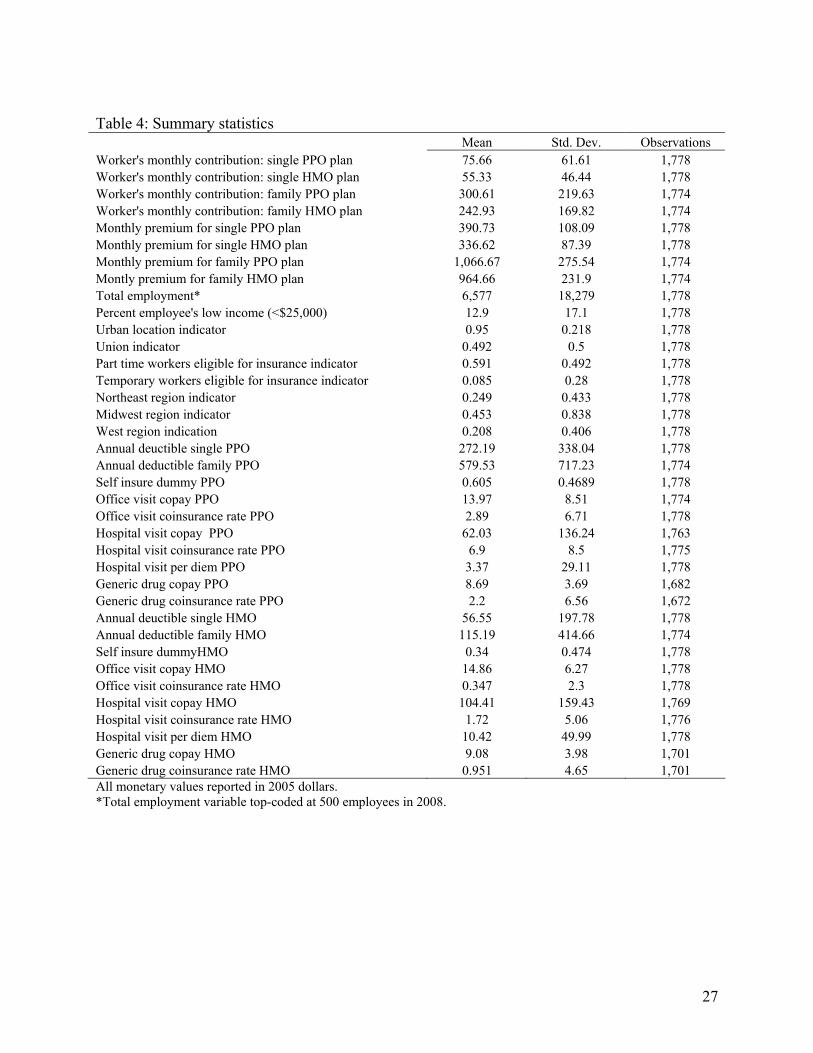
Table 4: Summary statistics Mean Std. Dev. Observations Worker's monthly contribution: single PPO plan 75.66 61.61 1,778 Worker's monthly contribution: single HMO plan 55.33 46.44 1,778 Worker's monthly contribution: family PPO plan 300.61 219.63 1,774 Worker's monthly contribution: family HMO plan 242.93 169.82 1,774 Monthly premium for single PPO plan 390.73 108.09 1,778 Monthly premium for single HMO plan 336.62 87.39 1,778 Monthly premium for family PPO plan 1,066.67 275.54 1,774 Montly premium for family HMO plan 964.66 231.9 1,774 Total employment* 6,577 18,279 1,778 Percent employee's low income (<$25,000) 12.9 17.1 1,778 Urban location indicator 0.95 0.218 1,778 Union indicator 0.492 0.5 1,778 Part time workers eligible for insurance indicator 0.591 0.492 1,778 Temporary workers eligible for insurance indicator 0.085 0.28 1,778 Northeast region indicator 0.249 0.433 1,778 Midwest region indicator 0.453 0.838 1,778 West region indication 0.208 0.406 1,778 Annual deuctible single PPO 272.19 338.04 1,778 Annual deductible family PPO 579.53 717.23 1,774 Self insure dummy PPO 0.605 0.4689 1,778 Office visit copay PPO 13.97 8.51 1,774 Office visit coinsurance rate PPO 2.89 6.71 1,778 Hospital visit copay PPO 62.03 136.24 1,763 Hospital visit coinsurance rate PPO 6.9 8.5 1,775 Hospital visit per diem PPO 3.37 29.11 1,778 Generic drug copay PPO 8.69 3.69 1,682 Generic drug coinsurance rate PPO 2.2 6.56 1,672 Annual deuctible single HMO 56.55 197.78 1,778 Annual deductible family HMO 115.19 414.66 1,774 Self insure dummyHMO 0.34 0.474 1,778 Office visit copay HMO 14.86 6.27 1,778 Office visit coinsurance rate HMO 0.347 2.3 1,778 Hospital visit copay HMO 104.41 159.43 1,769 Hospital visit coinsurance rate HMO 1.72 5.06 1,776 Hospital visit per diem HMO 10.42 49.99 1,778 Generic drug copay HMO 9.08 3.98 1,701 Generic drug coinsurance rate HMO 0.951 4.65 1,701 All monetary values reported in 2005 dollars. *Total employment variable top-coded at 500 employees in 2008.
27
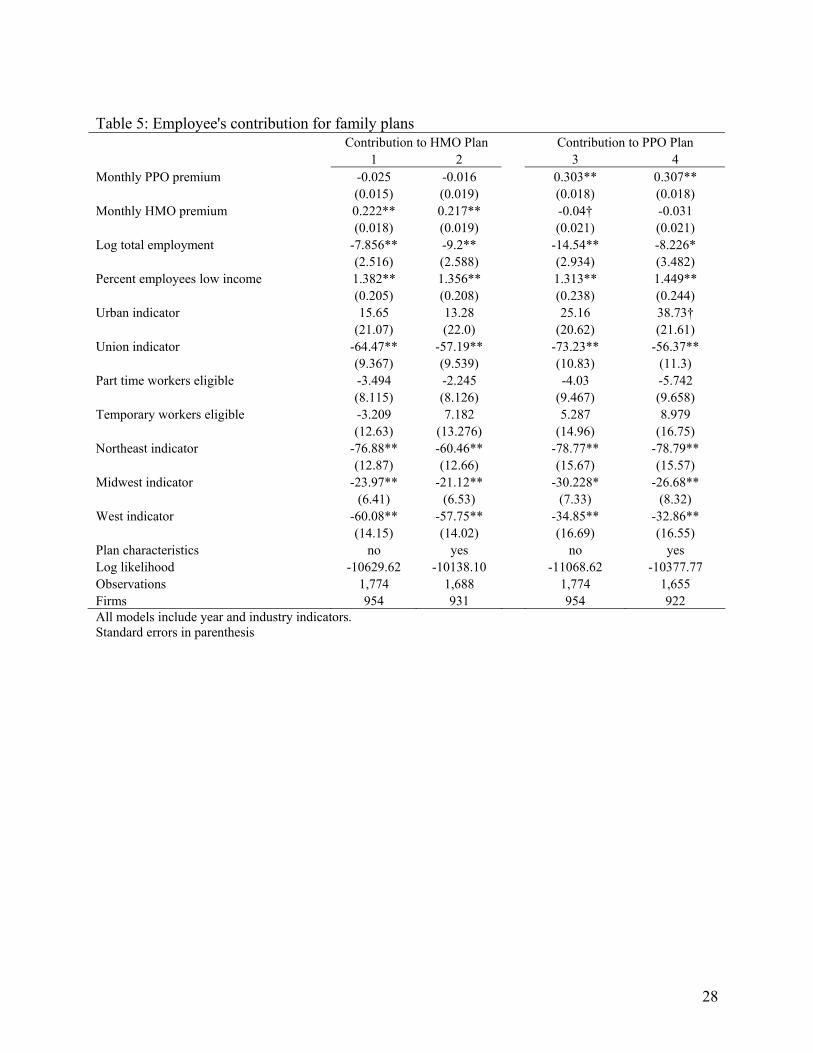
Table 5: Employee's contribution for family plans Contribution to HMO Plan Contribution to PPO Plan 1 2 3 4 Monthly PPO premium -0.025 -0.016 0.303** 0.307** (0.015) (0.019) (0.018) (0.018) Monthly HMO premium 0.222** 0.217** -0.04† -0.031 (0.018) (0.019) (0.021) (0.021) Log total employment -7.856** -9.2** -14.54** -8.226* (2.516) (2.588) (2.934) (3.482) Percent employees low income 1.382** 1.356** 1.313** 1.449** (0.205) (0.208) (0.238) (0.244) Urban indicator 15.65 13.28 25.16 38.73† (21.07) (22.0) (20.62) (21.61) Union indicator -64.47** -57.19** -73.23** -56.37** (9.367) (9.539) (10.83) (11.3) Part time workers eligible -3.494 -2.245 -4.03 -5.742 (8.115) (8.126) (9.467) (9.658) Temporary workers eligible -3.209 7.182 5.287 8.979 (12.63) (13.276) (14.96) (16.75) Northeast indicator -76.88** -60.46** -78.77** -78.79** (12.87) (12.66) (15.67) (15.57) Midwest indicator -23.97** -21.12** -30.228* -26.68** (6.41) (6.53) (7.33) (8.32) West indicator -60.08** -57.75** -34.85** -32.86** (14.15) (14.02) (16.69) (16.55) Plan characteristics no yes no yes Log likelihood -10629.62 -10138.10 -11068.62 -10377.77 Observations 1,774 1,688 1,774 1,655 Firms 954 931 954 922 All models include year and industry indicators. Standard errors in parenthesis
28
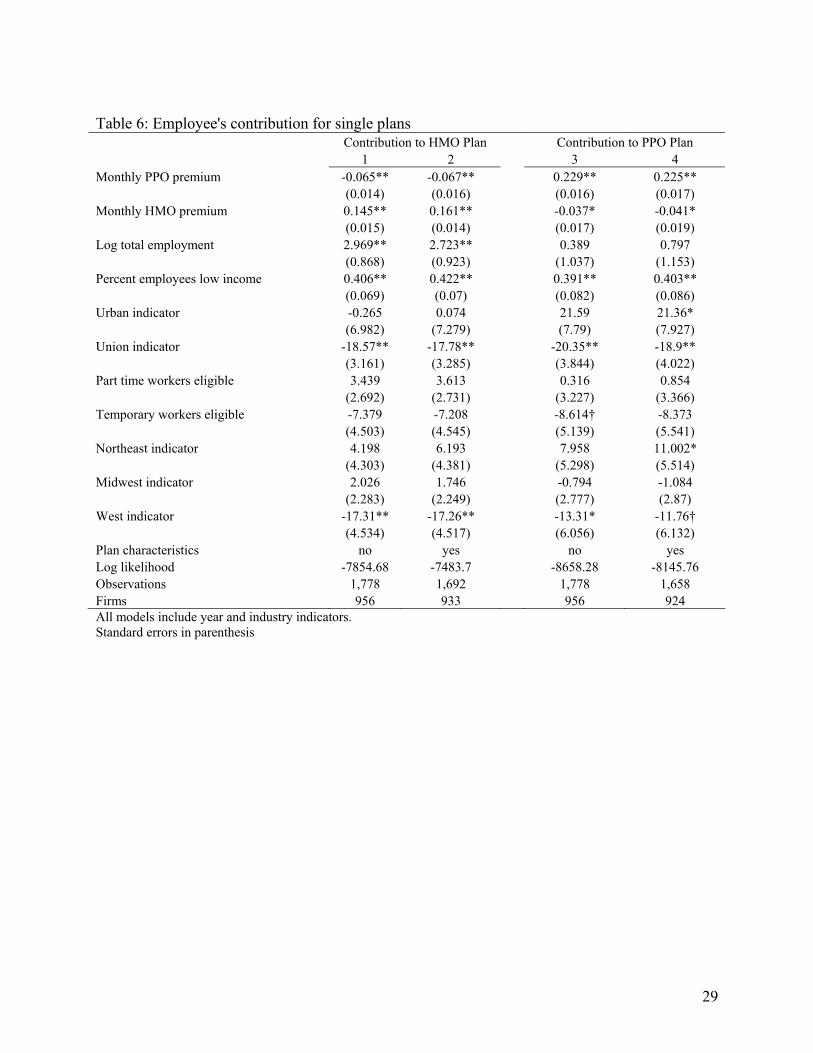
Table 6: Employee's contribution for single plans Contribution to HMO Plan Contribution to PPO Plan 1 2 3 4 Monthly PPO premium -0.065** -0.067** 0.229** 0.225** (0.014) (0.016) (0.016) (0.017) Monthly HMO premium 0.145** 0.161** -0.037* -0.041* (0.015) (0.014) (0.017) (0.019) Log total employment 2.969** 2.723** 0.389 0.797 (0.868) (0.923) (1.037) (1.153) Percent employees low income 0.406** 0.422** 0.391** 0.403** (0.069) (0.07) (0.082) (0.086) Urban indicator -0.265 0.074 21.59 21.36* (6.982) (7.279) (7.79) (7.927) Union indicator -18.57** -17.78** -20.35** -18.9** (3.161) (3.285) (3.844) (4.022) Part time workers eligible 3.439 3.613 0.316 0.854 (2.692) (2.731) (3.227) (3.366) Temporary workers eligible -7.379 -7.208 -8.614† -8.373 (4.503) (4.545) (5.139) (5.541) Northeast indicator 4.198 6.193 7.958 11.002* (4.303) (4.381) (5.298) (5.514) Midwest indicator 2.026 1.746 -0.794 -1.084 (2.283) (2.249) (2.777) (2.87) West indicator -17.31** -17.26** -13.31* -11.76† (4.534) (4.517) (6.056) (6.132) Plan characteristics no yes no yes Log likelihood -7854.68 -7483.7 -8658.28 -8145.76 Observations 1,778 1,692 1,778 1,658 Firms 956 933 956 924 All models include year and industry indicators. Standard errors in parenthesis
29
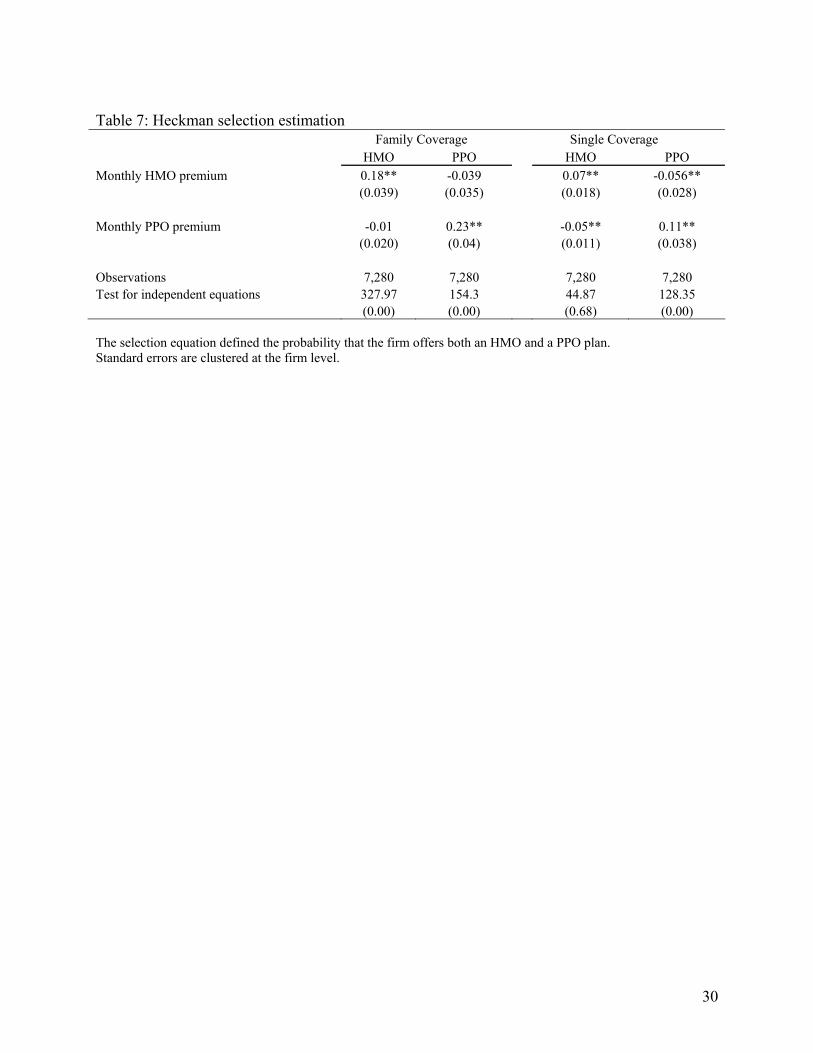
Table 7: Heckman selection estimation Family Coverage Single Coverage HMO PPO HMO PPO Monthly HMO premium 0.18** -0.039 0.07** -0.056** (0.039) (0.035) (0.018) (0.028) Monthly PPO premium -0.01 0.23** -0.05** 0.11** (0.020) (0.04) (0.011) (0.038) Observations 7,280 7,280 7,280 7,280 Test for independent equations 327.97 154.3 44.87 128.35 (0.00) (0.00) (0.68) (0.00) The selection equation defined the probability that the firm offers both an HMO and a PPO plan. Standard errors are clustered at the firm level.
30
Related Documents