Health Inequalities - PH Research Unit Jacqueline Clay Ross Maconachie Public Health Research Unit West Sussex County Council j [email protected]

Health Inequalities - PH Research Unit
Dec 31, 2015
Health Inequalities - PH Research Unit. Jacqueline Clay Ross Maconachie Public Health Research Unit West Sussex County Council j [email protected]. Marmot Review (2010) - Key themes. Reducing health inequalities is a matter of fairness and social justice - PowerPoint PPT Presentation
Welcome message from author
This document is posted to help you gain knowledge. Please leave a comment to let me know what you think about it! Share it to your friends and learn new things together.
Transcript

Health Inequalities- PH Research Unit
Jacqueline ClayRoss MaconachiePublic Health Research UnitWest Sussex County [email protected]

Reducing health inequalities is a matter of fairness and social justice
Action is needed to tackle the social gradient in health –Proportionate universalism
Action on health inequalities requires action across all the social determinants of health
Reducing health - cost of inaction Beyond economic growth to well-being
2
Marmot Review (2010) - Key themes
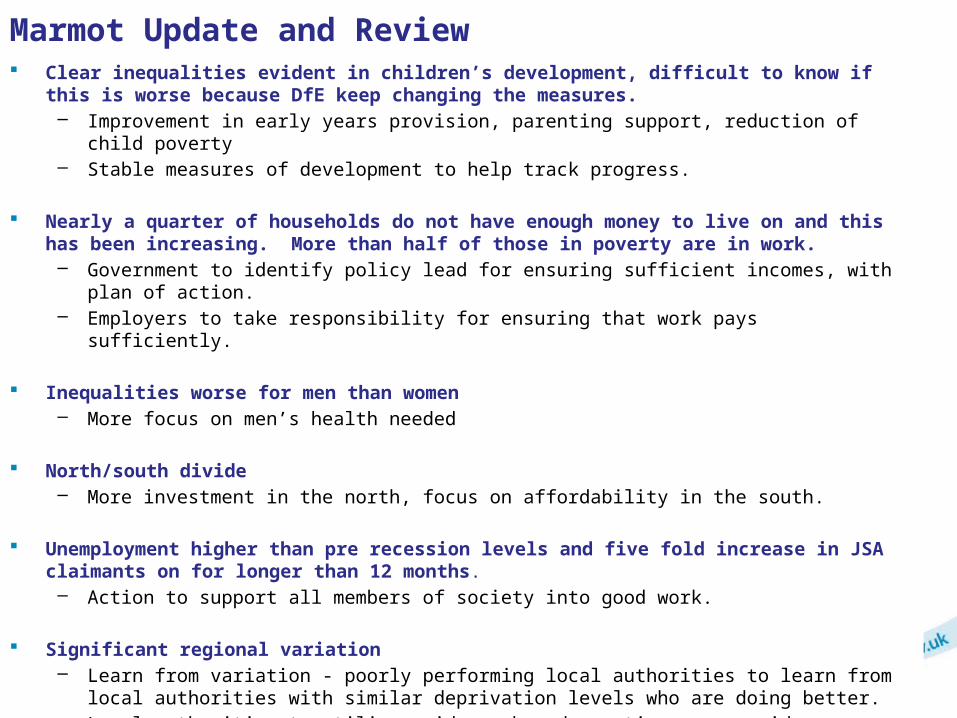
Marmot Update and Review Clear inequalities evident in children’s development, difficult to know if this is
worse because DfE keep changing the measures. – Improvement in early years provision, parenting support, reduction of child poverty – Stable measures of development to help track progress.
Nearly a quarter of households do not have enough money to live on and this has been increasing. More than half of those in poverty are in work. – Government to identify policy lead for ensuring sufficient incomes, with plan of action. – Employers to take responsibility for ensuring that work pays sufficiently.
Inequalities worse for men than women– More focus on men’s health needed
North/south divide– More investment in the north, focus on affordability in the south.
Unemployment higher than pre recession levels and five fold increase in JSA claimants on for longer than 12 months. – Action to support all members of society into good work.
Significant regional variation – Learn from variation - poorly performing local authorities to learn from local authorities
with similar deprivation levels who are doing better.– Local authorities to utilise evidence based practices, see evidence briefings IHE
authored for PHE.
4
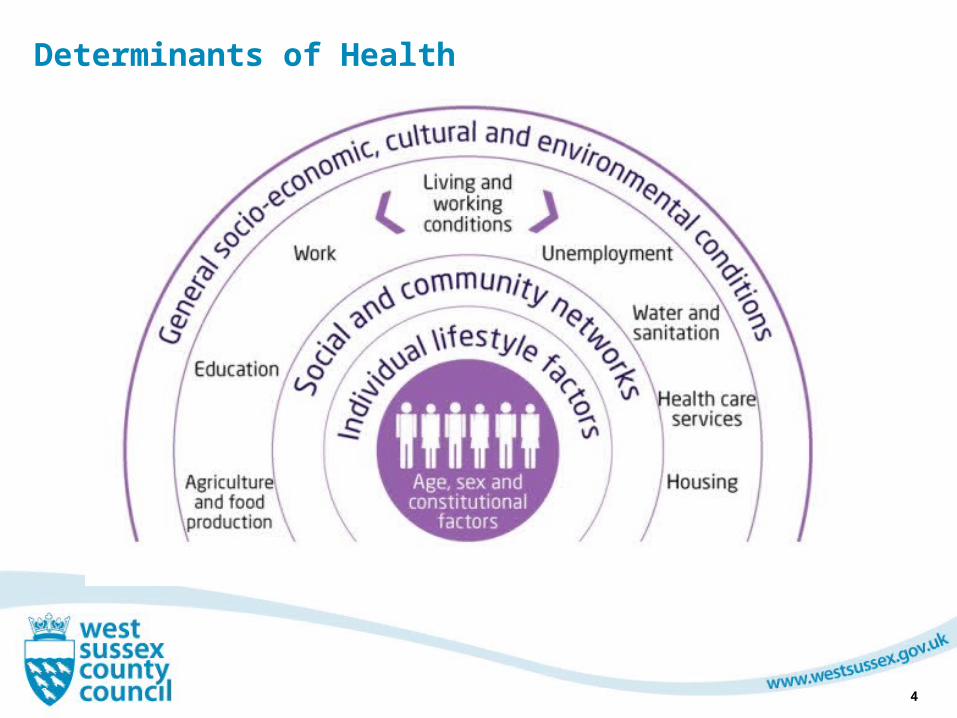
Determinants of Health
5
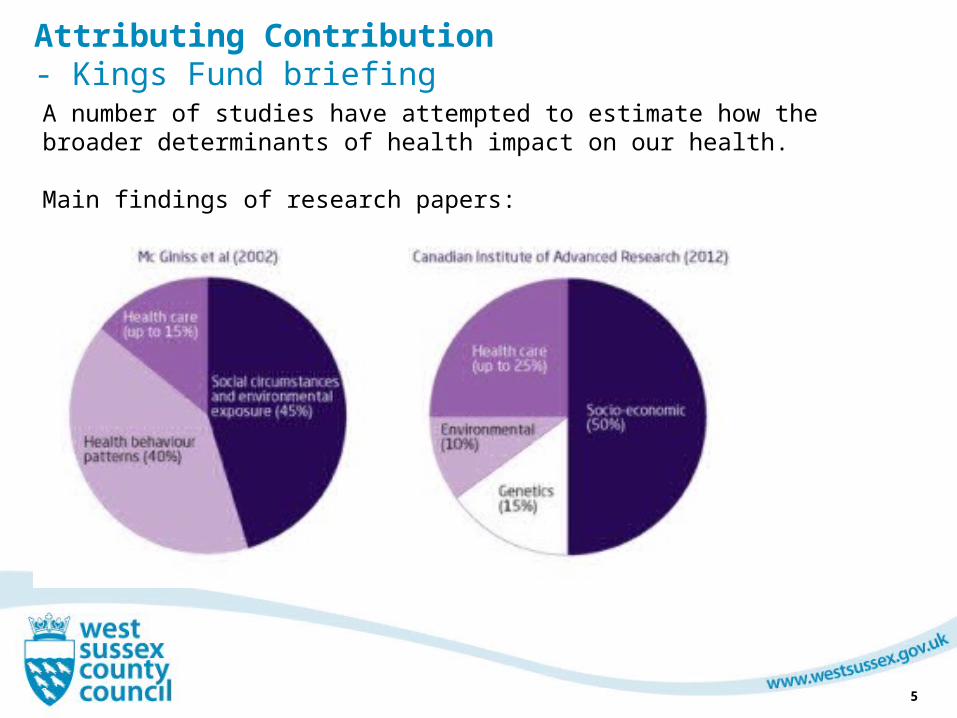
Attributing Contribution- Kings Fund briefingA number of studies have attempted to estimate how the broader determinants of health impact on our health.
Main findings of research papers:
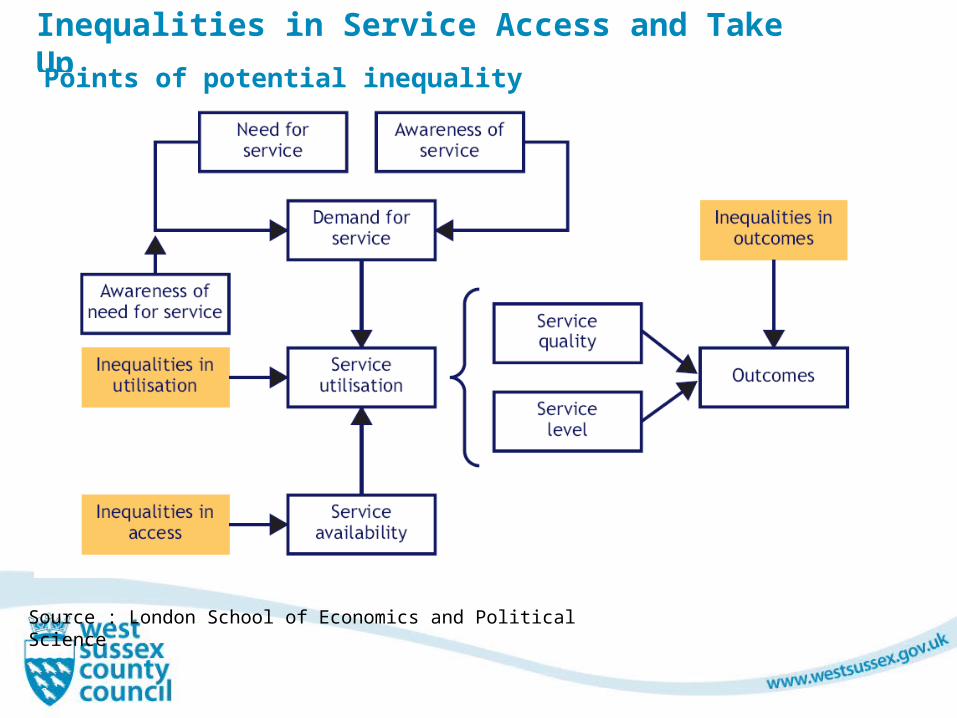
Inequalities in Service Access and Take Up
Source : London School of Economics and Political Science
Points of potential inequality
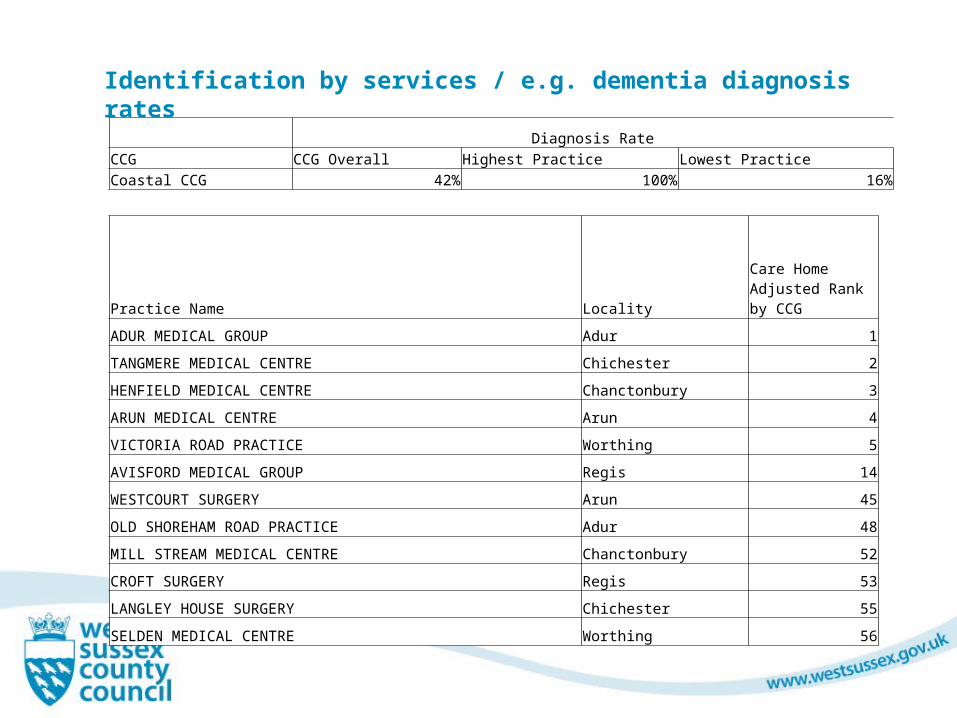
Diagnosis RateCCG CCG Overall Highest Practice Lowest PracticeCoastal CCG 42% 100% 16%
Practice Name Locality
Care Home Adjusted Rank by CCG
ADUR MEDICAL GROUP Adur 1
TANGMERE MEDICAL CENTRE Chichester 2
HENFIELD MEDICAL CENTRE Chanctonbury 3
ARUN MEDICAL CENTRE Arun 4
VICTORIA ROAD PRACTICE Worthing 5
AVISFORD MEDICAL GROUP Regis 14
WESTCOURT SURGERY Arun 45
OLD SHOREHAM ROAD PRACTICE Adur 48
MILL STREAM MEDICAL CENTRE Chanctonbury 52
CROFT SURGERY Regis 53
LANGLEY HOUSE SURGERY Chichester 55
SELDEN MEDICAL CENTRE Worthing 56
Identification by services / e.g. dementia diagnosis rates

8
Mental illness is 'as bad for life expectancy as smoking', experts warn
Nut eaters may have
a longer life
expectancy
Life expectancy gap between men and women
narrows to less than four years as Dorset is
revealed as the place to grow old.
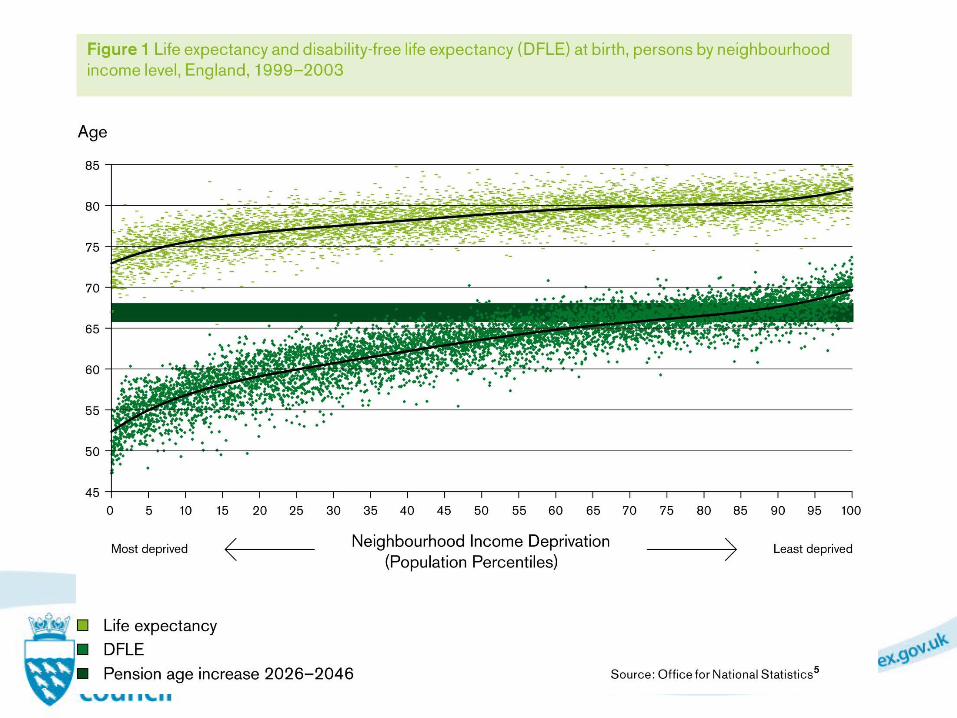
Life expectancy a powerful measure of inequality
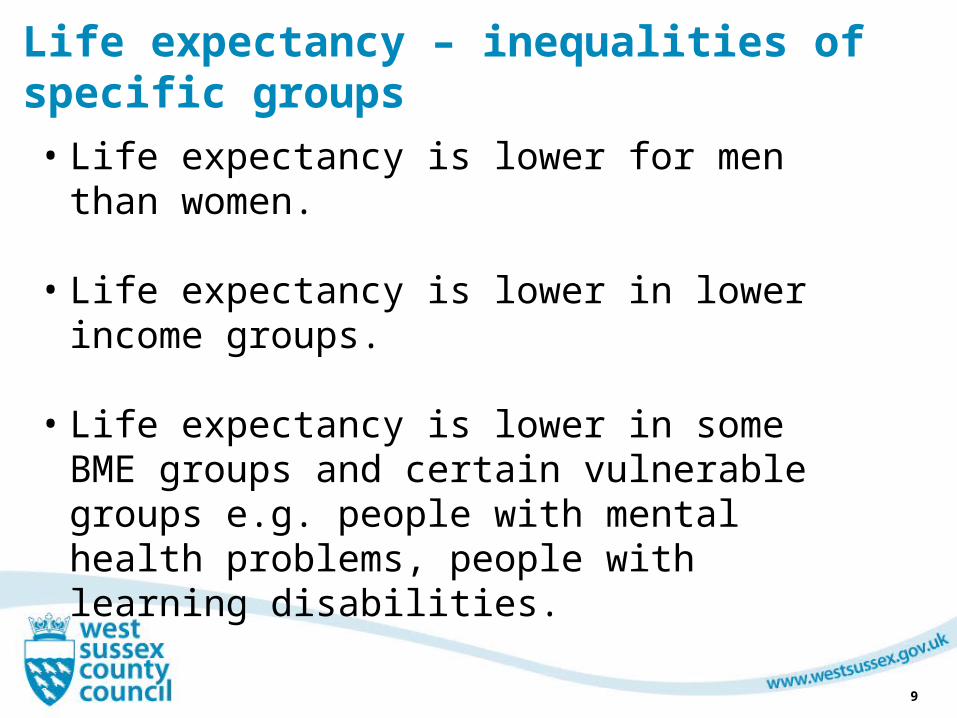
Life expectancy – inequalities of specific groups
9
• Life expectancy is lower for men than women.
• Life expectancy is lower in lower income groups.
• Life expectancy is lower in some BME groups and certain vulnerable groups e.g. people with mental health problems, people with learning disabilities.
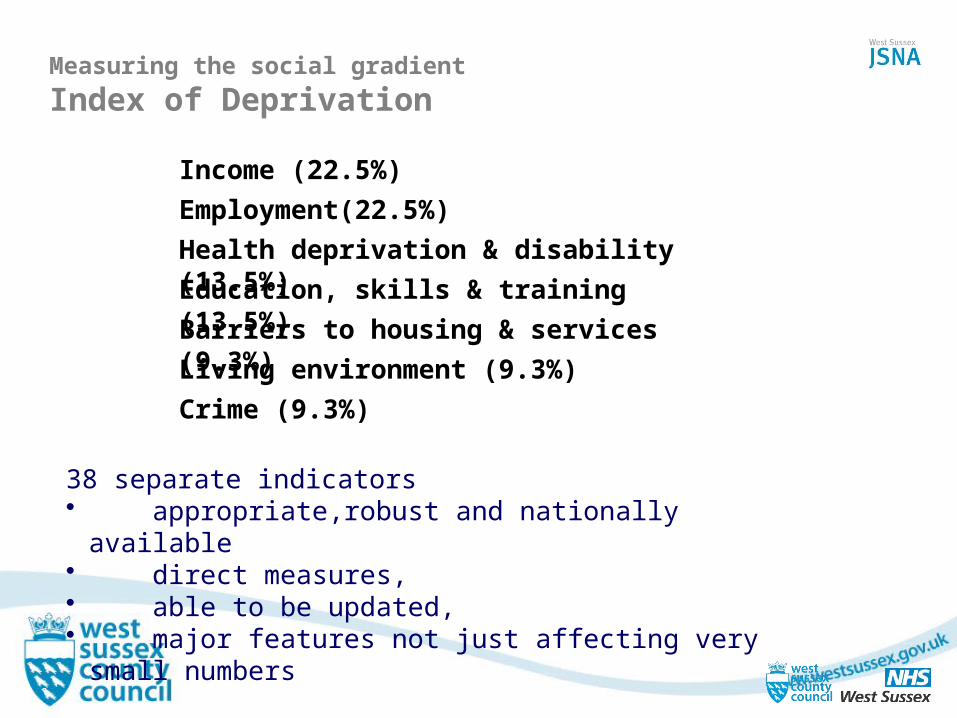
Measuring the social gradient
Index of Deprivation
Income (22.5%)
Employment(22.5%)
Health deprivation & disability (13.5%)Education, skills & training (13.5%)Barriers to housing & services (9.3%)Living environment (9.3%)
Crime (9.3%)
38 separate indicators • appropriate,robust and nationally available• direct measures, • able to be updated, • major features not just affecting very small
numbers
Arundel
Haywards Heath
Burgess Hill
Chichester
Selsey
Horsham
Crawley
Fernhurst
Petworth
Midhurst
Pulborough
Billingshurst
Shoreham
Worthing
LittlehamptonBognor
East Grinstead
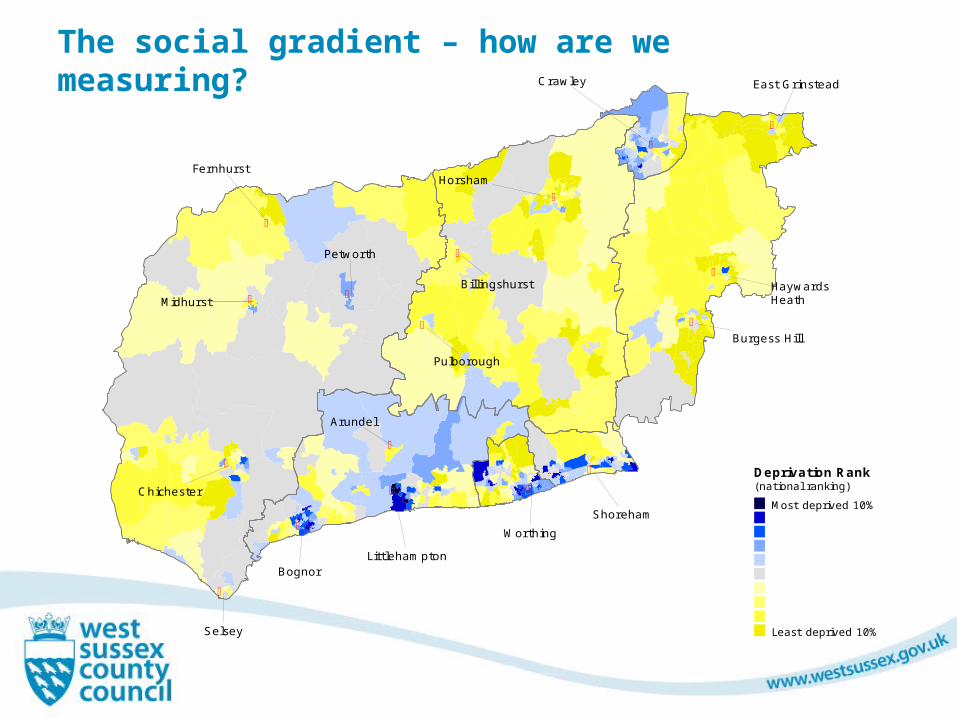
Deprivation Rank(national ranking)
Most deprived 10%
Least deprived 10%
The social gradient – how are we measuring?
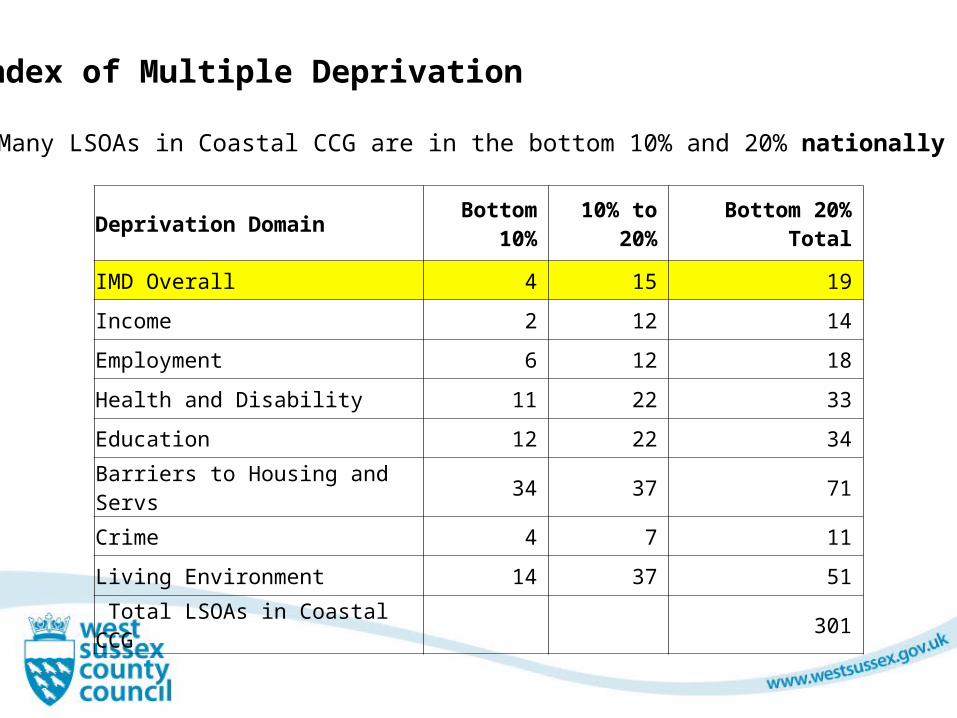
Deprivation Domain Bottom 10%
10% to 20%
Bottom 20% Total
IMD Overall 4 15 19
Income 2 12 14
Employment 6 12 18
Health and Disability 11 22 33
Education 12 22 34
Barriers to Housing and Servs 34 37 71
Crime 4 7 11
Living Environment 14 37 51
Total LSOAs in Coastal CCG 301
Index of Multiple Deprivation
• Many LSOAs in Coastal CCG are in the bottom 10% and 20% nationally
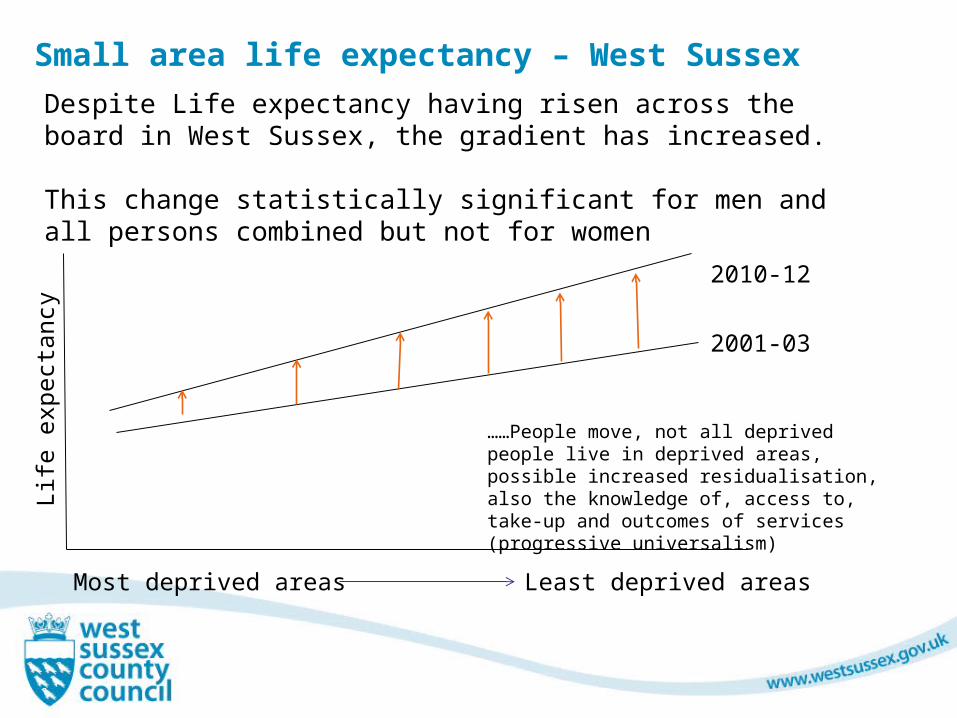
Small area life expectancy – West Sussex
Despite Life expectancy having risen across the board in West Sussex, the gradient has increased.
This change statistically significant for men and all persons combined but not for women
Least deprived areasMost deprived areas
Life
exp
ecta
ncy
2001-03
2010-12
……People move, not all deprived people live in deprived areas, possible increased residualisation, also the knowledge of, access to, take-up and outcomes of services (progressive universalism)

Ward level life expectancy – West Sussex (2007-2012)
15
Highest
LE (2007-
12) 95% CI Lowest LE (2007-12) 95% CI
Burgess Hill Dunstall 89.3 (84.3 - 94.4) Southgate 78.0 (76.9 - 79.1)
East Grinstead Imberhorne 87.5 (85.1 - 89.8) Central 76.7 (75.6 - 77.9)
Findon 87.4 (85.1 - 89.7) Heene 75.2 (73.9 - 76.5)
Pound Hill South and Worth 86.6 (84.4 - 88.9) Marine 74.5 (73 - 75.9)
Harting 86.6 (84.1 - 89.1) River 74.2 (72.8 - 75.6)
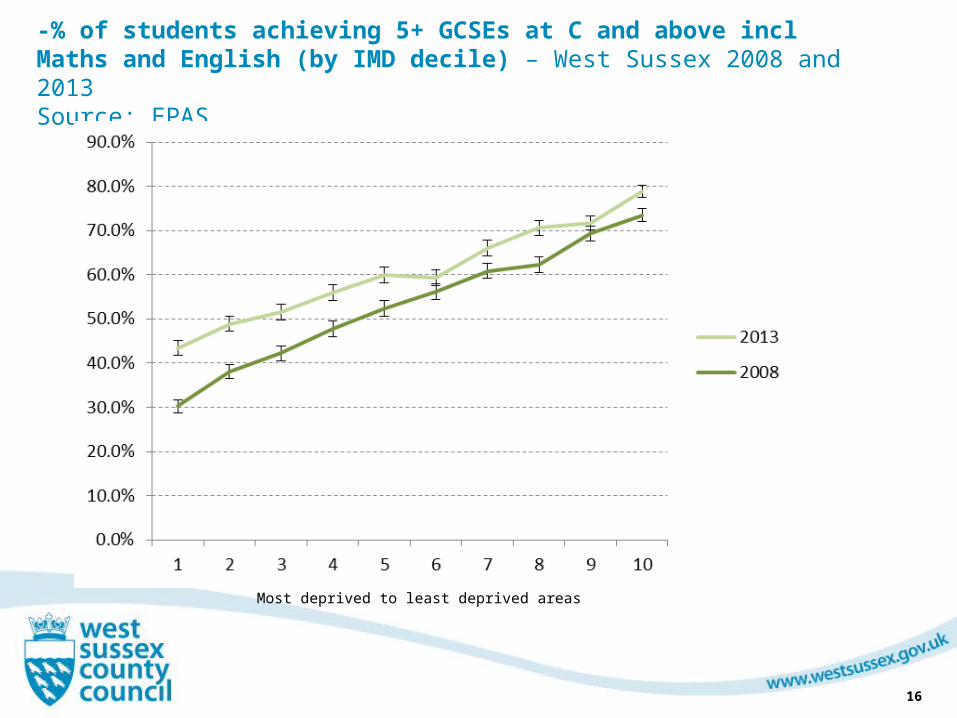
-% of students achieving 5+ GCSEs at C and above incl Maths and English (by IMD decile) – West Sussex 2008 and 2013 Source: EPAS
16
Most deprived to least deprived areas
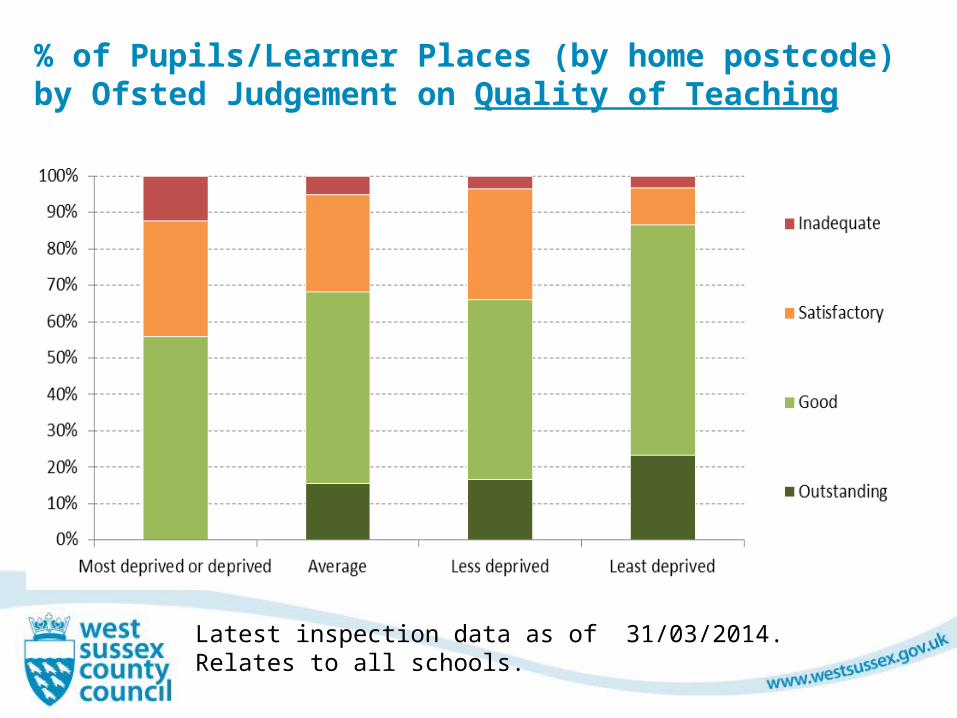
% of Pupils/Learner Places (by home postcode) by Ofsted Judgement on Quality of Teaching
Latest inspection data as of 31/03/2014. Relates to all schools.

Geographic Pattern of Long Term Health Conditions /Disability aligned to Deprivation
Standardised Rate (Per 100 Population)
Residents with a health condition or disability limiting day-to-day activities (a little or a lot)

Mental Health Admission Rate (per 100,000 population aged 17 years+)
Pooled Year Data 2010-2012
Mental Health Diagnosis – excluding organic mental

Not just single conditions, many people have multi-morbidities – Study of Scottish Patients
20
• The prevalence of multi-morbidity increased (substantially) with age.
• For people living in the most deprived areas the onset of multi-morbidity occurred 10-15 years earlier than people living in the least deprived areas.
• Mental health was not only associated with physical illness but the presence of a mental health disorder increased as the number of physical morbidities increased.
Source: Epidemiology of multi-morbidity and implications for health care, research, and medical education: A cross-sectional study (Lancet 2012).
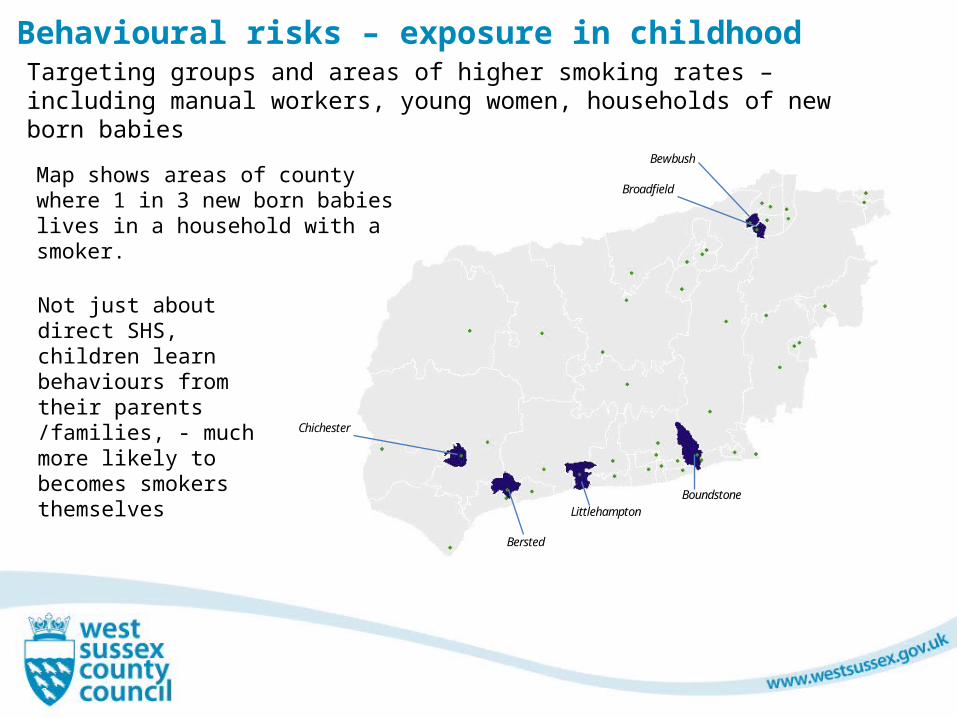
Behavioural risks – exposure in childhood Targeting groups and areas of higher smoking rates – including manual workers, young women, households of new born babies
Chichester
Areas with High Rates (30% or higher) of New Borns in Households with a Smoker (2012/13 Data) Source: West Sussex Public Health Research Unit
Broadfield
Bewbush
Bersted
Littlehampton Boundstone
Not just about direct SHS, children learn behaviours from their parents /families, - much more likely to becomes smokers themselves
Map shows areas of county where 1 in 3 new born babies lives in a household with a smoker.
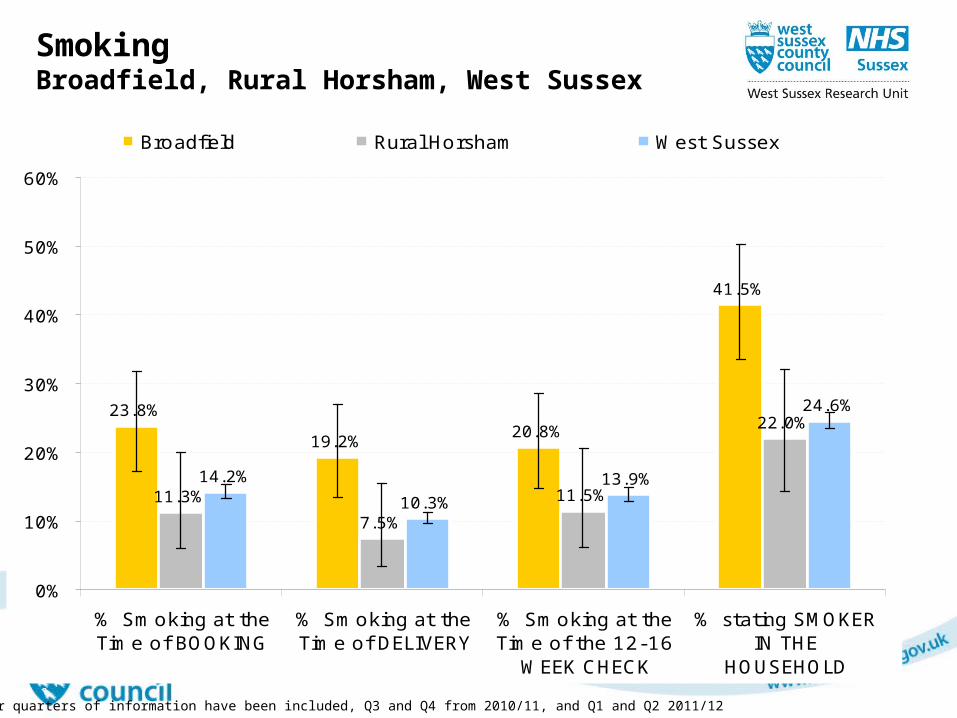
SmokingBroadfield, Rural Horsham, West Sussex
23.8%
19.2%20.8%
41.5%
11.3%
7.5%
11.5%
22.0%
14.2%
10.3%
13.9%
24.6%
0%
10%
20%
30%
40%
50%
60%
% Smoking at theTime of BOOKING
% Smoking at theTime of DELIVERY
% Smoking at theTime of the 12-16
WEEK CHECK
% stating SMOKERIN THE
HOUSEHOLD
Broadfield Rural Horsham West Sussex
Four quarters of information have been included, Q3 and Q4 from 2010/11, and Q1 and Q2 2011/12
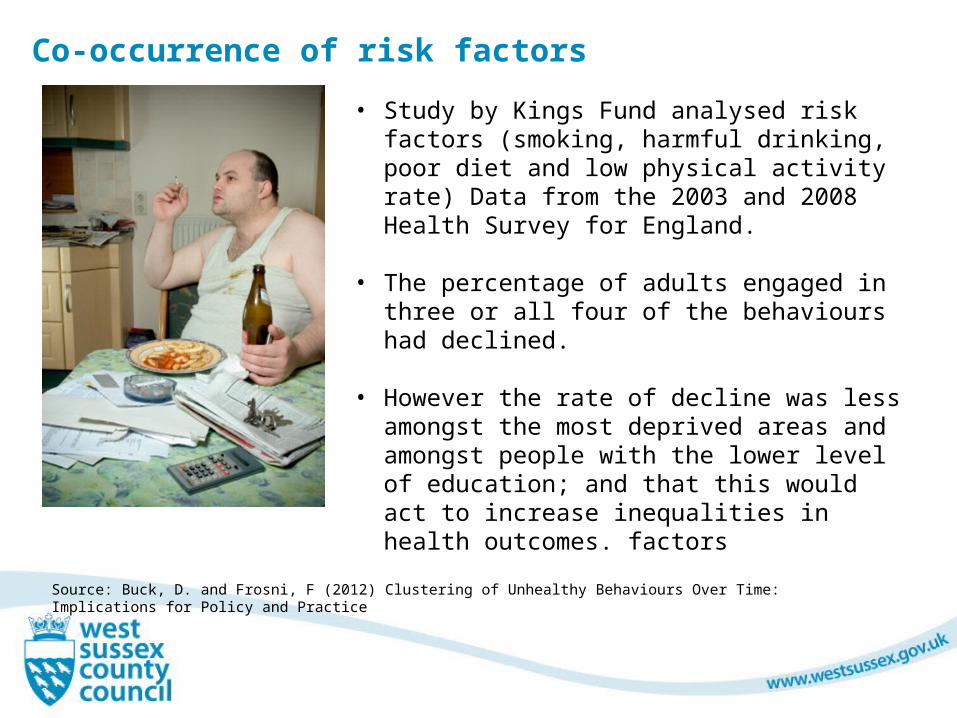
Co-occurrence of risk factors
• Study by Kings Fund analysed risk factors (smoking, harmful drinking, poor diet and low physical activity rate) Data from the 2003 and 2008 Health Survey for England.
• The percentage of adults engaged in three or all four of the behaviours had declined.
• However the rate of decline was less amongst the most deprived areas and amongst people with the lower level of education; and that this would act to increase inequalities in health outcomes. factors
Source: Buck, D. and Frosni, F (2012) Clustering of Unhealthy Behaviours Over Time: Implications for Policy and Practice
The Cost of Emergency Admissions
Data taken from SUS database 2012/13 (newer data not available)
Costs measured in PBR cost charged to CCGs
Deprivation measured as WSx deciles (tenths of our local population)
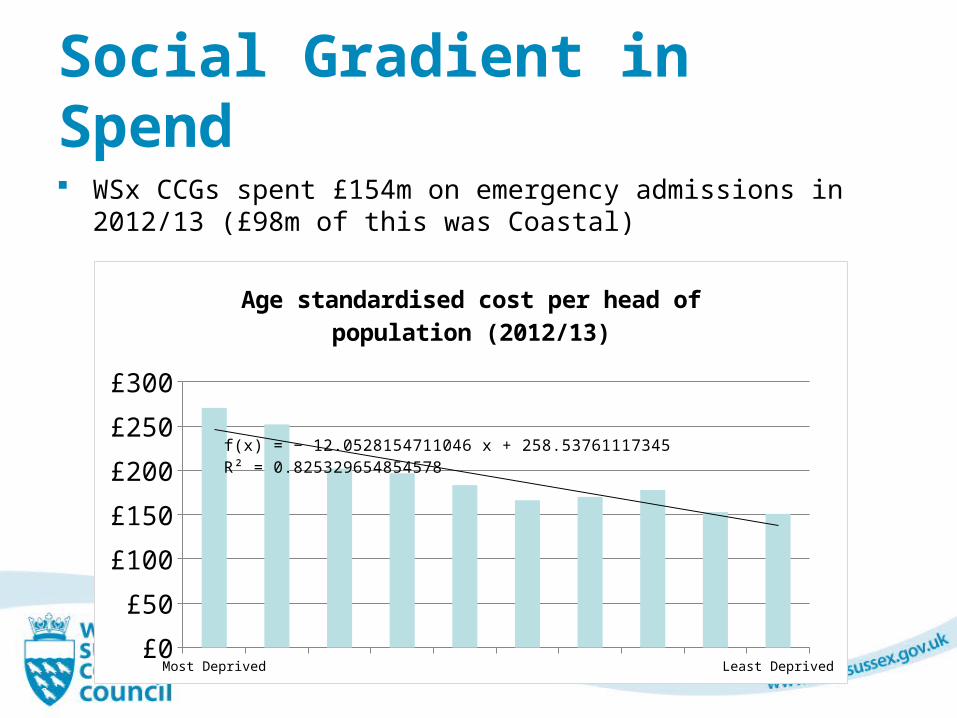
Social Gradient in Spend WSx CCGs spent £154m on emergency admissions in
2012/13 (£98m of this was Coastal)
Most De-
prived
Least Deprived
£0
£50
£100
£150
£200
£250
£300
f(x) = − 12.0528154711046 x + 258.537611173451R² = 0.82532965485458
Age standardised cost per head of popu-lation (2012/13)
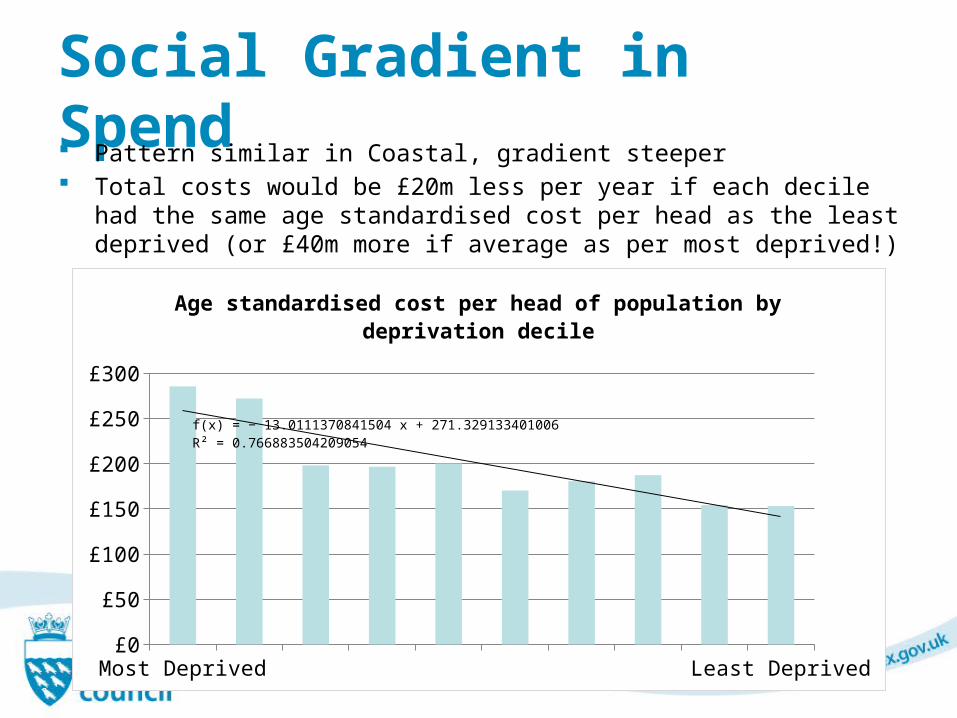
Social Gradient in Spend Pattern similar in Coastal, gradient steeper Total costs would be £20m less per year if each decile had the
same age standardised cost per head as the least deprived (or £40m more if average as per most deprived!)
Most Deprived Least Deprived£0
£50
£100
£150
£200
£250
£300
f(x) = − 13.0111370841504 x + 271.329133401006R² = 0.766883504209054
Age standardised cost per head of population by deprivation decile
NE
W P
ON
D R
OW
PR
AC
TIC
ETH
E O
RC
HA
RD
SU
RG
ER
YO
LD
SH
OR
EH
AM
RO
AD
PR
AC
TIC
ETH
E M
AN
OR
PR
AC
TIC
EN
OR
TH
BO
UR
NE
ME
DIC
AL C
EN
TR
EB
ALL T
RE
E S
UR
GE
RY
KIN
GFIS
HE
R F
AM
ILY P
RA
CTIC
EA
DU
R M
ED
ICA
L G
RO
UP
TH
E L
YO
NS
PR
AC
TIC
EFIT
ZA
LA
N M
ED
ICA
L G
RO
UP
AR
UN
ME
DIC
AL C
EN
TR
ETH
E P
AR
K S
UR
GE
RY
WE
STC
OU
RT S
UR
GE
RY
WIL
LO
W G
RE
EN
SU
RG
ER
YTH
E L
AW
NS
SU
RG
ER
YTH
E C
OPPIC
E P
RA
CTIC
EB
ILLIN
GS
HU
RS
T S
UR
GE
RY
HE
NFIE
LD
ME
DIC
AL C
EN
TR
EM
ILL S
TR
EA
M M
ED
ICA
L C
EN
TR
ES
TE
YN
ING
HE
ALTH
CE
NTR
ETH
E G
LE
BE
SU
RG
ER
YC
ATH
ED
RA
L M
ED
ICA
L G
RO
UP
SE
AL M
ED
ICA
L G
RO
UP
PE
TW
OR
TH
SU
RG
ER
YLA
NG
LE
Y H
OU
SE
SU
RG
ER
YTA
NG
ME
RE
ME
DIC
AL C
EN
TR
ES
OU
TH
BO
UR
NE
SU
RG
ER
YPA
RK
LA
ND
S S
UR
GE
RY
RIV
ER
BA
NK
ME
DIC
AL C
EN
TR
EW
ITTE
RIN
GS
HE
ALTH
CE
NTR
ES
ELS
EY M
ED
ICA
L C
EN
TR
ELA
VA
NT R
OA
D S
UR
GE
RY
LO
XW
OO
D M
ED
ICA
L P
RA
CTIC
EPU
LB
OR
OR
UG
H M
ED
ICA
L G
RO
UP
SE
LD
EN
ME
DIC
AL C
EN
TR
EW
OR
TH
ING
ME
DIC
AL G
RO
UP
VIC
TO
RIA
RO
AD
PR
AC
TIC
ES
TR
AN
D M
ED
ICA
L G
RO
UP
HE
EN
E R
OA
D P
RA
CTIC
ETH
E M
AYFLO
WE
R S
UR
GE
RY
LIM
E T
RE
E S
UR
GE
RY
CO
RN
ER
WA
YS
PR
AC
TIC
ETH
E B
AR
N S
UR
GE
RY
ST L
AW
RE
NC
E S
UR
GE
RY
BR
OA
DW
ATE
R M
ED
ICA
L C
EN
TR
EH
IGH
DO
WN
SU
RG
ER
YTH
E P
HO
EN
IX S
UR
GE
RY
BO
GN
OR
HE
ALTH
CE
NTR
EM
AYW
OO
D H
EA
LTH
CA
RE
CE
NTR
EB
ER
STE
D G
RE
EN
SU
RG
ER
YW
ES
T M
EA
DS
SU
RG
ER
YA
VIS
FO
RD
ME
DIC
AL G
RO
UP
CR
OFT S
UR
GE
RY
FE
LPH
AM
& M
IDD
LE
TO
N H
EA
LTH
CE
NTR
EG
RO
VE
HO
US
E S
UR
GE
RY
AR
UN
DE
L S
UR
GE
RY
NH
S C
oasta
l West S
usse
x C
CG
£0
£50
£100
£150
£200
£250
£300
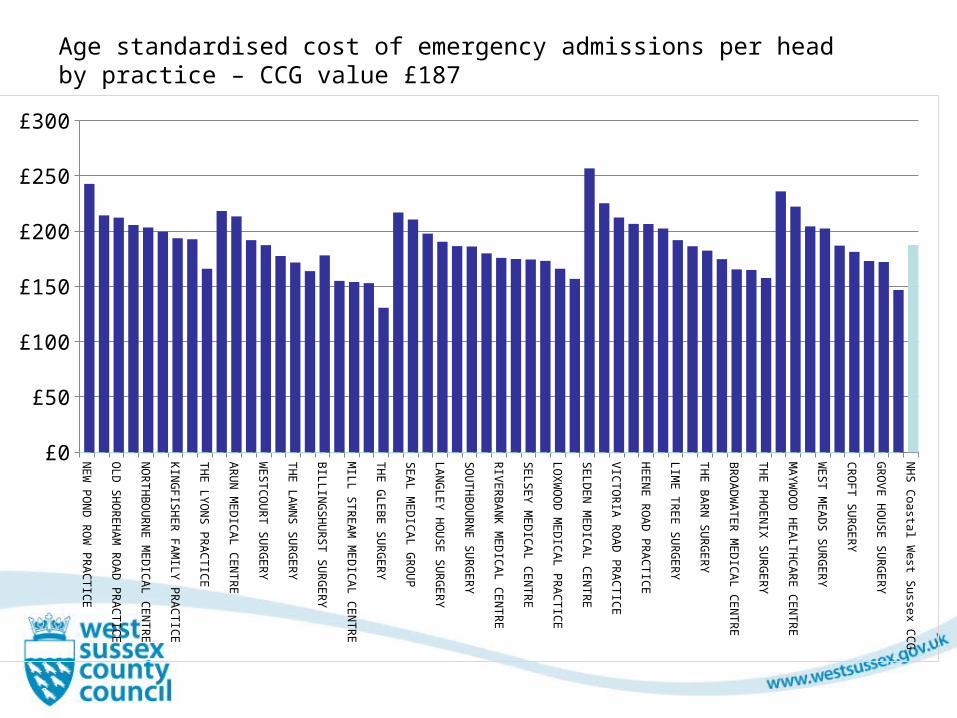
Age standardised cost of emergency admissions per head by practice – CCG value £187
Practice Locality Av Cost
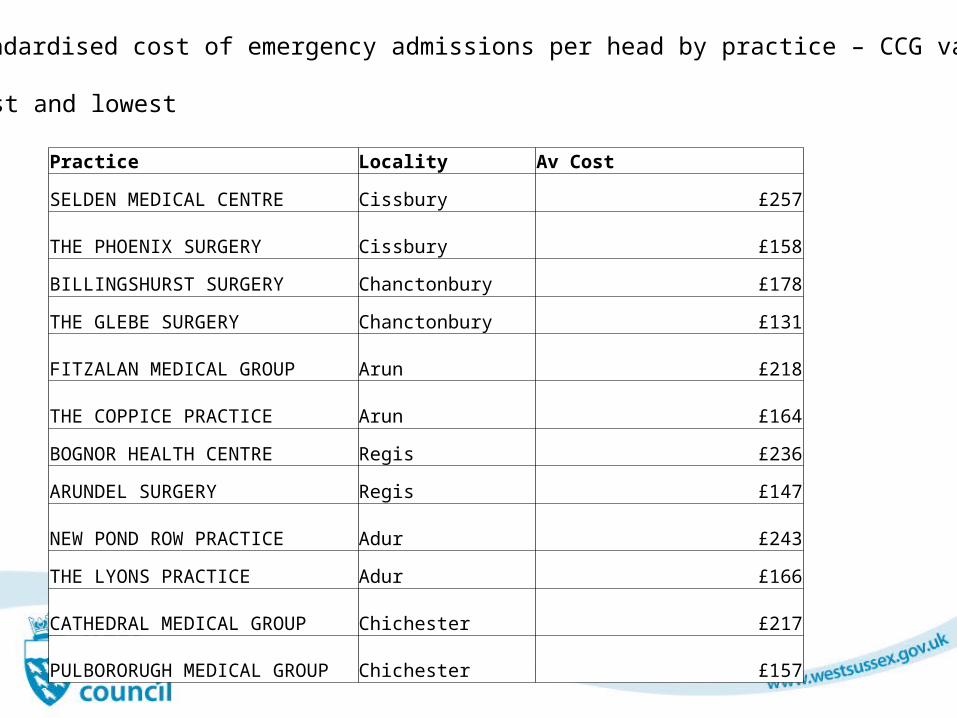
SELDEN MEDICAL CENTRE Cissbury £257
THE PHOENIX SURGERY Cissbury £158
BILLINGSHURST SURGERY Chanctonbury £178
THE GLEBE SURGERY Chanctonbury £131
FITZALAN MEDICAL GROUP Arun £218
THE COPPICE PRACTICE Arun £164
BOGNOR HEALTH CENTRE Regis £236
ARUNDEL SURGERY Regis £147
NEW POND ROW PRACTICE Adur £243
THE LYONS PRACTICE Adur £166
CATHEDRAL MEDICAL GROUP Chichester £217PULBORORUGH MEDICAL GROUP Chichester £157
Age standardised cost of emergency admissions per head by practice – CCG value £187
• Highest and lowest
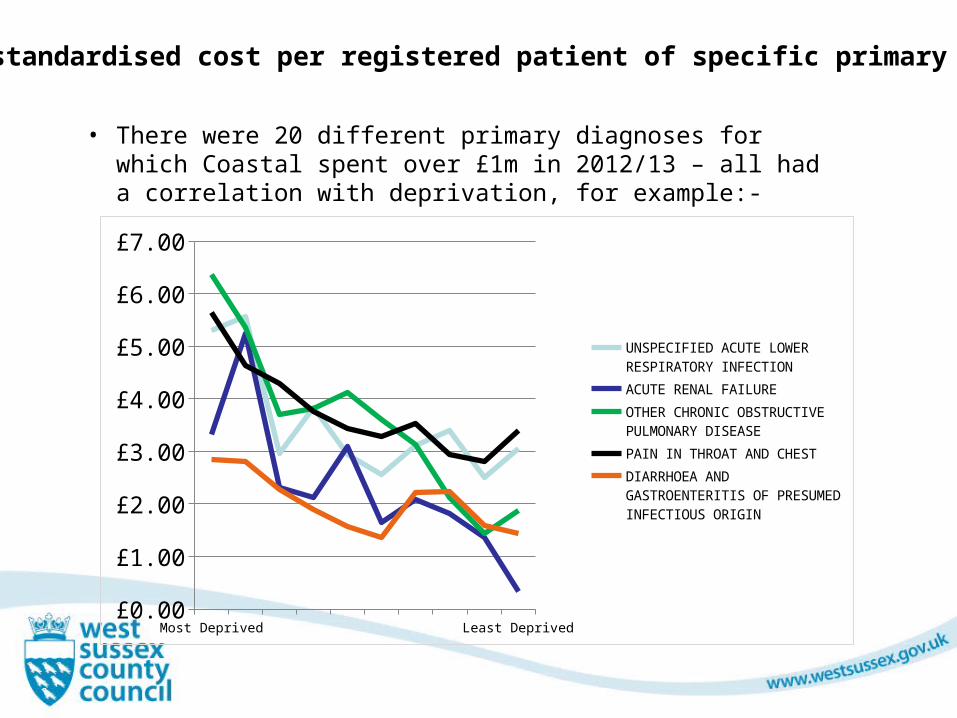
Age standardised cost per registered patient of specific primary diagnoses
Most Deprived Least Deprived£0.00
£1.00
£2.00
£3.00
£4.00
£5.00
£6.00
£7.00
UNSPECIFIED ACUTE LOWER RESPIRATORY INFECTIONACUTE RENAL FAILUREOTHER CHRONIC OBSTRUCTIVE PULMONARY DISEASEPAIN IN THROAT AND CHESTDIARRHOEA AND GAS-TROENTERITIS OF PRESUMED INFECTIOUS ORIGIN
• There were 20 different primary diagnoses for which Coastal spent over £1m in 2012/13 – all had a correlation with deprivation, for example:-
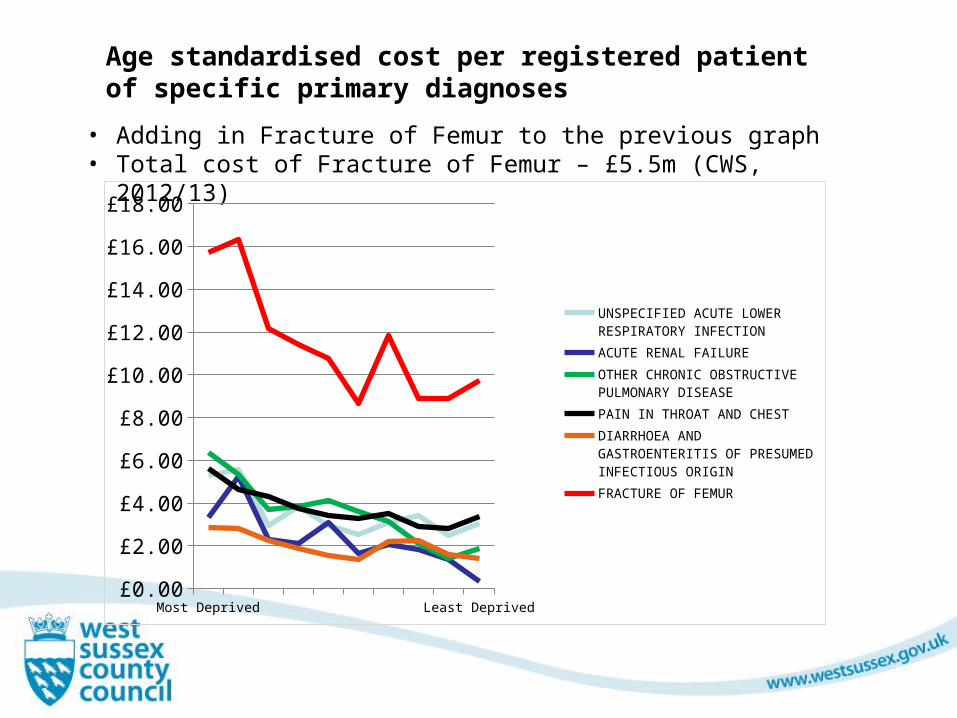
Age standardised cost per registered patient of specific primary diagnoses
• Adding in Fracture of Femur to the previous graph• Total cost of Fracture of Femur – £5.5m (CWS, 2012/13)
Most Deprived Least Deprived£0.00
£2.00
£4.00
£6.00
£8.00
£10.00
£12.00
£14.00
£16.00
£18.00
UNSPECIFIED ACUTE LOWER RESPIRATORY INFECTIONACUTE RENAL FAILUREOTHER CHRONIC OBSTRUCTIVE PULMONARY DISEASEPAIN IN THROAT AND CHESTDIARRHOEA AND GAS-TROENTERITIS OF PRESUMED INFECTIOUS ORIGINFRACTURE OF FEMUR
31
Wide range of resources to support work on inequalities
Marmot Reviewhttp://www.instituteofhealthequity.org/projects/fair-society-healthy-lives-the-marmot-reviewKings Fundhttp://www.kingsfund.org.uk/time-to-think-differently/trends/broader-determinants-health#messagesNICEhttp://www.nice.org.uk/advice/lgb4
Related Documents