HEALTH EQUITY IN ENGLAND: THE MARMOT REVIEW 10 YEARS ON EXECUTIVE SUMMARY

Welcome message from author
This document is posted to help you gain knowledge. Please leave a comment to let me know what you think about it! Share it to your friends and learn new things together.
Transcript

HEALTH EQUITY IN ENGLAND:THE MARMOT REVIEW 10 YEARS ONEXECUTIVE SUMMARY

1HEALTH EQUITY IN ENGLAND: THE MARMOT REVIEW 10 YEARS ON
Key messages of this review 3
Introduction 4
Proposals to support action on health inequalities 7
Inequalities in health since 2010 10
Social determinants of health 16Give every child the best start in life 17Attainment 18
Child poverty 18
Funding 19
Enable all children, young people and adults to maximise their capabilities and have control over their lives 20Attainment 21
School exclusions 22
Youth crime 22
Funding 22
Create fair employment and good work for all 23Employment rates 23
Work quality 23
Automation 24
Low wages and in work poverty 24
Contents
Ensure a healthy standard of living for all 25Wage, income and wealth inequalities 25
Poverty 26Tax and benefit system 27Social mobility 27
Create and develop healthy and sustainable places and communities 28Communities and places facing particular hardship and adversity 28
Air quality 28
Built environment and transport 29
Housing 29
Climate change 30
Conclusions 31
References 32

2 HEALTH EQUITY IN ENGLAND: THE MARMOT REVIEW 10 YEARS ON
AUTHORS
Report writing team: Michael Marmot, Jessica Allen, Tammy Boyce, Peter Goldblatt, Joana Morrison.
The Marmot Review team was led by Michael Marmot and Jessica Allen and consisted of Jessica Allen, Matilda Allen, Peter Goldblatt, Tammy Boyce, Antiopi Ntouva, Joana Morrison, Felicity Porritt.
Peter Goldblatt, Tammy Boyce and Joana Morrison coordinated production and analysis of tables and charts.
Team support: Luke Beswick, Darryl Bourke, Kit Codling, Patricia Hallam, Alice Munro.
The work of the Review was informed and guided by the Advisory Group and the Health Foundation.
Suggested citation: Michael Marmot, Jessica Allen, Tammy Boyce, Peter Goldblatt, Joana Morrison (2020) Health Equity in England: The Marmot Review ten years on. London: Institute of Health Equity
HEALTH FOUNDATION
The Health Foundation supported this work and provided insight and advice IHE would like to thank in particular: Jennifer Dixon, Jo Bibby, Jenny Cockin, Tim Elwell Sutton, Adam Tinson, David Finch, Grace Everest, Rita Ranmal.
AUTHORS’ ACKNOWLEDGEMENTS
We are indebted to the Advisory Group that informed the review: Torsten Bell, David Buck, Sally Burlington, Jabeer Butt, Jo Casebourne, Adam Coutts, Naomi Eisenstadt, Joanne Roney, Frank Soodeen, Alice Wiseman.
We are also grateful for advice and insight from the Collaboration for Health and Wellbeing.
We are grateful for advice and input from Nicky Hawkins, Frameworks Institute; Angela Donkin, NFER; and Tom McBride, Early Intervention Foundation for comments on drafts. We are grateful to Madhavi Bajekal, UCL/ Legal & General for input on life expectancy data. We are grateful to Greater Manchester Health and Social Care Partnership, Greater Manchester Combined Authority and the Greater Manchester localities.
SOURCE MATERIALS FOR CASE STUDIES
Source materials used in the case studies presented in the report were collated by Jessica Allen, Tammy Boyce, Peter Goldblatt and Joana Morrison. Some case studies were provided by People’s Health Trust.
We are grateful to the following organisations that represent the case studies: ACORN Ethical Lettings, Advice Nottingham, Aspire & Succeed, Beat the Cold, Bikes for All, Centre for Local Economic Strategies, Edberts House, English for Action (EFA), Eastern Savings and Loans Credit Union, Gateshead Public Health, Justice Prince, Magic Breakfasts, Malmo City Council, Northumbria Foundation Trust Welfare Rights Team, Nottingham City Council, Open Door Community Action Trust, Positive Youth Foundation, Redcar Athletic Football Club Limited, the Resurgam Trust, Stepping Stones for Families, Streetgames, Switchee, Surrey Minority Ethnic Forum (SMEF), Tower Hamlets Whole Systems Data Project, Wales Future Generation Commission, West Midlands Fire Service, Whitehawk GPs.

3HEALTH EQUITY IN ENGLAND: THE MARMOT REVIEW 10 YEARS ON
Key messages of this review
• Since 2010 life expectancy in England has stalled; this has not happened since at least 1900. If health has stopped improving it is a sign that society has stopped improving. When a society is flourishing health tends to flourish.
• The health of the population is not just a matter of how well the health service is funded and functions, important as that is. Health is closely linked to the conditions in which people are born, grow, live, work and age and inequities in power, money and resources – the social determinants of health.
• The slowdown in life expectancy increase cannot for the most part be attributed to severe winters. More than 80 percent of the slowdown, between 2011 and 2019, results from influences other than winter-associated mortality.
• Life expectancy follows the social gradient – the more deprived the area the shorter the life expectancy. This gradient has become steeper; inequalities in life expectancy have increased. Among women in the most deprived 10 percent of areas, life expectancy fell between 2010-12 and 2016-18.
• There are marked regional differences in life expectancy, particularly among people living in more deprived areas. Differences both within and between regions have tended to increase. For both men and women, the largest decreases in life expectancy were seen in the most deprived 10 percent of neighbourhoods in the North East and the largest increases in the least deprived 10 percent of neighbourhoods in London.
• There has been no sign of a decrease in mortality for people under 50. In fact, mortality rates have increased for people aged 45-49. It is likely that social and economic conditions have undermined health at these ages.
• The gradient in healthy life expectancy is steeper than that of life expectancy. It means that people in more deprived areas spend more of their shorter lives in ill-health than those in less deprived areas.
• The amount of time people spend in poor health has increased across England since 2010. As we reported in 2010, inequalities in poor health harm individuals, families, communities and are expensive to the public purse. They are also unnecessary and can be reduced with the right policies.
• Large funding cuts have affected the social determinants across the whole of England, but deprived areas and areas outside London and the South East experienced larger cuts; their capacity to improve social determinants of health has been undermined.
• As in 2010 reducing health inequalities requires action on six policy objectives. In this report we review significant changes since 2010 in five of them.
- Give every child the best start in life
- Enable all children, young people and adults to maximise their capabilities and have control over their lives
- Create fair employment and good work for all
- Ensure a healthy standard of living for all
- Create and develop healthy and sustainable places and communities
• For each objective we outline areas of progress and decline since 2010 and make clear the links with health and health inequalities.
• Despite the cuts and deteriorating outcomes in many social determinants some local authorities and communities have established effective approaches to tackling health inequalities. The practical evidence about how to reduce inequalities has built significantly since 2010.
• The national government has not prioritised health inequalities, despite the concerning trends and there has been no national health inequalities strategy since 2010. We see this as an essential first step in leading the necessary national endeavour to reduce health inequalities.
• We set out a clear agenda for national government to tackle health inequalities, building on evidence of experience in other countries and local areas since 2010. We establish how the Government must take action in England as a matter of urgency.
• The goal should be to bring the level of health of deprived areas in the North up to the level of good health enjoyed by people living in affluent areas in London and the South.

4 HEALTH EQUITY IN ENGLAND: THE MARMOT REVIEW 10 YEARS ON
Introduction
Health is repeatedly shown to be the Nation’s top priority. And so it should be – it is quite simply a matter of life or death of wellbeing or sickness. Good health is an indication that society is thriving and that economic and social and cultural features of society are working in the best interests of the population.
The last decade has been marked by deteriorating health and widening health inequalities. People living in more deprived areas outside London have seen their life expectancy stalling, even declining for some, while it has increased in more advantaged areas. For healthy life expectancy there has been little increase for men and a slight fall for women.
This damage to health has been largely unnecessary. There is no biological reason for stalling life expectancy and widening health inequalities. Other countries are doing better, even those with longer life expectancy than England. The slowdown in life expectancy is not down to exceptionally cold winters or virulent flu, and cannot be attributed solely to problems with the NHS or social care – although declining funding relative to need in each sector will undoubtedly have played a role. The increase in health inequalities in England points to social and economic conditions, many of which have shown increased inequalities, or deterioration since 2010.
In the 2010 Marmot Review, Fair Society Healthy Lives, we set out 6 areas, which covered stages of life, healthy standard of living, communities and places and ill health prevention. These formed the basis for our six priority objectives and areas of recommendations:
• Give every child the best start in life.
• Enable all children, young people and adults to maximise their capabilities and have control over their lives.
• Create fair employment and good work for all.
• Ensure a healthy standard of living for all.
• Create and develop healthy and sustainable places and communities.
• Strengthen the role and impact of ill health prevention.
5HEALTH EQUITY IN ENGLAND: THE MARMOT REVIEW 10 YEARS ON
In this 10 Years on Report, we assess what has happened since 2010 in all the areas except the sixth – ill health prevention. Our reason for not covering the sixth area is that it has been explored in detail by others since 2010 and there have been many programmes and interventions – led by Public Health England and NHS England and public health teams in local government. This area is vitally important for ill health prevention and our recommendations in 2010 still stand: we call for an increase in public health funding and increased focus on prevention from the NHS.
For the other five areas we examine outcomes over the last decade and include new areas for analysis which have risen in importance since the original report. We have a stronger focus on regional inequalities; areas outside London and the South have fared worse in health and the social determinants since 2010 and remedying this should be a major focus of government action. We make recommendation to this effect.
We also have a greater emphasis on poverty as well as the socioeconomic gradient, those towards the bottom of the socioeconomic gradient have suffered particularly over the decade and require proportionately more investment and support over the next decade even just to bring them back to where they were in 2010.
We have a somewhat stronger focus on ethnicity, recognising that ethnicity intersects with socioeconomic position to produce particularly poor outcomes for some minority ethnic groups. Lack of data though is a continuing limitation in understanding ethnic inequalities in health and we welcome efforts to make better use of data linkage to support analyses, and to inform policy and interventions to reduce ethnic inequalities and to strengthen accountability.
Since 2010 there have been widespread and deep cuts in most areas of public spending, a result of austerity and government responses to perceived financial pressures. Government spending as a percentage of GDP declined by seven percentage points between 2009/10 and 2018/19, from 42 percent to 35 percent. Cuts to local authorities have been hugely significant; local government allocations from the Ministry of Housing, Communities and Local Government declined by 77 percent between 2009–10 and 2018–19. There have also been large cuts to most other Departments’ expenditure. Spending on social protection and education, both vital for health, have declined the most – by 1.5 percent of GDP.
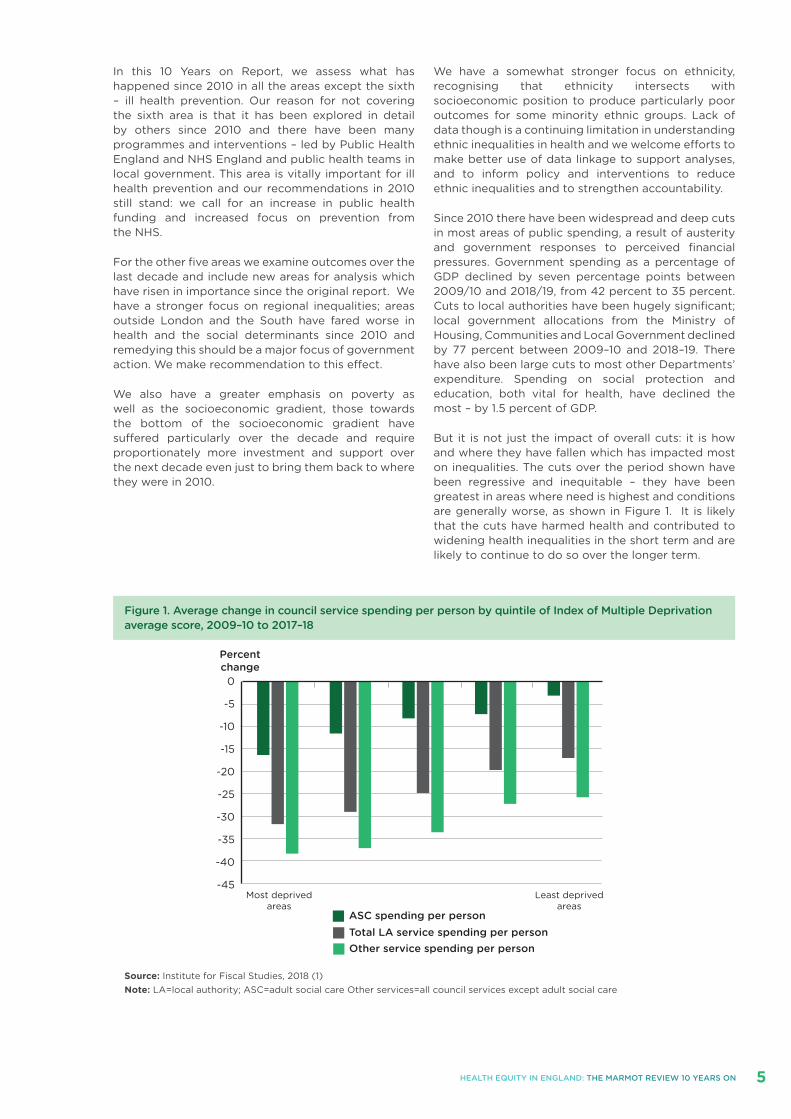
But it is not just the impact of overall cuts: it is how and where they have fallen which has impacted most on inequalities. The cuts over the period shown have been regressive and inequitable – they have been greatest in areas where need is highest and conditions are generally worse, as shown in Figure 1. It is likely that the cuts have harmed health and contributed to widening health inequalities in the short term and are likely to continue to do so over the longer term.
0
-5
-10
-15
-20
-25
-30
-35
-40
-45
ASC spending per person
Percentchange
Total LA service spending per personOther service spending per person
Least deprivedareas
Most deprivedareas
Figure 1. Average change in council service spending per person by quintile of Index of Multiple Deprivation average score, 2009–10 to 2017–18
Source: Institute for Fiscal Studies, 2018 (1)Note: LA=local authority; ASC=adult social care Other services=all council services except adult social care

6 HEALTH EQUITY IN ENGLAND: THE MARMOT REVIEW 10 YEARS ON
While outcomes and actions in England have been disappointing, there is some cause for optimism. Since 2010 there has been a marked change in awareness and prioritisation of health inequalities and social determinants of health. Many organisations in England now have social determinants of health strategies and have helped build evidence, providing practical tools for implementing approaches for a wide range of organisations and sectors; they have also provided support and funding to help communities to make the changes. Examples of these are highlighted throughout the report. There has been a welcome change in debate, at least by local governments, think tanks, health workforces, public health – and social determinants approaches are increasingly on the agenda.
Internationally too, governments have taken forward national approaches to health inequalities. Some governments in the UK have prioritised health inequalities and social determinants to a greater extent than in England. Throughout the main report we include brief descriptions of these and refer to others.
Local governments have played a vital role. Despite widespread cuts there has been positive action and some are leading the way, establishing whole system approaches to tackling health inequalities. Alongside this report we publish an evaluation assessing what Coventry City Council has achieved since becoming a Marmot City in 2013. We are also publishing a
short case study of work in Greater Manchester to establish itself as a Marmot City Region. Other areas in England have similarly developed strong and effective ways of improving health and reducing inequalities. Some of these are described in the report. There is much evidence and ample precedent on which the national government in England can base future plans to improve the nation’s health and reduce health inequalities.
Another reason for optimism is that the current Government has signalled an end to austerity and announced a programme of spending which could, if allocated in the right way, help reduce health inequalities and turn around some of the trajectories and poor outcomes experienced over the last ten years. This would require a significant prioritisation of equity – in relation to reducing regional inequalities and inequalities related to area deprivation and peoples’ socioeconomic position.
We set out proposals for policies and actions which, taken together, would reduce inequalities in the social determinants of health and thus achieve greater health equity. There is a pressing need to do this, and lives are being lost and harmed unnecessarily. There is clear evidence of the way forward, practical experience from England and around the world about how to take action, and evidence that there are savings to be made; there are no technical reasons for inaction and the onus is clearly on politicians to take the lead.

7HEALTH EQUITY IN ENGLAND: THE MARMOT REVIEW 10 YEARS ON
Proposals to support action on health inequalities
Strong national government commitment and leadership is required to begin to turn around the deteriorating health situation in England. Improving the health and wellbeing of the population and reducing health inequalities is a whole of society endeavour. But the necessary prioritisation, focus and resources must come from national government with leadership from the Prime Minister. Within the context of overall improvement in health, there are twin challenges:
• To reduce socioeconomic inequalities in length of life and health;
• To reduce regional inequalities in health, improving the health of people living in deprived areas – particularly those outside affluent areas in London and the South.
The following components are essential to achieve that:
Implementation of action on health inequalities and their social determinants
1. Develop a national strategy for action on the social determinants of health with the aim of reducing inequalities in health.
2. Ensure proportionate universal allocation of resources and implementation of policies.
3. Early intervention to prevent health inequalities.
4. Develop the social determinants of health workforce.
5. Engage the public.
6. Develop whole systems monitoring and strengthen accountability for health inequalities.
1. Develop a national strategy for action on the social determinants of health with the aim of reducing inequalities.
A first priority for the Government is to establish a national strategy for health inequalities, led by the Prime Minister. There is evidence that the previous health inequality strategy which ended in 2010 reduced inequalities. Other national governments around the world have established effective national strategies. We propose:
• Development a of national strategy on health inequalities led by the Prime Minister.
• Ensuring a strong focus on social determinants of health in the new strategy and by Public Health England and NHS England.
• Establishing a Cabinet Level cross-departmental committee to lead implementation of the work on the health inequalities strategy.
• The cross departmental committee to lead prioritisation of equity considerations at the heart of policy formulation and implementation in all sectors.
2. Ensure proportionate universal allocation of resources and implementation of policies.
In the 2010 Marmot Review we proposed proportionate universal approaches, that is, policies and interventions which are universal but developed to be more intense where need is higher – to be proportionate to need. These approaches can raise overall levels of health and flatten the gradient in health and we have examples of them in the Report. As we describe in the report, over the last ten years, changes to funding allocations and cuts to benefits have disproportionately affected poorer areas and communities and have been greatest in the North. Reversing these losses requires funding and action to be greater in those areas which have lost most, but universal as all areas have suffered cuts and widening inequalities. Therefore, we propose:
• Health inequalities targets to reduce socioeconomic and area inequalities in health. Regional health inequalities should be reduced by achieving proportionately greater improvements in health inequalities in the North.
• Strengthen the deprivation components in the Revenue Support Grant to local authorities. The NHS Resource allocation formula should also be increased to better reflect social need.

8 HEALTH EQUITY IN ENGLAND: THE MARMOT REVIEW 10 YEARS ON
• Fund and adopt a proportionate universalist approach to building community resources and involve communities in the design and implementation of programmes to reduce inequalities.
3. Early intervention to prevent health inequalities.
Take action on the five areas outlined in the report in the ways set out and summarised here and continue to take action in the sixth area of the 2010 Marmot Review: 1. Give every child the best start in life2. Enable all children, young people and adults to
maximise their capabilities and have control over their lives
3. Create fair employment and good work for all4. Ensure a healthy standard of living for all5. Create and develop healthy and sustainable places
and communities
6. Strengthen the role and impact of ill health prevention.
We also propose increasing spending on public health to seven percent of the NHS budget as set out in the 2010 Marmot Review
4. Develop the social determinants of health workforce.
Action on the social determinants of health requires action across multiple arenas and domains and that requires commitment and know-how from a range of workforces outside health. Since 2010, there have been many promising developments from non-healthcare workforces, which illustrate the possibility of health equity in all policies. Police, fire fighters, social care, housing and early years workforces have all developed approaches to tackling health inequalities, by extending and adapting their day-to-day practices and procurement.
Clearly the prime focus of the healthcare workforce will always be on health care and treatment, but there are many effective and promising practices developed by the health care workforce which can improve population health and reduce inequalities through actions on the social determinants. We recommend:
• Development of education programmes focusing on the social determinants for a range of workforces
• Development of anchor institution approaches
• Develop a health system approach to population health, with partnerships to improve population health among a range of sectors, locally and nationally.
5. Engage the public
While health is repeatedly at the top of the public’s concerns, there is widespread lack of public understanding about what drives health. This is a major obstacle to further progress in reducing health inequalities and increasing population health. Even though the health system and national government
know the evidence that social determinants are largely responsible for the nations’ health and levels of health inequalities, they retain the focus on health care and continue to underfund and overlook actions on the social determinants of health.
A 2017 survey by the British Social Attitude Survey for the Health Foundation found almost all, 96 percent of respondents reflected the consistent political and media discourse, as they considered free health care to have a ‘very large’ or ‘quite large’ impact on health and ‘individual behaviours’ close behind, 93 percent. Assessments in England and internationally repeatedly show that social determinants account for most of health; health care a much lesser extent.
A 2019 report from WHO EURO concluded that only about 10 percent of self-reported health relates to health care, the rest in varying proportions to four other social, environmental and economic factors. The public and political debate on health needs to move towards the social determinants and away from the overwhelming focus on individual behaviours and health care; this will help shift political focus and lead to greater investment and action on social determinants. We therefore recommend:
• Government and Public Health England initiate a highly visible and accessible public debate highlighting widening health inequalities and addressing how the social determinants affect health.
• Development of appropriate public facing reporting mechanisms for inequalities in health.
6. Develop whole systems monitoring and strengthen accountability for health inequalities.
Accountability for health inequalities is weak. The Health and Social Care Act of 2012 did contain health inequalities duties and legal accountabilities for health inequalities, but these have been largely disregarded nationally, although NHS England has made some progress.
National Government needs to be accountable for health inequalities, and for the range of policies outside the health care sector that are necessary for addressing health inequalities. Reducing inequalities is a whole of society endeavour, involving many different parts of government and a range of different sectors and organisations as well as the public. National government must be responsible for regional and socioeconomic health inequalities and be held accountable for progress. Developing broad targets to strengthen accountability and galvanise action is one of number of ways of ensuring that action on health inequalities is prioritised.
Effective monitoring systems are an essential component of understanding the nature of health inequalities, understanding the impacts of policies and programmes and holding Government and other organisations to account for them. Since 2010, progress has been made in developing system-wide monitoring which incorporates health outcomes and social determinants at local level – these types of

9HEALTH EQUITY IN ENGLAND: THE MARMOT REVIEW 10 YEARS ON
monitoring offer opportunities for understanding the impacts of the social determinants on health at the local level – and for designing interventions to improve outcomes. Data showing regional and socioeconomic inequalities in health is routinely available. Government should demonstrate that it is accountable for progress on these inequalities by actively monitoring indicators based on these data and reporting to the public – much like current health care targets on waiting times for example.
We therefore propose development of targets to:
• Bring the level of health of deprived areas in the North up to the level of good health enjoyed by people living in affluent areas in London and the South.
In support of meeting those targets we propose to:
• Strengthen accountability mechanisms for health inequalities including through legislation
• Build more effective whole system data sets and improve data for ethnicity.

10 HEALTH EQUITY IN ENGLAND: THE MARMOT REVIEW 10 YEARS ON
Inequalities in health since 2010
LIFE EXPECTANCY SINCE 2010
• Increases in life expectancy have slowed since 2010, with the slowdown greatest in more deprived areas of the country.
• The UK has seen low rates of life expectancy increases compared with most European and other high-income countries.
• Inequalities in life expectancy have increased since 2010, especially for women.
• Female life expectancy declined in the most deprived 10 percent of neighbourhoods between 2010-12 and 2016-18 and there were only negligible increases in male life expectancy in these areas.
• There are growing regional inequalities in life expectancy. Life expectancy is lower in the North and higher in the South. It is now lowest in the North East and highest in London.
• Within regions, life expectancy for men in the most deprived 10 percent of neighbourhoods decreased in the North East, Yorkshire and the Humber and the East of England.
• Life expectancy for women in the most deprived 10 percent of neighbourhoods decreased in every region except London, the West Midlands and the North West.
• For both men and women, the largest decreases were seen in the most deprived 10 percent of neighbourhoods in the North East and the largest increases in the least deprived 10 percent of neighbourhoods in London.
• In every region men and women in the least deprived 10 percent of neighbourhoods have seen increases in life expectancy and differences between regions for these neighbourhoods are much smaller than for more deprived neighbourhoods.
HEALTH SINCE 2010
• There is a strong relationship between deprivation measured at the small area level and healthy life expectancy at birth. The poorer the area, the worse the health.
• There is a social gradient in the proportion of life spent in ill health, with those in poorer areas spending more of their shorter lives in ill health.
• Healthy life expectancy has declined for women since 2010 and the percentage of life spent in ill health has increased for men and women.
MORTALITY RATES SINCE 2010
• There has been no sign of a decrease in mortality for people under 50. In fact, mortality rates have increased for people aged 45-49. It is likely that social and economic conditions have undermined health at these ages.
• For people in their 70s mortality rates are continuing to decrease, but not for those at older ages.
• The slowdown in life expectancy increase cannot, for the most part be attributed to severe winters. More than 80 percent of the slowdown, between 2011 and 2019, results from influences other than winter-associated mortality.
• There are clear socioeconomic gradients in preventable mortality. The poorest areas have the highest preventable mortality rates and the richest areas have the lowest.

11HEALTH EQUITY IN ENGLAND: THE MARMOT REVIEW 10 YEARS ON
In the 2010 Marmot Review we labelled health inequalities as ‘unjust’ and ‘unnecessary’ and that is still the case. Since 2010 there have been worrying deteriorations in health and widening health inequalities in England and these are likely related to deteriorations in the social determinants.
Figure 2, shows stalling life expectancy in England since 2011, this stalling is unprecedented, at least since the turn of the last century. Life expectancy from 1980 is shown in Figure 2 and the stalling of life expectancy growth is clear for both men and women.
Figure 2 Life expectancy at birth for males and females, England, 1981–2018
Source: ONS, 2019 (2)
1980
85
80
75
70
Life expectancy at birth (years)
1982 1984
Year
Females
Males
1986 1988 1990 1992 1994 1996 1998 2000 2002 2004 2006 2008 2010 2012 2014 2016 2018
Inequalities in life expectancy have widened since 2010. The difference in life expectancy at birth between the least and most deprived deciles was 9.5 years for males and 7.7 years for females in 2016–18. In 2010-12, the corresponding differences were smaller - 9.1 and 6.8 years, respectively. Life expectancy at birth for males living in the most deprived areas in England was 73.9 years in 2016-18, compared with 83.4 years in the least deprived areas; the corresponding figures for females were 78.6 and 86.3 years.

12 HEALTH EQUITY IN ENGLAND: THE MARMOT REVIEW 10 YEARS ON
Figure 3. Life expectancy at birth by area deprivation quintiles and sex, England, 2003–05 to 2015–17
Source: Calculated by Bajekal M using ONS data, 2019 (3)
85
80
75
70
Life expectancy(years)
Years
Deprivation quintiles
2001 2002 2003 2004 2005 2006 2007 2008 2009 2010 2011 2012 2013 2014 2015 2016 2017
Middle deprived
90
85
80
75
70
Life expectancy(years)
Years
Deprivation quintiles
2001 2002 2003 2004 2005 2006 2007 2008 2009 2010 2011 2012 2013 2014 2015 2016 2017
Trends in inequalities in life expectancy by quintile of area deprivation are shown in Figure 3. People in the most deprived area quintile experienced slower improvements in life expectancy than the rest of the population between 2001 and 2017. The differences between the least and most deprived area quintiles in 2001 were 7.4 for men and 5.0 for women. These differences increased to 7.5.and 5.4, respectively in 2010 and further increased to 7.7 and 6.1, respectively in 2017 – a substantially greater rate of increase in inequalities, especially for women, in the years since 2010 than in the previous decade.
As in 2010, there are clear inequalities in life expectancy between regions in England and between area deprivation deciles within each region. Since 2010 there have been some significant changes in regional inequalities. Principally, life expectancy in London increased more rapidly than elsewhere from 2010, so that the region had improved from having the fourth highest life expectancy to the highest for males and females by 2016–18. By contrast, the North East, had the slowest rate of improvement to become the region with the lowest life expectancy in 2016–18.
a) Males
b) Females

13HEALTH EQUITY IN ENGLAND: THE MARMOT REVIEW 10 YEARS ON
Figure 4. Life expectancy at birth by sex and deprivation deciles in London and the North East regions, 2010–12 and 2016–18
Changes in relative positions in average regional life expectancy provide important information about how different regions are performing in health. Inequalities in life expectancy within regions point to possible reasons for these regional differences. Wealthier areas in the North and South have similar life expectancy to one another, while more deprived areas have lower life expectancy in the North. The life expectancy difference between regions can be accounted for by differences between more deprived areas (4).
This can be illustrated by comparing London with the North East region (Figure 4). The gradient in life expectancy is steeper in the North East than in London. The health disadvantage of living in the North East increases with the level of deprivation of the area of residence. Figure 4, also shows that, in the North East, life expectancy stagnated between 2010-12 and 2016-18 for men living in more deprived areas, and actually declined for women. By contrast, it increased for both men and women in the least deprived area deciles. For those living in London, life expectancy increased in all deciles for both men and women.
Source: Based on PHE, 2020 (5)
90
85
80
75
70
65
Life expectancy (years)
1
Deprivation deciles Least deprivedMost deprived
2 3 4 5 6 8 9 107
North East region 2016-18
North East region 2010-12
London region 2016-18
London region 2010-12
90
85
80
75
70
65
Life expectancy (years)
1
Deprivation deciles Least deprivedMost deprived
2 3 4 5 6 8 9 107
North East region 2016-18
North East region 2010-12
London region 2016-18
London region 2010-12
a) Males
b) Females

14 HEALTH EQUITY IN ENGLAND: THE MARMOT REVIEW 10 YEARS ON
Ethnicity is not recorded at death registration, making routine analysis of ethnic inequalities in health difficult. Two research studies using area data pointed to those with Pakistani and Bangladeshi ethnicity having the lowest life expectancy and non-British Whites having the highest.
While life expectancy is one important measure of health, how long a person can expect to live in good health is an even more significant measure of quality of life. Certainly, recent debates have focused on adding ‘life to years, rather than years to life’. Giving cause for concern on top of the stalling in life expectancy improvements, recent measures have shown that improvements in health have stalled too and have even declined for many. For women, healthy life expectancy has declined since 2009–11 and, for both men and women, years spent in poor health have increased.
In Table 1 ONS data show that healthy life expectancy at birth in England in 2015–17 was 63.4 years for males and 63.8 years for females, meaning that more than one-fifth of life will likely be spent in ill health. The figures in red in Table 1 indicate the deterioration since 2009–11.
Healthy life expectancy (HLE)
Years in poor health
Percentage life spent in poor health
Disability-free life expectancy (DFLE)
Years with disability
Percentage life spent with disability
Males
2009–11 63.0 15.8 20.0 63.5 15.3 19.4
2012–14 63.4 16.1 20.2 63.1 16.3 20.5
2015–17 63.4 16.2 20.3 63.1 16.5 20.7
Females
2009–11 64.0 18.7 22.6 63.9 18.8 22.7
2012–14 63.9 19.3 23.2 62.8 20.3 24.4
2015–17 63.8 19.4 23.3 62.2 21.0 25.2
Source: ONS (5)
Table 1. Healthy life expectancy and proportion of life spent in good health, 2009–17, males and females, England

15HEALTH EQUITY IN ENGLAND: THE MARMOT REVIEW 10 YEARS ON
Figure 5 shows the relationship between local authority deprivation and healthy life expectancy at birth. On average, healthy life expectancy at birth differs by 12 years between the most and least deprived local authorities for men and women.
Figure 5. Healthy life expectancy at birth by Index of Multiple Deprivation score of upper tier local authorities, England, 2015-17
Source: Based on PHE, 2019 (5)
75
70
65
60
55
5045
IMD deprivation scoreLeast deprivedMost deprived
40 35 30 25 20 10 5 015
Years of healthy life
75
70
65
60
55
5045
Least deprivedMost deprived40 35 30 25 20 10 5 015
IMD deprivation score
Years of healthy life
a) Males
b) Females
Public Health England’s survey of quality life by different ethnic groups shows Pakistani, Bangladeshi and White Gypsy Travellers have much lower quality of life than other ethnic groups. For many groups in England, health and life expectancy are deteriorating and there are clear systematic inequalities in the groups for whom this is happening.
Broadly speaking, poorer communities, women and those living in the North have experienced little or no improvement since 2010. There has been a slowdown in life expectancy of a duration not witnessed in
England for 120 years and that has not been seen to the same extent across the rest of Europe or in most other Organisation for Economic Co-operation and Development (OECD) countries. And health has deteriorated for the population as a whole.
While at this stage it is impossible to establish precisely why life expectancy has stalled and why health inequalities in England are widening, a change in winter-associated mortality and ill health is not the main factor and the reasons are most likely to lie in the social determinants of health.

16 HEALTH EQUITY IN ENGLAND: THE MARMOT REVIEW 10 YEARS ON
Social determinants of health
Since the 2010 Marmot Review there have been important developments in the evidence about the social determinants of health and in the implementation of interventions and policies to address them. There have also been fundamental political, cultural, social, economic and policy changes that have profoundly affected all aspects of the social determinants in England. This section summarises important developments in five of the six areas set out in the 2010 Marmot Review, changes that may explain why health has deteriorated for many in England, and will likely continue to do so in the longer term.
The evidence base for the priority objectives in the 2010 Marmot Review was substantial at the time and has grown more so. Rather than repeat the evidence the report covers particular issues in each of the five areas that have increased in importance for equity, and that have also been a focus of policy since 2010.

17HEALTH EQUITY IN ENGLAND: THE MARMOT REVIEW 10 YEARS ON
SUMMARY
• Since 2010, progress has been made in early years development, as measured by children’s readiness for school. Clear socioeconomic inequalities persist, with a graded relationship between these measures and level of deprivation.
• For low-income children, levels of good development are higher in more deprived areas than in less deprived areas.
• Rates of child poverty, a critical measure for early child development, have increased since 2010/11 with over four million children affected.
• Child poverty rates are highest for children living in workless families - in excess of 70 percent.
• Funding for Sure Start and Children’s Centres, and other children’s services, has been cut significantly, particularly in more deprived areas.
• More deprived areas have lost more funding for children and youth services than less deprived areas, even as need has increased.
• There are still low rates of pay and a low level of qualification required in the childcare workforce.
Early childhood is a critical time for development of later life outcomes, including health. Evidence shows that positive experiences early in life are closely associated with better performance at school, better social and emotional development, improved work outcomes, higher income and better lifelong health, including longer life expectancy. Conversely, less positive experiences early in life, particularly experiences of adversity, relate closely to many negative long-term outcomes: poverty, unemployment, homelessness, unhealthy behaviours and poor mental and physical health. Since 2010 IHE and other organisations have continued to assess the growing body of evidence describing the associations between experiences in early years, education, and short- and long-term health outcomes. Such is the strength of evidence linking experiences in the early years to later health outcomes that this was the priority area for the 2010 Marmot Review.
Give every child the best start in life

18 HEALTH EQUITY IN ENGLAND: THE MARMOT REVIEW 10 YEARS ON
ATTAINMENT
Since 2010 progress has been made on readiness for school and attainment during school and rates have risen. However, clear socioeconomic inequalities in these measures persist and there are wide inequalities in outcomes between regions. Gender inequalities remain and there are inequalities related to ethnic background that require much greater focus. Some areas, such as Greater Manchester, have rapidly improved outcomes for children in the early years, a result of concerted system-wide efforts and prioritisation of support for families and children during these years.
Since 2010 evidence has shown that children in families with low incomes do better at schools in more deprived areas than they do in wealthier areas. It seems clear that schools and communities in some more deprived areas are making a beneficial difference for the most deprived students and breaking the close association between deprivation and lower outcomes. A second possibility is that being a poorer child among more privileged children may lead to feelings of exclusion and lack of self-esteem.
There are two types of influence on children’s development – both of which follow the social gradient. The positive activities are associated with caring and nurturing which foster good early child development. By contrast, adverse child experiences, more frequent lower down the social hierarchy, have profound impact on children’s lives and throughout their life course. Reduction of inequalities and relief of poverty will be important to both of these.
CHILD POVERTY
High rates of child poverty continue to blight the lives of too many children. Poverty experienced during childhood harms health at the time and throughout the rest of life. Since 2010 there have been increases in child poverty, particularly in families with parents in work. Child poverty is not an inevitability, but largely the result of political and policy choices in areas including social protection, taxation rates, housing and income and minimum wage policies. Many countries in the OECD have considerably lower rates of child poverty than England.
Figure 6 shows child poverty rates before and after housing costs, demonstrating the significant difference housing costs make to child poverty rates – an eight percent point increase in 2017/18. Numbers of children in poverty have increased to exceed four million after housing costs are taken into account. In England the proportion of children in poverty is projected to increase under present policies. The Institute for Fiscal Studies predicts relative child poverty, living in a household with less than 60 percent of median income, after housing costs will increase from 30 percent to 36.6 percent in 2021 in the UK.
35
30
25
20
15
10
5
0
Before housing costs After housing costs
2010/11 2011/12 2012/13 2013/14 2014/15 2015/16 2016/17 2017/18
Percent of children
Years
Source: Department for Work and Pensions, 2019 (7)Note: Low-income families are those in receipt of out-of-work benefits or tax credits or whose reported income is less than 60 percent of median income
Figure 6. Percent of children living in poverty measured before and after housing costs, England, 2010/11–2017/18

19HEALTH EQUITY IN ENGLAND: THE MARMOT REVIEW 10 YEARS ON
Some minority ethnic groups have particularly high rates of child poverty. In 2017/18, 45 percent of minority ethnic children lived in families in poverty after housing costs, compared with 20 percent of children in White British families in the UK. These children experience cumulative impacts of the intersections between poverty and exclusion and discrimination, which harms health and life chances even from the earliest age.
Child poverty is highest for children living in workless families - in excess of 70 percent of children in these families are in poverty, up from just over 60 percent in 2010, affecting 1.3 million children. Even for those in two parent families, where one of the parents is not working or working part time, there are 1.6 million children living in poverty.
FUNDING
At the same time that child poverty rates have been increasing, there have been significant cuts in funding for family support services. Funding for local authority children and young people’s services fell by £3 billion between 2010/11 and 2017/18 – a 29 percent reduction, with the greatest cuts for more deprived areas. The North East has had the steepest decline in funding for children and young peoples’ services, 34 percent between 2010–11 and 2017–18. The South East experienced the smallest decline, 22 percent.
Funding for free childcare for 3-4 year olds has been introduced, which is welcome, but this has been at the expense of Sure Start and Children’s Centres, which evidence has shown has helped improve outcomes for the most disadvantaged children and families. It has been estimated that well over 500 Children’s Centres have closed. Spending in England on the early years is currently 0.8 percent of GDP (latest available figures, 2015), compared with Iceland which spends 1.8 percent of GDP on children and families at this stage of life.
Recommendations for giving every child the best start in life
• Increase levels of spending on early years and as a minimum meet the OECD average and ensure allocation of funding is proportionately higher for more deprived areas.
• Reduce levels of child poverty to 10 percent – level with the lowest rates in Europe.
• Improve availability and quality of early years services, including Children’s Centres, in all regions of England.
• Increase pay and qualification requirements for the childcare workforce.

20 HEALTH EQUITY IN ENGLAND: THE MARMOT REVIEW 10 YEARS ON
SUMMARY
• Clear and persistent socioeconomic inequalities in educational attainment that were present in 2010 remain.
• Regionally, the North East, North West and East Midlands have the lowest levels of attainment at age 16 and London has the highest.
• Since 2010 the number of exclusions from school have significantly increased in both primary and secondary schools.
• Pupil numbers have risen while funding has decreased, by eight percent per pupil, with particularly steep declines in funding for sixth form (post-16) and further education.
• Youth services have been cut since 2010 and violent youth crime has increased greatly over the period.
Many of the changes to the education system and experiences of young people in England since 2010 have significant health equity impacts. Persisting socioeconomic inequalities in attainment during primary and secondary school have lifelong impacts on health and on a range of other outcomes throughout life. Since 2010 inequalities in attainment have persisted, although some schools and areas have shown promise in improving outcomes even in the most deprived circumstances, but at national level these approaches are not systematically applied and funding cuts are undermining the potential to do more. Exclusions from school have increased significantly, and violent youth crime has increased.
Funding has become an even greater concern in the decade since the 2010 Marmot Review as numbers of pupils have grown while secondary school funding, and particularly sixth form funding and funding for education post 16, has been reduced. This has limited the ability of schools, particularly in more deprived areas, to provide the intensive work and leadership required to reduce inequalities in attainment and experience.
Enable all children, young people and adults to maximise their capabilities and have control over their lives

21HEALTH EQUITY IN ENGLAND: THE MARMOT REVIEW 10 YEARS ON
ATTAINMENT
As with inequalities in the early years, inequalities experienced during school years have lifelong impacts – in terms of income, quality of work and a range of other social and economic outcomes including physical and mental health. Socioeconomic inequalities in educational attainment have persisted since 2010 entrenching trajectories of inequality which begin in the early years. Young people living in more deprived areas continue to have significantly lower levels of attainment during secondary school, measured by GCSE results and attainment 8 scores, which measures pupils’ performance in eight GCSE-level qualifications.
Figure 7 shows significant inequalities in attainment 8 scores related to eligibility for free school meals and ethnicity. For each ethnic group described, those eligible for free school meals do worse but there are different levels of attainment related to ethnicity. Chinese, Asian and mixed ethnic background children scored higher than average for Attainment 8.
Figure 7. Average Attainment 8 score, by ethnicity and free school meal eligibility, England and English regions, 2017/18
6040 50 703020
Gypsy/Roma
Unknown
Black
White
Other
Mixed
Asian
Chinese
100
Attainment 8 score
Eligible for free school meals
No free school meals
Source: Department for Education, 2019 (8)

22 HEALTH EQUITY IN ENGLAND: THE MARMOT REVIEW 10 YEARS ON
SCHOOL EXCLUSIONS
Since 2010 there have been significant increases in the rate of school exclusions in both primary and secondary schools and official figures, while high, are likely to mask the scale of the problem, with pupils forced out of mainstream schools by informal methods that are not captured in national exclusions data. There are clear socioeconomic inequalities in the risk of being excluded. In 2012 the Department of Education found children eligible for free school meals were four times more likely to be punished by a permanent exclusion than children who were not eligible for free school meals. Outcomes for excluded children are poor and harm those children’s prospects and health for the rest of their lives. There are also associations between exclusion and being a perpetrator or victim of crime.
YOUTH CRIME
Being a perpetrator or victim of crime is closely associated with deprivation and exclusion. It has impacts on health and a range of social and economic outcomes throughout life. Overall, youth crime rates have fallen since 2010, although the decrease has been more pronounced for White than Black children and in 2017/18 Black children were four times more likely than White children to be arrested.
Despite the welcome overall declines in youth crime, violent and particularly knife crimes have increased significantly among young people over the last decade. Between 2010/11 and 2018/19 there was a 31 percent increase in the total number of offences in England involving a knife or sharp instrument. Knife crime particularly affects young males from deprived communities. Household poverty and area deprivation are closely associated with youth violence.
FUNDING
There have been reductions in per pupil funding for secondary education since 2013/14 and the Institute for Fiscal Studies (IFS) reports that there were cuts of eight percent (by central and local government) per pupil. For many schools this has led to cutting subjects and reductions in the workforce. Post-16 education has been particularly hard hit, with spending per student in school sixth forms reported to have fallen by 23 percent in real terms between 2009/10 and 2018/19. The IFS estimate that reversing the cuts and bringing education spending back in line with 2009–10 would cost about £4.7 billion by 2022–23.
In the 2010 Marmot Review we set out how supporting young people to develop their capabilities was an essential component of supporting health equity and greater equity throughout life. Youth services have an essential role to play in that. However, since 2010, in addition to cuts in school funding, there have been significant cuts in funding for youth services following reductions in local authority funding from central government. Data from the Department of Education indicate that, from 2010–16, spending on youth services fell by 66 percent in real terms.
Recommendations for enabling all children, young people and adults to maximise their capabilities and have control over their lives
• Put equity at the heart of national decisions about education policy and funding.
• Increase attainment to match the best in Europe by reducing inequalities in attainment.
• Invest in preventative services to reduce exclusions and support schools to stop off-rolling pupils.
• Restore the per-pupil funding for secondary schools and especially sixth form, at least in line with 2010 levels and up to the level of London (excluding London weighting).

23HEALTH EQUITY IN ENGLAND: THE MARMOT REVIEW 10 YEARS ON
SUMMARY
• Employment rates have increased since 2010.
• There has been an increase in poor quality work, including part-time, insecure employment.
• The number of people on zero hours contracts has increased significantly since 2010.
• The incidence of stress caused by work has increased since 2010.
• Real pay is still below 2010 levels and there has been an increase in the proportion of people in poverty living in a working household.
• Automation is leading to job losses, particularly for low-paid, part-time workers; the North of England will be particularly affected.
Being in good employment is usually protective of health while unemployment, particularly long-term unemployment, contributes significantly to poor health. However, being in work is not an automatic step towards good health and wellbeing; employment can also be detrimental to health and wellbeing and a poor quality or stressful job can be more damaging to health than being unemployed. Unemployment and poor quality work are major drivers of inequalities in physical and mental health. Being in poverty and working in poor quality employment have marked effects on physical and mental health, including on children in the families concerned.
Since 2010 there have been profound shifts in many aspects of the labour market and employment practices in England. Rates of unemployment have decreased but increases in employment have often been in low-paid, unskilled, self-employed, short-term or zero hours contract jobs –which have seen a steady growth. Rates of pay have not increased and, notably, more people in poverty are now in work than out of work. The rise of automation in the labour market also has implications for health inequalities.
EMPLOYMENT RATES
Employment rates in England have risen since 2010, a welcome development. The risk of being unemployed and particularly long-term unemployed is still highly unequal between different groups. White people, married men, people with no disabilities and those with higher qualifications have higher employment rates than minority ethnic groups, women, lone parents and people with disabilities. The health risks associated with unemployment, and particularly long-term unemployment, are high and include higher mortality rates for those long-term unemployed.
As with so many factors overviewed in this report, there are significant inequalities between regions. The highest employment rates at the end of 2019 were found in the South West, followed closely by the South East and the East of England. The lowest employment rate was seen in the North East, followed by Yorkshire and the Humber which will impact on widening regional inequalities in health
The 2010 Marmot Review recommended an extension of active labour market programmes that were found to be effective in supporting unemployed people into work. However, these approaches have been scaled back. A major thrust of national policy since 2010 has been the extension of conditionalities and tougher sanctions for those who are unemployed or underemployed – requiring people to look for work for extended periods. A five-year study of welfare conditionality, conducted by the University of York from 2013 to 2018, which included analysis of Universal Credit, criticised the use of conditionality in England’s employment support system. The study found that the provision of good quality and targeted support, rather than sanctions, is pivotal in triggering and sustaining paid employment.
WORK QUALITY
Employment has risen in England since 2010, however, the increases, while welcome, have not necessarily been beneficial for health as much of the growth in employment has been in low quality employment with risks to health. Rates of self-reported work-related stress, depression and anxiety have been increasing, at least partly as a result of poor-quality work. Notably, those with a lower socioeconomic position, younger people, those in lower paid jobs and non-White people are all more likely to experience poor quality work with attendant impacts on health and health inequalities.
Create fair employment and good work for all

24 HEALTH EQUITY IN ENGLAND: THE MARMOT REVIEW 10 YEARS ON
Zero hours contracts are contracts that do not guarantee a minimum number of paid hours: they are a highly insecure form of work – and this insecurity is often harmful to health, particularly for those on low pay and with low socioeconomic status. The number of people on zero hours contracts has risen significantly since 2010. In autumn 2018 there were nearly 900,000 people on zero hours contracts in the UK, compared with 168,000 in 2010. Most of the people on zero hours contracts are in lower skilled and manual occupations, and because of the impacts on health, this will have contributed to widening health inequalities.
LOW WAGES AND IN WORK POVERTY
While more people are in work now than in 2010, average weekly wages have not recovered to the levels of 2010: average weekly earnings were £502 in September 2019, only £5 higher than in 2008 (at 2015 prices). Data comparing OECD countries’ wage growth found that the UK experienced negative wage growth between 2007 and 2018 and was third lowest along with Italy and Portugal and after Greece and Mexico.
Increasingly, work is not a way out of poverty and low wages, low level of benefits and the cost of living, particularly the high cost of housing mean that many working people are in poverty. The number of people in work and living in poverty increased from just over three million in 2010/11 to 3.7 million in 2015/16, with 2.4 million in full-time employment shown in Figure 8. A majority of people below the poverty line live in households where at least one adult is working.
Figure 8. Number of workers in poverty by employment type, UK, 2017
Millions of workers
2009/10 2010/11 2011/12 2012/13 2013/14 2016-17
Full-time employeePart-time employeeFull-time self-employedPart-time self-employed
4.0m
3.5m
3.0m
2.5m
2.0m
1.5m
1.0m
0.5m
0m2014/15
Source: Joseph Rowntree Foundation, 2019 (9)
AUTOMATION
Since 2010 concerns about the possible impacts of automation have risen. Unemployment and job insecurity are likely to follow automation both of which are associated with harm to health and rising mortality. Jobs with higher rates of female employment, part-time and low skill jobs are at particular risk of automation. The South East of England and London are relatively less likely to be impacted by automation than other regions.
Automation may also be an opportunity. Eliminating boring, repetitive jobs can be beneficial but only if the alternative is interesting, fulfilling work: achieving such a shift in the labour market entails investments in training as part of an overall approach to a changed economy. Labour market policy should be a key component of future automation strategy.
Recommendations for creating fair employment and good work for all
• Invest in good quality active labour market policies and reduce conditionalities and sanctions in benefit entitlement, particularly for those with children.
• Reduce in-work poverty by increasing the National Living Wage, achieving a minimum income for healthy living for those in work.
• Increase the number of post-school apprenticeships and support in-work training throughout the life course.
• Reduce the high levels of poor quality work and precarious employment.

25HEALTH EQUITY IN ENGLAND: THE MARMOT REVIEW 10 YEARS ON
SUMMARY
• Wage growth has been low since 2010 and wage inequality persists.
• Rates of in-work poverty have increased.
• Incomes have risen slowly and inequalities persist.
• Wealth inequalities have increased.
• Regional inequalities in wealth have increased: London and the South of England have increased their share of national wealth compared with the North.
• The number of families with children who do not reach the minimum income standard has increased.
• Food insecurity has increased significantly.
• Social mobility in England has declined.
• Tax and benefit reforms have widened income and wealth inequalities
Since 2010 rates of wage and income growth have been low and wage inequalities increased slightly and income inequality has persisted; wealth inequalities have increased and regional inequalities in wealth have widened a great deal. While wage growth has been low, benefits have been cut even while costs of living, particularly housing, have increased. As a result, rates of poverty have increased for many – particularly for children and for those in work.
WAGE, INCOME AND WEALTH INEQUALITIES
Since 2010 inequalities in weekly earnings have increased slightly, as those in the top 10 percent of earnings have seen their wages increase the most while those in the 40 percent of lower earnings have seen their wages increase at a lower rate, and barely increasing at all for the lowest 10 percent. Earnings in London remain the highest by some margin followed by the South East, while the North East has the lowest weekly earnings.
The National Living Wage introduced in 2016 has helped raise wages for those on low wages which is positive. However, it is still too low to meet the Minimum Income Standard, which sets out what is sufficient income as defined by the public for an acceptable standard of living.
Average incomes have barely increased since 2010, this is mainly the result of low wage growth and low levels of benefits. Inequalities in income have persisted since 2009/10 and there is a particularly large difference between the level of the top of the income distribution and the rest.
Wealth includes savings and also all financial assets, such as property, shares, private pensions and valuable goods. In 2016–18 the top three wealth deciles held 76 percent of all wealth, while the bottom three wealth deciles held 2 percent. Inequalities in wealth in England are higher than wage and income inequalities. For the lowest thirty percent wealth has hardly increased over the period. In the decade 2010–20, as in the decades that preceded it, the wealthy have become wealthier as capital growth has risen much faster than faltering wage growth. Put simply, the wealthy have got wealthier – and therefore healthier.
The thrust of the 2010 Marmot Review and this report is that social disadvantage is not only a lack of money. Life is worse for people lower down the social hierarchy for each of the five domains covered in this report. Having control over one’s life is critical to an individual’s health and wellbeing. That said, position in the social hierarchy is, in part, defined by money and having resources to live a healthy life is central to reducing poverty in all its forms and to improving health.
Poverty is associated with poor long-term physical and mental health and low life expectancy. Living in poor quality housing, being exposed to poor quality environmental conditions, poor quality work and unemployment, not being able to afford nutritious food and sufficient heating for example all impact on health. Poverty is also stressful. Coping with day-to-day shortages, facing inconveniences and adversity and perceptions of loss of status all affect physical and mental health in negative ways.
Ensure a healthy standard of living for all

26 HEALTH EQUITY IN ENGLAND: THE MARMOT REVIEW 10 YEARS ON
Regional inequalities in wealth have also risen markedly over the decade as London and the South East increased their wealth at a much faster rate than other regions. The North East, the region with the lowest average household wealth, has barely increased its wealth since 2010.
The UK is slightly more unequal in terms of wealth distribution than many other wealthy countries, but wealth inequality increased faster in the UK than in any other country OECD country except the USA between 2010 and 2016.
POVERTY
Since 2010 levels of benefits have been reduced, wages have stagnated and costs of living increased particularly, in housing. As a result, rates of poverty have increased for many. In 2017/18, 14 million people in the UK, 22 percent of the population, lived on incomes below the poverty line after housing costs are taken into consideration. Poverty rates (after housing costs) have increased for pensioners since 2010/11, and for children, poverty rates increased from 27 percent in 2010/11 to 30 percent in 2017/18.
Work is no longer a way out of poverty for many described in Figure 9. Poverty for families in work after housing costs rose from 16 percent in 2010 to 18 percent in 2018. Low pay, the cost of living, particularly housing, and low level of benefits contribute to in-work poverty. Most people in poverty are now working.
Figure 9. Relative poverty rate (after housing costs), working age adults in working families, UK, 2010/11 to 2017/18
20
19
18
17
16
15
14
13
12
11
10
Percent
Years
2010-11 2017-182011-12 2012-13 2013-14 2014-15 2015-16 2016-17
Source: Based on IFS, 2019 (9)
Nearly half of those in poverty in the UK in 2018 – 6.9 million people – were from families in which someone had a disability. Some ethnic groups also face much higher rates of poverty than others, particularly those who are Black and Bangladeshi and Pakistani origin where rates of poverty after housing costs are as high as 50 percent. Persistent poverty refers to someone who has been in poverty in three of the past four years. People in persistent poverty are at particularly high risk of having poor physical or mental health. Rates have stayed roughly the same since 2010, at about 13 percent. Lone parents with children have the highest risk of being in persistent poverty
While poverty is harmful to health in many direct and indirect ways, not being able to pay rent, heat your home or eat a sufficient nutritious diet are perhaps the most obvious manifestations. In 2017, close to 11 per cent of households in England (2.5 million households) were classed as fuel-poor, while between eight and 10 percent of households in the UK were food insecure, rising from 28 percent to 46 percent of low-income adults between 2004 and 2016.

27HEALTH EQUITY IN ENGLAND: THE MARMOT REVIEW 10 YEARS ON
TAX AND BENEFIT SYSTEM
Since 2010 there have been widespread changes to the tax and benefit system, notably the introduction of Universal Credit. The implementation of Universal Credit has pushed many people further into poverty and debt, particularly through delays in being awarded credit. Overall the tax and benefit reforms in England between 2015 and 2017 were regressive. Analysis shows negative impacts of benefit reform for the poorest 50 percent in the UK with the poorest 20 percent experiencing the most negative impacts. Meanwhile, the benefit changes were positive for the top 40 percent, which, combined with tax reforms have been beneficial to the top 30 percent in particular.
Meanwhile the average effect of all forms of direct and indirect taxes on the bottom income decile is to take away 44 percent of gross income (which includes both earned income and direct cash benefits). The corresponding figure in the top decile is 34 percent. That is to say effective tax rates are higher in the bottom decile than in the top decile which means that the tax system is also regressive.
Tax revenues in the UK are below the OECD average. In 2018 the British Social Attitudes survey found 60 percent of the UK public were in favour of the Government increasing tax to spend more, an increase from 49 percent of the public who responded in this way in 2016 and 31 percent in 2010.
Recommendations for ensuring a healthy standard of living for all
• Ensure everyone has a minimum income for healthy living through increases to the National Living Wage and redesign of Universal Credit.
• Remove sanctions and reduce conditionalities in welfare payments.
• Put health equity and wellbeing at the heart of local, regional and national economic planning and strategy.
• Adopt inclusive growth and social value approaches nationally and locally to value health and wellbeing as well as, or more than, economic efficiency.
• Review the taxation and benefit system to ensure it achieves greater equity and ensure effective tax rates are not regressive.
SOCIAL MOBILITY
Social mobility in England is stuck. This is partly a result of stagnating wages, increases in poverty for some and increasing inequalities in wealth, as we have described. It is also a result of the profound and persistent socioeconomic inequalities in experiences in early years, education and the labour market. The OECD stated in 2018 that social mobility in the UK was “so frozen that it would take five generations for a poorer family in the UK to reach the average income”. It found just under one-fifth of the children of low-income families go on to become high earners. Social mobility is even less likely to occur in many Northern cities and coastal towns, due to higher rates of unemployment and poverty, low incomes, lower rates of home ownership, and lower levels of educational attainment in these places. Education, housing, income, taxation and social protection policies have undermined, not supported, social mobility.

28 HEALTH EQUITY IN ENGLAND: THE MARMOT REVIEW 10 YEARS ON
SUMMARY
• There are more areas of intense deprivation in the North, Midlands and in southern coastal towns than the rest of England.
• Government spending has decreased most in the most deprived places and cuts in services outside health and social care have hit more deprived communities hardest.
• The costs of housing have increased significantly, including social housing, impacting on all the other social determinants of health and pushing many people into poverty, homelessness and ill health.
• The number of non-decent houses has decreased, including in the private rental sector, but this sector still has high levels of cold, damp and poor conditions, including insecure tenures.
• Homelessness has increased significantly including more children in homeless families living in temporary accommodation.
• Health harm from climate change is increasing, and will likely affect more deprived communities most.
Empowering and sustaining communities was central to the 2010 Marmot Review, an overarching theme was to ‘create an enabling society that maximises individual and community potential.’ The Review described the importance of communities and places in shaping physical and mental health and wellbeing and described how inequalities among communities are related to inequalities in health. Since 2010 these community inequalities have, in many ways, widened.
COMMUNITIES AND PLACES FACING PARTICULAR HARDSHIP AND ADVERSITY
Since 2010, in many places levels of deprivation and exclusion have intensified and accumulated. Throughout England there are communities and places, that have been labelled as ‘left behind’ we call it ignored, where multiple forms of deprivation intersect and where deprivation has persisted for many years with little prospect of alleviation.
Over the last ten years, these deprived communities and areas have seen vital physical and community assets lost, resources and funding reduced, community and voluntary sector services diminished and public services cut, all of which may have damaged health and widened inequalities. Since 2009, net expenditure per person in local authorities in the 10 percent most deprived areas fell by 31 percent, compared to a 16 decrease in the least deprived areas. In the North East spending per person fell by 30 percent, compared to cuts of 15 percent in the South West. Neighbourhoods in the North of England, the Midlands, the North West, Teesside and the East Midlands make up the majority of neighbourhoods dealing with the largest cuts.
AIR QUALITY
Air quality and related health risks have emerged as a major equity issue since 2010. Pollution levels are, on average, worse in areas of highest deprivation compared with areas of lowest deprivation. In 2016 the Chief Medical Officer’s annual report was based on the risks of air pollution and described worse impacts for deprived communities and places, showing these places had ‘a higher exposure to air pollution and a greater burden of poor health increasing susceptibility to the impact of pollution’.
Create and develop healthy and sustainable places and communities

29HEALTH EQUITY IN ENGLAND: THE MARMOT REVIEW 10 YEARS ON
BUILT ENVIRONMENT AND TRANSPORT
Many measures of environmental quality highlight that conditions are worse in more deprived areas, and these measures show a gradient – the more deprived the area the worse the conditions, including quality of high streets. The unhealthiest high streets are likely to be located in more deprived areas; and have the highest number of fast food outlets, betting shops, more littering and fouling, noise and air pollution, unhealthy retail outlets, crime and fear of crime and road traffic accidents.
The government’s prioritisation of road and train travel over buses has widened inequalities in access to essential services, employment and social interactions. Current travel policies benefit those on higher incomes, as those on lower incomes tend to travel more on buses. Between 2010 and 2017 funding for bus travel reduced by 45 percent.
One quarter of the UK’s greenhouse gas emissions come from transport and road transport is the largest contributor to poor air quality. In 2016 the Government set the target to double cycling rates and increase the number of children (aged 5-10) walking to school by six percent. However, between 2010 and 2018 the percentage of children in England (aged 5-16 years) who walked to school has not changed, while the number who cycle to school increased by one percent. More positively active travel for adults has increased but inequalities have widened. There was a 5 percent increase in walking trips per year for those on the lowest incomes and 14 percent increase for those on the highest incomes between 2010 and 2018.
HOUSING
Poor quality housing, particularly damp and cold homes, directly harm physical and mental health and poor housing conditions continue to harm health in England and widen health inequalities. Unaffordable housing also damages health, 21 percent of adults in England said a housing issue had negatively impacted their mental health, even when they had no previous mental health issues, and housing affordability was most frequently stated as the reason. The stress levels resulting from falling into arrears with housing payments are comparable to unemployment.
Housing costs have significantly increased in England since 2010 and the impacts are clearly higher for lower income families, described in Figure 10. The cost of social renting in England increased by 40 percent from 2008 to 2016 and one-third of households in the private rental sector fall into poverty as a result of their housing costs. As housing costs have increased, there is less to spend on other essentials such as food, clothing and transport; this, and the stress of trying to pay housing costs will have significantly worsened health for low income families.
Figure 10. Proportion of families spending more than a 1/3 of income on housing costs by income decile, 1996/97 and 2016/17
40
35
30
25
20
15
10
5
02 3 94 5 6 7 8
1996/97 2016/17
101
Percent of families
Most deprived Income deciles Least deprived
Source: Judge L, 2018 (10) Note: Housing costs and incomes net of housing benefit

30 HEALTH EQUITY IN ENGLAND: THE MARMOT REVIEW 10 YEARS ON
The increasing costs of the private rental sector have not only led to increased arrears for renters, but also for record incomes for private landlords as a growing number of private renters receive Housing Benefit.
Housing conditions tend to be worst in the private rental sector, although there have been some improvements since 2010. Still in 2017/18 around 1.9 million private renters reported an issue with condensation, damp or mould in their home and many more keep silent about these condition as private landlords can evict tenants if they complain. In the West and East Midlands and Yorkshire and the Humber, more than one in five of homes fail to meet the decent homes standard.
Homelessness and rough sleeping rates have increased substantially since 2009-10. At the end of 2018, 83,700 households were homeless, including 124,490 children, a five percent increase on the end of 2017 and an increase of 74 percent since 2010. In 2016 the housing charity Shelter found one in three working families are a single paycheque away from homelessness. Rough sleeping has increased significantly since 2010, from approximately 1,700 to approximately 5,000 in 2017.
CLIMATE CHANGE
The 2010 Marmot Review labelled climate change as a fundamental threat to health and stated that mitigating climate change would also help mitigate health inequalities. The health risks arising from climate breakdown are now better understood. Climate change affects health and worsens inequalities; older people are at most risk of extremes of heat and cold; lower income groups are disproportionately impacted by extreme weather by virtue of living in poorer quality housing in vulnerable locations and conditions and tenants are more vulnerable than owner-occupiers
Recommendations for creating and sustaining healthy and sustainable places and communities.
• Invest in the development of economic, social and cultural resources in the most deprived communities
• 100 percent of new housing is carbon neutral by 2030, with an increased proportion being either affordable or in the social housing sector
• Aim for net zero carbon emissions by 2030 ensuring inequalities do not widen as a result
as they have less ability to modify their homes and prepare for and to recover from climate events. In the UK close to 2 million people live in homes in areas of significant river, surface water or coastal flooding and people living in properties the UK’s most deprived communities face higher increases in risk from flooding.
The UK has reduced its greenhouse gas emissions since 2010, and renewable energy now accounts for a higher proportion of energy generation. Measures to reduce greenhouse gas emissions must continue to be strengthened. Domestic emissions remain high – insulating housing has the twin benefits of reducing emissions and reducing cold and damp, improving health. However, programmes to insulate houses have been cut over the decade and active travel initiatives are not strong enough. In fact, budgets for cycling and walking have declined while road investment budgets increased

31HEALTH EQUITY IN ENGLAND: THE MARMOT REVIEW 10 YEARS ON
Conclusions
This ‘10 years on’ report shows that, in England, health is getting worse for people living in more deprived districts and regions, health inequalities are increasing and, for the population as a whole, health is declining. The data that this report brings together also show that for almost of all the recommendations made in the original Marmot Review, the country has been moving in the wrong direction. In particular, lives for people towards the bottom of the social hierarchy have been made more difficult. Some of these difficulties have been the direct result of government policies, some have resulted from failure to counter adverse trends such as increased economic inequalities or market failures.
The purpose of the report is to show what can be done, in a spirit of social justice, to take action on the social determinants of health to reduce these avoidable health inequalities. It is not enough for the Government simply to declare that austerity is over. Actions are needed in all six domains set out in the 2010 Review to improve the lives people are able to lead and hence achieve a greater degree of health equity and better health and wellbeing for all; we set out new recommendations in five of these areas in this report, to account for profound changes in health and the social determinants since 2010.
The aim of all policies should be to level up, for everyone to enjoy the good health and wellbeing of those at the top of the social hierarchy – hence our reiteration of proportionate universalism: universalist policies with effort proportionate to need. We extend this to include investment – over the last decade government allocations of funding have declined most in poorer areas and this must be reversed. Funding should be allocated in a proportionate way – those areas that have lost the most and are more deprived must receive renewed investment first - and at higher levels.
We repeat: we neither desire nor can envisage a society without social and economic inequalities. The public thinks that inequalities have gone too far, and evidence suggests that the rising levels of health inequalities in England are avoidable. We welcome action from local and regional governments to tackle social determinants of health. More action of the type we have described here will be necessary. It is not, though, a matter of action by either central government or local government: we need both and we need leadership. If we leave this for another 10 years, we risk losing a generation.
Our main recommendation is to the Prime Minister – to initiate an ambitious and world-leading health inequalities strategy and lead a Cabinet-level cross-departmental committee charged with its development and implementation. We suggest that the new strategy is highly visible to the public and that clear targets are set.

32 HEALTH EQUITY IN ENGLAND: THE MARMOT REVIEW 10 YEARS ON
References
1. Phillips D, Simpson P. Changes in councils’ adult social care and overall service spending in England, 2009–10 to 2017–18. IFS briefing note, London: 2018.
2. ONS. Expectation of life, principal projection, England, 2018-based. ONS; 2018. Available from https://www.ons.gov.uk/peoplepopulationandcommunity/birthsdeathsandmarriages/lifeexpectancies/datasets/expectationoflifeprincipalprojectionengland.
3. Bajekal M using ONS data. Number of deaths and populations in deprivation decile areas by sex and single year of age, England and Wales, registered years 2001 to 2017, 2019.
4. ONS. Health state life expectancies, UK: 2016 to 2018, December 2019. Available from: https://www.ons.gov.uk/peoplepopulationandcommunity/healthandsocialcare/healthandlifeexpectancies/bulletins/healthstatelifeexpectanciesuk/2016to2018.
5. PHE. Fingertips tool, 2019-20.
6. Department for work and pensions. Households below average income: 1994/95 to 2017/18. Available from: https://www.gov.uk/government/statistics/households-below-average-income-199495-to-201718.
7. Department for Education. GCSE results (‘Attainment 8’). Available from: https://www.ethnicity-facts-figures.service.gov.uk/education-skills-and-training/11-to-16-years-old/gcse-results-attainment-8-for-children-aged-14-to-16-key-stage-4/latest.
8. Joseph Rowntree Foundation. UK Poverty 2017. Available from: https://www.jrf.org.uk/report/uk-poverty-2017.
9. Bourquin P, Cribb J, Waters T, Xu X. Why has in-work poverty risen in Britain. Institute for Fiscal Studies and University College London, 2019.
10. Judge L, Bell T. Housing stress is up – and has shifted. Our debate on social housing needs to keep up. Resolution Foundation: London; 2018. Available from: https://www.resolutionfoundation.org/comment/housing-stress-is-rising-the-social-housing-sector-must-respond-to-this-challenge/

HEALTH EQUITY IN ENGLAND:THE MARMOT REVIEW 10 YEARS ON
www.instituteofhealthequity.org/the-marmot-review-10-years-on
Related Documents