Fordham University Department of Economics Discussion Paper Series Healthcare Expenditures of Living with a Disability: Total Expenditures, Out of Pocket Expenses and Burden, 1996-2004 Sophie Mitra Fordham University, Department of Economics Patricia A. Findley Rutgers University, School of Social Work Usha Sambamoorthi UMASS Medical School, Worcester, Department of Psychiatry, and Morehouse School of Medicine, Department of Community Health and Preventive Medicine Discussion Paper No: 2008-18 September 2008 (Updated: February 2009) Fordham University, Department of Economics 441 E Fordham Rd, Dealy Hall Bronx, NY 10458 (718) 817-4048

Welcome message from author
This document is posted to help you gain knowledge. Please leave a comment to let me know what you think about it! Share it to your friends and learn new things together.
Transcript
Fordham University Department of Economics Discussion Paper Series
Healthcare Expenditures of Living with a Disability: Total Expenditures, Out of Pocket
Expenses and Burden, 1996-2004
Sophie Mitra Fordham University, Department of Economics
Patricia A. Findley Rutgers University, School of Social Work
Usha Sambamoorthi UMASS Medical School, Worcester, Department of Psychiatry, and Morehouse School of Medicine, Department of Community Health
and Preventive Medicine
Discussion Paper No: 2008-18 September 2008
(Updated: February 2009)
Fordham University, Department of Economics 441 E Fordham Rd, Dealy Hall
Bronx, NY 10458 (718) 817-4048

1
Healthcare Expenditures of Living with a Disability:
Total Expenditures, Out of Pocket Expenses and Burden, 1996-2004
Sophie Mitra∗a,1 Patricia A. Findleyb
Usha Sambamoorthi c,d
a Department of Economics, Fordham University, New York, USA b School of Social Work, Rutgers University, NJ USA
c University of Massachusetts Medical School, Department of Psychiatry, Worcester, MA, USA d Department of Community Health and Preventive Medicine,
Morehouse School of Medicine, Atlanta, Georgia, USA
1Corresponding Author
∗ Corresponding author: Dr Sophie Mitra, Tel: +1 718 817 5337; Fax: +1 718 817 3518; Fordham University, 441 East Fordham Road, Bronx, NY 10458-9993. Email address: [email protected]. The opinions expressed here are those of the authors and do not represent the views of any of the affiliated organizations. The authors wish to acknowledge the UpJohn Institute for Employment Research for funding for part of Dr. Sophie Mitra’s time. Excellent research assistance was provided by Leanne Marcelino.

2
ABSTRACT
Objective: This paper estimates the healthcare expenditures associated with a disability and their
recent trends.
Design: Retrospective analysis of survey data
Participants: Data from multiple years (1996 through 2004) of the Medical Expenditure Panel
Survey (MEPS) for a nationally representative sample of civilian, non-institutionalized US
population.
Interventions: Not applicable
Main Outcome Measures: Healthcare expenditures consisted of: total healthcare expenditures,
total out-of-pocket spending (OOP), and burden (the ratio of OOP to family income). All the
analyses accounted for the complex survey design of the MEPS.
Results: Between 1996 and 2004, 6% to 9% of individuals in the working age group (21-61
years) were identified as having a disability. Persons with disabilities consistently had higher
total health expenditures, OOP and burden compared to their counterparts without disabilities.
In 2004, the average total expenditures were estimated at $10,508 for persons with disabilities
and at $2,256 for those without disabilities. In a multiple regression framework, persons with
disabilities were consistently found to have higher expenditures, OOP and burden between 1996
and 2004. Although expenditures, OOP and burden increased over time, after controlling for
demographic, socio-economic, and health status, these three healthcare costs were not found to
change disproportionately for individuals with disability.
Conclusions: Over the 1996-2004 period, persons with disabilities were consistently found to
have significantly higher health expenditures, OOP and burden compared to their counterparts
without disabilities, which may adversely affect their health and standard of living.

3
Key Words: Disability, Health Expenditures, Out of Pocket Expenditures, Burden.

4
INTRODUCTION
It is estimated that, in the United States, between 40 and 50 million people have a disability. 1
For working age individuals, recent estimates range between 20 and 23 million.2 During the
1990s, the disability prevalence rate among the working age population increased.3 At the same
time, among all adults younger than 65 years, healthcare costs have been rising and an increasing
proportion of family budgets have been for out-of-pocket (OOP) spending4, particularly if the
individuals have chronic health conditions, i.e. medical conditions that require ongoing
treatment.5 For those under 65 with chronic conditions, the highest OOP expense has been
reported to be physician office visits, and if they are uninsured, they are five times less likely to
see a medical provider than those with insurance in a given year.6 There have been studies of
trends in expenditures for specific chronic conditions.7 However, such studies do not cover the
expenditures associated with disability because disability is not a medical attribute of the
individual. Indeed, disability has increasingly been considered as taking place at the interface of
the individual and the physical and social environment. Having a disability does not require
having a medical chronic condition, and in reverse, a medical chronic condition does not
necessarily lead to a disability. Among persons with disabilities, several studies have
demonstrated that persons with disabilities face, compared to those without disability, higher
cost-of-living in general,8 and higher healthcare expenditures in particular.9 It has also been
noted that activity limitations alone increase the cost of care.10 The financial burden of OOP
spending as a proportion of total family income was 2.5 times greater for a family with a person
with disability compared to families without a person with a disability in 1987,11 even after
controlling for availability of healthcare insurance.

5
It is essential to understand how the increasing trend in healthcare expenditures, OOP,
and burden for the general population is affecting persons with disabilities for several reasons. It
has been shown that poor families with a member with a disability resort to healthcare
rationing.11 Recent trends in health expenditures for working age persons with disabilities may
also have implications for future healthcare spending as this population becomes older and
eligible for Medicare. 12 A major policy concern has been that the rising cost of healthcare has
contributed to the decline in the employment of persons with disabilities of the 1990s, but
evidence of an impact on health insurance is unclear. 13 Finally, several policy initiatives over
the 1990s and early 2000s were expected to affect persons with disabilities’ access to healthcare
services and insurance (e.g., Medicaid Buy-in programs for persons with disabilities).
Past research has shown that persons with disabilities overall have greater healthcare
expenditures than their counterparts without disabilities but estimates of the magnitude of extra
healthcare expenditures are outdated. For example, using 1997 Medical Expenditure Panel
Survey (MEPS) data, Yelin, Cisternas and Trupin 9 find that a person with a disability faces an
increment in medical care expenditures of $2,953 beyond what would be expected of similar
persons without disabilities. Persons with disabilities often, but not always, need substantial
healthcare services and support.14 For example, a person who loses a limb may experience a
high demand for healthcare in the short term, but not after the condition has stabilized.13 It is
also possible that persons with disabilities underutilize healthcare services due to their limited
access to healthcare providers and facilities, 15, 16 which may result in lower healthcare
expenditures.
However, for total health expenditures, we expect to find an increase for persons with
disabilities that is disproportionate compared to persons without disabilities due to several key

6
developments in federal policies, the 1990 American with Disabilities Act (ADA) and the 1999
Olmstead decision in particular. One may expect greater access to healthcare services for
persons with disabilities made possible by the ADA. Title II of the ADA protects qualified
individuals with disabilities from discrimination on the basis of disability in accessing services,
programs, or activities provided by state and local governments. Title III prohibits discrimination
against individuals with disabilities by places of public accommodation and private healthcare
providers are considered places of public accommodation. However, the ADA did not
specifically prohibit private insurance companies from discriminating on the basis of actuarial
risk. The Health Insurance Portability and Accountability Act (HIPAA) of 1996 did attempt to
extend coverage to individuals with pre-existing conditions, but this protection, together with
that of the Consolidated Omnibus Budget Reconciliation Act (COBRA) of 1986, is hardly
sufficient. 17, 18 In addition, the Supreme Court’s Olmstead decision of 1999 may have also put
some upward pressure on health expenditures for persons with disabilities. This decision
challenged states to provide community placements and develop more accessible services for
persons with disabilities, and continued a move toward deinstitutionalization started in the early
1980s. Section 2176 of the Omnibus Budget Reconciliation Act (OBRA) of 1981 (Public Law
97-35), added section 1915(c) to the Social Security Act for the Medicaid program to create
Home and Community-Based Services Waivers, states were allowed to waive or set aside some
of the Medicaid provisions to allow long-term care services to be delivered in community
settings outside of institutional settings for those with disabilities. Being in the community may
generate expenditures to the individual which were previously covered through an institution.
While total health expenditures are expected to have increased disproportionately more
for persons with disabilities, OOP and burden on the contrary may have increased
7
disproportionately less for persons with disabilities compared to their counterparts without
disabilities. Indeed, several policy initiatives developed at the federal and state level in the 1990s
and 2000s may have placed a downward pressure on OOP and burden among persons with
disabilities. There have been several initiatives to make public health insurance benefits more
widely available among persons with disabilities, and in particular to break the link between
public health insurance benefits (Medicaid and Medicare) and income support benefits, i.e.
Supplemental Security Income (SSI) and Social Security Disability Insurance (SSDI). Most
notably, Section 4733 of the Balanced Budget Act of 1997 and provisions of the Ticket to Work
and Work Incentives Improvement Act of 1999 (Ticket to Work Act thereafter) encouraged, but
did not require, states to implement Medicaid buy-in programs, under which workers with
disabilities that would qualify for SSI or SSDI but earn more than the allowable limits for regular
Medicaid, can purchase Medicaid benefits at a heavily subsidized premium. Thirty-two states
have implemented the Medicaid Buy in Program. Finally, OOP and burden may have been
influenced by general developments related to disability benefits for persons with disabilities.
Disability benefit programs such as SSDI and SSI have grown very rapidly through the 1990s
and early 2000s, 19 which may have had an effect on the personal income of persons with
disabilities and reduced OOP through access to Medicare and Medicaid respectively. Overall, the
expected increase in public health insurance coverage leads us to expect that OOP and burden for
persons with disabilities would have increased disproportionately less than for their counterparts
without disabilities.
Despite increased disability prevalence among working age individuals, very little is
known about healthcare expenditures, OOP and burden among persons with disabilities and their
recent trends. To the best of our knowledge, no study has so far assessed, based on recent data

8
the disparity and trends in healthcare expenditures, OOP, and burden across disability status. The
objective of this study is to compare healthcare expenditures, OOP, and burden for individuals
with and without disabilities aged between 21 and 61 years and their trends between 1996 and
2004 using nationally representative household data from the Medical Expenditure Panel Survey
(MEPS). This study takes the perspective of the individual living with the disability rather than
the perspective of insurers or society-at-large coping with the costs, as so frequently reported. 20
Our hypotheses are that, for persons with disabilities compared to persons without disabilities, (i)
expenditures, OOP and burden are consistently higher, (ii) total health expenditures have
disproportionately increased while (iii) OOP and burden have increased relatively less over the
1996-2004 period.
METHODS
Data Source
We used data from the household component of the MEPS. The MEPS, which began in 1996, is
a nationally representative household data set on healthcare use, expenditures, sources of
payment, and insurance coverage for the non-institutionalized civilian population. The MEPS
also collects detailed information on activity and functional limitations, which are used in our
paper to define disability. The MEPS has an overlapping panel design: for each panel, six rounds
of interviews are conducted over a period of two and a half years. We used data from selected
years only (1996, 1998, 2000, 2002 and 2004) to avoid repeated observations.
Participants
We restricted our study sample to individuals in the working age group (i.e. between 21
and 61 years). We used 61 years as the cut-off point instead of 64 to avoid including persons
who have transitioned to early retirement under the Social Security Administration Old Age

9
program. We also excluded part year observations (e.g., individuals who died during the calendar
year∗, individuals who could not be located). Thus, our final study sample consisted of 10,987
individuals in 1996, 11,407 in 1998, 12,082 in 2000, 18,854 in 2002 and 16,459 in 2004.
Disability definitions. Defining and measuring disability is challenging. Disability has been
defined through different conceptual models that lead to different measures.† For instance, in the
medical model, disability is caused by a disease, an injury or other health conditions and requires
medical care in the form of treatment and rehabilitation. Under this model, an individual with
any impairment is considered disabled, regardless of whether the person experiences limitations
in his or her life activities due to the impairment. An impairment is an anatomical or
physiological loss (deaf, blind) caused by a pathology. On the other hand, in the social model,
disability is understood as a social construct; “disability is not the attribute of an individual,
instead it is created by the social environment and requires social change.”21 A third model of
interest is the International Classification of Functioning, Disability and Health (ICF) developed
by the World Health Organization. ICF is conceptually an integration of the medical and the
social models.22 In the ICF, disability is an umbrella term, which covers impairments, functional
limitations (e.g. limitation in walking) and participation restrictions (e.g. restrictions in
employment). In addition to the conceptual challenge of defining disability, several researchers
have empirically demonstrated the importance of using multiple disability measures. 23Therefore,
we use two measures of disability that can be understood as part of the ICF model. Our first
measure of disability is based on major activity limitations, which is typically used in disability
research for the working age population‡. For each panel, in rounds three and five, individuals
were queried as to whether they had any limitation in work, housework or school. Persons who
answered positively in either round were recorded as disabled. It is important to note that this

10
activity limitation measure may lead to an overestimate of the burden since persons with work
limitations are likely to have lower earnings compared to persons without work limitations. This
might affect our estimates of burdens for given years, but is not expected to affect the trend
analysis. This limitation makes it important to use other measures of disability. Our second
measure of disability was derived using functional limitations. In two rounds of the MEPS,
respondents were queried if they had a walking limitation or a cognitive limitation (individuals
are asked if they experienced confusion or memory loss, had problems making decisions, or
required supervision for their own safety). In addition, in one round of the survey, functional
limitations questions related to seeing and hearing were asked. For each of the functional
limitation questions described above, the person can only answer “yes” or “no.” In our second
measure of disability, a person who reported at least one functional limitation in one round was
considered as having a disability.
Dependent Variables
Annual Total Healthcare Expenditure. Within the MEPS, healthcare services that were paid
for by third party payors and/or individuals themselves are defined as “health expenditures” and
reported for each year. We used individual’s annual total expenditures that were summed across
inpatient, emergency room, outpatient (e.g., clinic and office-based visits), pharmacy, and other
(e.g., home health services, vision care services, dental care, ambulance services, and medical
equipment). All expenditures were adjusted for inflation and converted to constant 2004 dollars
with the use of the consumer price index for medical care services.
Out-of-pocket Spending on Healthcare. In the MEPS, total expenditures were also categorized
by 12 major sources of payment§, including out of pocket expenditures paid by the individual or
the family. Our measure of OOP expenditures did not include expenditures for healthcare

11
insurance premiums because data on premiums paid is not available in the Public Use files of the
MEPS.
Out-of-Pocket Spending Burden. We measured the burden of out-of-pocket spending as the
percent of family income spent out-of-pocket because the ability to pay for healthcare costs not
covered by third party payers is an important determinant of the use of healthcare services.
Statistical Methods
Differences in levels and trends in total health expenditures, OOP, and OOP burden across
disability status were examined using linear regression models. Due to the highly skewed nature
of the data, we transformed total health expenditures, OOP expenditures and burden into
logarithmic terms using ln(outcome+1). Many studies use generalized linear models (GLM) with
log link to examine the relationship between expenditures and other variables.24 We compared
the deviance and kurtosis to assess the fitness of the GLM log-normal model as an alternative to
the OLS log-normal model. We found in all years, the total healthcare expenditures were right-
skewed and had kurtosis value greater than 3, which suggested that the OLS log-normal model is
preferable to the GLM model. 25 All analyses controlled for the complex sampling design||.
The linear model described above does not distinguish between group composition
changes and differences in regression coefficients across disability status. To understand the
factors that contribute to the difference in health expenditures between persons with and without
disabilities, we follow the Oaxaca decomposition method (e.g., Oaxaca and Ransom26). Oaxaca
decomposes the gap in the mean of outcome between two groups: it allows for the possibility
that the gap in outcome (log health expenditures, log of OOPS or burden) is caused in part by
differences in the effects of determinants (regression coefficients). For example, the health
expenditures of persons with disabilities may be less responsive to changes in insurance

12
coverage. The Oaxaca decomposition starts with a multiple regression analysis of the outcome
variable as follows:
jijijjji XE ,,,ln εβα ++= (j=D or ND) (1)
where ln is the log of health expenditures of individual i, D and ND denote persons with and
without disability respectively, a set of characteristics, which include demographic,
socioeconomic, health variables and a time variable. are the coefficients on those
characteristic variables. The difference in mean health expenditures between persons with and
without disabilities can be decomposed as:
jiE ,
jiX ,
ji,β
DDNDDND XXEE β̂)(lnln −=− )ˆˆ( DNDDX ββ −+ (2)
On the right-hand side of equation (2), the first term is the difference in health
expenditures which is attributable to differences in characteristics, while the second term
represents the part of the expenditure difference which is unexplained. The second term may
result from differences in unobservables and in returns to characteristics between the two groups.
RESULTS
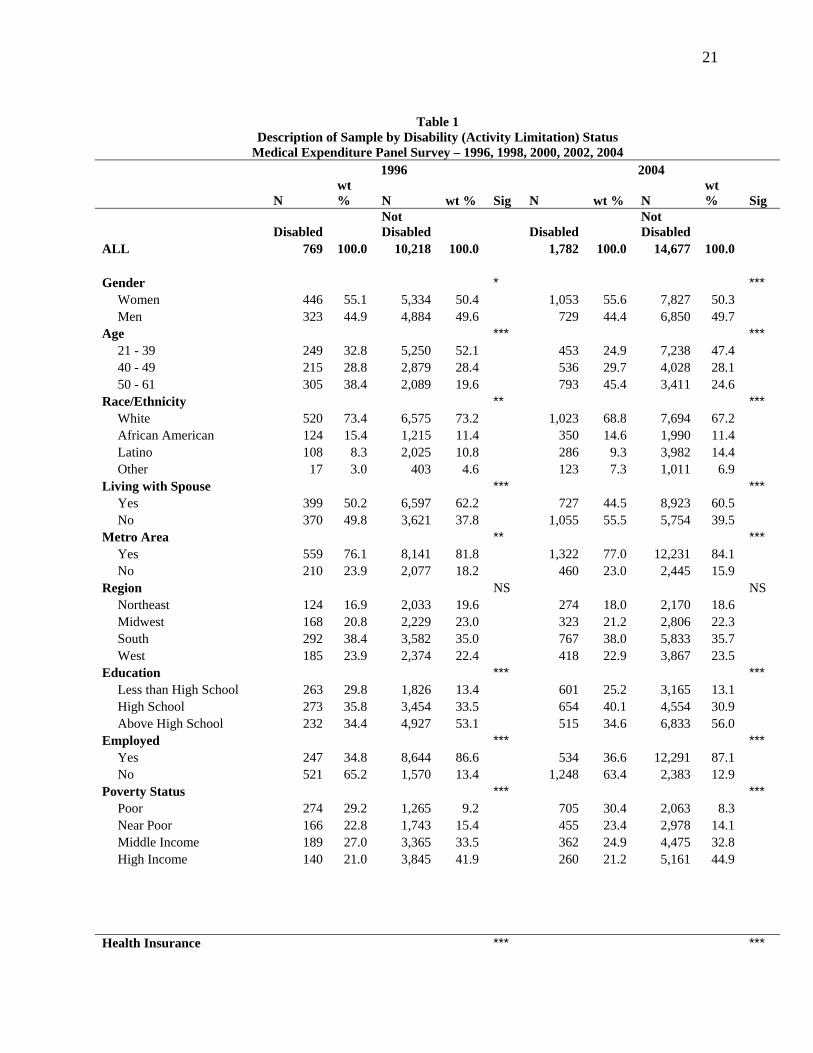
Disability prevalence as measured by the percentage of working age persons with a major
activity limitation has increased from 6.7% in 1996 to 9.4% in 2004 ( .01 < p < .05). Persons
with disabilities are significantly more likely to be older, less educated, less likely to be
employed, to have public insurance, and more likely to be poor than the nondisabled (Table 1).
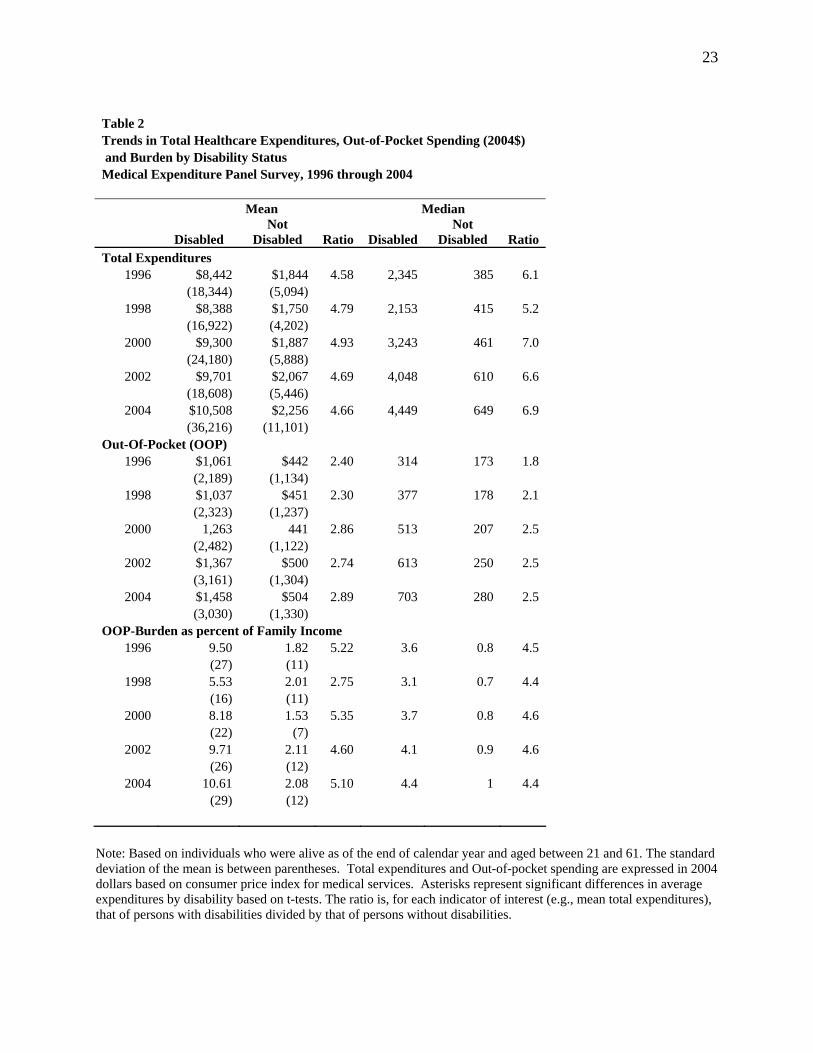
Table 2 displays the levels and changes over time in all three measures of healthcare
expenditures between 1996 and 2004 by disability status. In 2004, median total health
expenditures were estimated at $649 for those without disabilities, and $4,449 for persons with
13
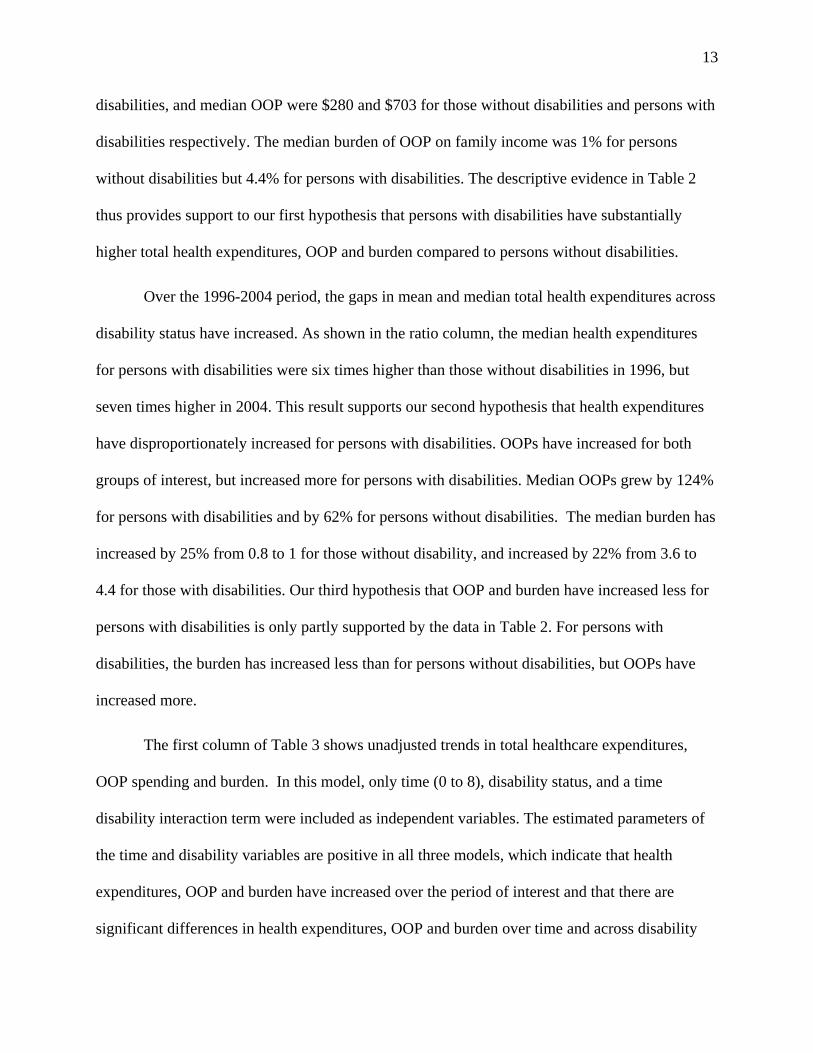
disabilities, and median OOP were $280 and $703 for those without disabilities and persons with
disabilities respectively. The median burden of OOP on family income was 1% for persons
without disabilities but 4.4% for persons with disabilities. The descriptive evidence in Table 2
thus provides support to our first hypothesis that persons with disabilities have substantially
higher total health expenditures, OOP and burden compared to persons without disabilities.
Over the 1996-2004 period, the gaps in mean and median total health expenditures across
disability status have increased. As shown in the ratio column, the median health expenditures
for persons with disabilities were six times higher than those without disabilities in 1996, but
seven times higher in 2004. This result supports our second hypothesis that health expenditures
have disproportionately increased for persons with disabilities. OOPs have increased for both
groups of interest, but increased more for persons with disabilities. Median OOPs grew by 124%
for persons with disabilities and by 62% for persons without disabilities. The median burden has
increased by 25% from 0.8 to 1 for those without disability, and increased by 22% from 3.6 to
4.4 for those with disabilities. Our third hypothesis that OOP and burden have increased less for
persons with disabilities is only partly supported by the data in Table 2. For persons with
disabilities, the burden has increased less than for persons without disabilities, but OOPs have
increased more.
The first column of Table 3 shows unadjusted trends in total healthcare expenditures,
OOP spending and burden. In this model, only time (0 to 8), disability status, and a time
disability interaction term were included as independent variables. The estimated parameters of
the time and disability variables are positive in all three models, which indicate that health
expenditures, OOP and burden have increased over the period of interest and that there are
significant differences in health expenditures, OOP and burden over time and across disability
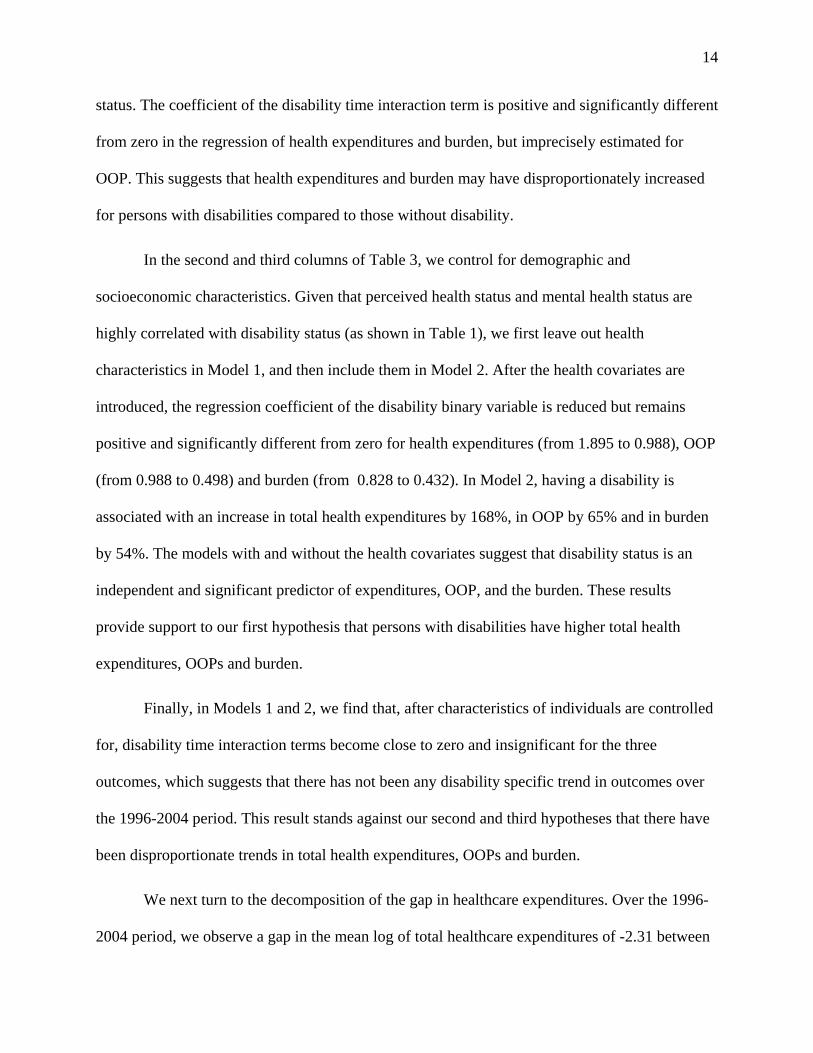
14
status. The coefficient of the disability time interaction term is positive and significantly different
from zero in the regression of health expenditures and burden, but imprecisely estimated for
OOP. This suggests that health expenditures and burden may have disproportionately increased
for persons with disabilities compared to those without disability.
In the second and third columns of Table 3, we control for demographic and
socioeconomic characteristics. Given that perceived health status and mental health status are
highly correlated with disability status (as shown in Table 1), we first leave out health
characteristics in Model 1, and then include them in Model 2. After the health covariates are
introduced, the regression coefficient of the disability binary variable is reduced but remains
positive and significantly different from zero for health expenditures (from 1.895 to 0.988), OOP
(from 0.988 to 0.498) and burden (from 0.828 to 0.432). In Model 2, having a disability is
associated with an increase in total health expenditures by 168%, in OOP by 65% and in burden
by 54%. The models with and without the health covariates suggest that disability status is an
independent and significant predictor of expenditures, OOP, and the burden. These results
provide support to our first hypothesis that persons with disabilities have higher total health
expenditures, OOPs and burden.
Finally, in Models 1 and 2, we find that, after characteristics of individuals are controlled
for, disability time interaction terms become close to zero and insignificant for the three
outcomes, which suggests that there has not been any disability specific trend in outcomes over
the 1996-2004 period. This result stands against our second and third hypotheses that there have
been disproportionate trends in total health expenditures, OOPs and burden.
We next turn to the decomposition of the gap in healthcare expenditures. Over the 1996-
2004 period, we observe a gap in the mean log of total healthcare expenditures of -2.31 between
15
persons with and without disability (7.69 versus 5.38). After adjusting for characteristics, the
estimated gap is -1.88 (7.28 versus 5.40), or 35 percentage points. This negative difference
reflects the fact that individuals with disability have greater expenditures than those without
disability. Of this gap, we find that -0.913 (or 48.4% of the gap) is explained by differences in
characteristics between the two groups. The negative sign of the explained portion suggests that
if individuals with disability had the characteristics of individuals without disability (e.g., in
terms of age, health status), the total expenditures of individuals with disability would be lower.
When we examine in Table 4 the total explained difference by domains such as demographics,
socio-economic status, access to care and health status, we find that 40.3% of the gap is due to
differences in health. Time contributed only 0.2% of the gap, so there are no significant trends
associated with having a disability. This result is consistent with the result reached earlier in the
regression analysis (Table 3) where the interaction term between time and disability status is not
statistically different from zero. The same result was reached with the decompositions in the
gaps in OOP and burden across disability status and is available from the authors.
Alternative Specifications:
We specified several alternative models to ensure the robustness of our findings with regard to
disability and healthcare costs. These are summarized below.
Second Definition of Disability: We repeated the analysis above using the second disability
definition based on functional limitations. Disability prevalence based on functional limitations
is higher compared to that based on activity limitation but shows a similar increasing trend over
the 1996-2004 period, from 17.2% to 19.4% (p < .01). Findings from the analysis using the

16
second definition of disability did not substantially differ from those with our primary
definition¶.
Two-part model: We found that nearly 20% of adults in the age group 21 – 61 had zero total
healthcare expenditures. Therefore, we also estimated a two-part model for total expenditures. In
the first part, the probability of nonzero health expenditures is estimated, while in the second
part, the amount of healthcare expenditures is estimated for all individuals with positive
expenditures. This approach has been used in many studies (e.g., Steinman, Telser, & Zweifel
200727) and has been found to be superior to those that simultaneously estimate use and
expenditures through Heckman type selection models.28
In the first part, findings from the logistic regression to predict the likelihood among
working age adults to have positive total healthcare expenditures revealed that those persons
with disabilities were nearly three times more likely than those without disability to incur
healthcare expenditures during the study period. The adjusted odds ratio was 2.75 with 95%
confidence interval [2.00, 3.77]. In the second part of the model, among working age adults with
positive healthcare expenditures, persons with disabilities had greater expenditures. The OLS
parameter estimate for disability status was 0.73 (p = 0.000). Again, after controlling for
demographic and socioeconomic characteristics, the interaction term between disability and time
did not reveal any significant difference in the trend of total expenditures across disability
status**.
DISCUSSION
Across all years, persons with disabilities had greater total health expenditures, OOP and
burden compared to adults without disability, suggesting there are additional healthcare costs
associated with disability. Higher OOP associated with disability, has implications for the

17
measurement and estimation of the prevalence of poverty among persons with disabilities. As
shown in Fujiura, Yamaki and Czechowicz,29 the percentage of households living below the
poverty line is significantly higher when the household has a person with a disability (28%)
compared to a household without a person with a disability (8.3%). These estimates of poverty
prevalence among households with and without a person with a disability were estimated
applying the standard poverty threshold, assuming that the minimum standard of resources
encapsulated in the poverty threshold is sufficient to meet the needs of persons with disabilities.
The estimate of poverty among households with members with a disability would be even higher
if the poverty line was adjusted to reflect the extra health costs of living with a disability. In fact,
She and Livermore found that the conventional income-based measures of poverty do not
adequately measure poverty among those with disabilities who require additional resources just
to meet basic material needs, particularly medical needs and food security.30
Although further research is needed to estimate the extent to which OOP leads to poverty
among persons with disabilities and assess the adequacy of disability benefits such as SSDI, SSI
and of mainstream benefits such as TANF (Temporary Assistance for Needy Families), one
could speculate that the benefit amounts should be higher for persons with disabilities to reach a
standard of living similar to persons without disabilities. In addition, researchers and policy
makers need to assess whether the Health Savings Accounts created in 2003 to enable
individuals to pay for current health expenses and save for future expenses on a tax-free basis
have helped persons with disabilities cover their extra health care costs. Another policy that
might alleviate the burden of extra-costs of living with disability is to provide allowances to
persons with disabilities as part of standalone programs that compensate for disability related
expenditures. Such programs are available in other developed countries. For example, in

18
Sweden, special allowances are provided for a wide range of disability related costs, including
durable medical equipment and attendant care. 31 In Great Britain, the so-called “disability living
allowance” compensates for the extra costs incurred due to the effects of a disability. 32 The
allowance has two components, a care component and a mobility component and is provided on
a temporary or a permanent basis, irrespective of the work status of the person.
Our hypotheses regarding disability specific trends in expenditures, OOP and burden
were not confirmed by the analysis. Between 1996 and 2004, we found significant increases in
total healthcare expenditures, OOP and burden for all working age individuals. However, there
was not any evidence of a disproportionate increase in total expenditures among persons with
disabilities over the study period. This finding suggests that there might not have been an
improvement in access to healthcare services, as expected following the ADA of 1990 and the
Olmstead decision of 1999, which would have resulted in higher total health expenditures. Of
course, this paper does not provide any direct evidence on the effects of the ADA and the
Olmstead decision, but certainly points toward the need for more research in this area.
In addition, we could not find evidence of a smaller increase in OOP and burden for
persons with disabilities, which may point toward the inability of recent policy attempts to
facilitate persons with disabilities’ access to health insurance. Programs such as the Medicaid
Buy In programs do not appear to have curbed the increase in OOP for persons with disabilities
relative to persons without disabilities. Again, more research is needed to assess the specific
impact of such policy initiatives on OOP and generally on access to healthcare among persons
with disabilities.
This study has several limitations. This study does not cover the institutionalized
population with disabilities, and is therefore not representative of the entire working age
19
population with disabilities. This study is focused on health related expenditures and it therefore
does not capture other potential additional expenditures associated with disability such as
transportation which has been shown to be significant based on data for other countries.33 The
MEPS dataset did not capture the complete expenditure for personal attendant care, care that has
both a formal and an informal component, and can represent a significant portion of community-
based expenditures for persons with disabilities.34, 35 The primary level of analysis for this paper
is the individual. Further research on expenditures across disability status is required at the
household level and at the insurer level, whether public or private. Furthermore, our study did
not include insurance premiums, which changed over the study period in Medicare and in private
health insurance plans, and might have affected persons with and without disabilities
differentially.
CONCLUSIONS
Despite these limitations, this paper fills an important knowledge gap. It uses a nationally
representative dataset of the non-institutionalized population to analyze levels and recent trends
in healthcare expenditures, OOP, and OOP burden across disability status. The paper finds that
substantial direct healthcare expenditures, OOP and burden are associated with disability.
Although expenditures, OOP and burden increased over time, after controlling for demographic,
socio-economic, and health status, these three healthcare costs were not found to change
disproportionately for individuals with disability. Our findings suggest that insurance coverage
expansions as they have been put in place over the last decade or so may alone not be enough to
reduce OOP and burden among persons with disabilities. Further research is needed on
expenditures, OOP and burden associated with a disability at the household level and on the
20
effectiveness of specific policy initiatives in reducing OOP and burden on persons with
disabilities.
NOTES
∗ By removing persons who die during the year, we avoid the challenge of comparing part year expenditures to full year expenditures and we reduce the skew in the data. However, health expenditures in the last year of life are known to be high, so removing persons who died during the year is likely to lead to an underestimate of actual expenditures and might bias our estimates if mortality occurs differentially across disability status. † A detailed coverage of these models is available in Altman (2001) and Mitra (2006). ‡ We could not use definitions of disability based on limitations in Activities of Daily Living (ADL) and in self care tasks (Instrumental Activities of Daily Living) due to small sample sizes. Such definitions are usually used for the elderly. § These sources were: 1) Out of pocket by user or family; 2) Medicare; 3) Medicaid; 4. Private Insurance; 5) Veterans Administration, excluding CHAMPVA (VA); 6) Tricare; 7)Other Federal Sources--includes Indian Health Service, Military Treatment Facilities, and other care provided by the Federal government; 8. Other State and Local Source--includes community and neighborhood clinics, State and local health departments, and State programs other than Medicaid; 9) Worker’s Compensation; 10) Other Unclassified Sources--includes sources such as automobile, homeowner’s, and 11) Other Private - any type of private insurance payments reported for persons. || The MEPS has a complex sample design with stratification, clustering, multiple stages of selection, and disproportionate sampling. 36, 37 This complex survey design requires special adjustments with regard to variance estimation and analysis for results to be nationally representative. Appropriate commands in the SAS software were used to have such an adjustment done in the analysis. ¶ Results are available from the authors. ** Results of the two-part model are available from the authors.
21
Table 1
Description of Sample by Disability (Activity Limitation) Status Medical Expenditure Panel Survey – 1996, 1998, 2000, 2002, 2004
1996 2004
N wt % N wt % Sig N wt % N
wt % Sig
Disabled Not Disabled Disabled
Not Disabled
ALL 769 100.0 10,218 100.0 1,782 100.0 14,677 100.0 Gender * *** Women 446 55.1 5,334 50.4 1,053 55.6 7,827 50.3 Men 323 44.9 4,884 49.6 729 44.4 6,850 49.7 Age *** *** 21 - 39 249 32.8 5,250 52.1 453 24.9 7,238 47.4 40 - 49 215 28.8 2,879 28.4 536 29.7 4,028 28.1 50 - 61 305 38.4 2,089 19.6 793 45.4 3,411 24.6 Race/Ethnicity ** *** White 520 73.4 6,575 73.2 1,023 68.8 7,694 67.2 African American 124 15.4 1,215 11.4 350 14.6 1,990 11.4 Latino 108 8.3 2,025 10.8 286 9.3 3,982 14.4 Other 17 3.0 403 4.6 123 7.3 1,011 6.9 Living with Spouse *** *** Yes 399 50.2 6,597 62.2 727 44.5 8,923 60.5 No 370 49.8 3,621 37.8 1,055 55.5 5,754 39.5 Metro Area ** *** Yes 559 76.1 8,141 81.8 1,322 77.0 12,231 84.1 No 210 23.9 2,077 18.2 460 23.0 2,445 15.9 Region NS NS Northeast 124 16.9 2,033 19.6 274 18.0 2,170 18.6 Midwest 168 20.8 2,229 23.0 323 21.2 2,806 22.3 South 292 38.4 3,582 35.0 767 38.0 5,833 35.7 West 185 23.9 2,374 22.4 418 22.9 3,867 23.5 Education *** *** Less than High School 263 29.8 1,826 13.4 601 25.2 3,165 13.1 High School 273 35.8 3,454 33.5 654 40.1 4,554 30.9 Above High School 232 34.4 4,927 53.1 515 34.6 6,833 56.0 Employed *** *** Yes 247 34.8 8,644 86.6 534 36.6 12,291 87.1 No 521 65.2 1,570 13.4 1,248 63.4 2,383 12.9 Poverty Status *** *** Poor 274 29.2 1,265 9.2 705 30.4 2,063 8.3 Near Poor 166 22.8 1,743 15.4 455 23.4 2,978 14.1 Middle Income 189 27.0 3,365 33.5 362 24.9 4,475 32.8 High Income 140 21.0 3,845 41.9 260 21.2 5,161 44.9 Health Insurance *** ***

22
Table 1 Description of Sample by Disability (Activity Limitation) Status
Medical Expenditure Panel Survey – 1996, 1998, 2000, 2002, 2004 1996 2004
N wt % N wt % Sig N wt % N
wt % Sig
Disabled Not Disabled Disabled
Not Disabled
Private 343 48.8 7,775 79.8 646 47.3 10,049 78.2 Public 327 38.3 684 5.1 874 38.4 1,259 5.2 Uninsured 99 12.9 1,759 15.1 262 14.3 3,369 16.5 Usual Source of Care *** *** Yes 676 88.4 7,580 75.9 1,524 86.1 10,053 72.5 No USC 92 11.6 2,586 24.1 245 13.9 4,451 27.5 Perceived Health *** *** Excellent/Very Good 76 10.9 5,551 57.2 79 5.3 6,104 47.0 Good 158 22.9 3,309 31.4 311 19.4 6,080 39.1 Fair/Poor 535 66.2 1,358 11.4 1,392 75.2 2,492 13.9 Chronic Conditions *** *** None 301 42.5 7,617 75.0 613 35.8 10,601 71.0 One 244 29.4 2,006 19.3 476 27.4 2,929 20.9 Two 131 17.0 475 4.6 359 19.3 878 6.1 Three 60 7.3 99 0.9 214 11.3 217 1.5 Four or more 33 3.9 21 0.2 120 6.2 52 0.4 Mental Health *** *** Excellent/Very Good 191 26.4 6,583 66.6 219 14.5 7,608 55.8 Good 276 35.4 3,015 27.8 561 33.2 5,768 36.2 Fair/Poor 302 38.2 620 5.6 1,002 52.3 1,300 7.9 Any Mental Illness *** *** Yes 265 34.3 1,093 10.9 851 48.2 1,948 14.3 No 504 65.7 9,125 89.1 931 51.8 12,729 85.7
Notes: i) Based on individuals aged between 21 and 61. Asterisks represent significant differences in sample composition by disability status based on chi-square statistic. ii) Perceived health and mental health questions are inquired in each round of MEPS. Individuals were categorized as having fair-poor health if they reported being in fair/poor health in any of the three rounds.
*** p < .001; ** .001 < p < .01; * .01 < p < .05 ; NS stands for not statistically significant.
23
Table 2 Trends in Total Healthcare Expenditures, Out-of-Pocket Spending (2004$) and Burden by Disability Status Medical Expenditure Panel Survey, 1996 through 2004 Mean Median
Disabled Not
Disabled Ratio Disabled Not
Disabled Ratio Total Expenditures
1996 $8,442 $1,844 4.58 2,345 385 6.1 (18,344) (5,094)
1998 $8,388 $1,750 4.79 2,153 415 5.2 (16,922) (4,202)
2000 $9,300 $1,887 4.93 3,243 461 7.0 (24,180) (5,888)
2002 $9,701 $2,067 4.69 4,048 610 6.6 (18,608) (5,446)
2004 $10,508 $2,256 4.66 4,449 649 6.9 (36,216) (11,101) Out-Of-Pocket (OOP)
1996 $1,061 $442 2.40 314 173 1.8 (2,189) (1,134)
1998 $1,037 $451 2.30 377 178 2.1 (2,323) (1,237)
2000 1,263 441 2.86 513 207 2.5 (2,482) (1,122)
2002 $1,367 $500 2.74 613 250 2.5 (3,161) (1,304)
2004 $1,458 $504 2.89 703 280 2.5 (3,030) (1,330) OOP-Burden as percent of Family Income
1996 9.50 1.82 5.22 3.6 0.8 4.5 (27) (11)
1998 5.53 2.01 2.75 3.1 0.7 4.4 (16) (11)
2000 8.18 1.53 5.35 3.7 0.8 4.6 (22) (7)
2002 9.71 2.11 4.60 4.1 0.9 4.6 (26) (12)
2004 10.61 2.08 5.10 4.4 1 4.4 (29) (12)
Note: Based on individuals who were alive as of the end of calendar year and aged between 21 and 61. The standard deviation of the mean is between parentheses. Total expenditures and Out-of-pocket spending are expressed in 2004 dollars based on consumer price index for medical services. Asterisks represent significant differences in average expenditures by disability based on t-tests. The ratio is, for each indicator of interest (e.g., mean total expenditures), that of persons with disabilities divided by that of persons without disabilities.

24
Table 3Unadjusted and Adjusted Trends in Total and Out-of-Pocket Expenditures and Burden By disability StatusMedical Expenditure Panel Survey, 1996, 1998, 2000, 2002, 2004
Unadjusted Model 1 Model 2Beta SE Sig Beta SE Sig Beta SE Sig
Total ExpendituresIntercept 5.467 0.030 *** *** ***
* *** **** *** *****
*** *** ****** *** **** *** ***
*** *** ****** *** ****** *** *****
1.888 0.077 0.660 0.077Year 0.014 0.006 0.026 0.004 0.010 0.004Disabled 2.164 0.072 1.895 0.069 0.988 0.068Disability * Year 0.034 0.013 0.014 0.012 -0.014 0.012
Out-of-Pocket ExpendituresIntercept 5.138 0.021 4.451 0.063 3.667 0.064Year 0.022 0.004 0.017 0.004 0.007 0.003Disabled 0.673 0.063 0.988 0.057 0.498 0.058Disability * Year 0.020 0.012 0.015 0.011 -0.002 0.011
OOP Burden Family IncomeIntercept -5.548 0.020 -3.310 0.076 -3.936 0.077Year 0.030 0.004 0.033 0.003 0.024 0.003Disabled 1.417 0.075 0.828 0.066 0.432 0.065Disability * Year 0.038 0.014 0.014 0.012 0.000 0.012
Note: Based on individuals who were aged between 21 and 61. Adjusted trend is based on ordinary least squares regression on logged expenditures for total and out-of-pocket spending. Model 1 adjusted for gender, race/ethnicity, age, marital status, region of residence, education, employment, and poverty status. Model 2 additionally included controls for physical illness, mental illness, perceived physical and mental health status. *** p < .001; ** .001 < p < .01; * .01 < p < .05; + * .05 < p < .1

25
Table 4: Decomposition of Total Healthcare Expenditures by Disability Status,Medical Expenditure Panel Survey, 1996, 1998,2000,2002, 2004
Total Gap ExplainedGap %
Total -1.886 -0.913 48.43%Variables:Year -0.038 -0.003 0.15%
Demographics 0.115 -0.070 3.69%
Socioeconomic 0.557 0.174 -9.25%
Access to care 0.006 -0.256 13.58%
Health status 0.188 -0.759 40.26%
Note: Based on individuals aged between 21 and 61. Decomposition is based on parameter estimates derived from 3 regressions (non-disabled, disabled, pooled regression without controlling for disability status). The model adjusted for gender, race/ethnicity, age, marital status, region of residence, education, employment, poverty status, physical illness, mental illness, perceived physical, and perceived mental health status.

26
References
1. Field M, Jette AM, Committee on Disability in America, eds. The Future of Disability in
America. Washington, D.C.: Institute of Medicine of the National Academies; 2007.
2. Rehabilitation Research and Training Center on Disability Demographics and Statistics. 2006
disability status report. Ithaca, NY: Cornell University; 2007.
3. Bhattacharya J, Choudhry K, Lakdawalla D. Chronic disease and severe disability among
working-age populations. Med Care. 2008;46:92-100.
4. Banthin JS, Bernard DM. Changes in financial burdens for health care: National estimates for
the population younger than 65 years, 1996 to 2003. JAMA. 2006;296:2712-2719.
5. Waters HR, Anderson GF, Mays J. Measuring financial protection in health in the united
states. Health Policy. 2004;69:339-349.
6. Hwang W, Weller W, Ireys H, Anderson G. Out-of-pocket medical spending for care of
chronic conditions. Health Affairs. 2001;20:267-278.
7. Yelin E, Murphy L, Cisternas MG, Foreman AJ, Pasta DJ, Helmick CG. Medical care
expenditures and earnings losses among persons with arthritis and other rheumatic conditions in
2003, and comparisons with 1997. Arthritis & Rheumatism. 2007;56:1397-1407.
8. Zaidi A, Burchardt T. Comparing incomes when needs differ: Equivalization for the extra
costs of disability in the U.K. Rev Income Wealth. 2005;51:89-114.
9. Yelin E, Cisternas M, Trupin L. The economic impact of disability in the united states, 1997;
total and incremental estimates. Journal of Disability Policy Studies. 2006;17:137-147.
27
10. Chan L, Beaver S, Maclehose RF, Jha A, Maciejewski M, Doctor JN. Disability and health
care costs in the medicare population. Archives of Physical Medicine & Rehabilitation.
2002;83:1196-1201.
11. Altman BM, Cooper PF, Cunningham PJ. The case of disability in the family: Impact on
health care utilization and expenditures for nondisabled members. Milbank Q. 1999;77:39-75.
12. Bhattacharya J, Cutler DM, Goldman DP, et al. Disability forecasts and future medicare
costs. Forum for Health Economics & Policy: Frontiers in Health Policy Research. ;7:1052.
13. Hill SC, Livermore GA, Houtenville AJ. Rising health care expenditures and the
employment of people with high-cost chronic conditions. In: Stapleton DC, Burkhauser RV, eds.
The Decline in Employment of People with Disabilities: A Policy Puzzle. Kalamazoo, MI:
UpJohn Institute for Employment Research; 2003.
14. Goodman NJ, Stapleton DC, Livermore GA, O'Day B. The Health Care Financing Maze for
Working-Age People with Disabilities. Cornell University Institute for Policy Research:
Rehabilitation Research and Training Center for Economic Research on Employment Policy for
Person with Disabilities; 2007.
15. Iezzoni LI, Killeen MB, O'Day BL. Rural residents with disabilities confront substantial
barriers to obtaining primary care. Health Serv Res. 2006;41:1258-1275.
16. Iezzoni LI, O'Day BL. More than Ramps: A Guide to Improving Health Care Quality and
Access for People with Disabilities. New York: Oxford University Press; 2006.
17. Atchinson BK, Fox DM. The politics of the health insurance portability and accountability
act. Health Aff. 1997;16:146-150.

28
18. White PH. Access to health care: Health insurance considerations for young adults with
special health care needs/disabilities. Pediatrics. 2002;110:1328-1335.
19. Social Security Administration. Trends in the social security and supplemental security
income disability programs. Baltimore, MD: SSA; 2006 Accessed July 14, 2008.
20. Minden K, Niewerth M, Listing J, Biedermann T, Schontube M, Zink A. Burden and cost of
illness in patients with juvenile idiopathic arthritis. Ann Rheum Dis. 2004;63:836-842.
21. Mitra S. The capability approach and disability. Journal of Disability Policy Studies.
2006;16:236-247.
22. World Health Organization. International Classification of Functioning, Disability and
Health. Geneva: World Health Organization; 2001.
23. Kruse D, Schur L. Does the definition affect the outcome? In: Stapleton DC, Burkhauser RV,
eds. The Decline in Employment of People with Disabilities Kalamazoo, USA: UpJohn Institute
for Employment Research; 2003:279-300.
24. Diehr P, Yanez D, Ash A, Hornbrook M, Lin DY. Methods for analyzing health care
utilization and costs. Annu Rev Public Health. 1999;20:125-144.
25. Manning WG. The logged dependent variable, heteroscedasticity, and the retransformation
problem. J Health Econ. 1998;17:283-295.
26. Oaxaca R, and Ransom M. On discrimination and the decomposition of wage differentials.
Journal of Econometrics. 1994;61:5-21.
27. Steinmann L, Telser H, Zweifel PS. Aging and future healthcare expenditure: A consistent
approach. Forum for Health Economics & Policy: Frontiers in Health Policy Research.
2007;10:1041.

29
28. Dow WH, Norton EC. Choosing between and interpreting the heckit and two-part models for
corner solutions. Health Services & Outcomes Research Methodology. 2003;4:5-18.
29. Fujiura GT, Yamaki K, Czechowicz S. Disability among ethnic and racial minorities in the
united states. Journal of Disability Policy Studies. 1998;9:111-130.
30. She P, Livermore GA. Material hardshp, poverty, and disability among working-age adults.
Social Science Quarterly. 2007;88:970-989-989.
31. Zeitzer I. The challenges of disability pension policy: Three western european case studies of
the battle against the numbers. In: Fultz E, Ruck M, eds. Reforming Worker Protections:
Disability Pensions in Transformation. Budapest, Hungary: International Labour Organization;
2002:227-286.
32. Mitra S. Temporary and partial disability programs in nine countries: What can the united
states learn from other countries? Journal of Disability Policy Studies. Forthcoming.
33. Jones A, O'Donnell O. Equivalence scales and the costs of disability. Journal of Public
Economics. 1995;56:273-289.
34. LaPlante MP, Kaye HS, Harrington C. Estimating the expense of a mandatory home-and
community-based personal assistance services benefit under medicaid. J Aging Soc Policy.
2007;19:47-64.
35. Grossman BR, Kitchener M, Mullan JT, Harrington C. Paid personal assistance services:An
exploratory study of working-age consumers' perspectives. J Aging Soc Policy. 2007;19:27-45.
36. Cohen J. Methodology Report #1: Design and Methods of the Medical Expenditure Panel
Survey Household Component. Available at:
http://www.meps.ahrq.gov/data_files/publications/mr1/mr1.shtml. Accessed January 16, 2009.

30
37. Cohen SB, DiGaetano R, Goksel H. Methodology Report #5: Estimation Procedures in the
1996 Medical Expenditure Panel Survey Household Component. Available at:
http://www.meps.ahrq.gov/data_files/publications/mr5/mr5.shtml. Accessed January 16, 2009.
Related Documents


