Health and wellbeing of women aged 18 to 23 in 2013 and 1996: F indings f r om the A ust r alian L ongitudinal Stud y on Wome n ’s Healt h Authors: Gita Mishra, Deborah Loxton, Amy Anderson, Richard Hockey, Jenny Powers, Wendy Brown, Annette Dobson, Luke Duffy, Anna Graves, Melissa Harris, Sheree Harris, Jayne Lucke, Deirdre McLaughlin, Rosemary Mooney, Nancy Pachana, Stephanie Pease, Meredith Tavener, Clare Thomson, Leigh Tooth, Natalie Townsend, Ryan Tuckerman and Julie Byles. Final report prepared for the Australian Government Department of Health May 2014

Welcome message from author
This document is posted to help you gain knowledge. Please leave a comment to let me know what you think about it! Share it to your friends and learn new things together.
Transcript

Health and wellbeing of women aged 18 to 23 in 2013 and 1996: F indings f r om the A ust r alian L ongitudinal Stud y on Wome n’s Healt h
Authors: Gita Mishra, Deborah Loxton, Amy Anderson, Richard Hockey, Jenny Powers, Wendy Brown, Annette Dobson, Luke Duffy, Anna Graves, Melissa Harris, Sheree Harris, Jayne Lucke, Deirdre McLaughlin, Rosemary Mooney, Nancy Pachana, Stephanie Pease, Meredith Tavener, Clare Thomson, Leigh Tooth, Natalie Townsend, Ryan Tuckerman and Julie Byles.
Final report prepared for the Australian Government Department of Health
May 2014

Health and wellbeing of women aged 18 to 23 in 2013 and 1996: Findings from the Australian
Longitudinal Study on Women’s Health
The research on which this report is based was conducted as part of the Australian Longitudinal Study on Women’s Health by researchers from the University of Newcastle and the University of Queensland. We are grateful to the Australian Government Department of Health for funding and to the women who provided the survey data.
Suggested citation:
Mishra G, Loxton D, Anderson A, Hockey R, Powers J, Brown W, Dobson A, Duffy L, Graves A, Harris M, Harris S, Lucke J, McLaughlin D, Mooney R, Pachana N, Pease S, Tavener M, Thomson C, Tooth L, Townsend N, Tuckerman R and Byles J. Health and wellbeing of women aged 18 to 23 in 2013 and 1996: Findings from the Australian Longitudinal Study on Women’s Health. Report prepared for the Australian Government Department of Health, May 2014.
Final report prepared for the Australian Government Department of Health
MAY 2014

i
TABLE OF CONTENTS
EXECUTIVE SUMMARY .................................................................................... 1 1
INTRODUCTION: ESTABLISHMENT OF THE 1989-95 COHORT OF THE 2AUSTRALIAN LONGITUDINAL STUDY ON WOMEN’S HEALTH ........................... 9
2.1 Overview ................................................................................................................... 9
2.2 Ethics approval ........................................................................................................ 10
2.3 References .............................................................................................................. 10
RECRUITMENT OF THE 1989-95 COHORT: WOMEN AGED 18 TO 23 IN 2013.... 11 3
3.1 Survey development ............................................................................................... 12 3.1.1 Focus groups .............................................................................................................................. 12 3.1.2 Pre-test ....................................................................................................................................... 13
3.2 Recruitment ............................................................................................................ 13 3.2.1 Recruitment strategies ............................................................................................................... 14 3.2.2 Evaluation of recruitment strategies ......................................................................................... 14 3.2.3 Summary .................................................................................................................................... 20
3.3 References .............................................................................................................. 20
REPRESENTATIVENESS OF THE 1989-95 COHORT: WOMEN AGED 18 TO 23 IN 42013 21
4.1 Representativeness ................................................................................................. 21 4.1.1 Comparison of sociodemographic characteristics of the 1989-95 cohort with women of
the same age range in the 2011 Census .................................................................................... 21 4.1.2 Comparison of education level and lifestyle characteristics of the 1989-95 cohort with
women aged 18 to 23 in the 2011-12 Australian Health Survey (AHS) ..................................... 23 4.1.3 Discussion................................................................................................................................... 25 4.1.4 Summary .................................................................................................................................... 26
4.2 Consent to data linkage .......................................................................................... 27 4.2.1 Summary .................................................................................................................................... 27
4.3 References .............................................................................................................. 28
THEN AND NOW CHARACTERISTICS OF YOUNG WOMEN: A COMPARISON OF 5WOMEN AGED 18 TO 23 IN 1996 AND 2013 ................................................... 29
5.1 Comparison of women aged 18 to 23 at the 1996 Census and the 2011 Census .. 30
5.2 Comparison of ALSWH women aged 18 to 23 in 1996 and 2013 ........................... 31 5.2.1 Education ................................................................................................................................... 32 5.2.2 Marital status ............................................................................................................................. 35 5.2.3 Living arrangements ................................................................................................................... 35 5.2.4 Paid employment ....................................................................................................................... 38 5.2.5 Ability to manage on income ..................................................................................................... 40
5.3 Summary ................................................................................................................. 44
5.4 References .............................................................................................................. 44
RISK FACTORS ................................................................................................ 45 6
6.1 Tobacco use ............................................................................................................ 46 6.1.1 Tobacco use among women aged 18 to 23 in 2013 by sociodemographic characteristics ....... 47 6.1.2 Summary .................................................................................................................................... 50

ii
6.2 Alcohol consumption .............................................................................................. 51 6.2.1 Alcohol consumption among women aged 18 to 23 in 1996 and 2013 ..................................... 52 6.2.2 Alcohol consumption among women aged 18 to 23 in 2013 by sociodemographic
characteristics ............................................................................................................................ 56 6.2.3 Summary .................................................................................................................................... 62
6.3 Illicit drugs ............................................................................................................... 63 6.3.1 Marijuana use among women aged 18 to 23 in 2013 by sociodemographic characteristics .... 66 6.3.2 Other illicit drug use among women aged 18 to 23 in 2013 by sociodemographic
characteristics ............................................................................................................................ 69 6.3.3 Summary .................................................................................................................................... 72
6.4 Physical Activity ...................................................................................................... 73 6.4.1 Physical activity among women aged 18 to 23 in 2013 by sociodemographic characteristics .. 76 6.4.2 Summary .................................................................................................................................... 79
6.5 Body Mass Index (BMI) / body weight .................................................................... 80 6.5.1 BMI by sociodemographic characteristics ................................................................................. 80 6.5.2 BMI then and now ...................................................................................................................... 83 6.5.3 Summary .................................................................................................................................... 84
6.6 References .............................................................................................................. 84
PHYSICAL HEALTH .......................................................................................... 85 7
7.1 Somatic symptoms .................................................................................................. 86
7.2 Menstrual and urogenital health ............................................................................ 87
7.3 Digestive and intestinal disorders .......................................................................... 88
7.4 Other doctor diagnosed conditions ........................................................................ 88
7.5 Disability .................................................................................................................. 89
7.6 Summary ................................................................................................................. 89
PSYCHOLOGICAL DISTRESS ............................................................................. 90 8
8.1 Stress ....................................................................................................................... 91
8.2 Kessler Psychological Distress Scale (K-10) ............................................................. 95
8.3 Suicidal ideation and self-harm .............................................................................. 99
8.4 Diagnosed mental health conditions .................................................................... 106
8.5 Discussion ............................................................................................................. 109
8.6 Summary ............................................................................................................... 110
8.7 References ............................................................................................................ 110
VIOLENCE..................................................................................................... 112 9
9.1 Physical and sexual violence against women aged 18 to 23 in 1996 and 2013 ... 113
9.2 Experiences of bullying among women aged 18 to 23 in 2013 ............................ 115
9.3 Intimate Partner Violence (IPV) experienced by women aged 18 to 23 in 1996 and 2013 ............................................................................................................. 118
9.3.1 Types of IPV experienced by women aged 18 to 23 in 2013 ................................................... 121
9.4 Summary ............................................................................................................... 122
9.5 References ............................................................................................................ 122
SEXUAL AND REPRODUCTIVE HEALTH .......................................................... 124 10
10.1 Sexual behaviour ................................................................................................... 125
10.2 Sexual transmitted infections (STIs) ..................................................................... 127
10.3 Contraception ....................................................................................................... 128 10.3.1 Oral contraceptive pill use ....................................................................................................... 129 10.3.2 Condom use ............................................................................................................................. 132

iii
10.3.3 Other forms of contraception .................................................................................................. 134 10.3.4 No contraceptive use ............................................................................................................... 136
10.4 Reproductive events ............................................................................................. 139
10.5 Summary ............................................................................................................... 144
ACCESS TO HEALTH SERVICES ....................................................................... 145 11
11.1 Female doctors ..................................................................................................... 145
11.2 Sources of health information .............................................................................. 149
11.3 Medicare cards ..................................................................................................... 151
11.4 Health Care Cards ................................................................................................. 153
11.5 Preventive services and health screening ............................................................ 155 11.5.1 Pap tests ................................................................................................................................... 155 11.5.2 Blood pressure checks ............................................................................................................. 156 11.5.3 Skin checks ............................................................................................................................... 156 11.5.4 HPV Vaccination ....................................................................................................................... 157
11.6 Summary ............................................................................................................... 158
11.7 Reference .............................................................................................................. 159
EXPLANATORY NOTES .................................................................................. 160 12
12.1 Explanatory Notes for Section 2 ........................................................................... 160
12.2 Explanatory Notes for Section 3 ........................................................................... 161
12.3 Explanatory notes for section 4 ............................................................................ 163 12.3.1 Weightings ............................................................................................................................... 163 12.3.2 Consent to data linkage ........................................................................................................... 164
12.4 Explanatory Notes for Section 5 ........................................................................... 166 12.4.1 Area of residence ..................................................................................................................... 166 12.4.2 Education ................................................................................................................................. 166 12.4.3 Marital Status ........................................................................................................................... 169 12.4.4 Living arrangements ................................................................................................................. 170 12.4.5 Paid employment ..................................................................................................................... 172 12.4.6 Income management ............................................................................................................... 173 12.4.7 References ............................................................................................................................... 173
12.5 Explanatory Notes for Section 6 ........................................................................... 174 12.5.1 Physical activity ........................................................................................................................ 174
12.6 Explanatory Notes for Section 9 ........................................................................... 177
12.7 Explanatory Notes for Section 10 ......................................................................... 178 12.7.1 Sexual behaviour ...................................................................................................................... 178 12.7.2 Sexually transmitted infections ................................................................................................ 179 12.7.3 Contraception .......................................................................................................................... 180 12.7.4 Reproductive events ................................................................................................................ 181

iv
TABLE OF FIGURES
Figure 3-1 1989-95 cohort recruitment timeline October 2012 to December 2013. ............................................................................................................ 13
Figure 3-2 Number of participants in the 1989-95 cohort recruited per week between November 2012 and December 2013.......................................... 15
Figure 3-3 Recruitment strategy, stratified by age. ....................................................... 17
Figure 3-4 Recruitment strategy, stratified by area of residence. ................................. 18
Figure 3-5 Recruitment strategy, stratified by level of educational attainment. .......... 19
Figure 4-1 Distribution of the 1989-95 cohort of women aged 18 to 23 (N= 17,070) mainly recruited using the internet across Australia (each dot represents one or more participants). ................................................. 25
Figure 5-1 Level of educational attainment of women aged 18 to 23 in 1996 and 2013, weighted by age and area of residence. .................................... 32
Figure 5-2 Level of educational attainment of women aged 18 to 23 in 2013, stratified by age........................................................................................... 33
Figure 5-3 Level of educational attainment of women aged 18 to 23 in 2013, stratified by area of residence. ................................................................... 34
Figure 5-4 Marital status of women aged 18 to 23 in 1996 and 2013, weighted by age and area of residence. ..................................................... 35
Figure 5-5 Percentage of women aged 18 to 23 in 2013 living with parents, stratified by age........................................................................................... 36
Figure 5-6 Percentage of women aged 18 to 23 in 2013 living with parents, stratified by area of residence. ................................................................... 37
Figure 5-7 Percentage of women aged 18 to 23 in 2013 living with parents, stratified by level of educational attainment. ............................................ 38
Figure 5-8 Ability to manage on available income among women aged 18 to 23 in 1996 and 2013, weighted by age and area of residence. .................. 40
Figure 5-9 Ability to manage on available income among women aged 18 to 23 in 2013, stratified by age. ....................................................................... 41
Figure 5-10 Ability to manage on available income among women aged 18 to 23 in 2013, stratified by area of residence. ................................................ 42
Figure 5-11 Ability to manage on available income among women aged 18 to 23 in 2013, stratified by level of educational attainment........................... 43
Figure 6-1 Smoking status of women aged 18 to 23 in 1996 and 2013, weighted by age and area of residence. ..................................................... 46
Figure 6-2 Smoking status of women aged 18 to 23 in 2013, stratified by age. ........... 47
Figure 6-3 Smoking status of women aged 18 to 23, stratified by area of residence. .................................................................................................... 48
v
TABLE OF FIGURES (cont.)
Figure 6-4 Smoking status of women aged 18 to 23 in 2013, stratified by level of educational attainment. ......................................................................... 49
Figure 6-5 Age at which women aged 18 to 23 in 2013 first drank a standard drink of alcohol, weighted by age and area of residence. .......................... 51
Figure 6-6 Frequency of alcohol consumption for women aged 18 to 23 in 1996 and 2013, weighted by age and area of residence. ........................... 52
Figure 6-7 Quantity of alcohol usually consumed on a drinking day by women aged 18 to 23 in 1996 and 2013, weighted by age and area of residence. .................................................................................................... 53
Figure 6-8 Average number of standard drinks consumed per day by women aged 18 to 23 in 1996 and 2013, weighted by age and area of residence. .................................................................................................... 54
Figure 6-9 Frequency of binge drinking (consuming more than four standard drinks on one occasion) by women aged 18 to 23 in 1996 and 2013, weighted by age and area of residence. ........................................... 55
Figure 6-10 Average number of standard drinks consumed per day by women aged 18 to 23 in 2013, stratified by age...................................................... 56
Figure 6-11 Average number of standard drinks consumed per day by women aged 18 to 23 in 2013, stratified by area of residence. .............................. 57
Figure 6-12 Average number of standard drinks consumed per day by women aged 18 to 23 in 2013, stratified by level of educational attainment. .................................................................................................. 58
Figure 6-13 Frequency of binge drinking (consuming more than four standard drinks on one occasion) by women aged 18 to 23 in 2013, stratified by age........................................................................................... 59
Figure 6-14 Frequency of binge drinking (consuming more than four standard drinks on one occasion) by women aged 18 to 23 in 2013, stratified by area of residence. ................................................................... 60
Figure 6-15 Frequency of binge drinking (consuming more than four standard drinks on one occasion) by women aged 18 to 23 in 2013, stratified by level of educational attainment. ............................................ 61
Figure 6-16 Age at which women aged 18 to 23 in 2013 first used marijuana, weighted by age and area of residence. ..................................................... 63
Figure 6-17 Age at which women aged 18 to 23 in 2013 first used other illicit drugs (i.e. excluding marijuana), weighted by age and area of residence. .................................................................................................... 64
Figure 6-18 Use of marijuana and other illicit drugs by women aged 18 to 23 in 2013, weighted by age and area of residence. ....................................... 65

vi
TABLE OF FIGURES (cont.)
Figure 6-19 Time of last marijuana use among women aged 18 to 23 in 2013, stratified by age........................................................................................... 66
Figure 6-20 Time of last marijuana use among women aged 18 to 23 in 2013, stratified by area of residence. ................................................................... 67
Figure 6-21 Time of last marijuana use among women aged 18 to 23 in 2013, stratified by level of educational attainment. ............................................ 68
Figure 6-22 Use of illicit drugs other than marijuana among women aged 18 to 23 in 2013, stratified by age. ....................................................................... 69
Figure 6-23 Use of illicit drugs other than marijuana among women aged 18 to 23 in 2013, stratified by area of residence. ................................................ 70
Figure 6-24 Use of illicit drugs other than marijuana among women aged 18 to 23 in 2013, stratified by level of educational attainment........................... 71
Figure 6-25 Physical activity levels among women aged 22 to 23 in 2000 (N=3515) and 2013 (N=5791), weighted by area of residence. .................. 74
Figure 6-26 Comparison of physical activity levels among women aged 18 to 23 in 2013 from the ALSWH 1989-95 cohort (weighted by age and area of residence), with similarly aged women from the Australian Health Survey 2011-12. ............................................................. 75
Figure 6-27 Levels of physical activity of women aged 18 to 23 in 2013, stratified by age........................................................................................... 76
Figure 6-28 Levels of physical activity among women aged 18 to 23 in 2013, stratified by area of residence. ................................................................... 77
Figure 6-29 Levels of physical activity among women aged 18 to 23 in 2013, stratified by level of educational attainment. ............................................ 78
Figure 6-30 BMI categories among women aged 18 to 23 in 2013, stratified by area of residence. ........................................................................................ 80
Figure 6-31 BMI categories among women aged 18 to 23 in 2013, stratified by level of educational attainment. ................................................................. 81
Figure 6-32 Percentage of women aged 18 to 23 in 2013 in each BMI category, stratified by age. ......................................................................... 82
Figure 6-33 Comparison of BMI status for women aged 18 to 23 in 1996 and 2013, weighted for age and area of residence. .......................................... 83
Figure 8-1 Comparisons of perceived stress (PSQYW) reported by women aged 18 to 23 in 1996 and 2013, weighted by age and area of residence. .................................................................................................... 91
Figure 8-2 Mean perceived stress reported by women aged 18 to 23 in 2013, stratified by age........................................................................................... 92

vii
TABLE OF FIGURES (cont.)
Figure 8-3 Mean perceived stress (PSQYW) reported by women aged 18 to 23 in 2013, stratified by area of residence. ..................................................... 93
Figure 8-4 Mean perceived stress (PSQYW) reported by women aged 18 to 23 in 2013, stratified by level of educational attainment. .............................. 94
Figure 8-5 Comparison of psychological distress (K-10) of women aged 18 to 23 in 2013 from the ALSWH 1989-95 cohort (weighted by age and area of residence), with similarly aged women from the 2011-12 AHS and the 2010 NDSHS. ........................................................................... 95
Figure 8-6 Level of psychological distress (K-10) among women aged 18 to 23 in 2013, stratified by age. ............................................................................ 96
Figure 8-7 Level of psychological distress (K-10) among women aged 18 to 23 in 2013, stratified by area of residence. ..................................................... 97
Figure 8-8 Level of psychological distress (K-10) among women aged 18 to 23 in 2013, stratified by level of educational attainment. .............................. 98
Figure 8-9 Feelings that life isn’t worth living among women aged 18 to 23 in 2013, stratified by age............................................................................... 100
Figure 8-10 Feelings that life isn’t worth living among women aged 18 to 23 in 2013, stratified by area of residence. ....................................................... 101
Figure 8-11 Feelings that life isn’t worth living among women aged 18 to 23 in 2013, stratified by level of educational attainment. ................................ 102
Figure 8-12 Reported self-harm among women aged 18 to 23 in 2013, stratified by age......................................................................................... 103
Figure 8-13 Reported self-harm among women aged 18 to 23 in 2013, stratified by area of residence. ................................................................. 104
Figure 8-14 Reported self-harm among women aged 18 to 23 in 2013, stratified by level of educational attainment. .......................................... 105
Figure 8-15 Diagnosed or treated depression reported by women aged 18 to 23 in 2013, stratified by area of residence. .............................................. 106
Figure 8-16 Diagnosed or treated anxiety reported by women aged 18 to 23 in 2013, stratified by area of residence. ....................................................... 107
Figure 8-17 Diagnosed or treated depression reported by women aged 18 to 23 in 2013, stratified by level of educational attainment......................... 108
Figure 8-18 Diagnosed or treated anxiety reported by women aged 18 to 23 in 2013, stratified by level of educational attainment. ................................ 109
Figure 9-1 Physical or sexual violence experienced within the last 12 months by women aged 18 to 23 in 1996 and 2013, weighted by age and area of residence. ...................................................................................... 113

viii
TABLE OF FIGURES (cont.)
Figure 9-2 Experience of being bullied among women aged 18 to 23 in 2013, stratified by age......................................................................................... 115
Figure 9-3 Experience of being bullied among women aged 18 to 23 in 2013, stratified by area of residence. ................................................................. 116
Figure 9-4 Experience of being bullied among women aged 18 to 23 in 2013, stratified by level of educational attainment. .......................................... 117
Figure 9-5 Experience of a violent relationship with a partner or spouse among women aged 18 to 23 in 2013, stratified by age. ......................... 118
Figure 9-6 Experience of a violent relationship with a partner or spouse among women aged 18 to 23 in 2013, stratified by area of residence. .................................................................................................. 119
Figure 9-7 Experience of a violent relationship with a partner or spouse among women aged 18 to 23 in 2013, stratified by level of educational attainment. ............................................................................ 120
Figure 9-8 Different types of IPV ever experienced by women aged 18 to 23 in 2013, weighted by age and area of residence. ......................................... 121
Figure 10-1 Experience of vaginal sex reported by women aged 18 to 23 in 2013, stratified by age............................................................................... 125
Figure 10-2 Comparison of age at first sexual intercourse for women aged 22 to 23 in 2000 and 2013, weighted for age and area of residence. ........... 126
Figure 10-3 Comparison of sexually transmitted infections for women aged 18 to 23 in 1996 and 2013, weighted for age and area of residence. ........... 127
Figure 10-4 Contraceptive use among women aged 18 to 23 in 2013 who reported they had experienced sexual intercourse, weighted for age and area of residence. ........................................................................ 128
Figure 10-5 Oral contraceptive pill use among women aged 18 to 23 in 2013 who reported they had experienced sexual intercourse, stratified by age. ....................................................................................................... 129
Figure 10-6 Oral contraceptive pill use among women aged 18 to 23 in 2013 who reported they had experienced sexual intercourse, stratified by area of residence. ................................................................................. 130
Figure 10-7 Oral contraceptive pill use among women aged 18 to 23 in 2013 who reported they had experienced sexual intercourse, stratified by level of educational attainment. .......................................................... 131
Figure 10-8 Condom use among women aged 18 to 23 in 2013 who reported they had experienced sexual intercourse, stratified by age. .................... 132
Figure 10-9 Condom use among women aged 18 to 23 in 2013 who reported they had experienced sexual intercourse, stratified by level of educational attainment. ............................................................................ 133

ix
TABLE OF FIGURES (cont.)
Figure 10-10 Contraceptive use other than OCP or condoms among women aged 18 to 23 in 2013 who reported they had experienced sexual intercourse, stratified by area of residence. ............................................. 134
Figure 10-11 Contraceptive use other than OCP or condoms among women aged 18 to 23 in 2013 who reported they had experienced sexual intercourse, stratified by level of educational attainment. ...................... 135
Figure 10-12 No contraceptive use among women aged 18 to 23 in 2013, stratified by age......................................................................................... 136
Figure 10-13 No contraceptive use among women aged 18 to 23 in 2013, stratified by area of residence. ................................................................. 137
Figure 10-14 No contraceptive use for women aged 18 to 23 in 2013, stratified by level of educational attainment. .......................................................... 138
Figure 10-15 Comparison of women aged 18 to 23 in 1996 and 2013 who had ever been pregnant, weighted for age and area of residence. ................ 139
Figure 10-16 Comparison of women aged 18 to 23 in 2013 who had ever been pregnant, stratified by age. ....................................................................... 140
Figure 10-17 Comparison of women aged 18 to 23 in 2013 who had ever been pregnant, stratified by area of residence. ................................................ 141
Figure 10-18 Comparison of women aged 18 to 23 in 2013 who had ever been pregnant, stratified by level of educational attainment. .......................... 142
Figure 10-19 Comparison of number of pregnancies for women aged 18 to 23 in 1996 and 2013, weighted for age and area of residence. .................... 143
Figure 11-1 Preference to see a female doctor among women aged 18 to 23 in 1996 and 2013 to see a female doctor, weighted by age and area of residence. .............................................................................................. 145
Figure 11-2 Preference to see a female doctor among women aged 18 to 23 in 2013, stratified by age............................................................................... 146
Figure 11-3 Preference to see a female doctor among women aged 18 to 23 in 2013, stratified by highest educational level. ........................................... 147
Figure 11-4 Preference to see a female doctor among women aged 18 to 23 in 2013, stratified by area of residence. ....................................................... 148
Figure 11-5 Sources of health information reported by women aged 18 to 23 in 2013, weighted by age and area of residence. ..................................... 149
Figure 11-6 Medicare card status of women aged 18 to 23 in 2013, stratified by age. ....................................................................................................... 151
Figure 11-7 Medicare card status of women aged 18 to 23 in 2013, stratified by area of residence. ................................................................................. 152

x
TABLE OF FIGURES (cont.)
Figure 11-8 Health Care Card status of women aged 18 to 23 in 2013, stratified by level of educational attainment. .......................................... 153
Figure 11-9 Health Care Card status of women aged 18 to 23, stratified by area of residence. ...................................................................................... 154
Figure 11-10 Pap test status of women aged 18 to 23 in 2013, stratified by area of residence. ...................................................................................... 155
Figure 11-11 Blood pressure check status of women aged 18 to 23 in 2013, stratified by age......................................................................................... 156
Figure 11-12 HPV vaccination status of women aged 18 to 23, stratified by area of residence. ...................................................................................... 157

xi
LIST OF TABLES
Table 3-1 Strategies used to recruit the 1989-95 cohort (Explanatory Notes for Section 3) ............................................................................................... 14
Table 4-1 Comparison of sociodemographic characteristics of the 1989-95 cohort of women aged 18 to 23 in 2013 with women of the same age range in the 2011 Australian Census data ............................................ 22
Table 4-2 Comparison of education level and lifestyle characteristics of the 1989-95 cohort of women aged 18 to 23 in 2013 with women in the same age range from the 2011-12 Australian Health Survey (AHS) ............................................................................................................ 24
Table 5-1 Sociodemographic characteristics of women aged 18 to 23 at the 1996 and 2011 Censuses ............................................................................. 31
Table 7-1 Comparison of the prevalence of somatic symptoms reported by women aged 18 to 23 in 1996 and 2013, weighted by age and area of residence ......................................................................................... 86
Table 7-2 Comparison of the prevalence of menstrual and urogenital symptoms reported by women aged 18 to 23 in 1996 and 2013, weighted by age and area of residence, as well as the prevalence of two doctor diagnosed conditions collected for the first time in 2013 ............................................................................................................. 87
Table 7-3 Comparison of the prevalence of digestive and intestinal disorders reported ...................................................................................................... 88
Table 7-4 Comparison of the prevalence of doctor diagnosed conditions reported ...................................................................................................... 88
Table 12-1 Survey schedules, ages, and participant numbers for the three original ALSWH cohorts ............................................................................. 160
Table 12-2 Characteristics of consenters and non-consenters with complete data for all variables in the table (N = 21,620) ......................................... 164
Table 12-3 Questions on level of educational attainment in the first survey of women aged 18 to 23 in 1996 and 2013 .................................................. 167
Table 12-4 Harmonisation of the level of educational attainment question in the first survey of women aged 18 to 23 in 1996 and 2013 ..................... 167
Table 12-5 Questions on participation in study in the first survey of women aged 18 to 23 in 1996 and 2013 ................................................................ 168
Table 12-6 Harmonisation of the question on participation in study in the first survey of women aged 18 to 23 in 1996 and 2013 ................................... 168
Table 12-7 Questions on marital status in the first survey of women aged 18 to 23 in 1996 and 2013 ............................................................................. 169

xii
LIST OF TABLES (cont.)
Table 12-8 Harmonisation of the question on marital status in the first survey of women aged 18 to 23 in 1996 and 2013 .............................................. 170
Table 12-9 Questions on living arrangements in the first survey of women aged 18 to 23 in 1996 and 2013 ................................................................ 171
Table 12-10 Harmonisation of living arrangements question in the first survey of women aged 18 to 23 in 1996 and 2013 .............................................. 172
Table 12-11 Questions on employment participation in the first survey of women aged 18 to 23 in 1996 and 2013 .................................................. 172
Table 12-12 Harmonisation of the question on participation in employment in the first survey of women aged 18 to 23 in 1996 and 2013 ..................... 173
Table 12-13 Questions on sexual behaviour for the 1973-78 and 1989-95 cohorts ...................................................................................................... 178
Table 12-14 Harmonisation of the questions on sexual behaviour in the 1973-78 and 1989-95 cohorts ............................................................................ 179
Table 12-15 Questions on sexually transmitted infections in the first survey of the 1973-78 and 1989-95 cohorts............................................................. 179
Table 12-16 Harmonisation of the questions on sexually transmitted infections in in the first survey of the 1973-78 and 1989-95 cohorts ...................................................................................................... 180
Table 12-17 Questions on reproductive events in the first survey of the 1973-78 and 1989-95 cohorts ............................................................................ 181
Table 12-18 Harmonisation of the question on reproductive events in the first survey of the 1973-78 and 1989-95 cohorts ............................................. 182

1
Executive summary 1
The Australian Longitudinal Study on Women’s Health (ALSWH) assesses the physical and mental
health of Australian women, as well as psychosocial aspects of their health (such as lifestyle and
socio-demographic factors) and their use of health services. ALSWH is funded by the Australian
Government Department of Health and has been collecting data since 1996 from over 40,000
women across three cohorts aged 18 to 23 (1973-78 cohort), 45 to 50 (1946-51 cohort) and 70 to
75 (1921-26 cohort) in 1996 when they were first recruited. The cohorts were recruited from the
Health Insurance Commission (now Medicare Australia) database and women’s survey data can
be linked to Medicare and Pharmaceutical Benefits Schemes datasets.
By 2010, ALSWH women were aged 32 to 37 (1973-78 cohort), 59 to 64 (1946-51 cohort) and 84
to 89 (1921-26 cohort). Since women in the youngest cohort were no longer young adults, in 2011
the Department of Health and Ageing (now the Department of Health) provided ALSWH with
funding to establish a new, fourth cohort of young women aged 18 to 23 (born 1989-95). It is
important to ensure young women are represented in national longitudinal studies as they are at
a key stage in their lifespan with respect to reproductive and lifestyle decisions that will affect
fertility rates, future demographic trends, and demand for health services.
This report describes the new recruitment methods used for the 1989-95 cohort of young women,
and the resultant representativeness of the cohort with respect to women of the same age in the
Australian population. Women in the cohort were aged 18 to 23 in 2013 and the report provides a
snapshot of their health, health behaviours and health service use. Where possible a comparison
is drawn with women of the same age range in 1996, by using baseline data from the 1973-78
cohort.
Recruitment
Since prior testing indicated poor response rates by young women to letters of invitation sent by
Medicare, an innovative recruitment protocol was developed. This involved:
using the internet and social media platforms as the main recruitment method, with over
two thirds of responses related to Facebook;
other recruitment methods including referral and traditional media;
a dynamic recruitment review process with targeted advertising, for instance to ensure
recruitment from regional and remote areas;
development of an online survey.
A total of 17,568 women met the inclusion criteria, that is, they completed survey information,
provided a valid and verified Medicare number, and consented to linkage of survey data with

2
administrative databases. A pilot study group of 498 women was formed, leaving a total of 17,070
women in the 1989-95 main cohort.
Consent to Data Linkage
Consent for survey data to be linked with external administrative datasets, such as Medicare, was
one of the criteria for inclusion in the cohort. Data linkage is an increasingly important feature of
the study as it enables investigation of important topics, such as health service use. Of the women
who completed the online survey, 78% consented to data linkage with only slight variation by age.
Representativeness
Representativeness of the cohort enables generalisation of findings from the study to support the
development of national health policy and healthcare planning. Recruitment of the cohort using
the internet and social networking sites, combined with an online survey, has resulted in a sample
of women who are broadly representative of women aged 18 to 23 from the Australian
population.
Compared with women of the same age in the 2011 Australian Census and the Australian Health
Survey (2011-12), women in the 1989-95 cohort are representative in terms of age distribution,
marital status, and area of residence. There is some indication of over-representation in the
cohort of university educated women. This may be in part due to the distinct ALSWH sample
frame, which unlike the Census, excluded women who did not have a valid Medicare number.
For prevalence statistics at the population level, sample weightings have been developed to
account for differences in age distribution and education level between women from the 1989-95
cohort and those from the 2011 census. For comparisons of women from the 1989-95 cohort with
women from the 1973-78 cohort in 1996, which had oversampling of those living in rural and
remote areas, sample weightings for age and geographical region were used. (Further information
on both sets of weightings is presented in the Explanatory Notes for Section 4).
Sociodemographic characteristics
Sociodemographic characteristics of the 1989-95 cohort indicate a good range of diversity of
women’s backgrounds and social circumstances.
23% of women in the cohort had a university degree, and 8% had not completed year 12.
The proportion with a university degree was higher than in the 2011 census, even though
the proportion of women aged 18 to 23 with university education has increased in the
Australian population since 1996. Analysis by age and area of residence showed that
higher educational qualifications, especially university level education, were strongly
related to age. Level of educational attainment was directly proportional to participation in

3
the labour force. Also, women in major cities were more likely to have higher educational
qualifications, particularly university level, than women in regional and remote areas.
23% of the women were in a de facto relationship, and 3% were married (similar to the
2011 census). Compared with women aged 18 to 23 in 1996, women in the 1989-95 cohort
were more likely to be in a de facto relationship (23% compared with 12%) and less likely
to be married.
Women aged 18 to 23 in 2013 differed little in their living arrangements from women of
the same age in 1996: a similar proportion of women from both cohorts lived with parents
(about half) or lived with partners (about one-quarter). Women in the 1989-95 cohort,
were more likely to be living with parents if they were younger, had completed Year 12
education, and lived in major cities.
61% of women aged 18 to 23 in 2013 reported having some level of difficulty managing on
their income compared with 51% women in the same age group in 1996.
Women with qualifications less than Year 12 had the highest percentage of reported
difficulties with income, with almost two-fifths of these women finding it impossible or
difficult all of the time to manage on their income.
Risk factors: Tobacco use
Over several decades, governments in Australia have introduced a range of policies to reduce
smoking rates. Findings from the 1989-95 cohort provide evidence to support these policy goals,
but point to some clear sociodemographic differences in the prevalence of smoking.
From 1996 to 2013, the percentage of women aged 18 to 23 who had never smoked
increased from 53% to 63%, while there was also a substantial decline in the percentage of
current smokers from one in three (32%) to less than one in five (19%).
In 2013, 44% of women with less than Year 12 education qualifications were current
smokers, compared with 10% of those with university qualifications.
One in four women (23%) living in remote and very remote areas was a current smoker,
with 3% smoking 20 or more cigarettes per day.
Risk factors: Alcohol consumption
Patterns of alcohol consumption have changed little among women aged 18 to 23 since 1996.
In 2013, one in four women (26%) drank alcohol weekly or more frequently (compared
with 29% in 1996); around 5% of the women consumed an average of more than two
standard drinks per day (exceeding the 2009 Australian guidelines for alcohol consumption
and placing them at increased lifetime risk of alcohol-related disease or injury).

4
Although the prevalence of binge drinking (consuming more than four drinks on one
occasion) in 2013 was higher than in 1996 (78% and 70% respectively), women engaged in
this risk behaviour slightly less frequently than in 1996. More than one in three (35%)
women reported binge drinking at least once a month in 2013, compared with 38% in
1996. In 2013, 13% engaged in binge drinking on at least a weekly basis.
Little variation was evident by sociodemographic characteristics, but women living in
remote or very remote areas had the highest prevalence of binge drinking with one in five
(22%) doing so weekly or more frequently; 37% of women with university level
qualifications reported binge drinking at least monthly.
Risk factors: Illicit drugs
A large percentage of women aged 18 to 23 in 2013 have used marijuana and other illicit drugs.
The majority (53%) of women in this age group have used marijuana, with 30% doing so
within the last 12 months. The use of other illicit drugs was about half this prevalence, at
29% of women, with 17% using other illicit drugs within the last 12 months.
Marijuana use within the last 12 months varied by sociodemographic characteristics, with
a peak of 33% at age 20; other groups with a high prevalence were women with less than
Year 12 education (35%) or those living in major cities (32%).
The use of other illicit drugs within the last twelve months was also highest among women
with less than Year 12 education (23%), and those living in remote areas (20%) or in major
cities (19%) as opposed to regional areas.
Risk factors: Lack of physical activity
Findings indicate that women aged 22 to 23 in 2013 were more physically active than the same
age group in 2000 (Survey 2 of the 1973-78 cohort). Only 30% of women in 2013 were in the
inactive or low physical activity categories, compared with 41% in 2000.
It was estimated that 70% of women aged 18 to 23 in 2013 met the threshold
recommendation for physical activity under the 2012 Australian guidelines.
Little variation by age or area of residence was evident, but women with less than Year 12
qualifications reported lower levels of physical activity than other women; 44% were in the
low activity or inactive categories compared with 24% of women with university level
qualifications.

5
Risk factors: Being overweight or obese
Among women aged 18 to 23 years in 2013, 19% were categorised as overweight and 14% as
obese. Comparison with women in the same age range in 1996 indicated a marked increase by
2013 in the percentage of overweight or obese women (20% in 1996 and 33% in 2013
respectively). BMI status also differed according to sociodemographic characteristics.
The percentage of women in overweight and obese categories increased with age, area of
residence (from the major cities to remote or very remote areas), and was highest among
women with less than Year 12 education level.
The percentage of underweight women was highest (9%) among those living in the major
cities.
Physical health
Compared with data for women aged 18 to 23 in 1996, data for women in this age group in 2013
point to an overall increase in the prevalence of symptoms experienced often.
More than one in five women reported frequent experience for one or more of the
following: severe tiredness (29%), back pain (21%), headaches or migraines (23%), irregular
periods (20%) or severe period pain (22%).
Nearly one-third of women reported being diagnosed with low iron.
A quarter of women reported being diagnosed with asthma.
The prevalence of a number of symptoms reported by the women had doubled, or nearly
doubled for this age group since 1996: difficulty in sleeping (25%), back pain (21%), vaginal
discharge or irritation (11%), haemorrhoids (2%), constipation (6%) and other bowel
problems (5%).
Psychological distress
Young adulthood is a period in the lifespan that is characterised by many social, educational,
occupational and residential changes that in some, can lead to high levels of psychological
distress.
Women aged 18 to 23 in 2013 reported higher levels of psychological stress than women
in the same age group in 1996, with the women who were younger and those with less
than Year 12 education indicating the highest stress levels.
The women reported high or very high levels of psychological distress in much greater
proportions (49%) than similarly aged participants in two other large Australian national
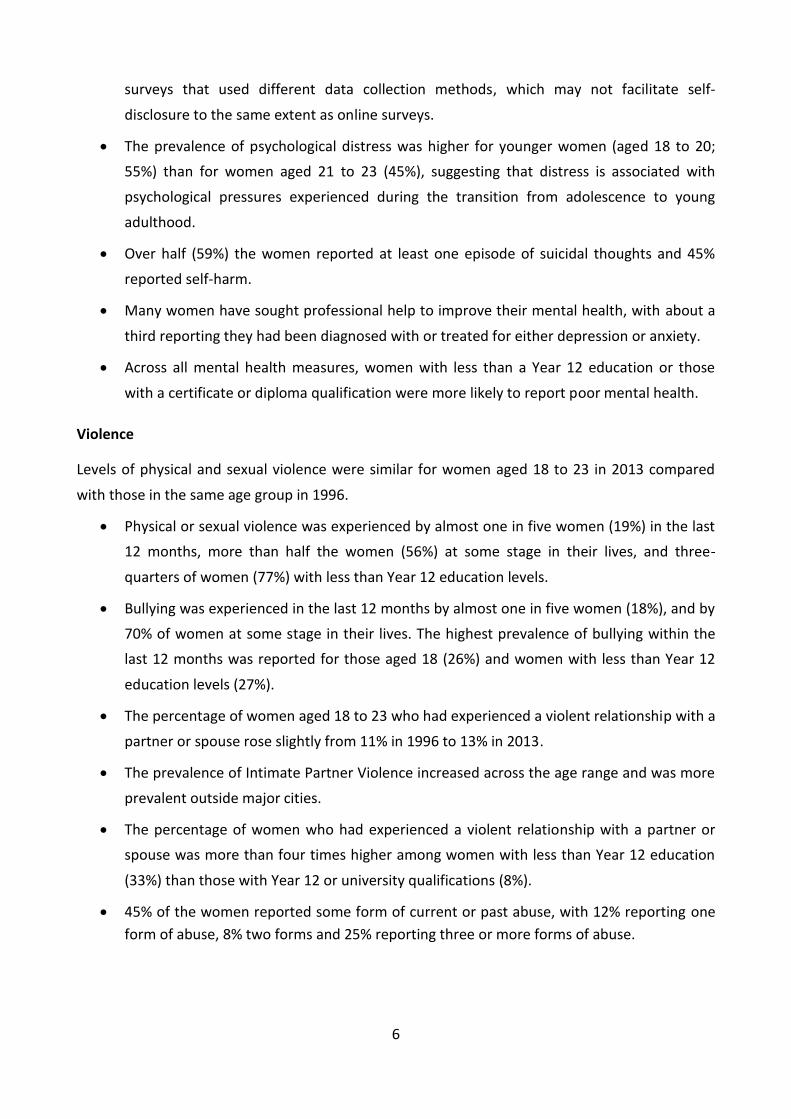
6
surveys that used different data collection methods, which may not facilitate self-
disclosure to the same extent as online surveys.
The prevalence of psychological distress was higher for younger women (aged 18 to 20;
55%) than for women aged 21 to 23 (45%), suggesting that distress is associated with
psychological pressures experienced during the transition from adolescence to young
adulthood.
Over half (59%) the women reported at least one episode of suicidal thoughts and 45%
reported self-harm.
Many women have sought professional help to improve their mental health, with about a
third reporting they had been diagnosed with or treated for either depression or anxiety.
Across all mental health measures, women with less than a Year 12 education or those
with a certificate or diploma qualification were more likely to report poor mental health.
Violence
Levels of physical and sexual violence were similar for women aged 18 to 23 in 2013 compared
with those in the same age group in 1996.
Physical or sexual violence was experienced by almost one in five women (19%) in the last
12 months, more than half the women (56%) at some stage in their lives, and three-
quarters of women (77%) with less than Year 12 education levels.
Bullying was experienced in the last 12 months by almost one in five women (18%), and by
70% of women at some stage in their lives. The highest prevalence of bullying within the
last 12 months was reported for those aged 18 (26%) and women with less than Year 12
education levels (27%).
The percentage of women aged 18 to 23 who had experienced a violent relationship with a
partner or spouse rose slightly from 11% in 1996 to 13% in 2013.
The prevalence of Intimate Partner Violence increased across the age range and was more
prevalent outside major cities.
The percentage of women who had experienced a violent relationship with a partner or
spouse was more than four times higher among women with less than Year 12 education
(33%) than those with Year 12 or university qualifications (8%).
45% of the women reported some form of current or past abuse, with 12% reporting one
form of abuse, 8% two forms and 25% reporting three or more forms of abuse.

7
Sexual and reproductive health
The pill and condoms were the main forms of contraception used by women aged 18 to 23
in 2013.
Women with less than Year 12 educational attainment were more likely to report not
using contraceptives the last time they had sex (27%) compared with women with higher
qualifications (7-15%).
Contraceptive use was reported by a higher percentage of women living in major cities and
those with Year 12 or university qualifications.
There remain marked variations in the percentage of women who reported ever having
been pregnant according to age, area of residence and education level: 21% of women
aged 23, 24% of women living in remote or very remote areas, and 41% of those with less
than Year 12 qualifications reported ever having been pregnant.
Access to health services
Women’s preference for a female doctor was different for different age groups within the
cohort but there was little difference between women aged 18 to 23 in 2013 and in 1996.
78% of women aged 18 to 23 in 2013 reported doctors as a source of information, with a
similar figure across the age range, area of residence, and education level.
62% of women identified family members as a source of health information; however,
there was a clear decline in the percentage with age and was lowest among those who had
not completed Year 12 qualifications.
44% of the women identified the internet as a source of health information; the
percentage was higher among those living in the major cities than elsewhere, increased
with age (37% at 18 to 49% at age 23 years) and was higher among those with higher levels
of education.
Overall 69% of women had their own Medicare card while 13% had a copy of a parent’s
card and 18% had to borrow their parents’ card.
Preventive services and screening:
Overall more than half the women reported having had a Pap test within the last two
years, which was slightly more than the percentage of women in the age group in 1996. As
expected, use of Pap tests increased with age.
86% of women aged 18 to 23 in 2013 reported that they had their blood pressure checked,
and 30% of women reported having their skin checked for “spots, lesions, moles”.

8
Women aged 18 to 23 in 2013 were eligible for the free HPV vaccination program at school
when it was introduced in 2007. However, only 83% reported they had ever been
vaccinated for HPV, with little variation by area of residence.
Reporting of HPV vaccination was lowest among the 18 year olds (78%) and highest among
those aged 21 or more (85-86%). It was lowest among those with the lowest levels of
educational attainment.
Summary:
This report provides an overview on the recruitment of a large cohort of young women who are
broadly representative of the Australian population and who have provided consent for linkage to
administrative datasets (e.g. Medicare) and to continue in the longitudinal study. While there are
some differences between the cohort and the Australian population of women of the same ages,
the cohort still presents a wide diversity of backgrounds and circumstances allowing the aims of
the study, to assess factors associated with women’s health, to be addressed. The women in the
1989-95 cohort are not dissimilar to women of the same age in 1996, but they are more physically
active and appear to have higher levels of psychological stress. Over time we expect to see rapid
changes in the women’s social circumstances, health risks, health, and health care use which will
provide new understandings of what influences the health of young women in the 21st Century.

9
Introduction: Establishment of the 1989-95 cohort of 2the Australian Longitudinal Study on Women’s Health
Overview 2.1
The Australian Longitudinal Study on Women’s Health (ALSWH) first surveyed three age cohorts of
women in 1996. At recruitment, the women were aged 18 to 23 (1973-78 cohort), 45 to 50 (1946-
51 cohort) and 70 to 75 (1921-26 cohort). These age groups were selected to ensure coverage
across the adult lifespan. Over the last 18 years, the cohorts have been surveyed regularly
(Explanatory Notes for Section 2) and the information obtained has been used to inform policy
development across Australia (Australian Government Department of Health and Ageing, 2010).
By 2010, women in the original cohorts were aged 32 to 37 (1973-78 cohort), 59 to 64 (1946-51
cohort) and 84 to 89 (1921-26 cohort). As a result, these cohorts no longer provided information
from across the entire adult lifespan. To remedy this, in 2011 the Department of Health and
Ageing (now the Department of Health) provided the study with funding to establish a fourth
ALSWH cohort of women aged 18 to 23 in 2013 (born 1989-95). It is particularly important to
ensure young women are represented in national data sources because these women will go on
to:
make reproductive and lifestyle decisions that will affect fertility rates and future
demographic trends;
be the new workforce in the context of an ageing population and changing dependency
ratios;
be the first generation of Australian women likely to have access to almost universal paid
maternity leave.
In addition, young women today live in an environment where many recent technological
advances, such as mobile phones, the internet, chat rooms, social media, and online learning are a
part of everyday life. Data from the 1989-95 cohort will provide information on the long-term
physical and mental health effects of these aspects of modern life.
The overall objectives for establishing the 1989-95 cohort were to:
collect scientifically valid information about the current health and health service use of
young women which will provide an evidence base for the development and evaluation of
health policy and practice relevant to a new generation of Australian women;
add health information from young women to the information from existing cohorts, in
order to examine the health and health service use of Australian women across the
lifespan;
10
compare the health and health service use of women aged 18 to 23 in 2013 (1989-95
cohort) with that of similarly aged women in 1996 (1973-78 cohort baseline), thereby
providing a measure of generational differences in health and an opportunity to evaluate
the effect of changes in health policy and practice.
All surveys of the 1989-95 cohort will be conducted online and linked with Medicare and other
administrative data to provide an objective measure of health and health service use. The surveys
are planned to continue longitudinally with on-going linkage of health service data for the same
individuals. Findings will provide evidence that can be used to inform health policy and planning.
The purpose of this report is to describe the recruitment and representativeness of the 1989-95
cohort and their health and wellbeing. Where possible, generational health differences will be
identified by comparing women aged 18 to 23 in 2013 (1989-95 cohort) with women who were in
the same age range in 1996 (1973-78 cohort).
Ethics approval 2.2
Ethics approval for establishment of the 1989-95 cohort was granted by the University of
Newcastle (H-2012-0256 and H-2011-0154), the University of Queensland (2012000950 and
2011000809), the Department of Health (project: 15/2012) and the Department of Human
Services (2012/CO10726). The Department of Human Services gave permission to obtain
participants’ online consent for data linkage.
References 2.3
Australian Government Department of Health and Ageing 2010, National Women’s Health Policy
2010. Available at: http://www.health.gov.au/internet/main/publishing.nsf/Content/national-
womens-health-policy.

11
Recruitment of the 1989-95 cohort: Women aged 18 3to 23 in 2013
The original ALSWH cohorts were recruited via the Health Insurance Australia (now Medicare)
database with oversampling (by a factor of two) of women from rural and remote areas. A letter
of invitation was sent to women randomly selected from the Health Insurance Australia database,
and only after women had agreed to take part and complete the survey, were their personal
details provided to ALSWH. The same method of recruitment was planned for the 1989-95 cohort,
with sampling to continue until at least 10,000 participants had been recruited.
Selection criteria included being female, aged 18 to 23, having a Medicare number (inclusion on
either a family card or personal card), agreeing to take part in ongoing surveys and consenting to
data linkage with the Medicare database (e.g. Medicare Benefits Scheme, Pharmaceuticals Benefit
Scheme) and other administrative databases related to health and medical services.
The pilot study of the Contraceptive Use, Pregnancy Intentions and Decisions of Australian
Women (CUPID) project provided valuable information on the methods proposed for recruitment
of the ALSWH 1989-95 cohort. Several of the ALSWH investigators are also investigators on the
CUPID project which attempted to use the same recruitment protocol as that proposed for the
ALSWH 1989-95 cohort, except that the CUPID pilot study was limited to New South Wales. In
May 2012, the CUPID pilot study commenced, with Medicare posting an invitation letter on behalf
of the research team to a sample of potential participants who had been selected from the
Medicare database. Of the 900 women approached, 54 responses (6%) were received after
reminder letters, resulting in a recruitment cost of $88 per participant. The response rate for the
CUPID pilot study was considerably lower than the 40% obtained using the same recruitment
protocol for the original ALSWH cohorts in 1996 (Brown et. al., 1998).
Due to the poor response rate obtained in the CUPID project, a range of alternative and
innovative recruitment methods were considered, and a new protocol developed. The remainder
of this section aims to:
explain the processes by which the survey and recruitment methods were developed;
describe the new recruitment strategies adopted;
identify the sociodemographic characteristics of women recruited through different
strategies.

12
Survey development 3.1
With advances in information and communications technology, a number of research techniques,
such as online survey questionnaires, have emerged. It was proposed that an online survey would
likely be more appealing than paper-based surveys to women in the 18 to 23 year age group who
could utilise the technology they had become accustomed to and avoid the burden of posting
surveys back to the researchers. The acceptability and format of an online survey was tested
through the use of focus groups and a pre-test with women in the target age range. Results
informed the development of the survey and recruitment strategies.
3.1.1 Focus groups
In 2011 and 2012 focus groups were conducted in urban and rural areas of New South Wales and
Queensland to inform the development and implementation of the first survey for the 1989-95
cohort. A total of 19 focus groups were conducted with 75 female participants aged 18 to 23.
Discussions included issues of survey format and appearance, mode of administration and time
taken to complete, promotion of the survey to the target population, privacy of personal
information, methods of broaching sensitive subjects, and data linkage.
Key outcomes from the focus groups were as follows.
The majority of participants supported an online survey format for speed, ease, and
likelihood of completion.
Social media, particularly Facebook, was considered the best way of connecting with
potential participants.
Recruitment should include careful branding of the study to a younger age group and
explanations of why collecting such health information is important.
Including incentives would work as a strategy for encouraging participation.
Survey features, such as a visible progress bar, multiple choice questions, organising the
questions by topic, and asking only one or two questions per page would help off-set the
burden of a long survey.
The survey should be formatted for completion on a computer, smart phone, and iPad in a
way that would minimise the need to scroll down or across the page.
Confidentiality of information was raised as a definite concern, but study transparency
would help to ease this.
The longitudinal method should be described to clarify the need for personal contact
information (e.g. address).

13
The uniqueness of each participant’s contribution should be emphasised.
Sensitive questions on drug and alcohol use, reproductive health, sex, and traumatic life
events could be made more acceptable if an explanation was given for why certain
questions were being asked and by including an ‘opt out’ response.
Participants were open to the concept of data linkage if it was optional and they were
provided with information about the process and its value.
Email and SMS reminders were deemed more appropriate for this age group than postal
and telephone reminders.
3.1.2 Pre-test
A total of 204 women recruited through an online market research company completed the pre-
test. Most women did so using a desktop computer, with about 10% using a smart device (e.g.,
iPad, iPhone). Responses to the evaluation items on survey content and method were positive,
with participants reporting a high degree of satisfaction with the quality of the survey and ease of
completion. The majority of participants selected Facebook as the best recruitment platform,
followed by traditional media (e.g. TV and radio).
Recruitment 3.2
Recruitment commenced in October 2012 and concluded in December 2013. Follow-up processes
continued into 2014 in order to finalise the cohort. Over the recruitment period, two distinct
campaigns were conducted during the times shown in Figure 3-1.
Figure 3-1 1989-95 cohort recruitment timeline October 2012 to December 2013.
The first campaign, ‘You are more than the sum of your parts’, was designed and initiated by
ALSWH staff with professional promotional advice provided by their institutions. The incentive for
this campaign was the chance to win one of 100 $50 gift vouchers. The study was rebranded to
WHoA! (Women’s Health of Australia) for the second campaign. The WHoA! campaign involved a
marketing communications company that set up a collaboration with Black Milk Clothing to offer
2012 2013
O N D J F M A M J J A S O N D
Campaign Sum Of Your Parts WHoA!
14
the incentive of a chance to win one of 2000 exclusive pairs of leggings, available only to
participants of the 1989-95 cohort.
3.2.1 Recruitment strategies
During both campaigns, a variety of strategies was used to recruit the 1989-95 cohort, as seen in
Table 3-1. Additional activities such as face-to-face events (e.g. music festivals and career expos)
raised awareness of the study. Recruitment required a flexible approach, as many recruitment
strategies had not been tested on this age group or at a national level. Relevant survey items
measuring participant demographics and how participants heard about the survey were
monitored regularly over the recruitment period to assess the usefulness of different recruitment
strategies. Popular strategies such as Facebook advertising were then refined over the study
period, whereas less promising strategies, such as cinema advertising, were discontinued.
Monitoring also resulted in the development of targeted strategies to improve the
representativeness of the cohort.
Table 3-1 Strategies used to recruit the 1989-95 cohort (Explanatory Notes for Section 3)
Type of recruitment Strategies included
Facebook ALSWH Facebook page, WHoA! Facebook page, other Facebook pages, Facebook advertising
Other online media ALSWH website, WHoA! website, other websites, web advertising or promotion (e.g. Gumtree, University Career Hubs) Twitter, Instagram, Tumblr, YouTube, web forums
Referral Original ALSWH cohorts, ALSWH collaborators and their networks, professional bodies, participants who already completed the survey
Traditional media ALSWH posters, WHoA! posters, Avant Cards, business cards/small flyers, magazine, conference packs, TV interviews, radio interviews, newspaper and magazine articles/advertisements
Black Milk Above mentioned strategies with a focus on the Black Milk leggings promotion, video and blog seeding, email to existing Black Milk followers, Black Milk Facebook page
3.2.2 Evaluation of recruitment strategies
For inclusion in the 1989-95 cohort, respondents needed to:
meet the eligibility criteria of being female, aged 18 to 23 and having a Medicare number;
answer at least some survey questions;
meet the requirements for data linkage.

15
A total of 17,568 women met the above inclusion criteria. To establish a pilot study group for the
cohort, the first 498 young women that met the above criteria were removed from the main
cohort. As a result the pilot study group included all women recruited in October 2012 who were
verified by the Department of Human Services. Of the remaining sample, 17,070 participants were
verified by the Department of Human Services. The results in this report, with the exception of
Section 4.21, are based on the 17,070 verified participants of the 1989-95 cohort.
Figure 3-2 Number of participants in the 1989-95 cohort recruited per week between November 2012 and December 2013.
Figure 3-2 shows the participant response rate over the recruitment period for the main cohort,
corresponding to a range of recruitment strategies.
1. Traditional media such as magazine advertisements, other online media, Facebook
advertisements aimed at women in the target age range, and promotional events to raise
awareness were being used for recruitment.
2. The Facebook advertisements were aimed at women in the target age range with
particular interests such as health or fitness.
1 Section 4.2 compares the characteristics of women who consented to data linkage with those who did not.
0
500
1000
1500
2000
2500
Nov Dec Jan Feb Mar Apr May Jun Jul Aug Sep Oct Nov Dec
WHoA Legs Campaign
1
2 3
4 5
6
1
7

16
3. Facebook introduced a new type of advertisement where the advertisement was displayed
in the newsfeed (i.e., centre screen) amongst other posts, rather than in the right hand
column. Daily spending limits for Facebook advertising were also increased.
4. The number of Facebook advertisements and the daily spending limits on Facebook
advertising were increased.
5. Facebook advertising was more successful after the 2013 federal election advertising
finished.
6. The WHoA! campaign was launched.
7. Facebook advertising was restarted (after stopping for launch of the WHoA! campaign)
and the number of advertisements was increased. Black Milk email was sent out to Black
Milk subscribers.
Response by recruitment strategy
Participants were asked how they heard about the survey. Responses were collapsed into five
broad categories: Facebook including Facebook advertising, other online media, referral,
traditional media and Black Milk (for definitions see Explanatory Notes for Section 3).
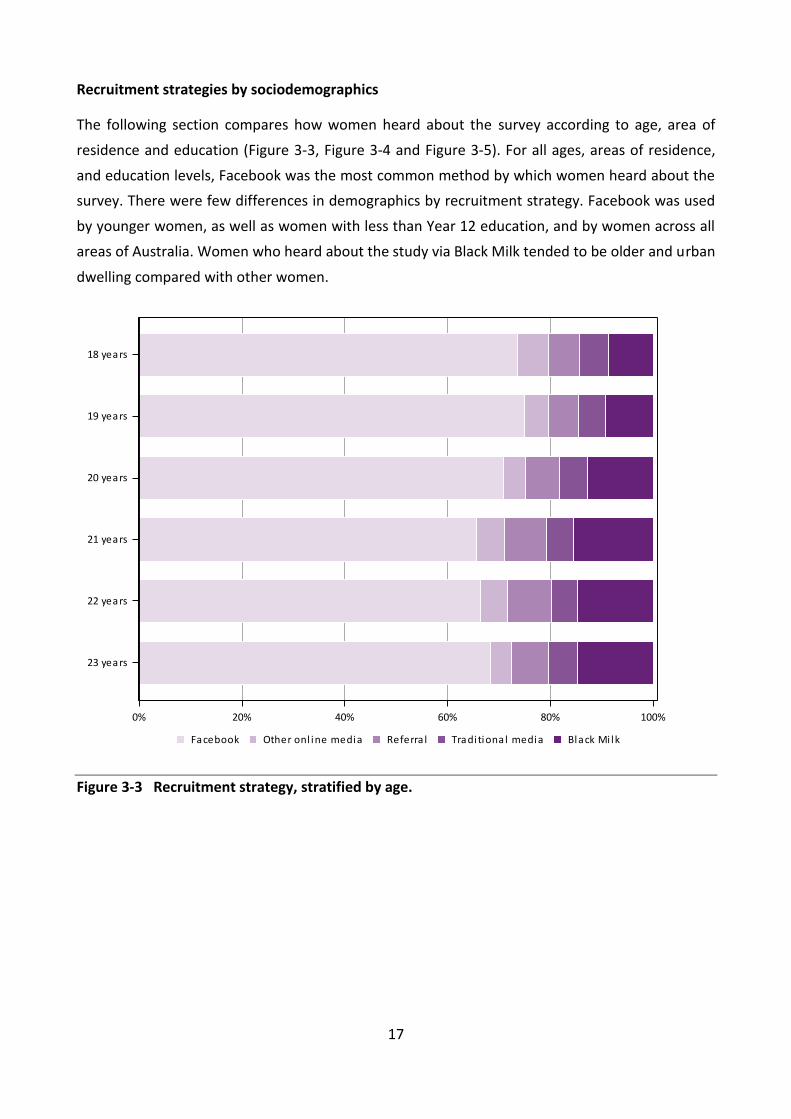
17
Recruitment strategies by sociodemographics
The following section compares how women heard about the survey according to age, area of
residence and education (Figure 3-3, Figure 3-4 and Figure 3-5). For all ages, areas of residence,
and education levels, Facebook was the most common method by which women heard about the
survey. There were few differences in demographics by recruitment strategy. Facebook was used
by younger women, as well as women with less than Year 12 education, and by women across all
areas of Australia. Women who heard about the study via Black Milk tended to be older and urban
dwelling compared with other women.
Figure 3-3 Recruitment strategy, stratified by age.
0% 20% 40% 60% 80% 100%
23 years
22 years
21 years
20 years
19 years
18 years
Black Mi lkTraditional mediaReferra lOther onl ine mediaFacebook
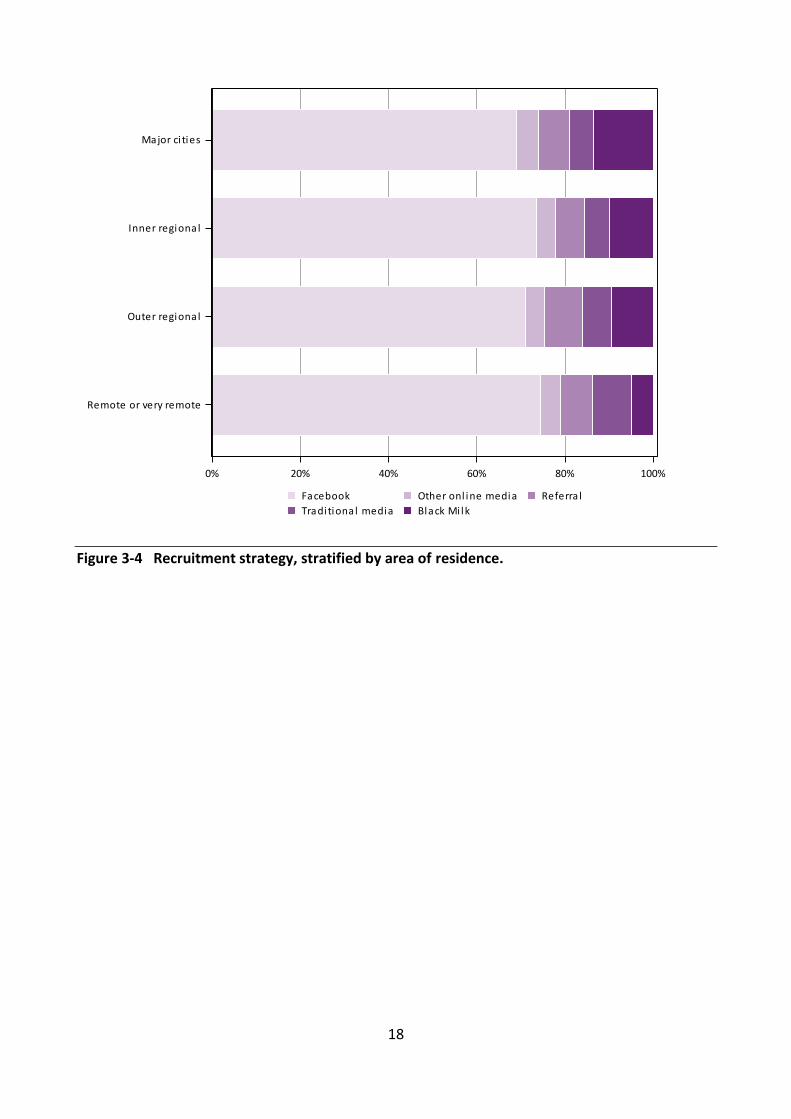
18
Figure 3-4 Recruitment strategy, stratified by area of residence.
0% 20% 40% 60% 80% 100%
Remote or very remote
Outer regional
Inner regional
Major ci ties
Black Mi lkTraditional media
Referra lOther onl ine mediaFacebook

19
Figure 3-5 Recruitment strategy, stratified by level of educational attainment.
0% 20% 40% 60% 80% 100%
Univers i ty
Certi ficate/Diploma
Year 12
Less than Year 12
Black Mi lkTraditional mediaReferra lOther onl ine mediaFacebook

20
3.2.3 Summary
17,070 women were recruited to the 1989-95 cohort
Facebook:
o accounted for seventy percent of participants;
o was most useful when using advertisements targeted at interests and displayed in
the newsfeed;
o had good reach to women aged 18 to 23, particularly 18 and 19 year olds;
o had good reach to women with less than Year 12 education;
o is widely available to researchers.
Referral, traditional media and online media:
o accounted for 17% of responses.
Black Milk:
o accounted for 13% of participants;
o was more likely to attract older and urban women compared with the other
strategies;
o was a rapid method of recruitment, particularly after the email sent to Black Milk
subscribers;
o was dependent on hiring a marketing communications company, which may be less
available to other researchers.
References 3.3
Brown WJ, Bryson L, Byles JE, Dobson AJ, Lee C, Mishra G & Schofield M. 1998. ‘Women's Health
Australia: recruitment for a national longitudinal cohort study’, Women & Health, vol. 28, no. 1,
pp. 23-40.
21
Representativeness of the 1989-95 cohort: Women 4aged 18 to 23 in 2013
Representativeness 4.1
The representativeness of this sample of young Australian women in terms of key attributes such
as their sociodemographic characteristics, enables generalisation of findings at the population
level and supports the development of national health policy and healthcare planning.
4.1.1 Comparison of sociodemographic characteristics of the 1989-95 cohort with women of the same age range in the 2011 Census
The ALSWH 1989-95 cohort of women aged 18 to 23 was found to be broadly representative in
terms of geographical distribution across Australia (both in terms of the State or Territory of
residence and the remoteness of their area of residence), their marital status (95.5% were never
married) and their age distribution (see Table 4-1).
A higher percentage of the 1989-95 cohort had university level education than in the population
(22.5% versus 9.4%) and certificate or diploma qualifications were also higher (25.9% versus
21.7%). Conversely, only 7.4% had less than Year 12 education compared with 14.9% in the
population. This difference may in part be due to the distinct sample frame of ALSWH, which
unlike the Census, excluded women who did not have a valid Medicare number.

22
Table 4-1 Comparison of sociodemographic characteristics of the 1989-95 cohort of women aged 18 to 23 in 2013 with women of the same age range in the 2011 Australian Census data
1989-95 cohort 2013
(N= 17,070) %
Census data 2011
(N= 847,042) %
Age 18 15.2 16.0 19 17.5 16.2 20 17.2 16.8 21 16.5 17.1 22 16.9 17.0 23 16.7 17.0
State/Territories New South Wales 27.8 31.0 Victoria 24.0 25.4 Queensland 22.3 20.6 Western Australia 11.0 10.6 South Australia 7.6 7.3 Australian Capital Territory 3.3 2.0 Tasmania 2.9 2.1 Northern Territory 0.8 1.0
Area of residence Major city 75.3 74.5 Inner regional 16.6 16.0 Outer regional 6.7 7.2 Remote 0.8 1.1 Very remote Migratory/no usual address
0.3 N/A
0.9 0.3
Missing 0.3 - Highest qualification
Less than Year 12 7.4 14.9 Year 12 or equivalent 43.0 46.1 Certificate / Diploma 25.9 21.7 University degree 22.5 9.4 Missing/not stated/inadequately described 1.2 7.8
Aboriginal or Torres Strait Islander origin* No 97.3 91.9 Yes 2.7 3.4 Missing 0.0 4.7
Marital Status Never married 95.5 94.5 Married 3.0 4.9 Separated/divorced/widowed 0.4 0.6 Missing 1.2 -
*n=14,909 as this question was only asked in a later version of the survey

23
4.1.2 Comparison of education level and lifestyle characteristics of the 1989-95 cohort with women aged 18 to 23 in the 2011-12 Australian Health Survey (AHS)
A higher percentage of the 1989-95 cohort rated their health in the online survey as “fair or poor”
compared with the rates reported by women from the same age group in the AHS using face-to-
face interviews (17% versus 10%; Table 4-2). Conversely, the 1989-95 cohort reported a higher
level of physical activity (60% were classified as sufficiently active versus 48% of women in the
AHS).2 Less than one in five women (19%) from the 1989-95 cohort were current smokers and
59% reported drinking alcohol at least once per month (compared with 16% and 66% respectively
in the AHS).
Based on self-reported height and weight, the mean body mass index (BMI) of women in the
1989-95 cohort was 24.4 kg/m2 compared with 24.7 kg/m2 using measured BMI data in the AHS.
Almost one in three (32%) of the 1989-95 cohort were classified as overweight or obese (BMI ≥
25) compared with 34% respectively using measured BMI data in the AHS. (Using age-education
weighted data did not make substantive changes to these results - see Explanatory Notes for
Section 4 sample weights formula.)
2 Physical activity levels of women from the AHS and those of women from the 1989-95 cohort were difficult to
compare due to differences in questions, algorithms and categories. Further details can be found in Section 6.4.

24
Table 4-2 Comparison of education level and lifestyle characteristics of the 1989-95 cohort of women aged 18 to 23 in 2013 with women in the same age range from the 2011-12 Australian Health Survey (AHS)
1989-95 cohort a
2013 (N=17,070) %
1989-95 cohort b
2013 (N=17,070) %
AHSc
2011-12 %
Education level Less than Year 12 7.4 15.4 17.9 Year 12 or equivalent 43.0 49.7 40.1 Certificate / Diploma 25.9 23.4 32.9 University degree 22.5 10.4 8.7 Missing/not stated/inadequately described
1.2 1.1 0.4
Self-rated health Excellent 6.4 5.8 17.7 Very good 35.6 33.4 38.1 Good 40.2 41.3 34.4 Fair/Poor 16.7 18.6 10.1
Smoking statusd Current smoker 18.7 21.5 16.3
Body mass index (kg/m2) Underweight, BMI < 18.5 7.8 7.7 5.4 Acceptable weight, 18.5 <= BMI < 25 58.1 56.4 58.2 Overweight, 25 <= BMI < 30 18.9 19.2 14.8 Obese, 30 <= BMI 13.5 15.0 18.8
Mean weight (kg) 67.4 68.0 66.4 Mean height (cm) 166.2 166.1 164.6 Mean BMI 24.4 24.7 24.7 Physical Activity Level
Inactive 6.0 6.8 9.8 Insufficiently active 33.0 34.1 41.3 Sufficiently active 60.1 58.8 48.3
Alcohol consumption Never drink 7.5 7.8 12.7 Less than once a month 33.0 34.0 21.4 Less than once a week 32.6 32.2 31.9 At least once a week 25.9 24.9 34.0
a Unweighted
b Weighted for age and education
c Sample size for women aged 18 to 23 in the AHS was not readily available
dData for never smokers and ex-smokers were not comparable due to substantial differences in the questions asked
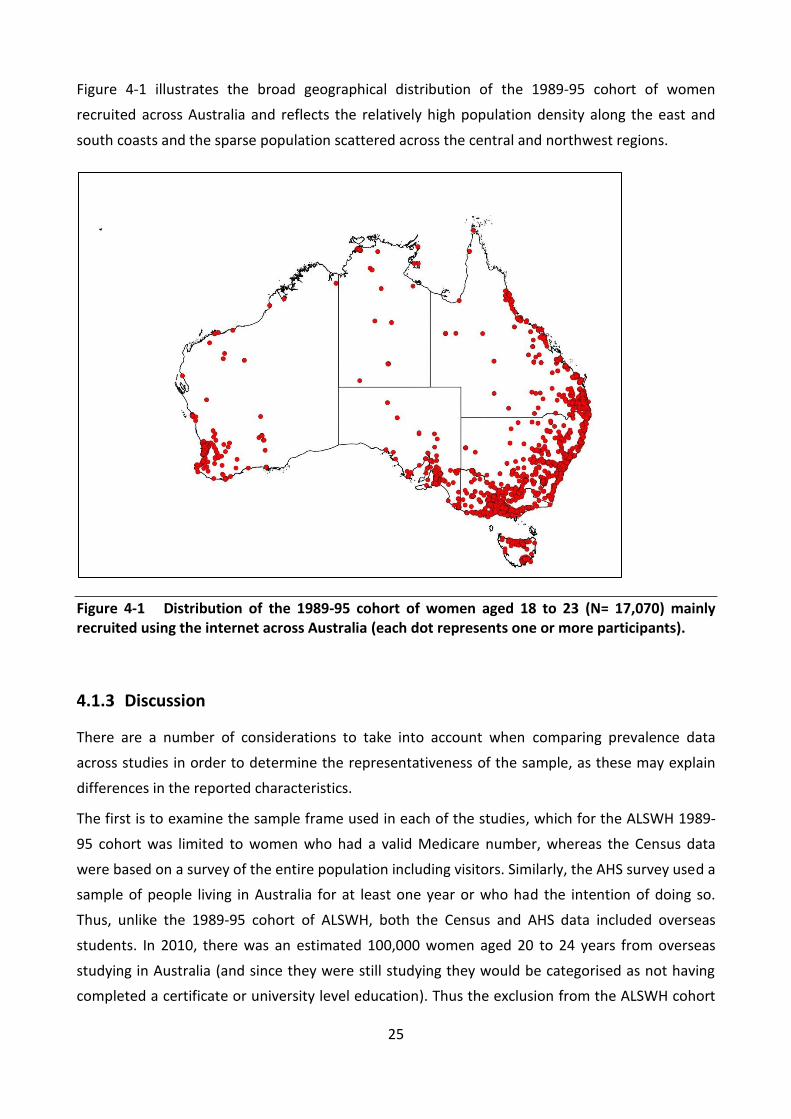
25
Figure 4-1 illustrates the broad geographical distribution of the 1989-95 cohort of women
recruited across Australia and reflects the relatively high population density along the east and
south coasts and the sparse population scattered across the central and northwest regions.
Figure 4-1 Distribution of the 1989-95 cohort of women aged 18 to 23 (N= 17,070) mainly recruited using the internet across Australia (each dot represents one or more participants).
4.1.3 Discussion
There are a number of considerations to take into account when comparing prevalence data
across studies in order to determine the representativeness of the sample, as these may explain
differences in the reported characteristics.
The first is to examine the sample frame used in each of the studies, which for the ALSWH 1989-
95 cohort was limited to women who had a valid Medicare number, whereas the Census data
were based on a survey of the entire population including visitors. Similarly, the AHS survey used a
sample of people living in Australia for at least one year or who had the intention of doing so.
Thus, unlike the 1989-95 cohort of ALSWH, both the Census and AHS data included overseas
students. In 2010, there was an estimated 100,000 women aged 20 to 24 years from overseas
studying in Australia (and since they were still studying they would be categorised as not having
completed a certificate or university level education). Thus the exclusion from the ALSWH cohort

26
of women who were not permanent residents, such as overseas students, may in part explain the
higher proportion in the sample who reported that they had completed a certificate or university
level education.
Similarly, consideration should be given to differences in the mode of survey administration
between studies and the response options available for certain questions. For instance, the AHS
was conducted via a face-to-face interview, whereas the women in the 1989-95 cohort completed
an online questionnaire. This difference may have had a varying degree of impact according to the
nature of the survey question, such as for self-rated health or reported levels of alcohol
consumption. There were also variations in the wording of the question related to physical activity
level and in the available response options which may also limit the comparability of results. The
1989-95 cohort tended to report greater physical activity and lower amounts of alcohol
consumption than women in the AHS. Sometimes the prevalence of a particular characteristic
however, appears not to be substantively influenced by the mode of data collection. For instance,
even though the BMI data for the cohort members were calculated from self-assessed height and
weight whereas for the AHS, height and weight were measured directly, the proportion of those
classified as overweight or obese was essentially the same in both studies.
4.1.4 Summary
Findings confirm that the use of internet and social networking sites, combined with an online
survey, represents a feasible recruitment strategy for a national cohort of young women and
result in a broadly representative sample of the Australian population.

27
Consent to data linkage 4.2
Linking to administrative datasets such as Medicare, Hospital Admissions and Cancer Registries,
can allow researchers to answer important questions such as the extent of health service use, that
are not readily answerable through the use of ALSWH survey data alone. Essentially, it will enable
researchers to provide an overarching and more detailed account of the factors that impact on
the health and wellbeing of young Australian women. Data linkage also reduces participant
burden in this longitudinal study and allows for validation of self-reported data on significant
health events against official records.
The ALSWH survey design for the 1989-95 cohort incorporated a protocol for consent that
contained information about record linkage and sought the participants’ consent for their survey
data to be linked with individual level administrative records. A proportion of survey respondents
did not provide this consent, which was one of the criteria for becoming a cohort participant.
Exploration of any differences between consenters and non-consenters is important to exclude
the possibility that systematic differences may exist. Based on the previous literature (da Silva et
al., 2012; Kho et al., 2009; Knies et al., 2012; Patterson et al., 2013), comparisons were conducted
on a number of variables that have been identified as potentially related to consent refusal: age,
area of residence, income, education, and physical and mental health status. Since many of the
women consented to data linkage but failed to provide further information to meet data linkage
requirements, the number of women in this section varies from the remainder of the report. The
results reported here include survey respondents who provided complete data for the variables of
interest (see Explanatory Notes for Section 4).
Of the 21,620 women for whom complete data were available, 16,757 consented to data linkage
(78%) and 4,863 refused (22%). The proportion of survey respondents who provided consent is at
the upper end of the 39% to 97% range reported in a recent systematic review that examined
consent to data linkage (da Silva et al., 2012). Examination of the variables of interest indicated
that minor differences between consenters and non-consenters existed for age only: women aged
less than 20 years were more likely to refuse consent.
4.2.1 Summary
Most of the women consented to link their survey data with data from external administrative
datasets such as Medicare. Women aged less than 20 years were slightly more likely to refuse
consent.

28
References 4.3
da Silva ME, Coeli CM, Ventura M, Palacios M, Magnanini MM, Camargo TM & Camargo KR Jr.
2012, ‘Informed consent for record linkage: A systematic review’, Journal of Medical Ethics, vol.
38, no. 10, pp. 639-642.
Kho ME, Duffett M, Willison DJ, Cook DJ & Brouwers MC. 2009, ‘Written informed consent and
selection bias in observational studies using medical records: systematic review’, British Medical
Journal, vol. 338, no. b866, doi:10.1136/bmj.b866.
Knies G, Burton J & Sala E. 2012, ‘Consenting to health record linkage: Evidence from a multi-
purpose longitudinal survey of a general population’, BMC Health Services Research, vol. 12, no.
52, doi:10.1186/1472-6963-12-52.
Patterson L, Cruise SM & O’Reilly D. 2013, ‘Bias in consent to health data linkage: Evidence from a
UK cross-sectional survey’, Journal of Epidemiology and Community Health, vol. 67 no. Supp 1, pp.
A43-A44.
29
Then and now characteristics of young women: A 5comparison of women aged 18 to 23 in 1996 and 2013
The period between the ages of 18 and 23 years is a significant time in the lives of women as it
often covers major educational, occupational, family and personal events, and transitions. These
include finishing high school, beginning and possibly completing higher educational qualifications,
beginning formal work as an adult, and juggling work and study commitments. Important personal
events may include partnering, beginning a family, leaving the parental home, and travelling.
This section compares women who were aged 18 to 23 in two time periods. In Section 5.1, data
from the 1996 and 2011 Censuses were used to show how Australian women aged 18 to 23 at
those times compared on key sociodemographic characteristics. Similarly, Section 5.2 compares
the sociodemographic characteristics of ALSWH participants aged 18 to 23 in 1996 (the 1973-78
cohort) and 2013 (the 1989-95 cohort). The sociodemographic characteristics selected were
education, marital status, living arrangements, paid employment, and income management. This
section presents direct comparisons in graphical format between the two cohorts, with data
further stratified by age, education, and area of residence where appropriate.
Details on how each sociodemographic characteristic was measured at the two surveys and how
the data were harmonised if the measurements between cohorts differed, are presented in
Explanatory Notes for Section 5.

30
Comparison of women aged 18 to 23 at the 1996 Census and the 5.12011 Census
Data from the 1996 and 2011 Censuses showed that there have been some changes in Australia’s
population. Almost 17.9 million people responded to the 1996 Census and 4.2% were women
aged 18 to 23. With the general ageing of the population, in 2011, women aged 18 to 23
comprised a slightly smaller percentage of the population, 3.9% of the 21.5 million people
counted at that Census.
Australia has become increasingly urbanised since the 1996 Census (Australian Bureau of Statistics
4102.0, 2008). In addition, a higher proportion of young adults live in major cities than in other
areas of Australia (Australian Bureau of Statistics, 2013).
How women aged 18 to 23 at the 1996 and 2011 Censuses compared on key sociodemographic
characteristics is shown in Table 5-1. There were few changes in country of birth or Indigenous
status. In the 15 years between 1996 and 2011, the proportion of women aged 18 to 23 who were
born in Australia remained at approximately 78%, with around 3% identifying as Indigenous.
While 4% of women aged 18 to 23 came from other countries where English was the main
language, a further 11% came from Asia. The proportion of women aged 18 to 23 who had ever
married halved over the 15 years. The median age of first marriage for women was 28 years in
2011, and it appeared that the delay in marriage may have been due to changing values about
cohabitation and having children before marriage (Australian Bureau of Statistics 4102.0, 2008).
Young women are increasingly attending tertiary educational institutions (Australian Bureau of
Statistics, 2013). As a result, a greater proportion of women aged 18 to 23 obtained a post-school
qualification in 2011 than in 1996 (Table 5-1). These figures were also influenced by the 123%
increase in international students arriving in Australia since 1996 (Australian Bureau of Statistics
3416.0, 2008). In 2011, more than half the women in this age group were studying and more than
80% of these women were engaged in full-time study (comparable data from the 1996 Census
were not available).
One of the biggest changes over the 15 year period occurred in employment status (Table 5-1). In
1996, 32% of women worked full-time and 26% worked part-time. In 2011, these proportions
were reversed with 25% working full-time and 33% working part-time. The high level of part-time
work may have been related to the high proportion of women in this age group studying full-time.

31
Table 5-1 Sociodemographic characteristics of women aged 18 to 23 at the 1996 and 2011 Censuses
Characteristics 1996 Census %
2011 Census %
Country of birth Australia 77.8 78.6 Other English speaking 4.1 4.4 Other Europe 1.6 1.3 Asia 10.6 11.0 Not stated / other 6.0 8.7 Indigenous status Nonindigenous 94.9 91.9 Indigenous 2.7 3.5 Not stated 2.5 4.7 Marital status Married 9.0 4.9 Separated / divorced/ widowed 1.2 0.6 Never married 89.8 94.5 Highest qualification Year 12 or less 69.3 61.0 Certificate / diploma 13.9 21.7 University degree or higher 7.7 9.4 Missing / inadequately described 9.1 7.8 Current employment status Employed full-time 32.4 25.4 Employed part-time 26.4 32.7 Unemployed 10.5 7.7 Total not in labour force 26.3 25.1 Not stated / other 4.0 9.1
Comparison of ALSWH women aged 18 to 23 in 1996 and 2013 5.2
To compare the two cohorts of women, both samples of women aged 18 to 23 were weighted to
the nearest Census (Explanatory Notes for Section 5). The 1996 ALSWH survey was weighted to
the age and area distribution of women aged 18 to 23 in the 1996 Census, and the 2013 survey
was weighted to the same distribution of women aged 18 to 23 in the 2011 Census. (These
variables were used for weighting since in the 1996 ALSWH survey, women were randomly
sampled with deliberate oversampling of women living in rural and remote areas and women
aged 23 were under-represented; in the 2013 ALSWH survey, women aged 18 were under-
represented.)

32
5.2.1 Education
The comparison between the ALSWH cohorts on education is shown in Figure 5-1 (Explanatory
Notes for Section 5). There were notable differences between the cohorts. In 2013, almost twice
the proportion of women aged 18 to 23 had a university education (23% versus 14%) and fewer
women had school level qualifications compared with women aged 18 to 23 in 1996. The
proportion with qualifications less than Year 12 was halved from 15% to 8% (Figure 5-1).
Figure 5-1 Level of educational attainment of women aged 18 to 23 in 1996 and 2013, weighted by age and area of residence.
0% 20% 40% 60% 80% 100%
18-23 years in 2013
18-23 years in 1996
Univers i tyCerti ficate/DiplomaYear 12Less than Year 12

33
Further stratification of level of educational attainment by age and area of residence is presented
in Figure 5-2 and Figure 5-3. Unsurprisingly, older age was associated with higher educational
attainment (Figure 5-2). The percentage of women with university qualifications greatly increased
across the age range. However, the prevalence of women with certificate or diploma
qualifications also increased, nearly doubling from 16% of women aged 18 to 30% of women aged
23.
Figure 5-2 Level of educational attainment of women aged 18 to 23 in 2013, stratified by age.
0% 20% 40% 60% 80% 100%
23 years
22 years
21 years
20 years
19 years
18 years
Univers i tyCerti ficate/DiplomaYear 12Less than Year 12

34
Figure 5-3 shows that women aged 18 to 23 who lived in major cities tended to be more highly
educated than those in regional and remote areas. However, numbers were relatively small in
remote and very remote areas. A quarter of women in major cities reported university level
qualifications, compared with 18% or less for women in regional and remote areas. The
percentage with a Year 12 or equivalent qualification, was similar across the regions; however,
regional and rural areas had higher proportions of women with less than Year 12 qualifications or
with certificate or diploma qualifications.
Figure 5-3 Level of educational attainment of women aged 18 to 23 in 2013, stratified by area of residence.
A similar trend was found in relation to women who reported they were currently studying [data
not shown], with a much higher proportion of participants in 2013 reporting they were currently
studying than participants in 1996. In 1996, approximately one-half of women aged 18 to 23
studied either full or part-time. In 2013, this proportion had risen to approximately two-thirds.
The percentage of women in 2013 who were studying was highest (around three quarters) in
those with Year 12 or university level qualifications. This percentage dropped to one-third for
women with less than Year 12 qualifications and half of those with a certificate or diploma.
0% 20% 40% 60% 80% 100%
Remote or very remote
Outer regional
Inner regional
Major ci ties
Univers i tyCerti ficate/DiplomaYear 12Less than Year 12

35
5.2.2 Marital status
The most notable difference between women aged 18 to 23 in 2013 compared with those in 1996
was the doubling of the proportion who were living in a de facto relationship (23% versus 12%
respectively) and a more than halving of the proportion who were married from 10% to 3% (see
Figure 5-4 and Explanatory Notes for Section 5).
Figure 5-4 Marital status of women aged 18 to 23 in 1996 and 2013, weighted by age and area of residence.
5.2.3 Living arrangements
The comparison between the cohorts regarding living arrangements is illustrated by a series of
graphs showing the proportions living with parents (Explanatory Notes for Section 5). Data on
women living with partners, living alone, and living with children are not graphically presented but
are summarised in text.
There was surprisingly little difference between the two cohorts in the proportions of those living
with parents (49% in 1996 and 50% in 2013) and those living with partners (23% in 1996 and 24%
in 2013). Around 6% and 4% of women lived alone in 1996 and 2013 respectively. The largest
0% 20% 40% 60% 80% 100%
18-23 years in 2013
18-23 years in 1996
Separated/divorced/widowedNever marriedDe factoMarried

36
difference was between the percentages of women aged 18 to 23 living with children, which
declined from 9% in 1996 to 5% in 2013.
Further stratification of the proportion of women in 2013 living with parents by age, area and
education is presented in Figure 5-5 , Figure 5-6 and Figure 5-7. Unsurprisingly, the percentage of
women who were living with their parents tended to decline with age, from 71% at age 18 to one-
third (32%) by age 23 (Figure 5-5).
Figure 5-5 Percentage of women aged 18 to 23 in 2013 living with parents, stratified by age.
0% 20% 40% 60% 80% 100%
23 years
22 years
21 years
20 years
19 years
18 years
YesNo

37
Over half of young women in 2013 from urban areas lived with parents (Figure 5-6). This dropped
to between 36% and 43% of women from regional areas and 22% of those from remote and very
remote areas. Numbers were relatively small in the latter areas.
Figure 5-6 Percentage of women aged 18 to 23 in 2013 living with parents, stratified by area of residence.
0% 20% 40% 60% 80% 100%
Remote or very remote
Outer regional
Inner regional
Major ci ties
YesNo

38
The percentage of women living with parents in 2013 was similar (at 42% to 45%) for those with
post-school qualifications and qualifications less than Year 12 (Figure 5-7). However, a greater
percentage of women with Year 12 or equivalent qualifications reported living with parents (58%),
possibly reflecting the fact that this group also had the highest percentage (75%) of women still
studying full or part-time.
Figure 5-7 Percentage of women aged 18 to 23 in 2013 living with parents, stratified by level of educational attainment.
5.2.4 Paid employment
These data are not graphed because the questions in the 1996 and 2013 surveys were asked
differently (Explanatory Notes for Section 5). The design of this question for the 1996 cohort
meant that some participants who were employed but considered that another activity (e.g.
studying, caring or volunteer work) was their main activity may not have responded, thus
underestimating the proportion of women undertaking paid employment. Nevertheless, a
summary comparison of the data suggests that almost half of women aged 18 to 23 in 1996 were
not in paid work compared with less than a quarter of those in 2013. When data on employment
0% 20% 40% 60% 80% 100%
Univers i ty
Certi ficate/Diploma
Year 12
Less than Year 12
YesNo

39
among women in 2013 were further analysed by educational qualification, a clear gradient
existed. The percentage of women in paid employment by level of educational attainment was
86% for those with university qualifications, 79% with certificate or diploma, 77% with Year 12 or
equivalent and 54% for women with less than Year 12 qualifications.
When analysed across the age range, the percentage of women in paid employment increased
from 69% of women aged 18 to 81% of women aged 23. When analysed by area of residence, the
percentage of women in paid employment was 80% in major cities, 72% in inner regional, 74% in
outer regional areas and 80% in remote or very remote areas (based on small numbers).

40
5.2.5 Ability to manage on income
The comparison between women aged 18 to 23 in 1996 and 2013 on their ability to manage on
their income is shown in Figure 5-8 (Explanatory Notes for Section 5). The figure presents the
proportion who reported that it was “easy”, “not too bad”, “difficult some of the time”, “difficult
all the time” or “impossible” to manage on their available income. The percentages for 2013 were
then further stratified by age, area, and education. A higher percentage of women aged 18 to 23
in 2013 reported having some level of difficulty managing on their income compared with women
in the same age group in 1996 (61% and 51% respectively).
Figure 5-8 Ability to manage on available income among women aged 18 to 23 in 1996 and 2013, weighted by age and area of residence.
0% 20% 40% 60% 80% 100%
18-23 years in 2013
18-23 years in 1996
EasyNot too bad
Difficul t some timesDi fficul t a l l the timeImposs ible

41
Further stratifications of the figures for women in 2013 by age, area and education are presented
in Figure 5-9, Figure 5-10 and Figure 5-11. The prevalence of women reporting significant difficulty
managing on income (“difficult all of the time”, “impossible”) tended to decline with age (Figure
5-9): women aged 18 and 19 had the highest percentage reporting significant difficulty (over one-
quarter) and women aged 22 and 23 had the lowest (about 22%).
Figure 5-9 Ability to manage on available income among women aged 18 to 23 in 2013, stratified by age.
0% 20% 40% 60% 80% 100%
23 years
22 years
21 years
20 years
19 years
18 years
EasyNot too badDifficul t some timesDi fficul t a l l the timeImposs ible
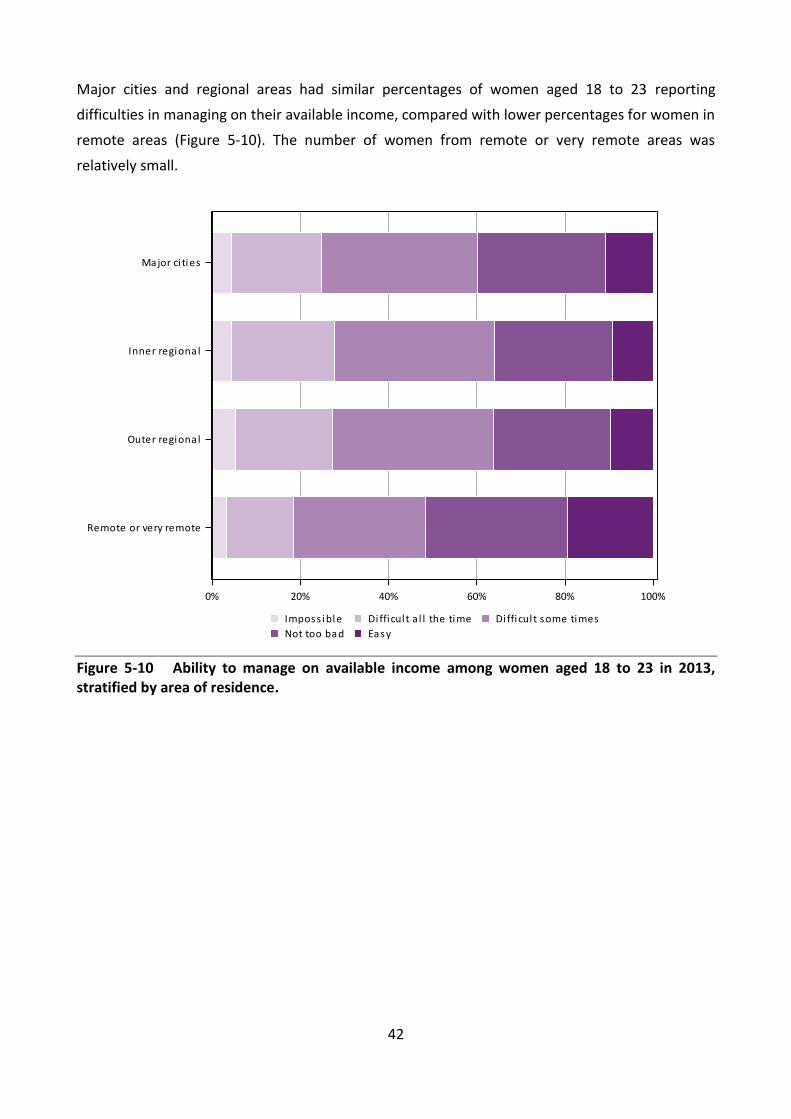
42
Major cities and regional areas had similar percentages of women aged 18 to 23 reporting
difficulties in managing on their available income, compared with lower percentages for women in
remote areas (Figure 5-10). The number of women from remote or very remote areas was
relatively small.
Figure 5-10 Ability to manage on available income among women aged 18 to 23 in 2013, stratified by area of residence.
0% 20% 40% 60% 80% 100%
Remote or very remote
Outer regional
Inner regional
Major ci ties
EasyNot too bad
Difficul t some timesDi fficul t a l l the timeImposs ible

43
Women with qualifications less than Year 12 had the highest percentage of reported difficulties
with income, with 38% of these women finding it impossible or difficult all of the time to manage
on their income (Figure 5-11). This compares with 29% of women with a certificate or diploma and
19% of women with a university qualification who reported finding it impossible or difficult all of
the time to manage on their income.
Figure 5-11 Ability to manage on available income among women aged 18 to 23 in 2013, stratified by level of educational attainment.
0% 20% 40% 60% 80% 100%
Univers i ty
Certi ficate/Diploma
Year 12
Less than Year 12
EasyNot too bad
Difficul t some timesDi fficul t a l l the timeImposs ible

44
References 5.4
Australian Bureau of Statistics. 2008, 4102.0 Australian Social Trends, ABS, Canberra.
Australian Bureau of Statistics. 2008, Perspectives on migrants 2007, cat. No. 3416.0, ABS,
Canberra.
Australian Bureau of Statistics. 2013, 4102.0. Australian Social Trends April 2013. Young adults:
then and now. ABS, Canberra.
Summary 5.3
This section has described how women aged 18 to 23 in two time periods differed on key
sociodemographic characteristics. Both Census data and data from the ALSWH were presented
and summarised. Important differences were apparent.
Comparisons of Census data showed women aged 18 to 23 in 2011 were less likely to be
married, were better educated and were more likely to be working part-time rather than
full-time and to be in paid work overall compared with women aged 18 to 23 in 1996.
Comparisons of women aged 18 to 23 in the ALSWH 1973-78 and 1989-95 cohorts showed
key differences in marital status, education and employment.
Compared with women aged 18 to 23 in 1996, women in 2013 were more likely to be in a
de facto relationship and less likely to be married.
For educational attainment of women aged 18 to 23 in 2013, analysis by age and area of
residence showed that the increase in the proportion with higher educational
qualifications was strongly related to age and almost entirely due to an increased
prevalence of women with university level education. Level of educational attainment was
directly proportional to participation in paid work. Also, women in major cities were more
educated, particularly at university level, than women in regional and remote areas.
For employment, more women were in paid work in 2013 than 1996. The data suggested
an increase in part-time work by women aged 18 to 23 at the expense of full-time work.
Women aged 18 to 23 in 2013 rarely differed from women in 1996 on their living
arrangements, except when it came to living with children. A similar proportion of women
from both cohorts lived with parents (about half) or lived with partners (about one-
quarter). For women living with parents in 2013, differences were found by age, area of
residence and education.

45
Risk factors 6
Several health behaviours and lifestyle factors have been identified as increasing the risk of poor
health. These factors include:
tobacco use;
excess alcohol consumption;
illicit drug use;
lack of physical activity;
overweight and obesity.
Information about differences in health risk factors among women aged 18 to 23 in 1996 (1973-78
cohort) and women of the same age in 2013 (1989-95 cohort) provides insights on how women’s
health is likely to change over time.
Australia has had a national drug strategy covering tobacco, alcohol and other drugs since 1985.
The aim of the National Drug Strategy 2010-2015 is to minimise harm using three strategies:
demand reduction, supply reduction and harm reduction (Ministerial Council on Drug Strategy,
2011). Demand reduction aims to stop or postpone the uptake of drugs and help people reduce
and recover from misuse of drugs. The aims of supply reduction are to stop or reduce the supply
of illegal drugs and control availability of legal drugs. Harm reduction includes strategies to reduce
the adverse health and other effects of drug use.

46
Tobacco use 6.1From 1996 to 2013, the percentage of women aged 18 to 23 who had never smoked increased
from 53% to 63% and the percentage who had smoked and then quit also increased, from 15% to
18% (Figure 6-1). Consequently there was a substantial decline in the percentage of current
smokers from 32% to 19%. The ALSWH findings in 2013 were very similar to the smoking rates for
women in this age group reported from other national surveys: 16% were categorised as current
smokers in the Australian Health Survey in 2011-12 and 19% in the National Drug Strategy
Household Survey in 2010.
Figure 6-1 Smoking status of women aged 18 to 23 in 1996 and 2013, weighted by age and area of residence.
0% 20% 40% 60% 80% 100%
18-23 years in 2013
18-23 years in 1996
Current smokerEx-smokerNever smoked

47
6.1.1 Tobacco use among women aged 18 to 23 in 2013 by sociodemographic characteristics
For women aged 18 to 23 in 2013, Figure 6-2 shows that across the age range 18 to 23, more
women tried smoking (so the percentage of never smokers decreased slightly with age), but the
percentage of ex-smokers increased and the percentage of current smokers decreased with age.
Less than 1% were heavy smokers (i.e., 20 cigarettes per day or more).
Figure 6-2 Smoking status of women aged 18 to 23 in 2013, stratified by age.
0% 20% 40% 60% 80% 100%
23 years
22 years
21 years
20 years
19 years
18 years
Smoke >=20 daySmoke 10-19 daySmoke <10 dayEx-smokerNever smoked

48
The patterns of smoking were very similar across major cities and inner and outer regional areas
(Figure 6-3). In remote and very remote areas however, a higher percentage of women in this age
group were current smokers (23%) than in other areas, especially for heavy smoking (i.e., 20
cigarettes per day or more; 3%). These results are based on small numbers of women in remote
and very remote areas.
Figure 6-3 Smoking status of women aged 18 to 23, stratified by area of residence.
0% 20% 40% 60% 80% 100%
Remote/Very Remote
Outer Regional
Inner Regional
Major Ci ties
Smoke >=20 daySmoke 10-19 day
Smoke <10 dayEx-smokerNever smoked

49
Large differences in smoking behaviour were evident across educational groups (Figure 6-4). The
percentage of women aged 18 to 23 with university qualifications who were current smokers
(10%) was less than half that for women who had certificate or diploma qualifications. Likewise,
the percent with Year 12 qualifications who were current smokers was less than half that for
women with less than Year 12 education. While these data do not take account of age
differences between the groups, based on Figure 6-2 the results are unlikely to be affected
substantially. Rather, the results point to socioeconomic differences in the prevalence of smoking
among these young women.
Figure 6-4 Smoking status of women aged 18 to 23 in 2013, stratified by level of educational attainment.
0% 20% 40% 60% 80% 100%
Univers i ty
Certi ficate/Diploma
Year 12
Less than Year 12
Smoke >=20 daySmoke 10-19 day
Smoke <10 dayEx-smokerNever smoked
50
6.1.2 Summary
Reductions in tobacco smoking have been the goals of successive governments for decades. All of
the well-established strategies of education, taxation and regulation have been employed to
reduce this behaviour which remains one of the major contributors to the burden of disease in
Australia (AIHW, Begg et. al., 2007). The results shown here provide substantial evidence of the
success of these long-term strategies. They bode well for future reductions in disease burden.
However, the data also show where these interventions need to be targeted: among less
educated young women and those living in remote parts of Australia.

51
Alcohol consumption 6.2
In Australia, alcohol is commonly consumed at a wide range of social activities, normally at levels
that are unlikely to cause adverse effects. However, a proportion of the population drinks at levels
that might increase the risk of alcohol-related injury, illness or death.
In 2013 women were asked at what age they first had a standard drink of alcohol. Comparison
figures were not available for women aged 18 to 23 in 1996. The majority of women aged 18 to 23
in 2013 had their first standard drink of alcohol before they were 18 (Figure 6-5). With the
exception of 3% of women who had never had a standard drink of alcohol, only 2% of women had
their first drink after the age of 18. In the 2010 National Drug Strategy Household Survey, 5% of
women indicated they had never had a full serve of alcohol and a further 5% had their first drink
after the age of 18.
Figure 6-5 Age at which women aged 18 to 23 in 2013 first drank a standard drink of alcohol, weighted by age and area of residence.
Several measures relate to alcohol consumption. Women aged 18 to 23 in 1996 and 2013 were
asked to report their usual quantity and frequency of alcohol consumption, as well as how often
they drank five or more drinks on one occasion. Quantity and frequency were used to estimate
the average alcohol consumption per day.
0
5
10
15
20
25
Neverdrank
alcohol
12 orless
13 14 15 16 17 18 19 20 ormore
per
cen
tage

52
6.2.1 Alcohol consumption among women aged 18 to 23 in 1996 and 2013
There were small differences in the frequency of alcohol consumption between women aged 18
to 23 in 2013 and the same age group in 1996 (Figure 6-6). In 2013, 8% of women did not drink,
two thirds (66%) drank less than weekly and 26% drank weekly or more, compared with 10%, 61%
and 29% respectively for women in this age group in 1996. The 2013 figures are also similar to
other recent national surveys. Data from the 2011-12 AHS for women of the same age showed
that 13% of women aged 18 to 23 reported not drinking in the last 12 months, 53% drank less
than weekly and 32% drank weekly or more, while the National Drug Strategy Household Survey
2010 indicated that 16% of women in this age group had not had a drink in the last 12 months,
45% drank less than weekly and 37% drank weekly or more.
Figure 6-6 Frequency of alcohol consumption for women aged 18 to 23 in 1996 and 2013, weighted by age and area of residence.
0% 20% 40% 60% 80% 100%
18-23 years in 2013
18-23 years in 1996
5 or more days a week3 or 4 days a week1 or 2 days a week
Less than once a weekLess than once a monthNever drink a lcohol

53
Women reported the number of standard drinks they usually had on days when they drank
alcohol. Findings for women aged 18 to 23 in 2013 were similar to those for women of the same
age in 1996 (Figure 6-7). One third (31%-32%) of women in this age group usually drank one or
two drinks, 29%-31% drank three or four drinks and almost 30% drank five or more drinks. These
figures also compare with the 2010 National Drug Strategy Household Survey which showed that
16% of women in this age group had not had a drink in the last 12 months, 22% usually drank one
or two drinks, 22% drank three or four drinks and 38% drank five or more drinks. Equivalent data
were not available from the AHS.
Figure 6-7 Quantity of alcohol usually consumed on a drinking day by women aged 18 to 23 in 1996 and 2013, weighted by age and area of residence.
Australia introduced alcohol guidelines in 1992 (National Health and Medical Research Council
[NHMRC], 1992), followed by revised guidelines in 2001 (NHMRC, 2001) and 2009 (NHMRC, 2009).
In 2009, the first guideline was designed to reduce alcohol-related harm over the lifetime and
stated, ‘For healthy men and women, drinking no more than two standard drinks on any day
0% 20% 40% 60% 80% 100%
18-23 years in 2013
18-23 years in 1996
9 or more drinks5 to 8 drinks
3 or 4 drinks1 or 2 drinksNever drink a lcohol

54
reduces the lifetime risk of harm from alcohol-related disease or injury’ (NHMRC, 2009, p. 2).
These guidelines are reported in the 2010 National Drug Strategy Household Survey Report as an
average of no more than two standard drinks per day, which is consistent with the earlier
guidelines. The same calculation was used for this report. Average alcohol consumption was
calculated using the usual number of standard drinks consumed on a drinking day and the usual
frequency of consuming alcohol. Average alcohol consumption patterns for women aged 18 to 23
were similar in 1996 and 2013 (Figure 6-8). More than 75% of women aged 18 to 23 drank on
average up to one standard drink a day, and up to 10% consumed on average between one and
two standard drinks a day. Up to 5% of young women exceeded the lifetime risk guideline by
consuming more than two standard drinks a day. AHS data were not available; however, data
from the 2010 National Drug Strategy Household Survey indicated that 14% abstained, 68% drank
at low lifetime risk of alcohol-related harm and 18% exceeded the lifetime risk guideline by
consuming more than two standard drinks a day.
Figure 6-8 Average number of standard drinks consumed per day by women aged 18 to 23 in 1996 and 2013, weighted by age and area of residence.
0% 20% 40% 60% 80% 100%
18-23 years in 2013
18-23 years in 1996
More than 2 drinks per day1 to 2 drinks per day
Up to 1 drink per dayNever drink a lcohol
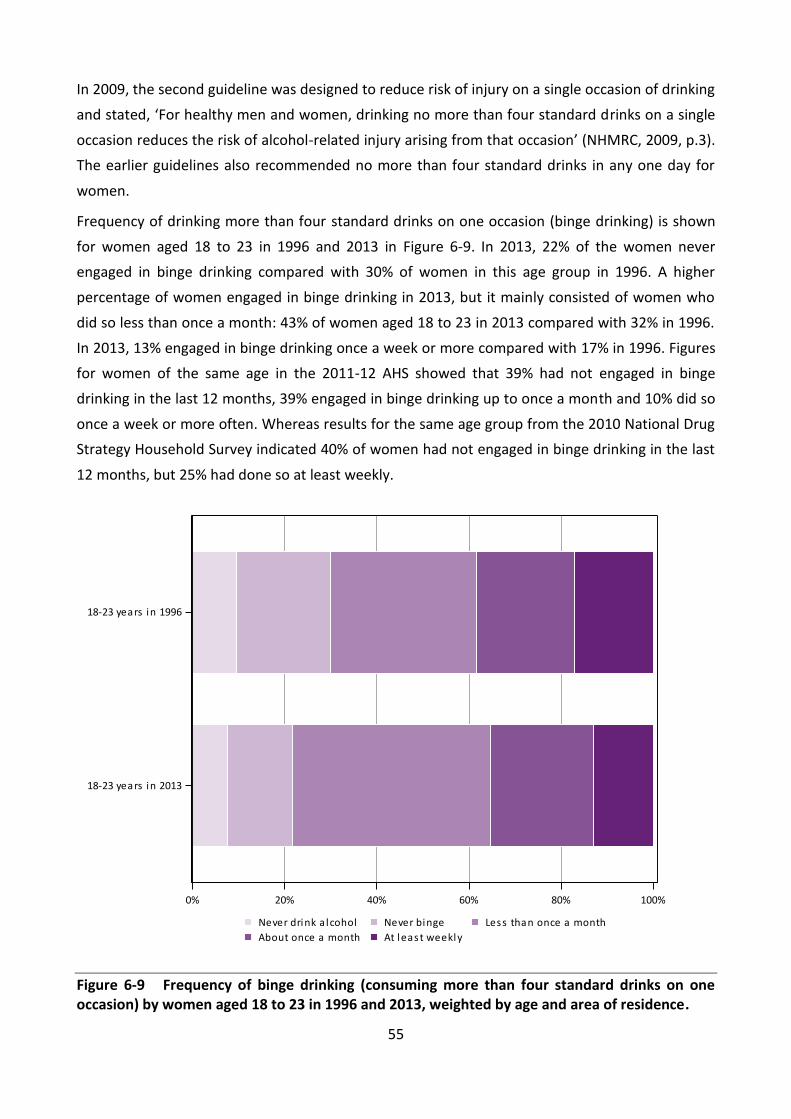
55
In 2009, the second guideline was designed to reduce risk of injury on a single occasion of drinking
and stated, ‘For healthy men and women, drinking no more than four standard drinks on a single
occasion reduces the risk of alcohol-related injury arising from that occasion’ (NHMRC, 2009, p.3).
The earlier guidelines also recommended no more than four standard drinks in any one day for
women.
Frequency of drinking more than four standard drinks on one occasion (binge drinking) is shown
for women aged 18 to 23 in 1996 and 2013 in Figure 6-9. In 2013, 22% of the women never
engaged in binge drinking compared with 30% of women in this age group in 1996. A higher
percentage of women engaged in binge drinking in 2013, but it mainly consisted of women who
did so less than once a month: 43% of women aged 18 to 23 in 2013 compared with 32% in 1996.
In 2013, 13% engaged in binge drinking once a week or more compared with 17% in 1996. Figures
for women of the same age in the 2011-12 AHS showed that 39% had not engaged in binge
drinking in the last 12 months, 39% engaged in binge drinking up to once a month and 10% did so
once a week or more often. Whereas results for the same age group from the 2010 National Drug
Strategy Household Survey indicated 40% of women had not engaged in binge drinking in the last
12 months, but 25% had done so at least weekly.
Figure 6-9 Frequency of binge drinking (consuming more than four standard drinks on one occasion) by women aged 18 to 23 in 1996 and 2013, weighted by age and area of residence.
0% 20% 40% 60% 80% 100%
18-23 years in 2013
18-23 years in 1996
At least weeklyAbout once a month
Less than once a monthNever bingeNever drink a lcohol
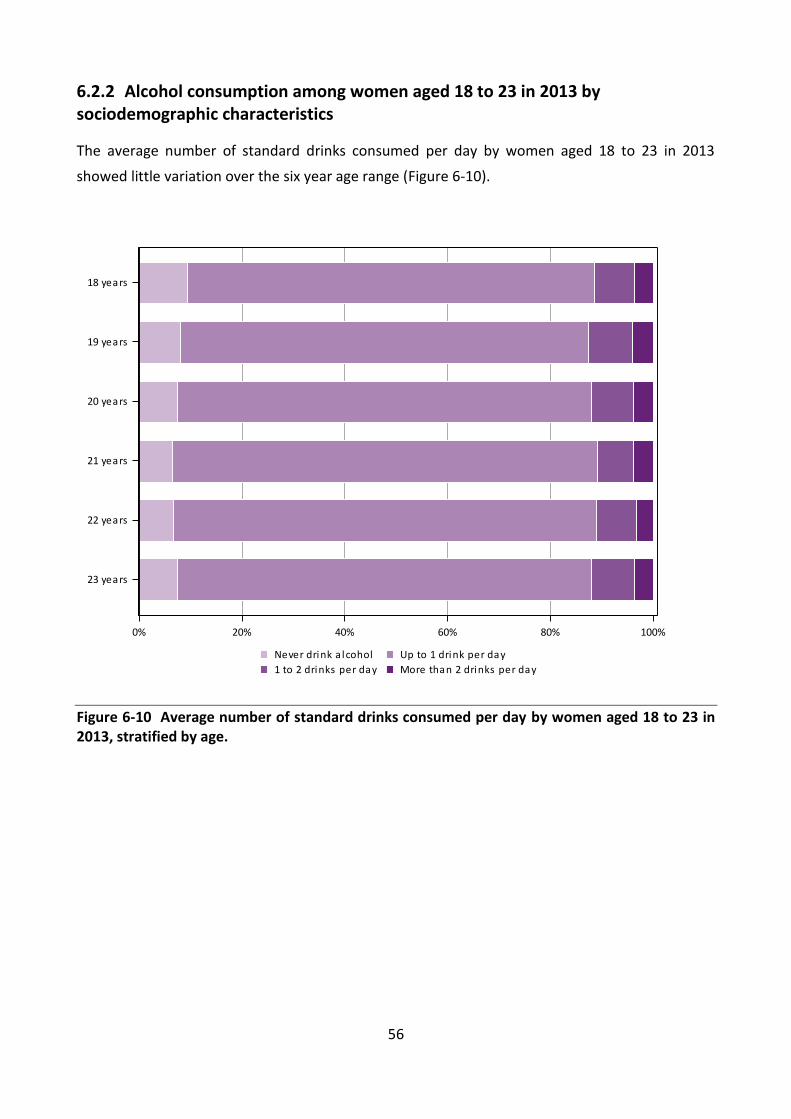
56
6.2.2 Alcohol consumption among women aged 18 to 23 in 2013 by sociodemographic characteristics
The average number of standard drinks consumed per day by women aged 18 to 23 in 2013
showed little variation over the six year age range (Figure 6-10).
Figure 6-10 Average number of standard drinks consumed per day by women aged 18 to 23 in 2013, stratified by age.
0% 20% 40% 60% 80% 100%
23 years
22 years
21 years
20 years
19 years
18 years
More than 2 drinks per day1 to 2 drinks per day
Up to 1 drink per dayNever drink a lcohol

57
Women living in remote areas (small numbers) were the most likely to be drinkers and were more
likely to drink outside the recommended guidelines (Figure 6-11).
Figure 6-11 Average number of standard drinks consumed per day by women aged 18 to 23 in 2013, stratified by area of residence.
0% 20% 40% 60% 80% 100%
Remote or very remote
Outer regional
Inner regional
Major ci ties
More than 2 drinks per day1 to 2 drinks per day
Up to 1 drink per dayNever drink a lcohol

58
There was little variation in the average alcohol consumption categories of women aged 18 to 23
according to their level of educational attainment, except that women with less than a Year 12
education were less likely to consume alcohol (Figure 6-12).
Figure 6-12 Average number of standard drinks consumed per day by women aged 18 to 23 in 2013, stratified by level of educational attainment.
0% 20% 40% 60% 80% 100%
Univers i ty
Certi ficate/Diploma
Year 12
Less than Year 12
More than 2 drinks per day1 to 2 drinks per day
Up to 1 drink per dayNever drink a lcohol

59
Drinking more than four drinks on a single occasion (binge drinking) increases the risk of alcohol-
related injury. Few differences were observed in the frequency of binge drinking by women aged
18 to 23 across the six year age range (Figure 6-13).
Figure 6-13 Frequency of binge drinking (consuming more than four standard drinks on one occasion) by women aged 18 to 23 in 2013, stratified by age.
0% 20% 40% 60% 80% 100%
23 years
22 years
21 years
20 years
19 years
18 years
At least weeklyAbout once a month
Less than once a monthNever bingeNever drink a lcohol

60
Women living in remote and very remote areas were more likely to binge drink once a week or
more often (22%; Figure 6-14). However, there was a small number of women in these areas.
Figure 6-14 Frequency of binge drinking (consuming more than four standard drinks on one occasion) by women aged 18 to 23 in 2013, stratified by area of residence.
0% 20% 40% 60% 80% 100%
Remote or very remote
Outer regional
Inner regional
Major ci ties
At least weeklyAbout once a month
Less than once a monthNever bingeNever drink a lcohol

61
Less educated women were least likely to binge drink (Figure 6-15). Binge drinking at least once a
month was reported by 37% of women with university qualifications. There were few differences
between women with more education.
Figure 6-15 Frequency of binge drinking (consuming more than four standard drinks on one occasion) by women aged 18 to 23 in 2013, stratified by level of educational attainment.
0% 20% 40% 60% 80% 100%
Univers i ty
Certi ficate/Diploma
Year 12
Less than Year 12
At least weeklyAbout once a month
Less than once a monthNever bingeNever drink a lcohol

62
6.2.3 Summary
Alcohol consumption was similar for women aged 18 to 23 in 1996 and 2013. In 1996, women
aged 18 to 23 were less likely to drink or to binge drink than women aged 18 to 23 in 2013.
Women aged 18 to 23 in 1996 who did drink were more likely to drink outside the guidelines. It is
difficult to tell whether these differences were generational or due to differences in policy
(negligible), knowledge about alcohol guidelines or differences in the samples and sampling
methodology.
For women aged 18 to 23 in 1996 and 2013:
more than 90% of women reported drinking alcohol;
fewer than one in 20 women consumed more than two drinks a day on average;
more than one third engaged in binge drinking once a month or more often.
For women aged 18 to 23 in 2013:
most women consumed their first standard drink of alcohol before the age of 18;
almost three-quarters of the women drank less than weekly;
thirteen percent of women engaged in binge drinking at least weekly;
less educated women were least likely to binge drink.
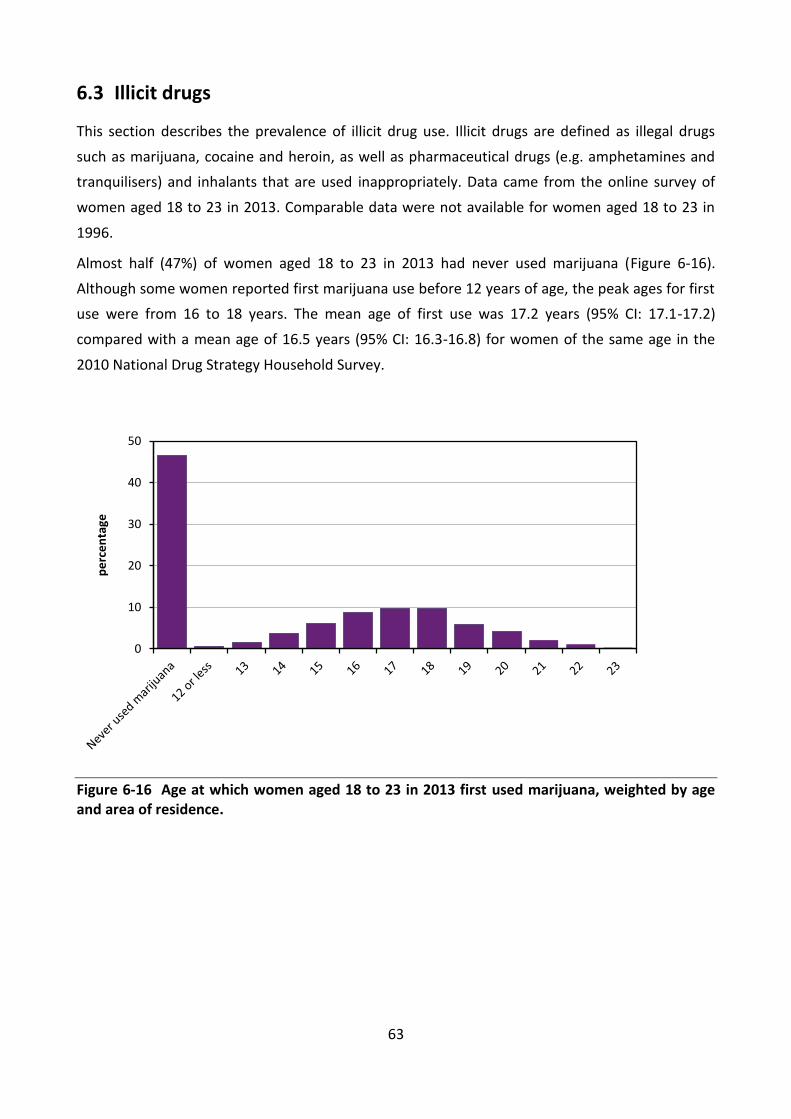
63
Illicit drugs 6.3
This section describes the prevalence of illicit drug use. Illicit drugs are defined as illegal drugs
such as marijuana, cocaine and heroin, as well as pharmaceutical drugs (e.g. amphetamines and
tranquilisers) and inhalants that are used inappropriately. Data came from the online survey of
women aged 18 to 23 in 2013. Comparable data were not available for women aged 18 to 23 in
1996.
Almost half (47%) of women aged 18 to 23 in 2013 had never used marijuana (Figure 6-16).
Although some women reported first marijuana use before 12 years of age, the peak ages for first
use were from 16 to 18 years. The mean age of first use was 17.2 years (95% CI: 17.1-17.2)
compared with a mean age of 16.5 years (95% CI: 16.3-16.8) for women of the same age in the
2010 National Drug Strategy Household Survey.
Figure 6-16 Age at which women aged 18 to 23 in 2013 first used marijuana, weighted by age and area of residence.
0
10
20
30
40
50
pe
rce
nta
ge

64
The prevalence of use of other illicit drugs by women aged 18 to 23 in 2013 was lower than that
for marijuana (Figure 6-17). Twenty-nine percent of the women had used other illicit drugs, with
mean age at first use of 18.0 years (95% CI: 17.9-18.0).
Figure 6-17 Age at which women aged 18 to 23 in 2013 first used other illicit drugs (i.e. excluding marijuana), weighted by age and area of residence.
0
10
20
30
40
50
60
70
80
Neverusedillicitdrugs
12 orless
13 14 15 16 17 18 19 20 21 22 23
pe
rce
nta
ge

65
Around 30% of women aged 18 to 23 had used marijuana within the last twelve months (Figure
6-18), with another 23% reporting they had last used marijuana more than 12 months ago. The
use for other illicit drugs was about half this prevalence, at 17% and 11% respectively. These
figures were comparable with data collected from women in the same age range in the 2010
National Drug Strategy Household Survey that indicated 20% had used marijuana and 15% had
used at least one of 14 other illicit drugs in the last 12 months.
Figure 6-18 Use of marijuana and other illicit drugs by women aged 18 to 23 in 2013, weighted by age and area of residence.
0% 20% 40% 60% 80% 100%
Other i l l i ci t drugs
Mari juana
In las t 12 months , more than 12 months agoIn las t 12 months
More than 12 months agoNever

66
6.3.1 Marijuana use among women aged 18 to 23 in 2013 by sociodemographic characteristics
While the majority (58%) of women aged 18 had never used marijuana, this figure dropped to
39% among those aged 23 (Figure 6-19). Across the age range, more than one in four women had
used marijuana within the last 12 months, with a peak of one in three (33%) occurring at the age
of 20. However, many women did not continue to use marijuana: 12% of women had last used
marijuana more than 12 months ago at 18 years of age and this figure rose almost threefold to
34% at 23 years of age.
Figure 6-19 Time of last marijuana use among women aged 18 to 23 in 2013, stratified by age.
0% 20% 40% 60% 80% 100%
23 years
22 years
21 years
20 years
19 years
18 years
In las t 12 months , more than 12 months agoIn las t 12 months
More than 12 months agoNever

67
Women living in major cities were more likely to have ever used marijuana (55%) and to have
used marijuana within the last 12 months (32%) than women living in other areas (Figure 6-20).
Figure 6-20 Time of last marijuana use among women aged 18 to 23 in 2013, stratified by area of residence.
0% 20% 40% 60% 80% 100%
Remote or very remote
Outer regional
Inner regional
Major ci ties
In las t 12 months , more than 12 months agoIn las t 12 months
More than 12 months agoNever

68
Women who had attained less than Year 12 educational qualifications had the highest percentage
(69%) of those who had tried marijuana and had used it in the last 12 months (35%;Figure 6-21).
Figure 6-21 Time of last marijuana use among women aged 18 to 23 in 2013, stratified by level of educational attainment.
0% 20% 40% 60% 80% 100%
Univers i ty
Certi ficate/Diploma
Year 12
Less than Year 12
In las t 12 months , more than 12 months agoIn las t 12 months
More than 12 months agoNever
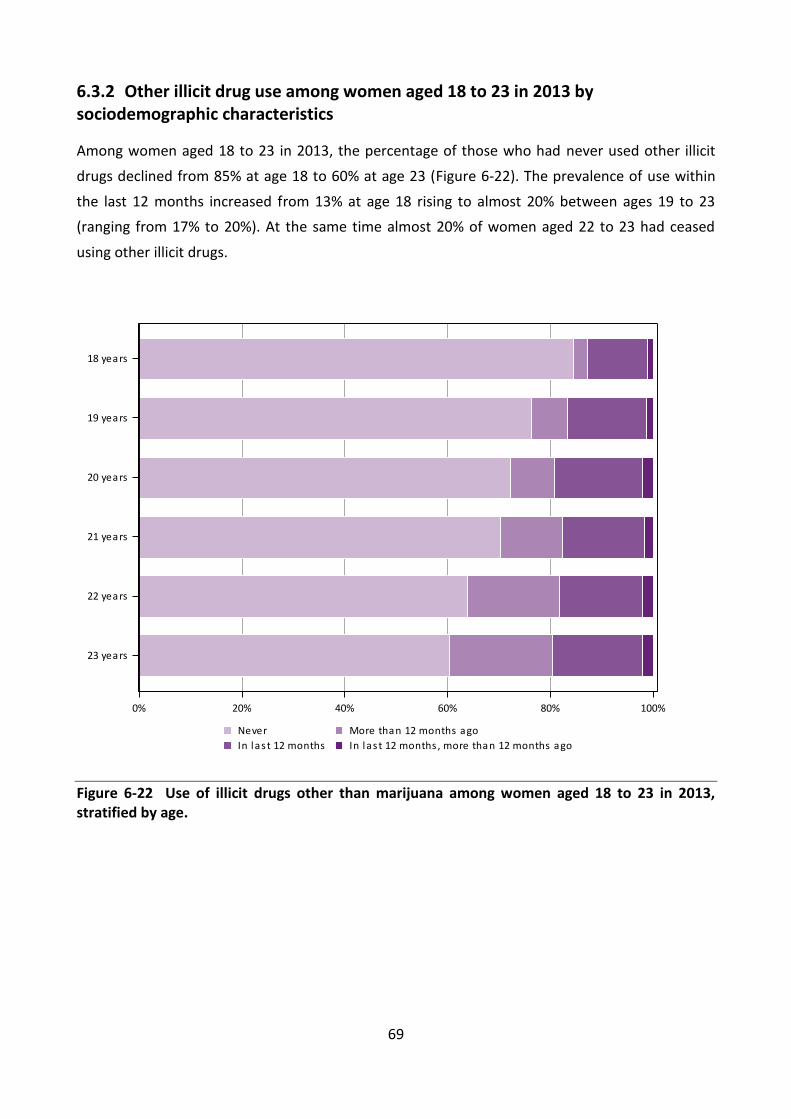
69
6.3.2 Other illicit drug use among women aged 18 to 23 in 2013 by sociodemographic characteristics
Among women aged 18 to 23 in 2013, the percentage of those who had never used other illicit
drugs declined from 85% at age 18 to 60% at age 23 (Figure 6-22). The prevalence of use within
the last 12 months increased from 13% at age 18 rising to almost 20% between ages 19 to 23
(ranging from 17% to 20%). At the same time almost 20% of women aged 22 to 23 had ceased
using other illicit drugs.
Figure 6-22 Use of illicit drugs other than marijuana among women aged 18 to 23 in 2013, stratified by age.
0% 20% 40% 60% 80% 100%
23 years
22 years
21 years
20 years
19 years
18 years
In las t 12 months , more than 12 months agoIn las t 12 months
More than 12 months agoNever

70
Use of illicit drugs other than marijuana within the last 12 months by this age group of young
women was more prevalent among those living in major cities (19%) and remote areas (20%;
small numbers) than in regional areas (13 to 14%; Figure 6-23).
Figure 6-23 Use of illicit drugs other than marijuana among women aged 18 to 23 in 2013, stratified by area of residence.
0% 20% 40% 60% 80% 100%
Remote or very remote
Outer regional
Inner regional
Major ci ties
In las t 12 months , more than 12 months agoIn las t 12 months
More than 12 months agoNever

71
Women with less than Year 12 qualifications were more likely to have tried illicit drugs other than
marijuana (44%), than women with a certificate or diploma (36%), those with Year 12 (23%) and
university qualifications (27%). More than 20% of women with less than Year 12 qualifications, a
certificate or diploma had used other illicit drugs in the last 12 months; however, almost as many
women in the less than Year 12 qualifications group had also ceased using these drugs. (Figure
6-24).
Figure 6-24 Use of illicit drugs other than marijuana among women aged 18 to 23 in 2013, stratified by level of educational attainment.
0% 20% 40% 60% 80% 100%
Univers i ty
Certi ficate/Diploma
Year 12
Less than Year 12
In las t 12 months , more than 12 months agoIn las t 12 months
More than 12 months agoNever

72
6.3.3 Summary
Almost twice as many women had tried marijuana as other illicit drugs.
Women first tried marijuana and other illicit drugs in their teens.
Most women did not continue using marijuana or other illicit drugs.
Marijuana was more commonly tried and used:
o in major cities;
o by less educated women.
Other illicit drugs were more commonly tried and used:
o in major cities and remote areas;
o by less educated women.
73
Physical Activity 6.4
The new Australian physical activity guidelines suggest that all adults should accumulate 150 to
300 minutes (2 ½ to 5 hours) of moderate intensity physical activity or 75 to 150 minutes (1 ¼ to 2
½ hours) of vigorous intensity physical activity or an equivalent combination of both moderate
and vigorous activities, each week (Brown et. al., 2012). The overall weekly physical activity level
can be calculated using an algorithm developed for the United States guidelines (Brown et. al.,
2012; Powell et. al., 2011) based on generic Metabolic Equivalent (MET) values of 3.33 for walking
and moderate activity, and 6.66 for vigorous activity, and a cut point of 500 MET.mins/week (150
minutes x 3.33 METs, or 75 minutes x 6.66 METs or a combination of moderate and vigorous
activities). Based on this algorithm, it is estimated that almost 70% of women aged 18 to 23 in
2013 met the lower recommendation in the new Australian guidelines. Almost half (48%) met the
upper recommendation of 1000 MET.min/week (300 minutes x 3.33 METs, or 150 minutes x 6.66
METs, or a combination). Only 6.6% reported doing no physical activity and almost one quarter
reported doing some activity, but insufficient to meet the 500 MET.min/week threshold.
While the activity questions asked in the first survey (2013) of the 1989-95 cohort differed from
those asked at baseline (1996) for the 1973-78 cohort, they were the same as the questions asked
in subsequent surveys of the 1973-78 cohort (see Explanatory Notes for Section 6). Thus the
physical activity levels of women aged 22 to 23 in 2000 (N=3515; 1973-78 cohort second survey),
can be compared with women in the same two year age range in 2013 (N=5791; 1989-95 cohort
baseline survey). Women at both time points were categorised as: ‘inactive’ (<33.3
MET.mins/week); ‘low’ (reporting some activity but not meeting guidelines, 33.3 - <500
MET.mins/week); ‘moderate’ (500 - <1000 MET.mins/week); or ‘high’ (≥1000 MET.mins/week).

74
The data showed that women aged 22 to 23 in 2013 were clearly more physically active than
women of the same age in 2000 (Figure 6-25). Only 30% of women in 2013 were in the inactive or
low physical activity category (N=5791), compared with 41% of women in the same age group in
2000 (N=3515). As per the figure for the whole cohort, 70% of the women aged 22 to 23 in 2013
met the threshold level for recommended physical activity in the new guidelines, compared with
59% of the women in 2000.
Figure 6-25 Physical activity levels among women aged 22 to 23 in 2000 (N=3515) and 2013 (N=5791), weighted by area of residence.
0% 20% 40% 60% 80% 100%
22-23 years in 2013
22-23 years in 2000
HighModerateLowInactive

75
Although the questions asked in the 2011-2012 Australian Health Survey (AHS) were slightly
different from those in the first survey (2013) of the 1989-95 cohort, it is possible to compare
activity levels in these two samples by applying the algorithm and cut-points used in the AHS to
the 1985-95 data, as follows:
Physical activity score = (duration of walking for fitness * 3.5 METs) + (duration of walking for
transport *3.5 METs) + (duration of moderate intensity activity * 5 METs) + (duration of vigorous
intensity activity *7.5 METs). Scores were categorised as: sedentary (< 50 MET.mins [includes no
activity]); low (50 to < 800 MET.mins); moderate (800 to 1,600, or > 1,600 but with less than 1
hour vigorous physical activity); or high (> 1,600 and with 1 hour or more of vigorous physical
activity).
Only 40% of 18-23 year old women in the AHS were categorised as moderately or highly active on
this basis, compared with 62% of the women in the 1989-1995 cohort (Figure 6-26).
Figure 6-26 Comparison of physical activity levels among women aged 18 to 23 in 2013 from the ALSWH 1989-95 cohort (weighted by age and area of residence), with similarly aged women from the Australian Health Survey 2011-12.
0% 20% 40% 60% 80% 100%
AHS 2011-12(Incl walking for transport)
ALSWH 2013
HighModerateLowSedentary

76
6.4.1 Physical activity among women aged 18 to 23 in 2013 by sociodemographic characteristics
The percentage of women in 2013 in each of the physical activity categories was largely consistent
across the 18 to 23 year age range. There was a small increase in the percentage of inactive
women with age, from nearly 6% at 18 to 7% at 23 (Figure 6-27). The percentages meeting the
new physical activity guidelines (moderate and high physical activity categories) were similar at
each age, ranging from 68% at age 18 to 70% at age 21.
Figure 6-27 Levels of physical activity of women aged 18 to 23 in 2013, stratified by age.
0% 20% 40% 60% 80% 100%
23 years
22 years
21 years
20 years
19 years
18 years
HighModerateLowInactive

77
Distributions of women across the physical activity categories did not vary greatly by area of
residence (Figure 6-28). Women aged 18 to 23 living in major cities were most likely to meet the
physical activity guidelines (70%, compared with 67-68% in the other areas). The percentage of
women classified as inactive was twice as high in remote or very remote areas (12%) as in major
cities (6%).
Figure 6-28 Levels of physical activity among women aged 18 to 23 in 2013, stratified by area of residence.
0% 20% 40% 60% 80% 100%
Remote/Very Remote
Outer Regional
Inner Regional
Major Ci ties
HighModerateLowInactive
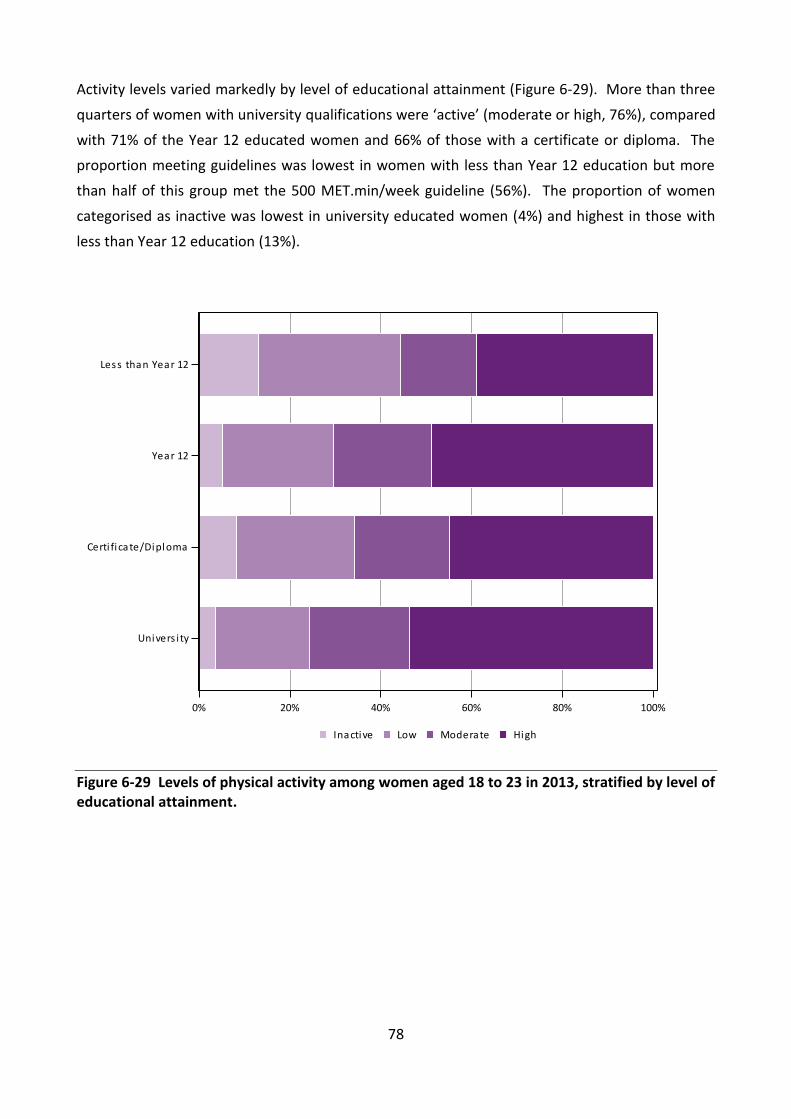
78
Activity levels varied markedly by level of educational attainment (Figure 6-29). More than three
quarters of women with university qualifications were ‘active’ (moderate or high, 76%), compared
with 71% of the Year 12 educated women and 66% of those with a certificate or diploma. The
proportion meeting guidelines was lowest in women with less than Year 12 education but more
than half of this group met the 500 MET.min/week guideline (56%). The proportion of women
categorised as inactive was lowest in university educated women (4%) and highest in those with
less than Year 12 education (13%).
Figure 6-29 Levels of physical activity among women aged 18 to 23 in 2013, stratified by level of educational attainment.
0% 20% 40% 60% 80% 100%
Univers i ty
Certi ficate/Diploma
Year 12
Less than Year 12
HighModerateLowInactive

79
6.4.2 Summary
Women aged 22 to 23 in 2013 were more physically active than the same age group in 2000. In
2013, 70% of women aged 22 to 23 were considered moderately or highly active compared with
59% of the women in 2000
Over two thirds (70%) of women aged 18 to 23 in 2013 met the threshold
recommendation for physical activity under the 2012 Australian guidelines.
A smaller proportion of women with less than Year 12 qualifications (56%) reported
moderate or high activity levels compared with women who had university qualifications
(76%).

80
Body Mass Index (BMI) / body weight 6.5
Body Mass Index (BMI) is an established predictor for a range of adverse outcomes, including
increased risk of chronic disease, such as cardiovascular disease, and of poor reproductive health.
The BMI of women aged 18 to 23 in 2013 was calculated from their self-reported height and
weight. The mean height was 166.2 cm and mean weight was 67.4 kg, resulting in mean BMI of
24.4 kg/m2. A comparison of the distribution of BMI with data from the 2011-12 AHS was
provided in Section 4.1 on representativeness.
6.5.1 BMI by sociodemographic characteristics
The BMI status of women aged 18 to 23 in 2013 according to their area of residence indicated a
clear city-country difference (Figure 6-30). The proportion of overweight and obese women was
more than 40% among those who lived outside the major cities. In contrast, the highest
percentage of women in the underweight category occurred in the major cities (9%).
Figure 6-30 BMI categories among women aged 18 to 23 in 2013, stratified by area of residence.
0% 20% 40% 60% 80% 100%
Remote/Very Remote
Outer Regional
Inner Regional
Major Ci ties
Obese, 30 <= BMIOverweight, 25 <= BMI < 30
Acceptable weight, 18.5 <= BMI < 25Underweight, BMI < 18.5

81
BMI status also varied among the women aged 18 to 23 in 2013 according to their education level
(Figure 6-31). More than 40% of the women with a certificate or diploma qualification or less than
Year 12 schooling were overweight or obese compared with 27% of women with university
qualifications.
Figure 6-31 BMI categories among women aged 18 to 23 in 2013, stratified by level of educational attainment.
0% 20% 40% 60% 80% 100%
Univers i ty
Certi ficate/Diploma
Year 12
Less than Year 12
Obese, 30 <= BMIOverweight, 25 <= BMI < 30
Acceptable weight, 18.5 <= BMI < 25Underweight, BMI < 18.5

82
Among women aged 18 to 23 in 2013, there was a clear trend of increasing BMI across the age
range, with the percentage of women in the overweight or obese categories rising from 29% at
age 18 to 38% at age 23 (Figure 6-32). Conversely, the proportion of women in the underweight
BMI category declined with age from 11% to 5% respectively.
Figure 6-32 Percentage of women aged 18 to 23 in 2013 in each BMI category, stratified by age.
0% 20% 40% 60% 80% 100%
23 years
22 years
21 years
20 years
19 years
18 years
Obese, 30 <= BMIOverweight, 25 <= BMI < 30
Acceptable weight, 18.5 <= BMI < 25Underweight, BMI < 18.5

83
6.5.2 BMI then and now
Comparison of women aged 18 to 23 in 2013 and the same age group in 1996 indicated that the
percentage of women in the overweight and obese categories increased from 20% to about 33%
in 2013 (Figure 6-33) and the percentage of women in this age group who were obese more than
doubled from 6% to 14%.
Figure 6-33 Comparison of BMI status for women aged 18 to 23 in 1996 and 2013, weighted for age and area of residence.
0% 20% 40% 60% 80% 100%
18-23 years in 2013
18-23 years in 1996
Obese, 30 <= BMIOverweight, 25 <= BMI < 30
Acceptable weight, 18.5 <= BMI < 25Underweight, BMI < 18.5
84
6.5.3 Summary
Among women aged 18 to 23 in 2013, 19% were categorised as overweight and 14% as obese.
BMI status was also characterised by sociodemographic gradients.
The percentage of women in overweight and obese categories increased with age, area of
residence (from the major cities to rural and remote areas) and was highest among
women with a less than Year 12 education level.
The percentage of underweight women was highest (9%) among those living in the major
cities.
Comparison with women in the same age range in 1996 indicated a marked increase by
2013 in the percentages of women categorised as overweight or obese (20% and 33%
respectively).
References 6.6
AIHW, Begg S, Vos T, Barker B, Stevenson C, Stanley L & Lopez A 2007. The burden of disease and
injury in Australia 2003. cat. no. PHE 82. Canberra: AIHW.
Brown WJ, Bauman AE, Bull FC & Burton NW. 2012. Development of Evidence-based Physical
Activity Recommendations for Adults (18-64 years). Report prepared for the Australian
Government Department of Health, Canberra.
http://www.health.gov.au/internet/main/publishing.nsf/Content/health-pubhlth-strateg-phys-
act-guidelines/$File/DEB-PAR-Adults-18-64years.pdf
Ministerial Council on Drug Strategy. 2011, National Drug Strategy 2010–2015: A framework for
action on alcohol, tobacco and other drugs. Canberra: Commonwealth of Australia.
National Health and Medical Research Council. 1992, Is there a safe level of daily consumption of
alcohol for men and women? [prepared by Pols R and Hawks D]. 2nd ed. Canberra:
Commonwealth of Australia.
National Health and Medical Research Council. 2001, Australian alcohol guidelines: Health risks
and benefits. Canberra: Commonwealth of Australia.
National Health and Medical Research Council. 2009, Australian guidelines to reduce health risks
from drinking alcohol. Canberra: Commonwealth of Australia.
Powell KE, Paluch AE & Blair SN. 2011, ‘Physical Activity for Health: What Kind? How Much? How
Intense? On Top of What?’ Annual Review of Public Health, vol. 32, pp. 349–65.

85
Physical health 7
This section examines a range of symptoms and diagnosed conditions to compare the physical
health of women aged 18 to 23 in 2013 with women in the same age range in 1996. It also reports
on the prevalence for a number of symptoms and diagnosed conditions not previously collected
for this age group. Physical symptoms are of interest, not only in terms of the implications of
changes in the prevalence of specific conditions for this age group, but as an ensemble of
indicators that suggest trends in the overall health of young women today compared with figures
obtained in 1996.
The self-reported indicators of physical health have been organized into four broad groups:
Somatic symptoms experienced often, such as difficulties in sleeping and headaches or migraines;
symptoms related to menstrual and urogenital health, including doctor diagnosed conditions of
Polycystic Ovary Syndrome and endometriosis; symptoms concerning the digestive and intestinal
disorders, such as constipation; other doctor diagnosed conditions, ranging from iron deficiency
(anaemia) and hypertension, to Type 1 diabetes, heart disease, and cancer. All prevalence figures
presented below have been weighted for age and area of residence (Explanatory Notes for
Section 4).

86
Somatic symptoms 7.1
All except one of the somatic symptoms surveyed showed an increase in prevalence among
women aged 18 to 23 in 2013 who reported experiencing these symptoms often, compared with
symptoms for this age group in 1996 (Table 7-1). Marked increases were particularly evident for
difficulty in sleeping, with the percentage that experienced this often more than doubling to 25%,
up from 10% for this age group in 1996. Increases in prevalence were also evident for severe
tiredness (29%), back pain (21%), frequent headaches or migraines (23%) and skin problems
(18%), with a small increase for the percentage with symptoms of allergies, hay fever and sinusitis
(20%). Breathing difficulties were the only symptom to show a modest decline to 5%.
For somatic symptoms collected in 2013 (not collected in 1996), 12% of the young women
reported often experiencing stiff or painful joints, while 8% had problems with one or both feet.
Table 7-1 Comparison of the prevalence of somatic symptoms reported by women aged 18 to 23 in 1996 and 2013, weighted by age and area of residence
Somatic Symptoms Women aged
18 to 23 in 1996
Women aged
18 to 23 in 2013
Severe tiredness 18.5 29.3
Difficulty sleeping 10.1 24.9
Headaches/migraines 18.5 22.5
Back pain 12.0 21.0
Allergies, hay fever, sinusitis 16.1 19.7
Skin problems 13.7 18.0
Stiff/painful joints - 11.7
Problems with one or both feet - 7.7
Breathing difficulties 5.9 4.7

87
Menstrual and urogenital health 7.2
A similar pattern of increase was evident for the percentage of women aged 18 to 23 in 2013 with
symptoms of menstrual and urogenital health, compared with figures for this age group in 1996
(Table 7-2). Marked increases in prevalence were reported for often having irregular periods
(20%), severe period pain (22%), heavy periods (16%), and frequent vaginal discharge or irritation
(11%).
For doctor diagnosed conditions related to menstrual and urogenital health, both collected in
2013 for the first time from this age group, 6% of the women had been diagnosed with Polycystic
Ovary Syndrome and 3% with endometriosis.
Table 7-2 Comparison of the prevalence of menstrual and urogenital symptoms reported by women aged 18 to 23 in 1996 and 2013, weighted by age and area of residence, as well as the prevalence of two doctor diagnosed conditions collected for the first time in 2013
Women aged
18 to 23 in 1996
Women aged 18 to 23 in
2013
Menstrual and Urogenital symptoms
Severe period pain 16.3 22.4
Irregular periods 11.7 20.2
Premenstrual tension 16.9 16.3
Heavy periods 9.1 15.8
Vaginal discharge or irritation 4.2 10.8
Leaking urine 1.0 2.3
Urine that burns or stings 1.7 1.9
Related Diagnosed Conditions
Polycystic Ovary Syndrome - 5.7
Endometriosis - 3.4

88
Digestive and intestinal disorders 7.3
Relatively few symptoms were available in this area, but all showed a marked increase in
prevalence for this age group of women in 2013 compared with women in 1996 (Table 7-3).
Marked increases were evident for the prevalence of frequent constipation (6%), haemorrhoids
(2%) and other bowel problems (5%).
Table 7-3 Comparison of the prevalence of digestive and intestinal disorders reported
by women aged 18 to 23 in 1996 and 2013, weighted by age and area of residence
Digestive and intestinal disorders Women aged
18 to 23 in 1996
Women aged 18 to 23 in
2013
Constipation 3.7 5.9
Haemorrhoids (piles) 0.8 1.8
Other bowel problems 2.2 5.3
Other doctor diagnosed conditions 7.4
Unlike symptoms in the previous categories, doctor diagnosed conditions showed mixed changes
with no clear overall pattern (Table 7-4). Almost one in three women (32%) in 2013 had been
diagnosed as having low iron (iron deficiency or anaemia) and one in four women (26%) had been
diagnosed with asthma, which was similar to the prevalence reported in 1996 for this age group.
Interestingly, the percentage with doctor diagnosed hypertension showed decline to less than 2%
in 2013 from 5% for this age group in 1996. The percentage of women diagnosed with heart
disease, Type 1 diabetes or cancers remained low (<2%), similar to 1996 figures.
Table 7-4 Comparison of the prevalence of doctor diagnosed conditions reported
by women aged 18 to 23 in 1996 and 2013, weighted by age and area of residence
Diagnosed conditions Women aged
18 to 23 in 1996
Women aged 18 to 23
in 2013
Low iron (iron deficiency or anaemia) 25.8 31.5
Asthma 24.6 25.7
Hypertension (high blood pressure) 5.0 1.5
Insulin dependent (Type 1) diabetes 1.0 0.7
Non-insulin dependent (Type 2) diabetes - 0.4
Cancer 1.6 1.2
Heart disease 0.4 0.4

89
Disability 7.5
As expected, given the age of the women, the proportion of women in both 1996 and 2013 who
indicated regularly needing help with daily tasks because of a long-term illness or disability was
extremely low (around 2%).
Summary 7.6
Compared with data for women in this age group in 1996, the evidence points to an overall
increase in the prevalence of symptoms experienced frequently by a sizable proportion of women
aged 18 to 23 in 2013:
More than 20% of the women reported frequently experiencing one or more of the
following: difficulty in sleeping, severe tiredness, back pain, headaches or migraines,
irregular periods or severe period pain.
Nearly one-third of women reported being diagnosed with low iron.
A quarter of women reported being diagnosed with asthma.
The prevalence of a number of symptoms reported by the women had doubled, or almost
doubled, for this age group since 1996: difficulty in sleeping, back pain, vaginal discharge
or irritation, haemorrhoids, constipation and other bowel problems.

90
Psychological distress 8
It is clear that young adulthood is a period in the lifespan that is characterised by many social,
educational, occupational and residential changes. Negotiating transitions between high school
and university or work, or between living at home with parents and living away from home, can
be stressful. Young adults are often juggling multiple roles and may be doing so with varying
degrees of social and financial support. According to the 2007 National Survey of Mental Health
and Wellbeing, the prevalence of 12 month mental disorders was highest in young adults aged 16
to 24, and thereafter declined with age (Slade et al., 2009). This pattern underscores the
importance of examining mental health issues at this stage of the lifespan.
This section examines psychological distress reported by women aged 18 to 23 in 2013 from the
ALSWH 1989-95 cohort. Where possible, their data are compared with results drawn from
similarly aged women who participated in the Australian Health Survey 2011-12 and the 2010
National Drug Strategy Household Survey. Where comparable measures were available,
comparisons are presented with women from the ALSWH 1973-78 cohort who were aged 18 to 23
in 1996.
The measures of mental health that are included are stress, psychological distress using the
Kessler Psychological Distress Scale (K-10), suicidal ideation and self-harm, and diagnosed
depression and anxiety.

91
Stress 8.1
Stress is strongly associated with poor mental and physical health and unhealthy lifestyle
behaviours. Young women report higher stress levels than young men (Davis et al., 1999) and
greater perceived stress than older women (Brown et al., 1998).
The Perceived Stress Questionnaire for Young Women (PSQYW) was validated with the ALSWH
1973-78 birth cohort and found to be an adequate measure of perceived stress in young women
(Bell & Lee, 2002). Women aged 18 to 23 in 1996 and 2013 received the PSQYW at their first
surveys. The PSQYW scale is scored from 0 to 4, with higher scores indicative of greater perceived
stress.
As shown in Figure 8-1, women aged 18 to 23 in 2013 reported significantly higher stress levels
than women in the same age range in 1996.
Figure 8-1 Comparisons of perceived stress (PSQYW) reported by women aged 18 to 23 in 1996 and 2013, weighted by age and area of residence.
18-23 years in 2013
18-23 years in 1996
0.8 1.0 1.2 1.4
Mean Stress
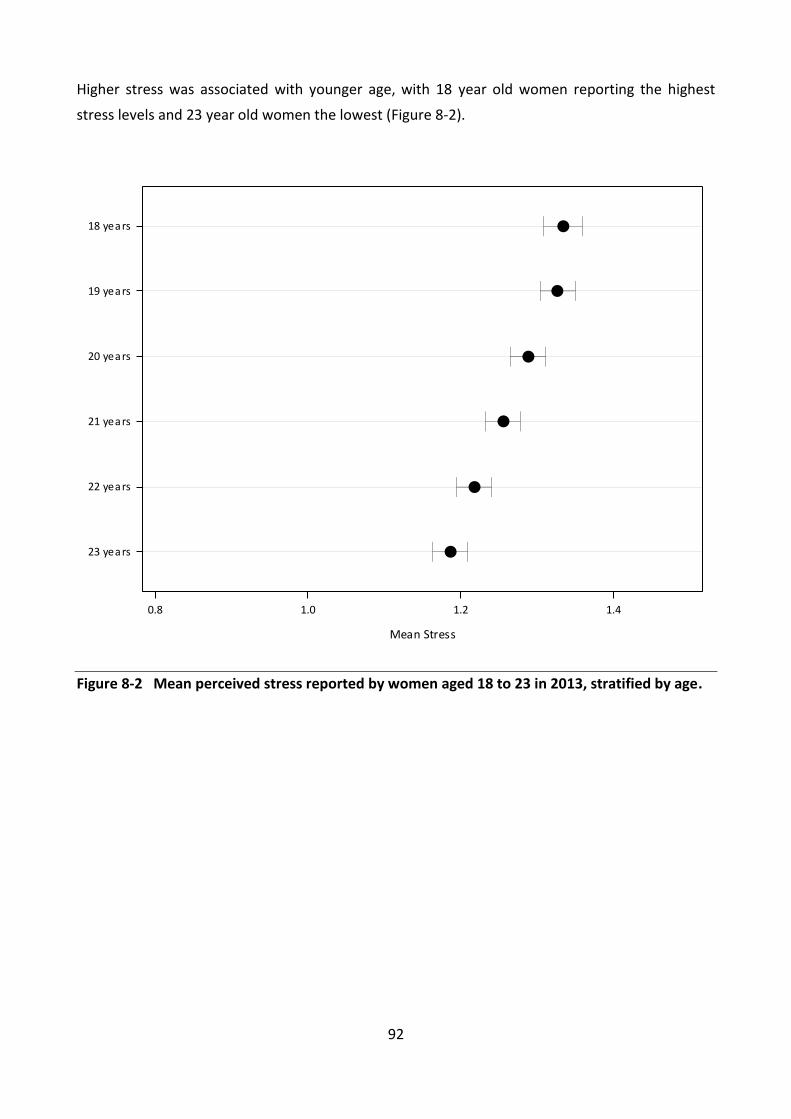
92
Higher stress was associated with younger age, with 18 year old women reporting the highest
stress levels and 23 year old women the lowest (Figure 8-2).
Figure 8-2 Mean perceived stress reported by women aged 18 to 23 in 2013, stratified by age.
23 years
22 years
21 years
20 years
19 years
18 years
0.8 1.0 1.2 1.4
Mean Stress

93
When these data were examined by area of residence (Figure 8-3), women in remote or very
remote areas had the lowest levels of perceived stress; however, numbers were relatively small in
these areas.
Figure 8-3 Mean perceived stress (PSQYW) reported by women aged 18 to 23 in 2013, stratified by area of residence.
Remote/Very Remote
Outer Regional
Inner Regional
Major Ci ties
0.8 1.0 1.2 1.4
Mean Stress

94
Lower educational attainment was also associated with stress: women with less than a Year 12
education reported greater perceived stress than those with a certificate, diploma or Year 12 or
equivalent. The least stressed women were those who had achieved a university education (Figure
8-4).
Figure 8-4 Mean perceived stress (PSQYW) reported by women aged 18 to 23 in 2013, stratified by level of educational attainment.
Univers i ty
Certi ficate/Diploma
Year 12
Less than Year 12
0.8 1.0 1.2 1.4
Mean Stress

95
Kessler Psychological Distress Scale (K-10) 8.2
The Kessler Psychological Distress Scale or K-10 is a short screening scale of non-specific
psychological distress in the anxiety-depression spectrum. The K-10 has been extensively
validated and has been used in Australian Bureau of Statistics national health surveys, telephone-
based State public health surveys and for patients attending community mental health services.
Consistent with the cut-off scores developed by the Australian Bureau of Statistics, the K-10
reports four levels of psychological distress to indicate severity: 10-15 low distress, 16-21
moderate distress, 22-29 high distress and 30-50 very high distress. Results of women aged 18 to
23 in 2013 from the ALSWH 1989-95 cohort were compared with results drawn from similarly
aged women who participated in the 2011-12 Australian Health Survey (AHS) and the 2010
National Drug Strategy Household Survey (NDSHS). These comparisons are presented in Figure
8-5. Women aged 18 to 23 in 2013 reported higher levels of distress (49% high or very high
distress) than women in the AHS (14%) or the NDSHS (19%).
Figure 8-5 Comparison of psychological distress (K-10) of women aged 18 to 23 in 2013 from the ALSWH 1989-95 cohort (weighted by age and area of residence), with similarly aged women from the 2011-12 AHS and the 2010 NDSHS.
0% 20% 40% 60% 80% 100%
NDSHS 2010
AHS 2011-12
ALSWH 2013
Very high (30-50)High (22-29)Moderate (16-21)Low (10-15)

96
The prevalence of psychological distress among women aged 18 to 23 in 2013 was highest among
women aged 18 and decreased with age (Figure 8-6). High or very high psychological distress was
reported by 59% of women aged 18, 54% of those aged 19 and 51% of those aged 20. By the age
of 23, 42% of the women reported high or very high distress.
Figure 8-6 Level of psychological distress (K-10) among women aged 18 to 23 in 2013, stratified by age.
0% 20% 40% 60% 80% 100%
23 years
22 years
21 years
20 years
19 years
18 years
Very High (30-50)High (22-29)Moderate (16-21)Low (10-15)
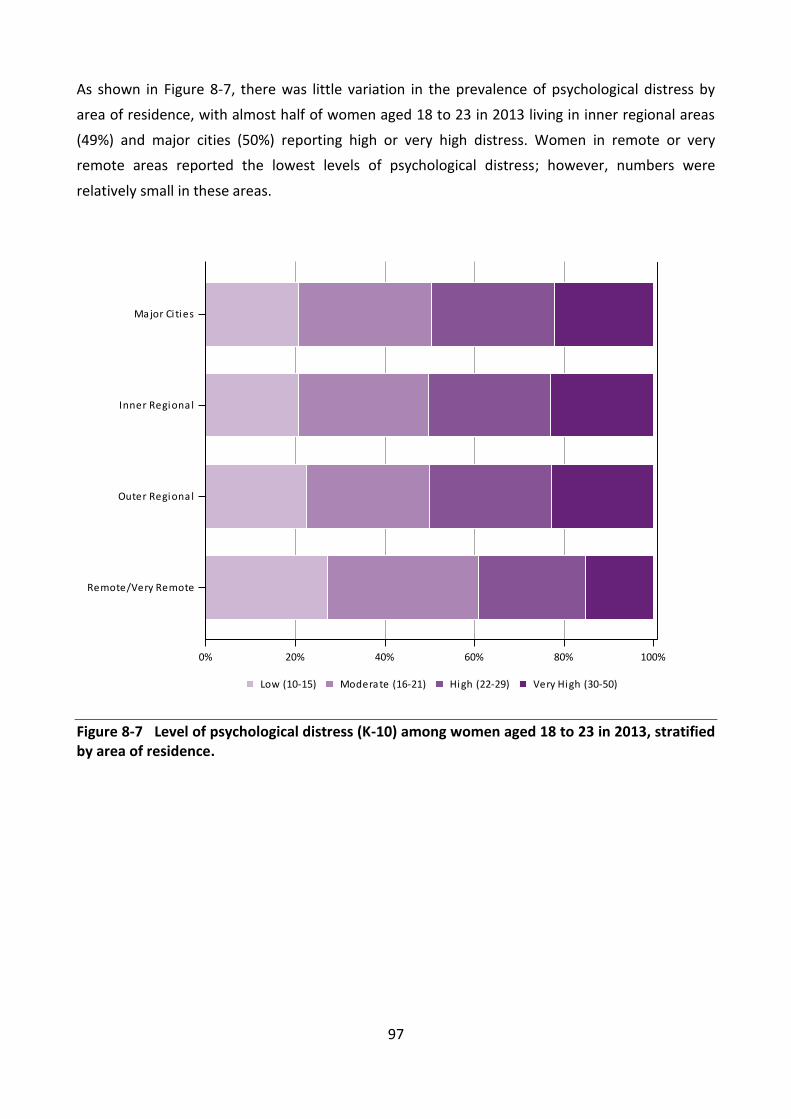
97
As shown in Figure 8-7, there was little variation in the prevalence of psychological distress by
area of residence, with almost half of women aged 18 to 23 in 2013 living in inner regional areas
(49%) and major cities (50%) reporting high or very high distress. Women in remote or very
remote areas reported the lowest levels of psychological distress; however, numbers were
relatively small in these areas.
Figure 8-7 Level of psychological distress (K-10) among women aged 18 to 23 in 2013, stratified by area of residence.
0% 20% 40% 60% 80% 100%
Remote/Very Remote
Outer Regional
Inner Regional
Major Ci ties
Very High (30-50)High (22-29)Moderate (16-21)Low (10-15)

98
Women aged 18 to 23 in 2013 who had attained less than a Year 12 education had a greater prevalence of high or very high distress (66%) than those with a university education (38%;Figure
8-8).
Figure 8-8 Level of psychological distress (K-10) among women aged 18 to 23 in 2013, stratified by level of educational attainment.
0% 20% 40% 60% 80% 100%
Univers i ty
Certi ficate/Diploma
Year 12
Less than Year 12
Very High (30-50)High (22-29)Moderate (16-21)Low (10-15)
99
Suicidal ideation and self-harm 8.3
Young people are consistently over-represented in international suicide statistics. In Australia,
almost 25% of deaths for both males and females aged 15 to 24 are due to suicide (Australian
Bureau of Statistics, 2012). Despite these statistics, completed suicide remains a relatively rare
event. Nonetheless, other forms of suicidal behaviour, such as incomplete suicide, persistent or
occasional thoughts about suicide (i.e. suicidal ideation) and self-harming behaviours are
considered possible indicators of suicidal intentions. There is good evidence that suicidal ideation
is a reliable predictor of subsequent suicide attempts (Joiner, 2002). Similarly, young adults who
engage in self-harming behaviours are more likely to report feelings of suicidality (Nada-Raja et al,
2004). In a recent Australian study, Delfabbro and colleagues (2013) reported that the prevalence
of suicidal ideation in their sample of 15 year old students was twice as high in girls as in boys.
Between 1999-2000 and 2010-11 there was an increase in hospital admissions for intentional self-
harm among young women aged 15 to 24, with 32% of women in this age group admitted in
2010-11 (Australian Institute of Health and Welfare, 2013).

100
Many (59%) of the women aged 18 to 23 in 2013 reported that they had experienced feelings that
“life wasn’t worth living” at some time in their lives, with 31% of women experiencing those
feelings within the last 12 months. Feeling that life wasn’t worth living was highest among women
aged 18 (65%) and declined with age, so that by 23, 56% of women reported these feelings at
some time (Figure 8-9).
Figure 8-9 Feelings that life isn’t worth living among women aged 18 to 23 in 2013, stratified by age.
0% 20% 40% 60% 80% 100%
23 years
22 years
21 years
20 years
19 years
18 years
In las t 12 months , more than 12 months agoIn las t 12 months
More than 12 months agoNever

101
There was little variation by area of residence, but women living in inner regional areas of
Australia had the highest percentage of those who reported ever feeling that life wasn’t worth
living (61%; Figure 8-10).
Figure 8-10 Feelings that life isn’t worth living among women aged 18 to 23 in 2013, stratified by area of residence.
0% 20% 40% 60% 80% 100%
Remote/Very Remote
Outer Regional
Inner Regional
Major Ci ties
In las t 12 months , more than 12 months agoIn las t 12 months
More than 12 months agoNever

102
In contrast, more than three-quarters (78%) of women in this age group who had attained less
than a Year 12 education reported ever feeling that life wasn’t worth living, compared with 48% of
those with a university education (Figure 8-11).
Figure 8-11 Feelings that life isn’t worth living among women aged 18 to 23 in 2013, stratified by level of educational attainment.
0% 20% 40% 60% 80% 100%
Univers i ty
Certi ficate/Diploma
Year 12
Less than Year 12
In las t 12 months , more than 12 months agoIn las t 12 months
More than 12 months agoNever

103
Of women aged 18 to 23 in 2013, 45% reported that they had ever either deliberately hurt
themselves or done something that may have harmed or killed them, with 13% reporting self-
harm in the last 12 months. The prevalence of self-harm decreased with age, from 51% at age 18
to 42% at 23 (Figure 8-12).
Figure 8-12 Reported self-harm among women aged 18 to 23 in 2013, stratified by age.
0% 20% 40% 60% 80% 100%
23 years
22 years
21 years
20 years
19 years
18 years
In las t 12 months , more than 12 months agoIn las t 12 months
More than 12 months agoNever

104
The percentage of women who reported self-harm was highest among those living in inner
regional areas (46%) or in major cities (45%; Figure 8-13).
Figure 8-13 Reported self-harm among women aged 18 to 23 in 2013, stratified by area of residence.
0% 20% 40% 60% 80% 100%
Remote/Very Remote
Outer Regional
Inner Regional
Major Ci ties
In las t 12 months , more than 12 months agoIn las t 12 months
More than 12 months agoNever

105
As with the other measures of psychological distress, women with low educational attainment
(less than Year 12) reported the highest percentage of self-harm (65%) and twice the prevalence
of those women who had attained university level education (33%;Figure 8-14).
Figure 8-14 Reported self-harm among women aged 18 to 23 in 2013, stratified by level of educational attainment.
0% 20% 40% 60% 80% 100%
Univers i ty
Certi ficate/Diploma
Year 12
Less than Year 12
In las t 12 months , more than 12 months agoIn las t 12 months
More than 12 months agoNever

106
Diagnosed mental health conditions 8.4
Over the lifespan, women are more likely than men to report having been diagnosed with an
anxiety or affective disorder, such as depression. The 2007 Australian National Mental Health
Survey reported that among women aged 16 to 24 the 12 month prevalence of depression was 8%
and anxiety 22%. Women aged 18 to 23 in 2013 from the ALSWH 1989-95 cohort were asked if
they had ever been diagnosed or treated for depression or an anxiety disorder.
More than one in three (35%) women reported that they had ever been diagnosed or treated for
depression and 28% reported that they had ever been diagnosed or treated for anxiety. There
were no differences by age for depression; however, younger women were slightly more likely to
report diagnosis or treatment for anxiety (30% of 18 year olds) than older women (27% of 23 year
olds). When these responses were examined by area of residence, it was apparent that the
prevalence of diagnosed or treated depression was highest among women living in inner regional
areas (38%;Figure 8-15).
Figure 8-15 Diagnosed or treated depression reported by women aged 18 to 23 in 2013, stratified by area of residence.
0% 20% 40% 60% 80% 100%
Remote/Very Remote
Outer Regional
Inner Regional
Major Ci ties
YesNo

107
The highest prevalence of anxiety diagnosis or treatment also occurred in women living in inner
regional areas (29%; Figure 8-16).
Figure 8-16 Diagnosed or treated anxiety reported by women aged 18 to 23 in 2013, stratified by area of residence.
0% 20% 40% 60% 80% 100%
Remote/Very Remote
Outer Regional
Inner Regional
Major Ci ties
YesNo

108
Women with less than a Year 12 education had a markedly greater prevalence of being diagnosed
or treated for depression (57%; Figure 8-17) or anxiety (42%; Figure 8-18) than women who had
attained a higher level of education.
Figure 8-17 Diagnosed or treated depression reported by women aged 18 to 23 in 2013, stratified by level of educational attainment.
0% 20% 40% 60% 80% 100%
Univers i ty
Certi ficate/Diploma
Year 12
Less than Year 12
YesNo

109
Figure 8-18 Diagnosed or treated anxiety reported by women aged 18 to 23 in 2013, stratified by level of educational attainment.
Discussion 8.5
While social media and other internet forums provide support networks for socially isolated young
people, the internet has been linked to an increased risk of suicide and self-harm among
vulnerable young people (Daine et al., 2013). Importantly, there is evidence to suggest on-line
data gathering may facilitate self-disclosure of more intimate information (Nguyen et al., 2012),
offering a potential partial explanation for the higher rates of distress reported.
It is clear that many women have sought professional help to improve their mental health, with
about a third of the women having been diagnosed with or treated for either depression or
anxiety.
0% 20% 40% 60% 80% 100%
Univers i ty
Certi ficate/Diploma
Year 12
Less than Year 12
YesNo

110
Summary 8.6
The levels of stress that women aged 18 to 23 in 2013 reported were significantly
higher than those experienced by women aged 18 to 23 in 1996.
Women who were younger and those with less than a Year 12 education reported
the highest perceived stress.
Women from the 1989-95 cohort reported high or very high levels of psychological
distress in much greater numbers than similarly aged participants in two other large
Australian national surveys, although data collection methods differed among
surveys.
The prevalence of psychological distress decreased with age suggesting that distress
is associated with the psychological pressures experienced during the transition from
adolescence to young adulthood.
Over half (59%) of the women reported at least one episode of suicidal thoughts and
45% reported self-harm.
About a third of the women had been diagnosed with or treated for either
depression or anxiety.
Women with less than a Year 12 education or those with a certificate or diploma
qualification were more likely to report poor mental health across all measures.
References 8.7
Australian Institute of Health and Wellbeing, Pointer, S. 2013, Trends in hospitalised injury,
Australia, 1999–00 to 2010–11, Cat. no. INJCAT 162, AIHW, Canberra.
Australian Bureau of Statistics, 2012, 3303.0. Causes of Death, ABS, Canberra.
Bell S & Lee C. 2003, ‘Perceived stress revisited: The Women’s Health Australia Project Young
cohort’, Psychology, Health and Medicine, vol. 8, no. 3, pp.343-353.
Brown W, Bryson L, Byles J, Dobson A, Lee C, Mishra G & Schofield M. 1998, ‘Women’s Health
Australia: Recruitment for a national longitudinal cohort study’, Women and Health, vol. 28, no. 1,
pp. 23-40.
Daine K, Hawton K, Singaravelu V, Stewart A, Simkin S & Montgomery P. 2013, ‘The power of the
Web: A systematic review of studies of the influence of the internet on self-harm and suicide in
young people’, PLOS ONE, vol. 8, no. 10.
111
Davis M, Matthews K & Twamley E. 1999, ‘Is life more difficult on Mars or Venus? A meta-analytic
review of sex differences in major and minor life events’, Annals of Behavioral Medicine, vol. 21,
no. 1, pp. 83-97.
Delfabbro P, Winefield H & Winefield A. 2013, ‘Life-time and current suicide-ideation in Australian
secondary school students: Socio-demographic, health and psychological predictors’, Journal of
Affective Disorders, vol. 151, no. 2, pp. 514-524.
Joiner T. 2002, ‘The trajectory of suicidal behaviour over time’, Suicide and Life-Threatening
Behaviour, vol. 32, no. 1, pp. 33-42.
Nada-Raja S, Skegg K, Langley J, Morrison D & Sowerby P. 2004, ‘Self-harmful behaviours in a
population-based sample of young adults’, Suicide and Life-Threatening Behaviour, vol. 34, no. 2,
pp. 177-186.
Nguyen M, Bin Y & Campbell A. 2012, ‘Comparing Online and Offline Self-Disclosure: A
Systematic Review’, Cyberpsychology, Behavior, and Social Networking, vol. 15, no. 2, pp. 103-111.
Slade T, Johnston A, Browne MAO, Andrews G & Whiteford H. 2009, ‘2007 National Survey of
Mental Health and Well-being: Methods and key findings’, Australian and New Zealand Journal of
Psychiatry, vol. 43, no. 7, pp. 594-605.

112
Violence 9
Violence against women is a widespread and multi-faceted problem. It takes various forms
including physical, psychological, emotional and sexual abuse. Such violence is associated with a
range of negative health outcomes, including chronic mental and physical health conditions,
substance abuse and physical injury (Black 2011; Coker et al., 2002).
The Australian government has introduced a number of initiatives to combat violence against
women, such as the “Violence Against Women. Australia Says No” campaign (FaCSIA, 2006). In
2009, $42 million was allocated to address recommendations of the National Council to Reduce
Violence Against Women and their Children, including the establishment of a national domestic
violence and sexual assault telephone and online counselling service, the Respectful Relationships
program and a social marketing campaign (Council of Australian Governments, 2011). More
recently in 2011, The National Plan to Reduce Violence Against Women and their Children 2010-
2022 was introduced (Council of Australian Governments, 2011).
Since the introduction of these initiatives, it is unknown whether young women experience the
same level of violence as previous generations of young women. This section will assess a range of
violence experienced by women aged 18 to 23 in 2013 (1989-95 cohort), and where possible,
compare that with the violence experienced by women aged 18 to 23 in 1996 (1973-78 cohort). It
is not possible to directly attribute any differences in the experience of violence to the individual
campaigns.
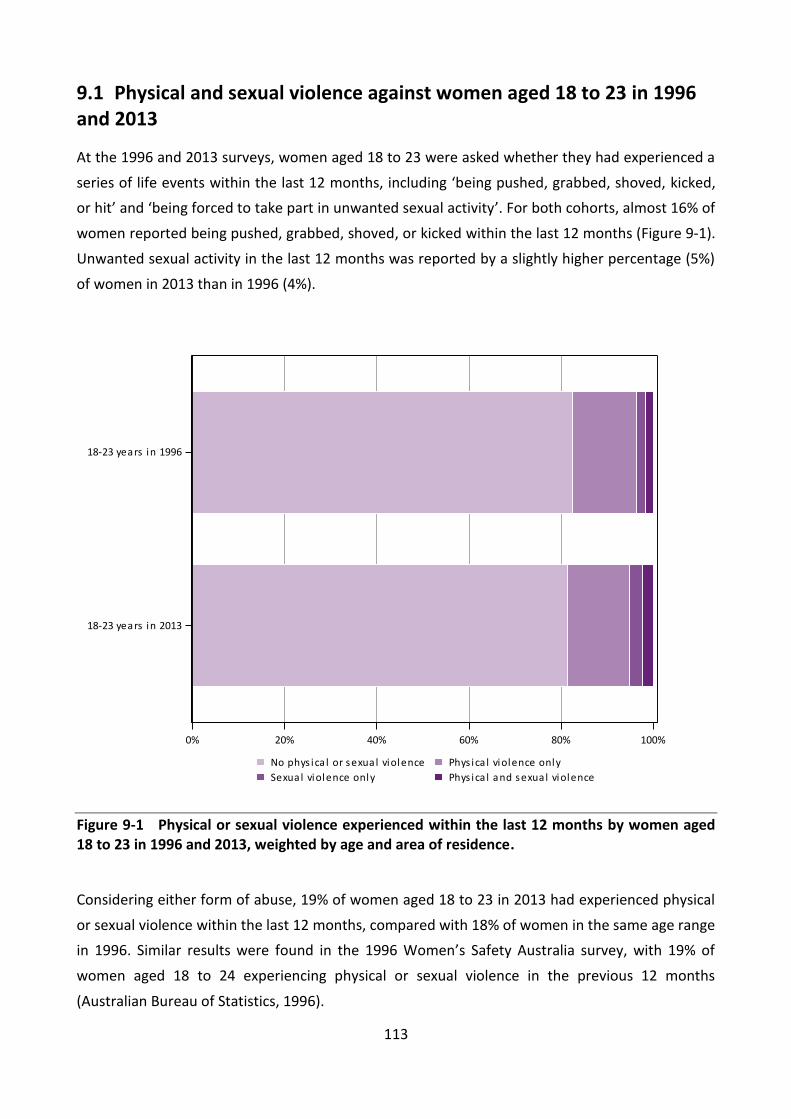
113
Physical and sexual violence against women aged 18 to 23 in 1996 9.1and 2013
At the 1996 and 2013 surveys, women aged 18 to 23 were asked whether they had experienced a
series of life events within the last 12 months, including ‘being pushed, grabbed, shoved, kicked,
or hit’ and ‘being forced to take part in unwanted sexual activity’. For both cohorts, almost 16% of
women reported being pushed, grabbed, shoved, or kicked within the last 12 months (Figure 9-1).
Unwanted sexual activity in the last 12 months was reported by a slightly higher percentage (5%)
of women in 2013 than in 1996 (4%).
Figure 9-1 Physical or sexual violence experienced within the last 12 months by women aged 18 to 23 in 1996 and 2013, weighted by age and area of residence.
Considering either form of abuse, 19% of women aged 18 to 23 in 2013 had experienced physical
or sexual violence within the last 12 months, compared with 18% of women in the same age range
in 1996. Similar results were found in the 1996 Women’s Safety Australia survey, with 19% of
women aged 18 to 24 experiencing physical or sexual violence in the previous 12 months
(Australian Bureau of Statistics, 1996).
0% 20% 40% 60% 80% 100%
18-23 years in 2013
18-23 years in 1996
Phys ica l and sexual violenceSexual violence only
Phys ica l violence onlyNo phys ica l or sexual violence

114
In the 2013 survey women were asked if they had ever experienced physical or sexual violence.
More than half the women (56%) had experienced physical or sexual violence at some time in
their lives.
Although experiences of physical and sexual violence were similar across age, they appeared
greater in remote areas (small numbers) and differed by educational attainment. Seventy-seven
percent of women with less than Year 12 education had experienced physical or sexual abuse
compared with 53% of those with Year 12 qualifications, 65% with a certificate or diploma and
46% with university qualifications.

115
Experiences of bullying among women aged 18 to 23 in 2013 9.2
At the 2013 survey, women were asked whether they had experienced bullying. Seventy-two
percent of women aged 18 to 23 indicated they had been bullied at some stage. Most bullying
occurred more than 12 months previously, rather than within the last 12 months (53% compared
with 18%).
Across the age range more than 70% of women in 2013 reported having been bullied at some
time; however, the prevalence of being bullied within the last 12 months decreased with age
(Figure 9-2). At age 18, 26% of women had experienced bullying within the last 12 months,
declining to 17% at age 23.
Figure 9-2 Experience of being bullied among women aged 18 to 23 in 2013, stratified by age.
0% 20% 40% 60% 80% 100%
23 years
22 years
21 years
20 years
19 years
18 years
In las t 12 months , more than 12 months agoIn las t 12 months
More than 12 months agoNever
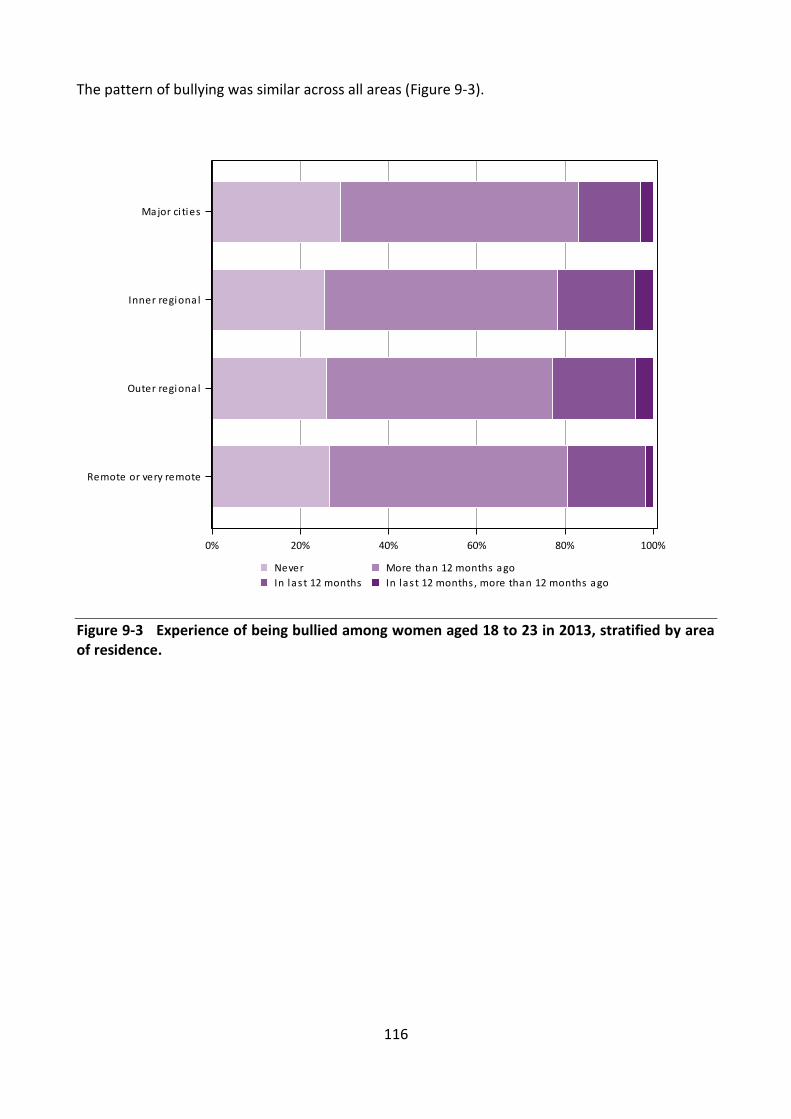
116
The pattern of bullying was similar across all areas (Figure 9-3).
Figure 9-3 Experience of being bullied among women aged 18 to 23 in 2013, stratified by area of residence.
0% 20% 40% 60% 80% 100%
Remote or very remote
Outer regional
Inner regional
Major ci ties
In las t 12 months , more than 12 months agoIn las t 12 months
More than 12 months agoNever

117
The experience of being bullied varied by level of educational attainment. Women aged 18 to 23
in 2013 who had not completed Year 12 qualifications had the highest percentage of those who
had ever been bullied (82%) or had been bullied within the last 12 months (27%). This compares
with 12% of women with university qualifications who reported being bullied within the last 12
months (Figure 9-4).
Figure 9-4 Experience of being bullied among women aged 18 to 23 in 2013, stratified by level of educational attainment.
0% 20% 40% 60% 80% 100%
Univers i ty
Certi ficate/Diploma
Year 12
Less than Year 12
In las t 12 months , more than 12 months agoIn las t 12 months
More than 12 months agoNever

118
Intimate Partner Violence (IPV) experienced by women aged 18 to 9.323 in 1996 and 2013
At the 1996 and 2013 surveys, women were asked whether they had ever been in a violent
relationship with a partner or spouse. Among women aged 18 to 23 in 2013, 13% reported that
they had experienced Intimate Partner Violence (IPV), compared with 11% for the same age group
in 1996. The prevalence of IPV increased with age among the women in 2013, from 10% at age 18
to 16% at age 23 (Figure 9-5).
Figure 9-5 Experience of a violent relationship with a partner or spouse among women aged 18 to 23 in 2013, stratified by age.
0% 20% 40% 60% 80% 100%
23 years
22 years
21 years
20 years
19 years
18 years
YesNo

119
A lower percentage (12%) of women aged 18 to 23 in 2013 living in major cities reported the
experience of IPV than those living in regional and remote areas (15%-16%; Figure 9-6). Numbers
in remote and very remote areas were small.
Figure 9-6 Experience of a violent relationship with a partner or spouse among women aged 18 to 23 in 2013, stratified by area of residence.
0% 20% 40% 60% 80% 100%
Remote or very remote
Outer regional
Inner regional
Major ci ties
YesNo

120
The percentage of those who had experienced a violent relationship differed greatly by level of
educational attainment. One in three women (33%) with less than Year 12 qualifications had
experienced IPV, more than four times higher than those with Year 12 or university level
qualifications (8%; Figure 9-7). Twenty percent of women with a certificate or diploma had
experienced IPV.
Figure 9-7 Experience of a violent relationship with a partner or spouse among women aged 18 to 23 in 2013, stratified by level of educational attainment.
0% 20% 40% 60% 80% 100%
Univers i ty
Certi ficate/Diploma
Year 12
Less than Year 12
YesNo

121
9.3.1 Types of IPV experienced by women aged 18 to 23 in 2013
In 2013, 12 questions were asked about situations that women may have experienced with
current or past partners within the last 12 months, more than 12 months ago, or never (Figure
9-8). The new questions covered emotional abuse, harassment, physical, and sexual abuse
(Explanatory Notes for Section 9). Forty-five percent of women aged 18 to 23 reported some form
of IPV, with 12% reporting one form of abuse, 8% reporting two different forms of abuse and 25%
reporting three or more forms of abuse. The most common forms of IPV were being told they
were ugly, stupid or crazy (28%), being harassed over the telephone, email, Facebook or internet
(25%), and their partner trying to keep them from seeing or talking to friends or relatives (18%).
Sixteen percent of women were blamed for causing their partner’s violent behaviour and 15% of
women reported being forced to take part in unwanted sexual activity by a past or current
partner.
Figure 9-8 Different types of IPV ever experienced by women aged 18 to 23 in 2013, weighted by age and area of residence.
0 10 20 30 40 50
Refused to let me work outside the home
Became upset if dinner / housework wasn't done
Used a knife or gun or other weapon or beat me up
Harassed me over the telephone, email, Facebook
Blamed me for causing their violent behaviour
Pushed, grabbed, shoved, shook or threw me
Tried to keep me from my family, friends, children
Forced me to take part in unwanted sexual activity
Kicked, bit, slapped or hit me with a fist
Tried to turn my family, friends, children against me
Harassed me around my neighbourhood / work
Told me that I was ugly, stupid or crazy
Percentage
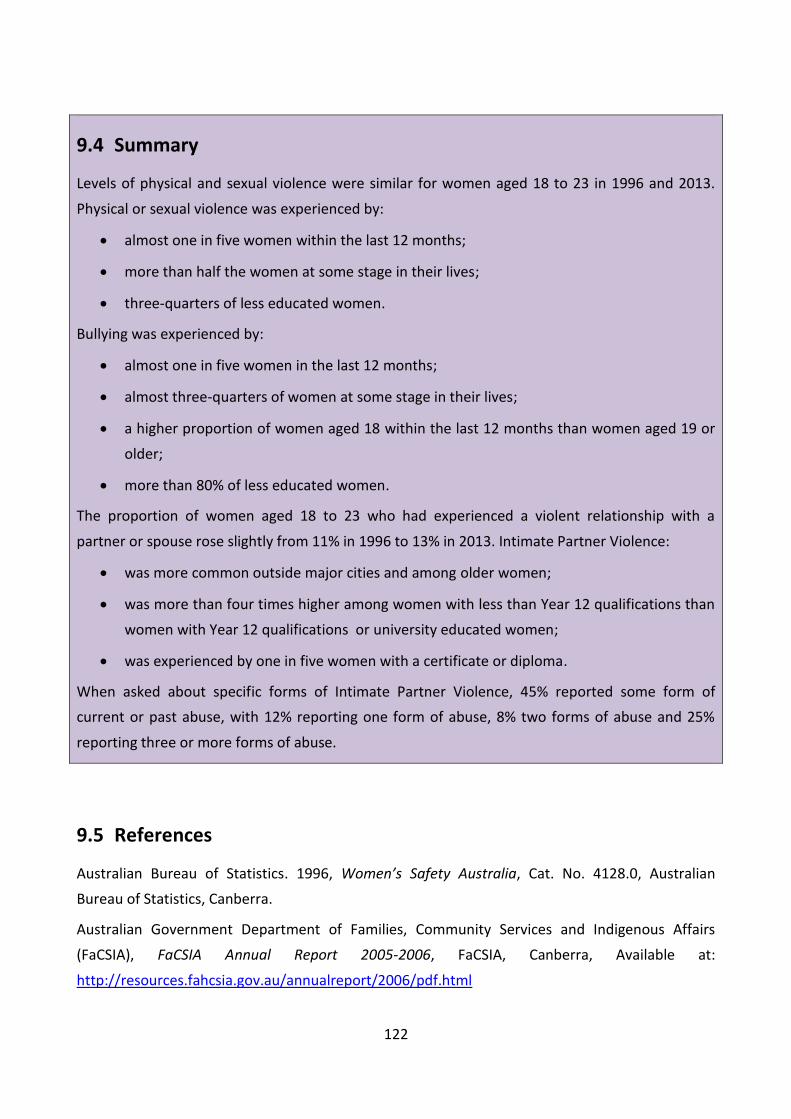
122
Summary 9.4
Levels of physical and sexual violence were similar for women aged 18 to 23 in 1996 and 2013.
Physical or sexual violence was experienced by:
almost one in five women within the last 12 months;
more than half the women at some stage in their lives;
three-quarters of less educated women.
Bullying was experienced by:
almost one in five women in the last 12 months;
almost three-quarters of women at some stage in their lives;
a higher proportion of women aged 18 within the last 12 months than women aged 19 or
older;
more than 80% of less educated women.
The proportion of women aged 18 to 23 who had experienced a violent relationship with a
partner or spouse rose slightly from 11% in 1996 to 13% in 2013. Intimate Partner Violence:
was more common outside major cities and among older women;
was more than four times higher among women with less than Year 12 qualifications than
women with Year 12 qualifications or university educated women;
was experienced by one in five women with a certificate or diploma.
When asked about specific forms of Intimate Partner Violence, 45% reported some form of
current or past abuse, with 12% reporting one form of abuse, 8% two forms of abuse and 25%
reporting three or more forms of abuse.
References 9.5
Australian Bureau of Statistics. 1996, Women’s Safety Australia, Cat. No. 4128.0, Australian
Bureau of Statistics, Canberra.
Australian Government Department of Families, Community Services and Indigenous Affairs
(FaCSIA), FaCSIA Annual Report 2005-2006, FaCSIA, Canberra, Available at:
http://resources.fahcsia.gov.au/annualreport/2006/pdf.html

123
Black M. 2011, ‘Intimate Partner Violence and Adverse Health Consequences: Implications for
Clinicians’. American Journal of Lifestyle Medicine, vol. 5, pp. 428-439.
Coker A, Davis K, Arias I, Desai S, Sanderson M, Brandt H & Smith P. 2002, ‘Physical and mental
health effects of intimate partner violence for men and women’. American Journal of Preventive
Medicine, vol. 23, no. 4, pp. 260-268.
Council of Australian Governments. 2011, National Plan to Reduce Violence Against Women and
Their Children, 2010-2022. Department of Families, Housing, Community Services and Indigenous
Affairs, Canberra.
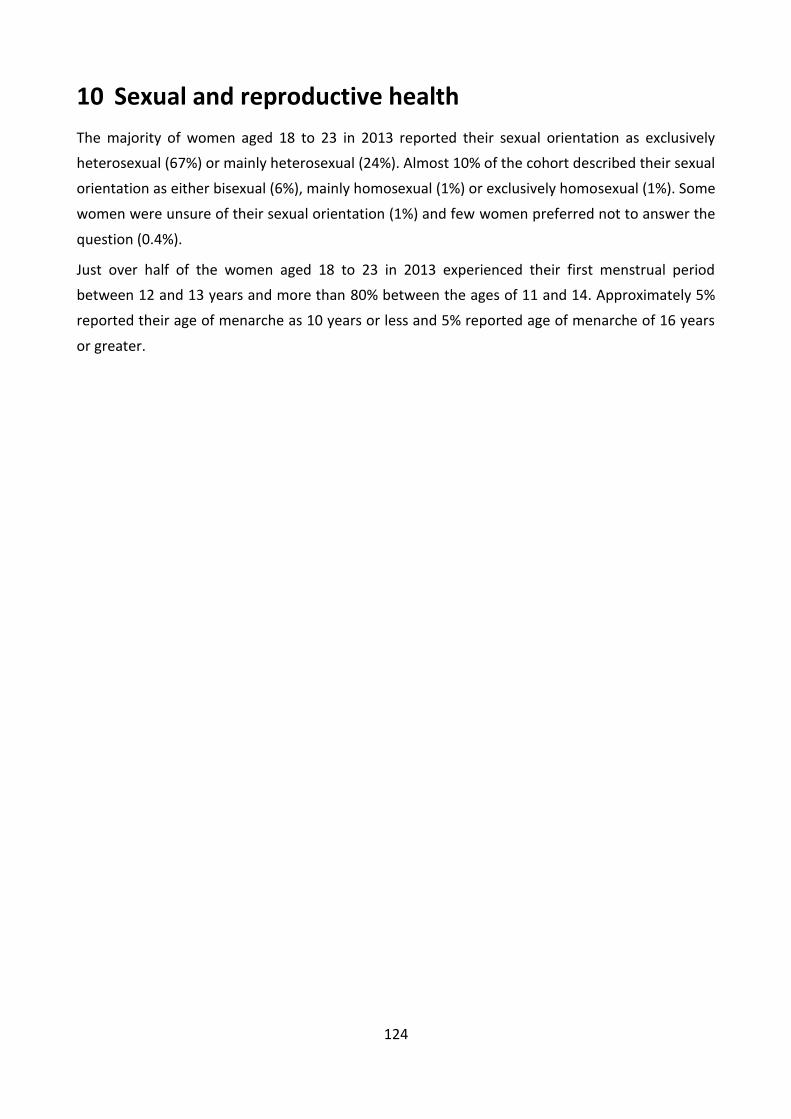
124
Sexual and reproductive health 10
The majority of women aged 18 to 23 in 2013 reported their sexual orientation as exclusively
heterosexual (67%) or mainly heterosexual (24%). Almost 10% of the cohort described their sexual
orientation as either bisexual (6%), mainly homosexual (1%) or exclusively homosexual (1%). Some
women were unsure of their sexual orientation (1%) and few women preferred not to answer the
question (0.4%).
Just over half of the women aged 18 to 23 in 2013 experienced their first menstrual period
between 12 and 13 years and more than 80% between the ages of 11 and 14. Approximately 5%
reported their age of menarche as 10 years or less and 5% reported age of menarche of 16 years
or greater.

125
Sexual behaviour 10.1
Of women aged 18 to 23 in 2013, 86% reported that they had experienced vaginal sex. The
proportion of women who had experienced vaginal sex increased across the age range from
approximately 72% of those aged 18 to 93% of women aged 23 (Figure 10-1; Explanatory Notes
for Section 10).
Figure 10-1 Experience of vaginal sex reported by women aged 18 to 23 in 2013, stratified by age.
The 92% of women aged 22 to 23 in 2013 who had already experienced their first sexual
intercourse was higher than the 86% figure for women from the 1973-78 cohort in the same age
range in 2000. Overall women aged 22 to 23 in 2013 reported that they had experienced their first
sexual intercourse at younger ages than the women in the same age group in 2000, with 44%
reporting their first sexual intercourse at age 16 or less in 2013, compared with 29% of the women
in 2000 (Figure 10-2). These results need to be treated with caution as respondents to the 2000
0% 20% 40% 60% 80% 100%
23 years
22 years
21 years
20 years
19 years
18 years
YesNo
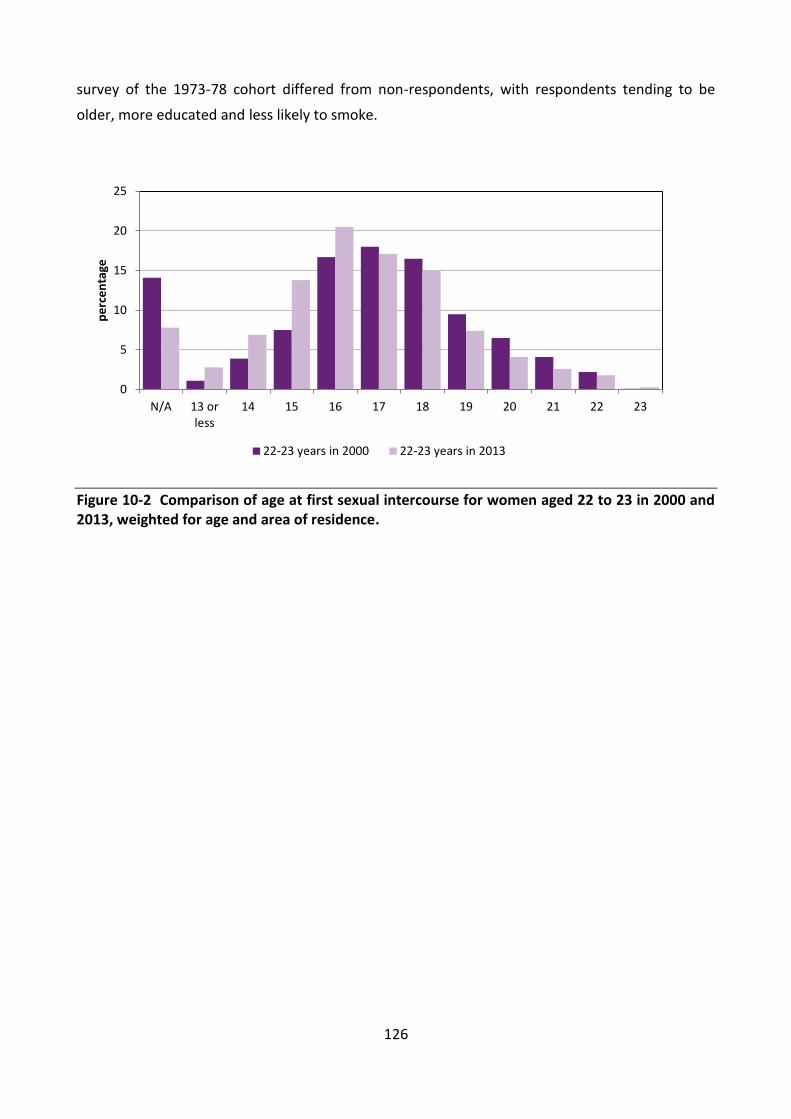
126
survey of the 1973-78 cohort differed from non-respondents, with respondents tending to be
older, more educated and less likely to smoke.
Figure 10-2 Comparison of age at first sexual intercourse for women aged 22 to 23 in 2000 and 2013, weighted for age and area of residence.
0
5
10
15
20
25
N/A 13 orless
14 15 16 17 18 19 20 21 22 23
pe
rce
nta
ge
22-23 years in 2000 22-23 years in 2013

127
Sexual transmitted infections (STIs) 10.2
Chlamydia was the most commonly reported sexually transmitted infection (STI) for women aged
18 to 23 in 2013, with over 8% of women indicating that they had been diagnosed or treated for
this condition (Figure 10-3; Explanatory Notes for Section 10). This was more than four times the
rate of chlamydia reported by women in this age group in 1996. Whether this increase in the rate
of reported chlamydia is due to an increasing number of cases of chlamydia in Australia or an
increase in the rate of testing for chlamydia is unable to be determined.
Figure 10-3 Comparison of sexually transmitted infections for women aged 18 to 23 in 1996 and 2013, weighted for age and area of residence.
The percentage of the women aged 18 to 23 in 2013 reporting genital warts, genital herpes or
other STIs was much lower than the prevalence reported for chlamydia. In 2013, 1% of the
women reported they had been diagnosed or treated for human papillomavirus (HPV, genital
warts). In comparison, 3% of women aged 18 to 23 in 1996 reported they had been diagnosed or
treated for HPV. There was a slight increase in the proportion of women in this age group
reporting genital herpes in 2013 compared with 1996, and a slight reduction in the proportion of
women reporting other STIs. Of women aged 18 to 23 in 2013, 41% reported that they had
experienced urinary tract infections. The prevalence of reported HIV or AIDS (0.1%), or Hepatitis B
or C (0.2%) was very low.
0
5
10
15
20
Chlamydia Genital herpes Genital warts Other STI
pe
rce
nta
ge
18-23 years in 1996 18-23 years in 2013
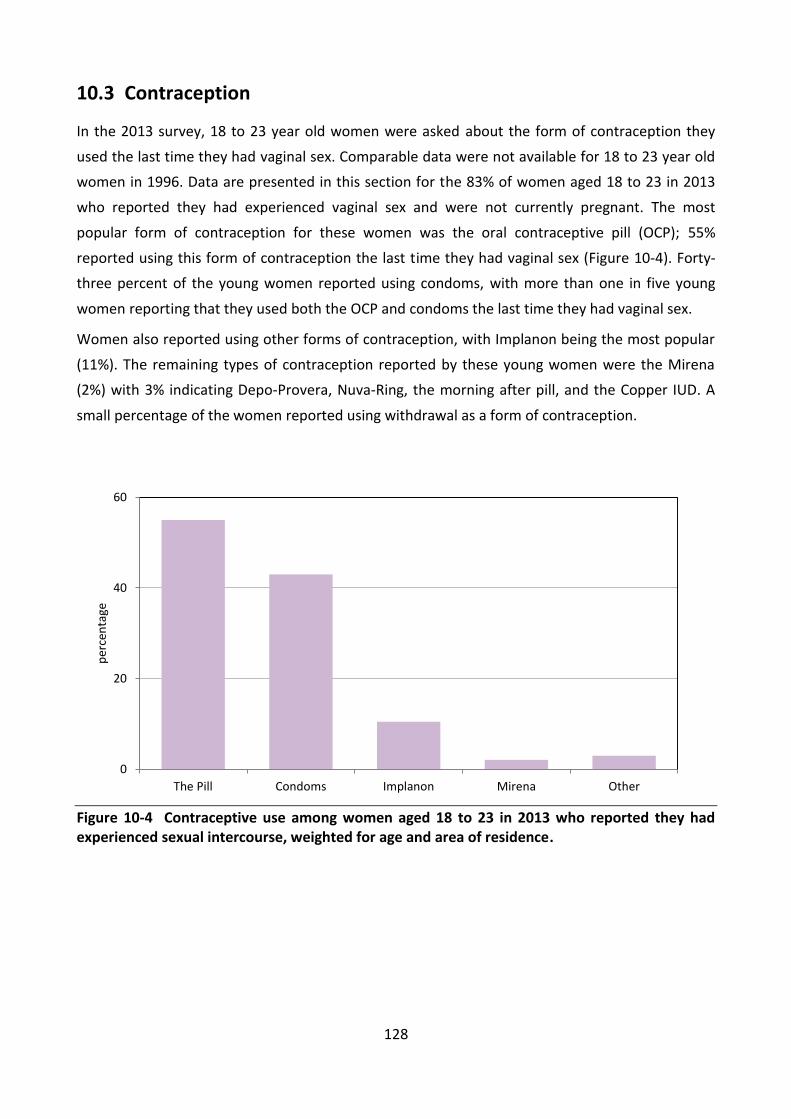
128
Contraception 10.3
In the 2013 survey, 18 to 23 year old women were asked about the form of contraception they
used the last time they had vaginal sex. Comparable data were not available for 18 to 23 year old
women in 1996. Data are presented in this section for the 83% of women aged 18 to 23 in 2013
who reported they had experienced vaginal sex and were not currently pregnant. The most
popular form of contraception for these women was the oral contraceptive pill (OCP); 55%
reported using this form of contraception the last time they had vaginal sex (Figure 10-4). Forty-
three percent of the young women reported using condoms, with more than one in five young
women reporting that they used both the OCP and condoms the last time they had vaginal sex.
Women also reported using other forms of contraception, with Implanon being the most popular
(11%). The remaining types of contraception reported by these young women were the Mirena
(2%) with 3% indicating Depo-Provera, Nuva-Ring, the morning after pill, and the Copper IUD. A
small percentage of the women reported using withdrawal as a form of contraception.
Figure 10-4 Contraceptive use among women aged 18 to 23 in 2013 who reported they had experienced sexual intercourse, weighted for age and area of residence.
0
20
40
60
The Pill Condoms Implanon Mirena Other
per
cen
tage

129
10.3.1 Oral contraceptive pill use
Women aged 18 had the lowest rate of OCP use with less than 53% of the women reporting that
they used the OCP the last time they had sex (Figure 10-5). OCP use was higher between the ages
of 19 and 23 for women in 2013.
Figure 10-5 Oral contraceptive pill use among women aged 18 to 23 in 2013 who reported they had experienced sexual intercourse, stratified by age.
0% 20% 40% 60% 80% 100%
23 years
22 years
21 years
20 years
19 years
18 years
YesNo

130
Use of the pill was higher in major cities (56%) and in regional areas (53% to 54%) than in remote
areas (46%; Figure 10-6).
Figure 10-6 Oral contraceptive pill use among women aged 18 to 23 in 2013 who reported they had experienced sexual intercourse, stratified by area of residence.
0% 20% 40% 60% 80% 100%
Remote or very remote
Outer regional
Inner regional
Major ci ties
YesNo

131
OCP use varied considerably with educational qualifications. Women aged 18 to 23 with a
university education and those with Year 12 had the highest reported rates of OCP use in 2013,
with 63% and 58% respectively reporting the use of OCP the last time they had vaginal sex (Figure
10-7). In contrast, one-third of women (35%) with less than a Year 12 qualification reported using
OCP. Almost a half of those with a certificate or diploma used OCP.
Figure 10-7 Oral contraceptive pill use among women aged 18 to 23 in 2013 who reported they had experienced sexual intercourse, stratified by level of educational attainment.
0% 20% 40% 60% 80% 100%
Univers i ty
Certi ficate/Diploma
Year 12
Less than Year 12
YesNo

132
10.3.2 Condom use
For women aged 18 to 23 in 2013, the prevalence of condom use as a contraceptive declined
across the age range, from 52% to 39% reporting they used a condom the last time they had
vaginal sex (Figure 10-8).
Figure 10-8 Condom use among women aged 18 to 23 in 2013 who reported they had experienced sexual intercourse, stratified by age.
The prevalence of condom use among women living in major cities, inner and outer regional areas
was 43%. Women living in remote and very remote areas reported the lowest percentage of
condom use, with 40% indicating they used a condom the last time they had vaginal sex. However,
numbers were relatively low in these areas.
0% 20% 40% 60% 80% 100%
23 years
22 years
21 years
20 years
19 years
18 years
YesNo

133
Consistent with OCP use, women with less than Year 12 qualifications were less likely to use
condoms (34%), as were women with a certificate or diploma (38%). Women with Year 12
qualifications and those with university degrees were more likely to use condoms (44% to 47%;
Figure 10-9).
Figure 10-9 Condom use among women aged 18 to 23 in 2013 who reported they had experienced sexual intercourse, stratified by level of educational attainment.
0% 20% 40% 60% 80% 100%
Univers i ty
Certi ficate/Diploma
Year 12
Less than Year 12
YesNo

134
10.3.3 Other forms of contraception
Overall 15% of women used other forms of contraception: Implanon, Mirena, Depo-Provera,
Nuva-Ring and others. The use of other forms of contraception was similar across age, ranging
from 14% to 17% between the ages of 18 and 23.
Use of other forms of contraception increased with rurality from 15% in major cities to 19% in
remote or very remote areas (Figure 10-10).
Figure 10-10 Contraceptive use other than OCP or condoms among women aged 18 to 23 in 2013 who reported they had experienced sexual intercourse, stratified by area of residence.
0% 20% 40% 60% 80% 100%
Remote or very remote
Outer regional
Inner regional
Major ci ties
YesNo

135
Women with less than Year 12 qualifications or a certificate or diploma had the highest reported
use of other contraceptive use (19% and 18% respectively). Those with Year 12 or a university
education had lower reported rates of use of other forms of contraception (13% and 14%
respectively; Figure 10-11).
Figure 10-11 Contraceptive use other than OCP or condoms among women aged 18 to 23 in 2013 who reported they had experienced sexual intercourse, stratified by level of educational attainment.
0% 20% 40% 60% 80% 100%
Univers i ty
Certi ficate/Diploma
Year 12
Less than Year 12
YesNo

136
10.3.4 No contraceptive use
Women aged 22 to 23 in 2013 had a slightly higher prevalence (13%) of not using a contraceptive
the last time they had vaginal sex, compared with only about 11% of women aged 18 (Figure
10-12).
Figure 10-12 No contraceptive use among women aged 18 to 23 in 2013, stratified by age.
0% 20% 40% 60% 80% 100%
23 years
22 years
21 years
20 years
19 years
18 years
YesNo

137
Women in remote and very remote regions had the highest reported prevalence of no
contraceptive use with over 15% of women indicating they did not use a contraceptive the last
time they had vaginal sex (Figure 10-13). Numbers in these areas were relatively low. For other
regions this figure ranged from 12% to 14%.
Figure 10-13 No contraceptive use among women aged 18 to 23 in 2013, stratified by area of residence.
0% 20% 40% 60% 80% 100%
Remote or very remote
Outer regional
Inner regional
Major ci ties
YesNo

138
Women with less than a Year 12 education had the highest rate of no contraceptive use - 27%
indicating that they did not use a contraceptive the last time they had vaginal sex (Figure 10-14).
Those with a university or Year 12 qualification had the lowest rates of no contraceptive use
(around 7% to 10%). Fifteen percent of women with a certificate or diploma reported no
contraceptive use.
Figure 10-14 No contraceptive use for women aged 18 to 23 in 2013, stratified by level of educational attainment.
0% 20% 40% 60% 80% 100%
Univers i ty
Certi ficate/Diploma
Year 12
Less than Year 12
YesNo
139
Reproductive events 10.4
Of the women aged 18 to 23 in 2013, 14% indicated that they had ever been pregnant, compared
with 17% for women in this age range in 1996 (Figure 10-15; Explanatory Notes for Section 10).
Just 1.3% of women in 2013 reported that they were currently pregnant, while the corresponding
percentage in 1996 was double this at 2.6%.
Figure 10-15 Comparison of women aged 18 to 23 in 1996 and 2013 who had ever been pregnant, weighted for age and area of residence.
0% 20% 40% 60% 80% 100%
18-23 years in 2013
18-23 years in 1996
YesNo
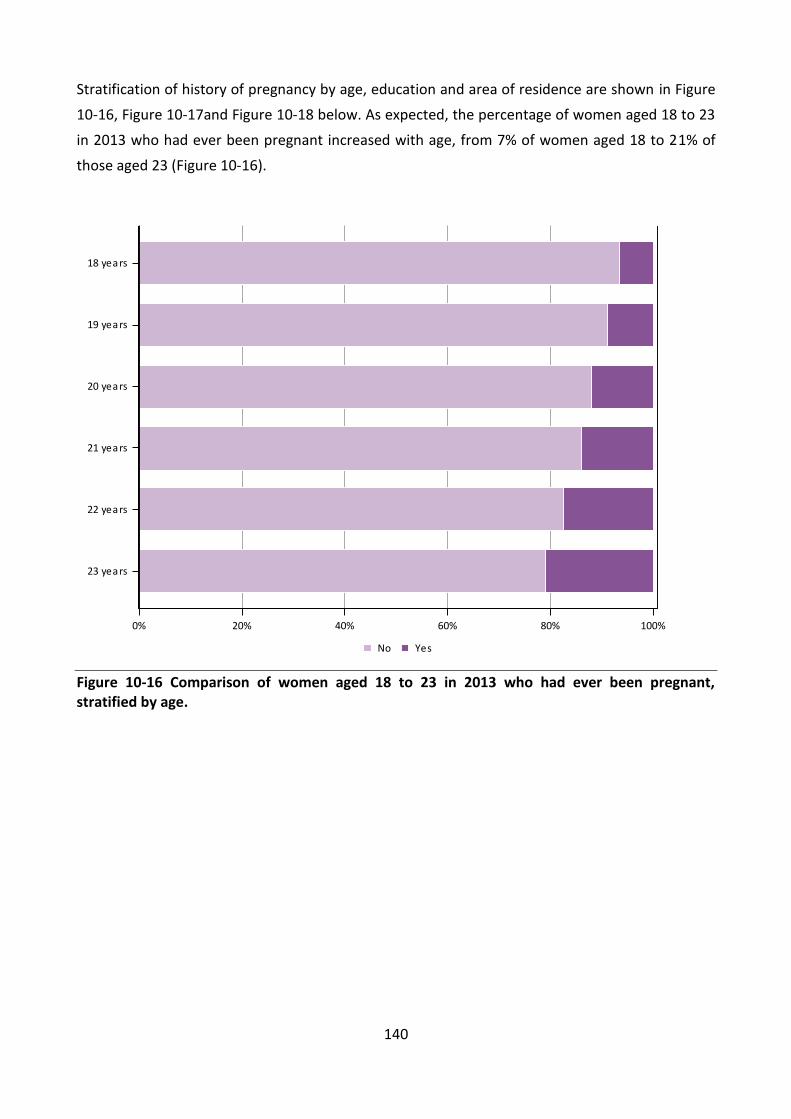
140
Stratification of history of pregnancy by age, education and area of residence are shown in Figure
10-16, Figure 10-17and Figure 10-18 below. As expected, the percentage of women aged 18 to 23
in 2013 who had ever been pregnant increased with age, from 7% of women aged 18 to 21% of
those aged 23 (Figure 10-16).
Figure 10-16 Comparison of women aged 18 to 23 in 2013 who had ever been pregnant, stratified by age.
0% 20% 40% 60% 80% 100%
23 years
22 years
21 years
20 years
19 years
18 years
YesNo

141
The percentage of women in 2013 who had ever been pregnant increased with rurality (Figure
10-17). Major cities had the lowest percentage (12%) of women aged 18 to 23 indicating that they
had ever been pregnant, which was half that reported for women living in remote or very remote
regions (24%). Pregnancy was reported by 18% of women living in inner regional areas and 21% of
women living in outer regional areas.
Figure 10-17 Comparison of women aged 18 to 23 in 2013 who had ever been pregnant, stratified by area of residence.
0% 20% 40% 60% 80% 100%
Remote or very remote
Outer regional
Inner regional
Major ci ties
YesNo

142
History of pregnancy varied considerably by level of educational attainment. Women with less
than Year 12 qualifications had the highest percentage (41%) of those who had ever been
pregnant (Figure 10-18). One in five women (20%) with a certificate or diploma reported that they
had ever been pregnant. In contrast, the percentages for those who had attained Year 12 or
equivalent qualifications or a university qualification were markedly lower at 8% and 7%
respectively.
Figure 10-18 Comparison of women aged 18 to 23 in 2013 who had ever been pregnant, stratified by level of educational attainment.
0% 20% 40% 60% 80% 100%
Univers i ty
Certi ficate/Diploma
Year 12
Less than Year 12
YesNo

143
The vast majority of women aged 18 to 23 in 1996 and 2013 had never experienced a pregnancy;
however, this figure had increased to 86% in 2013 from 83% in 1996 (Figure 10-19). In 2013, 8% of
the women had experienced one pregnancy and 3% reported having experienced two
pregnancies, compared with 11% and 5% respectively for women in this age group in 1996. In
both 1996 and 2013 very few women (less than 2%) had experienced three or more pregnancies.
As the prevalence of women experiencing pregnancies decreased from 1996 to 2013,
unsurprisingly so did the proportion of women who reported having had a live birth (9% to less
than 6% respectively).
Figure 10-19 Comparison of number of pregnancies for women aged 18 to 23 in 1996 and 2013, weighted for age and area of residence.
The proportion of women aged 18 to 23 who had experienced a miscarriage was similar in 1996
and 2013, with 4% of women at both time points indicating that they had experienced a
miscarriage. The proportion of women in this age group who reported terminations was 7% in
1996 and 6% in 2013.
0% 20% 40% 60% 80% 100%
18-23 years in 2013
18-23 years in 1996
3 or more pregnancies2 pregnancies1 pregnancyNo pregnancies

144
Summary 10.5
In 2013, 86% of 18 to 23 year old women had experienced vaginal sex.
Levels of sexually transmitted infections were similar for women aged 18 to 23 in 1996 and 2013.
Most women who were not pregnant used contraception the last time they had vaginal sex.
Contraception included:
oral contraceptive pill for more than half the women;
condoms for more than 40% of women;
other forms of contraception for 15% of women.
Contraception was more commonly used:
in major cities;
by women with Year 12 or university qualifications.
Fewer women aged 18 to 23 in 2013 reported experiencing a pregnancy than in 1996. In 2013,
pregnancy had been experienced by:
less than one in ten 18 and 19 year olds;
around one in five 22 and 23 year olds;
one in eight women living in major cities;
around one in five women living outside major cities;
more than 40% of women with less than Year 12 qualifications;
one in five women with a certificate or diploma;
less than one in ten women with Year 12 or university qualifications.

145
Access to health services 11
Female doctors 11.1
Women’s preferences for a woman doctor changed little between 1996 and 2013; most women
aged 18 to 23 either preferred to see a woman doctor only ‘for certain things’ or did not care.
Only around 20% always preferred to see a woman doctor (Figure 11-1). However, there were
some demographic differences in women’s preferences.
Figure 11-1 Preference to see a female doctor among women aged 18 to 23 in 1996 and 2013, weighted by age and area of residence.
0% 20% 40% 60% 80% 100%
18-23 years in 2013
18-23 years in 1996
Don't careNoCerta in thingsAlways

146
The preference for seeing a woman doctor varied across the age range, with the highest
percentage who did not care (33%) or who always preferred a women doctor (27%) among
women aged 18 and the lowest percentage reported by women aged 23 (30% and 19%
respectively; Figure 11-2). Conversely, the prevalence of women who preferred to see a female
doctor for ‘certain things’ increased across the age range.
Figure 11-2 Preference to see a female doctor among women aged 18 to 23 in 2013, stratified by age.
0% 20% 40% 60% 80% 100%
23 years
22 years
21 years
20 years
19 years
18 years
Don't careNoCerta in thingsAlways

147
This age-related change in preference to see a woman doctor probably underlies the differences
by education shown in Figure 11-3. Those women with Year 12 or equivalent education were likely
to be younger and hence had a stronger preference for always seeing a woman doctor. In
contrast, those who had attained a university degree were older with a preference for only seeing
a woman doctor for ‘certain things’.
Figure 11-3 Preference to see a female doctor among women aged 18 to 23 in 2013, stratified by highest educational level.
0% 20% 40% 60% 80% 100%
Univers i ty
Certi ficate/Diploma
Year 12
Less than Year 12
Don't careNoCerta in thingsAlways
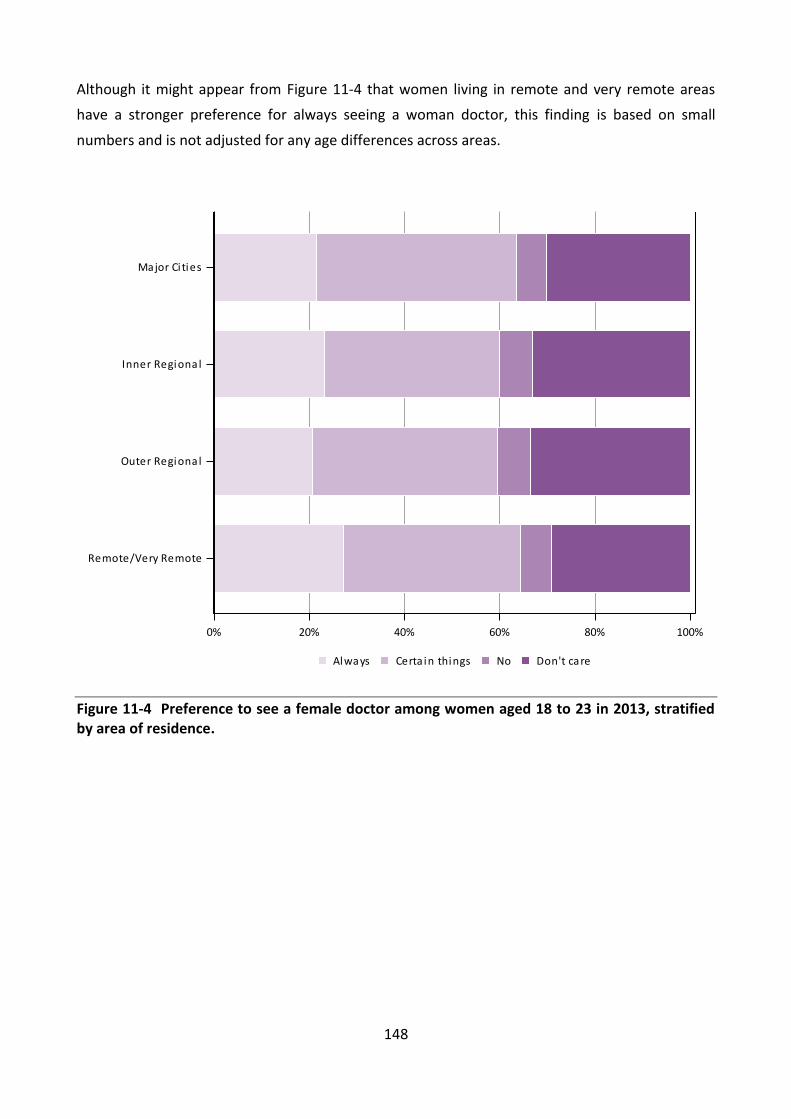
148
Although it might appear from Figure 11-4 that women living in remote and very remote areas
have a stronger preference for always seeing a woman doctor, this finding is based on small
numbers and is not adjusted for any age differences across areas.
Figure 11-4 Preference to see a female doctor among women aged 18 to 23 in 2013, stratified by area of residence.
0% 20% 40% 60% 80% 100%
Remote/Very Remote
Outer Regional
Inner Regional
Major Ci ties
Don't careNoCerta in thingsAlways
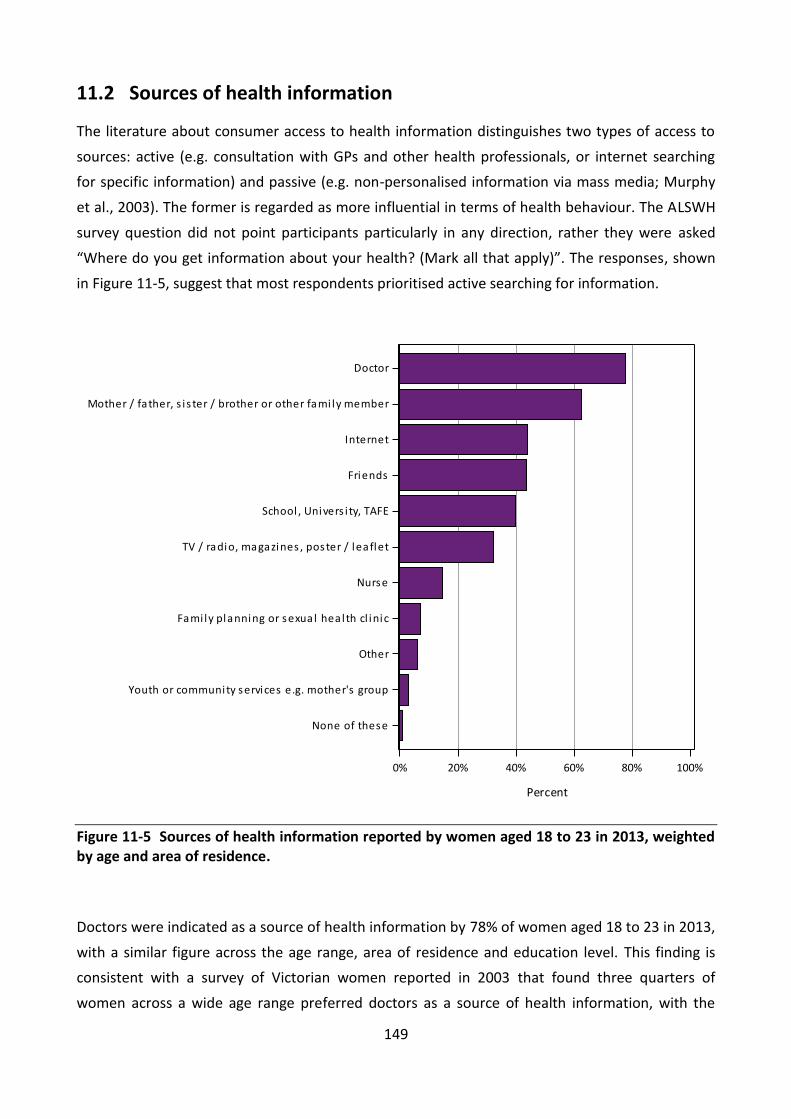
149
Sources of health information 11.2
The literature about consumer access to health information distinguishes two types of access to
sources: active (e.g. consultation with GPs and other health professionals, or internet searching
for specific information) and passive (e.g. non-personalised information via mass media; Murphy
et al., 2003). The former is regarded as more influential in terms of health behaviour. The ALSWH
survey question did not point participants particularly in any direction, rather they were asked
“Where do you get information about your health? (Mark all that apply)”. The responses, shown
in Figure 11-5, suggest that most respondents prioritised active searching for information.
Figure 11-5 Sources of health information reported by women aged 18 to 23 in 2013, weighted by age and area of residence.
Doctors were indicated as a source of health information by 78% of women aged 18 to 23 in 2013,
with a similar figure across the age range, area of residence and education level. This finding is
consistent with a survey of Victorian women reported in 2003 that found three quarters of
women across a wide age range preferred doctors as a source of health information, with the
0% 20% 40% 60% 80% 100%
Percent
None of these
Youth or community services e.g. mother's group
Other
Fami ly planning or sexual heal th cl inic
Nurse
TV / radio, magazines , poster / leaflet
School , Univers i ty, TAFE
Friends
Internet
Mother / father, s i s ter / brother or other fami ly member
Doctor

150
internet, family and friends as the only other common sources; doctors were also regarded as the
most credible sources (Murphy et al., 2003).
In the ALSWH survey, doctors were followed by family members as a source of health information
– identified by 62% of women. However, there was a clear age related trend: among women aged
18 to 19, 68% cited family members as sources of information, but this declined to 56% among
those aged 23. With respect to education level, the percentage of women who cited family
members as a source of health information was lowest among those who had not completed Year
12 qualifications.
Overall 44% of women identified the internet as a source of health information. This was higher
among those living in the major cities than elsewhere. Use of the internet as a source of health
information increased with age from 37% among women aged 18 to 49% among those aged 23,
and was higher among those with higher levels of education.
Friends were identified as a source of information by 44% of the women. This was similar across
all ages but higher in major cities and among the more educated women.
School, university and TAFE were reported as sources of health information by 40% of women
aged 18 to 23 in 2013. As might be expected, women with more contact with these institutions
were more likely to cite them - younger women, those with more education and those living in
major cities.
Conventional media such as television, radio, magazines, posters and leaflets were reported by
32% of the women as sources of information. This was similar across age groups and areas but
lower among women who had not attained Year 12 qualifications.
Although nurses were only endorsed by 15% of women aged 18 to 23 as sources of information,
the percentages varied from 13% in major cities to 31% in remote and very remote areas. Women
who cited nurses as a source of health information had lower levels of education. All the other
sources of information listed in the response options were endorsed by fewer than 10% of
women.

151
Medicare cards 11.3
To be eligible for this study, participants had to have a valid Medicare number. All the women in
the 1989-95 cohort would have been eligible to have their own card but some reported they had a
copy of their parents’ card while others had to borrow their parent’s card. Having to borrow a
Medicare card could be a barrier to access to health services.
Overall 69% had their own Medicare card while 13% had a copy of a parent’s card and 18% had to
borrow their parents’ card. The percentage of women having their own card increased across the
age range, while the percentage that reported they had to borrow their parents’ card declined
with age (Figure 11-6).
Figure 11-6 Medicare card status of women aged 18 to 23 in 2013, stratified by age.
0% 20% 40% 60% 80% 100%
23 years
22 years
21 years
20 years
19 years
18 years
No, I need to borrow my parent's card
Yes , I have a copy of my parent's cardYes , I have my own card
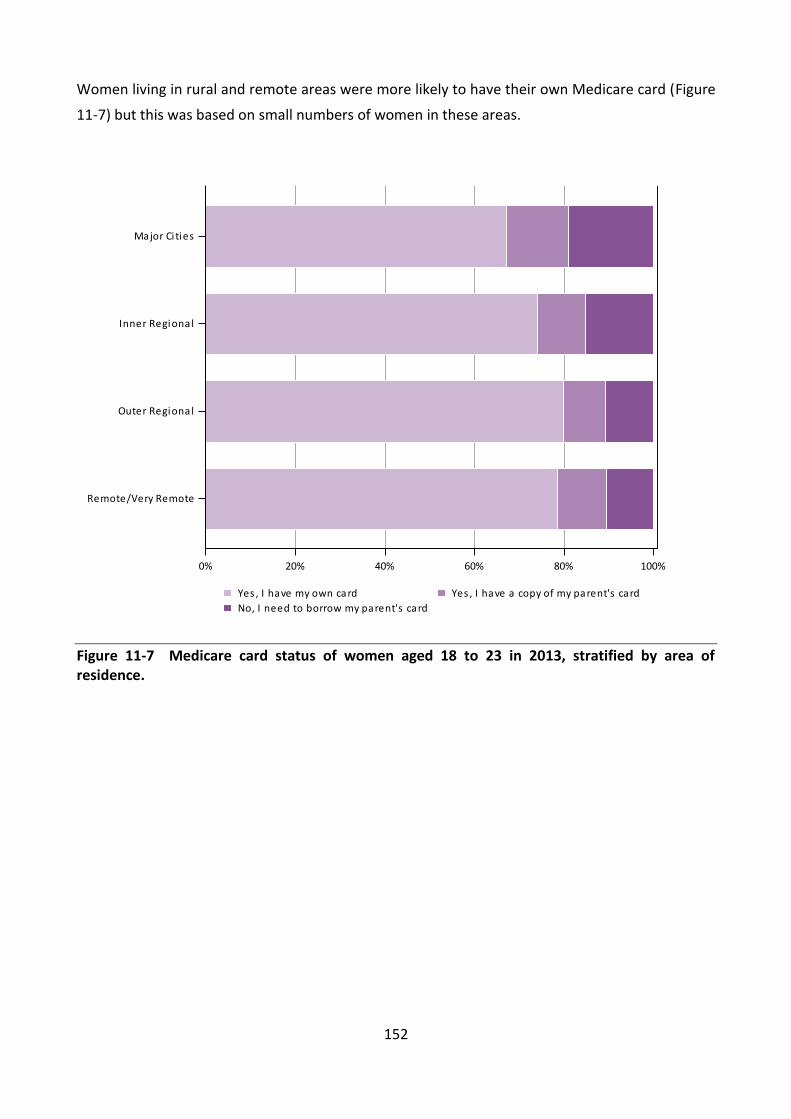
152
Women living in rural and remote areas were more likely to have their own Medicare card (Figure
11-7) but this was based on small numbers of women in these areas.
Figure 11-7 Medicare card status of women aged 18 to 23 in 2013, stratified by area of residence.
0% 20% 40% 60% 80% 100%
Remote/Very Remote
Outer Regional
Inner Regional
Major Ci ties
No, I need to borrow my parent's card
Yes , I have a copy of my parent's cardYes , I have my own card

153
Health Care Cards 11.4
The women were also asked if they had a Health Care Card (with the explanation: This is a card
that entitles you to discounts and assistance with medical expenses. This is not the same as a
Medicare card.) These cards are available to full-time students and people receiving a variety of
different social security benefits. They are intended to relieve cost pressures for health care
among those with very low incomes.
Overall 33% of women aged 18 to 23 in 2013 reported having a Health Care Card, and this
percentage was higher than among women of the same age who responded to the Australian
Health Survey 2011-12 (28%). Having a Health Care Card decreased with age and higher levels of
educational attainment (Figure 11-8).
Figure 11-8 Health Care Card status of women aged 18 to 23 in 2013, stratified by level of educational attainment.
0% 20% 40% 60% 80% 100%
Univers i ty
Certi ficate/Diploma
Year 12
Less than Year 12
NoYes

154
With respect to area of residence, the highest percentage of women having a Health Care Card
was among those who lived in an inner regional area (39%), with the lowest percentage reported
by those living in remote areas (21%; Figure 11-9).
Figure 11-9 Health Care Card status of women aged 18 to 23, stratified by area of residence.
0% 20% 40% 60% 80% 100%
Remote/Very Remote
Outer Regional
Inner Regional
Major Ci ties
NoYes

155
Preventive services and health screening 11.5
11.5.1 Pap tests
Women aged 18 to 23 in 2013 were asked about their use of various screening and preventive
health services.
The results for Pap tests are shown for all women, regardless of reported sexual activity. Overall,
52% of the women reported having had a Pap test within the last two years, which was a little
more than the percentage of women in this age group in 1996 (48%). As expected, use of Pap
tests increased strongly with age (Figure 11-10). The results were similar across areas of
residence.
Figure 11-10 Pap test status of women aged 18 to 23 in 2013, stratified by age.
0% 20% 40% 60% 80% 100%
23 years
22 years
21 years
20 years
19 years
18 years
NoYes

156
11.5.2 Blood pressure checks
Women aged 18 to 23 in 2013 were also asked if they had had their blood pressure checked
within the last two years; 86% reported that they had, and this percentage increased with age
(Figure 11-11) with few differences with area of residence or by level of educational attainment.
Figure 11-11 Blood pressure check status of women aged 18 to 23 in 2013, stratified by age.
11.5.3 Skin checks
The percentage of women aged 18 to 23 in 2013 who reported having had their skin checked for
spots, lesions or moles was 30% overall, and this percentage increased with age and the level of
educational attainment, but did not vary with area of residence.
0% 20% 40% 60% 80% 100%
23 years
22 years
21 years
20 years
19 years
18 years
NoYes

157
11.5.4 HPV Vaccination
Women aged 18 to 23 in 2013 would have been eligible for the free HPV vaccination program as
they would have been at school when it was introduced in 2007. It was surprising therefore, that
only 83% reported they had ever been vaccinated for HPV. This finding was similar across all
areas. Reporting of HPV vaccination was lowest among women aged 18 (78%) and highest among
those aged 21 or more (85-86%). It was lowest among those with the lowest level of educational
attainment (Figure 11-12).
Figure 11-12 HPV vaccination status of women aged 18 to 23, stratified by educational attainment.
Participants were not asked how many doses of the HPV vaccination they had received so full
coverage cannot be estimated. However, the finding is very similar to that reported recently by
Brotherton and colleagues (2013) who found the prevalence of at least one dose among girls who
would have been aged 12 to 17 in 2007 was 83%. While Brotherton and colleagues (2013) found
differences in coverage between States and Territories, the ALSWH data from women aged 18 to
23 in 2013 can provide greater insight into inequities in reported coverage of this program that
0% 20% 40% 60% 80% 100%
Univers i ty
Certi ficate/Diploma
Year 12
Less than Year 12
NoYes

158
appears to be effective against cervical abnormalities (Crowe et al., 2014). In particular it will be
possible to explore the finer geographic and socio-economic differences, and compare
behavioural patterns between those who reported not having received HPV vaccinations and
those who did.
Summary 11.6
Women’s preferences for a female doctor changed with age but there was little evidence that the
patterns have changed over time or that they differed by other factors.
For women aged 18-23 in 2013:
one in five women preferred to see a female doctor all of the time;
two out of five women preferred to see a female doctor for ‘certain things’.
When women aged 18 to 23 in 2013 were asked where they obtained information about their
health:
78% identified doctors, with a similar figure across the age range, area of residence and
education level;
62% identified family members, but this percentage decreased with age and was lowest
among those with less than Year 12 qualifications;
44% identified the internet, with this percentage being higher among those living in the
major cities, older women and those with higher levels of education.
Overall, 69% of the women had their own Medicare card and this percentage increased with age.
Conversely, the proportion of women possessing a Health Care Card (33%) decreased with age.
For women aged 18 to 23 in 2013:
more than half (52%) the women reported having had a Pap test within the last two years,
which was slightly more than the percentage of women in the age group in 1996 (48%);
86% of women reported that they had their blood pressure checked, and 30% of women
reported having their skin checked for “spots, lesions, moles”;
The proportion of women reporting having had a Pap test, skin check or blood pressure
check increased with age;
83% reported they had been vaccinated for HPV, with the lowest proportion reported by
women aged 18 (78%) and those with the lowest levels of educational attainment.
159
Reference 11.7
Brotherton J, Murray S, Hall M, Andrewartha L, Banks C, Meijer D, Pitcher H, Scully M &
Molchanoff L. 2013, ‘Human papillomavirus vaccine coverage among female Australian
adolescents: success of the school-based approach’, Medical Journal of Australia, vol. 199, no. 9,
pp. 614-617.
Crowe E, Pandeya N, Brotherton J, Dobson A, Kisely S, Lambert S & Whiteman D. 2014,
‘Effectiveness of quadrivalent human papillomavirus vaccine for the prevention of cervical
abnormalities: case-control study nested within a population based screening programme in
Australia’, British Medical Journal, vol. 348, pp. g1458.
Murphy M. 2003, ‘Access to women's health information (5): research summary’ Melbourne:
Women's Health Victoria. Available at: http://whv.org.au/publications-resources/publications-
resources-by-topic/post/access-to-womens-health-information-5-research-summary/

160
Explanatory notes 12
Explanatory Notes for Section 2 12.1
Table 12-1 Survey schedules, ages, and participant numbers for the three original ALSWH cohorts
Survey 1973-78 cohort 1946-51 cohort 1921-26 cohort
Survey 1
1996
Age 18-23
N=14 247
1996
Age 45-50
N=13 715
1996
Age 70-75
N=12 432
Survey 2
2000
Age 22-27
N=9688
1998
Age 47-52
N=12 338
1999
Age 73-78
N=10 434
Survey 3
2003
Age 25-30
N=9081
2001
Age 50-55
N=11 226
2002
Age 76-81
N=8647
Survey 4
2006
Age 28-33
N=9145
2004
Age 53-58
N=10 905
2005
Age 79-84
N=7158
Survey 5
2009
Age 31-36
N= 8200
2007
Age 56-61
N=10 638
2008
Age 82-87
N=5561
Survey 6
2012
Age 34-39
*N = 8010
2010
Age 59-64
N = 10 011
2011
Age 85-90
**N=3759
Survey 7
2015
Age 37-42
2013
Age 62-67
*As at March 2014
**From 2011 onwards, the 1921-26 cohort have been surveyed every six months

161
Explanatory Notes for Section 3 12.2
Glossary of Social Media Terminology
Avant Card
- a specialised promotion company with a national network of venues that display free
postcards and mini-magazines.
Blog (and microblog)
- a website where an individual or a group of individuals, write about opinions, experiences and
observations. Blogs can be used to repost information or share links to other websites, videos
or images. A single entry is also referred to as a blog. A microblog is a short version of a blog,
typically just a sentence, image or link to another website or video.
- a social networking website that allows users to create a profile and become “friends” with
other users. Communication occurs through private messages between users, and public or
private postings on Facebook walls or group pages. Paid advertisements are displayed to
users and can be tailored to target specific groups of users based on the information provided
in their Facebook profiles.
Gumtree
- a free Australian online classified advertisement and community website with national
coverage. Advertisements must be unique and posted to a specific suburb, town or region.
Hashtag
- a type of search term used by social media websites consisting of a word or phrase without
spaces following a hash symbol (e.g. #ALSWH). Hashtags are generally used to identify themes
relevant to a post.
- a social networking website that centres on photo and video sharing. Users can upload
images along with a text description and hashtags which appear in their followers’ newsfeeds
or to users searching for a specific hashtag.
Social Media
- a form of online communication enabling social networking by allowing users to share
information with one another through videos, written messages and photos.

162
- a microblogging service that allows users to read and post “tweets” (short text messages
limited to 140 characters), as well as “re-tweet” (re-blog) and respond to other users’
“tweets”. Users’ “tweets” are displayed in their followers’ feed or to users searching for a
specific hashtag. Users can also see “trending” hashtags (the most popular hashtags at that
time).
Tumblr
- a social networking website and microblogging platform that primarily involves visual media,
but also has the capacity for longer text entries. Users can follow blogs, search hashtags, as
well as comment, like or re-blog posts.
Video or blog seeding
- a form of online advertising where videos or blogs are promoted through existing social
media platforms, either through paid advertisement or spread through word of mouth.
Embedding videos in an existing blog that is popular with the targeted audience is one type of
video seeding.
Web forum
- online discussion websites where users can hold conversations in the form of posted public
messages. Conversations are organised on similar topics called “threads”.
YouTube
- a video sharing website that allows users to upload, view, and comment on short videos. Paid
advertising is available through YouTube, where a short paid video is shown before the
requested clip begins to play. Paid YouTube advertising can be targeted at general
demographics.
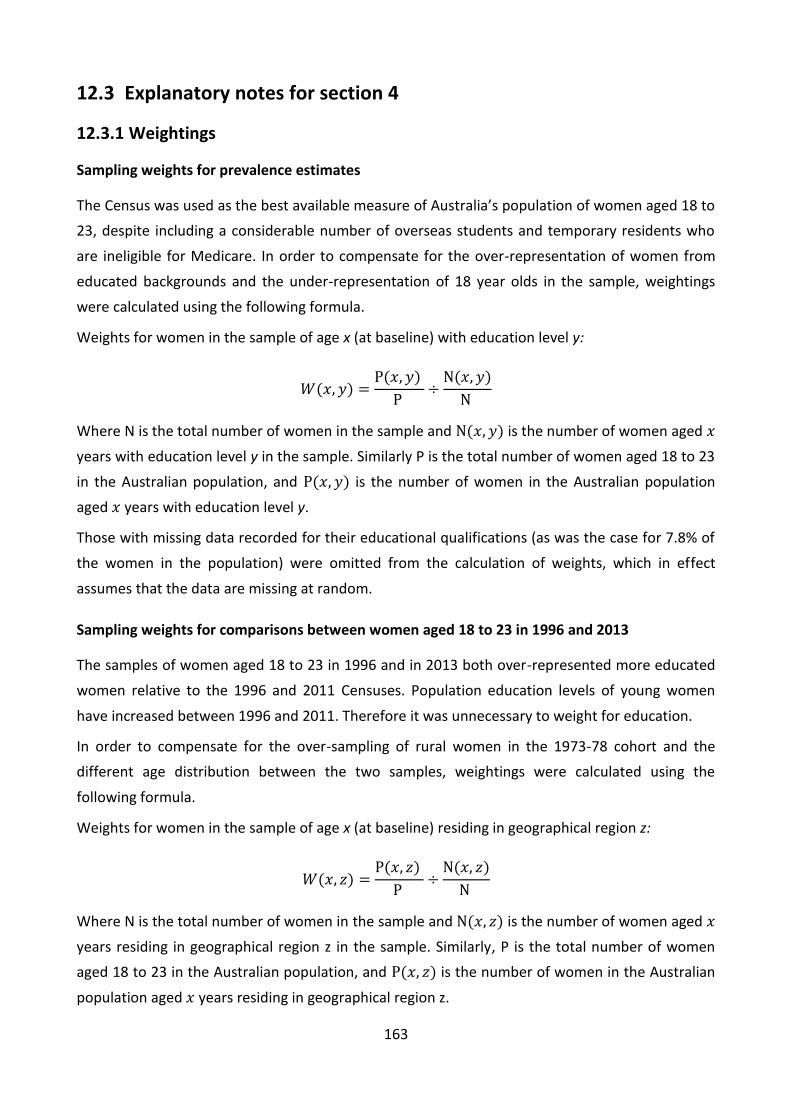
163
Explanatory notes for section 4 12.3
12.3.1 Weightings
Sampling weights for prevalence estimates
The Census was used as the best available measure of Australia’s population of women aged 18 to
23, despite including a considerable number of overseas students and temporary residents who
are ineligible for Medicare. In order to compensate for the over-representation of women from
educated backgrounds and the under-representation of 18 year olds in the sample, weightings
were calculated using the following formula.
Weights for women in the sample of age x (at baseline) with education level y:
Where N is the total number of women in the sample and is the number of women aged
years with education level y in the sample. Similarly P is the total number of women aged 18 to 23
in the Australian population, and is the number of women in the Australian population
aged years with education level y.
Those with missing data recorded for their educational qualifications (as was the case for 7.8% of
the women in the population) were omitted from the calculation of weights, which in effect
assumes that the data are missing at random.
Sampling weights for comparisons between women aged 18 to 23 in 1996 and 2013
The samples of women aged 18 to 23 in 1996 and in 2013 both over-represented more educated
women relative to the 1996 and 2011 Censuses. Population education levels of young women
have increased between 1996 and 2011. Therefore it was unnecessary to weight for education.
In order to compensate for the over-sampling of rural women in the 1973-78 cohort and the
different age distribution between the two samples, weightings were calculated using the
following formula.
Weights for women in the sample of age x (at baseline) residing in geographical region z:
Where N is the total number of women in the sample and is the number of women aged
years residing in geographical region z in the sample. Similarly, P is the total number of women
aged 18 to 23 in the Australian population, and is the number of women in the Australian
population aged years residing in geographical region z.

164
Those with missing data recorded for their area of residence were omitted from the calculation of weights, which in effect assumes that the data are missing at random.
12.3.2 Consent to data linkage
Table 12-2 Characteristics of consenters and non-consenters with complete data for all variables in the table (N = 21,620)
Consenters Non-consenters Chi-sq
Variables (n=16,757) % (n = 4,863) % p value
Age
18 15.7 16.8 0.029
19 18.3 19.6
20 17.6 16.0
21 15.9 15.5
22 16.3 16.1
23 16.2 15.9
Area of residence
Major cities 75.3 73.9 0.106
Inner regional 16.9 17.5
Outer regional 6.7 7.1
Remote and very remote 1.1 1.4
Income
Difficult to impossible 61.4 60.9 0.521
Not too bad to easy 38.6 39.1
Education
Year 12 or below 51.1 50.0 0.162
Certificate/Diploma 27.3 27.1
University 21.6 22.9
Health status
SF 1
Good to excellent 82.3 83.0 0.253
Fair to poor 17.7 17.0
K10
Low (10-15) 19.8 20.6 0.655
Med (16-21) 29.4 29.1
High (22-29) 27.6 27.0
Very high (30-50) 23.3 23.3
Conditions
Diabetes 0.4 0.5 0.374
Heart disease 0.4 0.6 0.167
Hypertension 1.4 2.0 0.003
Low iron 31.2 29.7 0.055
Asthma 25.8 26.7 0.191
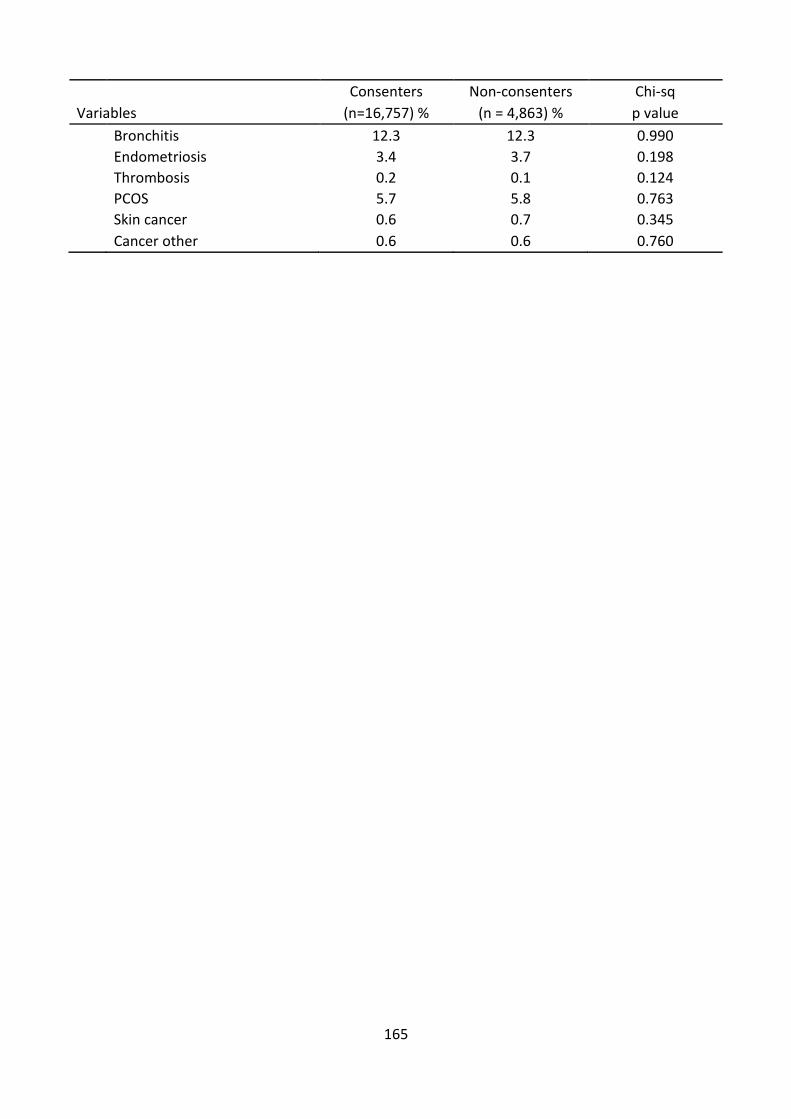
165
Consenters Non-consenters Chi-sq
Variables (n=16,757) % (n = 4,863) % p value
Bronchitis 12.3 12.3 0.990
Endometriosis 3.4 3.7 0.198
Thrombosis 0.2 0.1 0.124
PCOS 5.7 5.8 0.763
Skin cancer 0.6 0.7 0.345
Cancer other 0.6 0.6 0.760

166
Explanatory Notes for Section 5 12.4
12.4.1 Area of residence
Participants were asked for their residential postcode in the first surveys of the 1973-78 and 1989-
95 cohorts. The method of geocoding used was the ARIA Accessibility/Remoteness Index of
Australia (Department of Health and Aged Care 2001) and ARIA+. ARIA was developed in 2001 by
the National Key Centre for Social Applications of Geographic Information Systems (GISCA) as a
measure of remoteness based on road distances to service centres. In 2003, GISCA released a new
version of the ARIA, called ARIA+. The major difference between ARIA and ARIA+ was the inclusion
of a fifth service centre category including all urban centres with population of greater than 1,000
and fewer than 5,000 people, thus allowing more detailed representation of remoteness across
Australia.
ARIA+ scores range from 0 – 15. These scores are further categorised as:
ARIA+ Score Category
0 – 0.20 Major Cities of Australia
>0.20 – 2.40 Inner Regional Australia
>2.40 – 5.92 Outer Regional Australia
>5.92 – 10.53 Remote Australia
>10.53 Very Remote Australia
Explanation of how the data were harmonised
To make comparisons between the two cohorts, the ARIA+ variable is used for the 1989-95 cohort
and an estimate of the ARIA+ is used for data from the 1996 survey of the 1973-78 cohort. Due to
very small numbers of women in both the 1973-78 and 1989-95 cohorts residing in very remote
areas, the categories of remote and very remote were combined.
12.4.2 Education
Explanation of how the data were harmonised for level of educational attainment
Questions about the level of educational attainment achieved were asked in the first survey for
both cohorts (Table 12-3). As the questions were not identically asked, harmonisation of the data
was required. The table below shows the question asked in each survey and the response options
available to participants.

167
Table 12-3 Questions on level of educational attainment in the first survey of women aged 18 to 23 in 1996 and 2013
1973-78 cohort in 1996 1989-95 cohort in 2013
Q78. What is the highest qualification you
have completed? (Circle one number only)
Response options:
No formal qualifications
School Certificate (Year 10 or equivalent)
Higher School Certificate (Year 12 or
equivalent)
Trade/apprenticeship (e.g. Hairdresser,
Chef)
Certificate/diploma (e.g. Child Care,
Technician)
University degree
Higher University degree (e.g. Grad Dip,
DipMasters, PhD
Q50. What is the highest level of education
you have completed? (Mark one only)
Response options:
Year 10 or below
Year 11 or equivalent
Year 12 or equivalent
Certificate I / II
Certificate III / IV
Advanced Diploma / Diploma
Bachelor degree
Graduate diploma / Graduate certificate
Postgraduate degree
To enable comparisons between the two cohorts, four educational categories were created for
each cohort, as shown in Table 12-4.
Table 12-4 Harmonisation of the level of educational attainment question in the first survey of women aged 18 to 23 in 1996 and 2013
Category 1973-78 cohort in 1996
response options
1989-95 cohort in 2013 response
options
Less than Year 12 No formal qualifications
School Certificate (Year 10 or equivalent)
Year 10 or below
Year 11 or equivalent
Year 12
Higher School Certificate (Year 12 or equivalent)
Year 12 or equivalent
Certificate or diploma
Trade/apprenticeship (e.g. Hairdresser, Chef)
Certificate/diploma (e.g. Child Care, Technician)
Certificate I / II
Certificate III / IV
Advanced Diploma / Diploma
University
University degree
Higher University degree (e.g. Grad Dip, Masters, PhD)
Bachelor degree
Graduate diploma / Graduate certificate
Postgraduate degree

168
Explanation of how the data were harmonised for current participation in study
Questions about current participation in study were asked in the first survey for both cohorts. As
the questions were not identically asked, harmonisation of the data was required, as shown
below. Table 12-5 below shows the question asked in each survey and the response options
available to participants.
Table 12-5 Questions on participation in study in the first survey of women aged 18 to 23 in 1996 and 2013
1973-78 cohort in 1996 1989-95 cohort in 2013
77. Are you currently attending an educational institution?
(Circle one number only)
Response options:
No
Yes, part-time student
Yes, full-time student
53. In a usual week, how many hours do you spend studying?
Response options:
0
1-15
16-29
30-34
35-40
41-49
50+
To enable comparisons between the two cohorts, two categories representing participation or no
participation in study were created for each cohort, as shown in Table 12-6.
Table 12-6 Harmonisation of the question on participation in study in the first survey of women aged 18 to 23 in 1996 and 2013
Category 1973-78 in 1996 response
options
1989-95 in 2013
response options
Studying Yes, part-time student
Yes, full-time student
1-15 (hours)
16-29
30-34
35-40
41-49
50+
Not studying No 0 (hours)

169
12.4.3 Marital Status
Explanation of how the data were harmonised
Questions about marital status were asked in the first surveys for both cohorts. As the questions
were not identically asked, harmonisation of the data was required. Table 12-7 below shows the
questions asked in each survey and the response options available to participants.
Table 12-7 Questions on marital status in the first survey of women aged 18 to 23 in 1996 and 2013
1973-78 cohort in 1996 1989-95 cohort in 2013
Q84. What is your PRESENT marital status?
(Circle one number only)
Response options:
Married
Defacto (opposite sex)
Defacto (same sex)
Separated
Divorced
Widowed
Never married
Q57. What is your current relationship status?
(mark the response that best suits your current
circumstances)
Response options:
I am single
I am in a relationship (not living together)
I am living with a partner
I am engaged
I am married
I am divorced
I am separated
Other (please specify) _______________
Q58. What are your living arrangements? (Mark
all that apply)
I live alone
I live with one or both parents
I live with other adults
I live with my male partner
I live with my female partner
I live with children
Other (please specify) _______________
To enable comparisons between the two cohorts six categories were created for each cohort, as
shown in Table 12-8. Question 58 from the 1989-95 cohort survey that asked about living
arrangements and identified male or female partners was also used to harmonise this question.

170
Table 12-8 Harmonisation of the question on marital status in the first survey of women aged 18 to 23 in 1996 and 2013
Category 1973-78 cohort in 1996 response
options
1989-95 cohort in 2013 response
options
Married - Married - I am married
Defacto
- Defacto (same sex)
- Defacto (opposite sex)
- I am living with a partner
- I am engaged & I live with my
male partner
- I am engaged & I live with my
female partner
- Other text
Never married
- Never married - I am single
- I am in a relationship (not living
together)
- I am engaged & I DO NOT live with
my male partner
- I am engaged & I DO NOT live with
my female partner
- Other text
Separated/
divorced/ widowed
- Separated
- Divorced
- Widowed
- I am separated
- I am divorced
- Other text
12.4.4 Living arrangements
Explanation of how the data were harmonised
Questions about living arrangements were asked in the first survey for both cohorts. As the
questions were not identically asked, harmonisation of the data was required as shown below.
The table below (Table 12-9) shows the question asked in each survey and the response options
available to participants.

171
Table 12-9 Questions on living arrangements in the first survey of women aged 18 to 23 in 1996 and 2013
1973-78 cohort in 1996 1989-95 cohort in 2013
Q67. Who lives with you?
(Circle one number on each line)
a No-one, I live alone
b Partner/spouse
c Own children
d Someone else’s children
e Parents
f Brothers/sisters
g Other adult relatives
h Other adults who are not family members
Response options:
Yes
No
Q58. What are your living arrangements?
(Mark all that apply)
Response options:
I live alone
I live with one or both parents
I live with other adults
I live with my male partner
I live with my female partner
I live with children
Other (please specify) _____________
To enable comparisons between the two cohorts non-mutually exclusive categories were created
for each cohort:
o Alone – defined as lives with no other person.
o Partner – defined as lives with a partner or spouse. May or may not live with other people
including parents, adults, brothers or sisters, etc.
o Parents – defined as lives with a parent or both parents. May or may not live with other
people including partner, children, etc.
o Children – defined as lives with children
The response options from each survey used to create each category are shown in Table 12-10.

172
Table 12-10 Harmonisation of living arrangements question in the first survey of women aged 18 to 23 in 1996 and 2013
Category 1973-78 cohort in 1996 response options
1989-95 cohort in 2013 response options
Alone No-one, I live alone
I live alone
Partner Partner/spouse
I live with my male partner or I live with my female partner
Parents Parents
I live with one or both parents
Children Own children or Someone else’s children
I live with children
12.4.5 Paid employment
Explanation of how the data were harmonised
Questions about employment were asked in the first survey for both cohorts. As the questions
were not identically asked, harmonisation of the data was required. Table 12-11 below shows the
question asked in each survey and the response options available to participants.
Table 12-11 Questions on employment participation in the first survey of women aged 18 to 23 in 1996 and 2013
1973-78 cohort in 1996 1989-95 cohort in 2013
Q58. How many hours do you normally spend in all your PAID jobs each week? Response options:
1-15
16-24
25-34
35-40
41-48
49 hours or more
Note: There was a “skip” on this question Participants were only directed to this question if they answered that they were in full or part-time work as their MAIN activity on the earlier question 57.
Q52. In a usual week, how many hours do you spend doing paid work? Response options:
0
1-15
16-29
30-34
35-40
41-49
50+

173
To enable comparisons between the two cohorts, three categories representing working part-
time, working full-time or not working were created for each cohort, as shown in Table 12-12. Part
time was defined as between 1 and 34 hours, and full time was defined as working more than 34
hours.
Table 12-12 Harmonisation of the question on participation in employment in the first survey of women aged 18 to 23 in 1996 and 2013
Category 1973-78 cohort in 1996
response options
1989-95 cohort in 2013 response
options
Not working
Response of work without
pay, home duties only,
studying, unemployed,
unpaid voluntary work,
unable to work or Other
from Question 57
0 (hours)
1-34 hours
1-15
16-24
25-34
1-15
16-29
30-34
35 hours or more
35-40
41-48
49 hours or more
35-40
41-49
50+
12.4.6 Income management
Explanation of how the data were harmonised
Questions about income management were asked in the first survey for both cohorts. The questions were asked identically, so harmonisation of the data was not required.
12.4.7 References
Department of Health and Aged Care (GISCA). 2001, Measuring remoteness: Accessibility/
remoteness index of Australia (ARIA), Revised Ed, Occasional Papers: New Series Number 14,
Department of Health and Aged Care, Canberra.

174
Explanatory Notes for Section 6 12.5
12.5.1 Physical activity
(a) Physical activity questions in 1989-95 cohort (2013)
The next questions are about the physical activity you do in leisure time and for getting to and
from places. Please state how many times you did each type of activity last week, and how much
time you spent altogether doing each type of activity last week.
Only count activities that lasted for 10 minutes or more; add up all the times you spent in each activity to get the total time for each activity. (If you did not do an activity, please type "0")
Number of Times Hours Minutes
Walking briskly (for recreation or exercise, or to get from place to place)
Moderate leisure activity (like social tennis, moderate exercise classes, recreational swimming, dancing)
Vigorous leisure activity (that makes you breathe harder or puff and pant like aerobics, competitive sport, vigorous cycling, running, swimming)
Vigorous household or garden chores (that make you breathe harder or puff and pant)
(b) Physical activity questions in AHS 2011
Question Wording
APA_Q01 I would now like to ask you about the physical activity [you/(respondent name)] did in the last week. Excluding any walking you have done for fitness, recreation or sport, in the last week how many times did you walk continuously, for at least 10 minutes, to get to or from places? Interviewer: Exclude walking done as part of other physical activity, such as golf. APA_Q02 What was the total time that you spent walking, for at least 10 minutes, to get to or from places,

175
Question Wording
in the last week?
AA_Q01 [Excluding any walking to get to or from places you have already mentioned,] In the last week, how many times have you walked continuously, for at least 10 minutes, for fitness, recreation or sport? Interviewer: Exclude walking done as part of other physical activity, such as golf.
AA_Q02 What was the total time that you spent walking for fitness, recreation or sport in the last week?
AA_Q03 In the last week, how many times did you do any vigorous gardening or heavy work around the yard, which made you breathe harder or puff and pant?
AA_Q04 What was the total time that you spent doing vigorous gardening or heavy work around the yard in the last week?
AA_Q05A The next few questions are about moderate and vigorous physical activity. Please exclude walking that you may have done for transport, fitness, recreation or sport, and household chores, gardening or yard work.
AA_Q05 In the last week, how many times did you do any vigorous physical activity which made you breathe harder or puff and pant? (e.g. jogging, cycling, aerobics, competitive tennis).
AA_Q06 What was the total time that you spent doing this vigorous physical activity in the last week?
AA_Q07 In the last week, how many times did you do any other more moderate physical activity that you have not already mentioned? (e.g. gentle swimming, social tennis, golf). AA_Q08 What was the total time that you spent doing these activities in the last week?
Additional notes:
In the AHS, women were also categorised as sedentary, low, moderate or high according to “levels of physical activity undertaken for fitness, recreation, or sport in the last week” as follows:
Duration of physical activity (mins) x Intensity factor (walking for fitness = 3.5, moderate = 5, vigorous = 7.5), with output categories as follows: Sedentary: Scores less than 50 (includes no physical activity) Low: Scores of 50 to less than 800

176
Moderate: Scores of 800 to 1600, or more than 1600 but with less than 2 hours vigorous physical activity
High: Scores more than 1,600 and with 2 hours or more of vigorous physical activity

177
Explanatory Notes for Section 9 12.6
Response options contained in Figure 9-8 (Different types of IPV ever experienced by women aged
18-23 in 2013, weighted by age and area of residence) detailing types of Intimate Partner Violence
were shortened for this report. The actual response options for this item were as follows:
o Told me that I was ugly, stupid or crazy, or that I wasn't good enough or that no one would
ever want me
o Followed me or harassed me around my neighbourhood/work
o Tried to turn my family, friends or children against me or tried to convince them I was
crazy
o Kicked, bit, slapped or hit me with a fist or tried to hit me with something
o Forced me to take part in unwanted sexual activity
o Tried to keep me from seeing or talking to my family, friends or children, or didn't want me
to socialise
o Pushed, grabbed, shoved, shook or threw me
o Blamed me for causing their violent behaviour
o Harassed me over the telephone, email, Facebook or internet
o Used a knife or gun or other weapon or beat me up
o Became upset if dinner/housework wasn't done when they thought it should be
o Refused to let me work outside the home or took my wallet and left me stranded

178
Explanatory Notes for Section 10 12.7
12.7.1 Sexual behaviour
Explanation of how the data was harmonised
o Questions about sexual behaviour were asked in the first survey for the 1989-95 cohort.
o Questions about sexual behaviour were not asked in the first survey of the 1973-78 cohort
but were asked in the second survey in 2000. Total number of respondents for the second
survey was n=9688.
o 22 to 23 years olds to be analysed at first survey for 1989-95 cohort and second survey for
1973-78 cohort.
o As the questions were not identically asked, further harmonisation of the data was
required.
o The second survey of the 1973-78 cohort asked about the age participants were when they
had their first sexual intercourse, whereas the first survey of the 1989-95 cohort asked the
age at first vaginal sex.
Table 12-13 shows the sexual behaviour questions asked in each survey and the response options
available to participants.
Table 12-13 Questions on sexual behaviour for the 1973-78 and 1989-95 cohorts
1973-78 cohort in 2000 1989-95 cohort in 2013
27. What age were you when you had:
(Write age clearly in the boxes or mark one
on each line)
b Your first sexual intercourse
Response options:
(numeric entry) years
Not applicable
Have you ever had vaginal sex?
Response options:
1 Yes
2 No
3 I prefer not to answer
How old were you when you first had vaginal
sex? (Age in years)
Response options:
(numeric entry) years

179
To enable comparisons between the two cohorts the following categories were created for each
cohort, as shown in Table 12-14.
Table 12-14 Harmonisation of the questions on sexual behaviour in the 1973-78 and 1989-95 cohorts
Category 1973-78 cohort in 2000 (women aged 22 to 23)
1989-95 cohort in 2013
Ever had sex: Yes No Missing
- Age of first sexual intercourse
- Not applicable
- Did not answer question
- Yes OR
- I prefer not to answer and gave a valid age in following question on age of first vaginal sex
- No
- I prefer not to answer and
did not give a valid age in following question on age of first vaginal sex OR
- Did not answer question
12.7.2 Sexually transmitted infections
Explanation of how the data was harmonised
Questions about sexually transmitted infections were asked in the first surveys for both cohorts.
As the questions were not identically asked, harmonisation of the data was required. Table 12-15
shows the questions asked in each survey and the response options available to participants.
Table 12-15 Questions on sexually transmitted infections in the first survey of the 1973-78 and 1989-95 cohorts
1973-78 cohort in 1996 1989-95 cohort in 2013
16. Have you ever been told by a doctor that
you have any sexually transmissible disease
(STD)?
a Chlamydia
b Genital herpes
c Genital warts (HPV)
d Other STD (please specify on line)
Have you ever been diagnosed or treated for:
(Mark all that apply)
1 Urinary tract infection
2 Chlamydia
3 Genital herpes
4 Genital warts (HPV)
5 HIV or AIDS
6 Hepatitis B or C
7 Other sexually transmitted infection (please

180
1973-78 cohort in 1996 1989-95 cohort in 2013
Response Options:
1 Yes
2 No
3 Don’t want to answer
specify)
8 None of these conditions
Response Options:
0 No
1 Yes
To enable comparisons between the two cohorts four categories were created for each cohort, as
shown in Table 12-16.
Table 12-16 Harmonisation of the questions on sexually transmitted infections in the first survey of the 1973-78 and 1989-95 cohorts
Category 1973-78 cohort in 1996 1989-95 cohort in 2013
Chlamydia
Genital herpes
Genital warts (HPV)
Other sexually transmitted
infection
Chlamydia
Genital herpes
Genital warts (HPV)
Other STD
Chlamydia
Genital herpes
Genital warts (HPV)
HIV or AIDS
Hepatitis B or C
Other sexually transmitted
infection (please specify)
12.7.3 Contraception
Explanation of how the data was harmonised
Questions about contraception were asked in the first surveys for both cohorts.
For the 1989-95 cohort, the question about contraceptive methods was:
asked of women who reported having had vaginal sex;
multiple choice (pill, condoms, Implanon, Mirena, other contraceptive, or none);

181
worded “thinking about the LAST TIME you had vaginal sex, did you use any of the
following?”.
For the 1973-78 cohort, the question about contraceptive methods was:
asked of all women;
single rather than multiple choice (pill, condoms, other, or don’t use);
worded “what sort of contraception do you use now?”.
12.7.4 Reproductive events
Explanation of how the data was harmonised
Questions about reproductive events were asked in the first surveys for both cohorts. As the
questions were not identically asked, harmonisation of the data was required. Table 12-17 shows
the questions asked in each survey and the response options available to participants.
Table 12-17 Questions on reproductive events in the first survey of the 1973-78 and 1989-95 cohorts
1973-78 cohort in 1996 1989-95 cohort in 2013
21 Are you currently pregnant?
(Circle one number only)
Response options:
1 Yes
2 No
3 Don’t know
22 How many times have you:
(Circle one number on each line)
a Been pregnant
b Had a miscarriage
c Had a termination
d Given birth to a child
Response options:
0 Never
Are you currently pregnant?
Response options:
1 Yes
2 No
Have you ever been pregnant?
Response options:
1 Yes
2 No
Have you ever had a:
Miscarriage
Abortion or termination (for personal reasons)

182
1973-78 cohort in 1996 1989-95 cohort in 2013
1 Once
2 Twice
3 Three times
4 Four or more times
5 Don’t want to answer
Abortion or termination (for medical reasons)
Ectopic pregnancy (tubal pregnancy)
Live birth
Still birth
Response options:
1 Yes
2 No
3 Don’t know
4 I prefer not to answer
If respondents answer yes to any of the above
they are then asked how many they have had or
the corresponding reproductive event.
Response options:
(numeric entry)
To enable comparisons between the two cohorts the following categories were created for each
cohort, as shown in Table 12-18.
Table 12-18 Harmonisation of the question on reproductive events in the first survey of the 1973-78 and 1989-95 cohorts
Category 1973-78 cohort in 1996 1989-95 cohort in 2013
Currently pregnant
Ever been pregnant
Ever had a miscarriage
- response of yes to currently
pregnant
- response of once, twice,
three times, four times or
more to how many times
have you been pregnant
- response of once, twice,
three times, four times or
more to how many times
- response of yes to currently
pregnant
- Response of yes to ever been
pregnant
- Response of yes to ever had a
miscarriage

183
Category 1973-78 cohort in 1996 1989-95 cohort in 2013
Ever had a termination
Ever given birth
have you had a miscarriage
- response of once, twice,
three times, four times or
more to how many times
have you had a termination
- response of once, twice,
three times, four times or
more to how many times
have you given birth to a
child
Response of yes to ever had an:
- Abortion or termination (for
personal reasons)
OR
- Abortion or termination (for
medical reasons)
Response of yes to ever had a:
- Live birth
OR
- Still birth
Related Documents