NOMESCO Nordic Medico Statistical Committee 106:2017 Health and health care of the elderly in the Nordic Countries – from a statistical perspective

Welcome message from author
This document is posted to help you gain knowledge. Please leave a comment to let me know what you think about it! Share it to your friends and learn new things together.
Transcript
NOMESCO Nord icMedico Stat is t i ca lCommit tee 106 :2017
Health and health care of the elderly in the Nordic Countries – from a statistical perspective

Health and health care of the elderly in the Nordic Countries - From a statistical perspective

Project Manager
Anders Åberg
Editor Ingalill Paulsson Lütz together with the Nordic Reference group. Each country in the project team is responsible for the information provided to the report.
Denmark Linda Saabye Kongerslev The Danish Health Data Authority
Faroe Islands Irena Nolsø Dep. of Health Economic and Public Health
Finland Sanna-Mari Saukkonen National Institute for Health and Welfare
Iceland Guðrún Kr. Guðfinnsdóttir Directorate of Health
Norway Berit Otnes Statistics Norway Solveig Herbern The Norwegian Directorate of Health
Sweden Kalle Brandstedt Rocio Winnersjö Max Köster The National Board of Health and Welfare
Nordic Welfare Centre
Elisabeth Dahler Larsen
NOMESCO’s secretariat
Jesper Munk Marcussen Lene Kokholm
Translation, CommunicAID
Leslie Walke
© Nordic Medico-Statistical Committee Copenhagen 2017
ISBN 978–87-89702-90-5

3
Preface
Preface
The Nordic region has one of the world’s oldest populations and over the past decades, the health and care of elderly people have attracted more and more attention, as the proportion of elderly people in the population is increasing. This trend is expected to continue in the coming decades.
The first report on the health of elderly people was published in 2008 as a thematic part of the NOMESCO publication Health Statistics in the Nordic Countries. The Nordic Council of Ministers commissioned this follow up. The report has been extended with new information about geriatric care in the Nordic region.
The aim of this report is to provide a general statistical description of the care and treatment of elderly people in the Nordic region from the age of 65, with a focus on the 80+ age group. Another aim is to develop and improve NOMESCO’s annual statistics, and revisions to the statistics are proposed where necessary. Some of the OECD indicators are used to highlight and compare certain aspects of health care that are particularly important for elderly people.
The report is based on available Nordic statistics collected continually by NOMESCO and other international organisations, and on statistics collected especially for this project from the national patient, cancer, prescribed drugs, and cause of death registers. The statistics show, for example, the occurrence of disease, pharmaceutical prescriptions and mortality in different age groups over 65, distinguishing between women and men, in the Nordic countries. Most of the data is from 2014.
Information from national interview surveys is an important complement to the registry data, enabling health trends in the population to be monitored over time. Over several decades, the Nordic countries have developed their own surveys of living conditions, which are adapted to national circumstances. This means there are certain differences between the countries in survey methods and degree of coverage.
This report was prepared by Anders Åberg (Project Manager) and Ingalill Paulsson Lütz (Editor), Swedish National Board of Health and Welfare, together with the Nordic working group. The project team is responsible for the information provided to the report. During the project period, members of the project group participated in two working meetings, one in Copenhagen and one in Stockholm, and several meetings by video link. The report has also been sent to Delegation leaders for Nomesco and Nososco for review and comments.

4
Preface

5
Contents
Contents
Preface ............................................................................................. 5
Chapter 1 Elderly care and health.......................................................................... 9
Health status report based on data from health registers .......................... 9
Health status based on questionnaire data on self-reported health ............. 10
Quality in health care ................................................................... 14
Chapter 2 Demographic conditions in the Nordic region ............................................... 15
Chapter 3 Living conditions and financial situation .................................................... 23
Special accommodation ................................................................. 23
Age on moving into special accommodation ........................................ 24
Average length of stay in special accommodation .................................. 25
Trends over long-term care facilities ................................................. 25
Home-care services ...................................................................... 28
Civil status ................................................................................ 29
Financial situation ....................................................................... 31
Financial support ......................................................................... 33
6
Contents
Chapter 4 Life style .......................................................................................... 35
Smoking .................................................................................... 35
Overweight and obesity ................................................................. 36
Alcohol ..................................................................................... 37
Chapter 5 Diagnosis-related mortality and sickness ................................................... 39
Cardiovascular diseases ................................................................. 43
Cancer diseases ........................................................................... 60
Diseases of the digestive system and the urinary system .......................... 76
Endocrine diseases ....................................................................... 84
COPD and asthma ........................................................................ 88
Pneumonia ................................................................................. 94
Dementia and Alzheimer’s disease .................................................... 97
Mental illness ............................................................................ 103
Muscular and skeletal diseases ........................................................ 114
Falls and hip fractures .................................................................. 119
Chapter 6 Quality indicators .............................................................................. 123
Avoidable hospital admissions ......................................................... 124
Major lower extremity amputations .................................................. 127
Prescription of benzodiazepines ...................................................... 129
Prescription of antibiotics ............................................................. 132
Mortality following acute myocardial infarction (AMI) ............................ 135
Mortality following ischaemic stroke ................................................. 137
Hip fracture surgery within two days ................................................ 139
Excess mortality among patients with schizophrenia and bipolar disorder .... 141
5-year cancer survival .................................................................. 145
7
Contents
Chapter 7 Pharmaceutical treatments among elderly people ...................................... 151
Pharmaceuticals unsuitable for elderly people .................................... 151
Ten or More Drugs ....................................................................... 152
Chapter 8 Organisation and legislation ................................................................. 155
Chapter 9 Pensions ......................................................................................... 159
Work after the retirement age ........................................................ 159
Retirement pension ..................................................................... 163
Conclusions and recommendations Pharmaceutical treatment .................................................................... 167
The quality of care ............................................................................. 167
Literature Literature ........................................................................................ 169

8
Contents

9
Elderly care and health
Chapter 1
Elderly care and health
The World Health Organization (WHO) has set up two objectives for the ageing person.
1. The ageing person will be able to age with good health, and maintain both independence and autonomy in important life choices as long as possible
2. The ageing person will be an active participant in society
In principle, it is these objectives that steer and permeate the ambitions of the Nordic countries’ health care and social services.
Elderly people in the Nordic region do not comprise a homogeneous group in terms of health. There are large individual variations. Biological ageing follows no fixed chronological pattern – people age at different rates depending on genetic conditions, dietary and living habits, and a wide range of external factors.
Generally, living conditions of elderly people are closely related to each country’s general standards and living conditions. Here, the Nordic countries show great similarities. The oldest members of the elderly group grew up during the Second World War, while younger elderly people have lived most of their lives in the post-war welfare society. Even if these phases have varied slightly in the Nordic countries, today’s younger elderly people and those who are now entering pensionable age can look forward to relatively many years of health, with a relatively high standard of living.
The proportion of people aged 65 and older in the Nordic region is increasing, and an increasing number of people are now living to high ages. Many old people retain independence and remain in their own homes up to a high age. Not until the age is nearly 80 does the proportion of elderly people living in special accommodation in the Nordic countries reach over 10 per cent.
The older a person becomes, the greater the risk of contracting more and comorbid diseases, living with reduced physical and cognitive abilities, and becoming more dependent on help, medical and otherwise, to manage everyday life. However, health has generally improved in recent decades, and increasing life expectancy is driven not least by reduced mortality after retirement age.
Health status report based on data from health registers
In this report, our aim is to describe health and health care among elderly people in the Nordic region, primarily using data from the Nordic countries’ various health registers and cause of death registers.
The most common causes of death among elderly people are cardiovascular diseases and cancer. Cardiovascular diseases were previously the dominant cause of

10
Elderly care and health
death, but the relative importance of cancer has increased as cardiovascular diseases have decreased. The risk of suffering a stroke or myocardial infarction has fallen, and the occurrence has shifted towards higher ages. The total incidence of cancer has not changed much in recent decades, and for individual cancer diagnoses the trend is both positive and negative. Mortality in cancer has fallen. This is because cancer is more often detected at earlier stages, so treatment can be started earlier, and because treatment methods have become more effective.
Even if dementia diseases should not be seen as a natural part of ageing, the number of people with dementia diseases increases with age. This presents a challenge for the Nordic welfare systems, not least for municipal health care and care services.
Anxiety, worry, angst, and insomnia are common in the elderly population in the Nordic region. These, too, are not a natural part of ageing, even though loss of social identity after leaving working life, loss of bodily abilities and greater illness are examples of factors that can affect mental balance and a sense of wellbeing. Depression among elderly people is not uncommon and often has multifactorial causes. One problem among elderly people is that depression is less often diagnosed and treated than among young people. In many cases, depression is a significant risk factor for suicidal actions. Suicide among elderly people often attracts less attention, despite the suicide figures being relatively high.
As people age and health deteriorates, pharmaceutical treatment increases. More and concomitant pharmaceuticals are prescribed. At the same time, sensitivity to medication increases. There is every reason, also in a Nordic perspective, to turn the focus on pharmaceutical treatment of elderly people to ensure it is as well-considered and safe as possible. This applies not least to prescription of psychotropic.
Pharmaceutical treatment is one of several factors behind falls being the most common cause of injury among elderly people. A fall accident often results in a hip fracture which, apart from the suffering and increased mortality risk for the individual, entails large costs for society in compensating permanent disability.
Health status based on questionnaire data on self-reported health
A person can perceive their health as being good or poor, regardless of whether the person has any diseases. The subjective perception of health is affected by, for example, what expectations the person has regarding their own health and their reference framework. Younger people probably have higher expectations when assessing their own health than older people.
Among the Nordic countries, the proportion of people who rate their health as good or very good has increased in the past ten years, but the differences between the Nordic countries are great (see Table 1.1). A high proportion of women and men over 65 in Norway and Sweden rate their health as good or very good. This is very different from Finland, where less than half of women and men over 65 rate their health as good or very good.

11
Elderly care and health
Table 1.1 Perceived health status: Good/very good health, age 65+, per cent of the population in the Nordic Countries, 2005-2014
2005 2007 2010 2011 2012 2013 2014
Men
Denmark 61.1 60.8 60.3 55.8 55.7 61.8 60.3 Finland 40.9 38.9 38.5 39.3 44.4 42.1 41.5 Iceland 53.4 60.8 52.8 59.1 58.2 58.4 58.7 Norway 61.0 62.9 70.5 65.0 66.6 63.5 67.6 Sweden 58.6 63.0 64.9 64.8 69.7 71.4 71.4 Women
Denmark 53.1 56.4 53.3 53.4 56.6 57.2 58.5 Finland 36.1 34.8 31.9 34.1 37.9 35.9 40.6 Iceland 41.8 47.0 48.8 47.0 51.3 50.1 54.2 Norway 51.5 57.0 61.6 53.9 68.3 61.2 67.1 Sweden 52.6 58.4 61.2 62.0 64.0 65.5 64.4
Source: OECD Health statistics
Figure 1.1 shows the proportion of people aged 65 and over who, in a health survey in 2014, reported that their health was ‘good’ or ‘very good’. Generally, Nordic men report better health than Nordic women. The proportion reporting good/very good health is greatest among Swedish men and women and lowest among elderly people in Finland.
Differences between the countries can probably partly be attributed to differences in how to access and get responses from the oldest citizens in this type of questionnaire survey. Low response rates among the oldest people, who often have the poorest health, are common and therefore skew the results.
Figure 1.1 Perceived health status: proportion (%) of the total population aged 65+ reporting good/very good health in 2014
Source: OECD Health statistics

12
Elderly care and health
Figure 1.2 Perceived health status: proportion (%) of the total population aged 65+ reporting good/very good health 2005-2014
Source: OECD Health statistics
As a supplement to the traditional ways of calculating and reporting remaining average life length, Eurostat has developed an indicator for the health status in the population aged 65 and older. Healthy Life Years (HLY), also called disability-free life expectancy, is based on age-specific mortality data and data on self-reported health from EU-SILC. The indicator gives an estimate of the number of years people can expect to live with good health or without disability after the age of 65.
We combine this data on healthy years with data on the total number of remaining years after 65 in Figure 1.3 and 1.4. The figures show the relationship between the number of remaining healthy and less healthy years for men and women.
People who were 65 in Iceland and Norway in 2014 were those who could expect most years of good health in the Nordic region, approximately 15 years. In contrast, Finnish women and men only remain ‘healthy’ for 9.3 and 8.8 years respectively.

13
Elderly care and health
Figure 1.3 Relationship between remaining healthy and less healthy years at 65 years, men 2014
Source: Eurostat
Figure 1.4 Relationship between remaining healthy and less healthy years at 65 years, women 2014
Source: Eurostat
14
Elderly care and health
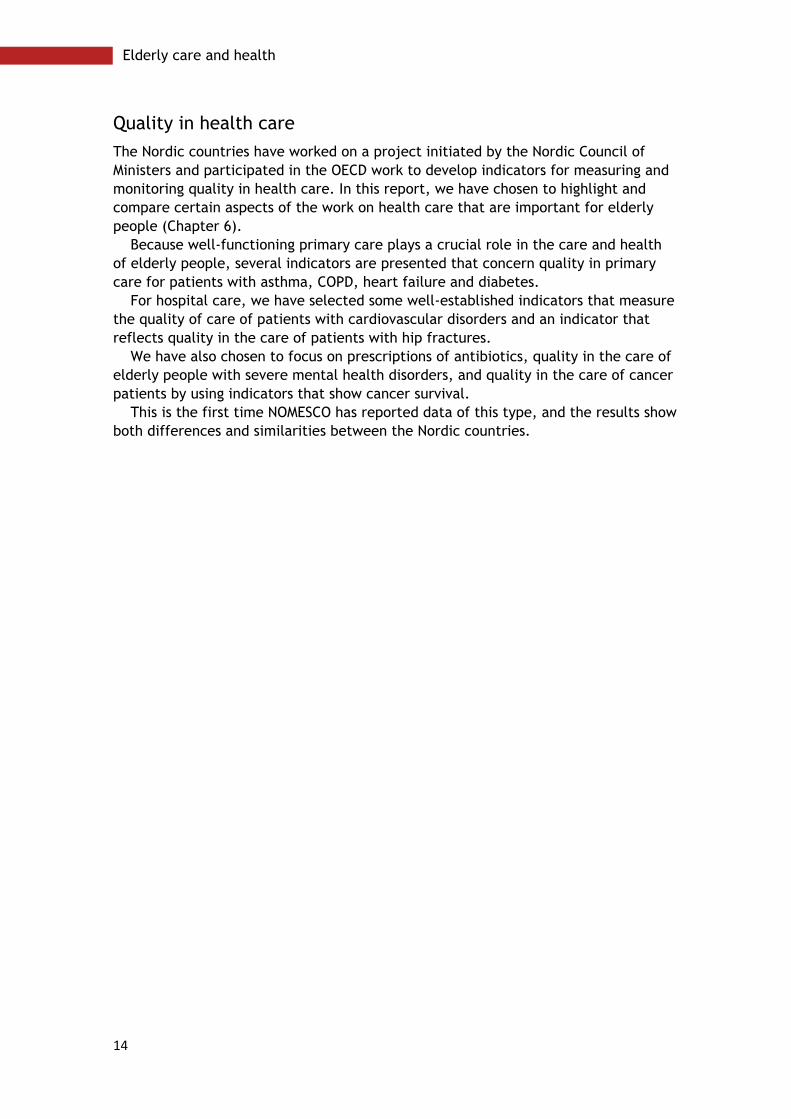
Quality in health care
The Nordic countries have worked on a project initiated by the Nordic Council of Ministers and participated in the OECD work to develop indicators for measuring and monitoring quality in health care. In this report, we have chosen to highlight and compare certain aspects of the work on health care that are important for elderly people (Chapter 6).
Because well-functioning primary care plays a crucial role in the care and health of elderly people, several indicators are presented that concern quality in primary care for patients with asthma, COPD, heart failure and diabetes.
For hospital care, we have selected some well-established indicators that measure the quality of care of patients with cardiovascular disorders and an indicator that reflects quality in the care of patients with hip fractures.
We have also chosen to focus on prescriptions of antibiotics, quality in the care of elderly people with severe mental health disorders, and quality in the care of cancer patients by using indicators that show cancer survival.
This is the first time NOMESCO has reported data of this type, and the results show both differences and similarities between the Nordic countries.
15
Demographic conditions in the Nordic region
Chapter 2
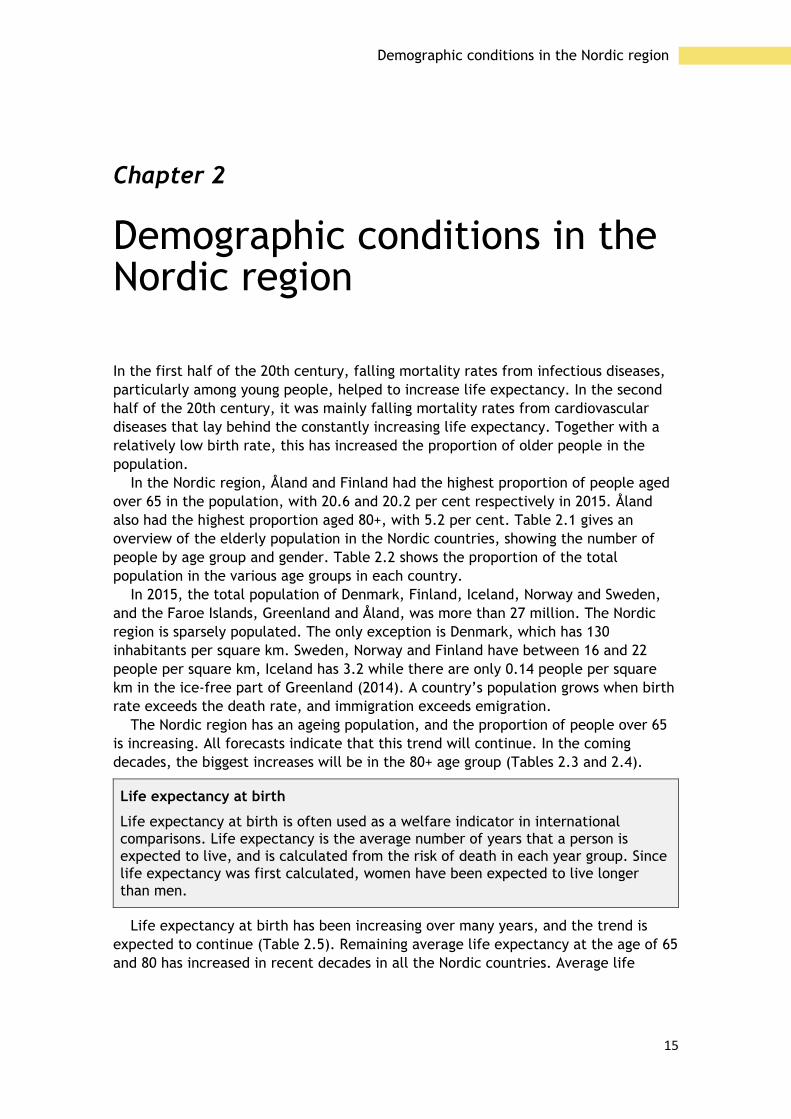
Demographic conditions in the Nordic region
In the first half of the 20th century, falling mortality rates from infectious diseases, particularly among young people, helped to increase life expectancy. In the second half of the 20th century, it was mainly falling mortality rates from cardiovascular diseases that lay behind the constantly increasing life expectancy. Together with a relatively low birth rate, this has increased the proportion of older people in the population.
In the Nordic region, Åland and Finland had the highest proportion of people aged over 65 in the population, with 20.6 and 20.2 per cent respectively in 2015. Åland also had the highest proportion aged 80+, with 5.2 per cent. Table 2.1 gives an overview of the elderly population in the Nordic countries, showing the number of people by age group and gender. Table 2.2 shows the proportion of the total population in the various age groups in each country.
In 2015, the total population of Denmark, Finland, Iceland, Norway and Sweden, and the Faroe Islands, Greenland and Åland, was more than 27 million. The Nordic region is sparsely populated. The only exception is Denmark, which has 130 inhabitants per square km. Sweden, Norway and Finland have between 16 and 22 people per square km, Iceland has 3.2 while there are only 0.14 people per square km in the ice-free part of Greenland (2014). A country’s population grows when birth rate exceeds the death rate, and immigration exceeds emigration.
The Nordic region has an ageing population, and the proportion of people over 65 is increasing. All forecasts indicate that this trend will continue. In the coming decades, the biggest increases will be in the 80+ age group (Tables 2.3 and 2.4).
Life expectancy at birth
Life expectancy at birth is often used as a welfare indicator in international comparisons. Life expectancy is the average number of years that a person is expected to live, and is calculated from the risk of death in each year group. Since life expectancy was first calculated, women have been expected to live longer than men.
Life expectancy at birth has been increasing over many years, and the trend is expected to continue (Table 2.5). Remaining average life expectancy at the age of 65 and 80 has increased in recent decades in all the Nordic countries. Average life

16
Demographic conditions in the Nordic region
expectancy is increasing more for men than for women, so the gender gap is closing somewhat.
There are big differences in remaining life expectancy between the autonomous areas, where Greenlandic men and women have considerably shorter remaining average life expectancy than men and women in the Faroe Islands and Åland.
In 2015, average life expectancy of men in Iceland, Norway and Sweden was 80 years, while for women in Finland, Åland, Norway and Sweden average life expectancy was 84 years.
During the coming decades, the proportion of old people in the population will increase in relation to the proportion of people of working age in all the Nordic countries, if the present demographic trends continue. This means that approximately one-quarter of the population in the Nordic countries will be 65 or older around the year 2050.
The old-age dependency ratio shows the proportion of people aged 65 and older in relation to the population of working age, 15-64, in 2015, as shown in Nordic population statistics.
Old-age dependency ratio
The old-age dependency ratio shows the proportion of people aged 65 and older in relation to the population of working age, 15-64, and is an indicator often used in international comparisons.
The changing age structure, with a growing proportion of old and very old people will make new demands on society as the proportion of people of working age in the population falls. When fewer economically productive people are to support a greater proportion of old people, there are fewer resources available for allocation to different parts of society. The dependency burden is expected to increase in all the Nordic countries, though Denmark and Sweden will have a relatively small increase in the coming decades. Iceland and Norway will continue to have the smallest number of old people in the population.
The population is mainly increasing in the Nordic capitals. The proportion of old people in relation to young people is increasing. In both Finland and Sweden, the proportion of old people is growing in rural areas, when young people in the population move to the metropolitan areas to study and work. This phenomenon increases the pressure on the municipalities in rural areas. Figure 2.1 shows the unequal geographical distribution of the proportion of old people in the population, except in Denmark and Iceland where the geographical differences are relatively small.

17
Demographic conditions in the Nordic region
Table 2.1 Mean population in the Nordic countries, by age groups and sex, 2015
Denmark Faroe Islands
Greenland Finland Åland Iceland Norway Sweden
Men 0-19 671 782 7 123 8 098 613 501 3 288 45 371 646 178 1 145 66020-64 1 665 212 14 158 19 222 1 604 843 8 393 99 506 1 581 703 2 869 67065-69 171 172 1 380 1 049 182 171 1 002 7 520 138 897 293 53370-74 135 736 1 097 721 115 579 759 5 232 98 701 242 54075-79 87 364 680 324 85 105 460 3 629 64 732 158 41980-84 52 329 489 153 55 709 328 2 791 43 813 103 38485-89 27 514 246 55 29 493 188 1 598 26 074 60 19990-94 9 505 82 11 8 861 62 505 10 004 23 70395+ 1 921 23 1 1 440 10 102 1 893 4 524Total 2 822 535 25 278 29 634 2 696 702 14 490 166 254 2 611 995 4 901 632
Women 0-19 638 414 6 737 7 740 586 702 3 057 43 524 613 669 1 078 79120-64 1 639 061 12 632 16 710 1 567 271 8 280 97 138 1 503 676 2 775 04265-69 177 703 1 229 705 196 770 1 007 7 249 139 571 300 50470-74 147 335 1 001 636 134 441 695 5 536 105 200 252 67575-79 102 978 721 366 112 707 544 4 045 77 378 181 86280-84 71 559 605 217 88 130 411 3 426 61 084 139 66985-89 47 205 439 89 62 889 309 2 377 45 540 101 60290-94 24 130 227 15 27 608 154 1 069 24 725 52 56595+ 7 428 64 2 6 361 48 248 7 108 14 893Total 2 855 813 23 655 26 480 2 782 879 14 505 164 612 2 577 951 4 897 603Men and Women 0-19 1 310 196 13 854 15 838 1 200 197 6 342 88 892 1 259 843 2 224 44620-64 3 304 273 26 781 35 932 3 172 109 16 661 196 632 3 085 364 5 644 70065-69 348 875 2 606 1 754 378 939 2 007 14 767 278 466 594 03770-74 283 071 2 098 1 357 250 020 1 454 10 765 203 900 495 21375-79 190 342 1 399 690 197 810 1 004 7 673 142 108 340 28180-84 123 888 1 094 370 143 837 739 6 215 104 895 243 05385-89 74 719 684 144 92 381 495 3 973 71 614 161 79990-94 33 635 308 26 36 468 215 1 574 34 726 76 26795+ 9 349 85 3 7 798 58 349 9 000 19 417Total 5 678 348 48 909 56 114 5 479 559 28 975 330 840 5 189 916 9 799 213Men and women 65+ 1 063 879 8 274 4 344 1 107 253 5 972 45 316 844 709 1 930 067Men and women 80+ 241 591 2 171 543 280 484 1 507 12 111 220 235 500 536
Source: Nordic statistics

18
Demographic conditions in the Nordic region
Table 2.2 Mean population, by age groups and sex as a percentage of the total population in the Nordic population, 2015
Denmark Faroe Islands
Greenland Finland Åland Iceland Norway Sweden
Men 0-19 11.8 14.6 14.4 11.2 11.3 13.7 12.5 11.7 20-64 29.3 28.9 34.3 29.3 29.0 30.1 30.5 29.3 65-69 3.0 2.8 1.9 3.3 3.5 2.3 2.7 3.0 70-74 2.4 2.2 1.3 2.1 2.6 1.6 1.9 2.5 75-79 1.5 1.4 0.6 1.6 1.6 1.1 1.2 1.6 80-84 0.9 1.0 0.3 1.0 1.1 0.8 0.8 1.1 85-89 0.5 0.5 0.1 0.5 0.6 0.5 0.5 0.6 90-94 0.2 0.2 - 0.2 0.2 0.2 0.2 0.2 95+ - - - - - - - - Total 49.7 51.7 52.8 49.2 50.0 50.3 50.3 50.0
Women 0-19 11.2 13.8 13.8 10.7 10.6 13.2 11.8 11.0 20-64 28.9 25.8 29.8 28.6 28.6 29.4 29.0 28.3 65-69 3.1 2.5 1.3 3.6 3.5 2.2 2.7 3.1 70-74 2.6 2.0 1.1 2.5 2.4 1.7 2.0 2.6 75-79 1.8 1.5 0.7 2.1 1.9 1.2 1.5 1.9 80-84 1.3 1.2 0.4 1.6 1.4 1.0 1.2 1.4 85-89 0.8 0.9 0.2 1.1 1.1 0.7 0.9 1.0 90-94 0.4 0.5 - 0.5 0.5 0.3 0.5 0.5 95+ 0.1 0.1 - 0.1 0.2 0.1 0.1 0.2 Total 50.3 48.4 47.2 50.8 50.1 49.8 49.7 50.0 Men and women 0-19 23.1 28.3 28.2 21.9 21.9 26.9 24.3 22.7 20-64 58.2 54.8 64.0 57.9 57.5 59.4 59.4 57.6 65-69 6.1 5.3 3.1 6.9 6.9 4.5 5.4 6.1 70-74 5.0 4.3 2.4 4.6 5.0 3.3 3.9 5.1 75-79 3.4 2.9 1.2 3.6 3.5 2.3 2.7 3.5 80-84 2.2 2.2 0.7 2.6 2.6 1.9 2.0 2.5 85-89 1.3 1.4 0.3 1.7 1.7 1.2 1.4 1.7 90-94 0.6 0.6 - 0.7 0.7 0.5 0.7 0.8 95+ 0.2 0.2 - 0.1 0.2 0.1 0.2 0.2 Total 100.0 100.0 100.0 100.0 100.0 100.0 100.0 100.0 Men and women 65+ 18.7 16.9 7.7 20.2 20.6 13.7 16.3 19.7 Men and women 80+ 4.3 4.4 1.0 5.1 5.2 3.7 4.2 5.1
Source: Nordic statistics

19
Demographic conditions in the Nordic region
Table 2.3 Projected population 65 years and older as percentage of the total population 2015-2055
Denmark Faroe Islands
Green-land
Finland Åland Iceland Norway Sweden EU28
Men 2015 17.2 15.8 8.7 17.1 19.4 12.9 14.7 18.1 16.5 2020 18.7 17.7 8.8 20.2 21.5 14.2 15.8 19.0 18.0 2040 23.6 24.9 14.1 23.7 25.3 19.0 21.1 22.7 24.4 2055 23.1 26.1 .. 25.5 .. 21.4 22.9 23.9 25.9
Women 2015 20.3 18.1 7.7 22.6 21.9 14.6 17.9 21.3 21.1 2020 21.6 19.7 8.8 25 24.1 15.9 18.6 21.8 22.6 2040 26.2 27.6 15.0 28.6 29.2 22.5 23.3 25.0 29.2 2055 25.8 29.6 .. 29.3 .. 25.7 24.8 26.0 30.8 Men and women 2015 18.7 16.9 7.7 20.2 20.6 13.7 16.3 19.7 18.9 2020 20.1 18.7 8.8 22.6 22.8 15.0 17.2 20.4 20.4 2040 24.9 26.2 14.6 26.2 27.3 20.8 22.2 23.8 26.9 2055 24.5 27.8 .. 27.4 .. 23.6 23.9 24.9 28.4
Source: Nordic statistics
Table 2.4 Projected population 80 years and older as percentage of the total population 2015-2055
Denmark Faroe Islands
Green-land
Finland Åland Iceland Norway Sweden EU28
Men 2015 3.2 3.3 0.7 3.5 4.1 3.9 3.1 3.9 3.8 2020 3.8 3.7 0.7 4.2 4.5 2.9 3.2 4.3 4.4 2040 7.2 7.9 2.6 8.6 8.6 5.5 6.4 7.2 7.3 2055 9.2 10.7 .. 9.3 .. 6.4 8.5 8.7 9.6
Women 2015 5.3 5.7 1.2 6.6 6.4 4.3 5.4 6.3 6.6 2020 5.6 5.6 1.3 7.2 6.5 4.3 5.1 6.3 7.2 2040 9.2 10.5 3.4 12.6 11.9 7.8 8.1 9.1 10.6 2055 11.2 13.1 .. 12.8 .. 9.8 10.0 10.5 13.3 Men and women 2015 4.3 4.4 1.0 5.1 5.2 3.7 4.2 5.1 5.2 2020 4.7 4.6 1.0 5.7 5.5 3.6 4.2 5.3 5.8 2040 8.2 7.9 3.0 10.6 10.3 6.7 7.2 8.1 9.0 2055 10.2 11.9 .. 11.0 .. 8.1 9.3 9.6 11.5
Source: Nordic statistics

20
Demographic conditions in the Nordic region
Table 2.5 Average life expectancy, 2000-2015 Men Women
Age 0 15 45 65 80 0 15 45 65 80
Denmark
2000/01 74.5 60.1 31.6 15.2 6.8 79.2 64.7 35.5 18.2 8.5
2004/05 75.6 61.2 32.5 16.0 7.0 80.2 65.7 36.4 19.0 8.8
2010 77.1 62.4 33.5 16.9 7.4 81.2 66.6 37.2 19.6 9.0
2014 78.5 63.9 34.9 17.9 7.9 82.7 68.1 38.6 20.7 9.6
2015 78.6 64.0 34.9 17.9 7.9 82.5 67.9 38.4 20.5 9.5
Faroe Islands
2006-10 77.2 63.1 34.2 17.0 7.2 83.0 68.6 39.1 20.8 9.5
2011-15 78.8 64.5 35.6 18.3 7.8 83.8 69.5 40.0 21.6 10.1
Greenland
2006-10 67.8 54.6 28.6 12.4 5.2 72.8 59.0 31.1 14.9 6.6
2011-15 69.7 56.2 29.9 13.5 5.9 74.1 60.0 32.0 15.0 6.4
Finland
2000 74.1 59.6 31.6 15.5 6.6 81.0 66.4 37.3 19.4 8.2
2005 75.5 61.0 32.7 16.7 7.4 82.3 67.7 38.6 20.7 9.1
2010 76.7 62.0 33.7 17.3 7.6 83.2 68.5 39.2 21.2 9.4
2014 78.2 63.5 34.9 18.0 8.0 83.9 69.1 39.8 21.5 9.7
2015 78.4 63.7 35.0 18.0 8.1 84.1 69.3 39.9 21.6 9.7
Åland
2006-10 79.0 64.3 35.3 17.5 7.8 83.1 68.8 39.3 21.0 9.6
2011-15 79.2 64.2 35.1 17.9 8.1 84.2 69.5 40.0 21.2 10.0
Iceland
2000 77.6 63.1 34.4 17.3 7.5 81.4 66.7 37.1 19.5 8.4
2005 79.2 64.5 35.6 18.0 7.7 83.1 68.4 39.0 20.7 9.4
2010 79.5 64.8 36.0 18.2 7.7 83.5 68.8 39.3 20.8 9.4
2014 80.6 65.9 36.9 19.0 8.2 83.6 69.1 39.7 21.3 9.8
2015 81.0 66.3 37.4 19.4 8.4 83.6 69.1 39.7 21.3 9.7
Norway
2000 76.0 61.5 33.2 16.1 6.8 81.4 66.8 37.6 19.7 8.6
2005 77.7 63.2 34.5 17.1 7.3 82.5 67.9 38.6 20.6 9.3
2010 78.9 64.2 35.4 17.9 7.8 83.2 68.5 39.1 21.0 9.6
2014 80.0 65.4 36.4 18.7 8.2 84.1 69.3 39.8 21.5 9.9
2015 80.4 65.7 36.6 18.8 8.2 84.1 69.4 39.9 21.5 9.9
Sweden
2000 77.4 62.8 34.0 16.7 7.1 82.0 67.4 38.0 20.1 8.9
2005 78.4 63.8 34.9 17.4 7.5 82.8 68.1 38.7 20.6 9.3
2010 79.5 64.8 35.8 18.2 7.9 83.5 68.8 39.3 21.1 9.6
2014 80.4 65.6 36.7 18.9 8.2 84.1 69.3 39.8 21.5 9.8
2015 80.3 65.6 36.7 18.9 8.2 84.0 69.3 39.8 24.1 9.7
Source: National statistical institutes

21
Demographic conditions in the Nordic region
Figure 2.1 Old-age dependency ratio in the Nordic countries 2015
Source: Nordregio, published: 16 February 2016

22
Demographic conditions in the Nordic region

23
Living conditions and financial situation
Chapter 3
Living conditions and financial situation
The health of old people is related to their living conditions. The risk of poor health and disability increases with age. As people grow older, they tend to spend more and more time in their own homes. The living environment and any support measures are therefore important conditions for a well-functioning everyday life and opportunities to retain one’s health.
Special accommodation
Most old people in the Nordic region continue to live in the same house or flat they lived in during their working lives, up to a high age. When this is no longer possible, all Nordic countries have various types of special accommodation, particularly adapted to old people’s needs, either needs-tested or not. These types of accommodation have different names, and vary from institution-like to more ordinary accommodation with different levels of 24-hour care.
As shown in Table 3.1, the proportion of old people who live in sheltered accommodation increases with age. While the figures are only one or a few per cent among younger old people (65-74 years), the figures are much higher for the oldest people (80+), ranging from nearly 13 per cent in Denmark to nearly 25 per cent on the Faroe Islands.

24
Living conditions and financial situation
Table 3.1 People aged 65 or older living at institutions or in service housing, as percentage of the total number of elderly in the age group
Denmark1 Faroe Islands2
Finland Iceland3 Norway Sweden4
2016 2013 2015 2014 2016 2016
65-74 1.0 1.0 1.5 3.0 2.0 0.9
75-79 2.8 5.7 3.7 8.3 5.1 3.1
80+ 12.1 24.7 14.2 18.1 20.8 14.1
Total 65+ 3.9 9.5 5.1 8.0 7.3 4.7
1 Includes residents in nursing homes, sheltered housing, special care housing and special housing units (for those under 67). Recipients as percentage of age group, second quarter of 2014
2 Age groups 67-74, 75-79 and 80+ 3 Covers inhabitants in nursing homes and sheltered housing. Calculation as of December 2014 4 Preliminary figures - Cross section of 31. December - Data applies to residents in special care housing
units, as well as people admitted to institutions, in the age group 65 + 5 Calculation as of 31 October. Includes people staying on a short-term basis as well as residents in
service housing
Source: NOSOSCO, Social Protection in the Nordic Countries 2015/2016
Age on moving into special accommodation
One reason why the proportion aged 80 and older living in special accommodation for old people is so high, is that many people have already reached 80 when they are allocated a place and move in to such accommodation. The average age of people moving in during 2014 was higher for women than men. Norwegian men were youngest, on average 81.6 years and Swedish women were oldest, 86.3 (Table 3.2). In Sweden, data shows that a person applying for a place in a retirement home in a municipality needed to wait an average of 54 days before a decision.
Table 3.2 Average age on moving into special accommodation, 2014 Faroe Islands Norway Sweden
Men 82.4 81.6 83.9
Women 85.5 85.3 86.3
Source: Dep. of Health Economic and Public Health, Faroe Islands, The Norwegian Directorate of Health, Statistics on care and help services to Elderly and Persons with Impairments, The National Board of Health and Welfare
The fact that more women than men moved into special accommodation (Table 3.3) contributes to the high average age among residents, because women are generally older when they move in.
Table 3.3 Gender distribution on moving in to special accommodation, 2014 Faroe Islands Norway Sweden
Men 43 43 37
Women 57 57 63
Source: Dep. of Health Economic and Public Health, Faroe Islands, The Norwegian Directorate of Health, Statistics on care and help services to Elderly and Persons with Impairments, The National Board of Health and Welfare

25
Living conditions and financial situation
Average length of stay in special accommodation
Partly because of the high age on moving in to special accommodation forms for old people, Swedish data shows that a significant proportion of those allocated a place die relatively shortly after moving in (Table 3.4). Although women were older when they moved in, men died sooner than women. Overall, 62 per cent of women were still alive after two years, while the figure for men was 51 per cent. The differences between men and women were greatest during the first year.
Table 3.4 Percentage of Swedish women and men still alive 0, 5, 10, 15, 20 and 24 months after moving in to institutions or service housing
Number of months after moving in
Men Women
0 99.8 99.9
5 76.6 83.5
10 64.9 74.8
15 56.5 67.7
20 52.1 63.6
24 51.0 62.6
Source: Statistics on care and help services to Elderly and Persons with Impairments, The National Board of Health and Welfare
Trends over long-term care facilities
All Nordic countries report information about the number of beds/places in long-term care facilities, i.e. not hospitals, to OECD. Figure 3.1 shows how the number of such places per 1 000 in the age group 65 and older has changed from 1990 to 2013. In Denmark, Norway and Sweden the number of places has fallen since 2000. In Sweden 1992, the Elderly Reform (ÄDEL) was enforced. Under this reform, the municipalities were given the overall responsibility for social care for the elderly and the disabled. In Iceland and Finland, except for the most recent years, the number of places has increased.

26
Living conditions and financial situation
Figure 3.1 Beds in residential long-term care facilities per 1 000 in the population aged 65 and older, 1990-2015
Source: OECD Stat. 2016
Trends for 2010-2013 are shown in Table 3.5. All countries show a declining number of places per 1 000 of the population aged 65 and older.
Table 3.5 Beds in residential long-term care facilities per 1 000 in the population aged 65 and older
Denmark Finland Iceland Norway Sweden
2010 51.9 64.1 66.7 57.2 78.8
2011 48.7 64.3 62.9 55.6 75.8
2012 .. 61.7 61.0 54.3 72.1
2013 .. 60.5 60.1 52.4 69.6
2014 .. 59.7 60.1 50.8 66.1
2015 .. 59.3 58.3 48.8 65.5
Source: OECD Stat. 2016
Figure 3.2 shows how the number of long-term care recipients was distributed by age group in 2010. which is the most recent year where information from all five Nordic countries is shown in OECD statistics. Figure 3.3 shows how the figures changed in Denmark and Norway during the period 2010-2014.

27
Living conditions and financial situation
Figure 3.2 Long-term care recipients in institutions (other than hospitals), percentage of the population, 2010
Source: OECD Stat. 2015
Figure 3.3 Long-term care recipients in institutions (other than hospitals), percentage of the population, 2010-2014
Source: OECD Stat. 2015
0 5 10 15 20
Women
Women
Men
Men
Women
Women
Men
Men
15.7
16.8
10.0
10.4
6.0
7.0
3.2
3.7
13.5
14.3
11.1
12.5
4.9
5.6
2.8
3.42010
2010
2010
2010
2014
2014
2014
2014
65+
80+
Denmark
Norway

28
Living conditions and financial situation
Home-care services
An ambition in all Nordic countries is that elderly people should be able to live in their own homes for as long as possible. which sometimes necessitates support measures in the home. Home-care services are granted in all cases, at a level determined by the individual need, which can vary from a few hours a month to many hours a day. Municipalities are responsible for organising home-care services, but the service is often provided by either publicly or privately employed personnel. People rarely have home-care services in the years immediately after 65, but such services are much more common for people aged 80 and older.
Table 3.6 shows that Finland and the Faroe Islands generally have the lowest proportion of old people with home-care services, while Denmark and Iceland have the highest proportions.
Table 3.6 People aged 65 or older, with home-care services as percentages of the total number of elderly in the age group, at the time of census, 2015
Denmark1 Faroe Islands2
Finland3 Iceland Norway4 Sweden5
2015 2013 2015 2015 2015 2015
65-74 3.9 1.3 1.6 7.2 2.5 2.0
75-79 10.4 4.4 5.0 21.2 6.3 7.0
80+ 32.7 12.5 16.4 45.9 21.5 24.0
1 Home help to people living in their own home, with the exception of serviced housing. Recipients as percentage of age group, January 2015
2 Age groups 67-74. 75-79 and 80+ 3 Regular home-care clients as of 30 November 4 Including residents in service housing units receiving practical assistance (home help) and home
nursing. Those receiving only home nursing are not included 5 People granted home help as of 31 October and living in their own house or flat
Source: DK, Statistics Denmark; FO, Ministry of Social Affairs; FI, National Institute for Health and Welfare (THL); IS, Statistics Iceland; NO, Statistics Norway; SV, the National Board of Health and Welfare
However, some difficulties are involved when comparing Nordic statistics on home-care services. One problem is that the countries collect statistics in different ways. Another is that there are ongoing trials, for example in some municipalities in Sweden, where certain support measures are provided without an official decision. These cases are not captured by the official statistics.
Swedish data shows that, particularly among the oldest age groups, men had homecare services in the final year before they moved into special accommodation for the elderly (Table 3.7). However, the statistics also show that there is a relatively large proportion, 21 per cent of women and 33 per cent of men, who received no support services at all before they were granted special accommodation.

29
Living conditions and financial situation
Table 3.7 Proportion of women and men by age in Sweden who had homecare services before moving into special accommodation
65-79 years 80+ years
Men 67% 78%
Women 79% 85%
Source: Statistics on care and help services to Elderly and Persons with Impairments. The National Board of Health and Welfare
Civil Status
Many old people manage on their own up to a high age. When they start to lose their independence, it is common that a marital partner provides help. Whether an old person lives alone or with a partner can therefore affect the need for special accommodation and the need for homecare services and other care. The older the person, the more likely they are to live in a single-person household. Women’s generally longer average life expectancy and the fact that men are more likely to be the older partner in a marriage means that women of older ages more often live alone than men of the same age.
Table 3.8 shows that between 74 and 79 per cent of Nordic women aged 80 and older live alone (not married), while the corresponding proportion of Nordic men is between 38 and 43 per cent. The information for Finland refers to people aged 75 and older, and shows considerably lower figures, probably a result of increased mortality among people aged 80 and older.
Table 3.8 Proportion of single people (not married) in the 80+ age group Denmark Finland1 Iceland Norway Sweden
Men 41 27 42 38 43
Women 78 55 74 78 79
Total 64 45 61 63 65
1 Statistics from Finland refer to people aged 75 and older
Source: The Nordic Centre for Welfare and Social Issues (NVC). 80+ living in Scandinavia

30
Living conditions and financial situation
Medical and other aids Various types of (technical) aids, such as security alarms, are provided to make everyday life easier, and to help people remain in their own homes. Swedish, Norwegian and Finnish date is shown in Table 3.9.
Table 3.9 Percentage of people in different age groups with security alarms, December 2014
Finland Norway Sweden
Men
Age
65+ 1.3 4.2 5.8
65-69 -
70-74 1.1
75-79 2.6
80-84 3.8
80+ 13.6 18.0
Women
Age
65+ 3.4 11.7 11.7
65-69 1.1
70-74 1.1
75-79 4.0
80-84 9.9
80+ 30.9 30.9 1 2013 2 Data for Finland relates to the 65-84 age group
Source: FI, the ‘Health Behaviour and Health among the Finnish Elderly’ (EVTK) survey; NO; The Norwegian Directorate of Health; SV, Statistics on care and help services to Elderly and Persons with Impairments. The National Board of Health and Welfare
Other statistics on technical aids are being compiled. In Sweden, there has been a trial of collecting statistics on individually prescribed and individually tagged aids, whereby every device is traceable through its unique identification number. As shown in Table 3.10, approximately 20 per cent of the population aged 65 or older have such individually tagged aids prescribed, and aids are more common among women than among men.
Table 3.10 Proportion of the population aged 65+ with individually tagged technical aids in Sweden. 2014
Per cent Mean number of aids/person
Men 16.2 2.24
Women 23.2 2.09
Total 20.0 2.14
Source: The National Board of Health and Welfare in Sweden
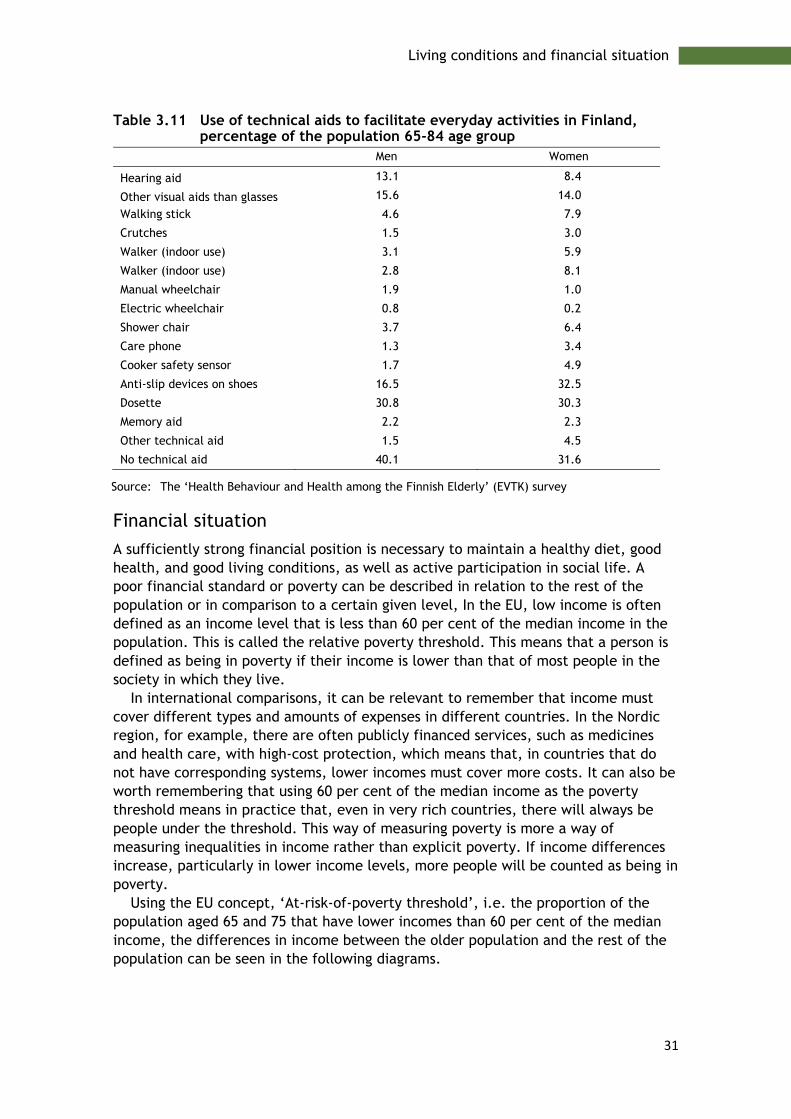
Statistics are available from Finland regarding technical aids in 2013 (Table 3.11). These statistics show that, in Finland too, more women than men have technical aids.
31
Living conditions and financial situation
Table 3.11 Use of technical aids to facilitate everyday activities in Finland, percentage of the population 65-84 age group
Men Women
Hearing aid 13.1 8.4
Other visual aids than glasses 15.6 14.0
Walking stick 4.6 7.9
Crutches 1.5 3.0
Walker (indoor use) 3.1 5.9
Walker (indoor use) 2.8 8.1
Manual wheelchair 1.9 1.0
Electric wheelchair 0.8 0.2
Shower chair 3.7 6.4
Care phone 1.3 3.4
Cooker safety sensor 1.7 4.9
Anti-slip devices on shoes 16.5 32.5
Dosette 30.8 30.3
Memory aid 2.2 2.3
Other technical aid 1.5 4.5
No technical aid 40.1 31.6
Source: The ‘Health Behaviour and Health among the Finnish Elderly’ (EVTK) survey
Financial situation
A sufficiently strong financial position is necessary to maintain a healthy diet, good health, and good living conditions, as well as active participation in social life. A poor financial standard or poverty can be described in relation to the rest of the population or in comparison to a certain given level, In the EU, low income is often defined as an income level that is less than 60 per cent of the median income in the population. This is called the relative poverty threshold. This means that a person is defined as being in poverty if their income is lower than that of most people in the society in which they live.
In international comparisons, it can be relevant to remember that income must cover different types and amounts of expenses in different countries. In the Nordic region, for example, there are often publicly financed services, such as medicines and health care, with high-cost protection, which means that, in countries that do not have corresponding systems, lower incomes must cover more costs. It can also be worth remembering that using 60 per cent of the median income as the poverty threshold means in practice that, even in very rich countries, there will always be people under the threshold. This way of measuring poverty is more a way of measuring inequalities in income rather than explicit poverty. If income differences increase, particularly in lower income levels, more people will be counted as being in poverty.
Using the EU concept, ‘At-risk-of-poverty threshold’, i.e. the proportion of the population aged 65 and 75 that have lower incomes than 60 per cent of the median income, the differences in income between the older population and the rest of the population can be seen in the following diagrams.

32
Living conditions and financial situation
Figure 3.4 At-risk-of-poverty rate by poverty threshold, percentage of population 65+ and 75+, 2015
We find in Figures 3.4 that the proportion living under what Eurostat regards as poverty is clearly highest among women in Norway, Finland, and Sweden, and that the proportions increase with age. The differences between men and women are also biggest in these countries. To all intents and purposes, gender differences reflect today’s and, above all, past inequalities in wages and salaries and conditions in the labour market. The smallest differences between men and women are in Denmark and Iceland.
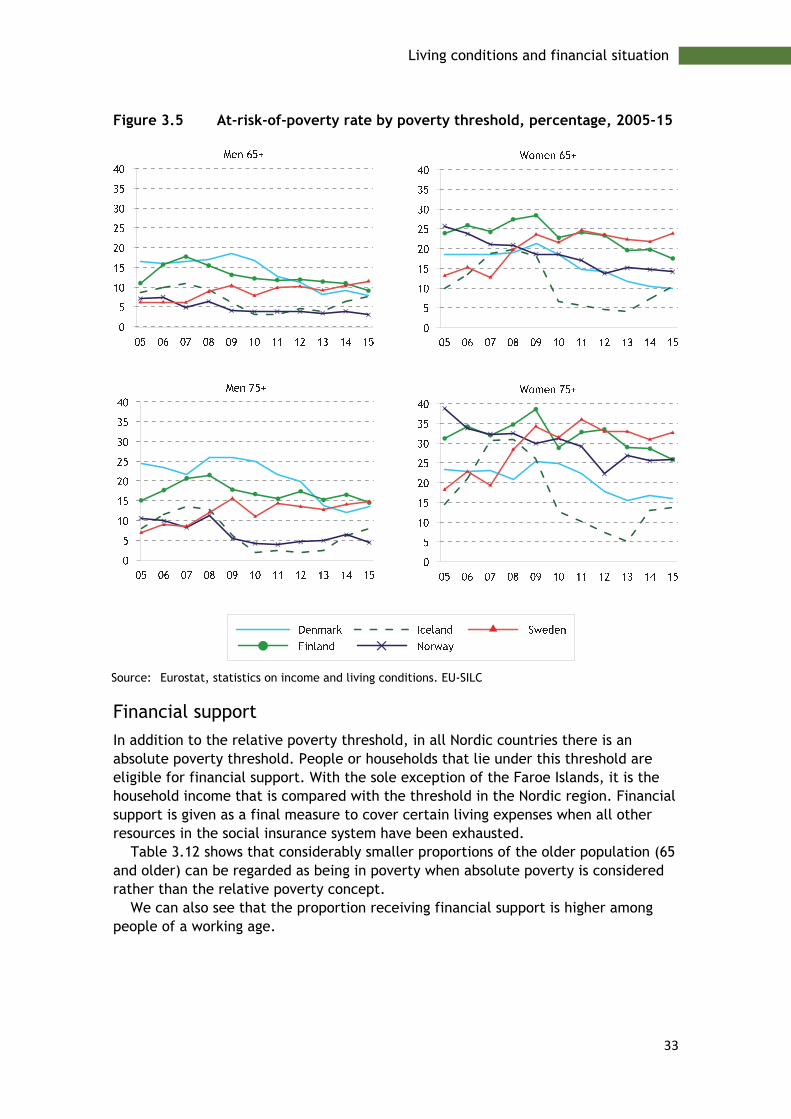
Seen over time, the proportions that lie under the poverty threshold have decreased in recent years, both for younger old people (65-75) and for older old people (75 and older), in all Nordic countries except Sweden (Figures 3.5). The trend in Sweden can be explained by the relatively high salary increases in the working population, while pensions have remained relatively unchanged. Similarly, the working population in Sweden has received significant tax relief in the form of job tax deduction that has not benefited retired people.
33
Living conditions and financial situation
Figure 3.5 At-risk-of-poverty rate by poverty threshold, percentage, 2005-15
Source: Eurostat, statistics on income and living conditions. EU-SILC
Financial support
In addition to the relative poverty threshold, in all Nordic countries there is an absolute poverty threshold. People or households that lie under this threshold are eligible for financial support. With the sole exception of the Faroe Islands, it is the household income that is compared with the threshold in the Nordic region. Financial support is given as a final measure to cover certain living expenses when all other resources in the social insurance system have been exhausted.
Table 3.12 shows that considerably smaller proportions of the older population (65 and older) can be regarded as being in poverty when absolute poverty is considered rather than the relative poverty concept.
We can also see that the proportion receiving financial support is higher among people of a working age.

34
Living conditions and financial situation
Table 3.12 People drawing financial social assistance in 2015 as percentages of the age groups in the population
Age Denmark Finland1 Iceland Norway Sweden2
65+ - 1.5 0.6 0.5 0.5 16/18 and over 3.6 6.7 2.8 3.7 3.5
1 2014
Source: NOSOSKO, Social protection in the Nordic countries, 2015-2016
The largest proportions of older people (by household) granted financial support are in Finland.
35
Life style
Chapter 4
Life style
In the past decades, health in the population as a whole has improved. Most old people enjoy good health and can live for many years with retained health and good functional abilities. Together with improved living habits, the reduced mortality for many causes of death has led to an increase in average life expectancy.
Our living habits are very important for health, and are linked to values, lifestyle, and cultural patterns, and change over time. Health changes in old people often depend on factors earlier in life. Lifestyle factors such as smoking, alcohol, overweight and obesity, physical inactivity, social activity and diet affect our health in different ways. A collection of unhealthy living habits increases the risk of developing illhealth. In many of the Nordic countries, alcohol consumption, overweight and obesity have increased, which in the long term can lead to more diseases and increased need for treatment and care.
Smoking
Smoking multiplies the risk of, above all, cancer diseases, cardiovascular diseases, respiratory disorders and premature death. Even for old people who have smoked for many years, giving up smoking can bring significant health benefits.
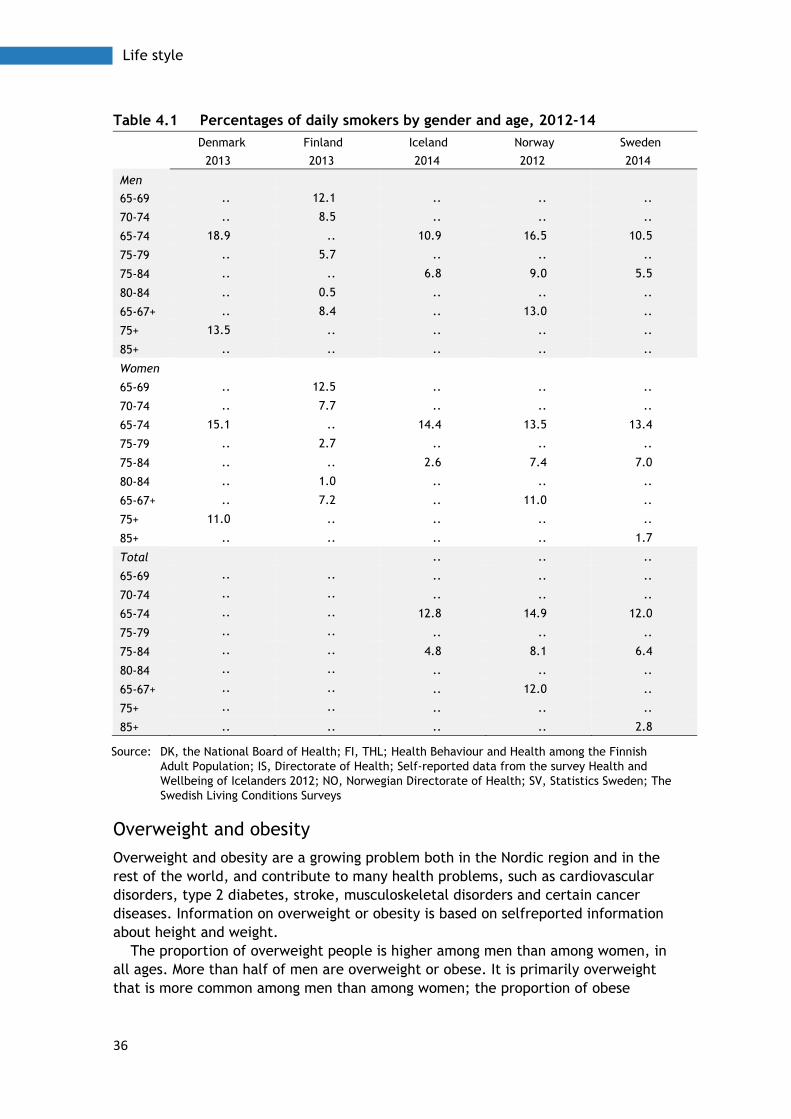
The proportion of smokers among the elderly varies, both between the Nordic countries and between women and men. In Table 4.1, the Nordic interview surveys report different age groups, so the statistics are not directly comparable between the Nordic countries. Swedish men and Icelandic women smoke least in the 65 to 74 age group. Finnish men and women have a small proportion of daily smokers, particularly in the 70 to 74 age group.
36
Life style
Table 4.1 Percentages of daily smokers by gender and age, 2012-14
Denmark Finland Iceland Norway Sweden
2013 2013 2014 2012 2014
Men
65-69 .. 12.1 .. .. ..
70-74 .. 8.5 .. .. ..
65-74 18.9 .. 10.9 16.5 10.5
75-79 .. 5.7 .. .. ..
75-84 .. .. 6.8 9.0 5.5
80-84 .. 0.5 .. .. ..
65-67+ .. 8.4 .. 13.0 ..
75+ 13.5 .. .. .. ..
85+ .. .. .. .. ..
Women
65-69 .. 12.5 .. .. ..
70-74 .. 7.7 .. .. ..
65-74 15.1 .. 14.4 13.5 13.4
75-79 .. 2.7 .. .. ..
75-84 .. .. 2.6 7.4 7.0
80-84 .. 1.0 .. .. ..
65-67+ .. 7.2 .. 11.0 ..
75+ 11.0 .. .. .. ..
85+ .. .. .. .. 1.7
Total .. .. ..
65-69 .. .. .. .. ..
70-74 .. .. .. .. ..
65-74 .. .. 12.8 14.9 12.0
75-79 .. .. .. .. ..
75-84 .. .. 4.8 8.1 6.4
80-84 .. .. .. .. ..
65-67+ .. .. .. 12.0 ..
75+ .. .. .. .. ..
85+ .. .. .. .. 2.8
Source: DK, the National Board of Health; FI, THL; Health Behaviour and Health among the Finnish Adult Population; IS, Directorate of Health; Self-reported data from the survey Health and Wellbeing of Icelanders 2012; NO, Norwegian Directorate of Health; SV, Statistics Sweden; The Swedish Living Conditions Surveys
Overweight and obesity
Overweight and obesity are a growing problem both in the Nordic region and in the rest of the world, and contribute to many health problems, such as cardiovascular disorders, type 2 diabetes, stroke, musculoskeletal disorders and certain cancer diseases. Information on overweight or obesity is based on selfreported information about height and weight.
The proportion of overweight people is higher among men than among women, in all ages. More than half of men are overweight or obese. It is primarily overweight that is more common among men than among women; the proportion of obese

37
Life style
people is the same for both men and women. However, a higher proportion of women than men report that they have problems caused by overweight or obesity.
There is an association with age. The proportion of men who are overweight or obese increases up to the age of 55-59, after which the proportion is stable until 70-74, when the proportion starts to fall. The proportion of women who are overweight or obese continues to increase up to the age of 75-79.
Table 4.2 Percentage of elderly persons with overweight or obesity by gender and age in the Nordic countries, 2012-14
Denmark Finland Iceland Norway Sweden
2013 2013 2014 2012 2014
Over- weight and obesity >25
Obesity I,
30-31.9
Obesity II,
> 32
Over-weight
25-29.9
Obesity, > 30
Over
weight
25-29.9
Obesity, > 30
Over-
weight
25-29.9
Obesity, > 30
Men
65-69 .. 8.7 12.6 .. .. .. .. .. ..
70-74 .. 10 6.8 .. .. .. .. .. ..
65-74 65.9 .. .. 50.2 24.8 48.1 13.7 46.5 16.5
75-79 .. 9.2 6.3 .. .. .. .. .. ..
80-84 .. 4.9 5.4 .. .. 45.5 5.2 40.2 11.7
65+ .. 8.6 8.9 .. .. .. .. .. ..
75+ 57.7 .. .. .. .. .. .. .. ..
85+ .. .. .. .. .. .. .. .. ..
Women
65-69 .. 8.4 14.1 .. .. .. .. .. ..
70-74 .. 11.9 13.2 .. .. .. .. .. ..
65-74 49.8 .. .. 43.2 24.4 38.7 11 35.8 17.8
75-79 .. 8.5 12.7 .. .. .. .. .. ..
80-84 .. 13.5 13.5 .. .. 35.9 15.8 39.7 14.5
65+ .. 10.2 13.3 .. .. .. .. .. ..
75+ 44.3 .. .. .. .. .. .. .. ..
85+ .. .. .. .. .. .. .. 28.5 11.5
Source: DK, the National Board of Health; IS, Directorate of Health. Self-reported data from the survey Health and Wellbeing of Icelanders 2012; FI, THL; Health. Behaviour and Health among the Finnish Adult Population; NO, Norwegian Directorate of Health; SV, Statistics Sweden
Alcohol
In many of the Nordic countries, alcohol consumption is increasing. In the long term, this can lead to more disease and acute need for treatment and care, as well as an increase of mortality in cancer, cardiovascular disorders and liver diseases, such as renal cirrhosis. Added to this are injuries caused by accidents and violence-related deaths that occur under the influence of alcohol. Alcohol mortality in the Nordic countries is highest in Denmark and Finland.

38
Life style
Table 4.3 Deaths from alcohol-related causes1 per 100 000 inhabitants by gen-der and age, 2014
Denmark Finland Iceland2 Norway Sweden
Men, age
65-74 98.8 110.5 16.5 32.8 39.1
75+ 55.2 55.7 9.7 23.8 19.4
Woman, age
65-74 38.4 53.4 15.5 8 11.8
75+ 17.7 19.1 1.8 6.1 3.8
Total
65-74 67.7 84.4 14.5 20.2 25.2
75+ 33.1 101.1 5.2 13.3 10.3
1 ICD-10: E244, F10, G312, G621, G721, I426, K292, K700-709, K860, O354, P043, Q860, Y15, X45 2 2010-14
Source: The national registers for causes of death

39
Diagnosis-related morbidity and mortality
Chapter 5
Diagnosis-related morbidity and mortality
In this section, diagnosis-related data is presented, based on the respective registers in the Nordic countries for cancer, patients, prescribed drugs and causes of death (see below). The information concerns several diseases and disease groups that are common among old people. They are presented in ten sections.
5.1 Cardiovascular diseases 5.2 Cancer diseases 5.3 Diseases of the digestive system and the urinary system 5.4 Endocrine diseases 5.5 COPD and asthma 5.6 Pneumonia 5.7 Dementia and Alzheimer’s disease 5.8 Mental illness 5.9 Muscular and skeletal diseases 5.10 Falls and hip fractures
For all disease groups, data is presented on patients admitted to hospital and mortality. For treatment, data is presented on prescribed and collected medicines for most of the disease groups and, for some groups, surgical measures. Cancer data concerns newly detected tumours during the year.
Patients register data show the number of patients who were discharged after hospital treatment during the year in question. Every unique individual was only counted once per year, on discharge from the first treatment period with the diagnosis in question as the main diagnosis, i.e. the main reason for the treatment occasion. The information shows how common a certain diagnosis or diagnosis group is as a cause of hospitalisation, which is not necessarily a measure of illness.
Many of the differences in the tables and figures are caused by organisational differences in health care systems, and in differences in registration practices and coding of diagnoses. This applies, for example, to the information about the number of patients treated in hospital for fibrillation and for hypertension.
Data from the Norwegian Patient Register also includes patients who have been treated in open care, which means that these are not comparable with data from the other Nordic Countries.

40
Diagnosis-related morbidity and mortality
Cancer register data show the incidence of cancer, i.e. the number of newly detected cancer cases/tumours in the year in question. All Nordic countries except Sweden have centralised coding and classification. The Swedish cancer register does not follow up cancer cases in the Cause of Death Register to find any cancer cases that were not reported to the register, unlike the other Nordic cancer registers. This can mean that Sweden may report too low incidence figures, particularly for old people and for diseases with short survival and high mortality. Swedish survival data shown in the section on quality indicators may also be overestimated. Lung cancer is an example of a cancer disease where Swedish incidence and survival data may not be directly comparable with the data from the other Nordic countries. However, mortality is more comparable.
Prescription register data show prescribed and collected medicines. However, it does not include over-the-counter medicines, nor orders to nursing homes or medicines consumed in hospitals. Differences in how orders versus prescriptions are managed in old people’s homes in the different countries can affect comparisons of medicine data. In Norway, for example, medicines are distributed within the municipal nursing homes from a central medicines store, and are therefore not included in the prescription register. In Sweden, on the other hand, medicines are prescribed to people who live in elderly care homes primarily individually via primary care doctors, and so are recorded in the Swedish register. For Finland, it was not possible to produce drug statistics in 5-year classes for 2014.
Consequently, when interpreting data presented in this report, it is important to bear in mind that conditions relating to collection of data to the registers can differ from country to country. For example, differences in health care structure mean that data for the exact same patient groups are not collected and reported, or that there are certain differences in classification and coding practices.
Also, it is important to remember that the way of presenting data with age-standardisation has both advantages and limitations. The diseases shown in this report are usually strongly age-dependent. The advantage of age standardisation is that it allows comparisons between countries and over time, regardless of differences in age composition. In this way, it can be excluded that the differences shown depend on differences in age structure.
We have chosen to age-standardise the data, using the 2014 Nordic population. One disadvantage of age standardisation is that, for example, the number of cancer cases shown for each country and time are not the actual figures; they are converted to the number that would have applied if the population in question had the same age composition as the Nordic region as a whole in 2014. The information presented only gives a relative picture of cancer-related illness in the Nordic region, not an exact picture in the individual country.
It is also important to remember that the number of cases per 100 000 inhabitants shown in the tables and figures does not describe the actual numbers treated. For example, 1 290 cases of acute myocardial infarction per 100 000 men aged 80 and older in Iceland in 2014 gives the impression of a major load on health care. But since there are only just over 4 800 men in that age group, the actual figure was only just over 60 cases of acute myocardial infarction treated in Icelandic hospitals.

41
Diagnosis-related morbidity and mortality
Registers used in the report
Denmark
Cancer: The Danish Cancer Registry (The Danish Health Data Authority)
Patients: The Danish National Patient Register (The Danish Health Data Authority)
Prescriptions: The Danish National Prescription Database (The Danish Health Data Authority)
Cause of death:
Danish Cause of Death Register (The Danish Health Data Authority)
Finland
Cancer: The Finnish Cancer Registry (Institute for Statistical and Epidemiological Cancer Research / National Institute for Health and Welfare
Patients: Finnish Hospital Discharge Register (National Institute for Health and Welfare)
Prescriptions: The Finnish Prescription Register (The Social Insurance Institution of Finland)
Cause of death:
Finnish Cause of Death Register (Statistics Finland)
Iceland
Cancer: Icelandic Cancer Registry (the Icelandic Cancer Society)
Patients: National Patient Register (Directorate of Health in Iceland)
Prescriptions: Prescription Drugs Database (Directorate of Health in Iceland)
Cause of death:
Causes of Death Register (Directorate of Health in Iceland)
Norway
Cancer: The Cancer Registry of Norway (Institute of Population based Cancer Research)
Patients: The Norwegian Patient Registry (the Norwegian Directorate of Health)
Prescriptions: Norwegian Prescription Database (Norwegian Institute of Public Health)
Cause of death:
Norwegian Cause of Death Registry (Norwegian Institute of Public Health)

42
Diagnosis-related morbidity and mortality
Sweden
Cancer: The Swedish Cancer Register (National Board of Health and Welfare)
Patients: The Swedish National Patient Register (National Board of Health and Welfare)
Prescriptions: The Swedish Prescribed Drug Register (National Board of Health and Welfare)
Cause of death:
Swedish Cause of Death Register (National Board of Health and Welfare)

43
Diagnosis-related morbidity and mortality
5.1 Cardiovascular diseases
Cardiovascular diseases are the most common cause of hospital care and fatalities among old people. Myocardial infarction is caused by acute lack of oxygen due to clot formation in the heart’s coronary artery. Stroke is the generic name for myocardial infarction, cerebral haemorrhage and cerebral membrane bleeding. Myocardial infarction, also called ischaemic stroke, is the most common form of stroke. Atrial fibrillation is a cardiac dysrhythmia that increases the risk of blood clotting and myocardial infarction. Heart failure has several causes, the most common being coronary artery disease and high blood pressure.
The risk of contracting cardiovascular diseases is correlated to gender, but above all to age. People who die from cardiovascular diseases are generally older than 65. Known risk factors for cardiovascular diseases include hereditary factors, smoking, high blood pressure, dyslipidaemia, diabetes, physical inactivity, and alcohol. The more risk factors, the greater the risk of developing cardiovascular diseases.
Apart from the consequences shown below in the form of hospitalisation and death, cardiovascular diseases also cause disabilities among old people. Stroke can lead to permanent disability. Heart failure may not only affect the heart; it can also affect the functions of the brain and skeletal musculature, resulting in increased tiredness and poorer quality of life.
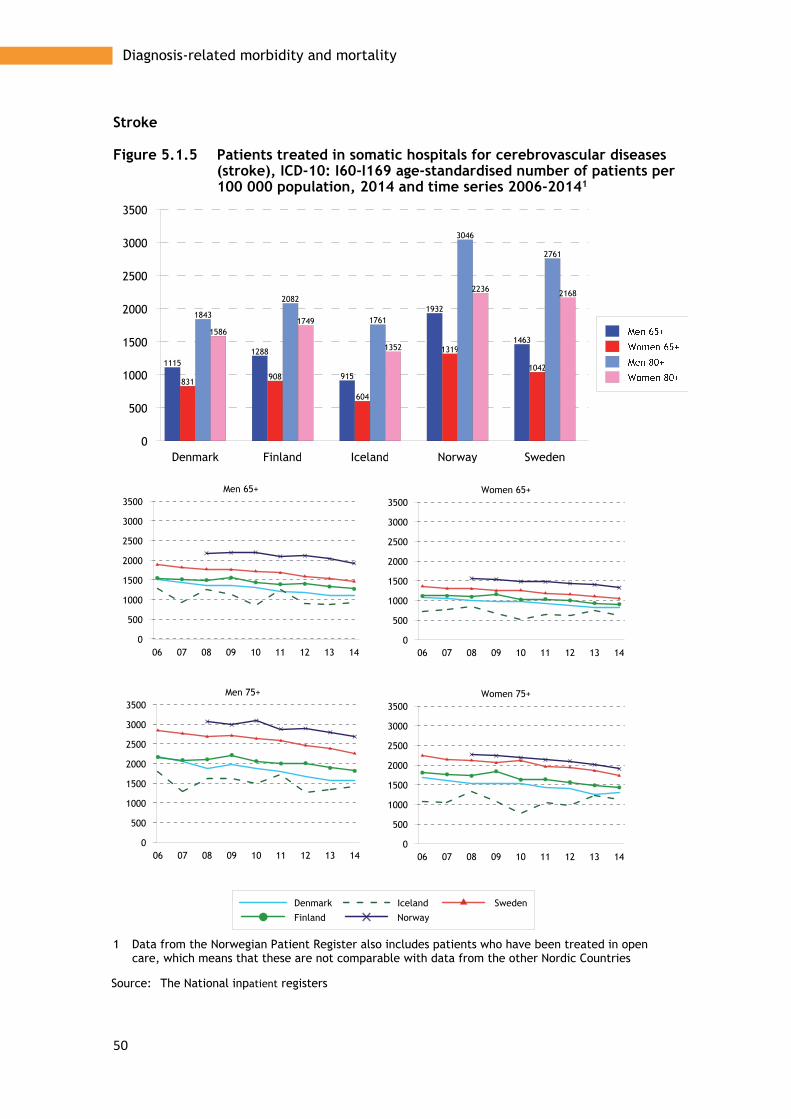
Hospitalisation Cardiovascular diseases are very common causes of hospitalisation among old people. Stroke is the somatic disease responsible for the most days of hospital care among old people.
Men are more likely than women to suffer myocardial infarction and stroke, and women are generally considerably older when they become ill (Figure 5.1.1). However, because there are more women in older age groups, the difference in the actual numbers that develop cardiovascular diseases is not great.
The number of people contracting myocardial infarction and stroke has fallen in all age groups, but somewhat less in younger than older ages (Figure 5.1.1). Norway and Sweden have the largest number of cases of illness, but the differences between the Nordic countries have decreased, and mainly in the very oldest age groups.
High blood pressure is one of the most common causes of cardiac diseases. How blood pressure is recorded on admission to hospital varies from country to country, so data from the patient registers does not necessarily reflect differences in illness. Norway reports the clearly highest proportion of older patients treated for high blood pressure and for fibrillations (Figure 5.1.1). While the proportion treated for high blood pressure has fallen, the proportion treated for fibrillation increased between 2006 and 2014 (Figure 5.1.1). In other countries, the proportions have remained largely unchanged. This also applies for heart failure (Figure 5.1.1)
Pharmaceutical treatment Even if admission to hospital is common, a large proportion of old people with cardiovascular diseases are treated with pharmaceuticals and the most common are shown below. However, these pharmaceuticals are also prescribed for other diseases, for example renal failure.
Diuretics (C03), which increase the amount of salt and water expelled from the body, are used to reduce the water content of the blood, which helps to reduce the

44
Diagnosis-related morbidity and mortality
pressure in the blood vessels. Diuretics are prescribed more often to women than to men, and are used most frequently in Denmark and Iceland. They are prescribed least in Norway, and prescription of these drugs is generally decreasing throughout the Nordic region (Figure 5.1.2).
Betablockers (C07) protect the heart by reducing the pulse and dampening stress symptoms, and are used to treat high blood pressure and heart failure. Betablockers are used most in Finland and Iceland, and least in Denmark (Figure 5.1.2). Prescription of betablockers is increasing somewhat, primarily among the oldest age groups.
Calcium antagonists (C08) widen the arteries by reducing the potassium content in the artery muscles, which has a sedating effect and reduces pressure. Norway uses least of these drugs and Denmark most. Consumption has increased, but by different amounts, which means a greater variation in the prescription patterns between the Nordic countries (Figure 5.1.2).
Pharmaceuticals that affect the renin-angiotensin system (C09) are used to improve the long-term prognosis in heart failure and myocardial infarction, and are used mainly in Finland and in other countries at approximately the same, slightly lower, level (Figure 5.1.2). Use is increasing generally.
Lipid-lowering drugs (C10) reduce the new formation of cholesterol in the body, and help to increase the good cholesterol (HDL) and reduce the bad cholesterol (LDL) and the triglycerides, which reduce the risk of heart disease and premature death (Figure 5.1.2).
Surgical treatment Myocardial infarction is caused by clots forming in the heart’s coronary artery. Figure 5.1.3 show the frequency of two important treatment forms that work by opening the passage in the coronary artery, PCI treatment (Percutaneous Coronary Intervention) and CABG treatment (coronary artery bypass grafting, sometimes just called a bypass). Figure 5.1.3 also show that surgical intervention is most common in the 75-84 age group, and that Norway has a somewhat higher treatment frequency than other Nordic countries, particularly for PCI.
PCI is more common than bypass. The differences are greatest among women and are generally highest in Sweden. Gender differences can be seen in both treatments. In the 65-74 age group, PTCA is performed three times more often among men than women. In the 75-84 age group, the frequency is twice as high. For bypass operations, the difference is four times for younger age groups and three times for older age groups.
Mortality Mortality due to cardiovascular diseases is considerably higher in older than younger age groups, and is higher among men than women. Mortality in myocardial infarction is highest in Finland and lowest in Norway (Figure 5.1.3). Mortality in stroke is highest in Denmark and lowest in Iceland (Figure 5.1.3).
Mortality due to cardiovascular diseases has fallen considerably throughout the Nordic region for both men and women, and has helped to increase average life expectancy. Despite the noticeable decrease in recent decades, cardiovascular diseases are still the most common cause of death among old people.

45
Diagnosis-related morbidity and mortality
The decreasing mortality is due to a decreased level of illness through improved lifestyle habits, such as reduced smoking, and improved survival among those who become ill, for example through better treatment methods. In the chapter on quality indicators, mortality 30 days after illness is compared.
Statistics – Cardiovascular diseases
The figures show information for 2014 divided into gender and the 65+ and 80+ age groups. For the period 2006-2014, information is reported for the 65+ and 75+ age groups. The statistics show:
Patients discharged from hospital • Acute myocardial infarction • Hypertensions • Stroke • Heart failure • Atrial fibrillation and flutter Pharmaceutical treatment • Agents acting on the renin-angiotensin system • Beta-blocking agents • Calcium channel blockers • Diuretics • Lipid modifying agents Surgical measures • Transluminal coronary angioplasty (PTCA, PCI) • Coronary artery bypass grafting Death • Ischaemic heart disease • Stroke

46
Diagnosis-related morbidity and mortality
Patients discharged from hospital
Figure 5.1.1 Patients treated in somatic hospitals for acute myocardial infarction, ICD-10: I21-I22, age-standardised number of patients per 100 000 population, 2014 and time series 2006-20141
1 Data from the Norwegian Patient Register also includes patients who have been treated in open
care, which means that these are not comparable with data from the other Nordic Countries
Source: The National inpatient registers
Denmark Finland Iceland Norway Sweden0
500
1000
1500
2000
762
966916
1267
1058
405
518471
647574
1149
1659
1290
1996
1746
732
1112
697
1258
1141
06 07 08 09 10 11 12 13 140
500
1000
1500
2000
2500
Denmark
Finland
Iceland
Norway
Sweden
Men 75+
06 07 08 09 10 11 12 13 14
0
500
1000
1500
2000
2500Women 75+
06 07 08 09 10 11 12 13 140
500
1000
1500
2000
2500Women 65+
06 07 08 09 10 11 12 13 14
0
500
1000
1500
2000
2500Men 65+

47
Diagnosis-related morbidity and mortality
Figure 5.1.2 Patients treated in somatic hospitals for hypertension, ICD-10: I10-I15, age-standardised number of patients per 100 000 population, 2014 and time series 2006-20141
1 Data from the Norwegian Patient Register also includes patients who have been treated in open
care, which means that these are not comparable with data from the other Nordic Countries
Source: The National inpatient registers
Denmark Finland Iceland Norway Sweden0
500
1000
1500
2000
222 215
88
1743
120
308 294
175
1628
187
343427
138
1403
196
523606
399
1561
341
06 07 08 09 10 11 12 13 140
500
1000
1500
2000
2500
Denmark
Finland
Iceland
Norway
Sweden
Men 75+
06 07 08 09 10 11 12 13 14
0
500
1000
1500
2000
2500Women 75+
06 07 08 09 10 11 12 13 140
500
1000
1500
2000
2500Women 65+
06 07 08 09 10 11 12 13 14
0
500
1000
1500
2000
2500Men 65+

48
Diagnosis-related morbidity and mortality
Heart failure
Figure 5.1.3 Patients treated in somatic hospitals for heart failure. ICD-10: I50. Age-standardised number of patients per 100 000 population, 2014 and time series 2006-20141
1 Data from the Norwegian Patient Register also includes patients who have been treated in open
care, which means that these are not comparable with data from the other Nordic Countries
Source: The National inpatient registers
06 07 08 09 10 11 12 13 140
500
1000
1500
2000
2500
3000
3500
Denmark
Finland
Iceland
Norway
Sweden
Men 75+
06 07 08 09 10 11 12 13 140
500
1000
1500
2000
2500
3000
3500Women 75+
06 07 08 09 10 11 12 13 140
500
1000
1500
2000
2500
3000
3500Women 65+
06 07 08 09 10 11 12 13 140
500
1000
1500
2000
2500
3000
3500Men 65+

49
Diagnosis-related morbidity and mortality
Atrial fibrillation and flutter
Figure 5.1.4 Patients treated in somatic hospitals for atrial fibrillation and flutter, ICD-10: I48, age-standardised number of patients per 100 000 population, 2014 and time series 2006-20141
1 Data from the Norwegian Patient Register also includes patients who have been treated in open
care, which means that these are not comparable with data from the other Nordic Countries
Source: The National inpatient registers
Denmark Finland Iceland Norway Sweden
0
500
1000
1500
2000
2500
3000
3500
4000
1371
1080
811
3171
10291064958
566
1930
917
1862
16181439
3876
1388
1746 1750
954
2857
1560
06 07 08 09 10 11 12 13 140
500
1000
1500
2000
2500
3000
3500
4000
Denmark
Finland
Iceland
Norway
Sweden
Men 75+
06 07 08 09 10 11 12 13 140
500
1000
1500
2000
2500
3000
3500
4000Women 75+
06 07 08 09 10 11 12 13 140
500
1000
1500
2000
2500
3000
3500
4000Women 65+
06 07 08 09 10 11 12 13 140
500
1000
1500
2000
2500
3000
3500
4000Men 65+
50
Diagnosis-related morbidity and mortality
Stroke
Figure 5.1.5 Patients treated in somatic hospitals for cerebrovascular diseases (stroke), ICD-10: I60-I169 age-standardised number of patients per 100 000 population, 2014 and time series 2006-20141
1 Data from the Norwegian Patient Register also includes patients who have been treated in open
care, which means that these are not comparable with data from the other Nordic Countries
Source: The National inpatient registers
Denmark Finland Iceland Norway Sweden0
500
1000
1500
2000
2500
3000
3500
11151288
915
1932
1463
831908
604
1319
1042
1843
2082
1761
3046
2761
15861749
1352
2236 2168
06 07 08 09 10 11 12 13 140
500
1000
1500
2000
2500
3000
3500
Denmark
Finland
Iceland
Norway
Sweden
Men 75+
06 07 08 09 10 11 12 13 140
500
1000
1500
2000
2500
3000
3500Women 75+
06 07 08 09 10 11 12 13 140
500
1000
1500
2000
2500
3000
3500Women 65+
06 07 08 09 10 11 12 13 140
500
1000
1500
2000
2500
3000
3500Men 65+

51
Diagnosis-related morbidity and mortality
Pharmaceutical treatment
Figure 5.1.6 Prescription of diuretics, ATC: C03, age-standardised one-year prevalence per 100 000 population, 2014 and time series 2006-2014
Source: The National prescription databases

52
Diagnosis-related morbidity and mortality
Beta-blocking agents
Figure 5.1.7 Prescription of beta-blocking agents, ATC: C07, age-standardised one-year prevalence per 100 000 population, 2014 and time series 2006-2014
Source: The National prescription databases
06 07 08 09 10 11 12 13 140
100
200
300
400
500
600
Denmark
Finland
Iceland
Norway
Sweden
Men 75+
06 07 08 09 10 11 12 13 140
100
200
300
400
500
600Women 75+
06 07 08 09 10 11 12 13 140
100
200
300
400
500
600Women 65+
06 07 08 09 10 11 12 13 140
100
200
300
400
500
600Men 65+
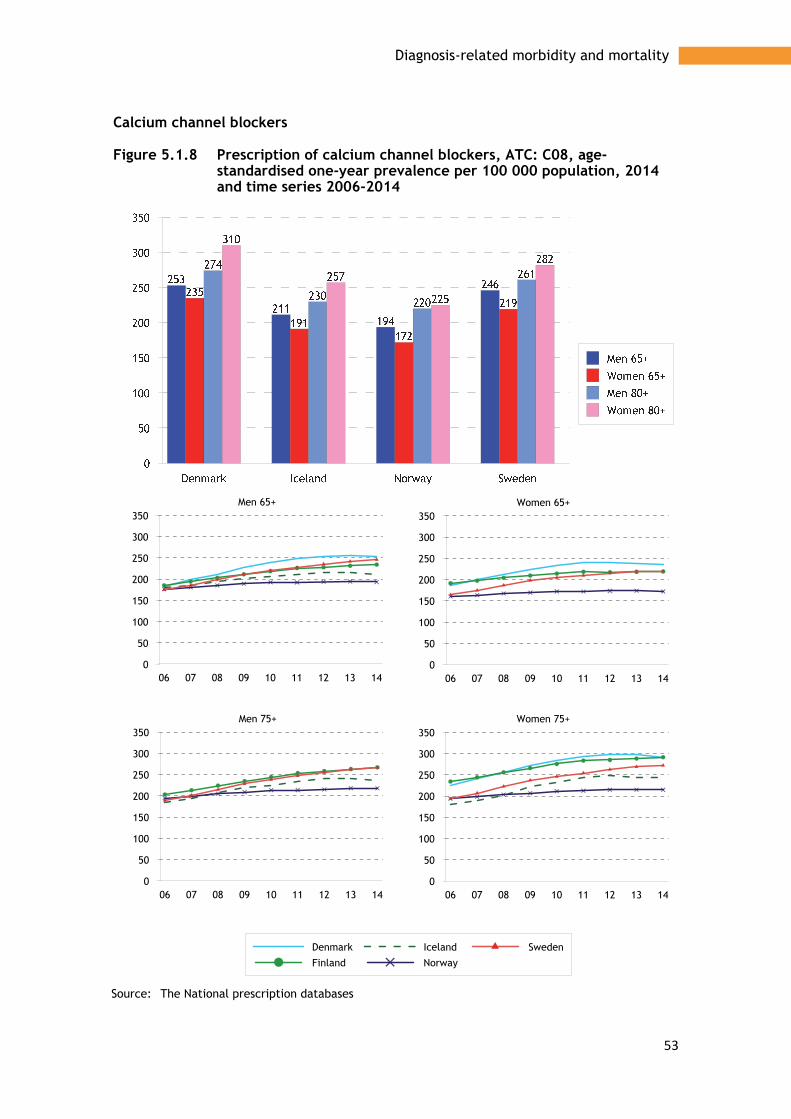
53
Diagnosis-related morbidity and mortality
Calcium channel blockers
Figure 5.1.8 Prescription of calcium channel blockers, ATC: C08, age-standardised one-year prevalence per 100 000 population, 2014 and time series 2006-2014
Source: The National prescription databases
06 07 08 09 10 11 12 13 140
50
100
150
200
250
300
350
Denmark
Finland
Iceland
Norway
Sweden
Men 75+
06 07 08 09 10 11 12 13 140
50
100
150
200
250
300
350Women 75+
06 07 08 09 10 11 12 13 140
50
100
150
200
250
300
350Women 65+
06 07 08 09 10 11 12 13 140
50
100
150
200
250
300
350Men 65+

54
Diagnosis-related morbidity and mortality
Agents acting on the renin-angiotensin system
Figure 5.1.9 Prescription of agents acting on the renin-angiotensin system, ATC: C09, age-standardised one-year prevalence per 100 000 population, 2014 and time series 2006-2014
Source: The National prescription databases
06 07 08 09 10 11 12 13 140
100
200
300
400
500
Denmark
Finland
Iceland
Norway
Sweden
Men 75+
06 07 08 09 10 11 12 13 140
100
200
300
400
500Women 75+
06 07 08 09 10 11 12 13 140
100
200
300
400
500Women 65+
06 07 08 09 10 11 12 13 140
100
200
300
400
500Men 65+
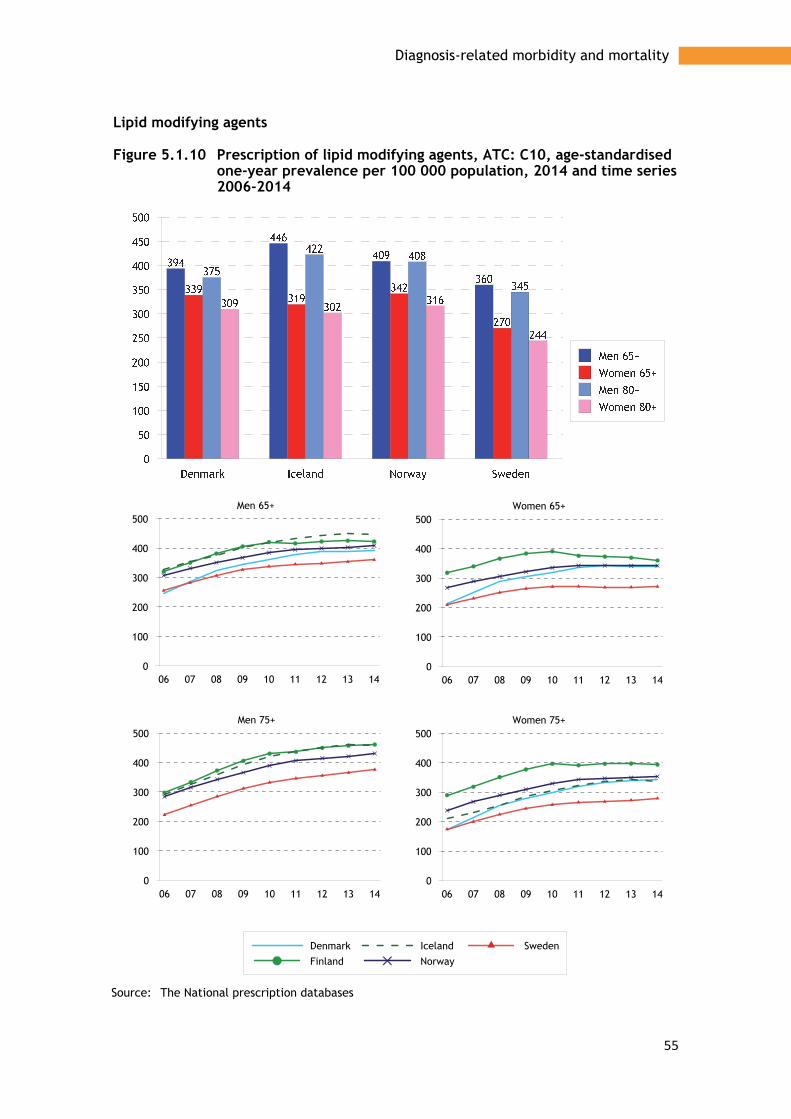
55
Diagnosis-related morbidity and mortality
Lipid modifying agents
Figure 5.1.10 Prescription of lipid modifying agents, ATC: C10, age-standardised one-year prevalence per 100 000 population, 2014 and time series 2006-2014
Source: The National prescription databases
06 07 08 09 10 11 12 13 140
100
200
300
400
500
Denmark
Finland
Iceland
Norway
Sweden
Men 75+
06 07 08 09 10 11 12 13 140
100
200
300
400
500Women 75+
06 07 08 09 10 11 12 13 140
100
200
300
400
500Women 65+
06 07 08 09 10 11 12 13 140
100
200
300
400
500Men 65+

56
Diagnosis-related morbidity and mortality
Surgical measures
Figure 5.1.11 Transluminal coronary angioplasty (PTCA/PCI) NCSP: FNG 02; FNG 05, total numbers of procedures per 100 000 in the age group, 2013
Source: NOMESCO: Health Statistics in the Nordic Countries 2016

57
Diagnosis-related morbidity and mortality
Bypass/CABG
Figure 5.1.12 Coronary artery bypass graft. NCSP: FNC. FND. FNE, total numbers of procedures per 100 000 in the age group, 2013
Source: NOMESCO: Health Statistics in the Nordic Countries 2016
Denmark Finland Norway Sweden0
50
100
150
200
250
300
350
231215
307
210
265245
336
233
30 28
71
29
Men
Denmark Finland Norway Sweden0
50
100
150
200
250
300
350
47 50
74
5068
92 100
69
5 13 18 10
Women

58
Diagnosis-related morbidity and mortality
Death
Figure 5.1.13 Deaths from ischaemic heart disease, ICD-10: I20-I25, age-standardised deaths per 100 000 population, 2014 and time series 2006-2014
Source: The National registers for causes of death
Denmark Finland Norway Sweden0
500
1000
1500
2000
2500
3000
698
1190
891
347483
666
465
207
1811
2977
2487
877
1410
2084
1440
618
Men 65+
Women 65+
Men 80+
Women 80+
06 07 08 09 10 11 12 13 140
500
1000
1500
2000
2500
3000
Denmark
Finland
Iceland
Norway
Sweden
Men 75+
06 07 08 09 10 11 12 13 140
500
1000
1500
2000
2500
3000Women 75+
06 07 08 09 10 11 12 13 140
500
1000
1500
2000
2500
3000Women 65+
06 07 08 09 10 11 12 13 14
0
500
1000
1500
2000
2500
3000Men 65+

59
Diagnosis-related morbidity and mortality
Figure 5.1.14 Deaths from stroke, ICD-10: I60-I69, age-standardised deaths per 100 000 population, 2014 and time series 2006-2014
Source: The National registers for causes of death
Denmark Finland Iceland Norway Sweden0
200
400
600
800
1000
1200
1400
438398
287321 344
425360
242283 301
1152
1039
889 903969
1226
1096
784
871927
06 07 08 09 10 11 12 13 140
200
400
600
800
1000
1200
Denmark
Finland
Iceland
Norway
Sweden
Men 75+
06 07 08 09 10 11 12 13 140
200
400
600
800
1000
1200Women 75+
06 07 08 09 10 11 12 13 140
200
400
600
800
1000
1200Women 65+
06 07 08 09 10 11 12 13 14
0
200
400
600
800
1000
1200Men 65+

60
Diagnosis-related morbidity and mortality
5.2 Cancer diseases
Cancer is one of our most common diseases and the risk of contracting cancer increases with age. Cancer is more common among older men than older women, mainly because prostate cancer is relatively common among older men. Cancer is the second most common cause of death among old people after cardiovascular diseases, regardless of gender.
As the Nordic population ages, the number of people with a cancer diagnosis has increased. However, if we remove the effect of ageing, the pattern is slightly different. Changes in the total cancer frequency in the most recent ten year period are small, and have been both positive and negative. Certain cancer types are increasing, such as breast cancer and lung cancer among women, while other types, such as stomach cancer and prostate cancer among men in the oldest age group, 75+, are decreasing.
On a more fundamental level, the number of new cancer cases and mortality in cancer are also affected by various risk factors. Smoking is a clear example that not only affects the risk of developing lung cancer, but also other cancer types. Lung cancer frequency among old people today can be said to reflect smoking habits of the older age group around two decades ago. Ultraviolet radiation from the sun is another significant risk factor in development of, for example, malignant melanoma, which is linked to changes in sunbathing habits, travel patterns, etc. Other risk factors for cancer include eating habits, alcohol consumption and degree of physical activity.
Since mortality in cardiovascular diseases has decreased, cancer has increased in relative importance as a cause of death. However, mortality in cancer has also fallen over time. One reason is that cancer is now often being diagnosed earlier, resulting in better treatment and survival prognosis. Another reason is that treatment methods are improving. (See data on 5-year survival in the section on quality indicators.)
Mortality differs greatly between cancer types. More women over 65 die from lung cancer and colorectal cancer than, for example, breast cancer. Consequently, the prognosis for breast cancer patients is better than for the two somewhat less frequent cancer types. Among men over 65, prostate cancer is the most common cancer type, both in terms of illness and mortality.
The following section describes some of the most common cancer types that affect old people.
Prostate cancer is the most common cancer type in men, and occurs most frequently in ages over 65 (Figure 5.2.2). Prostate cancer develops slowly, and the number of diagnosed cases is therefore dependent on the effectiveness of diagnostic procedures (e.g. screening using PSA test via blood test). The male sex hormone, testosterone, is significant in the development of prostate cancer. Fatness and obesity increase the risk of developing a more aggressive prostate cancer.
Norway and Sweden report most cases per 100 000 older men, both in terms of illness and mortality. Illness has remained at approximately the same level in all Nordic countries in the past decade among men aged 65+, but it has fallen somewhat for the older group (75+). Mortality is decreasing in both groups (Figure 5.2.2). However, the trend in Iceland is not as positive.

61
Diagnosis-related morbidity and mortality
Stomach cancer has decreased in recent decades, and continues to decrease, both in terms of new cases and mortality (Figures 5.2.3 and 5.2.9). Better eating habits, with more fruit and vegetables, are thought to reduce the risk of developing stomach cancer. There is also probably an association with the decline in infections caused by the Helicobacter pylori bacteria. Stomach cancer is more common among men. The differences between genders is smallest in Finland.
Colorectal cancer is one of the more common cancer types among older people. In 2014 the highest number of cases per 100 000 older people were diagnosed in Norway and the smallest number in Finland. In the past decade, there has been a slight increase in the number of diagnosed cases in the oldest group (75+), while mortality has fallen slightly. Iceland is an exception, and the oldest people in Sweden are more difficult to assess (Figures 5.2.4 and 5.2.10).
Lung cancer (including bronchus and trachea) is one of the cancer diseases with the worst prognosis, and mostly affects men. Tobacco smoking is the clearly dominant cause of lung cancer. In 2014, most lung cancer cases occurred among Danish men and women (Figure 5.2.5). Sweden had the smallest number of cases, and least differences between the genders. The fact that Sweden records the lowest incidence figures may be an effect of the Swedish cancer register not following up cancer cases in the Cause of Death Register to find any cancer cases that were not reported to the registry, unlike the other cancer registers in the Nordic region. Among men, illness has not changed significantly in the past ten years, while an increasing proportion of women have developed lung cancer in the same period.
Incidence of lung cancer has fallen in the Nordic region, except in Iceland. Figure 5.2.5 show the incidence, and Figure 5.2.11 show mortality in lung cancer.
Breast cancer is the most common type of cancer among women, and the incidence is highest in Finland and Sweden (Figure 5.2.13). The incidence in the Nordic region has increased in the past ten years (Figure 5.2.6), but the trend for mortality is not as clear. Except for Iceland, mortality has decreased somewhat, particularly in Denmark. For the 75+ age group, the trend is not as clear (Figure 5.2.12). However, an increasing number of women are now surviving breast cancer. Mortality is highest in Denmark and Iceland, and lowest in Finland.
The number of new cases of breast cancer, and mortality, is affected by screening. The Nordic countries have had screening for breast cancer to varying extents and for different lengths of time, which affects both illness and mortality.
Some forms of breast cancer are hereditary, and the risk of contracting breast cancer increases if the family history includes the disease. There is an association between breast cancer and obesity, where the fat protects the woman before the menopause but increases the risk of contracting the disease after the menopause. Giving birth to many children, and at a young age, has a protective effect. In view of the low birth rate today in many of the Nordic countries, together with the increasing age of mothers having their first children, it is possible that breast cancer will continue to increase.
Cancer of the uterus and ovary is an unusual type of cancer that occurs before the menopause, and mainly affects older women. Women who have not had children, women who started to menstruate early, and women entering the menopause late are at increased risk. Heredity is also important in the risk of developing this type of

62
Diagnosis-related morbidity and mortality
cancer. Obesity and fatness are other known risk factors. The prognosis for cancer of the uterus and ovary is relatively good. The mortality pattern is similar in the Nordic region, but Figure 5.2.53 shows that mortality is highest in Denmark and lowest in Iceland.
Statistics – Cancer diseases The figures show information for 2014 divided into gender and the 65+ and 80+ age groups. For the period 2006-2014, information is reported for the 65+ and 75+ age groups. Statistics are shown for the following forms of cancer:
New cases and mortality for • Cancer all sites • Prostate • Stomach • Colon and rectum • Lung, bronchus and trachea • Breast • Uterus and ovary

63
Diagnosis-related morbidity and mortality
New cancer cases
Figure 5.2.1 New cases of cancer1, all sites, age-standardised cases per 100 000 population, 2014 and time series 2006-2014
1 ICD-10: C00-C97
Source: The cancer registers in the Nordic countries
Denmark Finland Iceland Norway Sweden0
500
1000
1500
2000
2500
3000
3500
4000
4500
5000
3700
2358 2388
31172880
4627
1558
2653
40033765
2550
1939
1615
1877 1898
2995
1798 1735
23642252
06 07 08 09 10 11 12 13 140
500100015002000250030003500400045005000
Denmark
Finland
Iceland
Norway
Sweden
Men 75+
06 07 08 09 10 11 12 13 140
500100015002000250030003500400045005000
Women 75+
06 07 08 09 10 11 12 13 140
500100015002000250030003500400045005000
Women 65+
06 07 08 09 10 11 12 13 140
500100015002000250030003500400045005000
Men 65+
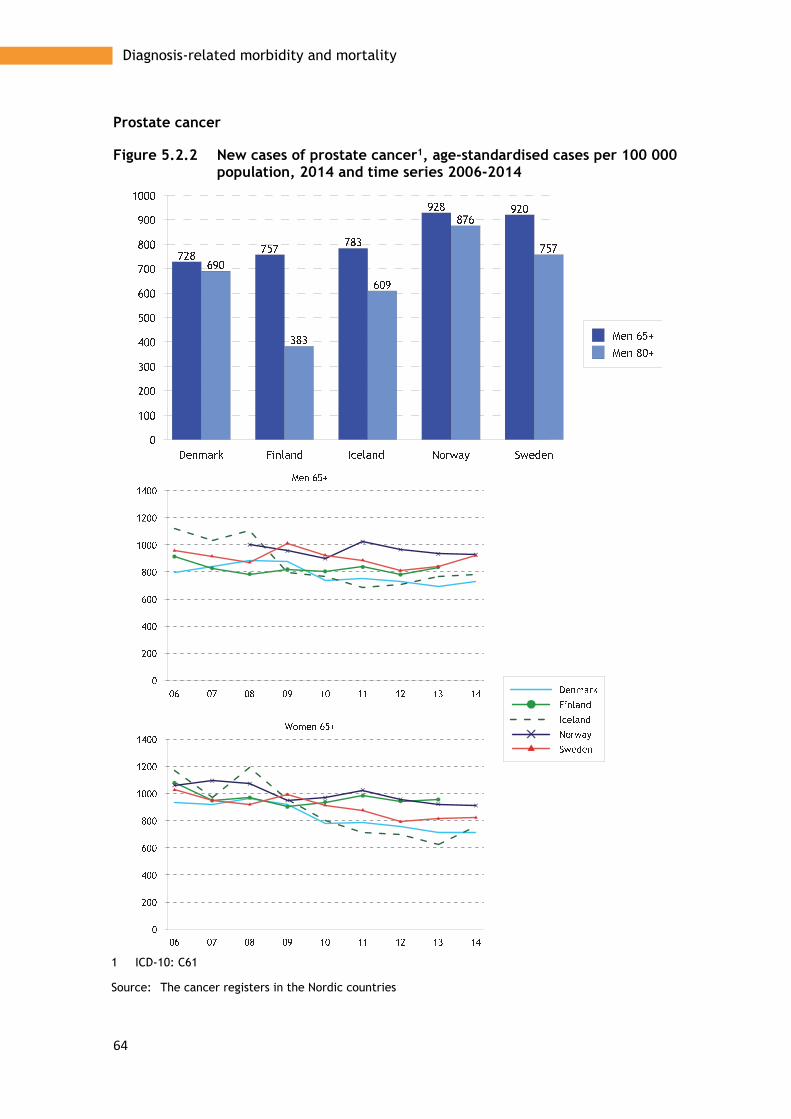
64
Diagnosis-related morbidity and mortality
Prostate cancer
Figure 5.2.2 New cases of prostate cancer1, age-standardised cases per 100 000 population, 2014 and time series 2006-2014
1 ICD-10: C61
Source: The cancer registers in the Nordic countries

65
Diagnosis-related morbidity and mortality
Stomach cancer
Figure 5.2.3 New cases of stomach cancer1, age-standardised cases per 100 000 population, 2014 and time series 2006-2014
1 ICD-10: C16
Source: The cancer registers in the Nordic countries
Denmark Finland Iceland Norway Sweden0
10
20
30
40
50
60
70
80
90
100
64
54
44
58
47
22
3630 28
23
96
48
59
93
69
25
48
28
47
28
06 07 08 09 10 11 12 13 140
20
40
60
80
100
120
140
Denmark
Finland
Iceland
Norway
Sweden
Men 75+
06 07 08 09 10 11 12 13 140
20
40
60
80
100
120
140Women 75+
06 07 08 09 10 11 12 13 140
20
40
60
80
100
120
140Women 65+
06 07 08 09 10 11 12 13 140
20
40
60
80
100
120
140Men 65+
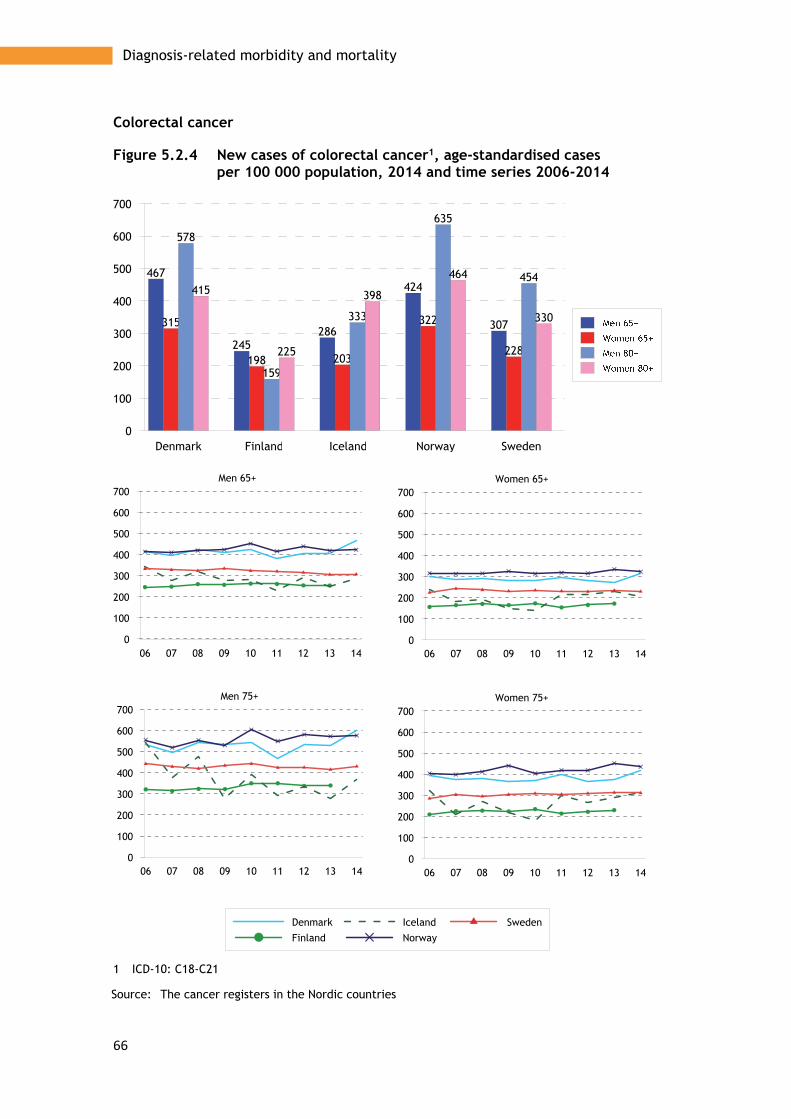
66
Diagnosis-related morbidity and mortality
Colorectal cancer
Figure 5.2.4 New cases of colorectal cancer1, age-standardised cases per 100 000 population, 2014 and time series 2006-2014
1 ICD-10: C18-C21
Source: The cancer registers in the Nordic countries
Denmark Finland Iceland Norway Sweden0
100
200
300
400
500
600
700
467
245286
424
307315
198 203
322
228
578
159
333
635
454415
225
398
464
330
06 07 08 09 10 11 12 13 140
100
200
300
400
500
600
700
Denmark
Finland
Iceland
Norway
Sweden
Men 75+
06 07 08 09 10 11 12 13 140
100
200
300
400
500
600
700Women 75+
06 07 08 09 10 11 12 13 140
100
200
300
400
500
600
700Women 65+
06 07 08 09 10 11 12 13 140
100
200
300
400
500
600
700Men 65+

67
Diagnosis-related morbidity and mortality
Cancer of the lung, bronchus and trachea
Figure 5.2.5 New cases of cancer1 of the lung, bronchus and trachea, age-standardised cases per 100 000 population, 2014 and time series 2006-2014
1 ICD-10: C33-C34
Source: The cancer registers in the Nordic countries
Denmark Finland Iceland Norway Sweden0
100
200
300
400
500
389
280
215
332
175
284
156
294
223
155
445
166
272
407
186
279
105
185204
116
06 07 08 09 10 11 12 13 140
100
200
300
400
500
600
Denmark
Finland
Iceland
Norway
Sweden
Men 75+
06 07 08 09 10 11 12 13 140
100
200
300
400
500
600Women 75+
06 07 08 09 10 11 12 13 140
100
200
300
400
500
600Women 65+
06 07 08 09 10 11 12 13 140
100
200
300
400
500
600Men 65+

68
Diagnosis-related morbidity and mortality
Breast cancer
Figure 5.2.6 New cases of breast cancer1, age-standardised cases per 100 000 population, 2014 and time series 2006-2014
1 ICD-10: C50
Source: The cancer registers in the Nordic countries
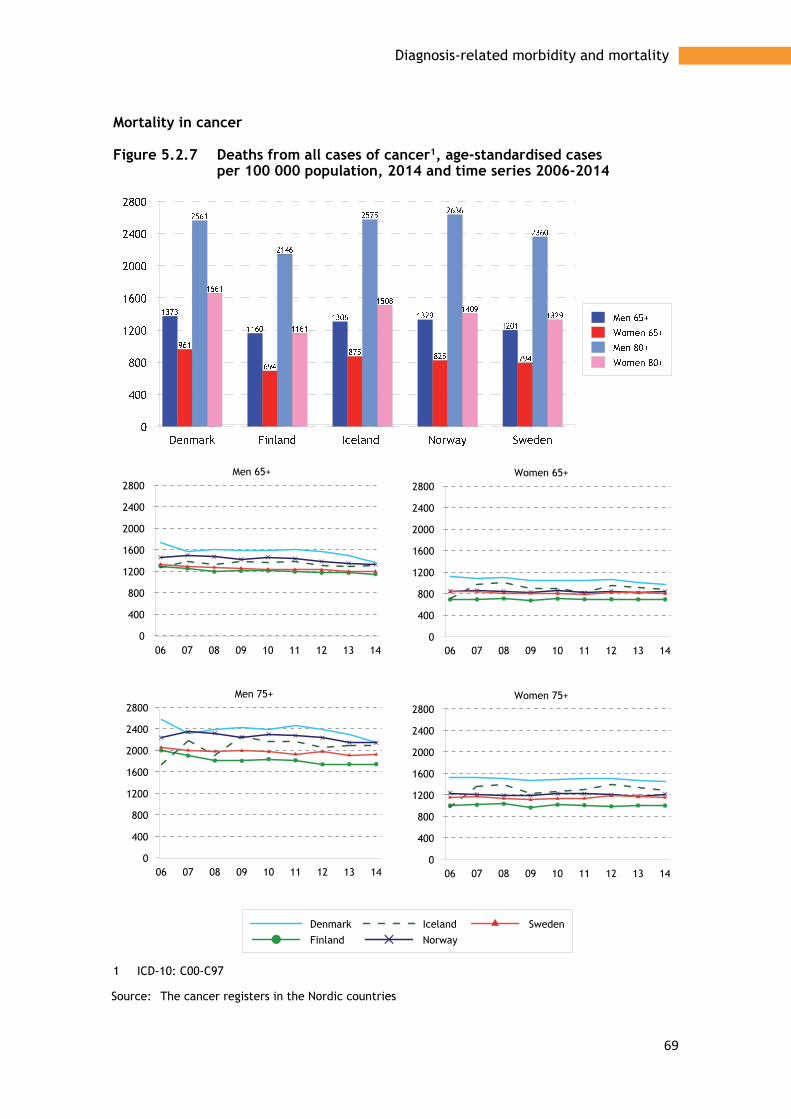
69
Diagnosis-related morbidity and mortality
Mortality in cancer
Figure 5.2.7 Deaths from all cases of cancer1, age-standardised cases per 100 000 population, 2014 and time series 2006-2014
1 ICD-10: C00-C97
Source: The cancer registers in the Nordic countries
06 07 08 09 10 11 12 13 140
400
800
1200
1600
2000
2400
2800
Denmark
Finland
Iceland
Norway
Sweden
Men 75+
06 07 08 09 10 11 12 13 140
400
800
1200
1600
2000
2400
2800Women 75+
06 07 08 09 10 11 12 13 140
400
800
1200
1600
2000
2400
2800Women 65+
06 07 08 09 10 11 12 13 140
400
800
1200
1600
2000
2400
2800Men 65+

70
Diagnosis-related morbidity and mortality
Prostate cancer
Figure 5.2.8 Deaths from prostate cancer1, age-standardised cases per 100 000 population, 2014 and time series 2006-2014
1 ICD-10: C61
Source: The cancer registers in the Nordic countries

71
Diagnosis-related morbidity and mortality
Stomach cancer
Figure 5.2.9 Deaths from stomach cancer1, age-standardised cases per 100 000 population, 2014 and time series 2006-2014
1 ICD-10: C16
Source: The cancer registers in the Nordic countries
Denmark Finland Iceland Norway Sweden0
20
40
60
80
100
35
43
3440
34
19 2124
20 19
68
79
5966
58
38 3843 43
32
06 07 08 09 10 11 12 13 140
20
40
60
80
100
120
140
Denmark
Finland
Iceland
Norway
Sweden
Men 75+
06 07 08 09 10 11 12 13 140
20
40
60
80
100
120
140Women 75+
06 07 08 09 10 11 12 13 140
20
40
60
80
100
120
140Women 65+
06 07 08 09 10 11 12 13 140
20
40
60
80
100
120
140Men 65+

72
Diagnosis-related morbidity and mortality
Colorectal cancer
Figure 5.2.10 Deaths from colorectal cancer1, age-standardised cases per 100 000 population, 2014 and time series 2006-2014
1 ICD-10: C18-C21
Source: The cancer registers in the Nordic countries
Denmark Finland Iceland Norway Sweden0
50
100
150
200
250
300
350
400
196
115
170181
143149
73
114130
101
388
214
304
368
269
321
147
370
270
199
06 07 08 09 10 11 12 13 140
50
100
150
200
250
300
350
400
Denmark
Finland
Iceland
Norway
Sweden
Men 75+
06 07 08 09 10 11 12 13 140
50
100
150
200
250
300
350
400Women 75+
06 07 08 09 10 11 12 13 140
50
100
150
200
250
300
350
400Women 65+
06 07 08 09 10 11 12 13 140
50
100
150
200
250
300
350
400Men 65+

73
Diagnosis-related morbidity and mortality
Cancer of the lung, bronchus and trachea
Figure 5.2.11 Deaths from cancer1 of the lung, bronchus and trachea, age-standardised cases per 100 000 population, 2014 and time series 2006-2014
1 ICD-10: C33-C34
Source: The cancer registers in the Nordic countries
Denmark Finland Iceland Norway Sweden0
50
100
150
200
250
300
350
400
450
500
328
243 247258
174
207
98
203
159141
458
378393
374
242244
116
227
172 163
06 07 08 09 10 11 12 13 140
100
200
300
400
500
600
Denmark
Finland
Iceland
Norway
Sweden
Men 75+
06 07 08 09 10 11 12 13 140
100
200
300
400
500
600Women 75+
06 07 08 09 10 11 12 13 140
100
200
300
400
500
600Women 65+
06 07 08 09 10 11 12 13 140
100
200
300
400
500
600Men 65+

74
Diagnosis-related morbidity and mortality
Breast cancer
Figure 5.2.12 Deaths from breast cancer1, age-standardised cases per 100 000 population, 2014 and time series 2006-2014
1 ICD-10: C50
Source: The cancer registers in the Nordic countries

75
Diagnosis-related morbidity and mortality
Cancer of the uterus and ovary
Figure 5.2.13 Deaths from cancer1 of the uterus and ovary, age-standardised cases per 100 000 population, 2014 and time series 2006-2014
ICD-10: C53-C56
Source: The cancer registers in the Nordic countries

76
Diagnosis-related morbidity and mortality
5.3 Diseases of the digestive system and the urinary system
Problems associated with eating and digestion is common among old people, but it is less common that these disorders are treated in hospital. Information from the Nordic patient registers presented in Figure 5.3.1 therefore does not reflect differences in the occurrence of the disease as much as differences in health care structure and admissions policy.
Norway and Denmark report the largest number of stomach ulcer patients. However, the number has fallen in recent years, in line with the rest of the Nordic region (Figure 5.3.1).
Consumption of drugs for stomach ulcers and reflux diseases has generally increased, and is highest in Iceland (Figure 5.3.1). Consumption increases with age, and is more common among women than men. Norway and Denmark show lowest consumption of drugs.
Inguinal hernia is a much more common cause of admission to hospital among men than women. Most people are treated in hospital in Norway and fewest in Iceland (Figure 5.3.1).
The number of patients treated for cholelithiasis disorders increases with age, and the treatment pattern does not differ significantly between the countries (Figure 5.3.1). Norway has most people under treatment, while Finland has the highest number of patients who have undergone surgery (Figure 5.3.2). In Finland, more women than men undergo surgery, unlike the rest of the Nordic region.
For renal failure, all countries except Norway show similar admission patterns. Norway reports more patients treated in hospital and, unlike other countries, the number of admissions is increasing (Figure 5.3.2). Norway also shows the highest frequency of transplants, but does not differ from the other countries in terms of mortality from diseases in the kidneys and the urinary tract (Figure 5.3.2). Generally, men are more often treated for these diseases, undergo more transplants, and have higher mortality.
Statistics – Diseases of the digestive system and the urinary system The figures show information for 2014 divided into gender and the 65+ and 80+ age groups. For the period 2006-2014, information is reported for the 65+ and 75+ age groups. The statistics show:
Patients discharged from hospital • Gastric ulcer • Inguinal hernia • Cholelithiasis • Renal failure Drugs for peptic ulcer and gastro-oesophageal reflux Surgical treatment • Cholecystectomy • Transplantation of kidney Deaths caused by kidney and ureter disorders

77
Diagnosis-related morbidity and mortality
Patients discharged from hospital
Figure 5.3.1 Patients treated for gastric ulcer, ICD-10: K25-K28, age-standardised number of patients per 100 000 population, 2014 and time series 2006-20141
1 Data from the Norwegian Patient Register also includes patients who have been treated in open
care, which means that these are not comparable with data from the other Nordic Countries
Source: The National inpatient registers
Denmark Finland Iceland Norway Sweden0
100
200
300
400
500
600
261
99120
380
208196
69 69
331
150
461
152
191
576
356359
133 128
522
265

78
Diagnosis-related morbidity and mortality
Inguinal hernia
Figure 5.3.2 Patients treated for inguinal hernia, ICD-10: K40, age-standardised number of patients per 100 000 population, 2014 and time series 2006-20141
1 Data from the Norwegian Patient Register also includes patients who have been treated in open
care, which means that these are not comparable with data from the other Nordic Countries
Source: The National inpatient registers
Denmark Finland Iceland Norway Sweden0
200
400
600
800
1000
1200
399
812
144
1075
280
47 7129
9334
551
711
207
1167
433
73 8043
12653
06 07 08 09 10 11 12 13 140
200
400
600
800
1000
1200
Denmark
Finland
Iceland
Norway
Sweden
Men 75+
06 07 08 09 10 11 12 13 140
200
400
600
800
1000
1200Women 75+
06 07 08 09 10 11 12 13 140
200
400
600
800
1000
1200Women 65+
06 07 08 09 10 11 12 13 140
200
400
600
800
1000
1200Men 65+

79
Diagnosis-related morbidity and mortality
Cholelithiasis
Figure 5.3.3 Patients treated for cholelithiasis, ICD-10: K80, age-standardised number of patients per 100 000 population, 2014 and time series 2006-20141
1 Data from the Norwegian Patient Register also includes patients who have been treated in open care, which means that these are not comparable with data from the other Nordic Countries
Source: The National inpatient registers
Denmark Finland Iceland Norway Sweden0
100
200
300
400
500
600
700
287
390 380
425
297314
349 359
468
283
441
566 559
644
460
411 421
370
528
365
06 07 08 09 10 11 12 13 140
100
200
300
400
500
600
700
800
Denmark
Finland
Iceland
Norway
Sweden
Men 75+
06 07 08 09 10 11 12 13 140
100
200
300
400
500
600
700
800Women 75+
06 07 08 09 10 11 12 13 140
100
200
300
400
500
600
700
800Women 65+
06 07 08 09 10 11 12 13 140
100
200
300
400
500
600
700
800Men 65+

80
Diagnosis-related morbidity and mortality
Renal failure
Figure 5.3.4 Patients treated for renal failure, ICD-10: N17-N19, age-standardised number of patients per 100 000 population, 2014 and time series 2006-20141
1 Data from the Norwegian Patient Register also includes patients who have been treated in open
care, which means that these are not comparable with data from the other Nordic Countries
Source: The National inpatient registers
Denmark Finland Iceland Norway Sweden0
500
1000
1500
2000
2500
3000
427
245 304
1797
389
206134
221
807
196
736
389
631
3054
694
343246
455
1240
353
06 07 08 09 10 11 12 13 140
500
1000
1500
2000
2500
3000
Denmark
Finland
Iceland
Norway
Sweden
Men 75+
06 07 08 09 10 11 12 13 140
500
1000
1500
2000
2500
3000Women 75+
06 07 08 09 10 11 12 13 140
500
1000
1500
2000
2500
3000Women 65+
06 07 08 09 10 11 12 13 140
500
1000
1500
2000
2500
3000Men 65+

81
Diagnosis-related morbidity and mortality
Prescription of drugs
Figure 5.3.5 Prescription of drugs for peptic ulcer and gastro-oesophageal reflux, ATC: A02B, age-standardised one-year prevalence per 1 000 population, 2014 and time series 2006-2014
Source: The National prescription databases

82
Diagnosis-related morbidity and mortality
Surgical treatment
Figure 5.3.6 Cholecystectom in the age of 65+, NCSP: JKA 20-21, total numbers of procedures per 100 000 in the age group, 2013
1 Åland average 2009-13
Source: NOMESCO: Health Statistics in the Nordic Countries 2015
Figure 5.3.7 Transplantation of kidney in the age of 65+, NCSP: KAS00-20, total numbers of procedures per 100 000 in the age group, 2013
1 Åland average 2009-13
Source: NOMESCO: Health Statistics in the Nordic Countries 2015
Denmark Finland Åland Norway Sweden0
50
100
150
200
250
300
160
276
175
129
180183
241
211
144
173
Denmark Finland Åland Norway Sweden0
2
4
6
8
10
12
14
16
6
8
6
14
6
3 3 3
54

83
Diagnosis-related morbidity and mortality
Deaths
Figure 5.3.8 Deaths from diseases of the kidney and ureter, ICD-10: N00-N29, age-standardised deaths per 100 000 population, 2014 and time series 2006-2014
Source: The National registers for causes of death
06 07 08 09 10 11 12 13 140
50
100
150
200
250
Denmark
Finland
Iceland
Norway
Sweden
Men 75+
06 07 08 09 10 11 12 13 140
50
100
150
200
250Women 75+
06 07 08 09 10 11 12 13 140
50
100
150
200
250Women 65+
06 07 08 09 10 11 12 13 140
50
100
150
200
250Men 65+

84
Diagnosis-related morbidity and mortality
5.4 Endocrine diseases
Diabetes is a chronic disease that increases the risk of developing other diseases, known as diabetes complications. For example, diabetes patients are at higher risk of contracting and dying from cardiovascular diseases such as myocardial infarction, angina, ischaemic stroke, high blood pressure, and narrowing of arteries in the legs. Similarly, there is greater risk of eye diseases, such as retinopathy, i.e. vascular damage in the retina.
Hospitalisation of diabetes patients can be avoided if factors such as blood sugar, blood pressure, living habits, and eye ground are monitored in primary care or outpatient specialist care. (See text on avoidable hospitalisation in the section on quality indicators.) Because there is no register information from primary care in most Nordic countries, diabetes sickness among old people is described in this report using pharmaceutical data, i.e. the diabetes population treated with drugs.
Iceland has the highest rate of prescription of diabetes drugs (Figure 5.4.1). In Iceland, prescription is higher to women, but it is higher in men in the rest of the Nordic region. Prescription has increased throughout the Nordic region, with the highest increase being in Iceland and Finland (Figure 5.4.1).
The thyroid gland produces hormones that steer metabolism and affect many of the body’s functions. Insufficient production of the thyroid gland hormone leads to hypothyroidism and low metabolism, which can also cause weight increase.
Hypothyroidism is treated with thyroid hormones. Treatment with thyroid hormones is considerably more common among women, and increases with age. The prescription pattern corresponds reasonably well in the Nordic countries, except Denmark (both men and women), where consumption is lower than people in other countries (Figure 5.4.2).
Prescription is increasing in all Nordic countries, particularly among women. Prescription has increased fastest in Finland (Figure 5.4.2).
Thyroidectomy, i.e. removal of the thyroid gland, is more common among younger old people (65-74) and is more common among women than men (Figure 5.4.3). The reason for the removal is often hyperthyroidism, which means overproduction of the thyroid hormones, i.e. the opposite of hypothyroidism.
Statistics – Endocrine diseases The figures show information for 2014 divided into gender and the 65+ and 80+ age groups. For the period 2006-2014, information are reported for the 65+ and 75+ age groups. Data for surgical interventions apply to 2013. The statistics show:
Prescriptions • For diabetes • For disorders of the thyroid gland
Surgical interventions • Thyroidectomy

85
Diagnosis-related morbidity and mortality
Pharmaceutical treatment
Figure 5.4.1 Prescription of drugs for diabetes, age-standardised one-year prevalence per 1 000 population, 2014 and time series 2006-2014
1 ATC: A10
Source: The National prescription databases
Denmark Iceland Norway Sweden0
50
100
150
200
250
300
350
400
139
278
117
150
95
346
80102
127
326
111139
96
386
83106
06 07 08 09 10 11 12 13 140
50
100
150
200
250
300
350
400
Denmark
Finland
Iceland
Norway
Sweden
Men 75+
06 07 08 09 10 11 12 13 140
50
100
150
200
250
300
350
400Women 75+
06 07 08 09 10 11 12 13 140
50
100
150
200
250
300
350
400Women 65+
06 07 08 09 10 11 12 13 140
50
100
150
200
250
300
350
400Men 65+

86
Diagnosis-related morbidity and mortality
Figure 5.4.2 Prescription of drugs for disorders of the thyroid gland, age-standardised one-year prevalence per 1 000 population, 2014 and time series 2006-2014
1 ATC: H33AA
Source: The National prescription databases
Denmark Iceland Norway Sweden0
50
100
150
200
23
68
46 43
87
179
147155
31
99
65 64
99
181
147
178
06 07 08 09 10 11 12 13 140
50
100
150
200
Denmark
Finland
Iceland
Norway
Sweden
Men 75+
06 07 08 09 10 11 12 13 140
50
100
150
200Women 75+
06 07 08 09 10 11 12 13 140
50
100
150
200Women 65+
06 07 08 09 10 11 12 13 140
50
100
150
200Men 65+
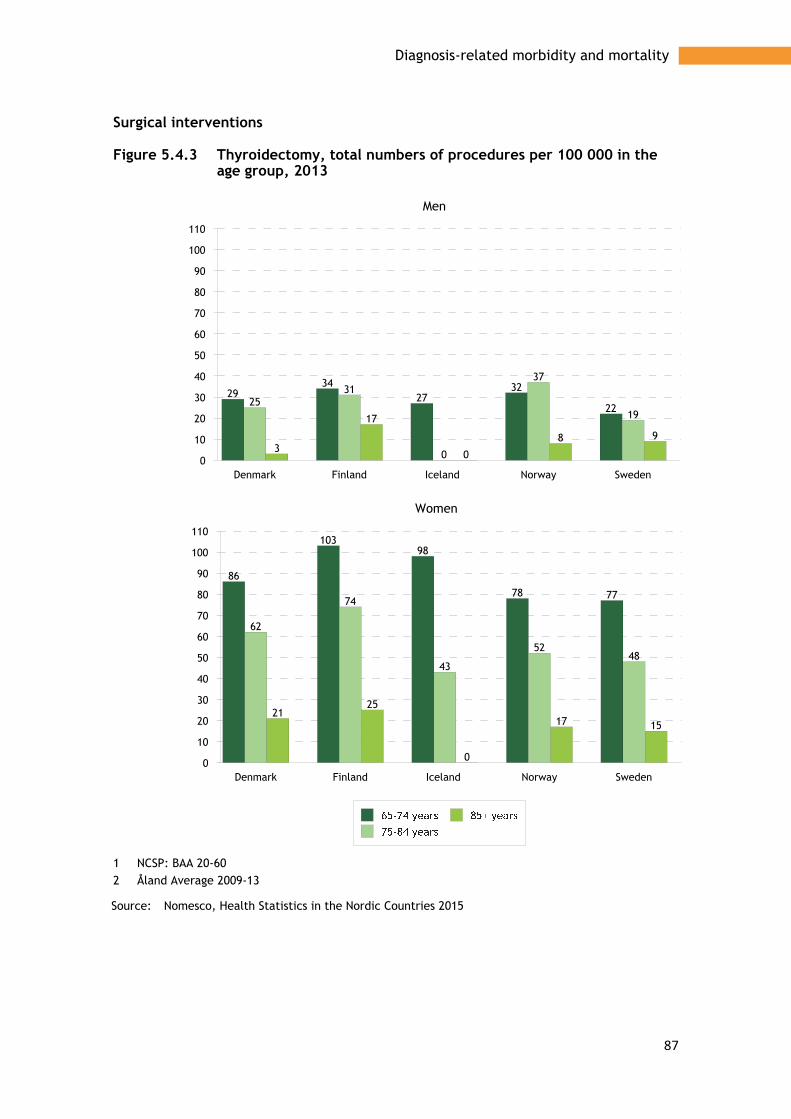
87
Diagnosis-related morbidity and mortality
Surgical interventions
Figure 5.4.3 Thyroidectomy, total numbers of procedures per 100 000 in the age group, 2013
1 NCSP: BAA 20-60 2 Åland Average 2009-13
Source: Nomesco, Health Statistics in the Nordic Countries 2015
Denmark Finland Iceland Norway Sweden0
10
20
30
40
50
60
70
80
90
100
110
2934
2732
2225
31
0
37
19
3
17
0
8 9
Men
Denmark Finland Iceland Norway Sweden0
10
20
30
40
50
60
70
80
90
100
110
86
10398
78 77
62
74
43
5248
2125
0
17 15
Women

88
Diagnosis-related morbidity and mortality
5.5 COPD and asthma
Asthma and chronic obstructive pulmonary disease (COPD) are common disorders, causing much suffering and high socioeconomic costs. Both are chronic diseases in the lower respiratory tract, and are regarded as obstructive lung diseases because they reduce air flow in the airways. While asthma is common in both children and adults, COPD mainly affects older people. COPD causes considerably more deaths than asthma.
COPD is characterised by a gradually worsening lung function. The disorder often starts with chronic bronchitis and, over time, emphysema also develops. Comorbidity is common among COPD patients, who also often suffer from, for example, depression, cardiovascular disease, metabolic syndrome, diabetes, and osteoporosis. Comorbidity further reduces quality of life, and increases mortality.
COPD is an underdiagnosed disease. In Sweden, it is estimated that half a million people suffer from COPD, of which 400 000 or 80 per cent are thought to have the disorder without knowing it. Under diagnosis is more common among young people. This is because the diagnosis is not made until the disease has advanced to a moderate or severe stage.
By far the most dominant cause of COPD is tobacco smoking, and today’s prevalence can be assumed to reflect smoking habits in the previous 30-50 years. Among smokers who have attained a high age, nearly half have developed COPD. With severe COPD, drugs only provide limited relief, while stopping smoking extends survival. For a long time, a greater proportion of men than women have contracted and died from COPD in the Nordic region. However, as smoking habits have changed, the pattern has also changed in recent years. This applies primarily to younger old people in Iceland and Sweden.
Asthma is a chronic inflammatory disease in the airways that lead to periods of reduced air flow and respiratory distress. Severe asthma can develop into COPD. Drugs enable most people to lead an almost normal life, and hospitalisation and mortality in asthma is now unusual.
Hospitalised patients Data from hospital care is not a good measure of the prevalence of COPD. As shown by data presented on avoidable hospital care in the section on quality indicators, the general ambition is to treat these patients in primary or outpatient care. Norway reports the highest proportion of old people treated in hospitals for COPD and other chronic pneumonia diseases in the lower airways, and Finland the lowest (Figure 5.5.1). The differences between the countries reflect differences in health care structure rather than in disease prevalence.
Prescription of drugs Even if the differences are not great, most medicines for COPD and asthma and other obstructive pulmonary diseases are prescribed to women aged 65 and older, particularly in Iceland (Figures 5.5.2 and 5.5.3). The oldest group of men, aged 80+, has high levels of prescription in, for example, Denmark and Norway. Regardless of the type of medicine and age group, prescription has increased noticeably in all Nordic countries (Figures 5.6.2 and 5.6.3) .

89
Diagnosis-related morbidity and mortality
Mortality Mortality in asthma and other chronic diseases in the lower airways has been reasonably stable in the past decade, with mostly small movements downwards, but also some small movements upwards in, for example, women aged 75 and older in Sweden and Norway. Denmark has the highest mortality (Figures 5.6.4).
Statistics – Chronic obstructive pulmonary disease and asthma The figures show information for 2014 divided into gender and the 65+ and 80+ age groups. For the period 2006-2014, information is reported for the 65+ and 75+ age groups. The statistics show:
Patients discharged after hospital treatment for COPD Prescriptions
• Adrenergic inhalants • Other drugs for chronic obstructive pulmonary disease
Mortality from chronic obstructive pulmonary disease and asthma

90
Diagnosis-related morbidity and mortality
Patients in hospitals, Chronic obstructive pulmonary disease
Figure 5.5.1 Patients treated in somatic hospitals for chronic lower respiratory diseases1 excl. asthma, age-standardised number of patients per 100 000 population, 2014 and time series 2006-20142
1 ICD10: J40-J44, J47 2 Data from the Norwegian Patient Register also includes patients who have been treated in open
care, which means that these are not comparable with data from the other Nordic Countries
Source: The National inpatient registers
Denmark Finland Iceland Norway Sweden0
500
1000
1500
2000
2500
3000
894
435558
2285
500
867
191
809
1906
541
1605
591
1058
2506
923
1260
207
1024
1498
740
06 07 08 09 10 11 12 13 140
500
1000
1500
2000
2500
3000
Denmark
Finland
Iceland
Norway
Sweden
Men 75+
06 07 08 09 10 11 12 13 140
500
1000
1500
2000
2500
3000Women 75+
06 07 08 09 10 11 12 13 140
500
1000
1500
2000
2500
3000Women 65+
06 07 08 09 10 11 12 13 140
500
1000
1500
2000
2500
3000Men 65+

91
Diagnosis-related morbidity and mortality
Prescription of medications, adrenergic inhalants
Figure 5.5.2 Prescription of adrenergic inhalants, age-standardised one-year prevalence per 1 000 population, 2014 and time series 2006-2014
1 ATC: R03A
Source: The National prescription databases
Denmark Iceland Norway Sweden0
50
100
150
200
112 114 115
87
121
163
130
115
146
112122
100
123 128
103 104
06 07 08 09 10 11 12 13 140
50
100
150
200
Denmark
Finland
Iceland
Norway
Sweden
Men 75+
06 07 08 09 10 11 12 13 140
50
100
150
200Women 75+
06 07 08 09 10 11 12 13 140
50
100
150
200Women 65+
06 07 08 09 10 11 12 13 140
50
100
150
200Men 65+

92
Diagnosis-related morbidity and mortality
Other drugs for chronic obstructive pulmonary disease (and asthma)
Figure 5.5.3 Prescription of other drugs for chronic lower respiratory diseases, age-standardised one-year prevalence per 1 000 population, 2014 and time series 2006-2014
1 ATC: R03B
Source: The National prescription databases
06 07 08 09 10 11 12 13 140
102030405060708090
100
Denmark
Finland
Iceland
Norway
Sweden
Men 75+
06 07 08 09 10 11 12 13 140
102030405060708090
100Women 75+
06 07 08 09 10 11 12 13 140
102030405060708090
100Women 65+
06 07 08 09 10 11 12 13 140
102030405060708090
100Men 65+

93
Diagnosis-related morbidity and mortality
Deaths
Figure 5.5.4 Deaths from chronic lower respiratory diseases, age-standardised deaths per 100 000 population, 2014 and time series 2006-2014
1 ICD-10: J40-J47
Source: The National registers for causes of death
Denmark Iceland Norway Sweden0
100
200
300
400
500
600
700
800
316
176137
281259
61
181 193
740
371322
646
474
121
441396
06 07 08 09 10 11 12 13 140
100
200
300
400
500
600
700
800
Denmark
Finland
Iceland
Norway
Sweden
Men 75+
06 07 08 09 10 11 12 13 140
100
200
300
400
500
600
700
800Women 75+
06 07 08 09 10 11 12 13 140
100
200
300
400
500
600
700
800Women 65+
06 07 08 09 10 11 12 13 140
100
200
300
400
500
600
700
800Men 65+

94
Diagnosis-related morbidity and mortality
5.6 Pneumonia
Pneumonia is a common cause of hospitalisation (Figure 5.6.1) of older people in all the Nordic countries. Iceland reports the lowest proportion of hospitalised patients, and Denmark the highest. Frail older people are hit considerably harder by pneumonia than younger people, and a fatal course is not uncommon. Among the oldest, those over 85, pneumonia is therefore a common cause of death. However, the differences between the Nordic countries and differences over time reflect differences/similarities in coding practice in the cause of death registers.
Both admission patterns and mortality patterns (Figure 5.6.1) are largely the same throughout the Nordic region. Pneumonia is considerably more common among the older group of elderly than the younger group. Men are affected more often than women, and it is among the oldest men that difference is greatest between the Nordic countries.
While the number of patients per 100 000 old people has remained relatively constant (Figure 5.6.1), mortality has fallen in the past ten-year period (Figure 5.6.1). Finland shows considerably lower mortality in pneumonia than other Nordic countries.
Statistics – Pneumonia The figures show information for 2014 divided into gender and the 65+ and 80+ age groups. For the period 2006-2014, information is reported for the 65+ and 75+ age groups. The statistics show:
Patients discharged from hospital after treatment for pneumonia Deaths caused by pneumonia
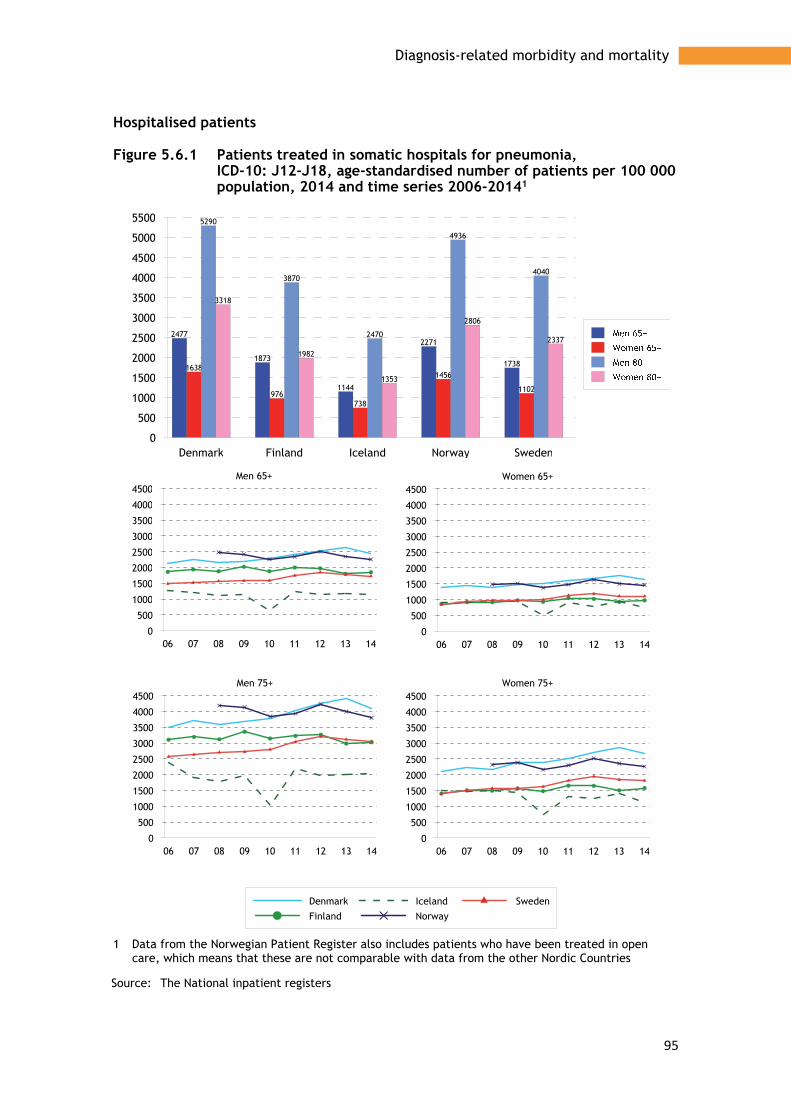
95
Diagnosis-related morbidity and mortality
Hospitalised patients
Figure 5.6.1 Patients treated in somatic hospitals for pneumonia, ICD-10: J12-J18, age-standardised number of patients per 100 000 population, 2014 and time series 2006-20141
1 Data from the Norwegian Patient Register also includes patients who have been treated in open care, which means that these are not comparable with data from the other Nordic Countries
Source: The National inpatient registers
Denmark Finland Iceland Norway Sweden0
500
1000
1500
2000
2500
3000
3500
4000
4500
5000
5500
2477
1873
1144
2271
17381638
976738
1456
1102
5290
3870
2470
4936
4040
3318
1982
1353
2806
2337
06 07 08 09 10 11 12 13 140
500
1000
1500
2000
2500
3000
3500
4000
4500
Denmark
Finland
Iceland
Norway
Sweden
Men 75+
06 07 08 09 10 11 12 13 140
500
1000
1500
2000
2500
3000
3500
4000
4500Women 75+
06 07 08 09 10 11 12 13 140
500
1000
1500
2000
2500
3000
3500
4000
4500Women 65+
06 07 08 09 10 11 12 13 140
500
1000
1500
2000
2500
3000
3500
4000
4500Men 65+

96
Diagnosis-related morbidity and mortality
Deaths
Figure 5.6.2 Deaths from pneumonia, ICD-10: J12-J18, age-standardised deaths per 100 000 population, 2014 and time series 2006-2014
Source: The National registers for cause of death
06 07 08 09 10 11 12 13 140
100
200
300
400
500
600
700
Denmark
Finland
Iceland
Norway
Sweden
Men 75+
06 07 08 09 10 11 12 13 140
100
200
300
400
500
600
700Women 75+
06 07 08 09 10 11 12 13 140
100
200
300
400
500
600
700Women 65+
06 07 08 09 10 11 12 13 140
100
200
300
400
500
600
700Men 65+

97
Diagnosis-related morbidity and mortality
5.7 Dementia and Alzheimer’s disease
Dementia is caused by damage in the brain, and gives a number of different symptoms depending on which parts of the brain are affected. Usually, memory deteriorates, and the ability to plan and carry out everyday activities diminishes. Language, perception of time, and orientation ability are other cognitive abilities that can be affected. The pattern of disease also includes worry, depression, and behavioural changes. The symptoms often result in people with dementia, over time, finding it hard to cope with their everyday lives.
Alzheimer’s disease is the most common form of dementia, and accounts for approximately 60-70 per cent of all cases. The next most common dementia disease is vascular dementia, which accounts for approximately 20 per cent. Other related disorders are frontal lobe dementia, dementia in Parkinson’s disease, and alcohol dementia.
The preventive strategies for dementia include preventing cardiovascular diseases, by reducing the risk of diabetes, high blood pressure, overweight, smoking and alcohol mis use. Genetic factors are also important in Alzheimer’s disease. The lifetime risk is estimated to be doubled if a parent or sibling has had the disease (Swedish Gene Technology Advisory Board, Åldrandets genetik, 2006).
Dementia is not part of natural ageing, even though the number of people with dementia diseases increases with age. There are no indications that the risk of contracting dementia diseases has increased in recent years. However, the number of people with dementia has probably increased in line with the ageing population, which presents a future challenge for the Nordic welfare systems, not so much for health care, but for the municipal care services.
It is hard to get an exact impression of the number of people with dementia diseases. The number has previously been estimated by assuming that the proportion of dementia patients comprises a growing percentage in different age intervals in the older population. However, according to an article published in the journal Lancet Neurology, dementia is falling in percentage terms among people over 80. The study is based on five epidemiological studies carried out in Sweden, the Netherlands, UK and Spain. The reason for the reduction is assumed to be higher levels of education and better living conditions, but also prevention and treatment of cardiovascular diseases has become better, which reduces the risk of dementia (World Alzheimers Report 2015. The Global Impact of Dementia. London; 2015).
Hospitalised patients Figures 5.7.1show that Norway and Iceland have most dementia patients treated in hospital, while Sweden and Denmark have the lowest proportions. However, the differences reflect differences in care policy and health care structure rather than differences in occurrence of dementia.
Prescription of drugs When a person is diagnosed with dementia, treatment often starts with a dementia drug, but there is no scientific support for treating all forms of dementia with drugs. However, for Alzheimer’s disease, there is support for drug therapy. Alzheimer’s disease cannot be cured, but dementia drugs can help to, for a period, maintain cognitive functional abilities and thereby improve quality of life.

98
Diagnosis-related morbidity and mortality
There are two types of drug used to treat Alzheimer’s disease, cholinesterase inhibitors and memantine. The latter is classified as the only named drug in what Figure 5.7.3 are shown as ‘other anti-dementia drugs’. Cholinesterase inhibitors are mainly used for treating mild or moderate Alzheimer’s disease, while memantine is used for moderate to severe Alzheimer’s disease.
As Figure 5.7.2 show, prescription of cholinesterase inhibitors has remained relatively constant in the Nordic region since 2006, except for Finland where prescriptions have increased, primarily in the oldest age group (75+). However, prescription of other anti-dementia drugs, e.g. memantine, has increased in all countries. Here too, prescription is highest in Finland.
Mortality The number of deaths where a dementia diagnosis is given as the cause of death has increased slightly in all Nordic countries, with the highest figures in Finland (Figure 5.7.3). Part of the increase can probably be ascribed to the greater attention in recent decades to dementia, and thereby an increased tendency to give dementia as the underlying cause of death.
Statistics – Dementia diseases The figures show information for 2014 divided into gender and the 65+ and 80+ age groups. For the period 2006-2014, information is reported for the 65+ and 75+ age groups. The statistics show:
• Patients discharged from hospital • Prescription of medicines
• Anticholinesterases • Other anti-dementia drugs
• Deaths
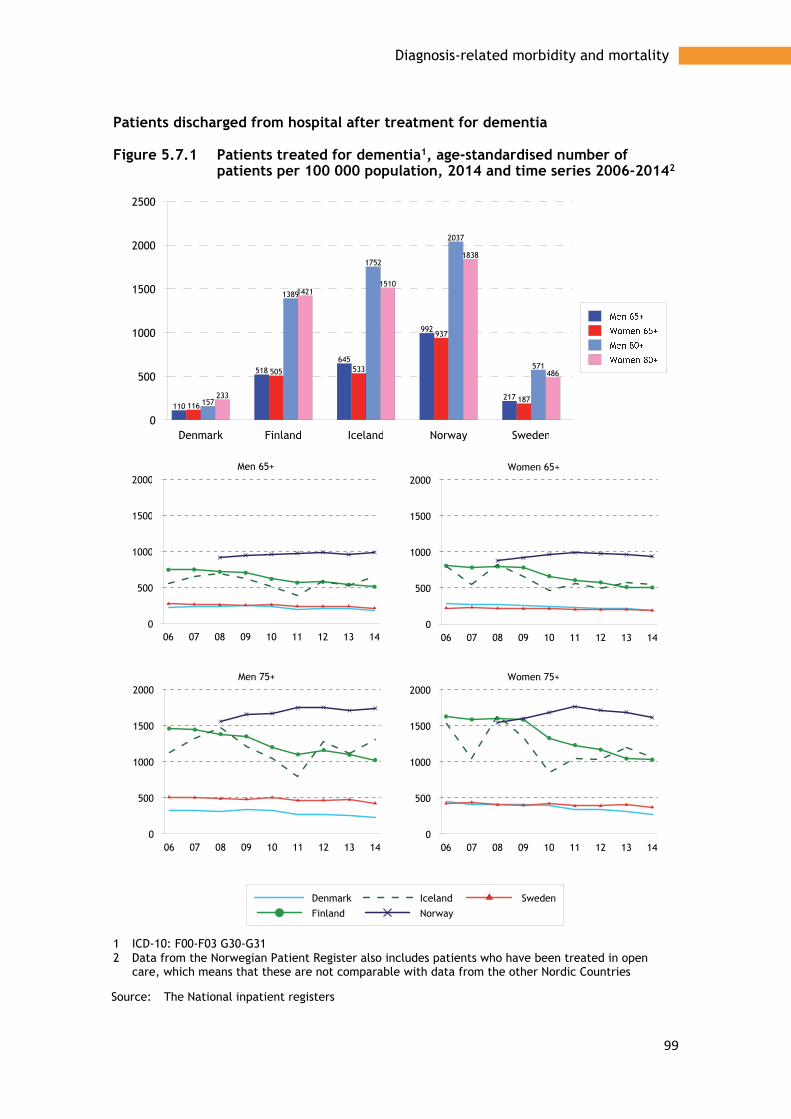
99
Diagnosis-related morbidity and mortality
Patients discharged from hospital after treatment for dementia
Figure 5.7.1 Patients treated for dementia1, age-standardised number of patients per 100 000 population, 2014 and time series 2006-20142
1 ICD-10: F00-F03 G30-G31 2 Data from the Norwegian Patient Register also includes patients who have been treated in open
care, which means that these are not comparable with data from the other Nordic Countries
Source: The National inpatient registers
Denmark Finland Iceland Norway Sweden0
500
1000
1500
2000
2500
110
518645
992
217116
505 533
937
187157
1389
1752
2037
571
233
14211510
1838
486
06 07 08 09 10 11 12 13 140
500
1000
1500
2000
Denmark
Finland
Iceland
Norway
Sweden
Men 75+
06 07 08 09 10 11 12 13 140
500
1000
1500
2000Women 75+
06 07 08 09 10 11 12 13 140
500
1000
1500
2000Women 65+
06 07 08 09 10 11 12 13 140
500
1000
1500
2000Men 65+

100
Diagnosis-related morbidity and mortality
Prescription of anti-dementia drugs
Figure 5.7.2 Prescription of anticholinesterases, age-standardised one-year prevalence per 1 000 population, 2014 and time series 2006-2014
1 ATC: N06DA
Source: The National prescription databases
Denmark Iceland Norway Sweden0
10
20
30
40
50
1518
13
171719
15
20
3538
29
4042
3634
45
06 07 08 09 10 11 12 13 140
20
40
60
80
100
120
Denmark
Finland
Iceland
Norway
Sweden
Men 75+
06 07 08 09 10 11 12 13 140
20
40
60
80
100
120Women 75+
06 07 08 09 10 11 12 13 140
20
40
60
80
100
120Women 65+
06 07 08 09 10 11 12 13 140
20
40
60
80
100
120Men 65+

101
Diagnosis-related morbidity and mortality
Figure 5.7.3 Prescription of other anti-dementia drugs1, 2, age-standardised one-year prevalence per 1 000 population, 2014 and time series 2006-2014
1 ATC: N06DX 2 Other drugs mainly comprise Memantine
Source: The National prescription databases
Denmark Iceland Norway Sweden0
10
20
30
40
8
15
4
109
17
4
10
21
36
9
2324
39
9
24
06 07 08 09 10 11 12 13 140
10
20
30
40
50
60
70
80
Denmark
Finland
Iceland
Norway
Sweden
Men 75+
06 07 08 09 10 11 12 13 140
10
20
30
40
50
60
70
80Women 75+
06 07 08 09 10 11 12 13 140
10
20
30
40
50
60
70
80Women 65+
06 07 08 09 10 11 12 13 140
10
20
30
40
50
60
70
80Men 65+

102
Diagnosis-related morbidity and mortality
Deaths caused by dementia
Figure 5.7.4 Deaths from dementia1, age-standardised deaths per 100 000 population, 2014 and time series 2006-2014
1 ICD-10: F00-F03 G30-G31
Source: The National registers for cause of death
Denmark Finland Iceland Norway Sweden0
500
1000
1500
2000
2500
3000
205
738
482
301 357273
805
452374
440
667
2425
1537
976
1165
913
2760
1411
1246
1490
06 07 08 09 10 11 12 13 140
500
1000
1500
2000
Denmark
Finland
Iceland
Norway
Sweden
Men 75+
06 07 08 09 10 11 12 13 140
500
1000
1500
2000Women 75+
06 07 08 09 10 11 12 13 140
500
1000
1500
2000Women 65+
06 07 08 09 10 11 12 13 140
500
1000
1500
2000Men 65+

103
Diagnosis-related morbidity and mortality
5.8 Mental illness
Anxiety, worry, angst, and insomnia are common among old people, but this does not mean that mental illness is a natural part of ageing. However, loss of social identity after retirement, loss of bodily abilities and greater illness are examples of factors that can affect the mental balance and a sense of wellbeing.
Mental ill-health is often measured through questionnaires and interview surveys. In the 2014 living conditions survey (ULF/SILC) in Sweden, 12 per cent of men and nearly 26 per cent of women aged 75-84 reported that they experienced problems of anxiety, worry and angst. In addition, over one per cent of the men and nearly six per cent of the women reported that they had severe problems. Approximately 30 per cent of the men in this age group and more than 40 per cent of the women reporting sleeping difficulties, ranging from mild to severe.
Depression is the most common cause of mental ill-health among old people. Angst diseases are also common. Old people with this type of mental ill-health have, more than other old people, comordity with severe somatic illnesses, such as heart diseases and chronic respiratory diseases. There is also a complex relationship between dementia and depression.
Figure 5.8.1 show the number of old people per thousand in the population who were admitted and treated at psychiatric clinics in 2013. In most age groups, more women were treated than men, more in young ages (65-79) than in older (80+). In total, most men were treated in Norway and Sweden. Iceland reported the lowest number of people treated.
Pharmaceutical treatment Data on hospitalised patients gives an incomplete and less comparable picture of mental ill-health and psychiatric disorders among old people. This is partly because psychiatric care is largely run in outpatient care forms and is organised in so many different ways. In this section, prescription of psycho-tropics is used as an indicator of mental illness and disorders, and provide more information.
The pattern is the same for all four pharmaceutical groups presented below. Prescription increases with patient age, and more prescriptions are issued for women than for men.
In 2014, prescription of antipsychotics was highest in Norway and lowest in Iceland. Prescription has decreased in Denmark, Norway, and Sweden, and increased in Finland and Iceland. The pattern is the same for all age groups (Figure 5.8.2).
Prescription of anxiolytics was highest in Iceland and lowest in Denmark, with a slight decrease in all countries except Iceland (Figure 5.8.3).
Prescription of hypnotics and sedatives was also highest in Iceland and lowest in Denmark, with a general decline in all countries (Figure 5.8.4).
Prescription of antidepressants was highest in Iceland and lowest in Norway. The prescription pattern has not changed significantly, except in Iceland where prescriptions have increased, particularly in the oldest age group (Figure 5.8.5).
Prescriptions to old people have attracted increasing attention in recent years. The question has been raised as to whether old people are being prescribed unreasonably many drugs and in excessively high doses. The risk of overmedication is particularly great in treatment with psychotropics, because depression and anxiety states among old people are so common and difficult to diagnose, and expertise in

104
Diagnosis-related morbidity and mortality
geriatric psychiatry is limited. Prescription of drugs to old people is considered in a special section of this report, ‘Pharmaceutical treatment of old people’, and in the section on quality indicators (prescription of long-acting benzodiazepines and long-term prescription of benzodiazepines).
Suicide attempts and suicide among old people
In many cases, depression is a significant risk factor for suicide attempts. Depression among old people is not uncommon and, like for young people, often has multifactorial causes. One problem among old people is that depression is more often not diagnosed and treated, unlike among young people.
Figures 5.8.6 and 5.8.7 show the number of old people treated for intentional self-harm and for events of undetermined intent, i.e. often called suicide attempts. Intentional self-harm includes purposely self-inflicted poisoning or injury as well as suicide attempts. Events of undetermined intent include events where available information is insufficient to make a distinction between accident, self-harm and assault. Sweden and Finland report clearly most treatment for suicide attempt, which not only reflects differences in occurrence but also differences in diagnostics and classification.
The pattern is different for completed suicide (Figure 5.8.8). Iceland and Denmark report most cases, Sweden least. A common pattern is that more twice as many men than women take their lives, and more older elderly men than younger elderly. It is virtually only Sweden and Finland that report deaths with undetermined intent, and Sweden’s relatively low number of completed suicides should probably be seen in relation to the number of cases reported with unclear intent (Figures 5.8.9).
Statistics – Mental illness The figures show information for 2013 and 2014, divided into gender and the 65+ and 80+ age groups. For the period 2006-2014, information is reported for the 65+ and 75+ age groups. The statistics show:
Hospitalised patients at psychiatric clinics
Pharmaceutical treatment • Antipsychotics • Anxiolytics • Hypnotics and sedatives • Antidepressants Suicide and suicide attempt • Hospitalised patients, intentional self-harm • Hospitalised patients, undetermined intent • Deaths, intentional self-harm • Deaths, undetermined intent

105
Diagnosis-related morbidity and mortality
Treated at psychiatric clinics in hospitals
Figure 5.8.1 Inpatient treatments at psychiatric wards, treated patients per 1 000 population, 20131
1 Data from the Norwegian Patient Register also includes patients who have been treated in open care, which means that these are not comparable with data from the other Nordic Countries
Source: The National Inpatient registers

106
Diagnosis-related morbidity and mortality
Pharmaceutical treatment
Figure 5.8.2 Prescription of antipsychotics1, age-standardised one-year prevalence per 1 000 population, 2014 and time series 2006-2014
1 ATC: N05A
Source: The National prescription databases
Denmark Iceland Norway Sweden0
10
20
30
40
50
60
70
80
90
100
30
58
2723
41
73
40
30
47
89
3238
58
92
4450
06 07 08 09 10 11 12 13 140
102030405060708090
100
Denmark
Finland
Iceland
Norway
Sweden
Men 75+
06 07 08 09 10 11 12 13 140
102030405060708090
100Women 75+
06 07 08 09 10 11 12 13 140
102030405060708090
100Women 65+
06 07 08 09 10 11 12 13 140
102030405060708090
100Men 65+

107
Diagnosis-related morbidity and mortality
Figure 5.8.3 Prescription of anxiolytics, age-standardised one-year prevalence per 1 000 population, 2014 and time series 2006-2014
1 ATC: N05B
Source: The National prescription databases
Denmark Iceland Norway Sweden0
50
100
150
200
250
48
130
84 8889
222
159141
66
160
107
142
112
243
186
212
06 07 08 09 10 11 12 13 140
50
100
150
200
250
300
Denmark
Finland
Iceland
Norway
Sweden
Men 75+
06 07 08 09 10 11 12 13 140
50
100
150
200
250
300Women 75+
06 07 08 09 10 11 12 13 140
50
100
150
200
250
300Women 65+
06 07 08 09 10 11 12 13 140
50
100
150
200
250
300Men 65+

108
Diagnosis-related morbidity and mortality
Figure 5.8.4 Prescription of hypnotics and sedatives, age-standardised one-year prevalence per 1 000 population, 2014 and time series 2006-2014
1 ATC: N05C
Source: The National prescription databases
Denmark Iceland Norway Sweden0
50
100
150
200
250
300
350
400
450
500
90
268
158 158142
399
276248
131
381
233 248
184
485
346 339
06 07 08 09 10 11 12 13 140
100
200
300
400
500
600
Denmark
Finland
Iceland
Norway
Sweden
Men 75+
06 07 08 09 10 11 12 13 140
100
200
300
400
500
600Women 75+
06 07 08 09 10 11 12 13 140
100
200
300
400
500
600Women 65+
06 07 08 09 10 11 12 13 140
100
200
300
400
500
600Men 65+

109
Diagnosis-related morbidity and mortality
Figure 5.8.5 Prescription of antidepressants, age-standardised one-year prevalence per 1 000 population, 2014 and time series 2006-2014
1 ATC: N05C
Source: The National prescription databases
Denmark Iceland Norway Sweden0
50
100
150
200
250
300
350
400
109
180
74
111
168
284
141
186161
253
92
168
240
345
157
261
06 07 08 09 10 11 12 13 140
100
200
300
400
Denmark
Finland
Iceland
Norway
Sweden
Men 75+
06 07 08 09 10 11 12 13 140
100
200
300
400Women 75+
06 07 08 09 10 11 12 13 140
100
200
300
400Women 65+
06 07 08 09 10 11 12 13 140
100
200
300
400Men 65+

110
Diagnosis-related morbidity and mortality
Figure 5.8.6 Patients treated for intentional self-harm1, age-standardised number of patients per 100 000 population, 2014 and time series 2006-20142
1 ICD-10: X60-X84 2 Data from the Norwegian Patient Register also includes patients who have been treated in open
care, which means that these are not comparable with data from the other Nordic Countries
Source: The National inpatient registers
Denmark Finland Iceland Norway Sweden0
10
20
30
40
50
60
3
28
0 0
37
2
26
0 0
40
3
23
0 1
59
2
19
0 1
39
06 07 08 09 10 11 12 13 140
10
20
30
40
50
60
Denmark
Finland
Iceland
Norway
Sweden
Men 75+
06 07 08 09 10 11 12 13 140
10
20
30
40
50
60Women 75+
06 07 08 09 10 11 12 13 140
10
20
30
40
50
60Women 65+
06 07 08 09 10 11 12 13 140
10
20
30
40
50
60Men 65+

111
Diagnosis-related morbidity and mortality
Figure 5.8.7 Patients treated for event of undetermined intent1, age-standardised number of patients per 100 000 population, 2014 and time series 2006-20142
1 ICD-10: Y10-Y34 2 Data from the Norwegian Patient Register also includes patients who have been treated in open
care, which means that these are not comparable with data from the other Nordic Countries
Source: The National inpatient registers
Denmark Finland Iceland Sweden0
2
4
6
8
10
12
14
16
18
20
22
24
26
0
9
0
15
0
4
0
12
0
17
0
25
0
3
0
19
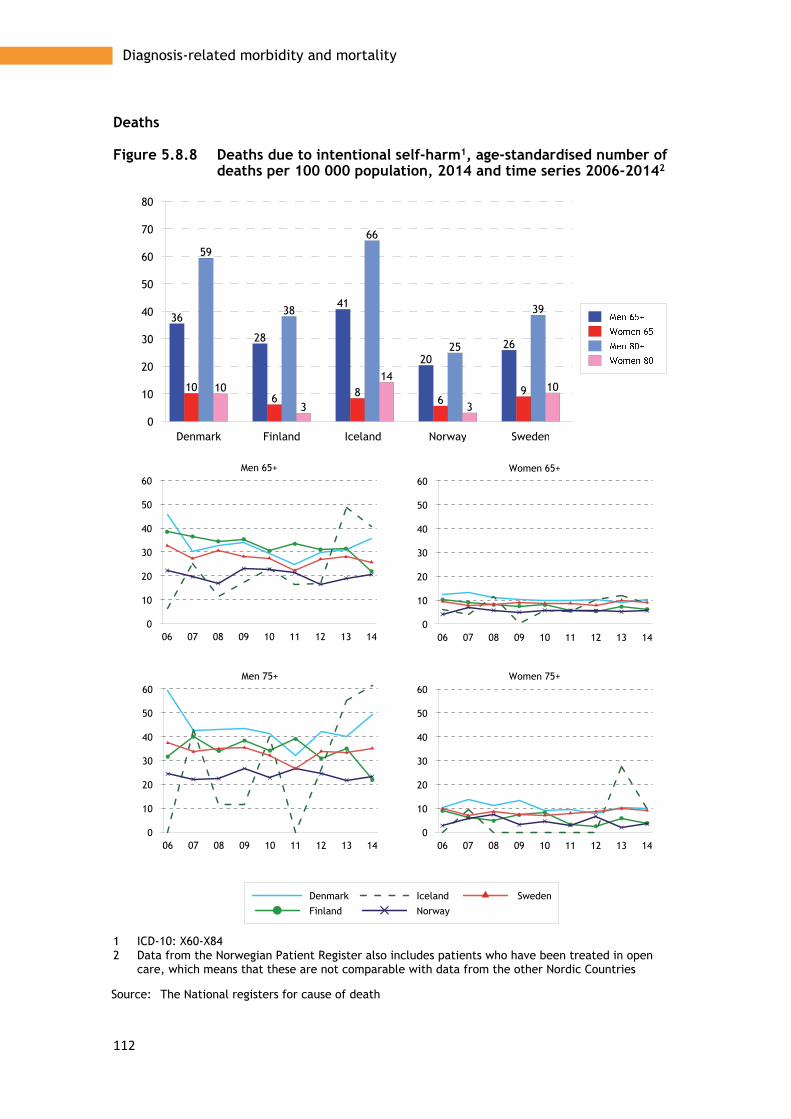
112
Diagnosis-related morbidity and mortality
Deaths
Figure 5.8.8 Deaths due to intentional self-harm1, age-standardised number of deaths per 100 000 population, 2014 and time series 2006-20142
1 ICD-10: X60-X84 2 Data from the Norwegian Patient Register also includes patients who have been treated in open
care, which means that these are not comparable with data from the other Nordic Countries
Source: The National registers for cause of death
Denmark Finland Iceland Norway Sweden0
10
20
30
40
50
60
70
80
36
28
41
2026
106 8
69
59
38
66
25
39
10
3
14
3
10
06 07 08 09 10 11 12 13 140
10
20
30
40
50
60
Denmark
Finland
Iceland
Norway
Sweden
Men 75+
06 07 08 09 10 11 12 13 140
10
20
30
40
50
60Women 75+
06 07 08 09 10 11 12 13 140
10
20
30
40
50
60Women 65+
06 07 08 09 10 11 12 13 140
10
20
30
40
50
60Men 65+
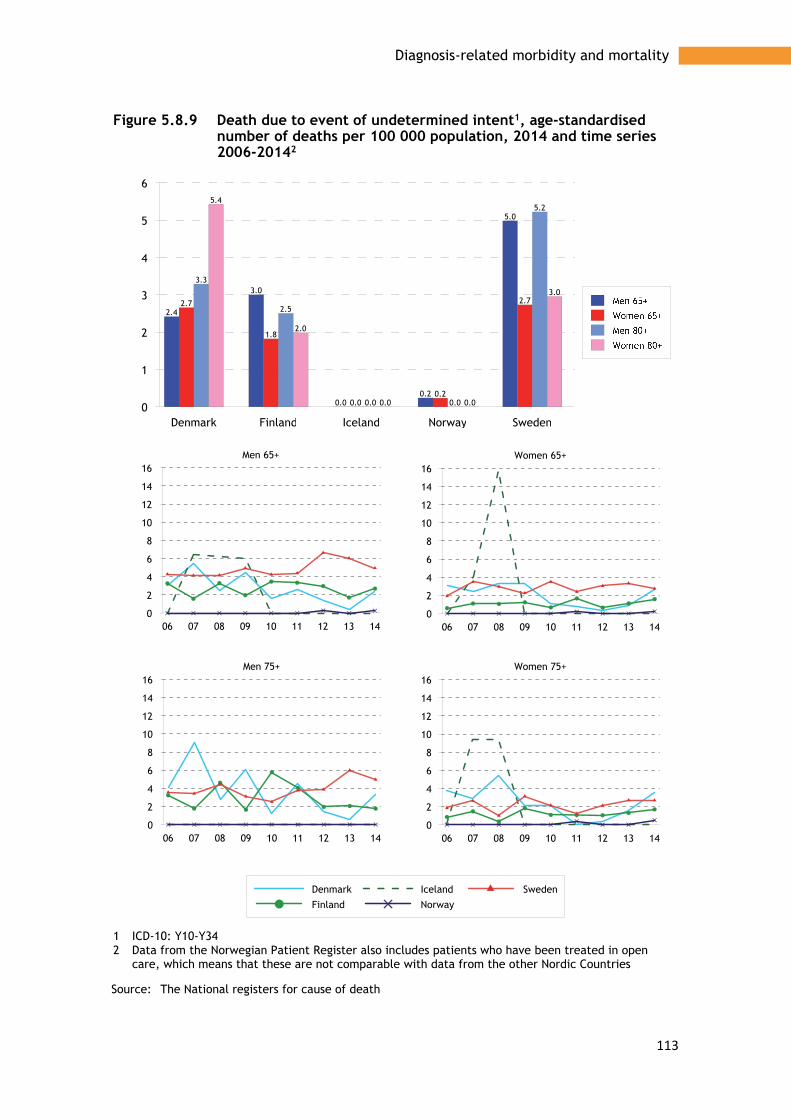
113
Diagnosis-related morbidity and mortality
Figure 5.8.9 Death due to event of undetermined intent1, age-standardised number of deaths per 100 000 population, 2014 and time series 2006-20142
1 ICD-10: Y10-Y34 2 Data from the Norwegian Patient Register also includes patients who have been treated in open
care, which means that these are not comparable with data from the other Nordic Countries
Source: The National registers for cause of death
Denmark Finland Iceland Norway Sweden0
1
2
3
4
5
6
2.4
3.0
0.00.2
5.0
2.7
1.8
0.00.2
2.7
3.3
2.5
0.0 0.0
5.25.4
2.0
0.0 0.0
3.0
06 07 08 09 10 11 12 13 140
2
4
6
8
10
12
14
16
Denmark
Finland
Iceland
Norway
Sweden
Men 75+
06 07 08 09 10 11 12 13 140
2
4
6
8
10
12
14
16Women 75+
06 07 08 09 10 11 12 13 140
2
4
6
8
10
12
14
16Women 65+
06 07 08 09 10 11 12 13 140
2
4
6
8
10
12
14
16Men 65+

114
Diagnosis-related morbidity and mortality
5.9 Muscular and skeletal diseases
Even if many old people manage on their own up to a high age, the risk of musculoskeletal diseases with subsequent disability increases markedly with age. When the OECD in ‘Health at a Glance 2015’ presents the data provided by the Nordic countries about limitations in everyday activities, as shown in Table 1, some clear differences can be seen. The overall differences between countries are relatively small, but the differences between countries are much more significant when the categories ‘limited to some extent’ and ‘greatly limited’ are considered separately. Denmark and Sweden are the countries that show the highest proportions of old people with limitations in ability to perform everyday activities.
Table 5.9.1 Limitations in ability to perform daily activities in adults aged 65 years and over, 2013
Limited to some extent Greatly limited Total
Denmark 27.7 7.7 35.4
Finland1 .. 15.0 ..
Iceland 9.3 15.3 24.6
Norway 13.2 10.1 23.4
Sweden 20.8 11.1 31.9
1 2012 data
Table 5.9.2 Great limitations in daily activities in adults aged 65 years and over, 2013
Men Women Total
Denmark 7.5 8.0 7.7
Finland1 14.6 15.3 15.0
Iceland 13.9 16.7 15.3
Norway 8.4 11.9 10.1
Sweden 9.8 12.2 11.1
1 2012 data
A slightly higher proportion of women than men report they have a high level of disability (Table 5.9.2).
In Finland in 2013, nearly 14 per cent of men and over 21 per cent of women over 65 reported that only with difficulty could they walk upstairs without help.
In the Norwegian Health Study from 2012, over 13 per cent of the 65-64 age group, and over 26 per cent of the 75-84 age group reported difficulties in walking up and down stairs or walking for 5 minutes at a reasonably fast speed.
The tables relating to gonarthrosis and coxarthrosis (Figure 5.9.2) show that hospitalisation because of these is more common among women than among men, and that it is somewhat less common in the oldest age group (75+) than in the 65+ age group. The differences between the Nordic countries are small, except that Norway reports considerably more hospital treatment than other countries. Norway has also reported an increasing number of admissions for gonarthrosis in recent

115
Diagnosis-related morbidity and mortality
years, unlike other countries which report a constant or declining trend. For coxarthrosis, there has been no change in admission frequency.
In 2013, knee replacement was generally more common for women than for men. It was also slightly more common among younger elderly (65-74 years) than in the older age group (75+). The highest number of knee replacement operations per 100 000 were carried out in Finland (Figure 5.9.3).
In 2013, the highest number of hip replacement operations per 100 000 were carried out in Norway. In all countries, the number of operations increases with age (Figure 5.9.3).
Statistics – Muscular and skeletal diseases The figures show information for 2014 divided into gender and the 65+ and 80+ age groups. For the period 2006-2014, information is reported for the 65+ and 75+ age groups. Data for surgical interventions applies to 2013. The statistics show:
Patients discharged from hospital • Gonarthrosis • Coxarthrosis
Surgical interventions • Knee replacement • Hip replacement
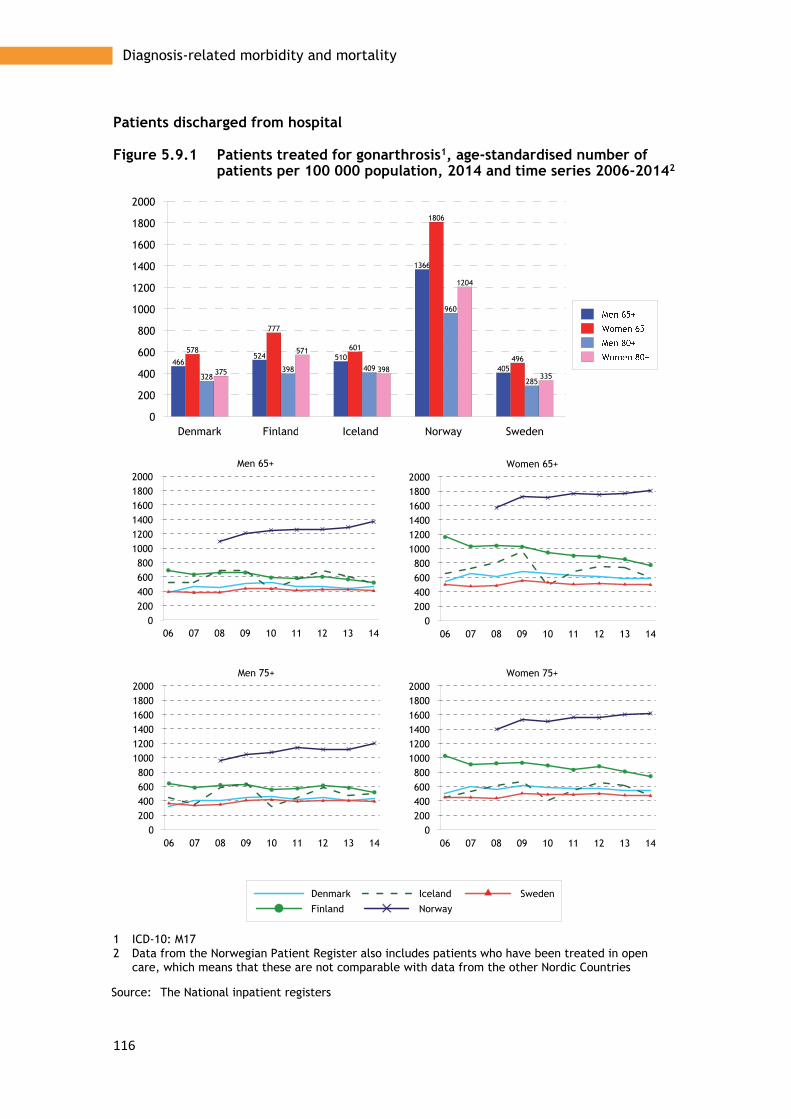
116
Diagnosis-related morbidity and mortality
Patients discharged from hospital
Figure 5.9.1 Patients treated for gonarthrosis1, age-standardised number of patients per 100 000 population, 2014 and time series 2006-20142
1 ICD-10: M17 2 Data from the Norwegian Patient Register also includes patients who have been treated in open
care, which means that these are not comparable with data from the other Nordic Countries
Source: The National inpatient registers
Denmark Finland Iceland Norway Sweden0
200
400
600
800
1000
1200
1400
1600
1800
2000
466524 510
1366
405
578
777
601
1806
496
328398 409
960
285375
571
398
1204
335
06 07 08 09 10 11 12 13 140
200400600800
100012001400160018002000
Denmark
Finland
Iceland
Norway
Sweden
Men 75+
06 07 08 09 10 11 12 13 140
200400600800
100012001400160018002000
Women 75+
06 07 08 09 10 11 12 13 140
200400600800
100012001400160018002000
Women 65+
06 07 08 09 10 11 12 13 140
200400600800
100012001400160018002000
Men 65+

117
Diagnosis-related morbidity and mortality
Figure 5.9.2 Patients treated for coxarthrosis1, age-standardised number of patients per 100 000 population, 2014 and time series 2006-20142
1 ICD-10: M16 2 Data from the Norwegian Patient Register also includes patients who have been treated in open
care, which means that these are not comparable with data from the other Nordic Countries
Source: The National inpatient registers
Denmark Finland Iceland Norway Sweden0
200
400
600
800
1000
1200
1400
1600
1800
493 457415
1013
432
601522 521
1723
541
441 406 391
942
352
522 524
683 694
424
06 07 08 09 10 11 12 13 140
200400600800
100012001400160018002000
Denmark
Finland
Iceland
Norway
Sweden
Men 75+
06 07 08 09 10 11 12 13 140
200400600800
100012001400160018002000
Women 75+
06 07 08 09 10 11 12 13 140
200400600800
100012001400160018002000
Women 65+
06 07 08 09 10 11 12 13 140
200400600800
100012001400160018002000
Men 65+

118
Diagnosis-related morbidity and mortality
Surgical interventions
Figure 5.9.3 Total knee replacement1 by age, total numbers of procedures per 100 000 in the age group, 2013
1 NCSP: NGB 20; NGB 30; NGB 40
2 Åland average 2009-13
Source: NOMESCO, Health Statistics in the Nordic Countries 2015
Figure 5.9.4 Hip replacement1 by age, total numbers of procedures per 100 000 in the age group, 2013
1 NCSP: NFB, NFC
2 Åland average 2009-13
Source: NOMESCO, Health Statistics in the Nordic Countries 2015
Denmark Finland Åland Norway Sweden0
100
200
300
400
500
600
700
800
900
1000
428
494 505
348373
571
806
669
483450
402
539
339
283
358
492
723
481
393 393
Denmark Finland Åland Norway Sweden0
200
400
600
800
1000
1200
1400
1600
1800
2000
2200
625 639571 604
538
791736
836
1098
683
1020 1024
817
1300
934
1467
1307
961
2013
1214

119
Diagnosis-related morbidity and mortality
5.10 Falls and hip fractures
Injuries caused by falling are the most common cause of injury among old people. Falls often result in a hip fracture which, apart from being painful, can lead to isolation and increased dependence on others. Apart from consequences in the form of lower quality of life for the individual, it can also entail major costs for society, as many old people never retain their earlier functional ability and become dependent on home-help services.
Many individual factors relating to living habits affect the risk of falling and subsequent injuries. Diet, smoking and alcohol consumption are risk factors that can lead to fall injuries, as well as blood pressure drops, underlying illnesses, low body weight and various types of medicines. Osteoporosis is a risk factor particularly relevant to women. However, physical activity reduces the risk of injury.
Apart from preventive measures directed towards these risk factors, such as physical activity, balance training, treatment of osteoporosis and medicinal review, measures such as adaptation of the surroundings, snow clearance, sanding of ice, and improved lighting have proved successful in protecting individuals from falling and injuring themselves.
The patterns are the same throughout the Nordic region in terms of gender and age. The number of people treated in hospital for hip fractures increases sharply with age, and more women than men injure their hips, regardless of age (Figure 5.10.1). Norway has the highest number of people treated for hip fractures, regardless of gender and age. The number treated per 100 000 in each population group is generally falling slowly. The changes are smallest among men in the younger age group, 65 and older (Figure 5.10.1).
Mortality through fall-related injuries does not show the same gender pattern as the number of people treated in hospital. Above all, it is in the oldest age group, 80+, that a larger proportion of men than women die. In Denmark and Iceland, there is no or very little difference between the genders. Finland generally reports most deaths resulting from fall-related injuries, and Denmark least (Figure 5.10.2). In Norway and Sweden, the number of deaths resulting from fall-related injuries has increased in the past decade, while the trend for the rest of the Nordic region is difficult to interpret (Figure 5.10.2).
Statistics presented – Falls and hip fractures The figures show information for 2014 divided into gender and the 65+ and 80+ age groups. For the period 2006-2014, information is reported for the 65+ and 75+ age groups. The statistics show:
• Patients discharged from hospital after hip fracture • Deaths caused by fall-related injuries

120
Diagnosis-related morbidity and mortality
Patients discharged from hospital
Figure 5.10.1 Patients treated for hip fracture1, age-standardised number of patients per 100 000 population, 2014 and time series 2006-20142
1 ICD-10: S72 2 Data from the Norwegian Patient Register also includes patients who have been treated in open
care, which means that these are not comparable with data from the other Nordic Countries
Source: The National inpatient registers
Denmark Finland Iceland Norway Sweden0
500
1000
1500
2000
2500
3000
3500
590 533667
813670
978
731
1108
1330
1014
14851354
1875
2127
1826
2511
1868
2707
3439
2696
06 07 08 09 10 11 12 13 140
500
1000
1500
2000
2500
3000
Denmark
Finland
Iceland
Norway
Sweden
Men 75+
06 07 08 09 10 11 12 13 140
500
1000
1500
2000
2500
3000Women 75+
06 07 08 09 10 11 12 13 140
500
1000
1500
2000
2500
3000Women 65+
06 07 08 09 10 11 12 13 140
500
1000
1500
2000
2500
3000Men 65+

121
Diagnosis-related morbidity and mortality
Deaths
Figure 5.10.2 Deaths due to falls1, age-standardised number of deaths per 100 000 population, 2014 and time series 2006-20142
1 ICD-10: S72 2 Data from the Norwegian Patient Register also includes patients who have been treated in open
care, which means that these are not comparable with data from the other Nordic Countries
Source: The National inpatient registers
Denmark Finland Iceland Norway Sweden0
50
100
150
200
250
300
350
27
123
29
7163
26
75
2945
35
77
335
114
207
187
79
232
114
143
113
06 07 08 09 10 11 12 13 140
50
100
150
200
250
300
350
Denmark
Finland
Iceland
Norway
Sweden
Men 75+
06 07 08 09 10 11 12 13 140
50
100
150
200
250
300
350Women 75+
06 07 08 09 10 11 12 13 140
50
100
150
200
250
300
350Women 65+
06 07 08 09 10 11 12 13 140
50
100
150
200
250
300
350Men 65+

122
Diagnosis-related morbidity and mortality

123
Quality indicators
Chapter 6
Quality indicators
The Nordic countries have worked jointly on developing quality indicators in a project initiated by the Nordic Council of Ministers (2007), and have also participated in the OECD work to develop indicators (Health Care Quality Indicator – HCQI Project, 2002) for measuring and monitoring quality in health care. In the OECD report ‘Health at a Glance 2015’, OECD statistics are presented and compared in accordance with these jointly agreed indicators. Most of the report is based on data relating to the entire population aged 15 upwards.
In this section, we use some of the OECD indicators to highlight and compare certain aspects of the work in health care that are important for older people. We have used the OECD definitions and the same data, but only in relation to the 65+ age group and, in some cases, 60+.
Well-functioning primary care plays a crucial role in the care and health of old people, so we have chosen to start with several indicators relating to quality in primary care. This concerns both the overall care of certain specific patient groups and prescription of medicines.
• Avoidable hospital admissions (asthma, COPD, heart failure and diabetes) • Amputations among diabetes patients • Prescription of long-acting benzodiazepines • Long-term prescription of benzodiazepines • Prescription of antibiotics, total prescriptions • Prescription of second-line antibiotics, quinolones, and cephalosporins
For hospital care, we have selected some well-established indicators that measure the quality of care of patients with cardiovascular disorders and an indicator that reflects quality in the care of patients with hip fractures.
• 30-day mortality after acute myocardial infarction • 30-day mortality after a stroke • Waiting time before operation of hip fracture
We have then chosen to focus on the quality of care of old people with severe mental health disorders
• Excess mortality among patients diagnosed with schizophrenia • Excess mortality among patients diagnosed with bipolar disorders
Finally, the quality of cancer care is examined using indicators that show cancer survival. These indicators were developed by NORDCAN (Association of the Nordic

124
Quality indicators
Cancer Registries), to which the Nordic Cancer Register reports its cancer data annually:
• 5-year relative survival for patients with breast cancer • 5-year relative survival for patients with prostate cancer • 5-year relative survival for patients with colorectal cancer • 5-year relative survival for patients with lung cancer • 5-year relative survival for all cancer patients • 5-year relative survival for all cancer patients except those with skin cancer
(excluding melanoma), breast and prostate cancer
Avoidable hospital admissions
Definition:
The indicator ‘Avoidable hospital admissions’ is defined as the number of discharged patients treated with one of the main diagnoses asthma, COPD, congestive heart failure or diabetes among people aged 65 and older per 100,000 of the population. The data is age-standardised, using the 2013 Nordic population, combined for men and women.
In all Nordic countries, there is a first level, primary care, which is responsible for the population’s needs for basic medical treatment and care that does not require the medical and technical resources of a hospital or other specialist expertise. Well-functioning primary care means that certain chronic disorders are mainly treated in health centres, and only to a limited extent are treated on admission to a hospital.
In terms of what is to be discussed as primary care sensitive conditions, the OECD has identified four different chronic disorders where efficient follow-up, coordinated care, and support from primary care reduces the need for hospital admissions: asthma, COPD, congestive heart failure and diabetes. The following shows a quality indicator with combined data for these disorders. (See definition in the separate box). The different diagnoses make varying contributions to the aggregated indicator. COPD and congestive heart failure contribute considerably more than asthma and diabetes. Congestive heart failure contributes most among men, and COPD mostly among women in the 65+ age group (Figures 6.1 and 6.2). In the 80+ age group, congestive heart failure comprises the largest proportion of admissions for both genders (Figure 6.1).

125
Quality indicators
Figure 6.1 Avoidable hospital admissions, age standardised rates per 100 000 population, 2013
1 Tree-years average
Source: The National inpatient registers
Figure 6.2 shows a cumulative picture in terms of the proportions of hospital-treated patients aged 65 or older with chronic disorders. For the 80+ age group, the proportions treated in hospital are higher and the differences between countries greater, which suggests primary care could improve in the way it meets the needs of the oldest patients with chronic disorders. This is especially true as the Nordic region has an ageing population with a growing number of older elderly people. Finland and Sweden have the highest proportions of hospital treatment in the older age groups. However, the trend in Finland is falling, with fewer patients treated in hospital.
The differences between the countries on the question of quality of primary care treatment can also be affected by differences in prevalence/occurrence of the disorder in question in the population, and by coding practice. For example, there can be differences in coding of diabetes as main and secondary diagnosis, and in the extent to which hospital care is used for certain diagnoses and conditions.

126
Quality indicators
Figure 6.2 Avoidable hospital admissions, age standardised rates per 100 000 population, 2013 and time series 2006-2013
1 Three-years average
Source: The National inpatient registers
Denmark Finland Iceland Norway Sweden0
5001000150020002500300035004000450050005500600065007000
2558
3011
2373 2379
3176
18372092
1871 1728
2299
4482
6366
5050
4367
6795
2834
5033
2895 2880
4613
06 07 08 09 10 11 12 130
1000
2000
3000
4000
5000
6000
7000
8000
9000
Denmark
Finland
Iceland
Norway
Sweden
Men 80+
06 07 08 09 10 11 12 130
1000
2000
3000
4000
5000
6000
7000
8000
9000Women 80+
06 07 08 09 10 11 12 130
1000
2000
3000
4000
5000
6000
7000
8000
9000Women 65+
06 07 08 09 10 11 12 130
1000
2000
3000
4000
5000
6000
7000
8000
9000Men 65+

127
Quality indicators
Major lower extremity amputations
Definition:
The indicator Major lower extremity amputations in elderly with diabetes is defined as the number of patients admitted to hospital who have undergone major lower extremity amputations per 100 000 in the population 65 years and older. The data is age-standardised, using the 2013 Nordic population.
As a measure of the quality in the long-term treatment and care of diabetes patients, OECD proposes that the proportion of major lower extremity amputations among diabetes patients is calculated, reported and compared. However, the difficulties of defining the diabetes populations in the Nordic countries have meant that, in this report, we use the entire older population (65+) as denominator (see definition in separate box).
Figure 6.3 shows that the number of amputations carried out on diabetes patients, per 100 000 inhabitants in the 65-74 age group, varies greatly in the Nordic countries. Sweden generally has the lowest proportions, 3.1 among women and 7.9 among men, while Denmark has the highest proportion among men (51.4) and Norway has the highest proportion among women (27.2). The diagram also shows that amputations are considerably more common among older ages than younger. The large differences between the Nordic countries indicate that something other than amputation frequency may explain the differences in the table and figure, such as different methods of registering and coding diabetes. The development of amputation frequency over time is rather difficult to interpret, since the reported time series are often so short. However, the proportion of amputations is slowly falling, but steadily, in Sweden, while the trend in Denmark, after a period of decline, appears to have slowed (Figure 6.3).
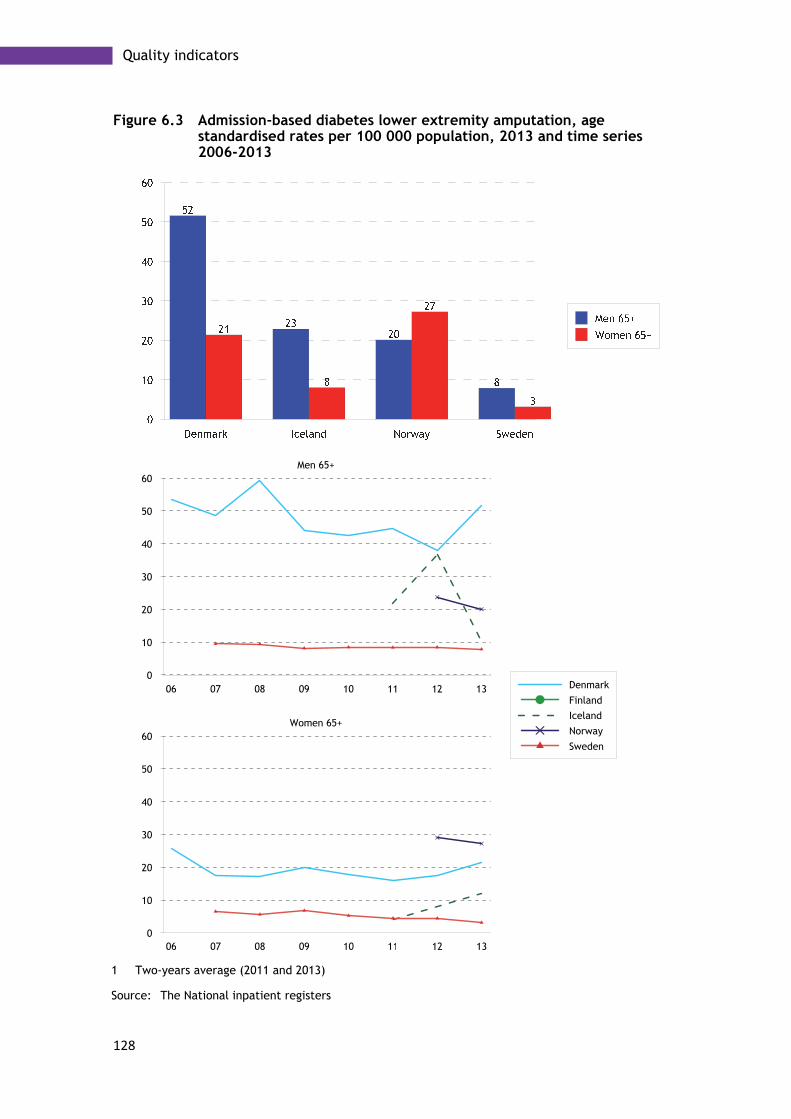
128
Quality indicators
Figure 6.3 Admission-based diabetes lower extremity amputation, age standardised rates per 100 000 population, 2013 and time series 2006-2013
1 Two-years average (2011 and 2013)
Source: The National inpatient registers
06 07 08 09 10 11 12 130
10
20
30
40
50
60Women 65+
06 07 08 09 10 11 12 130
10
20
30
40
50
60
Denmark
Finland
Iceland
Norway
Sweden
Men 65+

129
Quality indicators
Prescription of benzodiazepines
Treatment of old people with medications has attracted increasing attention in recent years. This is because age-related changes increase sensitivity to medication, and both the concentration and effect of medication are affected. Older people therefore have a higher risk of adverse effects and, in certain cases, even a higher risk of premature death. This applies to medication generally, but attention has particularly focused on the use of psycho-tropics. See Chapter 7, which focuses on the risks of medication prescription among old people.
Various types of benzodiazepines are often prescribed to relieve worry, anxiety and insomnia. Benzodiazepines are anxiolytics, a sedative that among old people increases the risk of adverse effects such as tiredness, dizziness and confusion. OECD has developed two indicators that concern prescription of benzodiazepines among old people. These are long-term use of benzodiazepines and the use of long-acting benzodiazepines.
Long-term prescription of benzodiazepines
Definition:
Long-term prescription of benzodiazepines means 365 or more defined daily doses (DDD) per year. The figures show the proportion of the populated aged 65 and older per 1 000 inhabitants that have had benzodiazepines prescribed for at least one year.
The figures for long-acting benzodiazepines show the proportion of the population aged 65 and older per 1 000 inhabitants that have had long-acting benzodiazepines prescribed on at least one occasion in the year in question.
Figure 6.4 shows that long-term prescription (365 or more daily doses during a year) is higher among women than men, and that prescription is generally highest in Norway and Sweden. Norway and Sweden lie above the average for OECD13, which is 28.9 per 1 000 inhabitants aged 65 and older. The corresponding figure for Norway is 50.0 and for Sweden 36.0.
Only Denmark and Sweden present data that enables development over time to be monitored. We can observe that long-term prescription has fallen significantly in Denmark in the period 2005-2013, while prescription has been at approximately the same level, with if anything a slight increase, during the corresponding period in Sweden. (Figure 6.4)
Figure 6.5 shows that Norway also has the highest prescription of long-acting benzodiazepines together with Denmark, regardless of age and gender. Finland has by far the lowest proportions among the Nordic countries.
Compared with OECD14, Norway is significantly above average, with 76 per 1 000 older inhabitants prescribed long-acting benzodiazepines at least once a year, compared with 62 in the OECD. Corresponding figures were 36 for Denmark, 23 for Sweden and 4.5 for Finland.
For this indicator, too, it is only Denmark and Sweden that show trends. Both countries show downward curves for both genders in the period 2005/06-2013. The decline is generally greater in Denmark than in Sweden (Figure 6.5).

130
Quality indicators
Figure 6.4 Long-term use of benzodiazepines and related drugs in elderly patients (≥ 365 DDDs per year), number per 1 000 elderly patients, 2013 and time series 2005-2013
1 Norway 2012
Source: The National prescription databases
Denmark Finland Norway Sweden0
10
20
30
40
50
60
70
80
139
33
2726
12
64
43
15
6
43
3530
10
74
54

131
Quality indicators
Figure 6.5 Use of long-acting benzodiazepines in elderly patients, number per 1 000 elderly patients, 2013 and time series 2005-2013
1 Norway 2012
Source: The National prescription databases
Denmark Finland Norway Sweden0
10
20
30
40
50
60
70
80
90
100
110
120
24
4
51
18
47
5
97
2831
2
61
23
59
3
110
35

132
Quality indicators
Prescription of antibiotics
Definition:
The total prescription of antibiotics in primary care is measured and expressed as the number of defined daily doses per day (DDD) per 1 000 in the population. The denominator comprises ‘the population’ in each country’s register of pharmaceuticals. Prescription of second-line antibiotics, i.e. the type of antibiotic prescribed when the primary choice of antibiotics has not brought the desired result, is calculated and expressed as the percentage of the total antibiotic prescription.
In the Nordic Council of Ministers report ‘The future Nordic health co-operation’ from 2014, Bo Könberg emphasises the need for measures against the increasing antibiotic resistance. Although the Nordic countries have, on average, lower antibiotic use than the rest of Europe, Könberg argues that they must set up their own goals to, within the next five years, reduce consumption of antibiotics to the lowest European level, currently that of the Netherlands.
The OECD project, ‘Health Care Quality Indicators’ presented in the report ‘Health at a Glance 2015’ also emphasises the necessity of limiting the prescription of antibiotics to situations where there is an evidence-based need and states that second-line antibiotics, quinolones and cephalosporins should only be prescribed if the first-line therapy has failed.
The following section, based on the OECD definitions, presents an indicator for the total prescription of antibiotics in primary care to the 60+ age group (Figure 6.6) and an indicator (Figure 6.7) for prescription of second-line antibiotics (see definition).
Compared with OECD’s reported average for antibiotic use in the entire population – Denmark 16.4, Finland 18.3, Iceland 21.4, Norway 16.2, and Sweden 13.0 daily doses per 1 000 – antibiotic use is higher and sometimes considerably higher among the older age groups in the population. (The slightly higher figure for Iceland can be explained by it not only referring to prescription in primary care).
Norway and Denmark have the highest prescription of antibiotics to old people. The highest levels of prescriptions are among the oldest people (80+). Finland and above all Sweden have considerably lower levels of prescription. Prescription levels are generally higher to women than to men.
Denmark and Sweden are the only countries that show trends for prescription levels over time (Figure 6.6). In Denmark, prescriptions have increased continually in recent years, but levels have decreased in Sweden. The differences are clearest in the older age groups.
In terms of the use of second-line antibiotics, Finland deviates from the other countries, with high figures for both women and men. Sweden has higher proportions than other countries, but considerably lower than Finland. More second-line antibiotics are prescribed to men than to women (Figure 6.7).
Figure 6.7 show a slight reduction in the second-line proportion of total antibiotic prescription in both Denmark and Sweden.

133
Quality indicators
Figure 6.6 Overall volume of antibiotics for systemic use (DDDs/Days/Users), DDDs per 1 000 population per day, 2013 and time series 2005-2013
1 Norway 2012
Source: The National prescription databases

134
Quality indicators
Figure 6.7 Volume of second line antibiotics as a share of total volume, percentage of all antibiotics prescribed, 2013 and time series 2005-2013
1 Norway 2012
Source: The National prescription databases
05 06 07 08 09 10 11 12 1302468
101214161820
Denmark Sweden
Men 80+
05 06 07 08 09 10 11 12 1302468
101214161820
Women 80+
05 06 07 08 09 10 11 12 1302468
101214161820
Women 60+
05 06 07 08 09 10 11 12 1302468
101214161820
Men 60+

135
Quality indicators
Mortality following acute myocardial infarction (AMI)
Definition:
Mortality following acute myocardial infarction (fatality or case fatality rate) measures the proportion of patients, 65 and older, who die within 30 days after admission to hospital for acute myocardial infarction, regardless of whether the death occurred in or outside the hospital. The figures in the tables are age-standardised according to age distribution among patients 65 and older, treated for acute myocardial infarction 2013, the same for both genders.
30-day mortality after an acute myocardial infarction (case fatality rate) is a frequently used indicator for the quality of the entire care chain, everything from rapid treatment during ambulance transport to efficient treatment of these patients. In the tables and figures presented in this section, we have followed the OECD definition of the quality indicator ‘30-day AMI case fatality rate’ (see explanation below). More information about the course of the disorder and hospital treatment, and total/general mortality in acute myocardial infarction is shown in the section on diagnosis-specific disease and mortality.
In all Nordic countries except Denmark, lethality (fatality among patients with AMI) is somewhat higher among men than women, both for the younger elderly (65+) and older elderly (80+). However, fatality is noticeably higher among older than younger patients. Even though fatality lies at approximately the same level within the age groups and countries, there are clear differences. The highest fatality is found among Finnish men and women aged 80+ and lowest among Norwegian women aged 65+ (Figure 6.8).
Figure 6.8 show clearly the improvements in cardiovascular care in recent years. Fatality has fallen, both among women and men, and among younger and older elderly, in all countries, except for Finnish men aged 80+.

136
Quality indicators
Figure 6.8 Patient-based AMI 30-day mortality, age-standardised rates per 100 patients, 2013 and time series 2005-2013
Source: The National prescription databases

137
Quality indicators
Mortality following ischaemic stroke
Definition:
Mortality following ischaemic stroke (fatality or case fatality rate) measures the proportion of patients, 65 and older, who die within 30 days after admission to hospital for ischaemic stroke, regardless of whether the death occurred in or outside the hospital. The figures in the tables are age-standardised according to age distribution among patients 65 and older, treated for ischaemic stroke 2013, the same for both genders.
As for acute myocardial infarction, 30-day mortality after an ischaemic stroke (case fatality rate) is an indicator often used to measure the quality of the entire care chain, everything from rapid treatment during ambulance transport to efficient treatment. In the tables and figures presented in this section, we have followed the OECD definition of the quality indicator ‘Ischaemic stroke case fatality rate’ (see explanation below). More information about the course of the disorder and hospital treatment, and pharmaceutical treatment for ischaemic stroke is shown in the section on diagnosis-specific disease and mortality.
Survival is clearly lower among older elderly than younger, and somewhat less for women than men. Denmark and Sweden have the highest fatality rates, regardless of age, and Finland has the lowest (Figure 6.9).
Seen over time, mortality after stroke does not decline as significantly as mortality after acute myocardial infarction. However, the decline is greatest in Denmark and Sweden (Figure 6.9).

138
Quality indicators
Figure 6.9 Patient-based ischaemic stroke 30-day mortality, age-standardised rates per 100 patients, 2013 and time series 2005-2013
Source: The National prescription databases
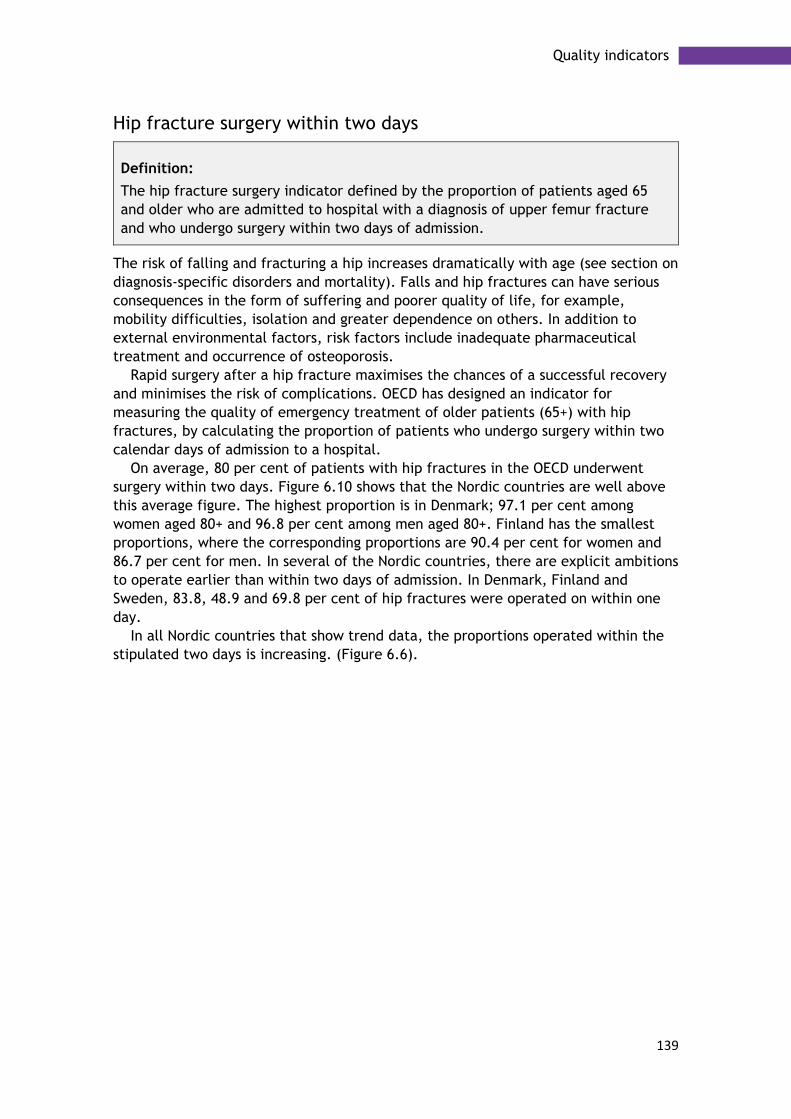
139
Quality indicators
Hip fracture surgery within two days
Definition:
The hip fracture surgery indicator defined by the proportion of patients aged 65 and older who are admitted to hospital with a diagnosis of upper femur fracture and who undergo surgery within two days of admission.
The risk of falling and fracturing a hip increases dramatically with age (see section on diagnosis-specific disorders and mortality). Falls and hip fractures can have serious consequences in the form of suffering and poorer quality of life, for example, mobility difficulties, isolation and greater dependence on others. In addition to external environmental factors, risk factors include inadequate pharmaceutical treatment and occurrence of osteoporosis.
Rapid surgery after a hip fracture maximises the chances of a successful recovery and minimises the risk of complications. OECD has designed an indicator for measuring the quality of emergency treatment of older patients (65+) with hip fractures, by calculating the proportion of patients who undergo surgery within two calendar days of admission to a hospital.
On average, 80 per cent of patients with hip fractures in the OECD underwent surgery within two days. Figure 6.10 shows that the Nordic countries are well above this average figure. The highest proportion is in Denmark; 97.1 per cent among women aged 80+ and 96.8 per cent among men aged 80+. Finland has the smallest proportions, where the corresponding proportions are 90.4 per cent for women and 86.7 per cent for men. In several of the Nordic countries, there are explicit ambitions to operate earlier than within two days of admission. In Denmark, Finland and Sweden, 83.8, 48.9 and 69.8 per cent of hip fractures were operated on within one day.
In all Nordic countries that show trend data, the proportions operated within the stipulated two days is increasing. (Figure 6.6).
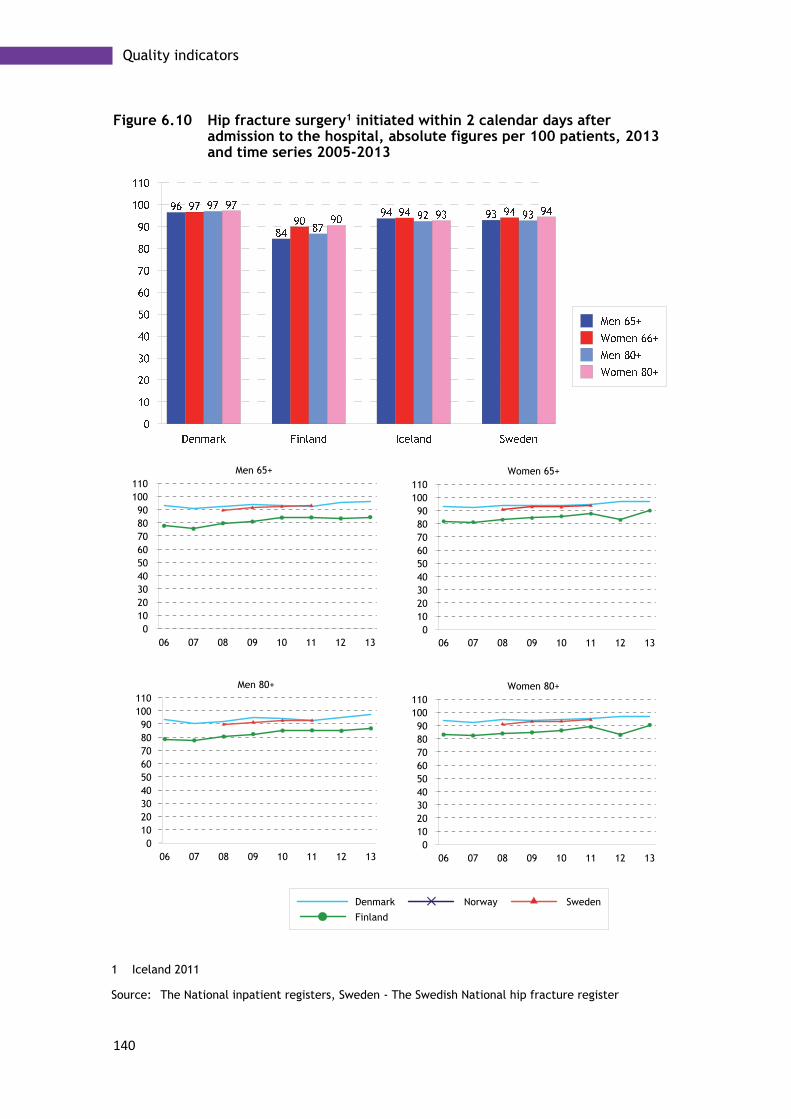
140
Quality indicators
Figure 6.10 Hip fracture surgery1 initiated within 2 calendar days after admission to the hospital, absolute figures per 100 patients, 2013 and time series 2005-2013
1 Iceland 2011
Source: The National inpatient registers, Sweden - The Swedish National hip fracture register
06 07 08 09 10 11 12 130
102030405060708090
100110
Denmark
Finland
Norway Sweden
Men 80+
06 07 08 09 10 11 12 130
102030405060708090
100110
Women 80+
06 07 08 09 10 11 12 130
102030405060708090
100110
Women 65+
06 07 08 09 10 11 12 130
102030405060708090
100110
Men 65+

141
Quality indicators
Excess mortality among patients with schizophrenia and bipolar disorder
Definition:
The numerator in the excess mortality indicator comprises the number of deaths for people aged 65-74 diagnosed with schizophrenia in the first case and bipolar disorder in the second. The denominator comprises number of deaths in the entire population aged 65-74.
In ‘Health at a Glance 2015’, OECD observes that people with mental health disorders have higher mortality than the rest of the population. For the population aged 15-74, OECD shows that mortality is more than twice as high in all eight reporting countries, and usually slightly higher for women than men.
For two serious mental health disorders, schizophrenia and bipolar disorder, OECD has developed indicators where mortality for these two groups of disorders in the 15-74 age group is compared with mortality in the rest of the population. For the Nordic countries reporting data, the greater risk of mortality was sometimes large, and was distributed as shown in Table 6.1.
Table 6.1 Excess mortality from schizophrenia and bipolar disorder, Ratio age 15-74, 2013
Denmark Finland Norway Sweden
Schizophrenia Women 3.6 6.1 5.6 5.2
Men 4.4 6.6 4.9 3.9
Biopolar disorder
Women 3.3 5.2 3.2 2.7
Men 2.6 3.3 2.6 2.5
Source: The National registers of causes of death
Excess mortality among older schizophrenia patients
In this report, we have used the same indicator definitions to make corresponding comparisons as those used by OECD for the 65-74 age group. Figure 6.11 shows that excess mortality for old people with schizophrenia is somewhat higher than mortality for schizophrenia patients in the whole population.
Women generally have a somewhat higher mortality rate, except in Denmark. The highest excess mortality among older schizophrenia patients was found among women aged 65-69 in Finland, where mortality was more than 7.5 times greater than in the whole population in the same age group. The lowest excess mortality was found among Danish women in the 70-74 age group, where excess mortality was 2.5.
If the trend shown in Figures 6.12 and 6.50 continues, excess mortality seems to be rising regardless of gender in the three Nordic countries that report data (Denmark, Finland and Sweden).

142
Quality indicators
Excess mortality among older patients with bipolar disorder
For the second of OECD’s excess mortality indicators, the one that concerns bipolar disorder, the difference in excess mortality is less between the 15-74 age group and the 65-74 age group. There are relatively few people with bipolar disorder, which means that the mortality figures for individual years can vary greatly. However, excess mortality is generally somewhat lower among patients diagnosed with bipolar disorder than those diagnosed with schizophrenia.
Women in the older population with bipolar disorder have somewhat higher mortality than men (Figure 6.12). Finland has the highest excess mortality among the total number aged 64-75 (3.3), and Denmark has the greatest excess mortality among all older men (2.9). Finland has the lowest excess mortality in an individual age group; among Finnish men aged 70-74 excess mortality was 1.4.
Denmark shows a negative trend, with excess mortality increasing some-what, while Finland, after a period in which excess mortality increased, has improved in recent years. The trend in Sweden is more difficult to assess (Figure 6.12).
143
Quality indicators
Figure 6.11 Excess mortality from schizophrenia, two-year average ratio, 2013 and time series 2006-2014
Source: The National registers of causes of death
06 07 08 09 10 11 12 13 140
2
4
6
8
10Women 65-74
06 07 08 09 10 11 12 13 140
2
4
6
8
10
Denmark
Finland
Sweden
Men 65-74

144
Quality indicators
Figure 6.12 Excess mortality from bipolar disorder, two-year average ratio, 2013 and time series 2005-2013
Source: The National registers of causes of death

145
Quality indicators
5-year cancer survival
Definition:
Relative survival is defined as the ratio between the observed survival among cancer patients and the expected survival based on population data, given the same gender, age and calendar period. It can be interpreted as the probability of survival given an absence of other causes of death. NORDCAN generally uses the cohort method. As the follow-up period does not reach 5 years, the calculations are supplemented with survival data from patients from earlier periods according to the hybrid method. International Cancer Survival Standards (ICSS) are used for age standardisation.
Quality in cancer care is measured and compared using the 5-year relative survival figure. This shows the proportion of patients with cancer who are still alive five years after being diagnosed, in relation to an expected survival rate in a comparable group in terms of gender and age, in the population as a whole. Many factors affect survival trends, such as improved treatment, but also new methods for diagnostics and screening.
The quality indicators published by OECD include survival indicators for cancer diseases. However, in the following section, we present 5-year survival rates for certain cancer types using data from NORDCAN (Association of the Nordic Cancer Registries), to which the Nordic Cancer Register reports its cancer data annually.
The data presented refers to the period 2009-2013 and is produced by NORDCAN (see definition box below) and concerns breast cancer, prostate cancer, colorectal cancer, and lung cancer (including trachea and bronchus). Also presented is the overall survival rate for all cancer types except skin cancer (excluding melanoma), breast and prostate. Consequently, in the latter survival rate data, the large dominating cancer types are excluded and thereby their impact on survival.
Figure 6.13 shows that 5-year survival of cancer generally and unanimously falls with increasing age. Here, increasing commodity with increasing age plays an important role. The highest survival rate among women is found in the youngest age group (72 per cent, Finland) and the lowest in the oldest age group (45 per cent, Iceland). Corresponding figures for men were very similar: 72 per cent among younger men (Sweden) and 46 per cent among the oldest (Iceland).
We can also see that the major cancer types with good survival figures, skin cancer and breast cancer among women and prostate cancer among men, have a positive effect on the total survival in a comparison between Figures 6.13 and 6.14.
The relative 5-year survival rate for breast and prostate cancer has increased gradually in recent years and, for the younger age group (60-69 years), is between 90 and 95 per cent (Figures 6.17 and 6.18). On the other hand, lung cancer is still a major challenge for health care, with low survival rates and relatively large differences between the Nordic countries (Figure 6.16). Survival rates in lung cancer vary between 17 (Finland) and 23 (Norway) among younger women, and between 6 (Denmark and Finland) and 8 (Norway and Sweden) among older people. Among men, the corresponding variation ranged between 12 (Denmark, Finland and Iceland) and 15 (Norway) among men aged 60-69, while the variation in the older group, 80-89 years, was between 3 (Finland) and 7 (Sweden).

146
Quality indicators
Figure 6.13 5-year relative all cancer survival, 2009-13
Source: NORDCAN

147
Quality indicators
Figure 6.14 5-year relative all cancer survival excluding breast, prostate and skin cancer (melanoma excluded), 2009-13
Source: NORDCAN

148
Quality indicators
Figure 6.15 5-year relative colorectal cancer survival, 2009-13
Source: NORDCAN

149
Quality indicators
Figure 6.16 5-year relative lung cancer survival, 2009-13
Source: NORDCAN

150
Quality indicators
Figure 6.17 5-year relative breast cancer survival, 2009-13
Source: NORDCAN
Figure 6.18 5-year relative prostate cancer survival, 2009-13
Source: NORDCAN

151
Pharmaceutical treatments among elderly people
Chapter 7
Pharmaceutical treatments among elderly people
As age increases, so does sensitivity to medicines, due to physiological changes and illness. The physiological changes comprise a reduced ability to absorb drugs, at the same time as the organs’ sensitivity to drugs increases with age. For certain drugs, sensitivity increases more with age. Examples are drugs with anticholinergic effects, which can have adverse effects such as mouth dryness. In older people, adverse effects like confusion, tiredness and memory impairment are common. Sleeping drugs can have a prolonged effect, causing tiredness and drowsiness.
The Nordic countries collaborate on pharmaceutical statistics within the framework of the Nordic Medico-Statistical Committee. This section only addresses pharmaceutical treatment of elderly people in Sweden. However, in time, it should be possible to make comparisons between the Nordic countries in terms of pharmaceutical treatments for elderly people.
Pharmaceuticals unsuitable for elderly people
In Sweden, the National Board of Health and Welfare has produced a list of pharmaceuticals that can be unsuitable for elderly people and should therefore be avoided. The list includes the following pharmaceutical groups and pharmaceuticals.
• Benzodiazepines with long half-life • Pharmaceuticals with significant anticholinergic effects • The painkiller Tramadol • The sleeping pill Propiomazine
The Swedish recommendation is that these pharmaceuticals should only be used if there is a well-founded and current indication and the prescribing physician has assessed that the expected benefit of the drug is in reasonable proportion to the risks. Treatment should also be followed up and reassessed at short, regular intervals. The Swedish government introduced performance remuneration for health care principals if they succeeded in reducing the proportion of old people using these pharmaceuticals, within the framework of the initiative for old people with greatest levels of illness. Figure 7.1 shows the proportion of elderly people taking pharmaceuticals that should be avoided, between 2005 and 2014.
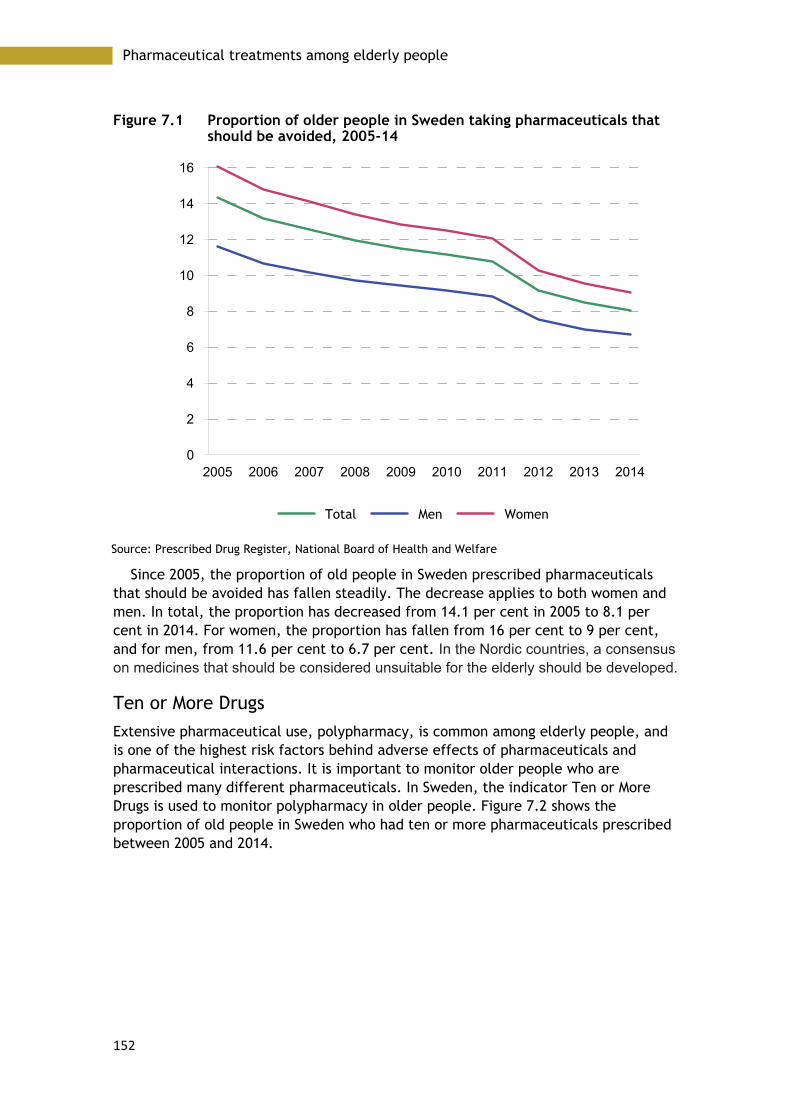
152
Pharmaceutical treatments among elderly people
Figure 7.1 Proportion of older people in Sweden taking pharmaceuticals that should be avoided, 2005-14
Source: Prescribed Drug Register, National Board of Health and Welfare
Since 2005, the proportion of old people in Sweden prescribed pharmaceuticals that should be avoided has fallen steadily. The decrease applies to both women and men. In total, the proportion has decreased from 14.1 per cent in 2005 to 8.1 per cent in 2014. For women, the proportion has fallen from 16 per cent to 9 per cent, and for men, from 11.6 per cent to 6.7 per cent. In the Nordic countries, a consensus on medicines that should be considered unsuitable for the elderly should be developed.
Ten or More Drugs
Extensive pharmaceutical use, polypharmacy, is common among elderly people, and is one of the highest risk factors behind adverse effects of pharmaceuticals and pharmaceutical interactions. It is important to monitor older people who are prescribed many different pharmaceuticals. In Sweden, the indicator Ten or More Drugs is used to monitor polypharmacy in older people. Figure 7.2 shows the proportion of old people in Sweden who had ten or more pharmaceuticals prescribed between 2005 and 2014.
2005 2006 2007 2008 2009 2010 2011 2012 2013 20140
2
4
6
8
10
12
14
16
Total Men Women
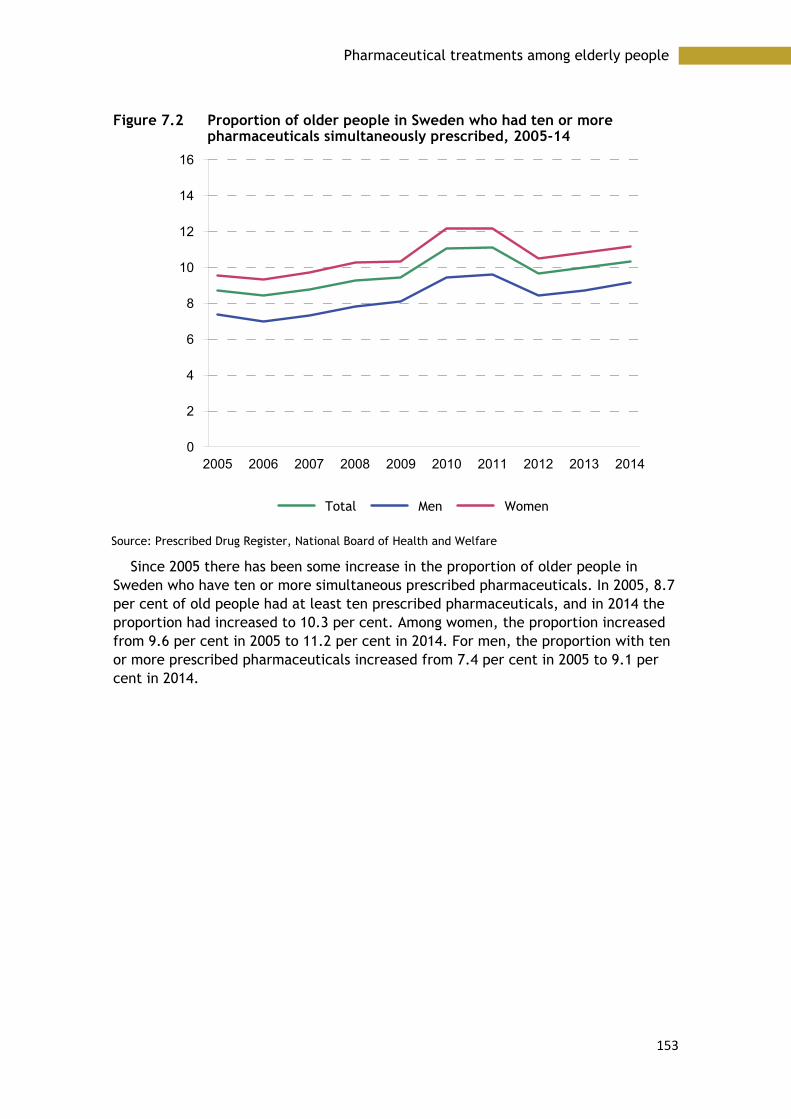
153
Pharmaceutical treatments among elderly people
Figure 7.2 Proportion of older people in Sweden who had ten or more pharmaceuticals simultaneously prescribed, 2005-14
Source: Prescribed Drug Register, National Board of Health and Welfare
Since 2005 there has been some increase in the proportion of older people in Sweden who have ten or more simultaneous prescribed pharmaceuticals. In 2005, 8.7 per cent of old people had at least ten prescribed pharmaceuticals, and in 2014 the proportion had increased to 10.3 per cent. Among women, the proportion increased from 9.6 per cent in 2005 to 11.2 per cent in 2014. For men, the proportion with ten or more prescribed pharmaceuticals increased from 7.4 per cent in 2005 to 9.1 per cent in 2014.
2005 2006 2007 2008 2009 2010 2011 2012 2013 20140
2
4
6
8
10
12
14
16
Total Men Women
154
Pharmaceutical treatments among elderly people

155
Organisation and legislation
Chapter 8
Organisation and legislation
Elderly care in the respective Nordic countries is strikingly similar, and is part of the general welfare system. Generally, it is municipalities that are responsible for elderly care and its financing.
Denmark The act governing social services for elderly people is the Social Services Act. This Act provides the legislative basis for counselling, support and a series of services, including preventive measures, to persons who have short-term or long-term physical or mental disabilities or who have social problems.
The main aims of care are to enable individuals to care for themselves, to make everyday life problem-free, and to improve quality of life. The Act ensures the provision of a series of services for elderly people. The most important are municipal home-help services, home-nursing services, physiotherapy, provision of aids for disabled people, chiropody, meals-on-wheels, provision of support persons, and transport services. The level of service provision can vary, as this is determined by the individual municipality.
Finland and Åland The Ministry of Social Affairs and Health (MSAH) sets out a policy on ageing in its strategy, in legislation, quality recommendations, programmes and projects. The aim of the policy on ageing is to promote.
• functional capacity • independent living • active participation in society
The MSAH is responsible for running services for older people. It decides how services are to develop, draws up legislation, and oversees the implementation of reforms. The ministry also monitors service standards through the National Supervisory Authority for Welfare and Health and the Regional State Administrative Agencies.
Municipalities are responsible for arranging services for old people. The municipality grants services after a needs assessment. Municipalities may provide the services themselves or buy them from other municipalities or from private service providers.
The National Supervisory Authority for Welfare and Health (Valvira) operates nationwide in guiding and overseeing social care. It steers the work of the Regional

156
Organisation and legislation
State Administrative Agencies to ensure that supervision and associated guidance is standardised throughout the country.
The Advisory Board for Ageing and Pensioners' Affairs monitors and assesses matters of income security, services and living conditions of older and retired people, and implements initiatives on their development.
Municipal social and health care services are governed by legislation covering social welfare, primary health care, specialised medical (hospital) care, and informal care support. The Acts entitle people to services according to need.
The Social Welfare Act secures the access of people aged 75 and older to a needs assessment within seven days of contacting the social services in their municipality. The time frames for guaranteed access to health services are stipulated in the Primary Health Care Act and the Act on Specialised Medical Care. Legislation entitles older people to the MSAH services according to need, and not necessarily according to age.
Iceland One objective of elderly care in Iceland is that as many elderly people as possible should be able to live in their own homes. Elderly care is governed by several Acts of Parliament. The main one is the Act on the Affairs of the Elderly, aimed at ensuring that the elderly have access to the health and social care services they require. Such services are provided at the most appropriate level depending on the needs and condition of the elderly person in question.
Another aim of the Act is to ensure that the elderly can enjoy a normal domestic life for as long as possible, and that they are assured the necessary institutional services when needed. The Act also ensures that the elderly enjoy equal rights with other citizens and that their right to self-determination is respected.
In Iceland the Ministry of Welfare is responsible for formulating policy and planning care of the elderly throughout the country. The ministry is also responsible for promoting public discussion and presenting the options available to elderly people.
Authority is divided between the Minister of Health and the Minister of Social Affairs and Housing under the Ministry of Welfare.
The Icelandic health care system is centralised with universal coverage. Policy and planning fall under the realm of the Ministry of Welfare, more specifically the Ministry of Health. The objective of the Health Service Act, no 40/2007, is to ensure that everyone in Iceland has access to the optimum health service that can be provided at any time to safeguard mental, physical and social health.
The Icelandic Government owns most organisations that provide health care, i.e. hospitals and primary health care centres, and these are financed through central budgets. Staff at state-owned institutions are salaried. Self-employed healthcare practitioners also provide health services at their own facilities, with or without a state contribution to costs.
In addition to the Act on the Affairs of the Elderly no 125/1999, relevant acts of Parliament, although not specifically aimed at the elderly, include the Health Service Act No. 40/2007, the Act on Health Insurance No. 112/2008, Patients’ Rights Act No. 74/1997, and the Social Security Act No. 100/2007.

157
Organisation and legislation
Norway One of the main aims of healthcare for the elderly in Norway is to formulate policies to promote healthy and active ageing. Active and social lives are essential to a healthy life, regardless of age. People are living longer and, at the same time, are healthier than ever before. Even though many people will still enjoy good health in their old age, many will live longer with chronic illnesses that will affect both their quality of life and everyday function. The services offered to promote healthy and active ageing are focused on activity and prevention.
Another objective in the care of the elderly is to provide care at the lowest efficient level of care (LEON principle, WHO). This principle states that all preventive work and measures to promote health should take place as close as possible to the person’s home environment, to utilise the resources available in the local environment and in the user’s social network. This also means that people should be able to live at home for as long as possible, and that any services required should be home-based.
Overall responsibility for the health care sector lies at national level, with the Ministry of Health and Care Services. The ministry determines national health policy, prepares and oversees legislation, decides on the allocation of funds within the health sector (allocation of resources to health and other sectors is the responsibility of the Ministry of Finance), and implements national health policy with the help of several subordinate institutions.
The system is regulated through several acts and secondary legislation. Legislation broadly reflects the decentralised nature of the healthcare system.
Specialist care, organised at RHA level, is regulated by the Specialist Care Act of 1999 and the Health Authorities and Health Trusts Act of 2001. Primary care, organised at municipal level, is regulated by the Municipal Health and Care Act of 2011. Dental care, organised at county level, is regulated by the Dental Health Services Act of 1983.
Other areas of care that span several organisational levels are regulated by separate acts, for example, the Mental Care Act of 1999 and the Public Health Act of 2011. Other key acts are the Patients’ Rights Act of 1999 and the National Insurance Act of 1997. The latter regulates financing and entitlement to certain non-medical benefits in case of sickness, maternity, disability, rehabilitation or occupational injury.
Sweden The aim of the Swedish government’s elderly policy is that old people should be able to lead an active life, exert influence in society and over their everyday lives, age safely and with retained independence, be treated with respect, and have access to good care and treatment. Care and treatment of elderly women and men is part of the welfare policy, and elderly people are to have access to fair and equal elderly care, regardless of where in the country they live.
The Health and Medical Services Act (HSL 1982:763) entitles people to treatment at hospitals and medical centres, and governs the distribution of responsibility between county councils and municipalities.
The Social Services Act (SoL 2001:453) entitles people to support in their homes, elderly accommodation, day-care centres if the person cannot meet their own needs, or support with needs in some other way. In the event of need for help in the home,
158
Organisation and legislation
a place in supported accommodation, transport service or other elderly care, the municipality carries out a needs assessment and decides on the level of support needed. The municipality is responsible for health care up to and including nurse level in special accommodation forms for service and care of old people. Responsibility also includes health care in housing with special service for disabled people of all ages who, for physical, mental or other reasons, encounter significant difficulties in their everyday lives.

159
Pensions
Chapter 9
Pensions
The Nordic population is ageing, and the proportion of old people in the population is growing. It is positive that people are living longer, but this also puts pressure on our economies and welfare systems. When fewer children are born, and life expectancy increases, this affects the age structure over time in the working population, and the labour force becomes older.
In that average life expectancy is increasing, most people approaching retirement need to work longer to reach the same level of pension income as earlier generations. Reforms in Sweden, Finland and Norway have been carried out to attain a higher level of financial stability in the pension systems to ensure they can meet future demographic and financial challenges. Denmark has also recently decided to reform its state pension system, so that retirement age will be gradually increased from 65 to 67 between 2019 and 2022.
Common for the Nordic pension systems is that all citizens have a legal right to a guarantee/minimum pension, and that the size of the pension depends on earlier occupational income. In addition to the statutory pension or a pension based on a collective agreement, various forms of private pension schemes can supplement the state pension. Entitlement to pension applies in the country where the person is covered by social insurance.
Since 1 March 2002, there has been an agreement between the Nordic countries on coordination of state pension rights in the same way as pensions earned through work.
Work after the retirement age
The time when a person starts to draw the retirement pension is very important for the size of the pension. The retirement age in the Nordic countries usually varies between 65 and 67, although in Sweden there is no formal retirement age. In Norway, people can start to draw the retirement pension at any time between the ages of 62 and 75.
Figure 9.1 and Figure 9.2 show the employment rates for the populations in the Nordic countries for men and women aged 65 to 69 and for everyone in the population over 65. The high proportion of people in employment in Iceland and Norway in the 65 to 69 age group should be seen against the background of the retirement age in these countries usually being higher, which particularly affects the proportion of workers in the ages 65 to 67.
The proportion of people choosing to continue to work after the age when they could draw their retirement pension is steadily increasing, and has done so in the

160
Pensions
past ten years in all Nordic countries, apart from among Icelandic men, where the trend is less clear. Both Icelandic and Swedish men, and Icelandic women, work on average to a higher age than the legal age of retirement. However, the trend in Iceland should be seen in relation to an already high level of employment among old people (Figure 9.3 and Figure 9.4).
Figure 9.1 Employment rates among people 65-69 years old 2014
Source: Eurostat
Figure 9.2 Employment rates among people 65 years and older 2014
Source: Eurostat
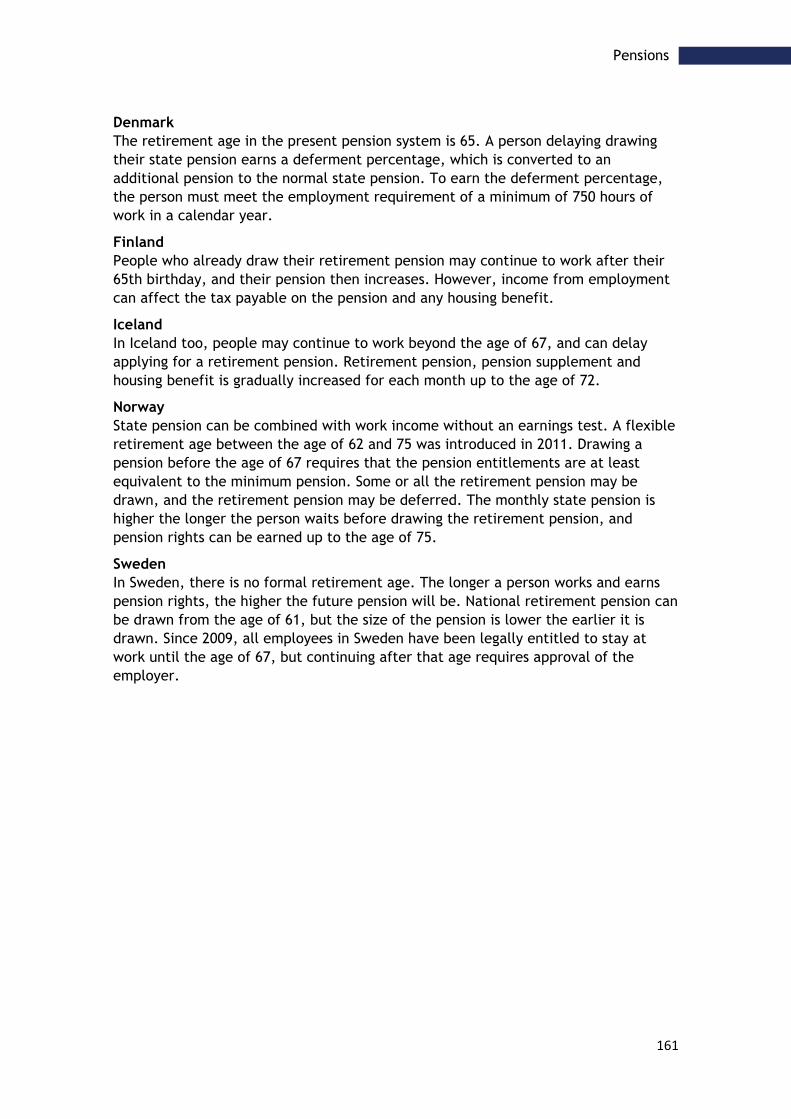
161
Pensions
Denmark The retirement age in the present pension system is 65. A person delaying drawing their state pension earns a deferment percentage, which is converted to an additional pension to the normal state pension. To earn the deferment percentage, the person must meet the employment requirement of a minimum of 750 hours of work in a calendar year.
Finland People who already draw their retirement pension may continue to work after their 65th birthday, and their pension then increases. However, income from employment can affect the tax payable on the pension and any housing benefit.
Iceland In Iceland too, people may continue to work beyond the age of 67, and can delay applying for a retirement pension. Retirement pension, pension supplement and housing benefit is gradually increased for each month up to the age of 72.
Norway State pension can be combined with work income without an earnings test. A flexible retirement age between the age of 62 and 75 was introduced in 2011. Drawing a pension before the age of 67 requires that the pension entitlements are at least equivalent to the minimum pension. Some or all the retirement pension may be drawn, and the retirement pension may be deferred. The monthly state pension is higher the longer the person waits before drawing the retirement pension, and pension rights can be earned up to the age of 75.
Sweden In Sweden, there is no formal retirement age. The longer a person works and earns pension rights, the higher the future pension will be. National retirement pension can be drawn from the age of 61, but the size of the pension is lower the earlier it is drawn. Since 2009, all employees in Sweden have been legally entitled to stay at work until the age of 67, but continuing after that age requires approval of the employer.
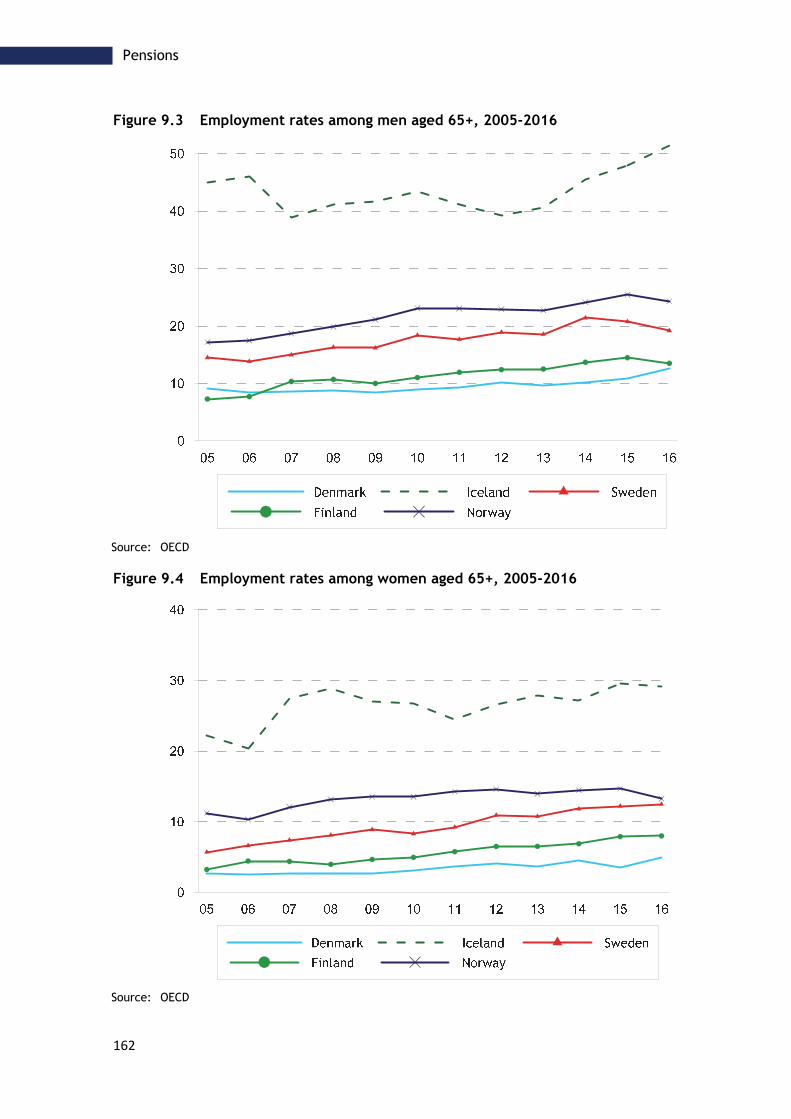
162
Pensions
Figure 9.3 Employment rates among men aged 65+, 2005-2016
Source: OECD
Figure 9.4 Employment rates among women aged 65+, 2005-2016
Source: OECD

163
Pensions
Retirement pension
For basic pension/minimum pension, similar requirements apply in all the Nordic countries, such as a residence requirement, but for supplementary pension and pension based on income, the requirements differ somewhat. In most of the Nordic countries, the pension amount is partly determined by the recipient’s civil status. For people with low or no pension, there are various kinds of supplementary benefits. Table 9.1 shows the conditions for the general retirement pension benefits in the Nordic countries.
Denmark Danish retirement pension comprises national pension, labour market pension (ATP) and pension based on a collective agreement.
National pension is made up of a basic amount and a pension supplement, which is greater for people who live alone.
At present, the general retirement age is 65, but this will be gradually raised to 67 over the period 2019 to 2022.
The length of residence in Denmark affects the size of the national pension.
Faroe Islands According to the main regulation, a person is entitled to retirement pension from their 67th birthday. A person who has lived in the Faroe Islands less than 40 years is entitled to a pension corresponding to the number of years they have lived in the Faroe Islands, in Greenland, or in Denmark. People who are 21 or older, but younger than 67, must save towards their own pension, and the retirement pension is also means tested.
Finland and Åland Everyone who works in Finland is entitled to a pension based on their earlier income. The pension system comprises an occupational pension, which a person earns through working in Finland, and a national pension, which is a residence-based social benefit, where the size of the pension depends on how long the person has lived in Finland. A person may apply for a retirement pension from Kela, the Social Insurance Institution of Finland (FPA) from the date of the 65th birthday. A pension may be drawn earlier, from the age of 63, but this results in a permanent reduction in the size of the pension.
Iceland Retirement pension payments have three main categories: basic pension, pension supplement, and household supplement. Individuals may be entitled to one or more of these payments. Income from other sources may affect the amount a person is entitled to receive from the Social Insurance Administration. The amount of money received from these work-related pension funds depends on the contribution of the fund member and length of the payment period.
To qualify for retirement pension from the state, an individual must have reached the age of 67 and lived in Iceland for at least three years between the ages of 17 and 67. To qualify for full pension from the state an individual must have lived in Iceland for 40 years out of the 51 years between the ages of 17 and 67, otherwise the pension is calculated as a percentage of the full payment.
164
Pensions
Norway For current retired people, the retirement pension consists of a basic pension, an earnings-related pension, and a special supplement for those with no or low earnings-related pension. The basic pension depends on marital status, and a full basic pension requires 40 years of residence in Norway. Occupational pensions became mandatory in Norway in 2006. The occupational pension schemes can be defined benefit schemes or defined contribution schemes. People with low income and high housing expenses may also be eligible for a housing allowance. A life expectancy adjustment was also introduced in 2011. When life expectancy increases, this implies that future cohorts must postpone retirement somewhat to achieve the same pension levels as older cohorts. New rules for earning pension entitlements have been introduced for people born in 1963 or later, whereas transitional rules apply for those born 1954 to 1962.
Sweden In the current pension system, the premium pension and income-based pension can be drawn from the age of 61, but the guarantee pension and housing supplement can only be drawn from the age of 65. The guarantee pension is part of the Swedish pension system, and is paid to people who have little or no income-based pension and who are 65 or older. Nearly 90 per cent of employees are also entitled to a pension based on a collective agreement.
The longer a person works, the greater the pension. Every year a person works in Sweden, they earn pension rights, which are allocated to the general state pension. Pension rights can be earned throughout life. Apart from occupational income, pension rights can also be earned when the person is taking care of young children, is studying, is doing national service, or has sickness or activity benefits. Pension rights for the premium pension can also be transferred to a husband, wife, or registered partner. The size of the retirement pension is also affected by the life expectancy of each cohort (year group).

165
Pensions
Table 9.1 Types of benefits for old-age pension recipients, 20151
Denmark Faroe Islands
Finland Iceland Norway Sweden
Basic pension/ guaranteed minimum pension
Citizenship and residence in the country
Citizenship and residence in the Realm of Denmark for at least 3 years
Citizenship and residence in the country
Citizenship and residence in the country
Citizenship and residence in the country
Citizenship and residence in the country
Length of residence required to obtain full basic pension
40 years 40 years 40 years 40 years 40 years 40 years
Employment pension/ earnings-related pension
Employees . Employees and self-employed people
Employees and self-employed people
Employees and self-employed people
Employees and self-employed people
Supplementary pensions
Statutory for public-sector employees/ civil servants
Statutory for public-sector employees/ civil servants
- - Statutory for public-sector employees/ civil servants
-
Public collective agreements
Public collective agreements
- - Public collective agreements
Public collective agreements
Private collective agreements
Private collective agreements
- - Statutory for employees in the private sector
Private collective agreements
Source: NOSOSCO – Social Protection in the Nordic Countries 2016
1 As a result of an amendment to the rules in the EEA Agreement, the rules governing entitlement to basic pension in the Nordic countries are now largely standardised. One of the main rules states that individuals must have been resident for a period of time in the country in question during their working life. According to EEA regulations, citizenship must be equalised with other EU member-states – except for the Faroe Islands, where citizenship is equalised only in relation to the other Nordic Countries
Recipients of:

166
Pensions

167
Conclusions and recommendations
Conclusions and recommendations
Many elderly people manage very well, and better than they did several decades ago. Many of them live a long life with good health after becoming a pensioner. Mortality from cardiovascular diseases has decreased markedly in all the Nordic countries. Average life expectancy has increased for both men and women, and will continue to increase in the Nordic countries. The proportion of people aged over 80 will increase in the future, and will make different demands on treatment and care services.
Pharmaceutical treatment As people age and health deteriorates, pharmaceutical treatment increases. More and concomitant pharmaceuticals are prescribed. At the same time, sensitivity to medication increases. There is every reason, also in a Nordic perspective, to turn the focus on pharmaceutical treatment of elderly people to ensure it is as well-considered and safe as possible. This applies not least to prescription of psychotropics.
We propose therefore that collaboration be initiated on pharmaceutical statistics within the framework of NOMESKO to enable quality-promoting comparisons between the Nordic countries on the matter of pharmaceutical treatment of elderly people.
Pharmaceutical treatment is one of several factors behind falls being the most common cause of injury among elderly people. A fall accident often results in a hip fracture which, apart from the suffering and increased mortality risk for the individual, entails large costs for society in compensating permanent disability.
The quality of care For hospital care, we have selected some well-established indicators that measure the quality of care of patients with cardiovascular disorders and an indicator that reflects quality in the care of patients with hip fractures.
We have also chosen to focus on prescriptions of antibiotics, quality in the care of elderly people with severe mental health disorders, and quality in the care of cancer patients by using indicators that show cancer survival.
This is the first time NOMESKO has reported data of this type, and the results show both differences and similarities between the Nordic countries.
To improve understanding of the differences and of how greater equality can be attained in Nordic health care, we propose continued work within the NOMESKO framework to present and analyse quality indicators, both in terms of care of elderly people and of the general population.

168
Conclusions and recommendations

169
Literature
Literature
1. Health of the elderly, NOMESCO 2008
2. Folkhälsorapport 2009, Socialstyrelsen
3. Old dependency ratio (map), Nordregio
4. The future Nordic health co-operation, Bo Könberg, Nordic Council of Ministers report 2014
5. Health at a Glance 2015, OECD
6. 80+ living IN SCANDINAVIA, Nordiska välfärdscentret 2013
7. World Alzheimer Report 2015
8. Swedish Gene Technology Advisory Board, Åldrandets genetik, 2006

170
Literature
NOMESCO’s Publications since 2000
Recurring Publications
Each year, NOMESCO publishes Health Statistics in the Nordic Countries. Up until and including 2011, this was a bi-lingual publication in Danish (Nordic languages) and English.
In cooperation with the Nordic Centre for Classification of Health Services (Nordclass), NOMESCO publishes NOMESCO Classification of Surgical Procedures. The publication was updated annually until 2011 the most recent version is 1.16.
In cooperation with the Baltic countries, the publication Nordic/Baltic Health Statistics has been published four times, the latest version with data from 2006.
Moreover, a number of theme publications have been published. These are shown below with their number in NOMESCO's publication list. 107. Statistics on Patient Mobility in the Nordic Countries, 2017
106. Health and health care of the elderly in the Nordic Countries - From a statistical perspective, 2017
105. Social Inequality in Mortality in the Nordic Countries – The inpact of smoking and alcohol, 2017
99. Financing of Health Care in the Nordic Countries, 2013
92. NOMESCO Report on Mortality Statistics – Theme section 2010, NOMESCO, Copenhagen 2010
90. Temasektion vedrørende kvalitetsindikatorer, NOMESCO’s Health Statistics in the Nordic Countries 2009, NOMESCO, Copenhagen 2010
88. Medicines Consumption in the Nordic Countries 2004-2008. NOMESCO, Copenhagen 2010
82. Ældres Helse, Temasektion, Health Statistics in the Nordic Countries 2006
80. Mental Helse, Temasektion, Health Statistics in the Nordic Countries 2005
79. NOMESCO Classification of External Causes of Injuries. Fourth revised edition. NOMESCO, Copenhagen 2007
78. Sustainable Social and Health Development in the Nordic Countries. Seminar, 6th April 2006, Oslo. Seminar Report. NOMESCO, Copenhagen 2006
76. Smedby, Björn and Schiøler Gunner: Health Classifications in the Nordic Countries. Historic development in a national and international perspective 2006. NOMESCO, Copenhagen 2006
72. Medicines Consumption in the Nordic Countries 1999-2003. NOMESKO, Copenhagen 2004
Related Documents