Health and community services labour force, 2001 later edition available

Welcome message from author
This document is posted to help you gain knowledge. Please leave a comment to let me know what you think about it! Share it to your friends and learn new things together.
Transcript

Health and community serviceslabour force, 2001
later
editio
n
avail
able

The Australian Institute of Health and Welfare is an independent health and welfare statisticsand information agency. The Institute’s mission is to inform community discussion anddecision making through national leadership in the development and provision ofauthoritative and timely information on the health and welfare of Australians.
The Australian Bureau of Statistics is Australia’s official statistics organisation. Its mission isto assist and encourage informed decision-making, research and discussion withingovernments and the community, by providing a high-quality, objective and responsivenational statistical service.
later
editio
n
avail
able

NATIONAL HEALTH LABOUR FORCE SERIES
Number 27
Health and communityservices labour force
2001
Australian Institute of Health and WelfareCanberra
AIHW Cat. no. HWL 27
ABS Cat. no. 8936.0
later
editio
n Health and community
editio
n Health and communityservices labour force
editio
n services labour force
editio
n
2001editio
n
2001
avail
ableservices labour force
avail
ableservices labour force
2001
avail
able2001
© Australian Institute of Health and Welfare 2003
This work is copyright. Apart from any use as permitted under the Copyright Act 1968, nopart may be reproduced without written permission from the Australian Institute of Health andWelfare. Requests and enquiries concerning reproduction and rights should be directed tothe Head, Media and Publishing, Australian Institute of Health and Welfare, GPO Box 570,Canberra ACT 2601.
This publication is part of the Australian Institute of Health and Welfare’s National HealthLabour Force Series. It presents data from the 2001 Census of Population and Housing andthe 2002 Survey of Employee Earnings and Hours conducted by the Australian Bureau ofStatistics, and makes comparisons with data from earlier ABS censuses and surveys. Acomplete list of the Institute’s publications is available from the Media and Publishing Unit,Australian Institute of Health and Welfare, GPO Box 570, Canberra ACT 2601, or via theInstitute’s web site <http://www.aihw.gov.au>.
ISSN 1327–4309ISBN 1740243099
Suggested citationAustralian Institute of Health and Welfare 2003. Health and community services labour force2001. AIHW Cat. no. HWL 27 and ABS Cat. no. 8936.0. Canberra: AIHW (National HealthLabour Force Series no. 27).
Australian Institute of Health and Welfare Australian Bureau of StatisticsBoard Chair Australian StatisticianDr Sandra Hacker Dennis TrewinDirectorDr Richard Madden
Any enquiries about or comments on this publication should be directed to:
Labour Force and Rural Health UnitAustralian Institute of Health and WelfareGPO Box 570Canberra ACT 2601Phone: (02) 6244 1156Email: [email protected]
Published by Australian Institute of Health and Welfare
Printed by Elect Printing
later
2001. AIHW Cat. no. HWL 27 and ABS Cat. no. 8936.0. Canberra: AIHW (National Health
later
2001. AIHW Cat. no. HWL 27 and ABS Cat. no. 8936.0. Canberra: AIHW (National Health
Australian Institute of Health and Welfare Australian Bureau of Statistics
later Australian Institute of Health and Welfare Australian Bureau of Statistics
later Board Chair Australian Statistician
later Board Chair Australian Statistician
Dr Sandra Hacker Dennis Trewinlater
Dr Sandra Hacker Dennis Trewin
editio
n Australian Institute of Health and Welfare, GPO Box 570, Canberra ACT 2601, or via the
editio
n Australian Institute of Health and Welfare, GPO Box 570, Canberra ACT 2601, or via the
Australian Institute of Health and Welfare 2003. Health and community services labour forceeditio
n Australian Institute of Health and Welfare 2003. Health and community services labour force2001. AIHW Cat. no. HWL 27 and ABS Cat. no. 8936.0. Canberra: AIHW (National Healthed
ition
2001. AIHW Cat. no. HWL 27 and ABS Cat. no. 8936.0. Canberra: AIHW (National Health
avail
ableAustralian Institute of Health and Welfare 2003. Health and community services labour force
avail
ableAustralian Institute of Health and Welfare 2003. Health and community services labour force
2001. AIHW Cat. no. HWL 27 and ABS Cat. no. 8936.0. Canberra: AIHW (National Health
avail
able2001. AIHW Cat. no. HWL 27 and ABS Cat. no. 8936.0. Canberra: AIHW (National Health
Australian Institute of Health and Welfare Australian Bureau of Statistics
avail
able
Australian Institute of Health and Welfare Australian Bureau of Statistics
avail
able
Board Chair Australian Statistician
avail
able
Board Chair Australian StatisticianDr Sandra Hacker Dennis Trewin
avail
able
Dr Sandra Hacker Dennis Trewin
v
ContentsList of tables .......................................................................................................................................vii
List of figures ........................................................................................................................................x
Preface................................................................................................................................................... xi
Acknowledgments.............................................................................................................................xii
Abbreviations....................................................................................................................................xiii
Symbols and other usages ........................................................................................................ xiii
Main findings.................................................................................................................................... xiv
Introduction...........................................................................................................................................1
Health and community services industries and occupations..................................................1
Context....................................................................................................................................................4
Population.......................................................................................................................................4
Changes in the age profile ....................................................................................................4
Changes in geographical distribution.................................................................................5
Health and welfare services in the economy .............................................................................6
Expenditure on health services ............................................................................................7
Expenditure on welfare services..........................................................................................8
Industry changes............................................................................................................................9
Changes in occupational mix .............................................................................................10
Changes in income and hours worked .............................................................................11
Characteristics of health and community services workers.......................................................15
Sex ................................................................................................................................................15
Age ................................................................................................................................................16
Highest qualification in a health field.......................................................................................17
Indigenous health and community service workers ..............................................................18
Health occupations.............................................................................................................................19
Medical practitioners...................................................................................................................19
Medical imaging ..........................................................................................................................20
Dental workers.............................................................................................................................20
Nursing workers ..........................................................................................................................21
Pharmacists...................................................................................................................................22
Allied health workers..................................................................................................................22
later
Health and welfare services in the economy .............................................................................6
later
Health and welfare services in the economy .............................................................................6
Expenditure on health services ............................................................................................7
later
Expenditure on health services ............................................................................................7
later Expenditure on welfare services..........................................................................................8
later Expenditure on welfare services..........................................................................................8
Industry changes............................................................................................................................9
later Industry changes............................................................................................................................9
Changes in occupational mix .............................................................................................10later
Changes in occupational mix .............................................................................................10
Changes in income and hours worked .............................................................................11later
Changes in income and hours worked .............................................................................11
editio
n Introduction...........................................................................................................................................1
editio
n Introduction...........................................................................................................................................1
industries and occupations..................................................1
editio
n industries and occupations..................................................1
Context....................................................................................................................................................4
editio
n Context....................................................................................................................................................4
Population.......................................................................................................................................4
editio
n Population.......................................................................................................................................4
Changes in the age profile ....................................................................................................4
editio
n Changes in the age profile ....................................................................................................4
Changes in geographical distribution.................................................................................5
editio
n Changes in geographical distribution.................................................................................5
Health and welfare services in the economy .............................................................................6editio
n
Health and welfare services in the economy .............................................................................6
Expenditure on health services ............................................................................................7editio
n
Expenditure on health services ............................................................................................7
avail
able
Changes in the age profile ....................................................................................................4
avail
able
Changes in the age profile ....................................................................................................4
Changes in geographical distribution.................................................................................5
avail
ableChanges in geographical distribution.................................................................................5
Health and welfare services in the economy .............................................................................6
avail
ableHealth and welfare services in the economy .............................................................................6
Expenditure on health services ............................................................................................7
avail
able
Expenditure on health services ............................................................................................7
avail
able
Expenditure on welfare services..........................................................................................8
avail
able
Expenditure on welfare services..........................................................................................8
Industry changes............................................................................................................................9
avail
able
Industry changes............................................................................................................................9
Changes in occupational mix .............................................................................................10
avail
able
Changes in occupational mix .............................................................................................10
Changes in income and hours worked .............................................................................11avail
able
Changes in income and hours worked .............................................................................11avail
able
Characteristics of health and community services workers.......................................................15avail
able
Characteristics of health and community services workers.......................................................15
vi
Complementary therapies workers...........................................................................................23
Other health workers ..................................................................................................................23
Community services occupations....................................................................................................25
Child and youth services workers.............................................................................................25
Family services workers .............................................................................................................26
Disability services workers.........................................................................................................26
Aged or disabled care workers ..................................................................................................26
Other community services workers ..........................................................................................27
Geographic regions ............................................................................................................................28
Industry by remoteness areas ....................................................................................................28
Occupation by state/territory and region................................................................................30
New South Wales.................................................................................................................32
Victoria ..................................................................................................................................34
Queensland ...........................................................................................................................35
Western Australia ................................................................................................................37
South Australia.....................................................................................................................38
Tasmania ...............................................................................................................................39
Australian Capital Territory ...............................................................................................40
Northern Territory ...............................................................................................................41
Health and community services, occupations and industries tables........................................42
Explanatory notes .............................................................................................................................121
Counts .........................................................................................................................................121
Industry.......................................................................................................................................121
Occupation..................................................................................................................................122
Data on region............................................................................................................................129
Qualifications .............................................................................................................................130
References..........................................................................................................................................131
Related publications ........................................................................................................................133
National health labour force series..........................................................................................133
Other publications .....................................................................................................................134
Internet access ............................................................................................................................134
later
Tasmania .......................................................................................................................
later
Tasmania .......................................................................................................................
Australian Capital Territory ...............................................................................................40
later
Australian Capital Territory ...............................................................................................40
later Northern Territory .............................................................................................................
later Northern Territory .............................................................................................................
Health and community services, occupations and industries tables........................................42
later Health and community services, occupations and industries tables........................................42
Explanatory notes ..............................................................................................................later
Explanatory notes ..............................................................................................................
Counts .........................................................................................................................later
Counts .........................................................................................................................
editio
n Occupation by state/territory and region................................................................................30
editio
n Occupation by state/territory and region................................................................................30
New South Wales................................................................................................................
editio
n New South Wales................................................................................................................
Victoria .......................................................................................................................
editio
n Victoria .......................................................................................................................
Queensland .....................................................................................................................
editio
n Queensland .....................................................................................................................
Western Australia ..............................................................................................................
editio
n Western Australia ..............................................................................................................
South Australia................................................................................................................editio
n South Australia................................................................................................................
Tasmania .......................................................................................................................editio
n
Tasmania .......................................................................................................................
Australian Capital Territory ...............................................................................................40editio
n
Australian Capital Territory ...............................................................................................40
avail
able
Queensland .....................................................................................................................
avail
able
Queensland .....................................................................................................................
Western Australia ..............................................................................................................
avail
able
Western Australia ..............................................................................................................
South Australia................................................................................................................
avail
ableSouth Australia................................................................................................................
Tasmania .......................................................................................................................
avail
ableTasmania .......................................................................................................................
Australian Capital Territory ...............................................................................................40
avail
able
Australian Capital Territory ...............................................................................................40
avail
able
Northern Territory .............................................................................................................
avail
able
Northern Territory .............................................................................................................
Health and community services, occupations and industries tables........................................42
avail
able
Health and community services, occupations and industries tables........................................42
Explanatory notes ..............................................................................................................
avail
able
Explanatory notes ..............................................................................................................
Counts .........................................................................................................................avail
able
Counts .........................................................................................................................
Industry.......................................................................................................................avail
able
Industry.......................................................................................................................
vii
List of tablesTable 1: Age distribution, Australia, 1981, 1986, 1991, 1996, 2001 ............................................5
Table 2: Population geographical distribution, Australia, 1991, 1996, 2001 ............................6
Table 3: Health and government welfare expenditure as a proportion of GDP, Australiaand other selected OECD countries, 1991 to 2000 ........................................................7
Table 4: Total health and welfare services expenditure as a proportion of GDP, 1996–97to 2000–01...........................................................................................................................8
Table 5: Employed persons in health and community services industries, Australia,1996 and 2001.....................................................................................................................9
Table 6: Employed persons in health and community services industries: occupation,Australia, 1996 and 2001 ................................................................................................11
Table 7: Health and community services: selected adult non-managerial employees,weekly earnings, 1996 and 2002....................................................................................12
Table 8: Distribution of hours worked per week in health and community servicesoccupations, Australia, 1996 and 2001 .........................................................................13
Table 9: Persons employed in selected health & community services occupations,proportions male, part-time & earning over $1,000 per week, Australia, 2001 .....15
Table 10: Persons employed in nursing occupations: proportions male, part-time andearning over $1,000 per week, Australia, 2001 ...........................................................16
Table 11: Employed persons per 100,000 population: industry and remoteness, 2001 .........30
Table 12: Supply of selected health and community services workers per 100,000population, New South Wales, 2001 ............................................................................33
Table 13: Supply of selected health and community services workers per 100,000population, Victoria, 2001..............................................................................................34
Table 14: Supply of selected health and community services workers per 100,000population, Queensland, 2001.......................................................................................36
Table 15: Supply of selected health and community services workers per 100,000population, Western Australia, 2001............................................................................37
Table 16: Supply of selected health and community services workers per 100,000population, South Australia, 2001 ................................................................................38
Table 17: Supply of selected health and community services workers per 100,000population, Tasmania, 2001...........................................................................................39
Table 18: Supply of selected health and community services workers per 100,000population, Australian Capital Territory and Northern Territory, 2001 ................40
Table A.1: Total health expenditure, constant prices, Australia, by area of expenditure,1995–96 and 1999–00 ($ million) ...................................................................................43
Table A.2: Health expenditure as proportion of GDP: areas of expenditure, Australia,1995–96 to 1999–00..........................................................................................................44
later
Table 10: Persons employed in nursing occupations: proportions male, part-time and
later
Table 10: Persons employed in nursing occupations: proportions male, part-time andearning over $1,000 per week, Australia, 2001 ...........................................................16
later
earning over $1,000 per week, Australia, 2001 ...........................................................16
Table 11: Employed persons per 100,000 popu
later Table 11: Employed persons per 100,000 popu
Table 12: Supply of selected health and community services workers per 100,000
later Table 12: Supply of selected health and community services workers per 100,000
population, New South Wales, 2001 ............................................................................33later
population, New South Wales, 2001 ............................................................................33later
Table 13: Supply of selected health and community services workers per 100,000later
Table 13: Supply of selected health and community services workers per 100,000population, Victoria, 2001..............................................................................................34lat
er population, Victoria, 2001..............................................................................................34
editio
n community services in
editio
n community services in
Australia, 1996 and 2001 ................................................................................................11
editio
n Australia, 1996 and 2001 ................................................................................................11
selected adult non-managerial employees,
editio
n selected adult non-managerial employees,weekly earnings, 1996 and 2002....................................................................................12
editio
n weekly earnings, 1996 and 2002....................................................................................12
r week in health and community services
editio
n r week in health and community services
occupations, Australia, 1996 and 2001 .........................................................................13
editio
n occupations, Australia, 1996 and 2001 .........................................................................13
Table 9: Persons employed in selected
editio
n Table 9: Persons employed in selected health & community services occupations,
editio
n health & community services occupations,
proportions male, part-time & earning over $1,000 per week, Australia, 2001 .....15editio
n proportions male, part-time & earning over $1,000 per week, Australia, 2001 .....15
Table 10: Persons employed in nursing occupations: proportions male, part-time andeditio
n
Table 10: Persons employed in nursing occupations: proportions male, part-time andearning over $1,000 per week, Australia, 2001 ...........................................................16ed
ition
earning over $1,000 per week, Australia, 2001 ...........................................................16
avail
able
occupations, Australia, 1996 and 2001 .........................................................................13
avail
able
occupations, Australia, 1996 and 2001 .........................................................................13
health & community services occupations,
avail
ablehealth & community services occupations,
proportions male, part-time & earning over $1,000 per week, Australia, 2001 .....15
avail
ableproportions male, part-time & earning over $1,000 per week, Australia, 2001 .....15
Table 10: Persons employed in nursing occupations: proportions male, part-time and
avail
ableTable 10: Persons employed in nursing occupations: proportions male, part-time and
earning over $1,000 per week, Australia, 2001 ...........................................................16
avail
able
earning over $1,000 per week, Australia, 2001 ...........................................................16
Table 11: Employed persons per 100,000 popu
avail
able
Table 11: Employed persons per 100,000 population: industry and remoteness, 2001 .........30
avail
able
lation: industry and remoteness, 2001 .........30
Table 12: Supply of selected health and community services workers per 100,000
avail
able
Table 12: Supply of selected health and community services workers per 100,000population, New South Wales, 2001 ............................................................................33
avail
able
population, New South Wales, 2001 ............................................................................33
avail
able
Table 13: Supply of selected health and community services workers per 100,000avail
able
Table 13: Supply of selected health and community services workers per 100,000population, Victoria, 2001..............................................................................................34av
ailab
le
population, Victoria, 2001..............................................................................................34
Table 14: Supply of selected health and community services workers per 100,000avail
able
Table 14: Supply of selected health and community services workers per 100,000
viii
Table A.3: Hospital expenditure as proportion of GDP, Australia, 1995–96 to 2000–01 .........45
Table A.4: Persons employed in health industries: occupation, 2001 ........................................46
Table A.5: Persons employed in community services industries: occupation, 2001................48
Table A.6: Persons employed in selected health occupations: 1991, 1996, 2001 .......................50
Table A.7: Persons employed in health occupations: industry, 2001 .........................................51
Table A.8: Persons employed in community services occupations: industry ofemployment, 2001...........................................................................................................52
Table A.9: Persons with a highest qualification in a health field: age andemployment status, 2001 ...............................................................................................53
Table A.10: Persons employed in health occupations: sex, states and territories, 2001 ............55
Table A.11: Persons employed in community services occupations: sex, states andterritories, 2001 ................................................................................................................61
Table A.12: Persons employed in health occupations per 100,000 population: states andterritories, 2001 ................................................................................................................64
Table A.13: Persons employed in community services occupations per 100,000 population:states and territories, 2001 .............................................................................................66
Table A.14: Persons employed in health occupations: age and sex, 2001 ...................................67
Table A.15: Persons employed in community services occupations: age and sex, 2001 ...........73
Table A.16: Persons employed in selected health occupations: sex andhours worked, 2001 ........................................................................................................76
Table A.17: Persons employed in community services occupations: sex and hoursworked, 2001....................................................................................................................82
Table A.18: Persons employed in selected health occupations: Indigenous status, 2001..........85
Table A.19: Persons employed in community services occupations: Indigenous status,2001 ...................................................................................................................................87
Table A.20: Persons employed in health occupations, Australia, 1996 and 2001.......................88
Table A.21: Persons employed in community services occupations, Australia,1996 and 2001...................................................................................................................90
Table A.22: Persons employed in health occupations: income, 2001 ...........................................91
Table A.23: Persons employed in community services occupations: income, 2001...................93
Table A.24: Health and community services: adult non-managerial employees, weeklyearnings, 1996 and 2002 .................................................................................................94
Table A.25: Persons employed in health occupations: birthplace, 2001 ......................................96
Table A.26: Persons employed in health and community services occupations: year ofarrival in Australia, 2001..............................................................................................100
Table A.27: Employed persons per 100,000 population in health and community servicesindustries, remoteness area and state or territory, 2001..........................................101
Table A.28: Persons employed in health and community services industries: states andterritories, remoteness area of workplace, 2001 .......................................................102
later
Table A.16: Persons employed in selected health occupations: sex and
later
Table A.16: Persons employed in selected health occupations: sex andhours worked, 2001 ........................................................................................................76
later
hours worked, 2001 ........................................................................................................76
Table A.17: Persons employed in community
later Table A.17: Persons employed in community
worked, 2001...................................................................................................................
later worked, 2001...................................................................................................................
Table A.18: Persons employed in selected health occupations: Indigenous status, 2001..........85
later Table A.18: Persons employed in selected health occupations: Indigenous status, 2001..........85
Table A.19: Persons employed in community later
Table A.19: Persons employed in community later
2001 ...........................................................................................................................later
2001 ...........................................................................................................................
editio
n territories, 2001 ..............................................................................................................
editio
n territories, 2001 ..............................................................................................................
Table A.12: Persons employed in health occupations per 100,000 population: states and
editio
n Table A.12: Persons employed in health occupations per 100,000 population: states andterritories, 2001 ..............................................................................................................
editio
n territories, 2001 ..............................................................................................................
services occupations per 100,000 population:
editio
n services occupations per 100,000 population:states and territories, 2001 .............................................................................................66
editio
n states and territories, 2001 .............................................................................................66
occupations: age and sex, 2001 ...................................67
editio
n occupations: age and sex, 2001 ...................................67
Table A.15: Persons employed in community seeditio
n Table A.15: Persons employed in community services occupations: age and sex, 2001 ...........73ed
ition
rvices occupations: age and sex, 2001 ...........73
Table A.16: Persons employed in selected health occupations: sex andeditio
n
Table A.16: Persons employed in selected health occupations: sex andhours worked, 2001 ........................................................................................................76ed
ition
hours worked, 2001 ........................................................................................................76
avail
able
occupations: age and sex, 2001 ...................................67
avail
able
occupations: age and sex, 2001 ...................................67
rvices occupations: age and sex, 2001 ...........73
avail
ablervices occupations: age and sex, 2001 ...........73
Table A.16: Persons employed in selected health occupations: sex and
avail
ableTable A.16: Persons employed in selected health occupations: sex and
hours worked, 2001 ........................................................................................................76
avail
able
hours worked, 2001 ........................................................................................................76
services occupations: sex and hours
avail
able
services occupations: sex and hoursworked, 2001...................................................................................................................
avail
able
worked, 2001...................................................................................................................
Table A.18: Persons employed in selected health occupations: Indigenous status, 2001..........85
avail
able
Table A.18: Persons employed in selected health occupations: Indigenous status, 2001..........85
Table A.19: Persons employed in community
avail
able
Table A.19: Persons employed in community services occupations: Indigenous status,
avail
able
services occupations: Indigenous status,
avail
able
2001 ...........................................................................................................................avail
able
2001 ...........................................................................................................................
Table A.20: Persons employed in healthavail
able
Table A.20: Persons employed in health occupations, Australia, 1996 and 2001.......................88avail
able
occupations, Australia, 1996 and 2001.......................88
ix
Table A.29: Health and community services workers: capital city and other regions,Australia, 2001...............................................................................................................106
Table A.30: Persons employed in health occupations: statistical region of workplace,Australia, 2001...............................................................................................................107
Table A.31: Persons employed in community services occupations: statistical region ofworkplace, 2001.............................................................................................................110
Table A.32: Persons employed in health occupations per 100,000 population: statisticalregion of workplace, 2001............................................................................................113
Table A.33: Employed persons per 100,000 population: statistical region of workplaceand selected health occupation, 2001 .........................................................................116
Table A.34: Persons employed in community services occupations per 100,000population: statistical region of workplace and occupation, 2001.........................118
later
editio
n
avail
able

x
List of figuresFigure 1: Health and community services industries and occupations .......................................2
Figure 2: Nursing workers, 1996 and 2001 .....................................................................................21
Figure 3: Employed persons in health and community services industries per 100,000population by remoteness area, 2001 .............................................................................29
Figure 4: Employed persons in health and community services occupations per 100,000 population by state and territory, 2001 ..........................................................................31
later
editio
n
avail
able
xi
PrefaceThis publication, published jointly by the AIHW and the Australian Bureau of Statistics(ABS), is the second in an AIHW series that presents health and community servicesworkers’ data from the ABS Census of Population and Housing. It includes information onthe number, distribution and characteristics of employed persons in 105 occupationsidentified as providing health and community services in the 2001 census, and discussesgrowth and other changes in this workforce since the 1996 census. Also included in thisreport are data from the census showing all persons employed in the health and communityservices industries. In addition, data from the ABS Employee Earnings and Hours surveys ofMay 1996 and May 2002 are provided to give an indication of the remuneration of employeesin these industries.There is increasing debate about the capacity of existing and likely future health andcommunity services workforces to meet service requirements. The changing age structure ofthe population affects demand, and this has been increasingly recognised. However, thesupply side is also affected by population ageing and other demographic changes (due tochanges in retirement patterns, hours worked and student numbers), and this aspect hasattracted far less debate. Just as importantly, earnings levels also affect labour supply, andthese will rise if shortages emerge.Debate on these important issues demands a strong information base. While the AustralianInstitute of Health and Welfare (AIHW) provides good quality data on registrable healthoccupations (doctors, nurses, dentists, pharmacists and some allied health professions), onlythe five-yearly census can provide a comprehensive picture.The report will be of interest to state and territory governments, which are the majorsuppliers of health and community services and engage in workforce planning, and toprofessional associations and industrial organisations in monitoring membership and inrepresenting their members.We would like to acknowledge the assistance of the Australian Health Workforce AdvisoryCouncil (AHWAC) in providing funding for this project.The Institute and the ABS welcome comments from the readers of this publication. These,and requests for further information, can be emailed to [email protected].
Richard MaddenAustralian Institute of Health and WelfareDirectorSeptember 2003
Dennis TrewinAustralian Bureau of StatisticsAustralian StatisticianSeptember 2003
later
occupations (doctors, nurses, dentists, pharmacists and some allied health professions), only
later
occupations (doctors, nurses, dentists, pharmacists and some allied health professions), onlyovide a comprehensive picture.
later
ovide a comprehensive picture.The report will be of interest to state and territory governments, which are the major
later The report will be of interest to state and territory governments, which are the major
suppliers of health and community services
later suppliers of health and community services
later professional associations and industrial or
later professional associations and industrial or
representing their members.later
representing their members.We would like to acknowledge the assistance lat
er We would like to acknowledge the assistance Council (AHWAC) in providing funding for this project.lat
er Council (AHWAC) in providing funding for this project.
editio
n ty of existing and likely future health and
editio
n ty of existing and likely future health and
community services workforces to meet service requirements. The changing age structure of
editio
n community services workforces to meet service requirements. The changing age structure ofbeen increasingly recognised. However, the
editio
n been increasingly recognised. However, theageing and other demographic changes (due to
editio
n ageing and other demographic changes (due to and student numbers), and this aspect has
editio
n and student numbers), and this aspect has
attracted far less debate. Just as importantly,
editio
n attracted far less debate. Just as importantly, earnings levels also affect labour supply, and
editio
n earnings levels also affect labour supply, and
Debate on these important issues demands a
editio
n Debate on these important issues demands a strong information base
editio
n strong information base
Institute of Health and Welfare (AIHW) provideditio
n Institute of Health and Welfare (AIHW) provides good quality data on registrable healthed
ition
es good quality data on registrable healthoccupations (doctors, nurses, dentists, pharmacists and some allied health professions), onlyed
ition
occupations (doctors, nurses, dentists, pharmacists and some allied health professions), onlyovide a comprehensive picture.ed
ition
ovide a comprehensive picture.
avail
able
earnings levels also affect labour supply, and
avail
able
earnings levels also affect labour supply, and
strong information base
avail
ablestrong information base. While the Australian
avail
able. While the Australian
es good quality data on registrable health
avail
ablees good quality data on registrable health
occupations (doctors, nurses, dentists, pharmacists and some allied health professions), only
avail
ableoccupations (doctors, nurses, dentists, pharmacists and some allied health professions), only
ovide a comprehensive picture.
avail
able
ovide a comprehensive picture.The report will be of interest to state and territory governments, which are the major
avail
able
The report will be of interest to state and territory governments, which are the major
avail
able
suppliers of health and community services
avail
able
suppliers of health and community services
avail
able
and engage in workforce planning, and to
avail
able
and engage in workforce planning, and toprofessional associations and industrial or
avail
able
professional associations and industrial organisations in monitoring membership and in
avail
able
ganisations in monitoring membership and in
We would like to acknowledge the assistance
avail
able
We would like to acknowledge the assistance of the Australian Health Workforce Advisory
avail
able
of the Australian Health Workforce AdvisoryCouncil (AHWAC) in providing funding for this project.av
ailab
le
Council (AHWAC) in providing funding for this project.The Institute and the ABS welcome comments from the readers of this publication. These,av
ailab
le
The Institute and the ABS welcome comments from the readers of this publication. These,and requests for further information, cav
ailab
le
and requests for further information, c

xii
AcknowledgmentsThis publication was prepared by Glenice Taylor, Warwick Conn and Brad Waters of theLabour Force and Rural Health Unit of the Australian Institute of Health and Welfare.We thank Alan Mackay, Sally Goodspeed and Julie Evans of the Australian Bureau ofStatistics and Paul Gavel from the Australian Health Workforce Advisory Committee forproviding guidance and comment during the preparation of the material in this report. Wealso thank the Australian Health Workforce Advisory Committee for its financial supportand the Australian Bureau of Statistics for providing population census, Employee earningsand hours and Labour force survey data.
later
editio
n
avail
able
xiii
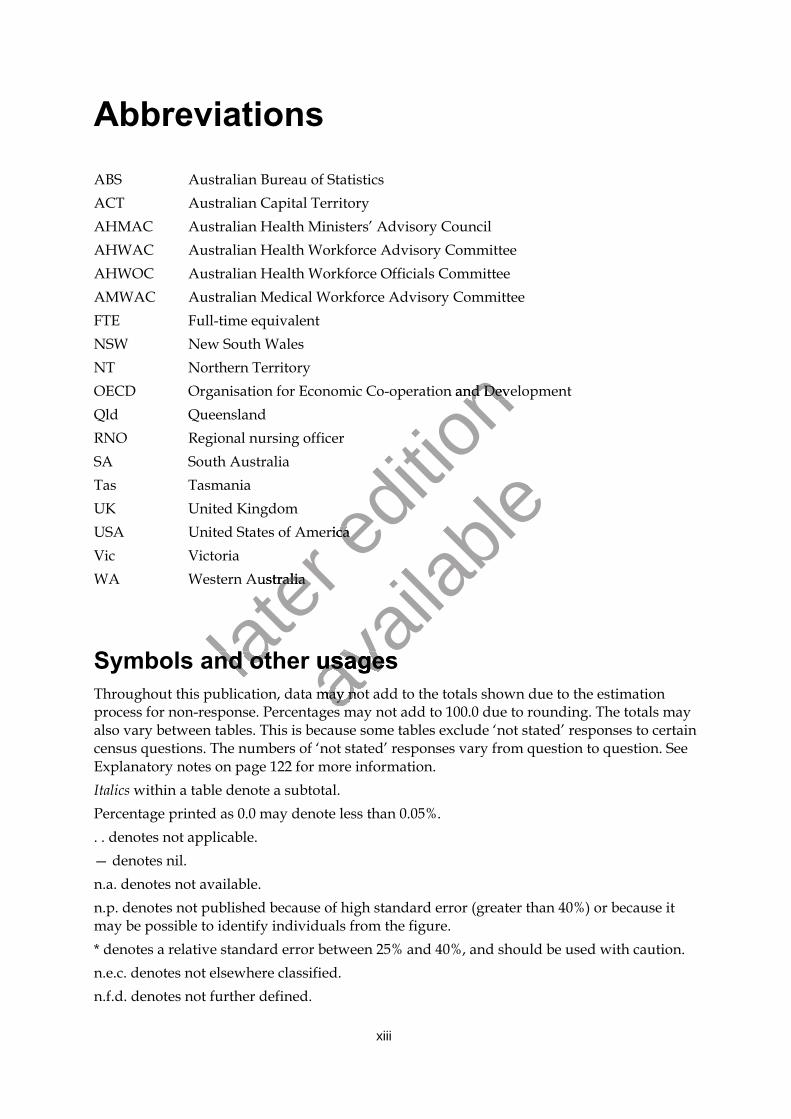
AbbreviationsABS Australian Bureau of StatisticsACT Australian Capital TerritoryAHMAC Australian Health Ministers’ Advisory CouncilAHWAC Australian Health Workforce Advisory CommitteeAHWOC Australian Health Workforce Officials CommitteeAMWAC Australian Medical Workforce Advisory CommitteeFTE Full-time equivalentNSW New South WalesNT Northern TerritoryOECD Organisation for Economic Co-operation and DevelopmentQld QueenslandRNO Regional nursing officerSA South AustraliaTas TasmaniaUK United KingdomUSA United States of AmericaVic VictoriaWA Western Australia
Symbols and other usagesThroughout this publication, data may not add to the totals shown due to the estimationprocess for non-response. Percentages may not add to 100.0 due to rounding. The totals mayalso vary between tables. This is because some tables exclude ‘not stated’ responses to certaincensus questions. The numbers of ‘not stated’ responses vary from question to question. SeeExplanatory notes on page 122 for more information.Italics within a table denote a subtotal.Percentage printed as 0.0 may denote less than 0.05%.. . denotes not applicable.— denotes nil.n.a. denotes not available.n.p. denotes not published because of high standard error (greater than 40%) or because itmay be possible to identify individuals from the figure.* denotes a relative standard error between 25% and 40%, and should be used with caution.n.e.c. denotes not elsewhere classified.n.f.d. denotes not further defined.
later WA Western Australia
later WA Western Australia
Symbols and other usageslater
Symbols and other usages
editio
n OECD Organisation for Economic Co-operation and Development
editio
n OECD Organisation for Economic Co-operation and Development
USA United States of America editio
n
USA United States of America
avail
able
Symbols and other usagesavail
able
Symbols and other usagesavail
able
Throughout this publication, data may not add to the totals shown due to the estimationavail
able
Throughout this publication, data may not add to the totals shown due to the estimationprocess for non-response. Percentages may not add to 100.0 due to rounding. The totals mayav
ailab
le
process for non-response. Percentages may not add to 100.0 due to rounding. The totals may
xiv
Main findingsIn 2001:� There were 450,792 people employed in health occupations and 237,055 employed in
community services occupations– this represented growth of 11.4% and 26.8%, respectively, since 1996.
� There were 798,295 people employed in health and community services industries, ofwhom over two-thirds (69%) worked in health or community services occupations– this represented growth of 10.6% since 1996.
� The largest occupational groups for health were nursing workers (244,405 employed) andmedical workers (51,859), and the largest for community services were child and youthservices (101,715 employed) and those employed in aged or disabled care (51,784).
� Between 1996 and 2001 there were increases of 12.6% in medical practitioner numbers,25.0% for medical imaging workers, 11.0% for dentists, 5.4% for nurses, 13.0% forpharmacists, 26.6% for allied health workers and 31.2% for complementary healththerapists; and increases of 9.0% for child and youth services workers and 44.1% forpersons employed in aged or disabled care.
� Workers in the health and community services occupations were predominantly female(74% and 87%, respectively). A relatively large proportion of all persons in theseoccupations worked part-time (34% and 51%, respectively).
� There were 3,742 Indigenous people employed in health occupations, comprising 0.9% ofhealth workers—well below the 2.4% Indigenous proportion of the population. Of theseworkers, 853 were employed as Indigenous health workers.
� There was a higher proportion of Indigenous workers in the community servicesoccupations, with the 6,294 Indigenous workers representing 2.7% of this group.
� Census data highlighted substantial restructuring within the health and communityservices industries by way of changes in occupational mix between 1996 and 2001:– there were large decreases in the number of workers in hospitals and nursing homes (down 10%), in line with changes in the delivery of care to aged persons and those with a disability or mental illness– there were decreases in hospitality and food preparation workers (down 9.3%), and tradespersons, plant operators, labourers and cleaners (down 19.2%), probably reflecting some outsourcing of food preparation, cleaning and maintenance services– there was an increase of 9,084 (6.0%) for registered nurses, but this was accompanied by a 4,946 (21.4%) decrease in enrolled nurses and a larger number of lower paid carers and aides (up by 8,488, or 20.3%).
� There were 2,354 health workers per 100,000 population overall in Australia, rangingfrom 2,150 per 100,000 in the Northern Territory to 2,614 per 100,000 in South Australia.
� There were 1,228 community services workers per 100,000 overall in Australia, rangingfrom 1,077 per 100,000 in New South Wales to 1,694 per 100,000 in the Australian CapitalTerritory.
� The supply of workers in the health industries decreased with increasing remoteness,from 3,005 per 100,000 population in the Major cities of Australia to 1,498 per 100,000 inVery remote Australia.
later
workers, 853 were employed as Indigenous health workers.
later
workers, 853 were employed as Indigenous health workers.There was a higher proportion of Indige
later There was a higher proportion of Indige
occupations, with the 6,294 Indigenous wo
later occupations, with the 6,294 Indigenous wo
later Census data highlighted substantial restructuring within the health and community
later Census data highlighted substantial restructuring within the health and community
services industries by way of changes later
services industries by way of changes – there were large decreases in the number lat
er – there were large decreases in the number (down 10%), in line with changes in the lat
er (down 10%), in line with changes in the
editio
n 25.0% for medical imaging workers, 11.0% for dentists, 5.4% for nurses, 13.0% for
editio
n 25.0% for medical imaging workers, 11.0% for dentists, 5.4% for nurses, 13.0% for
rkers and 31.2% for complementary health
editio
n rkers and 31.2% for complementary healththerapists; and increases of 9.0% for child and youth services workers and 44.1% for
editio
n therapists; and increases of 9.0% for child and youth services workers and 44.1% for
Workers in the health and community servic
editio
n Workers in the health and community services occupations were predominantly female
editio
n es occupations were predominantly female
(74% and 87%, respectively). A relatively
editio
n (74% and 87%, respectively). A relatively large proportion of all persons in these
editio
n large proportion of all persons in these
occupations worked part-time (34% and 51%, respectively).
editio
n occupations worked part-time (34% and 51%, respectively).There were 3,742 Indigenous people employed ed
ition
There were 3,742 Indigenous people employed health workers—well below the 2.4% Indigenoused
ition
health workers—well below the 2.4% Indigenousworkers, 853 were employed as Indigenous health workers.ed
ition
workers, 853 were employed as Indigenous health workers.
avail
able
large proportion of all persons in these
avail
able
large proportion of all persons in theseoccupations worked part-time (34% and 51%, respectively).
avail
able
occupations worked part-time (34% and 51%, respectively).in health occupations, comprising 0.9% of
avail
ablein health occupations, comprising 0.9% of
proportion of the population. Of these
avail
able proportion of the population. Of these
workers, 853 were employed as Indigenous health workers.
avail
ableworkers, 853 were employed as Indigenous health workers.
nous workers in the community services
avail
able
nous workers in the community servicesoccupations, with the 6,294 Indigenous wo
avail
able
occupations, with the 6,294 Indigenous wo
avail
able
rkers representing 2.7% of this group.
avail
able
rkers representing 2.7% of this group.Census data highlighted substantial restructuring within the health and community
avail
able
Census data highlighted substantial restructuring within the health and communityservices industries by way of changes
avail
able
services industries by way of changes in occupational mix between 1996 and 2001:
avail
able
in occupational mix between 1996 and 2001:– there were large decreases in the number
avail
able
– there were large decreases in the number of workers in hospitals and nursing homes
avail
able
of workers in hospitals and nursing homes (down 10%), in line with changes in the av
ailab
le
(down 10%), in line with changes in the delivery of care to aged persons and thoseavail
able
delivery of care to aged persons and those with a disability or mental illnessav
ailab
le
with a disability or mental illness– there were decreases in hospitality and food preparation workers (down 9.3%), andav
ailab
le
– there were decreases in hospitality and food preparation workers (down 9.3%), and

xv
� The supply of workers in the community services industries also decreased withincreasing remoteness, from 1,008 per 100,000 population in the Major cities of Australiato 796 per 100,000 in Very remote Australia.
� The central regions of the capital cities had the highest apparent supply of healthpractitioners, based on their place of work, probably reflecting the centralisation of majorhospital and specialist services in the inner city areas.
� Some of the rapidly growing regions on the outskirts of all five major capital cities hadthe lowest supply of health and community services professionals of any region withintheir respective states.
later
editio
n
avail
able

later
editio
n
avail
able
1
IntroductionThis report focuses on the health and community services workforce and is based on the 2001census. It makes some comparisons with the 1996 census data published by the AustralianInstitute of Health and Welfare (AIHW) in Health and Community Services Labour Force 1996.The five-yearly census is the most comprehensive data source on all of the occupations,although more detailed information on a number of the professions that require registrationis available from other data sources.The report will be of particular interest to those involved in health and community servicesworkforce planning. Many health and community services workforce planning issuesinvolve a specific occupation or a specialised subset of that occupation; this report provides awealth of detailed information on the numbers, and the demographic and workcharacteristics of health and community services workers. The real power of the census is itsability to provide population data as well as data on all occupations in relatively smallgeographic areas. This allows analysis of occupational growth and mix in the context ofchanges in population size and structure in rural and remote areas, which makes this reportof value to those who are interested in assessing patterns of provision of health and welfareworkers across Australia.This chapter provides an overview of the health and community services industries andoccupations, and illustrates the relationship between them.The following chapter provides contextual information relevant to interpreting changes inthe health and community services labour force that are occurring. The chapter starts bydescribing changes in the age profile and geographic distribution of the Australianpopulation. It then describes the role of health and welfare services in the economy, discusseschange in the numbers of employed people and in the occupational mix within the relevantindustries, and provides data on changes in income and hours worked.The main body of the report has chapters that describe the health and community servicesworkforce in detail: the characteristics of health and community services workers;information about each of the specific occupations; and finally the geographic distribution ofthe workers in those occupations.
Health and community services industries andoccupationsThe main focus of this report is on health and community services occupations, based on theAustralian Standard Classification of Occupations (ASCO) (see Explanatory notes). ASCOclassifies occupations by skill levels—managerial, professional, associate professional,tradesperson etc. Related occupations that may be separated by skill level in the classificationare grouped under headings to facilitate analysis. For the health occupations, these includemedical workers, medical imaging workers, dental workers, nursing workers, pharmacistworkers, allied health workers, complementary therapies workers and miscellaneous healthworkers. For the community services occupations, the groupings are child and youthservices, family services workers, disability workers, aged and disabled care workers andother community services workers. As an example, the occupations of director of nursing,registered nurse, enrolled nurse and nursing assistant are grouped under the heading
later
the health and community services labour forc
later
the health and community services labour forcdescribing changes in the age profile and
later
describing changes in the age profile and population. It then describes the role of health and welfare services in the economy, discusses
later population. It then describes the role of health and welfare services in the economy, discusses
change in the numbers of employed people and in the occupational mix within the relevant
later change in the numbers of employed people and in the occupational mix within the relevant
industries, and provides data on changes in income and hours worked.
later industries, and provides data on changes in income and hours worked.
later
The main body of the report has chapters thatlater
The main body of the report has chapters thatworkforce in detail: the characteristics oflat
er workforce in detail: the characteristics ofinformation about each of the specific occupations; and finally the geographic distribution oflat
er information about each of the specific occupations; and finally the geographic distribution of
editio
n mmunity services workers. The real power of the census is its
editio
n mmunity services workers. The real power of the census is its
data on all occupation
editio
n data on all occupationoccupational growth and mix in the context of
editio
n occupational growth and mix in the context ofral and remote areas, which makes this report
editio
n ral and remote areas, which makes this reportof value to those who are interested in assessing patterns of provision of health and welfare
editio
n of value to those who are interested in assessing patterns of provision of health and welfare
This chapter provides an overview of the health and community services industries and
editio
n This chapter provides an overview of the health and community services industries and
e relationship between them.
editio
n e relationship between them.
The following chapter provides contextual infoeditio
n The following chapter provides contextual information relevant to interpreting changes ined
ition
rmation relevant to interpreting changes inthe health and community services labour forced
ition
the health and community services labour forcdescribing changes in the age profile and ed
ition
describing changes in the age profile and geographic distribution of the Australianeditio
n
geographic distribution of the Australian
avail
able
This chapter provides an overview of the health and community services industries and
avail
able
This chapter provides an overview of the health and community services industries ande relationship between them.
avail
ablee relationship between them.
rmation relevant to interpreting changes in
avail
ablermation relevant to interpreting changes in
e that are occurring. The chapter starts by
avail
ablee that are occurring. The chapter starts by
geographic distribution of the Australian
avail
able
geographic distribution of the Australianpopulation. It then describes the role of health and welfare services in the economy, discusses
avail
able
population. It then describes the role of health and welfare services in the economy, discusseschange in the numbers of employed people and in the occupational mix within the relevant
avail
able
change in the numbers of employed people and in the occupational mix within the relevantindustries, and provides data on changes in income and hours worked.
avail
able
industries, and provides data on changes in income and hours worked.
avail
able
The main body of the report has chapters that
avail
able
The main body of the report has chapters that describe the health and community services
avail
able
describe the health and community servicesworkforce in detail: the characteristics of
avail
able
workforce in detail: the characteristics of health and community services workers;
avail
able
health and community services workers;workforce in detail: the characteristics of health and community services workers;workforce in detail: the characteristics of
avail
able
workforce in detail: the characteristics of health and community services workers;workforce in detail: the characteristics of
avail
able
information about each of the specific occupations; and finally the geographic distribution ofavail
able
information about each of the specific occupations; and finally the geographic distribution of
2
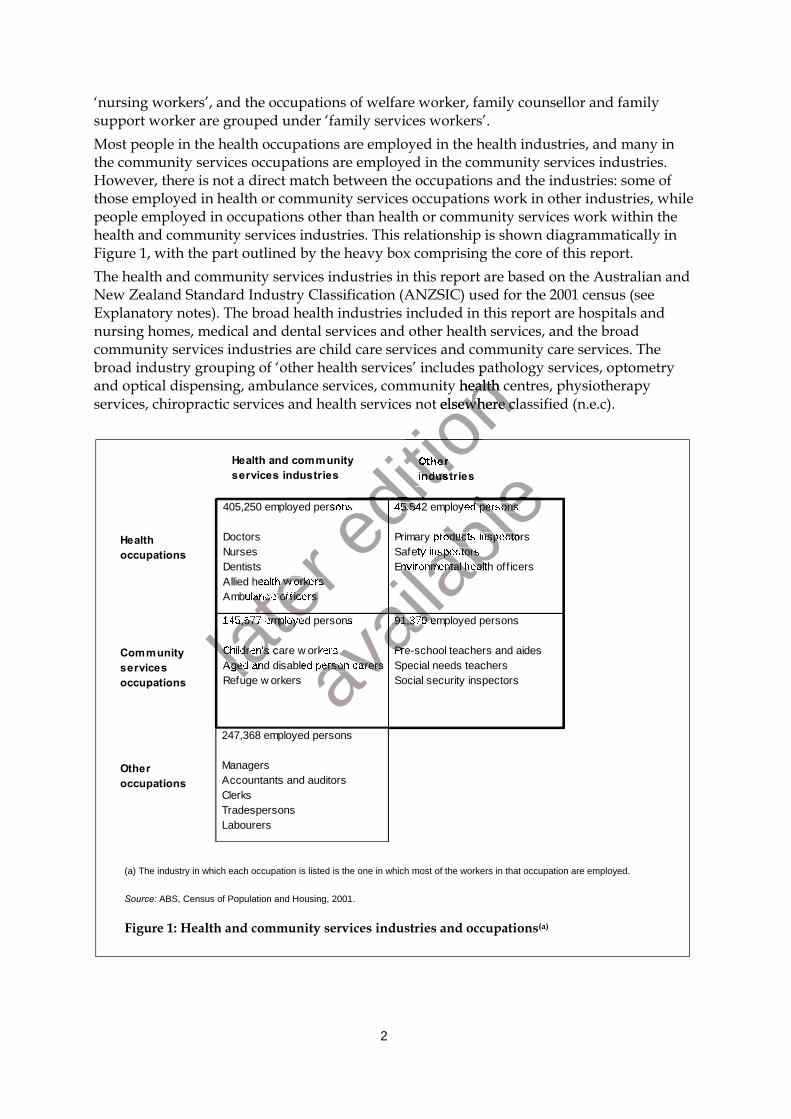
‘nursing workers’, and the occupations of welfare worker, family counsellor and familysupport worker are grouped under ‘family services workers’.Most people in the health occupations are employed in the health industries, and many inthe community services occupations are employed in the community services industries.However, there is not a direct match between the occupations and the industries: some ofthose employed in health or community services occupations work in other industries, whilepeople employed in occupations other than health or community services work within thehealth and community services industries. This relationship is shown diagrammatically inFigure 1, with the part outlined by the heavy box comprising the core of this report.The health and community services industries in this report are based on the Australian andNew Zealand Standard Industry Classification (ANZSIC) used for the 2001 census (seeExplanatory notes). The broad health industries included in this report are hospitals andnursing homes, medical and dental services and other health services, and the broadcommunity services industries are child care services and community care services. Thebroad industry grouping of ‘other health services’ includes pathology services, optometryand optical dispensing, ambulance services, community health centres, physiotherapyservices, chiropractic services and health services not elsewhere classified (n.e.c).
247,368 employed persons
Managers Accountants and auditors Clerks Tradespersons Labourers
405,250 employed persons
Doctors Nurses Dentists Allied health w orkers Ambulance off icers
45,542 employed persons
Primary products inspectors Safety inspectors Environmental health off icers
145,677 employed persons
Children's care w orkers Aged and disabled person carers Refuge w orkers
91,379 employed persons
Pre-school teachers and aides Special needs teachers Social security inspectors
Health occupations
Health and community services industries
Other industries
Community services occupations
Other occupations
(a) The industry in which each occupation is listed is the one in which most of the workers in that occupation are employed.
Source: ABS, Census of Population and Housing, 2001.
Figure 1: Health and community services industries and occupations(a)
later
later Allied health w orkers
later Allied health w orkers
Ambulance off icers
later Ambulance off icers
later
later
later
later
later
later
later 145,677 employed persons
later 145,677 employed persons
Children's care w orkerslater
Children's care w orkers Aged and disabled person carerslat
er Aged and disabled person carers Refuge w orkerslat
er Refuge w orkers
editio
n
editio
n rvices’ includes pathology services, optometry
editio
n rvices’ includes pathology services, optometrycommunity health centres, physiotherapy
editio
n community health centres, physiotherapyservices not elsewhere classified (n.e.c).
editio
n services not elsewhere classified (n.e.c).
editio
n
editio
n
editio
n 405,250 employed persons
editio
n 405,250 employed persons
editio
n
editio
n 45,542 employed persons
editio
n 45,542 employed persons
editio
n
editio
n Other
editio
n Other industries
editio
n industries
avail
able
avail
able
avail
able
avail
able
avail
able
avail
able 45,542 employed persons
avail
able 45,542 employed persons
Primary products inspectors
avail
able Primary products inspectors
Safety inspectors
avail
able
Safety inspectors Environmental health off icers
avail
able
Environmental health off icers
avail
able
avail
able
avail
able
145,677 employed persons
avail
able
145,677 employed persons
Children's care w orkers
avail
able
Children's care w orkers Aged and disabled person carersav
ailab
le
Aged and disabled person carersavail
able
avail
able
91,379 employed persons
avail
able
91,379 employed persons
Pre-school teachers and aides
avail
able
Pre-school teachers and aides
3
The health and community services industries comprise the fourth largest employingindustry division in the Australian economy, providing employment for almost 800,000people, or 9.7% of employed persons, and a growth of 10.6% since 1996. Because of their size,these industries can also have an impact on the wellbeing of communities. A recentDepartment of Family and Community Services occasional paper identified social physicalinfrastructure such as hospitals and schools, and social ‘soft’ infrastructure such as medicaland allied health professionals, teachers and institutions delivering community and welfareservices as factors enhancing community wellbeing (FACS 2001).Over two thirds (69%) of the 798,295 people employed in the health and community servicesindustries were employed in health (405,250) and community services (145,677) occupations,a growth of 11.4% and 26.8%, respectively, since 1996.
Over 80% of those in health occupations were employed in the health industry, and 2.3%were in government administration and defence (Table A.7). Industrial and retailpharmacists are essential to health care but are employed in the manufacturing and retailindustries. Most of the persons in occupations with a public health function (primaryproduct inspectors, safety inspectors, environmental health officers and occupational healthand safety officers) were employed in government administration or manufacturing orpersonal service industries. The makers of medical aids and appliances (dental technicians,biomedical engineers and orthotists) were mainly employed in manufacturing industries. Allof the health occupations discussed in this report have some persons employed ingovernment administration.The community services industry employed over 47% of those in community servicesoccupations, and 9.1% were in government administration. The pre-primary and specialneeds teachers were mainly employed in the education industry, which employed 22.8% ofthose in community services occupations.In this and the following chapters, the numbers of people working in the health andcommunity services occupations and industries refer to raw counts only. There has been noadjustment for the average number of hours worked, as this can not be calculated fromcensus data. As a result it is not possible to provide full-time equivalent numbers.lat
er needs teachers were mainly employed in the education industry, which employed 22.8% of
later
needs teachers were mainly employed in the education industry, which employed 22.8% ofthose in community services occupations.
later
those in community services occupations.In this and the following chapters, the nu
later In this and the following chapters, the nu
community services occupations
later community services occupations
later and industries refer to raw counts only. There has been no
later and industries refer to raw counts only. There has been no
adjustment for the average number of hours
later adjustment for the average number of hours
census data. As a result it is not possiblater
census data. As a result it is not possib
editio
n ons with a public heal
editio
n ons with a public heal
ental health officers and occupational health
editio
n ental health officers and occupational healthand safety officers) were employed in government administration or manufacturing or
editio
n and safety officers) were employed in government administration or manufacturing orpersonal service industries. The makers of medical aids and appliances (dental technicians,
editio
n personal service industries. The makers of medical aids and appliances (dental technicians,biomedical engineers and orthotists) were main
editio
n biomedical engineers and orthotists) were mainly employed in manufacturing industries. All
editio
n ly employed in manufacturing industries. All
is report have some persons employed in
editio
n is report have some persons employed in
The community services industry employed
editio
n The community services industry employed over 47% of those in community services
editio
n over 47% of those in community services
occupations, and 9.1% were in government editio
n occupations, and 9.1% were in government administration. The pre-primary and specialed
ition
administration. The pre-primary and specialneeds teachers were mainly employed in the education industry, which employed 22.8% ofed
ition
needs teachers were mainly employed in the education industry, which employed 22.8% ofthose in community services occupations.ed
ition
those in community services occupations.
avail
able
is report have some persons employed in
avail
able
is report have some persons employed in
over 47% of those in community services
avail
ableover 47% of those in community services
administration. The pre-primary and special
avail
ableadministration. The pre-primary and special
needs teachers were mainly employed in the education industry, which employed 22.8% of
avail
ableneeds teachers were mainly employed in the education industry, which employed 22.8% of
mbers of people working in the health and
avail
able
mbers of people working in the health and
avail
able
and industries refer to raw counts only. There has been no
avail
able
and industries refer to raw counts only. There has been noadjustment for the average number of hours
avail
able
adjustment for the average number of hours worked, as this can not be calculated from
avail
able
worked, as this can not be calculated fromcensus data. As a result it is not possib
avail
able
census data. As a result it is not possible to provide full-time equivalent numbers.
avail
able
le to provide full-time equivalent numbers.
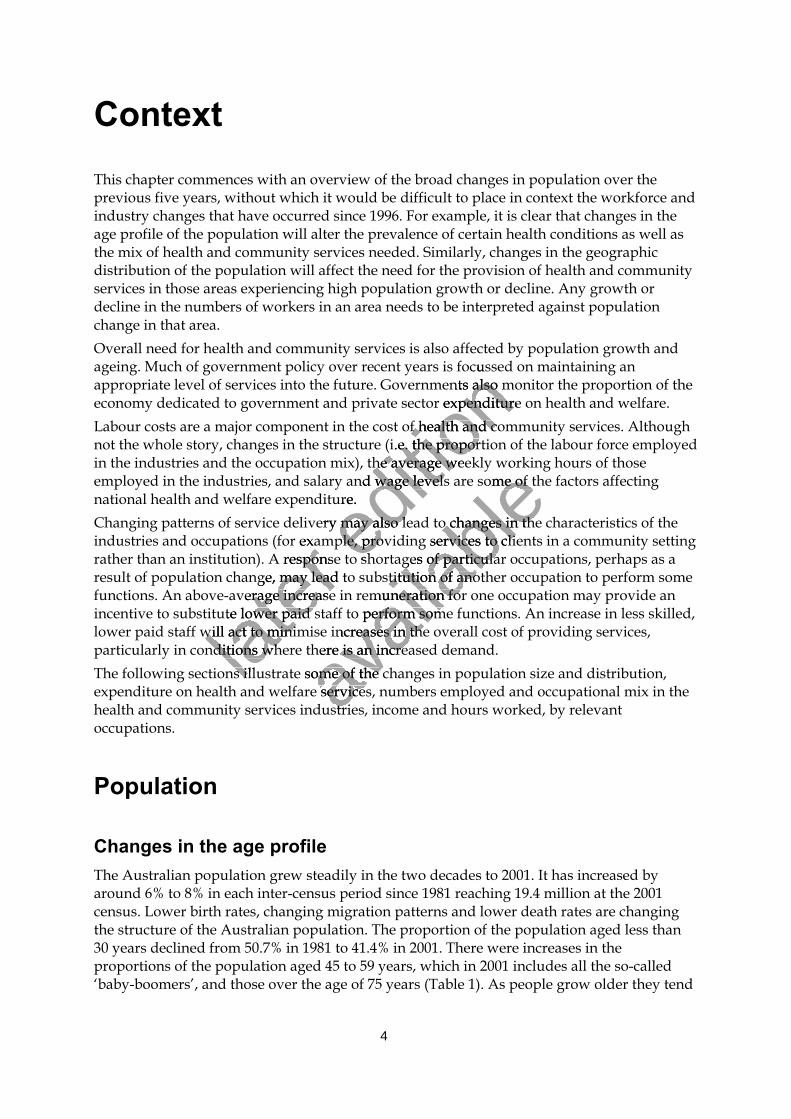
4
ContextThis chapter commences with an overview of the broad changes in population over theprevious five years, without which it would be difficult to place in context the workforce andindustry changes that have occurred since 1996. For example, it is clear that changes in theage profile of the population will alter the prevalence of certain health conditions as well asthe mix of health and community services needed. Similarly, changes in the geographicdistribution of the population will affect the need for the provision of health and communityservices in those areas experiencing high population growth or decline. Any growth ordecline in the numbers of workers in an area needs to be interpreted against populationchange in that area.Overall need for health and community services is also affected by population growth andageing. Much of government policy over recent years is focussed on maintaining anappropriate level of services into the future. Governments also monitor the proportion of theeconomy dedicated to government and private sector expenditure on health and welfare.Labour costs are a major component in the cost of health and community services. Althoughnot the whole story, changes in the structure (i.e. the proportion of the labour force employedin the industries and the occupation mix), the average weekly working hours of thoseemployed in the industries, and salary and wage levels are some of the factors affectingnational health and welfare expenditure.Changing patterns of service delivery may also lead to changes in the characteristics of theindustries and occupations (for example, providing services to clients in a community settingrather than an institution). A response to shortages of particular occupations, perhaps as aresult of population change, may lead to substitution of another occupation to perform somefunctions. An above-average increase in remuneration for one occupation may provide anincentive to substitute lower paid staff to perform some functions. An increase in less skilled,lower paid staff will act to minimise increases in the overall cost of providing services,particularly in conditions where there is an increased demand.The following sections illustrate some of the changes in population size and distribution,expenditure on health and welfare services, numbers employed and occupational mix in thehealth and community services industries, income and hours worked, by relevantoccupations.
Population
Changes in the age profileThe Australian population grew steadily in the two decades to 2001. It has increased byaround 6% to 8% in each inter-census period since 1981 reaching 19.4 million at the 2001census. Lower birth rates, changing migration patterns and lower death rates are changingthe structure of the Australian population. The proportion of the population aged less than30 years declined from 50.7% in 1981 to 41.4% in 2001. There were increases in theproportions of the population aged 45 to 59 years, which in 2001 includes all the so-called‘baby-boomers’, and those over the age of 75 years (Table 1). As people grow older they tend
later
industries and occupations (for example, provid
later
industries and occupations (for example, providrather than an institution). A response to shor
later
rather than an institution). A response to shorresult of population change, may lead to subs
later result of population change, may lead to subs
later functions. An above-average increase in re
later functions. An above-average increase in re
incentive to substitute lower paid staff to perf
later incentive to substitute lower paid staff to perf
lower paid staff will act to minimise increaselater
lower paid staff will act to minimise increaseparticularly in conditions where there is an increased demand.lat
er particularly in conditions where there is an increased demand.The following sections illustrate some of the lat
er The following sections illustrate some of the
editio
n cent years is focussed on maintaining an
editio
n cent years is focussed on maintaining anGovernments also monitor the proportion of the
editio
n Governments also monitor the proportion of thesector expenditure on health and welfare.
editio
n sector expenditure on health and welfare. of health and community services. Although
editio
n of health and community services. Althoughthe structure (i.e. the proportion
editio
n the structure (i.e. the proportion
in the industries and the occupation mix), the average weekly working hours of those
editio
n in the industries and the occupation mix), the average weekly working hours of thoseemployed in the industries, and salary and wage levels are some of the factors affecting
editio
n employed in the industries, and salary and wage levels are some of the factors affectingnational health and welfare expenditure.
editio
n national health and welfare expenditure.Changing patterns of service delivery may also leed
ition
Changing patterns of service delivery may also leindustries and occupations (for example, provided
ition
industries and occupations (for example, providrather than an institution). A response to shored
ition
rather than an institution). A response to shor
avail
able
in the industries and the occupation mix), the average weekly working hours of those
avail
able
in the industries and the occupation mix), the average weekly working hours of thoseemployed in the industries, and salary and wage levels are some of the factors affecting
avail
able
employed in the industries, and salary and wage levels are some of the factors affecting
ad to changes in the characteristics of the
avail
ablead to changes in the characteristics of the
ing services to clients in a community setting
avail
ableing services to clients in a community setting
tages of particular occu
avail
able
tages of particular occuresult of population change, may lead to subs
avail
able
result of population change, may lead to substitution of another occupation to perform some
avail
able
titution of another occupation to perform some
avail
able
muneration for one occupation may provide an
avail
able
muneration for one occupation may provide anincentive to substitute lower paid staff to perf
avail
able
incentive to substitute lower paid staff to perform some functions. An increase in less skilled,
avail
able
orm some functions. An increase in less skilled,lower paid staff will act to minimise increase
avail
able
lower paid staff will act to minimise increases in the overall cost of providing services,
avail
able
s in the overall cost of providing services,particularly in conditions where there is an increased demand.
avail
able
particularly in conditions where there is an increased demand.The following sections illustrate some of the av
ailab
le
The following sections illustrate some of the avail
able
changes in population size and distribution,avail
able
changes in population size and distribution,expenditure on health and welfare services, nuav
ailab
le
expenditure on health and welfare services, nuhealth and community services industriesav
ailab
le
health and community services industries
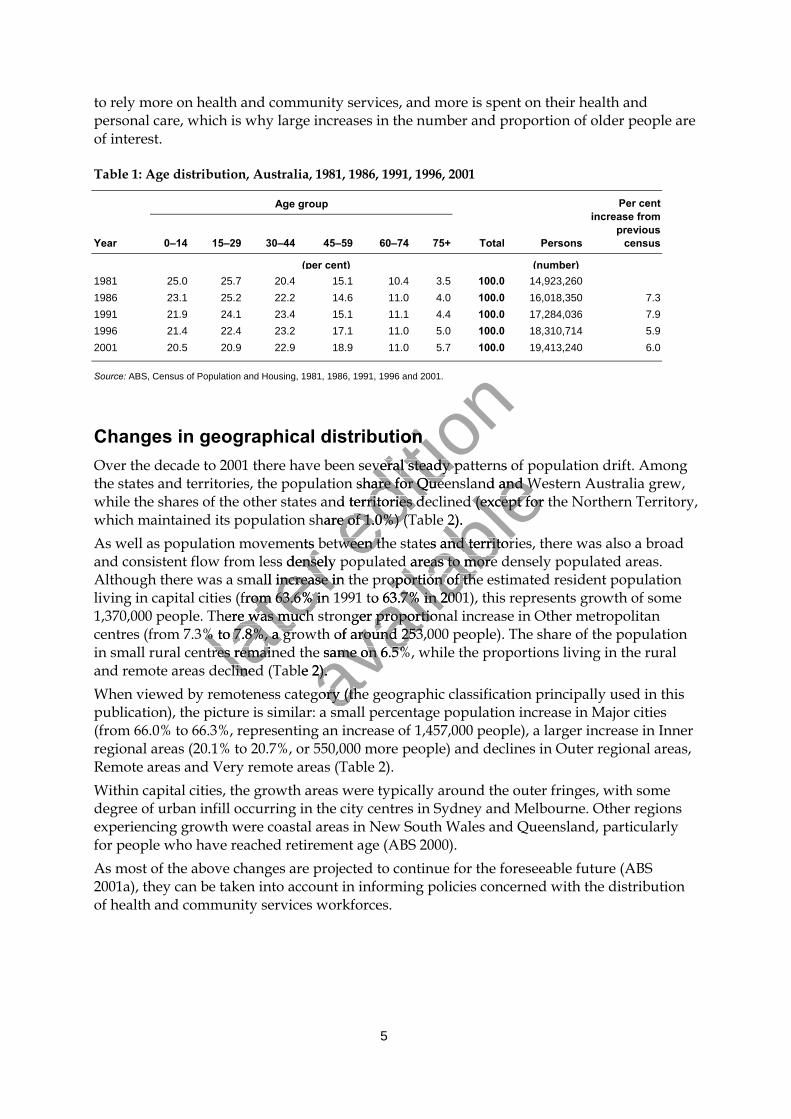
5
to rely more on health and community services, and more is spent on their health andpersonal care, which is why large increases in the number and proportion of older people areof interest.
Table 1: Age distribution, Australia, 1981, 1986, 1991, 1996, 2001
Age group
Year 0–14 15–29 30–44 45–59 60–74 75+ Total Persons
Per centincrease from
previouscensus
(per cent) (number)1981 25.0 25.7 20.4 15.1 10.4 3.5 100.0 14,923,2601986 23.1 25.2 22.2 14.6 11.0 4.0 100.0 16,018,350 7.31991 21.9 24.1 23.4 15.1 11.1 4.4 100.0 17,284,036 7.91996 21.4 22.4 23.2 17.1 11.0 5.0 100.0 18,310,714 5.92001 20.5 20.9 22.9 18.9 11.0 5.7 100.0 19,413,240 6.0
Source: ABS, Census of Population and Housing, 1981, 1986, 1991, 1996 and 2001.
Changes in geographical distributionOver the decade to 2001 there have been several steady patterns of population drift. Amongthe states and territories, the population share for Queensland and Western Australia grew,while the shares of the other states and territories declined (except for the Northern Territory,which maintained its population share of 1.0%) (Table 2).As well as population movements between the states and territories, there was also a broadand consistent flow from less densely populated areas to more densely populated areas.Although there was a small increase in the proportion of the estimated resident populationliving in capital cities (from 63.6% in 1991 to 63.7% in 2001), this represents growth of some1,370,000 people. There was much stronger proportional increase in Other metropolitancentres (from 7.3% to 7.8%, a growth of around 253,000 people). The share of the populationin small rural centres remained the same on 6.5%, while the proportions living in the ruraland remote areas declined (Table 2).When viewed by remoteness category (the geographic classification principally used in thispublication), the picture is similar: a small percentage population increase in Major cities(from 66.0% to 66.3%, representing an increase of 1,457,000 people), a larger increase in Innerregional areas (20.1% to 20.7%, or 550,000 more people) and declines in Outer regional areas,Remote areas and Very remote areas (Table 2).Within capital cities, the growth areas were typically around the outer fringes, with somedegree of urban infill occurring in the city centres in Sydney and Melbourne. Other regionsexperiencing growth were coastal areas in New South Wales and Queensland, particularlyfor people who have reached retirement age (ABS 2000).As most of the above changes are projected to continue for the foreseeable future (ABS2001a), they can be taken into account in informing policies concerned with the distributionof health and community services workforces.
later
As well as population movements between the states and territories, there was also a broad
later
As well as population movements between the states and territories, there was also a broadand consistent flow from less densely popula
later
and consistent flow from less densely populaAlthough there was a small increase in the prop
later Although there was a small increase in the prop
living in capital cities (from 63.6% in 1991 to 63.7% in 2001), this represents growth of some
later living in capital cities (from 63.6% in 1991 to 63.7% in 2001), this represents growth of some
1,370,000 people. There was much stronger pr
later 1,370,000 people. There was much stronger pr
later
centres (from 7.3% to 7.8%, a growth of aroundlater
centres (from 7.3% to 7.8%, a growth of aroundin small rural centres remained the same on 6.lat
er in small rural centres remained the same on 6.and remote areas declined (Table 2).lat
er and remote areas declined (Table 2).
editio
n Changes in geographical distribution
editio
n Changes in geographical distributionOver the decade to 2001 there have been severa
editio
n Over the decade to 2001 there have been several steady patterns of population drift. Among
editio
n l steady patterns of population drift. Among
the states and territories, the population s
editio
n the states and territories, the population share for Queensland and Western Australia grew,
editio
n hare for Queensland and Western Australia grew,
while the shares of the other states and territori
editio
n while the shares of the other states and territories declined (except for the Northern Territory,
editio
n es declined (except for the Northern Territory,
which maintained its population share of 1.0%) (Table 2).editio
n which maintained its population share of 1.0%) (Table 2).As well as population movements between the states and territories, there was also a broaded
ition
As well as population movements between the states and territories, there was also a broadand consistent flow from less densely populaed
ition
and consistent flow from less densely popula
avail
able
l steady patterns of population drift. Among
avail
able
l steady patterns of population drift. Amonghare for Queensland and Western Australia grew,
avail
able
hare for Queensland and Western Australia grew,es declined (except for the Northern Territory,
avail
ablees declined (except for the Northern Territory,
which maintained its population share of 1.0%) (Table 2).
avail
ablewhich maintained its population share of 1.0%) (Table 2).
As well as population movements between the states and territories, there was also a broad
avail
ableAs well as population movements between the states and territories, there was also a broad
ted areas to more densely populated areas.
avail
able
ted areas to more densely populated areas.Although there was a small increase in the prop
avail
able
Although there was a small increase in the proportion of the estimated resident population
avail
able
ortion of the estimated resident populationliving in capital cities (from 63.6% in 1991 to 63.7% in 2001), this represents growth of some
avail
able
living in capital cities (from 63.6% in 1991 to 63.7% in 2001), this represents growth of some1,370,000 people. There was much stronger pr
avail
able
1,370,000 people. There was much stronger proportional increase in Other metropolitan
avail
able
oportional increase in Other metropolitancentres (from 7.3% to 7.8%, a growth of around
avail
able
centres (from 7.3% to 7.8%, a growth of around 253,000 people). The share of the population
avail
able
253,000 people). The share of the populationin small rural centres remained the same on 6.
avail
able
in small rural centres remained the same on 6.5%, while the proportions living in the rural
avail
able
5%, while the proportions living in the rural
avail
able
and remote areas declined (Table 2). avail
able
and remote areas declined (Table 2).When viewed by remoteness category (the geogav
ailab
le
When viewed by remoteness category (the geogpublication), the picture is similar: a small peav
ailab
le
publication), the picture is similar: a small pe
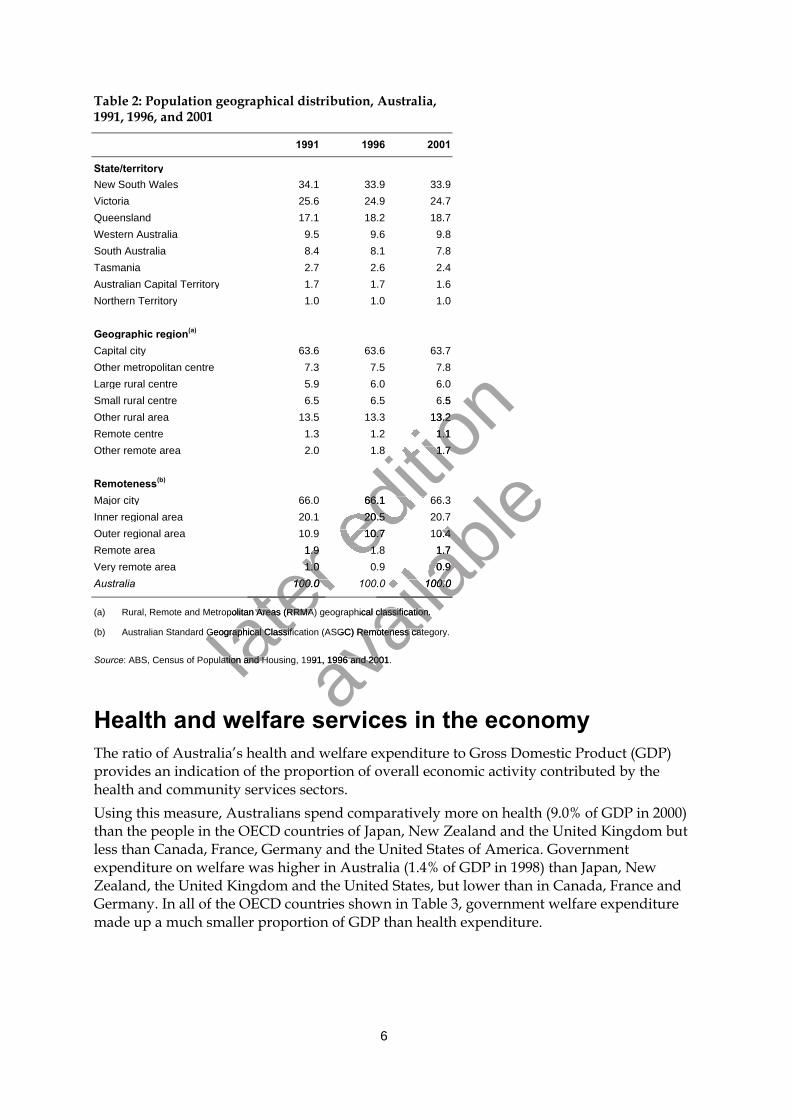
6
Table 2: Population geographical distribution, Australia,1991, 1996, and 2001
1991 1996 2001
State/territoryNew South Wales 34.1 33.9 33.9Victoria 25.6 24.9 24.7Queensland 17.1 18.2 18.7Western Australia 9.5 9.6 9.8South Australia 8.4 8.1 7.8Tasmania 2.7 2.6 2.4Australian Capital Territory 1.7 1.7 1.6Northern Territory 1.0 1.0 1.0
Geographic region(a)
Capital city 63.6 63.6 63.7Other metropolitan centre 7.3 7.5 7.8Large rural centre 5.9 6.0 6.0Small rural centre 6.5 6.5 6.5Other rural area 13.5 13.3 13.2Remote centre 1.3 1.2 1.1Other remote area 2.0 1.8 1.7
Remoteness(b)
Major city 66.0 66.1 66.3Inner regional area 20.1 20.5 20.7Outer regional area 10.9 10.7 10.4Remote area 1.9 1.8 1.7Very remote area 1.0 0.9 0.9Australia 100.0 100.0 100.0
(a) Rural, Remote and Metropolitan Areas (RRMA) geographical classification.
(b) Australian Standard Geographical Classification (ASGC) Remoteness category.
Source: ABS, Census of Population and Housing, 1991, 1996 and 2001.
Health and welfare services in the economyThe ratio of Australia’s health and welfare expenditure to Gross Domestic Product (GDP)provides an indication of the proportion of overall economic activity contributed by thehealth and community services sectors.Using this measure, Australians spend comparatively more on health (9.0% of GDP in 2000)than the people in the OECD countries of Japan, New Zealand and the United Kingdom butless than Canada, France, Germany and the United States of America. Governmentexpenditure on welfare was higher in Australia (1.4% of GDP in 1998) than Japan, NewZealand, the United Kingdom and the United States, but lower than in Canada, France andGermany. In all of the OECD countries shown in Table 3, government welfare expendituremade up a much smaller proportion of GDP than health expenditure.
later
1.9 1.8 1.7
later
1.9 1.8 1.7
later
1.0 0.9 0.9
later
1.0 0.9 0.9100.0 100.0 100.0
later 100.0 100.0 100.0
later (a) Rural, Remote and Metropolitan Areas (RRMA) geographical classification.
later (a) Rural, Remote and Metropolitan Areas (RRMA) geographical classification.
later
(b) Australian Standard Geographical Classification (ASGC) Remoteness category.later
(b) Australian Standard Geographical Classification (ASGC) Remoteness category.
: ABS, Census of Population and Housing, 1991, 1996 and 2001.later
: ABS, Census of Population and Housing, 1991, 1996 and 2001.
editio
n 6.5 6.5 6.5
editio
n 6.5 6.5 6.513.5 13.3 13.2
editio
n 13.5 13.3 13.21.3 1.2 1.1
editio
n 1.3 1.2 1.12.0 1.8 1.7
editio
n 2.0 1.8 1.7
66.0 66.1 66.3
editio
n 66.0 66.1 66.320.1 20.5 20.7ed
ition
20.1 20.5 20.710.9 10.7 10.4ed
ition
10.9 10.7 10.41.9 1.8 1.7ed
ition
1.9 1.8 1.7
avail
able10.9 10.7 10.4
avail
able10.9 10.7 10.4
1.9 1.8 1.7
avail
able
1.9 1.8 1.71.0 0.9 0.9
avail
able
1.0 0.9 0.9100.0 100.0 100.0
avail
able
100.0 100.0 100.0
avail
able
(a) Rural, Remote and Metropolitan Areas (RRMA) geographical classification.
avail
able
(a) Rural, Remote and Metropolitan Areas (RRMA) geographical classification.
avail
able
(b) Australian Standard Geographical Classification (ASGC) Remoteness category.
avail
able
(b) Australian Standard Geographical Classification (ASGC) Remoteness category.
: ABS, Census of Population and Housing, 1991, 1996 and 2001.avail
able
: ABS, Census of Population and Housing, 1991, 1996 and 2001.
Health and welfare services in the economyavail
able
Health and welfare services in the economy
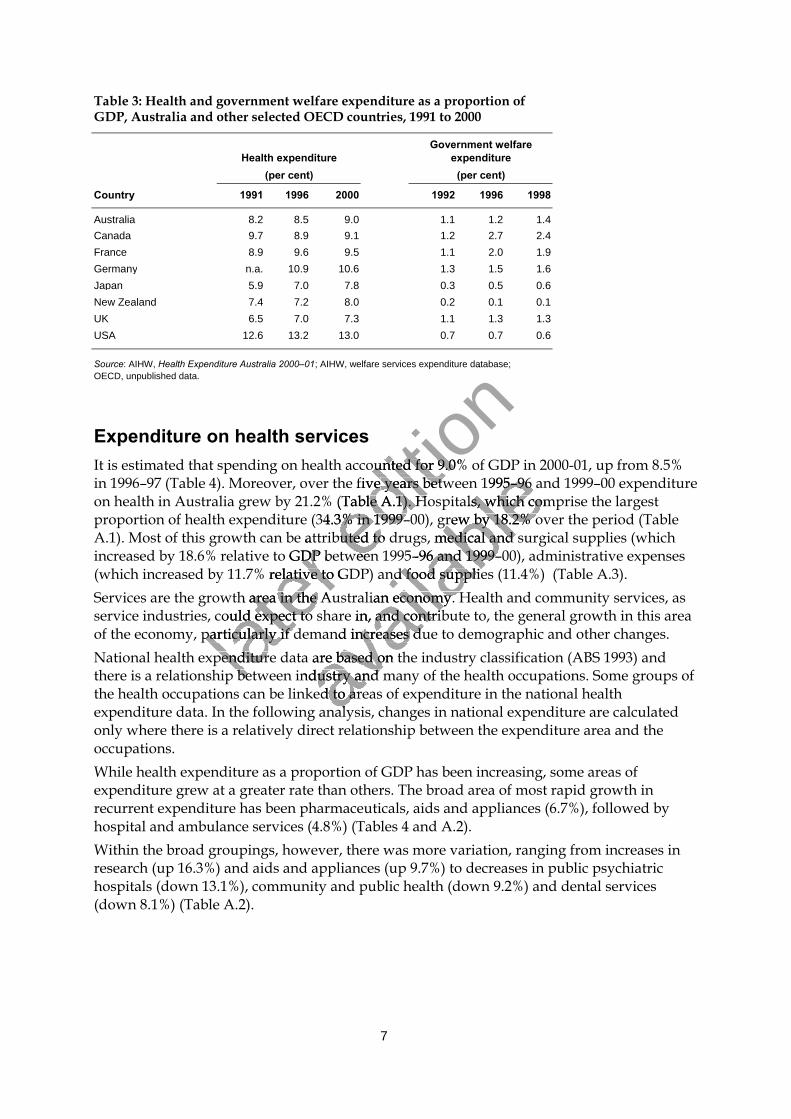
7
Table 3: Health and government welfare expenditure as a proportion ofGDP, Australia and other selected OECD countries, 1991 to 2000
Health expenditure(per cent)
Government welfareexpenditure
(per cent)
Country 1991 1996 2000 1992 1996 1998
Australia 8.2 8.5 9.0 1.1 1.2 1.4Canada 9.7 8.9 9.1 1.2 2.7 2.4France 8.9 9.6 9.5 1.1 2.0 1.9Germany n.a. 10.9 10.6 1.3 1.5 1.6Japan 5.9 7.0 7.8 0.3 0.5 0.6New Zealand 7.4 7.2 8.0 0.2 0.1 0.1UK 6.5 7.0 7.3 1.1 1.3 1.3USA 12.6 13.2 13.0 0.7 0.7 0.6
Source: AIHW, Health Expenditure Australia 2000–01; AIHW, welfare services expenditure database; OECD, unpublished data.
Expenditure on health servicesIt is estimated that spending on health accounted for 9.0% of GDP in 2000-01, up from 8.5%in 1996–97 (Table 4). Moreover, over the five years between 1995–96 and 1999–00 expenditureon health in Australia grew by 21.2% (Table A.1). Hospitals, which comprise the largestproportion of health expenditure (34.3% in 1999–00), grew by 18.2% over the period (TableA.1). Most of this growth can be attributed to drugs, medical and surgical supplies (whichincreased by 18.6% relative to GDP between 1995–96 and 1999–00), administrative expenses(which increased by 11.7% relative to GDP) and food supplies (11.4%) (Table A.3).Services are the growth area in the Australian economy. Health and community services, asservice industries, could expect to share in, and contribute to, the general growth in this areaof the economy, particularly if demand increases due to demographic and other changes.National health expenditure data are based on the industry classification (ABS 1993) andthere is a relationship between industry and many of the health occupations. Some groups ofthe health occupations can be linked to areas of expenditure in the national healthexpenditure data. In the following analysis, changes in national expenditure are calculatedonly where there is a relatively direct relationship between the expenditure area and theoccupations.While health expenditure as a proportion of GDP has been increasing, some areas ofexpenditure grew at a greater rate than others. The broad area of most rapid growth inrecurrent expenditure has been pharmaceuticals, aids and appliances (6.7%), followed byhospital and ambulance services (4.8%) (Tables 4 and A.2).Within the broad groupings, however, there was more variation, ranging from increases inresearch (up 16.3%) and aids and appliances (up 9.7%) to decreases in public psychiatrichospitals (down 13.1%), community and public health (down 9.2%) and dental services(down 8.1%) (Table A.2).
later
A.1). Most of this growth can be attributed
later
A.1). Most of this growth can be attributed increased by 18.6% relative to GDP between 1995–96 and 1999–00), administrative expenses
later
increased by 18.6% relative to GDP between 1995–96 and 1999–00), administrative expenses(which increased by 11.7% relative to GDP) and food supplies (11.4%) (Table A.3).
later (which increased by 11.7% relative to GDP) and food supplies (11.4%) (Table A.3).
Services are the growth area in the Australi
later Services are the growth area in the Australi
service industries, could expect to share in, and
later service industries, could expect to share in, and
of the economy, particularly if demand inlater
of the economy, particularly if demand inlater
National health expenditure data are based later
National health expenditure data are based there is a relationship between industry and malat
er there is a relationship between industry and ma
editio
n ; AIHW, welfare services expenditure database;
editio
n ; AIHW, welfare services expenditure database;
It is estimated that spending on health accounted for 9.0% of GDP in 2000-01, up from 8.5%
editio
n It is estimated that spending on health accounted for 9.0% of GDP in 2000-01, up from 8.5%in 1996–97 (Table 4). Moreover, over the five
editio
n in 1996–97 (Table 4). Moreover, over the five years between 1995–96 and 1999–00 expenditure
editio
n years between 1995–96 and 1999–00 expenditure
on health in Australia grew by 21.2% (Table A.1). Hospitals, which comprise the largest
editio
n on health in Australia grew by 21.2% (Table A.1). Hospitals, which comprise the largestproportion of health expenditure (34.3% in 19ed
ition
proportion of health expenditure (34.3% in 1999–00), grew by 18.2% over the period (Tableeditio
n 99–00), grew by 18.2% over the period (Table
A.1). Most of this growth can be attributed editio
n
A.1). Most of this growth can be attributed to drugs, medical and surgical supplies (whicheditio
n
to drugs, medical and surgical supplies (whichincreased by 18.6% relative to GDP between 1995–96 and 1999–00), administrative expensesed
ition
increased by 18.6% relative to GDP between 1995–96 and 1999–00), administrative expenses
avail
able
It is estimated that spending on health accounted for 9.0% of GDP in 2000-01, up from 8.5%
avail
able
It is estimated that spending on health accounted for 9.0% of GDP in 2000-01, up from 8.5% years between 1995–96 and 1999–00 expenditure
avail
able
years between 1995–96 and 1999–00 expenditureon health in Australia grew by 21.2% (Table A.1). Hospitals, which comprise the largest
avail
ableon health in Australia grew by 21.2% (Table A.1). Hospitals, which comprise the largest
99–00), grew by 18.2% over the period (Table
avail
able99–00), grew by 18.2% over the period (Table
to drugs, medical and surgical supplies (which
avail
ableto drugs, medical and surgical supplies (which
increased by 18.6% relative to GDP between 1995–96 and 1999–00), administrative expenses
avail
able
increased by 18.6% relative to GDP between 1995–96 and 1999–00), administrative expenses(which increased by 11.7% relative to GDP) and food supplies (11.4%) (Table A.3).
avail
able
(which increased by 11.7% relative to GDP) and food supplies (11.4%) (Table A.3).Services are the growth area in the Australi
avail
able
Services are the growth area in the Australian economy. Health and community services, as
avail
able
an economy. Health and community services, asservice industries, could expect to share in, and
avail
able
service industries, could expect to share in, and contribute to, the general growth in this area
avail
able
contribute to, the general growth in this areaof the economy, particularly if demand in
avail
able
of the economy, particularly if demand in
avail
able
creases due to demographic and other changes.
avail
able
creases due to demographic and other changes.National health expenditure data are based av
ailab
le
National health expenditure data are based on the industry classification (ABS 1993) andavail
able
on the industry classification (ABS 1993) andthere is a relationship between industry and maav
ailab
le
there is a relationship between industry and maavail
able
the health occupations can be linked to areas of expenditure in the national healthavail
able
the health occupations can be linked to areas of expenditure in the national healthexpenditure data. In the following analysis, cav
ailab
le
expenditure data. In the following analysis, c
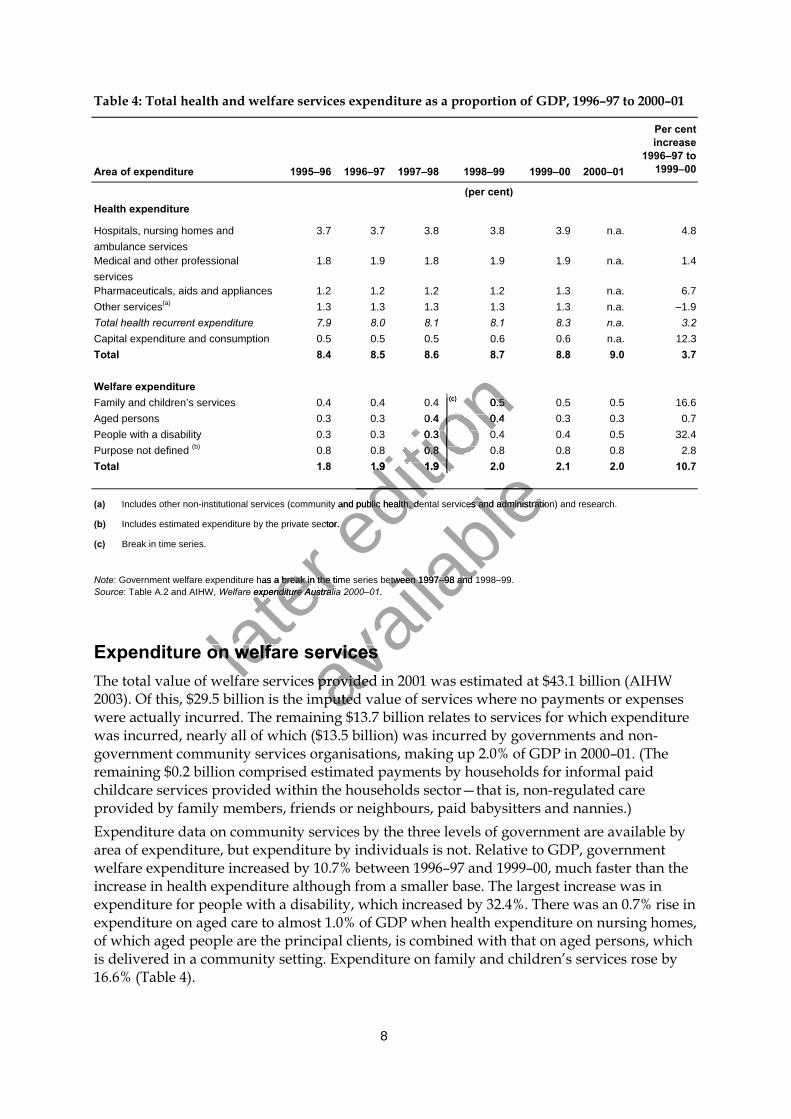
8
Table 4: Total health and welfare services expenditure as a proportion of GDP, 1996–97 to 2000–01
Area of expenditure 1995–96 1996–97 1997–98 1998–99 1999–00 2000–01
Per centincrease
1996–97 to1999–00
(per cent)Health expenditure
Hospitals, nursing homes andambulance services
3.7 3.7 3.8 3.8 3.9 n.a. 4.8
Medical and other professionalservices
1.8 1.9 1.8 1.9 1.9 n.a. 1.4
Pharmaceuticals, aids and appliances 1.2 1.2 1.2 1.2 1.3 n.a. 6.7Other services(a) 1.3 1.3 1.3 1.3 1.3 n.a. –1.9Total health recurrent expenditure 7.9 8.0 8.1 8.1 8.3 n.a. 3.2Capital expenditure and consumption 0.5 0.5 0.5 0.6 0.6 n.a. 12.3Total 8.4 8.5 8.6 8.7 8.8 9.0 3.7
Welfare expenditureFamily and children’s services 0.4 0.4 0.4 (c) 0.5 0.5 0.5 16.6Aged persons 0.3 0.3 0.4 0.4 0.3 0.3 0.7People with a disability 0.3 0.3 0.3 0.4 0.4 0.5 32.4Purpose not defined (b) 0.8 0.8 0.8 0.8 0.8 0.8 2.8Total 1.8 1.9 1.9 2.0 2.1 2.0 10.7
(a) Includes other non-institutional services (community and public health, dental services and administration) and research.
(b) Includes estimated expenditure by the private sector.
(c) Break in time series.
Note: Government welfare expenditure has a break in the time series between 1997–98 and 1998–99.Source: Table A.2 and AIHW, Welfare expenditure Australia 2000–01.
Expenditure on welfare servicesThe total value of welfare services provided in 2001 was estimated at $43.1 billion (AIHW2003). Of this, $29.5 billion is the imputed value of services where no payments or expenseswere actually incurred. The remaining $13.7 billion relates to services for which expenditurewas incurred, nearly all of which ($13.5 billion) was incurred by governments and non-government community services organisations, making up 2.0% of GDP in 2000–01. (Theremaining $0.2 billion comprised estimated payments by households for informal paidchildcare services provided within the households sector—that is, non-regulated careprovided by family members, friends or neighbours, paid babysitters and nannies.)Expenditure data on community services by the three levels of government are available byarea of expenditure, but expenditure by individuals is not. Relative to GDP, governmentwelfare expenditure increased by 10.7% between 1996–97 and 1999–00, much faster than theincrease in health expenditure although from a smaller base. The largest increase was inexpenditure for people with a disability, which increased by 32.4%. There was an 0.7% rise inexpenditure on aged care to almost 1.0% of GDP when health expenditure on nursing homes,of which aged people are the principal clients, is combined with that on aged persons, whichis delivered in a community setting. Expenditure on family and children’s services rose by16.6% (Table 4).
later : Government welfare expenditure has a break in the time series between 1997–98 and 1998–99.
later : Government welfare expenditure has a break in the time series between 1997–98 and 1998–99.
Welfare expenditure Australia 2000–01
later Welfare expenditure Australia 2000–01
Expenditure on welfare serviceslater
Expenditure on welfare servicesThe total value of welfare services providedlat
er The total value of welfare services provided
editio
n 0.4 0.4 0.4
editio
n 0.4 0.4 0.4 (c)
editio
n (c) 0.5 0.5 0.5 16.6
editio
n 0.5 0.5 0.5 16.6
editio
n 0.3 0.3 0.4 0.4 0.3 0.3
editio
n 0.3 0.3 0.4 0.4 0.3 0.3
editio
n 0.3 0.3 0.3 0.4 0.4 0.5 32.4
editio
n 0.3 0.3 0.3 0.4 0.4 0.5 32.4
editio
n 0.8 0.8 0.8 0.8 0.8 0.8
editio
n 0.8 0.8 0.8 0.8 0.8 0.8
editio
n 1.8 1.9 1.9 2.0 2.1 2.0 10.7
editio
n 1.8 1.9 1.9 2.0 2.1 2.0 10.7
editio
n
editio
n Includes other non-institutional services (community and public
editio
n Includes other non-institutional services (community and public health, dental services and administration) and research.
editio
n health, dental services and administration) and research.
Includes estimated expenditure by the private sector. editio
n Includes estimated expenditure by the private sector.
avail
able
1.8 1.9 1.9 2.0 2.1 2.0 10.7
avail
able
1.8 1.9 1.9 2.0 2.1 2.0 10.7
avail
able health, dental services and administration) and research.
avail
able health, dental services and administration) and research.
: Government welfare expenditure has a break in the time series between 1997–98 and 1998–99.
avail
able
: Government welfare expenditure has a break in the time series between 1997–98 and 1998–99.Welfare expenditure Australia 2000–01
avail
able
Welfare expenditure Australia 2000–01.
avail
able
.
Expenditure on welfare services
avail
able
Expenditure on welfare servicesThe total value of welfare services providedav
ailab
le
The total value of welfare services provided2003). Of this, $29.5 billion is the imputed value av
ailab
le
2003). Of this, $29.5 billion is the imputed value maining $13.7 billion relates to seav
ailab
le
maining $13.7 billion relates to se
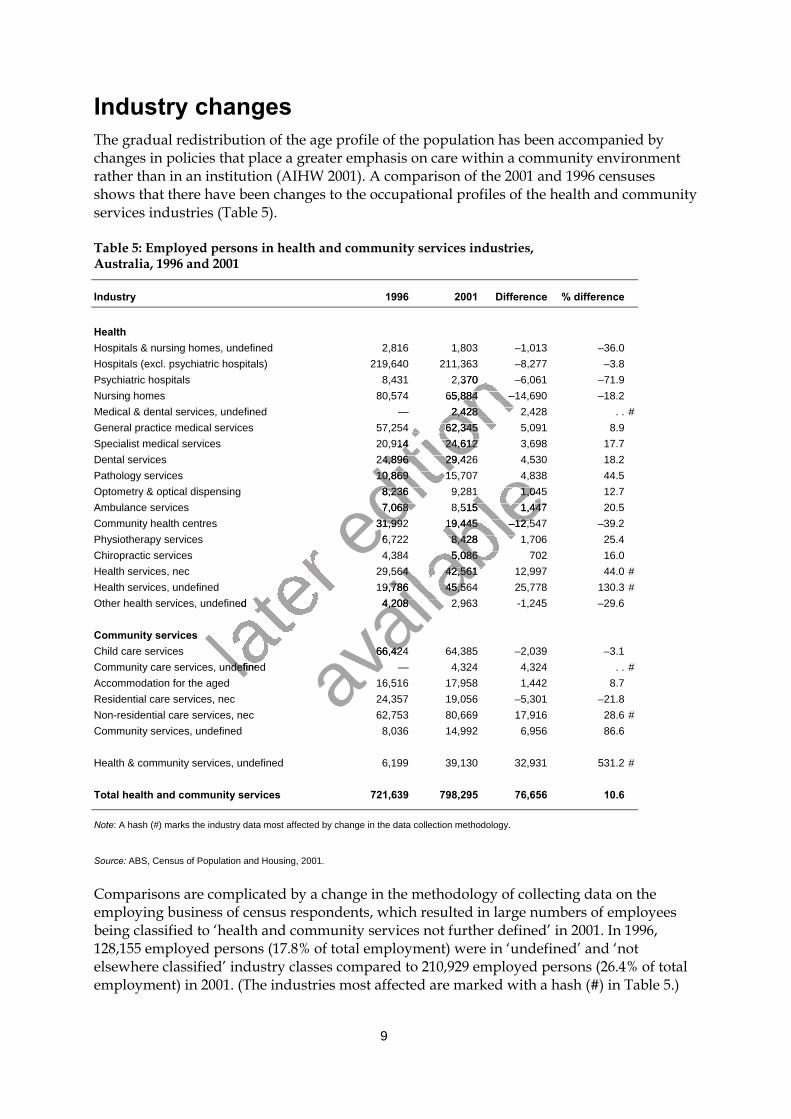
9
Industry changesThe gradual redistribution of the age profile of the population has been accompanied bychanges in policies that place a greater emphasis on care within a community environmentrather than in an institution (AIHW 2001). A comparison of the 2001 and 1996 censusesshows that there have been changes to the occupational profiles of the health and communityservices industries (Table 5).
Table 5: Employed persons in health and community services industries,Australia, 1996 and 2001
Industry 1996 2001 Difference % difference
HealthHospitals & nursing homes, undefined 2,816 1,803 –1,013 –36.0Hospitals (excl. psychiatric hospitals) 219,640 211,363 –8,277 –3.8Psychiatric hospitals 8,431 2,370 –6,061 –71.9Nursing homes 80,574 65,884 –14,690 –18.2Medical & dental services, undefined — 2,428 2,428 . . #General practice medical services 57,254 62,345 5,091 8.9Specialist medical services 20,914 24,612 3,698 17.7Dental services 24,896 29,426 4,530 18.2Pathology services 10,869 15,707 4,838 44.5Optometry & optical dispensing 8,236 9,281 1,045 12.7Ambulance services 7,068 8,515 1,447 20.5Community health centres 31,992 19,445 –12,547 –39.2Physiotherapy services 6,722 8,428 1,706 25.4Chiropractic services 4,384 5,086 702 16.0Health services, nec 29,564 42,561 12,997 44.0 #Health services, undefined 19,786 45,564 25,778 130.3 #Other health services, undefined 4,208 2,963 -1,245 –29.6
Community servicesChild care services 66,424 64,385 –2,039 –3.1Community care services, undefined — 4,324 4,324 . . #Accommodation for the aged 16,516 17,958 1,442 8.7Residential care services, nec 24,357 19,056 –5,301 –21.8Non-residential care services, nec 62,753 80,669 17,916 28.6 #Community services, undefined 8,036 14,992 6,956 86.6
Health & community services, undefined 6,199 39,130 32,931 531.2 #
Total health and community services 721,639 798,295 76,656 10.6
Note: A hash (#) marks the industry data most affected by change in the data collection methodology.
Source: ABS, Census of Population and Housing, 2001.
Comparisons are complicated by a change in the methodology of collecting data on theemploying business of census respondents, which resulted in large numbers of employeesbeing classified to ‘health and community services not further defined’ in 2001. In 1996,128,155 employed persons (17.8% of total employment) were in ‘undefined’ and ‘notelsewhere classified’ industry classes compared to 210,929 employed persons (26.4% of totalemployment) in 2001. (The industries most affected are marked with a hash (#) in Table 5.)
later Other health services, undefined
later Other health services, undefined
later
Community care services, undefinedlater
Community care services, undefined
editio
n 219,640 211,363 –8,277
editio
n 219,640 211,363 –8,277
8,431 2,370 –6,061 –71.9
editio
n 8,431 2,370 –6,061 –71.980,574 65,884 –14,690 –18.2
editio
n 80,574 65,884 –14,690 –18.2— 2,428 2,428
editio
n — 2,428 2,42857,254 62,345 5,091
editio
n 57,254 62,345 5,09120,914 24,612 3,698
editio
n 20,914 24,612 3,69824,896 29,426 4,530
editio
n 24,896 29,426 4,53010,869 15,707 4,838
editio
n 10,869 15,707 4,838
8,236 9,281 1,045
editio
n 8,236 9,281 1,0457,068 8,515 1,447
editio
n 7,068 8,515 1,447
31,992 19,445 –12,547 –39.2editio
n 31,992 19,445 –12,547 –39.26,722 8,428 1,706editio
n
6,722 8,428 1,706
avail
able
10,869 15,707 4,838
avail
able
10,869 15,707 4,8388,236 9,281 1,045
avail
able8,236 9,281 1,045
7,068 8,515 1,447
avail
able7,068 8,515 1,447
31,992 19,445 –12,547 –39.2
avail
able31,992 19,445 –12,547 –39.2
6,722 8,428 1,706
avail
able6,722 8,428 1,706
4,384 5,086 702
avail
able
4,384 5,086 70229,564 42,561 12,997
avail
able
29,564 42,561 12,99719,786 45,564 25,778 130.3 #
avail
able
19,786 45,564 25,778 130.3 #4,208 2,963 -1,245 –29.6
avail
able
4,208 2,963 -1,245 –29.6
66,424 64,385 –2,039
avail
able
66,424 64,385 –2,039

10
These data uncertainties make it difficult to conduct a definite quantitative analysis ofchange in the structure of the health and community service delivery industries since the1996 census, but some trends are evident. For example, Table 5 shows a decrease inemployment in institutional settings (hospitals, nursing homes and other residential careservices), consistent with recent moves from institutional to community-based care in severalhealth and community services industries (AIHW 2001a).A considerable number of respondents to the census identified an area health council, byvarious names depending on state, as their employer. These councils have been included inANZSIC in the health services ‘not elsewhere classified’ (n.e.c.) category, which increased by13,000 employed persons from 4.1% of total employment in 1996 to 5.3% in 2001. Theincrease in the number of employed persons in health services n.e.c., and an almost equaldecrease in numbers employed in community health centres between 1996 and 2001, areconsistent with this classification change.
Changes in occupational mixThe increase in employment in occupations in the health and community services industrieswas uneven, with a 14.7% increase in occupations designated as health and communityservices occupations and a much smaller 3.3% increase in the occupations providingmanagerial and other support services (Table 6). The largest growth tended to occur amongthe community services occupations.The main feature of the increases in the health and community services occupations was anadjustment to the mix of the nursing and nursing assistant occupations within the nursingworkforce. There was an increase in registered nurses that kept pace with the generalpopulation increase, and a decrease in enrolled nurses and their apparent replacement with alarger number of lower paid carers and aides. The number of medical professionals increasedat a slightly lower rate (11.2%) than the overall increase in employment in health andcommunity services occupations.The apparent 35% reduction in the number of education professionals was the result of achange in the census coding of some of these workers from the health and communityservices industries to the education industry. There was an overall increase of 11.3% in thenumber of pre-primary and special needs teachers (Table A.11 and AIHW 1996).There was a decrease of 2,976 (9.3%) in those employed in hospitality and food preparationoccupations, and a decrease of 7,835 (19.2%) in plant operators, labourers and cleaners (Table6). This may indicate some degree of outsourcing of food preparation, cleaning andmaintenance services. While most occupations in the tradespersons and related workersgroup recorded decreases, there was an increase in the number of drivers (264 or 6.6%),mainly employed in the pathology services industry, and for ‘other associate professionals’(296 or 28.0%), which includes security officers (Table 6 and unpublished data).Increasing computerisation of administrative functions was evident, associated with arestructuring in the administrative occupations. There was a decrease of 1,974 (12.2%) insecretaries, personal assistants and advanced clerks and an increase in business andcomputing associate professionals, and intermediate clerical workers of 7,144 (44.5%) and10,462 (13.9%) respectively.
later
workforce. There was an increase in registered
later
workforce. There was an increase in registeredpopulation increase, and a decrease in enrolled
later
population increase, and a decrease in enrolled larger number of lower paid carers and aides.
later larger number of lower paid carers and aides.
at a slightly lower rate (11.2%) than the overall increase in employment in health and
later at a slightly lower rate (11.2%) than the overall increase in employment in health and
community services occupations.
later community services occupations.
The apparent 35% reduction in the number of later
The apparent 35% reduction in the number of later
change in the census coding of some of later
change in the census coding of some of services industries to the education industry. lat
er services industries to the education industry.
editio
n the health and community services industries
editio
n the health and community services industriespations designated as health and community
editio
n pations designated as health and community3% increase in the occupations providing
editio
n 3% increase in the occupations providing
managerial and other support services (Table 6)
editio
n managerial and other support services (Table 6). The largest growth tended to occur among
editio
n . The largest growth tended to occur among
The main feature of the increases in the health and community services occupations was an
editio
n The main feature of the increases in the health and community services occupations was anadjustment to the mix of the nursing and nursing assistant occupations within the nursinged
ition
adjustment to the mix of the nursing and nursing assistant occupations within the nursingworkforce. There was an increase in registereded
ition
workforce. There was an increase in registeredpopulation increase, and a decrease in enrolled ed
ition
population increase, and a decrease in enrolled
avail
able
. The largest growth tended to occur among
avail
able
. The largest growth tended to occur among
The main feature of the increases in the health and community services occupations was an
avail
ableThe main feature of the increases in the health and community services occupations was an
adjustment to the mix of the nursing and nursing assistant occupations within the nursing
avail
ableadjustment to the mix of the nursing and nursing assistant occupations within the nursing
nurses that kept pace with the general
avail
able nurses that kept pace with the general
nurses and their apparent replacement with a
avail
able
nurses and their apparent replacement with a The number of medical professionals increased
avail
able
The number of medical professionals increasedat a slightly lower rate (11.2%) than the overall increase in employment in health and
avail
able
at a slightly lower rate (11.2%) than the overall increase in employment in health and
The apparent 35% reduction in the number of
avail
able
The apparent 35% reduction in the number of
avail
able
education professionals was the result of a
avail
able
education professionals was the result of achange in the census coding of some of
avail
able
change in the census coding of some of these workers from the health and community
avail
able
these workers from the health and communityservices industries to the education industry. av
ailab
le
services industries to the education industry. number of pre-primary and special needav
ailab
le
number of pre-primary and special needs teachers (Table A.11 and AIHW 1996).avail
able
s teachers (Table A.11 and AIHW 1996).There was a decrease of 2,976 (9.3%) in those av
ailab
le
There was a decrease of 2,976 (9.3%) in those
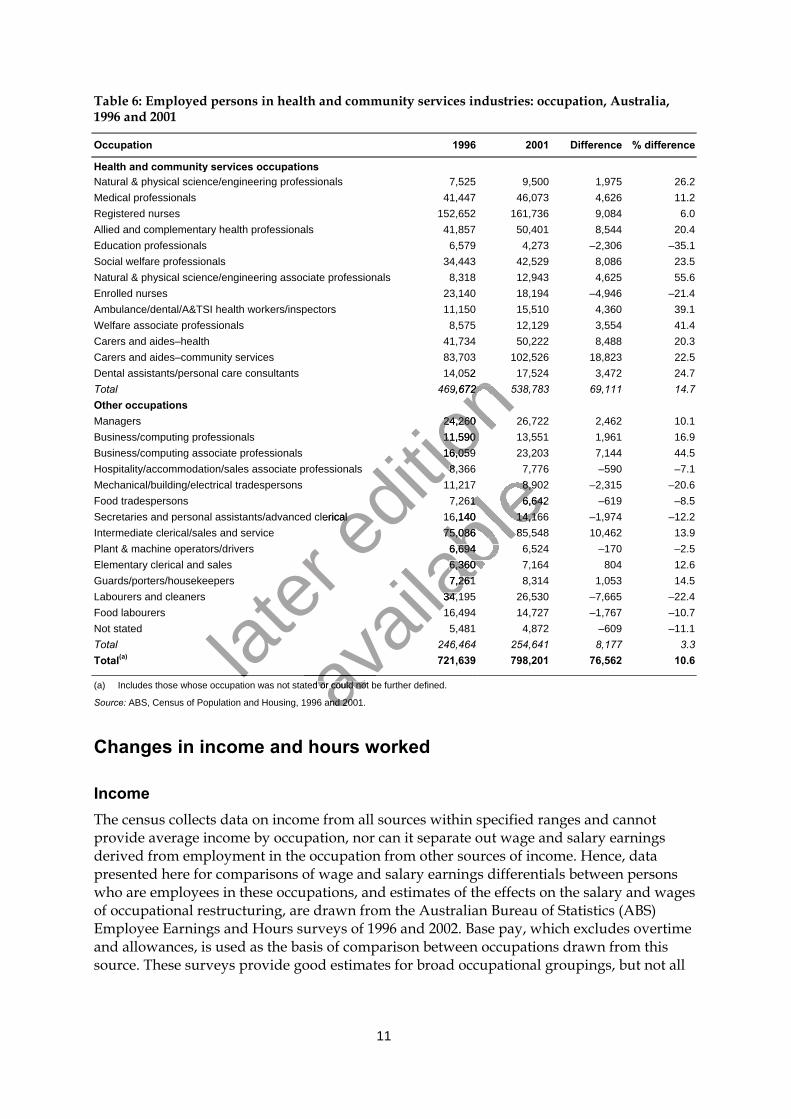
11
Table 6: Employed persons in health and community services industries: occupation, Australia,1996 and 2001
Occupation 1996 2001 Difference % difference
Health and community services occupationsNatural & physical science/engineering professionals 7,525 9,500 1,975 26.2Medical professionals 41,447 46,073 4,626 11.2Registered nurses 152,652 161,736 9,084 6.0Allied and complementary health professionals 41,857 50,401 8,544 20.4Education professionals 6,579 4,273 –2,306 –35.1Social welfare professionals 34,443 42,529 8,086 23.5Natural & physical science/engineering associate professionals 8,318 12,943 4,625 55.6Enrolled nurses 23,140 18,194 –4,946 –21.4Ambulance/dental/A&TSI health workers/inspectors 11,150 15,510 4,360 39.1Welfare associate professionals 8,575 12,129 3,554 41.4Carers and aides–health 41,734 50,222 8,488 20.3Carers and aides–community services 83,703 102,526 18,823 22.5Dental assistants/personal care consultants 14,052 17,524 3,472 24.7Total 469,672 538,783 69,111 14.7Other occupationsManagers 24,260 26,722 2,462 10.1Business/computing professionals 11,590 13,551 1,961 16.9Business/computing associate professionals 16,059 23,203 7,144 44.5Hospitality/accommodation/sales associate professionals 8,366 7,776 –590 –7.1Mechanical/building/electrical tradespersons 11,217 8,902 –2,315 –20.6Food tradespersons 7,261 6,642 –619 –8.5Secretaries and personal assistants/advanced clerical 16,140 14,166 –1,974 –12.2Intermediate clerical/sales and service 75,086 85,548 10,462 13.9Plant & machine operators/drivers 6,694 6,524 –170 –2.5Elementary clerical and sales 6,360 7,164 804 12.6Guards/porters/housekeepers 7,261 8,314 1,053 14.5Labourers and cleaners 34,195 26,530 –7,665 –22.4Food labourers 16,494 14,727 –1,767 –10.7Not stated 5,481 4,872 –609 –11.1Total 246,464 254,641 8,177 3.3Total(a) 721,639 798,201 76,562 10.6
(a) Includes those whose occupation was not stated or could not be further defined.
Source: ABS, Census of Population and Housing, 1996 and 2001.
Changes in income and hours worked
IncomeThe census collects data on income from all sources within specified ranges and cannotprovide average income by occupation, nor can it separate out wage and salary earningsderived from employment in the occupation from other sources of income. Hence, datapresented here for comparisons of wage and salary earnings differentials between personswho are employees in these occupations, and estimates of the effects on the salary and wagesof occupational restructuring, are drawn from the Australian Bureau of Statistics (ABS)Employee Earnings and Hours surveys of 1996 and 2002. Base pay, which excludes overtimeand allowances, is used as the basis of comparison between occupations drawn from thissource. These surveys provide good estimates for broad occupational groupings, but not all
later
later
editio
n 14,052 17,524 3,472 24.7
editio
n 14,052 17,524 3,472 24.7
469,672 538,783 69,111 14.7
editio
n 469,672 538,783 69,111 14.7
24,260 26,722 2,462 10.1
editio
n 24,260 26,722 2,462 10.111,590 13,551 1,961 16.9
editio
n 11,590 13,551 1,961 16.916,059 23,203 7,144 44.5
editio
n 16,059 23,203 7,144 44.5
8,366 7,776 –590 –7.1
editio
n 8,366 7,776 –590 –7.1
Secretaries and personal assistants/advanced clerical editio
n Secretaries and personal assistants/advanced clerical
avail
able
8,366 7,776 –590 –7.1
avail
able
8,366 7,776 –590 –7.111,217 8,902 –2,315 –20.6
avail
able
11,217 8,902 –2,315 –20.67,261 6,642 –619 –8.5
avail
able7,261 6,642 –619 –8.5
16,140 14,166 –1,974 –12.2
avail
able16,140 14,166 –1,974 –12.2
75,086 85,548 10,462 13.9
avail
able75,086 85,548 10,462 13.9
6,694 6,524 –170 –2.5
avail
able
6,694 6,524 –170 –2.56,360 7,164
avail
able
6,360 7,1647,261 8,314 1,053 14.5
avail
able
7,261 8,314 1,053 14.534,195 26,530 –7,665 –22.4
avail
able
34,195 26,530 –7,665 –22.4
avail
able
avail
able
t stated or could not be further defined.avail
able
t stated or could not be further defined.
ABS, Census of Population and Housing, 1996 and 2001.avail
able
ABS, Census of Population and Housing, 1996 and 2001.
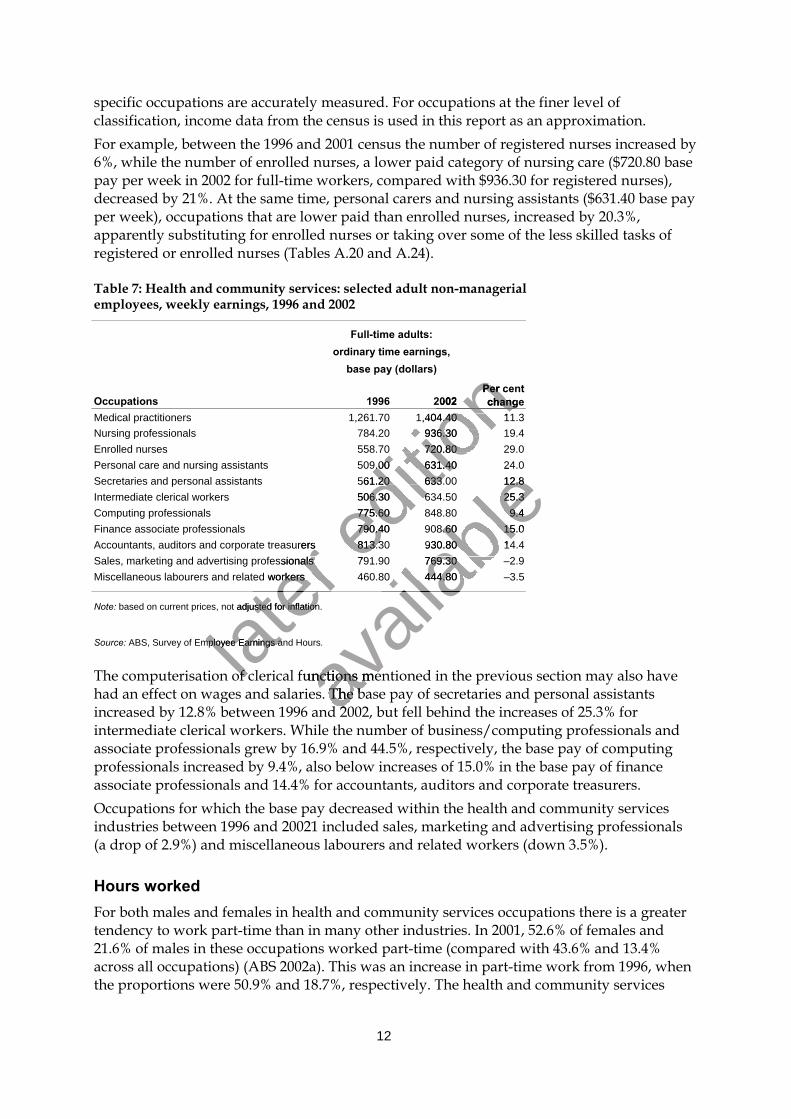
12
specific occupations are accurately measured. For occupations at the finer level ofclassification, income data from the census is used in this report as an approximation.For example, between the 1996 and 2001 census the number of registered nurses increased by6%, while the number of enrolled nurses, a lower paid category of nursing care ($720.80 basepay per week in 2002 for full-time workers, compared with $936.30 for registered nurses),decreased by 21%. At the same time, personal carers and nursing assistants ($631.40 base payper week), occupations that are lower paid than enrolled nurses, increased by 20.3%,apparently substituting for enrolled nurses or taking over some of the less skilled tasks ofregistered or enrolled nurses (Tables A.20 and A.24).
Table 7: Health and community services: selected adult non-managerial employees, weekly earnings, 1996 and 2002
Full-time adults:ordinary time earnings,
base pay (dollars)
Occupations 1996 2002Per centchange
Medical practitioners 1,261.70 1,404.40 11.3Nursing professionals 784.20 936.30 19.4Enrolled nurses 558.70 720.80 29.0Personal care and nursing assistants 509.00 631.40 24.0Secretaries and personal assistants 561.20 633.00 12.8Intermediate clerical workers 506.30 634.50 25.3Computing professionals 775.60 848.80 9.4Finance associate professionals 790.40 908.60 15.0Accountants, auditors and corporate treasurers 813.30 930.80 14.4Sales, marketing and advertising professionals 791.90 769.30 –2.9Miscellaneous labourers and related workers 460.80 444.80 –3.5
Note: based on current prices, not adjusted for inflation.
Source: ABS, Survey of Employee Earnings and Hours.
The computerisation of clerical functions mentioned in the previous section may also havehad an effect on wages and salaries. The base pay of secretaries and personal assistantsincreased by 12.8% between 1996 and 2002, but fell behind the increases of 25.3% forintermediate clerical workers. While the number of business/computing professionals andassociate professionals grew by 16.9% and 44.5%, respectively, the base pay of computingprofessionals increased by 9.4%, also below increases of 15.0% in the base pay of financeassociate professionals and 14.4% for accountants, auditors and corporate treasurers.Occupations for which the base pay decreased within the health and community servicesindustries between 1996 and 20021 included sales, marketing and advertising professionals(a drop of 2.9%) and miscellaneous labourers and related workers (down 3.5%).
Hours workedFor both males and females in health and community services occupations there is a greatertendency to work part-time than in many other industries. In 2001, 52.6% of females and21.6% of males in these occupations worked part-time (compared with 43.6% and 13.4%across all occupations) (ABS 2002a). This was an increase in part-time work from 1996, whenthe proportions were 50.9% and 18.7%, respectively. The health and community services
later
Accountants, auditors and corporate treasurers 813.30 930.80 14.4
later
Accountants, auditors and corporate treasurers 813.30 930.80 14.4Sales, marketing and advertising professionals 791.90 769.30 –2.9
later
Sales, marketing and advertising professionals 791.90 769.30 –2.9Miscellaneous labourers and related workers 460.80 444.80 –3.5
later Miscellaneous labourers and related workers 460.80 444.80 –3.5
later
later based on current prices, not adjusted for inflation.
later based on current prices, not adjusted for inflation.
ABS, Survey of Employee Earnings and Hourslater
ABS, Survey of Employee Earnings and Hours
The computerisation of clericallater
The computerisation of clerical
editio
n 1996 2002
editio
n 1996 2002Per cent
editio
n Per centchange
editio
n change1,261.70 1,404.40 11.3
editio
n 1,261.70 1,404.40 11.3
editio
n 784.20 936.30 19.4
editio
n 784.20 936.30 19.4558.70 720.80 29.0
editio
n 558.70 720.80 29.0509.00 631.40 24.0
editio
n 509.00 631.40 24.0561.20 633.00 12.8
editio
n 561.20 633.00 12.8506.30 634.50 25.3
editio
n 506.30 634.50 25.3775.60 848.80 9.4ed
ition
775.60 848.80 9.4790.40 908.60 15.0ed
ition
790.40 908.60 15.0Accountants, auditors and corporate treasurers 813.30 930.80 14.4ed
ition
Accountants, auditors and corporate treasurers 813.30 930.80 14.4Sales, marketing and advertising professionals 791.90 769.30 –2.9ed
ition
Sales, marketing and advertising professionals 791.90 769.30 –2.9
avail
able
509.00 631.40 24.0
avail
able
509.00 631.40 24.0561.20 633.00 12.8
avail
able
561.20 633.00 12.8506.30 634.50 25.3
avail
able506.30 634.50 25.3
775.60 848.80 9.4
avail
able775.60 848.80 9.4
790.40 908.60 15.0
avail
able790.40 908.60 15.0
Accountants, auditors and corporate treasurers 813.30 930.80 14.4
avail
ableAccountants, auditors and corporate treasurers 813.30 930.80 14.4
Sales, marketing and advertising professionals 791.90 769.30 –2.9
avail
able
Sales, marketing and advertising professionals 791.90 769.30 –2.9Miscellaneous labourers and related workers 460.80 444.80 –3.5
avail
able
Miscellaneous labourers and related workers 460.80 444.80 –3.5
avail
able
avail
able
functions mentioned in the previous section may also haveavail
able
functions mentioned in the previous section may also haveavail
able
had an effect on wages and salaries. The base pay of secretaries and personal assistantsavail
able
had an effect on wages and salaries. The base pay of secretaries and personal assistantsincreased by 12.8% between 1996 and 2002, but fell behind the increases of 25.3% forav
ailab
le
increased by 12.8% between 1996 and 2002, but fell behind the increases of 25.3% for
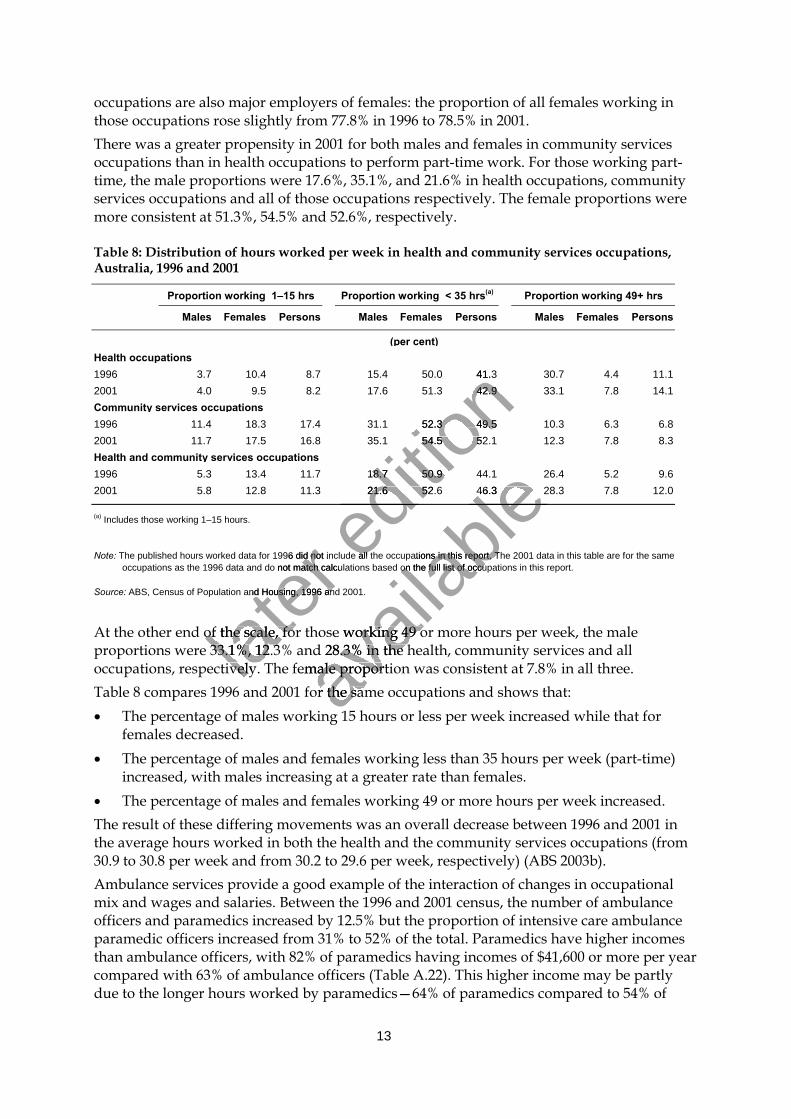
13
occupations are also major employers of females: the proportion of all females working inthose occupations rose slightly from 77.8% in 1996 to 78.5% in 2001.There was a greater propensity in 2001 for both males and females in community servicesoccupations than in health occupations to perform part-time work. For those working part-time, the male proportions were 17.6%, 35.1%, and 21.6% in health occupations, communityservices occupations and all of those occupations respectively. The female proportions weremore consistent at 51.3%, 54.5% and 52.6%, respectively.
Table 8: Distribution of hours worked per week in health and community services occupations,Australia, 1996 and 2001
Proportion working 1–15 hrs Proportion working < 35 hrs(a) Proportion working 49+ hrs
Males Females Persons Males Females Persons Males Females Persons
(per cent)Health occupations1996 3.7 10.4 8.7 15.4 50.0 41.3 30.7 4.4 11.12001 4.0 9.5 8.2 17.6 51.3 42.9 33.1 7.8 14.1Community services occupations1996 11.4 18.3 17.4 31.1 52.3 49.5 10.3 6.3 6.82001 11.7 17.5 16.8 35.1 54.5 52.1 12.3 7.8 8.3Health and community services occupations1996 5.3 13.4 11.7 18.7 50.9 44.1 26.4 5.2 9.62001 5.8 12.8 11.3 21.6 52.6 46.3 28.3 7.8 12.0
(a) Includes those working 1–15 hours.
Note: The published hours worked data for 1996 did not include all the occupations in this report. The 2001 data in this table are for the sameoccupations as the 1996 data and do not match calculations based on the full list of occupations in this report.
Source: ABS, Census of Population and Housing, 1996 and 2001.
At the other end of the scale, for those working 49 or more hours per week, the maleproportions were 33.1%, 12.3% and 28.3% in the health, community services and alloccupations, respectively. The female proportion was consistent at 7.8% in all three.Table 8 compares 1996 and 2001 for the same occupations and shows that:� The percentage of males working 15 hours or less per week increased while that for
females decreased.� The percentage of males and females working less than 35 hours per week (part-time)
increased, with males increasing at a greater rate than females.� The percentage of males and females working 49 or more hours per week increased.The result of these differing movements was an overall decrease between 1996 and 2001 inthe average hours worked in both the health and the community services occupations (from30.9 to 30.8 per week and from 30.2 to 29.6 per week, respectively) (ABS 2003b).Ambulance services provide a good example of the interaction of changes in occupationalmix and wages and salaries. Between the 1996 and 2001 census, the number of ambulanceofficers and paramedics increased by 12.5% but the proportion of intensive care ambulanceparamedic officers increased from 31% to 52% of the total. Paramedics have higher incomesthan ambulance officers, with 82% of paramedics having incomes of $41,600 or more per yearcompared with 63% of ambulance officers (Table A.22). This higher income may be partlydue to the longer hours worked by paramedics—64% of paramedics compared to 54% of
later
The published hours worked data for 1996 did not include all the oc
later
The published hours worked data for 1996 did not include all the ococcupations as the 1996 data and do not match calculations
later
occupations as the 1996 data and do not match calculations
ABS, Census of Population and Housing, 1996 and 2001.
later ABS, Census of Population and Housing, 1996 and 2001.
At the other end of the scale, for those working 49 or more hours per week, the malelater
At the other end of the scale, for those working 49 or more hours per week, the maleproportions were 33.1%, 12.3% and 28.3% inlat
er proportions were 33.1%, 12.3% and 28.3% inoccupations, respectively. The female proporlat
er occupations, respectively. The female propor
editio
n 3.7 10.4 8.7 15.4 50.0 41.3 30.7 4.4 11.1
editio
n 3.7 10.4 8.7 15.4 50.0 41.3 30.7 4.4 11.14.0 9.5 8.2 17.6 51.3 42.9 33.1 7.8 14.1
editio
n 4.0 9.5 8.2 17.6 51.3 42.9 33.1 7.8 14.1
11.4 18.3 17.4 31.1 52.3 49.5 10.3 6.3 6.8
editio
n 11.4 18.3 17.4 31.1 52.3 49.5 10.3 6.3 6.811.7 17.5 16.8 35.1 54.5 52.1 12.3 7.8 8.3
editio
n 11.7 17.5 16.8 35.1 54.5 52.1 12.3 7.8 8.3
5.3 13.4 11.7 18.7 50.9 44.1 26.4 5.2 9.6
editio
n 5.3 13.4 11.7 18.7 50.9 44.1 26.4 5.2 9.65.8 12.8 11.3 21.6 52.6 46.3 28.3 7.8 12.0
editio
n 5.8 12.8 11.3 21.6 52.6 46.3 28.3 7.8 12.0
editio
n
The published hours worked data for 1996 did not include all the oceditio
n
The published hours worked data for 1996 did not include all the oc
avail
able
5.3 13.4 11.7 18.7 50.9 44.1 26.4 5.2 9.6
avail
able
5.3 13.4 11.7 18.7 50.9 44.1 26.4 5.2 9.65.8 12.8 11.3 21.6 52.6 46.3 28.3 7.8 12.0
avail
able5.8 12.8 11.3 21.6 52.6 46.3 28.3 7.8 12.0
avail
able
cupations in this report. The 2001 data in this table are f
avail
able
cupations in this report. The 2001 data in this table are f based on the full list of occupations in this report.
avail
able
based on the full list of occupations in this report.
At the other end of the scale, for those working 49 or more hours per week, the male
avail
able
At the other end of the scale, for those working 49 or more hours per week, the maleproportions were 33.1%, 12.3% and 28.3% in
avail
able
proportions were 33.1%, 12.3% and 28.3% in the health, community services and all
avail
able
the health, community services and alloccupations, respectively. The female proporav
ailab
le
occupations, respectively. The female proporavail
able
tion was consistent at 7.8% in all three.avail
able
tion was consistent at 7.8% in all three.Table 8 compares 1996 and 2001 for the same occupations and shows that:av
ailab
le
Table 8 compares 1996 and 2001 for the same occupations and shows that:The percentage of males working 15 hours or less per week increased while that forav
ailab
le
The percentage of males working 15 hours or less per week increased while that for
14
ambulance officers worked more than 40 hours per week (Table A.16). The greater staffingcosts from this change in the occupational mix would amount to around $8 million based ona rough estimate using the data in Table A.22.As noted above, there were also apparent changes to the way nursing and related care isdelivered, with increases in the highest paid category of registered nurses, and in the lowestpaid category of personal carers and nursing aides, together with decreases in the number ofenrolled nurses. Enrolled nurses have a younger age profile than the other two nursinggroups, with 7.3% aged 55 or over, compared with 11.1% for registered nurses and 12.7% forpersonal care assistants and nursing assistants. This change in the mix of nursingoccupations has resulted in an older age profile of nursing workers (11.2% were aged55 years and over in 2001, compared with 7.6% in 1996) and a decrease in average hoursworked (50.9% worked part-time in 2001, compared with 33.8% in 1996) (Tables A.14 andA.16, and AIHW 1996). In combination, the effect has been a lower proportion in 2001 ofnursing workers with incomes under $41,600 (73.4%) than in 1996 (73.5%), but these are inactual dollars for each of those years rather than real terms (Table A.22 and AIHW 1996).Data on nursing pay rates is not available from the employee earnings and hours data.These are only two examples, however, and a more detailed analysis of changes for all themajor health and community services occupations is provided in later chapters.
later
editio
n than real terms (Table A.22 and AIHW 1996).
editio
n than real terms (Table A.22 and AIHW 1996).
from the employee earnings and hours data.
editio
n from the employee earnings and hours data.These are only two examples, however, and a more detailed analysis of changes for all the
editio
n These are only two examples, however, and a more detailed analysis of changes for all thepations is provided in later chapters.
editio
n pations is provided in later chapters.
avail
able
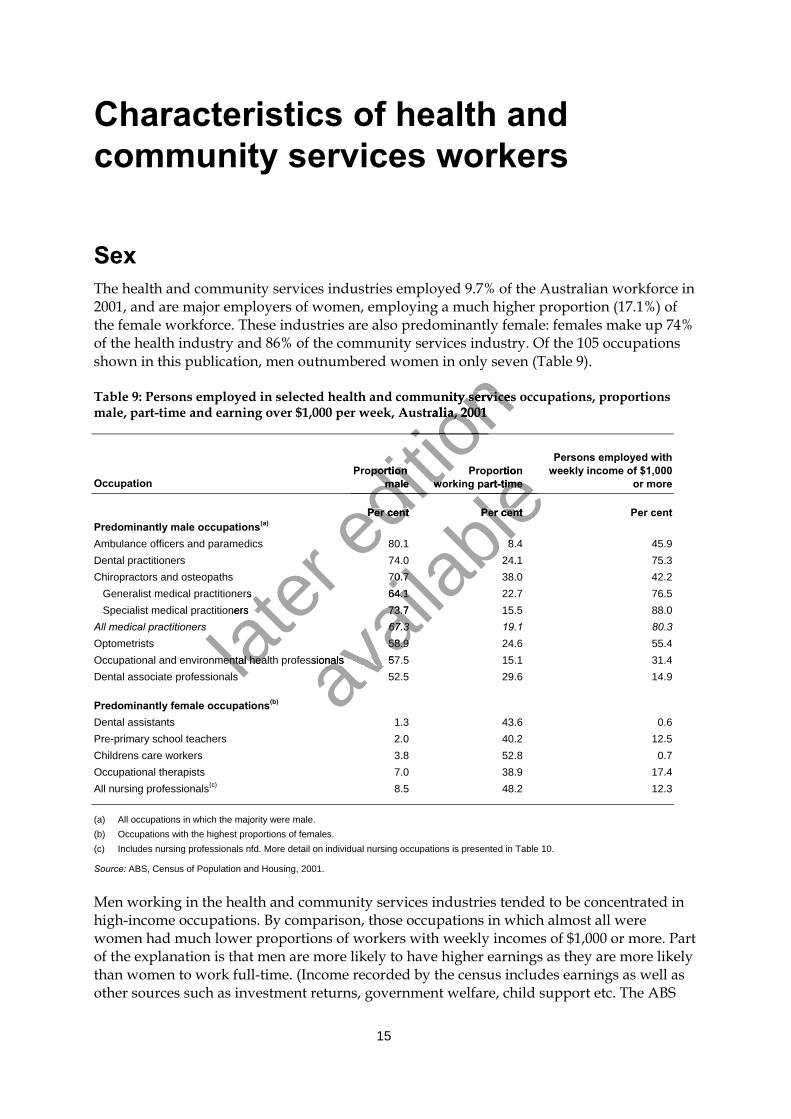
15
Characteristics of health andcommunity services workers
SexThe health and community services industries employed 9.7% of the Australian workforce in2001, and are major employers of women, employing a much higher proportion (17.1%) ofthe female workforce. These industries are also predominantly female: females make up 74%of the health industry and 86% of the community services industry. Of the 105 occupationsshown in this publication, men outnumbered women in only seven (Table 9).
Table 9: Persons employed in selected health and community services occupations, proportionsmale, part-time and earning over $1,000 per week, Australia, 2001
OccupationProportion
maleProportion
working part-time
Persons employed withweekly income of $1,000
or more
Per cent Per cent Per centPredominantly male occupations(a)
Ambulance officers and paramedics 80.1 8.4 45.9Dental practitioners 74.0 24.1 75.3Chiropractors and osteopaths 70.7 38.0 42.2 Generalist medical practitioners 64.1 22.7 76.5 Specialist medical practitioners 73.7 15.5 88.0All medical practitioners 67.3 19.1 80.3Optometrists 58.9 24.6 55.4Occupational and environmental health professionals 57.5 15.1 31.4Dental associate professionals 52.5 29.6 14.9
Predominantly female occupations(b)
Dental assistants 1.3 43.6 0.6Pre-primary school teachers 2.0 40.2 12.5Childrens care workers 3.8 52.8 0.7Occupational therapists 7.0 38.9 17.4All nursing professionals(c) 8.5 48.2 12.3
(a) All occupations in which the majority were male.(b) Occupations with the highest proportions of females.(c) Includes nursing professionals nfd. More detail on individual nursing occupations is presented in Table 10.
Source: ABS, Census of Population and Housing, 2001.
Men working in the health and community services industries tended to be concentrated inhigh-income occupations. By comparison, those occupations in which almost all werewomen had much lower proportions of workers with weekly incomes of $1,000 or more. Partof the explanation is that men are more likely to have higher earnings as they are more likelythan women to work full-time. (Income recorded by the census includes earnings as well asother sources such as investment returns, government welfare, child support etc. The ABS
later Generalist medical practitioners
later Generalist medical practitioners
Specialist medical practitioners
later Specialist medical practitioners
later
Occupational and environmental heallater
Occupational and environmental heal
editio
n shown in this publication, men outnumbered women in only seven (Table 9).
editio
n shown in this publication, men outnumbered women in only seven (Table 9).
Table 9: Persons employed in selected health and community services occupations, proportions
editio
n Table 9: Persons employed in selected health and community services occupations, proportionsmale, part-time and earning over $1,000 per week, Australia, 2001
editio
n male, part-time and earning over $1,000 per week, Australia, 2001
editio
n Proportion
editio
n Proportion
male
editio
n male working part-time
editio
n working part-time
editio
n Per cented
ition
Per cent
avail
able
Proportion
avail
able
Proportionworking part-time
avail
able
working part-time
avail
ablePer cent
avail
ablePer cent
8.4
avail
able8.4
70.7
avail
able
70.764.1
avail
able
64.173.7
avail
able
73.767.3
avail
able
67.358.9
avail
able
58.9
avail
able
th professionals 57.5avail
able
th professionals 57.5
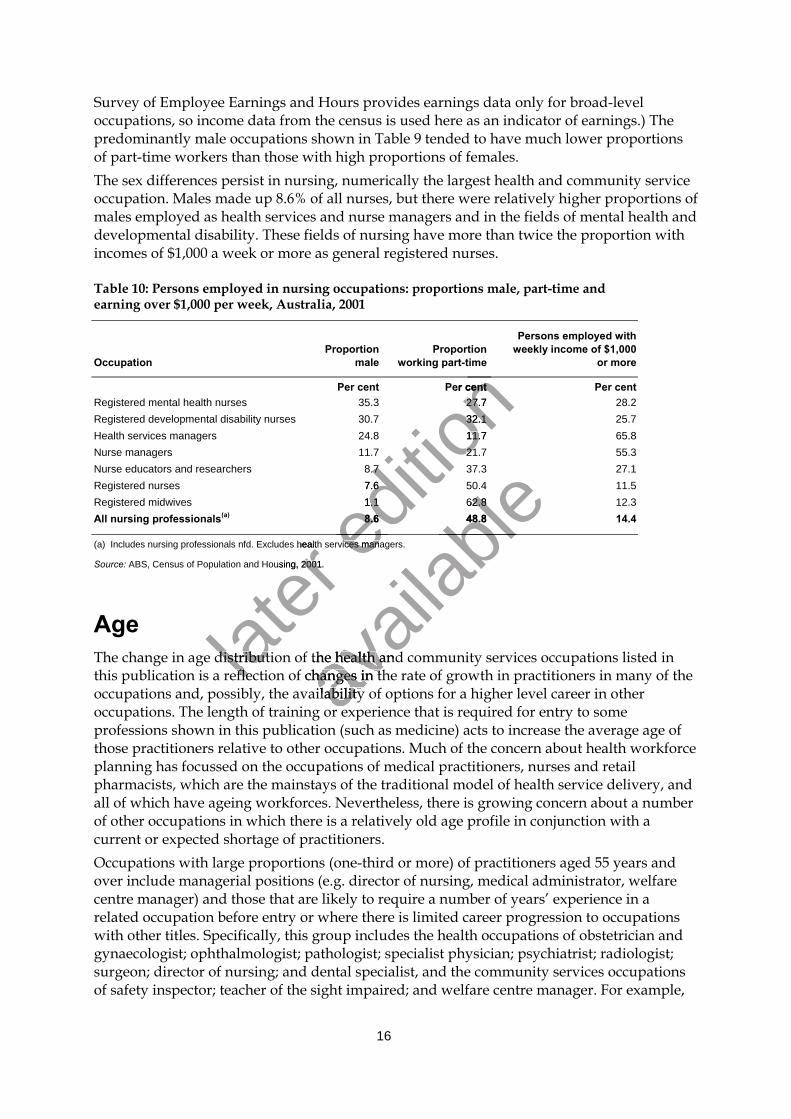
16
Survey of Employee Earnings and Hours provides earnings data only for broad-leveloccupations, so income data from the census is used here as an indicator of earnings.) Thepredominantly male occupations shown in Table 9 tended to have much lower proportionsof part-time workers than those with high proportions of females.The sex differences persist in nursing, numerically the largest health and community serviceoccupation. Males made up 8.6% of all nurses, but there were relatively higher proportions ofmales employed as health services and nurse managers and in the fields of mental health anddevelopmental disability. These fields of nursing have more than twice the proportion withincomes of $1,000 a week or more as general registered nurses.
Table 10: Persons employed in nursing occupations: proportions male, part-time andearning over $1,000 per week, Australia, 2001
OccupationProportion
maleProportion
working part-time
Persons employed withweekly income of $1,000
or more
Per cent Per cent Per centRegistered mental health nurses 35.3 27.7 28.2Registered developmental disability nurses 30.7 32.1 25.7Health services managers 24.8 11.7 65.8Nurse managers 11.7 21.7 55.3Nurse educators and researchers 8.7 37.3 27.1Registered nurses 7.6 50.4 11.5Registered midwives 1.1 62.8 12.3All nursing professionals(a) 8.6 48.8 14.4
(a) Includes nursing professionals nfd. Excludes health services managers.
Source: ABS, Census of Population and Housing, 2001.
AgeThe change in age distribution of the health and community services occupations listed inthis publication is a reflection of changes in the rate of growth in practitioners in many of theoccupations and, possibly, the availability of options for a higher level career in otheroccupations. The length of training or experience that is required for entry to someprofessions shown in this publication (such as medicine) acts to increase the average age ofthose practitioners relative to other occupations. Much of the concern about health workforceplanning has focussed on the occupations of medical practitioners, nurses and retailpharmacists, which are the mainstays of the traditional model of health service delivery, andall of which have ageing workforces. Nevertheless, there is growing concern about a numberof other occupations in which there is a relatively old age profile in conjunction with acurrent or expected shortage of practitioners.Occupations with large proportions (one-third or more) of practitioners aged 55 years andover include managerial positions (e.g. director of nursing, medical administrator, welfarecentre manager) and those that are likely to require a number of years’ experience in arelated occupation before entry or where there is limited career progression to occupationswith other titles. Specifically, this group includes the health occupations of obstetrician andgynaecologist; ophthalmologist; pathologist; specialist physician; psychiatrist; radiologist;surgeon; director of nursing; and dental specialist, and the community services occupationsof safety inspector; teacher of the sight impaired; and welfare centre manager. For example,
later
(a) Includes nursing professionals nfd. Excludes health services managers.
later
(a) Includes nursing professionals nfd. Excludes health services managers.
later
ABS, Census of Population and Housing, 2001.
later
ABS, Census of Population and Housing, 2001.
The change in age distribution of the healthlater
The change in age distribution of the healththis publication is a reflection of changes in the rate of growth in practitioners in many of thelat
er this publication is a reflection of changes in the rate of growth in practitioners in many of the
editio
n working part-time
editio
n working part-time
Per cent
editio
n Per cent
editio
n 27.7
editio
n 27.732.1
editio
n 32.111.7
editio
n 11.721.7
editio
n 21.7
8.7
editio
n 8.77.6
editio
n 7.61.1
editio
n 1.18.6ed
ition
8.6editio
n
(a) Includes nursing professionals nfd. Excludes health services managers.editio
n
(a) Includes nursing professionals nfd. Excludes health services managers.
avail
able
50.4
avail
able
50.462.8
avail
able62.8
48.8
avail
able48.8
avail
able
avail
able
The change in age distribution of the health
avail
able
The change in age distribution of the health and community services occupations listed in
avail
able
and community services occupations listed inthis publication is a reflection of changes in the rate of growth in practitioners in many of theav
ailab
le
this publication is a reflection of changes in the rate of growth in practitioners in many of theavail
able
occupations and, possibly, the availability of options for a higher level career in otheravail
able
occupations and, possibly, the availability of options for a higher level career in otheroccupations. The length of training or expeav
ailab
le
occupations. The length of training or expe
17
6.5% of employed medical practitioners and 6.4% of retail pharmacists were aged over65 years, as were 12.4% of ophthalmologists and 9.6% of surgeons (Tables A.14 and A.15).Three-quarters or more of the practitioners in 17 of the health occupations were aged under45 years — medical practitioner in training, emergency medicine specialist, radiationtherapist, nuclear medicine technologist, sonographer, dental therapist, dental hygienist,dental assistant, industrial pharmacist, occupational therapist, optometrist, speechpathologist, podiatrist, dietitian, orthoptist, anatomist or physiologist and health informationmanager. Many of these occupations underwent substantial growth between 1996 and 2001.For community services, occupations with a young age profile were confined to thoseconcerned with youth welfare: youth worker, child care worker and nanny.Age is only one factor that can contribute to or exacerbate current or expected workforceshortages. Some of the other changes affecting supply of health professionals may includethe increased number of females and an associated decrease in hours worked due topreferences for part-time work; rapid advances in technology; new approaches to servicedelivery; changes in the way health services are organised; changes in disease patterns(including those associated with an ageing population); and demographic shifts in the labourforce, including an increased tendency for early retirement. Many of those changes arelargely unpredictable, but even for those that are (such as the ageing workforce), the extent towhich supply may be affected can not be fully anticipated (AMWAC 2003).Making adjustments to student intake can only affect workforce numbers over the mediumterm, especially in professions requiring lengthy training. Adjustments to migrant intake andattracting qualified health practitioners into the labour force or encouraging current workersto work longer hours can have a quicker impact. For example, any undersupply of medicalpractitioners in rural and remote areas can in part be addressed by increasing the intake oftemporary resident doctors (immigrant doctors employed for a period of up to one year in adesignated area of need). This strategy can also introduce a number of younger practitionersinto the workforce.On the other hand, supply in many of the health occupations may be boosted by workerswho continue to work beyond the customary retirement age of 65 years. Across all healthfields, 15% of those 65 years of age with their highest qualification in a relevant field reportedbeing employed, as did 40.2% of people aged over 65 years with qualifications in chiropracticand osteopathy, 40.1% of those with qualifications in medical studies, pharmacy (26.5%),optometry (24.3%) and dentistry (19.7%) (Table A. 9). This compares with around 5.8% of thegeneral population aged 65 years or more who were employed in June 2001 (ABS 2001b).
Highest qualification in a health fieldHighest qualification data can provide a measure of the number of people with a relevantacademic qualification for a profession compared to the number employed in the profession.This can give an indication of how many qualified people are not working in the relevantfield, and an approximate size of the pool of potential re-entrants to a profession. For thoseoccupations where entry is not dependent on a particular qualification, this data can alsoindicate whether their workforces comprise a large proportion without relevant skills. Thedata has some limitations because it does not identify the initial qualification of those whohave a postgraduate qualification in a different field, for example, a nursing degree followedby a postgraduate management degree. In addition, a qualification reported in the censusmay be from an overseas institution and not recognised for entrance to a registered healthprofession in Australia.
later
practitioners in rural and remote areas can in
later
practitioners in rural and remote areas can in temporary resident doctors (immigrant doctors employed for a period of up to one year in a
later
temporary resident doctors (immigrant doctors employed for a period of up to one year in a
later designated area of need). This strategy can al
later designated area of need). This strategy can al
On the other hand, supply in many of the health occupations may be boosted by workers
later On the other hand, supply in many of the health occupations may be boosted by workers
who continue to work beyond the customary retirement age of 65 years. Across all healthlater
who continue to work beyond the customary retirement age of 65 years. Across all healthfields, 15% of those 65 years of age with their highest qualification in a relevant field reportedlat
er fields, 15% of those 65 years of age with their highest qualification in a relevant field reportedbeing employed, as did 40.2% of people aged ovlat
er being employed, as did 40.2% of people aged ov
editio
n are organised; changes in disease patterns
editio
n are organised; changes in disease patterns
lation); and demographic shifts in the labour
editio
n lation); and demographic shifts in the labourforce, including an increased tendency for early retirement. Many of those changes are
editio
n force, including an increased tendency for early retirement. Many of those changes aree (such as the ageing workforce), the extent to
editio
n e (such as the ageing workforce), the extent towhich supply may be affected can not be fully anticipated (AMWAC 2003).
editio
n which supply may be affected can not be fully anticipated (AMWAC 2003).Making adjustments to student intake can on
editio
n Making adjustments to student intake can only affect workforce numbers over the medium
editio
n ly affect workforce numbers over the medium
term, especially in professions requiring leng
editio
n term, especially in professions requiring lengthy training. Adjustments to migrant intake and
editio
n thy training. Adjustments to migrant intake and
titioners into the labour force
editio
n titioners into the labour force
to work longer hours can have a quicker impaeditio
n to work longer hours can have a quicker impact. For example, any undersupply of medicaled
ition
ct. For example, any undersupply of medicalpractitioners in rural and remote areas can in ed
ition
practitioners in rural and remote areas can in part be addressed by increasing the intake ofeditio
n
part be addressed by increasing the intake oftemporary resident doctors (immigrant doctors employed for a period of up to one year in aed
ition
temporary resident doctors (immigrant doctors employed for a period of up to one year in a
avail
able
ly affect workforce numbers over the medium
avail
able
ly affect workforce numbers over the mediumthy training. Adjustments to migrant intake and
avail
able
thy training. Adjustments to migrant intake andtitioners into the labour force
avail
abletitioners into the labour force or encouraging current workers
avail
ableor encouraging current workers
ct. For example, any undersupply of medical
avail
ablect. For example, any undersupply of medical
part be addressed by increasing the intake of
avail
ablepart be addressed by increasing the intake of
temporary resident doctors (immigrant doctors employed for a period of up to one year in a
avail
able
temporary resident doctors (immigrant doctors employed for a period of up to one year in a
avail
able
so introduce a number of
avail
able
so introduce a number of
On the other hand, supply in many of the health occupations may be boosted by workers
avail
able
On the other hand, supply in many of the health occupations may be boosted by workerswho continue to work beyond the customary retirement age of 65 years. Across all health
avail
able
who continue to work beyond the customary retirement age of 65 years. Across all healthfields, 15% of those 65 years of age with their highest qualification in a relevant field reported
avail
able
fields, 15% of those 65 years of age with their highest qualification in a relevant field reportedbeing employed, as did 40.2% of people aged ovav
ailab
le
being employed, as did 40.2% of people aged ovand osteopathy, 40.1% of those with qualifications in medical studies, pharmacy (26.5%),av
ailab
le
and osteopathy, 40.1% of those with qualifications in medical studies, pharmacy (26.5%),optometry (24.3%) and dentistry (19.7%) (Table A. 9). This compares with around 5.8% of theav
ailab
le
optometry (24.3%) and dentistry (19.7%) (Table A. 9). This compares with around 5.8% of the
18
There is a close relationship between the professional employment numbers and the numberwith qualifications in the fields of medical studies, dentistry, dental assisting, pharmacy,optometry, radiography, physiotherapy, chiropractic and osteopathy, speech pathology andpodiatry (Tables A.6 and A.9). It is noted that courses leading to these qualifications have aclose relationship with training for a related profession. Despite a similar close relationshipbetween nursing qualifications and the nursing occupation there is a substantial gap betweenthe numbers of employed persons who have a nursing qualification (230,184) (Table A.9) andthe numbers employed in the profession (171,615 registered nurses and 19,510 enrollednurses) (Table A.6). This indicates that there are around 40,000 employed persons with anursing qualification who are not employed in nursing.Unemployment ranged from zero for those qualified in obstetrics and gynaecology andpalliative care nursing to 3-4% for aged care nursing and most public health fields. The fieldswhere unemployment exceeded 4.0% were: ‘first aid’ at 14.5% among the 1,078 persons whoreported this qualification; 6.3% of the 432 persons with ‘Indigenous health’ qualifications;5.9% for ‘massage therapy’ and all the complementary therapy occupations (e.g.naturopathy, acupuncture and traditional Chinese medicine), which together averaged 5.4%(Table A.9).
Indigenous health and community service workersAt the 2001 census, there were 410,003 people who identified as being of Indigenous origin,an increase of 16.2% from 352,970 people in 1996. The Indigenous population represented2.4% of the total Australian population in 2001, up from 2.0% in 1996 (ABS 2003a). Thecurrent life expectancy at birth of Indigenous people is 56 years for males and 63 years forfemales, around 20 years less than the 77 years and 82 years for males and femalesrespectively for the total population (ABS 2002b). Health care provided by Indigenous peopleis one strategy to improve health care and increase the health status and life expectancy ofthe Indigenous population.There were 3,742 Indigenous people employed in health occupations in 2001, comprising0.9% of health occupation workers (Table A.18). The occupation of Aboriginal and TorresStrait Islander health worker (‘Indigenous health worker’ in this publication) employed853 Indigenous people, which comprised 22.8% of all Indigenous people working in healthoccupations and 93.2% of workers in this occupation. A total of 444 people reported a highestqualification in Indigenous health and, of those, 6.1% reported being unemployed and afurther 24.3% as not in the labour force (Table A.9).Excluding Indigenous health workers, 0.7% of health occupation workers in 2001 wereIndigenous—well below the 2.4% Indigenous representation in the population. In the healthoccupations not specifically targeted at Indigenous health, those with the greatest proportionof Indigenous people were environmental health worker (3.5%), primary products inspector(2.0%), nursing assistant (1.7%), medical administrator (1.6%), ambulance officer (1.6%),personal care assistant (1.4%) and admissions clerk (1.1%). In all other health occupationsthere were 1.0% or fewer Indigenous workers.There was a greater proportion of Indigenous workers in the community servicesoccupations, with 6,294 workers, comprising 2.7% of community services occupationworkers. The occupations with higher Indigenous representation were refuge worker(21.9%), family support worker (16.5%), special education teacher nec (16.2%), drug andalcohol counsellor (8.8%), welfare associate professional nfd (7.4%) and youth worker (7.1%)(Table A.19).
later
current life expectancy at birth of Indigenous
later
current life expectancy at birth of Indigenous females, around 20 years less than the 77 years and 82 years for males and females
later
females, around 20 years less than the 77 years and 82 years for males and femalesrespectively for the total population (ABS 2002b).
later respectively for the total population (ABS 2002b).
is one strategy to improve health care and in
later is one strategy to improve health care and in
the Indigenous population.
later the Indigenous population.
There were 3,742 Indigenous people employedlater
There were 3,742 Indigenous people employedlater
0.9% of health occupation workers (Table A.later
0.9% of health occupation workers (Table A.Strait Islander health worker (‘Indigenous lat
er Strait Islander health worker (‘Indigenous
editio
n 5.9% for ‘massage therapy’ and all the complementary therapy occupations (e.g.
editio
n 5.9% for ‘massage therapy’ and all the complementary therapy occupations (e.g.
e medicine), which together averaged 5.4%
editio
n e medicine), which together averaged 5.4%
Indigenous health and community service workers
editio
n Indigenous health and community service workersAt the 2001 census, there were 410,003 people who identified as being of Indigenous origin,
editio
n At the 2001 census, there were 410,003 people who identified as being of Indigenous origin,an increase of 16.2% from 352,970 people in ed
ition
an increase of 16.2% from 352,970 people in 1996. The Indigenous population representededitio
n 1996. The Indigenous population represented
2.4% of the total Australian population in 2001, up from 2.0% in 1996 (ABS 2003a). Theeditio
n
2.4% of the total Australian population in 2001, up from 2.0% in 1996 (ABS 2003a). Thecurrent life expectancy at birth of Indigenous ed
ition
current life expectancy at birth of Indigenous females, around 20 years less than the 77 years and 82 years for males and femalesed
ition
females, around 20 years less than the 77 years and 82 years for males and females
avail
able
Indigenous health and community service workers
avail
able
Indigenous health and community service workersAt the 2001 census, there were 410,003 people who identified as being of Indigenous origin,
avail
ableAt the 2001 census, there were 410,003 people who identified as being of Indigenous origin,
1996. The Indigenous population represented
avail
able1996. The Indigenous population represented
2.4% of the total Australian population in 2001, up from 2.0% in 1996 (ABS 2003a). The
avail
able2.4% of the total Australian population in 2001, up from 2.0% in 1996 (ABS 2003a). The
people is 56 years for males and 63 years for
avail
ablepeople is 56 years for males and 63 years for
females, around 20 years less than the 77 years and 82 years for males and females
avail
able
females, around 20 years less than the 77 years and 82 years for males and femalesrespectively for the total population (ABS 2002b).
avail
able
respectively for the total population (ABS 2002b). Health care provided by Indigenous people
avail
able
Health care provided by Indigenous peopleis one strategy to improve health care and in
avail
able
is one strategy to improve health care and increase the health status and life expectancy of
avail
able
crease the health status and life expectancy of
There were 3,742 Indigenous people employed
avail
able
There were 3,742 Indigenous people employed in health occupations in 2001, comprising
avail
able
in health occupations in 2001, comprising0.9% of health occupation workers (Table A.av
ailab
le
0.9% of health occupation workers (Table A.18). The occupation of Aboriginal and Torresavail
able
18). The occupation of Aboriginal and TorresStrait Islander health worker (‘Indigenous av
ailab
le
Strait Islander health worker (‘Indigenous avail
able
health worker’ in this publication) employedavail
able
health worker’ in this publication) employed853 Indigenous people, which comprised 22.8% of all Indigenous people working in healthav
ailab
le
853 Indigenous people, which comprised 22.8% of all Indigenous people working in healthoccupations and 93.2% of workers in this occupation. A total of 444 people reported a highestav
ailab
le
occupations and 93.2% of workers in this occupation. A total of 444 people reported a highest
19
Health occupationsThere were 450,792 people employed in health occupations in 2001, representing a growth of11.4% since 1996. This chapter provides a brief summary for each of the broad healthoccupations, including growth between 1996 and 2001, hours worked, gross incomeaccording to the census and earnings where available from the ABS Survey of EmployeeEarnings and Hours.
Medical practitionersThe number of medical practitioners (including medical administrators) increased by 12.6%(from 46,043 to 51,859) between the 1996 and 2001 censuses. This was more than the 6.0%population increase. There was considerable variation within this overall increase, rangingfrom decreases of 537 (31.8%) for pathologists and 61 (7.1%) for obstetricians andgynaecologists, to relatively large increases in other medical occupations (Table A.20).Occupations with higher percentage increases were emergency medicine specialists (139 or73.9%), dermatologists (41 or 20.1%), specialist physicians (307 or 18.8%), radiologists (189 or16.0%) and paediatricians (94 or 13.3%). Numerically large increases of 2,772 generalistpractitioners, 304 surgeons and 222 anaesthetists were all slightly below the general overallpercentage increase. There was a substantial increase of 1,803 (93.9%) in medicaladministrators.In 2001, 22.7% of generalist practitioners and 15.5% of specialists worked part-time hours(Table A.16)—an increase from 20.0% and 13.3% respectively in 1996. There was an increasein the proportion of specialists working long hours (49 or more hours per week), from 53.6%to 55.1%, and a decrease for generalist practitioners, from 46.4% to 44.1%. The proportion ofwomen in general practice increased from 32.3% to 34.9% between the censuses. Femalepractitioners work part-time more often than males, and are less likely to work long hours.At the 2001 census, 55.9% of medical practitioners reported annual gross income greater than$78,000 and a further 31.9% reported incomes in the range $41,600–$77,999 (Table A.22). Asnoted previously, income data derived from the census includes all sources; not just incomederived from paid employment. Most generalist practitioner and specialist remuneration inthe private sector is derived from Medicare payments, although medical practitioners alsoreceive payment as salaried and visiting medical practitioners in public hospitals. AustralianHospital Statistics reveal that in 2001–02, recurrent salary and wages expenditure on the18,628 FTE salaried medical officers in public acute and psychiatric hospitals amounted to$2.0 million (AIHW 2002). This equated to around $108,700 per FTE salaried medical officer.For generalist practitioners, the number of Medicare services per capita decreased by 7.3%between 1996–97 and 2001–02, and the fees charged per capita increased by 13.4%. Forspecialists, the Medicare services per capita increased by 17.3% and the Medicare feescharged per capita increased by 32.2% (DoHA 2002).Between May 1995 and May 2002, the base pay (which excludes allowances and overtimeearnings) for salaried medical practitioners increased by 11–12% and that for medicalpractitioners in managerial positions increased by around 33%. Base pay for full-time non-managerial medical practitioners was 63.7% above the health and community servicesindustry average (ABS 2002c).
later
In 2001, 22.7% of generalist practitioners and
later
In 2001, 22.7% of generalist practitioners and (Table A.16)—an increase from 20.0% and 13.3%
later
(Table A.16)—an increase from 20.0% and 13.3%in the proportion of specialists working long
later in the proportion of specialists working long
later to 55.1%, and a decrease for generalist practition
later to 55.1%, and a decrease for generalist practition
women in general practice increased from
later women in general practice increased from
practitioners work part-time more often than later
practitioners work part-time more often than At the 2001 census, 55.9% of medical practitioners reported annual gross income greater thanlat
er At the 2001 census, 55.9% of medical practitioners reported annual gross income greater than$78,000 and a further 31.9% reported incomes in the range $41,600–$77,999 (Table A.22). Aslat
er $78,000 and a further 31.9% reported incomes in the range $41,600–$77,999 (Table A.22). As
editio
n (from 46,043 to 51,859) between the 1996 and 2001 censuses. This was more than the 6.0%
editio
n (from 46,043 to 51,859) between the 1996 and 2001 censuses. This was more than the 6.0%
riation within this overall increase, ranging
editio
n riation within this overall increase, rangingfrom decreases of 537 (31.8%) for pathologists and 61 (7.1%) for obstetricians and
editio
n from decreases of 537 (31.8%) for pathologists and 61 (7.1%) for obstetricians ands in other medical occupations (Table A.20).
editio
n s in other medical occupations (Table A.20).Occupations with higher percentage increases were emergency medicine specialists (139 or
editio
n Occupations with higher percentage increases were emergency medicine specialists (139 or73.9%), dermatologists (41 or 20.1%), specialist physicians (307 or 18.8%), radiologists (189 or
editio
n 73.9%), dermatologists (41 or 20.1%), specialist physicians (307 or 18.8%), radiologists (189 or16.0%) and paediatricians (94 or 13.3%). Nume
editio
n 16.0%) and paediatricians (94 or 13.3%). Numerically large increases of 2,772 generalist
editio
n rically large increases of 2,772 generalist
practitioners, 304 surgeons and 222 anaesthetists were all slightly below the general overall
editio
n practitioners, 304 surgeons and 222 anaesthetists were all slightly below the general overallpercentage increase. There was a substantial increase of 1,803 (93.9%) in medicaled
ition
percentage increase. There was a substantial increase of 1,803 (93.9%) in medical
In 2001, 22.7% of generalist practitioners and editio
n
In 2001, 22.7% of generalist practitioners and
avail
able
rically large increases of 2,772 generalist
avail
able
rically large increases of 2,772 generalistpractitioners, 304 surgeons and 222 anaesthetists were all slightly below the general overall
avail
ablepractitioners, 304 surgeons and 222 anaesthetists were all slightly below the general overall
percentage increase. There was a substantial increase of 1,803 (93.9%) in medical
avail
ablepercentage increase. There was a substantial increase of 1,803 (93.9%) in medical
15.5% of specialists worked part-time hours
avail
able
15.5% of specialists worked part-time hours(Table A.16)—an increase from 20.0% and 13.3%
avail
able
(Table A.16)—an increase from 20.0% and 13.3% respectively in 1996. There was an increase
avail
able
respectively in 1996. There was an increasein the proportion of specialists working long
avail
able
in the proportion of specialists working long hours (49 or more hours per week), from 53.6%
avail
able
hours (49 or more hours per week), from 53.6%
avail
able
to 55.1%, and a decrease for generalist practition
avail
able
to 55.1%, and a decrease for generalist practitioners, from 46.4% to 44.1%. The proportion of
avail
able
ers, from 46.4% to 44.1%. The proportion ofwomen in general practice increased from
avail
able
women in general practice increased from 32.3% to 34.9% between the censuses. Female
avail
able
32.3% to 34.9% between the censuses. Femalepractitioners work part-time more often than
avail
able
practitioners work part-time more often than males, and are less likely to work long hours.
avail
able
males, and are less likely to work long hours.At the 2001 census, 55.9% of medical practitioners reported annual gross income greater thanav
ailab
le
At the 2001 census, 55.9% of medical practitioners reported annual gross income greater than$78,000 and a further 31.9% reported incomes in the range $41,600–$77,999 (Table A.22). Asav
ailab
le
$78,000 and a further 31.9% reported incomes in the range $41,600–$77,999 (Table A.22). Asavail
able
noted previously, income data derived from the avail
able
noted previously, income data derived from the
20
Medical imagingThe medical imaging workforce numbered 8,141 in 2001, a 25.0% increase on the 6,513 in theworkforce in 1996 (Table A.20), much higher than the 6.0% population increase. Diagnosticradiographers, radiation therapists and nuclear medicine technologists increased by 16.0%,15.4% and 12.1% respectively between 1996 and 2001. The number of sonographers increasedby 102.0% to 1,418 and in 2001 made up 17.4% of the medical imaging workforce, up from10.8% in 1996.Some 55.6% of medical imagists had gross annual income in the range $41,600–$77,999 (TableA.22). Sonographers had the highest incomes amongst the medical imaging workforce, with60.9% reporting gross income in the bracket $41,600–$77,999 and a further 12.2% withincomes above $78,000. Between 53.9% and 59.2% of workers in all the other occupations inthe group reported incomes in the range $41,600–$77,999 but did not have as large aproportion with incomes over $78,000.Sonographers generally worked fewer hours than diagnostic radiographers, radiationtherapists and nuclear medicine technologists. Some 39.8% of sonographers worked part-time compared to 29.5%, 22.6% and 21.6% respectively for radiographers, radiation therapistsand nuclear medicine technologists. At the other end of the scale, 5.5% of sonographersworked long hours (49 hours or more per week) compared to 9.5% of radiographers, 4.9% ofradiation therapists and 8.8% of nuclear medicine technologists (Table A.16).
Dental workersThe total dental workforce was 25,884 in 2001—an increase of 11.0% from 23,318 in 1996, andmore than the 6.0% population increase. The number of dentists and dental specialistsincreased by 7.8% to 8,194 between 1996 and 2001. This increase was slightly above theincrease in the population. Dental therapists and hygienists increased by 6.0% overall with adecrease in dental therapists offset by a substantial increase in dental hygienists. There was aminor increase of 1.3% in dental technicians. The number of dental assistants increased by16.3% to comprise 50.6% of the dental workforce in 2001—up from 48.3% in 1996 (TableA.20).Dentist specialists and dentists generally received relatively high incomes with 70.4% ofdental specialists and 48.1% of dentists having incomes higher than $78,000 in 2001. Theannual incomes of a further 14.9% of specialists and 36.9% of dentists were in the range$41,600–$77,999 (Table A.22).Dental hygienists had higher incomes than dental therapists, with 49.7% of hygienistsreceiving more than $41,600 compared to 23.1% of therapists. The majority (55.8%) of dentaltherapists had incomes in the range $20,800–$41,599. Hygienists achieved these higherincomes in fewer working hours than therapists, with 60.6% of hygienists working part-timecompared to 51.8% of therapists and 0.7% compared to 2.0%, respectively, working longhours (49 hours or more per week) (Table A.16).Most (54.7%) dental assistants’ annual incomes were in the range $20,800–$41,599 with 2.0%reporting incomes greater than $41,600. A further 31.6% reported incomes between $10,400and $20,799. In May 2002, the full-time adult base pay for dental assistants was 26.8% belowthe average for the health and community service industries, making dental assistants someof the lowest paid workers in the industries—only slightly above elementary clerks andlabourers. Some 43.6% of dental assistants worked part-time and 2.6% worked long hours.
later
The total dental workforce was 25,884 in 2001—an increase of 11.0% from 23,318 in 1996, and
later
The total dental workforce was 25,884 in 2001—an increase of 11.0% from 23,318 in 1996, andmore than the 6.0% population increase. The
later
more than the 6.0% population increase. The increased by 7.8% to 8,194 between 1996 and 2001. This increase was slightly above the
later increased by 7.8% to 8,194 between 1996 and 2001. This increase was slightly above the
increase in the population. Dental therapists and
later increase in the population. Dental therapists and
decrease in dental therapists offset by a subst
later decrease in dental therapists offset by a subst
minor increase of 1.3% in dental technicians. later
minor increase of 1.3% in dental technicians. later
16.3% to comprise 50.6% of the dental worklater
16.3% to comprise 50.6% of the dental work
editio
n Sonographers generally worked fewer hours than diagnostic radiographers, radiation
editio
n Sonographers generally worked fewer hours than diagnostic radiographers, radiation
Some 39.8% of sonographers worked part-
editio
n Some 39.8% of sonographers worked part-tively for radiographers, radiation therapists
editio
n tively for radiographers, radiation therapistsher end of the scale, 5.5% of sonographers
editio
n her end of the scale, 5.5% of sonographersworked long hours (49 hours or more per week)
editio
n worked long hours (49 hours or more per week) compared to 9.5% of radiographers, 4.9% of
editio
n compared to 9.5% of radiographers, 4.9% of
r medicine technologists (Table A.16).
editio
n r medicine technologists (Table A.16).
The total dental workforce was 25,884 in 2001—an increase of 11.0% from 23,318 in 1996, andeditio
n
The total dental workforce was 25,884 in 2001—an increase of 11.0% from 23,318 in 1996, and
avail
able
r medicine technologists (Table A.16).
avail
able
r medicine technologists (Table A.16).
The total dental workforce was 25,884 in 2001—an increase of 11.0% from 23,318 in 1996, and
avail
able
The total dental workforce was 25,884 in 2001—an increase of 11.0% from 23,318 in 1996, andnumber of dentists and dental specialists
avail
able
number of dentists and dental specialistsincreased by 7.8% to 8,194 between 1996 and 2001. This increase was slightly above the
avail
able
increased by 7.8% to 8,194 between 1996 and 2001. This increase was slightly above theincrease in the population. Dental therapists and
avail
able
increase in the population. Dental therapists and hygienists increased by 6.0% overall with a
avail
able
hygienists increased by 6.0% overall with adecrease in dental therapists offset by a subst
avail
able
decrease in dental therapists offset by a substantial increase in dental
avail
able
antial increase in dentalminor increase of 1.3% in dental technicians.
avail
able
minor increase of 1.3% in dental technicians.
avail
able
The number of dental assistants increased by
avail
able
The number of dental assistants increased by16.3% to comprise 50.6% of the dental workav
ailab
le
16.3% to comprise 50.6% of the dental workforce in 2001—up from 48.3% in 1996 (Tableavail
able
force in 2001—up from 48.3% in 1996 (Table
generally received relatively high incomes with 70.4% ofavail
able
generally received relatively high incomes with 70.4% of
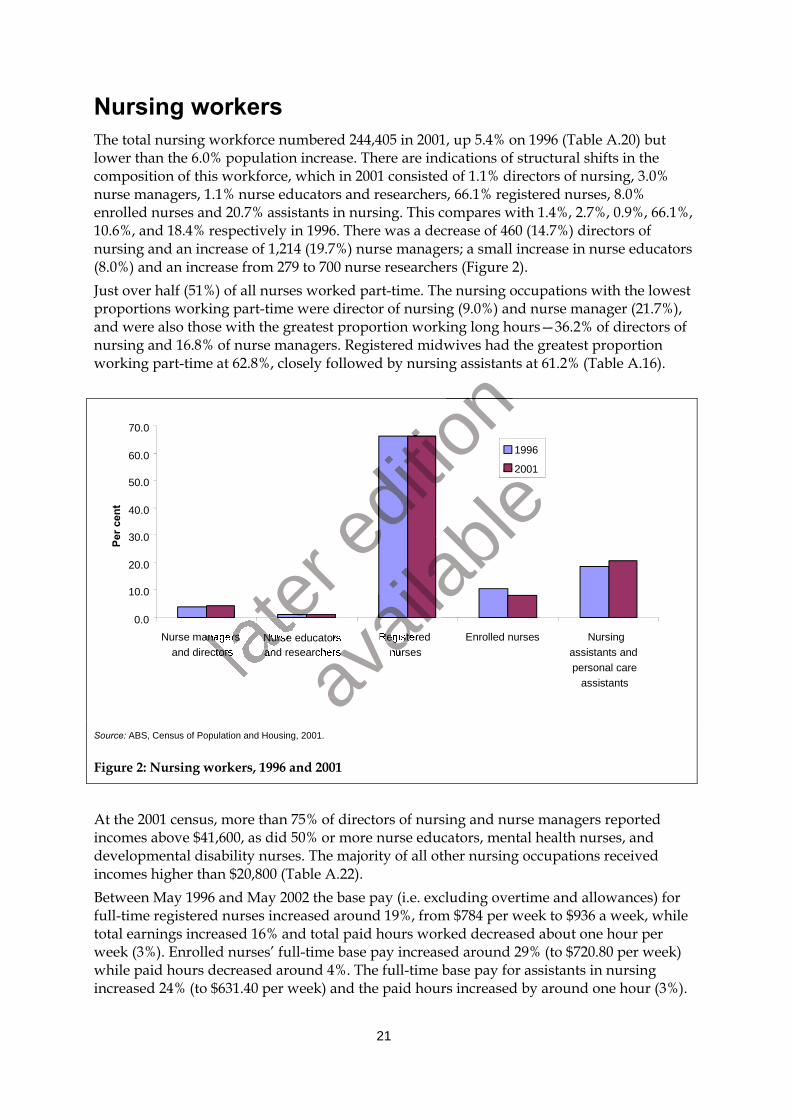
21
Nursing workersThe total nursing workforce numbered 244,405 in 2001, up 5.4% on 1996 (Table A.20) butlower than the 6.0% population increase. There are indications of structural shifts in thecomposition of this workforce, which in 2001 consisted of 1.1% directors of nursing, 3.0%nurse managers, 1.1% nurse educators and researchers, 66.1% registered nurses, 8.0%enrolled nurses and 20.7% assistants in nursing. This compares with 1.4%, 2.7%, 0.9%, 66.1%,10.6%, and 18.4% respectively in 1996. There was a decrease of 460 (14.7%) directors ofnursing and an increase of 1,214 (19.7%) nurse managers; a small increase in nurse educators(8.0%) and an increase from 279 to 700 nurse researchers (Figure 2).Just over half (51%) of all nurses worked part-time. The nursing occupations with the lowestproportions working part-time were director of nursing (9.0%) and nurse manager (21.7%),and were also those with the greatest proportion working long hours—36.2% of directors ofnursing and 16.8% of nurse managers. Registered midwives had the greatest proportionworking part-time at 62.8%, closely followed by nursing assistants at 61.2% (Table A.16).
0.0
10.0
20.0
30.0
40.0
50.0
60.0
70.0
Nurse managersand directors
Nurse educatorsand researchers
Registerednurses
Enrolled nurses Nursingassistants andpersonal care
assistants
Per c
ent
1996
2001
Source: ABS, Census of Population and Housing, 2001.
Figure 2: Nursing workers, 1996 and 2001
At the 2001 census, more than 75% of directors of nursing and nurse managers reportedincomes above $41,600, as did 50% or more nurse educators, mental health nurses, anddevelopmental disability nurses. The majority of all other nursing occupations receivedincomes higher than $20,800 (Table A.22).Between May 1996 and May 2002 the base pay (i.e. excluding overtime and allowances) forfull-time registered nurses increased around 19%, from $784 per week to $936 a week, whiletotal earnings increased 16% and total paid hours worked decreased about one hour perweek (3%). Enrolled nurses’ full-time base pay increased around 29% (to $720.80 per week)while paid hours decreased around 4%. The full-time base pay for assistants in nursingincreased 24% (to $631.40 per week) and the paid hours increased by around one hour (3%).
later
later
later
later
later
later
later
later
later
Nurse managerslater
Nurse managersand directors lat
er and directors
Nurse educatorslater
Nurse educatorsand researcherslater
and researchers
editio
n nursing assistants at 61.2% (Table A.16).
editio
n nursing assistants at 61.2% (Table A.16).
editio
n
editio
n
editio
n
editio
n
editio
n
editio
n
editio
n
editio
n
avail
able
avail
able
avail
able
avail
able
avail
able
avail
able
avail
able
avail
able
Nurse educators
avail
able
Nurse educatorsand researchers
avail
able
and researchersRegistered
avail
able
Registerednurses
avail
able
nurses
avail
able
avail
able
avail
able
avail
able
2001
avail
able
2001
22
In 1996 the base pay for a registered nurse in a non-managerial role was around 88% of thatfor a nurse in a managerial role. By 2002 this difference had disappeared and the base paywas equal (Table A.24 and ABS 2002c).
PharmacistsPharmacists overall increased by 13.0% between 1996 and 2001 to 13,911, which was higherthan the 6.0% population increase. Relatively large decreases in hospital pharmacists (339 or19.6%) and industrial pharmacists (222 or 31.5%) were offset by a relatively large increase(2,161 or 21.9%) in retail pharmacists. Retail pharmacists made up 86.5% of all pharmacists in2001—up from 80.2% in 1996 (Table A.20).In 2001, a similar proportion of both hospital (29.7%) and retail pharmacists (30.7%) workedpart-time. However, far fewer hospital pharmacists (9.6%) worked long hours than retailpharmacists (27.1%) (Table A.16).The Commonwealth Department of Health and Ageing publishes information on theirwebsite (<www.health.gov.au/pbs/pubs/atoz.htm>) relating to the government’sPharmaceutical Benefits Scheme (PBS). The number of prescriptions dispensed under thePBS gives an indication of the dispensing workload of retail pharmacists. There were124.1 million PBS prescriptions dispensed in 1996–97 and 155.0 million in 2001–02 (excludingscripts for Veterans’ Affairs)—a 24.9% increase. In 1996–97 there was an average of 12,560PBS prescriptions per retail pharmacist compared to 12,870 prescriptions per pharmacist in2001–02.At the 2001 census, the income of pharmacists closely reflected the distribution of workinghours. For most pharmacists, their income fell in the range $41,600–$77,999, while 35.6% ofhospital pharmacists and 33.2% of retail pharmacists received incomes less than $41,600.Receiving incomes over $78,000 per year were 5.7% of hospital pharmacists and 22.9% ofretail pharmacists. The pattern for industrial pharmacists differed in that 35.3% had incomesunder $41,600—but 17.3% of this group worked part-time (Table A.22).The average base pay for a full-time adult pharmacist in May 2002 was around $959.70 perweek, which was about 25% above the average base pay for employees in the healthindustries. This base pay had increased by about 25% since May 1996 (unpublished datafrom the ABS Surveys of Employee Earnings and Hours, 1996 and 2002).
Allied health workersMost allied health occupations were numerically small in 2001, but recorded relatively largeincreases between 1996 and 2001. Allied health professionals overall increased by 26.6% withthe numerically largest occupations of physiotherapist, clinical psychologist andoccupational therapist increasing 15.1%, 44.1% and 22.7% to 10,246, 7,567 and 5,353respectively. These increases were all more than the 6.0% population increase over theperiod. The three occupations comprised 58.7% of this group (Table A.20).At the 2001 census, allied health workers reported a wide range of incomes, with 38.2%reporting in the range $41,600–$77,999 and 37.7% in the range $20,800–$41,599 (Table A.22).A few occupations reported sizeable proportions with annual incomes above $78,000 (21.3%of optometrists, 20.7% of chiropractors and 16.1% of osteopaths).
later
At the 2001 census, the income of pharmacists
later
At the 2001 census, the income of pharmacists hours. For most pharmacists, their income fell in the range $41,600–$77,999, while 35.6% of
later
hours. For most pharmacists, their income fell in the range $41,600–$77,999, while 35.6% ofhospital pharmacists and 33.2% of retail ph
later hospital pharmacists and 33.2% of retail ph
Receiving incomes over $78,000 per year were
later Receiving incomes over $78,000 per year were
later retail pharmacists. The pattern for industrial
later retail pharmacists. The pattern for industrial
under $41,600—but 17.3% of this group worked part-time (Table A.22).later under $41,600—but 17.3% of this group worked part-time (Table A.22).
The average base pay for a full-time adult plater
The average base pay for a full-time adult pweek, which was about 25% ablat
er week, which was about 25% ab
editio
n The Commonwealth Department of Health and Ageing publishes information on their
editio
n The Commonwealth Department of Health and Ageing publishes information on theirwebsite (<www.health.gov.au/pbs/pubs/atoz.htm>) relating to the government’s
editio
n website (<www.health.gov.au/pbs/pubs/atoz.htm>) relating to the government’snumber of prescriptions dispensed under the
editio
n number of prescriptions dispensed under theworkload of retail pharmacists. There were
editio
n workload of retail pharmacists. There were
124.1 million PBS prescriptions dispensed in
editio
n 124.1 million PBS prescriptions dispensed in 1996–97 and 155.0 million
editio
n 1996–97 and 155.0 million
scripts for Veterans’ Affairs)—a 24.9% increa
editio
n scripts for Veterans’ Affairs)—a 24.9% increase. In 1996–97 there was an average of 12,560
editio
n se. In 1996–97 there was an average of 12,560
PBS prescriptions per retail pharmacist compar
editio
n PBS prescriptions per retail pharmacist compared to 12,870 prescriptions per pharmacist in
editio
n ed to 12,870 prescriptions per pharmacist in
At the 2001 census, the income of pharmacists editio
n
At the 2001 census, the income of pharmacists hours. For most pharmacists, their income fell in the range $41,600–$77,999, while 35.6% ofed
ition
hours. For most pharmacists, their income fell in the range $41,600–$77,999, while 35.6% of
avail
able
se. In 1996–97 there was an average of 12,560
avail
able
se. In 1996–97 there was an average of 12,560ed to 12,870 prescriptions per pharmacist in
avail
ableed to 12,870 prescriptions per pharmacist in
closely reflected the distribution of working
avail
ableclosely reflected the distribution of working
hours. For most pharmacists, their income fell in the range $41,600–$77,999, while 35.6% of
avail
able
hours. For most pharmacists, their income fell in the range $41,600–$77,999, while 35.6% ofarmacists received incomes less than $41,600.
avail
able
armacists received incomes less than $41,600.Receiving incomes over $78,000 per year were
avail
able
Receiving incomes over $78,000 per year were
avail
able
5.7% of hospital pharmacists and 22.9% of
avail
able
5.7% of hospital pharmacists and 22.9% ofretail pharmacists. The pattern for industrial
avail
able
retail pharmacists. The pattern for industrial pharmacists differed in that 35.3% had incomes
avail
able
pharmacists differed in that 35.3% had incomesunder $41,600—but 17.3% of this group worked part-time (Table A.22).
avail
able
under $41,600—but 17.3% of this group worked part-time (Table A.22).The average base pay for a full-time adult p
avail
able
The average base pay for a full-time adult pharmacist in May 2002 was around $959.70 per
avail
able
harmacist in May 2002 was around $959.70 perove the average base pay for employees in the healthav
ailab
le
ove the average base pay for employees in the healthavail
able
industries. This base pay had increased byavail
able
industries. This base pay had increased by about 25% since May 1996 (unpublished dataavail
able
about 25% since May 1996 (unpublished datafrom the ABS Surveys of Employee Earnings and Hours, 1996 and 2002).av
ailab
le
from the ABS Surveys of Employee Earnings and Hours, 1996 and 2002).
23
Over three-quarters of the allied health professionals worked 40 hours a week or less —42.1% worked part-time and 35.5% worked 35–40 hours per week. This was similar to theprofile of all health workers, of whom 77.3% worked 40 hours per week or less (Table A.16).
Complementary therapies workersAs with the allied health occupations, the complementary therapies occupations werenumerically small in 2001 (8,533 in total), but had increased substantially (by 31%) since 1996.Complementary therapies workers overall recorded an increase of 31.2% between 1996 and2001. Naturopathy was the largest profession in the group with 2,502 members in 2001—anincrease of 31.3% since 1996. Natural remedy consultants and chiropractors had 2,345 and2,072 members respectively. These three professions comprised 81.1% of this group.Over half (55.4%) of complementary therapy professionals worked part-time—those workingless than 16 hours per week made up the numerically largest group. Apart fromchiropractors and osteopaths, who generally reported incomes in the higher ranges, mostother practitioners of complementary therapies received incomes below $41,600 (Table A.22).
Other health workersOther health workers may be divided into two groups—a group who mainly work in thehealth and community services industries, and a second group who mainly work ingovernment administration or other industries.The first group increased in numbers by 38.4% between the censuses, with most occupationsrecording substantial relative increases. Medical technical officers, the largest group in 2001,increased by 5,709 (69.5%) to 13,927 members, with most of the increase occurring in thepathology services industry. There was a smaller increase of 1,595 medical scientists (16.8%),the largest group in 1996, but the second largest in 2001. The numbers of massage therapistsand anatomists or physiologists more than doubled to 4,921 and 512 respectively, and therewere overall increases of 166 (48.0%) for biomedical engineers, 218 (30.8%) for Indigenoushealth workers and 747 (12.5%) overall for the two ambulance occupations (ambulanceofficers and intensive care ambulance paramedics) (AIHW 1996 and Table A.20).Between 1996 and 2001, the second group decreased overall by 1.0% with an increase of 166(48.0%) biomedical engineers, 667 (23.8%) occupational health and safety officers and 898(24.5%) safety inspectors. These increases did not offset the decrease of 1,816 (35.4%)environmental health officers and a small decrease of 46 (1.6%) primary products inspectorsand 31 (3.9%) weight loss consultants (Table A.20).Between 1996 and 2001, ambulance officers and intensive care ambulance paramedicstogether increased by 12.4% to 6,708 officers. However, there was a major structural shift inthe numbers in each occupation. In 2001, there were 3,464 intensive care ambulanceparamedics and they comprised 51.6% of the two occupations together—up from 1,849 and31.0% in 1996. The proportion of paramedics differs widely among the states and territories,with New South Wales having 17.6% paramedics, the Northern Territory 42.6%, Tasmania52.0%, South Australia 60.9%, Western Australia 66.9%, Queensland and the AustralianCapital Territory both with 72.6%, and Victoria 75.8% paramedics.A small proportion of ambulance officers and intensive care ambulance paramedics workedpart-time, 8.4% and 5.5% respectively, and almost equal numbers worked 49 or more hours
later
The first group increased in numbers by 38.4% between the censuses, with most occupations
later
The first group increased in numbers by 38.4% between the censuses, with most occupationsrecording substantial relative in
later
recording substantial relative increases. Medical technical officers, the largest group in 2001,
later creases. Medical technical officers, the largest group in 2001,
increased by 5,709 (69.5%) to 13,927 members, wi
later increased by 5,709 (69.5%) to 13,927 members, wi
pathology services industry. There was a smaller
later pathology services industry. There was a smaller
the largest group in 1996, but the second larg
later the largest group in 1996, but the second larg
later
and anatomists or physiologists more than doubled to 4,921 and 512 respectively, and therelater
and anatomists or physiologists more than doubled to 4,921 and 512 respectively, and therewere overall increases of 166 (48.0%) for biomlat
er were overall increases of 166 (48.0%) for biomhealth workers and 747 (12.5%) overall folat
er health workers and 747 (12.5%) overall fo
editio
n less than 16 hours per week made up the numerically largest group. Apart from
editio
n less than 16 hours per week made up the numerically largest group. Apart from
ported incomes in the higher ranges, most
editio
n ported incomes in the higher ranges, mosts received incomes below $41,600 (Table A.22).
editio
n s received incomes below $41,600 (Table A.22).
Other health workers may be divided into tw
editio
n Other health workers may be divided into two groups—a group who mainly work in the
editio
n o groups—a group who mainly work in the
health and community services industrieseditio
n health and community services industries, and a second group who mainly work ined
ition
, and a second group who mainly work ingovernment administration or other industries.ed
ition
government administration or other industries.The first group increased in numbers by 38.4% between the censuses, with most occupationsed
ition
The first group increased in numbers by 38.4% between the censuses, with most occupations
avail
ableo groups—a group who mainly work in the
avail
ableo groups—a group who mainly work in the
, and a second group who mainly work in
avail
able, and a second group who mainly work in
The first group increased in numbers by 38.4% between the censuses, with most occupations
avail
able
The first group increased in numbers by 38.4% between the censuses, with most occupationscreases. Medical technical officers, the largest group in 2001,
avail
able
creases. Medical technical officers, the largest group in 2001,increased by 5,709 (69.5%) to 13,927 members, wi
avail
able
increased by 5,709 (69.5%) to 13,927 members, with most of the increase occurring in the
avail
able
th most of the increase occurring in thepathology services industry. There was a smaller
avail
able
pathology services industry. There was a smaller increase of 1,595 medical scientists (16.8%),
avail
able
increase of 1,595 medical scientists (16.8%),the largest group in 1996, but the second larg
avail
able
the largest group in 1996, but the second larg
avail
able
est in 2001. The numbers of massage therapists
avail
able
est in 2001. The numbers of massage therapistsand anatomists or physiologists more than doubled to 4,921 and 512 respectively, and there
avail
able
and anatomists or physiologists more than doubled to 4,921 and 512 respectively, and therewere overall increases of 166 (48.0%) for biomav
ailab
le
were overall increases of 166 (48.0%) for biomedical engineers, 218 (30.8%) for Indigenousavail
able
edical engineers, 218 (30.8%) for Indigenoushealth workers and 747 (12.5%) overall foav
ailab
le
health workers and 747 (12.5%) overall for the two ambulance occupations (ambulanceavail
able
r the two ambulance occupations (ambulanceofficers and intensive care ambulanc av
ailab
le
officers and intensive care ambulance paramedics) (AIHW 1996 and Table A.20).avail
able
e paramedics) (AIHW 1996 and Table A.20).

24
per week, 27.5% and 29.2% respectively (for which overtime payments may have applied)(Table A.16). The income that was recorded in the 2001 census would give an indication ofthe relative salary difference. Some 62.2% of ambulance officers and 80.7% of paramedics hadincomes above $41,600 per year (Table A.22).In the other occupations in this group, those that stand out are:� massage therapists and weight loss consultants—about 75% of workers in each
occupation worked part-time, with resultant relatively low incomes� biomedical engineers, with 3.4% working part-time, 22.9% working long hours and 76.0%
earning more than $41,600 per year.
later
editio
n
avail
able
25
Community services occupationsIn this section, occupations are grouped in categories that reflect the service or clients dealtwith by that occupation and relate to other statistics published by AIHW. The distinctionbetween the client group of an occupation is not always clear. For example, the ASCO jobdescription of residential care officer is one who ‘provides care and supervision for children ordisabled persons in group homes or government institutions’. An aged or disabled personcarer ‘provides care for aged or disabled people in their homes’ (ABS 1997). These occupationshave been allocated to the group that other AIHW data would indicate is the main clientgroup, that is, residential care officer has been allocated to ‘disability services’ and aged anddisabled person carer has not been grouped with another occupation.There were 237,055 persons employed in the 29 community services occupations shown inthis publication. Of those employed persons, 130,664 (56.8%) are in the general group ofoccupations called ‘carers and aides’. These occupations are predominantly female andcharacterised by relatively low income and large numbers in part-time work.Comparison of community services occupation data between the 1996 and 2001 censuseslend additional support to trends discussed in the chapter on de-institutionalisation in theAIHW publication Australia’s welfare 2001 (AIHW 2001).This chapter provides a brief summary for each of the broad community servicesoccupations, including growth between 1996 and 2001, hours worked, gross incomeaccording to the 2001 census, and earnings where available from the ABS Survey ofEmployee Earnings and Hours.
Child and youth services workersPre-primary and special education are in the education industry in ANZSIC but performfunctions classified as community service activities or are directed at community servicesspecial needs target groups.Overall, the workforce increased by 8,418 (9.0%) workers to 101,691 workers. Structuralchange appeared to have occurred in the child, youth and family services workforce between1996 and 2001. A move of day care services for children from either the child’s or carer’shome, by carers who may not have relevant qualifications, to childcare centres with qualifiedstaff was evident. There was a decrease of 7,558 in family day care worker, nanny andchildcare coordinator and an increase of 13,989 child care workers, for an overall increase of10.5% in workers providing day care services for children. In pre-primary schooling, therewas a 12.5% increase in pre-primary teachers and a 52.3% increase in pre-school aides so thatthe ratio was one aide to three teachers in 2001—up from 1:4 in 1996 (Table A.21).Child or youth residential carers decreased by 3,108 (86.5%) between 1996 and 2001. Theseworkers provided care for children in correctional service institutions. This decline, alongwith an increase of 777 (14.4%) in the number of youth workers (who provide care in thecommunity) indicates possible restructure in this industry.In the 2001 census, child and youth workers had relatively low incomes, with 8.1% of theoverall group (mainly the pre-primary teachers) receiving more than $41,600 and half (50.1%)less than $20,800 (Table A.23). The distribution is largely related to the hours worked, as
later
Employee Earnings and Hours.
later
Employee Earnings and Hours.
Child and youth services workers
later Child and youth services workers
Pre-primary and special education are in thlater
Pre-primary and special education are in thlater
functions classified as communilater
functions classified as communispecial needs target groups.lat
er special needs target groups.
editio
n s, 130,664 (56.8%) are in the general group of
editio
n s, 130,664 (56.8%) are in the general group ofoccupations are predominantly female and
editio
n occupations are predominantly female and and large numbers in part-time work.
editio
n and large numbers in part-time work.on data between the 1996 and 2001 censuses
editio
n on data between the 1996 and 2001 censuseslend additional support to trends discussed in
editio
n lend additional support to trends discussed in the chapter on de-institutionalisation in the
editio
n the chapter on de-institutionalisation in the
(AIHW 2001).
editio
n (AIHW 2001).
This chapter provides a brief summary fo
editio
n This chapter provides a brief summary for each of the broad community services
editio
n r each of the broad community services
occupations, including growth between 1996 and 2001, hours worked, gross income
editio
n occupations, including growth between 1996 and 2001, hours worked, gross incomeaccording to the 2001 census, and earningsed
ition
according to the 2001 census, and earnings where available from the ABS Survey ofeditio
n where available from the ABS Survey of
avail
able
r each of the broad community services
avail
able
r each of the broad community servicesoccupations, including growth between 1996 and 2001, hours worked, gross income
avail
ableoccupations, including growth between 1996 and 2001, hours worked, gross income
where available from the ABS Survey of
avail
able where available from the ABS Survey of
Child and youth services workers
avail
able
Child and youth services workersPre-primary and special education are in th
avail
able
Pre-primary and special education are in the education industry in ANZSIC but perform
avail
able
e education industry in ANZSIC but perform
avail
able
ty service activities or are directed at community services
avail
able
ty service activities or are directed at community services
Overall, the workforce increased by 8,418 (9avail
able
Overall, the workforce increased by 8,418 (9change appeared to have occurred in the child, youth and family services workforce betweenav
ailab
le
change appeared to have occurred in the child, youth and family services workforce between
26
49.7% of the group worked part-time (Table A.17). Base pay for full-time adult child careworkers was around $511 per week in May 2002—an increase of about 10% from May 1996.
Family services workersWelfare workers and family support workers in this group increased 44.3% and 38.2%respectively between 1996 and 2001. The exception was family counsellor (provides marriageor relationship counselling) that decreased 6.4% in the same period (Table A.21).The workers in these occupations do not generally work long hours, with only 7.2% overallworking 49 or more hours per week. A little more than one-third (35.5%) of welfare workersworked part-time, and over half the family counsellors and family support workers workedpart-time—52.4% and 57.4% respectively (Table A.17).In May 2002, the average full-time adult base pay for social welfare professionals, whichincludes family counsellors, was around $811 per week, and that for family support workerswas around $670 per week (Table A.24 and unpublished data from the ABS Survey ofEmployee Earnings and Hours, 2002).
Disability services workersBetween censuses, the most notable change was the 7,519 (261.3%) increase in integrationaides to 10,396; these aides assist children with developmental disabilities in mainstreamschools. Residential care officers (who provide care and supervision for children or disabledpeople in group housing) increased by 178.3% to 2,825 persons and disabilities servicesofficer increased by 26.4% to 6,232 persons between 1996 and 2001. Special educationteachers had an overall increase of 741 (6.9%) (Table A.21).The distribution of income for special education teachers and integration aides is related tohours worked. There were 59.8% of special needs teachers working full-time and 54.9% withincomes over $41,600 per year. Some 85.4% of integration aides worked part-time and 64.3%received incomes of less than $20,800 (Tables A.17 and A.23).Most residential care and disabilities services officers had incomes below $41,600 per year,with 83.3% in this category—with 32.8% working part-time. Some 16.5% received more than$41,600—and 9.1% of these officers worked long hours (49 hours per week or more). In May2002, the average base pay for full-time adult welfare associate professionals, which includesthese officers, was around $670 per week (Table A.24).
Aged or disabled care workersHome and Community Care (HACC), Community Aged Care Packages (CACP) and, sinceJanuary 2001, Veterans’ Home Care, are all programs that provide care in the home of anaged or disabled person. Around 70% of HACC clients are aged 70 or over. The number ofCACPs almost quadrupled in number between 1997 and 2001 to 24,430 packages (AIHW2001a).The occupation of aged and disabled carer performs the task of providing ‘general householdassistance, emotional support, care and companionship for aged and disabled in their homes’
later
schools. Residential care officers (who provid
later
schools. Residential care officers (who providpeople in group housing) increased by 178.3% to 2,825 persons and disabilities services
later
people in group housing) increased by 178.3% to 2,825 persons and disabilities servicesofficer increased by 26.4% to 6,232 persons between 1996 and 2001. Special education
later
officer increased by 26.4% to 6,232 persons between 1996 and 2001. Special educationteachers had an overall increase of 741 (6.9%) (Table A.21).
later teachers had an overall increase of 741 (6.9%) (Table A.21).
The distribution of income for special educatio
later The distribution of income for special educatio
hours worked. There were 59.8% of special needs teachers working full-time and 54.9% withlater hours worked. There were 59.8% of special needs teachers working full-time and 54.9% with
incomes over $41,600 per year. Some 85.4% of integration aides worked part-time and 64.3%later
incomes over $41,600 per year. Some 85.4% of integration aides worked part-time and 64.3%later
received incomes of less than $20,800 (Tables A.17 and A.23).later
received incomes of less than $20,800 (Tables A.17 and A.23).
editio
n r week, and that for family support workers
editio
n r week, and that for family support workers
unpublished data from the ABS Survey of
editio
n unpublished data from the ABS Survey of
Disability services workers
editio
n Disability services workersBetween censuses, the most notable change was the 7,519 (261.3%) increase in integration
editio
n Between censuses, the most notable change was the 7,519 (261.3%) increase in integrationaides to 10,396; these aides assist children ed
ition
aides to 10,396; these aides assist children with developmental disaeditio
n with developmental disa
schools. Residential care officers (who provideditio
n
schools. Residential care officers (who provide care and supervision for children or disablededitio
n
e care and supervision for children or disabledpeople in group housing) increased by 178.3% to 2,825 persons and disabilities servicesed
ition
people in group housing) increased by 178.3% to 2,825 persons and disabilities services
avail
ableBetween censuses, the most notable change was the 7,519 (261.3%) increase in integration
avail
ableBetween censuses, the most notable change was the 7,519 (261.3%) increase in integration
with developmental disa
avail
ablewith developmental disabilities in mainstream
avail
ablebilities in mainstream
e care and supervision for children or disabled
avail
ablee care and supervision for children or disabled
people in group housing) increased by 178.3% to 2,825 persons and disabilities services
avail
able
people in group housing) increased by 178.3% to 2,825 persons and disabilities servicesofficer increased by 26.4% to 6,232 persons between 1996 and 2001. Special education
avail
able
officer increased by 26.4% to 6,232 persons between 1996 and 2001. Special educationteachers had an overall increase of 741 (6.9%) (Table A.21).
avail
able
teachers had an overall increase of 741 (6.9%) (Table A.21).The distribution of income for special educatio
avail
able
The distribution of income for special education teachers and integration aides is related to
avail
able
n teachers and integration aides is related tohours worked. There were 59.8% of special needs teachers working full-time and 54.9% with
avail
able
hours worked. There were 59.8% of special needs teachers working full-time and 54.9% withincomes over $41,600 per year. Some 85.4% of integration aides worked part-time and 64.3%
avail
able
incomes over $41,600 per year. Some 85.4% of integration aides worked part-time and 64.3%
avail
able
received incomes of less than $20,800 (Tables A.17 and A.23).avail
able
received incomes of less than $20,800 (Tables A.17 and A.23).Most residential care and disabilities servicav
ailab
le
Most residential care and disabilities servicwith 83.3% in this category—with 32.8% working part-time. Some 16.5% received more thanav
ailab
le
with 83.3% in this category—with 32.8% working part-time. Some 16.5% received more than
27
(ABS 1997). A number of workers providing home care may be in other occupations but themajority of home care is provided by workers in this occupation.Between 1996 and 2001, the number of aged and disabled carers increased by 44.1% to 51,792.At the 2001 census, 70.0% reported working part-time hours and 5.9% reported working longhours. Reflecting the relatively large proportion of part-time workers in this group, 40.1%reported incomes between $20,800 and $40,599 per year, 39.7% between $10,400 and $20,799,and 14.4% less than $10,400 per year (Tables A.17, A.21 and A.23).In May 2002, the full-time adult base pay for special care workers was around $665 per weekbut the average pay of all these workers, including those working part-time, was around$370 per week (Table A.24).
Other community services workersWelfare, social and community worker numbers increased by 38.5% between the 1996 and2001 censuses. The 17,113 community workers are the largest occupation in the group and,together with the 9,302 social security assessors and the 9,110 social workers, comprise 86.7%of the group in 2001. In 2001, there were 1,532 rehabilitation counsellors and 1,099 drug andalcohol counsellors, an increase of 326 (27.0%) and 343 (45.4%) respectively since 1996. The368 refuge workers are the smallest occupation in the group (Table A.21).In the 2001 census, 43.6% of social workers and 33.2% of community workers reportedincomes greater than $41,600, and 9.5% and 15.6%, respectively, reported incomes under$20,800. Large differences in incomes were evident in 2001 between rehabilitation counsellorsand drug and alcohol counsellors. Of rehabilitation counsellors, 58.2% received more than$41,600, compared with 24.8% of drug and alcohol counsellors. Most (62.2%) drug andalcohol counsellors had incomes in the range $20,800–$41,599 (Table A.23). This disparity isnot explained by a difference in hours worked, as similar proportions of each occupationworked part-time and long hours (Table A.17).In May 2002, the average full-time adult base pay for social welfare professionals, whichincludes social and community workers, and rehabilitation and drug and alcoholcounsellors, was around $810 per week—about 6% above the health and community servicesindustry average (Table A.24).
later
and drug and alcohol counsellors. Of rehabilitation counsellors, 58.2% received more than
later
and drug and alcohol counsellors. Of rehabilitation counsellors, 58.2% received more than$41,600, compared with 24.8% of drug and
later
$41,600, compared with 24.8% of drug and alcohol counsellors had incomes in the range
later alcohol counsellors had incomes in the range
later not explained by a difference in hours worked
later not explained by a difference in hours worked
worked part-time and long hours (Table A.17).
later worked part-time and long hours (Table A.17).
In May 2002, the average full-time adult base later
In May 2002, the average full-time adult base includes social and community workers,lat
er includes social and community workers,counsellors, was around $810 per week—about 6% above the health and community serviceslat
er counsellors, was around $810 per week—about 6% above the health and community services
editio
n ers increased by 38.5% between the 1996 and
editio
n ers increased by 38.5% between the 1996 and
e the largest occupation in the group and,
editio
n e the largest occupation in the group and,rs and the 9,110 social workers, comprise 86.7%
editio
n rs and the 9,110 social workers, comprise 86.7%532 rehabilitation counsellors and 1,099 drug and
editio
n 532 rehabilitation counsellors and 1,099 drug andalcohol counsellors, an increase of 326 (27.0%) and 343 (45.4%) respectively since 1996. The
editio
n alcohol counsellors, an increase of 326 (27.0%) and 343 (45.4%) respectively since 1996. The
ccupation in the group (Table A.21).
editio
n ccupation in the group (Table A.21).
In the 2001 census, 43.6% of social worker
editio
n In the 2001 census, 43.6% of social workers and 33.2% of community workers reported
editio
n s and 33.2% of community workers reported
incomes greater than $41,600, and 9.5% and 15.6%, respectively, reported incomes under
editio
n incomes greater than $41,600, and 9.5% and 15.6%, respectively, reported incomes under$20,800. Large differences in incomes were evided
ition
$20,800. Large differences in incomes were evident in 2001 between rehabilitation counsellorseditio
n ent in 2001 between rehabilitation counsellors
and drug and alcohol counsellors. Of rehabilitation counsellors, 58.2% received more thaneditio
n
and drug and alcohol counsellors. Of rehabilitation counsellors, 58.2% received more than$41,600, compared with 24.8% of drug and ed
ition
$41,600, compared with 24.8% of drug and alcohol counsellors. Most (62.2%) drug andeditio
n
alcohol counsellors. Most (62.2%) drug and
avail
able
ccupation in the group (Table A.21).
avail
able
ccupation in the group (Table A.21).s and 33.2% of community workers reported
avail
able
s and 33.2% of community workers reportedincomes greater than $41,600, and 9.5% and 15.6%, respectively, reported incomes under
avail
ableincomes greater than $41,600, and 9.5% and 15.6%, respectively, reported incomes under
ent in 2001 between rehabilitation counsellors
avail
ableent in 2001 between rehabilitation counsellors
and drug and alcohol counsellors. Of rehabilitation counsellors, 58.2% received more than
avail
ableand drug and alcohol counsellors. Of rehabilitation counsellors, 58.2% received more than
alcohol counsellors. Most (62.2%) drug and
avail
able
alcohol counsellors. Most (62.2%) drug and$20,800–$41,599 (Table A.23). This disparity is
avail
able
$20,800–$41,599 (Table A.23). This disparity is
avail
able
not explained by a difference in hours worked
avail
able
not explained by a difference in hours worked, as similar proportions of each occupation
avail
able
, as similar proportions of each occupationworked part-time and long hours (Table A.17).
avail
able
worked part-time and long hours (Table A.17).In May 2002, the average full-time adult base
avail
able
In May 2002, the average full-time adult base pay for social welfare professionals, which
avail
able
pay for social welfare professionals, whichincludes social and community workers,
avail
able
includes social and community workers, and rehabilitation and drug and alcohol
avail
able
and rehabilitation and drug and alcoholcounsellors, was around $810 per week—about 6% above the health and community servicesav
ailab
le
counsellors, was around $810 per week—about 6% above the health and community services
28
Geographic regionsThis chapter discusses the provision of health and community services workers across thegeographic areas based on location of workplace. There are some factors that must be takeninto consideration when comparing the number of health and community services workersacross those areas. These include the placement of health care facilities, some blending of theroles of health and community services workers in more remote communities, thedemographic characteristics of the populations in different regions of Australia and theirpatterns of service usage.Because of the need for cost-effective utilisation of expensive equipment and/or to achieveand maintain clinical competence in complex and costly procedures, it may be feasible tohave only a limited number of health care establishments, such as hospitals, providingcertain specialised health services. These establishments are invariably located in largepopulation centres, which will increase the number of health workers in those places—butthese workers may service patients or clients from a much wider area.In less accessible areas, some occupations may partially take over some functions of otheroccupations. For example, certain registered nurses (nurse practitioners) are able to performsome of the functions of generalist practitioners, such as prescribing certain medications.Patterns of use can vary between regions according to their different age, sex, disease profilesand other characteristics. For example, usage rates for communities with relatively largeproportions of elderly people, very young children or women of child-bearing age would beexpected to be higher than for, say, communities with high proportions of men and womenin early adulthood, such as inner city areas (ABS 1999). The types of services would varycorrespondingly—from aged care services and treatment of diseases that are prevalent inolder age groups to family support services, obstetric care and paediatrics for young families.Data in this publication are shown with two different regional classifications—ASGCremoteness areas and detailed statistical region structure (see Explanatory notes). Industrydata, which includes employment for all support staff in addition to health and communityservices professionals, are shown by remoteness area. The data for the 105 identified healthand community services occupations in this publication are shown by the more detailedstatistical region classification.
Industry by remoteness areasIn the health industries overall, nationally the Major cities had double the number of personsemployed per 100,000 population than Very remote areas in Australia. There is considerablevariation among the states and territories, however. It might be expected that the supply ofhealth practitioners would decline with increasing remoteness, but only Western Australiaand South Australia showed this pattern. However, Victoria does not have a Very remotearea. In the Northern Territory the Remote area, which includes Alice Springs and itsimmediate hinterland, ranked third nationally behind the areas that include Adelaide andHobart, and was well above the national average, while Outer regional Australia, whichincludes Darwin, was below the national average. The Very remote area in the NorthernTerritory had the lowest supply nationally of persons in health industries (Table A.27).
later
expected to be higher than for, say, communi
later
expected to be higher than for, say, communi
later
in early adulthood, such as inner city areas (ABS 1999). The types of services would vary
later
in early adulthood, such as inner city areas (ABS 1999). The types of services would varycorrespondingly—from aged care services and
later correspondingly—from aged care services and
older age groups to family support services, obstetric care and paediatrics for young families.
later older age groups to family support services, obstetric care and paediatrics for young families.
Data in this publication are shown with
later Data in this publication are shown with
remoteness areas and detailed statistical regilater
remoteness areas and detailed statistical regilater
data, which includes employment for all supportlater
data, which includes employment for all supportservices professionals, are shown by remotenelat
er services professionals, are shown by remotene
editio
n blishments are invariab
editio
n blishments are invariab
population centres, which will increase the number of health workers in those places—but
editio
n population centres, which will increase the number of health workers in those places—but clients from a much wider area.
editio
n clients from a much wider area.partially take over some functions of other
editio
n partially take over some functions of otheroccupations. For example, certain registered nurs
editio
n occupations. For example, certain registered nurses (nurse practitioners)
editio
n es (nurse practitioners)
some of the functions of generalist practition
editio
n some of the functions of generalist practitioners, such as prescribing certain medications.
editio
n ers, such as prescribing certain medications.
Patterns of use can vary between regions accordin
editio
n Patterns of use can vary between regions according to their different age, sex, disease profiles
editio
n g to their different age, sex, disease profiles
and other characteristics. For example, usage
editio
n and other characteristics. For example, usage rates for communities with relatively large
editio
n rates for communities with relatively large
proportions of elderly people, very young cheditio
n proportions of elderly people, very young children or women of child-bearing age would beed
ition
ildren or women of child-bearing age would beexpected to be higher than for, say, communied
ition
expected to be higher than for, say, communities with high proporeditio
n
ties with high proporin early adulthood, such as inner city areas (ABS 1999). The types of services would varyed
ition
in early adulthood, such as inner city areas (ABS 1999). The types of services would vary
avail
able
ers, such as prescribing certain medications.
avail
able
ers, such as prescribing certain medications.g to their different age, sex, disease profiles
avail
able
g to their different age, sex, disease profilesrates for communities with relatively large
avail
ablerates for communities with relatively large
ildren or women of child-bearing age would be
avail
ableildren or women of child-bearing age would be
ties with high propor
avail
ableties with high propor
avail
able
in early adulthood, such as inner city areas (ABS 1999). The types of services would vary
avail
able
in early adulthood, such as inner city areas (ABS 1999). The types of services would varycorrespondingly—from aged care services and
avail
able
correspondingly—from aged care services and treatment of diseases that are prevalent in
avail
able
treatment of diseases that are prevalent inolder age groups to family support services, obstetric care and paediatrics for young families.
avail
able
older age groups to family support services, obstetric care and paediatrics for young families.Data in this publication are shown with
avail
able
Data in this publication are shown with two different regional classifications—ASGC
avail
able
two different regional classifications—ASGCremoteness areas and detailed statistical regi
avail
able
remoteness areas and detailed statistical region structure (see Explanatory notes). Industry
avail
able
on structure (see Explanatory notes). Industry
avail
able
data, which includes employment for all support
avail
able
data, which includes employment for all supportservices professionals, are shown by remoteneav
ailab
le
services professionals, are shown by remoteneavail
able
and community services occupations in this publication are shown by the more detailedavail
able
and community services occupations in this publication are shown by the more detailed
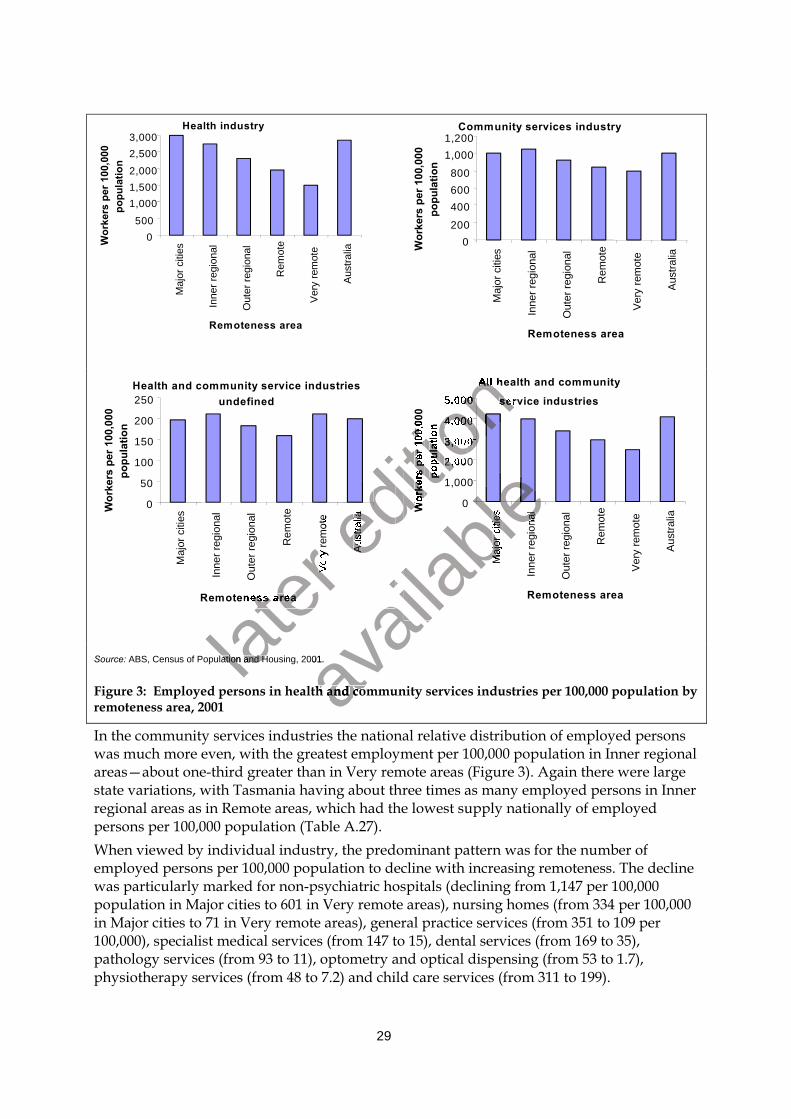
29
Health industry
0500
1,0001,5002,000
2,5003,000
Maj
or c
ities
Inne
r reg
iona
l
Out
er re
gion
al
Rem
ote
Ver
y re
mot
e
Aus
tralia
Remoteness area
Wor
kers
per
100
,000
popu
latio
nCommunity services industry
0200
400600800
1,0001,200
Maj
or c
ities
Inne
r reg
iona
l
Out
er re
gion
al
Rem
ote
Ver
y re
mot
e
Aus
tralia
Remoteness area
Wor
kers
per
100
,000
popu
latio
n
Health and community service industriesundefined
0
50
100
150
200
250
Maj
or c
ities
Inne
r reg
iona
l
Out
er re
gion
al
Rem
ote
Ver
y re
mot
e
Aus
tralia
Remoteness area
Wor
kers
per
100
,000
popu
latio
n
All health and community
service industries
0
1,000
2,000
3,000
4,000
5,000
Maj
or c
ities
Inne
r reg
iona
l
Out
er re
gion
al
Rem
ote
Ver
y re
mot
e
Aus
tralia
Remoteness area
Wor
kers
per
100
,000
popu
latio
n
Source: ABS, Census of Population and Housing, 2001.
Figure 3: Employed persons in health and community services industries per 100,000 population byremoteness area, 2001
In the community services industries the national relative distribution of employed personswas much more even, with the greatest employment per 100,000 population in Inner regionalareas—about one-third greater than in Very remote areas (Figure 3). Again there were largestate variations, with Tasmania having about three times as many employed persons in Innerregional areas as in Remote areas, which had the lowest supply nationally of employedpersons per 100,000 population (Table A.27).When viewed by individual industry, the predominant pattern was for the number ofemployed persons per 100,000 population to decline with increasing remoteness. The declinewas particularly marked for non-psychiatric hospitals (declining from 1,147 per 100,000population in Major cities to 601 in Very remote areas), nursing homes (from 334 per 100,000in Major cities to 71 in Very remote areas), general practice services (from 351 to 109 per100,000), specialist medical services (from 147 to 15), dental services (from 169 to 35),pathology services (from 93 to 11), optometry and optical dispensing (from 53 to 1.7),physiotherapy services (from 48 to 7.2) and child care services (from 311 to 199).
later
later
Ver
y re
mot
e
later
Ver
y re
mot
e
Remoteness area
later Remoteness area
later
ABS, Census of Population and Housing, 2001.later
ABS, Census of Population and Housing, 2001.
editio
n
editio
n
editio
n
editio
n
editio
n
editio
n All health and community
editio
n All health and community
service industries
editio
n service industriesservice industries
editio
n service industries
2,000
editio
n 2,000
3,000
editio
n 3,0003,000
editio
n 3,000
4,000
editio
n 4,0004,000
editio
n 4,000
5,000
editio
n 5,0005,000
editio
n 5,000
editio
n
editio
n
editio
n
editio
n
editio
n
editio
n V
ery
rem
ote ed
ition
Ver
y re
mot
e
Aus
traliaed
ition
Aus
traliaed
ition
Wor
kers
per
100
,000
editio
n W
orke
rs p
er 1
00,0
00po
pula
tion
editio
n po
pula
tion
avail
able
avail
able
avail
able
avail
able
avail
able
avail
able
avail
able
avail
able
avail
able0
avail
able0
Maj
or c
ities
avail
able
Maj
or c
ities
Inne
r reg
iona
l
avail
able
Inne
r reg
iona
l
avail
able
ABS, Census of Population and Housing, 2001. avail
able
ABS, Census of Population and Housing, 2001.
Figure 3: Employed persons in health and commuavail
able
Figure 3: Employed persons in health and commu
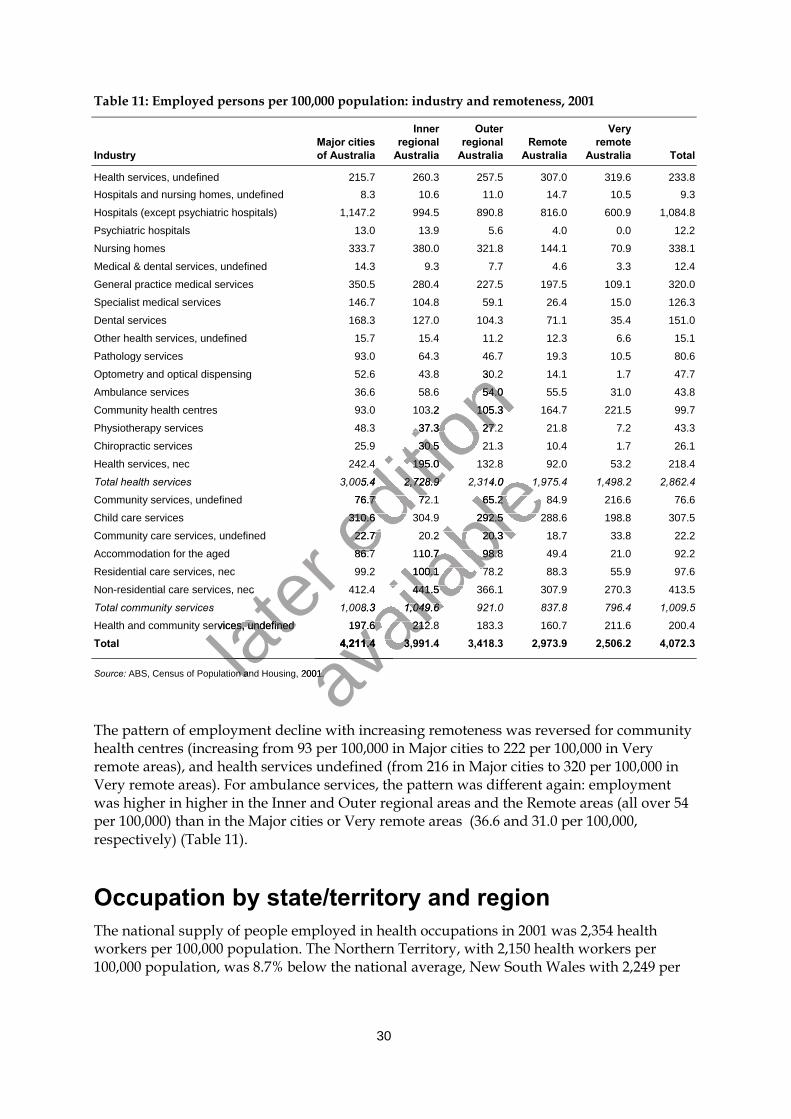
30
Table 11: Employed persons per 100,000 population: industry and remoteness, 2001
IndustryMajor citiesof Australia
Innerregional
Australia
Outerregional
AustraliaRemote
Australia
Veryremote
Australia Total
Health services, undefined 215.7 260.3 257.5 307.0 319.6 233.8Hospitals and nursing homes, undefined 8.3 10.6 11.0 14.7 10.5 9.3
Hospitals (except psychiatric hospitals) 1,147.2 994.5 890.8 816.0 600.9 1,084.8
Psychiatric hospitals 13.0 13.9 5.6 4.0 0.0 12.2
Nursing homes 333.7 380.0 321.8 144.1 70.9 338.1
Medical & dental services, undefined 14.3 9.3 7.7 4.6 3.3 12.4
General practice medical services 350.5 280.4 227.5 197.5 109.1 320.0
Specialist medical services 146.7 104.8 59.1 26.4 15.0 126.3
Dental services 168.3 127.0 104.3 71.1 35.4 151.0
Other health services, undefined 15.7 15.4 11.2 12.3 6.6 15.1
Pathology services 93.0 64.3 46.7 19.3 10.5 80.6
Optometry and optical dispensing 52.6 43.8 30.2 14.1 1.7 47.7
Ambulance services 36.6 58.6 54.0 55.5 31.0 43.8
Community health centres 93.0 103.2 105.3 164.7 221.5 99.7
Physiotherapy services 48.3 37.3 27.2 21.8 7.2 43.3
Chiropractic services 25.9 30.5 21.3 10.4 1.7 26.1
Health services, nec 242.4 195.0 132.8 92.0 53.2 218.4
Total health services 3,005.4 2,728.9 2,314.0 1,975.4 1,498.2 2,862.4
Community services, undefined 76.7 72.1 65.2 84.9 216.6 76.6
Child care services 310.6 304.9 292.5 288.6 198.8 307.5
Community care services, undefined 22.7 20.2 20.3 18.7 33.8 22.2
Accommodation for the aged 86.7 110.7 98.8 49.4 21.0 92.2
Residential care services, nec 99.2 100.1 78.2 88.3 55.9 97.6
Non-residential care services, nec 412.4 441.5 366.1 307.9 270.3 413.5
Total community services 1,008.3 1,049.6 921.0 837.8 796.4 1,009.5
Health and community services, undefined 197.6 212.8 183.3 160.7 211.6 200.4
Total 4,211.4 3,991.4 3,418.3 2,973.9 2,506.2 4,072.3
Source: ABS, Census of Population and Housing, 2001.
The pattern of employment decline with increasing remoteness was reversed for communityhealth centres (increasing from 93 per 100,000 in Major cities to 222 per 100,000 in Veryremote areas), and health services undefined (from 216 in Major cities to 320 per 100,000 inVery remote areas). For ambulance services, the pattern was different again: employmentwas higher in higher in the Inner and Outer regional areas and the Remote areas (all over 54per 100,000) than in the Major cities or Very remote areas (36.6 and 31.0 per 100,000,respectively) (Table 11).
Occupation by state/territory and regionThe national supply of people employed in health occupations in 2001 was 2,354 healthworkers per 100,000 population. The Northern Territory, with 2,150 health workers per100,000 population, was 8.7% below the national average, New South Wales with 2,249 per
later Non-residential care services, nec
later Non-residential care services, nec
Health and community services, undefined
later Health and community services, undefined
later
later
ABS, Census of Population and Housing, 2001.later
ABS, Census of Population and Housing, 2001.
editio
n 52.6 43.8 30.2 14.1 1.7 47.7
editio
n 52.6 43.8 30.2 14.1 1.7 47.7
36.6 58.6 54.0 55.5 31.0 43.8
editio
n 36.6 58.6 54.0 55.5 31.0 43.8
93.0 103.2 105.3 164.7 221.5 99.7
editio
n 93.0 103.2 105.3 164.7 221.5 99.7
48.3 37.3 27.2 21.8 7.2 43.3
editio
n 48.3 37.3 27.2 21.8 7.2 43.3
25.9 30.5 21.3 10.4 1.7 26.1
editio
n 25.9 30.5 21.3 10.4 1.7 26.1
242.4 195.0 132.8 92.0 53.2 218.4
editio
n 242.4 195.0 132.8 92.0 53.2 218.4
3,005.4 2,728.9 2,314.0 1,975.4 1,498.2 2,862.4
editio
n 3,005.4 2,728.9 2,314.0 1,975.4 1,498.2 2,862.4
76.7 72.1 65.2 84.9 216.6 76.6
editio
n 76.7 72.1 65.2 84.9 216.6 76.6
310.6 304.9 292.5 288.6 198.8 307.5editio
n 310.6 304.9 292.5 288.6 198.8 307.5
22.7 20.2 20.3 18.7 33.8 22.2editio
n
22.7 20.2 20.3 18.7 33.8 22.2
86.7 110.7 98.8 49.4 21.0 92.2editio
n
86.7 110.7 98.8 49.4 21.0 92.2
avail
able
242.4 195.0 132.8 92.0 53.2 218.4
avail
able
242.4 195.0 132.8 92.0 53.2 218.4
3,005.4 2,728.9 2,314.0 1,975.4 1,498.2 2,862.4
avail
able
3,005.4 2,728.9 2,314.0 1,975.4 1,498.2 2,862.4
76.7 72.1 65.2 84.9 216.6 76.6
avail
able76.7 72.1 65.2 84.9 216.6 76.6
310.6 304.9 292.5 288.6 198.8 307.5
avail
able310.6 304.9 292.5 288.6 198.8 307.5
22.7 20.2 20.3 18.7 33.8 22.2
avail
able22.7 20.2 20.3 18.7 33.8 22.2
86.7 110.7 98.8 49.4 21.0 92.2
avail
able
86.7 110.7 98.8 49.4 21.0 92.2
99.2 100.1 78.2 88.3 55.9 97.6
avail
able
99.2 100.1 78.2 88.3 55.9 97.6
412.4 441.5 366.1 307.9 270.3 413.5
avail
able
412.4 441.5 366.1 307.9 270.3 413.5
1,008.3 1,049.6 921.0 837.8 796.4 1,009.5
avail
able
1,008.3 1,049.6 921.0 837.8 796.4 1,009.5
avail
able
197.6 212.8 183.3 160.7 211.6 200.4
avail
able
197.6 212.8 183.3 160.7 211.6 200.4
4,211.4 3,991.4 3,418.3 2,973.9 2,506.2 4,072.3
avail
able
4,211.4 3,991.4 3,418.3 2,973.9 2,506.2 4,072.3
avail
able
ABS, Census of Population and Housing, 2001. avail
able
ABS, Census of Population and Housing, 2001.
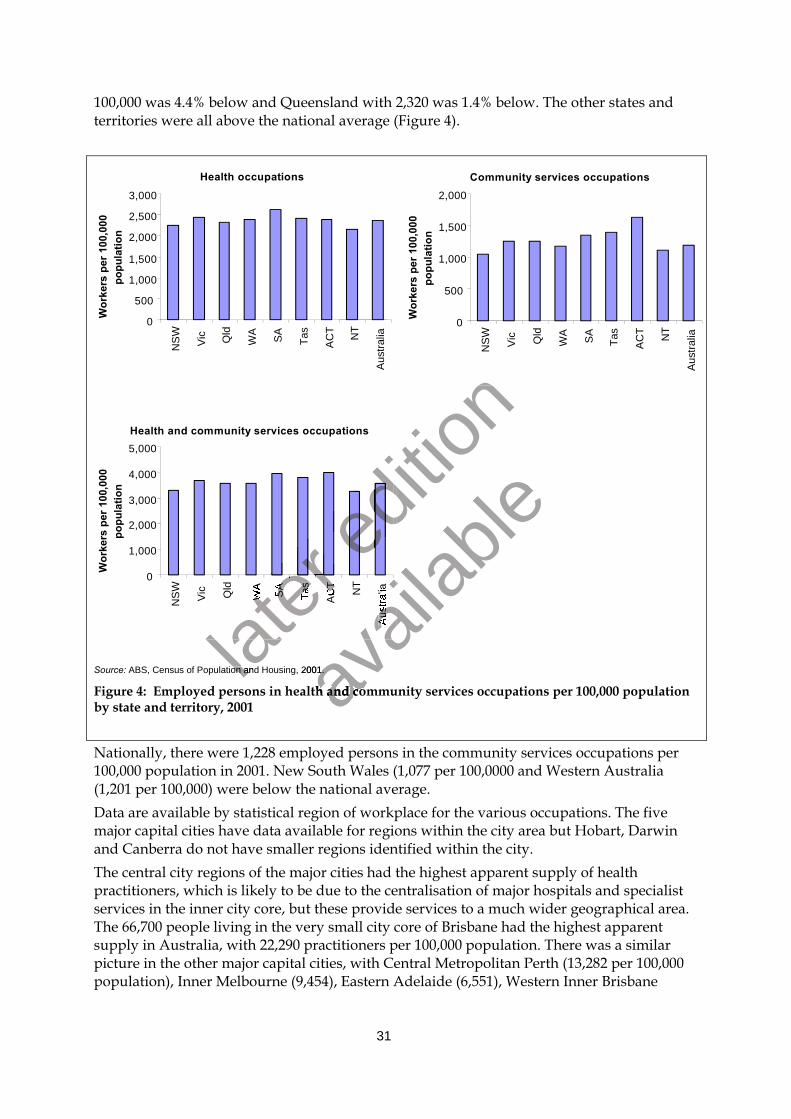
31
100,000 was 4.4% below and Queensland with 2,320 was 1.4% below. The other states andterritories were all above the national average (Figure 4).
Health occupations
0
500
1,000
1,500
2,000
2,500
3,000
NS
W
Vic Qld
WA SA
Tas
AC
T NT
Aus
tralia
Wor
kers
per
100
,000
popu
latio
n
Community services occupations
0
500
1,000
1,500
2,000
NS
W
Vic Qld
WA SA
Tas
AC
T NT
Aus
tralia
Wor
kers
per
100
,000
popu
latio
nHealth and community services occupations
0
1,000
2,000
3,000
4,000
5,000
NS
W
Vic Qld
WA
SA
Tas
AC
T NT
Aus
tralia
Wor
kers
per
100
,000
popu
latio
n
Source: ABS, Census of Population and Housing, 2001.
Figure 4: Employed persons in health and community services occupations per 100,000 populationby state and territory, 2001
Nationally, there were 1,228 employed persons in the community services occupations per100,000 population in 2001. New South Wales (1,077 per 100,0000 and Western Australia(1,201 per 100,000) were below the national average.Data are available by statistical region of workplace for the various occupations. The fivemajor capital cities have data available for regions within the city area but Hobart, Darwinand Canberra do not have smaller regions identified within the city.The central city regions of the major cities had the highest apparent supply of healthpractitioners, which is likely to be due to the centralisation of major hospitals and specialistservices in the inner city core, but these provide services to a much wider geographical area.The 66,700 people living in the very small city core of Brisbane had the highest apparentsupply in Australia, with 22,290 practitioners per 100,000 population. There was a similarpicture in the other major capital cities, with Central Metropolitan Perth (13,282 per 100,000population), Inner Melbourne (9,454), Eastern Adelaide (6,551), Western Inner Brisbane
later
later
later
later
later
later
later
later
later
later
later W
A
later W
A
SA
later S
A
Tas
later Ta
s
AC
T
later A
CT
ABS, Census of Population and Housing, 2001.later
ABS, Census of Population and Housing, 2001.
editio
n
editio
n
editio
n
editio
n
editio
n
editio
n
editio
n
editio
n
editio
n
editio
n
avail
able
avail
able
A
avail
able
Aus
tralia
avail
able
ustra
lia
ABS, Census of Population and Housing, 2001. avail
able
ABS, Census of Population and Housing, 2001. avail
able
Figure 4: Employed persons in health and community services occupations per 100,000 populationavail
able
Figure 4: Employed persons in health and community services occupations per 100,000 population
32
(5,185) and Inner Sydney (4,328). The same inner city regions also had the largest apparentsupply of generalist medical practitioners, dentists and retail pharmacists, who supply thehospitals located in the inner city and the large daytime workforce (Table A.32).Similarly, the supply of community services workers was relatively high in the inner citycores of the five major capital cities, but some areas outside the capital cities also rankedhighly. The largest supply of community services workers was in the city core of Brisbane(3,696 per 100,000), and the next largest was in the Central Metropolitan area of Perth (2,657per 100,000). This was closely followed by Central West Mackay–Fitzroy–Central West inQueensland (2,384 per 100,000), Inner Melbourne (2,188 per 100,000) and Nowra–Bomaderryin New South Wales (2,072 per 100,000).Because of the propensity for the large hospitals with specialist and teaching facilities to belocated in the inner city or older established areas close to the city centres, it is not alwaysappropriate to compare supply in those areas with other areas, including the outer fringes ofthe cities. This is because the facilities service patients from other parts of the city and the restof the state. It is, however, valid to compare supply between outer city areas and other areasoutside capital cities.Some of the rapidly growing regions on the outskirts of all five major capital cities (ABS2000) had the lowest supply (in terms of numbers per 100,000 population) of health andcommunity services professionals of any region within their respective states. The regionswith lowest supply of health practitioners were, in ascending order, Beaudesert Shire Part A(Brisbane), Pine Rivers Shire (Brisbane), Gold Coast City Part A, Outer South WesternSydney, Logan City, Illawarra Statistical Division balance (Wingecarribee, part Shoalhaven),North Western Melbourne, Eastern Inner Brisbane, North Metropolitan Perth and RedlandShire (Brisbane).As noted above, the demographic structure of a region can have an influence on the usage ofparticular services by the region’s population. A region with small numbers of aged andlarge numbers of children will have different service usage from a region with large numbersof aged persons. The analysis below looks at the regions in each state and territory with thelowest supply of health practitioners and community services workers, with some referenceto the population demographics in the region being discussed. For health, the keyoccupations of generalist medical practitioner, retail pharmacist, dentist, and ambulanceofficer and intensive care paramedic are used as indicators, and for community services, thechild and youth services occupations and the aged or disabled care occupation are used.Much of the information that follows is sourced from Tables A.32, A.33 and A.34.
New South WalesIn 2001, 20.8% of the New South Wales population was less than 15 years of age and 13.1%was 65 or more years of age. The region of Outer South Western Sydney had the state’shighest proportion (26.0%) of those less than 15 years and lowest proportion (6.8%) of thoseaged 65 or more. It was followed by North Western Sydney (24.6% and 8.1% respectively),and Fairfield–Liverpool (23.8% and 8.7% respectively). All regions outside Sydney andNewcastle had higher proportions of younger and older people than the state average.The supply of health workers and community services workers overall were each lower inthe outer areas of Sydney (2,103 per 100,000 and 941 per 100,000 population, respectively)than in the rest of the state outside Sydney (2,225 and 1,246, respectively) (Table 12). Thesupply of the key occupations of generalist medical practitioner, retail pharmacist and
later
As noted above, the demographic structure of
later
As noted above, the demographic structure of particular services by the region’s popula
later particular services by the region’s popula
large numbers of children will have different se
later large numbers of children will have different se
of aged persons. The analysis below looks at the regions in each state and territory with the
later of aged persons. The analysis below looks at the regions in each state and territory with the
later
lowest supply of health practitioners and community services later
lowest supply of health practitioners and community services to the population demographics in the region being discussed. For health, the keylat
er to the population demographics in the region being discussed. For health, the keyoccupations of generalist medical practitionerlat
er occupations of generalist medical practitioner
editio
n of the state. It is, however, valid to compare supply between outer city areas and other areas
editio
n of the state. It is, however, valid to compare supply between outer city areas and other areas
tskirts of all five major capital cities (ABS
editio
n tskirts of all five major capital cities (ABSmbers per 100,000 population) of health and
editio
n mbers per 100,000 population) of health ands of any region within their respective states. The regions
editio
n s of any region within their respective states. The regions
with lowest supply of health practitioners were, in ascending order, Beaudesert Shire Part A
editio
n with lowest supply of health practitioners were, in ascending order, Beaudesert Shire Part A(Brisbane), Pine Rivers Shire (Brisbane), Gold Coast City Part A, Outer South Western
editio
n (Brisbane), Pine Rivers Shire (Brisbane), Gold Coast City Part A, Outer South WesternSydney, Logan City, Illawarra Statistical Divisi
editio
n Sydney, Logan City, Illawarra Statistical Division balance (Wingecarribee, part Shoalhaven),
editio
n on balance (Wingecarribee, part Shoalhaven),
North Western Melbourne, Eastern Inner Brisbane, North Metropolitan Perth and Redlandeditio
n North Western Melbourne, Eastern Inner Brisbane, North Metropolitan Perth and Redland
As noted above, the demographic structure of editio
n
As noted above, the demographic structure of
avail
able
with lowest supply of health practitioners were, in ascending order, Beaudesert Shire Part A
avail
able
with lowest supply of health practitioners were, in ascending order, Beaudesert Shire Part A(Brisbane), Pine Rivers Shire (Brisbane), Gold Coast City Part A, Outer South Western
avail
able
(Brisbane), Pine Rivers Shire (Brisbane), Gold Coast City Part A, Outer South Westernon balance (Wingecarribee, part Shoalhaven),
avail
ableon balance (Wingecarribee, part Shoalhaven),
North Western Melbourne, Eastern Inner Brisbane, North Metropolitan Perth and Redland
avail
ableNorth Western Melbourne, Eastern Inner Brisbane, North Metropolitan Perth and Redland
a region can have an influence on the usage of
avail
able
a region can have an influence on the usage oftion. A region with small numbers of aged and
avail
able
tion. A region with small numbers of aged andlarge numbers of children will have different se
avail
able
large numbers of children will have different service usage from a region with large numbers
avail
able
rvice usage from a region with large numbersof aged persons. The analysis below looks at the regions in each state and territory with the
avail
able
of aged persons. The analysis below looks at the regions in each state and territory with the
avail
able
lowest supply of health practitioners and community services
avail
able
lowest supply of health practitioners and community services to the population demographics in the region being discussed. For health, the key
avail
able
to the population demographics in the region being discussed. For health, the keyoccupations of generalist medical practitionerav
ailab
le
occupations of generalist medical practitioneravail
able
officer and intensive care paramedic are used as indicators, and for community services, theavail
able
officer and intensive care paramedic are used as indicators, and for community services, thechild and youth services occupations and the agav
ailab
le
child and youth services occupations and the ag
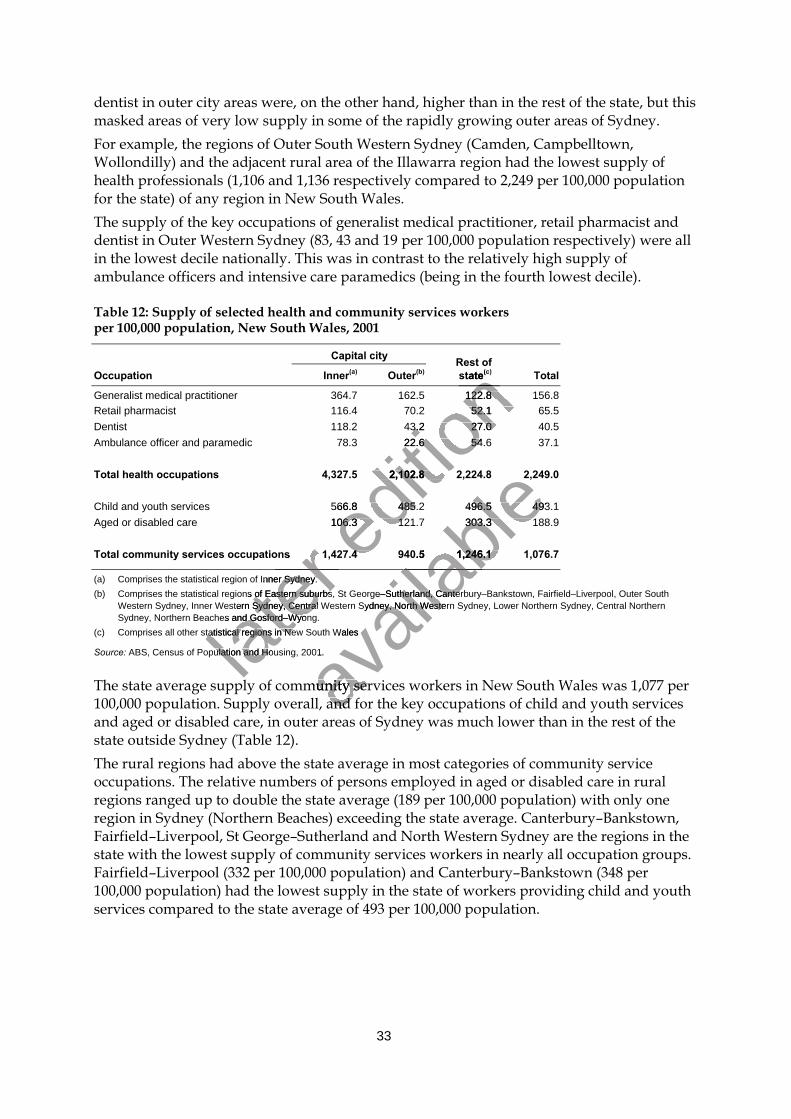
33
dentist in outer city areas were, on the other hand, higher than in the rest of the state, but thismasked areas of very low supply in some of the rapidly growing outer areas of Sydney.For example, the regions of Outer South Western Sydney (Camden, Campbelltown,Wollondilly) and the adjacent rural area of the Illawarra region had the lowest supply ofhealth professionals (1,106 and 1,136 respectively compared to 2,249 per 100,000 populationfor the state) of any region in New South Wales.The supply of the key occupations of generalist medical practitioner, retail pharmacist anddentist in Outer Western Sydney (83, 43 and 19 per 100,000 population respectively) were allin the lowest decile nationally. This was in contrast to the relatively high supply ofambulance officers and intensive care paramedics (being in the fourth lowest decile).
Table 12: Supply of selected health and community services workersper 100,000 population, New South Wales, 2001
Capital city
Occupation Inner(a) Outer(b)Rest ofstate(c) Total
Generalist medical practitioner 364.7 162.5 122.8 156.8Retail pharmacist 116.4 70.2 52.1 65.5Dentist 118.2 43.2 27.0 40.5Ambulance officer and paramedic 78.3 22.6 54.6 37.1
Total health occupations 4,327.5 2,102.8 2,224.8 2,249.0
Child and youth services 566.8 485.2 496.5 493.1Aged or disabled care 106.3 121.7 303.3 188.9
Total community services occupations 1,427.4 940.5 1,246.1 1,076.7
(a) Comprises the statistical region of Inner Sydney.(b) Comprises the statistical regions of Eastern suburbs, St George–Sutherland, Canterbury–Bankstown, Fairfield–Liverpool, Outer South
Western Sydney, Inner Western Sydney, Central Western Sydney, North Western Sydney, Lower Northern Sydney, Central NorthernSydney, Northern Beaches and Gosford–Wyong.
(c) Comprises all other statistical regions in New South Wales
Source: ABS, Census of Population and Housing, 2001.
The state average supply of community services workers in New South Wales was 1,077 per100,000 population. Supply overall, and for the key occupations of child and youth servicesand aged or disabled care, in outer areas of Sydney was much lower than in the rest of thestate outside Sydney (Table 12).The rural regions had above the state average in most categories of community serviceoccupations. The relative numbers of persons employed in aged or disabled care in ruralregions ranged up to double the state average (189 per 100,000 population) with only oneregion in Sydney (Northern Beaches) exceeding the state average. Canterbury–Bankstown,Fairfield–Liverpool, St George–Sutherland and North Western Sydney are the regions in thestate with the lowest supply of community services workers in nearly all occupation groups.Fairfield–Liverpool (332 per 100,000 population) and Canterbury–Bankstown (348 per100,000 population) had the lowest supply in the state of workers providing child and youthservices compared to the state average of 493 per 100,000 population.
later
tions 1,427.4 940.5 1,246.1 1,076.7
later
tions 1,427.4 940.5 1,246.1 1,076.7
later (a) Comprises the statistical region of Inner Sydney.
later (a) Comprises the statistical region of Inner Sydney.
(b) Comprises the statistical regions of Eastern suburbs, St
later (b) Comprises the statistical regions of Eastern suburbs, St
later Western Sydney, Inner Western Sydney, Central Western Sydney, No
later Western Sydney, Inner Western Sydney, Central Western Sydney, No
Sydney, Northern Beaches and Gosford–Wyong.
later Sydney, Northern Beaches and Gosford–Wyong.
(c) Comprises all other statistical regions in New South Waleslater
(c) Comprises all other statistical regions in New South Wales
ABS, Census of Population and Housing, 2001.later
ABS, Census of Population and Housing, 2001.
editio
n Rest of
editio
n Rest ofstate
editio
n state(c)
editio
n (c)
364.7 162.5 122.8 156.8
editio
n 364.7 162.5 122.8 156.8
editio
n 116.4 70.2 52.1 65.5
editio
n 116.4 70.2 52.1 65.5118.2 43.2 27.0 40.5
editio
n 118.2 43.2 27.0 40.578.3 22.6 54.6 37.1
editio
n 78.3 22.6 54.6 37.1
4,327.5 2,102.8 2,224.8 2,249.0
editio
n 4,327.5 2,102.8 2,224.8 2,249.0
566.8 485.2 496.5 493.1
editio
n 566.8 485.2 496.5 493.1106.3 121.7 303.3 188.9ed
ition
106.3 121.7 303.3 188.9
tions 1,427.4 940.5 1,246.1 1,076.7editio
n
tions 1,427.4 940.5 1,246.1 1,076.7
avail
able
4,327.5 2,102.8 2,224.8 2,249.0
avail
able
4,327.5 2,102.8 2,224.8 2,249.0
566.8 485.2 496.5 493.1
avail
able566.8 485.2 496.5 493.1
106.3 121.7 303.3 188.9
avail
able106.3 121.7 303.3 188.9
tions 1,427.4 940.5 1,246.1 1,076.7
avail
able
tions 1,427.4 940.5 1,246.1 1,076.7
avail
able
George–Sutherland, Canterbury–Bank
avail
able
George–Sutherland, Canterbury–Bank
avail
able
Western Sydney, Inner Western Sydney, Central Western Sydney, No
avail
able
Western Sydney, Inner Western Sydney, Central Western Sydney, North Western Sydney, Lower Northern Sydney, Central Northern
avail
able
rth Western Sydney, Lower Northern Sydney, Central Northern
(c) Comprises all other statistical regions in New South Wales
avail
able
(c) Comprises all other statistical regions in New South Wales
ABS, Census of Population and Housing, 2001.
avail
able
ABS, Census of Population and Housing, 2001.
mmunity services workers in New South Wales was 1,077 peravail
able
mmunity services workers in New South Wales was 1,077 per100,000 population. Supply overall, and for the av
ailab
le
100,000 population. Supply overall, and for the
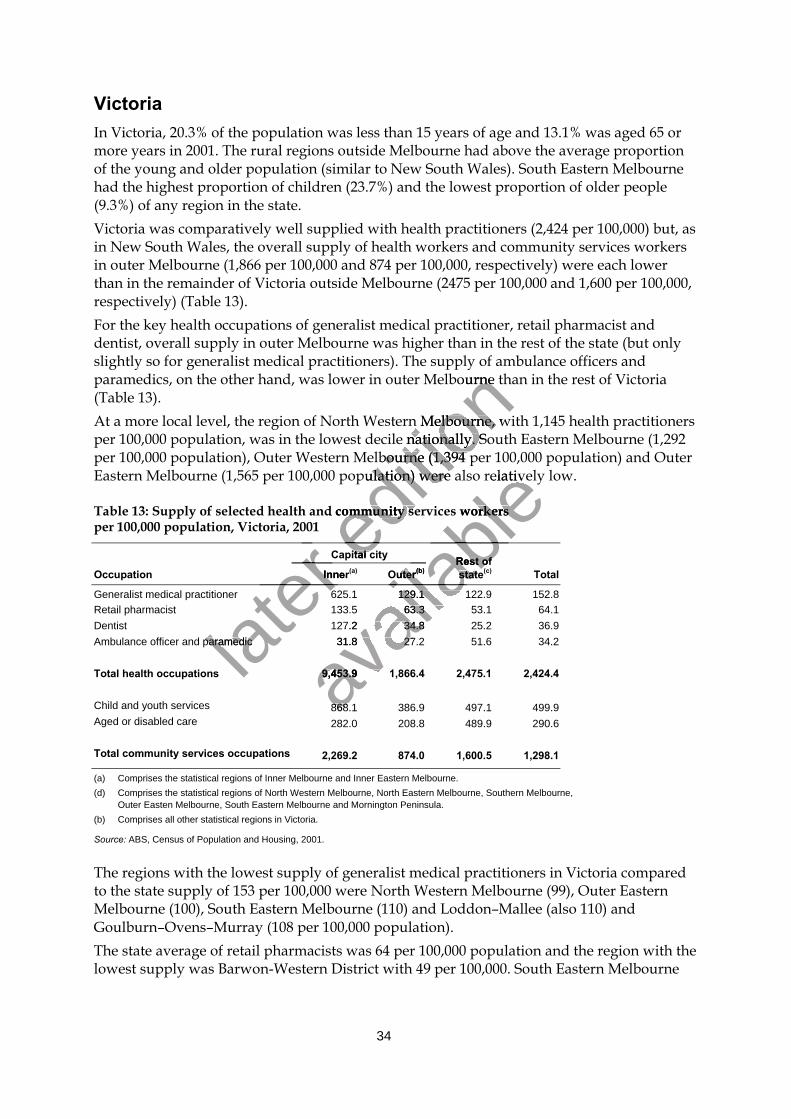
34
VictoriaIn Victoria, 20.3% of the population was less than 15 years of age and 13.1% was aged 65 ormore years in 2001. The rural regions outside Melbourne had above the average proportionof the young and older population (similar to New South Wales). South Eastern Melbournehad the highest proportion of children (23.7%) and the lowest proportion of older people(9.3%) of any region in the state.Victoria was comparatively well supplied with health practitioners (2,424 per 100,000) but, asin New South Wales, the overall supply of health workers and community services workersin outer Melbourne (1,866 per 100,000 and 874 per 100,000, respectively) were each lowerthan in the remainder of Victoria outside Melbourne (2475 per 100,000 and 1,600 per 100,000,respectively) (Table 13).For the key health occupations of generalist medical practitioner, retail pharmacist anddentist, overall supply in outer Melbourne was higher than in the rest of the state (but onlyslightly so for generalist medical practitioners). The supply of ambulance officers andparamedics, on the other hand, was lower in outer Melbourne than in the rest of Victoria(Table 13).At a more local level, the region of North Western Melbourne, with 1,145 health practitionersper 100,000 population, was in the lowest decile nationally. South Eastern Melbourne (1,292per 100,000 population), Outer Western Melbourne (1,394 per 100,000 population) and OuterEastern Melbourne (1,565 per 100,000 population) were also relatively low.
Table 13: Supply of selected health and community services workersper 100,000 population, Victoria, 2001
Capital city
Occupation Inner(a) Outer(b)Rest ofstate(c) Total
Generalist medical practitioner 625.1 129.1 122.9 152.8Retail pharmacist 133.5 63.3 53.1 64.1Dentist 127.2 34.8 25.2 36.9Ambulance officer and paramedic 31.8 27.2 51.6 34.2
Total health occupations 9,453.9 1,866.4 2,475.1 2,424.4
Child and youth services 868.1 386.9 497.1 499.9Aged or disabled care 282.0 208.8 489.9 290.6
Total community services occupations 2,269.2 874.0 1,600.5 1,298.1
(a) Comprises the statistical regions of Inner Melbourne and Inner Eastern Melbourne.(d) Comprises the statistical regions of North Western Melbourne, North Eastern Melbourne, Southern Melbourne,
Outer Easten Melbourne, South Eastern Melbourne and Mornington Peninsula.(b) Comprises all other statistical regions in Victoria.
Source: ABS, Census of Population and Housing, 2001.
The regions with the lowest supply of generalist medical practitioners in Victoria comparedto the state supply of 153 per 100,000 were North Western Melbourne (99), Outer EasternMelbourne (100), South Eastern Melbourne (110) and Loddon–Mallee (also 110) andGoulburn–Ovens–Murray (108 per 100,000 population).The state average of retail pharmacists was 64 per 100,000 population and the region with thelowest supply was Barwon-Western District with 49 per 100,000. South Eastern Melbourne
later
later Inner
later Inner
later
later 625.1 129.1 122.9 152.8
later 625.1 129.1 122.9 152.8
later
Ambulance officer and paramediclater
Ambulance officer and paramedic
editio
n oners). The supply of ambulance officers and
editio
n oners). The supply of ambulance officers and
outer Melbourne than in the rest of Victoria
editio
n outer Melbourne than in the rest of Victoria
ern Melbourne, with 1,145 health practitioners
editio
n ern Melbourne, with 1,145 health practitionersper 100,000 population, was in the lowest decile nationally. South Eastern Melbourne (1,292
editio
n per 100,000 population, was in the lowest decile nationally. South Eastern Melbourne (1,292per 100,000 population), Outer Western Melbourn
editio
n per 100,000 population), Outer Western Melbourne (1,394 per 100,000 population) and Outer
editio
n e (1,394 per 100,000 population) and Outer
Eastern Melbourne (1,565 per 100,000 population) were also relatively low.
editio
n Eastern Melbourne (1,565 per 100,000 population) were also relatively low.
Table 13: Supply of selected health and community services workerseditio
n Table 13: Supply of selected health and community services workers
Capital cityeditio
n
Capital cityeditio
n
avail
able
e (1,394 per 100,000 population) and Outer
avail
able
e (1,394 per 100,000 population) and OuterEastern Melbourne (1,565 per 100,000 population) were also relatively low.
avail
able
Eastern Melbourne (1,565 per 100,000 population) were also relatively low.
Table 13: Supply of selected health and community services workers
avail
ableTable 13: Supply of selected health and community services workers
avail
able
Outer
avail
able
Outer(b)
avail
able
(b)Rest of
avail
able
Rest ofstate
avail
able
state
avail
able
avail
able
625.1 129.1 122.9 152.8
avail
able
625.1 129.1 122.9 152.8
avail
able
133.5 63.3 53.1 64.1
avail
able
133.5 63.3 53.1 64.1127.2 34.8 25.2 36.9
avail
able
127.2 34.8 25.2 36.931.8 27.2 51.6 34.2
avail
able
31.8 27.2 51.6 34.2
9,453.9 1,866.4 2,475.1 2,424.4avail
able
9,453.9 1,866.4 2,475.1 2,424.4avail
able
868.1 386.9 497.1 499.9avail
able
868.1 386.9 497.1 499.9
35
had the lowest supply within Melbourne (52 per 100,000), and the supply of pharmacists inall the rural regions of Victoria were equal to or lower than that.North Western Melbourne had the lowest supply of dentists (22 per 100,000 populationcompared to the state figure of 37) with Goulburn–Ovens–Murray, Central Highlands–Wimmera and Gippsland only slightly better at 22, 23 and 23 per 100,000 population,respectively.North Eastern, Southern and North Western Melbourne had a similar supply of ambulanceofficers, mostly intensive care paramedics, 12, 12 and 14 per 100,000 population respectively,as the state total of 34 per 100,000.The key community services occupations of child and youth services, and particularly agedor disabled care, were in lower supply in outer Melbourne areas taken as a whole (387 and209 per 100,000, respectively), than in the rest of the state (497 and 490 per 100,000,respectively) (Table 13).The supply of community services occupations overall in rural regions was above theVictoria average of 1,298 per 100,000 population. Aged or disabled care worker supply inrural regions ranged from Loddon–Mallee at 289 per 100,000 population, just below the stateaverage of 291 per 100,000 population, to Central Highlands–Wimmera with 387 per 100,000.The proportion of young people in all rural regions was above the state average, but thesupply of child and youth service workers was below or around the state average of 500 per100,000 population.South Eastern Melbourne was the region with the lowest supply of community serviceworkers (998 per 100,000 population). North Western Melbourne, Outer Western Melbourneand Mornington Peninsula closely followed it with 1,015, 1,019 and 1,031 per 100,000population, respectively. Victoria’s lowest supply of child and youth service workers of 419per 100,000 population was in the Barwon–Western District. This closely followed by NorthWestern Melbourne (427), which had an above-average proportion of young people. Thelowest supply of aged and disabled carers (129 per 100,000 population) was in South EasternMelbourne, which had the lowest proportion of older people (9.3%).
QueenslandThe Queensland population in 2001 included 21.6% of people aged less than 15 years and11.7% of those aged 65 or more years. North West Queensland and Beaudesert Shire Part Awere the regions with the highest proportion of young people, 26.6% and 26.4% respectively,and the lowest proportion of older people, 5.9% and 4.7% respectively. Most rural regions ofQueensland have a proportion of young people greater than the state average, and of olderpeople less than the state average. The region South and East BSD Balance (Logan City, GoldCoast City Part A, Beaudesert Shire Part A and Redland Shire) had a relatively largeproportion of young people and a small proportion of older people.There were 2,320 health practitioners and 1,275 community services workers per 100,000population overall in Queensland. Once more, supply in the outer areas of Brisbane waslower than in the rest of the state outside Brisbane, markedly so for health practitioners(1,557 per 100,000 in outer Brisbane compared with 2,106 per 100,000 in the rest of the state),but also for community services workers (1,158 and 1,268 per 100,000, respectively).For the key health occupations, only retail pharmacists were in greater supply in outerBrisbane areas overall than in the rest of the state. For the key community servicesoccupations, there was a higher supply of child and youth services workers in the outer areas
later
and Mornington Peninsula closely followed it with 1,015, 1,019 and 1,031 per 100,000
later
and Mornington Peninsula closely followed it with 1,015, 1,019 and 1,031 per 100,000population, respectively. Victoria’s lowest su
later
population, respectively. Victoria’s lowest super 100,000 population was in the Barwon–Weste
later
per 100,000 population was in the Barwon–Weste
later Western Melbourne (427), which had an above-
later Western Melbourne (427), which had an above-
lowest supply of aged and disabled carers (
later lowest supply of aged and disabled carers (
Melbourne, which had the lowest pr
later Melbourne, which had the lowest pr
editio
n s overall in rural regions was above the
editio
n s overall in rural regions was above the
on. Aged or disabled care worker supply in
editio
n on. Aged or disabled care worker supply in
per 100,000 population, just below the state
editio
n per 100,000 population, just below the statentral Highlands–Wimmera with 387 per 100,000.
editio
n ntral Highlands–Wimmera with 387 per 100,000.regions was above the state average, but the
editio
n regions was above the state average, but thesupply of child and youth service workers was
editio
n supply of child and youth service workers was below or around the state average of 500 per
editio
n below or around the state average of 500 per
South Eastern Melbourne was the region with
editio
n South Eastern Melbourne was the region with the lowest supply of community service
editio
n the lowest supply of community serviceSouth Eastern Melbourne was the region with the lowest supply of community serviceSouth Eastern Melbourne was the region with
editio
n South Eastern Melbourne was the region with the lowest supply of community serviceSouth Eastern Melbourne was the region withworkers (998 per 100,000 population). North ed
ition
workers (998 per 100,000 population). North Western Melbourne, Outer Western Melbourneeditio
n Western Melbourne, Outer Western Melbourne
and Mornington Peninsula closely followed it with 1,015, 1,019 and 1,031 per 100,000editio
n
and Mornington Peninsula closely followed it with 1,015, 1,019 and 1,031 per 100,000population, respectively. Victoria’s lowest sued
ition
population, respectively. Victoria’s lowest super 100,000 population was in the Barwon–Westeed
ition
per 100,000 population was in the Barwon–Weste
avail
able the lowest supply of community service
avail
able the lowest supply of community service
Western Melbourne, Outer Western Melbourne
avail
ableWestern Melbourne, Outer Western Melbourne
and Mornington Peninsula closely followed it with 1,015, 1,019 and 1,031 per 100,000
avail
ableand Mornington Peninsula closely followed it with 1,015, 1,019 and 1,031 per 100,000
pply of child and youth service workers of 419
avail
ablepply of child and youth service workers of 419
per 100,000 population was in the Barwon–Weste
avail
able
per 100,000 population was in the Barwon–Western District. This closely followed by North
avail
able
rn District. This closely followed by North
avail
able
Western Melbourne (427), which had an above-
avail
able
Western Melbourne (427), which had an above-average proportion of young people. The
avail
able
average proportion of young people. Thelowest supply of aged and disabled carers (
avail
able
lowest supply of aged and disabled carers (129 per 100,000 population) was in South Eastern
avail
able
129 per 100,000 population) was in South Easternoportion of older people (9.3%).
avail
able
oportion of older people (9.3%).
The Queensland population in 2001 included 21.avail
able
The Queensland population in 2001 included 21.11.7% of those aged 65 or more years. North av
ailab
le
11.7% of those aged 65 or more years. North
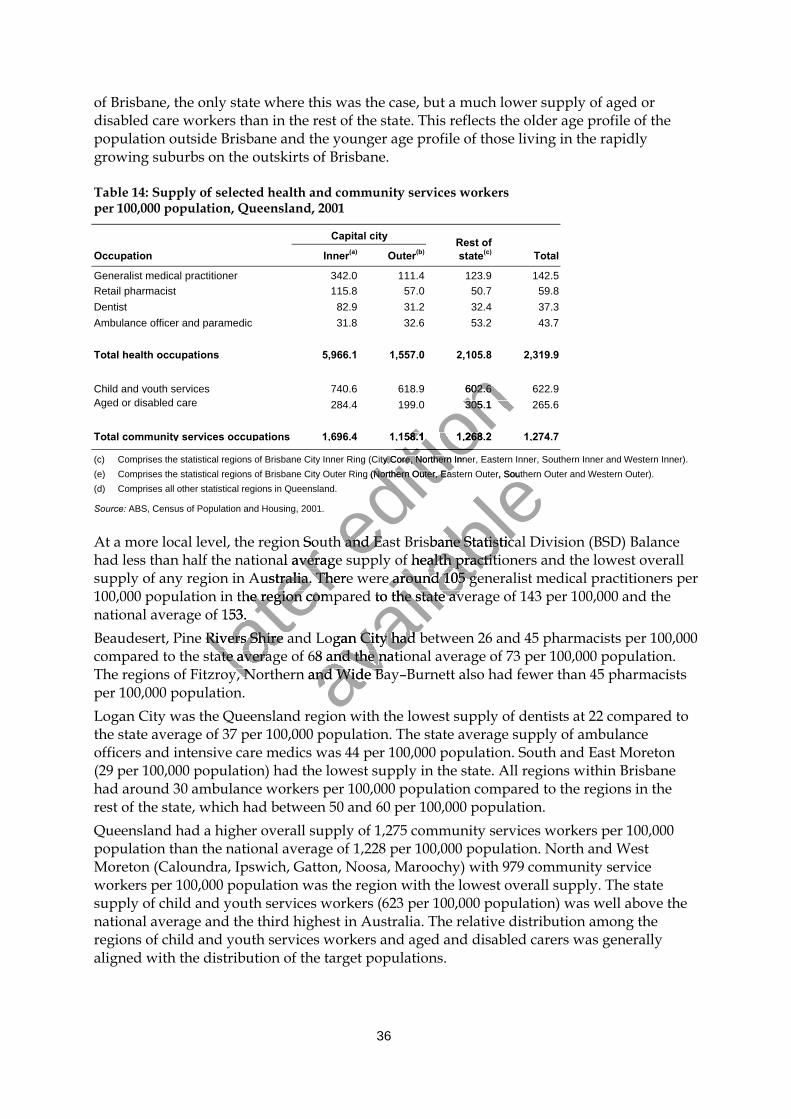
36
of Brisbane, the only state where this was the case, but a much lower supply of aged ordisabled care workers than in the rest of the state. This reflects the older age profile of thepopulation outside Brisbane and the younger age profile of those living in the rapidlygrowing suburbs on the outskirts of Brisbane.
Table 14: Supply of selected health and community services workersper 100,000 population, Queensland, 2001
Capital city
Occupation Inner(a) Outer(b)Rest ofstate(c) Total
Generalist medical practitioner 342.0 111.4 123.9 142.5Retail pharmacist 115.8 57.0 50.7 59.8Dentist 82.9 31.2 32.4 37.3Ambulance officer and paramedic 31.8 32.6 53.2 43.7
Total health occupations 5,966.1 1,557.0 2,105.8 2,319.9
Child and youth services 740.6 618.9 602.6 622.9Aged or disabled care 284.4 199.0 305.1 265.6
Total community services occupations 1,696.4 1,158.1 1,268.2 1,274.7
(c) Comprises the statistical regions of Brisbane City Inner Ring (City Core, Northern Inner, Eastern Inner, Southern Inner and Western Inner).(e) Comprises the statistical regions of Brisbane City Outer Ring (Northern Outer, Eastern Outer, Southern Outer and Western Outer).(d) Comprises all other statistical regions in Queensland.
Source: ABS, Census of Population and Housing, 2001.
At a more local level, the region South and East Brisbane Statistical Division (BSD) Balancehad less than half the national average supply of health practitioners and the lowest overallsupply of any region in Australia. There were around 105 generalist medical practitioners per100,000 population in the region compared to the state average of 143 per 100,000 and thenational average of 153.Beaudesert, Pine Rivers Shire and Logan City had between 26 and 45 pharmacists per 100,000compared to the state average of 68 and the national average of 73 per 100,000 population.The regions of Fitzroy, Northern and Wide Bay–Burnett also had fewer than 45 pharmacistsper 100,000 population.Logan City was the Queensland region with the lowest supply of dentists at 22 compared tothe state average of 37 per 100,000 population. The state average supply of ambulanceofficers and intensive care medics was 44 per 100,000 population. South and East Moreton(29 per 100,000 population) had the lowest supply in the state. All regions within Brisbanehad around 30 ambulance workers per 100,000 population compared to the regions in therest of the state, which had between 50 and 60 per 100,000 population.Queensland had a higher overall supply of 1,275 community services workers per 100,000population than the national average of 1,228 per 100,000 population. North and WestMoreton (Caloundra, Ipswich, Gatton, Noosa, Maroochy) with 979 community serviceworkers per 100,000 population was the region with the lowest overall supply. The statesupply of child and youth services workers (623 per 100,000 population) was well above thenational average and the third highest in Australia. The relative distribution among theregions of child and youth services workers and aged and disabled carers was generallyaligned with the distribution of the target populations.
later
At a more local level, the region South and Ea
later
At a more local level, the region South and Eahad less than half the national
later
had less than half the national average supply of health practi
later
average supply of health practisupply of any region in Australia. There were around 105 generalist medical practitioners per
later supply of any region in Australia. There were around 105 generalist medical practitioners per
100,000 population in the region compared to
later 100,000 population in the region compared to
later national average of 153.
later national average of 153.
Beaudesert, Pine Rivers Shire and Logan Citylater
Beaudesert, Pine Rivers Shire and Logan Citycompared to the state average of 68 and the lat
er compared to the state average of 68 and the The regions of Fitzroy, Northern and Wide Balat
er The regions of Fitzroy, Northern and Wide Ba
editio
n 740.6 618.9 602.6 622.9
editio
n 740.6 618.9 602.6 622.9284.4 199.0 305.1 265.6
editio
n 284.4 199.0 305.1 265.6
158.1 1
editio
n 158.1 1,
editio
n ,268.2 1
editio
n 268.2 1
editio
n ng (City Core, Northern Inner, Eastern Inner, Southern Inner and
editio
n ng (City Core, Northern Inner, Eastern Inner, Southern Inner and
(e) Comprises the statistical regions of Brisbane City Outer Ring (Northern Outer, Eastern Outer, Southern Outer and Western Ou
editio
n (e) Comprises the statistical regions of Brisbane City Outer Ring (Northern Outer, Eastern Outer, Southern Outer and Western Ou
At a more local level, the region South and Eaeditio
n
At a more local level, the region South and Eaaverage supply of health practied
ition
average supply of health practi
avail
able
(e) Comprises the statistical regions of Brisbane City Outer Ring (Northern Outer, Eastern Outer, Southern Outer and Western Ou
avail
able
(e) Comprises the statistical regions of Brisbane City Outer Ring (Northern Outer, Eastern Outer, Southern Outer and Western Ou
st Brisbane Statistical Division (BSD) Balance
avail
ablest Brisbane Statistical Division (BSD) Balance
average supply of health practi
avail
able
average supply of health practitioners and the lowest overall
avail
able
tioners and the lowest overallsupply of any region in Australia. There were around 105 generalist medical practitioners per
avail
able
supply of any region in Australia. There were around 105 generalist medical practitioners per100,000 population in the region compared to
avail
able
100,000 population in the region compared to the state average of 143 per 100,000 and the
avail
able
the state average of 143 per 100,000 and the
Beaudesert, Pine Rivers Shire and Logan City
avail
able
Beaudesert, Pine Rivers Shire and Logan City had between 26 and 45 pharmacists per 100,000
avail
able
had between 26 and 45 pharmacists per 100,000compared to the state average of 68 and the
avail
able
compared to the state average of 68 and the
avail
able
national average of 73 per 100,000 population.
avail
able
national average of 73 per 100,000 population.The regions of Fitzroy, Northern and Wide Baav
ailab
le
The regions of Fitzroy, Northern and Wide Ba
Logan City was the Queensland region with the avail
able
Logan City was the Queensland region with the
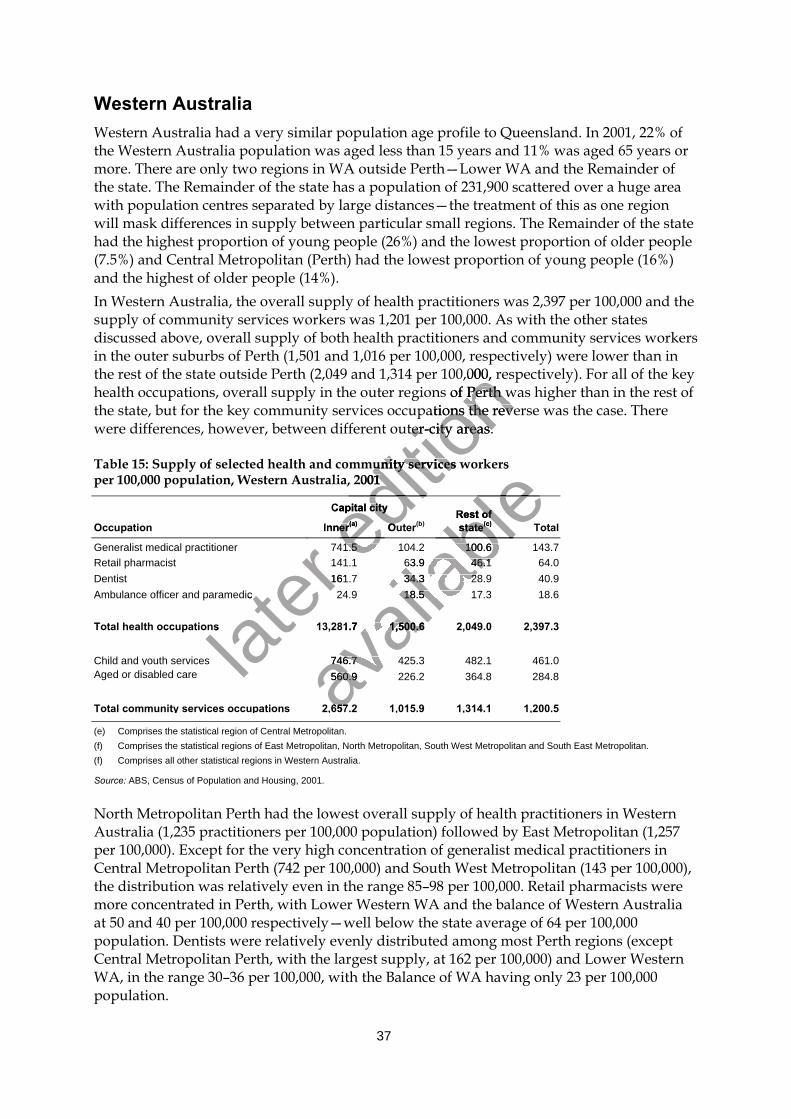
37
Western AustraliaWestern Australia had a very similar population age profile to Queensland. In 2001, 22% ofthe Western Australia population was aged less than 15 years and 11% was aged 65 years ormore. There are only two regions in WA outside Perth—Lower WA and the Remainder ofthe state. The Remainder of the state has a population of 231,900 scattered over a huge areawith population centres separated by large distances—the treatment of this as one regionwill mask differences in supply between particular small regions. The Remainder of the statehad the highest proportion of young people (26%) and the lowest proportion of older people(7.5%) and Central Metropolitan (Perth) had the lowest proportion of young people (16%)and the highest of older people (14%).In Western Australia, the overall supply of health practitioners was 2,397 per 100,000 and thesupply of community services workers was 1,201 per 100,000. As with the other statesdiscussed above, overall supply of both health practitioners and community services workersin the outer suburbs of Perth (1,501 and 1,016 per 100,000, respectively) were lower than inthe rest of the state outside Perth (2,049 and 1,314 per 100,000, respectively). For all of the keyhealth occupations, overall supply in the outer regions of Perth was higher than in the rest ofthe state, but for the key community services occupations the reverse was the case. Therewere differences, however, between different outer-city areas.
Table 15: Supply of selected health and community services workersper 100,000 population, Western Australia, 2001
Capital city
Occupation Inner(a) Outer(b)Rest ofstate(c) Total
Generalist medical practitioner 741.5 104.2 100.6 143.7Retail pharmacist 141.1 63.9 46.1 64.0Dentist 161.7 34.3 28.9 40.9Ambulance officer and paramedic 24.9 18.5 17.3 18.6
Total health occupations 13,281.7 1,500.6 2,049.0 2,397.3
Child and youth services 746.7 425.3 482.1 461.0Aged or disabled care 560.9 226.2 364.8 284.8
Total community services occupations 2,657.2 1,015.9 1,314.1 1,200.5
(e) Comprises the statistical region of Central Metropolitan.(f) Comprises the statistical regions of East Metropolitan, North Metropolitan, South West Metropolitan and South East Metropolitan.(f) Comprises all other statistical regions in Western Australia.
Source: ABS, Census of Population and Housing, 2001.
North Metropolitan Perth had the lowest overall supply of health practitioners in WesternAustralia (1,235 practitioners per 100,000 population) followed by East Metropolitan (1,257per 100,000). Except for the very high concentration of generalist medical practitioners inCentral Metropolitan Perth (742 per 100,000) and South West Metropolitan (143 per 100,000),the distribution was relatively even in the range 85–98 per 100,000. Retail pharmacists weremore concentrated in Perth, with Lower Western WA and the balance of Western Australiaat 50 and 40 per 100,000 respectively—well below the state average of 64 per 100,000population. Dentists were relatively evenly distributed among most Perth regions (exceptCentral Metropolitan Perth, with the largest supply, at 162 per 100,000) and Lower WesternWA, in the range 30–36 per 100,000, with the Balance of WA having only 23 per 100,000population.
later
later
141.1 63.9 46.1 64.0
later
141.1 63.9 46.1 64.0161.7 34.3 28.9 40.9
later 161.7 34.3 28.9 40.9
Ambulance officer and paramedic
later Ambulance officer and paramedic
Total health occupations
later Total health occupations
editio
n the rest of the state outside Perth (2,049 and 1,314 per 100,000, respectively). For all of the key
editio
n the rest of the state outside Perth (2,049 and 1,314 per 100,000, respectively). For all of the key
gions of Perth was higher than in the rest of
editio
n gions of Perth was higher than in the rest of occupations the reverse was the case. There
editio
n occupations the reverse was the case. Therewere differences, however, between different outer-city areas.
editio
n were differences, however, between different outer-city areas.
Table 15: Supply of selected health and community services workers
editio
n Table 15: Supply of selected health and community services workersper 100,000 population, Western Australia, 2001
editio
n per 100,000 population, Western Australia, 2001
Capital city
editio
n Capital city
editio
n
Inner editio
n
Inner(a)editio
n (a) Outered
ition
Outer
741.5 104.2 100.6 143.7editio
n
741.5 104.2 100.6 143.7editio
n
141.1 63.9 46.1 64.0editio
n
141.1 63.9 46.1 64.0
avail
able
Table 15: Supply of selected health and community services workers
avail
able
Table 15: Supply of selected health and community services workers
avail
ableRest of
avail
ableRest of
state
avail
ablestate(c)
avail
able(c)
741.5 104.2 100.6 143.7
avail
able
741.5 104.2 100.6 143.7
avail
able
avail
able
141.1 63.9 46.1 64.0
avail
able
141.1 63.9 46.1 64.0161.7 34.3 28.9 40.9
avail
able
161.7 34.3 28.9 40.924.9 18.5 17.3 18.6
avail
able
24.9 18.5 17.3 18.6
13,281.7 1,500.6 2,049.0 2,397.3
avail
able
13,281.7 1,500.6 2,049.0 2,397.3
746.7 425.3 482.1 461.0avail
able
746.7 425.3 482.1 461.0560.9 226.2 364.8 284.8av
ailab
le
560.9 226.2 364.8 284.8
657.2 1avail
able
657.2 1
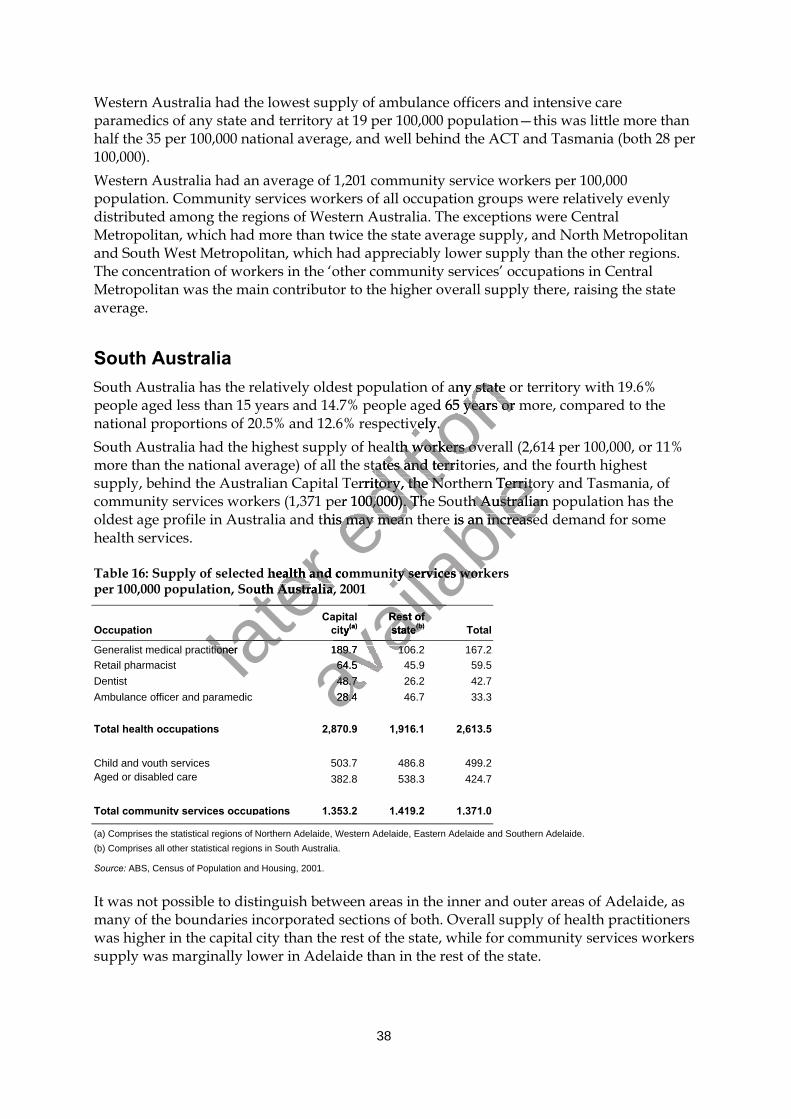
38
Western Australia had the lowest supply of ambulance officers and intensive careparamedics of any state and territory at 19 per 100,000 population—this was little more thanhalf the 35 per 100,000 national average, and well behind the ACT and Tasmania (both 28 per100,000).Western Australia had an average of 1,201 community service workers per 100,000population. Community services workers of all occupation groups were relatively evenlydistributed among the regions of Western Australia. The exceptions were CentralMetropolitan, which had more than twice the state average supply, and North Metropolitanand South West Metropolitan, which had appreciably lower supply than the other regions.The concentration of workers in the ‘other community services’ occupations in CentralMetropolitan was the main contributor to the higher overall supply there, raising the stateaverage.
South AustraliaSouth Australia has the relatively oldest population of any state or territory with 19.6%people aged less than 15 years and 14.7% people aged 65 years or more, compared to thenational proportions of 20.5% and 12.6% respectively.South Australia had the highest supply of health workers overall (2,614 per 100,000, or 11%more than the national average) of all the states and territories, and the fourth highestsupply, behind the Australian Capital Territory, the Northern Territory and Tasmania, ofcommunity services workers (1,371 per 100,000). The South Australian population has theoldest age profile in Australia and this may mean there is an increased demand for somehealth services.
Table 16: Supply of selected health and community services workersper 100,000 population, South Australia, 2001
OccupationCapital
city(a)Rest ofstate(b) Total
Generalist medical practitioner 189.7 106.2 167.2Retail pharmacist 64.5 45.9 59.5Dentist 48.7 26.2 42.7Ambulance officer and paramedic 28.4 46.7 33.3
Total health occupations 2,870.9 1,916.1 2,613.5
Child and youth services 503.7 486.8 499.2Aged or disabled care 382.8 538.3 424.7
Total community services occupations 1,353.2 1,419.2 1,371.0
(a) Comprises the statistical regions of Northern Adelaide, Western Adelaide, Eastern Adelaide and Southern Adelaide.(b) Comprises all other statistical regions in South Australia.
Source: ABS, Census of Population and Housing, 2001.
It was not possible to distinguish between areas in the inner and outer areas of Adelaide, asmany of the boundaries incorporated sections of both. Overall supply of health practitionerswas higher in the capital city than the rest of the state, while for community services workerssupply was marginally lower in Adelaide than in the rest of the state.
later Table 16: Supply of selected health and community services workers
later Table 16: Supply of selected health and community services workers
South Australia, 2001
later South Australia, 2001
later
later
Generalist medical practitionerlater
Generalist medical practitionerlater
editio
n lation of any state or territory with 19.6%
editio
n lation of any state or territory with 19.6%people aged less than 15 years and 14.7% people aged 65 years or more, compared to the
editio
n people aged less than 15 years and 14.7% people aged 65 years or more, compared to thenational proportions of 20.5% and 12.6% respectively.
editio
n national proportions of 20.5% and 12.6% respectively.South Australia had the highest supply of heal
editio
n South Australia had the highest supply of health workers overall (2,614 per 100,000, or 11%
editio
n th workers overall (2,614 per 100,000, or 11%
more than the national average) of all the st
editio
n more than the national average) of all the states and territories, and the fourth highest
editio
n ates and territories, and the fourth highest
supply, behind the Australian Capital Territo
editio
n supply, behind the Australian Capital Territory, the Northern Territory and Tasmania, of
editio
n ry, the Northern Territory and Tasmania, of
community services workers (1,371 per 100,000). The South Australian population has the
editio
n community services workers (1,371 per 100,000). The South Australian population has theoldest age profile in Australia and this maed
ition
oldest age profile in Australia and this may mean there is an increased demand for someeditio
n y mean there is an increased demand for some
avail
able
ates and territories, and the fourth highest
avail
able
ates and territories, and the fourth highestry, the Northern Territory and Tasmania, of
avail
able
ry, the Northern Territory and Tasmania, ofcommunity services workers (1,371 per 100,000). The South Australian population has the
avail
ablecommunity services workers (1,371 per 100,000). The South Australian population has the
y mean there is an increased demand for some
avail
abley mean there is an increased demand for some
Table 16: Supply of selected health and community services workers
avail
able
Table 16: Supply of selected health and community services workers
avail
able
Capital
avail
able
Capitalcity
avail
able
city
avail
able
(a)
avail
able
(a)Rest of
avail
able
Rest ofstate
avail
able
state(b)
avail
able
(b)
avail
able
189.7 106.2 167.2
avail
able
189.7 106.2 167.2
avail
able
64.5 45.9 59.5avail
able
64.5 45.9 59.548.7 26.2 42.7av
ailab
le
48.7 26.2 42.728.4 46.7 33.3av
ailab
le
28.4 46.7 33.3
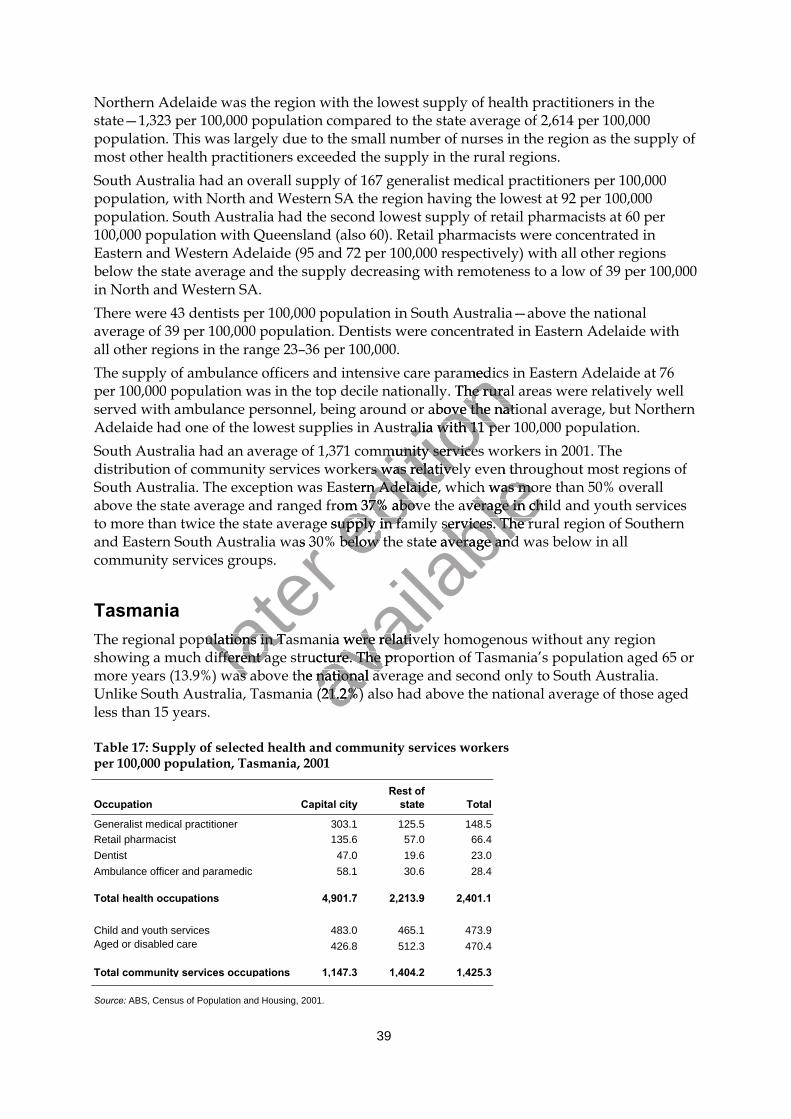
39
Northern Adelaide was the region with the lowest supply of health practitioners in thestate—1,323 per 100,000 population compared to the state average of 2,614 per 100,000population. This was largely due to the small number of nurses in the region as the supply ofmost other health practitioners exceeded the supply in the rural regions.South Australia had an overall supply of 167 generalist medical practitioners per 100,000population, with North and Western SA the region having the lowest at 92 per 100,000population. South Australia had the second lowest supply of retail pharmacists at 60 per100,000 population with Queensland (also 60). Retail pharmacists were concentrated inEastern and Western Adelaide (95 and 72 per 100,000 respectively) with all other regionsbelow the state average and the supply decreasing with remoteness to a low of 39 per 100,000in North and Western SA.There were 43 dentists per 100,000 population in South Australia—above the nationalaverage of 39 per 100,000 population. Dentists were concentrated in Eastern Adelaide withall other regions in the range 23–36 per 100,000.The supply of ambulance officers and intensive care paramedics in Eastern Adelaide at 76per 100,000 population was in the top decile nationally. The rural areas were relatively wellserved with ambulance personnel, being around or above the national average, but NorthernAdelaide had one of the lowest supplies in Australia with 11 per 100,000 population.South Australia had an average of 1,371 community services workers in 2001. Thedistribution of community services workers was relatively even throughout most regions ofSouth Australia. The exception was Eastern Adelaide, which was more than 50% overallabove the state average and ranged from 37% above the average in child and youth servicesto more than twice the state average supply in family services. The rural region of Southernand Eastern South Australia was 30% below the state average and was below in allcommunity services groups.
TasmaniaThe regional populations in Tasmania were relatively homogenous without any regionshowing a much different age structure. The proportion of Tasmania’s population aged 65 ormore years (13.9%) was above the national average and second only to South Australia.Unlike South Australia, Tasmania (21.2%) also had above the national average of those agedless than 15 years.
Table 17: Supply of selected health and community services workersper 100,000 population, Tasmania, 2001
Occupation Capital cityRest of
state Total
Generalist medical practitioner 303.1 125.5 148.5Retail pharmacist 135.6 57.0 66.4Dentist 47.0 19.6 23.0Ambulance officer and paramedic 58.1 30.6 28.4
Total health occupations 4,901.7 2,213.9 2,401.1
Child and youth services 483.0 465.1 473.9Aged or disabled care 426.8 512.3 470.4
Total community services occupations 1,147.3 1,404.2 1,425.3
Source: ABS, Census of Population and Housing, 2001.
later
and Eastern South Australia was 30% below the state average and was below in all
later
and Eastern South Australia was 30% below the state average and was below in all
The regional populations in Tasmania were later
The regional populations in Tasmania were later
showing a much different age structure. The proportion of Tasmania’s population aged 65 orlater
showing a much different age structure. The proportion of Tasmania’s population aged 65 ormore years (13.9%) was above the national avlat
er more years (13.9%) was above the national av
editio
n care paramedics in Eastern Adelaide at 76
editio
n care paramedics in Eastern Adelaide at 76ionally. The rural areas were relatively well
editio
n ionally. The rural areas were relatively well or above the national average, but Northern
editio
n or above the national average, but Northern Australia with 11 per 100,000 population.
editio
n Australia with 11 per 100,000 population.community services workers in 2001. The
editio
n community services workers in 2001. The
ices workers was relatively even throughout most regions of
editio
n ices workers was relatively even throughout most regions of
South Australia. The exception was Eastern
editio
n South Australia. The exception was Eastern Adelaide, which was more than 50% overall
editio
n Adelaide, which was more than 50% overall
above the state average and ranged from 37%
editio
n above the state average and ranged from 37% above the average in child and youth services
editio
n above the average in child and youth services
to more than twice the state average supply in editio
n to more than twice the state average supply in family services. The rural region of Southerned
ition
family services. The rural region of Southernand Eastern South Australia was 30% below the state average and was below in alled
ition
and Eastern South Australia was 30% below the state average and was below in all
avail
able
ices workers was relatively even throughout most regions of
avail
able
ices workers was relatively even throughout most regions ofAdelaide, which was more than 50% overall
avail
able
Adelaide, which was more than 50% overallabove the average in child and youth services
avail
ableabove the average in child and youth services
family services. The rural region of Southern
avail
ablefamily services. The rural region of Southern
and Eastern South Australia was 30% below the state average and was below in all
avail
ableand Eastern South Australia was 30% below the state average and was below in all
The regional populations in Tasmania were
avail
able
The regional populations in Tasmania were relatively homogenous without any region
avail
able
relatively homogenous without any region
avail
able
showing a much different age structure. The proportion of Tasmania’s population aged 65 or
avail
able
showing a much different age structure. The proportion of Tasmania’s population aged 65 ormore years (13.9%) was above the national avav
ailab
le
more years (13.9%) was above the national avavail
able
Unlike South Australia, Tasmania (21.2%) also hadavail
able
Unlike South Australia, Tasmania (21.2%) also had
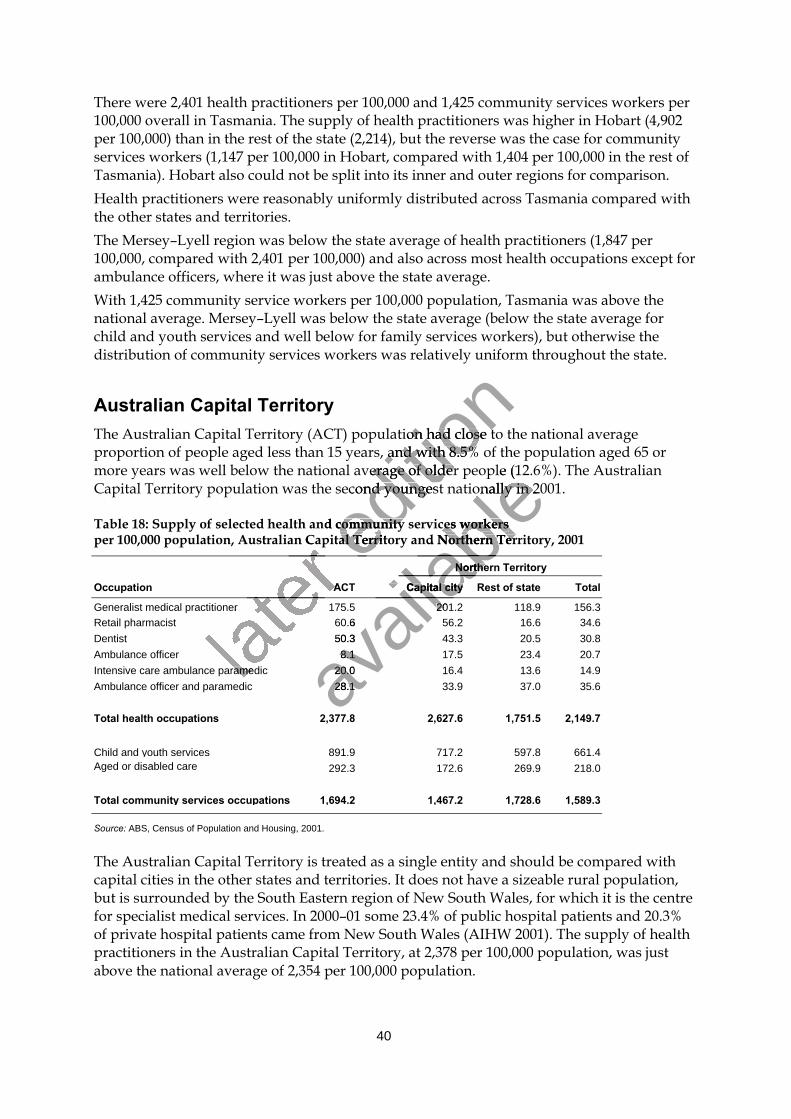
40
There were 2,401 health practitioners per 100,000 and 1,425 community services workers per100,000 overall in Tasmania. The supply of health practitioners was higher in Hobart (4,902per 100,000) than in the rest of the state (2,214), but the reverse was the case for communityservices workers (1,147 per 100,000 in Hobart, compared with 1,404 per 100,000 in the rest ofTasmania). Hobart also could not be split into its inner and outer regions for comparison.Health practitioners were reasonably uniformly distributed across Tasmania compared withthe other states and territories.The Mersey–Lyell region was below the state average of health practitioners (1,847 per100,000, compared with 2,401 per 100,000) and also across most health occupations except forambulance officers, where it was just above the state average.With 1,425 community service workers per 100,000 population, Tasmania was above thenational average. Mersey–Lyell was below the state average (below the state average forchild and youth services and well below for family services workers), but otherwise thedistribution of community services workers was relatively uniform throughout the state.
Australian Capital TerritoryThe Australian Capital Territory (ACT) population had close to the national averageproportion of people aged less than 15 years, and with 8.5% of the population aged 65 ormore years was well below the national average of older people (12.6%). The AustralianCapital Territory population was the second youngest nationally in 2001.
Table 18: Supply of selected health and community services workersper 100,000 population, Australian Capital Territory and Northern Territory, 2001
Northern Territory
Occupation ACT Capital city Rest of state Total
Generalist medical practitioner 175.5 201.2 118.9 156.3Retail pharmacist 60.6 56.2 16.6 34.6Dentist 50.3 43.3 20.5 30.8Ambulance officer 8.1 17.5 23.4 20.7Intensive care ambulance paramedic 20.0 16.4 13.6 14.9Ambulance officer and paramedic 28.1 33.9 37.0 35.6
Total health occupations 2,377.8 2,627.6 1,751.5 2,149.7
Child and youth services 891.9 717.2 597.8 661.4Aged or disabled care 292.3 172.6 269.9 218.0
Total community services occupations 1,694.2 1,467.2 1,728.6 1,589.3
Source: ABS, Census of Population and Housing, 2001.
The Australian Capital Territory is treated as a single entity and should be compared withcapital cities in the other states and territories. It does not have a sizeable rural population,but is surrounded by the South Eastern region of New South Wales, for which it is the centrefor specialist medical services. In 2000–01 some 23.4% of public hospital patients and 20.3%of private hospital patients came from New South Wales (AIHW 2001). The supply of healthpractitioners in the Australian Capital Territory, at 2,378 per 100,000 population, was justabove the national average of 2,354 per 100,000 population.
later
per 100,000 population, Australian Capital Territory and Northern Territory, 2001
later
per 100,000 population, Australian Capital Territory and Northern Territory, 2001
later ACT Capital city Rest of state Total
later ACT Capital city Rest of state Total
Generalist medical practitioner
later Generalist medical practitioner
later
later
Intensive care ambulance paramediclater
Intensive care ambulance paramedic
editio
n ry (ACT) population had close to the national average
editio
n ry (ACT) population had close to the national averageproportion of people aged less than 15 years,
editio
n proportion of people aged less than 15 years, and with 8.5% of the population aged 65 or
editio
n and with 8.5% of the population aged 65 or
more years was well below the national averag
editio
n more years was well below the national average of older people (12.6%). The Australian
editio
n e of older people (12.6%). The Australian
second youngest nationally in 2001.
editio
n second youngest nationally in 2001.
Table 18: Supply of selected health and community services workerseditio
n Table 18: Supply of selected health and community services workersper 100,000 population, Australian Capital Territory and Northern Territory, 2001ed
ition
per 100,000 population, Australian Capital Territory and Northern Territory, 2001editio
n
avail
able
e of older people (12.6%). The Australian
avail
able
e of older people (12.6%). The Australiansecond youngest nationally in 2001.
avail
ablesecond youngest nationally in 2001.
Table 18: Supply of selected health and community services workers
avail
ableTable 18: Supply of selected health and community services workers
per 100,000 population, Australian Capital Territory and Northern Territory, 2001
avail
ableper 100,000 population, Australian Capital Territory and Northern Territory, 2001
Northern Territory
avail
able
Northern Territory
avail
able
ACT Capital city Rest of state Total
avail
able
ACT Capital city Rest of state Total
avail
able
201.2 118.9 156.3
avail
able
201.2 118.9 156.3
avail
able
60.6
avail
able
60.650.3
avail
able
50.38.1
avail
able
8.120.0av
ailab
le
20.028.1av
ailab
le
28.1
41
With 1,694 community services workers per 100,000 population, the Australian CapitalTerritory had the highest overall supply of any state or territory, but was lower than anyother inner capital city region except Sydney. The ACT had a relatively large supply of 892child and youth services workers per 100,000 population compared to the national average of524 per 100,000. The ACT also had above the national average supply of aged and disabledcarers.
Northern TerritoryThe Northern Territory population had the youngest age profile in Australia, with 25.8% ofthe population aged less than 15 years and 3.9% aged 65 or more years. Indigenous peoplemade up 28.8% of the Northern Territory population in June 2001 (ABS 2003a).Overall supply of health practitioners was 2,150 per 100,000 in the Northern Territory, andthere were 1,589 community services workers per 100,000. As with Adelaide and Hobart,Darwin could not be split into its inner and outer regions for comparison. Except forambulance officers, supply of health practitioners and was higher in Darwin than the rest ofthe Northern Territory. The opposite was true for community services: except for child andyouth services workers, supply of community services workers was lower in Darwin thanthe rest of the Northern Territory.The supply of most health practitioners in the Northern Territory was below the nationalaverage but the territory was relatively well supplied with generalist medical practitioners.With 172 generalist medical practitioners per 100,000, Darwin was well above the nationalaverage (153), and the Balance NT region (137 per 100,000) was higher than most ex-metropolitan regions in the other states.The supply of dentists in Darwin (37 per 100,000) was just under the national average (39),and well above the supply in the Balance NT region (21).Retail pharmacists were in relatively short supply in the Northern Territory (35 per 100,000compared with 63 per 100,000 nationally), and the Balance NT at 16 per 100,000 populationwas about one-quarter the national average and well below the next lowest region which had26 per 100,000 population.The supply of ambulance officers and intensive care paramedics in Darwin was lower thanthe national average (35), and evenly split between ambulance officers and paramedics at 15and 14 per 100,000 population respectively. The Balance NT was appreciably higher (41 per100,000).The Northern Territory was second to the Australian Capital Territory for overall supply ofcommunity services workers and, except for aged and disabled carers, was above thenational average in all of the groupings shown in this publication. The Northern Territoryhad above the national average supply of child and youth services workers and below thenational average for aged and disabled carers, as could be expected given the relativeproportions of the client groups in the territory’s population. Relative to population, Darwinhad fewer community services workers, with the exception of child and youth services, thanthe Balance of the Northern Territory.
later
metropolitan regions in the other states.
later
metropolitan regions in the other states.The supply of dentists in Darwin (37 per 100,0
later
The supply of dentists in Darwin (37 per 100,0and well above the supply in the Balance NT region (21).
later and well above the supply in the Balance NT region (21).
Retail pharmacists were in relatively short
later Retail pharmacists were in relatively short
later compared with 63 per 100,000 nationally), and
later compared with 63 per 100,000 nationally), and
was about one-quarter the national average and later
was about one-quarter the national average and 26 per 100,000 population.lat
er 26 per 100,000 population.The supply of ambulance officers and intensivlat
er The supply of ambulance officers and intensiv
editio
n outer regions for comparison. Except for
editio
n outer regions for comparison. Except for
th practitioners and was higher
editio
n th practitioners and was higher for community services: except for child and
editio
n for community services: except for child andyouth services workers, supply of community services workers was lower in Darwin than
editio
n youth services workers, supply of community services workers was lower in Darwin than
titioners in the Northern Territory was below the national
editio
n titioners in the Northern Territory was below the national
average but the territory was relatively well supplied with generalist medical practitioners.
editio
n average but the territory was relatively well supplied with generalist medical practitioners.With 172 generalist medical practitioners per
editio
n With 172 generalist medical practitioners per 100,000, Darwin was well above the national
editio
n 100,000, Darwin was well above the national
average (153), and the Balance NT region (editio
n average (153), and the Balance NT region (137 per 100,000) was higher than most ex-ed
ition
137 per 100,000) was higher than most ex-metropolitan regions in the other states. ed
ition
metropolitan regions in the other states.The supply of dentists in Darwin (37 per 100,0ed
ition
The supply of dentists in Darwin (37 per 100,0
avail
able
titioners in the Northern Territory was below the national
avail
able
titioners in the Northern Territory was below the nationalaverage but the territory was relatively well supplied with generalist medical practitioners.
avail
able
average but the territory was relatively well supplied with generalist medical practitioners.100,000, Darwin was well above the national
avail
able100,000, Darwin was well above the national
137 per 100,000) was higher than most ex-
avail
able137 per 100,000) was higher than most ex-
00) was just under the national average (39),
avail
able
00) was just under the national average (39),and well above the supply in the Balance NT region (21).
avail
able
and well above the supply in the Balance NT region (21).Retail pharmacists were in relatively short
avail
able
Retail pharmacists were in relatively short supply in the Northern Territory (35 per 100,000
avail
able
supply in the Northern Territory (35 per 100,000
avail
able
compared with 63 per 100,000 nationally), and
avail
able
compared with 63 per 100,000 nationally), and the Balance NT at 16 per 100,000 population
avail
able
the Balance NT at 16 per 100,000 populationwas about one-quarter the national average and
avail
able
was about one-quarter the national average and well below the next lowest region which had
avail
able
well below the next lowest region which had
The supply of ambulance officers and intensivavail
able
The supply of ambulance officers and intensivthe national average (35), and evenly split beav
ailab
le
the national average (35), and evenly split beand 14 per 100,000 population respectively. Thav
ailab
le
and 14 per 100,000 population respectively. Th

42
Health and community services,occupations and industries tablesMost of the following tables are compiled from census data. For many census questions,there is a relatively small proportion of respondents who either do not supply an answer, orwhose response is not clear enough to place in a category. These responses are called ‘notstated’ and ‘not further defined’, respectively. When not stated responses are removed froma table for analytical purposes, however, it does make a numerical difference to the totalsshown. Readers should refer to the footnotes when totals are not consistent.The following classifications are used for analysis in this publication:� The Australian and New Zealand Standard Industry Classification (ANZSIC), at varying
degrees of detail, is used for industry breakdowns. The broad health industries includedin this report are hospitals and nursing homes, medical and dental services and otherhealth services, and the broad community services industries are child care services andcommunity care services. The broad industry grouping of ‘other health services’ includespathology services, optometry and optical dispensing, ambulance services, communityhealth centres, physiotherapy services, chiropractic services and health services notelsewhere classified (n.e.c).
� The Australian Standard Classification for Occupations (ASCO), 2nd edition is used for2001 occupation data. The highest categories (Major and Sub-major Groups, as presentedin Table A.4), incorporate occupations in nine skill levels, and range from managers andadministrators to labourers and related workers.Individual health and community services occupations sit within those categories in theMinor (as in Table A.26) and Unit Groups. For example, medical administrators are inMajor Group 1 (managers and administrators), generalist medical practitioners are inMajor Group 2 (professionals), dental therapists are in major Group 3 (associateprofessionals) and pre-school aides are in the Major Group 6 (intermediate clerical, salesand service workers).For this report, the individual occupations are re-grouped under different headings tofacilitate analysis (as presented in Table A.7, for example). For the health occupations,these groups include medical workers, medical imaging workers, dental workers,nursing workers, pharmacist workers, allied health workers, complementary therapiesworkers and miscellaneous health workers. Community services occupations aregrouped into child and youth services, family services workers, disability workers, agedand disabled care workers and other community services workers.Table A.6 presents only those health occupations that are consistent across the 1991, 1996and 2001 censuses, and for convenience are re-grouped as diagnosis and treatmentpractitioners, nurses and health-related occupations.
� Geographic area breakdowns include state/territory and region. The Australian StandardGeographic Classification (ASGC) is used for regional breakdowns, based on thepostcode of place of employment. ASGC remoteness areas and statistical regions are thetwo main categories used in this report.
� The ABS Classification of Qualifications relates to highest educational qualification.
The Explanatory notes provide more information about the above classification systems.
later
2001 occupation data. The highest categories
later
2001 occupation data. The highest categories in Table A.4), incorporate occupations in ni
later
in Table A.4), incorporate occupations in ni
later
administrators to labourers and related workers.
later
administrators to labourers and related workers.Individual health and community
later Individual health and community services occupations sit with
later services occupations sit with
Minor (as in Table A.26) and Unit Groups.
later Minor (as in Table A.26) and Unit Groups.
Major Group 1 (managers and administrators),
later Major Group 1 (managers and administrators),
Major Group 2 (professionals), dental therlater
Major Group 2 (professionals), dental therlater
professionals) and pre-school aides are in the Major Group 6 later
professionals) and pre-school aides are in the Major Group 6 and service workers).lat
er and service workers).
editio
n ry Classification (ANZSIC), at varying
editio
n ry Classification (ANZSIC), at varying
kdowns. The broad health industries included
editio
n kdowns. The broad health industries includedmes, medical and dental services and other
editio
n mes, medical and dental services and otherhealth services, and the broad community services industries are child care services and
editio
n health services, and the broad community services industries are child care services andcommunity care services. The broad industry grouping of ‘other health services’ includes
editio
n community care services. The broad industry grouping of ‘other health services’ includespathology services, optometry and optical
editio
n pathology services, optometry and optical dispensing, ambulanc
editio
n dispensing, ambulanc
health centres, physiotherapy services, chir
editio
n health centres, physiotherapy services, chiropractic services and health services not
editio
n opractic services and health services not
The Australian Standard Classifica editio
n The Australian Standard Classification for Occupations (ASCO), 2ed
ition
tion for Occupations (ASCO), 22001 occupation data. The highest categories ed
ition
2001 occupation data. The highest categories in Table A.4), incorporate occupations in nied
ition
in Table A.4), incorporate occupations in niadministrators to labourers and related workers.ed
ition
administrators to labourers and related workers.
avail
able
opractic services and health services not
avail
able
opractic services and health services not
tion for Occupations (ASCO), 2
avail
abletion for Occupations (ASCO), 2nd
avail
ablend
(Major and Sub-major Groups, as presented
avail
able(Major and Sub-major Groups, as presented
ne skill levels, and range from managers and
avail
ablene skill levels, and range from managers and
avail
able
administrators to labourers and related workers.
avail
able
administrators to labourers and related workers. services occupations sit with
avail
able
services occupations sit withMinor (as in Table A.26) and Unit Groups.
avail
able
Minor (as in Table A.26) and Unit Groups. For example, medical administrators are in
avail
able
For example, medical administrators are inMajor Group 1 (managers and administrators),
avail
able
Major Group 1 (managers and administrators), generalist medical practitioners are in
avail
able
generalist medical practitioners are inMajor Group 2 (professionals), dental ther
avail
able
Major Group 2 (professionals), dental ther
avail
able
apists are in major Group 3 (associate
avail
able
apists are in major Group 3 (associateprofessionals) and pre-school aides are in the Major Group 6
avail
able
professionals) and pre-school aides are in the Major Group 6
For this report, the individual occupations avail
able
For this report, the individual occupations facilitate analysis (as presented in Table A.7,av
ailab
le
facilitate analysis (as presented in Table A.7,
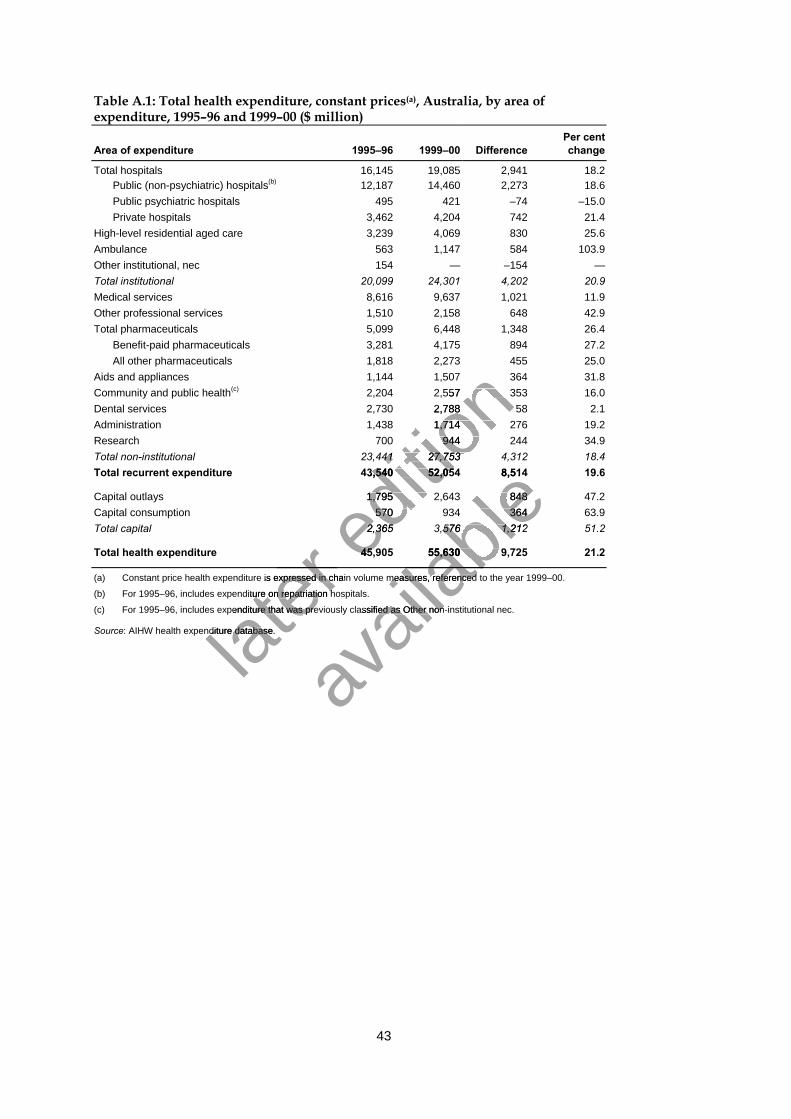
43
Table A.1: Total health expenditure, constant prices(a), Australia, by area ofexpenditure, 1995–96 and 1999–00 ($ million)
Area of expenditure 1995–96 1999–00 DifferencePer centchange
Total hospitals 16,145 19,085 2,941 18.2Public (non-psychiatric) hospitals(b) 12,187 14,460 2,273 18.6Public psychiatric hospitals 495 421 –74 –15.0Private hospitals 3,462 4,204 742 21.4
High-level residential aged care 3,239 4,069 830 25.6Ambulance 563 1,147 584 103.9Other institutional, nec 154 — –154 —Total institutional 20,099 24,301 4,202 20.9Medical services 8,616 9,637 1,021 11.9Other professional services 1,510 2,158 648 42.9Total pharmaceuticals 5,099 6,448 1,348 26.4
Benefit-paid pharmaceuticals 3,281 4,175 894 27.2All other pharmaceuticals 1,818 2,273 455 25.0
Aids and appliances 1,144 1,507 364 31.8Community and public health(c) 2,204 2,557 353 16.0Dental services 2,730 2,788 58 2.1Administration 1,438 1,714 276 19.2Research 700 944 244 34.9Total non-institutional 23,441 27,753 4,312 18.4Total recurrent expenditure 43,540 52,054 8,514 19.6
Capital outlays 1,795 2,643 848 47.2Capital consumption 570 934 364 63.9Total capital 2,365 3,576 1,212 51.2
Total health expenditure 45,905 55,630 9,725 21.2
(a) Constant price health expenditure is expressed in chain volume measures, referenced to the year 1999–00.
(b) For 1995–96, includes expenditure on repatriation hospitals.
(c) For 1995–96, includes expenditure that was previously classified as Other non-institutional nec.
Source: AIHW health expenditure database.later
later (a) Constant price health expenditure is expressed in chain volume measures, referenced to the year 1999–00.
later (a) Constant price health expenditure is expressed in chain volume measures, referenced to the year 1999–00.
later (b) For 1995–96, includes expenditure on repatriation hospitals.
later (b) For 1995–96, includes expenditure on repatriation hospitals.
(c) For 1995–96, includes expenditure that was previously classified as Other non-institutional nec.
later (c) For 1995–96, includes expenditure that was previously classified as Other non-institutional nec.
: AIHW health expenditure database.later
: AIHW health expenditure database.
editio
n 1,818 2,273 455
editio
n 1,818 2,273 4551,144 1,507 364
editio
n 1,144 1,507 3642,204 2,557 353
editio
n 2,204 2,557 3532,730 2,788
editio
n 2,730 2,788 58
editio
n 581,438 1,714 276
editio
n 1,438 1,714 276700 944 244
editio
n 700 944 244
23,441 27,753 4,312
editio
n 23,441 27,753 4,31243,540 52,054 8,514
editio
n 43,540 52,054 8,514
1,795 2,643 848
editio
n 1,795 2,643 848
570 934 364editio
n 570 934 364
2,365 3,576 1,212editio
n
2,365 3,576 1,212
45,905 55,630 9,725editio
n
45,905 55,630 9,725
avail
able
43,540 52,054 8,514
avail
able
43,540 52,054 8,514
1,795 2,643 848
avail
able1,795 2,643 848
570 934 364
avail
able570 934 364
2,365 3,576 1,212
avail
able2,365 3,576 1,212
45,905 55,630 9,725
avail
able
45,905 55,630 9,725
avail
able
avail
able
(a) Constant price health expenditure is expressed in chain volume measures, referenced to the year 1999–00.
avail
able
(a) Constant price health expenditure is expressed in chain volume measures, referenced to the year 1999–00.
avail
able
(c) For 1995–96, includes expenditure that was previously classified as Other non-institutional nec.
avail
able
(c) For 1995–96, includes expenditure that was previously classified as Other non-institutional nec.
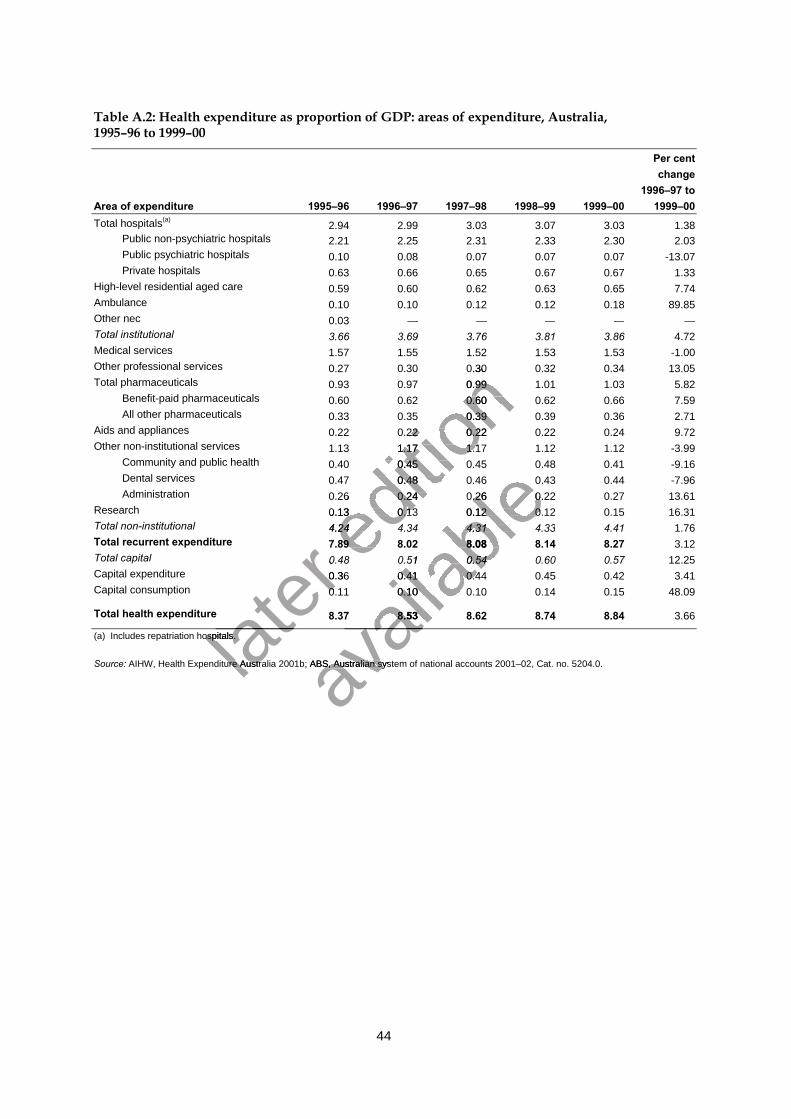
44
Table A.2: Health expenditure as proportion of GDP: areas of expenditure, Australia,1995–96 to 1999–00
Area of expenditure 1995–96 1996–97 1997–98 1998–99 1999–00
Per centchange
1996–97 to1999–00
Total hospitals(a)2.94 2.99 3.03 3.07 3.03 1.38
Public non-psychiatric hospitals 2.21 2.25 2.31 2.33 2.30 2.03Public psychiatric hospitals 0.10 0.08 0.07 0.07 0.07 -13.07Private hospitals 0.63 0.66 0.65 0.67 0.67 1.33
High-level residential aged care 0.59 0.60 0.62 0.63 0.65 7.74Ambulance 0.10 0.10 0.12 0.12 0.18 89.85Other nec 0.03 — — — — —Total institutional 3.66 3.69 3.76 3.81 3.86 4.72Medical services 1.57 1.55 1.52 1.53 1.53 -1.00Other professional services 0.27 0.30 0.30 0.32 0.34 13.05Total pharmaceuticals 0.93 0.97 0.99 1.01 1.03 5.82
Benefit-paid pharmaceuticals 0.60 0.62 0.60 0.62 0.66 7.59All other pharmaceuticals 0.33 0.35 0.39 0.39 0.36 2.71
Aids and appliances 0.22 0.22 0.22 0.22 0.24 9.72Other non-institutional services 1.13 1.17 1.17 1.12 1.12 -3.99
Community and public health 0.40 0.45 0.45 0.48 0.41 -9.16Dental services 0.47 0.48 0.46 0.43 0.44 -7.96Administration 0.26 0.24 0.26 0.22 0.27 13.61
Research 0.13 0.13 0.12 0.12 0.15 16.31Total non-institutional 4.24 4.34 4.31 4.33 4.41 1.76Total recurrent expenditure 7.89 8.02 8.08 8.14 8.27 3.12Total capital 0.48 0.51 0.54 0.60 0.57 12.25Capital expenditure 0.36 0.41 0.44 0.45 0.42 3.41Capital consumption 0.11 0.10 0.10 0.14 0.15 48.09
Total health expenditure 8.37 8.53 8.62 8.74 8.84 3.66
(a) Includes repatriation hospitals.
Source: AIHW, Health Expenditure Australia 2001b; ABS, Australian system of national accounts 2001–02, Cat. no. 5204.0.later
0.48 0.51 0.54 0.60 0.5
later
0.48 0.51 0.54 0.60 0.50.36 0.41 0.44 0.45 0.42 3.41
later 0.36 0.41 0.44 0.45 0.42 3.41
0.11 0.10 0.10 0.14 0.15 48.09
later 0.11 0.10 0.10 0.14 0.15 48.09
later
later
(a) Includes repatriation hospitals. later
(a) Includes repatriation hospitals.
AIHW, Health Expenditure Australia 2001b; ABS, Australater
AIHW, Health Expenditure Australia 2001b; ABS, Austra
editio
n 0.27 0.30 0.30 0.32 0.34 13.05
editio
n 0.27 0.30 0.30 0.32 0.34 13.050.93 0.97 0.99 1.01 1.03 5.82
editio
n 0.93 0.97 0.99 1.01 1.03 5.820.60 0.62 0.60 0.62 0.66 7.59
editio
n 0.60 0.62 0.60 0.62 0.66 7.590.33 0.35 0.39 0.39 0.36 2.71
editio
n 0.33 0.35 0.39 0.39 0.36 2.710.22 0.22 0.22 0.22 0.24 9.72
editio
n 0.22 0.22 0.22 0.22 0.24 9.721.13 1.17 1.17 1.12 1.12 -3.99
editio
n 1.13 1.17 1.17 1.12 1.12 -3.990.40 0.45 0.45 0.48 0.41 -9.16
editio
n 0.40 0.45 0.45 0.48 0.41 -9.160.47 0.48 0.46 0.43 0.44 -7.96
editio
n 0.47 0.48 0.46 0.43 0.44 -7.960.26 0.24 0.26 0.22 0.27 13.61
editio
n 0.26 0.24 0.26 0.22 0.27 13.610.13 0.13 0.12 0.12 0.15 16.31ed
ition
0.13 0.13 0.12 0.12 0.15 16.314.24 4.34 4.31 4.3ed
ition
4.24 4.34 4.31 4.37.89 8.02 8.08 8.14 8.27ed
ition
7.89 8.02 8.08 8.14 8.270.48 0.51 0.54 0.60 0.5ed
ition
0.48 0.51 0.54 0.60 0.5
avail
able
0.40 0.45 0.45 0.48 0.41 -9.16
avail
able
0.40 0.45 0.45 0.48 0.41 -9.160.47 0.48 0.46 0.43 0.44 -7.96
avail
able
0.47 0.48 0.46 0.43 0.44 -7.960.26 0.24 0.26 0.22 0.27 13.61
avail
able0.26 0.24 0.26 0.22 0.27 13.61
0.13 0.13 0.12 0.12 0.15 16.31
avail
able0.13 0.13 0.12 0.12 0.15 16.31
4.24 4.34 4.31 4.3
avail
able4.24 4.34 4.31 4.3
7.89 8.02 8.08 8.14 8.27
avail
able7.89 8.02 8.08 8.14 8.27
0.48 0.51 0.54 0.60 0.5
avail
able
0.48 0.51 0.54 0.60 0.50.36 0.41 0.44 0.45 0.42 3.41
avail
able
0.36 0.41 0.44 0.45 0.42 3.410.11 0.10 0.10 0.14 0.15 48.09
avail
able
0.11 0.10 0.10 0.14 0.15 48.09
8.37 8.53 8.62 8.74 8.84
avail
able
8.37 8.53 8.62 8.74 8.84
avail
able
avail
able
AIHW, Health Expenditure Australia 2001b; ABS, Austraavail
able
AIHW, Health Expenditure Australia 2001b; ABS, Australian system of national accounts 2001–02, Cat. no. 5204.0.avail
able
lian system of national accounts 2001–02, Cat. no. 5204.0.
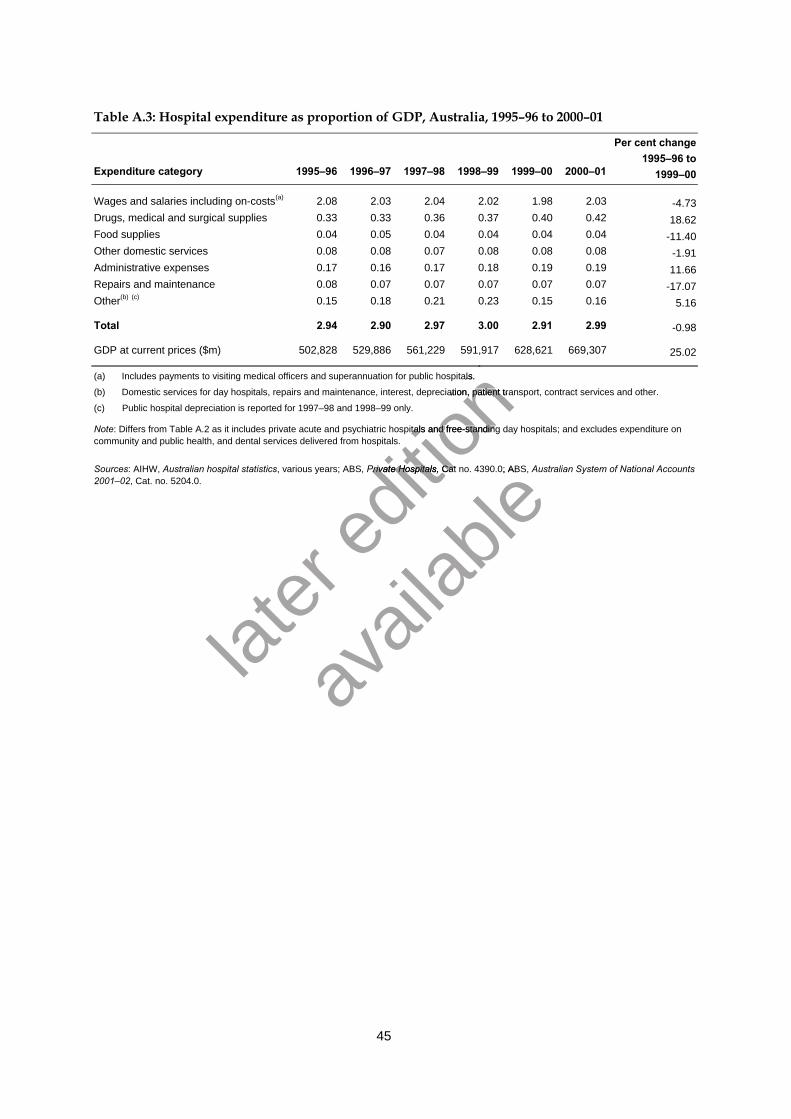
45
Table A.3: Hospital expenditure as proportion of GDP, Australia, 1995–96 to 2000–01
Expenditure category 1995–96 1996–97 1997–98 1998–99 1999–00 2000–01
Per cent change1995–96 to
1999–00
Wages and salaries including on-costs(a) 2.08 2.03 2.04 2.02 1.98 2.03 -4.73Drugs, medical and surgical supplies 0.33 0.33 0.36 0.37 0.40 0.42 18.62Food supplies 0.04 0.05 0.04 0.04 0.04 0.04 -11.40Other domestic services 0.08 0.08 0.07 0.08 0.08 0.08 -1.91Administrative expenses 0.17 0.16 0.17 0.18 0.19 0.19 11.66Repairs and maintenance 0.08 0.07 0.07 0.07 0.07 0.07 -17.07Other(b) (c) 0.15 0.18 0.21 0.23 0.15 0.16 5.16
Total 2.94 2.90 2.97 3.00 2.91 2.99 -0.98
GDP at current prices ($m) 502,828 529,886 561,229 591,917 628,621 669,307 25.02
(a) Includes payments to visiting medical officers and superannuation for public hospitals.
(b) Domestic services for day hospitals, repairs and maintenance, interest, depreciation, patient transport, contract services and other.
(c) Public hospital depreciation is reported for 1997–98 and 1998–99 only.
Note: Differs from Table A.2 as it includes private acute and psychiatric hospitals and free-standing day hospitals; and excludes expenditure oncommunity and public health, and dental services delivered from hospitals.
Sources: AIHW, Australian hospital statistics, various years; ABS, Private Hospitals, Cat no. 4390.0; ABS, Australian System of National Accounts2001–02, Cat. no. 5204.0.
later
editio
n
editio
n ficers and superannuation for public hospitals.
editio
n ficers and superannuation for public hospitals.
interest, depreciation, patient transport, contract services
editio
n interest, depreciation, patient transport, contract services
: Differs from Table A.2 as it includes private acute and psychiatric hospitals and free-standing day hospitals; and excludes expenditure on
editio
n : Differs from Table A.2 as it includes private acute and psychiatric hospitals and free-standing day hospitals; and excludes expenditure oncommunity and public health, and dental services delivered from hospitals.
editio
n community and public health, and dental services delivered from hospitals.
Private Hospitals,
editio
n Private Hospitals, Cat no. 4390.0; ABS,
editio
n Cat no. 4390.0; ABS,
avail
able
Cat no. 4390.0; ABS,
avail
able
Cat no. 4390.0; ABS,
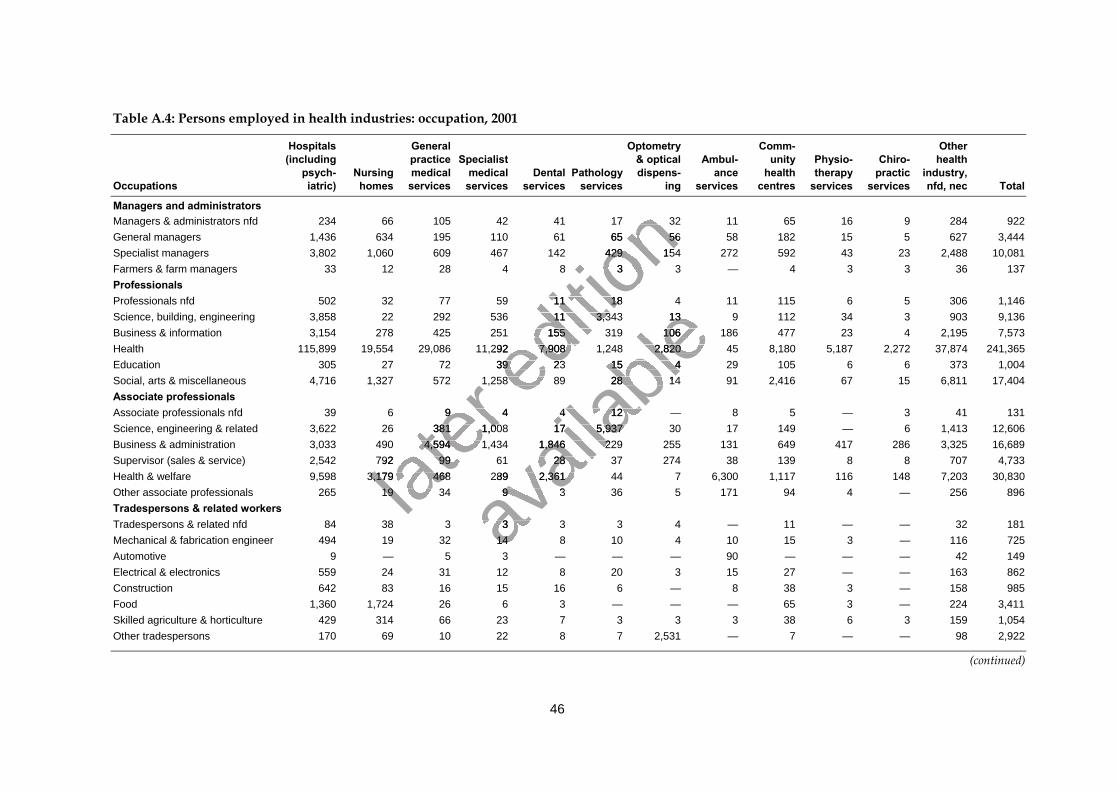
46
Table A.4: Persons employed in health industries: occupation, 2001
Occupations
Hospitals(including
psych-iatric)
Nursinghomes
Generalpracticemedicalservices
Specialistmedicalservices
Dentalservices
Pathologyservices
Optometry& opticaldispens-
ing
Ambul-ance
services
Comm-unity
healthcentres
Physio-therapy
services
Chiro-practic
services
Otherhealth
industry,nfd, nec Total
Managers and administratorsManagers & administrators nfd 234 66 105 42 41 17 32 11 65 16 9 284 922General managers 1,436 634 195 110 61 65 56 58 182 15 5 627 3,444Specialist managers 3,802 1,060 609 467 142 429 154 272 592 43 23 2,488 10,081Farmers & farm managers 33 12 28 4 8 3 3 — 4 3 3 36 137ProfessionalsProfessionals nfd 502 32 77 59 11 18 4 11 115 6 5 306 1,146Science, building, engineering 3,858 22 292 536 11 3,343 13 9 112 34 3 903 9,136Business & information 3,154 278 425 251 155 319 106 186 477 23 4 2,195 7,573Health 115,899 19,554 29,086 11,292 7,908 1,248 2,820 45 8,180 5,187 2,272 37,874 241,365Education 305 27 72 39 23 15 4 29 105 6 6 373 1,004Social, arts & miscellaneous 4,716 1,327 572 1,258 89 28 14 91 2,416 67 15 6,811 17,404Associate professionalsAssociate professionals nfd 39 6 9 4 4 12 — 8 5 — 3 41 131Science, engineering & related 3,622 26 381 1,008 17 5,937 30 17 149 — 6 1,413 12,606Business & administration 3,033 490 4,594 1,434 1,846 229 255 131 649 417 286 3,325 16,689Supervisor (sales & service) 2,542 792 99 61 28 37 274 38 139 8 8 707 4,733Health & welfare 9,598 3,179 468 289 2,361 44 7 6,300 1,117 116 148 7,203 30,830Other associate professionals 265 19 34 9 3 36 5 171 94 4 — 256 896Tradespersons & related workersTradespersons & related nfd 84 38 3 3 3 3 4 — 11 — — 32 181Mechanical & fabrication engineer 494 19 32 14 8 10 4 10 15 3 — 116 725Automotive 9 — 5 3 — — — 90 — — — 42 149Electrical & electronics 559 24 31 12 8 20 3 15 27 — — 163 862Construction 642 83 16 15 16 6 — 8 38 3 — 158 985Food 1,360 1,724 26 6 3 — — — 65 3 — 224 3,411Skilled agriculture & horticulture 429 314 66 23 7 3 3 3 38 6 3 159 1,054Other tradespersons 170 69 10 22 8 7 2,531 — 7 — — 98 2,922
(continued)
later
4,716 1,327 572 1,258 89 28 14 91 2,416 67 15 6,811 17,404
later
4,716 1,327 572 1,258 89 28 14 91 2,416 67 15 6,811 17,404
39 6 9 4 4 12 — 8 5 — 3 41 131
later 39 6 9 4 4 12 — 8 5 — 3 41 131
Science, engineering & related 3,622 26 381 1,008 17 5,937 30 17 149 — 6 1,413 12,606
later Science, engineering & related 3,622 26 381 1,008 17 5,937 30 17 149 — 6 1,413 12,606
3,033 490 4,594 1,434 1,846 229 255 131 649 417 286 3,325 16,689
later 3,033 490 4,594 1,434 1,846 229 255 131 649 417 286 3,325 16,689
2,542 792 99 61 28 37 274 38 139 8 8 707 4,733
later 2,542 792 99 61 28 37 274 38 139 8 8 707 4,733
9,598 3,179 468 289 2,361 44 7 6,300 1,117 116 148 7,203 30,830later
9,598 3,179 468 289 2,361 44 7 6,300 1,117 116 148 7,203 30,830265 19 34 9 3 36 5 171 94 4 — 256 896lat
er 265 19 34 9 3 36 5 171 94 4 — 256 896
editio
n 234 66 105 42 41 17 32 11 65 16 9 284 922
editio
n 234 66 105 42 41 17 32 11 65 16 9 284 9221,436 634 195 110 61 65 56 58 182 15 5 627 3,444
editio
n 1,436 634 195 110 61 65 56 58 182 15 5 627 3,4443,802 1,060 609 467 142 429 154 272 592 43 23 2,488 10,081
editio
n 3,802 1,060 609 467 142 429 154 272 592 43 23 2,488 10,08133 12 28 4 8 3 3 — 4 3 3 36 137
editio
n 33 12 28 4 8 3 3 — 4 3 3 36 137
502 32 77 59 11 18 4 11 115 6 5 306 1,146
editio
n
502 32 77 59 11 18 4 11 115 6 5 306 1,1463,858 22 292 536 11 3,343 13 9 112 34 3 903 9,136
editio
n 3,858 22 292 536 11 3,343 13 9 112 34 3 903 9,1363,154 278 425 251 155 319 106 186 477 23 4 2,195 7,573
editio
n 3,154 278 425 251 155 319 106 186 477 23 4 2,195 7,573
115,899 19,554 29,086 11,292 7,908 1,248 2,820 45 8,180 5,187 2,272 37,874 241,365editio
n 115,899 19,554 29,086 11,292 7,908 1,248 2,820 45 8,180 5,187 2,272 37,874 241,365
305 27 72 39 23 15 4 29 105 6 6 373 1,004editio
n 305 27 72 39 23 15 4 29 105 6 6 373 1,004
4,716 1,327 572 1,258 89 28 14 91 2,416 67 15 6,811 17,404editio
n 4,716 1,327 572 1,258 89 28 14 91 2,416 67 15 6,811 17,404
avail
able
502 32 77 59 11 18 4 11 115 6 5 306 1,146
avail
able
502 32 77 59 11 18 4 11 115 6 5 306 1,1463,858 22 292 536 11 3,343 13 9 112 34 3 903 9,136
avail
able
3,858 22 292 536 11 3,343 13 9 112 34 3 903 9,1363,154 278 425 251 155 319 106 186 477 23 4 2,195 7,573
avail
able3,154 278 425 251 155 319 106 186 477 23 4 2,195 7,573
115,899 19,554 29,086 11,292 7,908 1,248 2,820 45 8,180 5,187 2,272 37,874 241,365
avail
able115,899 19,554 29,086 11,292 7,908 1,248 2,820 45 8,180 5,187 2,272 37,874 241,365
305 27 72 39 23 15 4 29 105 6 6 373 1,004
avail
able305 27 72 39 23 15 4 29 105 6 6 373 1,004
4,716 1,327 572 1,258 89 28 14 91 2,416 67 15 6,811 17,404
avail
able4,716 1,327 572 1,258 89 28 14 91 2,416 67 15 6,811 17,404
39 6 9 4 4 12 — 8 5 — 3 41 131
avail
able
39 6 9 4 4 12 — 8 5 — 3 41 131Science, engineering & related 3,622 26 381 1,008 17 5,937 30 17 149 — 6 1,413 12,606
avail
able
Science, engineering & related 3,622 26 381 1,008 17 5,937 30 17 149 — 6 1,413 12,6063,033 490 4,594 1,434 1,846 229 255 131 649 417 286 3,325 16,689
avail
able
3,033 490 4,594 1,434 1,846 229 255 131 649 417 286 3,325 16,6892,542 792 99 61 28 37 274 38 139 8 8 707 4,733
avail
able
2,542 792 99 61 28 37 274 38 139 8 8 707 4,7339,598 3,179 468 289 2,361 44 7 6,300 1,117 116 148 7,203 30,830
avail
able
9,598 3,179 468 289 2,361 44 7 6,300 1,117 116 148 7,203 30,830265 19 34 9 3 36 5 171 94 4 — 256 896
avail
able
265 19 34 9 3 36 5 171 94 4 — 256 896
avail
able
84 38 3 3 3 3 4 — 11 — — 32 181avail
able
84 38 3 3 3 3 4 — 11 — — 32 181Mechanical & fabrication engineer 494 19 32 14 8 10 4 10 15 3 — 116 725av
ailab
leMechanical & fabrication engineer 494 19 32 14 8 10 4 10 15 3 — 116 725
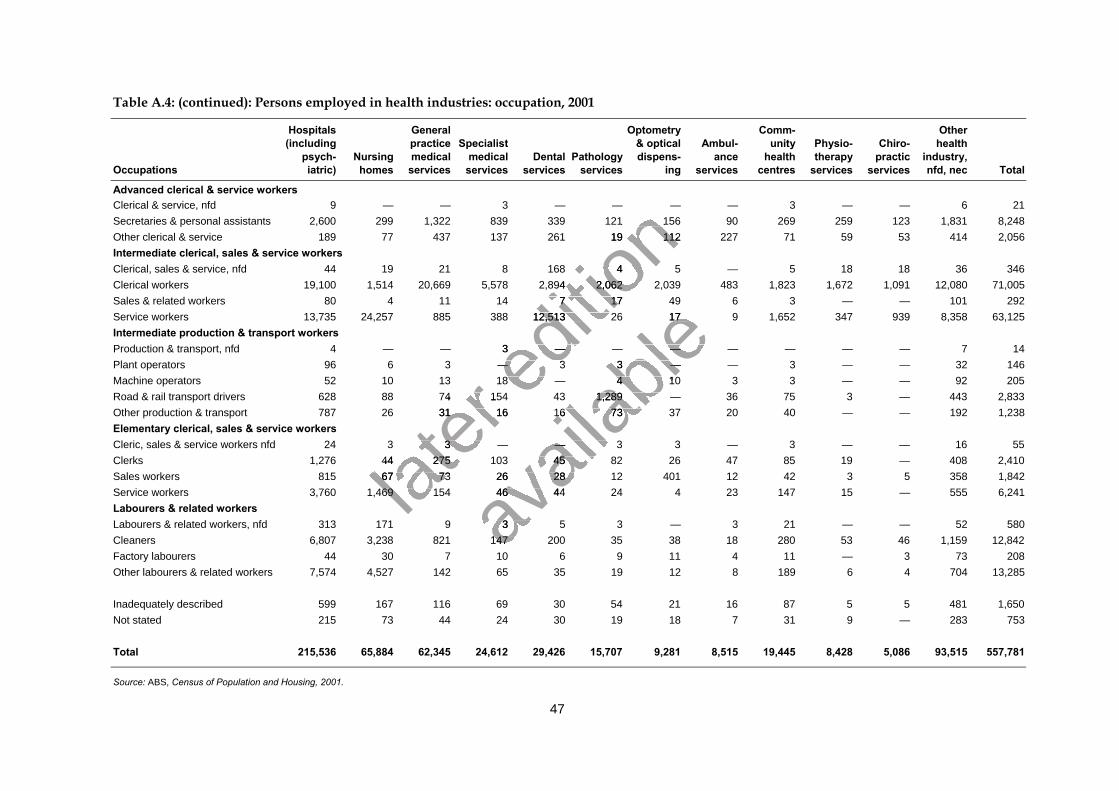
47
Table A.4: (continued): Persons employed in health industries: occupation, 2001
Occupations
Hospitals(including
psych-iatric)
Nursinghomes
Generalpracticemedicalservices
Specialistmedicalservices
Dentalservices
Pathologyservices
Optometry& opticaldispens-
ing
Ambul-ance
services
Comm-unity
healthcentres
Physio-therapy
services
Chiro-practic
services
Otherhealth
industry,nfd, nec Total
Advanced clerical & service workersClerical & service, nfd 9 — — 3 — — — — 3 — — 6 21Secretaries & personal assistants 2,600 299 1,322 839 339 121 156 90 269 259 123 1,831 8,248Other clerical & service 189 77 437 137 261 19 112 227 71 59 53 414 2,056Intermediate clerical, sales & service workersClerical, sales & service, nfd 44 19 21 8 168 4 5 — 5 18 18 36 346Clerical workers 19,100 1,514 20,669 5,578 2,894 2,062 2,039 483 1,823 1,672 1,091 12,080 71,005Sales & related workers 80 4 11 14 7 17 49 6 3 — — 101 292Service workers 13,735 24,257 885 388 12,513 26 17 9 1,652 347 939 8,358 63,125Intermediate production & transport workersProduction & transport, nfd 4 — — 3 — — — — — — — 7 14Plant operators 96 6 3 — 3 3 — — 3 — — 32 146Machine operators 52 10 13 18 — 4 10 3 3 — — 92 205Road & rail transport drivers 628 88 74 154 43 1,289 — 36 75 3 — 443 2,833Other production & transport 787 26 31 16 16 73 37 20 40 — — 192 1,238Elementary clerical, sales & service workersCleric, sales & service workers nfd 24 3 3 — — 3 3 — 3 — — 16 55Clerks 1,276 44 275 103 45 82 26 47 85 19 — 408 2,410Sales workers 815 67 73 26 28 12 401 12 42 3 5 358 1,842Service workers 3,760 1,469 154 46 44 24 4 23 147 15 — 555 6,241Labourers & related workersLabourers & related workers, nfd 313 171 9 3 5 3 — 3 21 — — 52 580Cleaners 6,807 3,238 821 147 200 35 38 18 280 53 46 1,159 12,842Factory labourers 44 30 7 10 6 9 11 4 11 — 3 73 208Other labourers & related workers 7,574 4,527 142 65 35 19 12 8 189 6 4 704 13,285
Inadequately described 599 167 116 69 30 54 21 16 87 5 5 481 1,650Not stated 215 73 44 24 30 19 18 7 31 9 — 283 753
Total 215,536 65,884 62,345 24,612 29,426 15,707 9,281 8,515 19,445 8,428 5,086 93,515 557,781
Source: ABS, Census of Population and Housing, 2001.
later
52 10 13 18 — 4 10 3 3 — — 92 205
later
52 10 13 18 — 4 10 3 3 — — 92 205628 88 74 154 43 1,289 — 36 75 3 — 443 2,833
later
628 88 74 154 43 1,289 — 36 75 3 — 443 2,833787 26 31 16 16 73 37 20 40 — — 192 1,238
later 787 26 31 16 16 73 37 20 40 — — 192 1,238
Cleric, sales & service workers nfd 24 3 3 — — 3 3 — 3 — — 16 55
later Cleric, sales & service workers nfd 24 3 3 — — 3 3 — 3 — — 16 55
1,276 44 275 103 45 82 26 47 85 19 — 408 2,410
later 1,276 44 275 103 45 82 26 47 85 19 — 408 2,410
815 67 73 26 28 12 401 12 42 3 5 358 1,842later
815 67 73 26 28 12 401 12 42 3 5 358 1,8423,760 1,469 154 46 44 24 4 23 147 15 — 555 6,241lat
er 3,760 1,469 154 46 44 24 4 23 147 15 — 555 6,241
editio
n
9 — — 3 — — — — 3 — — 6 21
editio
n
9 — — 3 — — — — 3 — — 6 21Secretaries & personal assistants 2,600 299 1,322 839 339 121 156 90 269 259 123 1,831 8,248
editio
n Secretaries & personal assistants 2,600 299 1,322 839 339 121 156 90 269 259 123 1,831 8,248189 77 437 137 261 19 112 227 71 59 53 414 2,056
editio
n 189 77 437 137 261 19 112 227 71 59 53 414 2,056
44 19 21 8 168 4 5 — 5 18 18 36 346
editio
n 44 19 21 8 168 4 5 — 5 18 18 36 3462,894 2,062 2,039 483 1,823 1,672 1,091 12,080 71,005
editio
n
2,894 2,062 2,039 483 1,823 1,672 1,091 12,080 71,00580 4 11 14 7 17 49 6 3 — — 101 292
editio
n
80 4 11 14 7 17 49 6 3 — — 101 29213,735 24,257 885 388 12,513 26 17 9 1,652 347 939 8,358 63,125
editio
n 13,735 24,257 885 388 12,513 26 17 9 1,652 347 939 8,358 63,125
4 — — 3 — — — — — — — 7 14editio
n 4 — — 3 — — — — — — — 7 14
96 6 3 — 3 3 — — 3 — — 32 146editio
n 96 6 3 — 3 3 — — 3 — — 32 14652 10 13 18 — 4 10 3 3 — — 92 205editio
n 52 10 13 18 — 4 10 3 3 — — 92 205
628 88 74 154 43 1,289 — 36 75 3 — 443 2,833editio
n 628 88 74 154 43 1,289 — 36 75 3 — 443 2,833
avail
able
80 4 11 14 7 17 49 6 3 — — 101 292
avail
able
80 4 11 14 7 17 49 6 3 — — 101 29213,735 24,257 885 388 12,513 26 17 9 1,652 347 939 8,358 63,125
avail
able
13,735 24,257 885 388 12,513 26 17 9 1,652 347 939 8,358 63,125
4 — — 3 — — — — — — — 7 14
avail
able4 — — 3 — — — — — — — 7 14
96 6 3 — 3 3 — — 3 — — 32 146
avail
able96 6 3 — 3 3 — — 3 — — 32 146
52 10 13 18 — 4 10 3 3 — — 92 205
avail
able52 10 13 18 — 4 10 3 3 — — 92 205
628 88 74 154 43 1,289 — 36 75 3 — 443 2,833
avail
able
628 88 74 154 43 1,289 — 36 75 3 — 443 2,833787 26 31 16 16 73 37 20 40 — — 192 1,238
avail
able
787 26 31 16 16 73 37 20 40 — — 192 1,238
Cleric, sales & service workers nfd 24 3 3 — — 3 3 — 3 — — 16 55
avail
able
Cleric, sales & service workers nfd 24 3 3 — — 3 3 — 3 — — 16 551,276 44 275 103 45 82 26 47 85 19 — 408 2,410
avail
able
1,276 44 275 103 45 82 26 47 85 19 — 408 2,410815 67 73 26 28 12 401 12 42 3 5 358 1,842
avail
able
815 67 73 26 28 12 401 12 42 3 5 358 1,8423,760 1,469 154 46 44 24 4 23 147 15 — 555 6,241
avail
able
3,760 1,469 154 46 44 24 4 23 147 15 — 555 6,241
avail
able
Labourers & related workers, nfd 313 171 9 3 5 3 — 3 21 — — 52 580avail
able
Labourers & related workers, nfd 313 171 9 3 5 3 — 3 21 — — 52 5806,807 3,238 821 147 200 35 38 18 280 53 46 1,159 12,842av
ailab
le6,807 3,238 821 147 200 35 38 18 280 53 46 1,159 12,842
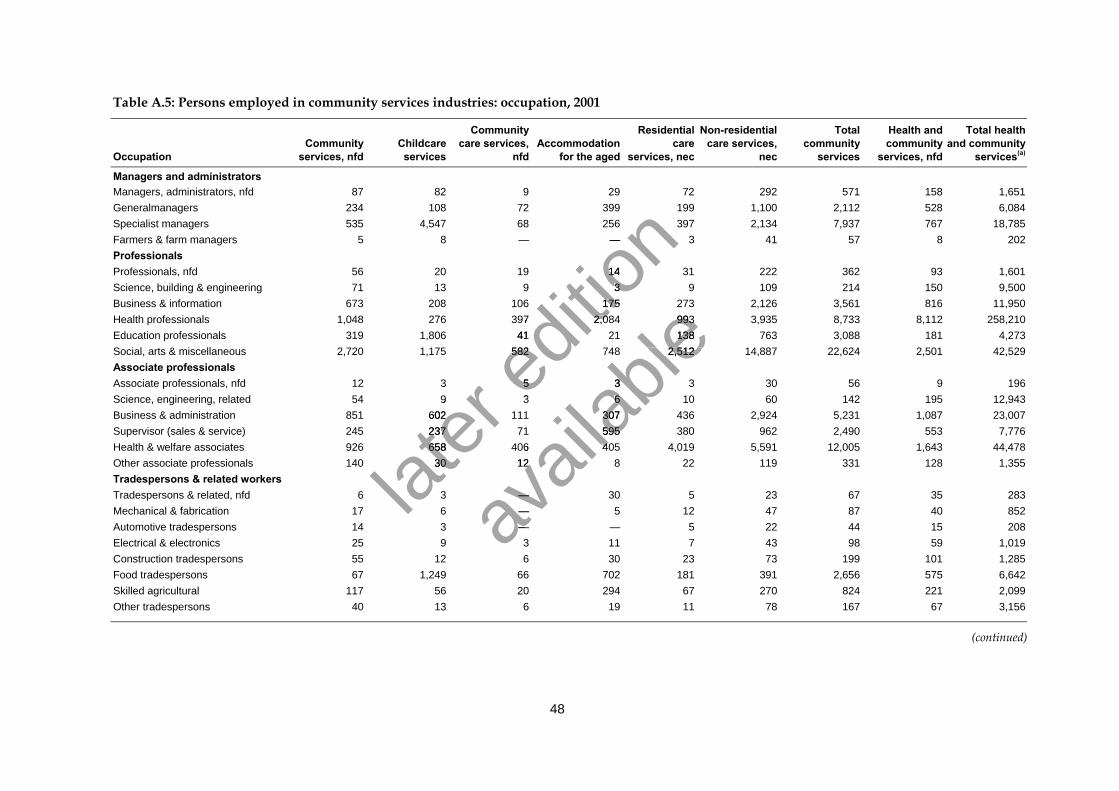
48
Table A.5: Persons employed in community services industries: occupation, 2001
OccupationCommunity
services, nfdChildcareservices
Communitycare services,
nfdAccommodation
for the aged
Residentialcare
services, nec
Non-residentialcare services,
nec
Totalcommunity
services
Health andcommunity
services, nfd
Total healthand community
services(a)
Managers and administratorsManagers, administrators, nfd 87 82 9 29 72 292 571 158 1,651Generalmanagers 234 108 72 399 199 1,100 2,112 528 6,084Specialist managers 535 4,547 68 256 397 2,134 7,937 767 18,785Farmers & farm managers 5 8 — — 3 41 57 8 202ProfessionalsProfessionals, nfd 56 20 19 14 31 222 362 93 1,601Science, building & engineering 71 13 9 3 9 109 214 150 9,500Business & information 673 208 106 175 273 2,126 3,561 816 11,950Health professionals 1,048 276 397 2,084 993 3,935 8,733 8,112 258,210Education professionals 319 1,806 41 21 138 763 3,088 181 4,273Social, arts & miscellaneous 2,720 1,175 582 748 2,512 14,887 22,624 2,501 42,529Associate professionalsAssociate professionals, nfd 12 3 5 3 3 30 56 9 196Science, engineering, related 54 9 3 6 10 60 142 195 12,943Business & administration 851 602 111 307 436 2,924 5,231 1,087 23,007Supervisor (sales & service) 245 237 71 595 380 962 2,490 553 7,776Health & welfare associates 926 658 406 405 4,019 5,591 12,005 1,643 44,478Other associate professionals 140 30 12 8 22 119 331 128 1,355Tradespersons & related workersTradespersons & related, nfd 6 3 — 30 5 23 67 35 283Mechanical & fabrication 17 6 — 5 12 47 87 40 852Automotive tradespersons 14 3 — — 5 22 44 15 208Electrical & electronics 25 9 3 11 7 43 98 59 1,019Construction tradespersons 55 12 6 30 23 73 199 101 1,285Food tradespersons 67 1,249 66 702 181 391 2,656 575 6,642Skilled agricultural 117 56 20 294 67 270 824 221 2,099Other tradespersons 40 13 6 19 11 78 167 67 3,156
(continued)
later
9
later
9602
later 602
237
later 237
658
later 658
30
later 30
editio
n 256
editio
n 256—
editio
n —
14
editio
n 143
editio
n
3175
editio
n
175397
editio
n 397 2,084
editio
n 2,084
41
editio
n 41
582editio
n 582
5editio
n 53ed
ition
3
avail
able
273
avail
able
273993
avail
able
993138
avail
able138
748 2,512 14,887 22,624
avail
able748 2,512 14,887 22,624
3
avail
able
36
avail
able
6307
avail
able
307595
avail
able
595406
avail
able
406 405 4,019
avail
able
405 4,01912
avail
able
12
—
avail
able
——av
ailab
le——av
ailab
le—
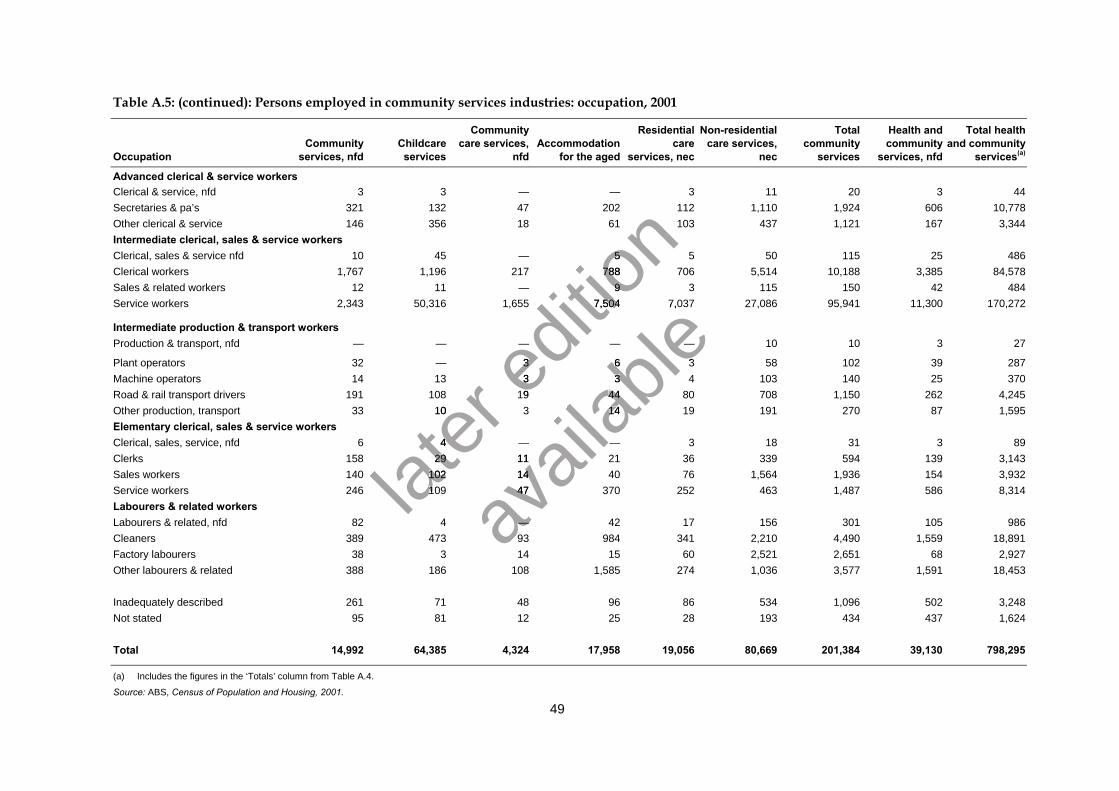
49
Table A.5: (continued): Persons employed in community services industries: occupation, 2001
OccupationCommunity
services, nfdChildcareservices
Communitycare services,
nfdAccommodation
for the aged
Residentialcare
services, nec
Non-residentialcare services,
nec
Totalcommunity
services
Health andcommunity
services, nfd
Total healthand community
services(a)
Advanced clerical & service workersClerical & service, nfd 3 3 — — 3 11 20 3 44Secretaries & pa’s 321 132 47 202 112 1,110 1,924 606 10,778Other clerical & service 146 356 18 61 103 437 1,121 167 3,344Intermediate clerical, sales & service workersClerical, sales & service nfd 10 45 — 5 5 50 115 25 486Clerical workers 1,767 1,196 217 788 706 5,514 10,188 3,385 84,578Sales & related workers 12 11 — 9 3 115 150 42 484Service workers 2,343 50,316 1,655 7,504 7,037 27,086 95,941 11,300 170,272
Intermediate production & transport workersProduction & transport, nfd — — — — — 10 10 3 27
Plant operators 32 — 3 6 3 58 102 39 287Machine operators 14 13 3 3 4 103 140 25 370Road & rail transport drivers 191 108 19 44 80 708 1,150 262 4,245Other production, transport 33 10 3 14 19 191 270 87 1,595Elementary clerical, sales & service workersClerical, sales, service, nfd 6 4 — — 3 18 31 3 89Clerks 158 29 11 21 36 339 594 139 3,143Sales workers 140 102 14 40 76 1,564 1,936 154 3,932Service workers 246 109 47 370 252 463 1,487 586 8,314Labourers & related workersLabourers & related, nfd 82 4 — 42 17 156 301 105 986Cleaners 389 473 93 984 341 2,210 4,490 1,559 18,891Factory labourers 38 3 14 15 60 2,521 2,651 68 2,927Other labourers & related 388 186 108 1,585 274 1,036 3,577 1,591 18,453
Inadequately described 261 71 48 96 86 534 1,096 502 3,248Not stated 95 81 12 25 28 193 434 437 1,624
Total 14,992 64,385 4,324 17,958 19,056 80,669 201,384 39,130 798,295
(a) Includes the figures in the ‘Totals’ column from Table A.4.
Source: ABS, Census of Population and Housing, 2001.
later 10
later 10
4
later 4
29
later 29
102later
102109later
109
editio
n 61
editio
n 61
5
editio
n 5788
editio
n 7889
editio
n
97,504 7,037 27,086 95,941 11,300 170,272
editio
n
7,504 7,037 27,086 95,941 11,300 170,272
—
editio
n —
3editio
n 33ed
ition
319ed
ition
19
avail
able
7,504 7,037 27,086 95,941 11,300 170,272
avail
able
7,504 7,037 27,086 95,941 11,300 170,272
—
avail
able—6
avail
able6 3
avail
able33
avail
able3
44
avail
able
4414
avail
able
14
11
avail
able
1114
avail
able
1447
avail
able
47
—avail
able
—93av
ailab
le93
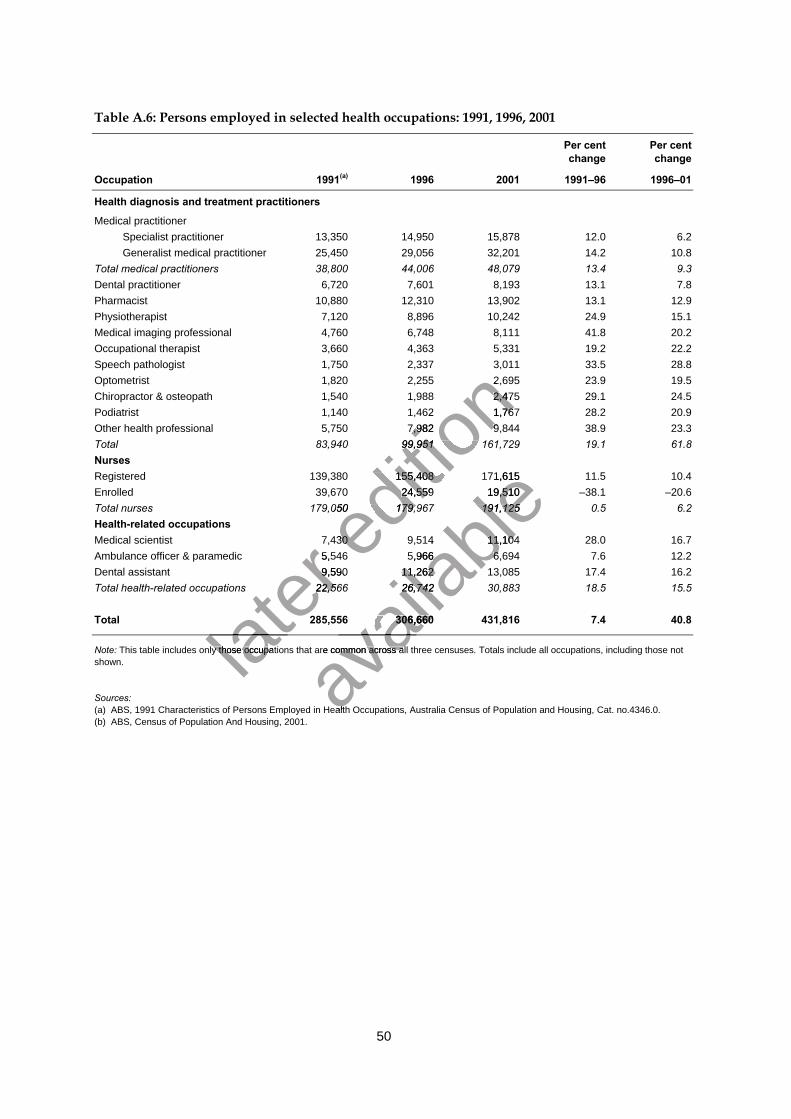
50
Table A.6: Persons employed in selected health occupations: 1991, 1996, 2001
Occupation 1991(a) 1996 2001
Per centchange
1991–96
Per centchange
1996–01
Health diagnosis and treatment practitioners
Medical practitionerSpecialist practitioner 13,350 14,950 15,878 12.0 6.2Generalist medical practitioner 25,450 29,056 32,201 14.2 10.8
Total medical practitioners 38,800 44,006 48,079 13.4 9.3Dental practitioner 6,720 7,601 8,193 13.1 7.8Pharmacist 10,880 12,310 13,902 13.1 12.9Physiotherapist 7,120 8,896 10,242 24.9 15.1Medical imaging professional 4,760 6,748 8,111 41.8 20.2Occupational therapist 3,660 4,363 5,331 19.2 22.2Speech pathologist 1,750 2,337 3,011 33.5 28.8Optometrist 1,820 2,255 2,695 23.9 19.5Chiropractor & osteopath 1,540 1,988 2,475 29.1 24.5Podiatrist 1,140 1,462 1,767 28.2 20.9Other health professional 5,750 7,982 9,844 38.9 23.3Total 83,940 99,951 161,729 19.1 61.8NursesRegistered 139,380 155,408 171,615 11.5 10.4Enrolled 39,670 24,559 19,510 –38.1 –20.6Total nurses 179,050 179,967 191,125 0.5 6.2Health-related occupationsMedical scientist 7,430 9,514 11,104 28.0 16.7Ambulance officer & paramedic 5,546 5,966 6,694 7.6 12.2Dental assistant 9,590 11,262 13,085 17.4 16.2Total health-related occupations 22,566 26,742 30,883 18.5 15.5
Total 285,556 306,660 431,816 7.4 40.8
Note: This table includes only those occupations that are common across all three censuses. Totals include all occupations, including those notshown.
Sources:(a) ABS, 1991 Characteristics of Persons Employed in Health Occupations, Australia Census of Population and Housing, Cat. no.4346.0.(b) ABS, Census of Population And Housing, 2001.
later
5,546
later
5,546
later 9,590
later 9,590
22,566
later 22,566
later
later
This table includes only those occupations later
This table includes only those occupations
editio
n 2,695
editio
n 2,6952,475
editio
n 2,4751,462
editio
n 1,462 1,767
editio
n 1,7677,982
editio
n 7,982 9,844
editio
n 9,84499,951 161,729
editio
n 99,951 161,729
139,380 155,408 171,615
editio
n 139,380 155,408 171,61539,670
editio
n 39,670 24,559
editio
n 24,559
179,050 179,967 191,125editio
n 179,050 179,967 191,125
7,430 editio
n
7,430
avail
able
139,380 155,408 171,615
avail
able
139,380 155,408 171,61519,510
avail
able19,510
179,050 179,967 191,125
avail
able179,050 179,967 191,125
9,514
avail
able9,514 11,104
avail
able11,104
avail
able
5,966
avail
able
5,966 6,694
avail
able
6,69411,262
avail
able
11,26226,742
avail
able
26,742
285,556 306,660 431,816
avail
able
285,556 306,660 431,816
avail
able
avail
able
that are common across all three censuses
avail
able
that are common across all three censuses
(a) ABS, 1991 Characteristics of Persons Employed in Health Occupations, Austravail
able
(a) ABS, 1991 Characteristics of Persons Employed in Health Occupations, Austr
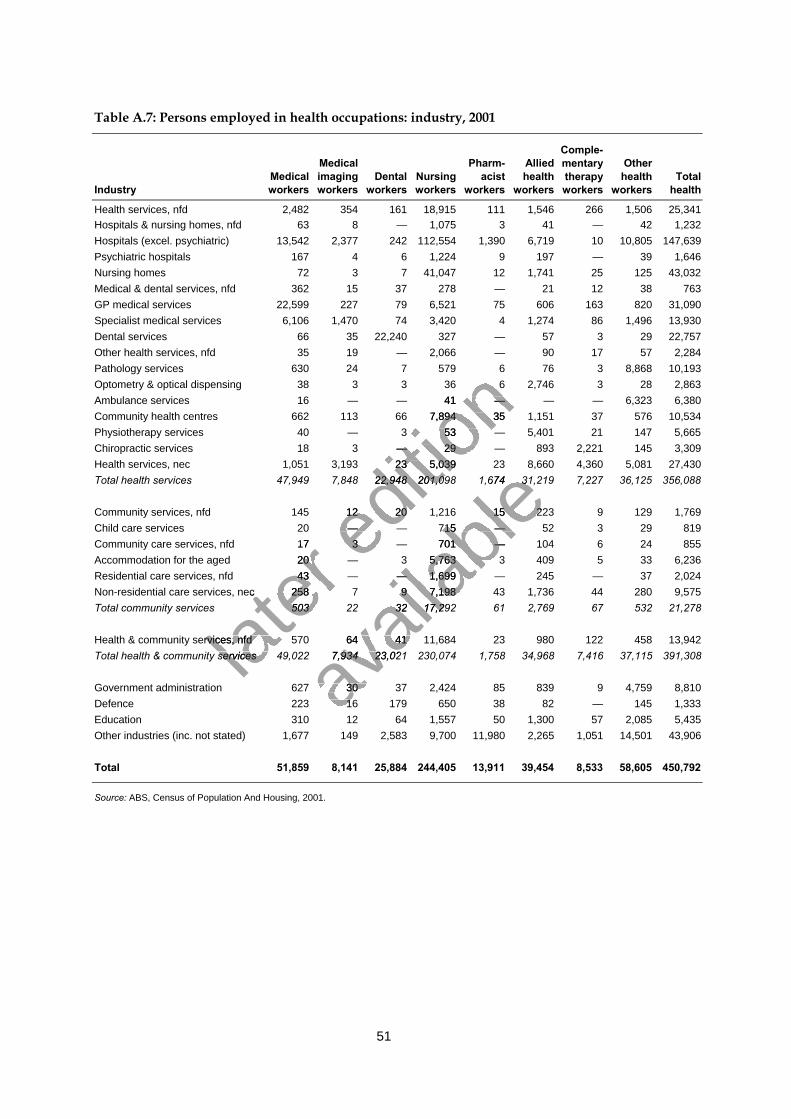
51
Table A.7: Persons employed in health occupations: industry, 2001
IndustryMedicalworkers
Medicalimagingworkers
Dentalworkers
Nursingworkers
Pharm-acist
workers
Alliedhealth
workers
Comple-mentarytherapyworkers
Otherhealth
workersTotal
health
Health services, nfd 2,482 354 161 18,915 111 1,546 266 1,506 25,341Hospitals & nursing homes, nfd 63 8 — 1,075 3 41 — 42 1,232Hospitals (excel. psychiatric) 13,542 2,377 242 112,554 1,390 6,719 10 10,805 147,639Psychiatric hospitals 167 4 6 1,224 9 197 — 39 1,646Nursing homes 72 3 7 41,047 12 1,741 25 125 43,032Medical & dental services, nfd 362 15 37 278 — 21 12 38 763GP medical services 22,599 227 79 6,521 75 606 163 820 31,090Specialist medical services 6,106 1,470 74 3,420 4 1,274 86 1,496 13,930Dental services 66 35 22,240 327 — 57 3 29 22,757Other health services, nfd 35 19 — 2,066 — 90 17 57 2,284Pathology services 630 24 7 579 6 76 3 8,868 10,193Optometry & optical dispensing 38 3 3 36 6 2,746 3 28 2,863Ambulance services 16 — — 41 — — — 6,323 6,380Community health centres 662 113 66 7,894 35 1,151 37 576 10,534Physiotherapy services 40 — 3 53 — 5,401 21 147 5,665Chiropractic services 18 3 — 29 — 893 2,221 145 3,309Health services, nec 1,051 3,193 23 5,039 23 8,660 4,360 5,081 27,430Total health services 47,949 7,848 22,948 201,098 1,674 31,219 7,227 36,125 356,088
Community services, nfd 145 12 20 1,216 15 223 9 129 1,769Child care services 20 — — 715 — 52 3 29 819Community care services, nfd 17 3 — 701 — 104 6 24 855Accommodation for the aged 20 — 3 5,763 3 409 5 33 6,236Residential care services, nfd 43 — — 1,699 — 245 — 37 2,024Non-residential care services, nec 258 7 9 7,198 43 1,736 44 280 9,575Total community services 503 22 32 17,292 61 2,769 67 532 21,278
Health & community services, nfd 570 64 41 11,684 23 980 122 458 13,942Total health & community services 49,022 7,934 23,021 230,074 1,758 34,968 7,416 37,115 391,308
Government administration 627 30 37 2,424 85 839 9 4,759 8,810Defence 223 16 179 650 38 82 — 145 1,333Education 310 12 64 1,557 50 1,300 57 2,085 5,435Other industries (inc. not stated) 1,677 149 2,583 9,700 11,980 2,265 1,051 14,501 43,906
Total 51,859 8,141 25,884 244,405 13,911 39,454 8,533 58,605 450,792
Source: ABS, Census of Population And Housing, 2001.
later 17 3 — 701 — 104 6 24 855
later 17 3 — 701 — 104 6 24 85520 — 3 5,763 3 409 5 33 6,236
later 20 — 3 5,763 3 409 5 33 6,23643 — — 1,699 — 245 — 37 2,024
later 43 — — 1,699 — 245 — 37 2,024
Non-residential care services, nec 258 7 9 7,198 43 1,736 44 280 9,575
later Non-residential care services, nec 258 7 9 7,198 43 1,736 44 280 9,575
503 22 32 17,292 61 2,769 67 532 21,278
later 503 22 32 17,292 61 2,769 67 532 21,278
Health & community services, nfd 570 64 41 11,684 23 980 122 458 13,942later
Health & community services, nfd 570 64 41 11,684 23 980 122 458 13,942later
Total health & community services 49,022 7,934 23,021 230,074 1,758 34,968 7,416 37,115 391,308later
Total health & community services 49,022 7,934 23,021 230,074 1,758 34,968 7,416 37,115 391,308
editio
n 630 24 7 579 6 76 3 8,868 10,193
editio
n 630 24 7 579 6 76 3 8,868 10,193
38 3 3 36 6 2,746 3 28 2,863
editio
n 38 3 3 36 6 2,746 3 28 2,86316 — — 41 — — — 6,323 6,380
editio
n 16 — — 41 — — — 6,323 6,380662 113 66 7,894 35 1,151 37 576 10,534
editio
n 662 113 66 7,894 35 1,151 37 576 10,53440 — 3 53 — 5,401 21 147 5,665
editio
n 40 — 3 53 — 5,401 21 147 5,66518 3 — 29 — 893 2,221 145 3,309
editio
n 18 3 — 29 — 893 2,221 145 3,309
1,051 3,193 23 5,039 23 8,660 4,360 5,081 27,430
editio
n 1,051 3,193 23 5,039 23 8,660 4,360 5,081 27,430
47,949 7,848 22,948 201,098 1,674 31,219 7,227 36,125 356,088
editio
n 47,949 7,848 22,948 201,098 1,674 31,219 7,227 36,125 356,088
145 12 20 1,216 15 223 9 129 1,769editio
n 145 12 20 1,216 15 223 9 129 1,76920 — — 715 — 52 3 29 819ed
ition
20 — — 715 — 52 3 29 81917 3 — 701 — 104 6 24 855ed
ition
17 3 — 701 — 104 6 24 85520 — 3 5,763 3 409 5 33 6,236ed
ition
20 — 3 5,763 3 409 5 33 6,236
avail
able
1,051 3,193 23 5,039 23 8,660 4,360 5,081 27,430
avail
able
1,051 3,193 23 5,039 23 8,660 4,360 5,081 27,43047,949 7,848 22,948 201,098 1,674 31,219 7,227 36,125 356,088
avail
able
47,949 7,848 22,948 201,098 1,674 31,219 7,227 36,125 356,088
145 12 20 1,216 15 223 9 129 1,769
avail
able145 12 20 1,216 15 223 9 129 1,769
20 — — 715 — 52 3 29 819
avail
able20 — — 715 — 52 3 29 819
17 3 — 701 — 104 6 24 855
avail
able17 3 — 701 — 104 6 24 855
20 — 3 5,763 3 409 5 33 6,236
avail
able
20 — 3 5,763 3 409 5 33 6,23643 — — 1,699 — 245 — 37 2,024
avail
able
43 — — 1,699 — 245 — 37 2,024Non-residential care services, nec 258 7 9 7,198 43 1,736 44 280 9,575
avail
able
Non-residential care services, nec 258 7 9 7,198 43 1,736 44 280 9,575503 22 32 17,292 61 2,769 67 532 21,278
avail
able
503 22 32 17,292 61 2,769 67 532 21,278
Health & community services, nfd 570 64 41 11,684 23 980 122 458 13,942
avail
able
Health & community services, nfd 570 64 41 11,684 23 980 122 458 13,942
avail
able
Total health & community services 49,022 7,934 23,021 230,074 1,758 34,968 7,416 37,115 391,308
avail
able
Total health & community services 49,022 7,934 23,021 230,074 1,758 34,968 7,416 37,115 391,308
627 30 37 2,424 85 839 9 4,759 8,810avail
able
627 30 37 2,424 85 839 9 4,759 8,810avail
able
223 16 179 650 38 82 — 145 1,333avail
able
223 16 179 650 38 82 — 145 1,333
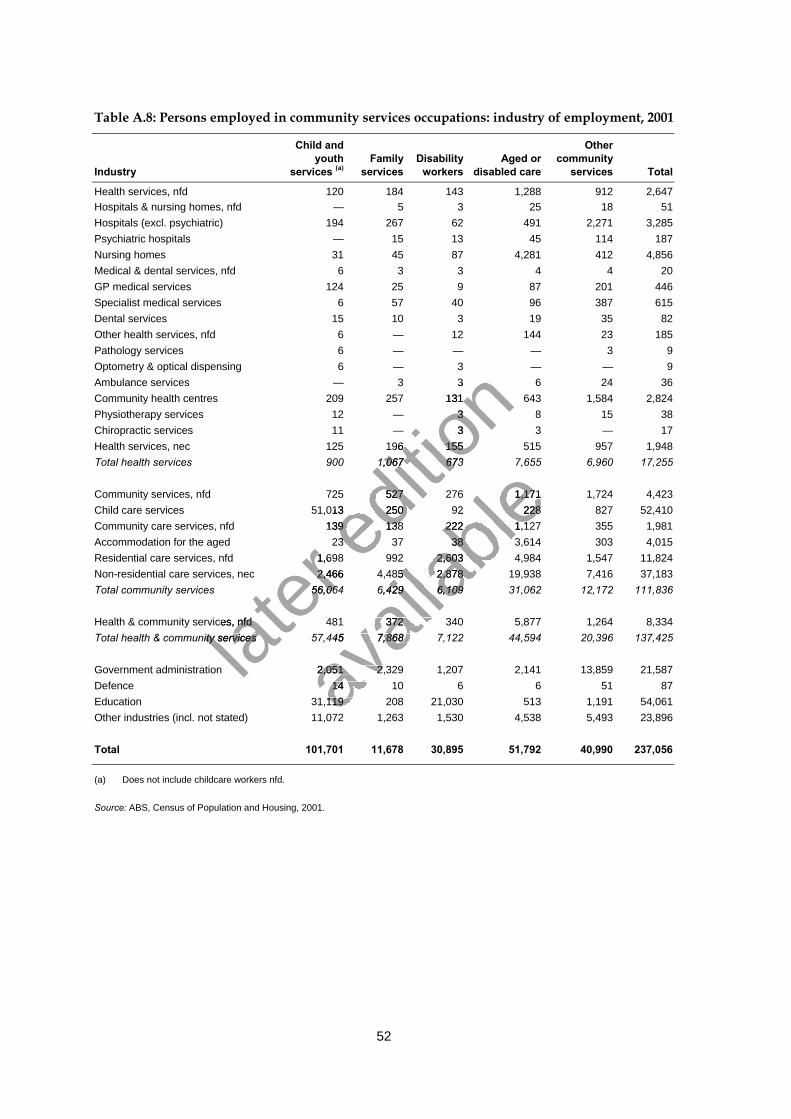
52
Table A.8: Persons employed in community services occupations: industry of employment, 2001
Industry
Child andyouth
services (a)Family
servicesDisability
workersAged or
disabled care
Othercommunity
services Total
Health services, nfd 120 184 143 1,288 912 2,647Hospitals & nursing homes, nfd — 5 3 25 18 51Hospitals (excl. psychiatric) 194 267 62 491 2,271 3,285Psychiatric hospitals — 15 13 45 114 187Nursing homes 31 45 87 4,281 412 4,856Medical & dental services, nfd 6 3 3 4 4 20GP medical services 124 25 9 87 201 446Specialist medical services 6 57 40 96 387 615Dental services 15 10 3 19 35 82Other health services, nfd 6 — 12 144 23 185Pathology services 6 — — — 3 9Optometry & optical dispensing 6 — 3 — — 9Ambulance services — 3 3 6 24 36Community health centres 209 257 131 643 1,584 2,824Physiotherapy services 12 — 3 8 15 38Chiropractic services 11 — 3 3 — 17Health services, nec 125 196 155 515 957 1,948Total health services 900 1,067 673 7,655 6,960 17,255
Community services, nfd 725 527 276 1,171 1,724 4,423Child care services 51,013 250 92 228 827 52,410Community care services, nfd 139 138 222 1,127 355 1,981Accommodation for the aged 23 37 38 3,614 303 4,015Residential care services, nfd 1,698 992 2,603 4,984 1,547 11,824Non-residential care services, nec 2,466 4,485 2,878 19,938 7,416 37,183Total community services 56,064 6,429 6,109 31,062 12,172 111,836
Health & community services, nfd 481 372 340 5,877 1,264 8,334Total health & community services 57,445 7,868 7,122 44,594 20,396 137,425
Government administration 2,051 2,329 1,207 2,141 13,859 21,587Defence 14 10 6 6 51 87Education 31,119 208 21,030 513 1,191 54,061Other industries (incl. not stated) 11,072 1,263 1,530 4,538 5,493 23,896
Total 101,701 11,678 30,895 51,792 40,990 237,056
(a) Does not include childcare workers nfd.
Source: ABS, Census of Population and Housing, 2001.
later
1,698 992 2,603 4,984 1,547 11,824
later
1,698 992 2,603 4,984 1,547 11,8242,466 4,485 2,878 19,938 7,416 37,183
later 2,466 4,485 2,878 19,938 7,416 37,183
56,064 6,429 6,109 31,062 12,172 111,836
later 56,064 6,429 6,109 31,062 12,172 111,836
Health & community services, nfd
later Health & community services, nfd
Total health & community serviceslater
Total health & community services
editio
n 3
editio
n 3209 257 131
editio
n 209 257 1313
editio
n 33
editio
n 3125 196 155
editio
n 125 196 155900 1,067 673 7,655 6,960 17,255
editio
n 900 1,067 673 7,655 6,960 17,255
725 527 276 1,171 1,724 4,423
editio
n 725 527 276 1,171 1,724 4,423
51,013 250 92editio
n 51,013 250 92
139 138 222 1,127editio
n 139 138 222 1,127
23 37 38 3,614editio
n
23 37 38 3,6141,698 992 2,603 4,984 1,547 11,824ed
ition
1,698 992 2,603 4,984 1,547 11,824
avail
able
900 1,067 673 7,655 6,960 17,255
avail
able
900 1,067 673 7,655 6,960 17,255
725 527 276 1,171 1,724 4,423
avail
able725 527 276 1,171 1,724 4,423
51,013 250 92
avail
able51,013 250 92 228
avail
able228
139 138 222 1,127
avail
able139 138 222 1,127
23 37 38 3,614
avail
able23 37 38 3,614
1,698 992 2,603 4,984 1,547 11,824
avail
able
1,698 992 2,603 4,984 1,547 11,8242,466 4,485 2,878 19,938 7,416 37,183
avail
able
2,466 4,485 2,878 19,938 7,416 37,18356,064 6,429 6,109 31,062 12,172 111,836
avail
able
56,064 6,429 6,109 31,062 12,172 111,836
481 372 340 5,877 1,264 8,334
avail
able
481 372 340 5,877 1,264 8,334
avail
able
57,445 7,868 7,122 44,594 20,396 137,425
avail
able
57,445 7,868 7,122 44,594 20,396 137,425
2,051 2,329 1,207 2,141 13,859 21,587avail
able
2,051 2,329 1,207 2,141 13,859 21,58714 10 6 6 51 87av
ailab
le
14 10 6 6 51 87avail
able
31,119 208 21,030avail
able
31,119 208 21,030
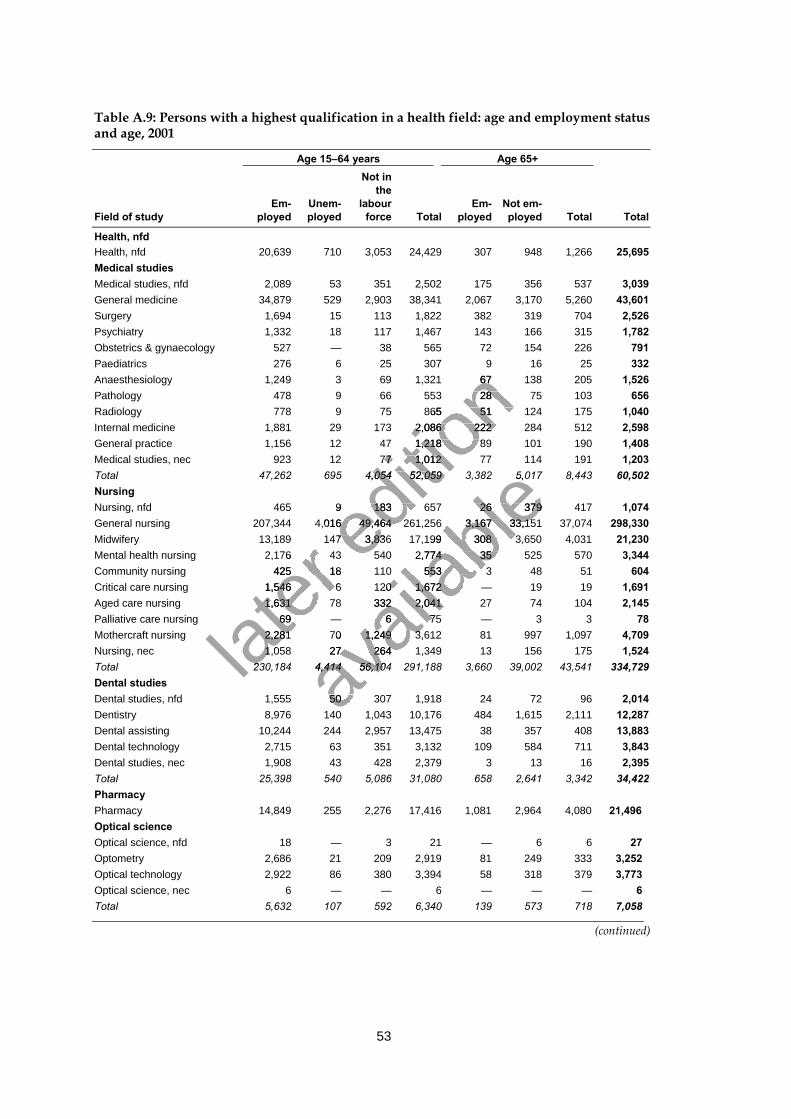
53
Table A.9: Persons with a highest qualification in a health field: age and employment statusand age, 2001
Age 15–64 years Age 65+
Field of studyEm-
ployedUnem-ployed
Not inthe
labourforce Total
Em-ployed
Not em-ployed Total Total
Health, nfdHealth, nfd 20,639 710 3,053 24,429 307 948 1,266 25,695Medical studiesMedical studies, nfd 2,089 53 351 2,502 175 356 537 3,039General medicine 34,879 529 2,903 38,341 2,067 3,170 5,260 43,601Surgery 1,694 15 113 1,822 382 319 704 2,526Psychiatry 1,332 18 117 1,467 143 166 315 1,782Obstetrics & gynaecology 527 — 38 565 72 154 226 791Paediatrics 276 6 25 307 9 16 25 332Anaesthesiology 1,249 3 69 1,321 67 138 205 1,526Pathology 478 9 66 553 28 75 103 656Radiology 778 9 75 865 51 124 175 1,040Internal medicine 1,881 29 173 2,086 222 284 512 2,598General practice 1,156 12 47 1,218 89 101 190 1,408Medical studies, nec 923 12 77 1,012 77 114 191 1,203Total 47,262 695 4,054 52,059 3,382 5,017 8,443 60,502NursingNursing, nfd 465 9 183 657 26 379 417 1,074General nursing 207,344 4,016 49,464 261,256 3,167 33,151 37,074 298,330Midwifery 13,189 147 3,836 17,199 308 3,650 4,031 21,230Mental health nursing 2,176 43 540 2,774 35 525 570 3,344Community nursing 425 18 110 553 3 48 51 604Critical care nursing 1,546 6 120 1,672 — 19 19 1,691Aged care nursing 1,631 78 332 2,041 27 74 104 2,145Palliative care nursing 69 — 6 75 — 3 3 78Mothercraft nursing 2,281 70 1,249 3,612 81 997 1,097 4,709Nursing, nec 1,058 27 264 1,349 13 156 175 1,524Total 230,184 4,414 56,104 291,188 3,660 39,002 43,541 334,729Dental studiesDental studies, nfd 1,555 50 307 1,918 24 72 96 2,014Dentistry 8,976 140 1,043 10,176 484 1,615 2,111 12,287Dental assisting 10,244 244 2,957 13,475 38 357 408 13,883Dental technology 2,715 63 351 3,132 109 584 711 3,843Dental studies, nec 1,908 43 428 2,379 3 13 16 2,395Total 25,398 540 5,086 31,080 658 2,641 3,342 34,422PharmacyPharmacy 14,849 255 2,276 17,416 1,081 2,964 4,080 21,496Optical scienceOptical science, nfd 18 — 3 21 — 6 6 27Optometry 2,686 21 209 2,919 81 249 333 3,252Optical technology 2,922 86 380 3,394 58 318 379 3,773Optical science, nec 6 — — 6 — — — 6Total 5,632 107 592 6,340 139 573 718 7,058
(continued)
later
13,189 147 3,836 17,199 308 3,650 4,031
later
13,189 147 3,836 17,199 308 3,650 4,0312,176 43 540 2,774 35 525 570
later
2,176 43 540 2,774 35 525 570425 18 110 553 3 48 51
later 425 18 110 553 3 48 51
1,546 6 120 1,672 — 19 19
later 1,546 6 120 1,672 — 19 19
1,631 78 332 2,041 27 74 104
later 1,631 78 332 2,041 27 74 104
69 — 6 75 — 3 3
later 69 — 6 75 — 3 3
2,281 70 1,249 3,612 81 997 1,097later
2,281 70 1,249 3,612 81 997 1,0971,058 27 264 1,349 13 156 175later
1,058 27 264 1,349 13 156 175230,184 4,414 56,104 291,188 3,660 39,002 43,541lat
er 230,184 4,414 56,104 291,188 3,660 39,002 43,541
editio
n 276 6 25 307 9 16 25
editio
n 276 6 25 307 9 16 25
1,249 3 69 1,321 67 138 205
editio
n 1,249 3 69 1,321 67 138 205478 9 66 553 28 75 103
editio
n 478 9 66 553 28 75 103778 9 75 865 51 124 175
editio
n 778 9 75 865 51 124 1751,881 29 173 2,086 222 284 512
editio
n 1,881 29 173 2,086 222 284 5121,156 12 47 1,218 89 101 190
editio
n 1,156 12 47 1,218 89 101 190
923 12 77 1,012 77 114 191
editio
n 923 12 77 1,012 77 114 191
47,262 695 4,054 52,059 3,382 5,017 8,443
editio
n 47,262 695 4,054 52,059 3,382 5,017 8,443
465 9 183 657 26 379 417
editio
n 465 9 183 657 26 379 417
207,344 4,016 49,464 261,256 3,167 33,151 37,074editio
n 207,344 4,016 49,464 261,256 3,167 33,151 37,07413,189 147 3,836 17,199 308 3,650 4,031ed
ition
13,189 147 3,836 17,199 308 3,650 4,0312,176 43 540 2,774 35 525 570ed
ition
2,176 43 540 2,774 35 525 570
avail
able
47,262 695 4,054 52,059 3,382 5,017 8,443
avail
able
47,262 695 4,054 52,059 3,382 5,017 8,443
465 9 183 657 26 379 417
avail
able465 9 183 657 26 379 417
207,344 4,016 49,464 261,256 3,167 33,151 37,074
avail
able207,344 4,016 49,464 261,256 3,167 33,151 37,074
13,189 147 3,836 17,199 308 3,650 4,031
avail
able13,189 147 3,836 17,199 308 3,650 4,031
2,176 43 540 2,774 35 525 570
avail
able
2,176 43 540 2,774 35 525 570425 18 110 553 3 48 51
avail
able
425 18 110 553 3 48 511,546 6 120 1,672 — 19 19
avail
able
1,546 6 120 1,672 — 19 191,631 78 332 2,041 27 74 104
avail
able
1,631 78 332 2,041 27 74 10469 — 6 75 — 3 3
avail
able
69 — 6 75 — 3 3
avail
able
2,281 70 1,249 3,612 81 997 1,097
avail
able
2,281 70 1,249 3,612 81 997 1,0971,058 27 264 1,349 13 156 175
avail
able
1,058 27 264 1,349 13 156 175230,184 4,414 56,104 291,188 3,660 39,002 43,541av
ailab
le
230,184 4,414 56,104 291,188 3,660 39,002 43,541
1,555 50 307 1,918 24 72 96avail
able
1,555 50 307 1,918 24 72 968,976 140 1,043 10,176 484 1,615 2,111av
ailab
le
8,976 140 1,043 10,176 484 1,615 2,111
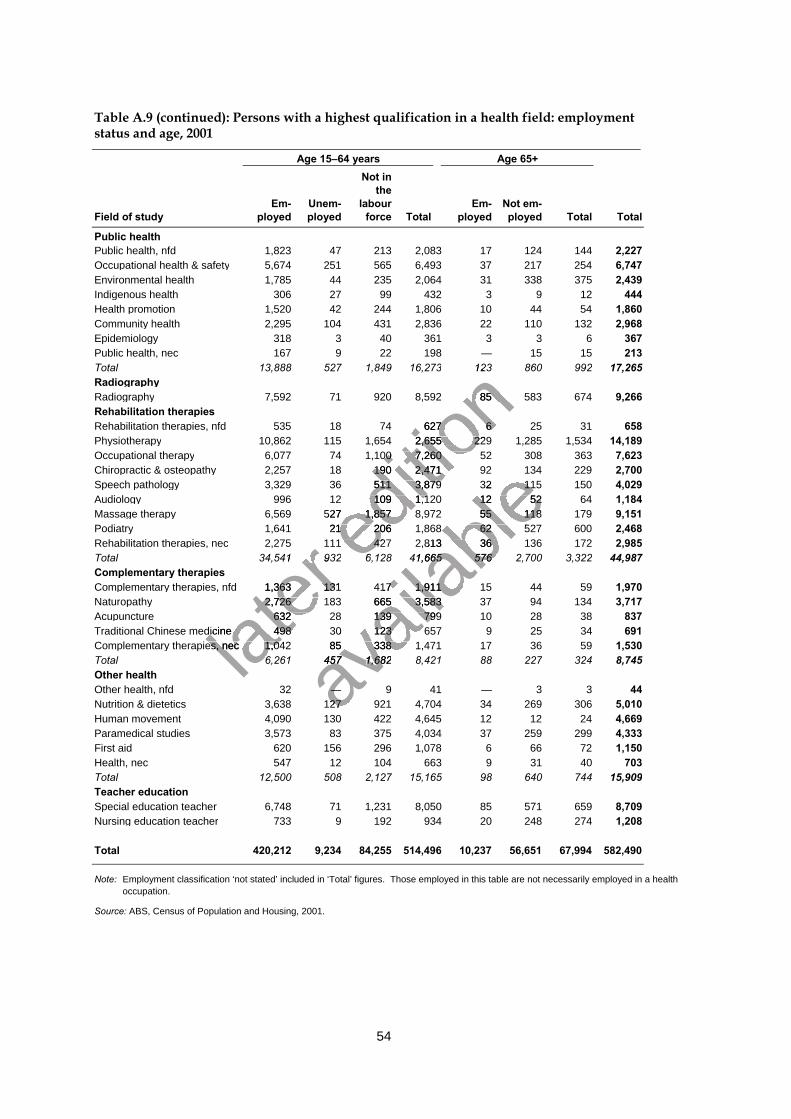
54
Table A.9 (continued): Persons with a highest qualification in a health field: employmentstatus and age, 2001
Age 15–64 years Age 65+
Field of studyEm-
ployedUnem-ployed
Not inthe
labourforce Total
Em-ployed
Not em-ployed Total Total
Public healthPublic health, nfd 1,823 47 213 2,083 17 124 144 2,227Occupational health & safety 5,674 251 565 6,493 37 217 254 6,747Environmental health 1,785 44 235 2,064 31 338 375 2,439Indigenous health 306 27 99 432 3 9 12 444Health promotion 1,520 42 244 1,806 10 44 54 1,860Community health 2,295 104 431 2,836 22 110 132 2,968Epidemiology 318 3 40 361 3 3 6 367Public health, nec 167 9 22 198 — 15 15 213Total 13,888 527 1,849 16,273 123 860 992 17,265RadiographyRadiography 7,592 71 920 8,592 85 583 674 9,266Rehabilitation therapiesRehabilitation therapies, nfd 535 18 74 627 6 25 31 658Physiotherapy 10,862 115 1,654 2,655 229 1,285 1,534 14,189Occupational therapy 6,077 74 1,100 7,260 52 308 363 7,623Chiropractic & osteopathy 2,257 18 190 2,471 92 134 229 2,700Speech pathology 3,329 36 511 3,879 32 115 150 4,029Audiology 996 12 109 1,120 12 52 64 1,184Massage therapy 6,569 527 1,857 8,972 55 118 179 9,151Podiatry 1,641 21 206 1,868 62 527 600 2,468Rehabilitation therapies, nec 2,275 111 427 2,813 36 136 172 2,985Total 34,541 932 6,128 41,665 576 2,700 3,322 44,987Complementary therapiesComplementary therapies, nfd 1,363 131 417 1,911 15 44 59 1,970Naturopathy 2,726 183 665 3,583 37 94 134 3,717Acupuncture 632 28 139 799 10 28 38 837Traditional Chinese medicine 498 30 123 657 9 25 34 691Complementary therapies, nec 1,042 85 338 1,471 17 36 59 1,530Total 6,261 457 1,682 8,421 88 227 324 8,745Other healthOther health, nfd 32 — 9 41 — 3 3 44Nutrition & dietetics 3,638 127 921 4,704 34 269 306 5,010Human movement 4,090 130 422 4,645 12 12 24 4,669Paramedical studies 3,573 83 375 4,034 37 259 299 4,333First aid 620 156 296 1,078 6 66 72 1,150Health, nec 547 12 104 663 9 31 40 703Total 12,500 508 2,127 15,165 98 640 744 15,909Teacher educationSpecial education teacher 6,748 71 1,231 8,050 85 571 659 8,709Nursing education teacher 733 9 192 934 20 248 274 1,208
Total 420,212 9,234 84,255 514,496 10,237 56,651 67,994 582,490
Note: Employment classification ‘not stated’ included in ‘Total’ figures. Those employed in this table are not necessarily employed in a healthoccupation.
Source: ABS, Census of Population and Housing, 2001.
later
ies, nec 2,275 111 427 2,813 36 136 172
later
ies, nec 2,275 111 427 2,813 36 136 17234,541 93
later
34,541 93
later ies, nfd 1,363 131 417 1,911 15 44 59
later ies, nfd 1,363 131 417 1,911 15 44 59
2,726 183 665 3,583 37 94 134
later 2,726 183 665 3,583 37 94 134
632 28 139 799 10 28 38
later 632 28 139 799 10 28 38
Traditional Chinese medicine 498 30 123 657 9 25 34later
Traditional Chinese medicine 498 30 123 657 9 25 34ies, nec 1,042 85 338 1,471 17 36 59lat
er ies, nec 1,042 85 338 1,471 17 36 59
6,261 45later
6,261 45
editio
n 12
editio
n 12
7,592 71 920 8,592 85 583 674
editio
n 7,592 71 920 8,592 85 583 674
ies, nfd 535 18 74 627 6 25 31
editio
n ies, nfd 535 18 74 627 6 25 3110,862 115 1,654 2,655 229 1,285 1,534
editio
n 10,862 115 1,654 2,655 229 1,285 1,5346,077 74 1,100 7,260 52 308 363
editio
n 6,077 74 1,100 7,260 52 308 3632,257 18 190 2,471 92 134 229
editio
n 2,257 18 190 2,471 92 134 2293,329 36 511 3,879 32 115 150
editio
n 3,329 36 511 3,879 32 115 150
996 12 109 1,120 12 52 64
editio
n 996 12 109 1,120 12 52 64
6,569 527 1,857 8,972 55 118 179editio
n 6,569 527 1,857 8,972 55 118 1791,641 21 206 1,868 62 527 600ed
ition
1,641 21 206 1,868 62 527 600ies, nec 2,275 111 427 2,813 36 136 172ed
ition
ies, nec 2,275 111 427 2,813 36 136 1726,128 41,66ed
ition
6,128 41,66
avail
able
2,257 18 190 2,471 92 134 229
avail
able
2,257 18 190 2,471 92 134 2293,329 36 511 3,879 32 115 150
avail
able
3,329 36 511 3,879 32 115 150996 12 109 1,120 12 52 64
avail
able996 12 109 1,120 12 52 64
6,569 527 1,857 8,972 55 118 179
avail
able6,569 527 1,857 8,972 55 118 179
1,641 21 206 1,868 62 527 600
avail
able1,641 21 206 1,868 62 527 600
ies, nec 2,275 111 427 2,813 36 136 172
avail
ableies, nec 2,275 111 427 2,813 36 136 172
6,128 41,66
avail
able
6,128 41,665
avail
able
5
avail
able
576 2,700 3,32
avail
able
576 2,700 3,32
ies, nfd 1,363 131 417 1,911 15 44 59
avail
able
ies, nfd 1,363 131 417 1,911 15 44 592,726 183 665 3,583 37 94 134
avail
able
2,726 183 665 3,583 37 94 134632 28 139 799 10 28 38
avail
able
632 28 139 799 10 28 38Traditional Chinese medicine 498 30 123 657 9 25 34
avail
able
Traditional Chinese medicine 498 30 123 657 9 25 34ies, nec 1,042 85 338 1,471 17 36 59
avail
able
ies, nec 1,042 85 338 1,471 17 36 596,261 45av
ailab
le
6,261 457avail
able
7 1,68avail
able
1,682avail
able
2
—avail
able
—avail
able
Nutrition & dietetics 3,638 127 921 4,704 34 269 306avail
able
Nutrition & dietetics 3,638 127 921 4,704 34 269 306
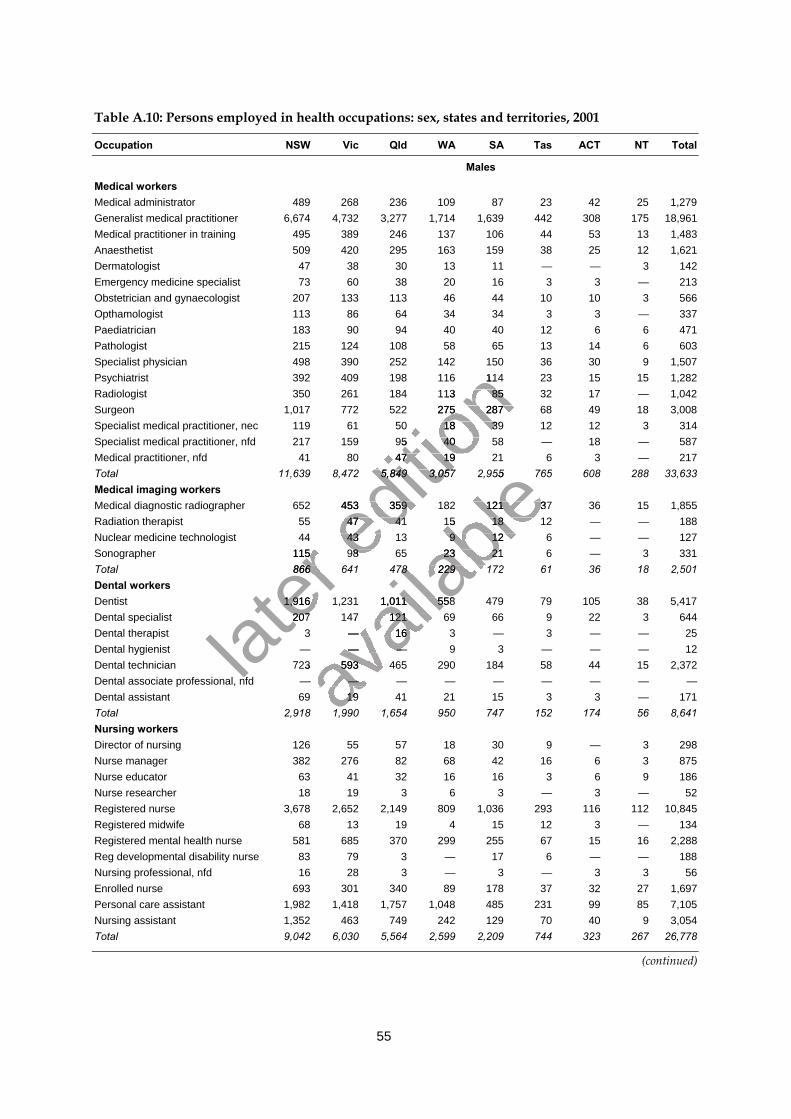
55
Table A.10: Persons employed in health occupations: sex, states and territories, 2001
Occupation NSW Vic Qld WA SA Tas ACT NT Total
Males
Medical workersMedical administrator 489 268 236 109 87 23 42 25 1,279Generalist medical practitioner 6,674 4,732 3,277 1,714 1,639 442 308 175 18,961Medical practitioner in training 495 389 246 137 106 44 53 13 1,483Anaesthetist 509 420 295 163 159 38 25 12 1,621Dermatologist 47 38 30 13 11 — — 3 142Emergency medicine specialist 73 60 38 20 16 3 3 — 213Obstetrician and gynaecologist 207 133 113 46 44 10 10 3 566Opthamologist 113 86 64 34 34 3 3 — 337Paediatrician 183 90 94 40 40 12 6 6 471Pathologist 215 124 108 58 65 13 14 6 603Specialist physician 498 390 252 142 150 36 30 9 1,507Psychiatrist 392 409 198 116 114 23 15 15 1,282Radiologist 350 261 184 113 85 32 17 — 1,042Surgeon 1,017 772 522 275 287 68 49 18 3,008Specialist medical practitioner, nec 119 61 50 18 39 12 12 3 314Specialist medical practitioner, nfd 217 159 95 40 58 — 18 — 587Medical practitioner, nfd 41 80 47 19 21 6 3 — 217Total 11,639 8,472 5,849 3,057 2,955 765 608 288 33,633Medical imaging workersMedical diagnostic radiographer 652 453 359 182 121 37 36 15 1,855Radiation therapist 55 47 41 15 18 12 — — 188Nuclear medicine technologist 44 43 13 9 12 6 — — 127Sonographer 115 98 65 23 21 6 — 3 331Total 866 641 478 229 172 61 36 18 2,501Dental workersDentist 1,916 1,231 1,011 558 479 79 105 38 5,417Dental specialist 207 147 121 69 66 9 22 3 644Dental therapist 3 — 16 3 — 3 — — 25Dental hygienist — — — 9 3 — — — 12Dental technician 723 593 465 290 184 58 44 15 2,372Dental associate professional, nfd — — — — — — — — —Dental assistant 69 19 41 21 15 3 3 — 171Total 2,918 1,990 1,654 950 747 152 174 56 8,641Nursing workersDirector of nursing 126 55 57 18 30 9 — 3 298Nurse manager 382 276 82 68 42 16 6 3 875Nurse educator 63 41 32 16 16 3 6 9 186Nurse researcher 18 19 3 6 3 — 3 — 52Registered nurse 3,678 2,652 2,149 809 1,036 293 116 112 10,845Registered midwife 68 13 19 4 15 12 3 — 134Registered mental health nurse 581 685 370 299 255 67 15 16 2,288Reg developmental disability nurse 83 79 3 — 17 6 — — 188Nursing professional, nfd 16 28 3 — 3 — 3 3 56Enrolled nurse 693 301 340 89 178 37 32 27 1,697Personal care assistant 1,982 1,418 1,757 1,048 485 231 99 85 7,105Nursing assistant 1,352 463 749 242 129 70 40 9 3,054Total 9,042 6,030 5,564 2,599 2,209 744 323 267 26,778
(continued)
later 44 43 13 9 12 6 — — 127
later 44 43 13 9 12 6 — — 127
115 98 65 23 21 6 — 3 331
later
115 98 65 23 21 6 — 3 331866 641 478 229 172 61 36 18 2,501
later
866 641 478 229 172 61 36 18 2,501
1,916 1,231 1,011 558 479 79 105 38 5,417
later 1,916 1,231 1,011 558 479 79 105 38 5,417
207 147 121 69 66 9 22 3 644
later 207 147 121 69 66 9 22 3 644
Dental associate professional, nfd — — —later
Dental associate professional, nfd — — —
editio
n 498 390 252 142 150 36 30 9 1,507
editio
n 498 390 252 142 150 36 30 9 1,507392 409 198 116 114 23 15 15 1,282
editio
n 392 409 198 116 114 23 15 15 1,282350 261 184 113 85 32 17 — 1,042
editio
n 350 261 184 113 85 32 17 — 1,0421,017 772 522 275 287 68 49 18 3,008
editio
n 1,017 772 522 275 287 68 49 18 3,008Specialist medical practitioner, nec 119 61 50 18 39 12 12 3 314
editio
n Specialist medical practitioner, nec 119 61 50 18 39 12 12 3 314Specialist medical practitioner, nfd 217 159 95 40 58 — 18 — 587
editio
n Specialist medical practitioner, nfd 217 159 95 40 58 — 18 — 587
41 80 47 19 21 6 3 — 217
editio
n 41 80 47 19 21 6 3 — 217
11,639 8,472 5,849 3,057 2,955 765 608 288 33,633
editio
n 11,639 8,472 5,849 3,057 2,955 765 608 288 33,633
Medical diagnostic radiographer 652 453 359 182 121 37 36 15 1,855
editio
n Medical diagnostic radiographer 652 453 359 182 121 37 36 15 1,855
55 47 41 15 18 12 — — 188editio
n 55 47 41 15 18 12 — — 18844 43 13 9 12 6 — — 127ed
ition
44 43 13 9 12 6 — — 127115 98 65 23 21 6 — 3 331ed
ition
115 98 65 23 21 6 — 3 331
avail
able
11,639 8,472 5,849 3,057 2,955 765 608 288 33,633
avail
able
11,639 8,472 5,849 3,057 2,955 765 608 288 33,633
Medical diagnostic radiographer 652 453 359 182 121 37 36 15 1,855
avail
ableMedical diagnostic radiographer 652 453 359 182 121 37 36 15 1,855
55 47 41 15 18 12 — — 188
avail
able55 47 41 15 18 12 — — 188
44 43 13 9 12 6 — — 127
avail
able44 43 13 9 12 6 — — 127
115 98 65 23 21 6 — 3 331
avail
able
115 98 65 23 21 6 — 3 331866 641 478 229 172 61 36 18 2,501
avail
able
866 641 478 229 172 61 36 18 2,501
1,916 1,231 1,011 558 479 79 105 38 5,417
avail
able
1,916 1,231 1,011 558 479 79 105 38 5,417207 147 121 69 66 9 22 3 644
avail
able
207 147 121 69 66 9 22 3 6443 — 16 3 — 3 — — 25
avail
able
3 — 16 3 — 3 — — 25
avail
able
— — — 9 3 — — — 12
avail
able
— — — 9 3 — — — 12723 593 465 290 184 58 44 15 2,372av
ailab
le
723 593 465 290 184 58 44 15 2,372Dental associate professional, nfd — — —av
ailab
le
Dental associate professional, nfd — — —69 19 41 21 15 3 3 — 171av
ailab
le
69 19 41 21 15 3 3 — 1712,918 1,990 1,654 950 747 152 174 56 8,641av
ailab
le
2,918 1,990 1,654 950 747 152 174 56 8,641
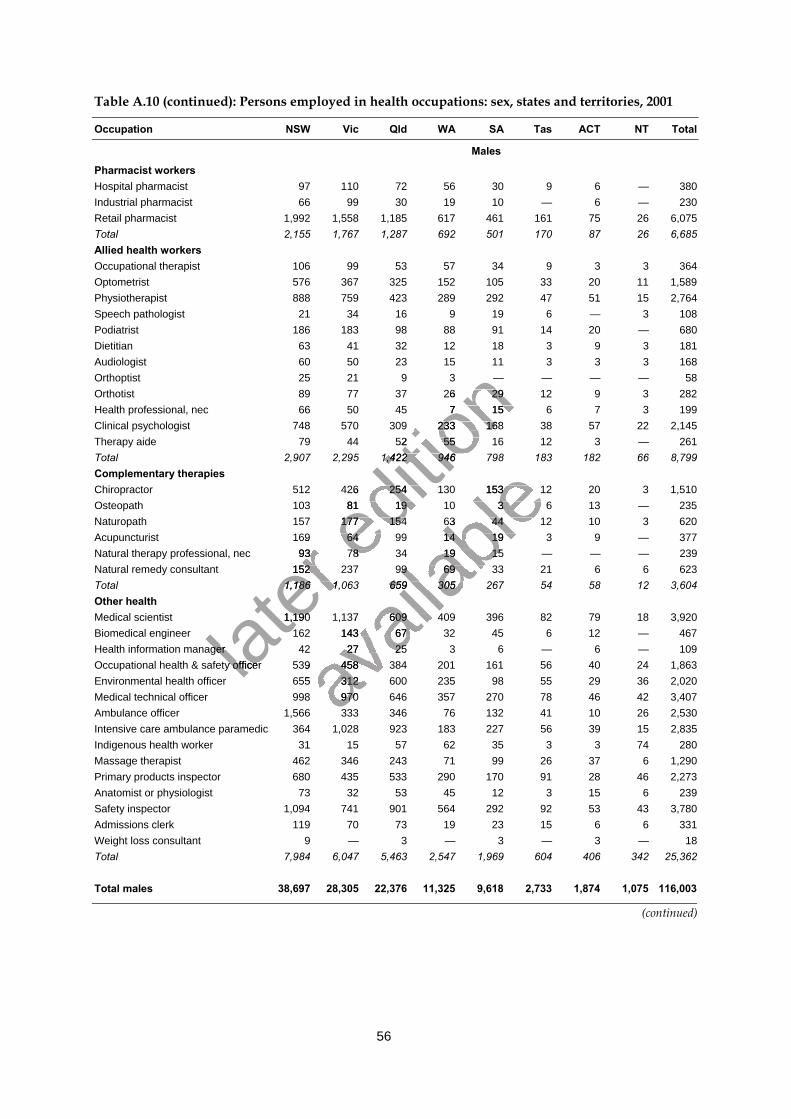
56
Table A.10 (continued): Persons employed in health occupations: sex, states and territories, 2001
Occupation NSW Vic Qld WA SA Tas ACT NT Total
Males
Pharmacist workersHospital pharmacist 97 110 72 56 30 9 6 — 380Industrial pharmacist 66 99 30 19 10 — 6 — 230Retail pharmacist 1,992 1,558 1,185 617 461 161 75 26 6,075Total 2,155 1,767 1,287 692 501 170 87 26 6,685Allied health workersOccupational therapist 106 99 53 57 34 9 3 3 364Optometrist 576 367 325 152 105 33 20 11 1,589Physiotherapist 888 759 423 289 292 47 51 15 2,764Speech pathologist 21 34 16 9 19 6 — 3 108Podiatrist 186 183 98 88 91 14 20 — 680Dietitian 63 41 32 12 18 3 9 3 181Audiologist 60 50 23 15 11 3 3 3 168Orthoptist 25 21 9 3 — — — — 58Orthotist 89 77 37 26 29 12 9 3 282Health professional, nec 66 50 45 7 15 6 7 3 199Clinical psychologist 748 570 309 233 168 38 57 22 2,145Therapy aide 79 44 52 55 16 12 3 — 261Total 2,907 2,295 1,422 946 798 183 182 66 8,799Complementary therapiesChiropractor 512 426 254 130 153 12 20 3 1,510Osteopath 103 81 19 10 3 6 13 — 235Naturopath 157 177 154 63 44 12 10 3 620Acupuncturist 169 64 99 14 19 3 9 — 377Natural therapy professional, nec 93 78 34 19 15 — — — 239Natural remedy consultant 152 237 99 69 33 21 6 6 623Total 1,186 1,063 659 305 267 54 58 12 3,604Other healthMedical scientist 1,190 1,137 609 409 396 82 79 18 3,920Biomedical engineer 162 143 67 32 45 6 12 — 467Health information manager 42 27 25 3 6 — 6 — 109Occupational health & safety officer 539 458 384 201 161 56 40 24 1,863Environmental health officer 655 312 600 235 98 55 29 36 2,020Medical technical officer 998 970 646 357 270 78 46 42 3,407Ambulance officer 1,566 333 346 76 132 41 10 26 2,530Intensive care ambulance paramedic 364 1,028 923 183 227 56 39 15 2,835Indigenous health worker 31 15 57 62 35 3 3 74 280Massage therapist 462 346 243 71 99 26 37 6 1,290Primary products inspector 680 435 533 290 170 91 28 46 2,273Anatomist or physiologist 73 32 53 45 12 3 15 6 239Safety inspector 1,094 741 901 564 292 92 53 43 3,780Admissions clerk 119 70 73 19 23 15 6 6 331Weight loss consultant 9 — 3 — 3 — 3 — 18Total 7,984 6,047 5,463 2,547 1,969 604 406 342 25,362
Total males 38,697 28,305 22,376 11,325 9,618 2,733 1,874 1,075 116,003
(continued)
later
169 64 99 14 19 3 9 — 377
later
169 64 99 14 19 3 9 — 377Natural therapy professional, nec 93 78 34 19 15 — — — 239
later
Natural therapy professional, nec 93 78 34 19 15 — — — 239152 237 99 69 33 21 6 6 623
later
152 237 99 69 33 21 6 6 6231,186 1,063 659 305 267 54 58 12 3,604
later 1,186 1,063 659 305 267 54 58 12 3,604
1,190 1,137 609 409 396 82 79 18 3,920
later 1,190 1,137 609 409 396 82 79 18 3,920
later
Health information manager later
Health information managerOccupational health & safety officer 539 458 384 201 161 56 40 24 1,863lat
er Occupational health & safety officer 539 458 384 201 161 56 40 24 1,863
editio
n 60 50 23 15 11 3 3 3 168
editio
n 60 50 23 15 11 3 3 3 16825 21 9 3 — — — — 58
editio
n 25 21 9 3 — — — — 5889 77 37 26 29 12 9 3 282
editio
n 89 77 37 26 29 12 9 3 28266 50 45 7 1
editio
n 66 50 45 7 15 6 7 3 199
editio
n 5 6 7 3 199748 570 309 233 168 38 57 22 2,145
editio
n 748 570 309 233 168 38 57 22 2,14579 44 52 55 16 12 3 — 261
editio
n 79 44 52 55 16 12 3 — 261
2,907 2,295 1,422 946 798 183 182 66 8,799
editio
n 2,907 2,295 1,422 946 798 183 182 66 8,799
512 426 254 130 153 12 20 3 1,510
editio
n 512 426 254 130 153 12 20 3 1,510103 81 19 10 3 6 13 — 235
editio
n 103 81 19 10 3 6 13 — 235157 177 154 63 44 12 10 3 620ed
ition
157 177 154 63 44 12 10 3 620169 64 99 14 19 3 9 — 377ed
ition
169 64 99 14 19 3 9 — 377Natural therapy professional, nec 93 78 34 19 15 — — — 239ed
ition
Natural therapy professional, nec 93 78 34 19 15 — — — 239
avail
able512 426 254 130 153 12 20 3 1,510
avail
able512 426 254 130 153 12 20 3 1,510
103 81 19 10 3 6 13 — 235
avail
able103 81 19 10 3 6 13 — 235
157 177 154 63 44 12 10 3 620
avail
able157 177 154 63 44 12 10 3 620
169 64 99 14 19 3 9 — 377
avail
able169 64 99 14 19 3 9 — 377
Natural therapy professional, nec 93 78 34 19 15 — — — 239
avail
able
Natural therapy professional, nec 93 78 34 19 15 — — — 239152 237 99 69 33 21 6 6 623
avail
able
152 237 99 69 33 21 6 6 6231,186 1,063 659 305 267 54 58 12 3,604
avail
able
1,186 1,063 659 305 267 54 58 12 3,604
1,190 1,137 609 409 396 82 79 18 3,920
avail
able
1,190 1,137 609 409 396 82 79 18 3,920
avail
able
162 143 67 32 45 6 12 — 467
avail
able
162 143 67 32 45 6 12 — 46742 27 25 3 6 — 6 — 109
avail
able
42 27 25 3 6 — 6 — 109Occupational health & safety officer 539 458 384 201 161 56 40 24 1,863av
ailab
le
Occupational health & safety officer 539 458 384 201 161 56 40 24 1,863avail
able
655 312 600 235 98 55 29 36 2,020avail
able
655 312 600 235 98 55 29 36 2,020998 970 646 357 270 78 46 42 3,407av
ailab
le
998 970 646 357 270 78 46 42 3,4071,566 333 346 76 132 41 10 26 2,530av
ailab
le
1,566 333 346 76 132 41 10 26 2,530
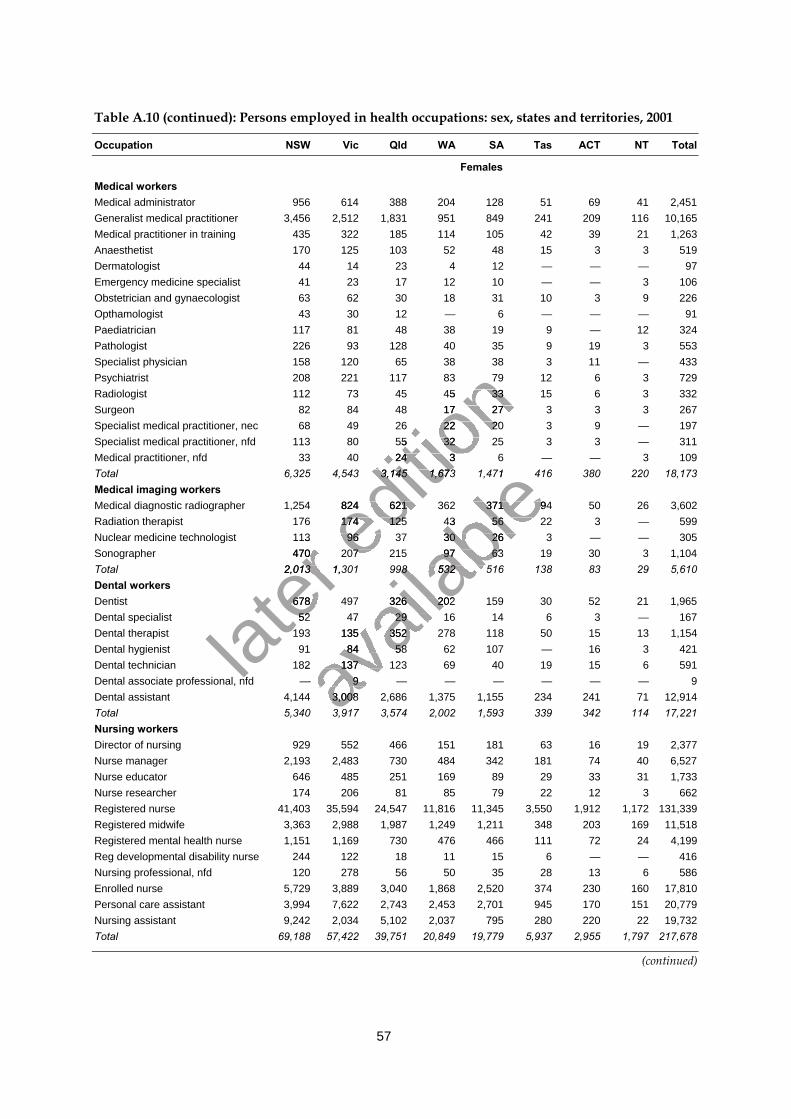
57
Table A.10 (continued): Persons employed in health occupations: sex, states and territories, 2001
Occupation NSW Vic Qld WA SA Tas ACT NT Total
Females
Medical workersMedical administrator 956 614 388 204 128 51 69 41 2,451Generalist medical practitioner 3,456 2,512 1,831 951 849 241 209 116 10,165Medical practitioner in training 435 322 185 114 105 42 39 21 1,263Anaesthetist 170 125 103 52 48 15 3 3 519Dermatologist 44 14 23 4 12 — — — 97Emergency medicine specialist 41 23 17 12 10 — — 3 106Obstetrician and gynaecologist 63 62 30 18 31 10 3 9 226Opthamologist 43 30 12 — 6 — — — 91Paediatrician 117 81 48 38 19 9 — 12 324Pathologist 226 93 128 40 35 9 19 3 553Specialist physician 158 120 65 38 38 3 11 — 433Psychiatrist 208 221 117 83 79 12 6 3 729Radiologist 112 73 45 45 33 15 6 3 332Surgeon 82 84 48 17 27 3 3 3 267Specialist medical practitioner, nec 68 49 26 22 20 3 9 — 197Specialist medical practitioner, nfd 113 80 55 32 25 3 3 — 311Medical practitioner, nfd 33 40 24 3 6 — — 3 109Total 6,325 4,543 3,145 1,673 1,471 416 380 220 18,173Medical imaging workersMedical diagnostic radiographer 1,254 824 621 362 371 94 50 26 3,602Radiation therapist 176 174 125 43 56 22 3 — 599Nuclear medicine technologist 113 96 37 30 26 3 — — 305Sonographer 470 207 215 97 63 19 30 3 1,104Total 2,013 1,301 998 532 516 138 83 29 5,610Dental workersDentist 678 497 326 202 159 30 52 21 1,965Dental specialist 52 47 29 16 14 6 3 — 167Dental therapist 193 135 352 278 118 50 15 13 1,154Dental hygienist 91 84 58 62 107 — 16 3 421Dental technician 182 137 123 69 40 19 15 6 591Dental associate professional, nfd — 9 — — — — — — 9Dental assistant 4,144 3,008 2,686 1,375 1,155 234 241 71 12,914Total 5,340 3,917 3,574 2,002 1,593 339 342 114 17,221Nursing workersDirector of nursing 929 552 466 151 181 63 16 19 2,377Nurse manager 2,193 2,483 730 484 342 181 74 40 6,527Nurse educator 646 485 251 169 89 29 33 31 1,733Nurse researcher 174 206 81 85 79 22 12 3 662Registered nurse 41,403 35,594 24,547 11,816 11,345 3,550 1,912 1,172 131,339Registered midwife 3,363 2,988 1,987 1,249 1,211 348 203 169 11,518Registered mental health nurse 1,151 1,169 730 476 466 111 72 24 4,199Reg developmental disability nurse 244 122 18 11 15 6 — — 416Nursing professional, nfd 120 278 56 50 35 28 13 6 586Enrolled nurse 5,729 3,889 3,040 1,868 2,520 374 230 160 17,810Personal care assistant 3,994 7,622 2,743 2,453 2,701 945 170 151 20,779Nursing assistant 9,242 2,034 5,102 2,037 795 280 220 22 19,732Total 69,188 57,422 39,751 20,849 19,779 5,937 2,955 1,797 217,678
(continued)
later
113 96 37 30 26 3 — — 305
later
113 96 37 30 26 3 — — 305470 207 215 97 63 19 30 3 1,104
later
470 207 215 97 63 19 30 3 1,1042,013 1,301 998 532 516 138 83 29 5,610
later
2,013 1,301 998 532 516 138 83 29 5,610
678 497 326 202 159 30 52 21 1,965
later 678 497 326 202 159 30 52 21 1,96552 47 29 16 14 6 3 — 167
later 52 47 29 16 14 6 3 — 167
Dental associate professional, nfd — 9 —later
Dental associate professional, nfd — 9 —
editio
n 158 120 65 38 38 3 11 — 433
editio
n 158 120 65 38 38 3 11 — 433208 221 117 83 79 12 6 3 729
editio
n 208 221 117 83 79 12 6 3 729112 73 45 45 33 15 6 3 332
editio
n 112 73 45 45 33 15 6 3 33282 84 48 17 2
editio
n 82 84 48 17 27 3 3 3 267
editio
n 7 3 3 3 267Specialist medical practitioner, nec 68 49 26 22 20 3 9 — 197
editio
n Specialist medical practitioner, nec 68 49 26 22 20 3 9 — 197Specialist medical practitioner, nfd 113 80 55 32 25 3 3 — 311
editio
n Specialist medical practitioner, nfd 113 80 55 32 25 3 3 — 311
33 40 24 3 6 — — 3 109
editio
n 33 40 24 3 6 — — 3 109
6,325 4,543 3,145 1,673 1,471 416 380 220 18,173
editio
n 6,325 4,543 3,145 1,673 1,471 416 380 220 18,173
Medical diagnostic radiographer 1,254 824 621 362 371 94 50 26 3,602
editio
n Medical diagnostic radiographer 1,254 824 621 362 371 94 50 26 3,602
176 174 125 43 56 22 3 — 599editio
n 176 174 125 43 56 22 3 — 599113 96 37 30 26 3 — — 305ed
ition
113 96 37 30 26 3 — — 305470 207 215 97 63 19 30 3 1,104ed
ition
470 207 215 97 63 19 30 3 1,104
avail
able
6,325 4,543 3,145 1,673 1,471 416 380 220 18,173
avail
able
6,325 4,543 3,145 1,673 1,471 416 380 220 18,173
Medical diagnostic radiographer 1,254 824 621 362 371 94 50 26 3,602
avail
ableMedical diagnostic radiographer 1,254 824 621 362 371 94 50 26 3,602
176 174 125 43 56 22 3 — 599
avail
able176 174 125 43 56 22 3 — 599
113 96 37 30 26 3 — — 305
avail
able113 96 37 30 26 3 — — 305
470 207 215 97 63 19 30 3 1,104
avail
able
470 207 215 97 63 19 30 3 1,1042,013 1,301 998 532 516 138 83 29 5,610
avail
able
2,013 1,301 998 532 516 138 83 29 5,610
678 497 326 202 159 30 52 21 1,965
avail
able
678 497 326 202 159 30 52 21 1,96552 47 29 16 14 6 3 — 167
avail
able
52 47 29 16 14 6 3 — 167
avail
able
193 135 352 278 118 50 15 13 1,154
avail
able
193 135 352 278 118 50 15 13 1,15491 84 58 62 107 — 16 3 421
avail
able
91 84 58 62 107 — 16 3 421182 137 123 69 40 19 15 6 591av
ailab
le
182 137 123 69 40 19 15 6 591Dental associate professional, nfd — 9 —av
ailab
le
Dental associate professional, nfd — 9 —avail
able
4,144 3,008 2,686 1,375 1,155 234 241 71 12,914avail
able
4,144 3,008 2,686 1,375 1,155 234 241 71 12,9145,340 3,917 3,574 2,002 1,593 339 342 114 17,221av
ailab
le
5,340 3,917 3,574 2,002 1,593 339 342 114 17,221
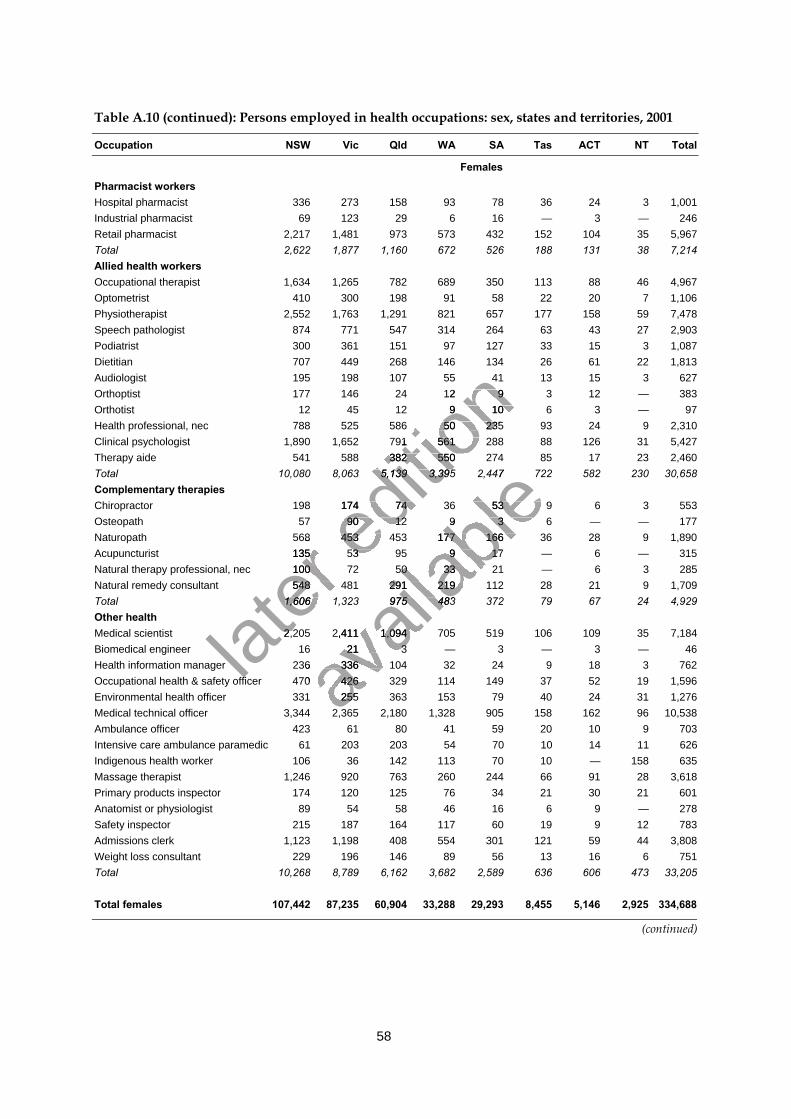
58
Table A.10 (continued): Persons employed in health occupations: sex, states and territories, 2001
Occupation NSW Vic Qld WA SA Tas ACT NT Total
Females
Pharmacist workersHospital pharmacist 336 273 158 93 78 36 24 3 1,001Industrial pharmacist 69 123 29 6 16 — 3 — 246Retail pharmacist 2,217 1,481 973 573 432 152 104 35 5,967Total 2,622 1,877 1,160 672 526 188 131 38 7,214Allied health workersOccupational therapist 1,634 1,265 782 689 350 113 88 46 4,967Optometrist 410 300 198 91 58 22 20 7 1,106Physiotherapist 2,552 1,763 1,291 821 657 177 158 59 7,478Speech pathologist 874 771 547 314 264 63 43 27 2,903Podiatrist 300 361 151 97 127 33 15 3 1,087Dietitian 707 449 268 146 134 26 61 22 1,813Audiologist 195 198 107 55 41 13 15 3 627Orthoptist 177 146 24 12 9 3 12 — 383Orthotist 12 45 12 9 10 6 3 — 97Health professional, nec 788 525 586 50 235 93 24 9 2,310Clinical psychologist 1,890 1,652 791 561 288 88 126 31 5,427Therapy aide 541 588 382 550 274 85 17 23 2,460Total 10,080 8,063 5,139 3,395 2,447 722 582 230 30,658Complementary therapiesChiropractor 198 174 74 36 53 9 6 3 553Osteopath 57 90 12 9 3 6 — — 177Naturopath 568 453 453 177 166 36 28 9 1,890Acupuncturist 135 53 95 9 17 — 6 — 315Natural therapy professional, nec 100 72 50 33 21 — 6 3 285Natural remedy consultant 548 481 291 219 112 28 21 9 1,709Total 1,606 1,323 975 483 372 79 67 24 4,929Other healthMedical scientist 2,205 2,411 1,094 705 519 106 109 35 7,184Biomedical engineer 16 21 3 — 3 — 3 — 46Health information manager 236 336 104 32 24 9 18 3 762Occupational health & safety officer 470 426 329 114 149 37 52 19 1,596Environmental health officer 331 255 363 153 79 40 24 31 1,276Medical technical officer 3,344 2,365 2,180 1,328 905 158 162 96 10,538Ambulance officer 423 61 80 41 59 20 10 9 703Intensive care ambulance paramedic 61 203 203 54 70 10 14 11 626Indigenous health worker 106 36 142 113 70 10 — 158 635Massage therapist 1,246 920 763 260 244 66 91 28 3,618Primary products inspector 174 120 125 76 34 21 30 21 601Anatomist or physiologist 89 54 58 46 16 6 9 — 278Safety inspector 215 187 164 117 60 19 9 12 783Admissions clerk 1,123 1,198 408 554 301 121 59 44 3,808Weight loss consultant 229 196 146 89 56 13 16 6 751Total 10,268 8,789 6,162 3,682 2,589 636 606 473 33,205
Total females 107,442 87,235 60,904 33,288 29,293 8,455 5,146 2,925 334,688
(continued)
later
568 453 453 177 166 36 28 9 1,890
later
568 453 453 177 166 36 28 9 1,890135 53 95 9 17 — 6 — 315
later
135 53 95 9 17 — 6 — 315Natural therapy professional, nec 100 72 50 33 21 — 6 3 285
later
Natural therapy professional, nec 100 72 50 33 21 — 6 3 285548 481 291 219 112 28 21 9 1,709
later 548 481 291 219 112 28 21 9 1,709
1,606 1,323 975 483 372 79 67 24 4,929
later 1,606 1,323 975 483 372 79 67 24 4,929
2,205 2,411 1,094 705 519 106 109 35 7,184later
2,205 2,411 1,094 705 519 106 109 35 7,184
Occupational health & safety officer 470 426 329 114 149 37 52 19 1,596later
Occupational health & safety officer 470 426 329 114 149 37 52 19 1,596
editio
n 707 449 268 146 134 26 61 22 1,813
editio
n 707 449 268 146 134 26 61 22 1,813195 198 107 55 41 13 15 3 627
editio
n 195 198 107 55 41 13 15 3 627177 146 24 12 9 3 12 — 383
editio
n 177 146 24 12 9 3 12 — 38312 45 12 9 10 6 3 — 97
editio
n 12 45 12 9 10 6 3 — 97788 525 586 50 235 93 24 9 2,310
editio
n 788 525 586 50 235 93 24 9 2,3101,890 1,652 791 561 288 88 126 31 5,427
editio
n 1,890 1,652 791 561 288 88 126 31 5,427
541 588 382 550 274 85 17 23 2,460
editio
n 541 588 382 550 274 85 17 23 2,460
10,080 8,063 5,139 3,395 2,447 722 582 230 30,658
editio
n 10,080 8,063 5,139 3,395 2,447 722 582 230 30,658
198 174 74 36 53 9 6 3 553
editio
n 198 174 74 36 53 9 6 3 55357 90 12 9 3 6 — — 177ed
ition
57 90 12 9 3 6 — — 177568 453 453 177 166 36 28 9 1,890ed
ition
568 453 453 177 166 36 28 9 1,890135 53 95 9 17 — 6 — 315ed
ition
135 53 95 9 17 — 6 — 315
avail
able
10,080 8,063 5,139 3,395 2,447 722 582 230 30,658
avail
able
10,080 8,063 5,139 3,395 2,447 722 582 230 30,658
198 174 74 36 53 9 6 3 553
avail
able198 174 74 36 53 9 6 3 553
57 90 12 9 3 6 — — 177
avail
able57 90 12 9 3 6 — — 177
568 453 453 177 166 36 28 9 1,890
avail
able568 453 453 177 166 36 28 9 1,890
135 53 95 9 17 — 6 — 315
avail
able
135 53 95 9 17 — 6 — 315Natural therapy professional, nec 100 72 50 33 21 — 6 3 285
avail
able
Natural therapy professional, nec 100 72 50 33 21 — 6 3 285548 481 291 219 112 28 21 9 1,709
avail
able
548 481 291 219 112 28 21 9 1,7091,606 1,323 975 483 372 79 67 24 4,929
avail
able
1,606 1,323 975 483 372 79 67 24 4,929
2,205 2,411 1,094 705 519 106 109 35 7,184
avail
able
2,205 2,411 1,094 705 519 106 109 35 7,184
avail
able
16 21 3 — 3 — 3 — 46
avail
able
16 21 3 — 3 — 3 — 46236 336 104 32 24 9 18 3 762av
ailab
le
236 336 104 32 24 9 18 3 762Occupational health & safety officer 470 426 329 114 149 37 52 19 1,596av
ailab
le
Occupational health & safety officer 470 426 329 114 149 37 52 19 1,596avail
able
331 255 363 153 79 40 24 31 1,276avail
able
331 255 363 153 79 40 24 31 1,2763,344 2,365 2,180 1,328 905 158 162 96 10,538av
ailab
le
3,344 2,365 2,180 1,328 905 158 162 96 10,538
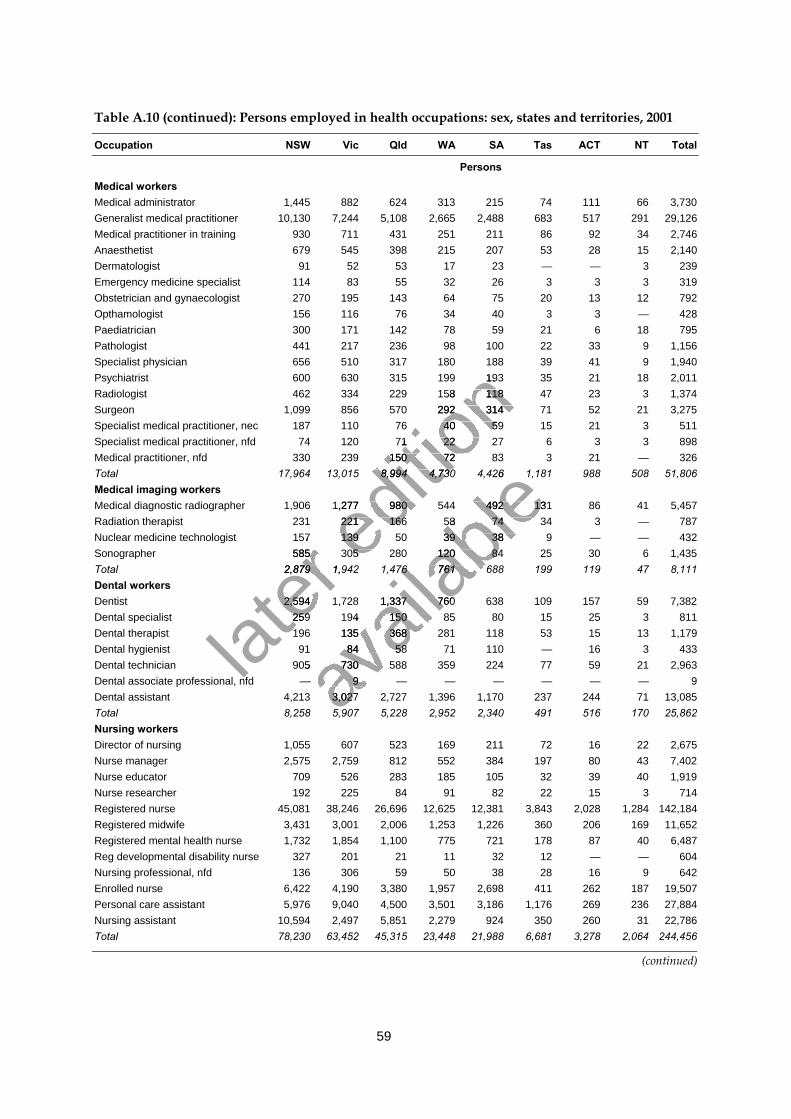
59
Table A.10 (continued): Persons employed in health occupations: sex, states and territories, 2001
Occupation NSW Vic Qld WA SA Tas ACT NT Total
Persons
Medical workersMedical administrator 1,445 882 624 313 215 74 111 66 3,730Generalist medical practitioner 10,130 7,244 5,108 2,665 2,488 683 517 291 29,126Medical practitioner in training 930 711 431 251 211 86 92 34 2,746Anaesthetist 679 545 398 215 207 53 28 15 2,140Dermatologist 91 52 53 17 23 — — 3 239Emergency medicine specialist 114 83 55 32 26 3 3 3 319Obstetrician and gynaecologist 270 195 143 64 75 20 13 12 792Opthamologist 156 116 76 34 40 3 3 — 428Paediatrician 300 171 142 78 59 21 6 18 795Pathologist 441 217 236 98 100 22 33 9 1,156Specialist physician 656 510 317 180 188 39 41 9 1,940Psychiatrist 600 630 315 199 193 35 21 18 2,011Radiologist 462 334 229 158 118 47 23 3 1,374Surgeon 1,099 856 570 292 314 71 52 21 3,275Specialist medical practitioner, nec 187 110 76 40 59 15 21 3 511Specialist medical practitioner, nfd 74 120 71 22 27 6 3 3 898Medical practitioner, nfd 330 239 150 72 83 3 21 — 326Total 17,964 13,015 8,994 4,730 4,426 1,181 988 508 51,806Medical imaging workersMedical diagnostic radiographer 1,906 1,277 980 544 492 131 86 41 5,457Radiation therapist 231 221 166 58 74 34 3 — 787Nuclear medicine technologist 157 139 50 39 38 9 — — 432Sonographer 585 305 280 120 84 25 30 6 1,435Total 2,879 1,942 1,476 761 688 199 119 47 8,111Dental workersDentist 2,594 1,728 1,337 760 638 109 157 59 7,382Dental specialist 259 194 150 85 80 15 25 3 811Dental therapist 196 135 368 281 118 53 15 13 1,179Dental hygienist 91 84 58 71 110 — 16 3 433Dental technician 905 730 588 359 224 77 59 21 2,963Dental associate professional, nfd — 9 — — — — — — 9Dental assistant 4,213 3,027 2,727 1,396 1,170 237 244 71 13,085Total 8,258 5,907 5,228 2,952 2,340 491 516 170 25,862Nursing workersDirector of nursing 1,055 607 523 169 211 72 16 22 2,675Nurse manager 2,575 2,759 812 552 384 197 80 43 7,402Nurse educator 709 526 283 185 105 32 39 40 1,919Nurse researcher 192 225 84 91 82 22 15 3 714Registered nurse 45,081 38,246 26,696 12,625 12,381 3,843 2,028 1,284 142,184Registered midwife 3,431 3,001 2,006 1,253 1,226 360 206 169 11,652Registered mental health nurse 1,732 1,854 1,100 775 721 178 87 40 6,487Reg developmental disability nurse 327 201 21 11 32 12 — — 604Nursing professional, nfd 136 306 59 50 38 28 16 9 642Enrolled nurse 6,422 4,190 3,380 1,957 2,698 411 262 187 19,507Personal care assistant 5,976 9,040 4,500 3,501 3,186 1,176 269 236 27,884Nursing assistant 10,594 2,497 5,851 2,279 924 350 260 31 22,786Total 78,230 63,452 45,315 23,448 21,988 6,681 3,278 2,064 244,456
(continued)
later
157 139 50 39 38 9 — — 432
later
157 139 50 39 38 9 — — 432585 305 280 120 84 25 30 6 1,435
later
585 305 280 120 84 25 30 6 1,4352,879 1,942 1,476 761 688 199 119 47 8,111
later
2,879 1,942 1,476 761 688 199 119 47 8,111
2,594 1,728 1,337 760 638 109 157 59 7,382
later 2,594 1,728 1,337 760 638 109 157 59 7,382
259 194 150 85 80 15 25 3 811
later 259 194 150 85 80 15 25 3 811
Dental associate professional, nfd — 9 —later
Dental associate professional, nfd — 9 —
editio
n 656 510 317 180 188 39 41 9 1,940
editio
n 656 510 317 180 188 39 41 9 1,940600 630 315 199 193 35 21 18 2,011
editio
n 600 630 315 199 193 35 21 18 2,011462 334 229 158 118 47 23 3 1,374
editio
n 462 334 229 158 118 47 23 3 1,3741,099 856 570 292 314 71 52 21 3,275
editio
n 1,099 856 570 292 314 71 52 21 3,275Specialist medical practitioner, nec 187 110 76 40 59 15 21 3 511
editio
n Specialist medical practitioner, nec 187 110 76 40 59 15 21 3 511Specialist medical practitioner, nfd 74 120 71 22 2
editio
n Specialist medical practitioner, nfd 74 120 71 22 2
330 239 150 72 83 3 21 — 326
editio
n 330 239 150 72 83 3 21 — 326
17,964 13,015 8,994 4,730 4,426 1,181 988 508 51,806
editio
n 17,964 13,015 8,994 4,730 4,426 1,181 988 508 51,806
Medical diagnostic radiographer 1,906 1,277 980 544 492 131 86 41 5,457
editio
n Medical diagnostic radiographer 1,906 1,277 980 544 492 131 86 41 5,457
231 221 166 58 74 34 3 — 787editio
n 231 221 166 58 74 34 3 — 787157 139 50 39 38 9 — — 432ed
ition
157 139 50 39 38 9 — — 432585 305 280 120 84 25 30 6 1,435ed
ition
585 305 280 120 84 25 30 6 1,435
avail
able
17,964 13,015 8,994 4,730 4,426 1,181 988 508 51,806
avail
able
17,964 13,015 8,994 4,730 4,426 1,181 988 508 51,806
Medical diagnostic radiographer 1,906 1,277 980 544 492 131 86 41 5,457
avail
ableMedical diagnostic radiographer 1,906 1,277 980 544 492 131 86 41 5,457
231 221 166 58 74 34 3 — 787
avail
able231 221 166 58 74 34 3 — 787
157 139 50 39 38 9 — — 432
avail
able157 139 50 39 38 9 — — 432
585 305 280 120 84 25 30 6 1,435
avail
able
585 305 280 120 84 25 30 6 1,4352,879 1,942 1,476 761 688 199 119 47 8,111
avail
able
2,879 1,942 1,476 761 688 199 119 47 8,111
2,594 1,728 1,337 760 638 109 157 59 7,382
avail
able
2,594 1,728 1,337 760 638 109 157 59 7,382259 194 150 85 80 15 25 3 811
avail
able
259 194 150 85 80 15 25 3 811196 135 368 281 118 53 15 13 1,179
avail
able
196 135 368 281 118 53 15 13 1,179
avail
able
91 84 58 71 110 — 16 3 433
avail
able
91 84 58 71 110 — 16 3 433905 730 588 359 224 77 59 21 2,963av
ailab
le
905 730 588 359 224 77 59 21 2,963Dental associate professional, nfd — 9 —av
ailab
le
Dental associate professional, nfd — 9 —4,213 3,027 2,727 1,396 1,170 237 244 71 13,085av
ailab
le
4,213 3,027 2,727 1,396 1,170 237 244 71 13,0858,258 5,907 5,228 2,952 2,340 491 516 170 25,862av
ailab
le
8,258 5,907 5,228 2,952 2,340 491 516 170 25,862
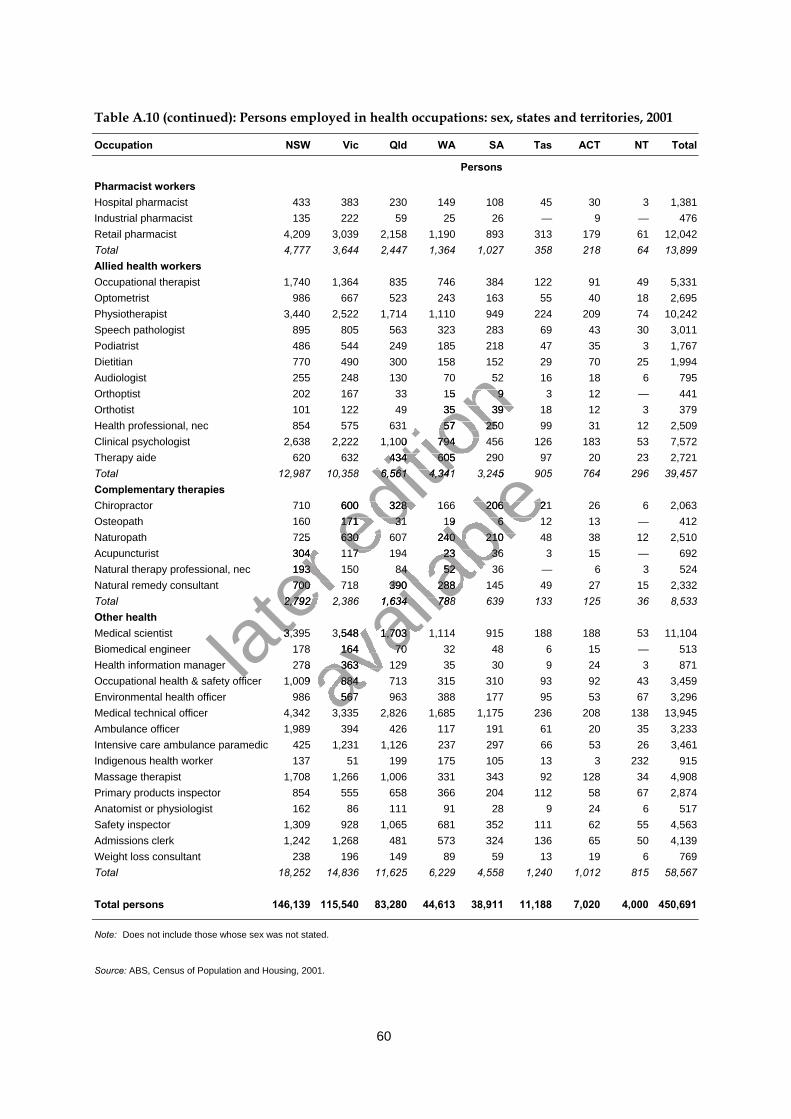
60
Table A.10 (continued): Persons employed in health occupations: sex, states and territories, 2001
Occupation NSW Vic Qld WA SA Tas ACT NT Total
Persons
Pharmacist workersHospital pharmacist 433 383 230 149 108 45 30 3 1,381Industrial pharmacist 135 222 59 25 26 — 9 — 476Retail pharmacist 4,209 3,039 2,158 1,190 893 313 179 61 12,042Total 4,777 3,644 2,447 1,364 1,027 358 218 64 13,899Allied health workersOccupational therapist 1,740 1,364 835 746 384 122 91 49 5,331Optometrist 986 667 523 243 163 55 40 18 2,695Physiotherapist 3,440 2,522 1,714 1,110 949 224 209 74 10,242Speech pathologist 895 805 563 323 283 69 43 30 3,011Podiatrist 486 544 249 185 218 47 35 3 1,767Dietitian 770 490 300 158 152 29 70 25 1,994Audiologist 255 248 130 70 52 16 18 6 795Orthoptist 202 167 33 15 9 3 12 — 441Orthotist 101 122 49 35 39 18 12 3 379Health professional, nec 854 575 631 57 250 99 31 12 2,509Clinical psychologist 2,638 2,222 1,100 794 456 126 183 53 7,572Therapy aide 620 632 434 605 290 97 20 23 2,721Total 12,987 10,358 6,561 4,341 3,245 905 764 296 39,457Complementary therapiesChiropractor 710 600 328 166 206 21 26 6 2,063Osteopath 160 171 31 19 6 12 13 — 412Naturopath 725 630 607 240 210 48 38 12 2,510Acupuncturist 304 117 194 23 36 3 15 — 692Natural therapy professional, nec 193 150 84 52 36 — 6 3 524Natural remedy consultant 700 718 390 288 145 49 27 15 2,332Total 2,792 2,386 1,634 788 639 133 125 36 8,533Other healthMedical scientist 3,395 3,548 1,703 1,114 915 188 188 53 11,104Biomedical engineer 178 164 70 32 48 6 15 — 513Health information manager 278 363 129 35 30 9 24 3 871Occupational health & safety officer 1,009 884 713 315 310 93 92 43 3,459Environmental health officer 986 567 963 388 177 95 53 67 3,296Medical technical officer 4,342 3,335 2,826 1,685 1,175 236 208 138 13,945Ambulance officer 1,989 394 426 117 191 61 20 35 3,233Intensive care ambulance paramedic 425 1,231 1,126 237 297 66 53 26 3,461Indigenous health worker 137 51 199 175 105 13 3 232 915Massage therapist 1,708 1,266 1,006 331 343 92 128 34 4,908Primary products inspector 854 555 658 366 204 112 58 67 2,874Anatomist or physiologist 162 86 111 91 28 9 24 6 517Safety inspector 1,309 928 1,065 681 352 111 62 55 4,563Admissions clerk 1,242 1,268 481 573 324 136 65 50 4,139Weight loss consultant 238 196 149 89 59 13 19 6 769Total 18,252 14,836 11,625 6,229 4,558 1,240 1,012 815 58,567
Total persons 146,139 115,540 83,280 44,613 38,911 11,188 7,020 4,000 450,691
Note: Does not include those whose sex was not stated.
Source: ABS, Census of Population and Housing, 2001.
later
725 630 607 240 210 48 38 12 2,510
later
725 630 607 240 210 48 38 12 2,510304 117 194 23 36 3 15 — 692
later
304 117 194 23 36 3 15 — 692Natural therapy professional, nec 193 150 84 52 36 — 6 3 524
later
Natural therapy professional, nec 193 150 84 52 36 — 6 3 524700 718 390 288 145 49 27 15 2,332
later 700 718 390 288 145 49 27 15 2,332
2,792 2,386 1,634 788 639 133 125 36 8,533
later 2,792 2,386 1,634 788 639 133 125 36 8,533
3,395 3,548 1,703 1,114 915 188 188 53 11,104later
3,395 3,548 1,703 1,114 915 188 188 53 11,104
Occupational health & safety officer 1,009 884 713 315 310 93 92 43 3,459later
Occupational health & safety officer 1,009 884 713 315 310 93 92 43 3,459
editio
n 770 490 300 158 152 29 70 25 1,994
editio
n 770 490 300 158 152 29 70 25 1,994255 248 130 70 52 16 18 6 795
editio
n 255 248 130 70 52 16 18 6 795202 167 33 15 9 3 12 — 441
editio
n 202 167 33 15 9 3 12 — 441101 122 49 35 39 18 12 3 379
editio
n 101 122 49 35 39 18 12 3 379854 575 631 57 250 99 31 12 2,509
editio
n 854 575 631 57 250 99 31 12 2,5092,638 2,222 1,100 794 456 126 183 53 7,572
editio
n 2,638 2,222 1,100 794 456 126 183 53 7,572
620 632 434 605 290 97 20 23 2,721
editio
n 620 632 434 605 290 97 20 23 2,721
12,987 10,358 6,561 4,341 3,245 905 764 296 39,457
editio
n 12,987 10,358 6,561 4,341 3,245 905 764 296 39,457
710 600 328 166 206 21 26 6 2,063
editio
n 710 600 328 166 206 21 26 6 2,063160 171 31 19 6 12 13 — 412ed
ition
160 171 31 19 6 12 13 — 412725 630 607 240 210 48 38 12 2,510ed
ition
725 630 607 240 210 48 38 12 2,510304 117 194 23 36 3 15 — 692ed
ition
304 117 194 23 36 3 15 — 692
avail
able
12,987 10,358 6,561 4,341 3,245 905 764 296 39,457
avail
able
12,987 10,358 6,561 4,341 3,245 905 764 296 39,457
710 600 328 166 206 21 26 6 2,063
avail
able710 600 328 166 206 21 26 6 2,063
160 171 31 19 6 12 13 — 412
avail
able160 171 31 19 6 12 13 — 412
725 630 607 240 210 48 38 12 2,510
avail
able725 630 607 240 210 48 38 12 2,510
304 117 194 23 36 3 15 — 692
avail
able
304 117 194 23 36 3 15 — 692Natural therapy professional, nec 193 150 84 52 36 — 6 3 524
avail
able
Natural therapy professional, nec 193 150 84 52 36 — 6 3 524700 718 390 288 145 49 27 15 2,332
avail
able
700 718 390 288 145 49 27 15 2,3322,792 2,386 1,634 788 639 133 125 36 8,533
avail
able
2,792 2,386 1,634 788 639 133 125 36 8,533
3,395 3,548 1,703 1,114 915 188 188 53 11,104
avail
able
3,395 3,548 1,703 1,114 915 188 188 53 11,104
avail
able
178 164 70 32 48 6 15 — 513
avail
able
178 164 70 32 48 6 15 — 513278 363 129 35 30 9 24 3 871av
ailab
le
278 363 129 35 30 9 24 3 871Occupational health & safety officer 1,009 884 713 315 310 93 92 43 3,459av
ailab
le
Occupational health & safety officer 1,009 884 713 315 310 93 92 43 3,459avail
able
986 567 963 388 177 95 53 67 3,296avail
able
986 567 963 388 177 95 53 67 3,2964,342 3,335 2,826 1,685 1,175 236 208 138 13,945av
ailab
le
4,342 3,335 2,826 1,685 1,175 236 208 138 13,945
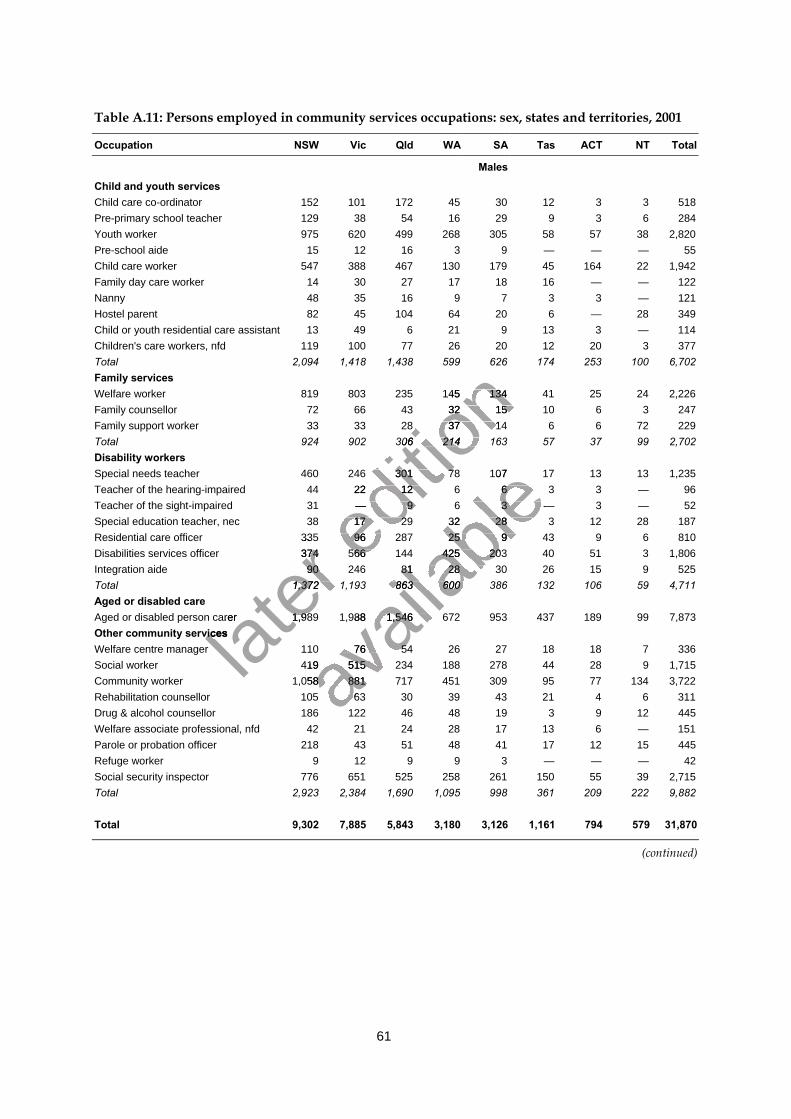
61
Table A.11: Persons employed in community services occupations: sex, states and territories, 2001
Occupation NSW Vic Qld WA SA Tas ACT NT Total
Males
Child and youth servicesChild care co-ordinator 152 101 172 45 30 12 3 3 518Pre-primary school teacher 129 38 54 16 29 9 3 6 284Youth worker 975 620 499 268 305 58 57 38 2,820Pre-school aide 15 12 16 3 9 — — — 55Child care worker 547 388 467 130 179 45 164 22 1,942Family day care worker 14 30 27 17 18 16 — — 122Nanny 48 35 16 9 7 3 3 — 121Hostel parent 82 45 104 64 20 6 — 28 349Child or youth residential care assistant 13 49 6 21 9 13 3 — 114Children's care workers, nfd 119 100 77 26 20 12 20 3 377Total 2,094 1,418 1,438 599 626 174 253 100 6,702Family servicesWelfare worker 819 803 235 145 134 41 25 24 2,226Family counsellor 72 66 43 32 15 10 6 3 247Family support worker 33 33 28 37 14 6 6 72 229Total 924 902 306 214 163 57 37 99 2,702Disability workersSpecial needs teacher 460 246 301 78 107 17 13 13 1,235Teacher of the hearing-impaired 44 22 12 6 6 3 3 — 96Teacher of the sight-impaired 31 — 9 6 3 — 3 — 52Special education teacher, nec 38 17 29 32 28 3 12 28 187Residential care officer 335 96 287 25 9 43 9 6 810Disabilities services officer 374 566 144 425 203 40 51 3 1,806Integration aide 90 246 81 28 30 26 15 9 525Total 1,372 1,193 863 600 386 132 106 59 4,711Aged or disabled careAged or disabled person carer 1,989 1,988 1,546 672 953 437 189 99 7,873Other community servicesWelfare centre manager 110 76 54 26 27 18 18 7 336Social worker 419 515 234 188 278 44 28 9 1,715Community worker 1,058 881 717 451 309 95 77 134 3,722Rehabilitation counsellor 105 63 30 39 43 21 4 6 311Drug & alcohol counsellor 186 122 46 48 19 3 9 12 445Welfare associate professional, nfd 42 21 24 28 17 13 6 — 151Parole or probation officer 218 43 51 48 41 17 12 15 445Refuge worker 9 12 9 9 3 — — — 42Social security inspector 776 651 525 258 261 150 55 39 2,715Total 2,923 2,384 1,690 1,095 998 361 209 222 9,882
Total 9,302 7,885 5,843 3,180 3,126 1,161 794 579 31,870
(continued)
later 335 96 287 25 9 43 9 6 810
later 335 96 287 25 9 43 9 6 810374 566 144 425 203 40 51 3 1,806
later 374 566 144 425 203 40 51 3 1,80690 246 81 28 30 26 15 9 525
later
90 246 81 28 30 26 15 9 5251,372 1,193 863 600 386 132 106 59 4,711
later 1,372 1,193 863 600 386 132 106 59 4,711
Aged or disabled person carer
later Aged or disabled person carer 1,989 1,988 1,546 672 953 437 189 99 7,873
later 1,989 1,988 1,546 672 953 437 189 99 7,873
Other community services later
Other community services
editio
n 2,094 1,418 1,438 599 626 174 253 100 6,702
editio
n 2,094 1,418 1,438 599 626 174 253 100 6,702
819 803 235 145 134 41 25 24 2,226
editio
n 819 803 235 145 134 41 25 24 2,22672 66 43 32 15 10 6 3 247
editio
n 72 66 43 32 15 10 6 3 24733 33 28 37 14 6 6 72 229
editio
n 33 33 28 37 14 6 6 72 229924 902 306 214 163 57 37 99 2,702
editio
n 924 902 306 214 163 57 37 99 2,702
460 246 301 78 107 17 13 13 1,235
editio
n 460 246 301 78 107 17 13 13 1,235
44 22 12 6 6 3 3 — 96
editio
n 44 22 12 6 6 3 3 — 9631 — 9 6 3 — 3 — 52
editio
n 31 — 9 6 3 — 3 — 5238 17 29 32 28 3 12 28 187ed
ition
38 17 29 32 28 3 12 28 187335 96 287 25 9 43 9 6 810ed
ition
335 96 287 25 9 43 9 6 810374 566 144 425 203 40 51 3 1,806ed
ition
374 566 144 425 203 40 51 3 1,806
avail
able
460 246 301 78 107 17 13 13 1,235
avail
able
460 246 301 78 107 17 13 13 1,23544 22 12 6 6 3 3 — 96
avail
able44 22 12 6 6 3 3 — 96
31 — 9 6 3 — 3 — 52
avail
able31 — 9 6 3 — 3 — 52
38 17 29 32 28 3 12 28 187
avail
able38 17 29 32 28 3 12 28 187
335 96 287 25 9 43 9 6 810
avail
able335 96 287 25 9 43 9 6 810
374 566 144 425 203 40 51 3 1,806
avail
able
374 566 144 425 203 40 51 3 1,80690 246 81 28 30 26 15 9 525
avail
able
90 246 81 28 30 26 15 9 5251,372 1,193 863 600 386 132 106 59 4,711
avail
able
1,372 1,193 863 600 386 132 106 59 4,711
1,989 1,988 1,546 672 953 437 189 99 7,873
avail
able
1,989 1,988 1,546 672 953 437 189 99 7,873
avail
able
110 76 54 26 27 18 18 7 336
avail
able
110 76 54 26 27 18 18 7 336419 515 234 188 278 44 28 9 1,715av
ailab
le
419 515 234 188 278 44 28 9 1,7151,058 881 717 451 309 95 77 134 3,722av
ailab
le
1,058 881 717 451 309 95 77 134 3,722avail
able
105 63 30 39 43 21 4 6 311avail
able
105 63 30 39 43 21 4 6 311186 122 46 48 19 3 9 12 445av
ailab
le
186 122 46 48 19 3 9 12 445
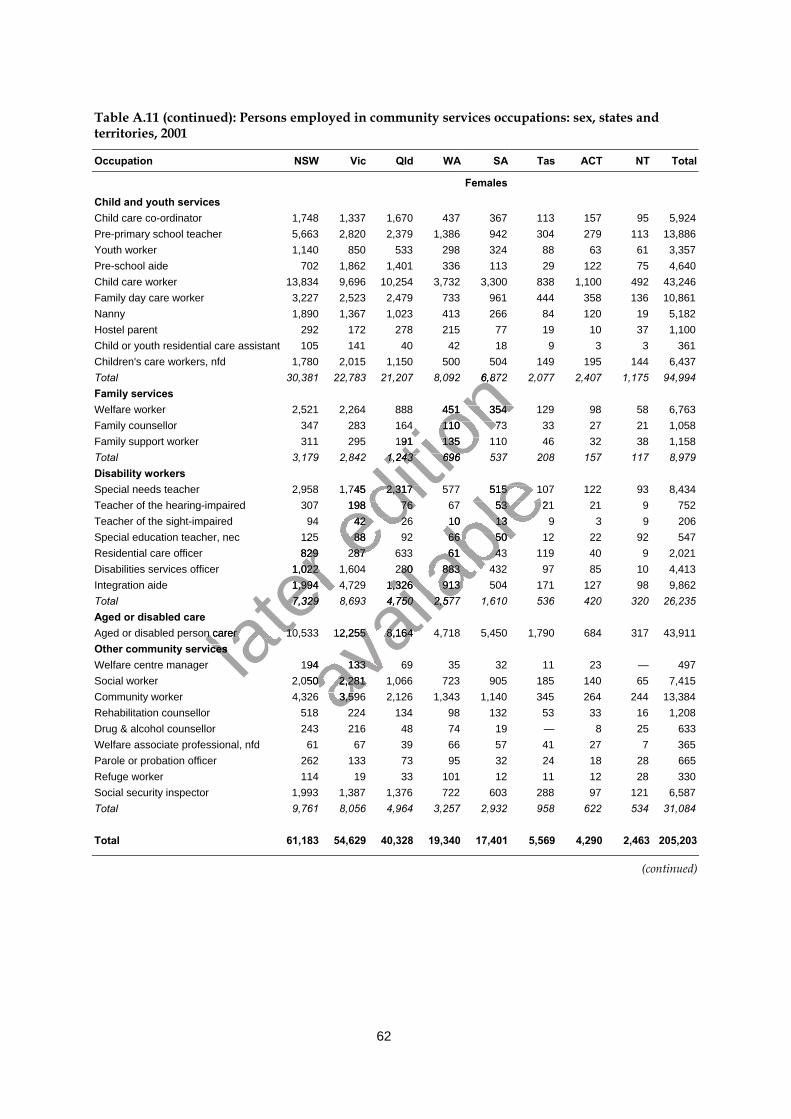
62
Table A.11 (continued): Persons employed in community services occupations: sex, states andterritories, 2001
Occupation NSW Vic Qld WA SA Tas ACT NT Total
Females
Child and youth servicesChild care co-ordinator 1,748 1,337 1,670 437 367 113 157 95 5,924Pre-primary school teacher 5,663 2,820 2,379 1,386 942 304 279 113 13,886Youth worker 1,140 850 533 298 324 88 63 61 3,357Pre-school aide 702 1,862 1,401 336 113 29 122 75 4,640Child care worker 13,834 9,696 10,254 3,732 3,300 838 1,100 492 43,246Family day care worker 3,227 2,523 2,479 733 961 444 358 136 10,861Nanny 1,890 1,367 1,023 413 266 84 120 19 5,182Hostel parent 292 172 278 215 77 19 10 37 1,100Child or youth residential care assistant 105 141 40 42 18 9 3 3 361Children's care workers, nfd 1,780 2,015 1,150 500 504 149 195 144 6,437Total 30,381 22,783 21,207 8,092 6,872 2,077 2,407 1,175 94,994Family servicesWelfare worker 2,521 2,264 888 451 354 129 98 58 6,763Family counsellor 347 283 164 110 73 33 27 21 1,058Family support worker 311 295 191 135 110 46 32 38 1,158Total 3,179 2,842 1,243 696 537 208 157 117 8,979Disability workersSpecial needs teacher 2,958 1,745 2,317 577 515 107 122 93 8,434Teacher of the hearing-impaired 307 198 76 67 53 21 21 9 752Teacher of the sight-impaired 94 42 26 10 13 9 3 9 206Special education teacher, nec 125 88 92 66 50 12 22 92 547Residential care officer 829 287 633 61 43 119 40 9 2,021Disabilities services officer 1,022 1,604 280 883 432 97 85 10 4,413Integration aide 1,994 4,729 1,326 913 504 171 127 98 9,862Total 7,329 8,693 4,750 2,577 1,610 536 420 320 26,235Aged or disabled careAged or disabled person carer 10,533 12,255 8,164 4,718 5,450 1,790 684 317 43,911Other community servicesWelfare centre manager 194 133 69 35 32 11 23 — 497Social worker 2,050 2,281 1,066 723 905 185 140 65 7,415Community worker 4,326 3,596 2,126 1,343 1,140 345 264 244 13,384Rehabilitation counsellor 518 224 134 98 132 53 33 16 1,208Drug & alcohol counsellor 243 216 48 74 19 — 8 25 633Welfare associate professional, nfd 61 67 39 66 57 41 27 7 365Parole or probation officer 262 133 73 95 32 24 18 28 665Refuge worker 114 19 33 101 12 11 12 28 330Social security inspector 1,993 1,387 1,376 722 603 288 97 121 6,587Total 9,761 8,056 4,964 3,257 2,932 958 622 534 31,084
Total 61,183 54,629 40,328 19,340 17,401 5,569 4,290 2,463 205,203
(continued)
later 125 88 92 66 50 12 22 92 547
later 125 88 92 66 50 12 22 92 547829 287 633 61 43 119 40 9 2,021
later 829 287 633 61 43 119 40 9 2,021
1,022 1,604 280 883 432 97 85 10 4,413
later
1,022 1,604 280 883 432 97 85 10 4,4131,994 4,729 1,326 913 504 171 127 98 9,862
later 1,994 4,729 1,326 913 504 171 127 98 9,862
7,329 8,693 4,750 2,577 1,610 536 420 320 26,235
later 7,329 8,693 4,750 2,577 1,610 536 420 320 26,235
Aged or disabled person carer 10,533 12,255 8,164 4,718 5,450 1,790 684 317 43,911later
Aged or disabled person carer 10,533 12,255 8,164 4,718 5,450 1,790 684 317 43,911Other community services lat
er Other community services
editio
n 1,780 2,015 1,150 500 504 149 195 144 6,437
editio
n 1,780 2,015 1,150 500 504 149 195 144 6,437
30,381 22,783 21,207 8,092 6,872 2,077 2,407 1,175 94,994
editio
n 30,381 22,783 21,207 8,092 6,872 2,077 2,407 1,175 94,994
2,521 2,264 888 451 354 129 98 58 6,763
editio
n 2,521 2,264 888 451 354 129 98 58 6,763347 283 164 110 73 33 27 21 1,058
editio
n 347 283 164 110 73 33 27 21 1,058311 295 191 135 110 46 32 38 1,158
editio
n 311 295 191 135 110 46 32 38 1,158
3,179 2,842 1,243 696 537 208 157 117 8,979
editio
n 3,179 2,842 1,243 696 537 208 157 117 8,979
2,958 1,745 2,317 577 515 107 122 93 8,434
editio
n 2,958 1,745 2,317 577 515 107 122 93 8,434
307 198 76 67 53 21 21 9 752
editio
n 307 198 76 67 53 21 21 9 752
Teacher of the sight-impaired 94 42 26 10 13 9 3 9 206editio
n Teacher of the sight-impaired 94 42 26 10 13 9 3 9 206
125 88 92 66 50 12 22 92 547editio
n
125 88 92 66 50 12 22 92 547829 287 633 61 43 119 40 9 2,021ed
ition
829 287 633 61 43 119 40 9 2,021
avail
able2,958 1,745 2,317 577 515 107 122 93 8,434
avail
able2,958 1,745 2,317 577 515 107 122 93 8,434
307 198 76 67 53 21 21 9 752
avail
able307 198 76 67 53 21 21 9 752
Teacher of the sight-impaired 94 42 26 10 13 9 3 9 206
avail
ableTeacher of the sight-impaired 94 42 26 10 13 9 3 9 206
125 88 92 66 50 12 22 92 547
avail
able125 88 92 66 50 12 22 92 547
829 287 633 61 43 119 40 9 2,021
avail
able
829 287 633 61 43 119 40 9 2,0211,022 1,604 280 883 432 97 85 10 4,413
avail
able
1,022 1,604 280 883 432 97 85 10 4,4131,994 4,729 1,326 913 504 171 127 98 9,862
avail
able
1,994 4,729 1,326 913 504 171 127 98 9,8627,329 8,693 4,750 2,577 1,610 536 420 320 26,235
avail
able
7,329 8,693 4,750 2,577 1,610 536 420 320 26,235
Aged or disabled person carer 10,533 12,255 8,164 4,718 5,450 1,790 684 317 43,911
avail
able
Aged or disabled person carer 10,533 12,255 8,164 4,718 5,450 1,790 684 317 43,911
avail
able
194 133 69 35 32 11 23 — 497avail
able
194 133 69 35 32 11 23 — 4972,050 2,281 1,066 723 905 185 140 65 7,415av
ailab
le
2,050 2,281 1,066 723 905 185 140 65 7,4154,326 3,596 2,126 1,343 1,140 345 264 244 13,384av
ailab
le
4,326 3,596 2,126 1,343 1,140 345 264 244 13,384518 224 134 98 132 53 33 16 1,208av
ailab
le
518 224 134 98 132 53 33 16 1,208
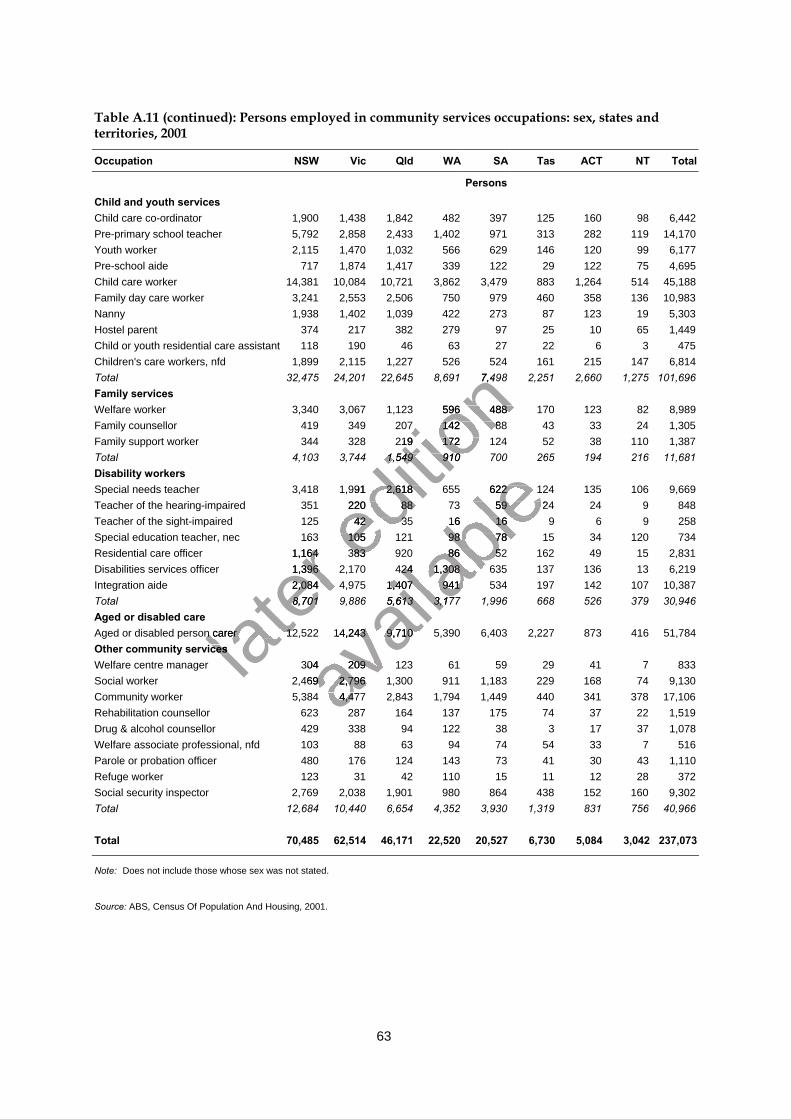
63
Table A.11 (continued): Persons employed in community services occupations: sex, states andterritories, 2001
Occupation NSW Vic Qld WA SA Tas ACT NT Total
Persons
Child and youth servicesChild care co-ordinator 1,900 1,438 1,842 482 397 125 160 98 6,442Pre-primary school teacher 5,792 2,858 2,433 1,402 971 313 282 119 14,170Youth worker 2,115 1,470 1,032 566 629 146 120 99 6,177Pre-school aide 717 1,874 1,417 339 122 29 122 75 4,695Child care worker 14,381 10,084 10,721 3,862 3,479 883 1,264 514 45,188Family day care worker 3,241 2,553 2,506 750 979 460 358 136 10,983Nanny 1,938 1,402 1,039 422 273 87 123 19 5,303Hostel parent 374 217 382 279 97 25 10 65 1,449Child or youth residential care assistant 118 190 46 63 27 22 6 3 475Children's care workers, nfd 1,899 2,115 1,227 526 524 161 215 147 6,814Total 32,475 24,201 22,645 8,691 7,498 2,251 2,660 1,275 101,696Family servicesWelfare worker 3,340 3,067 1,123 596 488 170 123 82 8,989Family counsellor 419 349 207 142 88 43 33 24 1,305Family support worker 344 328 219 172 124 52 38 110 1,387Total 4,103 3,744 1,549 910 700 265 194 216 11,681Disability workersSpecial needs teacher 3,418 1,991 2,618 655 622 124 135 106 9,669Teacher of the hearing-impaired 351 220 88 73 59 24 24 9 848Teacher of the sight-impaired 125 42 35 16 16 9 6 9 258Special education teacher, nec 163 105 121 98 78 15 34 120 734Residential care officer 1,164 383 920 86 52 162 49 15 2,831Disabilities services officer 1,396 2,170 424 1,308 635 137 136 13 6,219Integration aide 2,084 4,975 1,407 941 534 197 142 107 10,387Total 8,701 9,886 5,613 3,177 1,996 668 526 379 30,946Aged or disabled careAged or disabled person carer 12,522 14,243 9,710 5,390 6,403 2,227 873 416 51,784Other community servicesWelfare centre manager 304 209 123 61 59 29 41 7 833Social worker 2,469 2,796 1,300 911 1,183 229 168 74 9,130Community worker 5,384 4,477 2,843 1,794 1,449 440 341 378 17,106Rehabilitation counsellor 623 287 164 137 175 74 37 22 1,519Drug & alcohol counsellor 429 338 94 122 38 3 17 37 1,078Welfare associate professional, nfd 103 88 63 94 74 54 33 7 516Parole or probation officer 480 176 124 143 73 41 30 43 1,110Refuge worker 123 31 42 110 15 11 12 28 372Social security inspector 2,769 2,038 1,901 980 864 438 152 160 9,302Total 12,684 10,440 6,654 4,352 3,930 1,319 831 756 40,966
Total 70,485 62,514 46,171 22,520 20,527 6,730 5,084 3,042 237,073
Note: Does not include those whose sex was not stated.
Source: ABS, Census Of Population And Housing, 2001.
later 163 105 121 98 78 15 34 120 734
later 163 105 121 98 78 15 34 120 734
1,164 383 920 86 52 162 49 15 2,831
later
1,164 383 920 86 52 162 49 15 2,8311,396 2,170 424 1,308 635 137 136 13 6,219
later
1,396 2,170 424 1,308 635 137 136 13 6,2192,084 4,975 1,407 941 534 197 142 107 10,387
later 2,084 4,975 1,407 941 534 197 142 107 10,387
8,701 9,886 5,613 3,177 1,996 668 526 379 30,946
later 8,701 9,886 5,613 3,177 1,996 668 526 379 30,946
Aged or disabled person carer 12,522 14,243 9,710 5,390 6,403 2,227 873 416 51,784later
Aged or disabled person carer 12,522 14,243 9,710 5,390 6,403 2,227 873 416 51,784Other community services lat
er Other community services
editio
n 1,899 2,115 1,227 526 524 161 215 147 6,814
editio
n 1,899 2,115 1,227 526 524 161 215 147 6,814
32,475 24,201 22,645 8,691 7,498 2,251 2,660 1,275 101,696
editio
n 32,475 24,201 22,645 8,691 7,498 2,251 2,660 1,275 101,696
3,340 3,067 1,123 596 488 170 123 82 8,989
editio
n 3,340 3,067 1,123 596 488 170 123 82 8,989419 349 207 142 88 43 33 24 1,305
editio
n 419 349 207 142 88 43 33 24 1,305344 328 219 172 124 52 38 110 1,387
editio
n 344 328 219 172 124 52 38 110 1,387
4,103 3,744 1,549 910 700 265 194 216 11,681
editio
n 4,103 3,744 1,549 910 700 265 194 216 11,681
3,418 1,991 2,618 655 622 124 135 106 9,669
editio
n 3,418 1,991 2,618 655 622 124 135 106 9,669
351 220 88 73 59 24 24 9 848
editio
n 351 220 88 73 59 24 24 9 848
Teacher of the sight-impaired 125 42 35 16 16 9 6 9 258editio
n Teacher of the sight-impaired 125 42 35 16 16 9 6 9 258
163 105 121 98 78 15 34 120 734editio
n
163 105 121 98 78 15 34 120 7341,164 383 920 86 52 162 49 15 2,831ed
ition
1,164 383 920 86 52 162 49 15 2,831
avail
able3,418 1,991 2,618 655 622 124 135 106 9,669
avail
able3,418 1,991 2,618 655 622 124 135 106 9,669
351 220 88 73 59 24 24 9 848
avail
able351 220 88 73 59 24 24 9 848
Teacher of the sight-impaired 125 42 35 16 16 9 6 9 258
avail
ableTeacher of the sight-impaired 125 42 35 16 16 9 6 9 258
163 105 121 98 78 15 34 120 734
avail
able163 105 121 98 78 15 34 120 734
1,164 383 920 86 52 162 49 15 2,831
avail
able
1,164 383 920 86 52 162 49 15 2,8311,396 2,170 424 1,308 635 137 136 13 6,219
avail
able
1,396 2,170 424 1,308 635 137 136 13 6,2192,084 4,975 1,407 941 534 197 142 107 10,387
avail
able
2,084 4,975 1,407 941 534 197 142 107 10,3878,701 9,886 5,613 3,177 1,996 668 526 379 30,946
avail
able
8,701 9,886 5,613 3,177 1,996 668 526 379 30,946
Aged or disabled person carer 12,522 14,243 9,710 5,390 6,403 2,227 873 416 51,784
avail
able
Aged or disabled person carer 12,522 14,243 9,710 5,390 6,403 2,227 873 416 51,784
avail
able
304 209 123 61 59 29 41 7 833avail
able
304 209 123 61 59 29 41 7 8332,469 2,796 1,300 911 1,183 229 168 74 9,130av
ailab
le
2,469 2,796 1,300 911 1,183 229 168 74 9,1305,384 4,477 2,843 1,794 1,449 440 341 378 17,106av
ailab
le
5,384 4,477 2,843 1,794 1,449 440 341 378 17,106623 287 164 137 175 74 37 22 1,519av
ailab
le
623 287 164 137 175 74 37 22 1,519
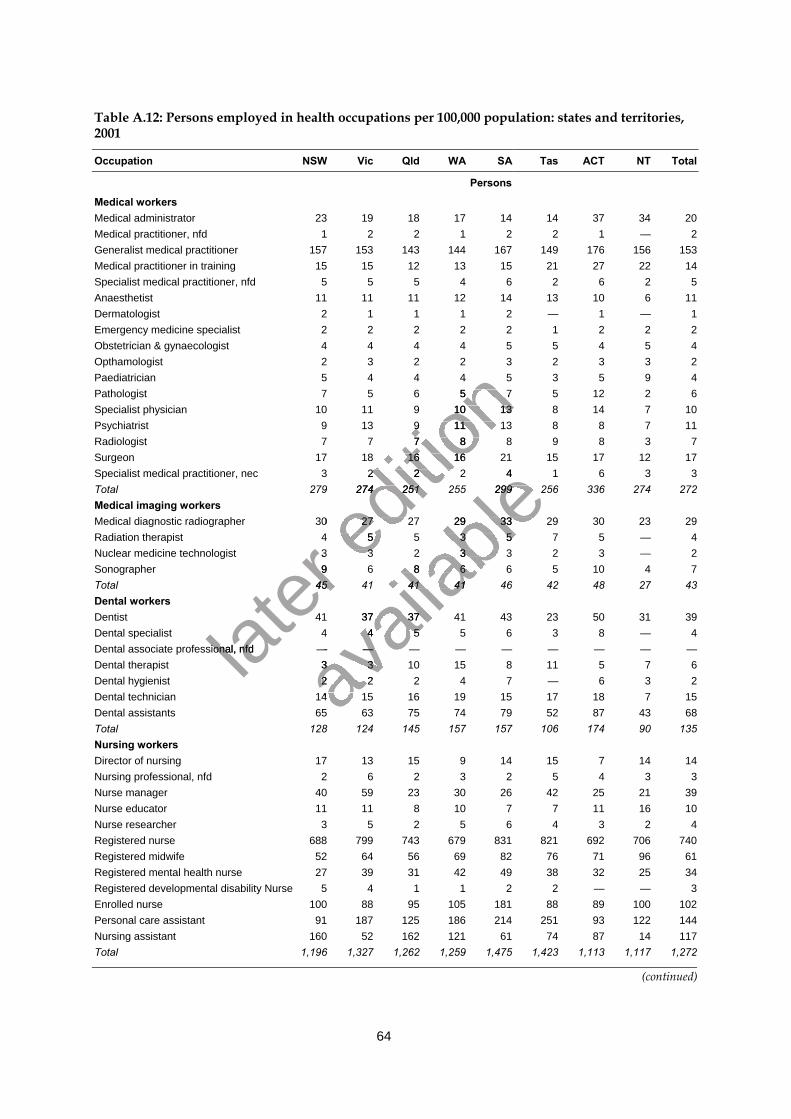
64
Table A.12: Persons employed in health occupations per 100,000 population: states and territories,2001
Occupation NSW Vic Qld WA SA Tas ACT NT Total
Persons
Medical workersMedical administrator 23 19 18 17 14 14 37 34 20Medical practitioner, nfd 1 2 2 1 2 2 1 — 2Generalist medical practitioner 157 153 143 144 167 149 176 156 153Medical practitioner in training 15 15 12 13 15 21 27 22 14Specialist medical practitioner, nfd 5 5 5 4 6 2 6 2 5Anaesthetist 11 11 11 12 14 13 10 6 11Dermatologist 2 1 1 1 2 — 1 — 1Emergency medicine specialist 2 2 2 2 2 1 2 2 2Obstetrician & gynaecologist 4 4 4 4 5 5 4 5 4Opthamologist 2 3 2 2 3 2 3 3 2Paediatrician 5 4 4 4 5 3 5 9 4Pathologist 7 5 6 5 7 5 12 2 6Specialist physician 10 11 9 10 13 8 14 7 10Psychiatrist 9 13 9 11 13 8 8 7 11Radiologist 7 7 7 8 8 9 8 3 7Surgeon 17 18 16 16 21 15 17 12 17Specialist medical practitioner, nec 3 2 2 2 4 1 6 3 3Total 279 274 251 255 299 256 336 274 272Medical imaging workersMedical diagnostic radiographer 30 27 27 29 33 29 30 23 29Radiation therapist 4 5 5 3 5 7 5 — 4Nuclear medicine technologist 3 3 2 3 3 2 3 — 2Sonographer 9 6 8 6 6 5 10 4 7Total 45 41 41 41 46 42 48 27 43Dental workersDentist 41 37 37 41 43 23 50 31 39Dental specialist 4 4 5 5 6 3 8 — 4Dental associate professional, nfd — — — — — — — — —Dental therapist 3 3 10 15 8 11 5 7 6Dental hygienist 2 2 2 4 7 — 6 3 2Dental technician 14 15 16 19 15 17 18 7 15Dental assistants 65 63 75 74 79 52 87 43 68Total 128 124 145 157 157 106 174 90 135Nursing workersDirector of nursing 17 13 15 9 14 15 7 14 14Nursing professional, nfd 2 6 2 3 2 5 4 3 3Nurse manager 40 59 23 30 26 42 25 21 39Nurse educator 11 11 8 10 7 7 11 16 10Nurse researcher 3 5 2 5 6 4 3 2 4Registered nurse 688 799 743 679 831 821 692 706 740Registered midwife 52 64 56 69 82 76 71 96 61Registered mental health nurse 27 39 31 42 49 38 32 25 34Registered developmental disability Nurse 5 4 1 1 2 2 — — 3Enrolled nurse 100 88 95 105 181 88 89 100 102Personal care assistant 91 187 125 186 214 251 93 122 144Nursing assistant 160 52 162 121 61 74 87 14 117Total 1,196 1,327 1,262 1,259 1,475 1,423 1,113 1,117 1,272
(continued)
later
3 3 2 3 3 2 3 — 2
later
3 3 2 3 3 2 3 — 29 6 8 6 6 5 10 4 7
later
9 6 8 6 6 5 10 4 745 41 41 41 46 42 48 27 43
later 45 41 41 41 46 42 48 27 43
Dental associate professional, nfdlater
Dental associate professional, nfd
editio
n 2 3 2 2 3 2 3 3 2
editio
n 2 3 2 2 3 2 3 3 25 4 4 4 5 3 5 9 4
editio
n 5 4 4 4 5 3 5 9 47 5 6 5 7 5 12 2 6
editio
n 7 5 6 5 7 5 12 2 610 11 9 10 13 8 14 7 10
editio
n 10 11 9 10 13 8 14 7 109 13 9 11 13 8 8 7 11
editio
n 9 13 9 11 13 8 8 7 117 7 7 8 8 9 8 3 7
editio
n 7 7 7 8 8 9 8 3 7
17 18 16 16 21 15 17 12 17
editio
n 17 18 16 16 21 15 17 12 17
3 2 2 2 4 1 6 3 3
editio
n 3 2 2 2 4 1 6 3 3
279 274 251 255 299 256 336 274 272
editio
n 279 274 251 255 299 256 336 274 272
30 27 27 29 33 29 30 23 29editio
n 30 27 27 29 33 29 30 23 29
4 5 5 3 5 7 5 — 4editio
n
4 5 5 3 5 7 5 — 43 3 2 3 3 2 3 — 2ed
ition
3 3 2 3 3 2 3 — 2
avail
able
3 2 2 2 4 1 6 3 3
avail
able
3 2 2 2 4 1 6 3 3279 274 251 255 299 256 336 274 272
avail
able279 274 251 255 299 256 336 274 272
30 27 27 29 33 29 30 23 29
avail
able30 27 27 29 33 29 30 23 29
4 5 5 3 5 7 5 — 4
avail
able4 5 5 3 5 7 5 — 4
3 3 2 3 3 2 3 — 2
avail
able
3 3 2 3 3 2 3 — 29 6 8 6 6 5 10 4 7
avail
able
9 6 8 6 6 5 10 4 745 41 41 41 46 42 48 27 43
avail
able
45 41 41 41 46 42 48 27 43
41 37 37 41 43 23 50 31 39
avail
able
41 37 37 41 43 23 50 31 394 4 5 5 6 3 8 — 4
avail
able
4 4 5 5 6 3 8 — 4
avail
able
— — — — — — — — —
avail
able
— — — — — — — — —3 3 10 15 8 11 5 7 6av
ailab
le
3 3 10 15 8 11 5 7 62 2 2 4 7 — 6 3 2av
ailab
le
2 2 2 4 7 — 6 3 2avail
able
14 15 16 19 15 17 18 7 15avail
able
14 15 16 19 15 17 18 7 1565 63 75 74 79 52 87 43 68av
ailab
le
65 63 75 74 79 52 87 43 68
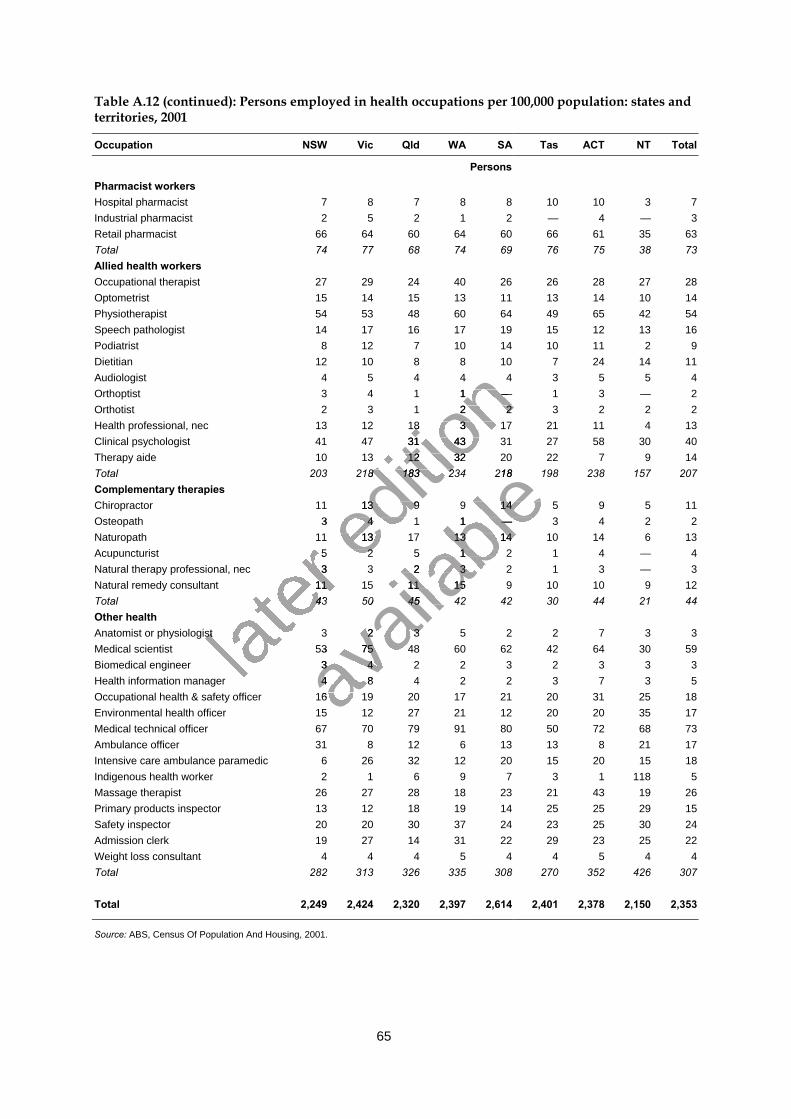
65
Table A.12 (continued): Persons employed in health occupations per 100,000 population: states andterritories, 2001
Occupation NSW Vic Qld WA SA Tas ACT NT Total
Persons
Pharmacist workersHospital pharmacist 7 8 7 8 8 10 10 3 7Industrial pharmacist 2 5 2 1 2 — 4 — 3Retail pharmacist 66 64 60 64 60 66 61 35 63Total 74 77 68 74 69 76 75 38 73Allied health workersOccupational therapist 27 29 24 40 26 26 28 27 28Optometrist 15 14 15 13 11 13 14 10 14Physiotherapist 54 53 48 60 64 49 65 42 54Speech pathologist 14 17 16 17 19 15 12 13 16Podiatrist 8 12 7 10 14 10 11 2 9Dietitian 12 10 8 8 10 7 24 14 11Audiologist 4 5 4 4 4 3 5 5 4Orthoptist 3 4 1 1 — 1 3 — 2Orthotist 2 3 1 2 2 3 2 2 2Health professional, nec 13 12 18 3 17 21 11 4 13Clinical psychologist 41 47 31 43 31 27 58 30 40Therapy aide 10 13 12 32 20 22 7 9 14Total 203 218 183 234 218 198 238 157 207Complementary therapiesChiropractor 11 13 9 9 14 5 9 5 11Osteopath 3 4 1 1 — 3 4 2 2Naturopath 11 13 17 13 14 10 14 6 13Acupuncturist 5 2 5 1 2 1 4 — 4Natural therapy professional, nec 3 3 2 3 2 1 3 — 3Natural remedy consultant 11 15 11 15 9 10 10 9 12Total 43 50 45 42 42 30 44 21 44Other healthAnatomist or physiologist 3 2 3 5 2 2 7 3 3Medical scientist 53 75 48 60 62 42 64 30 59Biomedical engineer 3 4 2 2 3 2 3 3 3Health information manager 4 8 4 2 2 3 7 3 5Occupational health & safety officer 16 19 20 17 21 20 31 25 18Environmental health officer 15 12 27 21 12 20 20 35 17Medical technical officer 67 70 79 91 80 50 72 68 73Ambulance officer 31 8 12 6 13 13 8 21 17Intensive care ambulance paramedic 6 26 32 12 20 15 20 15 18Indigenous health worker 2 1 6 9 7 3 1 118 5Massage therapist 26 27 28 18 23 21 43 19 26Primary products inspector 13 12 18 19 14 25 25 29 15Safety inspector 20 20 30 37 24 23 25 30 24Admission clerk 19 27 14 31 22 29 23 25 22Weight loss consultant 4 4 4 5 4 4 5 4 4Total 282 313 326 335 308 270 352 426 307
Total 2,249 2,424 2,320 2,397 2,614 2,401 2,378 2,150 2,353
Source: ABS, Census Of Population And Housing, 2001.
later
5 2 5 1 2 1 4 — 4
later
5 2 5 1 2 1 4 — 43 3 2 3 2 1 3 — 3
later
3 3 2 3 2 1 3 — 311 15 11 15 9 10 10 9 12
later 11 15 11 15 9 10 10 9 12
43 50 45 42 42 30 44 21 44
later 43 50 45 42 42 30 44 21 44
Anatomist or physiologist later
Anatomist or physiologist
editio
n 12 10 8 8 10 7 24 14 11
editio
n 12 10 8 8 10 7 24 14 114 5 4 4 4 3 5 5 4
editio
n 4 5 4 4 4 3 5 5 43 4 1 1 — 1 3 — 2
editio
n 3 4 1 1 — 1 3 — 22 3 1 2 2 3 2 2 2
editio
n 2 3 1 2 2 3 2 2 213 12 18 3 17 21 11 4 13
editio
n 13 12 18 3 17 21 11 4 1341 47 31 43 31 27 58 30 40
editio
n 41 47 31 43 31 27 58 30 4010 13 12 32 20 22 7 9 14
editio
n 10 13 12 32 20 22 7 9 14
203 218 183 234 218 198 238 157 207
editio
n 203 218 183 234 218 198 238 157 207
11 13 9 9 14 5 9 5 11
editio
n 11 13 9 9 14 5 9 5 113 4 1 1 — 3 4 2 2ed
ition
3 4 1 1 — 3 4 2 211 13 17 13 14 10 14 6 13ed
ition
11 13 17 13 14 10 14 6 135 2 5 1 2 1 4 — 4ed
ition
5 2 5 1 2 1 4 — 4
avail
able
203 218 183 234 218 198 238 157 207
avail
able
203 218 183 234 218 198 238 157 207
11 13 9 9 14 5 9 5 11
avail
able11 13 9 9 14 5 9 5 11
3 4 1 1 — 3 4 2 2
avail
able3 4 1 1 — 3 4 2 2
11 13 17 13 14 10 14 6 13
avail
able11 13 17 13 14 10 14 6 13
5 2 5 1 2 1 4 — 4
avail
able
5 2 5 1 2 1 4 — 43 3 2 3 2 1 3 — 3
avail
able
3 3 2 3 2 1 3 — 311 15 11 15 9 10 10 9 12
avail
able
11 15 11 15 9 10 10 9 1243 50 45 42 42 30 44 21 44
avail
able
43 50 45 42 42 30 44 21 44
avail
able
3 2 3 5 2 2 7 3 3
avail
able
3 2 3 5 2 2 7 3 353 75 48 60 62 42 64 30 59
avail
able
53 75 48 60 62 42 64 30 593 4 2 2 3 2 3 3 3av
ailab
le
3 4 2 2 3 2 3 3 34 8 4 2 2 3 7 3 5av
ailab
le
4 8 4 2 2 3 7 3 5avail
able
16 19 20 17 21 20 31 25 18avail
able
16 19 20 17 21 20 31 25 1815 12 27 21 12 20 20 35 17av
ailab
le
15 12 27 21 12 20 20 35 17
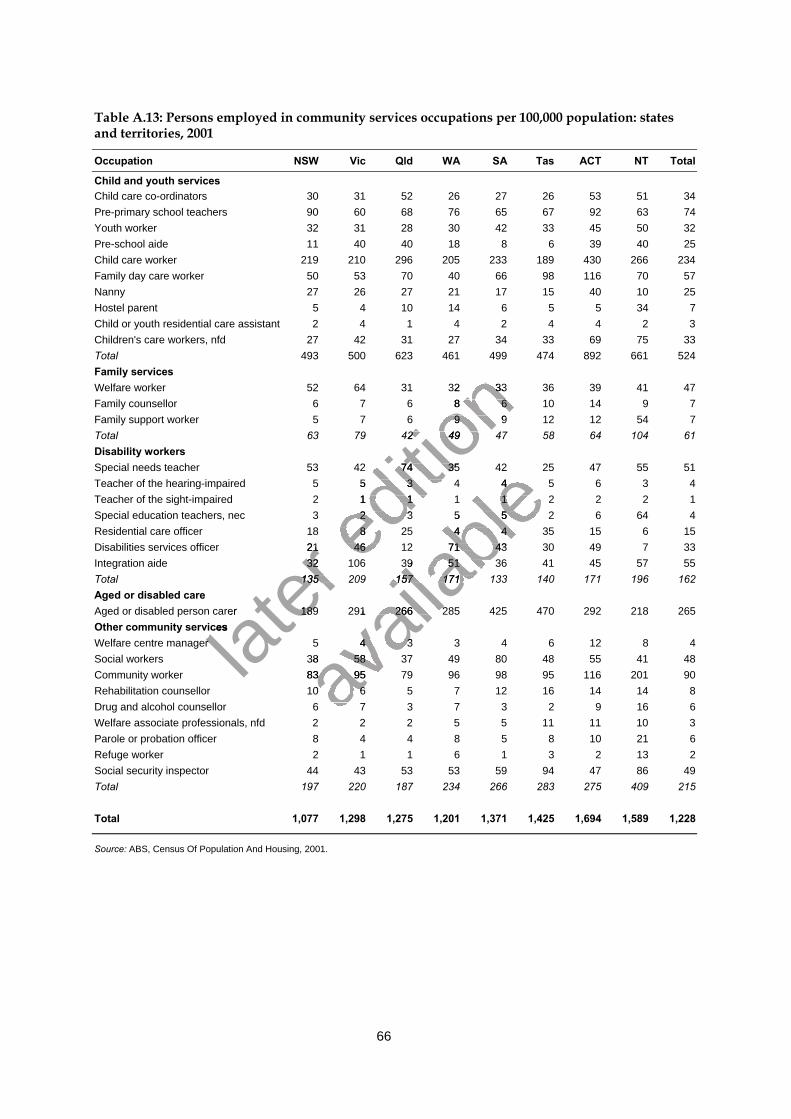
66
Table A.13: Persons employed in community services occupations per 100,000 population: statesand territories, 2001
Occupation NSW Vic Qld WA SA Tas ACT NT Total
Child and youth servicesChild care co-ordinators 30 31 52 26 27 26 53 51 34Pre-primary school teachers 90 60 68 76 65 67 92 63 74Youth worker 32 31 28 30 42 33 45 50 32Pre-school aide 11 40 40 18 8 6 39 40 25Child care worker 219 210 296 205 233 189 430 266 234Family day care worker 50 53 70 40 66 98 116 70 57Nanny 27 26 27 21 17 15 40 10 25Hostel parent 5 4 10 14 6 5 5 34 7Child or youth residential care assistant 2 4 1 4 2 4 4 2 3Children's care workers, nfd 27 42 31 27 34 33 69 75 33Total 493 500 623 461 499 474 892 661 524Family servicesWelfare worker 52 64 31 32 33 36 39 41 47Family counsellor 6 7 6 8 6 10 14 9 7Family support worker 5 7 6 9 9 12 12 54 7Total 63 79 42 49 47 58 64 104 61Disability workersSpecial needs teacher 53 42 74 35 42 25 47 55 51Teacher of the hearing-impaired 5 5 3 4 4 5 6 3 4Teacher of the sight-impaired 2 1 1 1 1 2 2 2 1Special education teachers, nec 3 2 3 5 5 2 6 64 4Residential care officer 18 8 25 4 4 35 15 6 15Disabilities services officer 21 46 12 71 43 30 49 7 33Integration aide 32 106 39 51 36 41 45 57 55Total 135 209 157 171 133 140 171 196 162Aged or disabled careAged or disabled person carer 189 291 266 285 425 470 292 218 265Other community servicesWelfare centre manager 5 4 3 3 4 6 12 8 4Social workers 38 58 37 49 80 48 55 41 48Community worker 83 95 79 96 98 95 116 201 90Rehabilitation counsellor 10 6 5 7 12 16 14 14 8Drug and alcohol counsellor 6 7 3 7 3 2 9 16 6Welfare associate professionals, nfd 2 2 2 5 5 11 11 10 3Parole or probation officer 8 4 4 8 5 8 10 21 6Refuge worker 2 1 1 6 1 3 2 13 2Social security inspector 44 43 53 53 59 94 47 86 49Total 197 220 187 234 266 283 275 409 215
Total 1,077 1,298 1,275 1,201 1,371 1,425 1,694 1,589 1,228
Source: ABS, Census Of Population And Housing, 2001.
later
21 46 12 71 43 30 49 7 33
later
21 46 12 71 43 30 49 7 3332 106 39 51 36 41 45 57 55
later
32 106 39 51 36 41 45 57 55135 209 157 171 133 140 171 196 162
later 135 209 157 171 133 140 171 196 162
Aged or disabled person carer
later Aged or disabled person carer 189 291 266 285 425 470 292 218 265
later 189 291 266 285 425 470 292 218 265
Other community services
later Other community services
Welfare centre manager later
Welfare centre manager
editio
n 52 64 31 32 33 36 39 41 47
editio
n 52 64 31 32 33 36 39 41 476 7 6 8 6 10 14 9 7
editio
n 6 7 6 8 6 10 14 9 75 7 6 9 9 12 12 54 7
editio
n 5 7 6 9 9 12 12 54 763 79 42 49 47 58 64 104 61
editio
n 63 79 42 49 47 58 64 104 61
53 42 74 35 42 25 47 55 51
editio
n 53 42 74 35 42 25 47 55 51
5 5 3 4 4 5 6 3 4
editio
n 5 5 3 4 4 5 6 3 42 1 1 1 1 2 2 2 1
editio
n 2 1 1 1 1 2 2 2 13 2 3 5 5 2 6 64 4ed
ition
3 2 3 5 5 2 6 64 418 8 25 4 4 35 15 6 15ed
ition
18 8 25 4 4 35 15 6 1521 46 12 71 43 30 49 7 33ed
ition
21 46 12 71 43 30 49 7 3332 106 39 51 36 41 45 57 55ed
ition
32 106 39 51 36 41 45 57 55
avail
able
53 42 74 35 42 25 47 55 51
avail
able
53 42 74 35 42 25 47 55 515 5 3 4 4 5 6 3 4
avail
able
5 5 3 4 4 5 6 3 42 1 1 1 1 2 2 2 1
avail
able2 1 1 1 1 2 2 2 1
3 2 3 5 5 2 6 64 4
avail
able3 2 3 5 5 2 6 64 4
18 8 25 4 4 35 15 6 15
avail
able18 8 25 4 4 35 15 6 15
21 46 12 71 43 30 49 7 33
avail
able
21 46 12 71 43 30 49 7 3332 106 39 51 36 41 45 57 55
avail
able
32 106 39 51 36 41 45 57 55135 209 157 171 133 140 171 196 162
avail
able
135 209 157 171 133 140 171 196 162
189 291 266 285 425 470 292 218 265
avail
able
189 291 266 285 425 470 292 218 265
avail
able
5 4 3 3 4 6 12 8 4
avail
able
5 4 3 3 4 6 12 8 438 58 37 49 80 48 55 41 48av
ailab
le
38 58 37 49 80 48 55 41 4883 95 79 96 98 95 116 201 90av
ailab
le
83 95 79 96 98 95 116 201 9010 6 5 7 12 16 14 14 8av
ailab
le
10 6 5 7 12 16 14 14 8avail
able
6 7 3 7 3 2 9 16 6avail
able
6 7 3 7 3 2 9 16 6
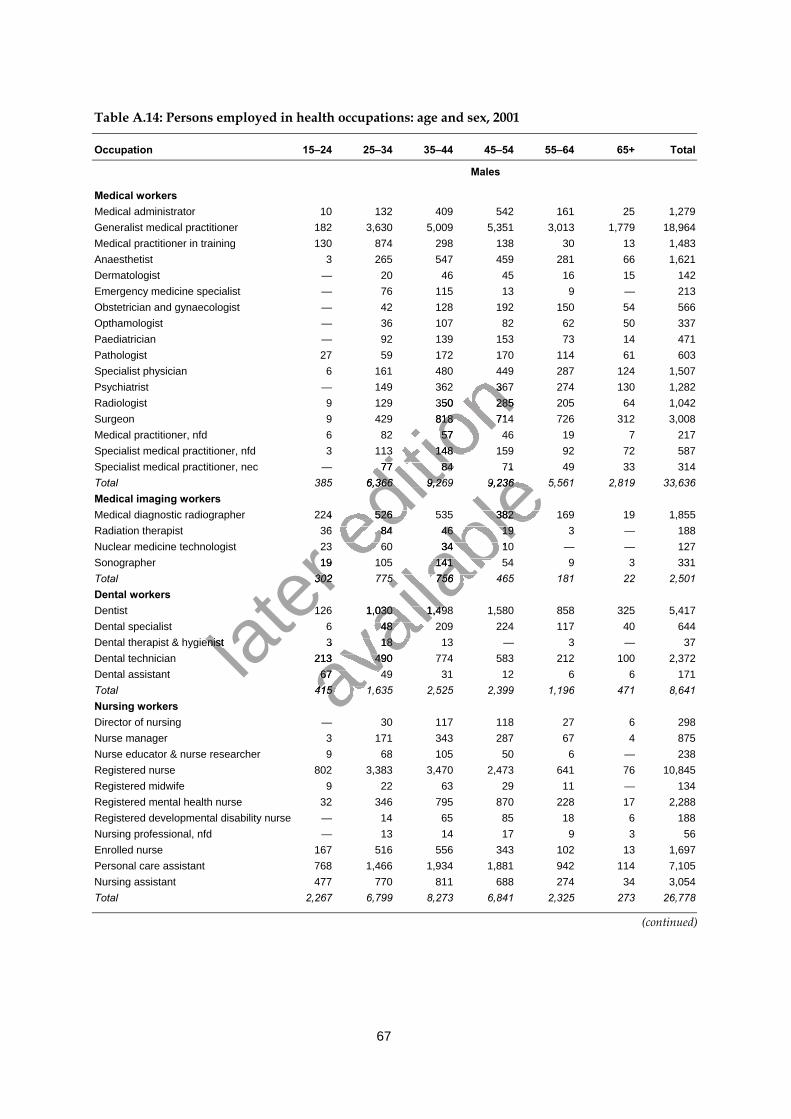
67
Table A.14: Persons employed in health occupations: age and sex, 2001
Occupation 15–24 25–34 35–44 45–54 55–64 65+ Total
Males
Medical workersMedical administrator 10 132 409 542 161 25 1,279Generalist medical practitioner 182 3,630 5,009 5,351 3,013 1,779 18,964Medical practitioner in training 130 874 298 138 30 13 1,483Anaesthetist 3 265 547 459 281 66 1,621Dermatologist — 20 46 45 16 15 142Emergency medicine specialist — 76 115 13 9 — 213Obstetrician and gynaecologist — 42 128 192 150 54 566Opthamologist — 36 107 82 62 50 337Paediatrician — 92 139 153 73 14 471Pathologist 27 59 172 170 114 61 603Specialist physician 6 161 480 449 287 124 1,507Psychiatrist — 149 362 367 274 130 1,282Radiologist 9 129 350 285 205 64 1,042Surgeon 9 429 818 714 726 312 3,008Medical practitioner, nfd 6 82 57 46 19 7 217Specialist medical practitioner, nfd 3 113 148 159 92 72 587Specialist medical practitioner, nec — 77 84 71 49 33 314Total 385 6,366 9,269 9,236 5,561 2,819 33,636Medical imaging workersMedical diagnostic radiographer 224 526 535 382 169 19 1,855Radiation therapist 36 84 46 19 3 — 188Nuclear medicine technologist 23 60 34 10 — — 127Sonographer 19 105 141 54 9 3 331Total 302 775 756 465 181 22 2,501Dental workersDentist 126 1,030 1,498 1,580 858 325 5,417Dental specialist 6 48 209 224 117 40 644Dental therapist & hygienist 3 18 13 — 3 — 37Dental technician 213 490 774 583 212 100 2,372Dental assistant 67 49 31 12 6 6 171Total 415 1,635 2,525 2,399 1,196 471 8,641Nursing workersDirector of nursing — 30 117 118 27 6 298Nurse manager 3 171 343 287 67 4 875Nurse educator & nurse researcher 9 68 105 50 6 — 238Registered nurse 802 3,383 3,470 2,473 641 76 10,845Registered midwife 9 22 63 29 11 — 134Registered mental health nurse 32 346 795 870 228 17 2,288Registered developmental disability nurse — 14 65 85 18 6 188Nursing professional, nfd — 13 14 17 9 3 56Enrolled nurse 167 516 556 343 102 13 1,697Personal care assistant 768 1,466 1,934 1,881 942 114 7,105Nursing assistant 477 770 811 688 274 34 3,054Total 2,267 6,799 8,273 6,841 2,325 273 26,778
(continued)
later
19 105 141 54
later
19 105 141 54302 775 756 465 181 22 2,501
later 302 775 756 465 181 22 2,501
126 1,030 1,498 1,580 858 325 5,417
later 126 1,030 1,498 1,580 858 325 5,417
Dental therapist & hygienist later
Dental therapist & hygienist
editio
n 6 161 480 449 287 124 1,507
editio
n 6 161 480 449 287 124 1,507
— 149 362 367 274 130 1,282
editio
n — 149 362 367 274 130 1,2829 129 350 285 205 64 1,042
editio
n 9 129 350 285 205 64 1,0429 429 818 714 726 312 3,008
editio
n 9 429 818 714 726 312 3,0086 82 57 46 19
editio
n 6 82 57 46 193 113 148 159 92 72 587
editio
n 3 113 148 159 92 72 587
— 77 84 71 49 33 314
editio
n — 77 84 71 49 33 314
385 6,366 9,269 9,236 5,561 2,819 33,636
editio
n 385 6,366 9,269 9,236 5,561 2,819 33,636
224 526 535 382 169 19 1,855editio
n 224 526 535 382 169 19 1,85536 84 46 19ed
ition
36 84 46 1923 60 34 10 — — 127ed
ition
23 60 34 10 — — 12719 105 141 54ed
ition
19 105 141 54
avail
able
— 77 84 71 49 33 314
avail
able
— 77 84 71 49 33 314385 6,366 9,269 9,236 5,561 2,819 33,636
avail
able
385 6,366 9,269 9,236 5,561 2,819 33,636
224 526 535 382 169 19 1,855
avail
able224 526 535 382 169 19 1,855
36 84 46 19
avail
able36 84 46 19
23 60 34 10 — — 127
avail
able
23 60 34 10 — — 12719 105 141 54
avail
able
19 105 141 54302 775 756 465 181 22 2,501
avail
able
302 775 756 465 181 22 2,501
126 1,030 1,498 1,580 858 325 5,417
avail
able
126 1,030 1,498 1,580 858 325 5,4176 48 209 224 117 40 644
avail
able
6 48 209 224 117 40 644
avail
able
3 18 13 —
avail
able
3 18 13 —213 490 774 583 212 100 2,372
avail
able
213 490 774 583 212 100 2,37267 49 31 12av
ailab
le
67 49 31 12415 1,635 2,525 2,399 1,196 471 8,641av
ailab
le
415 1,635 2,525 2,399 1,196 471 8,641
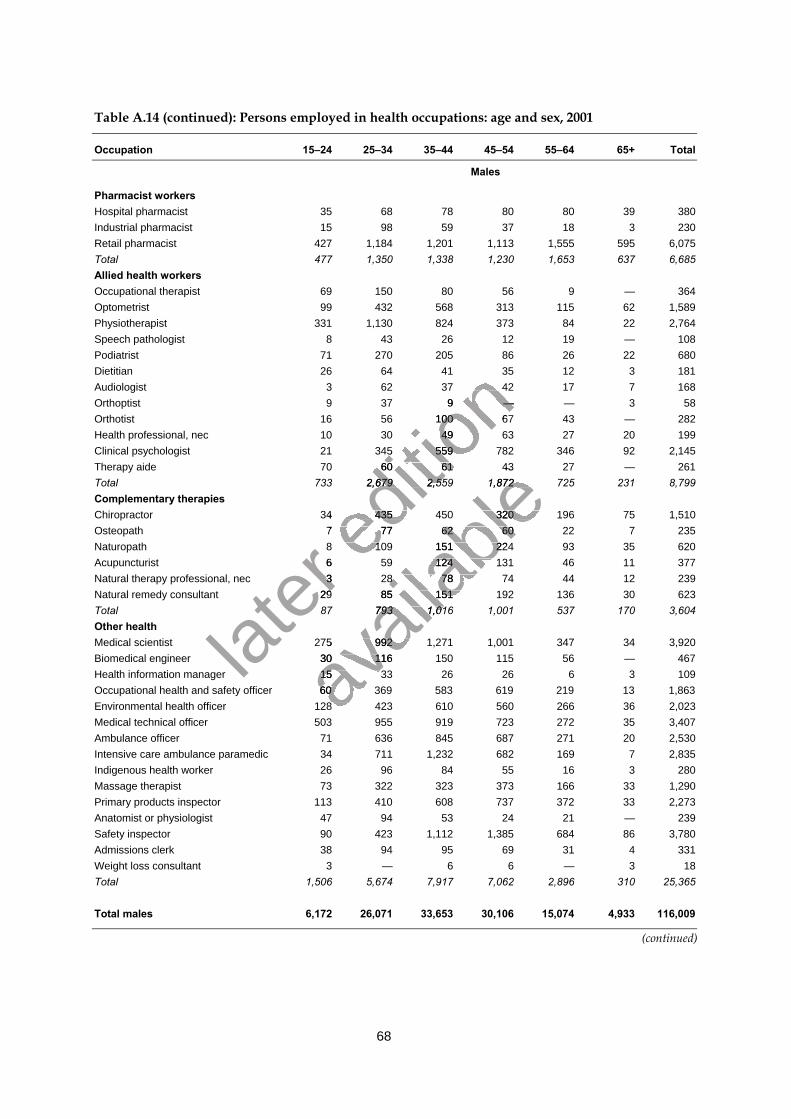
68
Table A.14 (continued): Persons employed in health occupations: age and sex, 2001
Occupation 15–24 25–34 35–44 45–54 55–64 65+ Total
Males
Pharmacist workersHospital pharmacist 35 68 78 80 80 39 380Industrial pharmacist 15 98 59 37 18 3 230Retail pharmacist 427 1,184 1,201 1,113 1,555 595 6,075Total 477 1,350 1,338 1,230 1,653 637 6,685Allied health workersOccupational therapist 69 150 80 56 9 — 364Optometrist 99 432 568 313 115 62 1,589Physiotherapist 331 1,130 824 373 84 22 2,764Speech pathologist 8 43 26 12 19 — 108Podiatrist 71 270 205 86 26 22 680Dietitian 26 64 41 35 12 3 181Audiologist 3 62 37 42 17 7 168Orthoptist 9 37 9 — — 3 58Orthotist 16 56 100 67 43 — 282Health professional, nec 10 30 49 63 27 20 199Clinical psychologist 21 345 559 782 346 92 2,145Therapy aide 70 60 61 43 27 — 261Total 733 2,679 2,559 1,872 725 231 8,799Complementary therapiesChiropractor 34 435 450 320 196 75 1,510Osteopath 7 77 62 60 22 7 235Naturopath 8 109 151 224 93 35 620Acupuncturist 6 59 124 131 46 11 377Natural therapy professional, nec 3 28 78 74 44 12 239Natural remedy consultant 29 85 151 192 136 30 623Total 87 793 1,016 1,001 537 170 3,604Other healthMedical scientist 275 992 1,271 1,001 347 34 3,920Biomedical engineer 30 116 150 115 56 — 467Health information manager 15 33 26 26 6 3 109Occupational health and safety officer 60 369 583 619 219 13 1,863Environmental health officer 128 423 610 560 266 36 2,023Medical technical officer 503 955 919 723 272 35 3,407Ambulance officer 71 636 845 687 271 20 2,530Intensive care ambulance paramedic 34 711 1,232 682 169 7 2,835Indigenous health worker 26 96 84 55 16 3 280Massage therapist 73 322 323 373 166 33 1,290Primary products inspector 113 410 608 737 372 33 2,273Anatomist or physiologist 47 94 53 24 21 — 239Safety inspector 90 423 1,112 1,385 684 86 3,780Admissions clerk 38 94 95 69 31 4 331Weight loss consultant 3 — 6 6 — 3 18Total 1,506 5,674 7,917 7,062 2,896 310 25,365
Total males 6,172 26,071 33,653 30,106 15,074 4,933 116,009
(continued)
later
6 59 124 131 46 11 377
later
6 59 124 131 46 11 3773 28 78 74 44 12 239
later 3 28 78 74 44 12 239
29 85 151 192 136 30 623
later 29 85 151 192 136 30 623
editio
n 26 64 41 35 12 3 181
editio
n 26 64 41 35 12 3 1813 62 37 42 17
editio
n 3 62 37 42 179 — —
editio
n 9 — —16 56 100 67 43 — 282
editio
n 16 56 100 67 43 — 28210 30 49 63 27 20 199
editio
n 10 30 49 63 27 20 19921 345 559 782 346 92 2,145
editio
n 21 345 559 782 346 92 2,14570 60 61 43 27 — 261
editio
n 70 60 61 43 27 — 261
733 2,679 2,559 1,872 725 231 8,799
editio
n 733 2,679 2,559 1,872 725 231 8,799
34 435 450 320 196 75 1,510editio
n 34 435 450 320 196 75 1,5107 77 62 60 22ed
ition
7 77 62 60 228 109 151 224 93 35 620ed
ition
8 109 151 224 93 35 6206 59 124 131 46 11 377ed
ition
6 59 124 131 46 11 377
avail
able
70 60 61 43 27 — 261
avail
able
70 60 61 43 27 — 261733 2,679 2,559 1,872 725 231 8,799
avail
able
733 2,679 2,559 1,872 725 231 8,799
34 435 450 320 196 75 1,510
avail
able34 435 450 320 196 75 1,510
7 77 62 60 22
avail
able7 77 62 60 22
8 109 151 224 93 35 620
avail
able
8 109 151 224 93 35 6206 59 124 131 46 11 377
avail
able
6 59 124 131 46 11 3773 28 78 74 44 12 239
avail
able
3 28 78 74 44 12 23929 85 151 192 136 30 623
avail
able
29 85 151 192 136 30 62387 793 1,016 1,001 537 170 3,604
avail
able
87 793 1,016 1,001 537 170 3,604
275 992 1,271 1,001 347 34 3,920
avail
able
275 992 1,271 1,001 347 34 3,920
avail
able
30 116 150 115 56 — 467
avail
able
30 116 150 115 56 — 46715 33 26 26av
ailab
le
15 33 26 26Occupational health and safety officer 60 369 583 619 219 13 1,863av
ailab
le
Occupational health and safety officer 60 369 583 619 219 13 1,863128 423 610 560 266 36 2,023av
ailab
le
128 423 610 560 266 36 2,023
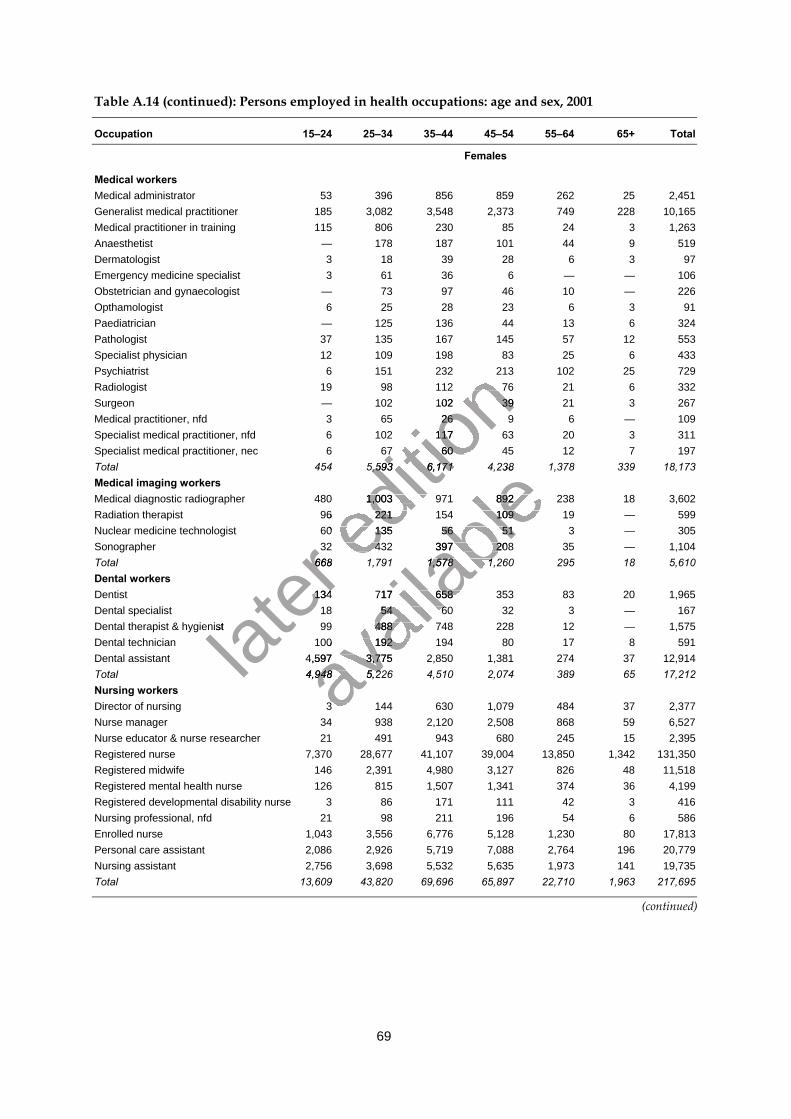
69
Table A.14 (continued): Persons employed in health occupations: age and sex, 2001
Occupation 15–24 25–34 35–44 45–54 55–64 65+ Total
Females
Medical workersMedical administrator 53 396 856 859 262 25 2,451Generalist medical practitioner 185 3,082 3,548 2,373 749 228 10,165Medical practitioner in training 115 806 230 85 24 3 1,263Anaesthetist — 178 187 101 44 9 519Dermatologist 3 18 39 28 6 3 97Emergency medicine specialist 3 61 36 6 — — 106Obstetrician and gynaecologist — 73 97 46 10 — 226Opthamologist 6 25 28 23 6 3 91Paediatrician — 125 136 44 13 6 324Pathologist 37 135 167 145 57 12 553Specialist physician 12 109 198 83 25 6 433Psychiatrist 6 151 232 213 102 25 729Radiologist 19 98 112 76 21 6 332Surgeon — 102 102 39 21 3 267Medical practitioner, nfd 3 65 26 9 6 — 109Specialist medical practitioner, nfd 6 102 117 63 20 3 311Specialist medical practitioner, nec 6 67 60 45 12 7 197Total 454 5,593 6,171 4,238 1,378 339 18,173Medical imaging workersMedical diagnostic radiographer 480 1,003 971 892 238 18 3,602Radiation therapist 96 221 154 109 19 — 599Nuclear medicine technologist 60 135 56 51 3 — 305Sonographer 32 432 397 208 35 — 1,104Total 668 1,791 1,578 1,260 295 18 5,610Dental workersDentist 134 717 658 353 83 20 1,965Dental specialist 18 54 60 32 3 — 167Dental therapist & hygienist 99 488 748 228 12 — 1,575Dental technician 100 192 194 80 17 8 591Dental assistant 4,597 3,775 2,850 1,381 274 37 12,914Total 4,948 5,226 4,510 2,074 389 65 17,212Nursing workersDirector of nursing 3 144 630 1,079 484 37 2,377Nurse manager 34 938 2,120 2,508 868 59 6,527Nurse educator & nurse researcher 21 491 943 680 245 15 2,395Registered nurse 7,370 28,677 41,107 39,004 13,850 1,342 131,350Registered midwife 146 2,391 4,980 3,127 826 48 11,518Registered mental health nurse 126 815 1,507 1,341 374 36 4,199Registered developmental disability nurse 3 86 171 111 42 3 416Nursing professional, nfd 21 98 211 196 54 6 586Enrolled nurse 1,043 3,556 6,776 5,128 1,230 80 17,813Personal care assistant 2,086 2,926 5,719 7,088 2,764 196 20,779Nursing assistant 2,756 3,698 5,532 5,635 1,973 141 19,735Total 13,609 43,820 69,696 65,897 22,710 1,963 217,695
(continued)
later
32 432 397 208 35 — 1,104
later
32 432 397 208 35 — 1,104668 1,791 1,578 1,260 295 18 5,610
later
668 1,791 1,578 1,260 295 18 5,610
134 717 658 353 83 20 1,965
later 134 717 658 353 83 20 1,965
Dental therapist & hygienist
later Dental therapist & hygienist
editio
n 6 151 232 213 102 25 729
editio
n 6 151 232 213 102 25 729
19 98 112 76 21
editio
n 19 98 112 76 21— 102 102 39 21
editio
n — 102 102 39 213 65 26
editio
n 3 65 266 102 117 63 20
editio
n 6 102 117 63 206 67 60 45 12
editio
n 6 67 60 45 12
454 5,593 6,171 4,238 1,378 339 18,173
editio
n 454 5,593 6,171 4,238 1,378 339 18,173
480 1,003 971 892 238 18 3,602
editio
n 480 1,003 971 892 238 18 3,60296 221 154 109 19 — 599ed
ition
96 221 154 109 19 — 59960 135 56 51ed
ition
60 135 56 5132 432 397 208 35 — 1,104ed
ition
32 432 397 208 35 — 1,104668 1,791 1,578 1,260 295 18 5,610ed
ition
668 1,791 1,578 1,260 295 18 5,610
avail
able
454 5,593 6,171 4,238 1,378 339 18,173
avail
able
454 5,593 6,171 4,238 1,378 339 18,173
480 1,003 971 892 238 18 3,602
avail
able480 1,003 971 892 238 18 3,602
96 221 154 109 19 — 599
avail
able96 221 154 109 19 — 599
60 135 56 51
avail
able60 135 56 51
32 432 397 208 35 — 1,104
avail
able
32 432 397 208 35 — 1,104668 1,791 1,578 1,260 295 18 5,610
avail
able
668 1,791 1,578 1,260 295 18 5,610
134 717 658 353 83 20 1,965
avail
able
134 717 658 353 83 20 1,96518 54 60 32
avail
able
18 54 60 32
avail
able
99 488 748 228 12 — 1,575
avail
able
99 488 748 228 12 — 1,575100 192 194 80 17
avail
able
100 192 194 80 174,597 3,775 2,850 1,381 274 37 12,914
avail
able
4,597 3,775 2,850 1,381 274 37 12,9144,948 5,226 4,510 2,074 389 65 17,212av
ailab
le
4,948 5,226 4,510 2,074 389 65 17,212avail
able
3 144 630 1,079 484 37 2,377avail
able
3 144 630 1,079 484 37 2,377
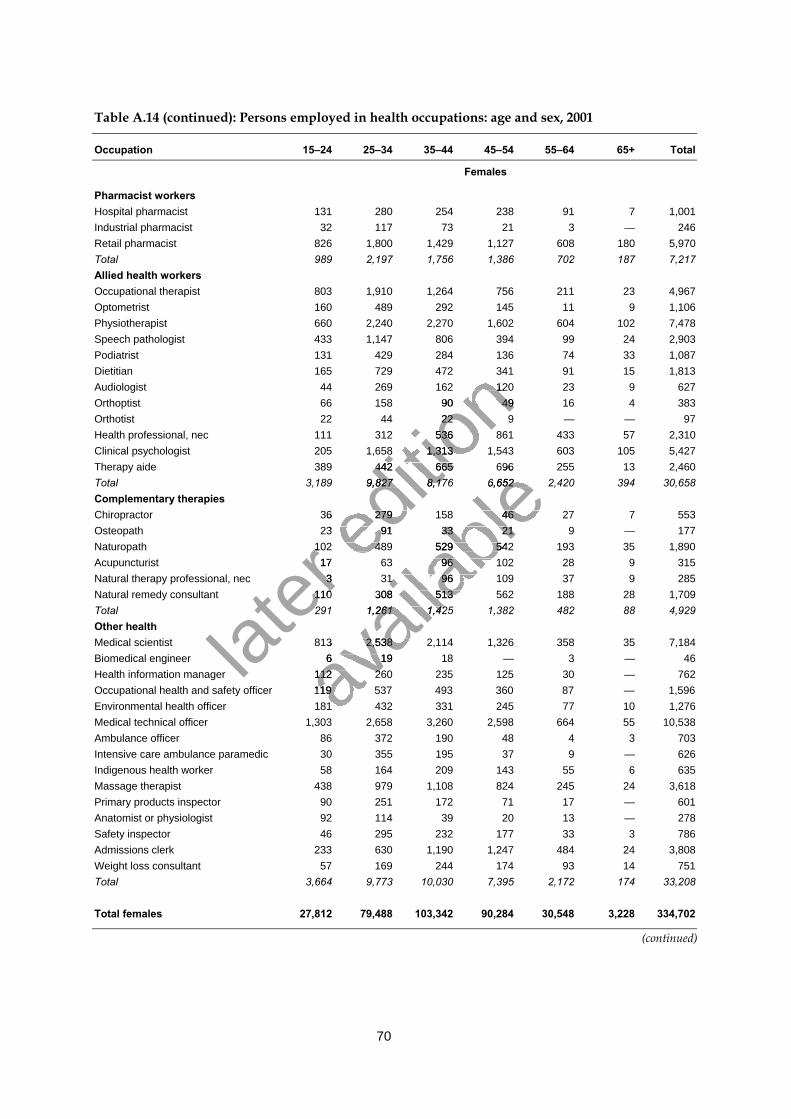
70
Table A.14 (continued): Persons employed in health occupations: age and sex, 2001
Occupation 15–24 25–34 35–44 45–54 55–64 65+ Total
Females
Pharmacist workersHospital pharmacist 131 280 254 238 91 7 1,001Industrial pharmacist 32 117 73 21 3 — 246Retail pharmacist 826 1,800 1,429 1,127 608 180 5,970Total 989 2,197 1,756 1,386 702 187 7,217Allied health workersOccupational therapist 803 1,910 1,264 756 211 23 4,967Optometrist 160 489 292 145 11 9 1,106Physiotherapist 660 2,240 2,270 1,602 604 102 7,478Speech pathologist 433 1,147 806 394 99 24 2,903Podiatrist 131 429 284 136 74 33 1,087Dietitian 165 729 472 341 91 15 1,813Audiologist 44 269 162 120 23 9 627Orthoptist 66 158 90 49 16 4 383Orthotist 22 44 22 9 — — 97Health professional, nec 111 312 536 861 433 57 2,310Clinical psychologist 205 1,658 1,313 1,543 603 105 5,427Therapy aide 389 442 665 696 255 13 2,460Total 3,189 9,827 8,176 6,652 2,420 394 30,658Complementary therapiesChiropractor 36 279 158 46 27 7 553Osteopath 23 91 33 21 9 — 177Naturopath 102 489 529 542 193 35 1,890Acupuncturist 17 63 96 102 28 9 315Natural therapy professional, nec 3 31 96 109 37 9 285Natural remedy consultant 110 308 513 562 188 28 1,709Total 291 1,261 1,425 1,382 482 88 4,929Other healthMedical scientist 813 2,538 2,114 1,326 358 35 7,184Biomedical engineer 6 19 18 — 3 — 46Health information manager 112 260 235 125 30 — 762Occupational health and safety officer 119 537 493 360 87 — 1,596Environmental health officer 181 432 331 245 77 10 1,276Medical technical officer 1,303 2,658 3,260 2,598 664 55 10,538Ambulance officer 86 372 190 48 4 3 703Intensive care ambulance paramedic 30 355 195 37 9 — 626Indigenous health worker 58 164 209 143 55 6 635Massage therapist 438 979 1,108 824 245 24 3,618Primary products inspector 90 251 172 71 17 — 601Anatomist or physiologist 92 114 39 20 13 — 278Safety inspector 46 295 232 177 33 3 786Admissions clerk 233 630 1,190 1,247 484 24 3,808Weight loss consultant 57 169 244 174 93 14 751Total 3,664 9,773 10,030 7,395 2,172 174 33,208
Total females 27,812 79,488 103,342 90,284 30,548 3,228 334,702
(continued)
later
102 489 529 542 193 35 1,890
later
102 489 529 542 193 35 1,89017 63 96 102 28
later
17 63 96 102 283 31 96 109 37
later 3 31 96 109 37
110 308 513 562 188 28 1,709
later 110 308 513 562 188 28 1,709
291 1,261 1,425 1,382 482 88 4,929
later 291 1,261 1,425 1,382 482 88 4,929
editio
n 165 729 472 341 91 15 1,813
editio
n 165 729 472 341 91 15 1,81344 269 162 120 23
editio
n 44 269 162 120 2366 158 90 49 16
editio
n 66 158 90 49 1622 44 22
editio
n 22 44 22111 312 536 861 433 57 2,310
editio
n 111 312 536 861 433 57 2,310205 1,658 1,313 1,543 603 105 5,427
editio
n 205 1,658 1,313 1,543 603 105 5,427389 442 665 696 255 13 2,460
editio
n 389 442 665 696 255 13 2,460
3,189 9,827 8,176 6,652 2,420 394 30,658
editio
n 3,189 9,827 8,176 6,652 2,420 394 30,658
36 279 158 46 27editio
n 36 279 158 46 2723 91 33 21ed
ition
23 91 33 21102 489 529 542 193 35 1,890ed
ition
102 489 529 542 193 35 1,89017 63 96 102 28ed
ition
17 63 96 102 28
avail
able
389 442 665 696 255 13 2,460
avail
able
389 442 665 696 255 13 2,4603,189 9,827 8,176 6,652 2,420 394 30,658
avail
able
3,189 9,827 8,176 6,652 2,420 394 30,658
36 279 158 46 27
avail
able36 279 158 46 27
23 91 33 21
avail
able23 91 33 21
102 489 529 542 193 35 1,890
avail
able
102 489 529 542 193 35 1,89017 63 96 102 28
avail
able
17 63 96 102 283 31 96 109 37
avail
able
3 31 96 109 37110 308 513 562 188 28 1,709
avail
able
110 308 513 562 188 28 1,709291 1,261 1,425 1,382 482 88 4,929
avail
able
291 1,261 1,425 1,382 482 88 4,929
avail
able
813 2,538 2,114 1,326 358 35 7,184
avail
able
813 2,538 2,114 1,326 358 35 7,1846 19 18 —
avail
able
6 19 18 —112 260 235 125 30 — 762av
ailab
le
112 260 235 125 30 — 762Occupational health and safety officer 119 537 493 360 87 — 1,596av
ailab
le
Occupational health and safety officer 119 537 493 360 87 — 1,596avail
able
181 432 331 245 77 10 1,276avail
able
181 432 331 245 77 10 1,276
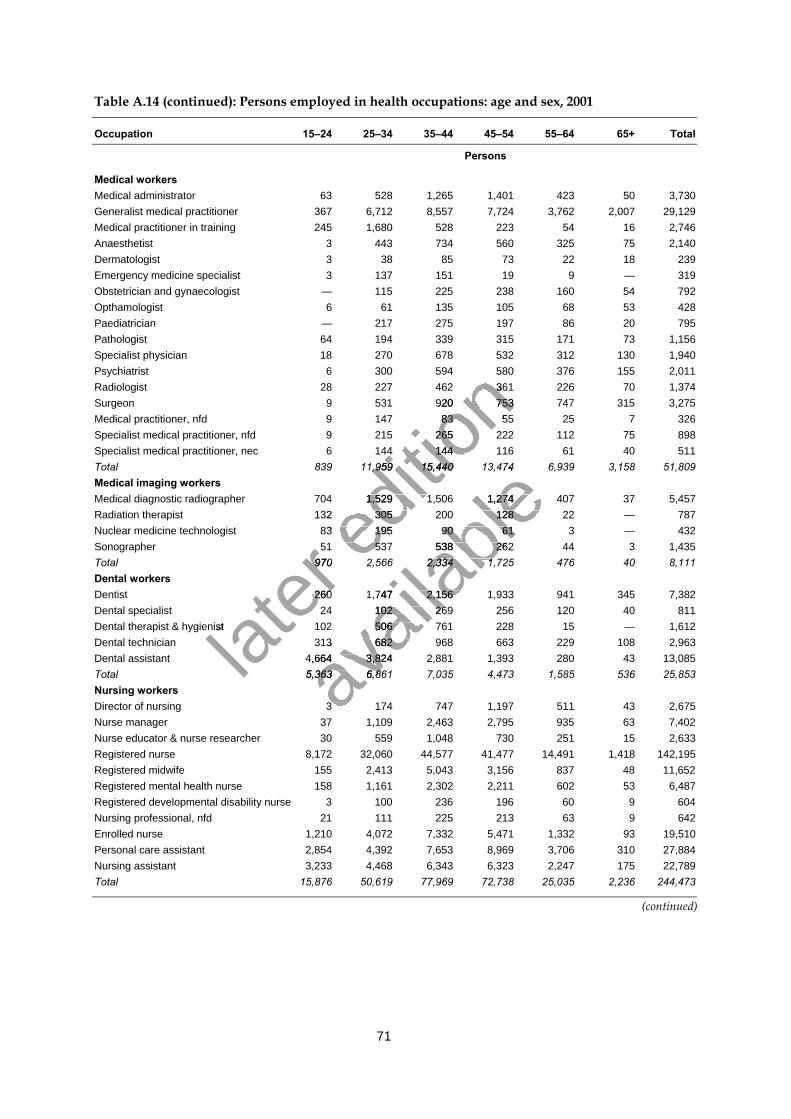
71
Table A.14 (continued): Persons employed in health occupations: age and sex, 2001
Occupation 15–24 25–34 35–44 45–54 55–64 65+ Total
Persons
Medical workersMedical administrator 63 528 1,265 1,401 423 50 3,730Generalist medical practitioner 367 6,712 8,557 7,724 3,762 2,007 29,129Medical practitioner in training 245 1,680 528 223 54 16 2,746Anaesthetist 3 443 734 560 325 75 2,140Dermatologist 3 38 85 73 22 18 239Emergency medicine specialist 3 137 151 19 9 — 319Obstetrician and gynaecologist — 115 225 238 160 54 792Opthamologist 6 61 135 105 68 53 428Paediatrician — 217 275 197 86 20 795Pathologist 64 194 339 315 171 73 1,156Specialist physician 18 270 678 532 312 130 1,940Psychiatrist 6 300 594 580 376 155 2,011Radiologist 28 227 462 361 226 70 1,374Surgeon 9 531 920 753 747 315 3,275Medical practitioner, nfd 9 147 83 55 25 7 326Specialist medical practitioner, nfd 9 215 265 222 112 75 898Specialist medical practitioner, nec 6 144 144 116 61 40 511Total 839 11,959 15,440 13,474 6,939 3,158 51,809Medical imaging workersMedical diagnostic radiographer 704 1,529 1,506 1,274 407 37 5,457Radiation therapist 132 305 200 128 22 — 787Nuclear medicine technologist 83 195 90 61 3 — 432Sonographer 51 537 538 262 44 3 1,435Total 970 2,566 2,334 1,725 476 40 8,111Dental workersDentist 260 1,747 2,156 1,933 941 345 7,382Dental specialist 24 102 269 256 120 40 811Dental therapist & hygienist 102 506 761 228 15 — 1,612Dental technician 313 682 968 663 229 108 2,963Dental assistant 4,664 3,824 2,881 1,393 280 43 13,085Total 5,363 6,861 7,035 4,473 1,585 536 25,853Nursing workersDirector of nursing 3 174 747 1,197 511 43 2,675Nurse manager 37 1,109 2,463 2,795 935 63 7,402Nurse educator & nurse researcher 30 559 1,048 730 251 15 2,633Registered nurse 8,172 32,060 44,577 41,477 14,491 1,418 142,195Registered midwife 155 2,413 5,043 3,156 837 48 11,652Registered mental health nurse 158 1,161 2,302 2,211 602 53 6,487Registered developmental disability nurse 3 100 236 196 60 9 604Nursing professional, nfd 21 111 225 213 63 9 642Enrolled nurse 1,210 4,072 7,332 5,471 1,332 93 19,510Personal care assistant 2,854 4,392 7,653 8,969 3,706 310 27,884Nursing assistant 3,233 4,468 6,343 6,323 2,247 175 22,789Total 15,876 50,619 77,969 72,738 25,035 2,236 244,473
(continued)
later
970 2,566 2,334 1,725 476 40 8,111
later
970 2,566 2,334 1,725 476 40 8,111
260 1,747 2,156 1,933 941 345 7,382
later 260 1,747 2,156 1,933 941 345 7,382
Dental therapist & hygienist
later Dental therapist & hygienist
editio
n 6 300 594 580 376 155 2,011
editio
n 6 300 594 580 376 155 2,011
28 227 462 361 226 70 1,374
editio
n 28 227 462 361 226 70 1,3749 531 920 753 747 315 3,275
editio
n 9 531 920 753 747 315 3,2759 147 83 55 25
editio
n 9 147 83 55 259 215 265 222 112 75 898
editio
n 9 215 265 222 112 75 8986 144 144 116 61 40 511
editio
n 6 144 144 116 61 40 511
839 11,959 15,440 13,474 6,939 3,158 51,809
editio
n 839 11,959 15,440 13,474 6,939 3,158 51,809
704 1,529 1,506 1,274 407 37 5,457
editio
n 704 1,529 1,506 1,274 407 37 5,457132 305 200 128 22 — 787ed
ition
132 305 200 128 22 — 78783 195 90 61ed
ition
83 195 90 6151 537 538 262 44ed
ition
51 537 538 262 44970 2,566 2,334 1,725 476 40 8,111ed
ition
970 2,566 2,334 1,725 476 40 8,111
avail
able
839 11,959 15,440 13,474 6,939 3,158 51,809
avail
able
839 11,959 15,440 13,474 6,939 3,158 51,809
704 1,529 1,506 1,274 407 37 5,457
avail
able704 1,529 1,506 1,274 407 37 5,457
132 305 200 128 22 — 787
avail
able132 305 200 128 22 — 787
83 195 90 61
avail
able83 195 90 61
51 537 538 262 44
avail
able
51 537 538 262 44970 2,566 2,334 1,725 476 40 8,111
avail
able
970 2,566 2,334 1,725 476 40 8,111
260 1,747 2,156 1,933 941 345 7,382
avail
able
260 1,747 2,156 1,933 941 345 7,38224 102 269 256 120 40 811
avail
able
24 102 269 256 120 40 811102 506 761 228 15 — 1,612
avail
able
102 506 761 228 15 — 1,612
avail
able
313 682 968 663 229 108 2,963
avail
able
313 682 968 663 229 108 2,9634,664 3,824 2,881 1,393 280 43 13,085
avail
able
4,664 3,824 2,881 1,393 280 43 13,0855,363 6,861 7,035 4,473 1,585 536 25,853av
ailab
le
5,363 6,861 7,035 4,473 1,585 536 25,853
3 174 747 1,197 511 43 2,675avail
able
3 174 747 1,197 511 43 2,675
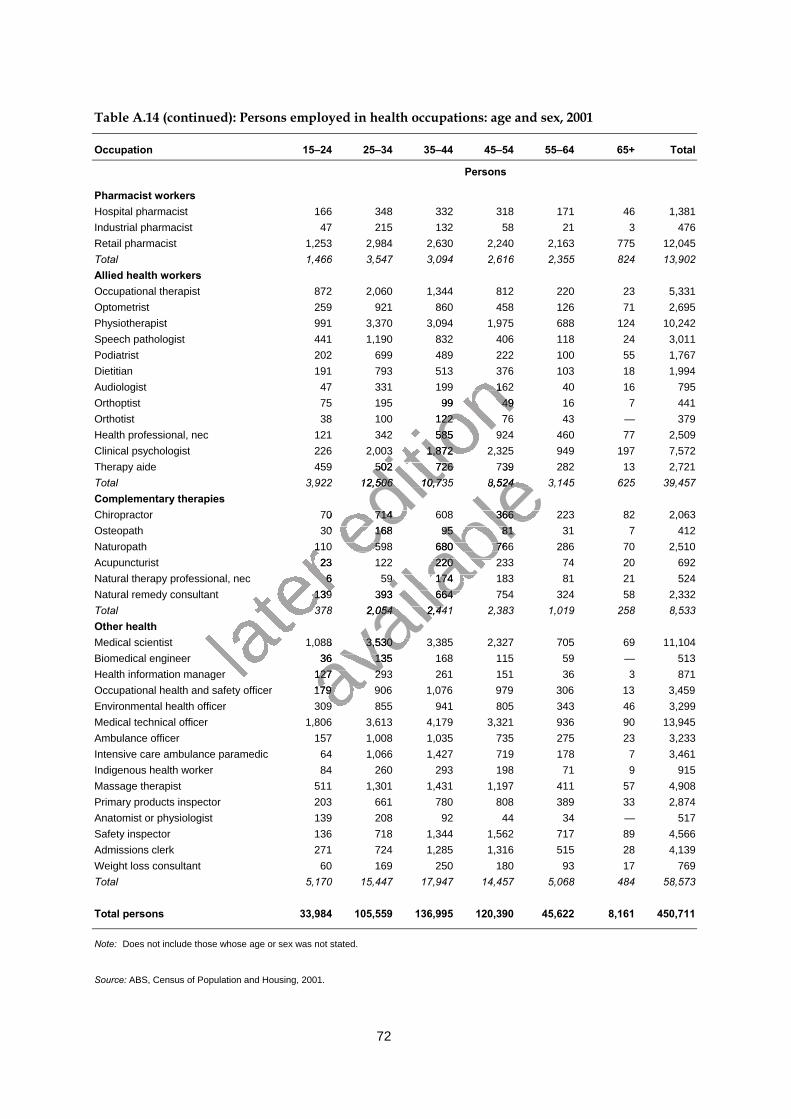
72
Table A.14 (continued): Persons employed in health occupations: age and sex, 2001
Occupation 15–24 25–34 35–44 45–54 55–64 65+ Total
Persons
Pharmacist workersHospital pharmacist 166 348 332 318 171 46 1,381Industrial pharmacist 47 215 132 58 21 3 476Retail pharmacist 1,253 2,984 2,630 2,240 2,163 775 12,045Total 1,466 3,547 3,094 2,616 2,355 824 13,902Allied health workersOccupational therapist 872 2,060 1,344 812 220 23 5,331Optometrist 259 921 860 458 126 71 2,695Physiotherapist 991 3,370 3,094 1,975 688 124 10,242Speech pathologist 441 1,190 832 406 118 24 3,011Podiatrist 202 699 489 222 100 55 1,767Dietitian 191 793 513 376 103 18 1,994Audiologist 47 331 199 162 40 16 795Orthoptist 75 195 99 49 16 7 441Orthotist 38 100 122 76 43 — 379Health professional, nec 121 342 585 924 460 77 2,509Clinical psychologist 226 2,003 1,872 2,325 949 197 7,572Therapy aide 459 502 726 739 282 13 2,721Total 3,922 12,506 10,735 8,524 3,145 625 39,457Complementary therapiesChiropractor 70 714 608 366 223 82 2,063Osteopath 30 168 95 81 31 7 412Naturopath 110 598 680 766 286 70 2,510Acupuncturist 23 122 220 233 74 20 692Natural therapy professional, nec 6 59 174 183 81 21 524Natural remedy consultant 139 393 664 754 324 58 2,332Total 378 2,054 2,441 2,383 1,019 258 8,533Other healthMedical scientist 1,088 3,530 3,385 2,327 705 69 11,104Biomedical engineer 36 135 168 115 59 — 513Health information manager 127 293 261 151 36 3 871Occupational health and safety officer 179 906 1,076 979 306 13 3,459Environmental health officer 309 855 941 805 343 46 3,299Medical technical officer 1,806 3,613 4,179 3,321 936 90 13,945Ambulance officer 157 1,008 1,035 735 275 23 3,233Intensive care ambulance paramedic 64 1,066 1,427 719 178 7 3,461Indigenous health worker 84 260 293 198 71 9 915Massage therapist 511 1,301 1,431 1,197 411 57 4,908Primary products inspector 203 661 780 808 389 33 2,874Anatomist or physiologist 139 208 92 44 34 — 517Safety inspector 136 718 1,344 1,562 717 89 4,566Admissions clerk 271 724 1,285 1,316 515 28 4,139Weight loss consultant 60 169 250 180 93 17 769Total 5,170 15,447 17,947 14,457 5,068 484 58,573
Total persons 33,984 105,559 136,995 120,390 45,622 8,161 450,711
Note: Does not include those whose age or sex was not stated.
Source: ABS, Census of Population and Housing, 2001.
later
110 598 680 766 286 70 2,510
later
110 598 680 766 286 70 2,51023 122 220 233 74 20 692
later
23 122 220 233 74 20 6926 59 174 183 81 21 524
later 6 59 174 183 81 21 524
139 393 664 754 324 58 2,332
later 139 393 664 754 324 58 2,332
378 2,054 2,441 2,383 1,019 258 8,533
later 378 2,054 2,441 2,383 1,019 258 8,533
editio
n 191 793 513 376 103 18 1,994
editio
n 191 793 513 376 103 18 1,99447 331 199 162 40 16 795
editio
n 47 331 199 162 40 16 79575 195 99 49 16
editio
n 75 195 99 49 1638 100 122 76 43 — 379
editio
n 38 100 122 76 43 — 379121 342 585 924 460 77 2,509
editio
n 121 342 585 924 460 77 2,509226 2,003 1,872 2,325 949 197 7,572
editio
n 226 2,003 1,872 2,325 949 197 7,572459 502 726 739 282 13 2,721
editio
n 459 502 726 739 282 13 2,721
3,922 12,506 10,735 8,524 3,145 625 39,457
editio
n 3,922 12,506 10,735 8,524 3,145 625 39,457
70 714 608 366 223 82 2,063editio
n 70 714 608 366 223 82 2,06330 168 95 81 31ed
ition
30 168 95 81 31110 598 680 766 286 70 2,510ed
ition
110 598 680 766 286 70 2,51023 122 220 233 74 20 692ed
ition
23 122 220 233 74 20 692
avail
able
459 502 726 739 282 13 2,721
avail
able
459 502 726 739 282 13 2,7213,922 12,506 10,735 8,524 3,145 625 39,457
avail
able
3,922 12,506 10,735 8,524 3,145 625 39,457
70 714 608 366 223 82 2,063
avail
able70 714 608 366 223 82 2,063
30 168 95 81 31
avail
able30 168 95 81 31
110 598 680 766 286 70 2,510
avail
able
110 598 680 766 286 70 2,51023 122 220 233 74 20 692
avail
able
23 122 220 233 74 20 6926 59 174 183 81 21 524
avail
able
6 59 174 183 81 21 524139 393 664 754 324 58 2,332
avail
able
139 393 664 754 324 58 2,332378 2,054 2,441 2,383 1,019 258 8,533
avail
able
378 2,054 2,441 2,383 1,019 258 8,533
1,088 3,530 3,385 2,327 705 69 11,104
avail
able
1,088 3,530 3,385 2,327 705 69 11,104
avail
able
36 135 168 115 59 — 513
avail
able
36 135 168 115 59 — 513127 293 261 151 36av
ailab
le
127 293 261 151 36Occupational health and safety officer 179 906 1,076 979 306 13 3,459av
ailab
le
Occupational health and safety officer 179 906 1,076 979 306 13 3,459309 855 941 805 343 46 3,299av
ailab
le
309 855 941 805 343 46 3,299
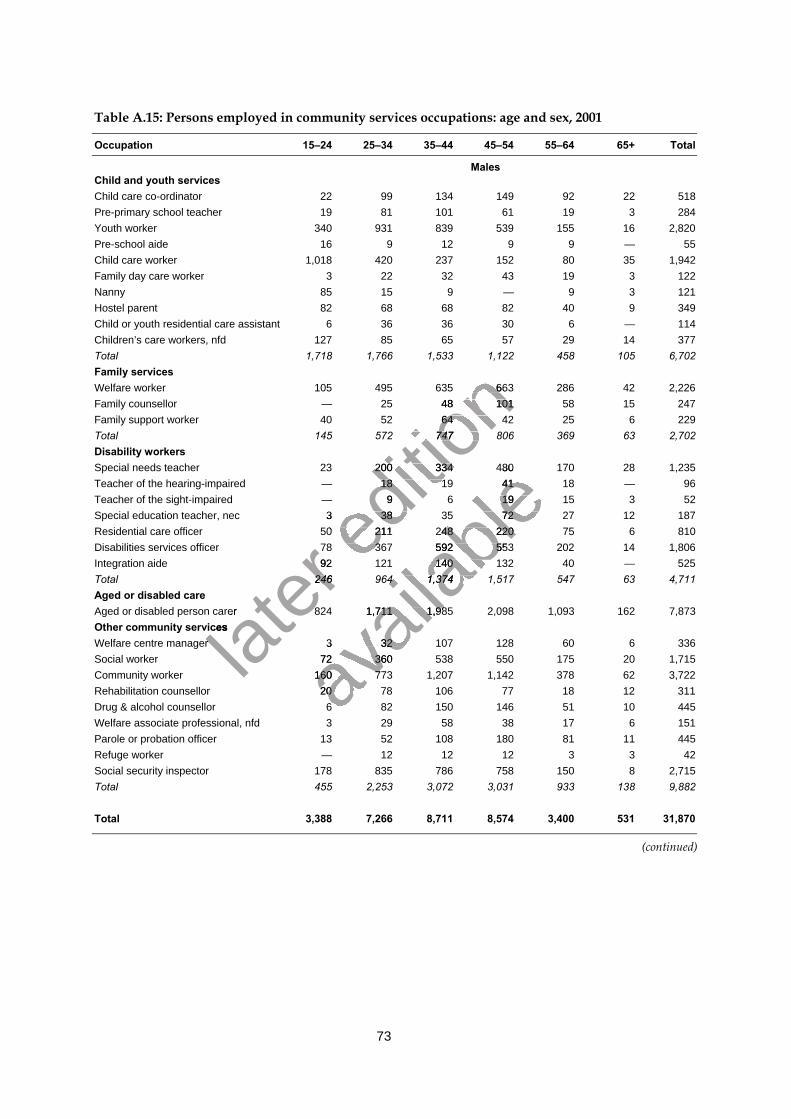
73
Table A.15: Persons employed in community services occupations: age and sex, 2001
Occupation 15–24 25–34 35–44 45–54 55–64 65+ Total
MalesChild and youth servicesChild care co-ordinator 22 99 134 149 92 22 518Pre-primary school teacher 19 81 101 61 19 3 284Youth worker 340 931 839 539 155 16 2,820Pre-school aide 16 9 12 9 9 — 55Child care worker 1,018 420 237 152 80 35 1,942Family day care worker 3 22 32 43 19 3 122Nanny 85 15 9 — 9 3 121Hostel parent 82 68 68 82 40 9 349Child or youth residential care assistant 6 36 36 30 6 — 114Children’s care workers, nfd 127 85 65 57 29 14 377Total 1,718 1,766 1,533 1,122 458 105 6,702Family servicesWelfare worker 105 495 635 663 286 42 2,226Family counsellor — 25 48 101 58 15 247Family support worker 40 52 64 42 25 6 229Total 145 572 747 806 369 63 2,702Disability workersSpecial needs teacher 23 200 334 480 170 28 1,235Teacher of the hearing-impaired — 18 19 41 18 — 96Teacher of the sight-impaired — 9 6 19 15 3 52Special education teacher, nec 3 38 35 72 27 12 187Residential care officer 50 211 248 220 75 6 810Disabilities services officer 78 367 592 553 202 14 1,806Integration aide 92 121 140 132 40 — 525Total 246 964 1,374 1,517 547 63 4,711Aged or disabled careAged or disabled person carer 824 1,711 1,985 2,098 1,093 162 7,873Other community servicesWelfare centre manager 3 32 107 128 60 6 336Social worker 72 360 538 550 175 20 1,715Community worker 160 773 1,207 1,142 378 62 3,722Rehabilitation counsellor 20 78 106 77 18 12 311Drug & alcohol counsellor 6 82 150 146 51 10 445Welfare associate professional, nfd 3 29 58 38 17 6 151Parole or probation officer 13 52 108 180 81 11 445Refuge worker — 12 12 12 3 3 42Social security inspector 178 835 786 758 150 8 2,715Total 455 2,253 3,072 3,031 933 138 9,882
Total 3,388 7,266 8,711 8,574 3,400 531 31,870
(continued)
later
78 367 592 553 202 14 1,806
later
78 367 592 553 202 14 1,80692 121 140 132 40 — 525
later
92 121 140 132 40 — 525246 964 1,374 1,517 547 63 4,711
later 246 964 1,374 1,517 547 63 4,711
Aged or disabled person carer
later Aged or disabled person carer 824 1,711 1,985 2,098 1,093 162 7,873
later 824 1,711 1,985 2,098 1,093 162 7,873
Other community services later Other community services
Welfare centre manager later
Welfare centre manager
editio
n 105 495 635 663 286 42 2,226
editio
n 105 495 635 663 286 42 2,226— 25 48 101 58 15 247
editio
n — 25 48 101 58 15 24740 52 64 42 25
editio
n 40 52 64 42 25145 572 747 806 369 63 2,702
editio
n 145 572 747 806 369 63 2,702
23 200 334 480 170 28 1,235
editio
n 23 200 334 480 170 28 1,235— 18 19 41 18 — 96
editio
n — 18 19 41 18 — 96
9
editio
n 9
3 38 35 72 27 12 187editio
n 3 38 35 72 27 12 187
50 211 248 220 75editio
n
50 211 248 220 7578 367 592 553 202 14 1,806ed
ition
78 367 592 553 202 14 1,80692 121 140 132 40 — 525ed
ition
92 121 140 132 40 — 525
avail
able
23 200 334 480 170 28 1,235
avail
able
23 200 334 480 170 28 1,235— 18 19 41 18 — 96
avail
able
— 18 19 41 18 — 966 19 15
avail
able6 19 15
3 38 35 72 27 12 187
avail
able3 38 35 72 27 12 187
50 211 248 220 75
avail
able50 211 248 220 75
78 367 592 553 202 14 1,806
avail
able
78 367 592 553 202 14 1,80692 121 140 132 40 — 525
avail
able
92 121 140 132 40 — 525246 964 1,374 1,517 547 63 4,711
avail
able
246 964 1,374 1,517 547 63 4,711
824 1,711 1,985 2,098 1,093 162 7,873
avail
able
824 1,711 1,985 2,098 1,093 162 7,873
avail
able
3 32 107 128 60
avail
able
3 32 107 128 6072 360 538 550 175 20 1,715av
ailab
le
72 360 538 550 175 20 1,715160 773 1,207 1,142 378 62 3,722av
ailab
le
160 773 1,207 1,142 378 62 3,722avail
able
20 78 106 77 18 12 311avail
able
20 78 106 77 18 12 3116 82 150 146 51 10 445av
ailab
le
6 82 150 146 51 10 445
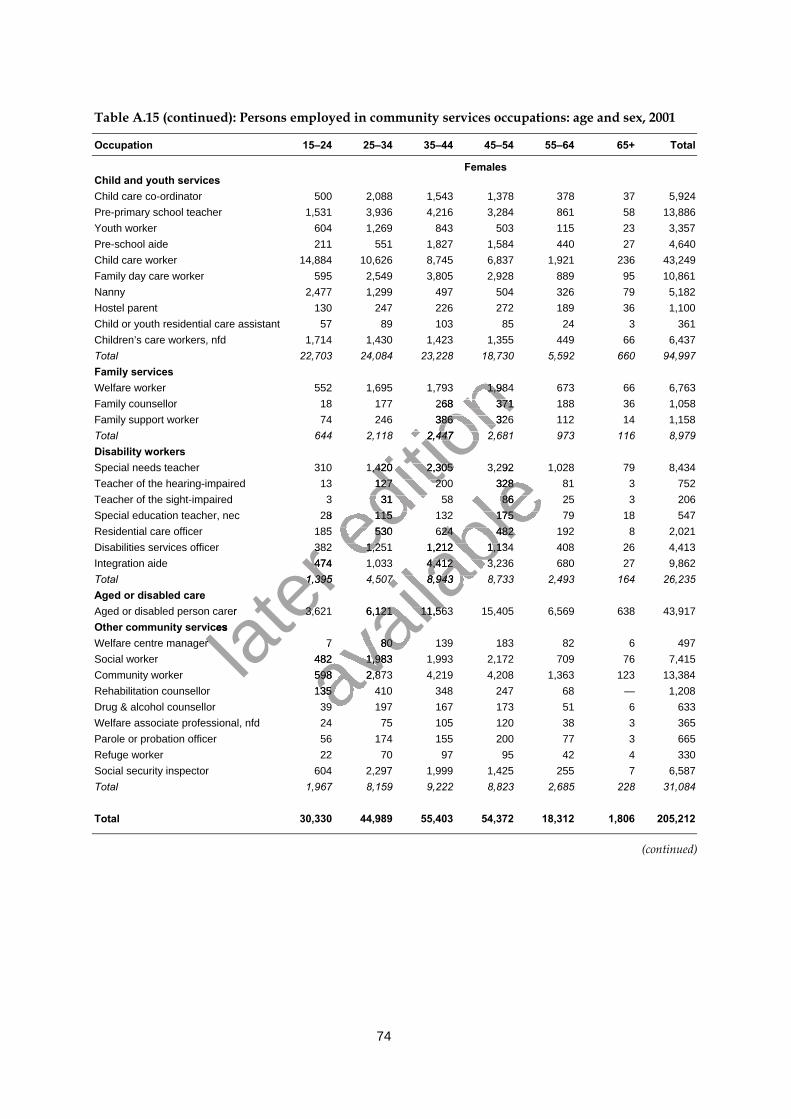
74
Table A.15 (continued): Persons employed in community services occupations: age and sex, 2001
Occupation 15–24 25–34 35–44 45–54 55–64 65+ Total
FemalesChild and youth servicesChild care co-ordinator 500 2,088 1,543 1,378 378 37 5,924Pre-primary school teacher 1,531 3,936 4,216 3,284 861 58 13,886Youth worker 604 1,269 843 503 115 23 3,357Pre-school aide 211 551 1,827 1,584 440 27 4,640Child care worker 14,884 10,626 8,745 6,837 1,921 236 43,249Family day care worker 595 2,549 3,805 2,928 889 95 10,861Nanny 2,477 1,299 497 504 326 79 5,182Hostel parent 130 247 226 272 189 36 1,100Child or youth residential care assistant 57 89 103 85 24 3 361Children’s care workers, nfd 1,714 1,430 1,423 1,355 449 66 6,437Total 22,703 24,084 23,228 18,730 5,592 660 94,997Family servicesWelfare worker 552 1,695 1,793 1,984 673 66 6,763Family counsellor 18 177 268 371 188 36 1,058Family support worker 74 246 386 326 112 14 1,158Total 644 2,118 2,447 2,681 973 116 8,979Disability workersSpecial needs teacher 310 1,420 2,305 3,292 1,028 79 8,434Teacher of the hearing-impaired 13 127 200 328 81 3 752Teacher of the sight-impaired 3 31 58 86 25 3 206Special education teacher, nec 28 115 132 175 79 18 547Residential care officer 185 530 624 482 192 8 2,021Disabilities services officer 382 1,251 1,212 1,134 408 26 4,413Integration aide 474 1,033 4,412 3,236 680 27 9,862Total 1,395 4,507 8,943 8,733 2,493 164 26,235Aged or disabled careAged or disabled person carer 3,621 6,121 11,563 15,405 6,569 638 43,917Other community servicesWelfare centre manager 7 80 139 183 82 6 497Social worker 482 1,983 1,993 2,172 709 76 7,415Community worker 598 2,873 4,219 4,208 1,363 123 13,384Rehabilitation counsellor 135 410 348 247 68 — 1,208Drug & alcohol counsellor 39 197 167 173 51 6 633Welfare associate professional, nfd 24 75 105 120 38 3 365Parole or probation officer 56 174 155 200 77 3 665Refuge worker 22 70 97 95 42 4 330Social security inspector 604 2,297 1,999 1,425 255 7 6,587Total 1,967 8,159 9,222 8,823 2,685 228 31,084
Total 30,330 44,989 55,403 54,372 18,312 1,806 205,212
(continued)
later
382 1,251 1,212 1,134 408 26 4,413
later
382 1,251 1,212 1,134 408 26 4,413474 1,033 4,412 3,236 680 27 9,862
later
474 1,033 4,412 3,236 680 27 9,8621,395 4,507 8,943 8,733 2,493 164 26,235
later 1,395 4,507 8,943 8,733 2,493 164 26,235
Aged or disabled person carer
later Aged or disabled person carer 3,621 6,121 11,563 15,405 6,569 638 43,917
later 3,621 6,121 11,563 15,405 6,569 638 43,917
Other community services later Other community services
Welfare centre manager later
Welfare centre manager
editio
n 552 1,695 1,793 1,984 673 66 6,763
editio
n 552 1,695 1,793 1,984 673 66 6,76318 177 268 371 188 36 1,058
editio
n 18 177 268 371 188 36 1,05874 246 386 326 112 14 1,158
editio
n 74 246 386 326 112 14 1,158644 2,118 2,447 2,681 973 116 8,979
editio
n 644 2,118 2,447 2,681 973 116 8,979
310 1,420 2,305 3,292 1,028 79 8,434
editio
n 310 1,420 2,305 3,292 1,028 79 8,434
13 127 200 328 81
editio
n 13 127 200 328 813 31 58 86 25
editio
n 3 31 58 86 25
28 115 132 175 79 18 547editio
n 28 115 132 175 79 18 547
185 530 624 482 192editio
n
185 530 624 482 192382 1,251 1,212 1,134 408 26 4,413ed
ition
382 1,251 1,212 1,134 408 26 4,413474 1,033 4,412 3,236 680 27 9,862ed
ition
474 1,033 4,412 3,236 680 27 9,862
avail
able
310 1,420 2,305 3,292 1,028 79 8,434
avail
able
310 1,420 2,305 3,292 1,028 79 8,43413 127 200 328 81
avail
able
13 127 200 328 813 31 58 86 25
avail
able3 31 58 86 25
28 115 132 175 79 18 547
avail
able28 115 132 175 79 18 547
185 530 624 482 192
avail
able185 530 624 482 192
382 1,251 1,212 1,134 408 26 4,413
avail
able
382 1,251 1,212 1,134 408 26 4,413474 1,033 4,412 3,236 680 27 9,862
avail
able
474 1,033 4,412 3,236 680 27 9,8621,395 4,507 8,943 8,733 2,493 164 26,235
avail
able
1,395 4,507 8,943 8,733 2,493 164 26,235
3,621 6,121 11,563 15,405 6,569 638 43,917
avail
able
3,621 6,121 11,563 15,405 6,569 638 43,917
avail
able
7 80 139 183 82
avail
able
7 80 139 183 82482 1,983 1,993 2,172 709 76 7,415av
ailab
le
482 1,983 1,993 2,172 709 76 7,415598 2,873 4,219 4,208 1,363 123 13,384av
ailab
le
598 2,873 4,219 4,208 1,363 123 13,384135 410 348 247 68 — 1,208av
ailab
le
135 410 348 247 68 — 1,208avail
able
39 197 167 173 51avail
able
39 197 167 173 51
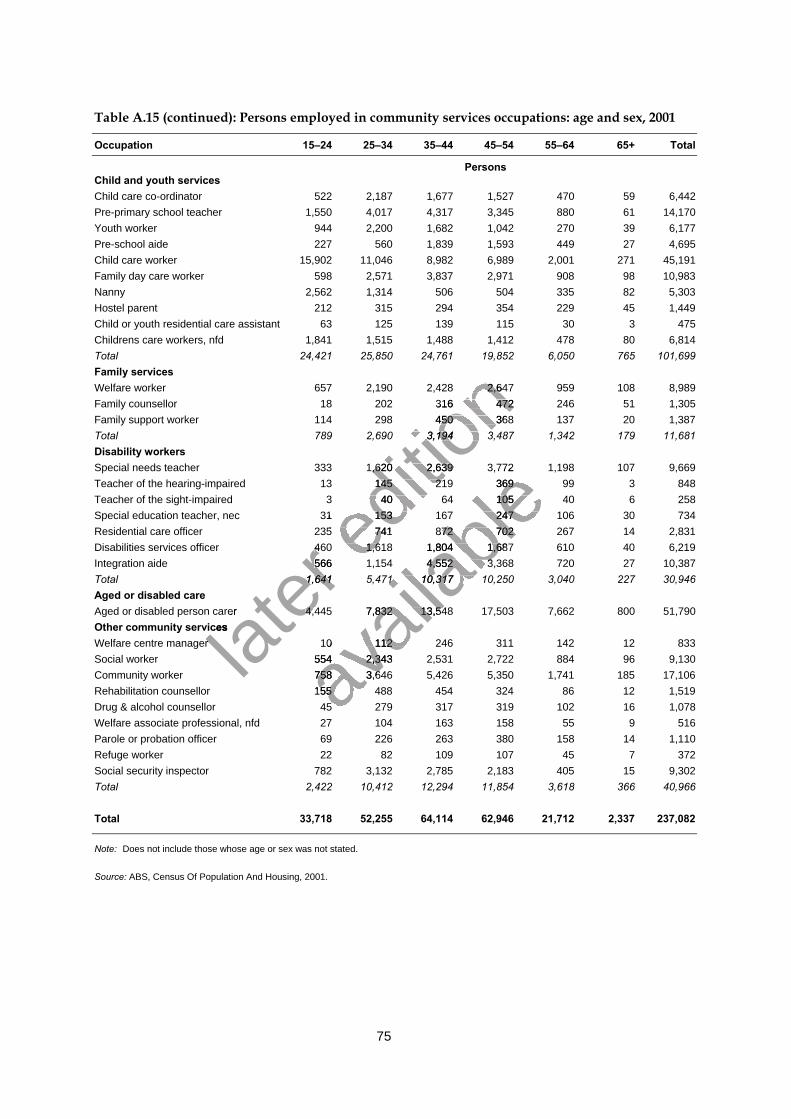
75
Table A.15 (continued): Persons employed in community services occupations: age and sex, 2001
Occupation 15–24 25–34 35–44 45–54 55–64 65+ Total
PersonsChild and youth servicesChild care co-ordinator 522 2,187 1,677 1,527 470 59 6,442Pre-primary school teacher 1,550 4,017 4,317 3,345 880 61 14,170Youth worker 944 2,200 1,682 1,042 270 39 6,177Pre-school aide 227 560 1,839 1,593 449 27 4,695Child care worker 15,902 11,046 8,982 6,989 2,001 271 45,191Family day care worker 598 2,571 3,837 2,971 908 98 10,983Nanny 2,562 1,314 506 504 335 82 5,303Hostel parent 212 315 294 354 229 45 1,449Child or youth residential care assistant 63 125 139 115 30 3 475Childrens care workers, nfd 1,841 1,515 1,488 1,412 478 80 6,814Total 24,421 25,850 24,761 19,852 6,050 765 101,699Family servicesWelfare worker 657 2,190 2,428 2,647 959 108 8,989Family counsellor 18 202 316 472 246 51 1,305Family support worker 114 298 450 368 137 20 1,387Total 789 2,690 3,194 3,487 1,342 179 11,681Disability workersSpecial needs teacher 333 1,620 2,639 3,772 1,198 107 9,669Teacher of the hearing-impaired 13 145 219 369 99 3 848Teacher of the sight-impaired 3 40 64 105 40 6 258Special education teacher, nec 31 153 167 247 106 30 734Residential care officer 235 741 872 702 267 14 2,831Disabilities services officer 460 1,618 1,804 1,687 610 40 6,219Integration aide 566 1,154 4,552 3,368 720 27 10,387Total 1,641 5,471 10,317 10,250 3,040 227 30,946Aged or disabled careAged or disabled person carer 4,445 7,832 13,548 17,503 7,662 800 51,790Other community servicesWelfare centre manager 10 112 246 311 142 12 833Social worker 554 2,343 2,531 2,722 884 96 9,130Community worker 758 3,646 5,426 5,350 1,741 185 17,106Rehabilitation counsellor 155 488 454 324 86 12 1,519Drug & alcohol counsellor 45 279 317 319 102 16 1,078Welfare associate professional, nfd 27 104 163 158 55 9 516Parole or probation officer 69 226 263 380 158 14 1,110Refuge worker 22 82 109 107 45 7 372Social security inspector 782 3,132 2,785 2,183 405 15 9,302Total 2,422 10,412 12,294 11,854 3,618 366 40,966
Total 33,718 52,255 64,114 62,946 21,712 2,337 237,082
Note: Does not include those whose age or sex was not stated.
Source: ABS, Census Of Population And Housing, 2001.
later
460 1,618 1,804 1,687 610 40 6,219
later
460 1,618 1,804 1,687 610 40 6,219566 1,154 4,552 3,368 720 27 10,387
later
566 1,154 4,552 3,368 720 27 10,3871,641 5,471 10,317 10,250 3,040 227 30,946
later 1,641 5,471 10,317 10,250 3,040 227 30,946
Aged or disabled person carer
later Aged or disabled person carer 4,445 7,832 13,548 17,503 7,662 800 51,790
later 4,445 7,832 13,548 17,503 7,662 800 51,790
Other community services later Other community services
Welfare centre manager later
Welfare centre manager
editio
n 657 2,190 2,428 2,647 959 108 8,989
editio
n 657 2,190 2,428 2,647 959 108 8,98918 202 316 472 246 51 1,305
editio
n 18 202 316 472 246 51 1,305114 298 450 368 137 20 1,387
editio
n 114 298 450 368 137 20 1,387789 2,690 3,194 3,487 1,342 179 11,681
editio
n 789 2,690 3,194 3,487 1,342 179 11,681
333 1,620 2,639 3,772 1,198 107 9,669
editio
n 333 1,620 2,639 3,772 1,198 107 9,669
13 145 219 369 99
editio
n 13 145 219 369 993 40 64 105 40
editio
n 3 40 64 105 40
31 153 167 247 106 30 734editio
n 31 153 167 247 106 30 734
235 741 872 702 267 14 2,831editio
n
235 741 872 702 267 14 2,831460 1,618 1,804 1,687 610 40 6,219ed
ition
460 1,618 1,804 1,687 610 40 6,219566 1,154 4,552 3,368 720 27 10,387ed
ition
566 1,154 4,552 3,368 720 27 10,387
avail
able
333 1,620 2,639 3,772 1,198 107 9,669
avail
able
333 1,620 2,639 3,772 1,198 107 9,66913 145 219 369 99
avail
able
13 145 219 369 993 40 64 105 40
avail
able3 40 64 105 40
31 153 167 247 106 30 734
avail
able31 153 167 247 106 30 734
235 741 872 702 267 14 2,831
avail
able235 741 872 702 267 14 2,831
460 1,618 1,804 1,687 610 40 6,219
avail
able
460 1,618 1,804 1,687 610 40 6,219566 1,154 4,552 3,368 720 27 10,387
avail
able
566 1,154 4,552 3,368 720 27 10,3871,641 5,471 10,317 10,250 3,040 227 30,946
avail
able
1,641 5,471 10,317 10,250 3,040 227 30,946
4,445 7,832 13,548 17,503 7,662 800 51,790
avail
able
4,445 7,832 13,548 17,503 7,662 800 51,790
avail
able
10 112 246 311 142 12 833
avail
able
10 112 246 311 142 12 833554 2,343 2,531 2,722 884 96 9,130av
ailab
le
554 2,343 2,531 2,722 884 96 9,130758 3,646 5,426 5,350 1,741 185 17,106av
ailab
le
758 3,646 5,426 5,350 1,741 185 17,106155 488 454 324 86 12 1,519av
ailab
le
155 488 454 324 86 12 1,51945 279 317 319 102 16 1,078av
ailab
le
45 279 317 319 102 16 1,078
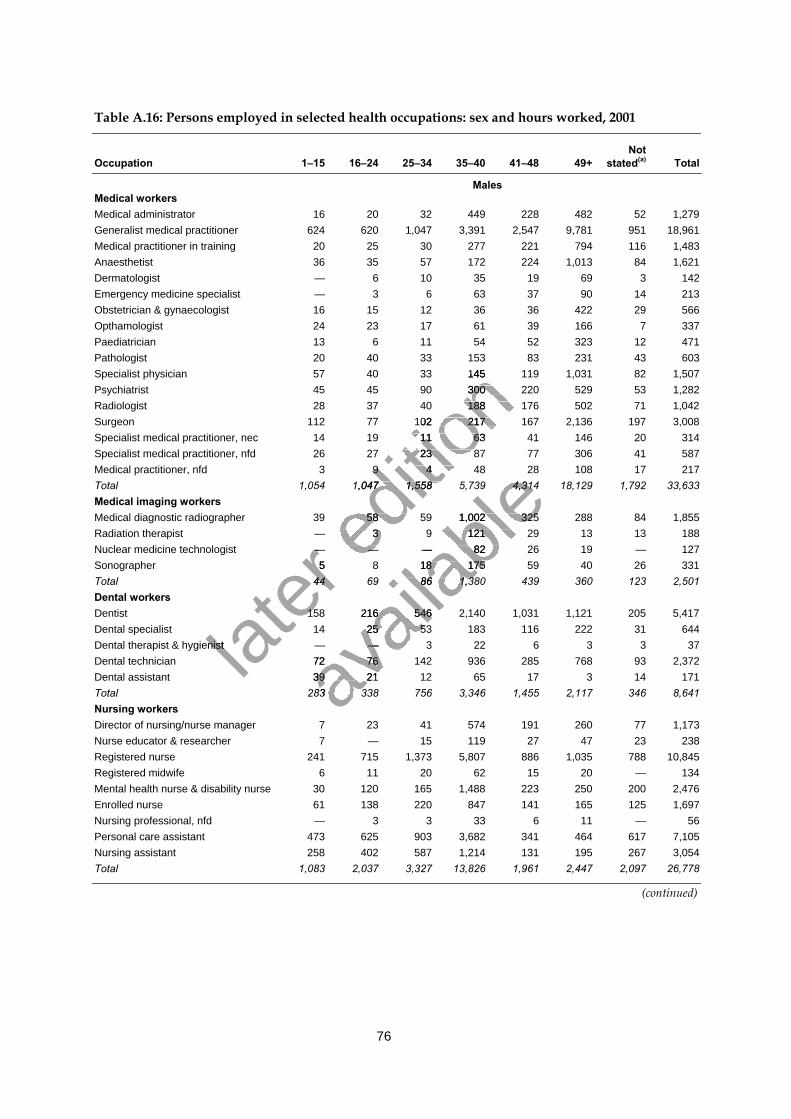
76
Table A.16: Persons employed in selected health occupations: sex and hours worked, 2001
Occupation 1–15 16–24 25–34 35–40 41–48 49+Not
stated(a) Total
MalesMedical workersMedical administrator 16 20 32 449 228 482 52 1,279Generalist medical practitioner 624 620 1,047 3,391 2,547 9,781 951 18,961Medical practitioner in training 20 25 30 277 221 794 116 1,483Anaesthetist 36 35 57 172 224 1,013 84 1,621Dermatologist — 6 10 35 19 69 3 142Emergency medicine specialist — 3 6 63 37 90 14 213Obstetrician & gynaecologist 16 15 12 36 36 422 29 566Opthamologist 24 23 17 61 39 166 7 337Paediatrician 13 6 11 54 52 323 12 471Pathologist 20 40 33 153 83 231 43 603Specialist physician 57 40 33 145 119 1,031 82 1,507Psychiatrist 45 45 90 300 220 529 53 1,282Radiologist 28 37 40 188 176 502 71 1,042Surgeon 112 77 102 217 167 2,136 197 3,008Specialist medical practitioner, nec 14 19 11 63 41 146 20 314Specialist medical practitioner, nfd 26 27 23 87 77 306 41 587Medical practitioner, nfd 3 9 4 48 28 108 17 217Total 1,054 1,047 1,558 5,739 4,314 18,129 1,792 33,633Medical imaging workersMedical diagnostic radiographer 39 58 59 1,002 325 288 84 1,855Radiation therapist — 3 9 121 29 13 13 188Nuclear medicine technologist — — — 82 26 19 — 127Sonographer 5 8 18 175 59 40 26 331Total 44 69 86 1,380 439 360 123 2,501Dental workersDentist 158 216 546 2,140 1,031 1,121 205 5,417Dental specialist 14 25 53 183 116 222 31 644Dental therapist & hygienist — — 3 22 6 3 3 37Dental technician 72 76 142 936 285 768 93 2,372Dental assistant 39 21 12 65 17 3 14 171Total 283 338 756 3,346 1,455 2,117 346 8,641Nursing workersDirector of nursing/nurse manager 7 23 41 574 191 260 77 1,173Nurse educator & researcher 7 — 15 119 27 47 23 238Registered nurse 241 715 1,373 5,807 886 1,035 788 10,845Registered midwife 6 11 20 62 15 20 — 134Mental health nurse & disability nurse 30 120 165 1,488 223 250 200 2,476Enrolled nurse 61 138 220 847 141 165 125 1,697Nursing professional, nfd — 3 3 33 6 11 — 56Personal care assistant 473 625 903 3,682 341 464 617 7,105Nursing assistant 258 402 587 1,214 131 195 267 3,054Total 1,083 2,037 3,327 13,826 1,961 2,447 2,097 26,778
(continued)
later
— — — 82 26 19 — 127
later
— — — 82 26 19 — 1275 8 18 175 59 40 26 331
later
5 8 18 175 59 40 26 33144 69 86 1,380 439 360 123 2,501
later 44 69 86 1,380 439 360 123 2,501
158 216 546 2,140 1,031 1,121 205 5,417
later 158 216 546 2,140 1,031 1,121 205 5,417
Dental therapist & hygienist later
Dental therapist & hygienist
editio
n 57 40 33 145 119 1,031 82 1,507
editio
n 57 40 33 145 119 1,031 82 1,50745 45 90 300 220 529 53 1,282
editio
n 45 45 90 300 220 529 53 1,28228 37 40 188 176 502 71 1,042
editio
n 28 37 40 188 176 502 71 1,042112 77 102 217 167 2,136 197 3,008
editio
n 112 77 102 217 167 2,136 197 3,00814 19 11 63 41 146 20 314
editio
n 14 19 11 63 41 146 20 31426 27 23 87 77 306 41 587
editio
n 26 27 23 87 77 306 41 5873 9 4 48 28 108 17 217
editio
n 3 9 4 48 28 108 17 217
1,054 1,047 1,558 5,739 4,314 18,129 1,792 33,633
editio
n 1,054 1,047 1,558 5,739 4,314 18,129 1,792 33,633
39 58 59 1,002 325 288 84 1,855editio
n 39 58 59 1,002 325 288 84 1,855— 3 9 121 29 13 13 188ed
ition
— 3 9 121 29 13 13 188— — — 82 26 19 — 127ed
ition
— — — 82 26 19 — 127
avail
able
3 9 4 48 28 108 17 217
avail
able
3 9 4 48 28 108 17 2171,054 1,047 1,558 5,739 4,314 18,129 1,792 33,633
avail
able
1,054 1,047 1,558 5,739 4,314 18,129 1,792 33,633
39 58 59 1,002 325 288 84 1,855
avail
able39 58 59 1,002 325 288 84 1,855
— 3 9 121 29 13 13 188
avail
able— 3 9 121 29 13 13 188
— — — 82 26 19 — 127
avail
able
— — — 82 26 19 — 1275 8 18 175 59 40 26 331
avail
able
5 8 18 175 59 40 26 33144 69 86 1,380 439 360 123 2,501
avail
able
44 69 86 1,380 439 360 123 2,501
158 216 546 2,140 1,031 1,121 205 5,417
avail
able
158 216 546 2,140 1,031 1,121 205 5,41714 25 53 183 116 222 31 644
avail
able
14 25 53 183 116 222 31 644
avail
able
— — 3 22 6 3 3 37
avail
able
— — 3 22 6 3 3 3772 76 142 936 285 768 93 2,372av
ailab
le
72 76 142 936 285 768 93 2,37239 21 12 65 17 3 14 171av
ailab
le
39 21 12 65 17 3 14 171283 338 756 3,346 1,455 2,117 346 8,641av
ailab
le
283 338 756 3,346 1,455 2,117 346 8,641
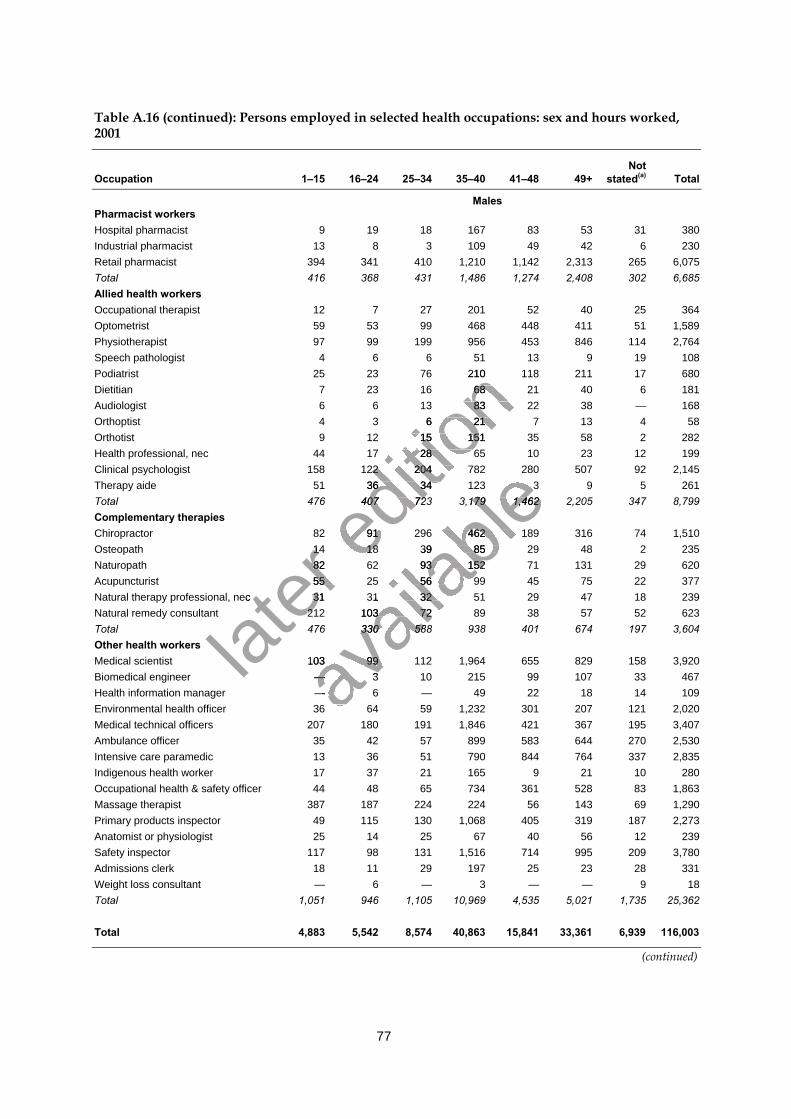
77
Table A.16 (continued): Persons employed in selected health occupations: sex and hours worked,2001
Occupation 1–15 16–24 25–34 35–40 41–48 49+Not
stated(a) Total
MalesPharmacist workersHospital pharmacist 9 19 18 167 83 53 31 380Industrial pharmacist 13 8 3 109 49 42 6 230Retail pharmacist 394 341 410 1,210 1,142 2,313 265 6,075Total 416 368 431 1,486 1,274 2,408 302 6,685Allied health workersOccupational therapist 12 7 27 201 52 40 25 364Optometrist 59 53 99 468 448 411 51 1,589Physiotherapist 97 99 199 956 453 846 114 2,764Speech pathologist 4 6 6 51 13 9 19 108Podiatrist 25 23 76 210 118 211 17 680Dietitian 7 23 16 68 21 40 6 181Audiologist 6 6 13 83 22 38 — 168Orthoptist 4 3 6 21 7 13 4 58Orthotist 9 12 15 151 35 58 2 282Health professional, nec 44 17 28 65 10 23 12 199Clinical psychologist 158 122 204 782 280 507 92 2,145Therapy aide 51 36 34 123 3 9 5 261Total 476 407 723 3,179 1,462 2,205 347 8,799Complementary therapiesChiropractor 82 91 296 462 189 316 74 1,510Osteopath 14 18 39 85 29 48 2 235Naturopath 82 62 93 152 71 131 29 620Acupuncturist 55 25 56 99 45 75 22 377Natural therapy professional, nec 31 31 32 51 29 47 18 239Natural remedy consultant 212 103 72 89 38 57 52 623Total 476 330 588 938 401 674 197 3,604Other health workersMedical scientist 103 99 112 1,964 655 829 158 3,920Biomedical engineer — 3 10 215 99 107 33 467Health information manager — 6 — 49 22 18 14 109Environmental health officer 36 64 59 1,232 301 207 121 2,020Medical technical officers 207 180 191 1,846 421 367 195 3,407Ambulance officer 35 42 57 899 583 644 270 2,530Intensive care paramedic 13 36 51 790 844 764 337 2,835Indigenous health worker 17 37 21 165 9 21 10 280Occupational health & safety officer 44 48 65 734 361 528 83 1,863Massage therapist 387 187 224 224 56 143 69 1,290Primary products inspector 49 115 130 1,068 405 319 187 2,273Anatomist or physiologist 25 14 25 67 40 56 12 239Safety inspector 117 98 131 1,516 714 995 209 3,780Admissions clerk 18 11 29 197 25 23 28 331Weight loss consultant — 6 — 3 — — 9 18Total 1,051 946 1,105 10,969 4,535 5,021 1,735 25,362
Total 4,883 5,542 8,574 40,863 15,841 33,361 6,939 116,003
(continued)
later
14 18 39 85 29 48 2 235
later
14 18 39 85 29 48 2 23582 62 93 152 71 131 29 620
later
82 62 93 152 71 131 29 62055 25 56 99 45 75 22 377
later 55 25 56 99 45 75 22 377
Natural therapy professional, nec
later Natural therapy professional, nec 31 31 32 51 29 47 18 239
later 31 31 32 51 29 47 18 239
212 103 72 89 38 57 52 623
later 212 103 72 89 38 57 52 623
editio
n 25 23 76 210 118 211 17 680
editio
n 25 23 76 210 118 211 17 680
7 23 16 68 21 40 6 181
editio
n 7 23 16 68 21 40 6 1816 6 13 83 22 38 — 168
editio
n 6 6 13 83 22 38 — 1684 3 6 21 7 13 4 58
editio
n 4 3 6 21 7 13 4 589 12 15 151 35 58 2 282
editio
n 9 12 15 151 35 58 2 282
44 17 28 65 10 23 12 199
editio
n 44 17 28 65 10 23 12 199
158 122 204 782 280 507 92 2,145
editio
n 158 122 204 782 280 507 92 2,145
51 36 34 123 3 9 5 261
editio
n 51 36 34 123 3 9 5 261
476 407 723 3,179 1,462 2,205 347 8,799
editio
n 476 407 723 3,179 1,462 2,205 347 8,799
82 91 296 462 189 316 74 1,510editio
n
82 91 296 462 189 316 74 1,51014 18 39 85 29 48 2 235ed
ition
14 18 39 85 29 48 2 235
avail
able
158 122 204 782 280 507 92 2,145
avail
able
158 122 204 782 280 507 92 2,14551 36 34 123 3 9 5 261
avail
able
51 36 34 123 3 9 5 261476 407 723 3,179 1,462 2,205 347 8,799
avail
able476 407 723 3,179 1,462 2,205 347 8,799
82 91 296 462 189 316 74 1,510
avail
able82 91 296 462 189 316 74 1,510
14 18 39 85 29 48 2 235
avail
able
14 18 39 85 29 48 2 23582 62 93 152 71 131 29 620
avail
able
82 62 93 152 71 131 29 62055 25 56 99 45 75 22 377
avail
able
55 25 56 99 45 75 22 37731 31 32 51 29 47 18 239
avail
able
31 31 32 51 29 47 18 239212 103 72 89 38 57 52 623
avail
able
212 103 72 89 38 57 52 623
avail
able
476 330 588 938 401 674 197 3,604
avail
able
476 330 588 938 401 674 197 3,604
103 99 112 1,964 655 829 158 3,920avail
able
103 99 112 1,964 655 829 158 3,920— 3 10 215 99 107 33 467av
ailab
le
— 3 10 215 99 107 33 467— 6 — 49 22 18 14 109av
ailab
le
— 6 — 49 22 18 14 10936 64 59 1,232 301 207 121 2,020av
ailab
le
36 64 59 1,232 301 207 121 2,020
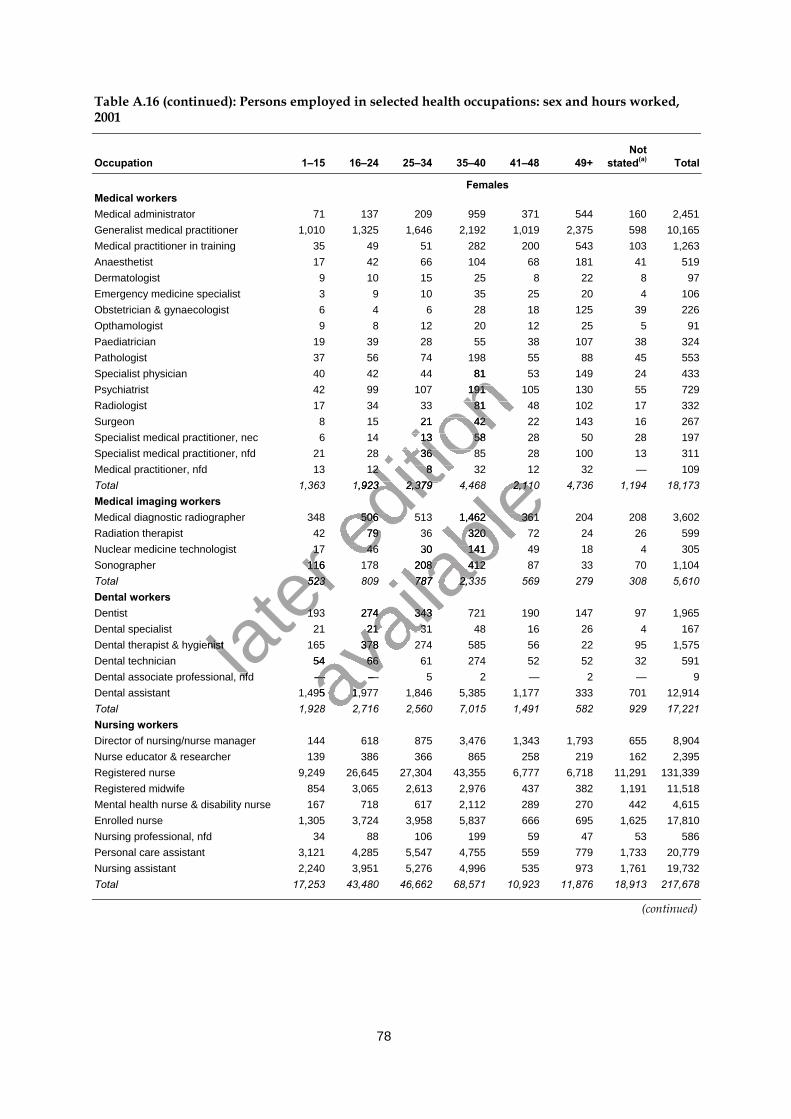
78
Table A.16 (continued): Persons employed in selected health occupations: sex and hours worked,2001
Occupation 1–15 16–24 25–34 35–40 41–48 49+Not
stated(a) Total
FemalesMedical workersMedical administrator 71 137 209 959 371 544 160 2,451Generalist medical practitioner 1,010 1,325 1,646 2,192 1,019 2,375 598 10,165Medical practitioner in training 35 49 51 282 200 543 103 1,263Anaesthetist 17 42 66 104 68 181 41 519Dermatologist 9 10 15 25 8 22 8 97Emergency medicine specialist 3 9 10 35 25 20 4 106Obstetrician & gynaecologist 6 4 6 28 18 125 39 226Opthamologist 9 8 12 20 12 25 5 91Paediatrician 19 39 28 55 38 107 38 324Pathologist 37 56 74 198 55 88 45 553Specialist physician 40 42 44 81 53 149 24 433Psychiatrist 42 99 107 191 105 130 55 729Radiologist 17 34 33 81 48 102 17 332Surgeon 8 15 21 42 22 143 16 267Specialist medical practitioner, nec 6 14 13 58 28 50 28 197Specialist medical practitioner, nfd 21 28 36 85 28 100 13 311Medical practitioner, nfd 13 12 8 32 12 32 — 109Total 1,363 1,923 2,379 4,468 2,110 4,736 1,194 18,173Medical imaging workersMedical diagnostic radiographer 348 506 513 1,462 361 204 208 3,602Radiation therapist 42 79 36 320 72 24 26 599Nuclear medicine technologist 17 46 30 141 49 18 4 305Sonographer 116 178 208 412 87 33 70 1,104Total 523 809 787 2,335 569 279 308 5,610Dental workersDentist 193 274 343 721 190 147 97 1,965Dental specialist 21 21 31 48 16 26 4 167Dental therapist & hygienist 165 378 274 585 56 22 95 1,575Dental technician 54 66 61 274 52 52 32 591Dental associate professional, nfd — — 5 2 — 2 — 9Dental assistant 1,495 1,977 1,846 5,385 1,177 333 701 12,914Total 1,928 2,716 2,560 7,015 1,491 582 929 17,221Nursing workersDirector of nursing/nurse manager 144 618 875 3,476 1,343 1,793 655 8,904Nurse educator & researcher 139 386 366 865 258 219 162 2,395Registered nurse 9,249 26,645 27,304 43,355 6,777 6,718 11,291 131,339Registered midwife 854 3,065 2,613 2,976 437 382 1,191 11,518Mental health nurse & disability nurse 167 718 617 2,112 289 270 442 4,615Enrolled nurse 1,305 3,724 3,958 5,837 666 695 1,625 17,810Nursing professional, nfd 34 88 106 199 59 47 53 586Personal care assistant 3,121 4,285 5,547 4,755 559 779 1,733 20,779Nursing assistant 2,240 3,951 5,276 4,996 535 973 1,761 19,732Total 17,253 43,480 46,662 68,571 10,923 11,876 18,913 217,678
(continued)
later
17 46 30 141 49 18 4 305
later
17 46 30 141 49 18 4 305116 178 208 412 87 33 70 1,104
later
116 178 208 412 87 33 70 1,104523 809 787 2,335 569 279 308 5,610
later 523 809 787 2,335 569 279 308 5,610
193 274 343 721 190 147 97 1,965
later 193 274 343 721 190 147 97 1,965
Dental therapist & hygienist later
Dental therapist & hygienist
Dental associate professional, nfdlater
Dental associate professional, nfd
editio
n 40 42 44 81 53 149 24 433
editio
n 40 42 44 81 53 149 24 43342 99 107 191 105 130 55 729
editio
n 42 99 107 191 105 130 55 72917 34 33 81 48 102 17 332
editio
n 17 34 33 81 48 102 17 3328 15 21 42 22 143 16 267
editio
n 8 15 21 42 22 143 16 2676 14 13 58 28 50 28 197
editio
n 6 14 13 58 28 50 28 197
21 28 36 85 28 100 13 311
editio
n 21 28 36 85 28 100 13 31113 12 8 32 12 32 — 109
editio
n 13 12 8 32 12 32 — 109
1,363 1,923 2,379 4,468 2,110 4,736 1,194 18,173
editio
n 1,363 1,923 2,379 4,468 2,110 4,736 1,194 18,173
348 506 513 1,462 361 204 208 3,602editio
n 348 506 513 1,462 361 204 208 3,60242 79 36 320 72 24 26 599ed
ition
42 79 36 320 72 24 26 59917 46 30 141 49 18 4 305ed
ition
17 46 30 141 49 18 4 305
avail
able
13 12 8 32 12 32 — 109
avail
able
13 12 8 32 12 32 — 1091,363 1,923 2,379 4,468 2,110 4,736 1,194 18,173
avail
able
1,363 1,923 2,379 4,468 2,110 4,736 1,194 18,173
348 506 513 1,462 361 204 208 3,602
avail
able348 506 513 1,462 361 204 208 3,602
42 79 36 320 72 24 26 599
avail
able42 79 36 320 72 24 26 599
17 46 30 141 49 18 4 305
avail
able
17 46 30 141 49 18 4 305116 178 208 412 87 33 70 1,104
avail
able
116 178 208 412 87 33 70 1,104523 809 787 2,335 569 279 308 5,610
avail
able
523 809 787 2,335 569 279 308 5,610
193 274 343 721 190 147 97 1,965
avail
able
193 274 343 721 190 147 97 1,96521 21 31 48 16 26 4 167
avail
able
21 21 31 48 16 26 4 167
avail
able
165 378 274 585 56 22 95 1,575
avail
able
165 378 274 585 56 22 95 1,57554 66 61 274 52 52 32 591av
ailab
le
54 66 61 274 52 52 32 591— — 5 2 — 2 — 9av
ailab
le
— — 5 2 — 2 — 9avail
able
1,495 1,977 1,846 5,385 1,177 333 701 12,914avail
able
1,495 1,977 1,846 5,385 1,177 333 701 12,9141,928 2,716 2,560 7,015 1,491 582 929 17,221av
ailab
le
1,928 2,716 2,560 7,015 1,491 582 929 17,221
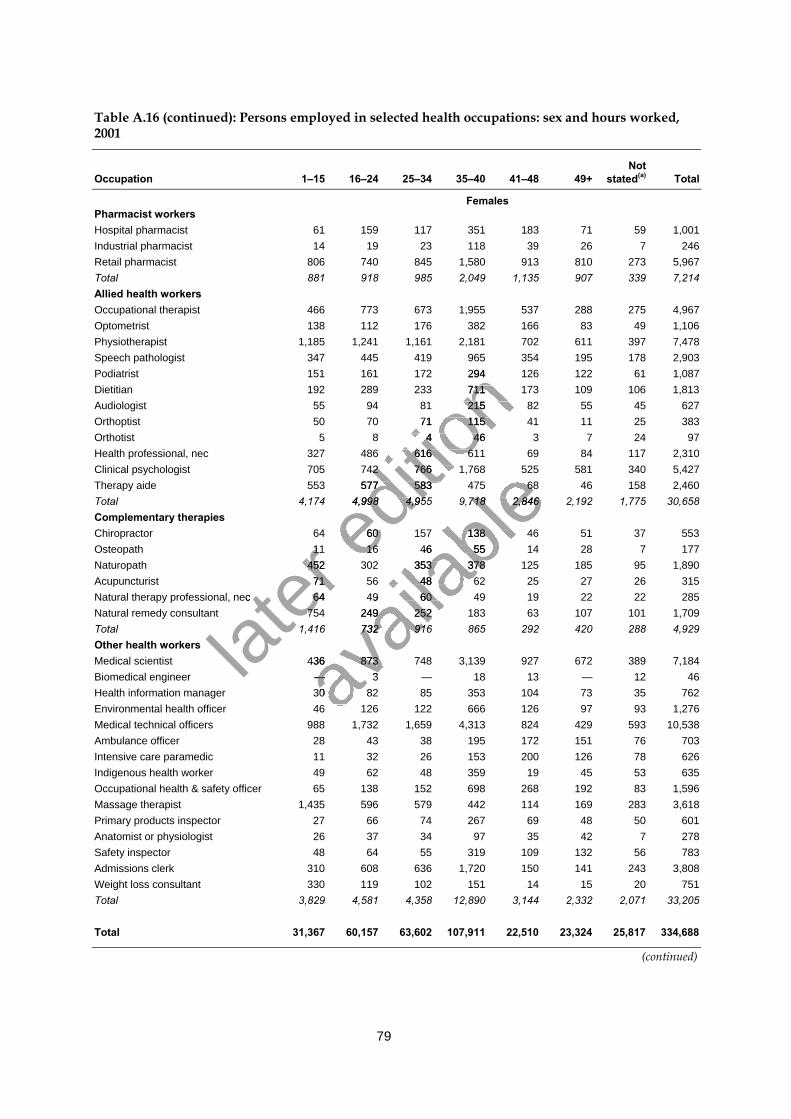
79
Table A.16 (continued): Persons employed in selected health occupations: sex and hours worked,2001
Occupation 1–15 16–24 25–34 35–40 41–48 49+Not
stated(a) Total
FemalesPharmacist workersHospital pharmacist 61 159 117 351 183 71 59 1,001Industrial pharmacist 14 19 23 118 39 26 7 246Retail pharmacist 806 740 845 1,580 913 810 273 5,967Total 881 918 985 2,049 1,135 907 339 7,214Allied health workersOccupational therapist 466 773 673 1,955 537 288 275 4,967Optometrist 138 112 176 382 166 83 49 1,106Physiotherapist 1,185 1,241 1,161 2,181 702 611 397 7,478Speech pathologist 347 445 419 965 354 195 178 2,903Podiatrist 151 161 172 294 126 122 61 1,087Dietitian 192 289 233 711 173 109 106 1,813Audiologist 55 94 81 215 82 55 45 627Orthoptist 50 70 71 115 41 11 25 383Orthotist 5 8 4 46 3 7 24 97Health professional, nec 327 486 616 611 69 84 117 2,310Clinical psychologist 705 742 766 1,768 525 581 340 5,427Therapy aide 553 577 583 475 68 46 158 2,460Total 4,174 4,998 4,955 9,718 2,846 2,192 1,775 30,658Complementary therapiesChiropractor 64 60 157 138 46 51 37 553Osteopath 11 16 46 55 14 28 7 177Naturopath 452 302 353 378 125 185 95 1,890Acupuncturist 71 56 48 62 25 27 26 315Natural therapy professional, nec 64 49 60 49 19 22 22 285Natural remedy consultant 754 249 252 183 63 107 101 1,709Total 1,416 732 916 865 292 420 288 4,929Other health workersMedical scientist 436 873 748 3,139 927 672 389 7,184Biomedical engineer — 3 — 18 13 — 12 46Health information manager 30 82 85 353 104 73 35 762Environmental health officer 46 126 122 666 126 97 93 1,276Medical technical officers 988 1,732 1,659 4,313 824 429 593 10,538Ambulance officer 28 43 38 195 172 151 76 703Intensive care paramedic 11 32 26 153 200 126 78 626Indigenous health worker 49 62 48 359 19 45 53 635Occupational health & safety officer 65 138 152 698 268 192 83 1,596Massage therapist 1,435 596 579 442 114 169 283 3,618Primary products inspector 27 66 74 267 69 48 50 601Anatomist or physiologist 26 37 34 97 35 42 7 278Safety inspector 48 64 55 319 109 132 56 783Admissions clerk 310 608 636 1,720 150 141 243 3,808Weight loss consultant 330 119 102 151 14 15 20 751Total 3,829 4,581 4,358 12,890 3,144 2,332 2,071 33,205
Total 31,367 60,157 63,602 107,911 22,510 23,324 25,817 334,688
(continued)
later
11 16 46 55 14 28 7 177
later
11 16 46 55 14 28 7 177452 302 353 378 125 185 95 1,890
later
452 302 353 378 125 185 95 1,89071 56 48 62 25 27 26 315
later 71 56 48 62 25 27 26 315
Natural therapy professional, nec
later Natural therapy professional, nec 64 49 60 49 19 22 22 285
later 64 49 60 49 19 22 22 285
754 249 252 183 63 107 101 1,709
later 754 249 252 183 63 107 101 1,709
editio
n 151 161 172 294 126 122 61 1,087
editio
n 151 161 172 294 126 122 61 1,087192 289 233 711 173 109 106 1,813
editio
n 192 289 233 711 173 109 106 1,81355 94 81 215 82 55 45 627
editio
n 55 94 81 215 82 55 45 62750 70 71 115 41 11 25 383
editio
n 50 70 71 115 41 11 25 3835 8 4 46 3 7 24 97
editio
n 5 8 4 46 3 7 24 97
327 486 616 611 69 84 117 2,310
editio
n 327 486 616 611 69 84 117 2,310705 742 766 1,768 525 581 340 5,427
editio
n 705 742 766 1,768 525 581 340 5,427553 577 583 475 68 46 158 2,460
editio
n 553 577 583 475 68 46 158 2,460
4,174 4,998 4,955 9,718 2,846 2,192 1,775 30,658
editio
n 4,174 4,998 4,955 9,718 2,846 2,192 1,775 30,658
64 60 157 138 46 51 37 553editio
n
64 60 157 138 46 51 37 55311 16 46 55 14 28 7 177ed
ition
11 16 46 55 14 28 7 177
avail
able
705 742 766 1,768 525 581 340 5,427
avail
able
705 742 766 1,768 525 581 340 5,427553 577 583 475 68 46 158 2,460
avail
able
553 577 583 475 68 46 158 2,4604,174 4,998 4,955 9,718 2,846 2,192 1,775 30,658
avail
able4,174 4,998 4,955 9,718 2,846 2,192 1,775 30,658
64 60 157 138 46 51 37 553
avail
able64 60 157 138 46 51 37 553
11 16 46 55 14 28 7 177
avail
able
11 16 46 55 14 28 7 177452 302 353 378 125 185 95 1,890
avail
able
452 302 353 378 125 185 95 1,89071 56 48 62 25 27 26 315
avail
able
71 56 48 62 25 27 26 31564 49 60 49 19 22 22 285
avail
able
64 49 60 49 19 22 22 285754 249 252 183 63 107 101 1,709
avail
able
754 249 252 183 63 107 101 1,709
avail
able
1,416 732 916 865 292 420 288 4,929
avail
able
1,416 732 916 865 292 420 288 4,929
436 873 748 3,139 927 672 389 7,184avail
able
436 873 748 3,139 927 672 389 7,184— 3 — 18 13 — 12 46av
ailab
le
— 3 — 18 13 — 12 4630 82 85 353 104 73 35 762av
ailab
le
30 82 85 353 104 73 35 76246 126 122 666 126 97 93 1,276av
ailab
le
46 126 122 666 126 97 93 1,276
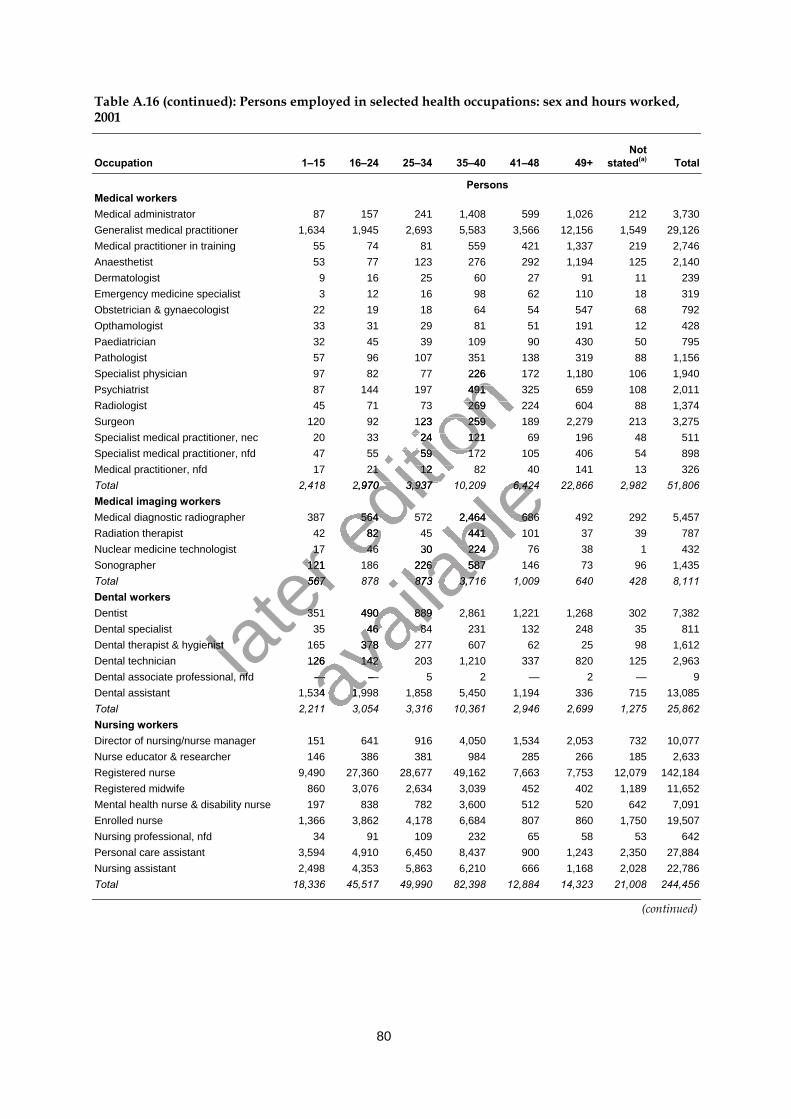
80
Table A.16 (continued): Persons employed in selected health occupations: sex and hours worked,2001
Occupation 1–15 16–24 25–34 35–40 41–48 49+Not
stated(a) Total
PersonsMedical workersMedical administrator 87 157 241 1,408 599 1,026 212 3,730Generalist medical practitioner 1,634 1,945 2,693 5,583 3,566 12,156 1,549 29,126Medical practitioner in training 55 74 81 559 421 1,337 219 2,746Anaesthetist 53 77 123 276 292 1,194 125 2,140Dermatologist 9 16 25 60 27 91 11 239Emergency medicine specialist 3 12 16 98 62 110 18 319Obstetrician & gynaecologist 22 19 18 64 54 547 68 792Opthamologist 33 31 29 81 51 191 12 428Paediatrician 32 45 39 109 90 430 50 795Pathologist 57 96 107 351 138 319 88 1,156Specialist physician 97 82 77 226 172 1,180 106 1,940Psychiatrist 87 144 197 491 325 659 108 2,011Radiologist 45 71 73 269 224 604 88 1,374Surgeon 120 92 123 259 189 2,279 213 3,275Specialist medical practitioner, nec 20 33 24 121 69 196 48 511Specialist medical practitioner, nfd 47 55 59 172 105 406 54 898Medical practitioner, nfd 17 21 12 82 40 141 13 326Total 2,418 2,970 3,937 10,209 6,424 22,866 2,982 51,806Medical imaging workersMedical diagnostic radiographer 387 564 572 2,464 686 492 292 5,457Radiation therapist 42 82 45 441 101 37 39 787Nuclear medicine technologist 17 46 30 224 76 38 1 432Sonographer 121 186 226 587 146 73 96 1,435Total 567 878 873 3,716 1,009 640 428 8,111Dental workersDentist 351 490 889 2,861 1,221 1,268 302 7,382Dental specialist 35 46 84 231 132 248 35 811Dental therapist & hygienist 165 378 277 607 62 25 98 1,612Dental technician 126 142 203 1,210 337 820 125 2,963Dental associate professional, nfd — — 5 2 — 2 — 9Dental assistant 1,534 1,998 1,858 5,450 1,194 336 715 13,085Total 2,211 3,054 3,316 10,361 2,946 2,699 1,275 25,862Nursing workersDirector of nursing/nurse manager 151 641 916 4,050 1,534 2,053 732 10,077Nurse educator & researcher 146 386 381 984 285 266 185 2,633Registered nurse 9,490 27,360 28,677 49,162 7,663 7,753 12,079 142,184Registered midwife 860 3,076 2,634 3,039 452 402 1,189 11,652Mental health nurse & disability nurse 197 838 782 3,600 512 520 642 7,091Enrolled nurse 1,366 3,862 4,178 6,684 807 860 1,750 19,507Nursing professional, nfd 34 91 109 232 65 58 53 642Personal care assistant 3,594 4,910 6,450 8,437 900 1,243 2,350 27,884Nursing assistant 2,498 4,353 5,863 6,210 666 1,168 2,028 22,786Total 18,336 45,517 49,990 82,398 12,884 14,323 21,008 244,456
(continued)
later
17 46 30 224 76 38 1 432
later
17 46 30 224 76 38 1 432121 186 226 587 146 73 96 1,435
later
121 186 226 587 146 73 96 1,435567 878 873 3,716 1,009 640 428 8,111
later 567 878 873 3,716 1,009 640 428 8,111
351 490 889 2,861 1,221 1,268 302 7,382
later 351 490 889 2,861 1,221 1,268 302 7,382
Dental therapist & hygienist later
Dental therapist & hygienist
Dental associate professional, nfdlater
Dental associate professional, nfd
editio
n 97 82 77 226 172 1,180 106 1,940
editio
n 97 82 77 226 172 1,180 106 1,94087 144 197 491 325 659 108 2,011
editio
n 87 144 197 491 325 659 108 2,01145 71 73 269 224 604 88 1,374
editio
n 45 71 73 269 224 604 88 1,374120 92 123 259 189 2,279 213 3,275
editio
n 120 92 123 259 189 2,279 213 3,27520 33 24 121 69 196 48 511
editio
n 20 33 24 121 69 196 48 51147 55 59 172 105 406 54 898
editio
n 47 55 59 172 105 406 54 89817 21 12 82 40 141 13 326
editio
n 17 21 12 82 40 141 13 326
2,418 2,970 3,937 10,209 6,424 22,866 2,982 51,806
editio
n 2,418 2,970 3,937 10,209 6,424 22,866 2,982 51,806
387 564 572 2,464 686 492 292 5,457editio
n 387 564 572 2,464 686 492 292 5,45742 82 45 441 101 37 39 787ed
ition
42 82 45 441 101 37 39 78717 46 30 224 76 38 1 432ed
ition
17 46 30 224 76 38 1 432
avail
able
17 21 12 82 40 141 13 326
avail
able
17 21 12 82 40 141 13 3262,418 2,970 3,937 10,209 6,424 22,866 2,982 51,806
avail
able
2,418 2,970 3,937 10,209 6,424 22,866 2,982 51,806
387 564 572 2,464 686 492 292 5,457
avail
able387 564 572 2,464 686 492 292 5,457
42 82 45 441 101 37 39 787
avail
able42 82 45 441 101 37 39 787
17 46 30 224 76 38 1 432
avail
able
17 46 30 224 76 38 1 432121 186 226 587 146 73 96 1,435
avail
able
121 186 226 587 146 73 96 1,435567 878 873 3,716 1,009 640 428 8,111
avail
able
567 878 873 3,716 1,009 640 428 8,111
351 490 889 2,861 1,221 1,268 302 7,382
avail
able
351 490 889 2,861 1,221 1,268 302 7,38235 46 84 231 132 248 35 811
avail
able
35 46 84 231 132 248 35 811
avail
able
165 378 277 607 62 25 98 1,612
avail
able
165 378 277 607 62 25 98 1,612126 142 203 1,210 337 820 125 2,963av
ailab
le
126 142 203 1,210 337 820 125 2,963— — 5 2 — 2 — 9av
ailab
le
— — 5 2 — 2 — 9avail
able
1,534 1,998 1,858 5,450 1,194 336 715 13,085avail
able
1,534 1,998 1,858 5,450 1,194 336 715 13,0852,211 3,054 3,316 10,361 2,946 2,699 1,275 25,862av
ailab
le
2,211 3,054 3,316 10,361 2,946 2,699 1,275 25,862
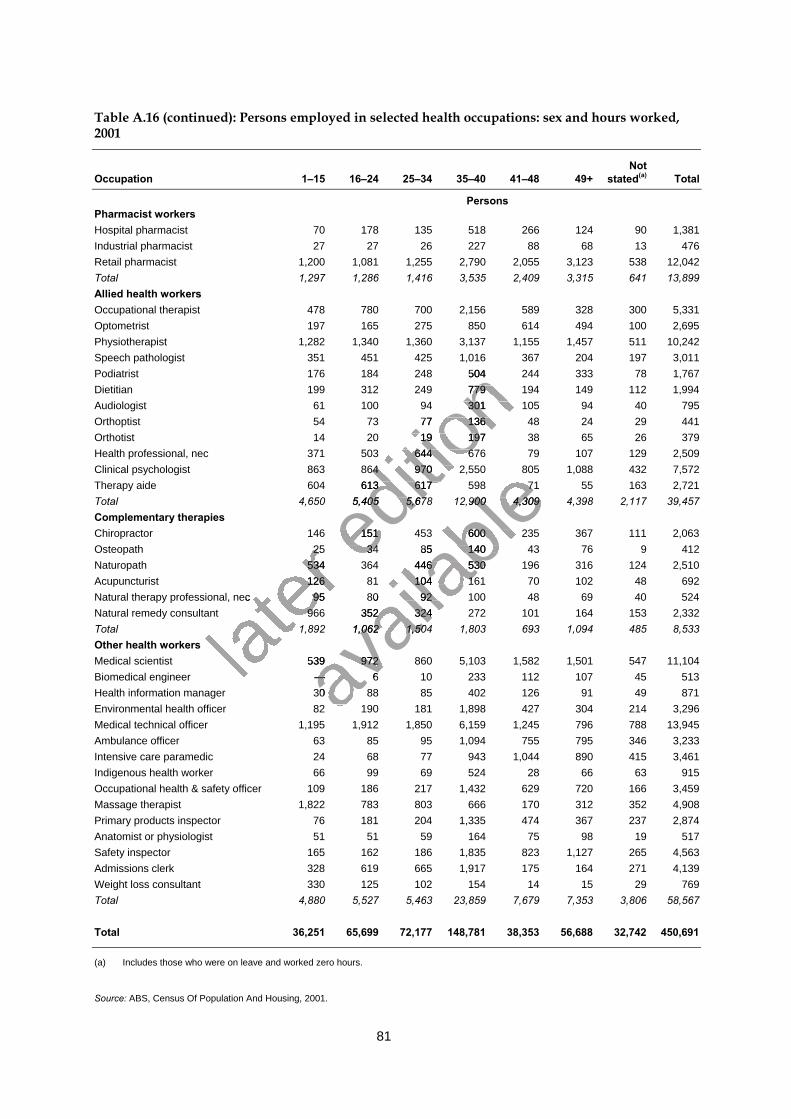
81
Table A.16 (continued): Persons employed in selected health occupations: sex and hours worked,2001
Occupation 1–15 16–24 25–34 35–40 41–48 49+Not
stated(a) Total
PersonsPharmacist workersHospital pharmacist 70 178 135 518 266 124 90 1,381Industrial pharmacist 27 27 26 227 88 68 13 476Retail pharmacist 1,200 1,081 1,255 2,790 2,055 3,123 538 12,042Total 1,297 1,286 1,416 3,535 2,409 3,315 641 13,899Allied health workersOccupational therapist 478 780 700 2,156 589 328 300 5,331Optometrist 197 165 275 850 614 494 100 2,695Physiotherapist 1,282 1,340 1,360 3,137 1,155 1,457 511 10,242Speech pathologist 351 451 425 1,016 367 204 197 3,011Podiatrist 176 184 248 504 244 333 78 1,767Dietitian 199 312 249 779 194 149 112 1,994Audiologist 61 100 94 301 105 94 40 795Orthoptist 54 73 77 136 48 24 29 441Orthotist 14 20 19 197 38 65 26 379Health professional, nec 371 503 644 676 79 107 129 2,509Clinical psychologist 863 864 970 2,550 805 1,088 432 7,572Therapy aide 604 613 617 598 71 55 163 2,721Total 4,650 5,405 5,678 12,900 4,309 4,398 2,117 39,457Complementary therapiesChiropractor 146 151 453 600 235 367 111 2,063Osteopath 25 34 85 140 43 76 9 412Naturopath 534 364 446 530 196 316 124 2,510Acupuncturist 126 81 104 161 70 102 48 692Natural therapy professional, nec 95 80 92 100 48 69 40 524Natural remedy consultant 966 352 324 272 101 164 153 2,332Total 1,892 1,062 1,504 1,803 693 1,094 485 8,533Other health workersMedical scientist 539 972 860 5,103 1,582 1,501 547 11,104Biomedical engineer — 6 10 233 112 107 45 513Health information manager 30 88 85 402 126 91 49 871Environmental health officer 82 190 181 1,898 427 304 214 3,296Medical technical officer 1,195 1,912 1,850 6,159 1,245 796 788 13,945Ambulance officer 63 85 95 1,094 755 795 346 3,233Intensive care paramedic 24 68 77 943 1,044 890 415 3,461Indigenous health worker 66 99 69 524 28 66 63 915Occupational health & safety officer 109 186 217 1,432 629 720 166 3,459Massage therapist 1,822 783 803 666 170 312 352 4,908Primary products inspector 76 181 204 1,335 474 367 237 2,874Anatomist or physiologist 51 51 59 164 75 98 19 517Safety inspector 165 162 186 1,835 823 1,127 265 4,563Admissions clerk 328 619 665 1,917 175 164 271 4,139Weight loss consultant 330 125 102 154 14 15 29 769Total 4,880 5,527 5,463 23,859 7,679 7,353 3,806 58,567
Total 36,251 65,699 72,177 148,781 38,353 56,688 32,742 450,691
(a) Includes those who were on leave and worked zero hours.
Source: ABS, Census Of Population And Housing, 2001.
later
25 34 85 140 43 76 9 412
later
25 34 85 140 43 76 9 412534 364 446 530 196 316 124 2,510
later
534 364 446 530 196 316 124 2,510126 81 104 161 70 102 48 692
later 126 81 104 161 70 102 48 692
Natural therapy professional, nec
later Natural therapy professional, nec 95 80 92 100 48 69 40 524
later 95 80 92 100 48 69 40 524
966 352 324 272 101 164 153 2,332
later 966 352 324 272 101 164 153 2,332
editio
n 176 184 248 504 244 333 78 1,767
editio
n 176 184 248 504 244 333 78 1,767199 312 249 779 194 149 112 1,994
editio
n 199 312 249 779 194 149 112 1,99461 100 94 301 105 94 40 795
editio
n 61 100 94 301 105 94 40 79554 73 77 136 48 24 29 441
editio
n 54 73 77 136 48 24 29 44114 20 19 197 38 65 26 379
editio
n 14 20 19 197 38 65 26 379
371 503 644 676 79 107 129 2,509
editio
n 371 503 644 676 79 107 129 2,509863 864 970 2,550 805 1,088 432 7,572
editio
n 863 864 970 2,550 805 1,088 432 7,572604 613 617 598 71 55 163 2,721
editio
n 604 613 617 598 71 55 163 2,721
4,650 5,405 5,678 12,900 4,309 4,398 2,117 39,457
editio
n 4,650 5,405 5,678 12,900 4,309 4,398 2,117 39,457
146 151 453 600 235 367 111 2,063editio
n
146 151 453 600 235 367 111 2,06325 34 85 140 43 76 9 412ed
ition
25 34 85 140 43 76 9 412
avail
able
863 864 970 2,550 805 1,088 432 7,572
avail
able
863 864 970 2,550 805 1,088 432 7,572604 613 617 598 71 55 163 2,721
avail
able
604 613 617 598 71 55 163 2,7214,650 5,405 5,678 12,900 4,309 4,398 2,117 39,457
avail
able4,650 5,405 5,678 12,900 4,309 4,398 2,117 39,457
146 151 453 600 235 367 111 2,063
avail
able146 151 453 600 235 367 111 2,063
25 34 85 140 43 76 9 412
avail
able
25 34 85 140 43 76 9 412534 364 446 530 196 316 124 2,510
avail
able
534 364 446 530 196 316 124 2,510126 81 104 161 70 102 48 692
avail
able
126 81 104 161 70 102 48 69295 80 92 100 48 69 40 524
avail
able
95 80 92 100 48 69 40 524966 352 324 272 101 164 153 2,332
avail
able
966 352 324 272 101 164 153 2,332
avail
able
1,892 1,062 1,504 1,803 693 1,094 485 8,533
avail
able
1,892 1,062 1,504 1,803 693 1,094 485 8,533
539 972 860 5,103 1,582 1,501 547 11,104avail
able
539 972 860 5,103 1,582 1,501 547 11,104— 6 10 233 112 107 45 513av
ailab
le
— 6 10 233 112 107 45 51330 88 85 402 126 91 49 871av
ailab
le
30 88 85 402 126 91 49 87182 190 181 1,898 427 304 214 3,296av
ailab
le
82 190 181 1,898 427 304 214 3,296
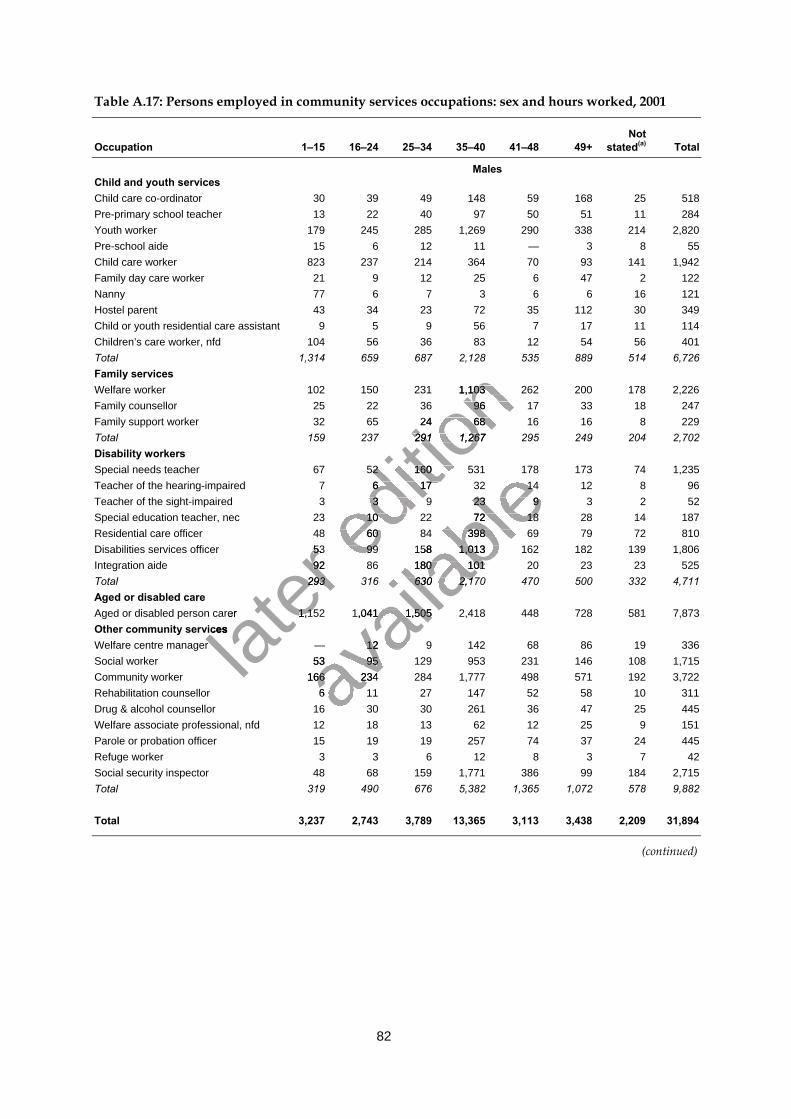
82
Table A.17: Persons employed in community services occupations: sex and hours worked, 2001
Occupation 1–15 16–24 25–34 35–40 41–48 49+Not
stated(a) Total
MalesChild and youth servicesChild care co-ordinator 30 39 49 148 59 168 25 518Pre-primary school teacher 13 22 40 97 50 51 11 284Youth worker 179 245 285 1,269 290 338 214 2,820Pre-school aide 15 6 12 11 — 3 8 55Child care worker 823 237 214 364 70 93 141 1,942Family day care worker 21 9 12 25 6 47 2 122Nanny 77 6 7 3 6 6 16 121Hostel parent 43 34 23 72 35 112 30 349Child or youth residential care assistant 9 5 9 56 7 17 11 114Children’s care worker, nfd 104 56 36 83 12 54 56 401Total 1,314 659 687 2,128 535 889 514 6,726Family servicesWelfare worker 102 150 231 1,103 262 200 178 2,226Family counsellor 25 22 36 96 17 33 18 247Family support worker 32 65 24 68 16 16 8 229Total 159 237 291 1,267 295 249 204 2,702Disability workersSpecial needs teacher 67 52 160 531 178 173 74 1,235Teacher of the hearing-impaired 7 6 17 32 14 12 8 96Teacher of the sight-impaired 3 3 9 23 9 3 2 52Special education teacher, nec 23 10 22 72 18 28 14 187Residential care officer 48 60 84 398 69 79 72 810Disabilities services officer 53 99 158 1,013 162 182 139 1,806Integration aide 92 86 180 101 20 23 23 525Total 293 316 630 2,170 470 500 332 4,711Aged or disabled careAged or disabled person carer 1,152 1,041 1,505 2,418 448 728 581 7,873Other community servicesWelfare centre manager — 12 9 142 68 86 19 336Social worker 53 95 129 953 231 146 108 1,715Community worker 166 234 284 1,777 498 571 192 3,722Rehabilitation counsellor 6 11 27 147 52 58 10 311Drug & alcohol counsellor 16 30 30 261 36 47 25 445Welfare associate professional, nfd 12 18 13 62 12 25 9 151Parole or probation officer 15 19 19 257 74 37 24 445Refuge worker 3 3 6 12 8 3 7 42Social security inspector 48 68 159 1,771 386 99 184 2,715Total 319 490 676 5,382 1,365 1,072 578 9,882
Total 3,237 2,743 3,789 13,365 3,113 3,438 2,209 31,894
(continued)
later
53 99 158 1,013 162 182 139 1,806
later
53 99 158 1,013 162 182 139 1,80692 86 180 101 20 23 23 525
later
92 86 180 101 20 23 23 525293 316 630 2,170 470 500 332 4,711
later 293 316 630 2,170 470 500 332 4,711
Aged or disabled person carer
later Aged or disabled person carer 1,152 1,041 1,505 2,418 448 728 581 7,873
later 1,152 1,041 1,505 2,418 448 728 581 7,873
Other community services later
Other community servicesWelfare centre manager lat
er Welfare centre manager
editio
n 102 150 231 1,103 262 200 178 2,226
editio
n 102 150 231 1,103 262 200 178 2,22625 22 36 96 17 33 18 247
editio
n 25 22 36 96 17 33 18 24732 65 24 68 16 16 8 229
editio
n 32 65 24 68 16 16 8 229159 237 291 1,267 295 249 204 2,702
editio
n 159 237 291 1,267 295 249 204 2,702
67 52 160 531 178 173 74 1,235
editio
n 67 52 160 531 178 173 74 1,235
7 6 17 32 14 12 8 96
editio
n 7 6 17 32 14 12 8 963 3 9 23 9 3 2 52
editio
n 3 3 9 23 9 3 2 52
23 10 22 72 18 28 14 187editio
n 23 10 22 72 18 28 14 18748 60 84 398 69 79 72 810ed
ition
48 60 84 398 69 79 72 81053 99 158 1,013 162 182 139 1,806ed
ition
53 99 158 1,013 162 182 139 1,806
avail
able
67 52 160 531 178 173 74 1,235
avail
able
67 52 160 531 178 173 74 1,2357 6 17 32 14 12 8 96
avail
able
7 6 17 32 14 12 8 963 3 9 23 9 3 2 52
avail
able3 3 9 23 9 3 2 52
23 10 22 72 18 28 14 187
avail
able23 10 22 72 18 28 14 187
48 60 84 398 69 79 72 810
avail
able48 60 84 398 69 79 72 810
53 99 158 1,013 162 182 139 1,806
avail
able
53 99 158 1,013 162 182 139 1,80692 86 180 101 20 23 23 525
avail
able
92 86 180 101 20 23 23 525293 316 630 2,170 470 500 332 4,711
avail
able
293 316 630 2,170 470 500 332 4,711
1,152 1,041 1,505 2,418 448 728 581 7,873
avail
able
1,152 1,041 1,505 2,418 448 728 581 7,873
avail
able
— 12 9 142 68 86 19 336
avail
able
— 12 9 142 68 86 19 33653 95 129 953 231 146 108 1,715av
ailab
le
53 95 129 953 231 146 108 1,715166 234 284 1,777 498 571 192 3,722av
ailab
le
166 234 284 1,777 498 571 192 3,7226 11 27 147 52 58 10 311av
ailab
le
6 11 27 147 52 58 10 31116 30 30 261 36 47 25 445av
ailab
le
16 30 30 261 36 47 25 445
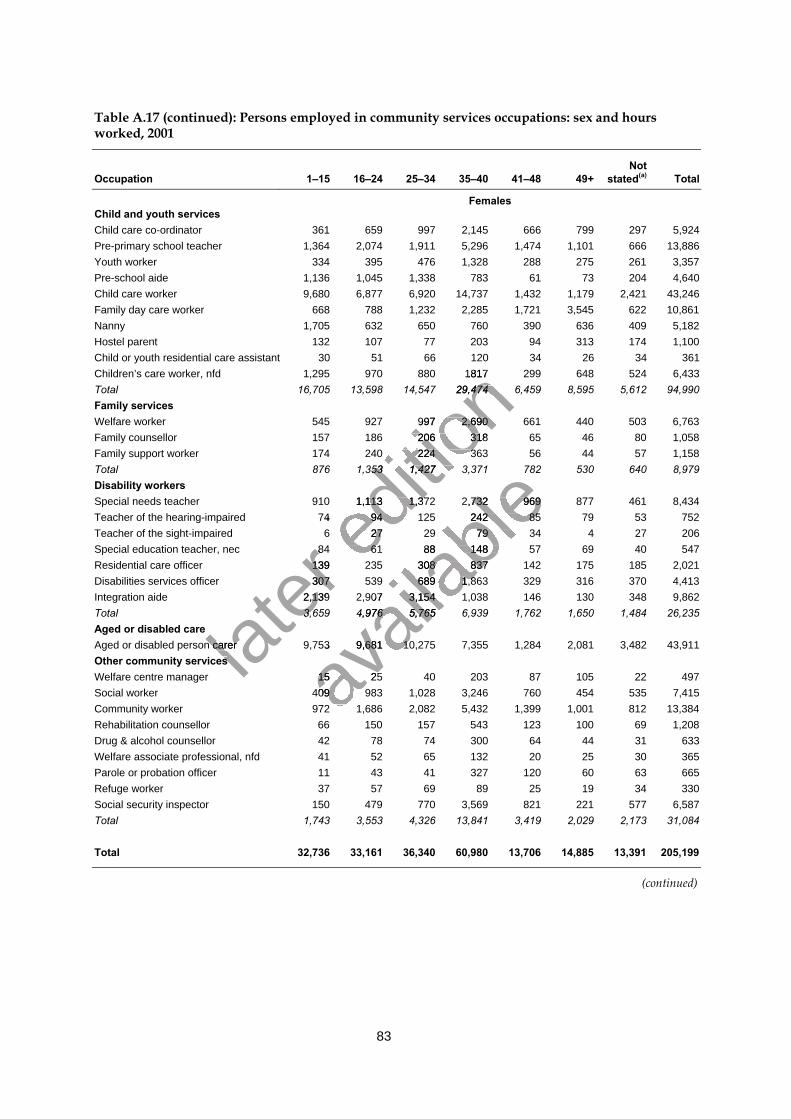
83
Table A.17 (continued): Persons employed in community services occupations: sex and hoursworked, 2001
Occupation 1–15 16–24 25–34 35–40 41–48 49+Not
stated(a) Total
FemalesChild and youth servicesChild care co-ordinator 361 659 997 2,145 666 799 297 5,924Pre-primary school teacher 1,364 2,074 1,911 5,296 1,474 1,101 666 13,886Youth worker 334 395 476 1,328 288 275 261 3,357Pre-school aide 1,136 1,045 1,338 783 61 73 204 4,640Child care worker 9,680 6,877 6,920 14,737 1,432 1,179 2,421 43,246Family day care worker 668 788 1,232 2,285 1,721 3,545 622 10,861Nanny 1,705 632 650 760 390 636 409 5,182Hostel parent 132 107 77 203 94 313 174 1,100Child or youth residential care assistant 30 51 66 120 34 26 34 361Children’s care worker, nfd 1,295 970 880 1817 299 648 524 6,433Total 16,705 13,598 14,547 29,474 6,459 8,595 5,612 94,990Family servicesWelfare worker 545 927 997 2,690 661 440 503 6,763Family counsellor 157 186 206 318 65 46 80 1,058Family support worker 174 240 224 363 56 44 57 1,158Total 876 1,353 1,427 3,371 782 530 640 8,979Disability workersSpecial needs teacher 910 1,113 1,372 2,732 969 877 461 8,434Teacher of the hearing-impaired 74 94 125 242 85 79 53 752Teacher of the sight-impaired 6 27 29 79 34 4 27 206Special education teacher, nec 84 61 88 148 57 69 40 547Residential care officer 139 235 308 837 142 175 185 2,021Disabilities services officer 307 539 689 1,863 329 316 370 4,413Integration aide 2,139 2,907 3,154 1,038 146 130 348 9,862Total 3,659 4,976 5,765 6,939 1,762 1,650 1,484 26,235Aged or disabled careAged or disabled person carer 9,753 9,681 10,275 7,355 1,284 2,081 3,482 43,911Other community servicesWelfare centre manager 15 25 40 203 87 105 22 497Social worker 409 983 1,028 3,246 760 454 535 7,415Community worker 972 1,686 2,082 5,432 1,399 1,001 812 13,384Rehabilitation counsellor 66 150 157 543 123 100 69 1,208Drug & alcohol counsellor 42 78 74 300 64 44 31 633Welfare associate professional, nfd 41 52 65 132 20 25 30 365Parole or probation officer 11 43 41 327 120 60 63 665Refuge worker 37 57 69 89 25 19 34 330Social security inspector 150 479 770 3,569 821 221 577 6,587Total 1,743 3,553 4,326 13,841 3,419 2,029 2,173 31,084
Total 32,736 33,161 36,340 60,980 13,706 14,885 13,391 205,199
(continued)
later
84 61 88 148 57 69 40 547
later
84 61 88 148 57 69 40 547139 235 308 837 142 175 185 2,021
later
139 235 308 837 142 175 185 2,021307 539 689 1,863 329 316 370 4,413
later 307 539 689 1,863 329 316 370 4,413
2,139 2,907 3,154 1,038 146 130 348 9,862
later 2,139 2,907 3,154 1,038 146 130 348 9,862
3,659 4,976 5,765 6,939 1,762 1,650 1,484 26,235
later 3,659 4,976 5,765 6,939 1,762 1,650 1,484 26,235
Aged or disabled person carerlater
Aged or disabled person carerOther community services lat
er Other community services
editio
n 1,295 970 880 1817 299 648 524 6,433
editio
n 1,295 970 880 1817 299 648 524 6,433
16,705 13,598 14,547 29,474 6,459 8,595 5,612 94,990
editio
n 16,705 13,598 14,547 29,474 6,459 8,595 5,612 94,990
545 927 997 2,690 661 440 503 6,763
editio
n 545 927 997 2,690 661 440 503 6,763157 186 206 318 65 46 80 1,058
editio
n 157 186 206 318 65 46 80 1,058174 240 224 363 56 44 57 1,158
editio
n 174 240 224 363 56 44 57 1,158876 1,353 1,427 3,371 782 530 640 8,979
editio
n 876 1,353 1,427 3,371 782 530 640 8,979
910 1,113 1,372 2,732 969 877 461 8,434
editio
n 910 1,113 1,372 2,732 969 877 461 8,434
74 94 125 242 85 79 53 752editio
n 74 94 125 242 85 79 53 7526 27 29 79 34 4 27 206ed
ition
6 27 29 79 34 4 27 20684 61 88 148 57 69 40 547ed
ition
84 61 88 148 57 69 40 547
avail
able
876 1,353 1,427 3,371 782 530 640 8,979
avail
able
876 1,353 1,427 3,371 782 530 640 8,979
910 1,113 1,372 2,732 969 877 461 8,434
avail
able910 1,113 1,372 2,732 969 877 461 8,434
74 94 125 242 85 79 53 752
avail
able74 94 125 242 85 79 53 752
6 27 29 79 34 4 27 206
avail
able6 27 29 79 34 4 27 206
84 61 88 148 57 69 40 547
avail
able
84 61 88 148 57 69 40 547139 235 308 837 142 175 185 2,021
avail
able
139 235 308 837 142 175 185 2,021307 539 689 1,863 329 316 370 4,413
avail
able
307 539 689 1,863 329 316 370 4,4132,139 2,907 3,154 1,038 146 130 348 9,862
avail
able
2,139 2,907 3,154 1,038 146 130 348 9,8623,659 4,976 5,765 6,939 1,762 1,650 1,484 26,235
avail
able
3,659 4,976 5,765 6,939 1,762 1,650 1,484 26,235
753 9,681 10,275 7,355 1,284 2,081 3,482 43,911
avail
able
753 9,681 10,275 7,355 1,284 2,081 3,482 43,911
avail
able
15 25 40 203 87 105 22 497avail
able
15 25 40 203 87 105 22 497409 983 1,028 3,246 760 454 535 7,415av
ailab
le
409 983 1,028 3,246 760 454 535 7,415972 1,686 2,082 5,432 1,399 1,001 812 13,384av
ailab
le
972 1,686 2,082 5,432 1,399 1,001 812 13,384
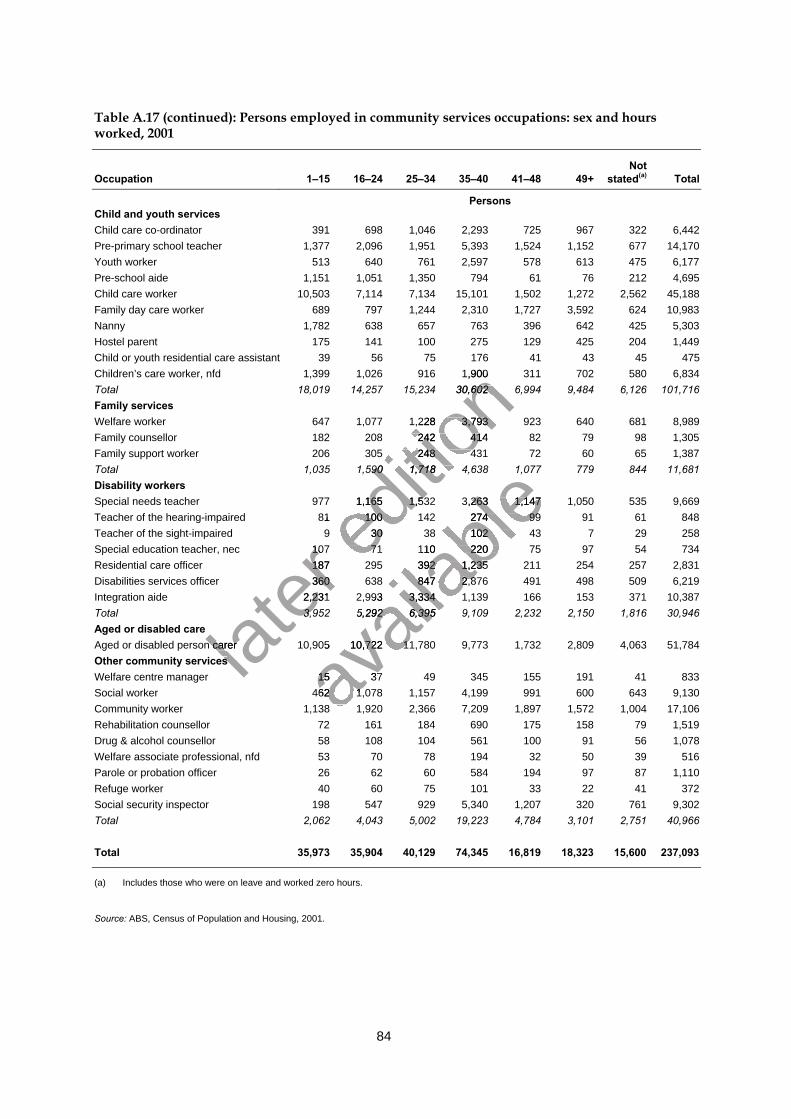
84
Table A.17 (continued): Persons employed in community services occupations: sex and hoursworked, 2001
Occupation 1–15 16–24 25–34 35–40 41–48 49+Not
stated(a) Total
PersonsChild and youth servicesChild care co-ordinator 391 698 1,046 2,293 725 967 322 6,442Pre-primary school teacher 1,377 2,096 1,951 5,393 1,524 1,152 677 14,170Youth worker 513 640 761 2,597 578 613 475 6,177Pre-school aide 1,151 1,051 1,350 794 61 76 212 4,695Child care worker 10,503 7,114 7,134 15,101 1,502 1,272 2,562 45,188Family day care worker 689 797 1,244 2,310 1,727 3,592 624 10,983Nanny 1,782 638 657 763 396 642 425 5,303Hostel parent 175 141 100 275 129 425 204 1,449Child or youth residential care assistant 39 56 75 176 41 43 45 475Children’s care worker, nfd 1,399 1,026 916 1,900 311 702 580 6,834Total 18,019 14,257 15,234 30,602 6,994 9,484 6,126 101,716Family servicesWelfare worker 647 1,077 1,228 3,793 923 640 681 8,989Family counsellor 182 208 242 414 82 79 98 1,305Family support worker 206 305 248 431 72 60 65 1,387Total 1,035 1,590 1,718 4,638 1,077 779 844 11,681Disability workersSpecial needs teacher 977 1,165 1,532 3,263 1,147 1,050 535 9,669Teacher of the hearing-impaired 81 100 142 274 99 91 61 848Teacher of the sight-impaired 9 30 38 102 43 7 29 258Special education teacher, nec 107 71 110 220 75 97 54 734Residential care officer 187 295 392 1,235 211 254 257 2,831Disabilities services officer 360 638 847 2,876 491 498 509 6,219Integration aide 2,231 2,993 3,334 1,139 166 153 371 10,387Total 3,952 5,292 6,395 9,109 2,232 2,150 1,816 30,946Aged or disabled careAged or disabled person carer 10,905 10,722 11,780 9,773 1,732 2,809 4,063 51,784Other community servicesWelfare centre manager 15 37 49 345 155 191 41 833Social worker 462 1,078 1,157 4,199 991 600 643 9,130Community worker 1,138 1,920 2,366 7,209 1,897 1,572 1,004 17,106Rehabilitation counsellor 72 161 184 690 175 158 79 1,519Drug & alcohol counsellor 58 108 104 561 100 91 56 1,078Welfare associate professional, nfd 53 70 78 194 32 50 39 516Parole or probation officer 26 62 60 584 194 97 87 1,110Refuge worker 40 60 75 101 33 22 41 372Social security inspector 198 547 929 5,340 1,207 320 761 9,302Total 2,062 4,043 5,002 19,223 4,784 3,101 2,751 40,966
Total 35,973 35,904 40,129 74,345 16,819 18,323 15,600 237,093
(a) Includes those who were on leave and worked zero hours.
Source: ABS, Census of Population and Housing, 2001.
later
107 71 110 220 75 97 54 734
later
107 71 110 220 75 97 54 734187 295 392 1,235 211 254 257 2,831
later
187 295 392 1,235 211 254 257 2,831360 638 847 2,876 491 498 509 6,219
later 360 638 847 2,876 491 498 509 6,219
2,231 2,993 3,334 1,139 166 153 371 10,387
later 2,231 2,993 3,334 1,139 166 153 371 10,387
3,952 5,292 6,395 9,109 2,232 2,150 1,816 30,946
later 3,952 5,292 6,395 9,109 2,232 2,150 1,816 30,946
Aged or disabled person carerlater
Aged or disabled person carerOther community services lat
er Other community services
editio
n 1,399 1,026 916 1,900 311 702 580 6,834
editio
n 1,399 1,026 916 1,900 311 702 580 6,834
18,019 14,257 15,234 30,602 6,994 9,484 6,126 101,716
editio
n 18,019 14,257 15,234 30,602 6,994 9,484 6,126 101,716
647 1,077 1,228 3,793 923 640 681 8,989
editio
n 647 1,077 1,228 3,793 923 640 681 8,989182 208 242 414 82 79 98 1,305
editio
n 182 208 242 414 82 79 98 1,305206 305 248 431 72 60 65 1,387
editio
n 206 305 248 431 72 60 65 1,387
1,035 1,590 1,718 4,638 1,077 779 844 11,681
editio
n 1,035 1,590 1,718 4,638 1,077 779 844 11,681
977 1,165
editio
n 977 1,165 1,532 3,263 1,147 1,050 535 9,669
editio
n 1,532 3,263 1,147 1,050 535 9,669
81 100 142 274 99 91 61 848editio
n 81 100 142 274 99 91 61 8489 30 38 102 43 7 29 258ed
ition
9 30 38 102 43 7 29 258107 71 110 220 75 97 54 734ed
ition
107 71 110 220 75 97 54 734
avail
able
1,035 1,590 1,718 4,638 1,077 779 844 11,681
avail
able
1,035 1,590 1,718 4,638 1,077 779 844 11,681
1,532 3,263 1,147 1,050 535 9,669
avail
able1,532 3,263 1,147 1,050 535 9,669
81 100 142 274 99 91 61 848
avail
able81 100 142 274 99 91 61 848
9 30 38 102 43 7 29 258
avail
able9 30 38 102 43 7 29 258
107 71 110 220 75 97 54 734
avail
able
107 71 110 220 75 97 54 734187 295 392 1,235 211 254 257 2,831
avail
able
187 295 392 1,235 211 254 257 2,831360 638 847 2,876 491 498 509 6,219
avail
able
360 638 847 2,876 491 498 509 6,2192,231 2,993 3,334 1,139 166 153 371 10,387
avail
able
2,231 2,993 3,334 1,139 166 153 371 10,3873,952 5,292 6,395 9,109 2,232 2,150 1,816 30,946
avail
able
3,952 5,292 6,395 9,109 2,232 2,150 1,816 30,946
avail
able
905 10,722 11,780 9,773 1,732 2,809 4,063 51,784
avail
able
905 10,722 11,780 9,773 1,732 2,809 4,063 51,784
15 37 49 345 155 191 41 833avail
able
15 37 49 345 155 191 41 833462 1,078 1,157 4,199 991 600 643 9,130av
ailab
le
462 1,078 1,157 4,199 991 600 643 9,1301,138 1,920 2,366 7,209 1,897 1,572 1,004 17,106av
ailab
le
1,138 1,920 2,366 7,209 1,897 1,572 1,004 17,106
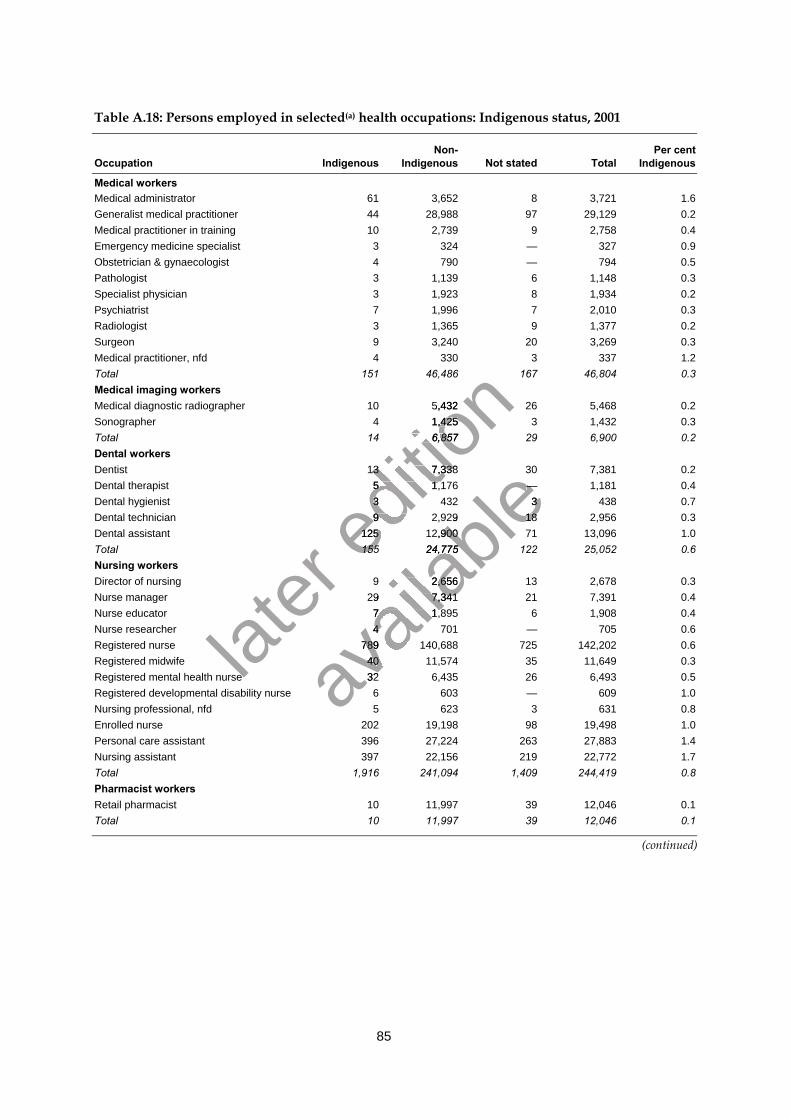
85
Table A.18: Persons employed in selected(a) health occupations: Indigenous status, 2001
Occupation IndigenousNon-
Indigenous Not stated TotalPer cent
Indigenous
Medical workersMedical administrator 61 3,652 8 3,721 1.6Generalist medical practitioner 44 28,988 97 29,129 0.2Medical practitioner in training 10 2,739 9 2,758 0.4Emergency medicine specialist 3 324 — 327 0.9Obstetrician & gynaecologist 4 790 — 794 0.5Pathologist 3 1,139 6 1,148 0.3Specialist physician 3 1,923 8 1,934 0.2Psychiatrist 7 1,996 7 2,010 0.3Radiologist 3 1,365 9 1,377 0.2Surgeon 9 3,240 20 3,269 0.3Medical practitioner, nfd 4 330 3 337 1.2Total 151 46,486 167 46,804 0.3Medical imaging workersMedical diagnostic radiographer 10 5,432 26 5,468 0.2Sonographer 4 1,425 3 1,432 0.3Total 14 6,857 29 6,900 0.2Dental workersDentist 13 7,338 30 7,381 0.2Dental therapist 5 1,176 — 1,181 0.4Dental hygienist 3 432 3 438 0.7Dental technician 9 2,929 18 2,956 0.3Dental assistant 125 12,900 71 13,096 1.0Total 155 24,775 122 25,052 0.6Nursing workersDirector of nursing 9 2,656 13 2,678 0.3Nurse manager 29 7,341 21 7,391 0.4Nurse educator 7 1,895 6 1,908 0.4Nurse researcher 4 701 — 705 0.6Registered nurse 789 140,688 725 142,202 0.6Registered midwife 40 11,574 35 11,649 0.3Registered mental health nurse 32 6,435 26 6,493 0.5Registered developmental disability nurse 6 603 — 609 1.0Nursing professional, nfd 5 623 3 631 0.8Enrolled nurse 202 19,198 98 19,498 1.0Personal care assistant 396 27,224 263 27,883 1.4Nursing assistant 397 22,156 219 22,772 1.7Total 1,916 241,094 1,409 244,419 0.8Pharmacist workersRetail pharmacist 10 11,997 39 12,046 0.1Total 10 11,997 39 12,046 0.1
(continued)
later
Registered mental health nurselater
Registered mental health nurse
editio
n 10 5,432
editio
n 10 5,4324 1,425
editio
n 4 1,42514 6,857
editio
n 14 6,857
13 7,338
editio
n 13 7,3385 1,176
editio
n 5 1,1763
editio
n 39 2,929ed
ition
9 2,929125 12,900ed
ition
125 12,900155 24,775ed
ition
155 24,775
avail
able
— 1,181
avail
able
— 1,1813
avail
able3
9 2,929
avail
able9 2,929 18 2,956
avail
able18 2,956
125 12,900
avail
able125 12,900
155 24,775
avail
able
155 24,775
9 2,656
avail
able
9 2,65629 7,341
avail
able
29 7,3417 1,895
avail
able
7 1,8954
avail
able
4789 140,688
avail
able
789 140,68840 11,574avail
able
40 11,57432 6,435avail
able
32 6,435
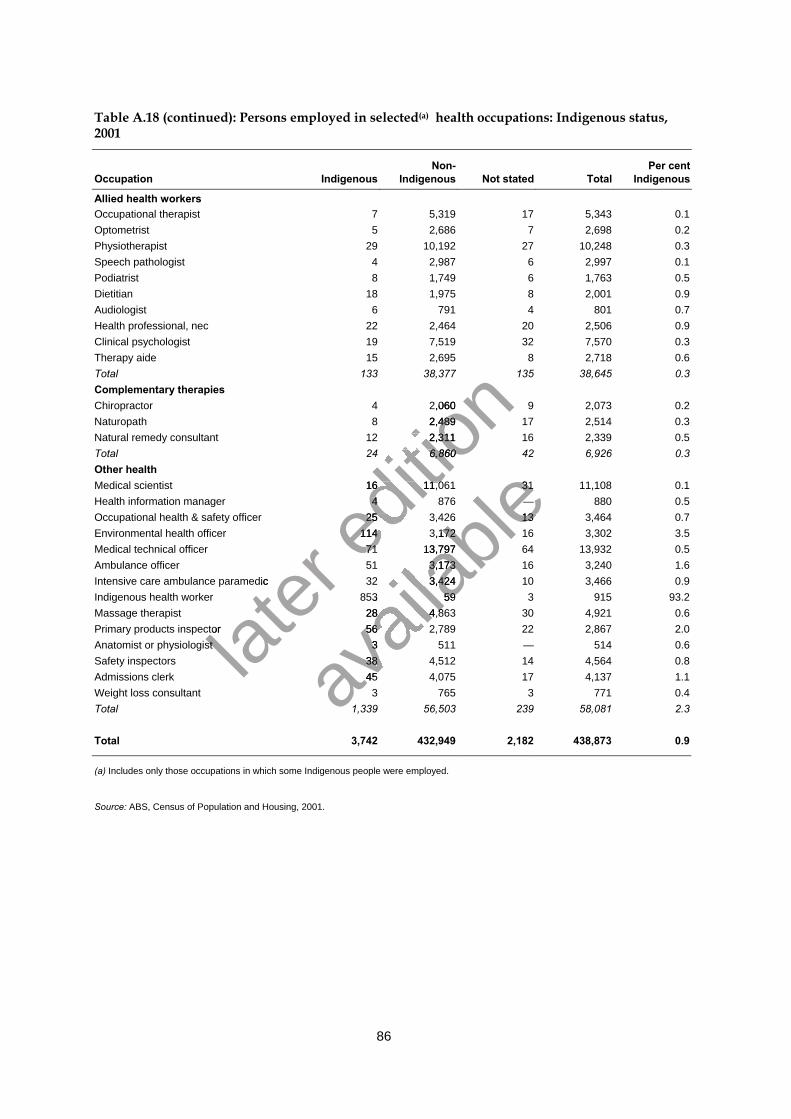
86
Table A.18 (continued): Persons employed in selected(a) health occupations: Indigenous status,2001
Occupation IndigenousNon-
Indigenous Not stated TotalPer cent
Indigenous
Allied health workersOccupational therapist 7 5,319 17 5,343 0.1Optometrist 5 2,686 7 2,698 0.2Physiotherapist 29 10,192 27 10,248 0.3Speech pathologist 4 2,987 6 2,997 0.1Podiatrist 8 1,749 6 1,763 0.5Dietitian 18 1,975 8 2,001 0.9Audiologist 6 791 4 801 0.7Health professional, nec 22 2,464 20 2,506 0.9Clinical psychologist 19 7,519 32 7,570 0.3Therapy aide 15 2,695 8 2,718 0.6Total 133 38,377 135 38,645 0.3Complementary therapiesChiropractor 4 2,060 9 2,073 0.2Naturopath 8 2,489 17 2,514 0.3Natural remedy consultant 12 2,311 16 2,339 0.5Total 24 6,860 42 6,926 0.3Other healthMedical scientist 16 11,061 31 11,108 0.1Health information manager 4 876 — 880 0.5Occupational health & safety officer 25 3,426 13 3,464 0.7Environmental health officer 114 3,172 16 3,302 3.5Medical technical officer 71 13,797 64 13,932 0.5Ambulance officer 51 3,173 16 3,240 1.6Intensive care ambulance paramedic 32 3,424 10 3,466 0.9Indigenous health worker 853 59 3 915 93.2Massage therapist 28 4,863 30 4,921 0.6Primary products inspector 56 2,789 22 2,867 2.0Anatomist or physiologist 3 511 — 514 0.6Safety inspectors 38 4,512 14 4,564 0.8Admissions clerk 45 4,075 17 4,137 1.1Weight loss consultant 3 765 3 771 0.4Total 1,339 56,503 239 58,081 2.3
Total 3,742 432,949 2,182 438,873 0.9
(a) Includes only those occupations in which some Indigenous people were employed.
Source: ABS, Census of Population and Housing, 2001.
later Intensive care ambulance paramedic
later Intensive care ambulance paramedic
Primary products inspector later
Primary products inspectorAnatomist or physiologist lat
er Anatomist or physiologist
editio
n 4 2,060
editio
n 4 2,0608 2,489
editio
n 8 2,48912 2,311
editio
n 12 2,31124 6,860
editio
n 24 6,860
16 11,061
editio
n 16 11,0614
editio
n 4
25 3,426editio
n 25 3,426
114 3,172editio
n
114 3,17271 13,797ed
ition
71 13,797
avail
able
31 11,108
avail
able
31 11,108—
avail
able—25 3,426
avail
able25 3,426 13 3,464
avail
able13 3,464
114 3,172
avail
able114 3,172
71 13,797
avail
able
71 13,79751 3,173
avail
able
51 3,17332 3,424
avail
able
32 3,424853
avail
able
853 59
avail
able
5928 4,863
avail
able
28 4,86356 2,789
avail
able
56 2,7893
avail
able
338 4,512avail
able
38 4,51245 4,075avail
able
45 4,075

87
Table A.19: Persons employed in community services occupations: Indigenous status, 2001
Occupation IndigenousNon-
Indigenous Not stated TotalPer cent
Indigenous
Child and youth servicesChild care co-ordinator 70 6,342 28 6,440 1.1Pre-primary school teacher 131 13,993 43 14,167 0.9Youth worker 435 5,695 38 6,168 7.1Pre-school aide 110 4,561 16 4,687 2.3Child care worker 958 43,992 243 45,193 2.1Family day care worker 110 10,822 54 10,986 1.0Nanny 50 5,227 27 5,304 0.9Hostel parent 53 1,381 15 1,449 3.7Child or youth residential care assistant 17 463 — 480 3.5Children’s care worker, nfd 310 6,449 66 6,825 4.5Total 2,244 98,925 530 101,699 2.2Family servicesWelfare worker 430 8,508 54 8,992 4.8Family counsellor 23 1,283 7 1,313 1.8Family support worker 228 1,147 8 1,383 16.5Total 681 10,938 69 11,688 5.8Disability workersSpecial needs teacher 35 9,583 44 9,662 0.4Teacher of the hearing-impaired 5 818 8 831 0.6Teacher of the sight-impaired — 239 — 239 —Special education teacher, nec 116 599 3 718 16.2Residential care officer 48 2,757 15 2,820 1.7Disabilities service officer 59 6,132 38 6,229 0.9Integration aide 94 10,249 45 10,388 0.9Total 357 30,377 153 30,887 1.2Aged or disabled careAged or disabled person carer 1,037 50,346 406 51,789 2.0Other community servicesWelfare centre manager 17 808 6 831 2.0Social worker 166 8,926 33 9,125 1.8Community worker 1,014 16,020 79 17,113 5.9Rehabilitation counsellor 12 1,516 5 1,533 0.8Drug and alcohol counsellor 96 993 5 1,094 8.8Welfare associate professional, nfd 39 484 4 527 7.4Parole or probation officer 42 1,064 4 1,110 3.8Refuge worker 80 285 — 365 21.9Social security inspector 509 8,762 32 9,303 5.5Total 1,975 38,858 168 41,001 4.8
Total 6,294 229,444 1,326 237,064 2.7
Source: ABS, Census of Population and Housing, 2001.
later Aged or disabled person carer
later Aged or disabled person carer
Other community services later
Other community servicesWelfare centre manager lat
er Welfare centre manager
editio
n 430 8,508
editio
n 430 8,50823 1,283
editio
n 23 1,283228 1,147
editio
n 228 1,147681 10,938
editio
n 681 10,938
35 9,583
editio
n 35 9,583
5
editio
n 5 818
editio
n 818
—
editio
n —
116editio
n 116
48 2,757editio
n
48 2,75759 6,132ed
ition
59 6,132
avail
able
8
avail
able
8—
avail
able—599
avail
able599 3
avail
able348 2,757
avail
able48 2,757
59 6,132
avail
able
59 6,132
avail
able
94 10,249
avail
able
94 10,249357 30,377
avail
able
357 30,377
1,037 50,346
avail
able
1,037 50,346
17
avail
able
17166 8,926avail
able
166 8,9261,014 16,020av
ailab
le
1,014 16,020
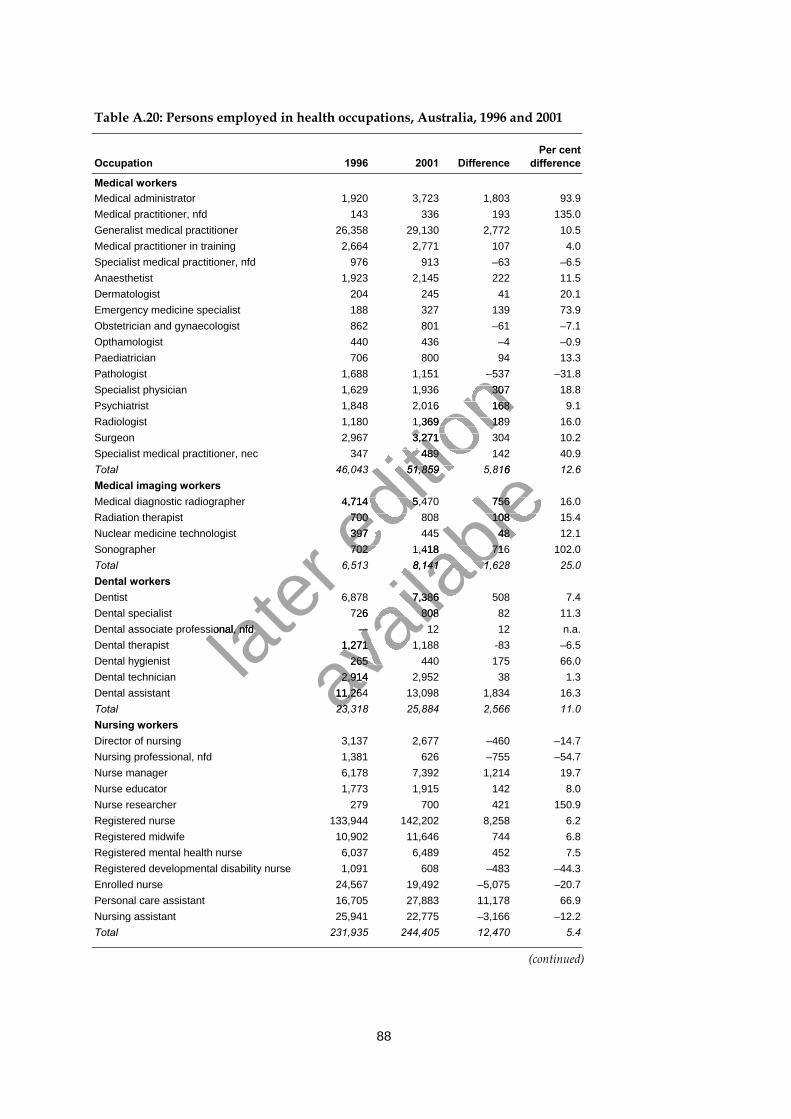
88
Table A.20: Persons employed in health occupations, Australia, 1996 and 2001
Occupation 1996 2001 DifferencePer cent
difference
Medical workersMedical administrator 1,920 3,723 1,803 93.9Medical practitioner, nfd 143 336 193 135.0Generalist medical practitioner 26,358 29,130 2,772 10.5Medical practitioner in training 2,664 2,771 107 4.0Specialist medical practitioner, nfd 976 913 –63 –6.5Anaesthetist 1,923 2,145 222 11.5Dermatologist 204 245 41 20.1Emergency medicine specialist 188 327 139 73.9Obstetrician and gynaecologist 862 801 –61 –7.1Opthamologist 440 436 –4 –0.9Paediatrician 706 800 94 13.3Pathologist 1,688 1,151 –537 –31.8Specialist physician 1,629 1,936 307 18.8Psychiatrist 1,848 2,016 168 9.1Radiologist 1,180 1,369 189 16.0Surgeon 2,967 3,271 304 10.2Specialist medical practitioner, nec 347 489 142 40.9Total 46,043 51,859 5,816 12.6Medical imaging workersMedical diagnostic radiographer 4,714 5,470 756 16.0Radiation therapist 700 808 108 15.4Nuclear medicine technologist 397 445 48 12.1Sonographer 702 1,418 716 102.0Total 6,513 8,141 1,628 25.0Dental workersDentist 6,878 7,386 508 7.4Dental specialist 726 808 82 11.3Dental associate professional, nfd –- 12 12 n.a.Dental therapist 1,271 1,188 -83 –6.5Dental hygienist 265 440 175 66.0Dental technician 2,914 2,952 38 1.3Dental assistant 11,264 13,098 1,834 16.3Total 23,318 25,884 2,566 11.0Nursing workersDirector of nursing 3,137 2,677 –460 –14.7Nursing professional, nfd 1,381 626 –755 –54.7Nurse manager 6,178 7,392 1,214 19.7Nurse educator 1,773 1,915 142 8.0Nurse researcher 279 700 421 150.9Registered nurse 133,944 142,202 8,258 6.2Registered midwife 10,902 11,646 744 6.8Registered mental health nurse 6,037 6,489 452 7.5Registered developmental disability nurse 1,091 608 –483 –44.3Enrolled nurse 24,567 19,492 –5,075 –20.7Personal care assistant 16,705 27,883 11,178 66.9Nursing assistant 25,941 22,775 –3,166 –12.2Total 231,935 244,405 12,470 5.4
(continued)
later
Dental associate professional, nfdlater
Dental associate professional, nfd
editio
n 1,688 1,151 –537 –31.8
editio
n 1,688 1,151 –537 –31.81,629 1,936 307 18.8
editio
n 1,629 1,936 307 18.81,848 2,016 168
editio
n 1,848 2,016 1681,180 1,369 189 16.0
editio
n 1,180 1,369 189 16.02,967 3,271 304 10.2
editio
n 2,967 3,271 304 10.2
347 489 142 40.9
editio
n 347 489 142 40.9
46,043 51,859 5,816 12.6
editio
n 46,043 51,859 5,816 12.6
4,714 5,470 756 16.0
editio
n 4,714 5,470 756 16.0
700 808 108 15.4editio
n 700 808 108 15.4397 445ed
ition
397 445702 1,418 716 102.0ed
ition
702 1,418 716 102.0
avail
able
46,043 51,859 5,816 12.6
avail
able
46,043 51,859 5,816 12.6
4,714 5,470 756 16.0
avail
able4,714 5,470 756 16.0
700 808 108 15.4
avail
able700 808 108 15.4
397 445
avail
able397 445 48 12.1
avail
able48 12.1
702 1,418 716 102.0
avail
able
702 1,418 716 102.06,513 8,141 1,628 25.0
avail
able
6,513 8,141 1,628 25.0
6,878 7,386 508
avail
able
6,878 7,386 508726 808
avail
able
726 808–-
avail
able
–-1,271 1,188
avail
able
1,271 1,188265 440 175 66.0av
ailab
le
265 440 175 66.02,914 2,952av
ailab
le
2,914 2,95211,264 13,098 1,834 16.3av
ailab
le
11,264 13,098 1,834 16.323,318 25,884 2,566 11.0av
ailab
le
23,318 25,884 2,566 11.0
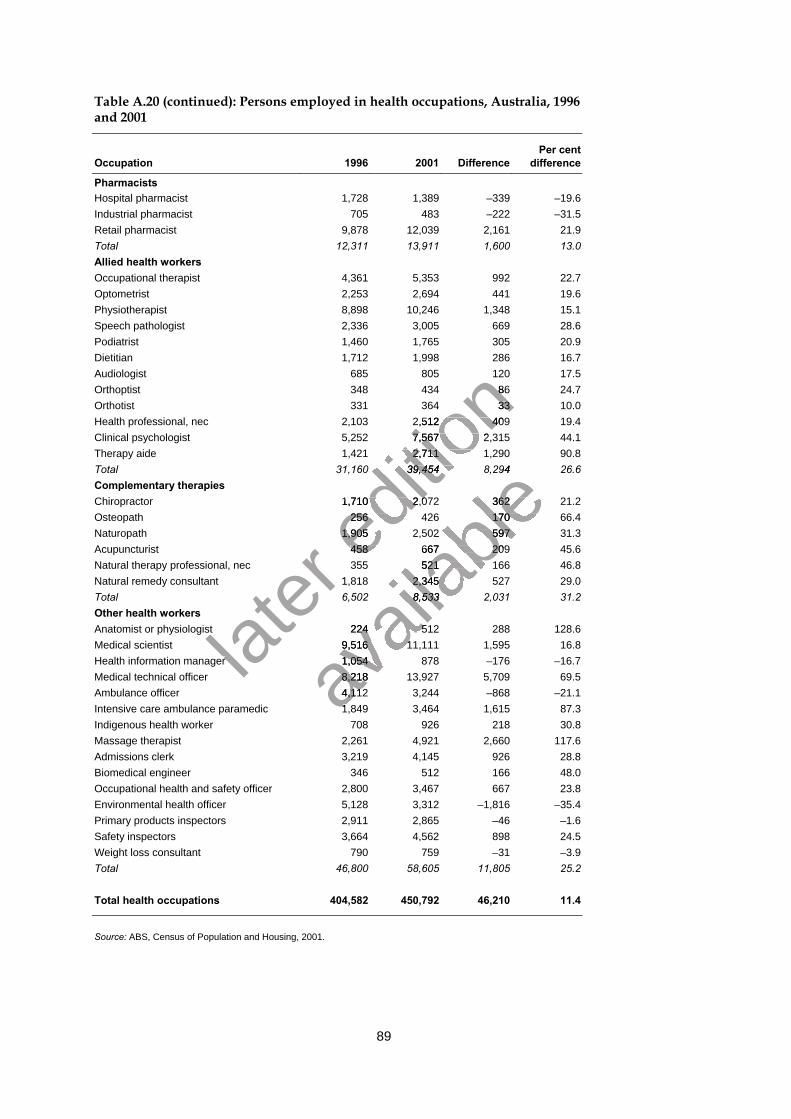
89
Table A.20 (continued): Persons employed in health occupations, Australia, 1996and 2001
Occupation 1996 2001 DifferencePer cent
difference
PharmacistsHospital pharmacist 1,728 1,389 –339 –19.6Industrial pharmacist 705 483 –222 –31.5Retail pharmacist 9,878 12,039 2,161 21.9Total 12,311 13,911 1,600 13.0Allied health workersOccupational therapist 4,361 5,353 992 22.7Optometrist 2,253 2,694 441 19.6Physiotherapist 8,898 10,246 1,348 15.1Speech pathologist 2,336 3,005 669 28.6Podiatrist 1,460 1,765 305 20.9Dietitian 1,712 1,998 286 16.7Audiologist 685 805 120 17.5Orthoptist 348 434 86 24.7Orthotist 331 364 33 10.0Health professional, nec 2,103 2,512 409 19.4Clinical psychologist 5,252 7,567 2,315 44.1Therapy aide 1,421 2,711 1,290 90.8Total 31,160 39,454 8,294 26.6Complementary therapiesChiropractor 1,710 2,072 362 21.2Osteopath 256 426 170 66.4Naturopath 1,905 2,502 597 31.3Acupuncturist 458 667 209 45.6Natural therapy professional, nec 355 521 166 46.8Natural remedy consultant 1,818 2,345 527 29.0Total 6,502 8,533 2,031 31.2Other health workersAnatomist or physiologist 224 512 288 128.6Medical scientist 9,516 11,111 1,595 16.8Health information manager 1,054 878 –176 –16.7Medical technical officer 8,218 13,927 5,709 69.5Ambulance officer 4,112 3,244 –868 –21.1Intensive care ambulance paramedic 1,849 3,464 1,615 87.3Indigenous health worker 708 926 218 30.8Massage therapist 2,261 4,921 2,660 117.6Admissions clerk 3,219 4,145 926 28.8Biomedical engineer 346 512 166 48.0Occupational health and safety officer 2,800 3,467 667 23.8Environmental health officer 5,128 3,312 –1,816 –35.4Primary products inspectors 2,911 2,865 –46 –1.6Safety inspectors 3,664 4,562 898 24.5Weight loss consultant 790 759 –31 –3.9Total 46,800 58,605 11,805 25.2
Total health occupations 404,582 450,792 46,210 11.4
Source: ABS, Census of Population and Housing, 2001.
later 1,818 2,345 527 29.0
later 1,818 2,345 527 29.0
Anatomist or physiologist later
Anatomist or physiologist
Health information manager later
Health information manager
editio
n 685 805 120 17.5
editio
n 685 805 120 17.5
86 24.7
editio
n 86 24.7331 364
editio
n 331 364 33 10.0
editio
n 33 10.02,103 2,512 409 19.4
editio
n 2,103 2,512 409 19.45,252 7,567 2,315 44.1
editio
n 5,252 7,567 2,315 44.11,421 2,711 1,290 90.8
editio
n 1,421 2,711 1,290 90.8
31,160 39,454 8,294 26.6
editio
n 31,160 39,454 8,294 26.6
1,710 2,072 362 21.2
editio
n 1,710 2,072 362 21.2
256 426 170 66.4editio
n 256 426 170 66.4
1,905 2,502 597 31.3editio
n
1,905 2,502 597 31.3458 667 209 45.6ed
ition
458 667 209 45.6
avail
able
31,160 39,454 8,294 26.6
avail
able
31,160 39,454 8,294 26.6
1,710 2,072 362 21.2
avail
able1,710 2,072 362 21.2
256 426 170 66.4
avail
able256 426 170 66.4
1,905 2,502 597 31.3
avail
able1,905 2,502 597 31.3
458 667 209 45.6
avail
able
458 667 209 45.6355 521 166 46.8
avail
able
355 521 166 46.81,818 2,345 527 29.0
avail
able
1,818 2,345 527 29.06,502 8,533 2,031 31.2
avail
able
6,502 8,533 2,031 31.2
224 512 288 128.6
avail
able
224 512 288 128.69,516 11,111 1,595 16.8
avail
able
9,516 11,111 1,595 16.81,054 878 –176 –16.7av
ailab
le
1,054 878 –176 –16.78,218 13,927 5,709 69.5av
ailab
le
8,218 13,927 5,709 69.54,112 3,244 –868 –21.1av
ailab
le
4,112 3,244 –868 –21.11,849 3,464 1,615 87.3av
ailab
le
1,849 3,464 1,615 87.3
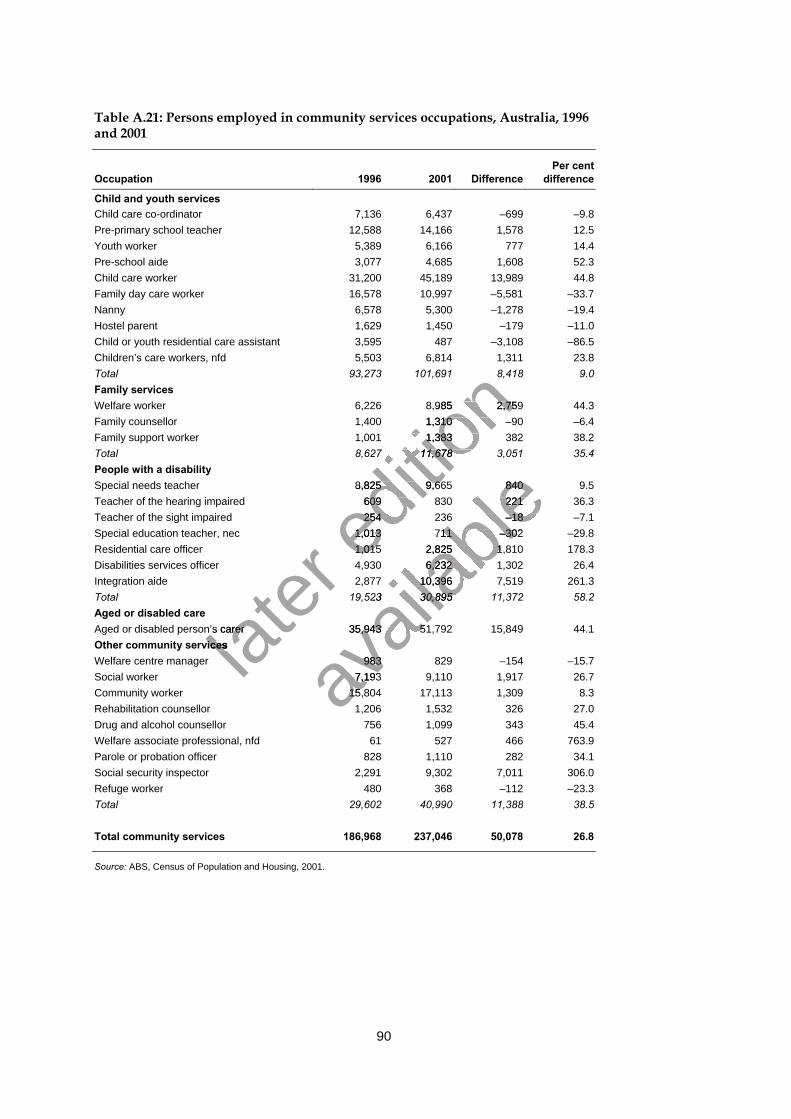
90
Table A.21: Persons employed in community services occupations, Australia, 1996and 2001
Occupation 1996 2001 DifferencePer cent
difference
Child and youth servicesChild care co-ordinator 7,136 6,437 –699 –9.8Pre-primary school teacher 12,588 14,166 1,578 12.5Youth worker 5,389 6,166 777 14.4Pre-school aide 3,077 4,685 1,608 52.3Child care worker 31,200 45,189 13,989 44.8Family day care worker 16,578 10,997 –5,581 –33.7Nanny 6,578 5,300 –1,278 –19.4Hostel parent 1,629 1,450 –179 –11.0Child or youth residential care assistant 3,595 487 –3,108 –86.5Children’s care workers, nfd 5,503 6,814 1,311 23.8Total 93,273 101,691 8,418 9.0Family servicesWelfare worker 6,226 8,985 2,759 44.3Family counsellor 1,400 1,310 –90 –6.4Family support worker 1,001 1,383 382 38.2Total 8,627 11,678 3,051 35.4People with a disabilitySpecial needs teacher 8,825 9,665 840 9.5Teacher of the hearing impaired 609 830 221 36.3Teacher of the sight impaired 254 236 –18 –7.1Special education teacher, nec 1,013 711 –302 –29.8Residential care officer 1,015 2,825 1,810 178.3Disabilities services officer 4,930 6,232 1,302 26.4Integration aide 2,877 10,396 7,519 261.3Total 19,523 30,895 11,372 58.2Aged or disabled careAged or disabled person’s carer 35,943 51,792 15,849 44.1Other community servicesWelfare centre manager 983 829 –154 –15.7Social worker 7,193 9,110 1,917 26.7Community worker 15,804 17,113 1,309 8.3Rehabilitation counsellor 1,206 1,532 326 27.0Drug and alcohol counsellor 756 1,099 343 45.4Welfare associate professional, nfd 61 527 466 763.9Parole or probation officer 828 1,110 282 34.1Social security inspector 2,291 9,302 7,011 306.0Refuge worker 480 368 –112 –23.3Total 29,602 40,990 11,388 38.5
Total community services 186,968 237,046 50,078 26.8
Source: ABS, Census of Population and Housing, 2001.
later
Aged or disabled person’s carerlater
Aged or disabled person’s carerOther community services lat
er Other community services
editio
n 93,273 101,691 8,418
editio
n 93,273 101,691 8,418
6,226 8,985 2,759 44.3
editio
n 6,226 8,985 2,759 44.31,400 1,310 –90 –6.4
editio
n 1,400 1,310 –90 –6.41,001 1,383 382 38.2
editio
n 1,001 1,383 382 38.28,627 11,678 3,051 35.4
editio
n 8,627 11,678 3,051 35.4
8,825 9,665 840
editio
n 8,825 9,665 840
609 830 221 36.3
editio
n 609 830 221 36.3254 236 –18 –7.1ed
ition
254 236 –18 –7.11,013 711 –302 –29.8ed
ition
1,013 711 –302 –29.81,015 2,825 1,810 178.3ed
ition
1,015 2,825 1,810 178.3
avail
able
8,825 9,665 840
avail
able
8,825 9,665 840609 830 221 36.3
avail
able609 830 221 36.3
254 236 –18 –7.1
avail
able254 236 –18 –7.1
1,013 711 –302 –29.8
avail
able1,013 711 –302 –29.8
1,015 2,825 1,810 178.3
avail
able
1,015 2,825 1,810 178.34,930 6,232 1,302 26.4
avail
able
4,930 6,232 1,302 26.42,877 10,396 7,519 261.3
avail
able
2,877 10,396 7,519 261.319,523 30,895 11,372 58.2
avail
able
19,523 30,895 11,372 58.2
35,943 51,792 15,849 44.1
avail
able
35,943 51,792 15,849 44.1
983 829 –154 –15.7avail
able
983 829 –154 –15.77,193 9,110 1,917 26.7avail
able
7,193 9,110 1,917 26.715,804 17,113 1,309av
ailab
le
15,804 17,113 1,309
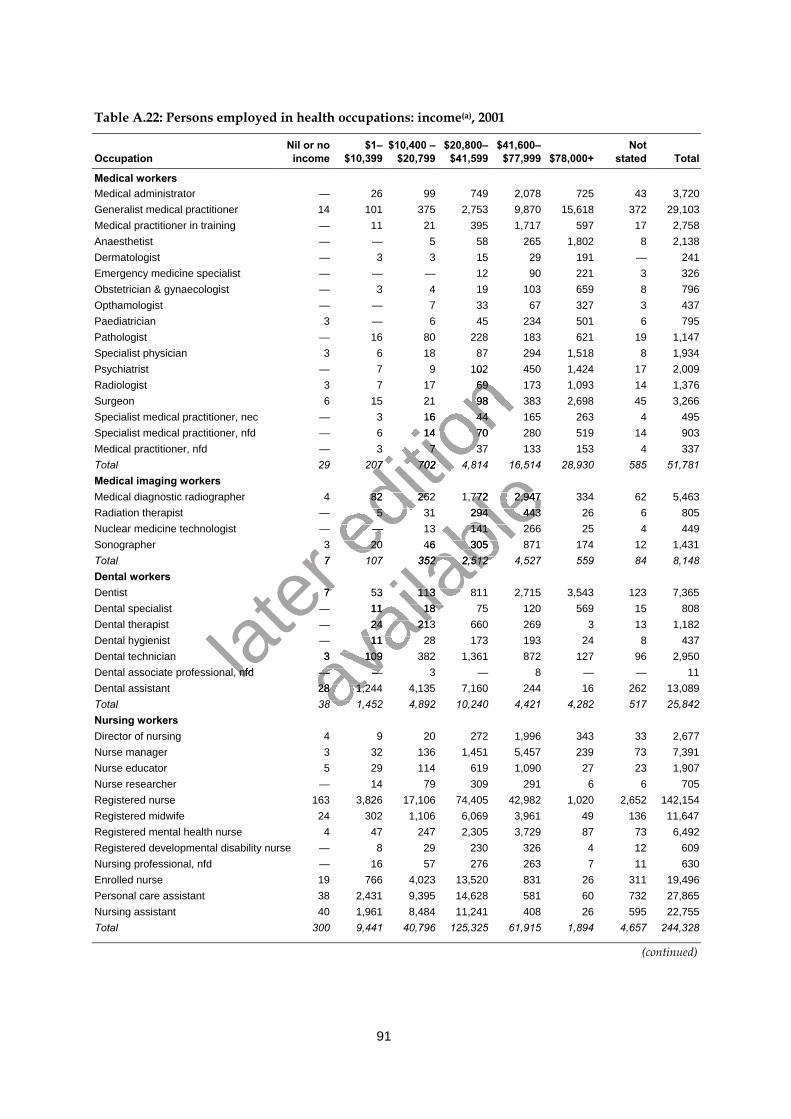
91
Table A.22: Persons employed in health occupations: income(a), 2001
OccupationNil or noincome
$1–$10,399
$10,400 –$20,799
$20,800–$41,599
$41,600–$77,999 $78,000+
Notstated Total
Medical workersMedical administrator — 26 99 749 2,078 725 43 3,720Generalist medical practitioner 14 101 375 2,753 9,870 15,618 372 29,103Medical practitioner in training — 11 21 395 1,717 597 17 2,758Anaesthetist — — 5 58 265 1,802 8 2,138Dermatologist — 3 3 15 29 191 — 241Emergency medicine specialist — — — 12 90 221 3 326Obstetrician & gynaecologist — 3 4 19 103 659 8 796Opthamologist — — 7 33 67 327 3 437Paediatrician 3 — 6 45 234 501 6 795Pathologist — 16 80 228 183 621 19 1,147Specialist physician 3 6 18 87 294 1,518 8 1,934Psychiatrist — 7 9 102 450 1,424 17 2,009Radiologist 3 7 17 69 173 1,093 14 1,376Surgeon 6 15 21 98 383 2,698 45 3,266Specialist medical practitioner, nec — 3 16 44 165 263 4 495Specialist medical practitioner, nfd — 6 14 70 280 519 14 903Medical practitioner, nfd — 3 7 37 133 153 4 337Total 29 207 702 4,814 16,514 28,930 585 51,781Medical imaging workersMedical diagnostic radiographer 4 82 262 1,772 2,947 334 62 5,463Radiation therapist — 5 31 294 443 26 6 805Nuclear medicine technologist — — 13 141 266 25 4 449Sonographer 3 20 46 305 871 174 12 1,431Total 7 107 352 2,512 4,527 559 84 8,148Dental workersDentist 7 53 113 811 2,715 3,543 123 7,365Dental specialist — 11 18 75 120 569 15 808Dental therapist — 24 213 660 269 3 13 1,182Dental hygienist — 11 28 173 193 24 8 437Dental technician 3 109 382 1,361 872 127 96 2,950Dental associate professional, nfd — — 3 — 8 — — 11Dental assistant 28 1,244 4,135 7,160 244 16 262 13,089Total 38 1,452 4,892 10,240 4,421 4,282 517 25,842Nursing workersDirector of nursing 4 9 20 272 1,996 343 33 2,677Nurse manager 3 32 136 1,451 5,457 239 73 7,391Nurse educator 5 29 114 619 1,090 27 23 1,907Nurse researcher — 14 79 309 291 6 6 705Registered nurse 163 3,826 17,106 74,405 42,982 1,020 2,652 142,154Registered midwife 24 302 1,106 6,069 3,961 49 136 11,647Registered mental health nurse 4 47 247 2,305 3,729 87 73 6,492Registered developmental disability nurse — 8 29 230 326 4 12 609Nursing professional, nfd — 16 57 276 263 7 11 630Enrolled nurse 19 766 4,023 13,520 831 26 311 19,496Personal care assistant 38 2,431 9,395 14,628 581 60 732 27,865Nursing assistant 40 1,961 8,484 11,241 408 26 595 22,755Total 300 9,441 40,796 125,325 61,915 1,894 4,657 244,328
(continued)
later
7 107 352 2,512 4,527 559 84 8,148
later
7 107 352 2,512 4,527 559 84 8,148
7 53 113 811 2,715 3,543 123 7,365
later 7 53 113 811 2,715 3,543 123 7,365
later
Dental associate professional, nfdlater
Dental associate professional, nfd
editio
n — 7 9 102 450 1,424 17 2,009
editio
n — 7 9 102 450 1,424 17 2,0093 7 17 69 173 1,093 14 1,376
editio
n 3 7 17 69 173 1,093 14 1,3766 15 21 98 383 2,698 45 3,266
editio
n 6 15 21 98 383 2,698 45 3,266— 3 16 44 165 263 4 495
editio
n — 3 16 44 165 263 4 495— 6 14 70 280 519 14 903
editio
n — 6 14 70 280 519 14 903— 3 7 37 133 153 4 337
editio
n — 3 7 37 133 153 4 33729 207 702 4,814 16,514 28,930 585 51,781
editio
n 29 207 702 4,814 16,514 28,930 585 51,781
4 82 262 1,772 2,947 334 62 5,463
editio
n 4 82 262 1,772 2,947 334 62 5,463
— 5 31 294 443 26 6 805editio
n — 5 31 294 443 26 6 805— — 13 141 266 25 4 449ed
ition
— — 13 141 266 25 4 4493 20 46 305 871 174 12 1,431ed
ition
3 20 46 305 871 174 12 1,4317 107 352 2,512 4,527 559 84 8,148ed
ition
7 107 352 2,512 4,527 559 84 8,148
avail
able
29 207 702 4,814 16,514 28,930 585 51,781
avail
able
29 207 702 4,814 16,514 28,930 585 51,781
4 82 262 1,772 2,947 334 62 5,463
avail
able4 82 262 1,772 2,947 334 62 5,463
— 5 31 294 443 26 6 805
avail
able— 5 31 294 443 26 6 805
— — 13 141 266 25 4 449
avail
able— — 13 141 266 25 4 449
3 20 46 305 871 174 12 1,431
avail
able3 20 46 305 871 174 12 1,431
7 107 352 2,512 4,527 559 84 8,148
avail
able
7 107 352 2,512 4,527 559 84 8,148
7 53 113 811 2,715 3,543 123 7,365
avail
able
7 53 113 811 2,715 3,543 123 7,365— 11 18 75 120 569 15 808
avail
able
— 11 18 75 120 569 15 808— 24 213 660 269 3 13 1,182
avail
able
— 24 213 660 269 3 13 1,182— 11 28 173 193 24 8 437
avail
able
— 11 28 173 193 24 8 437
avail
able
3 109 382 1,361 872 127 96 2,950
avail
able
3 109 382 1,361 872 127 96 2,950— — 3 — 8 — — 11av
ailab
le
— — 3 — 8 — — 1128 1,244 4,135 7,160 244 16 262 13,089av
ailab
le
28 1,244 4,135 7,160 244 16 262 13,089avail
able
38 1,452 4,892 10,240 4,421 4,282 517 25,842avail
able
38 1,452 4,892 10,240 4,421 4,282 517 25,842
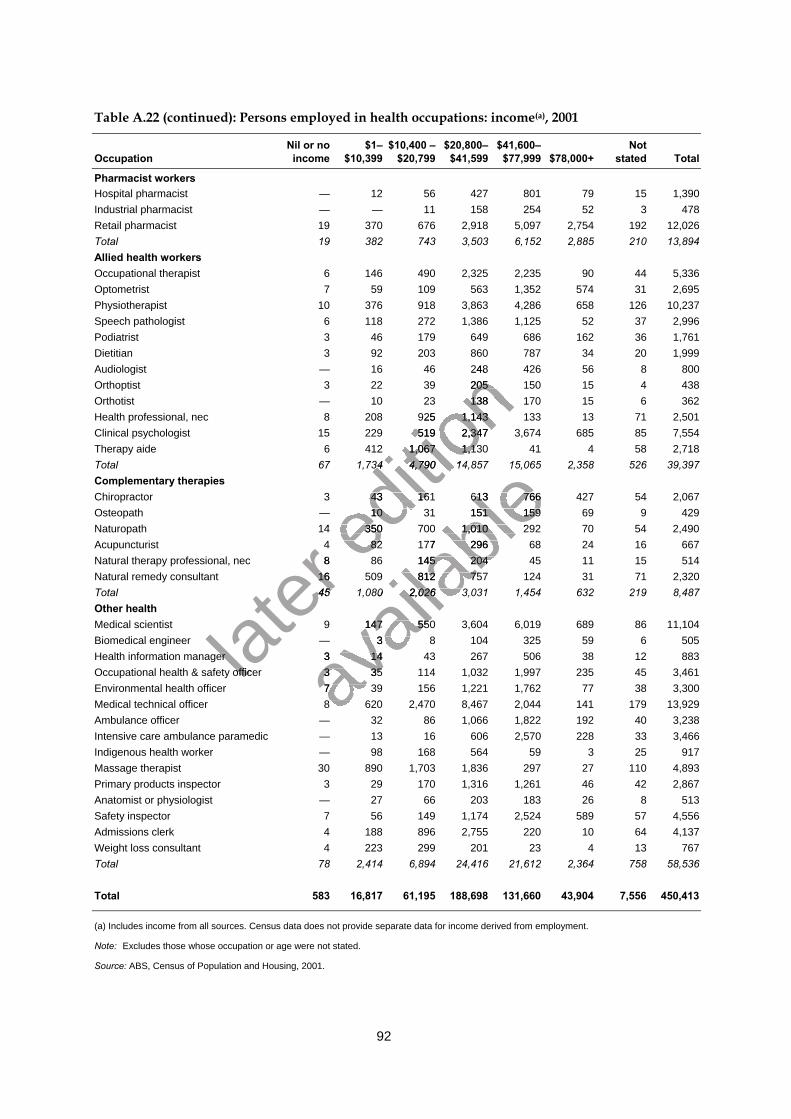
92
Table A.22 (continued): Persons employed in health occupations: income(a), 2001
OccupationNil or noincome
$1–$10,399
$10,400 –$20,799
$20,800–$41,599
$41,600–$77,999 $78,000+
Notstated Total
Pharmacist workersHospital pharmacist — 12 56 427 801 79 15 1,390Industrial pharmacist — — 11 158 254 52 3 478Retail pharmacist 19 370 676 2,918 5,097 2,754 192 12,026Total 19 382 743 3,503 6,152 2,885 210 13,894Allied health workersOccupational therapist 6 146 490 2,325 2,235 90 44 5,336Optometrist 7 59 109 563 1,352 574 31 2,695Physiotherapist 10 376 918 3,863 4,286 658 126 10,237Speech pathologist 6 118 272 1,386 1,125 52 37 2,996Podiatrist 3 46 179 649 686 162 36 1,761Dietitian 3 92 203 860 787 34 20 1,999Audiologist — 16 46 248 426 56 8 800Orthoptist 3 22 39 205 150 15 4 438Orthotist — 10 23 138 170 15 6 362Health professional, nec 8 208 925 1,143 133 13 71 2,501Clinical psychologist 15 229 519 2,347 3,674 685 85 7,554Therapy aide 6 412 1,067 1,130 41 4 58 2,718Total 67 1,734 4,790 14,857 15,065 2,358 526 39,397Complementary therapiesChiropractor 3 43 161 613 766 427 54 2,067Osteopath — 10 31 151 159 69 9 429Naturopath 14 350 700 1,010 292 70 54 2,490Acupuncturist 4 82 177 296 68 24 16 667Natural therapy professional, nec 8 86 145 204 45 11 15 514Natural remedy consultant 16 509 812 757 124 31 71 2,320Total 45 1,080 2,026 3,031 1,454 632 219 8,487Other healthMedical scientist 9 147 550 3,604 6,019 689 86 11,104Biomedical engineer — 3 8 104 325 59 6 505Health information manager 3 14 43 267 506 38 12 883Occupational health & safety officer 3 35 114 1,032 1,997 235 45 3,461Environmental health officer 7 39 156 1,221 1,762 77 38 3,300Medical technical officer 8 620 2,470 8,467 2,044 141 179 13,929Ambulance officer — 32 86 1,066 1,822 192 40 3,238Intensive care ambulance paramedic — 13 16 606 2,570 228 33 3,466Indigenous health worker — 98 168 564 59 3 25 917Massage therapist 30 890 1,703 1,836 297 27 110 4,893Primary products inspector 3 29 170 1,316 1,261 46 42 2,867Anatomist or physiologist — 27 66 203 183 26 8 513Safety inspector 7 56 149 1,174 2,524 589 57 4,556Admissions clerk 4 188 896 2,755 220 10 64 4,137Weight loss consultant 4 223 299 201 23 4 13 767Total 78 2,414 6,894 24,416 21,612 2,364 758 58,536
Total 583 16,817 61,195 188,698 131,660 43,904 7,556 450,413
(a) Includes income from all sources. Census data does not provide separate data for income derived from employment.
Note: Excludes those whose occupation or age were not stated.
Source: ABS, Census of Population and Housing, 2001.
later
8 86 145 204 45 11 15 514
later
8 86 145 204 45 11 15 51416 509 812 757 124 31 71 2,320
later 16 509 812 757 124 31 71 2,320
45 1,080 2,026 3,031 1,454 632 219 8,487
later 45 1,080 2,026 3,031 1,454 632 219 8,487
later
Health information manager later
Health information managerOccupational health & safety officerlat
er Occupational health & safety officer
editio
n — 16 46 248 426 56 8 800
editio
n — 16 46 248 426 56 8 8003 22 39 205 150 15 4 438
editio
n 3 22 39 205 150 15 4 438— 10 23 138 170 15 6 362
editio
n — 10 23 138 170 15 6 3628 208 925 1,143 133 13 71 2,501
editio
n 8 208 925 1,143 133 13 71 2,50115 229 519 2,347 3,674 685 85 7,554
editio
n 15 229 519 2,347 3,674 685 85 7,5546 412 1,067 1,130 41 4 58 2,718
editio
n 6 412 1,067 1,130 41 4 58 2,718
67 1,734 4,790 14,857 15,065 2,358 526 39,397
editio
n 67 1,734 4,790 14,857 15,065 2,358 526 39,397
3 43 161 613 766 427 54 2,067
editio
n 3 43 161 613 766 427 54 2,067
— 10 31 151 159 69 9 429editio
n — 10 31 151 159 69 9 42914 350 700 1,010 292 70 54 2,490ed
ition
14 350 700 1,010 292 70 54 2,4904 82 177 296 68 24 16 667ed
ition
4 82 177 296 68 24 16 6678 86 145 204 45 11 15 514ed
ition
8 86 145 204 45 11 15 514
avail
able
67 1,734 4,790 14,857 15,065 2,358 526 39,397
avail
able
67 1,734 4,790 14,857 15,065 2,358 526 39,397
3 43 161 613 766 427 54 2,067
avail
able3 43 161 613 766 427 54 2,067
— 10 31 151 159 69 9 429
avail
able— 10 31 151 159 69 9 429
14 350 700 1,010 292 70 54 2,490
avail
able14 350 700 1,010 292 70 54 2,490
4 82 177 296 68 24 16 667
avail
able4 82 177 296 68 24 16 667
8 86 145 204 45 11 15 514
avail
able
8 86 145 204 45 11 15 51416 509 812 757 124 31 71 2,320
avail
able
16 509 812 757 124 31 71 2,32045 1,080 2,026 3,031 1,454 632 219 8,487
avail
able
45 1,080 2,026 3,031 1,454 632 219 8,487
9 147 550 3,604 6,019 689 86 11,104
avail
able
9 147 550 3,604 6,019 689 86 11,104— 3 8 104 325 59 6 505
avail
able
— 3 8 104 325 59 6 5053 14 43 267 506 38 12 883
avail
able
3 14 43 267 506 38 12 8833 35 114 1,032 1,997 235 45 3,461av
ailab
le
3 35 114 1,032 1,997 235 45 3,461avail
able
7 39 156 1,221 1,762 77 38 3,300avail
able
7 39 156 1,221 1,762 77 38 3,3008 620 2,470 8,467 2,044 141 179 13,929av
ailab
le
8 620 2,470 8,467 2,044 141 179 13,929
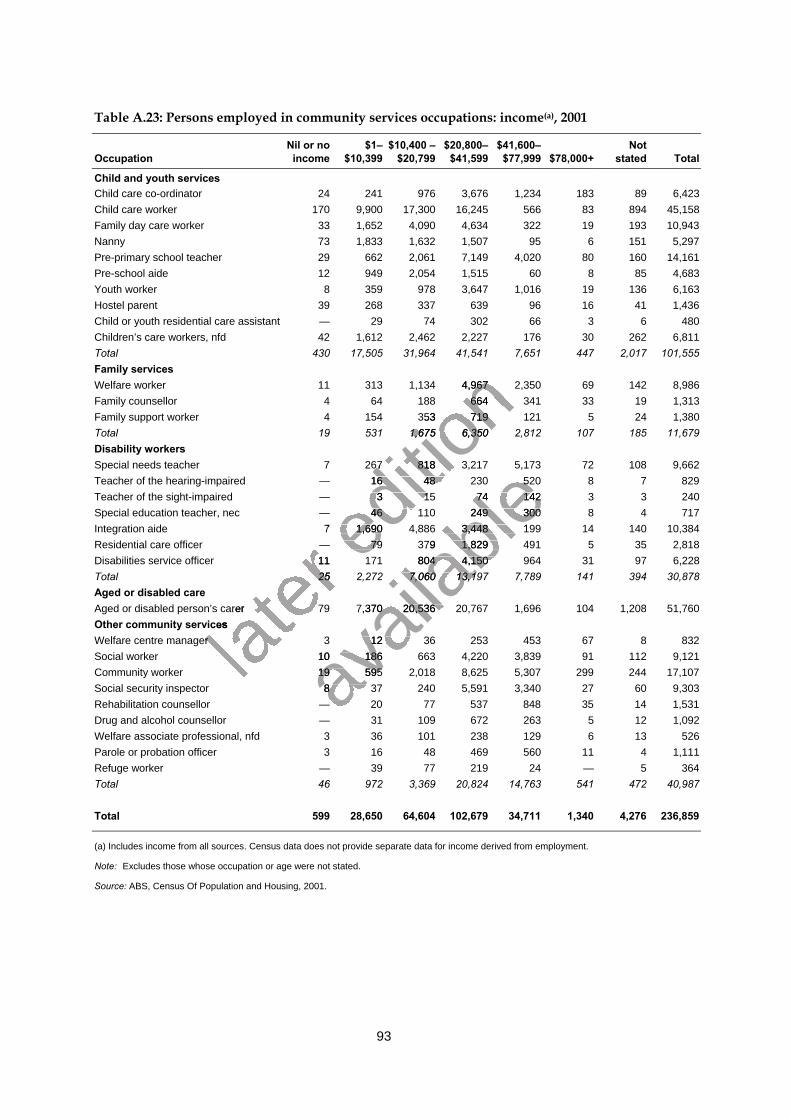
93
Table A.23: Persons employed in community services occupations: income(a), 2001
OccupationNil or noincome
$1–$10,399
$10,400 –$20,799
$20,800–$41,599
$41,600–$77,999 $78,000+
Notstated Total
Child and youth servicesChild care co-ordinator 24 241 976 3,676 1,234 183 89 6,423Child care worker 170 9,900 17,300 16,245 566 83 894 45,158Family day care worker 33 1,652 4,090 4,634 322 19 193 10,943Nanny 73 1,833 1,632 1,507 95 6 151 5,297Pre-primary school teacher 29 662 2,061 7,149 4,020 80 160 14,161Pre-school aide 12 949 2,054 1,515 60 8 85 4,683Youth worker 8 359 978 3,647 1,016 19 136 6,163Hostel parent 39 268 337 639 96 16 41 1,436Child or youth residential care assistant — 29 74 302 66 3 6 480Children’s care workers, nfd 42 1,612 2,462 2,227 176 30 262 6,811Total 430 17,505 31,964 41,541 7,651 447 2,017 101,555Family servicesWelfare worker 11 313 1,134 4,967 2,350 69 142 8,986Family counsellor 4 64 188 664 341 33 19 1,313Family support worker 4 154 353 719 121 5 24 1,380Total 19 531 1,675 6,350 2,812 107 185 11,679Disability workersSpecial needs teacher 7 267 818 3,217 5,173 72 108 9,662Teacher of the hearing-impaired — 16 48 230 520 8 7 829Teacher of the sight-impaired — 3 15 74 142 3 3 240Special education teacher, nec — 46 110 249 300 8 4 717Integration aide 7 1,690 4,886 3,448 199 14 140 10,384Residential care officer — 79 379 1,829 491 5 35 2,818Disabilities service officer 11 171 804 4,150 964 31 97 6,228Total 25 2,272 7,060 13,197 7,789 141 394 30,878Aged or disabled careAged or disabled person’s carer 79 7,370 20,536 20,767 1,696 104 1,208 51,760Other community servicesWelfare centre manager 3 12 36 253 453 67 8 832Social worker 10 186 663 4,220 3,839 91 112 9,121Community worker 19 595 2,018 8,625 5,307 299 244 17,107Social security inspector 8 37 240 5,591 3,340 27 60 9,303Rehabilitation counsellor — 20 77 537 848 35 14 1,531Drug and alcohol counsellor — 31 109 672 263 5 12 1,092Welfare associate professional, nfd 3 36 101 238 129 6 13 526Parole or probation officer 3 16 48 469 560 11 4 1,111Refuge worker — 39 77 219 24 — 5 364Total 46 972 3,369 20,824 14,763 541 472 40,987
Total 599 28,650 64,604 102,679 34,711 1,340 4,276 236,859
(a) Includes income from all sources. Census data does not provide separate data for income derived from employment.
Note: Excludes those whose occupation or age were not stated.
Source: ABS, Census Of Population and Housing, 2001.
later
11 171 804 4,150 964 31 97 6,228
later
11 171 804 4,150 964 31 97 6,22825 2,272 7,060 13,197 7,789 141 394 30,878
later 25 2,272 7,060 13,197 7,789 141 394 30,878
Aged or disabled person’s carer
later Aged or disabled person’s carer
Other community services
later Other community services
Welfare centre manager later
Welfare centre manager
editio
n 11 313 1,134 4,967 2,350 69 142 8,986
editio
n 11 313 1,134 4,967 2,350 69 142 8,9864 64 188 664 341 33 19 1,313
editio
n 4 64 188 664 341 33 19 1,3134 154 353 719 121 5 24 1,380
editio
n 4 154 353 719 121 5 24 1,38019 531 1,675 6,350 2,812 107 185 11,679
editio
n 19 531 1,675 6,350 2,812 107 185 11,679
7 267 818 3,217 5,173 72 108 9,662
editio
n 7 267 818 3,217 5,173 72 108 9,662
— 16 48 230 520 8 7 829
editio
n — 16 48 230 520 8 7 829— 3 15 74 142 3 3 240
editio
n — 3 15 74 142 3 3 240— 46 110 249 300 8 4 717ed
ition
— 46 110 249 300 8 4 7177 1,690 4,886 3,448 199 14 140 10,384ed
ition
7 1,690 4,886 3,448 199 14 140 10,384— 79 379 1,829 491 5 35 2,818ed
ition
— 79 379 1,829 491 5 35 2,81811 171 804 4,150 964 31 97 6,228ed
ition
11 171 804 4,150 964 31 97 6,228
avail
able
7 267 818 3,217 5,173 72 108 9,662
avail
able
7 267 818 3,217 5,173 72 108 9,662— 16 48 230 520 8 7 829
avail
able
— 16 48 230 520 8 7 829— 3 15 74 142 3 3 240
avail
able— 3 15 74 142 3 3 240
— 46 110 249 300 8 4 717
avail
able— 46 110 249 300 8 4 717
7 1,690 4,886 3,448 199 14 140 10,384
avail
able7 1,690 4,886 3,448 199 14 140 10,384
— 79 379 1,829 491 5 35 2,818
avail
able— 79 379 1,829 491 5 35 2,818
11 171 804 4,150 964 31 97 6,228
avail
able
11 171 804 4,150 964 31 97 6,22825 2,272 7,060 13,197 7,789 141 394 30,878
avail
able
25 2,272 7,060 13,197 7,789 141 394 30,878
79 7,370 20,536 20,767 1,696 104 1,208 51,760
avail
able
79 7,370 20,536 20,767 1,696 104 1,208 51,760
avail
able
3 12 36 253 453 67 8 832
avail
able
3 12 36 253 453 67 8 83210 186 663 4,220 3,839 91 112 9,121
avail
able
10 186 663 4,220 3,839 91 112 9,12119 595 2,018 8,625 5,307 299 244 17,107av
ailab
le
19 595 2,018 8,625 5,307 299 244 17,1078 37 240 5,591 3,340 27 60 9,303av
ailab
le
8 37 240 5,591 3,340 27 60 9,303avail
able
— 20 77 537 848 35 14 1,531avail
able
— 20 77 537 848 35 14 1,531
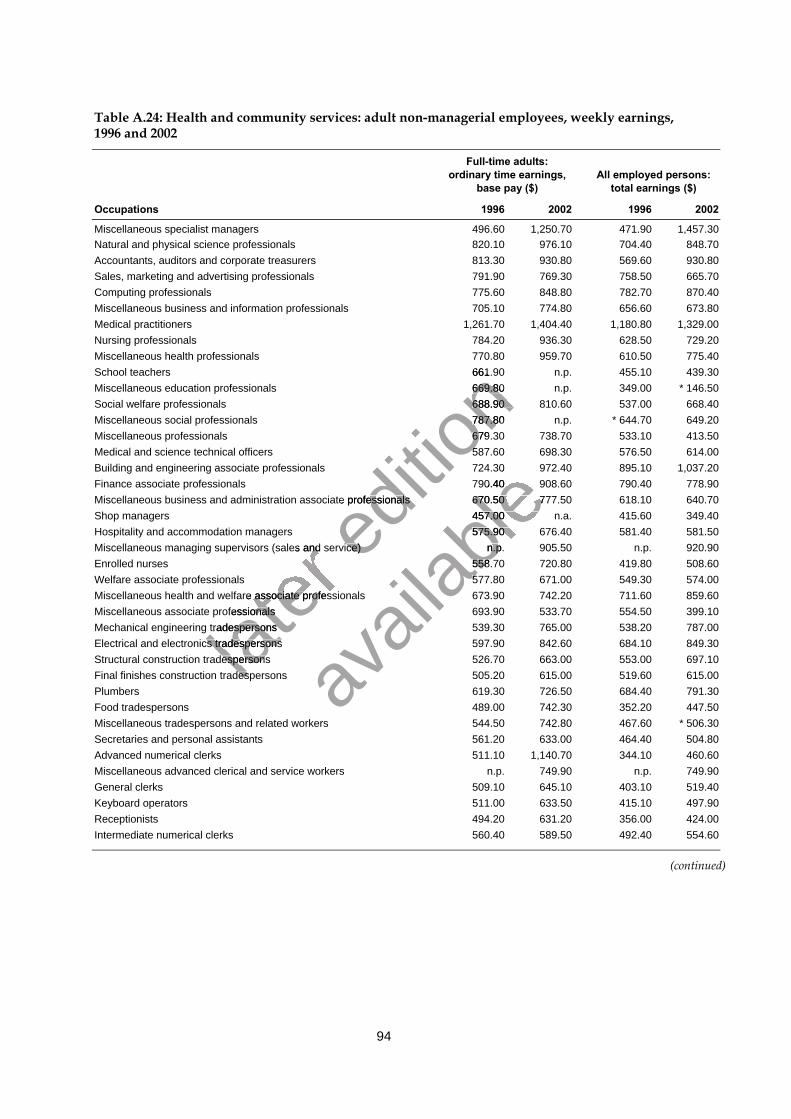
94
Table A.24: Health and community services: adult non-managerial employees, weekly earnings,1996 and 2002
Full-time adults:ordinary time earnings,
base pay ($)All employed persons:
total earnings ($)
Occupations 1996 2002 1996 2002
Miscellaneous specialist managers 496.60 1,250.70 471.90 1,457.30Natural and physical science professionals 820.10 976.10 704.40 848.70Accountants, auditors and corporate treasurers 813.30 930.80 569.60 930.80Sales, marketing and advertising professionals 791.90 769.30 758.50 665.70Computing professionals 775.60 848.80 782.70 870.40Miscellaneous business and information professionals 705.10 774.80 656.60 673.80Medical practitioners 1,261.70 1,404.40 1,180.80 1,329.00Nursing professionals 784.20 936.30 628.50 729.20Miscellaneous health professionals 770.80 959.70 610.50 775.40School teachers 661.90 n.p. 455.10 439.30Miscellaneous education professionals 669.80 n.p. 349.00 * 146.50Social welfare professionals 688.90 810.60 537.00 668.40Miscellaneous social professionals 787.80 n.p. * 644.70 649.20Miscellaneous professionals 679.30 738.70 533.10 413.50Medical and science technical officers 587.60 698.30 576.50 614.00Building and engineering associate professionals 724.30 972.40 895.10 1,037.20Finance associate professionals 790.40 908.60 790.40 778.90Miscellaneous business and administration associate professionals 670.50 777.50 618.10 640.70Shop managers 457.00 n.a. 415.60 349.40Hospitality and accommodation managers 575.90 676.40 581.40 581.50Miscellaneous managing supervisors (sales and service) n.p. 905.50 n.p. 920.90Enrolled nurses 558.70 720.80 419.80 508.60Welfare associate professionals 577.80 671.00 549.30 574.00Miscellaneous health and welfare associate professionals 673.90 742.20 711.60 859.60Miscellaneous associate professionals 693.90 533.70 554.50 399.10Mechanical engineering tradespersons 539.30 765.00 538.20 787.00Electrical and electronics tradespersons 597.90 842.60 684.10 849.30Structural construction tradespersons 526.70 663.00 553.00 697.10Final finishes construction tradespersons 505.20 615.00 519.60 615.00Plumbers 619.30 726.50 684.40 791.30Food tradespersons 489.00 742.30 352.20 447.50Miscellaneous tradespersons and related workers 544.50 742.80 467.60 * 506.30Secretaries and personal assistants 561.20 633.00 464.40 504.80Advanced numerical clerks 511.10 1,140.70 344.10 460.60Miscellaneous advanced clerical and service workers n.p. 749.90 n.p. 749.90General clerks 509.10 645.10 403.10 519.40Keyboard operators 511.00 633.50 415.10 497.90Receptionists 494.20 631.20 356.00 424.00Intermediate numerical clerks 560.40 589.50 492.40 554.60
(continued)
later
Miscellaneous managing supervisors (sales
later
Miscellaneous managing supervisors (sales and service)
later and service)
later Miscellaneous health and welfare associate professionals
later Miscellaneous health and welfare associate professionals
Miscellaneous associate professionals
later Miscellaneous associate professionals
Mechanical engineering tradespersonslater Mechanical engineering tradespersonslater
Electrical and electronics tradespersonslater
Electrical and electronics tradespersonsadespersonslat
er adespersons
tradespersonslater
tradespersons
editio
n 661.90 n.p. 455.10 439.30
editio
n 661.90 n.p. 455.10 439.30669.80 n.p. 349.00 * 146.50
editio
n 669.80 n.p. 349.00 * 146.50688.90 810.60 537.00 668.40
editio
n 688.90 810.60 537.00 668.40787.80 n.p. * 644.70 649.20
editio
n 787.80 n.p. * 644.70 649.20679.30 738.70 533.10 413.50
editio
n 679.30 738.70 533.10 413.50587.60 698.30 576.50 614.00
editio
n 587.60 698.30 576.50 614.00
Miscellaneous business and administration associate professionals
editio
n Miscellaneous business and administration associate professionals
and service)editio
n
and service)
avail
able
724.30 972.40 895.10 1,037.20
avail
able
724.30 972.40 895.10 1,037.20790.40 908.60 790.40 778.90
avail
able
790.40 908.60 790.40 778.90670.50 777.50 618.10 640.70
avail
able670.50 777.50 618.10 640.70
457.00 n.a. 415.60 349.40
avail
able457.00 n.a. 415.60 349.40
575.90 676.40 581.40 581.50
avail
able575.90 676.40 581.40 581.50
n.p. 905.50
avail
able
n.p. 905.50558.70 720.80 419.80 508.60
avail
able
558.70 720.80 419.80 508.60577.80 671.00 549.30 574.00
avail
able
577.80 671.00 549.30 574.00
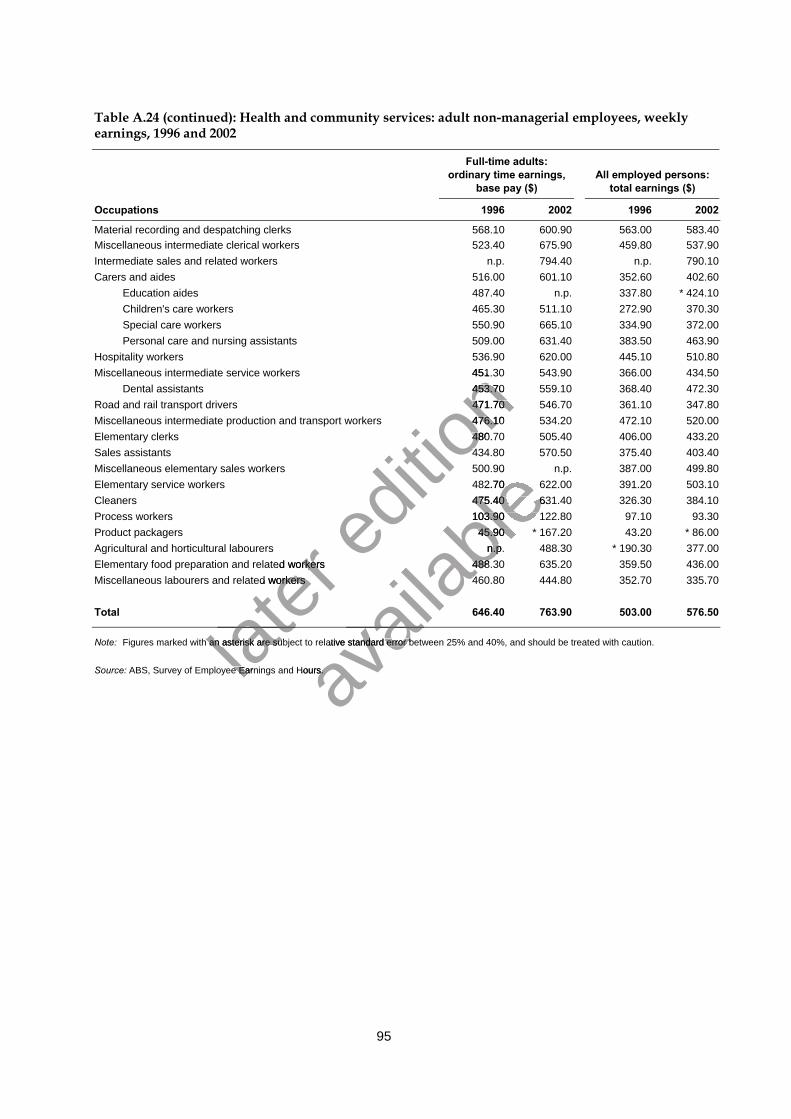
95
Table A.24 (continued): Health and community services: adult non-managerial employees, weeklyearnings, 1996 and 2002
Full-time adults:ordinary time earnings,
base pay ($)All employed persons:
total earnings ($)
Occupations 1996 2002 1996 2002
Material recording and despatching clerks 568.10 600.90 563.00 583.40Miscellaneous intermediate clerical workers 523.40 675.90 459.80 537.90Intermediate sales and related workers n.p. 794.40 n.p. 790.10Carers and aides 516.00 601.10 352.60 402.60
Education aides 487.40 n.p. 337.80 * 424.10Children's care workers 465.30 511.10 272.90 370.30Special care workers 550.90 665.10 334.90 372.00Personal care and nursing assistants 509.00 631.40 383.50 463.90
Hospitality workers 536.90 620.00 445.10 510.80Miscellaneous intermediate service workers 451.30 543.90 366.00 434.50
Dental assistants 453.70 559.10 368.40 472.30Road and rail transport drivers 471.70 546.70 361.10 347.80Miscellaneous intermediate production and transport workers 476.10 534.20 472.10 520.00Elementary clerks 480.70 505.40 406.00 433.20Sales assistants 434.80 570.50 375.40 403.40Miscellaneous elementary sales workers 500.90 n.p. 387.00 499.80Elementary service workers 482.70 622.00 391.20 503.10Cleaners 475.40 631.40 326.30 384.10Process workers 103.90 122.80 97.10 93.30Product packagers 45.90 * 167.20 43.20 * 86.00Agricultural and horticultural labourers n.p. 488.30 * 190.30 377.00Elementary food preparation and related workers 488.30 635.20 359.50 436.00Miscellaneous labourers and related workers 460.80 444.80 352.70 335.70
Total 646.40 763.90 503.00 576.50
Note: Figures marked with an asterisk are subject to relative standard error between 25% and 40%, and should be treated with caution.
Source: ABS, Survey of Employee Earnings and Hours.later
Elementary food preparation and related workers
later
Elementary food preparation and related workersMiscellaneous labourers and related workers
later Miscellaneous labourers and related workers
later
later
Figures marked with an asterisk are subject to relative standarlater
Figures marked with an asterisk are subject to relative standar
ABS, Survey of Employee Earnings and Hours.later
ABS, Survey of Employee Earnings and Hours.
editio
n 451.30 543.90 366.00 434.50
editio
n 451.30 543.90 366.00 434.50453.70 559.10 368.40 472.30
editio
n 453.70 559.10 368.40 472.30471.70 546.70 361.10 347.80
editio
n 471.70 546.70 361.10 347.80476.10 534.20 472.10 520.00
editio
n 476.10 534.20 472.10 520.00480.70 505.40 406.00 433.20
editio
n 480.70 505.40 406.00 433.20434.80 570.50 375.40 403.40
editio
n 434.80 570.50 375.40 403.40
avail
able
500.90 n.p. 387.00 499.80
avail
able
500.90 n.p. 387.00 499.80482.70 622.00 391.20 503.10
avail
able
482.70 622.00 391.20 503.10475.40 631.40 326.30 384.10
avail
able475.40 631.40 326.30 384.10
103.90 122.80 97.10 93.30
avail
able103.90 122.80 97.10 93.30
45.90 * 167.20 43.20 * 86.00
avail
able45.90 * 167.20 43.20 * 86.00
n.p. 488.30 * 190.30 377.00
avail
able
n.p. 488.30 * 190.30 377.00488.30 635.20 359.50 436.00
avail
able
488.30 635.20 359.50 436.00460.80 444.80 352.70 335.70
avail
able
460.80 444.80 352.70 335.70
avail
able
avail
able
Figures marked with an asterisk are subject to relative standar
avail
able
Figures marked with an asterisk are subject to relative standard error between 25% and 40%, and should be treated with caution.
avail
able
d error between 25% and 40%, and should be treated with caution.Figures marked with an asterisk are subject to relative standard error between 25% and 40%, and should be treated with caution.Figures marked with an asterisk are subject to relative standar
avail
able
Figures marked with an asterisk are subject to relative standard error between 25% and 40%, and should be treated with caution.Figures marked with an asterisk are subject to relative standar
ABS, Survey of Employee Earnings and Hours. avail
able
ABS, Survey of Employee Earnings and Hours.
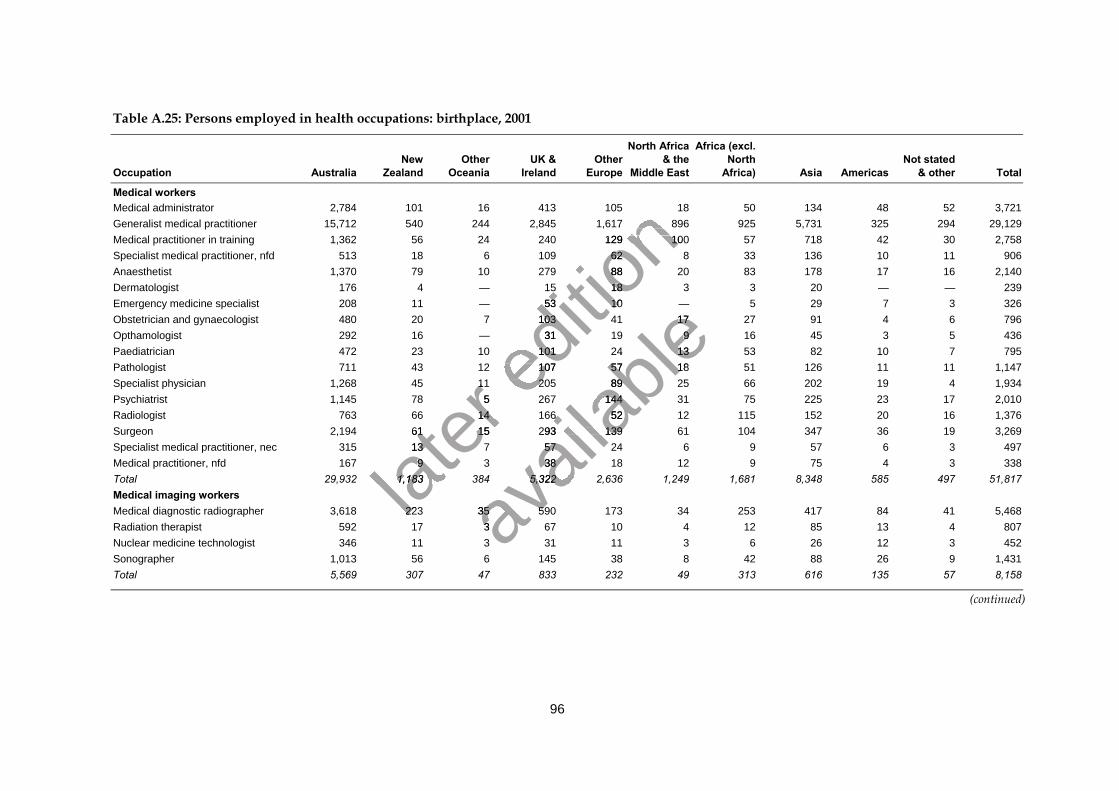
96
Table A.25: Persons employed in health occupations: birthplace, 2001
Occupation AustraliaNew
ZealandOther
OceaniaUK &
IrelandOther
Europe
North Africa& the
Middle East
Africa (excl.North
Africa) Asia AmericasNot stated
& other Total
Medical workersMedical administrator 2,784 101 16 413 105 18 50 134 48 52 3,721Generalist medical practitioner 15,712 540 244 2,845 1,617 896 925 5,731 325 294 29,129Medical practitioner in training 1,362 56 24 240 129 100 57 718 42 30 2,758Specialist medical practitioner, nfd 513 18 6 109 62 8 33 136 10 11 906Anaesthetist 1,370 79 10 279 88 20 83 178 17 16 2,140Dermatologist 176 4 — 15 18 3 3 20 — — 239Emergency medicine specialist 208 11 — 53 10 — 5 29 7 3 326Obstetrician and gynaecologist 480 20 7 103 41 17 27 91 4 6 796Opthamologist 292 16 — 31 19 9 16 45 3 5 436Paediatrician 472 23 10 101 24 13 53 82 10 7 795Pathologist 711 43 12 107 57 18 51 126 11 11 1,147Specialist physician 1,268 45 11 205 89 25 66 202 19 4 1,934Psychiatrist 1,145 78 5 267 144 31 75 225 23 17 2,010Radiologist 763 66 14 166 52 12 115 152 20 16 1,376Surgeon 2,194 61 15 293 139 61 104 347 36 19 3,269Specialist medical practitioner, nec 315 13 7 57 24 6 9 57 6 3 497Medical practitioner, nfd 167 9 3 38 18 12 9 75 4 3 338Total 29,932 1,183 384 5,322 2,636 1,249 1,681 8,348 585 497 51,817Medical imaging workersMedical diagnostic radiographer 3,618 223 35 590 173 34 253 417 84 41 5,468Radiation therapist 592 17 3 67 10 4 12 85 13 4 807Nuclear medicine technologist 346 11 3 31 11 3 6 26 12 3 452Sonographer 1,013 56 6 145 38 8 42 88 26 9 1,431Total 5,569 307 47 833 232 49 313 616 135 57 8,158
(continued)
later
11 205
later
11 2055 267 144
later
5 267 14414 166
later 14 166
61
later 61 15 293 139
later 15 293 139
13
later 13
9
later 9
29,932 1,183 384 5,322 2,636 1,249 1,681 8,348 585 497 51,817later
29,932 1,183 384 5,322 2,636 1,249 1,681 8,348 585 497 51,817
3,618 223later
3,618 223
editio
n 15,712 540 244 2,845 1,617 896 925 5,731 325 294 29,129
editio
n 15,712 540 244 2,845 1,617 896 925 5,731 325 294 29,12924 240 129 100
editio
n 24 240 129 10062
editio
n 6288
editio
n 8815
editio
n
15 18
editio
n
1853
editio
n
53 10
editio
n
107 103
editio
n 7 103
31
editio
n 31
10 101editio
n 10 10112 107ed
ition
12 10711 205ed
ition
11 2055 267 144ed
ition
5 267 144
avail
able
17
avail
able
179
avail
able924
avail
able24 13
avail
able13
57
avail
able57 18
avail
able18
89
avail
able
895 267 144
avail
able
5 267 14414 166
avail
able
14 166 52
avail
able
5215 293 139
avail
able
15 293 13957
avail
able
5738
avail
able
3829,932 1,183 384 5,322 2,636 1,249 1,681 8,348 585 497 51,817
avail
able
29,932 1,183 384 5,322 2,636 1,249 1,681 8,348 585 497 51,817
35 590 173avail
able
35 590 1733 avail
able
3
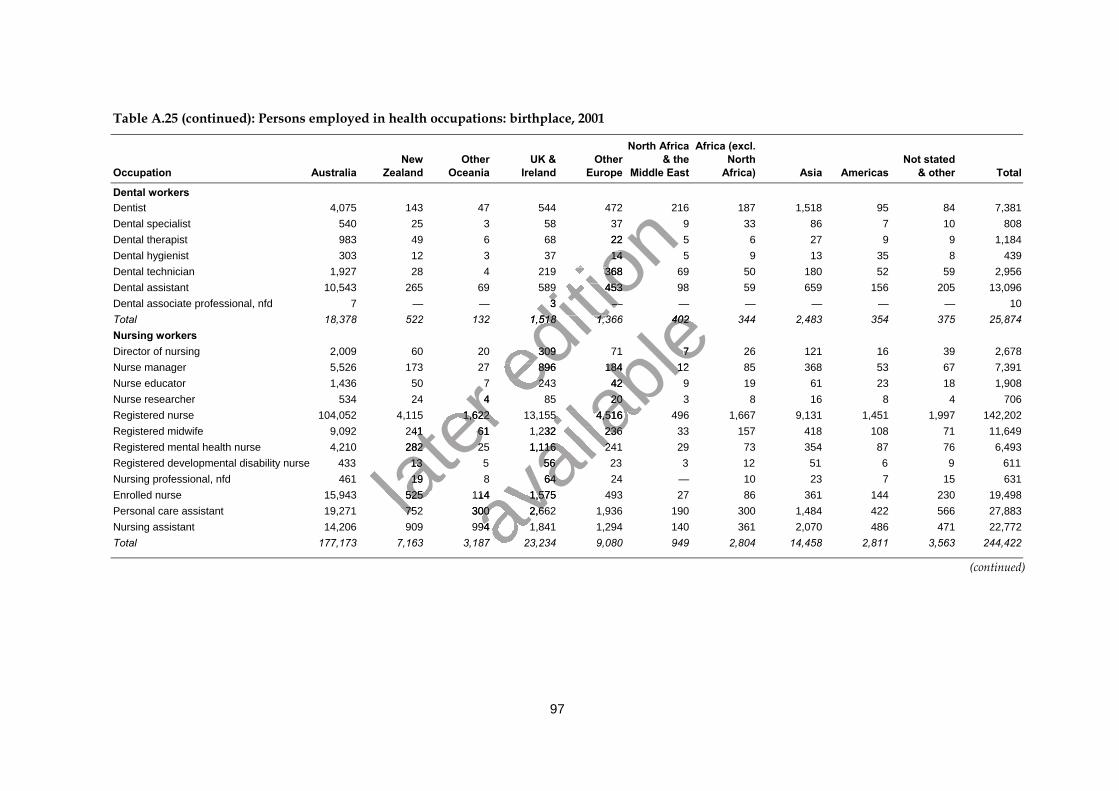
97
Table A.25 (continued): Persons employed in health occupations: birthplace, 2001
Occupation AustraliaNew
ZealandOther
OceaniaUK &
IrelandOther
Europe
North Africa& the
Middle East
Africa (excl.North
Africa) Asia AmericasNot stated
& other Total
Dental workersDentist 4,075 143 47 544 472 216 187 1,518 95 84 7,381Dental specialist 540 25 3 58 37 9 33 86 7 10 808Dental therapist 983 49 6 68 22 5 6 27 9 9 1,184Dental hygienist 303 12 3 37 14 5 9 13 35 8 439Dental technician 1,927 28 4 219 368 69 50 180 52 59 2,956Dental assistant 10,543 265 69 589 453 98 59 659 156 205 13,096Dental associate professional, nfd 7 — — 3 — — — — — — 10Total 18,378 522 132 1,518 1,366 402 344 2,483 354 375 25,874Nursing workersDirector of nursing 2,009 60 20 309 71 7 26 121 16 39 2,678Nurse manager 5,526 173 27 896 184 12 85 368 53 67 7,391Nurse educator 1,436 50 7 243 42 9 19 61 23 18 1,908Nurse researcher 534 24 4 85 20 3 8 16 8 4 706Registered nurse 104,052 4,115 1,622 13,155 4,516 496 1,667 9,131 1,451 1,997 142,202Registered midwife 9,092 241 61 1,232 236 33 157 418 108 71 11,649Registered mental health nurse 4,210 282 25 1,116 241 29 73 354 87 76 6,493Registered developmental disability nurse 433 13 5 56 23 3 12 51 6 9 611Nursing professional, nfd 461 19 8 64 24 — 10 23 7 15 631Enrolled nurse 15,943 525 114 1,575 493 27 86 361 144 230 19,498Personal care assistant 19,271 752 300 2,662 1,936 190 300 1,484 422 566 27,883Nursing assistant 14,206 909 994 1,841 1,294 140 361 2,070 486 471 22,772Total 177,173 7,163 3,187 23,234 9,080 949 2,804 14,458 2,811 3,563 244,422
(continued)
later
4
later
4104,052 4,115 1,622 13,
later 104,052 4,115 1,622 13,
9,092 241
later 9,092 241 61 1,232 236
later 61 1,232 236
4,210 282
later 4,210 282 25 1,116 241
later 25 1,116 241
13
later 13
19later
1915,943 525 114 1,575 493lat
er 15,943 525 114 1,575 49319,271 752 300 2,662 1,936 190 300 1,484 422 566 27,883lat
er 19,271 752 300 2,662 1,936 190 300 1,484 422 566 27,883
editio
n
47 544 472 216 187 1,518
editio
n
47 544 472 216 187 1,51837
editio
n 3722
editio
n 2214
editio
n 144 219 368
editio
n 4 219 36869 589 453
editio
n
69 589 4533
editio
n
3 —
editio
n
—18,378 522 132 1,518 1,366 402 344 2,483 354 375 25,874
editio
n 18,378 522 132 1,518 1,366 402 344 2,483 354 375 25,874
20 309editio
n 20 30927 896 184ed
ition
27 896 1847 243ed
ition
7 243
avail
able
18,378 522 132 1,518 1,366 402 344 2,483 354 375 25,874
avail
able
18,378 522 132 1,518 1,366 402 344 2,483 354 375 25,874
71
avail
able71 7
avail
able727 896 184
avail
able27 896 184 12
avail
able12
42
avail
able
4220
avail
able
20155 4,516 496 1,667 9,131 1,451 1,997 142,202
avail
able
155 4,516 496 1,667 9,131 1,451 1,997 142,20261 1,232 236
avail
able
61 1,232 23625 1,116 241
avail
able
25 1,116 24156
avail
able
5664
avail
able
6415,943 525 114 1,575 493
avail
able
15,943 525 114 1,575 49319,271 752 300 2,662 1,936 190 300 1,484 422 566 27,883av
ailab
le19,271 752 300 2,662 1,936 190 300 1,484 422 566 27,88314,206 909 994 1,841 1,294 140 361 2,070 486 471 22,772av
ailab
le14,206 909 994 1,841 1,294 140 361 2,070 486 471 22,772av
ailab
le177,173 7,163 3,187 23,234 9,080 949 2,804 14,458 2,811 3,563 244,422av
ailab
le177,173 7,163 3,187 23,234 9,080 949 2,804 14,458 2,811 3,563 244,422
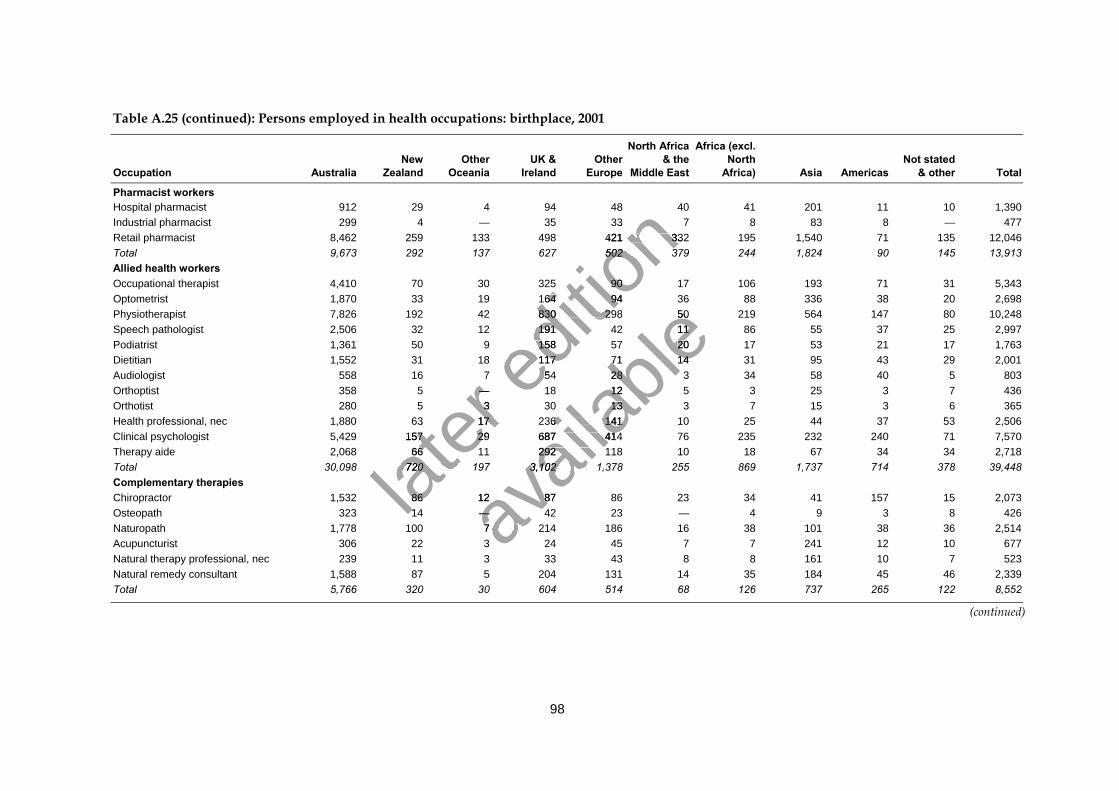
98
Table A.25 (continued): Persons employed in health occupations: birthplace, 2001
Occupation AustraliaNew
ZealandOther
OceaniaUK &
IrelandOther
Europe
North Africa& the
Middle East
Africa (excl.North
Africa) Asia AmericasNot stated
& other Total
Pharmacist workersHospital pharmacist 912 29 4 94 48 40 41 201 11 10 1,390Industrial pharmacist 299 4 — 35 33 7 8 83 8 — 477Retail pharmacist 8,462 259 133 498 421 332 195 1,540 71 135 12,046Total 9,673 292 137 627 502 379 244 1,824 90 145 13,913Allied health workersOccupational therapist 4,410 70 30 325 90 17 106 193 71 31 5,343Optometrist 1,870 33 19 164 94 36 88 336 38 20 2,698Physiotherapist 7,826 192 42 830 298 50 219 564 147 80 10,248Speech pathologist 2,506 32 12 191 42 11 86 55 37 25 2,997Podiatrist 1,361 50 9 158 57 20 17 53 21 17 1,763Dietitian 1,552 31 18 117 71 14 31 95 43 29 2,001Audiologist 558 16 7 54 28 3 34 58 40 5 803Orthoptist 358 5 — 18 12 5 3 25 3 7 436Orthotist 280 5 3 30 13 3 7 15 3 6 365Health professional, nec 1,880 63 17 236 141 10 25 44 37 53 2,506Clinical psychologist 5,429 157 29 687 414 76 235 232 240 71 7,570Therapy aide 2,068 66 11 292 118 10 18 67 34 34 2,718Total 30,098 720 197 3,102 1,378 255 869 1,737 714 378 39,448Complementary therapiesChiropractor 1,532 86 12 87 86 23 34 41 157 15 2,073Osteopath 323 14 — 42 23 — 4 9 3 8 426Naturopath 1,778 100 7 214 186 16 38 101 38 36 2,514Acupuncturist 306 22 3 24 45 7 7 241 12 10 677Natural therapy professional, nec 239 11 3 33 43 8 8 161 10 7 523Natural remedy consultant 1,588 87 5 204 131 14 35 184 45 46 2,339Total 5,766 320 30 604 514 68 126 737 265 122 8,552
(continued)
later
—
later
—3
later
363
later 63 17 236 141
later 17 236 141
5,429 157
later 5,429 157 29 687 414
later 29 687 414
66
later 66
30,098 720 197 3,102 1,378 255 869 1,737 714 378 39,448later
30,098 720 197 3,102 1,378 255 869 1,737 714 378 39,448
86later
8614lat
er 14
editio
n 33
editio
n 338,462 259 133 498 421 332 195 1,540
editio
n 8,462 259 133 498 421 332 195 1,5409,673 292 137 627 502 379 244 1,824
editio
n 9,673 292 137 627 502 379 244 1,824
90
editio
n
9019 164
editio
n
19 164 94
editio
n
9442 830 298
editio
n 42 830 29812 191
editio
n 12 1919 158ed
ition
9 15818 117ed
ition
18 11754ed
ition
54
avail
able
50 219 564 147
avail
able
50 219 564 14711
avail
able11
20
avail
able20
71
avail
able71 14
avail
able14
28
avail
able28
12
avail
able
1213
avail
able
1317 236 141
avail
able
17 236 14129 687 414
avail
able
29 687 41411 292 118
avail
able
11 292 11830,098 720 197 3,102 1,378 255 869 1,737 714 378 39,448
avail
able
30,098 720 197 3,102 1,378 255 869 1,737 714 378 39,448
12 avail
able
12 87avail
able
87avail
able
— avail
able
—7 214 186avail
able
7 214 186
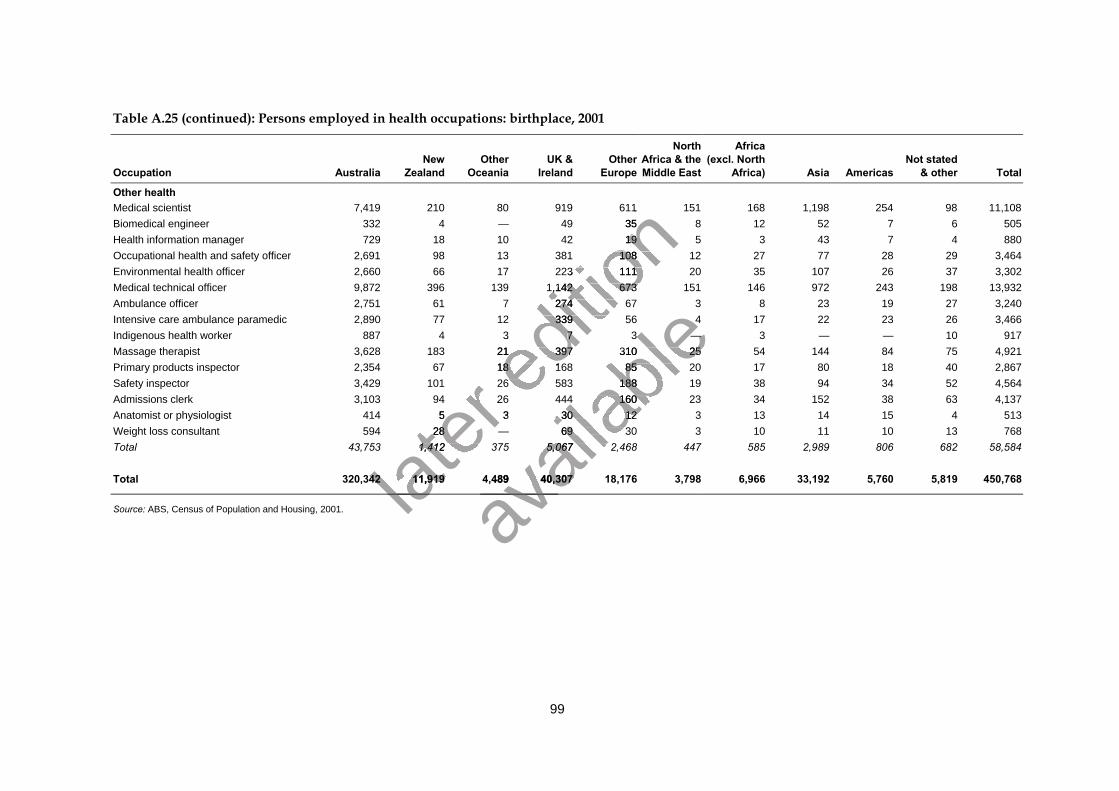
99
Table A.25 (continued): Persons employed in health occupations: birthplace, 2001
Occupation AustraliaNew
ZealandOther
OceaniaUK &
IrelandOther
Europe
NorthAfrica & theMiddle East
Africa(excl. North
Africa) Asia AmericasNot stated
& other Total
Other healthMedical scientist 7,419 210 80 919 611 151 168 1,198 254 98 11,108Biomedical engineer 332 4 — 49 35 8 12 52 7 6 505Health information manager 729 18 10 42 19 5 3 43 7 4 880Occupational health and safety officer 2,691 98 13 381 108 12 27 77 28 29 3,464Environmental health officer 2,660 66 17 223 111 20 35 107 26 37 3,302Medical technical officer 9,872 396 139 1,142 673 151 146 972 243 198 13,932Ambulance officer 2,751 61 7 274 67 3 8 23 19 27 3,240Intensive care ambulance paramedic 2,890 77 12 339 56 4 17 22 23 26 3,466Indigenous health worker 887 4 3 7 3 — 3 — — 10 917Massage therapist 3,628 183 21 397 310 25 54 144 84 75 4,921Primary products inspector 2,354 67 18 168 85 20 17 80 18 40 2,867Safety inspector 3,429 101 26 583 188 19 38 94 34 52 4,564Admissions clerk 3,103 94 26 444 160 23 34 152 38 63 4,137Anatomist or physiologist 414 5 3 30 12 3 13 14 15 4 513Weight loss consultant 594 28 — 69 30 3 10 11 10 13 768Total 43,753 1,412 375 5,067 2,468 447 585 2,989 806 682 58,584
Total 320,342 11,919 4,489 40,307 18,176 3,798 6,966 33,192 5,760 5,819 450,768
Source: ABS, Census of Population and Housing, 2001. later
3,429 101 26 583 188 19 38 94 34 52 4,564
later
3,429 101 26 583 188 19 38 94 34 52 4,564
later
3,103 94 26 444 160 23 34 152 38 63 4,137
later
3,103 94 26 444 160 23 34 152 38 63 4,1375
later 5 3 30 12
later 3 30 12
594 28
later 594 28
43,753 1,412 375 5,067 2,468 447 585 2,989 806 682 58,584
later 43,753 1,412 375 5,067 2,468 447 585 2,989 806 682 58,584
320,342 11,919 4,489 40,307 18,176 3,798 6,966 33,192 5,760 5,819 450,768later
320,342 11,919 4,489 40,307 18,176 3,798 6,966 33,192 5,760 5,819 450,768later
editio
n
7,419 210 80 919 611 151 168 1,198 254 98 11,108
editio
n
7,419 210 80 919 611 151 168 1,198 254 98 11,108— 49 35
editio
n — 49 35729 18 10 42 19
editio
n 729 18 10 42 192,691 98 13 381 108 12 27 77 28 29 3,464
editio
n 2,691 98 13 381 108 12 27 77 28 29 3,4642,660 66 17 223 111 20 35 107 26 37 3,302
editio
n 2,660 66 17 223 111 20 35 107 26 37 3,3029,872 396 139 1,142 673 151 146 972 243 198 13,932
editio
n
9,872 396 139 1,142 673 151 146 972 243 198 13,9327 274 67
editio
n
7 274 672,890 77 12 339 56
editio
n 2,890 77 12 339 56
3
editio
n 3 7
editio
n 7
3,628 183 21 397 310 25 54 144 84 75 4,921editio
n 3,628 183 21 397 310 25 54 144 84 75 4,9212,354 67 18 168 85 20 17 80 18 40 2,867editio
n 2,354 67 18 168 85 20 17 80 18 40 2,8673,429 101 26 583 188 19 38 94 34 52 4,564editio
n 3,429 101 26 583 188 19 38 94 34 52 4,5643,103 94 26 444 160 23 34 152 38 63 4,137editio
n 3,103 94 26 444 160 23 34 152 38 63 4,137
avail
able
4 17 22 23 26 3,466
avail
able
4 17 22 23 26 3,4663
avail
able3 —
avail
able—3,628 183 21 397 310 25 54 144 84 75 4,921
avail
able3,628 183 21 397 310 25 54 144 84 75 4,921
2,354 67 18 168 85 20 17 80 18 40 2,867
avail
able2,354 67 18 168 85 20 17 80 18 40 2,867
3,429 101 26 583 188 19 38 94 34 52 4,564
avail
able
3,429 101 26 583 188 19 38 94 34 52 4,564
avail
able
3,103 94 26 444 160 23 34 152 38 63 4,137
avail
able
3,103 94 26 444 160 23 34 152 38 63 4,1373 30 12
avail
able
3 30 12— 69 30
avail
able
— 69 3043,753 1,412 375 5,067 2,468 447 585 2,989 806 682 58,584
avail
able
43,753 1,412 375 5,067 2,468 447 585 2,989 806 682 58,584
320,342 11,919 4,489 40,307 18,176 3,798 6,966 33,192 5,760 5,819 450,768
avail
able
320,342 11,919 4,489 40,307 18,176 3,798 6,966 33,192 5,760 5,819 450,768
avail
able
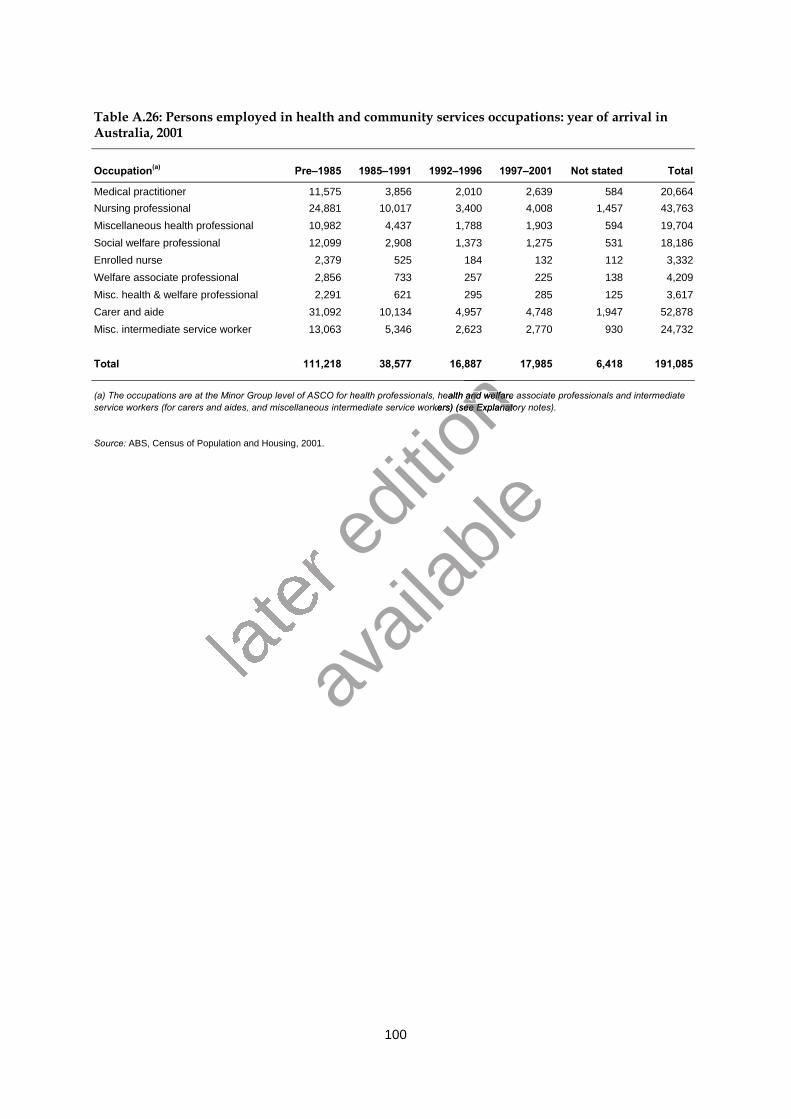
100
Table A.26: Persons employed in health and community services occupations: year of arrival inAustralia, 2001
Occupation(a) Pre–1985 1985–1991 1992–1996 1997–2001 Not stated Total
Medical practitioner 11,575 3,856 2,010 2,639 584 20,664Nursing professional 24,881 10,017 3,400 4,008 1,457 43,763Miscellaneous health professional 10,982 4,437 1,788 1,903 594 19,704Social welfare professional 12,099 2,908 1,373 1,275 531 18,186Enrolled nurse 2,379 525 184 132 112 3,332Welfare associate professional 2,856 733 257 225 138 4,209Misc. health & welfare professional 2,291 621 295 285 125 3,617Carer and aide 31,092 10,134 4,957 4,748 1,947 52,878Misc. intermediate service worker 13,063 5,346 2,623 2,770 930 24,732
Total 111,218 38,577 16,887 17,985 6,418 191,085
(a) The occupations are at the Minor Group level of ASCO for health professionals, health and welfare associate professionals and intermediateservice workers (for carers and aides, and miscellaneous intermediate service workers) (see Explanatory notes).
Source: ABS, Census of Population and Housing, 2001.
later
editio
n 111,218 38,577 16,887 17,985 6,418 191,085
editio
n 111,218 38,577 16,887 17,985 6,418 191,085
editio
n level of ASCO for health professionals, heal
editio
n level of ASCO for health professionals, health and welfare associate professionals a
editio
n th and welfare associate professionals a
editio
n intermediate service workers) (see Explanatory notes).
editio
n intermediate service workers) (see Explanatory notes).
avail
able
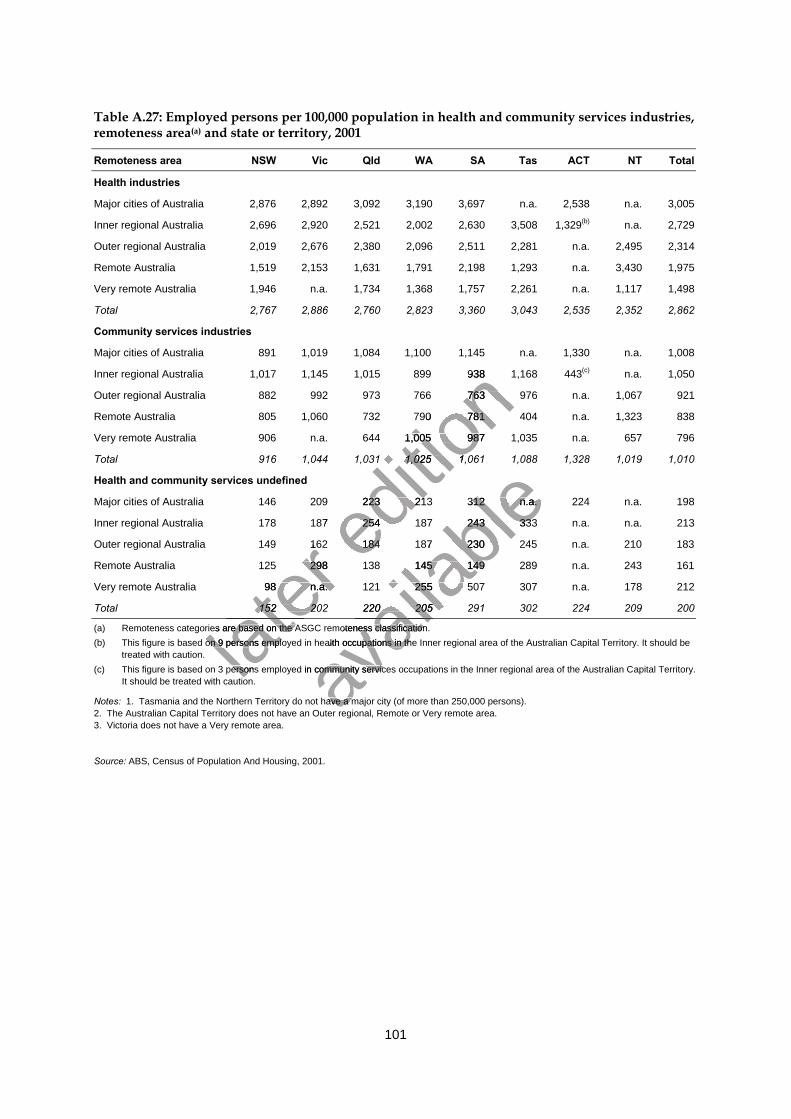
101
Table A.27: Employed persons per 100,000 population in health and community services industries,remoteness area(a) and state or territory, 2001
Remoteness area NSW Vic Qld WA SA Tas ACT NT Total
Health industries
Major cities of Australia 2,876 2,892 3,092 3,190 3,697 n.a. 2,538 n.a. 3,005
Inner regional Australia 2,696 2,920 2,521 2,002 2,630 3,508 1,329(b) n.a. 2,729
Outer regional Australia 2,019 2,676 2,380 2,096 2,511 2,281 n.a. 2,495 2,314
Remote Australia 1,519 2,153 1,631 1,791 2,198 1,293 n.a. 3,430 1,975
Very remote Australia 1,946 n.a. 1,734 1,368 1,757 2,261 n.a. 1,117 1,498
Total 2,767 2,886 2,760 2,823 3,360 3,043 2,535 2,352 2,862
Community services industries
Major cities of Australia 891 1,019 1,084 1,100 1,145 n.a. 1,330 n.a. 1,008
Inner regional Australia 1,017 1,145 1,015 899 938 1,168 443(c) n.a. 1,050
Outer regional Australia 882 992 973 766 763 976 n.a. 1,067 921
Remote Australia 805 1,060 732 790 781 404 n.a. 1,323 838
Very remote Australia 906 n.a. 644 1,005 987 1,035 n.a. 657 796
Total 916 1,044 1,031 1,025 1,061 1,088 1,328 1,019 1,010
Health and community services undefined
Major cities of Australia 146 209 223 213 312 n.a. 224 n.a. 198
Inner regional Australia 178 187 254 187 243 333 n.a. n.a. 213
Outer regional Australia 149 162 184 187 230 245 n.a. 210 183
Remote Australia 125 298 138 145 149 289 n.a. 243 161
Very remote Australia 98 n.a. 121 255 507 307 n.a. 178 212
Total 152 202 220 205 291 302 224 209 200
(a) Remoteness categories are based on the ASGC remoteness classification.(b) This figure is based on 9 persons employed in health occupations in the Inner regional area of the Australian Capital Territory. It should be
treated with caution.(c) This figure is based on 3 persons employed in community services occupations in the Inner regional area of the Australian Capital Territory.
It should be treated with caution.
Notes: 1. Tasmania and the Northern Territory do not have a major city (of more than 250,000 persons).2. The Australian Capital Territory does not have an Outer regional, Remote or Very remote area.3. Victoria does not have a Very remote area.
Source: ABS, Census of Population And Housing, 2001.
later
Outer regional Australia 149 162 184 187 230 245 n.a. 210 183
later
Outer regional Australia 149 162 184 187 230 245 n.a. 210 183
125 298 138 145 149 289 n.a. 243 161
later
125 298 138 145 149 289 n.a. 243 161
98 n.a. 121 255 507 307 n.a. 178 212
later 98 n.a. 121 255 507 307 n.a. 178 212
152 202 220 205 291 302 224 209 200
later 152 202 220 205 291 302 224 209 200
later
(a) Remoteness categories are based on the ASGC remoteness classification.later
(a) Remoteness categories are based on the ASGC remoteness classification.(b) This figure is based on 9 persons employed in health occupations in the Inner regional area of the Australian Capital Terrilat
er (b) This figure is based on 9 persons employed in health occupations in the Inner regional area of the Australian Capital Terri
(c) This figure is based on 3 persons employed in community services occupations in the Inner regional area of the Australian Clater
(c) This figure is based on 3 persons employed in community services occupations in the Inner regional area of the Australian CIt should be treated with caution.lat
er It should be treated with caution.
editio
n Inner regional Australia 1,017 1,145 1,015 899 938 1,168 443
editio
n Inner regional Australia 1,017 1,145 1,015 899 938 1,168 443
Outer regional Australia 882 992 973 766 763 976 n.a. 1,067 921
editio
n Outer regional Australia 882 992 973 766 763 976 n.a. 1,067 921
805 1,060 732 790 781 404 n.a. 1,323 838
editio
n 805 1,060 732 790 781 404 n.a. 1,323 838
906 n.a. 644 1,005 987 1,035 n.a. 657 796
editio
n 906 n.a. 644 1,005 987 1,035 n.a. 657 796
916 1,044 1,031 1,025 1,061 1,088 1,328 1,019 1,010
editio
n 916 1,044 1,031 1,025 1,061 1,088 1,328 1,019 1,010
146 209 223 213 312 n.a. 224 n.a. 198
editio
n 146 209 223 213 312 n.a. 224 n.a. 198
178 187 254 187 243 333 n.a. n.a. 213editio
n 178 187 254 187 243 333 n.a. n.a. 213
Outer regional Australia 149 162 184 187 230 245 n.a. 210 183editio
n
Outer regional Australia 149 162 184 187 230 245 n.a. 210 183
avail
able146 209 223 213 312 n.a. 224 n.a. 198
avail
able146 209 223 213 312 n.a. 224 n.a. 198
178 187 254 187 243 333 n.a. n.a. 213
avail
able178 187 254 187 243 333 n.a. n.a. 213
Outer regional Australia 149 162 184 187 230 245 n.a. 210 183
avail
ableOuter regional Australia 149 162 184 187 230 245 n.a. 210 183
125 298 138 145 149 289 n.a. 243 161
avail
able
125 298 138 145 149 289 n.a. 243 161
98 n.a. 121 255 507 307 n.a. 178 212
avail
able
98 n.a. 121 255 507 307 n.a. 178 212
152 202 220 205 291 302 224 209 200
avail
able
152 202 220 205 291 302 224 209 200
avail
able
(a) Remoteness categories are based on the ASGC remoteness classification.
avail
able
(a) Remoteness categories are based on the ASGC remoteness classification.(b) This figure is based on 9 persons employed in health occupations in the Inner regional area of the Australian Capital Terri
avail
able
(b) This figure is based on 9 persons employed in health occupations in the Inner regional area of the Australian Capital Terri
(c) This figure is based on 3 persons employed in community services occupations in the Inner regional area of the Australian Cavail
able
(c) This figure is based on 3 persons employed in community services occupations in the Inner regional area of the Australian Cavail
able
1. Tasmania and the Northern Territory do not have a major city (of more than 250,000 persons).avail
able
1. Tasmania and the Northern Territory do not have a major city (of more than 250,000 persons).an Outer regional, Remote or Very remote area.av
ailab
le
an Outer regional, Remote or Very remote area.
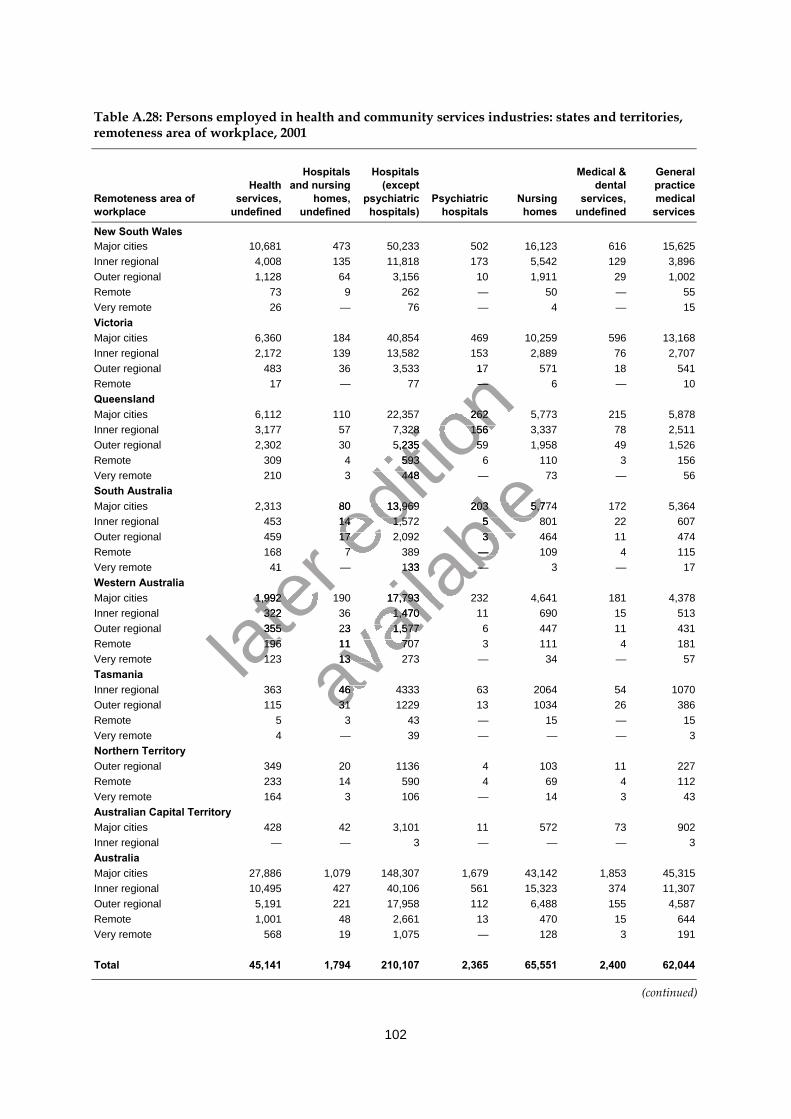
102
Table A.28: Persons employed in health and community services industries: states and territories,remoteness area of workplace, 2001
Remoteness area ofworkplace
Healthservices,
undefined
Hospitalsand nursing
homes,undefined
Hospitals(except
psychiatrichospitals)
Psychiatrichospitals
Nursinghomes
Medical &dental
services,undefined
Generalpracticemedicalservices
New South WalesMajor cities 10,681 473 50,233 502 16,123 616 15,625Inner regional 4,008 135 11,818 173 5,542 129 3,896Outer regional 1,128 64 3,156 10 1,911 29 1,002Remote 73 9 262 — 50 — 55Very remote 26 — 76 — 4 — 15VictoriaMajor cities 6,360 184 40,854 469 10,259 596 13,168Inner regional 2,172 139 13,582 153 2,889 76 2,707Outer regional 483 36 3,533 17 571 18 541Remote 17 — 77 — 6 — 10QueenslandMajor cities 6,112 110 22,357 262 5,773 215 5,878Inner regional 3,177 57 7,328 156 3,337 78 2,511Outer regional 2,302 30 5,235 59 1,958 49 1,526Remote 309 4 593 6 110 3 156Very remote 210 3 448 — 73 — 56South AustraliaMajor cities 2,313 80 13,969 203 5,774 172 5,364Inner regional 453 14 1,572 5 801 22 607Outer regional 459 17 2,092 3 464 11 474Remote 168 7 389 — 109 4 115Very remote 41 — 133 — 3 — 17Western AustraliaMajor cities 1,992 190 17,793 232 4,641 181 4,378Inner regional 322 36 1,470 11 690 15 513Outer regional 355 23 1,577 6 447 11 431Remote 196 11 707 3 111 4 181Very remote 123 13 273 — 34 — 57TasmaniaInner regional 363 46 4333 63 2064 54 1070Outer regional 115 31 1229 13 1034 26 386Remote 5 3 43 — 15 — 15Very remote 4 — 39 — — — 3Northern TerritoryOuter regional 349 20 1136 4 103 11 227Remote 233 14 590 4 69 4 112Very remote 164 3 106 — 14 3 43Australian Capital TerritoryMajor cities 428 42 3,101 11 572 73 902Inner regional — — 3 — — — 3AustraliaMajor cities 27,886 1,079 148,307 1,679 43,142 1,853 45,315Inner regional 10,495 427 40,106 561 15,323 374 11,307Outer regional 5,191 221 17,958 112 6,488 155 4,587Remote 1,001 48 2,661 13 470 15 644Very remote 568 19 1,075 — 128 3 191
Total 45,141 1,794 210,107 2,365 65,551 2,400 62,044
(continued)
later
41
later
41 — 133
later
— 133
1,992 190 17,793 232 4,641 181 4,378
later 1,992 190 17,793 232 4,641 181 4,378
322
later 322
355later
355196later
196123later
123
editio
n 17 571
editio
n 17 571—
editio
n —
6,112 110 22,357 262 5,773 215 5,878
editio
n 6,112 110 22,357 262 5,773 215 5,87857 7,328 156 3,337
editio
n 57 7,328 156 3,33730 5,235
editio
n 30 5,235 59 1,958
editio
n 59 1,958
4 593
editio
n 4 5933 448
editio
n 3 448
80 13,969 203 5,774 172 5,364
editio
n 80 13,969 203 5,774 172 5,36414 1,572ed
ition
14 1,57217 2,092ed
ition
17 2,0927 389ed
ition
7 389
avail
able80 13,969 203 5,774 172 5,364
avail
able80 13,969 203 5,774 172 5,364
5 801
avail
able5 801
3 464
avail
able3 464
7 389
avail
able
7 389 — 109
avail
able
— 109
avail
able
— 133
avail
able
— 133 —
avail
able
—
1,992 190 17,793 232 4,641 181 4,378
avail
able
1,992 190 17,793 232 4,641 181 4,37836 1,470
avail
able
36 1,47023 1,577
avail
able
23 1,57711 707
avail
able
11 70713 273av
ailab
le
13 273
46 4333avail
able
46 433331 1229av
ailab
le
31 1229
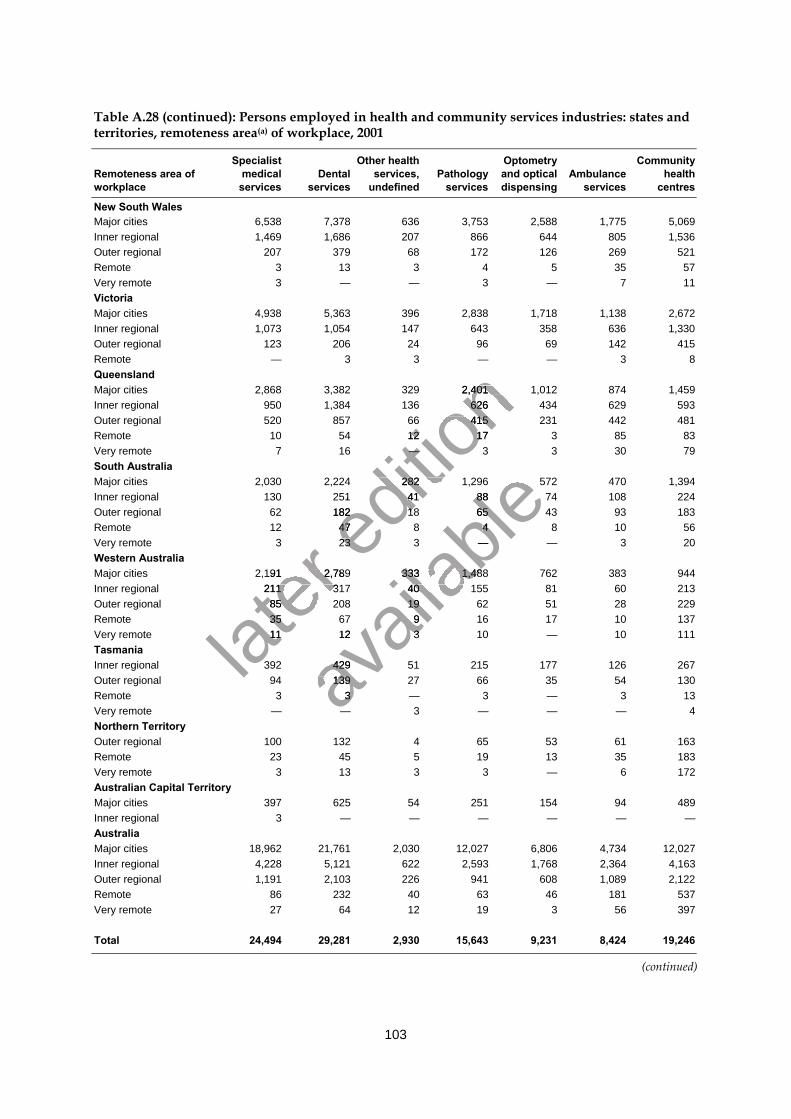
103
Table A.28 (continued): Persons employed in health and community services industries: states andterritories, remoteness area(a) of workplace, 2001
Remoteness area ofworkplace
Specialistmedicalservices
Dentalservices
Other healthservices,
undefinedPathology
services
Optometryand opticaldispensing
Ambulanceservices
Communityhealth
centres
New South WalesMajor cities 6,538 7,378 636 3,753 2,588 1,775 5,069Inner regional 1,469 1,686 207 866 644 805 1,536Outer regional 207 379 68 172 126 269 521Remote 3 13 3 4 5 35 57Very remote 3 — — 3 — 7 11VictoriaMajor cities 4,938 5,363 396 2,838 1,718 1,138 2,672Inner regional 1,073 1,054 147 643 358 636 1,330Outer regional 123 206 24 96 69 142 415Remote — 3 3 — — 3 8QueenslandMajor cities 2,868 3,382 329 2,401 1,012 874 1,459Inner regional 950 1,384 136 626 434 629 593Outer regional 520 857 66 415 231 442 481Remote 10 54 12 17 3 85 83Very remote 7 16 — 3 3 30 79South AustraliaMajor cities 2,030 2,224 282 1,296 572 470 1,394Inner regional 130 251 41 88 74 108 224Outer regional 62 182 18 65 43 93 183Remote 12 47 8 4 8 10 56Very remote 3 23 3 — — 3 20Western AustraliaMajor cities 2,191 2,789 333 1,488 762 383 944Inner regional 211 317 40 155 81 60 213Outer regional 85 208 19 62 51 28 229Remote 35 67 9 16 17 10 137Very remote 11 12 3 10 — 10 111TasmaniaInner regional 392 429 51 215 177 126 267Outer regional 94 139 27 66 35 54 130Remote 3 3 — 3 — 3 13Very remote — — 3 — — — 4Northern TerritoryOuter regional 100 132 4 65 53 61 163Remote 23 45 5 19 13 35 183Very remote 3 13 3 3 — 6 172Australian Capital TerritoryMajor cities 397 625 54 251 154 94 489Inner regional 3 — — — — — —AustraliaMajor cities 18,962 21,761 2,030 12,027 6,806 4,734 12,027Inner regional 4,228 5,121 622 2,593 1,768 2,364 4,163Outer regional 1,191 2,103 226 941 608 1,089 2,122Remote 86 232 40 63 46 181 537Very remote 27 64 12 19 3 56 397
Total 24,494 29,281 2,930 15,643 9,231 8,424 19,246
(continued)
later 2,191 2,789 333 1,488 762 383 944
later 2,191 2,789 333 1,488 762 383 944
211 317
later 211 317
85 208
later 85 208
35
later 35
11later
11
editio
n 2,868 3,382 329 2,401 1,012 874 1,459
editio
n 2,868 3,382 329 2,401 1,012 874 1,459950 1,384 136 626 434 629 593
editio
n 950 1,384 136 626 434 629 59366 415 231 442 481
editio
n 66 415 231 442 48112
editio
n 12 17
editio
n 17—
editio
n —
2,030 2,224 282 1,296 572 470 1,394
editio
n 2,030 2,224 282 1,296 572 470 1,394
130 251
editio
n 130 251 41
editio
n 41
62 182 editio
n 62 182 18ed
ition
1847 ed
ition
4723 ed
ition
23
avail
able
2,030 2,224 282 1,296 572 470 1,394
avail
able
2,030 2,224 282 1,296 572 470 1,39488
avail
able88
65
avail
able65
4
avail
able4
—
avail
able—
2,191 2,789 333 1,488 762 383 944
avail
able
2,191 2,789 333 1,488 762 383 94440 155
avail
able
40 15519
avail
able
199
avail
able
912
avail
able
12 3
avail
able
3
392 429avail
able
392 42994 139av
ailab
le
94 1393av
ailab
le
3— — 3 — — — 4av
ailab
le
— — 3 — — — 4
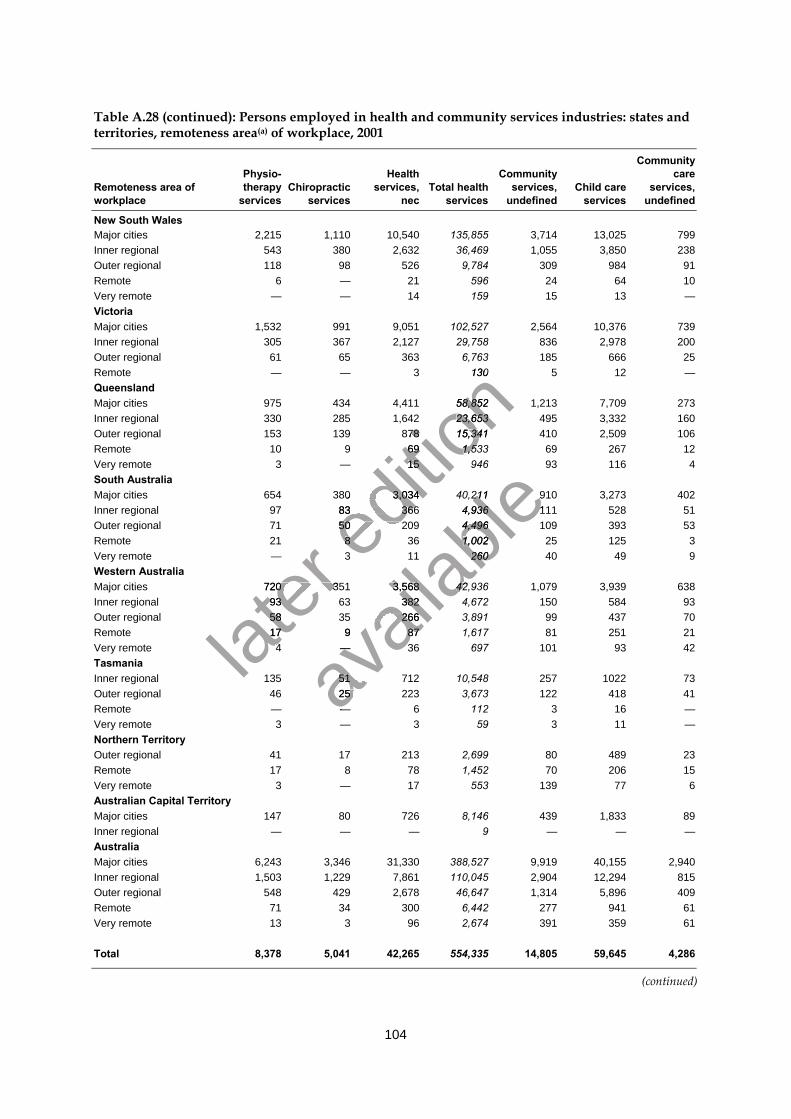
104
Table A.28 (continued): Persons employed in health and community services industries: states andterritories, remoteness area(a) of workplace, 2001
Remoteness area ofworkplace
Physio-therapy
servicesChiropractic
services
Healthservices,
necTotal health
services
Communityservices,
undefinedChild care
services
Communitycare
services,undefined
New South WalesMajor cities 2,215 1,110 10,540 135,855 3,714 13,025 799Inner regional 543 380 2,632 36,469 1,055 3,850 238Outer regional 118 98 526 9,784 309 984 91Remote 6 — 21 596 24 64 10Very remote — — 14 159 15 13 —VictoriaMajor cities 1,532 991 9,051 102,527 2,564 10,376 739Inner regional 305 367 2,127 29,758 836 2,978 200Outer regional 61 65 363 6,763 185 666 25Remote — — 3 130 5 12 —QueenslandMajor cities 975 434 4,411 58,852 1,213 7,709 273Inner regional 330 285 1,642 23,653 495 3,332 160Outer regional 153 139 878 15,341 410 2,509 106Remote 10 9 69 1,533 69 267 12Very remote 3 — 15 946 93 116 4South AustraliaMajor cities 654 380 3,034 40,211 910 3,273 402Inner regional 97 83 366 4,936 111 528 51Outer regional 71 50 209 4,496 109 393 53Remote 21 8 36 1,002 25 125 3Very remote — 3 11 260 40 49 9Western AustraliaMajor cities 720 351 3,568 42,936 1,079 3,939 638Inner regional 93 63 382 4,672 150 584 93Outer regional 58 35 266 3,891 99 437 70Remote 17 9 87 1,617 81 251 21Very remote 4 — 36 697 101 93 42TasmaniaInner regional 135 51 712 10,548 257 1022 73Outer regional 46 25 223 3,673 122 418 41Remote — — 6 112 3 16 —Very remote 3 — 3 59 3 11 —Northern TerritoryOuter regional 41 17 213 2,699 80 489 23Remote 17 8 78 1,452 70 206 15Very remote 3 — 17 553 139 77 6Australian Capital TerritoryMajor cities 147 80 726 8,146 439 1,833 89Inner regional — — — 9 — — —AustraliaMajor cities 6,243 3,346 31,330 388,527 9,919 40,155 2,940Inner regional 1,503 1,229 7,861 110,045 2,904 12,294 815Outer regional 548 429 2,678 46,647 1,314 5,896 409Remote 71 34 300 6,442 277 941 61Very remote 13 3 96 2,674 391 359 61
Total 8,378 5,041 42,265 554,335 14,805 59,645 4,286
(continued)
later 720 351 3,568
later 720 351 3,568
93
later 93
58
later 58
17later
174later
4
editio
n 130
editio
n 130
58,852
editio
n 58,85223,653
editio
n 23,653153 139 878
editio
n 153 139 878 15,341
editio
n 15,34169
editio
n 69 1,533
editio
n 1,533
15
editio
n 15
654 380 3,034
editio
n 654 380 3,034
83 366editio
n 83 36650 209ed
ition
50 2098 ed
ition
8
avail
able40,211
avail
able40,211 910 3,273 402
avail
able910 3,273 402
4,936
avail
able4,936 111 528
avail
able111 528
4,496
avail
able4,496
1,002
avail
able1,002
11
avail
able
11 260
avail
able
260
720 351 3,568
avail
able
720 351 3,568 42,936
avail
able
42,93663 382
avail
able
63 38235 266
avail
able
35 2669
avail
able
9 87
avail
able
87—
avail
able
—
51 712avail
able
51 71225 223av
ailab
le
25 223—av
ailab
le
—
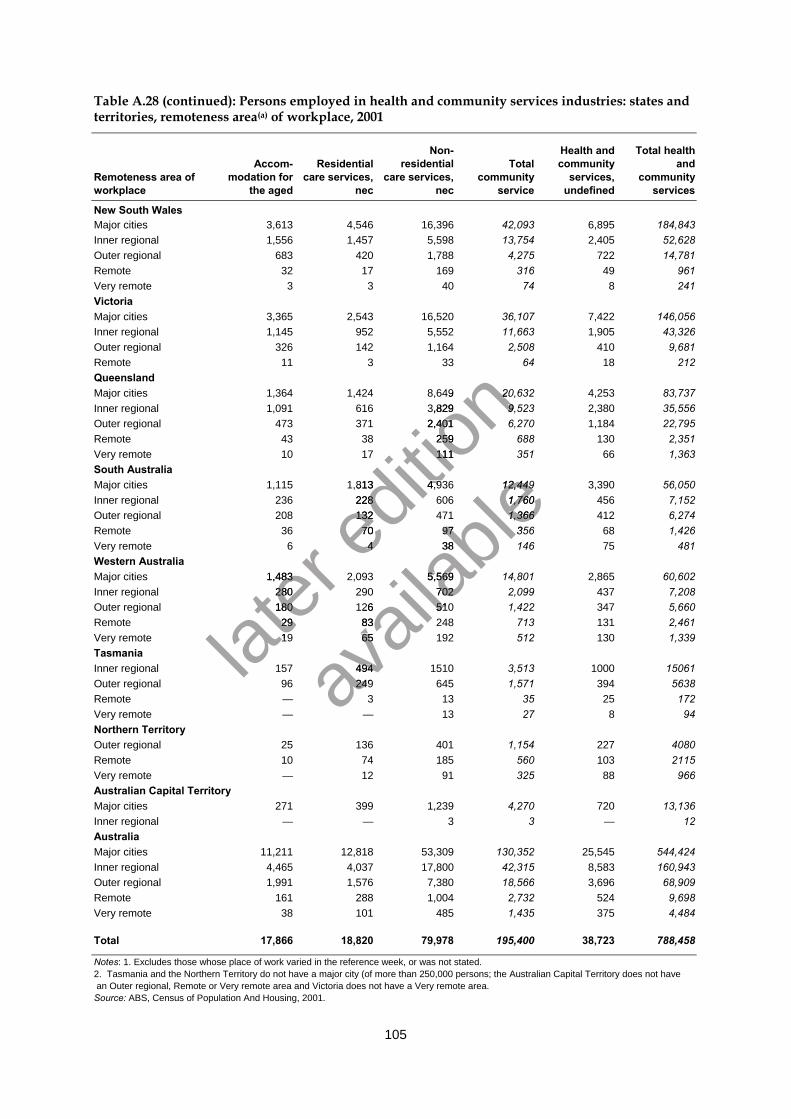
105
Table A.28 (continued): Persons employed in health and community services industries: states andterritories, remoteness area(a) of workplace, 2001
Remoteness area ofworkplace
Accom-modation for
the aged
Residentialcare services,
nec
Non-residential
care services,nec
Totalcommunity
service
Health andcommunity
services,undefined
Total healthand
communityservices
New South WalesMajor cities 3,613 4,546 16,396 42,093 6,895 184,843Inner regional 1,556 1,457 5,598 13,754 2,405 52,628Outer regional 683 420 1,788 4,275 722 14,781Remote 32 17 169 316 49 961Very remote 3 3 40 74 8 241VictoriaMajor cities 3,365 2,543 16,520 36,107 7,422 146,056Inner regional 1,145 952 5,552 11,663 1,905 43,326Outer regional 326 142 1,164 2,508 410 9,681Remote 11 3 33 64 18 212QueenslandMajor cities 1,364 1,424 8,649 20,632 4,253 83,737Inner regional 1,091 616 3,829 9,523 2,380 35,556Outer regional 473 371 2,401 6,270 1,184 22,795Remote 43 38 259 688 130 2,351Very remote 10 17 111 351 66 1,363South AustraliaMajor cities 1,115 1,813 4,936 12,449 3,390 56,050Inner regional 236 228 606 1,760 456 7,152Outer regional 208 132 471 1,366 412 6,274Remote 36 70 97 356 68 1,426Very remote 6 4 38 146 75 481Western AustraliaMajor cities 1,483 2,093 5,569 14,801 2,865 60,602Inner regional 280 290 702 2,099 437 7,208Outer regional 180 126 510 1,422 347 5,660Remote 29 83 248 713 131 2,461Very remote 19 65 192 512 130 1,339TasmaniaInner regional 157 494 1510 3,513 1000 15061Outer regional 96 249 645 1,571 394 5638Remote — 3 13 35 25 172Very remote — — 13 27 8 94Northern TerritoryOuter regional 25 136 401 1,154 227 4080Remote 10 74 185 560 103 2115Very remote — 12 91 325 88 966Australian Capital TerritoryMajor cities 271 399 1,239 4,270 720 13,136Inner regional — — 3 3 — 12AustraliaMajor cities 11,211 12,818 53,309 130,352 25,545 544,424Inner regional 4,465 4,037 17,800 42,315 8,583 160,943Outer regional 1,991 1,576 7,380 18,566 3,696 68,909Remote 161 288 1,004 2,732 524 9,698Very remote 38 101 485 1,435 375 4,484
Total 17,866 18,820 79,978 195,400 38,723 788,458
Notes: 1. Excludes those whose place of work varied in the reference week, or was not stated.2. Tasmania and the Northern Territory do not have a major city (of more than 250,000 persons; the Australian Capital Territory does not have an Outer regional, Remote or Very remote area and Victoria does not have a Very remote area.Source: ABS, Census of Population And Housing, 2001.
later 1,483
later 1,483
280
later 280
180
later 180
29
later 29
19later
19
editio
n 8,649
editio
n 8,649 20,632
editio
n 20,6323,829
editio
n 3,829 9,523
editio
n 9,5232,401
editio
n 2,401259
editio
n 259111
editio
n 111
1,813
editio
n 1,813 4,936
editio
n 4,936
228
editio
n 228132ed
ition
13270ed
ition
704ed
ition
4
avail
able
12,449
avail
able
12,4491,760
avail
able1,7601,366
avail
able1,366
97
avail
able97 356
avail
able356
38
avail
able38
5,569
avail
able
5,569702
avail
able
702126
avail
able
126 510
avail
able
51083
avail
able
8365
avail
able
65
494avail
able
494249avail
able
249
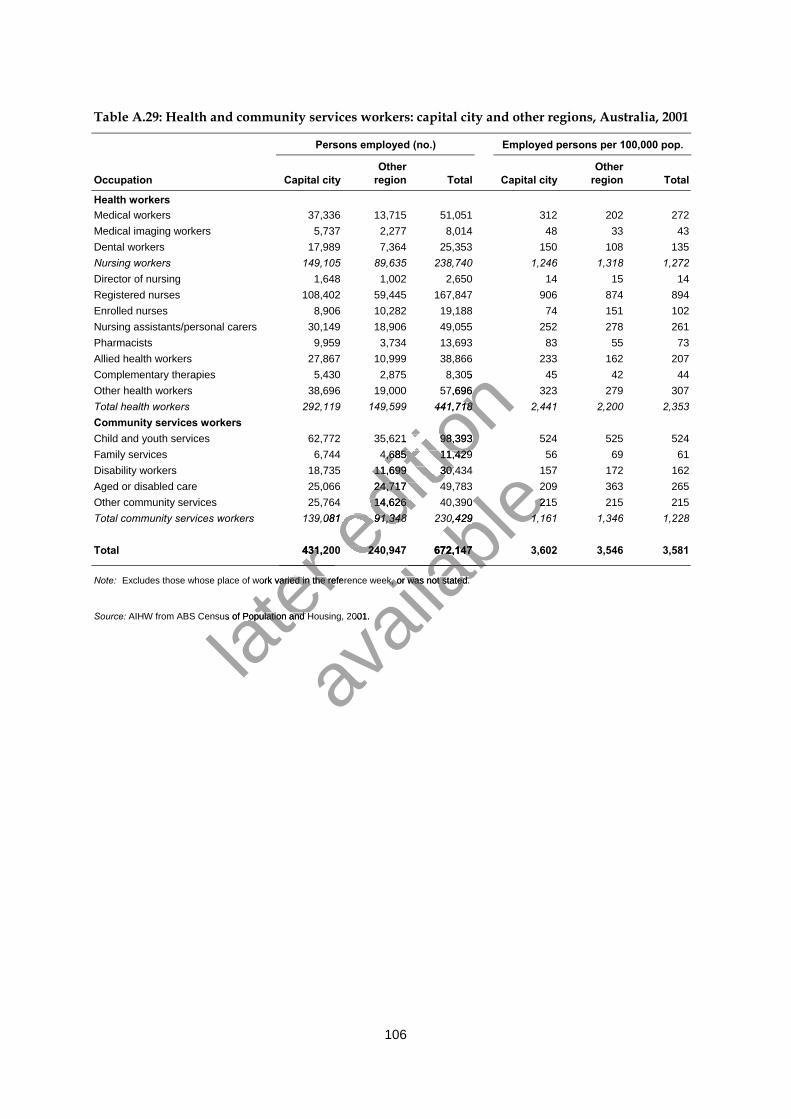
106
Table A.29: Health and community services workers: capital city and other regions, Australia, 2001
Persons employed (no.) Employed persons per 100,000 pop.
Occupation Capital cityOther
region Total Capital cityOther
region Total
Health workersMedical workers 37,336 13,715 51,051 312 202 272Medical imaging workers 5,737 2,277 8,014 48 33 43Dental workers 17,989 7,364 25,353 150 108 135Nursing workers 149,105 89,635 238,740 1,246 1,318 1,272Director of nursing 1,648 1,002 2,650 14 15 14Registered nurses 108,402 59,445 167,847 906 874 894Enrolled nurses 8,906 10,282 19,188 74 151 102Nursing assistants/personal carers 30,149 18,906 49,055 252 278 261Pharmacists 9,959 3,734 13,693 83 55 73Allied health workers 27,867 10,999 38,866 233 162 207Complementary therapies 5,430 2,875 8,305 45 42 44Other health workers 38,696 19,000 57,696 323 279 307Total health workers 292,119 149,599 441,718 2,441 2,200 2,353Community services workersChild and youth services 62,772 35,621 98,393 524 525 524Family services 6,744 4,685 11,429 56 69 61Disability workers 18,735 11,699 30,434 157 172 162Aged or disabled care 25,066 24,717 49,783 209 363 265Other community services 25,764 14,626 40,390 215 215 215Total community services workers 139,081 91,348 230,429 1,161 1,346 1,228
Total 431,200 240,947 672,147 3,602 3,546 3,581
Note: Excludes those whose place of work varied in the reference week, or was not stated.
Source: AIHW from ABS Census of Population and Housing, 2001.
later 431,200 240,947 672,147
later 431,200 240,947 672,147
later
later Excludes those whose place of work varied in the reference week, or was not stated.
later Excludes those whose place of work varied in the reference week, or was not stated.
later AIHW from ABS Census of Population and Housing, 2001.
later AIHW from ABS Census of Population and Housing, 2001.
editio
n 5,430 2,875 8,305
editio
n 5,430 2,875 8,305
38,696 19,000 57,696
editio
n 38,696 19,000 57,696292,119 149,599 441,718
editio
n 292,119 149,599 441,718
62,772 35,621 98,393
editio
n 62,772 35,621 98,3936,744 4,685 11,429
editio
n 6,744 4,685 11,429
18,735 11,699 30,434
editio
n 18,735 11,699 30,43425,066 24,717 49,783
editio
n 25,066 24,717 49,78325,764 14,626 40,390
editio
n 25,764 14,626 40,390
editio
n Total community services workers 139,081 91,348 230,429ed
ition
Total community services workers 139,081 91,348 230,429
431,200 240,947 672,147editio
n
431,200 240,947 672,147
avail
able25,764 14,626 40,390
avail
able25,764 14,626 40,390 215 215 215
avail
able215 215 215
Total community services workers 139,081 91,348 230,429
avail
ableTotal community services workers 139,081 91,348 230,429 1,161 1,346 1,228
avail
able1,161 1,346 1,228
431,200 240,947 672,147
avail
able
431,200 240,947 672,147
avail
able
avail
able
Excludes those whose place of work varied in the reference week, or was not stated.
avail
able
Excludes those whose place of work varied in the reference week, or was not stated.
AIHW from ABS Census of Population and Housing, 2001.
avail
able
AIHW from ABS Census of Population and Housing, 2001.
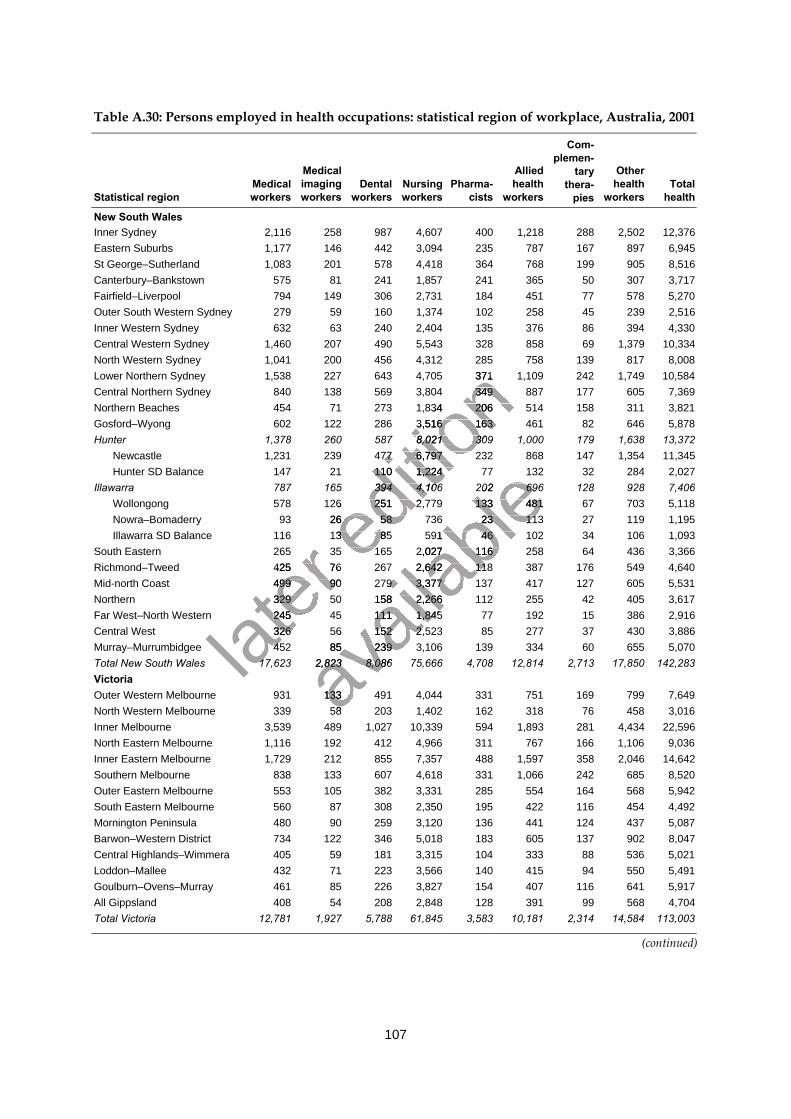
107
Table A.30: Persons employed in health occupations: statistical region of workplace, Australia, 2001
Statistical regionMedicalworkers
Medicalimagingworkers
Dentalworkers
Nursingworkers
Pharma-cists
Alliedhealth
workers
Com-plemen-
tarythera-
pies
Otherhealth
workersTotal
health
New South WalesInner Sydney 2,116 258 987 4,607 400 1,218 288 2,502 12,376Eastern Suburbs 1,177 146 442 3,094 235 787 167 897 6,945St George–Sutherland 1,083 201 578 4,418 364 768 199 905 8,516Canterbury–Bankstown 575 81 241 1,857 241 365 50 307 3,717Fairfield–Liverpool 794 149 306 2,731 184 451 77 578 5,270Outer South Western Sydney 279 59 160 1,374 102 258 45 239 2,516Inner Western Sydney 632 63 240 2,404 135 376 86 394 4,330Central Western Sydney 1,460 207 490 5,543 328 858 69 1,379 10,334North Western Sydney 1,041 200 456 4,312 285 758 139 817 8,008Lower Northern Sydney 1,538 227 643 4,705 371 1,109 242 1,749 10,584Central Northern Sydney 840 138 569 3,804 349 887 177 605 7,369Northern Beaches 454 71 273 1,834 206 514 158 311 3,821Gosford–Wyong 602 122 286 3,516 163 461 82 646 5,878Hunter 1,378 260 587 8,021 309 1,000 179 1,638 13,372
Newcastle 1,231 239 477 6,797 232 868 147 1,354 11,345Hunter SD Balance 147 21 110 1,224 77 132 32 284 2,027
Illawarra 787 165 394 4,106 202 696 128 928 7,406Wollongong 578 126 251 2,779 133 481 67 703 5,118Nowra–Bomaderry 93 26 58 736 23 113 27 119 1,195Illawarra SD Balance 116 13 85 591 46 102 34 106 1,093
South Eastern 265 35 165 2,027 116 258 64 436 3,366Richmond–Tweed 425 76 267 2,642 118 387 176 549 4,640Mid-north Coast 499 90 279 3,377 137 417 127 605 5,531Northern 329 50 158 2,266 112 255 42 405 3,617Far West–North Western 245 45 111 1,845 77 192 15 386 2,916Central West 326 56 152 2,523 85 277 37 430 3,886Murray–Murrumbidgee 452 85 239 3,106 139 334 60 655 5,070Total New South Wales 17,623 2,823 8,086 75,666 4,708 12,814 2,713 17,850 142,283VictoriaOuter Western Melbourne 931 133 491 4,044 331 751 169 799 7,649North Western Melbourne 339 58 203 1,402 162 318 76 458 3,016Inner Melbourne 3,539 489 1,027 10,339 594 1,893 281 4,434 22,596North Eastern Melbourne 1,116 192 412 4,966 311 767 166 1,106 9,036Inner Eastern Melbourne 1,729 212 855 7,357 488 1,597 358 2,046 14,642Southern Melbourne 838 133 607 4,618 331 1,066 242 685 8,520Outer Eastern Melbourne 553 105 382 3,331 285 554 164 568 5,942South Eastern Melbourne 560 87 308 2,350 195 422 116 454 4,492Mornington Peninsula 480 90 259 3,120 136 441 124 437 5,087Barwon–Western District 734 122 346 5,018 183 605 137 902 8,047Central Highlands–Wimmera 405 59 181 3,315 104 333 88 536 5,021Loddon–Mallee 432 71 223 3,566 140 415 94 550 5,491Goulburn–Ovens–Murray 461 85 226 3,827 154 407 116 641 5,917All Gippsland 408 54 208 2,848 128 391 99 568 4,704Total Victoria 12,781 1,927 5,788 61,845 3,583 10,181 2,314 14,584 113,003
(continued)
later
116 13 85 591 46 102 34 106 1,093
later
116 13 85 591 46 102 34 106 1,093265 35 165 2,027 116 258 64 436 3,366
later
265 35 165 2,027 116 258 64 436 3,366425 76 267 2,642 118 387 176 549 4,640
later
425 76 267 2,642 118 387 176 549 4,640499 90 279 3,377 137 417 127 605 5,531
later 499 90 279 3,377 137 417 127 605 5,531
329 50 158 2,266 112 255 42 405 3,617
later 329 50 158 2,266 112 255 42 405 3,617
245 45 111 1,845 77 192 15 386 2,916
later 245 45 111 1,845 77 192 15 386 2,916
326 56 152 2,523 85 277 37 430 3,886later
326 56 152 2,523 85 277 37 430 3,886452 85 239 3,106 139 334 60 655 5,070later
452 85 239 3,106 139 334 60 655 5,07017,623 2,823 8,086 75,666 4,708 12,814 2,713 17,850 142,283later
17,623 2,823 8,086 75,666 4,708 12,814 2,713 17,850 142,283
editio
n 1,538 227 643 4,705 371 1,109 242 1,749 10,584
editio
n 1,538 227 643 4,705 371 1,109 242 1,749 10,584
840 138 569 3,804 349 887 177 605 7,369
editio
n 840 138 569 3,804 349 887 177 605 7,369454 71 273 1,834 206 514 158 311 3,821
editio
n 454 71 273 1,834 206 514 158 311 3,821602 122 286 3,516 163 461 82 646 5,878
editio
n 602 122 286 3,516 163 461 82 646 5,8781,378 260 587 8,021 309 1,000 179 1,638 13,372
editio
n 1,378 260 587 8,021 309 1,000 179 1,638 13,3721,231 239 477 6,797 232 868 147 1,354 11,345
editio
n 1,231 239 477 6,797 232 868 147 1,354 11,345
147 21 110 1,224 77 132 32 284 2,027
editio
n 147 21 110 1,224 77 132 32 284 2,027787 165 394 4,106 202 696 128 928 7,406
editio
n 787 165 394 4,106 202 696 128 928 7,406578 126 251 2,779 133 481 67 703 5,118
editio
n 578 126 251 2,779 133 481 67 703 5,11893 26 58 736 23 113 27 119 1,195ed
ition
93 26 58 736 23 113 27 119 1,195116 13 85 591 46 102 34 106 1,093ed
ition
116 13 85 591 46 102 34 106 1,093265 35 165 2,027 116 258 64 436 3,366ed
ition
265 35 165 2,027 116 258 64 436 3,366
avail
able
147 21 110 1,224 77 132 32 284 2,027
avail
able
147 21 110 1,224 77 132 32 284 2,027787 165 394 4,106 202 696 128 928 7,406
avail
able
787 165 394 4,106 202 696 128 928 7,406578 126 251 2,779 133 481 67 703 5,118
avail
able578 126 251 2,779 133 481 67 703 5,118
93 26 58 736 23 113 27 119 1,195
avail
able93 26 58 736 23 113 27 119 1,195
116 13 85 591 46 102 34 106 1,093
avail
able116 13 85 591 46 102 34 106 1,093
265 35 165 2,027 116 258 64 436 3,366
avail
able
265 35 165 2,027 116 258 64 436 3,366425 76 267 2,642 118 387 176 549 4,640
avail
able
425 76 267 2,642 118 387 176 549 4,640499 90 279 3,377 137 417 127 605 5,531
avail
able
499 90 279 3,377 137 417 127 605 5,531329 50 158 2,266 112 255 42 405 3,617
avail
able
329 50 158 2,266 112 255 42 405 3,617245 45 111 1,845 77 192 15 386 2,916
avail
able
245 45 111 1,845 77 192 15 386 2,916
avail
able
326 56 152 2,523 85 277 37 430 3,886
avail
able
326 56 152 2,523 85 277 37 430 3,886452 85 239 3,106 139 334 60 655 5,070
avail
able
452 85 239 3,106 139 334 60 655 5,07017,623 2,823 8,086 75,666 4,708 12,814 2,713 17,850 142,283av
ailab
le
17,623 2,823 8,086 75,666 4,708 12,814 2,713 17,850 142,283
931 133 491 4,044 331 751 169 799 7,649avail
able
931 133 491 4,044 331 751 169 799 7,649339 58 203 1,402 162 318 76 458 3,016av
ailab
le
339 58 203 1,402 162 318 76 458 3,016
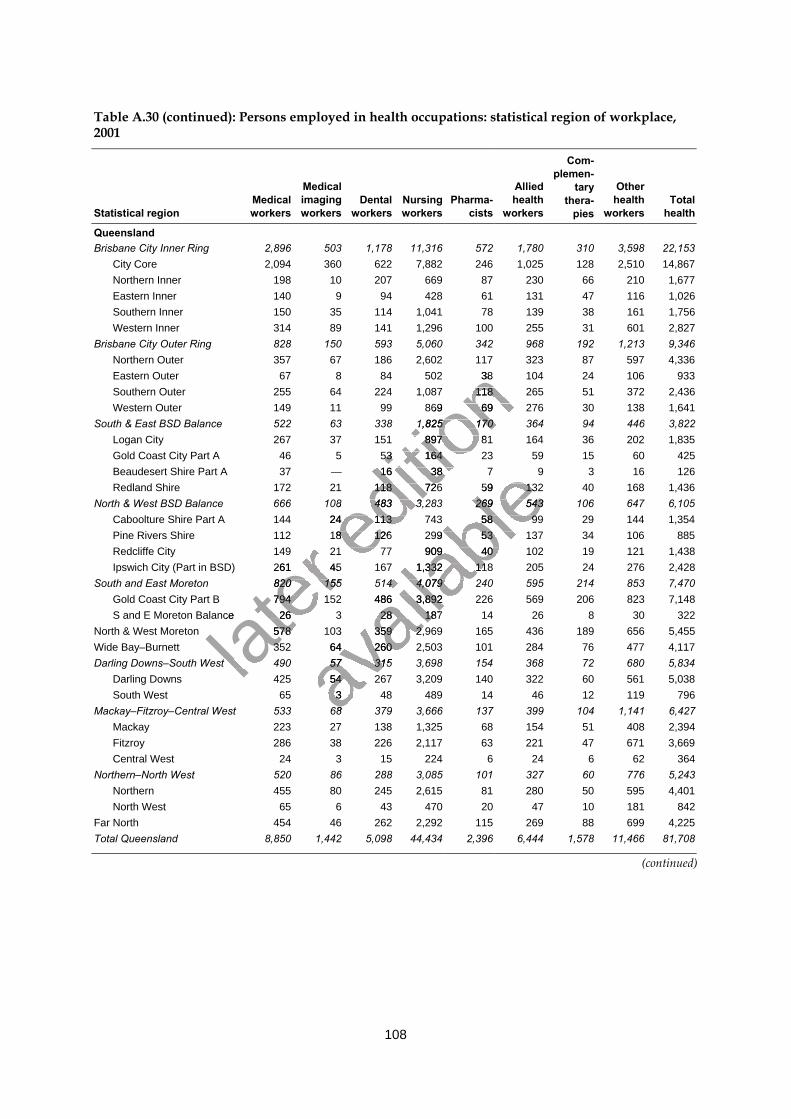
108
Table A.30 (continued): Persons employed in health occupations: statistical region of workplace,2001
Statistical regionMedicalworkers
Medicalimagingworkers
Dentalworkers
Nursingworkers
Pharma-cists
Alliedhealth
workers
Com-plemen-
tarythera-
pies
Otherhealth
workersTotal
health
QueenslandBrisbane City Inner Ring 2,896 503 1,178 11,316 572 1,780 310 3,598 22,153
City Core 2,094 360 622 7,882 246 1,025 128 2,510 14,867Northern Inner 198 10 207 669 87 230 66 210 1,677Eastern Inner 140 9 94 428 61 131 47 116 1,026Southern Inner 150 35 114 1,041 78 139 38 161 1,756Western Inner 314 89 141 1,296 100 255 31 601 2,827
Brisbane City Outer Ring 828 150 593 5,060 342 968 192 1,213 9,346Northern Outer 357 67 186 2,602 117 323 87 597 4,336Eastern Outer 67 8 84 502 38 104 24 106 933Southern Outer 255 64 224 1,087 118 265 51 372 2,436Western Outer 149 11 99 869 69 276 30 138 1,641
South & East BSD Balance 522 63 338 1,825 170 364 94 446 3,822Logan City 267 37 151 897 81 164 36 202 1,835Gold Coast City Part A 46 5 53 164 23 59 15 60 425Beaudesert Shire Part A 37 — 16 38 7 9 3 16 126Redland Shire 172 21 118 726 59 132 40 168 1,436
North & West BSD Balance 666 108 483 3,283 269 543 106 647 6,105Caboolture Shire Part A 144 24 113 743 58 99 29 144 1,354Pine Rivers Shire 112 18 126 299 53 137 34 106 885Redcliffe City 149 21 77 909 40 102 19 121 1,438Ipswich City (Part in BSD) 261 45 167 1,332 118 205 24 276 2,428
South and East Moreton 820 155 514 4,079 240 595 214 853 7,470Gold Coast City Part B 794 152 486 3,892 226 569 206 823 7,148S and E Moreton Balance 26 3 28 187 14 26 8 30 322
North & West Moreton 578 103 359 2,969 165 436 189 656 5,455Wide Bay–Burnett 352 64 260 2,503 101 284 76 477 4,117Darling Downs–South West 490 57 315 3,698 154 368 72 680 5,834
Darling Downs 425 54 267 3,209 140 322 60 561 5,038South West 65 3 48 489 14 46 12 119 796
Mackay–Fitzroy–Central West 533 68 379 3,666 137 399 104 1,141 6,427Mackay 223 27 138 1,325 68 154 51 408 2,394Fitzroy 286 38 226 2,117 63 221 47 671 3,669Central West 24 3 15 224 6 24 6 62 364
Northern–North West 520 86 288 3,085 101 327 60 776 5,243Northern 455 80 245 2,615 81 280 50 595 4,401North West 65 6 43 470 20 47 10 181 842
Far North 454 46 262 2,292 115 269 88 699 4,225Total Queensland 8,850 1,442 5,098 44,434 2,396 6,444 1,578 11,466 81,708
(continued)
later
112 18 126 299 53 137 34 106 885
later
112 18 126 299 53 137 34 106 885149 21 77 909 40 102 19 121 1,438
later
149 21 77 909 40 102 19 121 1,438Ipswich City (Part in BSD) 261 45 167 1,332 118 205 24 276 2,428
later
Ipswich City (Part in BSD) 261 45 167 1,332 118 205 24 276 2,428820 155 514 4,079 240 595 214 853 7,470
later 820 155 514 4,079 240 595 214 853 7,470
794 152 486 3,892 226 569 206 823 7,148
later 794 152 486 3,892 226 569 206 823 7,148
later S and E Moreton Balance 26 3 28 187 14 26 8 30 322
later S and E Moreton Balance 26 3 28 187 14 26 8 30 322
578 103 359 2,969 165 436 189 656 5,455later
578 103 359 2,969 165 436 189 656 5,455352 64 260 2,503 101 284 76 477 4,117later
352 64 260 2,503 101 284 76 477 4,117Darling Downs–South West 490 57 315 3,698 154 368 72 680 5,834lat
er Darling Downs–South West 490 57 315 3,698 154 368 72 680 5,834
editio
n 67 8 84 502 38 104 24 106 933
editio
n 67 8 84 502 38 104 24 106 933
255 64 224 1,087 118 265 51 372 2,436
editio
n 255 64 224 1,087 118 265 51 372 2,436149 11 99 869 69 276 30 138 1,641
editio
n 149 11 99 869 69 276 30 138 1,641South & East BSD Balance 522 63 338 1,825 170 364 94 446 3,822
editio
n South & East BSD Balance 522 63 338 1,825 170 364 94 446 3,822267 37 151 897 81 164 36 202 1,835
editio
n 267 37 151 897 81 164 36 202 1,83546 5 53 164 23 59 15 60 425
editio
n 46 5 53 164 23 59 15 60 425
Beaudesert Shire Part A 37 — 16 3
editio
n Beaudesert Shire Part A 37 — 16 38 7 9 3 16 126
editio
n 8 7 9 3 16 126
172 21 118 726 59 132 40 168 1,436
editio
n 172 21 118 726 59 132 40 168 1,436
North & West BSD Balance 666 108 483 3,283 269 543 106 647 6,105
editio
n North & West BSD Balance 666 108 483 3,283 269 543 106 647 6,105
Caboolture Shire Part A 144 24 113 743 58 99 29 144 1,354editio
n Caboolture Shire Part A 144 24 113 743 58 99 29 144 1,354
112 18 126 299 53 137 34 106 885editio
n
112 18 126 299 53 137 34 106 885149 21 77 909 40 102 19 121 1,438ed
ition
149 21 77 909 40 102 19 121 1,438
avail
able
8 7 9 3 16 126
avail
able
8 7 9 3 16 126172 21 118 726 59 132 40 168 1,436
avail
able
172 21 118 726 59 132 40 168 1,436North & West BSD Balance 666 108 483 3,283 269 543 106 647 6,105
avail
ableNorth & West BSD Balance 666 108 483 3,283 269 543 106 647 6,105
Caboolture Shire Part A 144 24 113 743 58 99 29 144 1,354
avail
ableCaboolture Shire Part A 144 24 113 743 58 99 29 144 1,354
112 18 126 299 53 137 34 106 885
avail
able112 18 126 299 53 137 34 106 885
149 21 77 909 40 102 19 121 1,438
avail
able
149 21 77 909 40 102 19 121 1,438Ipswich City (Part in BSD) 261 45 167 1,332 118 205 24 276 2,428
avail
able
Ipswich City (Part in BSD) 261 45 167 1,332 118 205 24 276 2,428820 155 514 4,079 240 595 214 853 7,470
avail
able
820 155 514 4,079 240 595 214 853 7,470794 152 486 3,892 226 569 206 823 7,148
avail
able
794 152 486 3,892 226 569 206 823 7,148
avail
able
S and E Moreton Balance 26 3 28 187 14 26 8 30 322
avail
able
S and E Moreton Balance 26 3 28 187 14 26 8 30 322578 103 359 2,969 165 436 189 656 5,455
avail
able
578 103 359 2,969 165 436 189 656 5,455352 64 260 2,503 101 284 76 477 4,117
avail
able
352 64 260 2,503 101 284 76 477 4,117Darling Downs–South West 490 57 315 3,698 154 368 72 680 5,834av
ailab
le
Darling Downs–South West 490 57 315 3,698 154 368 72 680 5,834avail
able
425 54 267 3,209 140 322 60 561 5,038avail
able
425 54 267 3,209 140 322 60 561 5,03865 3 48 489 14 46 12 119 796av
ailab
le
65 3 48 489 14 46 12 119 796Mackay–Fitzroy–Central West 533 68 379 3,666 137 399 104 1,141 6,427av
ailab
le
Mackay–Fitzroy–Central West 533 68 379 3,666 137 399 104 1,141 6,427
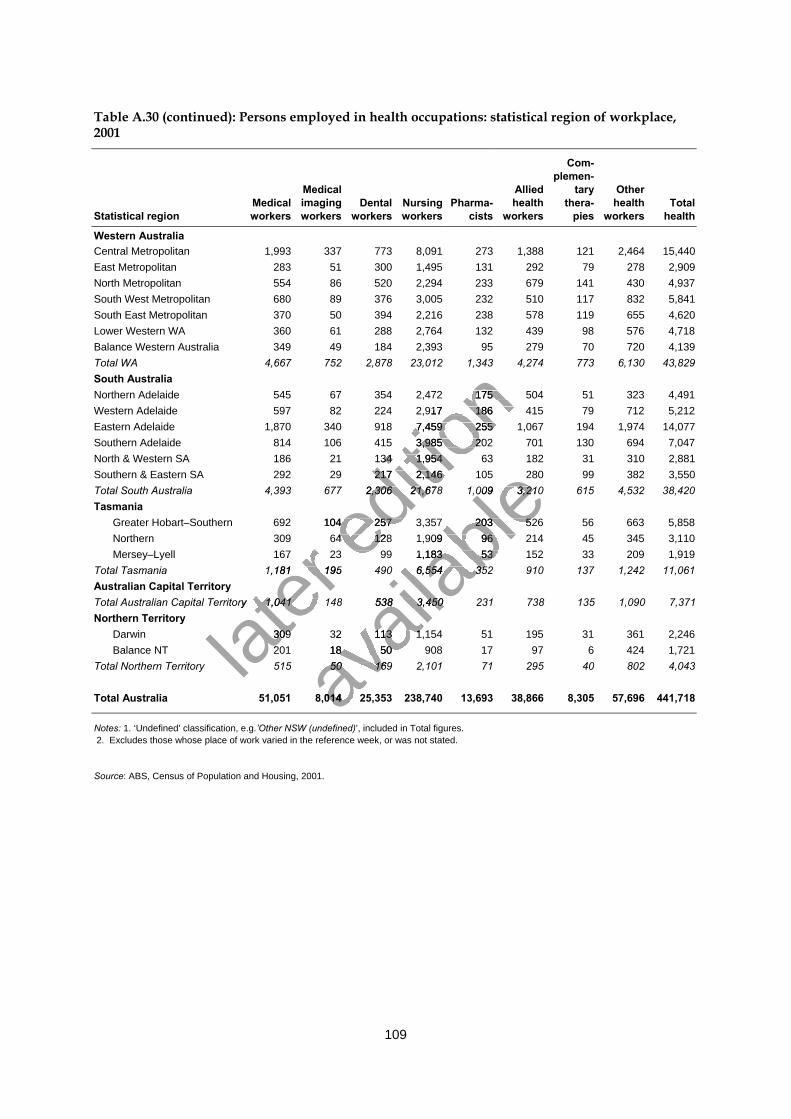
109
Table A.30 (continued): Persons employed in health occupations: statistical region of workplace,2001
Statistical regionMedicalworkers
Medicalimagingworkers
Dentalworkers
Nursingworkers
Pharma-cists
Alliedhealth
workers
Com-plemen-
tarythera-
pies
Otherhealth
workersTotal
health
Western AustraliaCentral Metropolitan 1,993 337 773 8,091 273 1,388 121 2,464 15,440East Metropolitan 283 51 300 1,495 131 292 79 278 2,909North Metropolitan 554 86 520 2,294 233 679 141 430 4,937South West Metropolitan 680 89 376 3,005 232 510 117 832 5,841South East Metropolitan 370 50 394 2,216 238 578 119 655 4,620Lower Western WA 360 61 288 2,764 132 439 98 576 4,718Balance Western Australia 349 49 184 2,393 95 279 70 720 4,139Total WA 4,667 752 2,878 23,012 1,343 4,274 773 6,130 43,829South AustraliaNorthern Adelaide 545 67 354 2,472 175 504 51 323 4,491Western Adelaide 597 82 224 2,917 186 415 79 712 5,212Eastern Adelaide 1,870 340 918 7,459 255 1,067 194 1,974 14,077Southern Adelaide 814 106 415 3,985 202 701 130 694 7,047North & Western SA 186 21 134 1,954 63 182 31 310 2,881Southern & Eastern SA 292 29 217 2,146 105 280 99 382 3,550Total South Australia 4,393 677 2,306 21,678 1,009 3,210 615 4,532 38,420Tasmania
Greater Hobart–Southern 692 104 257 3,357 203 526 56 663 5,858Northern 309 64 128 1,909 96 214 45 345 3,110Mersey–Lyell 167 23 99 1,183 53 152 33 209 1,919
Total Tasmania 1,181 195 490 6,554 352 910 137 1,242 11,061Australian Capital TerritoryTotal Australian Capital Territory 1,041 148 538 3,450 231 738 135 1,090 7,371Northern Territory
Darwin 309 32 113 1,154 51 195 31 361 2,246Balance NT 201 18 50 908 17 97 6 424 1,721
Total Northern Territory 515 50 169 2,101 71 295 40 802 4,043
Total Australia 51,051 8,014 25,353 238,740 13,693 38,866 8,305 57,696 441,718
Notes: 1. ‘Undefined’ classification, e.g.’Other NSW (undefined)’, included in Total figures. 2. Excludes those whose place of work varied in the reference week, or was not stated.
Source: ABS, Census of Population and Housing, 2001.
later
309 64 128 1,909 96 214 45 345 3,110
later
309 64 128 1,909 96 214 45 345 3,110167 23 99 1,183 53 152 33 209 1,919
later
167 23 99 1,183 53 152 33 209 1,9191,181 195 490 6,554 352 910 137 1,242 11,061
later
1,181 195 490 6,554 352 910 137 1,242 11,061
Total Australian Capital Territory 1,041 148 538 3,450 231 738 135 1,090 7,371
later Total Australian Capital Territory 1,041 148 538 3,450 231 738 135 1,090 7,371
309 32 113 1,154 51 195 31 361 2,246later
309 32 113 1,154 51 195 31 361 2,246201 18 50 908 17 97 6 424 1,721later
201 18 50 908 17 97 6 424 1,721
editio
n 4,667 752 2,878 23,012 1,343 4,274 773 6,130 43,829
editio
n 4,667 752 2,878 23,012 1,343 4,274 773 6,130 43,829
545 67 354 2,472 175 504 51 323 4,491
editio
n 545 67 354 2,472 175 504 51 323 4,491597 82 224 2,917 186 415 79 712 5,212
editio
n 597 82 224 2,917 186 415 79 712 5,2121,870 340 918 7,459 255 1,067 194 1,974 14,077
editio
n 1,870 340 918 7,459 255 1,067 194 1,974 14,077814 106 415 3,985 202 701 130 694 7,047
editio
n 814 106 415 3,985 202 701 130 694 7,047186 21 134 1,954 63 182 31 310 2,881
editio
n 186 21 134 1,954 63 182 31 310 2,881292 29 217 2,146 105 280 99 382 3,550
editio
n 292 29 217 2,146 105 280 99 382 3,550
4,393 677 2,306 21,678 1,009 3,210 615 4,532 38,420
editio
n 4,393 677 2,306 21,678 1,009 3,210 615 4,532 38,420
Greater Hobart–Southern 692 104 257 3,357 203 526 56 663 5,858editio
n Greater Hobart–Southern 692 104 257 3,357 203 526 56 663 5,858
309 64 128 1,909 96 214 45 345 3,110editio
n
309 64 128 1,909 96 214 45 345 3,110167 23 99 1,183 53 152 33 209 1,919ed
ition
167 23 99 1,183 53 152 33 209 1,919
avail
able
292 29 217 2,146 105 280 99 382 3,550
avail
able
292 29 217 2,146 105 280 99 382 3,5504,393 677 2,306 21,678 1,009 3,210 615 4,532 38,420
avail
able4,393 677 2,306 21,678 1,009 3,210 615 4,532 38,420
Greater Hobart–Southern 692 104 257 3,357 203 526 56 663 5,858
avail
ableGreater Hobart–Southern 692 104 257 3,357 203 526 56 663 5,858
309 64 128 1,909 96 214 45 345 3,110
avail
able309 64 128 1,909 96 214 45 345 3,110
167 23 99 1,183 53 152 33 209 1,919
avail
able
167 23 99 1,183 53 152 33 209 1,9191,181 195 490 6,554 352 910 137 1,242 11,061
avail
able
1,181 195 490 6,554 352 910 137 1,242 11,061
Total Australian Capital Territory 1,041 148 538 3,450 231 738 135 1,090 7,371
avail
able
Total Australian Capital Territory 1,041 148 538 3,450 231 738 135 1,090 7,371
309 32 113 1,154 51 195 31 361 2,246
avail
able
309 32 113 1,154 51 195 31 361 2,246201 18 50 908 17 97 6 424 1,721
avail
able
201 18 50 908 17 97 6 424 1,721515 50 169 2,101 71 295 40 802 4,043av
ailab
le
515 50 169 2,101 71 295 40 802 4,043avail
able
51,051 8,014 25,353 238,740 13,693 38,866 8,305 57,696 441,718avail
able
51,051 8,014 25,353 238,740 13,693 38,866 8,305 57,696 441,718
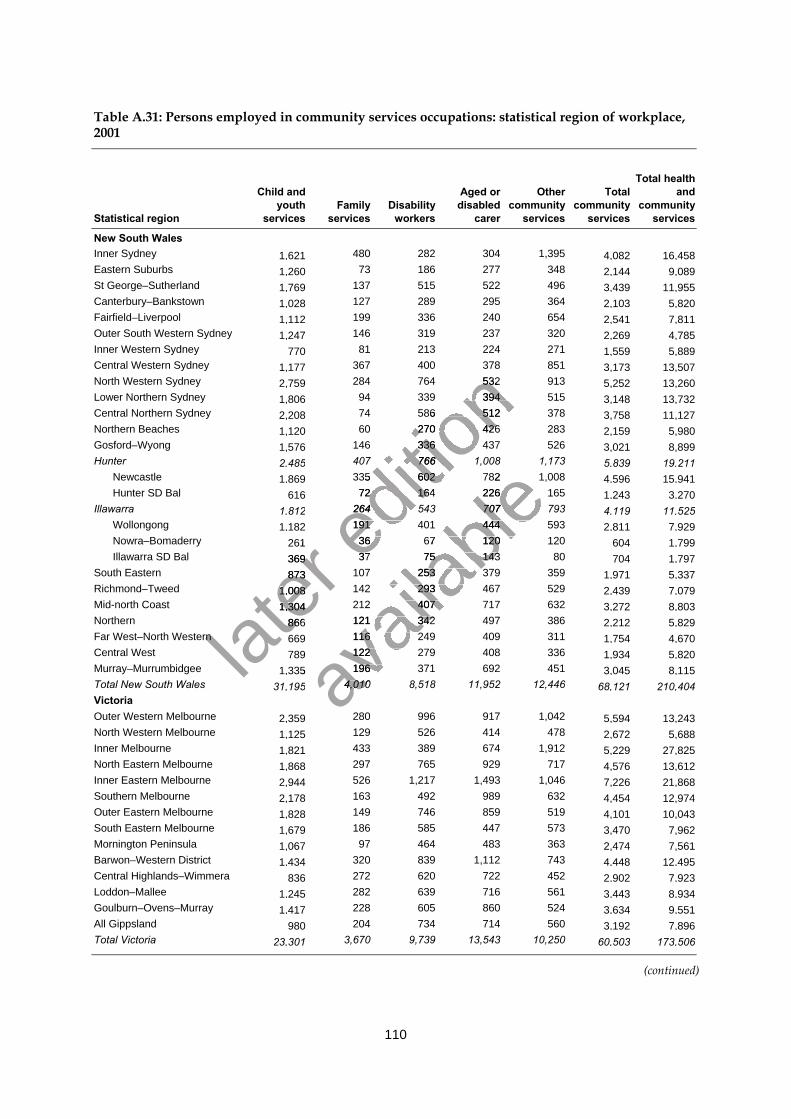
110
Table A.31: Persons employed in community services occupations: statistical region of workplace,2001
Statistical region
Child andyouth
servicesFamily
servicesDisability
workers
Aged ordisabled
carer
Othercommunity
services
Totalcommunity
services
Total healthand
communityservices
New South WalesInner Sydney 1,621 480 282 304 1,395 4,082 16,458Eastern Suburbs 1,260 73 186 277 348 2,144 9,089St George–Sutherland 1,769 137 515 522 496 3,439 11,955Canterbury–Bankstown 1,028 127 289 295 364 2,103 5,820Fairfield–Liverpool 1,112 199 336 240 654 2,541 7,811Outer South Western Sydney 1,247 146 319 237 320 2,269 4,785Inner Western Sydney 770 81 213 224 271 1,559 5,889Central Western Sydney 1,177 367 400 378 851 3,173 13,507North Western Sydney 2,759 284 764 532 913 5,252 13,260Lower Northern Sydney 1,806 94 339 394 515 3,148 13,732Central Northern Sydney 2,208 74 586 512 378 3,758 11,127Northern Beaches 1,120 60 270 426 283 2,159 5,980Gosford–Wyong 1,576 146 336 437 526 3,021 8,899Hunter 2,485 407 766 1,008 1,173 5,839 19,211
Newcastle 1,869 335 602 782 1,008 4,596 15,941Hunter SD Bal 616 72 164 226 165 1,243 3,270
Illawarra 1,812 264 543 707 793 4,119 11,525Wollongong 1,182 191 401 444 593 2,811 7,929Nowra–Bomaderry 261 36 67 120 120 604 1,799Illawarra SD Bal 369 37 75 143 80 704 1,797
South Eastern 873 107 253 379 359 1,971 5,337Richmond–Tweed 1,008 142 293 467 529 2,439 7,079Mid-north Coast 1,304 212 407 717 632 3,272 8,803Northern 866 121 342 497 386 2,212 5,829Far West–North Western 669 116 249 409 311 1,754 4,670Central West 789 122 279 408 336 1,934 5,820Murray–Murrumbidgee 1,335 196 371 692 451 3,045 8,115Total New South Wales 31,195 4,010 8,518 11,952 12,446 68,121 210,404VictoriaOuter Western Melbourne 2,359 280 996 917 1,042 5,594 13,243North Western Melbourne 1,125 129 526 414 478 2,672 5,688Inner Melbourne 1,821 433 389 674 1,912 5,229 27,825North Eastern Melbourne 1,868 297 765 929 717 4,576 13,612Inner Eastern Melbourne 2,944 526 1,217 1,493 1,046 7,226 21,868Southern Melbourne 2,178 163 492 989 632 4,454 12,974Outer Eastern Melbourne 1,828 149 746 859 519 4,101 10,043South Eastern Melbourne 1,679 186 585 447 573 3,470 7,962Mornington Peninsula 1,067 97 464 483 363 2,474 7,561Barwon–Western District 1,434 320 839 1,112 743 4,448 12,495Central Highlands–Wimmera 836 272 620 722 452 2,902 7,923Loddon–Mallee 1,245 282 639 716 561 3,443 8,934Goulburn–Ovens–Murray 1,417 228 605 860 524 3,634 9,551All Gippsland 980 204 734 714 560 3,192 7,896Total Victoria 23,301 3,670 9,739 13,543 10,250 60,503 173,506
(continued)
later
261
later
261369
later
369873
later 873
1
later 1,
later ,008
later 008
1
later 1,
later ,304
later 304
866
later 866
Far West–North Western later
Far West–North Western
editio
n 367 400 378 851
editio
n 367 400 378 851284 764 532 913
editio
n 284 764 532 91394 339 394 515
editio
n 94 339 394 51574 586 512 378
editio
n 74 586 512 37860 270 426 283
editio
n 60 270 426 283146 336 437 526
editio
n 146 336 437 526407 766 1,008 1,173
editio
n 407 766 1,008 1,173335 602 782 1,008
editio
n 335 602 782 1,00872 164 226 165
editio
n 72 164 226 165
264 543 707 793editio
n 264 543 707 793191 401 444 593ed
ition
191 401 444 59336 67 120 120ed
ition
36 67 120 12037 75 143 80ed
ition
37 75 143 80
avail
able
407 766 1,008 1,173
avail
able
407 766 1,008 1,173335 602 782 1,008
avail
able
335 602 782 1,00872 164 226 165
avail
able72 164 226 165
264 543 707 793
avail
able264 543 707 793
191 401 444 593
avail
able191 401 444 593
36 67 120 120
avail
able36 67 120 120
37 75 143 80
avail
able
37 75 143 80107 253 379 359
avail
able
107 253 379 359142 293 467 529
avail
able
142 293 467 529212 407 717 632
avail
able
212 407 717 632121 342 497 386
avail
able
121 342 497 386116 249 409 311
avail
able
116 249 409 311122 279 408 336
avail
able
122 279 408 336
335 avail
able
335 196 371 692 451avail
able
196 371 692 4514,010 8,518 11,952 12,446av
ailab
le
4,010 8,518 11,952 12,446
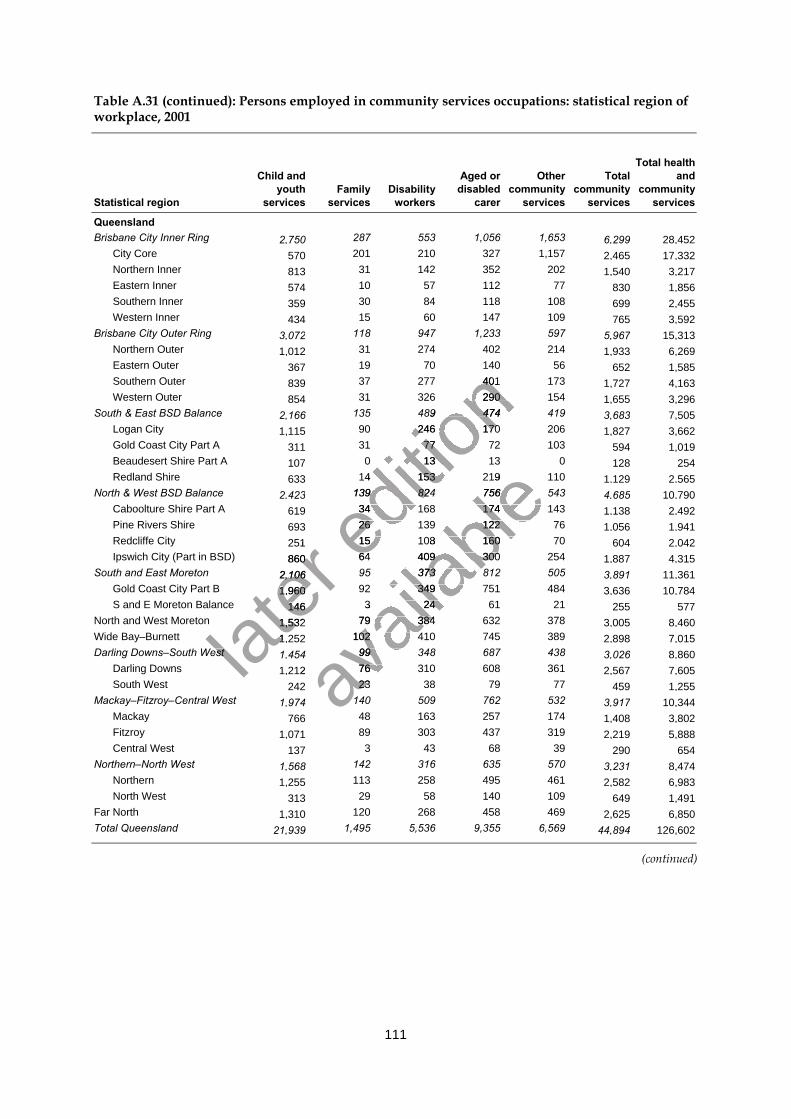
111
Table A.31 (continued): Persons employed in community services occupations: statistical region ofworkplace, 2001
Statistical region
Child andyouth
servicesFamily
servicesDisability
workers
Aged ordisabled
carer
Othercommunity
services
Totalcommunity
services
Total healthand
communityservices
QueenslandBrisbane City Inner Ring 2,750 287 553 1,056 1,653 6,299 28,452
City Core 570 201 210 327 1,157 2,465 17,332Northern Inner 813 31 142 352 202 1,540 3,217Eastern Inner 574 10 57 112 77 830 1,856Southern Inner 359 30 84 118 108 699 2,455Western Inner 434 15 60 147 109 765 3,592
Brisbane City Outer Ring 3,072 118 947 1,233 597 5,967 15,313Northern Outer 1,012 31 274 402 214 1,933 6,269Eastern Outer 367 19 70 140 56 652 1,585Southern Outer 839 37 277 401 173 1,727 4,163Western Outer 854 31 326 290 154 1,655 3,296
South & East BSD Balance 2,166 135 489 474 419 3,683 7,505Logan City 1,115 90 246 170 206 1,827 3,662Gold Coast City Part A 311 31 77 72 103 594 1,019Beaudesert Shire Part A 107 0 13 13 0 128 254Redland Shire 633 14 153 219 110 1,129 2,565
North & West BSD Balance 2,423 139 824 756 543 4,685 10,790Caboolture Shire Part A 619 34 168 174 143 1,138 2,492Pine Rivers Shire 693 26 139 122 76 1,056 1,941Redcliffe City 251 15 108 160 70 604 2,042Ipswich City (Part in BSD) 860 64 409 300 254 1,887 4,315
South and East Moreton 2,106 95 373 812 505 3,891 11,361Gold Coast City Part B 1,960 92 349 751 484 3,636 10,784S and E Moreton Balance 146 3 24 61 21 255 577
North and West Moreton 1,532 79 384 632 378 3,005 8,460Wide Bay–Burnett 1,252 102 410 745 389 2,898 7,015Darling Downs–South West 1,454 99 348 687 438 3,026 8,860
Darling Downs 1,212 76 310 608 361 2,567 7,605South West 242 23 38 79 77 459 1,255
Mackay–Fitzroy–Central West 1,974 140 509 762 532 3,917 10,344Mackay 766 48 163 257 174 1,408 3,802Fitzroy 1,071 89 303 437 319 2,219 5,888Central West 137 3 43 68 39 290 654
Northern–North West 1,568 142 316 635 570 3,231 8,474Northern 1,255 113 258 495 461 2,582 6,983North West 313 29 58 140 109 649 1,491
Far North 1,310 120 268 458 469 2,625 6,850Total Queensland 21,939 1,495 5,536 9,355 6,569 44,894 126,602
(continued)
later
251
later
251860
later
8602
later 2,
later ,106
later 106
1
later 1,
later ,960
later 960
146
later 146
1
later 1,
later ,532
later 532
1later
1Darling Downs–South West lat
er Darling Downs–South West
editio
n 19 70 140 56
editio
n 19 70 140 5637 277 401 173
editio
n 37 277 401 17331 326 290 154
editio
n 31 326 290 154135 489 474 419
editio
n 135 489 474 41990 246 170 206
editio
n 90 246 170 20631 77 72 103
editio
n 31 77 72 1030 13 13 0
editio
n 0 13 13 0
14 153 219 110
editio
n 14 153 219 110
139 824 756 543
editio
n 139 824 756 54334 168 174 143ed
ition
34 168 174 14326 139 122 76ed
ition
26 139 122 7615 108 160 70ed
ition
15 108 160 7064 409 300 254ed
ition
64 409 300 254
avail
able
14 153 219 110
avail
able
14 153 219 110139 824 756 543
avail
able139 824 756 543
34 168 174 143
avail
able34 168 174 143
26 139 122 76
avail
able26 139 122 76
15 108 160 70
avail
able15 108 160 70
64 409 300 254
avail
able
64 409 300 25495 373 812 505
avail
able
95 373 812 50592 349 751 484
avail
able
92 349 751 4843 24 61 21
avail
able
3 24 61 2179 384 632 378
avail
able
79 384 632 378102 410 745 389
avail
able
102 410 745 38999 348 687 438
avail
able
99 348 687 438
212 avail
able
212 76 310 608 361avail
able
76 310 608 36123 38 79 77avail
able
23 38 79 77140 509 762 532avail
able
140 509 762 532
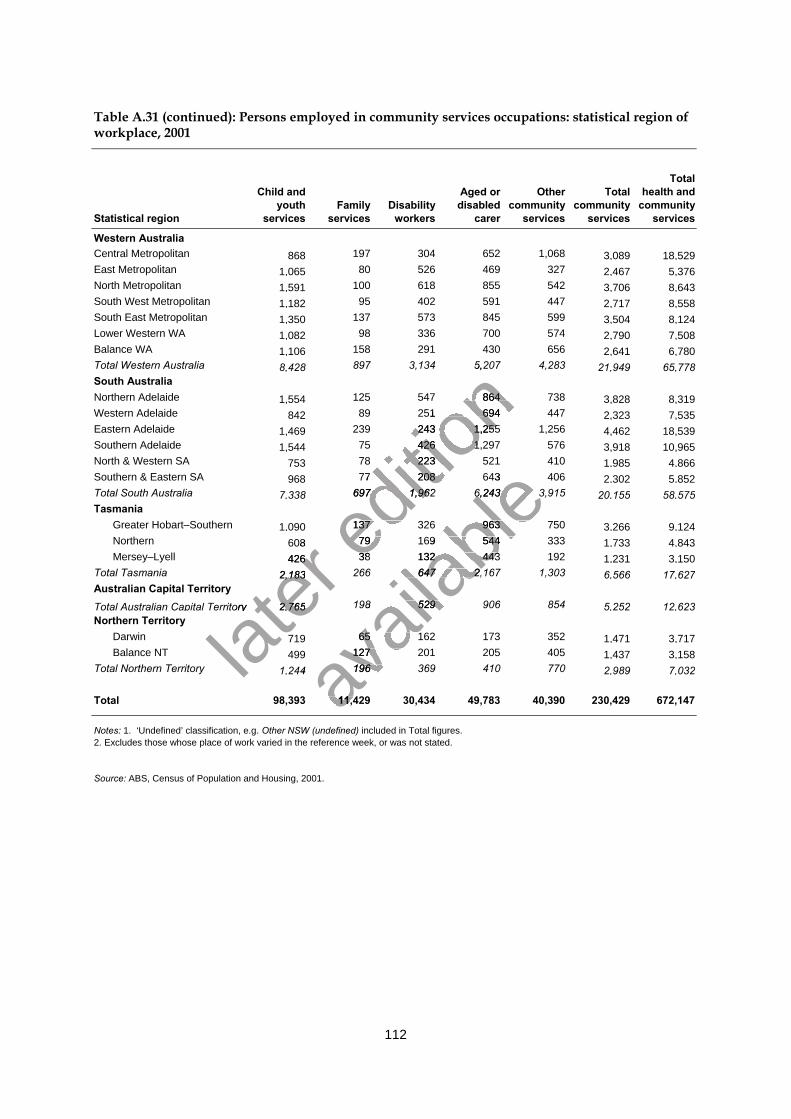
112
Table A.31 (continued): Persons employed in community services occupations: statistical region ofworkplace, 2001
Statistical region
Child andyouth
servicesFamily
servicesDisability
workers
Aged ordisabled
carer
Othercommunity
services
Totalcommunity
services
Totalhealth and
communityservices
Western AustraliaCentral Metropolitan 868 197 304 652 1,068 3,089 18,529East Metropolitan 1,065 80 526 469 327 2,467 5,376North Metropolitan 1,591 100 618 855 542 3,706 8,643South West Metropolitan 1,182 95 402 591 447 2,717 8,558South East Metropolitan 1,350 137 573 845 599 3,504 8,124Lower Western WA 1,082 98 336 700 574 2,790 7,508Balance WA 1,106 158 291 430 656 2,641 6,780Total Western Australia 8,428 897 3,134 5,207 4,283 21,949 65,778South AustraliaNorthern Adelaide 1,554 125 547 864 738 3,828 8,319Western Adelaide 842 89 251 694 447 2,323 7,535Eastern Adelaide 1,469 239 243 1,255 1,256 4,462 18,539Southern Adelaide 1,544 75 426 1,297 576 3,918 10,965North & Western SA 753 78 223 521 410 1,985 4,866Southern & Eastern SA 968 77 208 643 406 2,302 5,852Total South Australia 7,338 697 1,962 6,243 3,915 20,155 58,575Tasmania
Greater Hobart–Southern 1,090 137 326 963 750 3,266 9,124Northern 608 79 169 544 333 1,733 4,843Mersey–Lyell 426 38 132 443 192 1,231 3,150
Total Tasmania 2,183 266 647 2,167 1,303 6,566 17,627Australian Capital TerritoryTotal Australian Capital Territory 2,765 198 529 906 854 5,252 12,623Northern Territory
Darwin 719 65 162 173 352 1,471 3,717Balance NT 499 127 201 205 405 1,437 3,158
Total Northern Territory 1,244 196 369 410 770 2,989 7,032
Total 98,393 11,429 30,434 49,783 40,390 230,429 672,147
Notes: 1. ‘Undefined’ classification, e.g. Other NSW (undefined) included in Total figures.2. Excludes those whose place of work varied in the reference week, or was not stated.
Source: ABS, Census of Population and Housing, 2001.
later
608
later
608426
later
4262
later 2,
later ,18
later 183
later 3
ital Territor
later ital Territory
later yital Territoryital Territor
later ital Territoryital Territor 2
later 2,
later ,76
later 765
later 5
editio
n 897 3,134 5,207 4,283
editio
n 897 3,134 5,207 4,283
125 547 864 738
editio
n 125 547 864 73889 251 694 447
editio
n 89 251 694 447239 243 1,255 1,256
editio
n 239 243 1,255 1,25675 426 1,297 576
editio
n 75 426 1,297 57678 223 521 410
editio
n 78 223 521 41077 208 643 406
editio
n 77 208 643 406
697 1,962 6,243 3,915
editio
n 697 1,962 6,243 3,915
137 326 963 750editio
n 137 326 963 75079 169 544 333ed
ition
79 169 544 33338 132 443 192ed
ition
38 132 443 192
avail
able
77 208 643 406
avail
able
77 208 643 406697 1,962 6,243 3,915
avail
able697 1,962 6,243 3,915
137 326 963 750
avail
able137 326 963 750
79 169 544 333
avail
able79 169 544 333
38 132 443 192
avail
able
38 132 443 192266 647 2,167 1,303
avail
able
266 647 2,167 1,303
198 529 906 854
avail
able
198 529 906 854
65 162 173 352
avail
able
65 162 173 352127 201 205 405
avail
able
127 201 205 405
244 avail
able
244 196 369 410 770avail
able
196 369 410 770avail
able
98,393 11,429 30,434 49,783 40,390 230,429 672,147avail
able
98,393 11,429 30,434 49,783 40,390 230,429 672,147
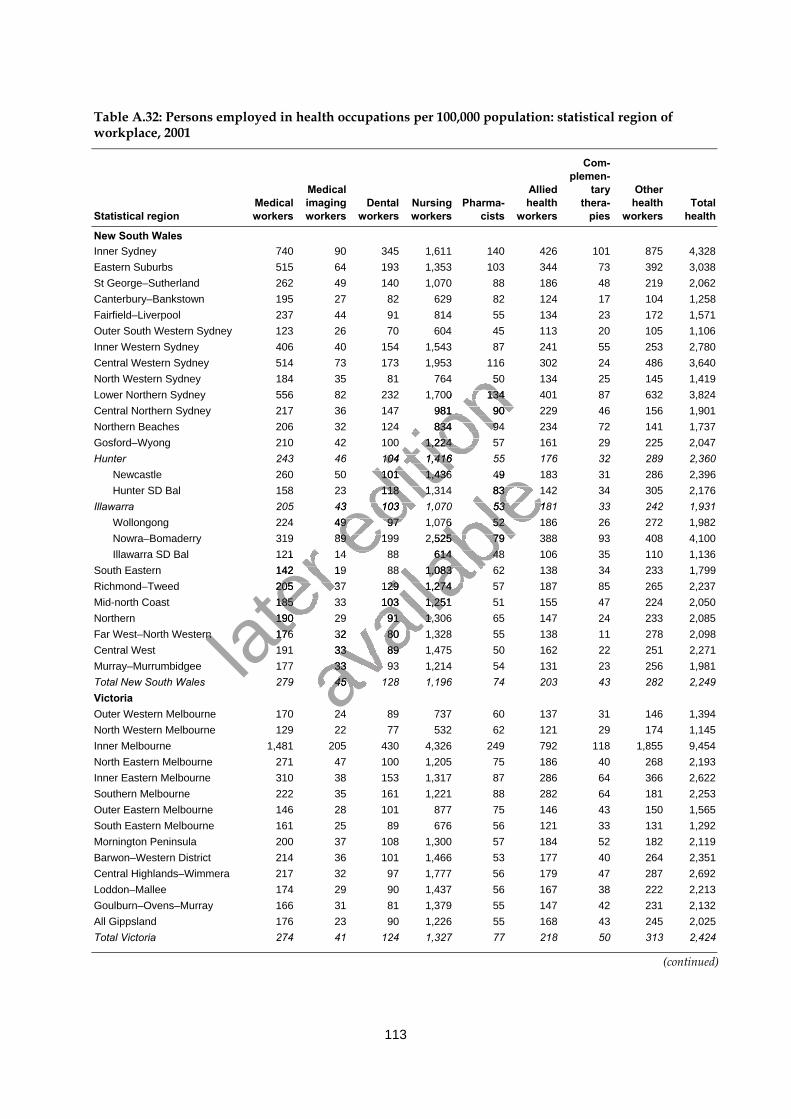
113
Table A.32: Persons employed in health occupations per 100,000 population: statistical region ofworkplace, 2001
Statistical regionMedicalworkers
Medicalimagingworkers
Dentalworkers
Nursingworkers
Pharma-cists
Alliedhealth
workers
Com-plemen-
tarythera-
pies
Otherhealth
workersTotal
health
New South WalesInner Sydney 740 90 345 1,611 140 426 101 875 4,328Eastern Suburbs 515 64 193 1,353 103 344 73 392 3,038St George–Sutherland 262 49 140 1,070 88 186 48 219 2,062Canterbury–Bankstown 195 27 82 629 82 124 17 104 1,258Fairfield–Liverpool 237 44 91 814 55 134 23 172 1,571Outer South Western Sydney 123 26 70 604 45 113 20 105 1,106Inner Western Sydney 406 40 154 1,543 87 241 55 253 2,780Central Western Sydney 514 73 173 1,953 116 302 24 486 3,640North Western Sydney 184 35 81 764 50 134 25 145 1,419Lower Northern Sydney 556 82 232 1,700 134 401 87 632 3,824Central Northern Sydney 217 36 147 981 90 229 46 156 1,901Northern Beaches 206 32 124 834 94 234 72 141 1,737Gosford–Wyong 210 42 100 1,224 57 161 29 225 2,047Hunter 243 46 104 1,416 55 176 32 289 2,360
Newcastle 260 50 101 1,436 49 183 31 286 2,396Hunter SD Bal 158 23 118 1,314 83 142 34 305 2,176
Illawarra 205 43 103 1,070 53 181 33 242 1,931Wollongong 224 49 97 1,076 52 186 26 272 1,982Nowra–Bomaderry 319 89 199 2,525 79 388 93 408 4,100Illawarra SD Bal 121 14 88 614 48 106 35 110 1,136
South Eastern 142 19 88 1,083 62 138 34 233 1,799Richmond–Tweed 205 37 129 1,274 57 187 85 265 2,237Mid-north Coast 185 33 103 1,251 51 155 47 224 2,050Northern 190 29 91 1,306 65 147 24 233 2,085Far West–North Western 176 32 80 1,328 55 138 11 278 2,098Central West 191 33 89 1,475 50 162 22 251 2,271Murray–Murrumbidgee 177 33 93 1,214 54 131 23 256 1,981Total New South Wales 279 45 128 1,196 74 203 43 282 2,249VictoriaOuter Western Melbourne 170 24 89 737 60 137 31 146 1,394North Western Melbourne 129 22 77 532 62 121 29 174 1,145Inner Melbourne 1,481 205 430 4,326 249 792 118 1,855 9,454North Eastern Melbourne 271 47 100 1,205 75 186 40 268 2,193Inner Eastern Melbourne 310 38 153 1,317 87 286 64 366 2,622Southern Melbourne 222 35 161 1,221 88 282 64 181 2,253Outer Eastern Melbourne 146 28 101 877 75 146 43 150 1,565South Eastern Melbourne 161 25 89 676 56 121 33 131 1,292Mornington Peninsula 200 37 108 1,300 57 184 52 182 2,119Barwon–Western District 214 36 101 1,466 53 177 40 264 2,351Central Highlands–Wimmera 217 32 97 1,777 56 179 47 287 2,692Loddon–Mallee 174 29 90 1,437 56 167 38 222 2,213Goulburn–Ovens–Murray 166 31 81 1,379 55 147 42 231 2,132All Gippsland 176 23 90 1,226 55 168 43 245 2,025Total Victoria 274 41 124 1,327 77 218 50 313 2,424
(continued)
later
319 89 199 2,525 79 388 93 408 4,100
later
319 89 199 2,525 79 388 93 408 4,100121 14 88 614 48 106 35 110 1,136
later
121 14 88 614 48 106 35 110 1,136142 19 88 1,083 62 138 34 233 1,799
later
142 19 88 1,083 62 138 34 233 1,799205 37 129 1,274 57 187 85 265 2,237
later 205 37 129 1,274 57 187 85 265 2,237
185 33 103 1,251 51 155 47 224 2,050
later 185 33 103 1,251 51 155 47 224 2,050
190 29 91 1,306 65 147 24 233 2,085
later 190 29 91 1,306 65 147 24 233 2,085
Far West–North Western later
Far West–North Western 176 32 80 1,328 55 138 11 278 2,098later
176 32 80 1,328 55 138 11 278 2,098
editio
n 514 73 173 1,953 116 302 24 486 3,640
editio
n 514 73 173 1,953 116 302 24 486 3,640184 35 81 764 50 134 25 145 1,419
editio
n 184 35 81 764 50 134 25 145 1,419556 82 232 1,700 134 401 87 632 3,824
editio
n 556 82 232 1,700 134 401 87 632 3,824217 36 147 981 90 229 46 156 1,901
editio
n 217 36 147 981 90 229 46 156 1,901206 32 124 834 94 234 72 141 1,737
editio
n 206 32 124 834 94 234 72 141 1,737210 42 100 1,224 57 161 29 225 2,047
editio
n 210 42 100 1,224 57 161 29 225 2,047243 46 104 1,416 55 176 32 289 2,360
editio
n 243 46 104 1,416 55 176 32 289 2,360260 50 101 1,436 49 183 31 286 2,396
editio
n 260 50 101 1,436 49 183 31 286 2,396158 23 118 1,314 83 142 34 305 2,176
editio
n 158 23 118 1,314 83 142 34 305 2,176205 43 103 1,070 53 181 33 242 1,931
editio
n 205 43 103 1,070 53 181 33 242 1,931224 49 97 1,076 52 186 26 272 1,982ed
ition
224 49 97 1,076 52 186 26 272 1,982319 89 199 2,525 79 388 93 408 4,100ed
ition
319 89 199 2,525 79 388 93 408 4,100121 14 88 614 48 106 35 110 1,136ed
ition
121 14 88 614 48 106 35 110 1,136
avail
able
260 50 101 1,436 49 183 31 286 2,396
avail
able
260 50 101 1,436 49 183 31 286 2,396158 23 118 1,314 83 142 34 305 2,176
avail
able158 23 118 1,314 83 142 34 305 2,176
205 43 103 1,070 53 181 33 242 1,931
avail
able205 43 103 1,070 53 181 33 242 1,931
224 49 97 1,076 52 186 26 272 1,982
avail
able224 49 97 1,076 52 186 26 272 1,982
319 89 199 2,525 79 388 93 408 4,100
avail
able319 89 199 2,525 79 388 93 408 4,100
121 14 88 614 48 106 35 110 1,136
avail
able
121 14 88 614 48 106 35 110 1,136142 19 88 1,083 62 138 34 233 1,799
avail
able
142 19 88 1,083 62 138 34 233 1,799205 37 129 1,274 57 187 85 265 2,237
avail
able
205 37 129 1,274 57 187 85 265 2,237185 33 103 1,251 51 155 47 224 2,050
avail
able
185 33 103 1,251 51 155 47 224 2,050
avail
able
190 29 91 1,306 65 147 24 233 2,085
avail
able
190 29 91 1,306 65 147 24 233 2,085176 32 80 1,328 55 138 11 278 2,098
avail
able
176 32 80 1,328 55 138 11 278 2,098191 33 89 1,475 50 162 22 251 2,271
avail
able
191 33 89 1,475 50 162 22 251 2,271
avail
able
177 33 93 1,214 54 131 23 256 1,981avail
able
177 33 93 1,214 54 131 23 256 1,981279 45 128 1,196 74 203 43 282 2,249av
ailab
le
279 45 128 1,196 74 203 43 282 2,249
170 24 89 737 60 137 31 146 1,394avail
able
170 24 89 737 60 137 31 146 1,394
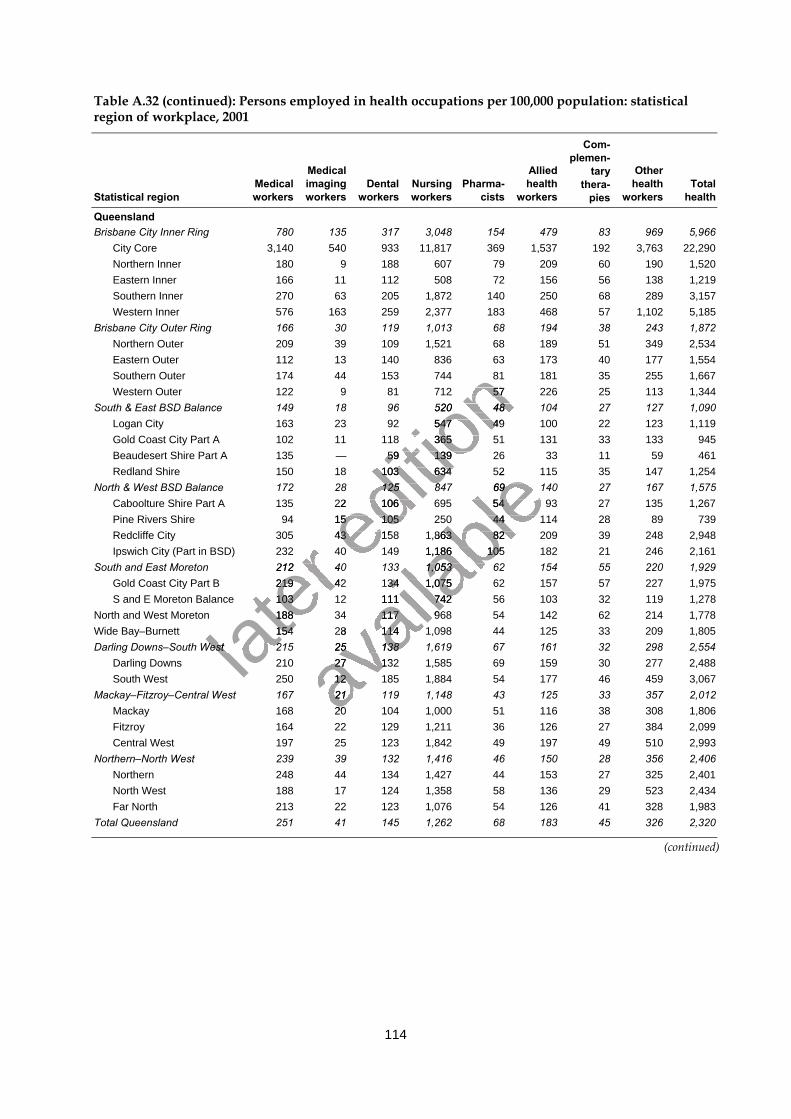
114
Table A.32 (continued): Persons employed in health occupations per 100,000 population: statisticalregion of workplace, 2001
Statistical regionMedicalworkers
Medicalimagingworkers
Dentalworkers
Nursingworkers
Pharma-cists
Alliedhealth
workers
Com-plemen-
tarythera-
pies
Otherhealth
workersTotal
health
QueenslandBrisbane City Inner Ring 780 135 317 3,048 154 479 83 969 5,966
City Core 3,140 540 933 11,817 369 1,537 192 3,763 22,290Northern Inner 180 9 188 607 79 209 60 190 1,520Eastern Inner 166 11 112 508 72 156 56 138 1,219Southern Inner 270 63 205 1,872 140 250 68 289 3,157Western Inner 576 163 259 2,377 183 468 57 1,102 5,185
Brisbane City Outer Ring 166 30 119 1,013 68 194 38 243 1,872Northern Outer 209 39 109 1,521 68 189 51 349 2,534Eastern Outer 112 13 140 836 63 173 40 177 1,554Southern Outer 174 44 153 744 81 181 35 255 1,667Western Outer 122 9 81 712 57 226 25 113 1,344
South & East BSD Balance 149 18 96 520 48 104 27 127 1,090Logan City 163 23 92 547 49 100 22 123 1,119Gold Coast City Part A 102 11 118 365 51 131 33 133 945Beaudesert Shire Part A 135 — 59 139 26 33 11 59 461Redland Shire 150 18 103 634 52 115 35 147 1,254
North & West BSD Balance 172 28 125 847 69 140 27 167 1,575Caboolture Shire Part A 135 22 106 695 54 93 27 135 1,267Pine Rivers Shire 94 15 105 250 44 114 28 89 739Redcliffe City 305 43 158 1,863 82 209 39 248 2,948Ipswich City (Part in BSD) 232 40 149 1,186 105 182 21 246 2,161
South and East Moreton 212 40 133 1,053 62 154 55 220 1,929Gold Coast City Part B 219 42 134 1,075 62 157 57 227 1,975S and E Moreton Balance 103 12 111 742 56 103 32 119 1,278
North and West Moreton 188 34 117 968 54 142 62 214 1,778Wide Bay–Burnett 154 28 114 1,098 44 125 33 209 1,805Darling Downs–South West 215 25 138 1,619 67 161 32 298 2,554
Darling Downs 210 27 132 1,585 69 159 30 277 2,488South West 250 12 185 1,884 54 177 46 459 3,067
Mackay–Fitzroy–Central West 167 21 119 1,148 43 125 33 357 2,012Mackay 168 20 104 1,000 51 116 38 308 1,806Fitzroy 164 22 129 1,211 36 126 27 384 2,099Central West 197 25 123 1,842 49 197 49 510 2,993
Northern–North West 239 39 132 1,416 46 150 28 356 2,406Northern 248 44 134 1,427 44 153 27 325 2,401North West 188 17 124 1,358 58 136 29 523 2,434Far North 213 22 123 1,076 54 126 41 328 1,983
Total Queensland 251 41 145 1,262 68 183 45 326 2,320
(continued)
later
305 43 158 1,863 82 209 39 248 2,948
later
305 43 158 1,863 82 209 39 248 2,948Ipswich City (Part in BSD) 232 40 149 1,186 105 182 21 246 2,161
later
Ipswich City (Part in BSD) 232 40 149 1,186 105 182 21 246 2,161212 40 133 1,053 62 154 55 220 1,929
later
212 40 133 1,053 62 154 55 220 1,929219 42 134 1,075 62 157 57 227 1,975
later 219 42 134 1,075 62 157 57 227 1,975
S and E Moreton Balance 103 12 111 742 56 103 32 119 1,278
later S and E Moreton Balance 103 12 111 742 56 103 32 119 1,278
188 34 117 968 54 142 62 214 1,778
later 188 34 117 968 54 142 62 214 1,778
later
154 28 114 1,098 44 125 33 209 1,805later
154 28 114 1,098 44 125 33 209 1,805Darling Downs–South West 215 25 138 1,619 67 161 32 298 2,554lat
er Darling Downs–South West 215 25 138 1,619 67 161 32 298 2,554
editio
n 174 44 153 744 81 181 35 255 1,667
editio
n 174 44 153 744 81 181 35 255 1,667122 9 81 712 57 226 25 113 1,344
editio
n 122 9 81 712 57 226 25 113 1,344149 18 96 520 48 104 27 127 1,090
editio
n 149 18 96 520 48 104 27 127 1,090163 23 92 547 49 100 22 123 1,119
editio
n 163 23 92 547 49 100 22 123 1,119102 11 118 365 51 131 33 133 945
editio
n 102 11 118 365 51 131 33 133 945
Beaudesert Shire Part A 135 — 59 139 26 33 11 59 461
editio
n Beaudesert Shire Part A 135 — 59 139 26 33 11 59 461
150 18 103 634 52 115 35 147 1,254
editio
n 150 18 103 634 52 115 35 147 1,254
North & West BSD Balance 172 28 125 847 69 140 27 167 1,575
editio
n North & West BSD Balance 172 28 125 847 69 140 27 167 1,575
Caboolture Shire Part A 135 22 106 695 54 93 27 135 1,267
editio
n Caboolture Shire Part A 135 22 106 695 54 93 27 135 1,267
94 15 105 250 44 114 28 89 739editio
n 94 15 105 250 44 114 28 89 739
305 43 158 1,863 82 209 39 248 2,948editio
n
305 43 158 1,863 82 209 39 248 2,948Ipswich City (Part in BSD) 232 40 149 1,186 105 182 21 246 2,161ed
ition
Ipswich City (Part in BSD) 232 40 149 1,186 105 182 21 246 2,161
avail
able
150 18 103 634 52 115 35 147 1,254
avail
able
150 18 103 634 52 115 35 147 1,254North & West BSD Balance 172 28 125 847 69 140 27 167 1,575
avail
able
North & West BSD Balance 172 28 125 847 69 140 27 167 1,575Caboolture Shire Part A 135 22 106 695 54 93 27 135 1,267
avail
ableCaboolture Shire Part A 135 22 106 695 54 93 27 135 1,267
94 15 105 250 44 114 28 89 739
avail
able94 15 105 250 44 114 28 89 739
305 43 158 1,863 82 209 39 248 2,948
avail
able305 43 158 1,863 82 209 39 248 2,948
Ipswich City (Part in BSD) 232 40 149 1,186 105 182 21 246 2,161
avail
able
Ipswich City (Part in BSD) 232 40 149 1,186 105 182 21 246 2,161212 40 133 1,053 62 154 55 220 1,929
avail
able
212 40 133 1,053 62 154 55 220 1,929219 42 134 1,075 62 157 57 227 1,975
avail
able
219 42 134 1,075 62 157 57 227 1,975S and E Moreton Balance 103 12 111 742 56 103 32 119 1,278
avail
able
S and E Moreton Balance 103 12 111 742 56 103 32 119 1,278188 34 117 968 54 142 62 214 1,778
avail
able
188 34 117 968 54 142 62 214 1,778
avail
able
154 28 114 1,098 44 125 33 209 1,805
avail
able
154 28 114 1,098 44 125 33 209 1,805Darling Downs–South West 215 25 138 1,619 67 161 32 298 2,554
avail
able
Darling Downs–South West 215 25 138 1,619 67 161 32 298 2,554210 27 132 1,585 69 159 30 277 2,488av
ailab
le
210 27 132 1,585 69 159 30 277 2,488250 12 185 1,884 54 177 46 459 3,067av
ailab
le
250 12 185 1,884 54 177 46 459 3,067avail
able
Mackay–Fitzroy–Central West 167 21 119 1,148 43 125 33 357 2,012avail
able
Mackay–Fitzroy–Central West 167 21 119 1,148 43 125 33 357 2,012168 20 104 1,000 51 116 38 308 1,806av
ailab
le
168 20 104 1,000 51 116 38 308 1,806
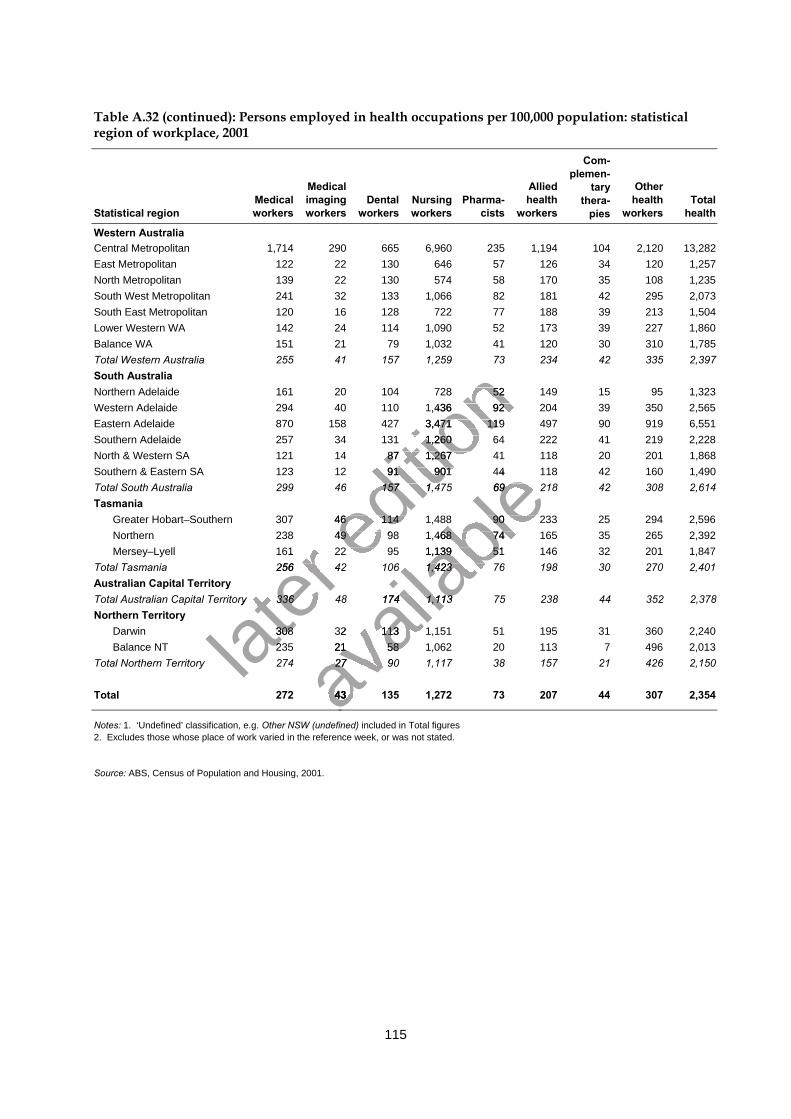
115
Table A.32 (continued): Persons employed in health occupations per 100,000 population: statisticalregion of workplace, 2001
Statistical regionMedicalworkers
Medicalimagingworkers
Dentalworkers
Nursingworkers
Pharma-cists
Alliedhealth
workers
Com-plemen-
tarythera-
pies
Otherhealth
workersTotal
health
Western AustraliaCentral Metropolitan 1,714 290 665 6,960 235 1,194 104 2,120 13,282East Metropolitan 122 22 130 646 57 126 34 120 1,257North Metropolitan 139 22 130 574 58 170 35 108 1,235South West Metropolitan 241 32 133 1,066 82 181 42 295 2,073South East Metropolitan 120 16 128 722 77 188 39 213 1,504Lower Western WA 142 24 114 1,090 52 173 39 227 1,860Balance WA 151 21 79 1,032 41 120 30 310 1,785Total Western Australia 255 41 157 1,259 73 234 42 335 2,397South AustraliaNorthern Adelaide 161 20 104 728 52 149 15 95 1,323Western Adelaide 294 40 110 1,436 92 204 39 350 2,565Eastern Adelaide 870 158 427 3,471 119 497 90 919 6,551Southern Adelaide 257 34 131 1,260 64 222 41 219 2,228North & Western SA 121 14 87 1,267 41 118 20 201 1,868Southern & Eastern SA 123 12 91 901 44 118 42 160 1,490Total South Australia 299 46 157 1,475 69 218 42 308 2,614Tasmania
Greater Hobart–Southern 307 46 114 1,488 90 233 25 294 2,596Northern 238 49 98 1,468 74 165 35 265 2,392Mersey–Lyell 161 22 95 1,139 51 146 32 201 1,847
Total Tasmania 256 42 106 1,423 76 198 30 270 2,401Australian Capital TerritoryTotal Australian Capital Territory 336 48 174 1,113 75 238 44 352 2,378Northern Territory
Darwin 308 32 113 1,151 51 195 31 360 2,240Balance NT 235 21 58 1,062 20 113 7 496 2,013
Total Northern Territory 274 27 90 1,117 38 157 21 426 2,150
Total 272 43 135 1,272 73 207 44 307 2,354
Notes: 1. ‘Undefined’ classification, e.g. Other NSW (undefined) included in Total figures2. Excludes those whose place of work varied in the reference week, or was not stated.
Source: ABS, Census of Population and Housing, 2001.
later
238 49 98 1,468 74 165 35 265 2,392
later
238 49 98 1,468 74 165 35 265 2,392161 22 95 1,139 51 146 32 201 1,847
later
161 22 95 1,139 51 146 32 201 1,847256 42 106 1,423 76 198 30 270 2,401
later
256 42 106 1,423 76 198 30 270 2,401
Total Australian Capital Territory 336 48 174 1,113 75 238 44 352 2,378
later Total Australian Capital Territory 336 48 174 1,113 75 238 44 352 2,378
308 32 113 1,151 51 195 31 360 2,240later
308 32 113 1,151 51 195 31 360 2,240235 21 58 1,062 20 113 7 496 2,013later
235 21 58 1,062 20 113 7 496 2,013
editio
n 161 20 104 728 52 149 15 95 1,323
editio
n 161 20 104 728 52 149 15 95 1,323294 40 110 1,436 92 204 39 350 2,565
editio
n 294 40 110 1,436 92 204 39 350 2,565870 158 427 3,471 119 497 90 919 6,551
editio
n 870 158 427 3,471 119 497 90 919 6,551257 34 131 1,260 64 222 41 219 2,228
editio
n 257 34 131 1,260 64 222 41 219 2,228121 14 87 1,267 41 118 20 201 1,868
editio
n 121 14 87 1,267 41 118 20 201 1,868123 12 91 901 44 118 42 160 1,490
editio
n 123 12 91 901 44 118 42 160 1,490299 46 157 1,475 69 218 42 308 2,614
editio
n 299 46 157 1,475 69 218 42 308 2,614
Greater Hobart–Southern 307 46 114 1,488 90 233 25 294 2,596editio
n Greater Hobart–Southern 307 46 114 1,488 90 233 25 294 2,596
238 49 98 1,468 74 165 35 265 2,392editio
n
238 49 98 1,468 74 165 35 265 2,392161 22 95 1,139 51 146 32 201 1,847ed
ition
161 22 95 1,139 51 146 32 201 1,847
avail
able
123 12 91 901 44 118 42 160 1,490
avail
able
123 12 91 901 44 118 42 160 1,490299 46 157 1,475 69 218 42 308 2,614
avail
able
299 46 157 1,475 69 218 42 308 2,614
Greater Hobart–Southern 307 46 114 1,488 90 233 25 294 2,596
avail
ableGreater Hobart–Southern 307 46 114 1,488 90 233 25 294 2,596
238 49 98 1,468 74 165 35 265 2,392
avail
able238 49 98 1,468 74 165 35 265 2,392
161 22 95 1,139 51 146 32 201 1,847
avail
able
161 22 95 1,139 51 146 32 201 1,847256 42 106 1,423 76 198 30 270 2,401
avail
able
256 42 106 1,423 76 198 30 270 2,401
Total Australian Capital Territory 336 48 174 1,113 75 238 44 352 2,378
avail
able
Total Australian Capital Territory 336 48 174 1,113 75 238 44 352 2,378
308 32 113 1,151 51 195 31 360 2,240
avail
able
308 32 113 1,151 51 195 31 360 2,240235 21 58 1,062 20 113 7 496 2,013
avail
able
235 21 58 1,062 20 113 7 496 2,013274 27 90 1,117 38 157 21 426 2,150av
ailab
le
274 27 90 1,117 38 157 21 426 2,150
272 43 135 1,272 73 207 44 307 2,354avail
able
272 43 135 1,272 73 207 44 307 2,354avail
able
avail
able
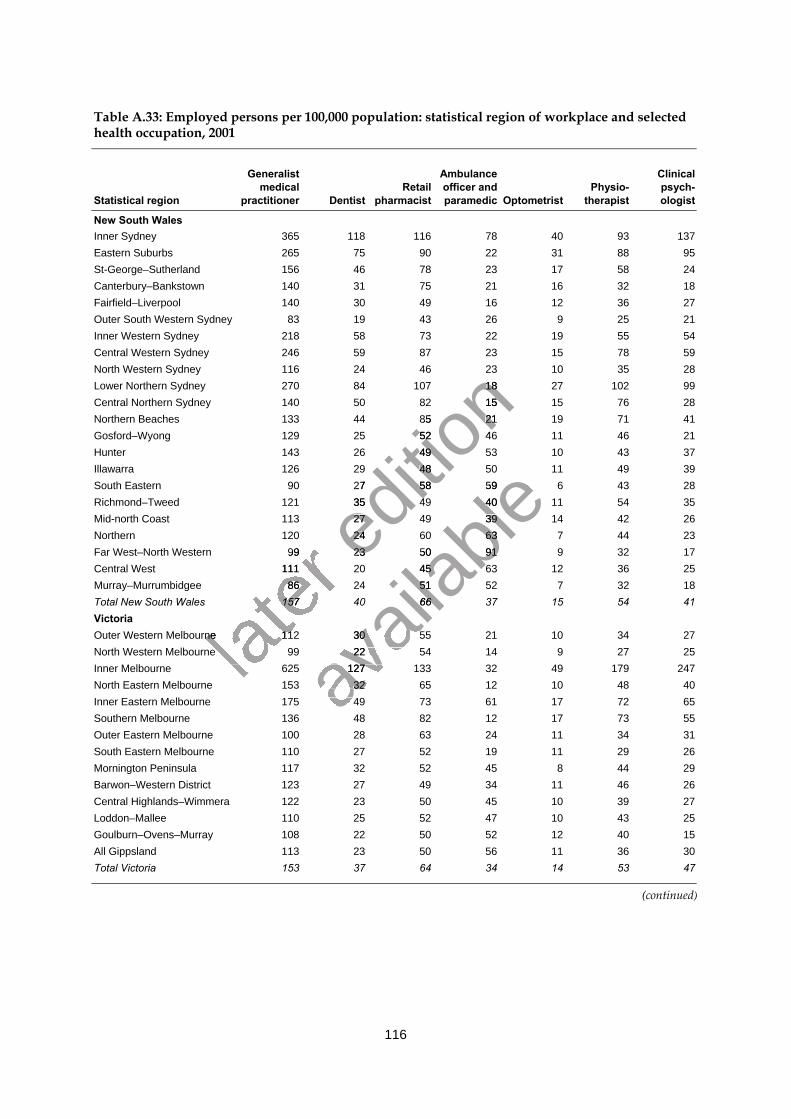
116
Table A.33: Employed persons per 100,000 population: statistical region of workplace and selectedhealth occupation, 2001
Statistical region
Generalistmedical
practitioner DentistRetail
pharmacist
Ambulanceofficer andparamedic Optometrist
Physio-therapist
Clinicalpsych-ologist
New South WalesInner Sydney 365 118 116 78 40 93 137Eastern Suburbs 265 75 90 22 31 88 95St-George–Sutherland 156 46 78 23 17 58 24Canterbury–Bankstown 140 31 75 21 16 32 18Fairfield–Liverpool 140 30 49 16 12 36 27Outer South Western Sydney 83 19 43 26 9 25 21Inner Western Sydney 218 58 73 22 19 55 54Central Western Sydney 246 59 87 23 15 78 59North Western Sydney 116 24 46 23 10 35 28Lower Northern Sydney 270 84 107 18 27 102 99Central Northern Sydney 140 50 82 15 15 76 28Northern Beaches 133 44 85 21 19 71 41Gosford–Wyong 129 25 52 46 11 46 21Hunter 143 26 49 53 10 43 37Illawarra 126 29 48 50 11 49 39South Eastern 90 27 58 59 6 43 28Richmond–Tweed 121 35 49 40 11 54 35Mid-north Coast 113 27 49 39 14 42 26Northern 120 24 60 63 7 44 23Far West–North Western 99 23 50 91 9 32 17Central West 111 20 45 63 12 36 25Murray–Murrumbidgee 86 24 51 52 7 32 18Total New South Wales 157 40 66 37 15 54 41VictoriaOuter Western Melbourne 112 30 55 21 10 34 27North Western Melbourne 99 22 54 14 9 27 25Inner Melbourne 625 127 133 32 49 179 247North Eastern Melbourne 153 32 65 12 10 48 40Inner Eastern Melbourne 175 49 73 61 17 72 65Southern Melbourne 136 48 82 12 17 73 55Outer Eastern Melbourne 100 28 63 24 11 34 31South Eastern Melbourne 110 27 52 19 11 29 26Mornington Peninsula 117 32 52 45 8 44 29Barwon–Western District 123 27 49 34 11 46 26Central Highlands–Wimmera 122 23 50 45 10 39 27Loddon–Mallee 110 25 52 47 10 43 25Goulburn–Ovens–Murray 108 22 50 52 12 40 15All Gippsland 113 23 50 56 11 36 30Total Victoria 153 37 64 34 14 53 47
(continued)
later
99
later
99111
later
11186
later 86
157
later 157
Outer Western Melbourne 112 30 55 21 10 34 27later
Outer Western Melbourne 112 30 55 21 10 34 27North Western Melbourne 99 22 54 14 9 27 25lat
er North Western Melbourne 99 22 54 14 9 27 25lat
er Inner Melbourne 625 127 133 32 49 179 247lat
er Inner Melbourne 625 127 133 32 49 179 247
editio
n 23
editio
n 2318
editio
n 1815
editio
n 1585
editio
n 85 21
editio
n 2152
editio
n 52 46
editio
n 4649
editio
n 4948
editio
n 48
27
editio
n 27 58
editio
n 58
35
editio
n 35 49
editio
n 49
27editio
n 2724ed
ition
2423ed
ition
23
avail
able
59
avail
able
5940
avail
able40
39
avail
able39
63
avail
able63
50
avail
able
50 91
avail
able
9145
avail
able
45 63
avail
able
6351
avail
able
5166
avail
able
66
Outer Western Melbourne 112 30 55 21 10 34 27
avail
able
Outer Western Melbourne 112 30 55 21 10 34 27North Western Melbourne 99 22 54 14 9 27 25
avail
able
North Western Melbourne 99 22 54 14 9 27 25
avail
able
Inner Melbourne 625 127 133 32 49 179 247avail
able
Inner Melbourne 625 127 133 32 49 179 247North Eastern Melbourne 153 32 65 12 10 48 40av
ailab
le
North Eastern Melbourne 153 32 65 12 10 48 40avail
able
Inner Eastern Melbourne 175 49 73 61 17 72 65avail
able
Inner Eastern Melbourne 175 49 73 61 17 72 65
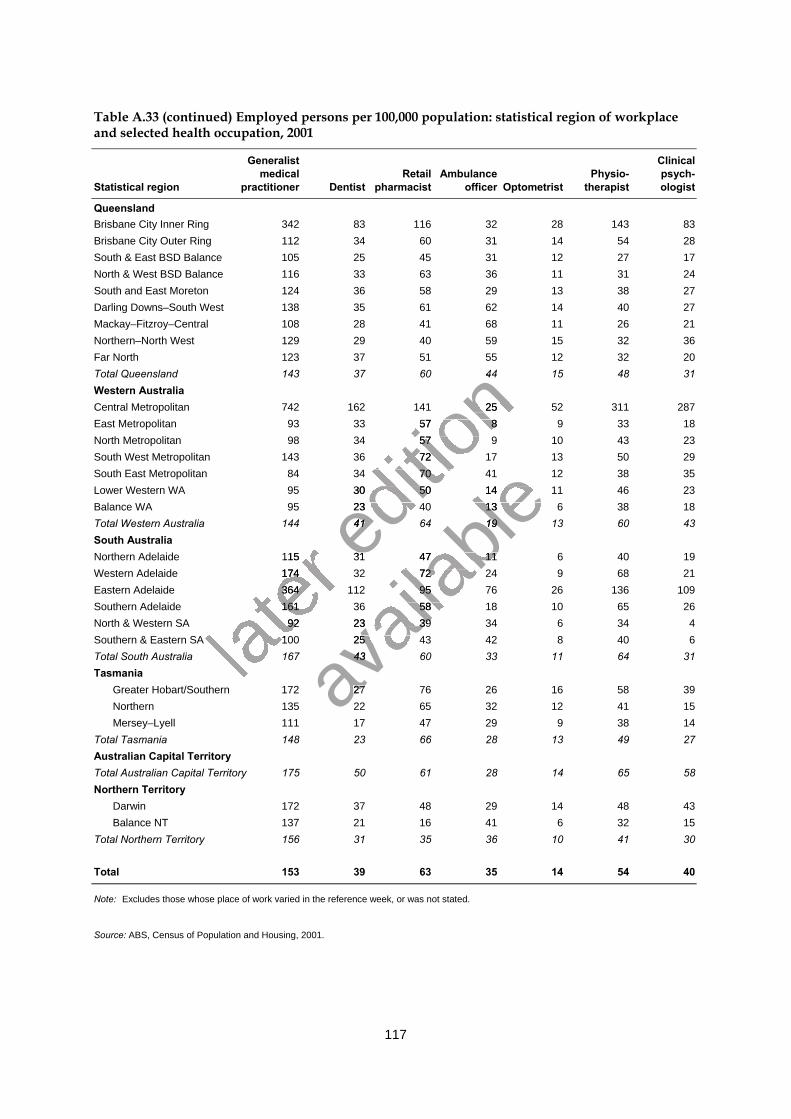
117
Table A.33 (continued) Employed persons per 100,000 population: statistical region of workplaceand selected health occupation, 2001
Statistical region
Generalistmedical
practitioner DentistRetail
pharmacistAmbulance
officer OptometristPhysio-
therapist
Clinicalpsych-ologist
QueenslandBrisbane City Inner Ring 342 83 116 32 28 143 83Brisbane City Outer Ring 112 34 60 31 14 54 28South & East BSD Balance 105 25 45 31 12 27 17North & West BSD Balance 116 33 63 36 11 31 24South and East Moreton 124 36 58 29 13 38 27Darling Downs–South West 138 35 61 62 14 40 27Mackay–Fitzroy–Central 108 28 41 68 11 26 21Northern–North West 129 29 40 59 15 32 36Far North 123 37 51 55 12 32 20Total Queensland 143 37 60 44 15 48 31Western AustraliaCentral Metropolitan 742 162 141 25 52 311 287East Metropolitan 93 33 57 8 9 33 18North Metropolitan 98 34 57 9 10 43 23South West Metropolitan 143 36 72 17 13 50 29South East Metropolitan 84 34 70 41 12 38 35Lower Western WA 95 30 50 14 11 46 23Balance WA 95 23 40 13 6 38 18Total Western Australia 144 41 64 19 13 60 43South AustraliaNorthern Adelaide 115 31 47 11 6 40 19Western Adelaide 174 32 72 24 9 68 21Eastern Adelaide 364 112 95 76 26 136 109Southern Adelaide 161 36 58 18 10 65 26North & Western SA 92 23 39 34 6 34 4Southern & Eastern SA 100 25 43 42 8 40 6Total South Australia 167 43 60 33 11 64 31Tasmania
Greater Hobart/Southern 172 27 76 26 16 58 39Northern 135 22 65 32 12 41 15Mersey–Lyell 111 17 47 29 9 38 14
Total Tasmania 148 23 66 28 13 49 27Australian Capital TerritoryTotal Australian Capital Territory 175 50 61 28 14 65 58Northern Territory
Darwin 172 37 48 29 14 48 43Balance NT 137 21 16 41 6 32 15
Total Northern Territory 156 31 35 36 10 41 30
Total 153 39 63 35 14 54 40
Note: Excludes those whose place of work varied in the reference week, or was not stated.
Source: ABS, Census of Population and Housing, 2001.
later
Northern Adelaide 115 31 47 11 6 40 19
later
Northern Adelaide 115 31 47 11 6 40 19Western Adelaide 174 32 72 24 9 68 21
later Western Adelaide 174 32 72 24 9 68 21
Eastern Adelaide 364 112 95 76 26 136 109
later Eastern Adelaide 364 112 95 76 26 136 109
Southern Adelaide 161 36 58 18 10 65 26
later Southern Adelaide 161 36 58 18 10 65 26
North & Western SA 92 23 39 34 6 34 4
later North & Western SA 92 23 39 34 6 34 4
Southern & Eastern SA 100 25 43 42 8 40 6later
Southern & Eastern SA 100 25 43 42 8 40 6
editio
n 44
editio
n 44
Central Metropolitan 742 162 141 25 52 311 287
editio
n Central Metropolitan 742 162 141 25 52 311 287East Metropolitan 93 33 57 8 9 33 18
editio
n East Metropolitan 93 33 57 8 9 33 18North Metropolitan 98 34 57 9 10 43 23
editio
n North Metropolitan 98 34 57 9 10 43 23South West Metropolitan 143 36 72 17 13 50 29
editio
n South West Metropolitan 143 36 72 17 13 50 29South East Metropolitan 84 34 70 41 12 38 35
editio
n South East Metropolitan 84 34 70 41 12 38 35Lower Western WA 95 30 50 14 11 46 23
editio
n Lower Western WA 95 30 50 14 11 46 23Balance WA 95 23 40 13 6 38 18
editio
n Balance WA 95 23 40 13 6 38 18
41editio
n 41
Northern Adelaide 115 31 47 11 6 40 19editio
n
Northern Adelaide 115 31 47 11 6 40 19
avail
able
South East Metropolitan 84 34 70 41 12 38 35
avail
able
South East Metropolitan 84 34 70 41 12 38 35Lower Western WA 95 30 50 14 11 46 23
avail
ableLower Western WA 95 30 50 14 11 46 23
Balance WA 95 23 40 13 6 38 18
avail
ableBalance WA 95 23 40 13 6 38 18
19
avail
able19
Northern Adelaide 115 31 47 11 6 40 19
avail
able
Northern Adelaide 115 31 47 11 6 40 19Western Adelaide 174 32 72 24 9 68 21
avail
able
Western Adelaide 174 32 72 24 9 68 21Eastern Adelaide 364 112 95 76 26 136 109
avail
able
Eastern Adelaide 364 112 95 76 26 136 109Southern Adelaide 161 36 58 18 10 65 26
avail
able
Southern Adelaide 161 36 58 18 10 65 26North & Western SA 92 23 39 34 6 34 4
avail
able
North & Western SA 92 23 39 34 6 34 4Southern & Eastern SA 100 25 43 42 8 40 6
avail
able
Southern & Eastern SA 100 25 43 42 8 40 643
avail
able
43
27avail
able
27
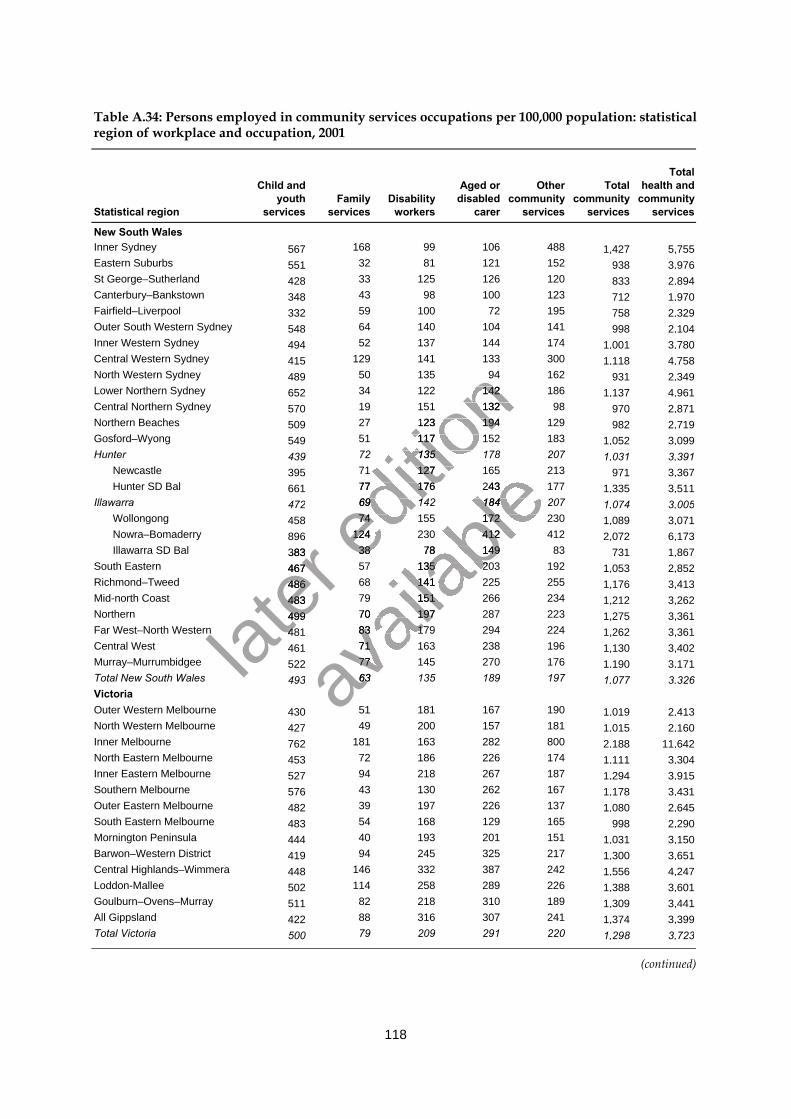
118
Table A.34: Persons employed in community services occupations per 100,000 population: statisticalregion of workplace and occupation, 2001
Statistical region
Child andyouth
servicesFamily
servicesDisability
workers
Aged ordisabled
carer
Othercommunity
services
Totalcommunity
services
Totalhealth and
communityservices
New South WalesInner Sydney 567 168 99 106 488 1,427 5,755Eastern Suburbs 551 32 81 121 152 938 3,976St George–Sutherland 428 33 125 126 120 833 2,894Canterbury–Bankstown 348 43 98 100 123 712 1,970Fairfield–Liverpool 332 59 100 72 195 758 2,329Outer South Western Sydney 548 64 140 104 141 998 2,104Inner Western Sydney 494 52 137 144 174 1,001 3,780Central Western Sydney 415 129 141 133 300 1,118 4,758North Western Sydney 489 50 135 94 162 931 2,349Lower Northern Sydney 652 34 122 142 186 1,137 4,961Central Northern Sydney 570 19 151 132 98 970 2,871Northern Beaches 509 27 123 194 129 982 2,719Gosford–Wyong 549 51 117 152 183 1,052 3,099Hunter 439 72 135 178 207 1,031 3,391
Newcastle 395 71 127 165 213 971 3,367Hunter SD Bal 661 77 176 243 177 1,335 3,511
Illawarra 472 69 142 184 207 1,074 3,005Wollongong 458 74 155 172 230 1,089 3,071Nowra–Bomaderry 896 124 230 412 412 2,072 6,173Illawarra SD Bal 383 38 78 149 83 731 1,867
South Eastern 467 57 135 203 192 1,053 2,852Richmond–Tweed 486 68 141 225 255 1,176 3,413Mid-north Coast 483 79 151 266 234 1,212 3,262Northern 499 70 197 287 223 1,275 3,361Far West–North Western 481 83 179 294 224 1,262 3,361Central West 461 71 163 238 196 1,130 3,402Murray–Murrumbidgee 522 77 145 270 176 1,190 3,171Total New South Wales 493 63 135 189 197 1,077 3,326VictoriaOuter Western Melbourne 430 51 181 167 190 1,019 2,413North Western Melbourne 427 49 200 157 181 1,015 2,160Inner Melbourne 762 181 163 282 800 2,188 11,642North Eastern Melbourne 453 72 186 226 174 1,111 3,304Inner Eastern Melbourne 527 94 218 267 187 1,294 3,915Southern Melbourne 576 43 130 262 167 1,178 3,431Outer Eastern Melbourne 482 39 197 226 137 1,080 2,645South Eastern Melbourne 483 54 168 129 165 998 2,290Mornington Peninsula 444 40 193 201 151 1,031 3,150Barwon–Western District 419 94 245 325 217 1,300 3,651Central Highlands–Wimmera 448 146 332 387 242 1,556 4,247Loddon-Mallee 502 114 258 289 226 1,388 3,601Goulburn–Ovens–Murray 511 82 218 310 189 1,309 3,441All Gippsland 422 88 316 307 241 1,374 3,399Total Victoria 500 79 209 291 220 1,298 3,723
(continued)
later
896
later
896383
later
383467
later
467486
later 486
483
later 483
499
later 499
481later
481
editio
n 50 135 94 162
editio
n 50 135 94 16234 122 142 186
editio
n 34 122 142 18619 151 132 98
editio
n 19 151 132 9827 123 194 129
editio
n 27 123 194 12951 117 152 183
editio
n 51 117 152 18372 135 178 207
editio
n 72 135 178 20771 127 165 213
editio
n 71 127 165 21377 176 243 177
editio
n 77 176 243 17769 142 184 207
editio
n 69 142 184 20774 155 172 230ed
ition
74 155 172 230124 230 412 412ed
ition
124 230 412 41238 78 149 83ed
ition
38 78 149 83
avail
able
71 127 165 213
avail
able
71 127 165 21377 176 243 177
avail
able
77 176 243 17769 142 184 207
avail
able69 142 184 207
74 155 172 230
avail
able74 155 172 230
124 230 412 412
avail
able124 230 412 412
38 78 149 83
avail
able
38 78 149 8357 135 203 192
avail
able
57 135 203 192
avail
able
68 141 225 255
avail
able
68 141 225 25579 151 266 234
avail
able
79 151 266 23470 197 287 223
avail
able
70 197 287 22383 179 294 224
avail
able
83 179 294 22471 163 238 196
avail
able
71 163 238 19677 145 270 176avail
able
77 145 270 176
3 avail
able
3 63 135 189 197avail
able
63 135 189 197
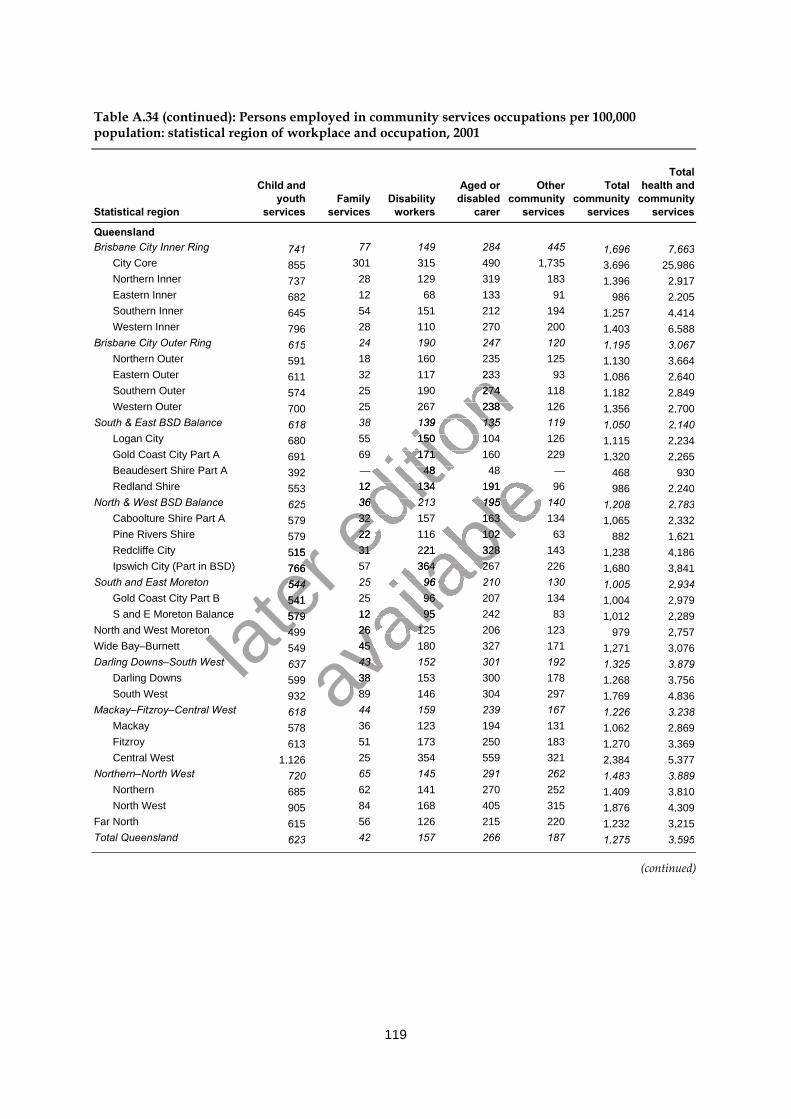
119
Table A.34 (continued): Persons employed in community services occupations per 100,000population: statistical region of workplace and occupation, 2001
Statistical region
Child andyouth
servicesFamily
servicesDisability
workers
Aged ordisabled
carer
Othercommunity
services
Totalcommunity
services
Totalhealth and
communityservices
QueenslandBrisbane City Inner Ring 741 77 149 284 445 1,696 7,663
City Core 855 301 315 490 1,735 3,696 25,986Northern Inner 737 28 129 319 183 1,396 2,917Eastern Inner 682 12 68 133 91 986 2,205Southern Inner 645 54 151 212 194 1,257 4,414Western Inner 796 28 110 270 200 1,403 6,588
Brisbane City Outer Ring 615 24 190 247 120 1,195 3,067Northern Outer 591 18 160 235 125 1,130 3,664Eastern Outer 611 32 117 233 93 1,086 2,640Southern Outer 574 25 190 274 118 1,182 2,849Western Outer 700 25 267 238 126 1,356 2,700
South & East BSD Balance 618 38 139 135 119 1,050 2,140Logan City 680 55 150 104 126 1,115 2,234Gold Coast City Part A 691 69 171 160 229 1,320 2,265Beaudesert Shire Part A 392 — 48 48 — 468 930Redland Shire 553 12 134 191 96 986 2,240
North & West BSD Balance 625 36 213 195 140 1,208 2,783Caboolture Shire Part A 579 32 157 163 134 1,065 2,332Pine Rivers Shire 579 22 116 102 63 882 1,621Redcliffe City 515 31 221 328 143 1,238 4,186Ipswich City (Part in BSD) 766 57 364 267 226 1,680 3,841
South and East Moreton 544 25 96 210 130 1,005 2,934Gold Coast City Part B 541 25 96 207 134 1,004 2,979S and E Moreton Balance 579 12 95 242 83 1,012 2,289
North and West Moreton 499 26 125 206 123 979 2,757Wide Bay–Burnett 549 45 180 327 171 1,271 3,076Darling Downs–South West 637 43 152 301 192 1,325 3,879
Darling Downs 599 38 153 300 178 1,268 3,756South West 932 89 146 304 297 1,769 4,836
Mackay–Fitzroy–Central West 618 44 159 239 167 1,226 3,238Mackay 578 36 123 194 131 1,062 2,869Fitzroy 613 51 173 250 183 1,270 3,369Central West 1,126 25 354 559 321 2,384 5,377
Northern–North West 720 65 145 291 262 1,483 3,889Northern 685 62 141 270 252 1,409 3,810North West 905 84 168 405 315 1,876 4,309
Far North 615 56 126 215 220 1,232 3,215Total Queensland 623 42 157 266 187 1,275 3,595
(continued)
later
579
later
579515
later
515766
later
766544
later 544
541
later 541
S and E Moreton Balance
later S and E Moreton Balance 579
later 579
499later
499
Darling Downs–South West later
Darling Downs–South West
editio
n 32 117 233 93
editio
n 32 117 233 9325 190 274 118
editio
n 25 190 274 11825 267 238 126
editio
n 25 267 238 12638 139 135 119
editio
n 38 139 135 11955 150 104 126
editio
n 55 150 104 12669 171 160 229
editio
n 69 171 160 229— 48 48 —
editio
n — 48 48 —12 134 191 96
editio
n 12 134 191 9636 213 195 140
editio
n 36 213 195 14032 157 163 134ed
ition
32 157 163 13422 116 102 63ed
ition
22 116 102 6331 221 328 143ed
ition
31 221 328 143
avail
able
— 48 48 —
avail
able
— 48 48 —12 134 191 96
avail
able
12 134 191 9636 213 195 140
avail
able36 213 195 140
32 157 163 134
avail
able32 157 163 134
22 116 102 63
avail
able22 116 102 63
31 221 328 143
avail
able
31 221 328 14357 364 267 226
avail
able
57 364 267 22625 96 210 130
avail
able
25 96 210 13025 96 207 134
avail
able
25 96 207 13412 95 242 83
avail
able
12 95 242 8326 125 206 123
avail
able
26 125 206 12345 180 327 171
avail
able
45 180 327 171
7 avail
able
7 43 152 301 192avail
able
43 152 301 192
599 avail
able
599 38 153 300 178avail
able
38 153 300 17889 146 304 297avail
able
89 146 304 297
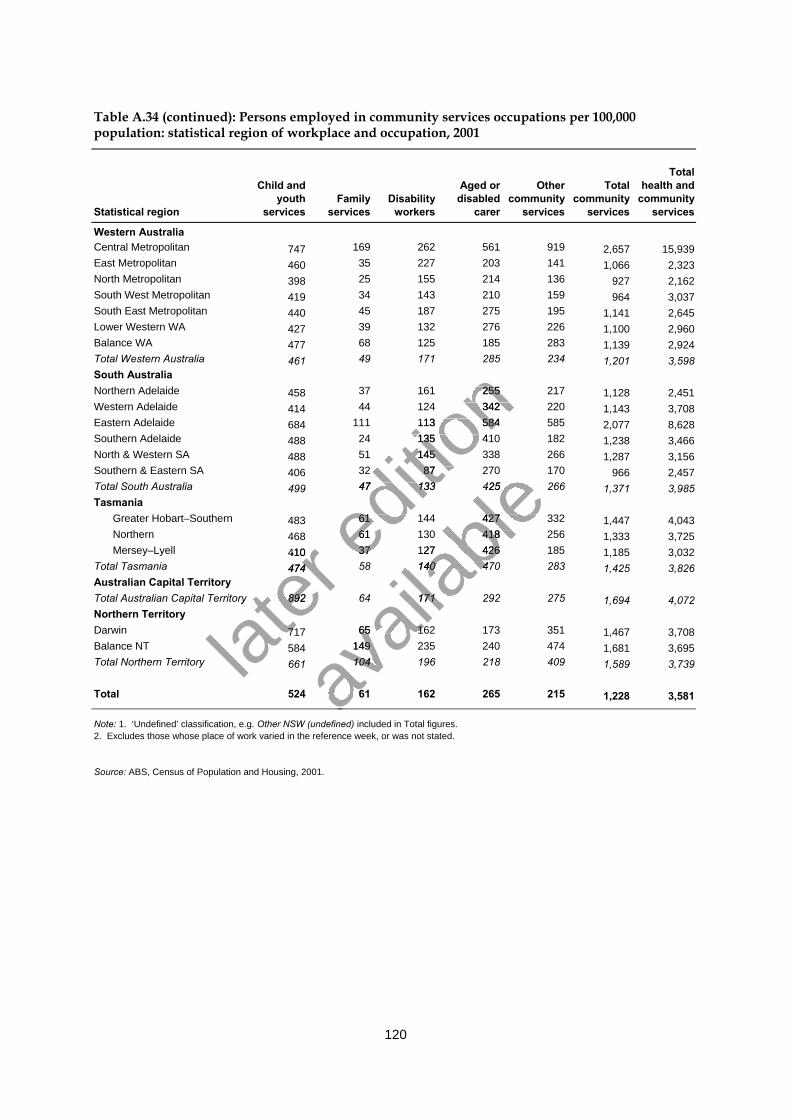
120
Table A.34 (continued): Persons employed in community services occupations per 100,000population: statistical region of workplace and occupation, 2001
Statistical region
Child andyouth
servicesFamily
servicesDisability
workers
Aged ordisabled
carer
Othercommunity
services
Totalcommunity
services
Totalhealth and
communityservices
Western AustraliaCentral Metropolitan 747 169 262 561 919 2,657 15,939East Metropolitan 460 35 227 203 141 1,066 2,323North Metropolitan 398 25 155 214 136 927 2,162South West Metropolitan 419 34 143 210 159 964 3,037South East Metropolitan 440 45 187 275 195 1,141 2,645Lower Western WA 427 39 132 276 226 1,100 2,960Balance WA 477 68 125 185 283 1,139 2,924Total Western Australia 461 49 171 285 234 1,201 3,598South AustraliaNorthern Adelaide 458 37 161 255 217 1,128 2,451Western Adelaide 414 44 124 342 220 1,143 3,708Eastern Adelaide 684 111 113 584 585 2,077 8,628Southern Adelaide 488 24 135 410 182 1,238 3,466North & Western SA 488 51 145 338 266 1,287 3,156Southern & Eastern SA 406 32 87 270 170 966 2,457Total South Australia 499 47 133 425 266 1,371 3,985Tasmania
Greater Hobart–Southern 483 61 144 427 332 1,447 4,043Northern 468 61 130 418 256 1,333 3,725Mersey–Lyell 410 37 127 426 185 1,185 3,032
Total Tasmania 474 58 140 470 283 1,425 3,826Australian Capital TerritoryTotal Australian Capital Territory 892 64 171 292 275 1,694 4,072Northern TerritoryDarwin 717 65 162 173 351 1,467 3,708Balance NT 584 149 235 240 474 1,681 3,695Total Northern Territory 661 104 196 218 409 1,589 3,739
Total 524 61 162 265 215 1,228 3,581
Note: 1. ‘Undefined’ classification, e.g. Other NSW (undefined) included in Total figures.2. Excludes those whose place of work varied in the reference week, or was not stated.
Source: ABS, Census of Population and Housing, 2001.
later
468
later
468410
later
410474
later
474
Total Australian Capital Territory 892
later Total Australian Capital Territory 892
717later
717
editio
n 37 161 255 217
editio
n 37 161 255 21744 124 342 220
editio
n 44 124 342 220111 113 584 585
editio
n 111 113 584 58524 135 410 182
editio
n 24 135 410 182
145
editio
n 14587 270 170
editio
n 87 270 170
47 133 425 266
editio
n 47 133 425 266
61 144 427 332editio
n 61 144 427 33261ed
ition
6137 127 426 185ed
ition
37 127 426 185
avail
able
87 270 170
avail
able
87 270 17047 133 425 266
avail
able
47 133 425 266
61 144 427 332
avail
able61 144 427 332
130 418 256
avail
able130 418 256
37 127 426 185
avail
able
37 127 426 18558 140 470 283
avail
able
58 140 470 283
avail
able
64 171 292 275
avail
able
64 171 292 275
65 162 173 351
avail
able
65 162 173 351149
avail
able
149104 196 218 409avail
able
104 196 218 409
524 61 162 265 215avail
able
524 61 162 265 215avail
able
avail
able
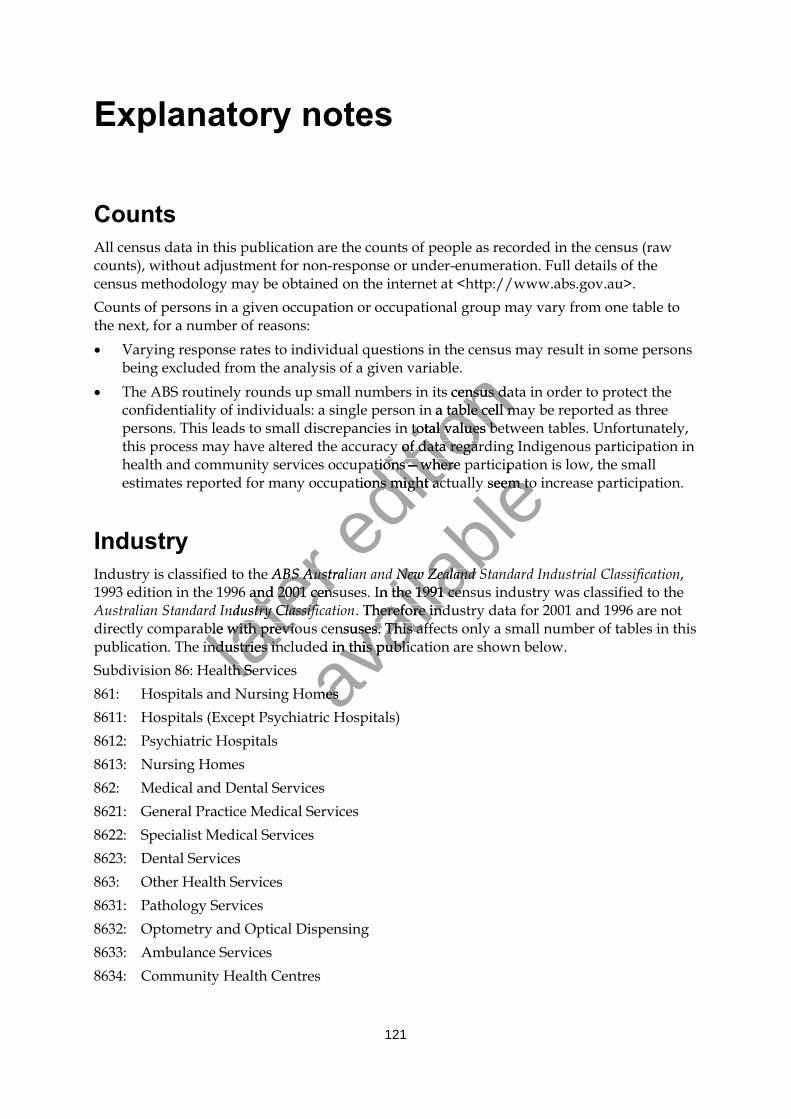
121
Explanatory notes
CountsAll census data in this publication are the counts of people as recorded in the census (rawcounts), without adjustment for non-response or under-enumeration. Full details of thecensus methodology may be obtained on the internet at <http://www.abs.gov.au>.Counts of persons in a given occupation or occupational group may vary from one table tothe next, for a number of reasons:� Varying response rates to individual questions in the census may result in some persons
being excluded from the analysis of a given variable.� The ABS routinely rounds up small numbers in its census data in order to protect the
confidentiality of individuals: a single person in a table cell may be reported as threepersons. This leads to small discrepancies in total values between tables. Unfortunately,this process may have altered the accuracy of data regarding Indigenous participation inhealth and community services occupations—where participation is low, the smallestimates reported for many occupations might actually seem to increase participation.
IndustryIndustry is classified to the ABS Australian and New Zealand Standard Industrial Classification,1993 edition in the 1996 and 2001 censuses. In the 1991 census industry was classified to theAustralian Standard Industry Classification. Therefore industry data for 2001 and 1996 are notdirectly comparable with previous censuses. This affects only a small number of tables in thispublication. The industries included in this publication are shown below.Subdivision 86: Health Services861: Hospitals and Nursing Homes8611: Hospitals (Except Psychiatric Hospitals)8612: Psychiatric Hospitals8613: Nursing Homes862: Medical and Dental Services8621: General Practice Medical Services8622: Specialist Medical Services8623: Dental Services863: Other Health Services8631: Pathology Services8632: Optometry and Optical Dispensing8633: Ambulance Services8634: Community Health Centres
later Industry is classified to the
later Industry is classified to the ABS Australian and New Zealand Stan
later ABS Australian and New Zealand Stan
1993 edition in the 1996 and 2001 censuses. In the 1991 census industry was classified to the
later 1993 edition in the 1996 and 2001 censuses. In the 1991 census industry was classified to the
Australian Standard Industry Classification
later Australian Standard Industry Classification
later directly comparable with previous censuses. Thislater directly comparable with previous censuses. This
publication. The industries included later
publication. The industries included Subdivision 86: Health Serviceslat
er Subdivision 86: Health Services
editio
n its census data in order to protect the
editio
n its census data in order to protect theon in a table cell may be reported as three
editio
n on in a table cell may be reported as three total values between tables. Unfortunately,
editio
n total values between tables. Unfortunately,this process may have altered the accuracy of
editio
n this process may have altered the accuracy of data regarding Indigenous participation in
editio
n data regarding Indigenous participation inthis process may have altered the accuracy of data regarding Indigenous participation inthis process may have altered the accuracy of
editio
n this process may have altered the accuracy of data regarding Indigenous participation inthis process may have altered the accuracy ofhealth and community services occupation
editio
n health and community services occupations—where participation is low, the small
editio
n s—where participation is low, the small
estimates reported for many occupations migh
editio
n estimates reported for many occupations might actually seem to increase participation.
editio
n t actually seem to increase participation.
avail
able
s—where participation is low, the small
avail
able
s—where participation is low, the smallt actually seem to increase participation.
avail
able
t actually seem to increase participation.
ABS Australian and New Zealand Stan
avail
able
ABS Australian and New Zealand Stan1993 edition in the 1996 and 2001 censuses. In the 1991 census industry was classified to the
avail
able
1993 edition in the 1996 and 2001 censuses. In the 1991 census industry was classified to the
avail
able
Australian Standard Industry Classification
avail
able
Australian Standard Industry Classification. Therefore industry data for 2001 and 1996 are not
avail
able
. Therefore industry data for 2001 and 1996 are notdirectly comparable with previous censuses. This
avail
able
directly comparable with previous censuses. This affects only a small number of tables in this
avail
able
affects only a small number of tables in thispublication. The industries included
avail
able
publication. The industries included in this publication are shown below.
avail
able
in this publication are shown below.
861: Hospitals and Nursing Homesavail
able
861: Hospitals and Nursing Homes
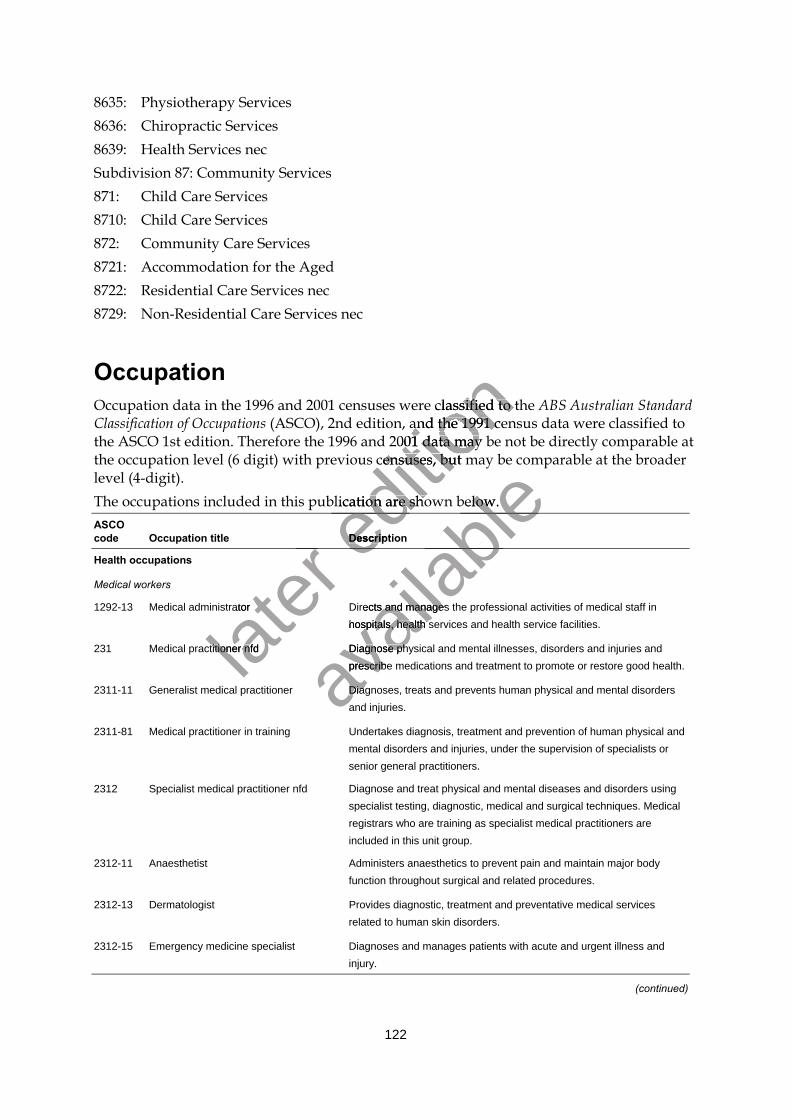
122
8635: Physiotherapy Services8636: Chiropractic Services8639: Health Services necSubdivision 87: Community Services871: Child Care Services8710: Child Care Services872: Community Care Services8721: Accommodation for the Aged8722: Residential Care Services nec8729: Non-Residential Care Services nec
OccupationOccupation data in the 1996 and 2001 censuses were classified to the ABS Australian StandardClassification of Occupations (ASCO), 2nd edition, and the 1991 census data were classified tothe ASCO 1st edition. Therefore the 1996 and 2001 data may be not be directly comparable atthe occupation level (6 digit) with previous censuses, but may be comparable at the broaderlevel (4-digit).The occupations included in this publication are shown below.ASCOcode Occupation title Description
Health occupations
Medical workers
1292-13 Medical administrator Directs and manages the professional activities of medical staff inhospitals, health services and health service facilities.
231 Medical practitioner nfd Diagnose physical and mental illnesses, disorders and injuries andprescribe medications and treatment to promote or restore good health.
2311-11 Generalist medical practitioner Diagnoses, treats and prevents human physical and mental disordersand injuries.
2311-81 Medical practitioner in training Undertakes diagnosis, treatment and prevention of human physical andmental disorders and injuries, under the supervision of specialists orsenior general practitioners.
2312 Specialist medical practitioner nfd Diagnose and treat physical and mental diseases and disorders usingspecialist testing, diagnostic, medical and surgical techniques. Medicalregistrars who are training as specialist medical practitioners areincluded in this unit group.
2312-11 Anaesthetist Administers anaesthetics to prevent pain and maintain major bodyfunction throughout surgical and related procedures.
2312-13 Dermatologist Provides diagnostic, treatment and preventative medical servicesrelated to human skin disorders.
2312-15 Emergency medicine specialist Diagnoses and manages patients with acute and urgent illness andinjury.
(continued)
later
later 1292-13 Medical administrator
later 1292-13 Medical administrator
231 Medical practitioner nfdlater
231 Medical practitioner nfd
editio
n Occupation data in the 1996 and 2001 censuses were classified to the
editio
n Occupation data in the 1996 and 2001 censuses were classified to the (ASCO), 2nd edition, and the 1991 census data were classified to
editio
n (ASCO), 2nd edition, and the 1991 census data were classified tothe ASCO 1st edition. Therefore the 1996 and 200
editio
n the ASCO 1st edition. Therefore the 1996 and 2001 data may be not be directly comparable at
editio
n 1 data may be not be directly comparable at
censuses, but may be comparable at the broader
editio
n censuses, but may be comparable at the broader
The occupations included in this publication are shown below.
editio
n The occupations included in this publication are shown below.
Descriptioneditio
n
Descriptioneditio
n
editio
n
avail
able
censuses, but may be comparable at the broader
avail
able
censuses, but may be comparable at the broader
The occupations included in this publication are shown below.
avail
ableThe occupations included in this publication are shown below.
avail
able
avail
able
Directs and manages the professional activities of medical staff in
avail
able
Directs and manages the professional activities of medical staff inhospitals, health services
avail
able
hospitals, health services
Diagnos
avail
able
Diagnose physical and mental illnesse
avail
able
e physical and mental illnesseprescribe medications and treatment to promote or restore good health.av
ailab
le
prescribe medications and treatment to promote or restore good health.
Diagnoses, treats avail
able
Diagnoses, treats
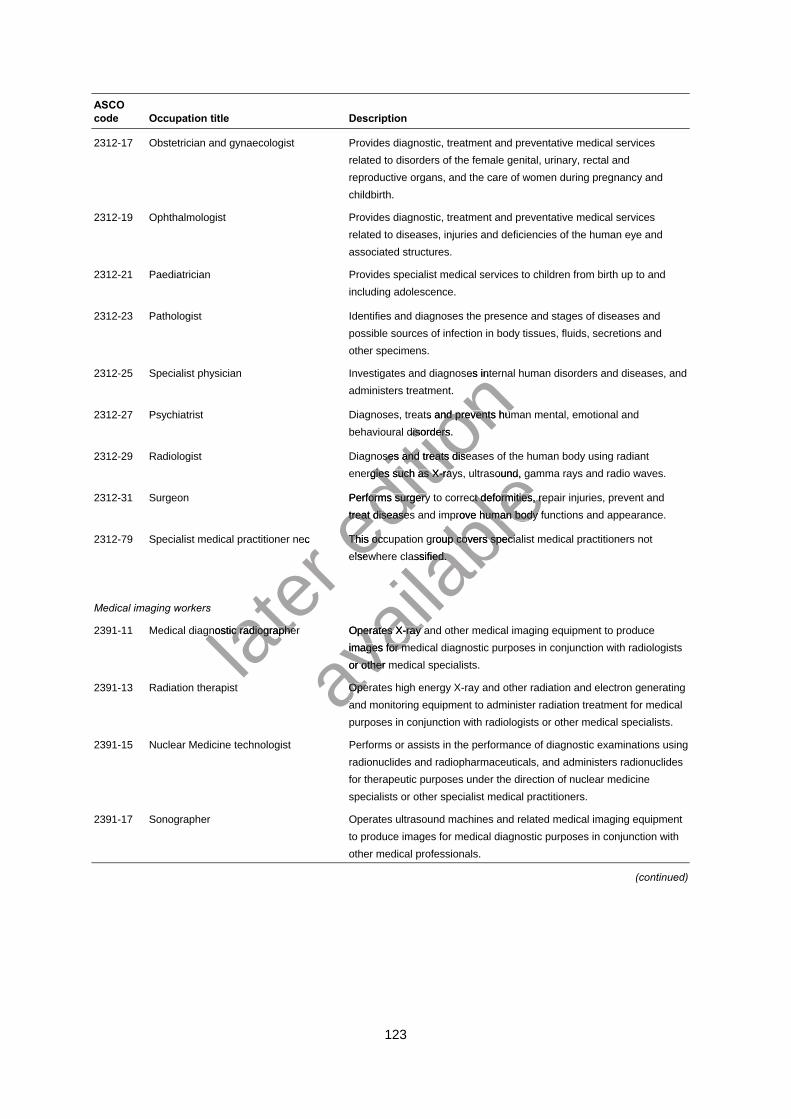
123
ASCOcode Occupation title Description
2312-17 Obstetrician and gynaecologist Provides diagnostic, treatment and preventative medical servicesrelated to disorders of the female genital, urinary, rectal andreproductive organs, and the care of women during pregnancy andchildbirth.
2312-19 Ophthalmologist Provides diagnostic, treatment and preventative medical servicesrelated to diseases, injuries and deficiencies of the human eye andassociated structures.
2312-21 Paediatrician Provides specialist medical services to children from birth up to andincluding adolescence.
2312-23 Pathologist Identifies and diagnoses the presence and stages of diseases andpossible sources of infection in body tissues, fluids, secretions andother specimens.
2312-25 Specialist physician Investigates and diagnoses internal human disorders and diseases, andadministers treatment.
2312-27 Psychiatrist Diagnoses, treats and prevents human mental, emotional andbehavioural disorders.
2312-29 Radiologist Diagnoses and treats diseases of the human body using radiantenergies such as X-rays, ultrasound, gamma rays and radio waves.
2312-31 Surgeon Performs surgery to correct deformities, repair injuries, prevent andtreat diseases and improve human body functions and appearance.
2312-79 Specialist medical practitioner nec This occupation group covers specialist medical practitioners notelsewhere classified.
Medical imaging workers
2391-11 Medical diagnostic radiographer Operates X-ray and other medical imaging equipment to produceimages for medical diagnostic purposes in conjunction with radiologistsor other medical specialists.
2391-13 Radiation therapist Operates high energy X-ray and other radiation and electron generatingand monitoring equipment to administer radiation treatment for medicalpurposes in conjunction with radiologists or other medical specialists.
2391-15 Nuclear Medicine technologist Performs or assists in the performance of diagnostic examinations usingradionuclides and radiopharmaceuticals, and administers radionuclidesfor therapeutic purposes under the direction of nuclear medicinespecialists or other specialist medical practitioners.
2391-17 Sonographer Operates ultrasound machines and related medical imaging equipmentto produce images for medical diagnostic purposes in conjunction withother medical professionals.
(continued)
later
2312-79 Specialist medical practitioner nec
later
2312-79 Specialist medical practitioner nec
2391-11 Medical diagnostic radiographer Operates X-ray and other medical imaging equipment to producelater
2391-11 Medical diagnostic radiographer Operates X-ray and other medical imaging equipment to produce
editio
n Investigates and diagnos
editio
n Investigates and diagnoses internal human disorders and diseases, and
editio
n es internal human disorders and diseases, and
administers treatment.
editio
n administers treatment.
Diagnoses, treats and prevents human mental, emotional and
editio
n Diagnoses, treats and prevents human mental, emotional andbehavioural disorders.
editio
n behavioural disorders.
Diagnoses and treats diseases of
editio
n Diagnoses and treats diseases ofenergies such as X-rays, ultrasound, gamma rays and radio waves.
editio
n energies such as X-rays, ultrasound, gamma rays and radio waves.
Performs surgery to correct deformities, repair injuries, prevent and
editio
n Performs surgery to correct deformities, repair injuries, prevent andtreat diseases and improve humed
ition
treat diseases and improve hum
This occupation group covers specialist medical practitioners noteditio
n
This occupation group covers specialist medical practitioners notelsewhere classified.ed
ition
elsewhere classified.
avail
able
energies such as X-rays, ultrasound, gamma rays and radio waves.
avail
able
energies such as X-rays, ultrasound, gamma rays and radio waves.
Performs surgery to correct deformities, repair injuries, prevent and
avail
ablePerforms surgery to correct deformities, repair injuries, prevent and
treat diseases and improve hum
avail
abletreat diseases and improve human body functions and appearance.
avail
ablean body functions and appearance.
This occupation group covers specialist medical practitioners not
avail
ableThis occupation group covers specialist medical practitioners not
elsewhere classified.
avail
able
elsewhere classified.
2391-11 Medical diagnostic radiographer Operates X-ray and other medical imaging equipment to produce
avail
able
2391-11 Medical diagnostic radiographer Operates X-ray and other medical imaging equipment to produceimages for medical diagnostic purposes in conjunction with radiologists
avail
able
images for medical diagnostic purposes in conjunction with radiologistsor other medical specialists.av
ailab
le
or other medical specialists.
Operates high energy X-ray and other radiation and electron generatingavail
able
Operates high energy X-ray and other radiation and electron generatingand monitoring equipment to administer radiation treatment for medicalav
ailab
le
and monitoring equipment to administer radiation treatment for medical
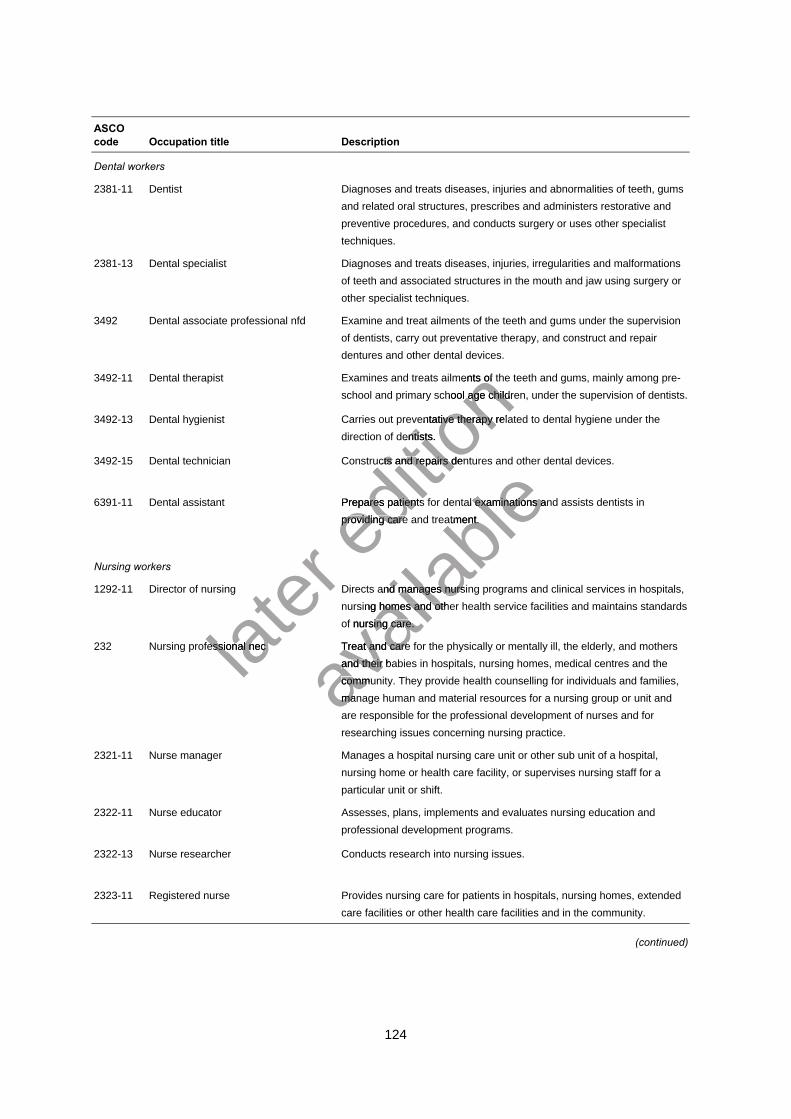
124
ASCOcode Occupation title Description
Dental workers
2381-11 Dentist Diagnoses and treats diseases, injuries and abnormalities of teeth, gumsand related oral structures, prescribes and administers restorative andpreventive procedures, and conducts surgery or uses other specialisttechniques.
2381-13 Dental specialist Diagnoses and treats diseases, injuries, irregularities and malformationsof teeth and associated structures in the mouth and jaw using surgery orother specialist techniques.
3492 Dental associate professional nfd Examine and treat ailments of the teeth and gums under the supervisionof dentists, carry out preventative therapy, and construct and repairdentures and other dental devices.
3492-11 Dental therapist Examines and treats ailments of the teeth and gums, mainly among pre-school and primary school age children, under the supervision of dentists.
3492-13 Dental hygienist Carries out preventative therapy related to dental hygiene under thedirection of dentists.
3492-15 Dental technician Constructs and repairs dentures and other dental devices.
6391-11 Dental assistant Prepares patients for dental examinations and assists dentists inproviding care and treatment.
Nursing workers
1292-11 Director of nursing Directs and manages nursing programs and clinical services in hospitals,nursing homes and other health service facilities and maintains standardsof nursing care.
232 Nursing professional nec Treat and care for the physically or mentally ill, the elderly, and mothersand their babies in hospitals, nursing homes, medical centres and thecommunity. They provide health counselling for individuals and families,manage human and material resources for a nursing group or unit andare responsible for the professional development of nurses and forresearching issues concerning nursing practice.
2321-11 Nurse manager Manages a hospital nursing care unit or other sub unit of a hospital,nursing home or health care facility, or supervises nursing staff for aparticular unit or shift.
2322-11 Nurse educator Assesses, plans, implements and evaluates nursing education andprofessional development programs.
2322-13 Nurse researcher Conducts research into nursing issues.
2323-11 Registered nurse Provides nursing care for patients in hospitals, nursing homes, extendedcare facilities or other health care facilities and in the community.
(continued)
later
232 Nursing professional neclater
232 Nursing professional nec
editio
n Examines and treats ailments of the teeth and gums, mainly among pre-
editio
n Examines and treats ailments of the teeth and gums, mainly among pre-school and primary school age children, under the supervision of dentists.
editio
n school and primary school age children, under the supervision of dentists.
Carries out preventative therapy related to dental hygiene under the
editio
n Carries out preventative therapy related to dental hygiene under thedirection of dentists.
editio
n direction of dentists.
Constructs and re
editio
n Constructs and repairs dentures and other dental devices.
editio
n pairs dentures and other dental devices.
Prepares patients for dental examinations and assists dentists in
editio
n Prepares patients for dental examinations and assists dentists inproviding care and treatment.ed
ition
providing care and treatment.
avail
able
pairs dentures and other dental devices.
avail
able
pairs dentures and other dental devices.
Prepares patients for dental examinations and assists dentists in
avail
ablePrepares patients for dental examinations and assists dentists in
providing care and treatment.
avail
ableproviding care and treatment.
Directs and manages nursi
avail
able
Directs and manages nursinursing homes and other health service facilities and maintains standards
avail
able
nursing homes and other health service facilities and maintains standardsof nursing care.
avail
able
of nursing care.
Tr
avail
able
Treat and care for the physically or
avail
able
eat and care for the physically or and their babies in hospitals, nursing homes, medical centres and theav
ailab
le
and their babies in hospitals, nursing homes, medical centres and thecommunity. They provide health cav
ailab
le
community. They provide health cmanage human and material resources for a nursing group or unit andav
ailab
le
manage human and material resources for a nursing group or unit and
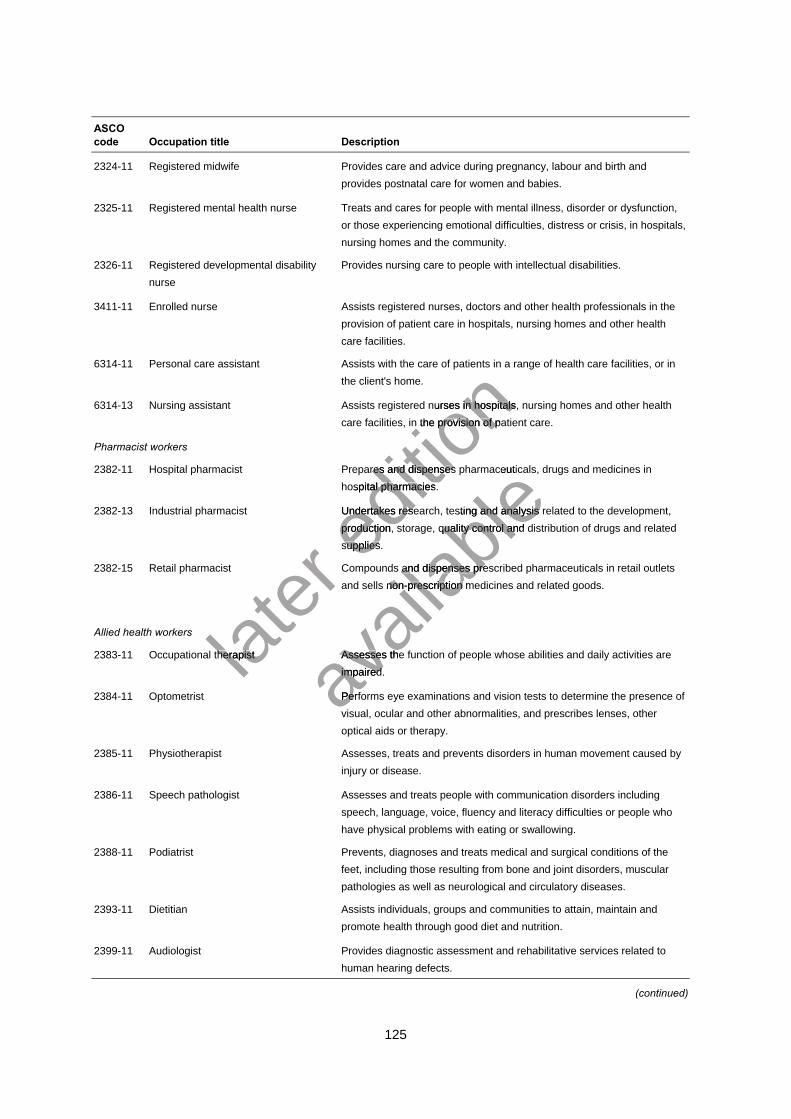
125
ASCOcode Occupation title Description
2324-11 Registered midwife Provides care and advice during pregnancy, labour and birth andprovides postnatal care for women and babies.
2325-11 Registered mental health nurse Treats and cares for people with mental illness, disorder or dysfunction,or those experiencing emotional difficulties, distress or crisis, in hospitals,nursing homes and the community.
2326-11 Registered developmental disabilitynurse
Provides nursing care to people with intellectual disabilities.
3411-11 Enrolled nurse Assists registered nurses, doctors and other health professionals in theprovision of patient care in hospitals, nursing homes and other healthcare facilities.
6314-11 Personal care assistant Assists with the care of patients in a range of health care facilities, or inthe client's home.
6314-13 Nursing assistant Assists registered nurses in hospitals, nursing homes and other healthcare facilities, in the provision of patient care.
Pharmacist workers
2382-11 Hospital pharmacist Prepares and dispenses pharmaceuticals, drugs and medicines inhospital pharmacies.
2382-13 Industrial pharmacist Undertakes research, testing and analysis related to the development,production, storage, quality control and distribution of drugs and relatedsupplies.
2382-15 Retail pharmacist Compounds and dispenses prescribed pharmaceuticals in retail outletsand sells non-prescription medicines and related goods.
Allied health workers
2383-11 Occupational therapist Assesses the function of people whose abilities and daily activities areimpaired.
2384-11 Optometrist Performs eye examinations and vision tests to determine the presence ofvisual, ocular and other abnormalities, and prescribes lenses, otheroptical aids or therapy.
2385-11 Physiotherapist Assesses, treats and prevents disorders in human movement caused byinjury or disease.
2386-11 Speech pathologist Assesses and treats people with communication disorders includingspeech, language, voice, fluency and literacy difficulties or people whohave physical problems with eating or swallowing.
2388-11 Podiatrist Prevents, diagnoses and treats medical and surgical conditions of thefeet, including those resulting from bone and joint disorders, muscularpathologies as well as neurological and circulatory diseases.
2393-11 Dietitian Assists individuals, groups and communities to attain, maintain andpromote health through good diet and nutrition.
2399-11 Audiologist Provides diagnostic assessment and rehabilitative services related tohuman hearing defects.
(continued)
later
Compounds and dispenses prescribed pharmaceuticals in retail outlets
later
Compounds and dispenses prescribed pharmaceuticals in retail outlets
2383-11 Occupational therapistlater
2383-11 Occupational therapist
editio
n patients in a range of health care facilities, or in
editio
n patients in a range of health care facilities, or in
Assists registered nurses in hospitals, nursing homes and other health
editio
n Assists registered nurses in hospitals, nursing homes and other healthcare facilities, in the provision of patient care.
editio
n care facilities, in the provision of patient care.
Prepares and dispens
editio
n Prepares and dispenses pharmaceuticals, drugs and medicines in
editio
n es pharmaceuticals, drugs and medicines in
hospital pharmacies.
editio
n hospital pharmacies.
Undertakes research, testing and analysis related to the development,editio
n Undertakes research, testing and analysis related to the development,production, storage, quality control and distribution of drugs and relateded
ition
production, storage, quality control and distribution of drugs and relatedsupplies.ed
ition
supplies.
avail
able
es pharmaceuticals, drugs and medicines in
avail
able
es pharmaceuticals, drugs and medicines in
Undertakes research, testing and analysis related to the development,
avail
ableUndertakes research, testing and analysis related to the development,
production, storage, quality control and distribution of drugs and related
avail
ableproduction, storage, quality control and distribution of drugs and related
Compounds and dispenses prescribed pharmaceuticals in retail outlets
avail
able
Compounds and dispenses prescribed pharmaceuticals in retail outletsand sells non-prescription medicines and related goods.
avail
able
and sells non-prescription medicines and related goods.
Assesses the function of people whose
avail
able
Assesses the function of people whose impaired.av
ailab
le
impaired.
Performs eye examinations and vision tests to determine the presence ofavail
able
Performs eye examinations and vision tests to determine the presence ofvisual, ocular and other abnormalities, and prescribes lenses, otherav
ailab
le
visual, ocular and other abnormalities, and prescribes lenses, other
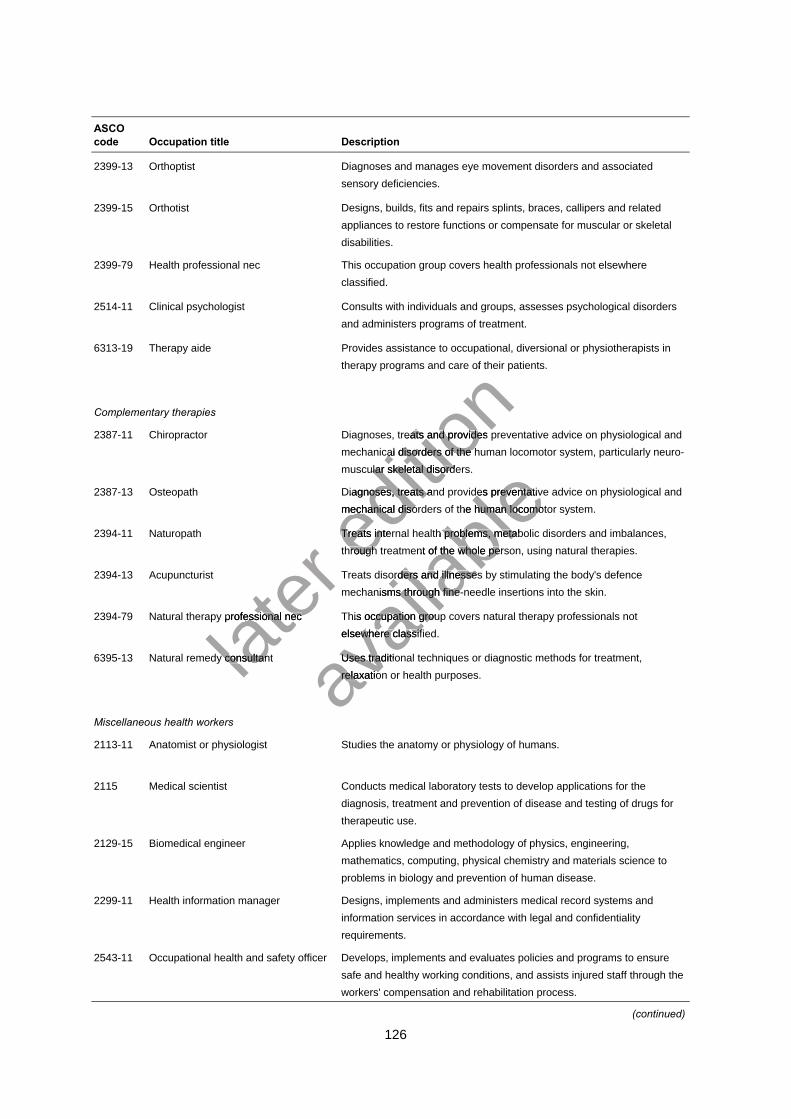
126
ASCOcode Occupation title Description
2399-13 Orthoptist Diagnoses and manages eye movement disorders and associatedsensory deficiencies.
2399-15 Orthotist Designs, builds, fits and repairs splints, braces, callipers and relatedappliances to restore functions or compensate for muscular or skeletaldisabilities.
2399-79 Health professional nec This occupation group covers health professionals not elsewhereclassified.
2514-11 Clinical psychologist Consults with individuals and groups, assesses psychological disordersand administers programs of treatment.
6313-19 Therapy aide Provides assistance to occupational, diversional or physiotherapists intherapy programs and care of their patients.
Complementary therapies
2387-11 Chiropractor Diagnoses, treats and provides preventative advice on physiological andmechanical disorders of the human locomotor system, particularly neuro-muscular skeletal disorders.
2387-13 Osteopath Diagnoses, treats and provides preventative advice on physiological andmechanical disorders of the human locomotor system.
2394-11 Naturopath Treats internal health problems, metabolic disorders and imbalances,through treatment of the whole person, using natural therapies.
2394-13 Acupuncturist Treats disorders and illnesses by stimulating the body's defencemechanisms through fine-needle insertions into the skin.
2394-79 Natural therapy professional nec This occupation group covers natural therapy professionals notelsewhere classified.
6395-13 Natural remedy consultant Uses traditional techniques or diagnostic methods for treatment,relaxation or health purposes.
Miscellaneous health workers
2113-11 Anatomist or physiologist Studies the anatomy or physiology of humans.
2115 Medical scientist Conducts medical laboratory tests to develop applications for thediagnosis, treatment and prevention of disease and testing of drugs fortherapeutic use.
2129-15 Biomedical engineer Applies knowledge and methodology of physics, engineering,mathematics, computing, physical chemistry and materials science toproblems in biology and prevention of human disease.
2299-11 Health information manager Designs, implements and administers medical record systems andinformation services in accordance with legal and confidentialityrequirements.
2543-11 Occupational health and safety officer Develops, implements and evaluates policies and programs to ensuresafe and healthy working conditions, and assists injured staff through theworkers' compensation and rehabilitation process.
(continued)
later Treats disorders and illnesses by stimulating the body's defence
later Treats disorders and illnesses by stimulating the body's defence
2394-79 Natural therapy professional nec
later 2394-79 Natural therapy professional nec
6395-13 Natural remedy consultantlater
6395-13 Natural remedy consultant
editio
n therapy programs and care of their patients.
editio
n therapy programs and care of their patients.
Diagnoses, treats and provides
editio
n Diagnoses, treats and provides preventative advice on physiological and
editio
n preventative advice on physiological andmechanical disorders of the human locomotor system, particularly neuro-
editio
n mechanical disorders of the human locomotor system, particularly neuro-muscular skeletal disorders.
editio
n muscular skeletal disorders.
Diagnoses, treats and provides prevent
editio
n Diagnoses, treats and provides preventmechanical disorders of the human locomotor system.ed
ition
mechanical disorders of the human locomotor system.
Treats internal health problems, metabolic disorders and imbalances,editio
n
Treats internal health problems, metabolic disorders and imbalances,through treatment of the whole person, using natural therapies.ed
ition
through treatment of the whole person, using natural therapies.
avail
ableDiagnoses, treats and provides prevent
avail
ableDiagnoses, treats and provides preventative advice on physiological and
avail
ableative advice on physiological and
mechanical disorders of the human locomotor system.
avail
ablemechanical disorders of the human locomotor system.
Treats internal health problems, metabolic disorders and imbalances,
avail
ableTreats internal health problems, metabolic disorders and imbalances,
through treatment of the whole person, using natural therapies.
avail
able
through treatment of the whole person, using natural therapies.
Treats disorders and illnesses by stimulating the body's defence
avail
able
Treats disorders and illnesses by stimulating the body's defencemechanisms through fine-needle insertions into the skin.
avail
able
mechanisms through fine-needle insertions into the skin.
This occupation group covers natural therapy professionals not
avail
able
This occupation group covers natural therapy professionals notelsewhere classified.
avail
able
elsewhere classified.
Uses traditional techniques or
avail
able
Uses traditional techniques or relaxation or health purposes.av
ailab
le
relaxation or health purposes.
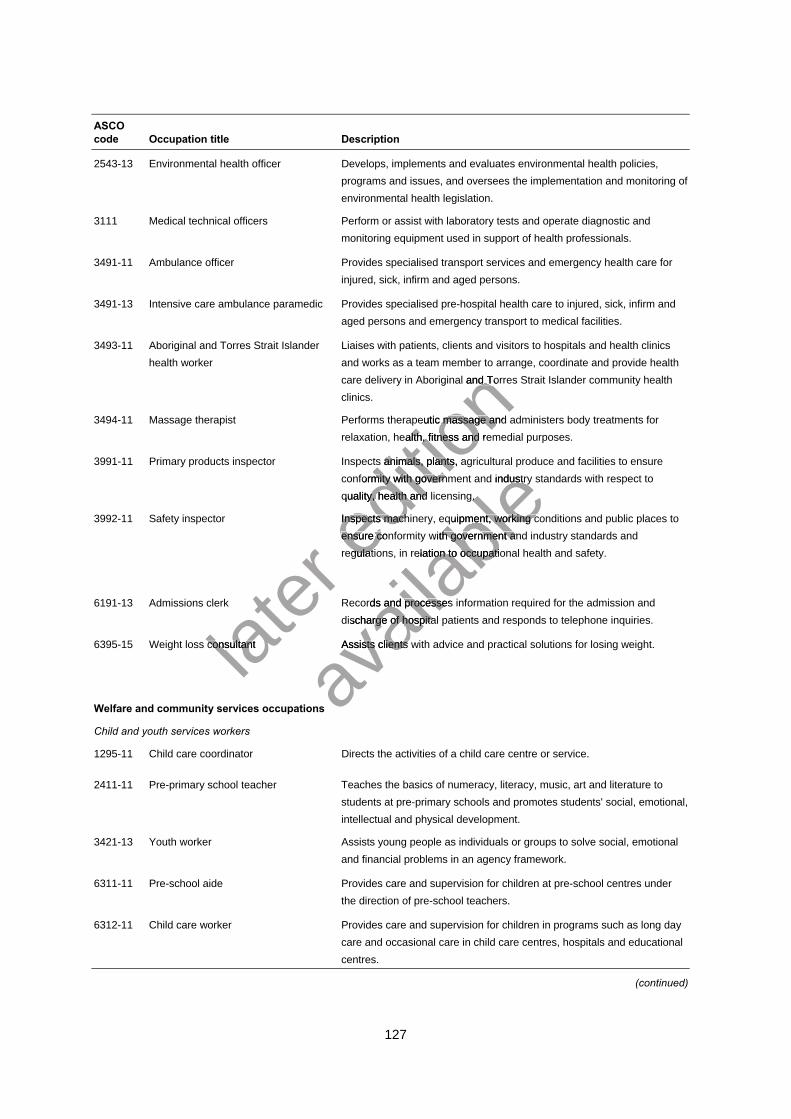
127
ASCOcode Occupation title Description
2543-13 Environmental health officer Develops, implements and evaluates environmental health policies,programs and issues, and oversees the implementation and monitoring ofenvironmental health legislation.
3111 Medical technical officers Perform or assist with laboratory tests and operate diagnostic andmonitoring equipment used in support of health professionals.
3491-11 Ambulance officer Provides specialised transport services and emergency health care forinjured, sick, infirm and aged persons.
3491-13 Intensive care ambulance paramedic Provides specialised pre-hospital health care to injured, sick, infirm andaged persons and emergency transport to medical facilities.
3493-11 Aboriginal and Torres Strait Islanderhealth worker
Liaises with patients, clients and visitors to hospitals and health clinicsand works as a team member to arrange, coordinate and provide healthcare delivery in Aboriginal and Torres Strait Islander community healthclinics.
3494-11 Massage therapist Performs therapeutic massage and administers body treatments forrelaxation, health, fitness and remedial purposes.
3991-11 Primary products inspector Inspects animals, plants, agricultural produce and facilities to ensureconformity with government and industry standards with respect toquality, health and licensing.
3992-11 Safety inspector Inspects machinery, equipment, working conditions and public places toensure conformity with government and industry standards andregulations, in relation to occupational health and safety.
6191-13 Admissions clerk Records and processes information required for the admission anddischarge of hospital patients and responds to telephone inquiries.
6395-15 Weight loss consultant Assists clients with advice and practical solutions for losing weight.
Welfare and community services occupations
Child and youth services workers
1295-11 Child care coordinator Directs the activities of a child care centre or service.
2411-11 Pre-primary school teacher Teaches the basics of numeracy, literacy, music, art and literature tostudents at pre-primary schools and promotes students' social, emotional,intellectual and physical development.
3421-13 Youth worker Assists young people as individuals or groups to solve social, emotionaland financial problems in an agency framework.
6311-11 Pre-school aide Provides care and supervision for children at pre-school centres underthe direction of pre-school teachers.
6312-11 Child care worker Provides care and supervision for children in programs such as long daycare and occasional care in child care centres, hospitals and educationalcentres.
(continued)
later
6395-15 Weight loss consultantlater
6395-15 Weight loss consultant
editio
n and works as a team member to arrange, coordinate and provide health
editio
n and works as a team member to arrange, coordinate and provide healthcare delivery in Aboriginal and Torres Strait Islander community health
editio
n care delivery in Aboriginal and Torres Strait Islander community health
Performs therapeutic massage and administers body treatments for
editio
n Performs therapeutic massage and administers body treatments forrelaxation, health, fitness and remedial purposes.
editio
n relaxation, health, fitness and remedial purposes.
pects animals, plants,
editio
n pects animals, plants, agricultural produce and facilities to ensure
editio
n agricultural produce and facilities to ensure
conformity with government and
editio
n conformity with government and quality, health and licensing.
editio
n quality, health and licensing.
Inspects machinery, equipment, working conditions and public places toeditio
n Inspects machinery, equipment, working conditions and public places toensure conformity with government and industry standards anded
ition
ensure conformity with government and industry standards andregulations, in relation to occupational health and safety.ed
ition
regulations, in relation to occupational health and safety.
avail
able
agricultural produce and facilities to ensure
avail
able
agricultural produce and facilities to ensureconformity with government and
avail
able
conformity with government and industry standards with respect to
avail
able
industry standards with respect toquality, health and licensing.
avail
ablequality, health and licensing.
Inspects machinery, equipment, working conditions and public places to
avail
ableInspects machinery, equipment, working conditions and public places to
ensure conformity with government and industry standards and
avail
ableensure conformity with government and industry standards and
regulations, in relation to occupational health and safety.
avail
able
regulations, in relation to occupational health and safety.
Records and processes information required for the admission and
avail
able
Records and processes information required for the admission anddischarge of hospital patients and responds to telephone inquiries.
avail
able
discharge of hospital patients and responds to telephone inquiries.
Assists clients with advice and practical solutions for losing weight.
avail
able
Assists clients with advice and practical solutions for losing weight.
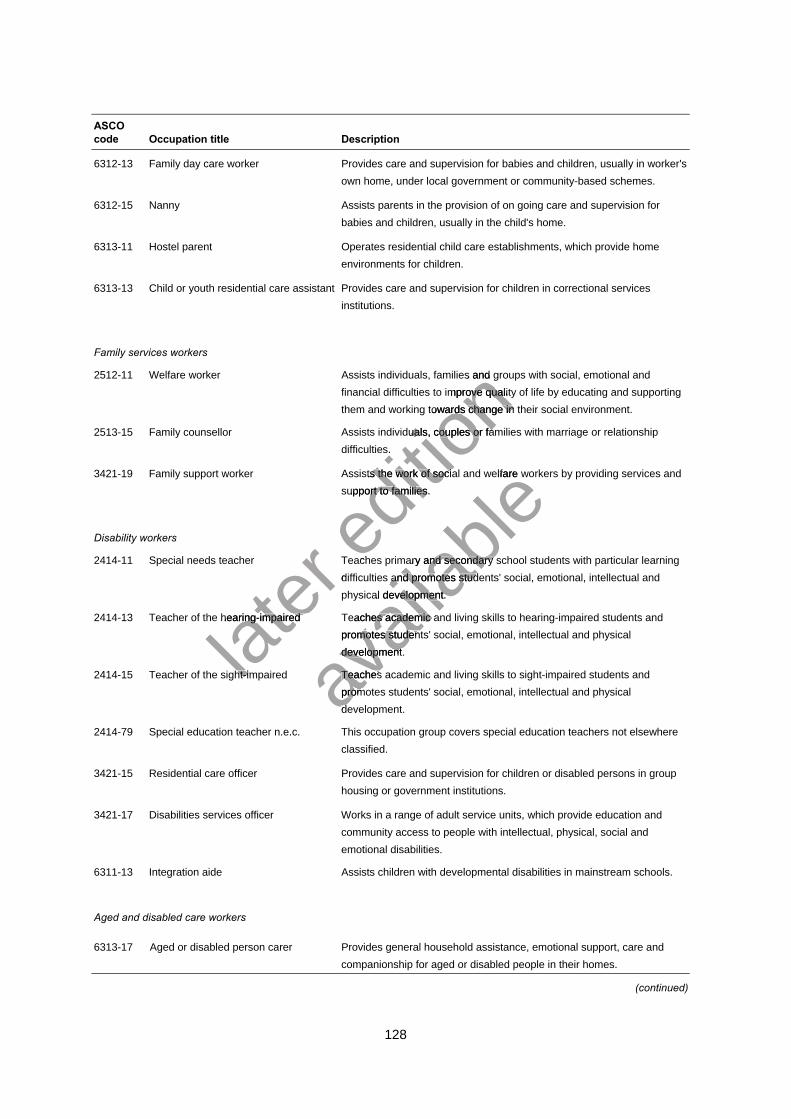
128
ASCOcode Occupation title Description
6312-13 Family day care worker Provides care and supervision for babies and children, usually in worker'sown home, under local government or community-based schemes.
6312-15 Nanny Assists parents in the provision of on going care and supervision forbabies and children, usually in the child's home.
6313-11 Hostel parent Operates residential child care establishments, which provide homeenvironments for children.
6313-13 Child or youth residential care assistant Provides care and supervision for children in correctional servicesinstitutions.
Family services workers
2512-11 Welfare worker Assists individuals, families and groups with social, emotional andfinancial difficulties to improve quality of life by educating and supportingthem and working towards change in their social environment.
2513-15 Family counsellor Assists individuals, couples or families with marriage or relationshipdifficulties.
3421-19 Family support worker Assists the work of social and welfare workers by providing services andsupport to families.
Disability workers
2414-11 Special needs teacher Teaches primary and secondary school students with particular learningdifficulties and promotes students' social, emotional, intellectual andphysical development.
2414-13 Teacher of the hearing-impaired Teaches academic and living skills to hearing-impaired students andpromotes students' social, emotional, intellectual and physicaldevelopment.
2414-15 Teacher of the sight-impaired Teaches academic and living skills to sight-impaired students andpromotes students' social, emotional, intellectual and physicaldevelopment.
2414-79 Special education teacher n.e.c. This occupation group covers special education teachers not elsewhereclassified.
3421-15 Residential care officer Provides care and supervision for children or disabled persons in grouphousing or government institutions.
3421-17 Disabilities services officer Works in a range of adult service units, which provide education andcommunity access to people with intellectual, physical, social andemotional disabilities.
6311-13 Integration aide Assists children with developmental disabilities in mainstream schools.
Aged and disabled care workers
6313-17 Aged or disabled person carer Provides general household assistance, emotional support, care andcompanionship for aged or disabled people in their homes.
(continued)
later difficulties and promotes students' social, emotional, intellectual and
later difficulties and promotes students' social, emotional, intellectual and
2414-13 Teacher of the hearing-impaired Teaches academic and living skills to hearing-impaired students and
later 2414-13 Teacher of the hearing-impaired Teaches academic and living skills to hearing-impaired students and
2414-15 Teacher of the sight-impairedlater
2414-15 Teacher of the sight-impaired
editio
n Assists individuals, families and groups with social, emotional and
editio
n Assists individuals, families and groups with social, emotional andfinancial difficulties to improve quality of life by educating and supporting
editio
n financial difficulties to improve quality of life by educating and supportingthem and working towards change in their social environment.
editio
n them and working towards change in their social environment.
Assists individuals, couples or fa
editio
n Assists individuals, couples or fa
Assists the work of social and welfare workers by providing services and
editio
n Assists the work of social and welfare workers by providing services andsupport to families.
editio
n support to families.
Teaches primary and seceditio
n
Teaches primary and sec
avail
able
Assists the work of social and welfare workers by providing services and
avail
able
Assists the work of social and welfare workers by providing services and
Teaches primary and sec
avail
able
Teaches primary and secondary school students with particular learning
avail
able
ondary school students with particular learningdifficulties and promotes students' social, emotional, intellectual and
avail
able
difficulties and promotes students' social, emotional, intellectual andphysical development.
avail
able
physical development.
2414-13 Teacher of the hearing-impaired Teaches academic and living skills to hearing-impaired students and
avail
able
2414-13 Teacher of the hearing-impaired Teaches academic and living skills to hearing-impaired students andpromotes students' social, emotional, intellectual and physical
avail
able
promotes students' social, emotional, intellectual and physicaldevelopment.
avail
able
development.
Teaches academic and living skills to sight-impaired students andavail
able
Teaches academic and living skills to sight-impaired students andpromotes students' social, emotional, intellectual and physicalav
ailab
le
promotes students' social, emotional, intellectual and physicaldevelopment.av
ailab
le
development.
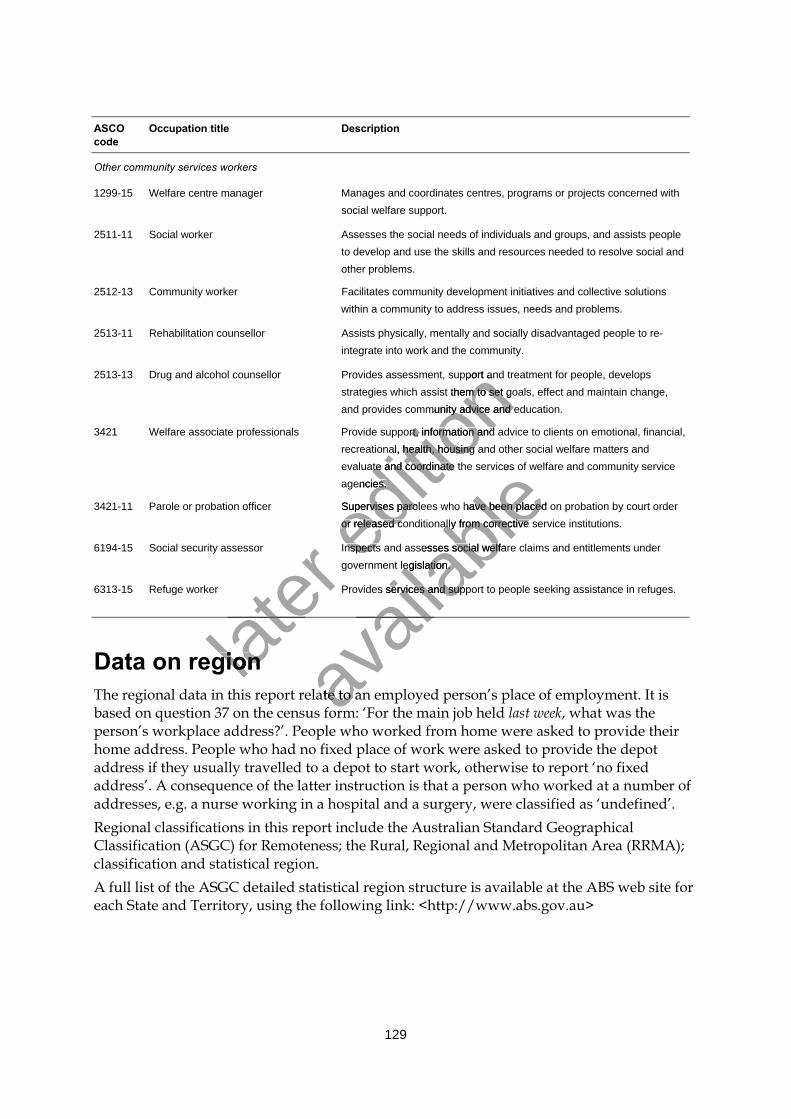
129
ASCOcode
Occupation title Description
Other community services workers
1299-15 Welfare centre manager Manages and coordinates centres, programs or projects concerned withsocial welfare support.
2511-11 Social worker Assesses the social needs of individuals and groups, and assists peopleto develop and use the skills and resources needed to resolve social andother problems.
2512-13 Community worker Facilitates community development initiatives and collective solutionswithin a community to address issues, needs and problems.
2513-11 Rehabilitation counsellor Assists physically, mentally and socially disadvantaged people to re-integrate into work and the community.
2513-13 Drug and alcohol counsellor Provides assessment, support and treatment for people, developsstrategies which assist them to set goals, effect and maintain change,and provides community advice and education.
3421 Welfare associate professionals Provide support, information and advice to clients on emotional, financial,recreational, health, housing and other social welfare matters andevaluate and coordinate the services of welfare and community serviceagencies.
3421-11 Parole or probation officer Supervises parolees who have been placed on probation by court orderor released conditionally from corrective service institutions.
6194-15 Social security assessor Inspects and assesses social welfare claims and entitlements undergovernment legislation.
6313-15 Refuge worker Provides services and support to people seeking assistance in refuges.
Data on regionThe regional data in this report relate to an employed person’s place of employment. It isbased on question 37 on the census form: ‘For the main job held last week, what was theperson’s workplace address?’. People who worked from home were asked to provide theirhome address. People who had no fixed place of work were asked to provide the depotaddress if they usually travelled to a depot to start work, otherwise to report ‘no fixedaddress’. A consequence of the latter instruction is that a person who worked at a number ofaddresses, e.g. a nurse working in a hospital and a surgery, were classified as ‘undefined’.Regional classifications in this report include the Australian Standard GeographicalClassification (ASGC) for Remoteness; the Rural, Regional and Metropolitan Area (RRMA);classification and statistical region.A full list of the ASGC detailed statistical region structure is available at the ABS web site foreach State and Territory, using the following link: <http://www.abs.gov.au>
later
later
Data on regionlater
Data on region
editio
n ssment, support and treatment for people, develops
editio
n ssment, support and treatment for people, develops
strategies which assist them to set goals, effect and maintain change,
editio
n strategies which assist them to set goals, effect and maintain change,and provides community advice and education.
editio
n and provides community advice and education.
3421 Welfare associate professionals Provide support, information and advice to clients on emotional, financial,
editio
n 3421 Welfare associate professionals Provide support, information and advice to clients on emotional, financial,recreational, health, housing and other social welfare matters and
editio
n recreational, health, housing and other social welfare matters andevaluate and coordinate the services of welfare and community service
editio
n evaluate and coordinate the services of welfare and community serviceagencies.
editio
n agencies.
Supervises parolees who have been placed on probation by court order
editio
n Supervises parolees who have been placed on probation by court orderor released conditionally from corrective service institutions.ed
ition
or released conditionally from corrective service institutions.
Inspects and assesses social welfare claims and entitlements undereditio
n
Inspects and assesses social welfare claims and entitlements under
avail
able
evaluate and coordinate the services of welfare and community service
avail
able
evaluate and coordinate the services of welfare and community service
Supervises parolees who have been placed on probation by court order
avail
ableSupervises parolees who have been placed on probation by court order
or released conditionally from corrective service institutions.
avail
ableor released conditionally from corrective service institutions.
Inspects and assesses social welfare claims and entitlements under
avail
able
Inspects and assesses social welfare claims and entitlements undergovernment legislation.
avail
able
government legislation.
Provides se
avail
able
Provides services and support to people seek
avail
able
rvices and support to people seek
avail
able
The regional data in this report relate to anavail
able
The regional data in this report relate to an form: ‘For the main job held av
ailab
le
form: ‘For the main job held

130
QualificationsQualifications are classified to the Australian Bureau of Statistics 1991, ABS Classification ofQualifications, ABS Cat. no. 1262.0, Canberra: ABS.
later
editio
n
avail
able
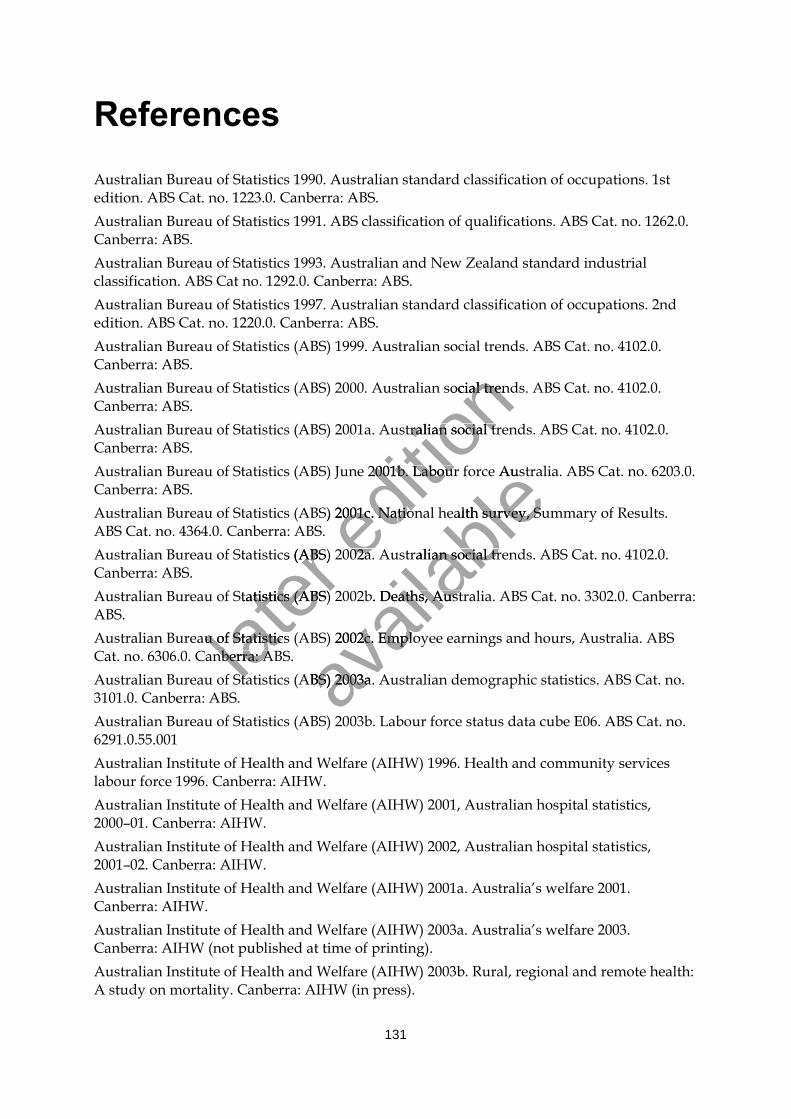
131
ReferencesAustralian Bureau of Statistics 1990. Australian standard classification of occupations. 1stedition. ABS Cat. no. 1223.0. Canberra: ABS.Australian Bureau of Statistics 1991. ABS classification of qualifications. ABS Cat. no. 1262.0.Canberra: ABS.Australian Bureau of Statistics 1993. Australian and New Zealand standard industrialclassification. ABS Cat no. 1292.0. Canberra: ABS.Australian Bureau of Statistics 1997. Australian standard classification of occupations. 2ndedition. ABS Cat. no. 1220.0. Canberra: ABS.Australian Bureau of Statistics (ABS) 1999. Australian social trends. ABS Cat. no. 4102.0.Canberra: ABS.Australian Bureau of Statistics (ABS) 2000. Australian social trends. ABS Cat. no. 4102.0.Canberra: ABS.Australian Bureau of Statistics (ABS) 2001a. Australian social trends. ABS Cat. no. 4102.0.Canberra: ABS.Australian Bureau of Statistics (ABS) June 2001b. Labour force Australia. ABS Cat. no. 6203.0.Canberra: ABS.Australian Bureau of Statistics (ABS) 2001c. National health survey, Summary of Results.ABS Cat. no. 4364.0. Canberra: ABS.Australian Bureau of Statistics (ABS) 2002a. Australian social trends. ABS Cat. no. 4102.0.Canberra: ABS.Australian Bureau of Statistics (ABS) 2002b. Deaths, Australia. ABS Cat. no. 3302.0. Canberra:ABS.Australian Bureau of Statistics (ABS) 2002c. Employee earnings and hours, Australia. ABSCat. no. 6306.0. Canberra: ABS.Australian Bureau of Statistics (ABS) 2003a. Australian demographic statistics. ABS Cat. no.3101.0. Canberra: ABS.Australian Bureau of Statistics (ABS) 2003b. Labour force status data cube E06. ABS Cat. no.6291.0.55.001Australian Institute of Health and Welfare (AIHW) 1996. Health and community serviceslabour force 1996. Canberra: AIHW.Australian Institute of Health and Welfare (AIHW) 2001, Australian hospital statistics,2000–01. Canberra: AIHW.Australian Institute of Health and Welfare (AIHW) 2002, Australian hospital statistics,2001–02. Canberra: AIHW.Australian Institute of Health and Welfare (AIHW) 2001a. Australia’s welfare 2001.Canberra: AIHW.Australian Institute of Health and Welfare (AIHW) 2003a. Australia’s welfare 2003.Canberra: AIHW (not published at time of printing).Australian Institute of Health and Welfare (AIHW) 2003b. Rural, regional and remote health:A study on mortality. Canberra: AIHW (in press).
later
Australian Bureau of Statistics (ABS) 2002a. Aus
later
Australian Bureau of Statistics (ABS) 2002a. Aus
Australian Bureau of Statistics (ABS) 2002b. Deat
later Australian Bureau of Statistics (ABS) 2002b. Deat
later
Australian Bureau of Statistics (ABS) 2002c. Employee earnings and hours, Australia.later
Australian Bureau of Statistics (ABS) 2002c. Employee earnings and hours, Australia.Cat. no. 6306.0. Canberra: ABS.lat
er Cat. no. 6306.0. Canberra: ABS.Australian Bureau of Statistics (ABS) 2003a. Auslat
er Australian Bureau of Statistics (ABS) 2003a. Aus
editio
n tralian social trends. ABS Cat. no. 4102.0.
editio
n tralian social trends. ABS Cat. no. 4102.0.
tralian social trends. ABS Cat. no. 4102.0.
editio
n tralian social trends. ABS Cat. no. 4102.0.
Australian Bureau of Statistics (ABS) June 2001b
editio
n Australian Bureau of Statistics (ABS) June 2001b. Labour force Australia. ABS Cat. no. 6203.0.
editio
n . Labour force Australia. ABS Cat. no. 6203.0.
Australian Bureau of Statistics (ABS) 2001c. Naeditio
n Australian Bureau of Statistics (ABS) 2001c. National health survey, Summary of Results.ed
ition
tional health survey, Summary of Results.
Australian Bureau of Statistics (ABS) 2002a. Auseditio
n
Australian Bureau of Statistics (ABS) 2002a. Aus
avail
able
. Labour force Australia. ABS Cat. no. 6203.0.
avail
able
. Labour force Australia. ABS Cat. no. 6203.0.
tional health survey, Summary of Results.
avail
abletional health survey, Summary of Results.
avail
able
tralian social trends. ABS Cat. no. 4102.0.
avail
able
tralian social trends. ABS Cat. no. 4102.0.
Australian Bureau of Statistics (ABS) 2002b. Deat
avail
able
Australian Bureau of Statistics (ABS) 2002b. Deaths, Australia. ABS Cat. no. 3302.0. Canberra:
avail
able
hs, Australia. ABS Cat. no. 3302.0. Canberra:
avail
able
Australian Bureau of Statistics (ABS) 2002c. Employee earnings and hours, Australia.
avail
able
Australian Bureau of Statistics (ABS) 2002c. Employee earnings and hours, Australia.
avail
able
Australian Bureau of Statistics (ABS) 2003a. Ausavail
able
Australian Bureau of Statistics (ABS) 2003a. Aus

132
Australian Medical Workforce Advisory Committee (AMWAC) 2003. Specialist MedicalWorkforce Planning in Australia – A Guide To The Planning Process Used By The AustralianMedical Workforce Advisory Committee, AMWAC Report 2003.1, Sydney.Department of Health and Ageing (DoHA) 2002. Medicare statistics 1984/85 to June quarter2002. ISSN 1328-0449. Canberra: DoHA.Department of Family and Community Services (FACS) 2001. The identification and analysisof indicators of community strength and outcomes. Prepared by Black A and Hughes P.Occasional paper No. 3, Feb 2001.
later
editio
n
avail
able
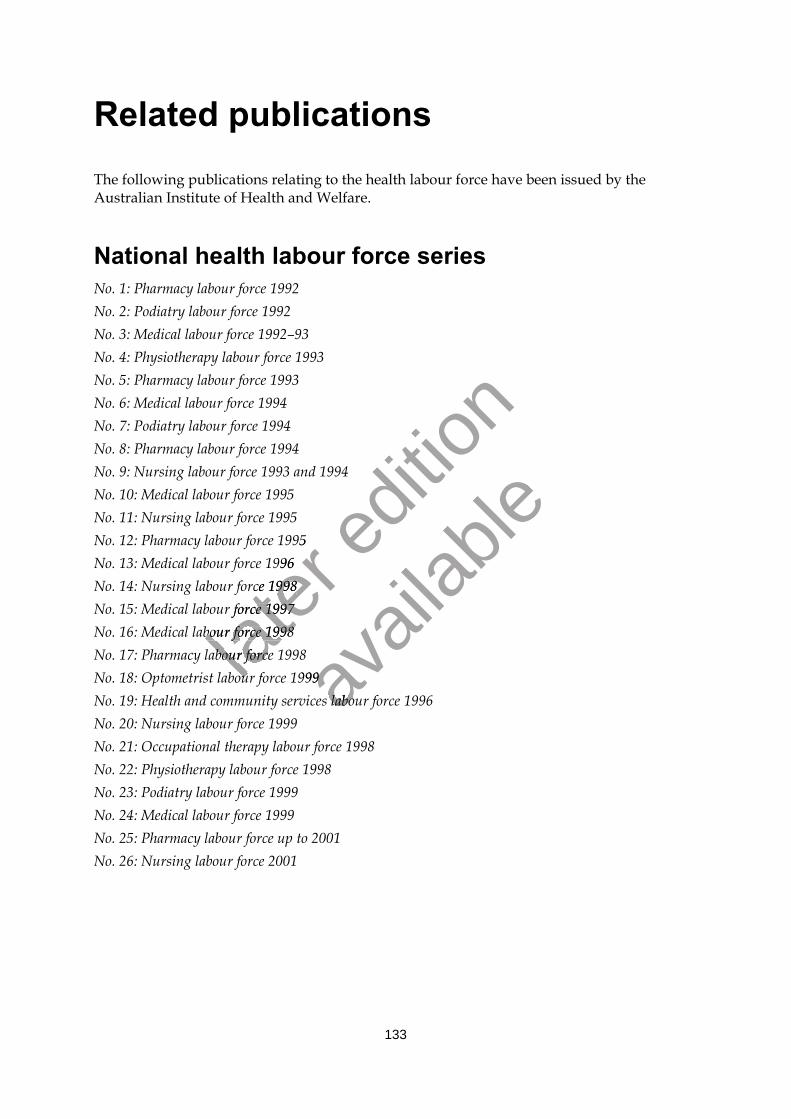
133
Related publicationsThe following publications relating to the health labour force have been issued by theAustralian Institute of Health and Welfare.
National health labour force seriesNo. 1: Pharmacy labour force 1992No. 2: Podiatry labour force 1992No. 3: Medical labour force 1992–93No. 4: Physiotherapy labour force 1993No. 5: Pharmacy labour force 1993No. 6: Medical labour force 1994No. 7: Podiatry labour force 1994No. 8: Pharmacy labour force 1994No. 9: Nursing labour force 1993 and 1994No. 10: Medical labour force 1995No. 11: Nursing labour force 1995No. 12: Pharmacy labour force 1995No. 13: Medical labour force 1996No. 14: Nursing labour force 1998No. 15: Medical labour force 1997No. 16: Medical labour force 1998No. 17: Pharmacy labour force 1998No. 18: Optometrist labour force 1999No. 19: Health and community services labour force 1996No. 20: Nursing labour force 1999No. 21: Occupational therapy labour force 1998No. 22: Physiotherapy labour force 1998No. 23: Podiatry labour force 1999No. 24: Medical labour force 1999No. 25: Pharmacy labour force up to 2001No. 26: Nursing labour force 2001
later
No. 12: Pharmacy labour force 1995
later
No. 12: Pharmacy labour force 1995No. 13: Medical labour force 1996
later
No. 13: Medical labour force 1996No. 14: Nursing labour force 1998
later No. 14: Nursing labour force 1998
No. 15: Medical labour force 1997
later No. 15: Medical labour force 1997
No. 16: Medical labour force 1998later
No. 16: Medical labour force 1998No. 17: Pharmacy labour force 1998lat
er No. 17: Pharmacy labour force 1998No. 18: Optometrist labour force 1999lat
er No. 18: Optometrist labour force 1999
editio
n
avail
able
No. 18: Optometrist labour force 1999 avail
able
No. 18: Optometrist labour force 1999 services labour force 1996av
ailab
le
services labour force 1996
134
Other publicationsAustralia’s health 1994Australia’s health 1996Australia’s health 1998Australia’s health 2000Australia’s health 2002Australia hospital statistics 1993–95: an overviewAustralian hospital statistics 1996–97Australian hospital statistics 1997–98Australian hospital statistics 1998–99Australian hospital statistics 1999–00Australian hospital statistics 2000–01Australian hospital statistics 2001–02Australia’s Welfare 1999Australia’s Welfare 2001Medical labour force 2000
Internet accessAdditional tables relating to this publication and a selection of material produced by theAustralian Institute of Health and Welfare are published on the Institute’s web site at<http://www.aihw.gov.au>. This includes the Institute’s medical and nursing labour forcepublications and the publications catalogue ordering information.lat
er Additional tables relating to this publicatio
later Additional tables relating to this publicatio
Australian Institute of Health and Welfare are published on the Institute’s web site at
later Australian Institute of Health and Welfare are published on the Institute’s web site at
<http://www.aihw.gov.au>. This includes the In
later <http://www.aihw.gov.au>. This includes the In
later
publications and the publications catalogue ordering information.later
publications and the publications catalogue ordering information.
editio
n
avail
able
n and a selection of material produced by the
avail
able
n and a selection of material produced by theAustralian Institute of Health and Welfare are published on the Institute’s web site at
avail
able
Australian Institute of Health and Welfare are published on the Institute’s web site at<http://www.aihw.gov.au>. This includes the In
avail
able
<http://www.aihw.gov.au>. This includes the In
avail
able
stitute’s medical and nursing labour force
avail
able
stitute’s medical and nursing labour forcepublications and the publications catalogue ordering information.
avail
able
publications and the publications catalogue ordering information.
Related Documents

![Fertility Model and Female Labour Force Participation in Selected … · 2013-05-08 · between fertility and female labour force participation [9]. Most studies on labour force participation](https://static.cupdf.com/doc/110x72/5e98a78712fceb60083365ee/fertility-model-and-female-labour-force-participation-in-selected-2013-05-08-between.jpg)