This content has been downloaded from IOPscience. Please scroll down to see the full text. Download details: IP Address: 134.174.179.59 This content was downloaded on 14/07/2016 at 15:40 Please note that terms and conditions apply. Health and climate benefits of offshore wind facilities in the Mid-Atlantic United States View the table of contents for this issue, or go to the journal homepage for more 2016 Environ. Res. Lett. 11 074019 (http://iopscience.iop.org/1748-9326/11/7/074019) Home Search Collections Journals About Contact us My IOPscience

Welcome message from author
This document is posted to help you gain knowledge. Please leave a comment to let me know what you think about it! Share it to your friends and learn new things together.
Transcript

This content has been downloaded from IOPscience. Please scroll down to see the full text.
Download details:
IP Address: 134.174.179.59
This content was downloaded on 14/07/2016 at 15:40
Please note that terms and conditions apply.
Health and climate benefits of offshore wind facilities in the Mid-Atlantic United States
View the table of contents for this issue, or go to the journal homepage for more
2016 Environ. Res. Lett. 11 074019
(http://iopscience.iop.org/1748-9326/11/7/074019)
Home Search Collections Journals About Contact us My IOPscience

Environ. Res. Lett. 11 (2016) 074019 doi:10.1088/1748-9326/11/7/074019
LETTER
Health and climate benefits of offshore wind facilities in theMid-Atlantic United States
Jonathan J Buonocore1, Patrick Luckow2, JeremyFisher2,Willett Kempton3 and Jonathan I Levy4
1 Center forHealth and theGlobal Environment, Harvard T.H. Chan School of PublicHealth, Boston,MA02215,USA2 Synapse Energy Economics, Cambridge,MA02139,USA3 College of Earth, Ocean&Environment, University ofDelaware, Newark, DE 19740,USA4 Department of Environmental Health, BostonUniversity School of PublicHealth, Boston,MA02118,USA
E-mail: [email protected]
Keywords: renewable energy, co-benefits, climatemitigation, air quality, offshore wind
AbstractElectricity from fossil fuels contributes substantially to both climate change and the health burden ofair pollution. Renewable energy sources are capable of displacing electricity from fossil fuels, but thequantity of health and climate benefits depend on site-specific attributes that are not often included inquantitativemodels. Here, we link an electrical grid simulationmodel to an air pollution healthimpact assessmentmodel andUS regulatory estimates of the impacts of carbon to estimate the healthand climate benefits of offshorewind facilities of different sizes in two different locations.Wefind thatoffshorewind in theMid-Atlantic is capable of producing health and climate benefits of between $54and $120 perMWhof generation, with the largest simulated facility (3000MWoff the coast ofNewJersey) producing approximately $690million in benefits in 2017. The variability in benefits per unitgeneration is a function of differences in locations (Maryland versusNew Jersey), simulated years(2012 versus 2017), and facility generation capacity, given complexities of the electrical grid anddifferences inwhich power plants are offset. This work demonstrates health and climate benefits ofoffshorewind, provides further evidence of the utility of geographically-refinedmodeling frame-works, and yields quantitative insights that would allow for inclusion of both climate and public healthin benefits assessments of renewable energy.
Introduction
Use of fossil-fuel derived electricity contributes to twomajor public health issues—climate change and airpollution (Haines et al 2009, Markandya et al 2009,IPCC 2014, Watts et al 2015), with climate changeprimarily caused by CO2 emissions (as well as leakedCH4) and health impacted by emissions of SO2, NOx,
PM2.5, and other pollutants. Climate change will likelybe the greatest public health threat in the 21st century,impacting health in ways ranging from sea level riseand displacement, to increasing air pollution, toimpacting water security and both food security andnutrition (IPCC 2014, Myers et al 2014, Wattset al 2015). The health burden of air pollution fromelectricity generation in 2010 is estimated at 460 000deaths worldwide, and approximately 17 000 in theUS(Lelieveld et al 2015). Reducing reliance on fossil-derived electricity can mitigate both of these issues
related to fossil fuel combustion, and therefore havebenefits for both public health and the climate(Markandya et al 2009,Watts et al 2015).
Energy efficiency and renewable energy (EE/RE)are capable of producing benefits to the environmentand public health by displacing electrical generationsources that emit greenhouse gases (GHGs) or otherair pollutants, as well as by having impacts across thefull life cycle of electrical generation (Jaramilloet al 2007, Epstein et al 2011). Many recent studiesevaluated the benefits of EE/RE projects (Gilmoreet al 2006, 2010, Thompson et al 2009, 2011, Weberet al 2010, Budischak et al 2013, Siler-evans et al 2013,Plachinski et al 2014, Buonocore et al 2015, Wiseret al 2016). These studies found that these projects canhave substantial benefits, and that the benefits of dif-ferent EE/RE projects can vary dramatically by typeand location due to a variety of factors, including localelectrical grid infrastructure, constraints, and
OPEN ACCESS
RECEIVED
17 February 2016
REVISED
12May 2016
ACCEPTED FOR PUBLICATION
3 June 2016
PUBLISHED
14 July 2016
Original content from thisworkmay be used underthe terms of the CreativeCommonsAttribution 3.0licence.
Any further distribution ofthis workmustmaintainattribution to theauthor(s) and the title ofthework, journal citationandDOI.
© 2016 IOPPublishing Ltd

electrical market conditions, and the conditions of thelocal and regional power plant fleet, including powerplant efficiency, fuel type, emissions rate, and popula-tions downwind. This high variability demonstratesthat there is substantial value in evaluating benefits in asite-specific manner, especially given that EE/RE pro-grams vary greatly in their diurnal and seasonalprofiles.
Previous studies examined the benefits of onshorewind, solar photovoltaic (PV), and demand side man-agement (DSM). However, none of these studies haveevaluated the climate and health benefits of offshorewind. Offshore wind is becoming an establishedsource of renewable energy in Europe, which had5.4 GW installed capacity in 2012 (InternationalEnergy Agency 2013). Offshore wind could have a sub-stantial role in the US energy mix, with an estimatedpotential capacity in the US of 4200 GW (Lopezet al 2012). Offshore wind in the east coast of the USgenerally coincides with peak demand, and is esti-mated to be able to fulfill approximately one-third ofelectrical demand for the entire east coast of the US(Dvorak et al 2013). Despite the large resource avail-ability, this energy source is in the beginning stages ofdevelopment in the US. The slow development of thisresource is possibly due to a variety of factors, rangingfrom high upfront costs, difficulties with permittingand obtaining power purchase agreements, lack ofnecessary infrastructure for construction, and uncer-tainties around applicable regulations and incentives,such as renewable portfolio standards and productiontax credits (Musial and Ram2010). There are currentlyno operating offshore wind facilities in North Amer-ica, but there are several in the development stages,especially off the Atlantic Coast. Construction of thefirst US offshore wind facility, Deepwater Wind’sBlock Island project in Rhode Island, began in thesummer of 2015, with a planned capacity of 30MW(US Energy Information Administration 2015). InMassachusetts, offshore wind development areas havealready been leased to three companies, with potentialtotal capacity over 6000MW (US Bureau of OffshoreEnergy Management 2015a). In addition, areas off thecoasts of Delaware, Maryland and New Jersey havebeen leased (US Bureau of Offshore EnergyManagement 2015b, 2015c, 2015d).
Here, we use the Electrical Policy Simulation Toolfor Electrical Grid Interventions, or the EPSTEINmodel (Buonocore et al 2015), to estimate the climateand health benefits of different sizes of offshore windprojects off the coast of New Jersey andMaryland. Weuse 2017 to represent a future implementation year,and simulate different sizes of projects, which allowsfor examination of whether the relationship betweenproject size and total benefits is linear. Additionally,we do two simulations using 2012 as a simulation yearto facilitate comparing offshore wind to onshore wind,solar PV and two different types of DSM, based on aprevious study (Buonocore et al 2015).
Methods
We developed offshore wind project scenarios thatreasonably bound the possible size of an offshore windfacility in each location, along with baseline scenarioswithout any offshore wind. Offshore wind generationoutput was calculated hourly based on the WeatherResearch and Forecasting (WRF) model for windspeeds offshore. To estimate benefits of different sizes,and to simulate the health and climate benefits, weused the EPSTEIN model (Buonocore et al 2015) forthe Eastern Interconnect. The EPSTEIN model linksan electrical grid simulation model that provideselectrical generation and emissions of NOx, SO2, andCO2 for electrical generation units (EGUs) on theEastern Interconnect (Buonocore et al 2015). Carbonemissions are valued using the social cost of carbonestablished by the US Federal Government (USGovt. 2013), and the monetary value of health impactsfrom NOx and SO2, due to formation of PM2.5, areestimated using a health impact assessmentmodel thatprovides site-specific impact estimates (Buonocoreet al 2014).
Scenario development and generation estimatesWe developed scenarios that provide reasonableestimates for possible offshore wind projects in eachlocation. For New Jersey, the capacity numberscorrespond approximately with the minimum off-shorewind capacity called for in theNew Jersey EnergyMaster Plan for 2012 and 2020 (1100MW and3000MW, respectively). For Maryland, the200–400MW capacity numbers reasonably corre-spond with scenarios under consideration in nearbyDelaware, while 1000MWrepresents a scenario underconsideration in Maryland. This region has averageoffshore wind speeds between 8 and 9 m s−1 at a heightof 90 m and power densities around 700–800Wm−2,so using RePower 5 M5MWturbines, capacity factorsfor generation around 40%–45% are possible in thisarea (Jonkman et al 2009). Scenarios are described intable 1.
We use estimated hourly generation based on runsof the WRF model for 2010 and 2011 (Dvoraket al 2013), and the power curve of the RePower 5M5MW turbine. We simulate the New Jersey facility asbeing connected to the PJM-MidE transmission areaand the Maryland facility being connected to PJM-SW.With array losses of 10% and transmission loss of1.5%, the average annual capacity factors in both casesare 36% (Jonkman et al 2009,Dvorak et al 2013).
Electrical dispatchmodelTo simulate the generation and emissions displaced bythe EGUs on the Eastern Interconnect, we use MarketAnalytics, under license from Ventyx (Ventyx/ABB 2012). The Market Analytics model uses thePROSYM engine to produce optimized unit
2
Environ. Res. Lett. 11 (2016) 074019
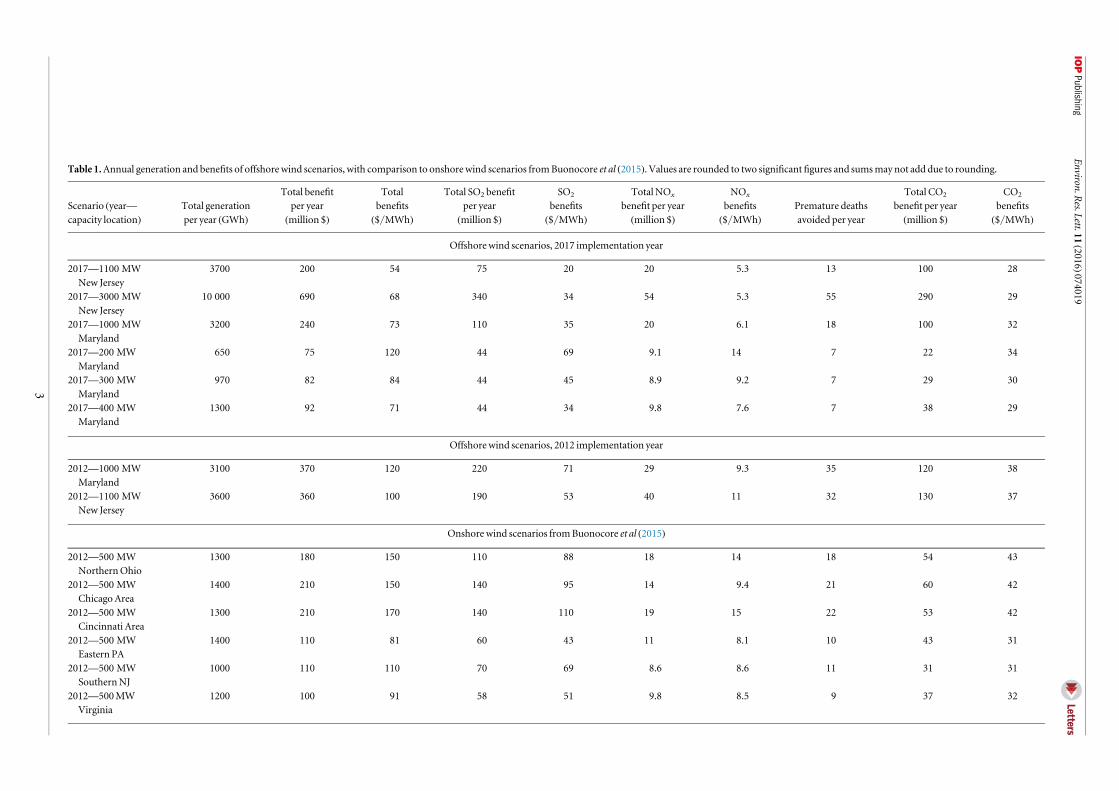
Table 1.Annual generation and benefits of offshorewind scenarios, with comparison to onshorewind scenarios fromBuonocore et al (2015). Values are rounded to two significant figures and sumsmay not add due to rounding.
Scenario (year—capacity location)
Total generation
per year (GWh)
Total benefitper year
(million $)
Totalbenefits
($/MWh)
Total SO2 benefitper year
(million $)
SO2
benefits
($/MWh)
Total NOx
benefit per year
(million $)
NOx
benefits
($/MWh)Premature deaths
avoided per year
Total CO2
benefit per year
(million $)
CO2
benefits
($/MWh)
Offshorewind scenarios, 2017 implementation year
2017—1100 MW
New Jersey
3700 200 54 75 20 20 5.3 13 100 28
2017—3000 MW
New Jersey
10 000 690 68 340 34 54 5.3 55 290 29
2017—1000 MW
Maryland
3200 240 73 110 35 20 6.1 18 100 32
2017—200 MW
Maryland
650 75 120 44 69 9.1 14 7 22 34
2017—300 MW
Maryland
970 82 84 44 45 8.9 9.2 7 29 30
2017—400 MW
Maryland
1300 92 71 44 34 9.8 7.6 7 38 29
Offshorewind scenarios, 2012 implementation year
2012—1000 MWMaryland
3100 370 120 220 71 29 9.3 35 120 38
2012—1100 MWNew Jersey
3600 360 100 190 53 40 11 32 130 37
Onshore wind scenarios fromBuonocore et al (2015)
2012—500 MWNorthernOhio
1300 180 150 110 88 18 14 18 54 43
2012—500 MWChicago Area
1400 210 150 140 95 14 9.4 21 60 42
2012—500 MWCincinnati Area
1300 210 170 140 110 19 15 22 53 42
2012—500 MWEastern PA
1400 110 81 60 43 11 8.1 10 43 31
2012—500 MWSouthernNJ
1000 110 110 70 69 8.6 8.6 11 31 31
2012—500MWVirginia
1200 100 91 58 51 9.8 8.5 9 37 32
3
Environ.R
es.Lett.11(2016)074019
commitment and dispatch decisions.Market Analyticssimulates the behavior of the electrical market byproviding zonal locational market-price-forecasting,including energy and operating reserves markets withEGU-specific operational data, including ramp rates,minimum up and down times, multiple capacityblocks, and variable generation capacity from renew-ables and hydroelectricity. It is a security-constrainedchronological dispatch model that produces hourlyelectricity prices for each zone, informed by hourlyloads, market rules, and EGU-specific constraints.This chronological approach accounts for timedynamics, including transmission constraints andoperating characteristics of EGUs, such as minimumdowntime for maintenance, and constraints on elec-trical transmission. Themodel includes regulations onNOx and SO2 emissions, participation in the regionalGHG initiative as appropriate, but no Federal regula-tion onCO2.
Our analysis was based on default data from Mar-ket Analytics, which includes data from the US EnergyInformation Administration, US EPA, North Amer-ican Electric Reliability Corporation and the FederalEnergy Regulatory Commission, Ventyx’s profes-sional judgment, and trade press announcements.Hourly load shapes are provided by Ventyx, adjustedannually based on utility and ISO/RTO forecasts ofregional energy and peak load growth. However, weincluded several updates to the dataset, includingtransmission path capacity across PJM to account fortransmission improvements required by RenewablePortfolio Standards, forecasted new gas plants, andupdated emissions rates based on data reported to theUS EPA (Buonocore et al 2015).
Public health impact assessmentmodelTo estimate the monetary value of the health impactsof SO2 and NOx emissions for each EGU on theEastern Interconnect, we used a previously publishedstatisticalmodel (Buonocore et al 2014). This statisticalmodel was developed using a series of simulations ofthe Community Multiscale Air Quality (CMAQ)model, designed to produce source-specific estimatesfor a set of EGUs on the PJM Interconnection for theinfluence of SO2 and NOx on annual average PM2.5
concentrations, the main health impact of SO2 andNOx emissions. CMAQ is a complex atmospheric fate,chemistry, and transport model that is used by theEPA for regulatory applications, and for air quality andhealth impact assessment (Byun and Ching 1999, Royet al 2007, Brown et al 2011, von Stackelberget al 2013). These PM2.5 concentrations, secondarilyformed from the SO2 and NOx emissions, were thenlinked to data on exposed population and baselinemortality rate, and the excess mortality due to PM2.5
was estimated using a concentration-response func-tion of a 1% increase in mortality per 1 μg m−3
increase in PM2.5 concentrations (Roman et al 2008,
Buonocore et al 2014). Monetized estimates of healthimpact per ton emitted of SO2 and NOx, due to healthimpacts of secondarily-formed PM2.5, were extrapo-lated to unmodeled EGUs based on the geographicaldistribution of population around the source. Thehealth impacts were then monetized using a value ofstatistical life (VSL) of US$7.58 million, 2012 USD(Dockins et al 2004). The impact/ton values of SO2
from this model are similar to those previouslyreported, after accounting for differences in concen-tration-response function and mortality risk (Fannet al 2009). The impact/ton values for NOx in thismodel are slightly higher than those previouslyreported in many studies, largely due to the effect thatNOx emissions have on amplifying sulfate formation,which is captured by the version of CMAQused in ourstudy (Buonocore et al 2014).
To facilitate comparison between scenarios and toexamine drivers behind differences in benefits, wereport total facility benefits and benefits per MWh ofelectricity generated for each emitted pollutant and intotal across emission types.
Results
Benefits to public health and the climate fromhypothetical offshore wind installations varied by anorder of magnitude across scenarios, with the annualbenefits ranging from $75 million for the smallestinstallation to $690 million for the largest (table 1).Generally, benefits attributable to avoided SO2 emis-sions were highest, followed by those attributable toavoided CO2, and then NOx. For the installations withtwo simulated years, the benefits are lower for futureyears due to the electric system having lower emissionsin 2017 than 2012.
As expected, benefits do increase with the size ofthe installation, but they do not scale linearly, and theincrease in benefits relative to the increase in installa-tion size varies by location (table 1). For example, the3000MW installation off the coast of New Jersey gen-erates 2.7 times more electricity than the 1100MWinstallation, but the total benefits increase by a factorof 3.45. Benefits from SO2 reductions increase by a fac-tor of 4.5, benefits from NOx reductions increase by afactor of 2.7, and benefits from CO2 reductionsincrease by a factor of 2.9. Conversely, the 400MWinstallation off the Maryland coast generates twice asmuch electricity as the 200MW installation, but thetotal benefits only increase by 23%. Benefits from SO2
reductions stay nearly the same, benefits from NOx
reductions increase by around 8%, and benefits fromCO2 reductions increase by 73%. Comparing the 400and 1000MW installations (an increase in electricitygeneration by a factor of 2.5), the total benefitsincrease by a factor of 2.6, benefits from SO2 reduc-tions increase by a factor of 2.5, benefits from NOx
4
Environ. Res. Lett. 11 (2016) 074019

Table 2.Annual generation and emissions avoided for offshorewind energy scenarios. Values are rounded to two significant figures and sumsmay not add due to rounding.
Scenario (year—capacity
location)Total generation per
year (GWh)Total SO2 benefit per
year (1000 tons)SO2 emissions avoided
(lb/MWh)Total NOx benefit per
year (1000 tons)NOx emissions avoided
(lb/MWh)Total CO2 benefit per
year (1000 tons)CO2 emissions avoided
(lb/MWh)
2012—1100 MWNew
Jersey
3600 11.5 6.4 3.1 1.7 2800 1500
2017—1100 MWNew
Jersey
3700 2.44 1.3 1.4 0.7 2200 1200
2017—3000 MWNew
Jersey
10 000 12.0 2.4 3.7 0.7 6100 1200
2012—1000 MWMaryland 3100 10.1 6.4 1.9 1.2 2500 1600
2017—1000 MWMaryland 3200 3.95 2.4 1.4 0.8 2200 1400
2017—200 MWMaryland 650 1.47 4.6 0.6 1.9 460 1400
2017—300 MWMaryland 970 1.45 3.0 0.6 1.2 610 1300
2017—400 MWMaryland 1300 1.47 2.3 0.7 1.0 800 1200
5
Environ.R
es.Lett.11(2016)074019

reductions increase by a factor of 2, and benefits fromCO2 reductions increase by a factor of 2.6 (table 1).
Health and climate benefits perMWh of electricitygenerated were between $54 and $120 (table 1). Varia-bility is based on facility size, geographic location, andsimulated year (2012 versus 2017). For example, com-paring the 3000MW installation off the New Jerseycoast to the 1100MW installation, benefits per MWhincrease, largely due to a factor of 1.7 increase in SO2
emissions averted per MWh (table 2). Comparing the400MW installation off the coast of Maryland to the200MW installation, the benefits per MWh decreasefrom $120/MWh to $71/MWh (table 1), given essen-tially no reductions in SO2 and minimal reductions inNOx between the two scenarios. Benefits perMWh forthe 400MW installation off the Maryland coast arefairly similar to those of the 1000MW installation,except forNOx, which decreased by around 20%.
Coal and natural gas are the main types of genera-tion affected by each installation, and the proportionsof each fuel type displaced vary depending on location,size, and year (figure 1). For the 1000MW installationoff the coast of Maryland and the 1100MW installa-tion of the coast of New Jersey, the proportions of coalversus natural gas displaced differ by year. In both
locations, more coal is displaced in 2012 than in 2017.In 2017, the 200, 300, and 400MW installations off thecoast of Maryland displace similar amounts of coal,with natural gas being displaced as facility size increa-ses, but the amount of coal generation displaced by the1000MWfacility is substantially higher.
Comparisons in benefits across scenarios generallyfollow the trends in generation, generation mix, andemissions displaced (figure 2, table 1). For the 2012 sce-narios, the Maryland facility had slightly higher benefitsthan theNew Jersey facility did (figure 2, table 1). This islargely explained by higher proportionate displacementof coal (figure 1) and the proportionately higher impactsof the SO2 from coal plants displaced (figure 2). For2017, total benefits tended to scale with total generation,andwithdisplaced generation fromcoal.
Under all scenarios, the generation displaced is amixture of small changes distributed across manyplants, and a few plants experiencing larger displace-ments, but themixture varies among scenarios (table 3).The percentage of total generation displacement fromplants contributing less than 1% of the total generationdisplacement ranges from 22% in the 2017 scenariowith a 200MWfacility off the coast ofMaryland, to 52%in the 2012 scenario with a 1000MW facility off the
Figure 1.Generation types offset by offshore wind installation location, size, and year.
6
Environ. Res. Lett. 11 (2016) 074019

coast of Maryland. The percentage of total generationdisplacement from plants contributing over 5% of thetotal generation displacement ranges from 0% in the
2012 scenario with the 1100MW facility off the coast ofNew Jersey, to 56% in the 2017 scenario with the200MW facility off the coast of Maryland. The larger
Figure 2.Monetized public health and climate benefits of different offshore wind scenarios, by impact type and fuel type.
Table 3.Total percentage of annual displaced generation coming fromplants contributing less than 1%ormore than 5%of the totalgeneration displaced by each installed facility, for each offshore wind scenario.
Scenario
Percentage of total displaced generation coming from
plants contributing less than 1% to total displaced
generation
Percentage of total displaced generation coming from
plants contributingmore than 5% to total displaced
generation
New Jersey—2012
1100 MW
43 0
New Jersey—2017
1100 MW
39 7.4
New Jersey—2017
3000 MW
35 5.5
Maryland—2012
1000 MW
52 29
Maryland—2017
1000 MW
36 16
Maryland—2017
200 MW
22 56
Maryland—2017
300 MW
27 46
Maryland—2017
400 MW
40 21
7
Environ. Res. Lett. 11 (2016) 074019
facilities tended to have a higher proportion of genera-tion displacement coming from smaller displacementsdistributed acrossmany sources.
Discussion
There was substantial variability among the totalbenefits and the benefits per unit generation ofdifferent offshore wind facilities simulated in Mary-land and New Jersey. Notably, total benefits per unitgeneration varied among facilities in the same locationwith the same physical attributes, where the onlydifferences were related to generation capacity. Thisindicates that the relationship between total benefitsand generation is not linear, an assumption that isoften implicitly made inmodels that provide estimatesof health benefits per unit generation. This can beexplained by facilities with different capacities displa-cing varying proportions of coal and natural gas, andconsequently, differing proportions of benefits com-ing from each displaced emission type.
The 2017 results in particular illustrate some inter-esting dynamics in the relationship between benefitsand the generation capacity of a facility. The 200, 300,and 400MW facilities in Maryland all displaceapproximately the same amount of coal, with most ofthe change in fuel displaced coming from natural gas(figure 1). The generation displacement also comesfrom a fairly high proportion of large individual con-tributors (table 3). However, the 1000MW Marylandfacility displaces proportionatelymuchmore coal thanthe 400MW facility, and a lower proportion fromplants contributing over 5% to the total displaced gen-eration (figure 1, table 3). This may indicate a ‘thresh-old’ effect, where the smaller offshore wind facilitiescan displace one coal generating source (or sources),and the 1000MW facility is able to displace a larger setof sources, with little space in between. This could bedue to the additional generation of the 1000MW facil-ity, making a coal-fired power plant (or set) no longereconomical to commit to generate in the day aheadunit-commitment, whereas it was economical to com-mit the day ahead with the 400MW facility in place.Because coal plants in particular are constrained byrelatively high minimum operating levels and longstart-up times, additional generation may need tomeet some threshold value to push an older fossil fuelunit entirely offline in the day-ahead scheduling doneby system operators. Similarly, comparing the twofacilities in New Jersey, the 3000MW facility displacesproportionately less coal than the 1100MW facility(figure 1), mostly from small contributors (table 3).However, the benefits perMWhof the 3000MW facil-ity are higher than the 1100MW facility, largely froman increase in benefits from displaced SO2 per MWh.This is explained by the 3000MW facility displacing
much more SO2 per MWh, indicating that the largerfacility displaces coal generation with higher SO2
emissions that the smaller facility does not displace.Our benefits perMWh estimates for offshore wind
are fairly similar to those previously found for onshorewind in the Eastern US along with baseload DSM andsolar PV (Buonocore et al 2015, table 1). The amountof variability among different sizes of offshore windfacilities is similar to the amount of variability amongdifferent locations of baseload DSM, onshore wind,and solar PV on the same power grid region. The dif-ferences in total benefits and benefits per MWh pro-vide further reinforcement for the idea that thelocation of a renewable energy installation is animportant determining factor for total benefits, andthat the location with the highest generation may notnecessarily be the one with the highest benefits (Siler-evans et al 2013, Buonocore et al 2015). Our resultsadd an additional important complexity—benefitsmay not linearly scale with the generation capacity ofthe facility, so relative benefits between different loca-tions or installation types may vary if different facilitysizes are compared.
Even though our modeling framework includeselectrical grid dynamics and power plant specific emis-sions and impacts, it has some limitations. Our model-ing framework only includes SO2, NOx, and CO2
emissions from power plants, and does not includeemissions of primary PM2.5, mercury, carbon mon-oxide, methane, nitrous oxide, and other compounds.However, the three substances we did include tend todominate estimates of impact of fossil fuels and benefitsof renewable energy installations (Epstein et al 2011,Siler-evans et al 2013, Buonocore et al 2015). Our mod-eling framework does not account for possible seasonalor temporal differences in impact per ton emitted orpossible differences in emissions due to power plantscycling up and down due to higher electrical load varia-bility.However, these are not likely to substantially affectour estimates (Katzenstein and Apt 2009, Weberet al 2009, 2010, Valentino et al 2012, Plachinskiet al 2014). Our model also does not take into accountfull life cycle impacts of the displaced fuels, includinghealth impacts of coal mining and waste disposal, orpossiblemethane leaks and health impacts related to theextraction of unconventional natural gas (Epsteinet al 2011, Adgate et al 2014, Brandt et al 2014). Ourchoice of values for the social cost of carbon likely alsorepresents a lower bound on the impacts due to climatechange (Arrow et al 2013, Moore and Diaz 2015), how-ever the implications of higher social costs of carbon canbe explored by linearly scaling. Additionally, our modelmakes parametric choices for the concentration-response function relating PM2.5 exposure and mortal-ity, and also for the VSL, which have uncertainties(Dockins et al 2004, Roman et al 2008, Buonocoreet al 2014). As for the social cost of carbon, the
8
Environ. Res. Lett. 11 (2016) 074019
implications of alternative values for these parameterscan be explored by linearly scaling, and formal uncer-tainty analysis around these key parameters could beconducted, although this would not change our centralconclusions regarding the magnitude of variabilityacross offshorewindmodel scenarios. Finally, our quan-titative estimates are dependent on the base year selectedand the corresponding fuel prices and regulatory scenar-ios, and may change if future offshore wind patterns aresubstantially different from those used as inputs here.
Despite these limitations, our work provides someuseful additions to the understanding of the health andclimate benefits of renewable energy. Our work is thefirst—to our knowledge—assessment of the health andclimate benefits of offshore wind, and demonstratesthat offshore wind can have benefits to climate andhealth that are similar to onshore wind. We show thatlike onshore wind, offshore wind is also capable of dis-placing coal given current fuel prices, which tends toincrease total benefits (Buonocore et al 2015), althoughpatterns of displacementmay differ since offshore windresource in this region tends to bemore coincident withpeak loads (Dvorak et al 2013). Also, like onshore wind,we show that offshore wind has total health and climatebenefits fairly similar to its market cost, using a value ofthe social cost of carbon that is likely an underestimate.Another way of describing that is that the entire cost ofan offshore wind facility would be justified in the healthand carbon benefits, before considering the value ofselling the electricity. For all offshore wind scenarios,the health benefits are between $25 and $83 per MWh,climate benefits are between $28 and $38 perMWh, andtotal benefits are between $54 and $120 per MWh. Forcomparison, the US Department of Energy andNational Renewable Energy Laboratory estimate thatthe levelized cost of offshore wind is between $100 and$200perMWh (USDepartment of Energy 2016).Whilea comprehensive energy choice model would need tocompare the costs and benefits with correspondingvalues for other technologies, these estimates reinforcethe importance of including health and climate benefits.Additionally, our work demonstrates that the relation-ship between facility size and total benefits is not linear.This again illustrates the complex, nonlinear nature ofthe electrical grid, and the importance of site-specificand facility-specific modeling exercises (Siler-evanset al2013, Buonocore et al2015).
This study, and others like it which analyze healthand climate benefits of EE/RE projects, are also usefulin the context of life cycle assessments (LCA) of elec-tricity generation. Standard attributional LCAs areable to calculate impacts of energy sources, compareimpacts of different fuel sources or fuel mixes, andexamine sensitivity to key parameters (Weinzettelet al 2009, Earles and Halog 2011, Dolan andHeath 2012). However, analyses such as the one pre-sented here are able to put these comparisons into a
more consequential LCA framework, which is able toaccount for environmental impacts, and also the bene-fits that occur through economic interactions (Earlesand Halog 2011), and do so including time- and loca-tion-specific parameters. This level of detail is impor-tant for making accurate assessments of benefits,doing comparisons fairly and accurately, and can feedinto project-specific consequential LCAs.
This paper further reinforces that renewableenergy can have benefits to climate by reducing GHGemissions, and to public health by reducing air pollu-tant emissions from fossil-fueled power plants andimproving air quality. Including both climate andhealth benefits is important since it may be a usefullever for policy. Climate change has been called oneof the greatest public health opportunities of the 21stcentury, since methods to mitigate climate changegenerally carry co-benefits to health (Wattset al 2015). Since these co-benefits are often local andnear-term, they can carry a lot of weight in policy andother decision-making (Driscoll et al 2015, Wattset al 2015). Therefore, using methods to estimatehealth benefits of climate mitigation measures allowspublic health be included in decision-making aroundclimate mitigation, and may provide additionalencouragement for climatemitigation.
Acknowledgments
This work was supported by a grant from The HeinzEndowments (Grant number C2988), the Charles FWilinsky award at Harvard THChan School of PublicHealth, and funds from the Mark and CatherineWinkler Foundation. The offshore wind analysis usedwind analysis from Sailor’s Energy, supported by DOEgrant DE-EE0005366 (WKempton, PI). This researchis dedicated to thememory ofDr Paul R Epstein.
References
Adgate J L,GoldsteinBDandMckenzieLM2014Potential publichealth hazards, exposures andhealth effects fromunconventional natural gas developmentEnviron. Sci. Technol.48 8307–20
ArrowK J, CropperM,Gollier C, GroomB,Heal G,Newell R andNordhausW2013Determining benefits and costs for futuregenerations Science 341 349–50
Brandt AR et al 2014Methane leaks fromNorthAmerican naturalgas systems Science 343 733–5
BrownN J, AllenDT, Amar P, KallosG,McNider R,Russell AG and StockwellWR2011 Final Report: Fourth PeerReview of the CMAQModelCommunityModeling andAnalysis SystemCenter, Carolina Environmental Program,TheUniversity ofNorthCarolina at ChapelHill (https://cfpub.epa.gov/si/si_public_file_download.cfm?p_download_id=525232)
BudischakC, Sewell D, ThomsonH,MacHL, VeronDE andKemptonW2013Cost-minimized combinations of windpower, solar power and electrochemical storage, poweringthe grid up to 99.9%of the time J. Power Sources 225 60–74
9
Environ. Res. Lett. 11 (2016) 074019

Buonocore J J, DongX, Spengler J D, Fu J S and Levy J I 2014UsingtheCommunityMultiscale AirQuality (CMAQ)model toestimate public health impacts of PM2.5 from individualpower plants Environ. Int. 68 200–8
Buonocore J J, LuckowP,Norris G, Spengler J D, Biewald B,Fisher J and Levy J I 2015Health and climate benefits ofdifferent energy-efficiency and renewable energy choicesNat.Clim. Change 6 100–5
ByunDWandChing J K S 1999 Science Algorithms of the EPAModels-3 CommunityMultiscale AirQuality (CMAQ)Modeling SystemAtmosphericModelingDivision,NationalExposure Research Laboratory, U.S. EnvironmentalProtectionAgency, EPA/600/R-99/030 (https://cfpub.epa.gov/si/si_public_file_download.cfm?p_download_id=524687)
Dockins C,Maguire K, SimonNand SullivanM2004Value ofStatistical Life Analysis and Environmental Policy: AWhitePaperUSEnviron. Prot. AgencyNatl. Cent. Environ. Econ.(https://yosemite.epa.gov/ee/epa/eerm.nsf/vwan/ee-0483-01.pdf/$file/ee-0483-01.pdf)
Dolan S L andHeathGA2012 Life cycle greenhouse gas emissionsof utility-scale wind power J. Ind. Ecol. 16 S136–54
DriscollCT,Buonocore J J, Levy J I, LambertKF,BurtrawD,Reid SB,FakhraeiHandSchwartz J 2015USpowerplant carbonstandards and clean air andhealth co-benefitsNat.Clim.Change5535–40
DvorakM J, CorcoranBA, TenHoeve J E,McIntyreNG andJacobsonMZ2013US East Coast offshorewind energyresources and their relationship to peak-time electricitydemandWind Energy 16 977–97
Earles JMandHalog A 2011Consequential life cycle assessment: areview Int. J. Life Cycle Assess. 16 445–53
Epstein PR et al 2011 Full cost accounting for the life cycle of coalAnn.NewYork Acad. Sci. 1219 73–98
FannN, Fulcher CMandHubbell B J 2009The influence oflocation, source, and emission type in estimates of the humanhealth benefits of reducing a ton of air pollutionAirQual.Atmos. Health 2 169–76
Gilmore EA, Apt J,Walawalkar R, Adams P J and Lave L B 2010Theair quality and humanhealth effects of integrating utility-scale batteries into theNewYork State electricity grid J. PowerSources 195 2405–13
Gilmore EA, Lave L B andAdams P J 2006The costs, air quality, andhumanhealth effects ofmeeting peak electricity demandwithinstalled backup generators Environ. Sci. Technol.40 6887–93
Haines A et al 2009 Public health benefits of strategies to reducegreenhouse-gas emissions: overview and implications forpolicymakers Lancet 374 2104–14
International EnergyAgency 2013Technology roadmap—Windenergy (http://iea.org/publications/freepublications/publication/Wind_2013_Roadmap.pdf)
IPCC2014Climate Change 2014: Synthesis Report. Contribution ofWorkingGroups I, II and III to the Fifth Assessment Report ofthe Intergovernmental Panel on Climate Change edRKPachauri and LAMeyer (Geneva, Switzerland: IPCC) p151 (www.ipcc.ch/pdf/assessment-report/ar5/syr/AR5_SYR_FINAL_SPM.pdf)
Jaramillo P,GriffinWMandMatthewsHS2007Comparative life-cycle air emissions of coal, domestic natural gas, LNG, and SNGfor electricity generationEnviron. Sci.Technol.41 6290–6
Jonkman J, Butterfield S,MusialWand Scott G 2009Definition of a5-MWReferenceWind Turbine forOffshore SystemDevelopment (http://tethys-development.pnnl.gov/sites/default/files/publications/Jonkman_<italic>et al</
italic>_2009.pdf)KatzensteinWandApt J 2009Air emissions due towind and solar
powerEnviron. Sci. Technol. 43 253–8Lelieveld J, Evans J S, FnaisM,Giannadaki D and Pozzer A 2015The
contribution of outdoor air pollution sources to prematuremortality on a global scaleNature 525 367–71
LopezA, Roberts B,Heimiller D, Blair N andPorroG2012USRenewable Energy Technical Potentials: AGIS-Based Analysis
Natl. Renew. Energy Lab.Doc., NREL/TP-6A20-51946(http://nrel.gov/docs/fy12osti/51946.pdf)
Markandya A, Armstrong BG,Hales S, Chiabai A, Criqui P,Mima S, TonneC andWilkinson P 2009 Public healthbenefits of strategies to reduce greenhouse-gas emissions:low-carbon electricity generation Lancet 374 2006–15
Moore FC andDiazDB2015Temperature impacts on economicgrowthwarrant stringentmitigation policyNat. Clim. Change5 127–32
MusialWandRamB2010Large-ScaleOffshoreWindPower in theUnited States (http://nrel.gov/wind/pdfs/40745.pdf)
Myers S S et al 2014 IncreasingCO2 threatens human nutritionNature 510 139–42
Plachinski SD,Holloway T,Meier P J, NemetG F, Rrushaj A,Oberman J T,Duran P L andVoigt C L 2014Quantifying theemissions and air quality co-benefits of lower-carbonelectricity productionAtmos. Environ. 94 180–91
RomanHA,Walker KD,Walsh T L, Conner L, RichmondHM,Hubbell B J andKinney P L 2008 Expert judgment assessmentof themortality impact of changes in ambientfine particulatematter in theUS Environ. Sci. Technol. 42 2268–74
Roy B,Mathur R, GillilandAB andHoward SC 2007A comparisonof CMAQ-based aerosol properties with IMPROVE,MODIS,andAERONETdata J. Geophys. Res. 112D14301
Siler-evansK, Lima I,MorganMGandApt J 2013Regionalvariations in the health, environmental, and climate benefitsof wind and solar generation Proc. Natl Acad. Sci. USA 11011768–73
ThompsonT,WebberMandAllenDT2009Air quality impacts ofusing overnight electricity generation to charge plug-inhybrid electric vehicles for daytime use Environ. Res. Lett. 414002
ThompsonTM,KingCW,AllenDT andWebberME2011Airquality impacts of plug-in hybrid electric vehicles in texas:evaluating three battery charging scenarios Environ. Res. Lett.6 24004
USBureau ofOffshore EnergyManagement 2015aCommercialWind LeasingOffshoreMassachusetts (http://boem.gov/Commercial-Wind-Leasing-Offshore-Massachusetts/)
USBureau ofOffshore EnergyManagement 2015bDelawareActivities (http://boem.gov/Maryland/)
USBureau ofOffshore EnergyManagement 2015cMarylandActivities (http://boem.gov/Maryland/)
USBureau ofOffshore EnergyManagement 2015dNew JerseyActivities (http://boem.gov/New-Jersey/)
USDepartment of Energy 2016 Energy Information, Data, andother ResourcesOpenEI (http://en.openei.org/wiki/Main_Page)
USEnergy InformationAdministration 2015 First offshorewindfarm in theUnited States begins constructionToday in Energy(http://eia.gov/todayinenergy/detail.cfm?id=22512)
USGovt. 2013Technical Update of the Social Cost of Carbon forRegulatory Impact Analysis Under ExecutiveOrder 12866 1–21
Valentino L, Valenzuela V, BotterudA, ZhouZ andConzelmannG2012 System-wide emissions implications of increasedwindpower penetration Environ. Sci. Technol. 46 4200–6
Ventyx/ABB 2012Market AnalyticsModule, EPMSimulation-ReadyData Release 9.4.0 (http://new.abb.com/enterprise-software/energy-portfolio-management/market-analysis/zonal-analysis)
von StackelbergK,Buonocore J, BhavePVand Schwartz JA 2013Public health impacts of secondary particulate formation fromaromatichydrocarbons in gasolineEnviron.Health 1219
WattsN et al 2015Health and climate change: policy responses toprotect public health Lancet 386 1861–914
WeberC L, Jaramillo P,Marriott J and Samaras C 2009Uncertaintyand variability in accounting for grid electricity in life cycleassessment 2009 IEEE Int. Symp. on Sustainable SystemsTechnology , ISSST ’09 pp 1–8 (http://ieeexplore.ieee.org/xpl/articleDetails.jsp?tp=&arnumber=5156776&matchBoolean%3Dtrue%26rowsPerPage%3D30%26searchField%3DSearch_All%26queryText%3D%28%22life+cycle%22+AND+electricity%29)
10
Environ. Res. Lett. 11 (2016) 074019

WeberC L, Jaramillo P,Marriott J and Samaras C 2010 Life cycleassessment and grid electricity:What dowe know andwhatcanwe know? Environ. Sci. Technol. 44 1895–901
Weinzettel J, ReenaasM, Solli C andHertwich EG2009 Life cycleassessment of a floating offshore wind turbineRenew. Energy34 742–7
Wiser R et al 2016 ARetrospective Analysis of the Benefits andImpacts of USRenewable Portfolio Standards ARetrospectiveAnalysis of the Benefits and Impacts of USRenewablePortfolio Standards (http://nrel.gov/docs/fy16osti/65005.pdf)
11
Environ. Res. Lett. 11 (2016) 074019
Related Documents