Welcome message from author
This document is posted to help you gain knowledge. Please leave a comment to let me know what you think about it! Share it to your friends and learn new things together.
Transcript


Head Start Impact Study
Final Report Executive Summary
January 2010
Prepared for:
Office of Planning, Research and Evaluation Administration for Children and Families
U.S. Department of Health and Human Services Washington, D.C.
under contract 282-00-0022, Head Start Impact Study
Prepared by:
Westat 1600 Research Blvd. Rockville, MD 20850
Chesapeake Research Associates Abt Associates 708 Riverview Terrace 4550 Montgomery Avenue Annapolis, MD 21401 Bethesda, MD 20814 Ronna Cook Associates The Urban Institute 5912 Rossmore Drive 2100 M Street, N.W. Bethesda, MD 20814 Washington, DC 20037 American Institutes for Research Decision Information Resources, Inc. 1000 Thomas Jefferson Street, N.W. 2600 Southwest Freeway, Suite 900 Washington, DC 20007 Houston, TX 77098


Head Start Impact Study Final Report
Executive Summary
Authors
Prepared by:
Michael Puma Stephen Bell Ronna Cook Camilla Heid
Contributing Authors:
Gary Shapiro Pam Broene Frank Jenkins Philip Fletcher Liz Quinn Janet Friedman Janet Ciarico Monica Rohacek Gina Adams Elizabeth Spier
Suggested Citation:
U.S. Department of Health and Human Services, Administration for Children and Families (January 2010). Head Start Impact Study. Final Report. Washington, DC. Disclaimer The Office of Planning, Research and Evaluation, Administration for Children and Families at the U.S. Department of Health and Human Services contracted with Westat to conduct the Head Start Impact Study. The views expressed in this report are those of the authors and they do not necessarily represent the opinions and positions of the Office of Planning, Research and Evaluation, Administration for Children and Families or the U.S. Department of Health and Human Services.


Acknowledgements
This report of the Head Start Impact Study is the result of several years of design, data collection, and analysis. We gratefully acknowledge the contributions and dedication of individuals and organizations in the preparation and production of this report. A special thanks to Dr. Jennifer Brooks, the Federal Project Officer, for her expert leadership and vision.
There were those who were worried that random assignment and subsequent data
collection efforts would be difficult, if not impossible to implement. Study staff have done a tremendous job in meeting these challenges to ensure the success of the study. Moreover, the partnership and support from the National Head Start Association, Head Start Grantees and Delegate Agencies and their center staff, as well as the study children’s elementary schools and their staff were instrumental in the successful implementation of this study. The ongoing backing of the Head Start Bureau and Regional Office staff was critical to the recruitment process. A special thank you is extended to all the families and their children who participated in the study. Their continued contributions of time and information during the data collection years have been exceptional and greatly appreciated.
We also want to thank the many external experts who helped us along the way,
particularly the members of the Advisory Committee on Head Start Research and Evaluation. Your wisdom about sample design, measures, program, policy, and analytic challenges has helped formulate the design and analysis presented in the report.
Finally, we gratefully acknowledge the staff from Westat, Chesapeake Research
Associates, Abt Associates, Ronna Cook Associates, Urban Institute, and American Institutes for Research for their hard work, professionalism and dedication to the project. We also wish to thank Decision Information Resources, Inc for their assistance in the data collection.


i
Study Goals
1) Determine the impact of Head Start on:
Children’s school readiness, and Parental practices that support
children’s development.
2) Determine under what circumstances Head Start achieves its greatest impact and for which children.
Head Start Impact Study Executive Summary
Overall Summary Introduction
Since its beginning in 1965 as a part of the War on Poverty, Head Start’s goal has been to boost the school readiness of low-income children. Based on a “whole child” model, the program provides comprehensive services that include preschool education; medical, dental, and mental health care; nutrition services; and efforts to help parents foster their child’s development. Head Start services are designed to be responsive to each child’s and family’s ethnic, cultural, and linguistic heritage.
In the 1998 reauthorization of Head Start, Congress mandated that the US Department of Health and Human Services (DHHS) determine, on a national level, the impact of Head Start on the children it serves. As noted by the Advisory Committee on Head Start Research, this legislative mandate required that the impact study address two main research questions:1
“What difference does Head Start make to key outcomes of development and learning
(and in particular, the multiple domains of school readiness) for low-income children? What difference does Head Start make to parental practices that contribute to children’s school readiness?”
“Under what circumstances does Head Start achieve the greatest impact? What works for which children? What Head Start services are most related to impact?”
This report addresses these questions by reporting on the impacts of Head Start on children and families during the children’s preschool, kindergarten, and 1st grade years.
The Head Start Impact Study was conducted with a nationally representative sample of 84 grantee/delegate agencies and included nearly 5,000 newly entering, eligible 3- and 4-year-old children who were randomly assigned to either: (1) a Head Start group that had access to Head Start program services or (2) a control group that did not have access to Head Start, but could enroll in other early childhood programs or non-Head Start services selected by their parents. Data collection began in fall 2002 and continued through 2006, following children from program application through the spring of their 1st grade year.2
1 Advisory Committee on Head Start Research and Evaluation (1999). Evaluating Head Start: A Recommended
Framework for Studying the Impact of the Head Start Program. Washington, DC: US Department of Health and Human Services.
2 The study design allowed 3-year-old cohort control group children to reapply to Head Start after the first year.

ii
The study was designed to separately examine two cohorts of children, newly entering 3-and 4-year-olds. This design reflects the hypothesis that different program impacts may be associated with different age of entry into Head Start. Differential impacts are of particular interest in light of a trend of increased enrollment of the 3-year-olds in some grantee/delegate agencies presumably due to the growing availability of preschool options for 4-year-olds. Consequently, the study included two separate samples: a newly entering 3-year-old group (to be studied through two years of Head Start participation i.e., Head Start year and age 4 year, kindergarten and 1st grade), and a newly entering 4-year-old group (to be studied through one year of Head Start participation, kindergarten and 1st grade).
The study showed that the two age cohorts varied in demographic characteristics, making it even more appropriate to examine them separately. The racial/ethnic characteristics of newly entering children in the 3-year-old cohort were substantially different from the characteristics of children in the newly entering 4-year-old cohort. While the newly entering 3-year-olds were relatively evenly distributed between Black children and Hispanic children (Black children 32.8%, Hispanic children 37.4%, and White/other children 29.8%), about half of newly entering 4-year-olds were Hispanic children (Black children 17.5%, Hispanic children 51.6%, and White/other children 30.8%). The ethnic difference is also reflected in the age-group differences in child and parent language.
This study is unique in its design and differs from prior evaluations of early childhood programs:
Randomized Control. The Congressional mandate for this study had a clearly stated goal of producing causal findings, i.e., the purpose was to determine if access to Head Start caused better developmental and parenting outcomes for participating children and families. To do this, the study randomly assigned Head Start applicants either to a Head Start group that was allowed to enroll, or to a “control” group that could not. This procedure ensured comparability between the two groups at program entry, so that later differences can be causally attributed to Head Start.
Representative Sample of Programs and Children. Most random assignment studies are conducted in small demonstration programs or in a small number of operating sites, usually those that volunteer to be included in the research. In contrast, the Head Start Impact Study is based on a nationally representative sample of Head Start programs and children. This makes the study results generalizable to the full national program not just the selected study sample. Unlike most studies, it examines the average impact of programs that represent the full range of intensity and quality (i.e., the best, the worst, and those in the middle of a fully implemented program) and adherence to the established Head Start program standards.
Examination of a Comprehensive Set of Outcomes Over Time. The study quantifies the overall impact of Head Start separately for 3- and 4-year-old children in four key program domains—cognitive development, social-emotional development, health status and services, and parenting practices. These impacts are quantified by examining the difference in outcomes between children assigned to the Head Start group and those assigned to the control group.

iii
Other study features that must be considered in interpreting the study findings:
Control Group Children Did Not All Stay at Home. Children who were placed in the control or comparison group were allowed to enroll in other non-parental care or non-Head Start child care or programs selected by their parents. They could remain at home in parent care, or enroll in a child care or preschool program. Consequently, the impact of Head Start was determined by a comparison to a mixture of alternative care settings rather than against a situation in which children were artificially prevented from obtaining child care or early education programs outside of their home. Approximately 60 percent of the control group children participated in child care or early education programs during the first year of the study, with 13.8 percent of the 4-year-olds in the control group and 17.8 percent of the 3-year-olds in the control group finding their way into Head Start during this year. Preventing families from seeking out alternative care or programs for their children is both infeasible and unethical. The design used here answers the policy question, i.e., how well does Head Start do when compared against what else low income children could receive in the absence of the program in fall 2002.
Impacts Represent the Effects of One Year of Head Start. For children in the 4-year-old cohort, the study provides the impact of Head Start for a single year, i.e., the year before they are eligible to enter kindergarten. The impacts for the 3-year-old cohort reflect the benefits of being provided an earlier year of Head Start. At the end of one year of Head Start participation, the 3-year-old cohort—but not the 4-year-old cohort—had another year to go before they started kindergarten. It was not feasible or reasonable to prevent 3-year-olds from participating in Head Start for two years. Thus, the study could not directly assess the receipt of one year versus two years of Head Start. Rather, it addresses the receipt of an earlier year—whether having Head Start available at age three is helpful to children brought to the program at that age, or whether those children would be just as well off, if the program did not enroll them until age four.3
The Head Start Impact Study is a comprehensive, well-designed study of a large-scale early childhood program that has existed for more than 40 years. It is designed to address the overall average impact of the program. The findings cannot be directly compared to more narrowly focused studies of other early childhood programs. The Advisory Committee on Head
This is not only important to individual families; it also answers an important policy question. To answer this question, the best approach is to preclude program entry at age three while allowing it at age four and contrast outcomes after that point with statistically equivalent children never excluded from the program. Therefore, the research design for the 3-year-old cohort only varied the first year of Head Start participation. Hence, impacts for the 3-year-old cohort reflect the benefits of being provided an earlier year of Head Start, rather than the effects of being provided two years of Head Start. By design, the study did not attempt to control children’s experiences after they received this Head Start year.
3 It was not feasible or reasonable to prevent 3-year-olds from participating in Head Start for two years. Thus, the
study does not directly assess the receipt of one-year versus two years of Head Start. It addresses the receipt of an earlier year.

iv
Start Research and Evaluation, who developed the blueprint for this study, recommended that “the research and findings should be used in combination with the rest of the Head Start research effort to improve the effectiveness of Head Start programs for children and families” (Advisory Committee on Head Start Research and Evaluation, 1999, p. 44).
Key Findings
The key findings are presented below. First, we present findings related to the primary questions about the average effect of Head Start as a whole. Next we present findings about subgroups of children. As described later in this summary, the subgroup findings should be viewed as secondary and exploratory as compared to the main impact findings that are considered primary as well as confirmatory.
Confirmatory Impact Findings
Providing access to Head Start has a positive impact on children’s preschool experiences. There are statistically significant differences between the Head Start group and the control group on every measure of children’s preschool experiences measured in this study.
Access to Head Start has positive impacts on several aspects of children’s school readiness during their time in the program.
o For the 4-year-old group, benefits at the end of the Head Start year were concentrated in language and literacy elements of the cognitive domain, including impacts on vocabulary (PPVT), letter-word identification, spelling, pre-academic skills, color identification, letter naming, and parent-reported emergent literacy. There was also an impact on access to dental care in the health domain.
o For the 3-year-old group, benefits were found in all four domains examined at the end of the Head Start and age 4 years, including impacts on vocabulary (PPVT), letter-word identification, pre-academic skills, letter naming, elision (phonological processing), parent-reported emergent literacy, McCarthy Draw-a-Design (perceptual motor skills and pre-writing), applied problems (math), hyperactive behavior, withdrawn behavior, dental care, health status, parent spanking, parent reading to child, and family cultural enrichment activities.
However, the advantages children gained during their Head Start and age 4 years yielded only a few statistically significant differences in outcomes at the end of 1st grade for the sample as a whole. Impacts at the end of kindergarten were scattered and are mentioned below only when they appear to be related to the 1st grade impacts.
o Cognitive Outcomes. By the end of 1st grade, only a single cognitive impact was found for each cohort. Head Start group children did significantly better on the PPVT (a vocabulary measure) for 4-year-olds and on the Woodcock-Johnson III test of Oral Comprehension for the 3-year-olds.
o Social-Emotional Outcomes. By the end of 1st grade, there was some evidence that the 3-year-old cohort had closer and more positive relationships with their parents. These impacts were preceded by other social-emotional impacts (improvements in behavior-hyperactive behavior and total problem behavior, and social skills and positive approaches to learning) in the earlier years. The findings
v
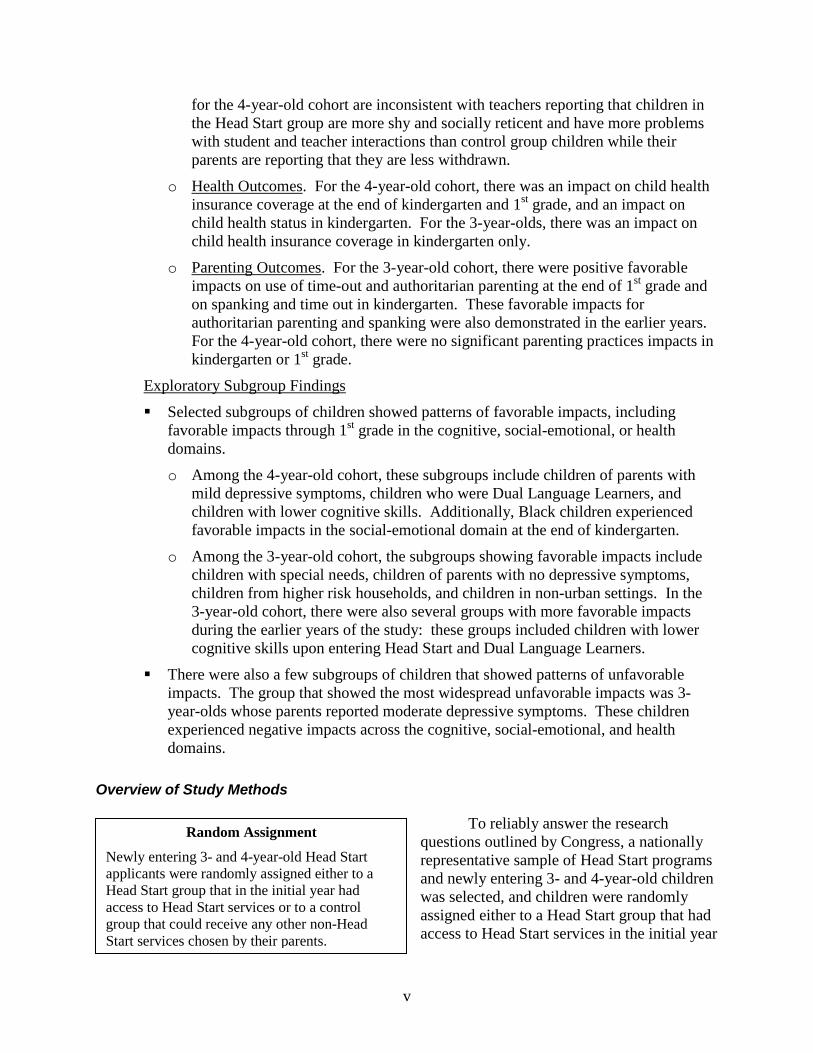
Random Assignment
Newly entering 3- and 4-year-old Head Start applicants were randomly assigned either to a Head Start group that in the initial year had access to Head Start services or to a control group that could receive any other non-Head Start services chosen by their parents.
for the 4-year-old cohort are inconsistent with teachers reporting that children in the Head Start group are more shy and socially reticent and have more problems with student and teacher interactions than control group children while their parents are reporting that they are less withdrawn.
o Health Outcomes. For the 4-year-old cohort, there was an impact on child health insurance coverage at the end of kindergarten and 1st grade, and an impact on child health status in kindergarten. For the 3-year-olds, there was an impact on child health insurance coverage in kindergarten only.
o Parenting Outcomes. For the 3-year-old cohort, there were positive favorable impacts on use of time-out and authoritarian parenting at the end of 1st grade and on spanking and time out in kindergarten. These favorable impacts for authoritarian parenting and spanking were also demonstrated in the earlier years. For the 4-year-old cohort, there were no significant parenting practices impacts in kindergarten or 1st grade.
Exploratory Subgroup Findings
Selected subgroups of children showed patterns of favorable impacts, including favorable impacts through 1st grade in the cognitive, social-emotional, or health domains.
o Among the 4-year-old cohort, these subgroups include children of parents with mild depressive symptoms, children who were Dual Language Learners, and children with lower cognitive skills. Additionally, Black children experienced favorable impacts in the social-emotional domain at the end of kindergarten.
o Among the 3-year-old cohort, the subgroups showing favorable impacts include children with special needs, children of parents with no depressive symptoms, children from higher risk households, and children in non-urban settings. In the 3-year-old cohort, there were also several groups with more favorable impacts during the earlier years of the study: these groups included children with lower cognitive skills upon entering Head Start and Dual Language Learners.
There were also a few subgroups of children that showed patterns of unfavorable impacts. The group that showed the most widespread unfavorable impacts was 3-year-olds whose parents reported moderate depressive symptoms. These children experienced negative impacts across the cognitive, social-emotional, and health domains.
Overview of Study Methods
To reliably answer the research questions outlined by Congress, a nationally representative sample of Head Start programs and newly entering 3- and 4-year-old children was selected, and children were randomly assigned either to a Head Start group that had access to Head Start services in the initial year
vi
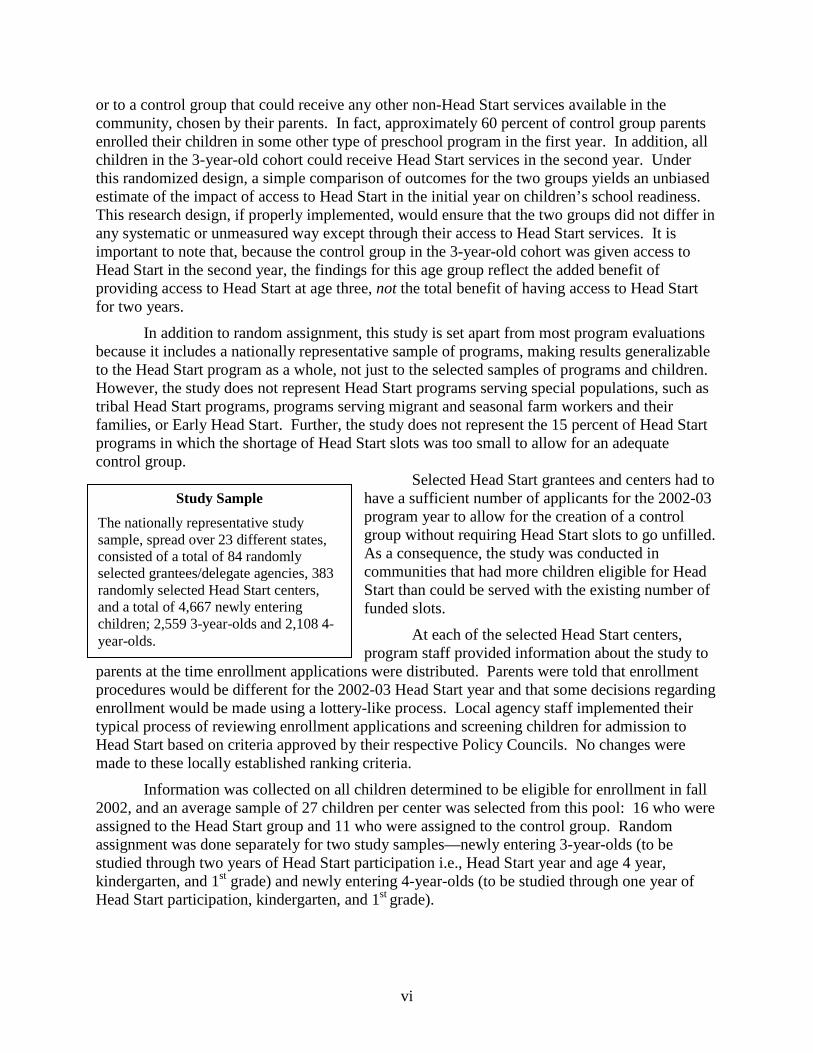
Study Sample
The nationally representative study sample, spread over 23 different states, consisted of a total of 84 randomly selected grantees/delegate agencies, 383 randomly selected Head Start centers, and a total of 4,667 newly entering children; 2,559 3-year-olds and 2,108 4-year-olds.
or to a control group that could receive any other non-Head Start services available in the community, chosen by their parents. In fact, approximately 60 percent of control group parents enrolled their children in some other type of preschool program in the first year. In addition, all children in the 3-year-old cohort could receive Head Start services in the second year. Under this randomized design, a simple comparison of outcomes for the two groups yields an unbiased estimate of the impact of access to Head Start in the initial year on children’s school readiness. This research design, if properly implemented, would ensure that the two groups did not differ in any systematic or unmeasured way except through their access to Head Start services. It is important to note that, because the control group in the 3-year-old cohort was given access to Head Start in the second year, the findings for this age group reflect the added benefit of providing access to Head Start at age three, not the total benefit of having access to Head Start for two years.
In addition to random assignment, this study is set apart from most program evaluations because it includes a nationally representative sample of programs, making results generalizable to the Head Start program as a whole, not just to the selected samples of programs and children. However, the study does not represent Head Start programs serving special populations, such as tribal Head Start programs, programs serving migrant and seasonal farm workers and their families, or Early Head Start. Further, the study does not represent the 15 percent of Head Start programs in which the shortage of Head Start slots was too small to allow for an adequate control group.
Selected Head Start grantees and centers had to have a sufficient number of applicants for the 2002-03 program year to allow for the creation of a control group without requiring Head Start slots to go unfilled. As a consequence, the study was conducted in communities that had more children eligible for Head Start than could be served with the existing number of funded slots.
At each of the selected Head Start centers, program staff provided information about the study to
parents at the time enrollment applications were distributed. Parents were told that enrollment procedures would be different for the 2002-03 Head Start year and that some decisions regarding enrollment would be made using a lottery-like process. Local agency staff implemented their typical process of reviewing enrollment applications and screening children for admission to Head Start based on criteria approved by their respective Policy Councils. No changes were made to these locally established ranking criteria.
Information was collected on all children determined to be eligible for enrollment in fall 2002, and an average sample of 27 children per center was selected from this pool: 16 who were assigned to the Head Start group and 11 who were assigned to the control group. Random assignment was done separately for two study samples—newly entering 3-year-olds (to be studied through two years of Head Start participation i.e., Head Start year and age 4 year, kindergarten, and 1st grade) and newly entering 4-year-olds (to be studied through one year of Head Start participation, kindergarten, and 1st grade).
vii
The total sample, spread over 23 different states, consisted of 84 randomly selected Head Start grantees/delegate agencies, 383 randomly selected Head Start centers, and a total of 4,667 newly entering children, including 2,559 in the 3-year-old group and 2,108 in the 4-year-old group.4
Data collection began in the fall of 2002 and continued through the spring of 2006, following children from entry into Head Start through the end of 1st grade. Comparable data were collected for both Head Start and control group children, including interviews with parents, direct child assessments, surveys of Head Start and non-Head Start teachers, interviews with center directors and other care providers, direct observations of the quality of various care settings, and care provider assessments of children. Response rates were consistently quite high, approximately 80 percent for parents and children throughout the study.
Although every effort was made to ensure complete compliance with random assignment, some children accepted into Head Start did not participate in the program (about 15 percent for the 3-year-old cohort and 20 percent for the 4-year-old cohort), and some children assigned to the non-Head Start group nevertheless entered the program in the first year (about 17 percent for 3-year-olds and 14 percent for 4-year-olds), typically at centers that were not in the study sample. These families are referred to as “no shows” and “crossovers.” Statistical procedures for dealing with these events are discussed in the report. Thus, the findings in this report provide estimates of both the impact of access to Head Start using the sample of all randomly assigned children and the impact of actual Head Start participation (adjusting for the no shows and crossovers).
Key Findings
Impact on Children’s Experiences
Head Start Experiences
Providing access to Head Start increases the likelihood that low-income children will be enrolled in a center-based early childhood program (including center-based Head Start, preschool, and child care). Specifically, Head Start group children5
Conversely, control group children were substantially more likely than Head Start group children to be exclusively in parent care
were twice as likely as control group children to use a center-based program in spring 2003.
6
4 The sample of 3-year-olds is slightly larger than the sample of 4-year-olds to ensure that an adequate sample size
was maintained, given the possibility of higher study attrition resulting from an additional year of longitudinal data collection for the younger children.
in spring 2003. Among children in the 3-year-old cohort, 38.4 percent of control group children were in parent care as compared to only 6.7 percent of children in the Head Start group; among children in the 4-year-old cohort, the figures were 39.7 and 9.1 percent, respectively (see Exhibit 1).
5 The Head Start group refers to children who were randomly assigned to have access to Head Start. 6 Exclusively in parent care is defined as not being in any other non-parental setting for at least five hours per week.

viii
During the second year of the study, the control group was given access to Head Start; thus the pattern of the 3-year-old cohort’s second year experiences was very different from that in their first year. At the end of the second year, about 90 percent of the Head Start group was in a center-based early childhood program (primarily Head Start, 63 percent). At this point, a comparable percentage of the control group was also in a center-based program, with about 50 percent of those children in Head Start (see Exhibit 1).
Exhibit 1: Child Care Settings Used by Head Start and Control Groups During the Head Start Year, Spring 2003, and 3-Year-Old Cohort’s Age 4 Year, Spring 2004
76.7
13.8
84.2
17.8
63.4
49.6
11.1
35.3
6.7
25.2 26.3
36.4
9.1
39.7
6.7
38.4
7.0 7.6
3.1
11.2
2.4
18.6
2.05.2
0%
10%
20%
30%
40%
50%
60%
70%
80%
90%
100%
Head StartGroup
ControlGroup
Head StartGroup
ControlGroup
Head StartGroup
ControlGroup
Perc
ent o
f chi
ldre
n by
type
of c
hild
car
e se
tting
Age 4 Year*Head Start Year
4-Year-Old Cohort 3-Year-Old Cohort 3-Year-Old Cohort
Head Start
Parent Care
Other Care Setting
Other Center-BasedCare
*For approximately 1 percent of respondents, setting type unknown.
There also was variation in the number of hours per week spent in Head Start as compared to other non-parental care for Head Start group and control group children. For those attending Head Start, the average number of hours spent per week was between 24 and 28 hours, with some variation by cohort and year. As discussed earlier, some control group children did receive Head Start services. Those control group children who found their way into Head Start experienced the same number of hours of Head Start as their program group counterparts. Non-parental care settings include Head Start, other center-based care, and home-based care. When averaging across all three types of non-parental care settings, control group children tended to be in non-parental care settings more hours per week than Head Start group children (Exhibit 2). For both the 3- and 4-year-old cohorts’ Head Start year, control group children spent four to five more hours per week in their primary non-parental care setting than Head Start group children. The number decreases to only two more hours for the 3-year-old cohort’s age 4 year.

ix
Exhibit 2: Average Hours Per Week that the 3- and 4-Year-Old Cohorts Spent in Non-Parental Care Settings
Hours Per Week
4-Year-Olds 3-Year-Olds Head
Start Year 3-Year-Olds Age 4
Year Head
Start Group
Control Group
Head Start
Group Control Group
Head Start
Group Control Group
Overall Average Across All Non-Parental Care Settings 25 29 28 33 27 29
Providing access to Head Start had a positive impact on children’s exposure to high-
quality early care and education environments. Specifically, there are statistically significant differences between the Head Start group and the control group on every aspect of children’s early care experiences measured in this study. These effects were found both for the 4-year-old cohort and for the 3-year-old cohort during the spring of the first year of study. The measures that were examined included, among others, teacher qualifications, including their training and education; classroom literacy and math instructional activities; classroom teacher-child ratios; the nature of teacher-child interactions; and global measures of the care environment as measured by the Early Childhood Environment Rating Scale-Revised (ECERS-R) and the Family Day Care Rating Scale (FDCRS) scores.7
The preschool experiences of children in the 3-year-old cohort were very different in the second preschool year. As discussed above, most of the children (both Head Start and control group) were in some type of center-based care by the second year. There were only three statistically significant differences across all the measures examined: (1) children in the Head Start group were less likely to be in a center that was affiliated with a school; (2) children in the Head Start group were more likely to have a teacher with a Child Development Associate (CDA) degree; and (3) children in the Head Start group were more likely to have hearing and vision screening referral services.
Of those 3-year-olds that attended a first year of Head Start, about 72 percent returned to Head Start for a second year. Characteristics related to an increased likelihood of returning for a second year included less competition from other early childhood programs in the area, centers with only full-day classrooms, parental satisfaction with how the center supported and respected their family’s culture and background, coming from a household in which the home language was Spanish, or having a mother who was a recent immigrant.
While on average having access to Head Start resulted in more positive experiences for children, not all children in the Head Start group had the same quality of experience. The experiences of children and the services they received varied. The majority (70 percent) of children in the Head Start group in both cohorts were in centers with overall average ECERS-R scores of at least a five on a seven-point scale, indicating a good or better quality environment. Most children were also in classrooms that emphasized language and literacy and math
7 These analyses compare the treatment and control groups, regardless of children’s preschool placements. Chapter
3 provides an in depth description of the types of programs children were exposed to as well as participated in prior to kindergarten.

x
activities—approximately 60 percent were in classrooms that provided an emphasis on language and literacy and math activities (in which teachers reported providing more than half of a list of 12 language and literacy activities and eight math activities at least three times per week).
Conversely, the remaining Head Start group children did not experience centers with such high ECERS-R scores or as strong an emphasis on language and literacy or math activities. There is also diversity in the training and qualifications of the teachers serving the Head Start group children. Approximately 30 percent of the Head Start group children had teachers with a BA degree, and 30 percent had teachers with at least an Associate’s degree, leaving approximately 40 percent of the children with teachers without a postsecondary degree. Slightly more than one-third of the 3-year-old cohort, and 40 percent of the 4-year-old cohort assigned to the Head Start group had teachers who had received 25 hours or more of training in the last year.
Experiences in Kindergarten and 1st Grade
This study collected data on children’s elementary schools from secondary sources, teacher report, and parents. A subsequent examination of children through the end of 3rd grade will shed greater light on school experiences. However, based on the information that was collected, the results show that providing access to Head Start did not appear to have an impact on the types of schools children attended through 1st grade.
Few significant differences were found between the teachers of the Head Start and control group children for any of the teacher qualification measures (certification, educational attainment, educational preparation, and tenure) or on measures of job satisfaction in either kindergarten or 1st grade. There were also few significant differences on measures of teacher beliefs on how children ought to be taught or on any other measures of classroom activities.
For the 4-year-old cohort, in fact, there were no significant differences on any measures. Those differences that did emerge for the 3-year-old Head Start group suggest they had kindergarten teachers who had completed more coursework in teaching reading and 1st grade teachers with more coursework in reading and in early education than the 3-year-old control group. Likewise, the 3-year-old Head Start group was more likely to be in classrooms that conducted more math activities in the 1st grade. Yet, the vast majority of measures of school quality showed no significant difference for either cohort.
Not surprisingly, the study children – regardless of Head Start status—attended schools with much higher levels of poverty than schools nationwide (as indicated by proportions of students eligible for free- and reduced-price meals) and were in schools with higher proportions of minority students.
Most children in both the Head Start and control groups attended public schools of middle quality as measured by student proficiency on state assessments in math and reading. There was however, one significant difference in these test scores: for the 3-year-old cohort, there was a significant difference in the schools the Head Start group and control group attended for kindergarten. Math proficiency scores were higher in the schools attended by the control group than in those attended by the Head Start group.
While there were very few statistically significant differences in experiences for the Head Start and control group children, the overall findings for both groups can contribute to an understanding of the school environment experienced by both groups of children. For example,
xi
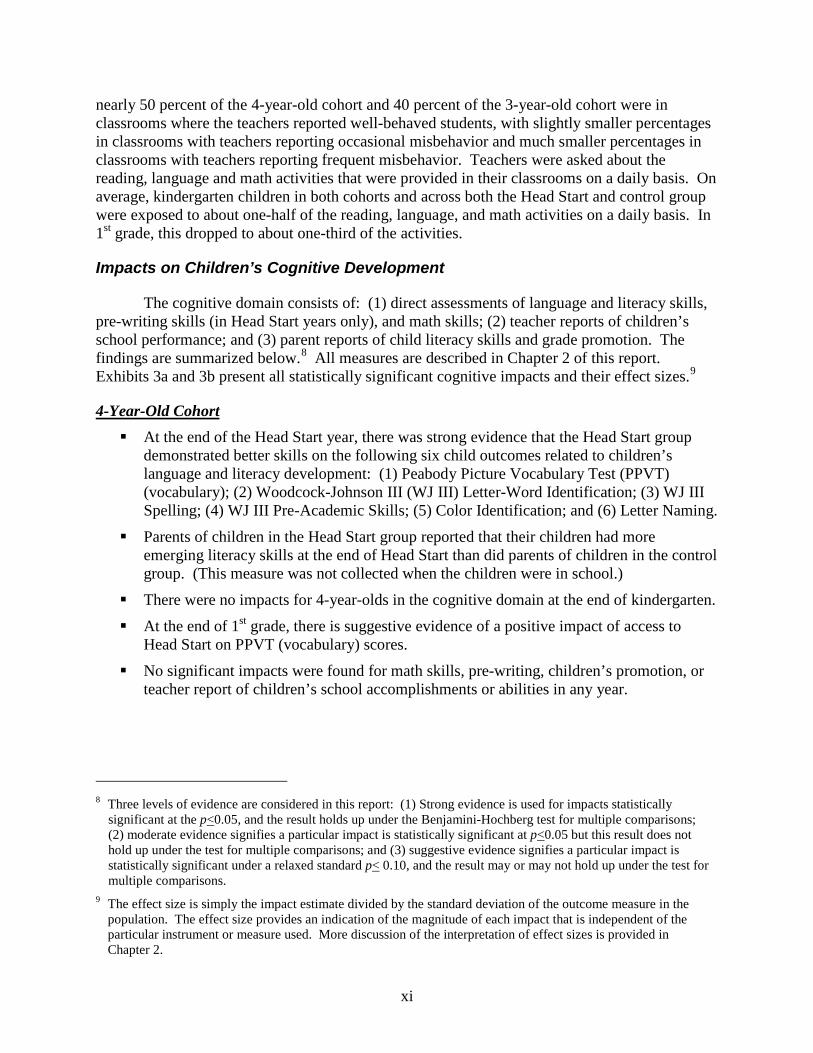
nearly 50 percent of the 4-year-old cohort and 40 percent of the 3-year-old cohort were in classrooms where the teachers reported well-behaved students, with slightly smaller percentages in classrooms with teachers reporting occasional misbehavior and much smaller percentages in classrooms with teachers reporting frequent misbehavior. Teachers were asked about the reading, language and math activities that were provided in their classrooms on a daily basis. On average, kindergarten children in both cohorts and across both the Head Start and control group were exposed to about one-half of the reading, language, and math activities on a daily basis. In 1st grade, this dropped to about one-third of the activities.
Impacts on Children’s Cognitive Development
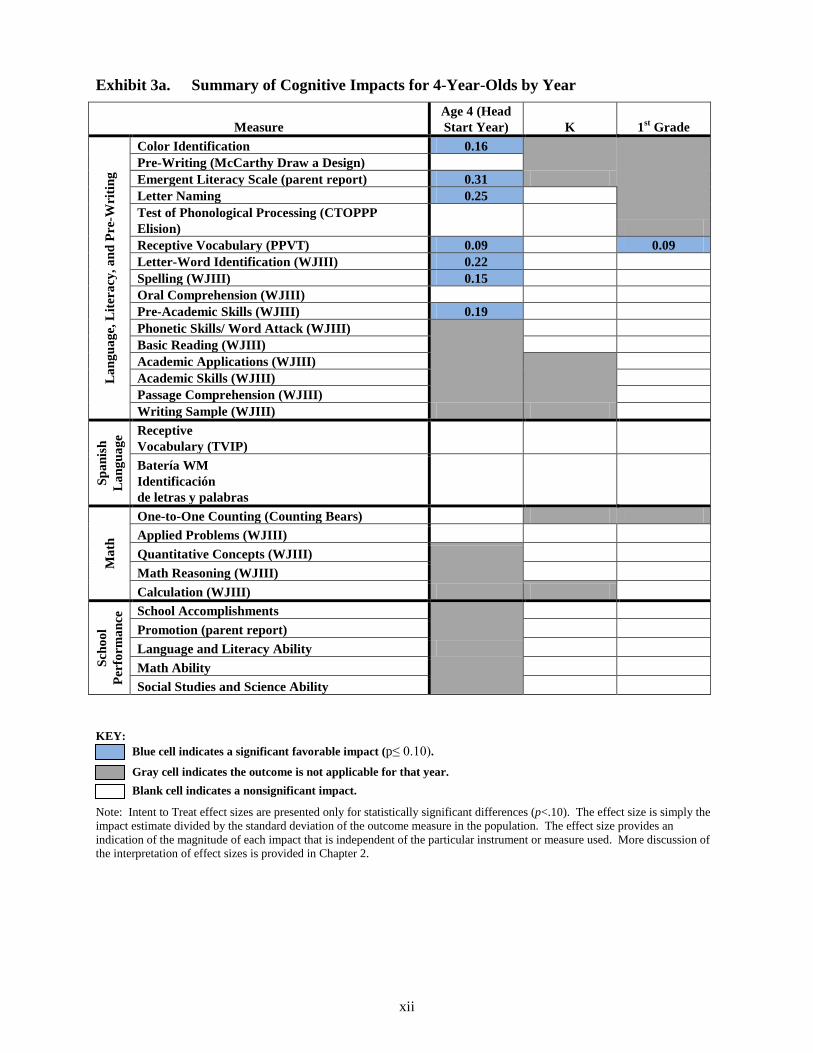
The cognitive domain consists of: (1) direct assessments of language and literacy skills, pre-writing skills (in Head Start years only), and math skills; (2) teacher reports of children’s school performance; and (3) parent reports of child literacy skills and grade promotion. The findings are summarized below.8 All measures are described in Chapter 2 of this report. Exhibits 3a and 3b present all statistically significant cognitive impacts and their effect sizes.9
4-Year-Old Cohort
At the end of the Head Start year, there was strong evidence that the Head Start group demonstrated better skills on the following six child outcomes related to children’s language and literacy development: (1) Peabody Picture Vocabulary Test (PPVT) (vocabulary); (2) Woodcock-Johnson III (WJ III) Letter-Word Identification; (3) WJ III Spelling; (4) WJ III Pre-Academic Skills; (5) Color Identification; and (6) Letter Naming.
Parents of children in the Head Start group reported that their children had more emerging literacy skills at the end of Head Start than did parents of children in the control group. (This measure was not collected when the children were in school.)
There were no impacts for 4-year-olds in the cognitive domain at the end of kindergarten.
At the end of 1st grade, there is suggestive evidence of a positive impact of access to Head Start on PPVT (vocabulary) scores.
No significant impacts were found for math skills, pre-writing, children’s promotion, or teacher report of children’s school accomplishments or abilities in any year.
8 Three levels of evidence are considered in this report: (1) Strong evidence is used for impacts statistically
significant at the p<0.05, and the result holds up under the Benjamini-Hochberg test for multiple comparisons; (2) moderate evidence signifies a particular impact is statistically significant at p<0.05 but this result does not hold up under the test for multiple comparisons; and (3) suggestive evidence signifies a particular impact is statistically significant under a relaxed standard p< 0.10, and the result may or may not hold up under the test for multiple comparisons.
9 The effect size is simply the impact estimate divided by the standard deviation of the outcome measure in the population. The effect size provides an indication of the magnitude of each impact that is independent of the particular instrument or measure used. More discussion of the interpretation of effect sizes is provided in Chapter 2.
xii
Exhibit 3a. Summary of Cognitive Impacts for 4-Year-Olds by Year
Measure Age 4 (Head Start Year) K 1st Grade
Lang
uage
, Lite
racy
, and
Pre
-Wri
ting
Color Identification 0.16
Pre-Writing (McCarthy Draw a Design) Emergent Literacy Scale (parent report) 0.31 Letter Naming 0.25 Test of Phonological Processing (CTOPPP Elision) Receptive Vocabulary (PPVT) 0.09 0.09 Letter-Word Identification (WJIII) 0.22 Spelling (WJIII) 0.15 Oral Comprehension (WJIII) Pre-Academic Skills (WJIII) 0.19 Phonetic Skills/ Word Attack (WJIII)
Basic Reading (WJIII) Academic Applications (WJIII)
Academic Skills (WJIII) Passage Comprehension (WJIII) Writing Sample (WJIII)
Span
ish
Lang
uage
Receptive Vocabulary (TVIP) Batería WM Identificación de letras y palabras
Mat
h
One-to-One Counting (Counting Bears) Applied Problems (WJIII) Quantitative Concepts (WJIII)
Math Reasoning (WJIII) Calculation (WJIII)
Scho
ol
Perf
orm
ance
School Accomplishments
Promotion (parent report) Language and Literacy Ability Math Ability Social Studies and Science Ability
KEY: Blue cell indicates a significant favorable impact (p≤ 0.10). Gray cell indicates the outcome is not applicable for that year. Blank cell indicates a nonsignificant impact.
Note: Intent to Treat effect sizes are presented only for statistically significant differences (p<.10). The effect size is simply the impact estimate divided by the standard deviation of the outcome measure in the population. The effect size provides an indication of the magnitude of each impact that is independent of the particular instrument or measure used. More discussion of the interpretation of effect sizes is provided in Chapter 2.

xiii
3-Year-Old Cohort At the end of their Head Start year, there was strong evidence that the Head Start group
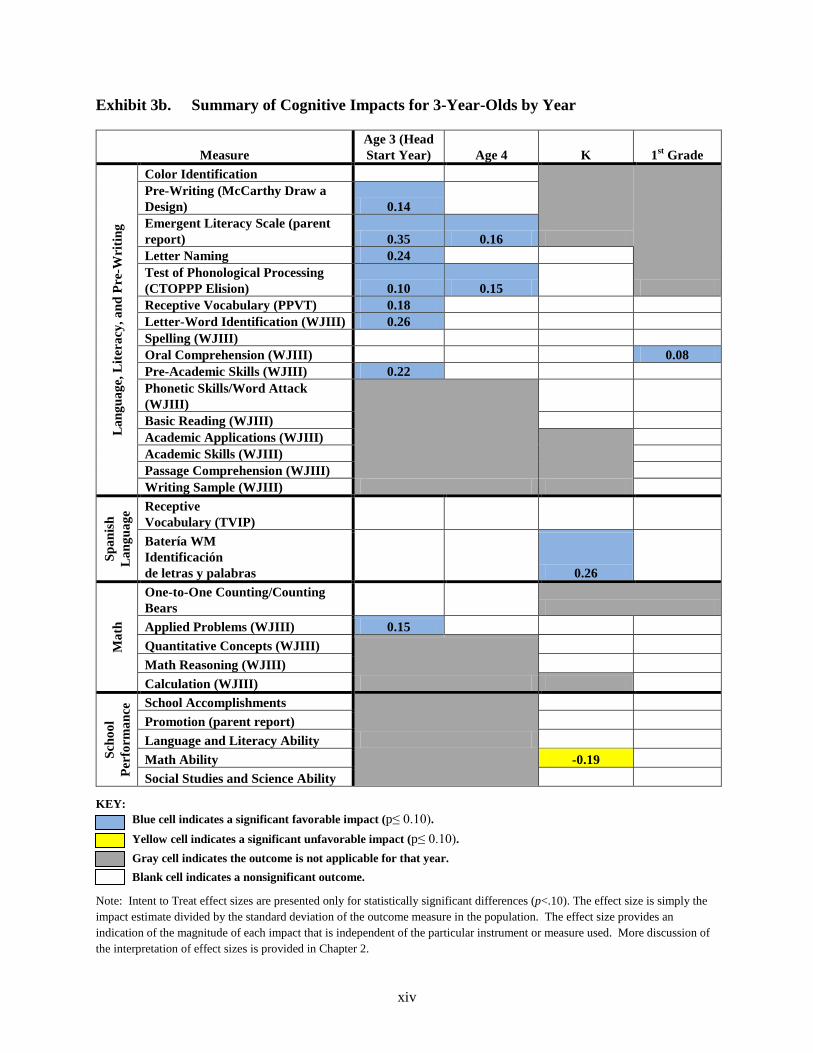
demonstrated better skills on the following five child outcomes related to children’s language and literacy development: (1) PPVT (vocabulary), (2) WJ III Letter-Word, (3) Preschool Comprehensive Test of Phonological and Print Processing (CTOPPP) Elision, (4) Letter Naming, and (5) WJ III Pre-Academic Skills. There was also a statistically significant impact on the measure of children’s pre-writing skills. Children in the Head Start group were found to have more advanced math skills than their counterparts at the end of the Head Start year on the WJ III test of Applied Problems.
Favorable impacts of Head Start were also found on parental reports of children’s emergent literacy skills at the end of the Head Start year.
At the end of the age 4 year, few statistically significant impacts were found. However, two impacts persisted related to children’s literacy skills. Children in the Head Start group scored higher than children in the control group on CTOPPP Elision as well as on parents’ reports of their literacy skills.
As with the 4-year-old cohort, there was no strong evidence of impacts on children’s language, literacy, or math measures at the end of kindergarten or at the end of 1st grade. However, there was some suggestive evidence of an impact on Oral Comprehension at the end of 1st grade.
No statistically significant impacts were found for teacher reports of children’s school performance in kindergarten and 1st grade with the exception of a lower teacher assessment in kindergarten of Head Start children’s math ability. This was the only unfavorable cognitive impact found for either cohort as a whole in any year and was not supported by children’s scores on the three direct math assessments where there was no evidence of math differences. Additionally, the schools attended by the control group children in the 3-year-old cohort during their kindergarten year report a significantly higher percent of students at or above the proficient level in math than the schools attended by the Head Start group children.
To provide context, we can compare the skill levels of children in the Head Start Impact Study with those of the general population of 3- and 4-year-olds in the United States (including those who were not from low-income families). The average 2003 PPVT score for a child in the 4-year-old control group was at the 27th percentile among children in the general population. Head Start group children’s scores were four percentile points higher, at the 31st percentile. For the 3-year-olds, average 2003 PPVT scores were at the 29th percentile for the control group and the 32nd percentile for the Head Start group.
The study children also lag behind other children in the nation on letter identification. Fifty-five percent of the 4-year-old Head Start group and 65 percent of the 3-year-old Head Start group can recognize all their letters by the end of their kindergarten year. For the control group, 58 percent of the 4-year-olds and 64 percent of the 3-year-olds recognize all their letters by the end of kindergarten. Comparing these numbers to a nationally representative sample of children
xiv
Exhibit 3b. Summary of Cognitive Impacts for 3-Year-Olds by Year ht
Ma
ginit
Wr
-er Pd
an
y,acreti
Lag
e,gu
anL e
l nco ma
ho rSc o
erf
P
h s age
ni guSp
aanL
Age 3 (Head Start Year) 1st Grade Measure Age 4 K
Color Identification Pre-Writing (McCarthy Draw a Design) 0.14 Emergent Literacy Scale (parent report) 0.35 0.16 Letter Naming 0.24 Test of Phonological Processing (CTOPPP Elision) 0.10 0.15 Receptive Vocabulary (PPVT) 0.18 Letter-Word Identification (WJIII) 0.26 Spelling (WJIII) Oral Comprehension (WJIII) 0.08 Pre-Academic Skills (WJIII) 0.22 Phonetic Skills/Word Attack (WJIII) Basic Reading (WJIII) Academic Applications (WJIII) Academic Skills (WJIII) Passage Comprehension (WJIII) Writing Sample (WJIII) Receptive Vocabulary (TVIP)
Batería WM Identificación de letras y palabras
0.26 One-to-One Counting/Counting Bears
Applied Problems (WJIII) 0.15 Quantitative Concepts (WJIII) Math Reasoning (WJIII) Calculation (WJIII) School Accomplishments Promotion (parent report) Language and Literacy Ability Math Ability -0.19 Social Studies and Science Ability
KEY: Blue cell indicates a significant favorable impact (p≤ 0.10). Yellow cell indicates a significant unfavorable impact (p≤ 0.10). Gray cell indicates the outcome is not applicable for that year. Blank cell indicates a nonsignificant outcome.
Note: Intent to Treat effect sizes are presented only for statistically significant differences (p<.10). The effect size is simply the impact estimate divided by the standard deviation of the outcome measure in the population. The effect size provides an indication of the magnitude of each impact that is independent of the particular instrument or measure used. More discussion of the interpretation of effect sizes is provided in Chapter 2.

xv
from the Early Childhood Longitudinal Study-Kindergarten Cohort (ECLS-K) (2002),10
Impacts on Children’s Social-Emotional Development
95 percent of children know all of the letters of the alphabet by the end of their kindergarten year.
The social-emotional domain consists of parent-reported measures during the Head Start years and reports by both parents and teachers in the early elementary school years. Measures of children’s behavior, social skills and approaches to learning, parent-child relationships, teacher child relationships, and school adjustment were assessed. The findings in this domain are summarized below, and Exhibits 4a and 4b provide all statistically significant impacts for both cohorts and their effect sizes.
4-Year-Old Cohort
There were no significant differences between the Head Start group and the control group on any measures of social-emotional development during the Head Start year or during kindergarten.
At the end of 1st grade, impacts on social-emotional development were few and mixed. - There were two unfavorable findings based on teacher reports of children’s behavior:
(1) Children in the Head Start group demonstrated moderate evidence of more socially reticent behavior (i.e., shy and hesitant behavior) as reported by teachers, and there is suggestive evidence of more problematic student-teacher interactions.
- In contrast, there is suggestive evidence of less withdrawn behavior for children in the Head Start group as reported by their parents.
3-Year-Old Cohort
At the end of the Head Start year, children in the Head Start group showed strong evidence of less hyperactive behavior and fewer overall problem behaviors as reported by their parents.
At the end of the age 4 year and the end of kindergarten, children in the Head Start group demonstrated suggestive evidence of better social skills and positive approaches to learning as reported by their parents. Further, children in the Head Start group also continued to show moderate evidence of less hyperactive behavior at the end of kindergarten.
By the end of 1st grade, parents of Head Start group children reported moderate evidence of a closer relationship with their child than parents of control group children. At the same time, parents of Head Start group children reported (suggestive evidence) a more positive overall relationship with their child than parents of children in the control group.
There were no impacts on teacher-reported measures of social-emotional development for the three-year-old cohort in either the kindergarten or 1st grade year.
10 U.S. Department of Education, National Center for Education Statistics. (2002). Children’s Reading and
Mathematics Achievement in Kindergarten and First Grade. Washington, DC: Author.

xvi
Exhibit 4a. Summary of Social-Emotional Impacts for 4-Year-Olds by Year
Measure Age 4 (Head Start Year) K 1st Grade
Pare
nt-R
epor
ted
Mea
sure
s
Aggressive Behavior Hyperactive Behavior Withdrawn Behavior -0.13 Total Problem Behavior Social Competencies Social Skills and Positive Approaches To Learning Closeness Conflict Positive Relationships
Teac
her-
Rep
orte
d M
easu
res Aggressive (ASPI)
Interactive/Hyperactive (ASPI) Withdrawn/Low Energy (ASPI) Oppositional (ASPI) Problems with Peer Interaction (ASPI) Shy/Socially Reticent (ASPI) 0.19 Problems with Structured Learning (ASPI) Problems with Teacher Interaction (ASPI) 0.13 Closeness Conflict Positive Relationships
KEY: Blue cell indicates a significant favorable impact (p≤ 0.10). Yellow cell indicates a significant unfavorable impact (p≤ 0.10). Gray cell indicates the outcome is not applicable for that year. Blank cell indicates a nonsignificant outcome.
Note: Intent to Treat effect sizes are presented only for statistically significant differences (p<.10). The effect size is simply the impact estimate divided by the standard deviation of the outcome measure in the population. The effect size provides an indication of the magnitude of each impact that is independent of the particular instrument or measure used. More discussion of the interpretation of effect sizes is provided in Chapter 2. Chapter 5 provides an explanation for the directionality of outcomes.
To provide context for the social-emotional findings, a t-score of 60 or higher for any
Adjustment Scales for Pre-school Intervention (ASPI) component empirically confirms a problem with that component. The percent of empirically confirmed problems for the study children at the end of 1st grade ranges from a low of five to six percent on the shy/socially reticent component to a high of 25 to 27 percent on the problems with peer interaction component.

xvii
Exhibit 4b. Summary of Social-Emotional Impacts for 3-Year-Olds by Year
Measure Age 3 (Head Start Year) Age 4 K 1st Grade
Pare
nt-R
epor
ted
Mea
sure
s
Aggressive Behavior Hyperactive Behavior -0.21 -0.12 Withdrawn Behavior Total Problem Behavior -0.14 Social Competencies Social Skills and Positive Approaches To Learning 0.11 0.14 Closeness 0.10 Conflict Positive Relationships 0.10
Teac
her-
Rep
orte
d M
easu
res
Aggressive (ASPI)
Interactive/Hyperactive (ASPI) Withdrawn/Low Energy (ASPI) Oppositional (ASPI) Problems with Peer Interaction (ASPI) Shy/Socially Reticent (ASPI) Problems with Structured Learning (ASPI) Problems with Teacher Interaction (ASPI) Closeness Conflict Positive Relationships
KEY: Blue cell indicates a significant favorable impact (p≤ 0.10). Gray cell indicates the outcome is not applicable for that year. Blank cell indicates a nonsignificant outcome.
Note: Intent to Treat effect sizes are presented only for statistically significant differences (p<.10). The effect size is simply the impact estimate divided by the standard deviation of the outcome measure in the population. The effect size provides an indication of the magnitude of each impact that is independent of the particular instrument or measure used. More discussion of the interpretation of effect sizes is provided in Chapter 2. Chapter 5 provides an explanation for the directionality of outcomes.
xviii
Impact on Health Status and Access to Health Services
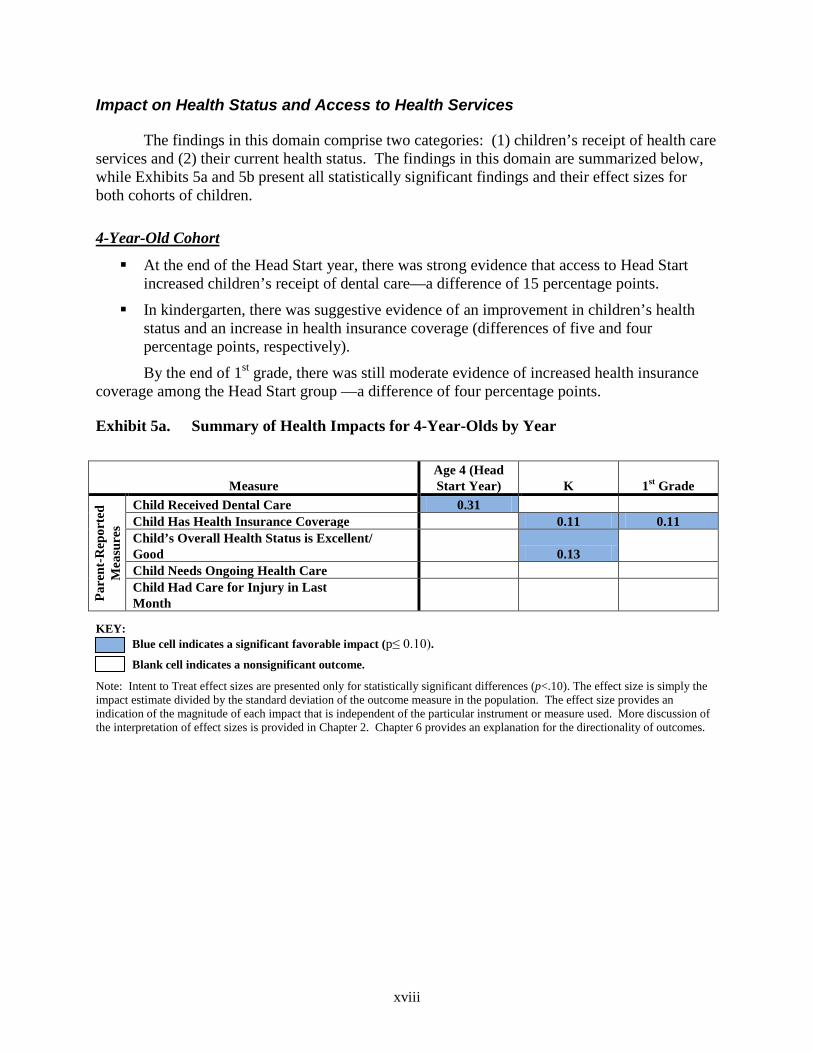
The findings in this domain comprise two categories: (1) children’s receipt of health care services and (2) their current health status. The findings in this domain are summarized below, while Exhibits 5a and 5b present all statistically significant findings and their effect sizes for both cohorts of children.
4-Year-Old Cohort
At the end of the Head Start year, there was strong evidence that access to Head Start increased children’s receipt of dental care—a difference of 15 percentage points.
In kindergarten, there was suggestive evidence of an improvement in children’s health status and an increase in health insurance coverage (differences of five and four percentage points, respectively).
By the end of 1st grade, there was still moderate evidence of increased health insurance coverage among the Head Start group —a difference of four percentage points.
Exhibit 5a. Summary of Health Impacts for 4-Year-Olds by Year
Measure Age 4 (Head Start Year) K 1st Grade
Pare
nt-R
epor
ted
Mea
sure
s
Child Received Dental Care 0.31 Child Has Health Insurance Coverage 0.11 0.11 Child’s Overall Health Status is Excellent/ Good 0.13 Child Needs Ongoing Health Care Child Had Care for Injury in Last Month
KEY: Blue cell indicates a significant favorable impact (p≤ 0.10). Blank cell indicates a nonsignificant outcome.
Note: Intent to Treat effect sizes are presented only for statistically significant differences (p<.10). The effect size is simply the impact estimate divided by the standard deviation of the outcome measure in the population. The effect size provides an indication of the magnitude of each impact that is independent of the particular instrument or measure used. More discussion of the interpretation of effect sizes is provided in Chapter 2. Chapter 6 provides an explanation for the directionality of outcomes.

xix
3-Year-Old Cohort
At the end of the Head Start year and again at the end of the age 4 year, there was strong evidence that access to Head Start increased children’s receipt of dental care—differences of 17 and 10 percentage points, respectively.
There was moderate evidence of improvements on children’s reported overall health status at the end of the Head Start year and moderate evidence of an impact on health insurance coverage at the end of kindergarten.
There was evidence of a significant impact on care for injuries at the end of the age 4 year, although the interpretation of this impact is unclear.
There were no significant impacts at the end of 1st grade.
Exhibit 5b. Summary of Health Impacts for 3-Year-Olds by Year
Measure Age 3 (Head Start Year) Age 4 K 1st Grade
Pare
nt-R
epor
ted
Mea
sure
s
Child Received Dental Care 0.33 0.20 Child Has Health Insurance Coverage 0.14 Child’s Overall Health Status is Excellent/Good 0.11 Child Needs Ongoing Health Care Child Had Care for Injury in Last Month 0.10
KEY: Blue cell indicates a significant favorable impact (p≤ 0.10). Blank cell indicates a nonsignificant outcome.
Note: Intent to Treat effect sizes are presented only for statistically significant differences (p<.10). The effect size is simply the impact estimate divided by the standard deviation of the outcome measure in the population. The effect size provides an indication of the magnitude of each impact that is independent of the particular instrument or measure used. More discussion of the interpretation of effect sizes is provided in Chapter 2. Chapter 6 provides an explanation for the directionality of outcomes.
Comparing the health status of the children in the Head Start Impact Study with children in the general population demonstrates that Head Start children are about equal to other children on general health status, as measured here, and receipt of dental care. The target for the Healthy People 2010 initiative (U.S. Department of Health and Human Services, 2000)11
11 U.S. Department of Health and Human Services. (2000). Healthy People 2010: 21 – Oral Health. Retrieved
from:www.healthypeople.gov/data/midcourse/html/focusareas/FA21Objectives.htm.
is to increase the proportion of low-income children and adolescents who receive any preventive dental services to 66 percent. For the 4-year-olds, 73 percent of children in the Head Start group had seen a dentist since September in their Head Start year, compared with 56 percent of children in the control group. For the 3-year-olds, 68 percent of children in the Head Start group had seen a dentist since September of their Head Start year, compared with 52 percent of children in the control group and 74 percent of the Head Start group had seen a dentist since September of their age 4 year, compared with 65 percent of the control group. By the end of 1st grade, the

xx
percentage who had seen a dentist since the start of the 1st grade year in the Head Start group was about 68 percent for the 4-year-old cohort and 74 percent for the 3-year-old cohort, with no statistically significant difference from the control group.
In the ECLS-K study (2000),12
Impact on Parenting Practices
83 percent of parents reported that their child’s health status was good or excellent at the beginning of kindergarten. In this study, at the end of kindergarten, 82 percent of the Head Start group parents for the 4-year-old cohort reported that their child’s health was good or excellent, compared with 76 percent of the control group parents. Eighty-one percent of the Head Start group parents for the 3-year-old cohort reported that their child’s health was good or excellent, with no statistically significant difference from the control group. These numbers compare favorably, suggesting that the low-income parents in this study do not see their children as more or less likely to be in good health than parents nationally. However, we have only very limited measures of health in this study, and cannot make definitive statements about how specific health conditions of the study children (e.g., asthma, obesity) compare to other children nationally.
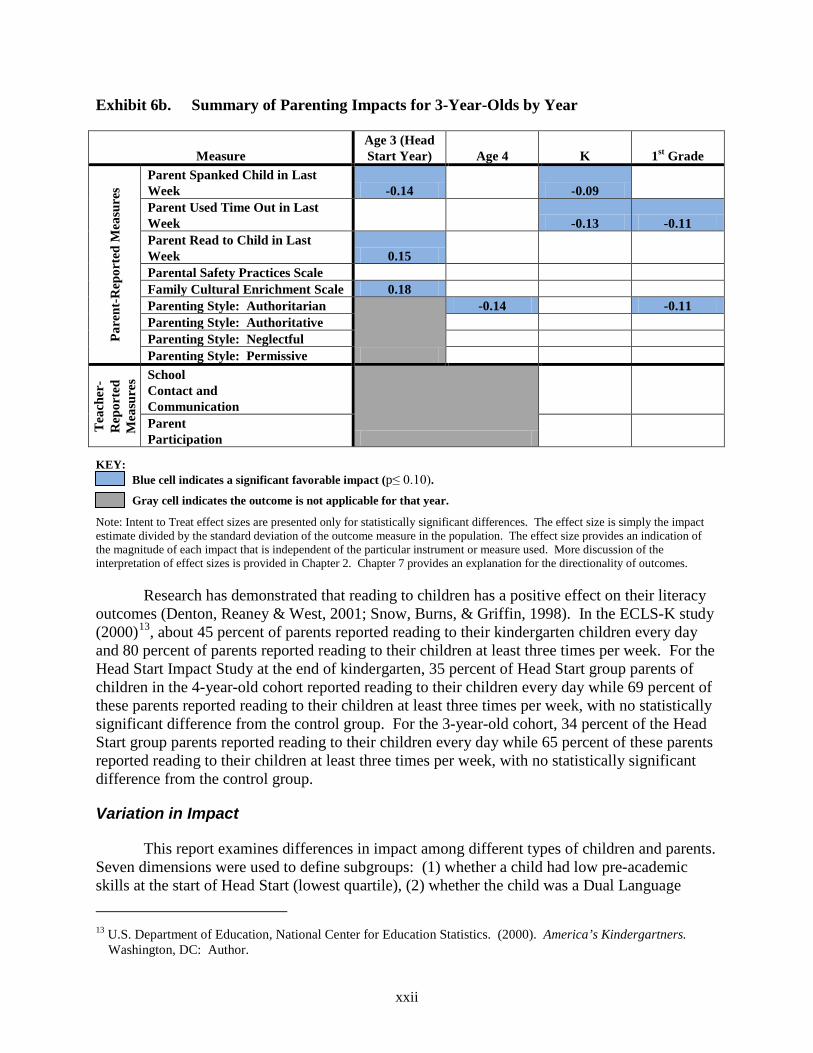
This domain consists of four categories of outcomes: (1) disciplinary practices, (2) educational supports, (3) safety practices, and (4) parenting styles. The findings for the 3-year-olds in the parenting practices domain are consistent with favorable impacts on children’s behavior through kindergarten and on parent-child relationships and closeness through 1st grade as reported in the social-emotional domain. The findings in this domain are summarized below, and Exhibits 6a and 6b provide the statistically significant findings and effect sizes.
4-Year-Old Cohort
There were minimal impacts for the 4-year-old cohort in this domain, with one exception: at the end of the Head Start year, parents in the Head Start group were less likely to use time out as a disciplinary practice than were parents in the control group. In the absence of any pattern of impacts on social-emotional development or other parenting practices for this cohort, it is difficult to interpret this finding, which might reflect changes in either children’s behavior or parents’ reactions to it.
3-Year-Old Cohort In the Head Start year, there were several impacts on parenting practices, and most were
supported by strong evidence:
o Parents of children in the Head Start group were less likely to have spanked their children than parents in the control group (a difference of seven percentage points).
o Parents of children in the Head Start group were also more likely to have read to their child in the last week than parents in the control group.
o Parents of children in the Head Start group involved their child in cultural enrichment activities more than parents of children in the control group.
12 U.S. Department of Education, National Center for Education Statistics. (2000). America’s Kindergartners.
Washington, DC: Author.

xxi
At the end of the age 4 year, parents of children in the Head Start group were less likely to use an authoritarian parenting style (characterized by high control and low warmth) than parents of children in the control group.
Evidence of impacts on parenting continues in kindergarten and 1st grade.
- At the end of kindergarten, there is suggestive evidence that parents of children in the Head Start group were less likely to spank their children and moderate evidence that these parents were less likely to use time out.
- At the end of 1st grade, there is also suggestive evidence that parents of children in the Head Start group were less likely to use time out and moderate evidence that these parents were more likely to use an authoritarian parenting style.
Exhibit 6a. Summary of Parenting Impacts for 4-Year-Olds by Year
Measure Age 4 (Head Start Year) K 1st Grade
Pare
nt-R
epor
ted
Mea
sure
s
Parent Spanked Child in Last Week Parent Used Time Out in Last Week -0.17 Parent Read to Child in Last Week Parental Safety Practices Scale Family Cultural Enrichment Scale Parenting Style: Authoritarian
Parenting Style: Authoritative Parenting Style: Neglectful Parenting Style: Permissive
Teac
her-
Rep
orte
d M
easu
res School
Contact and Communication
Parent Participation
• KEY: • Blue cell indicates a significant favorable impact (p≤ 0.10). • Gray cell indicates the outcome is not applicable for that year.
• Note: Intent to Treat effect sizes are presented only for statistically significant differences. The effect size is simply the impact estimate divided by the standard deviation of the outcome measure in the population. The effect size provides an indication of the magnitude of each impact that is independent of the particular instrument or measure used. More discussion of the interpretation of effect sizes is provided in Chapter 2. Chapter 7 provides an explanation for the directionality of outcomes.
xxii
Exhibit 6b. Summary of Parenting Impacts for 3-Year-Olds by Year
Measure Age 3 (Head Start Year) Age 4 K 1st Grade
Pare
nt-R
epor
ted
Mea
sure
s
Parent Spanked Child in Last Week -0.14 -0.09 Parent Used Time Out in Last Week -0.13 -0.11 Parent Read to Child in Last Week 0.15 Parental Safety Practices Scale Family Cultural Enrichment Scale 0.18 Parenting Style: Authoritarian
-0.14 -0.11 Parenting Style: Authoritative Parenting Style: Neglectful Parenting Style: Permissive
Teac
her-
Rep
orte
d M
easu
res School
Contact and Communication
Parent Participation
KEY: Blue cell indicates a significant favorable impact (p≤ 0.10). Gray cell indicates the outcome is not applicable for that year.
Note: Intent to Treat effect sizes are presented only for statistically significant differences. The effect size is simply the impact estimate divided by the standard deviation of the outcome measure in the population. The effect size provides an indication of the magnitude of each impact that is independent of the particular instrument or measure used. More discussion of the interpretation of effect sizes is provided in Chapter 2. Chapter 7 provides an explanation for the directionality of outcomes.
Research has demonstrated that reading to children has a positive effect on their literacy outcomes (Denton, Reaney & West, 2001; Snow, Burns, & Griffin, 1998). In the ECLS-K study (2000)13
Variation in Impact
, about 45 percent of parents reported reading to their kindergarten children every day and 80 percent of parents reported reading to their children at least three times per week. For the Head Start Impact Study at the end of kindergarten, 35 percent of Head Start group parents of children in the 4-year-old cohort reported reading to their children every day while 69 percent of these parents reported reading to their children at least three times per week, with no statistically significant difference from the control group. For the 3-year-old cohort, 34 percent of the Head Start group parents reported reading to their children every day while 65 percent of these parents reported reading to their children at least three times per week, with no statistically significant difference from the control group.
This report examines differences in impact among different types of children and parents. Seven dimensions were used to define subgroups: (1) whether a child had low pre-academic skills at the start of Head Start (lowest quartile), (2) whether the child was a Dual Language 13 U.S. Department of Education, National Center for Education Statistics. (2000). America’s Kindergartners.
Washington, DC: Author.

xxiii
Learner at the start of Head Start, (3) whether the child had special needs (as reported by the parent at the start of Head Start), (4) mother’s race/ethnicity, (5) reported level of depressive symptoms for the child’s parent/primary caregiver, (6) a composite index of household risks, and (7) urban location. All categorizations were based on data collected at the time of random assignment. Sample sizes by subgroup, age cohort, and random assignment status are presented in Chapter 8.
The approach to analyzing subgroups was to highlight patterns in the findings. There is no scientific consensus for what constitutes a pattern of impacts. Yet, given the large number of comparisons tested (almost 10,000, taking into consideration the study’s two cohorts, four time points for measuring outcomes, and multiple outcomes), it was important to find an approach that balances the risk of reporting on chance findings with that of ignoring important findings. To this end, the subgroup findings concentrate on differential impacts, that is, impacts where there was a statistically significant difference in Head Start’s effects for one subgroup compared to another. Particular attention was paid to multiple impacts that occur across domains or outcomes, or that persist into kindergarten and 1st grade.14
4-Year-Old Cohort
The subgroup findings should be viewed as secondary and exploratory as compared to the main impact findings that are considered primary as well as confirmatory. The major findings are presented below.
Children of parents with mild depressive symptoms experienced favorable cognitive impacts through the end of 1st grade. At the end of the Head Start year, this subgroup experienced several benefits of Head Start in language and literacy compared to children of parents with other levels of reported depressive symptoms. No cognitive impacts were found in kindergarten but the language and literacy impacts re-appeared at the end of 1st grade.
Dual Language Learners experienced health benefits from Head Start at the end of kindergarten and 1st grade, although the early impacts were mixed. Head Start had a favorable impact on the health insurance coverage of Dual Language Learners at the end of the Head Start and kindergarten years and on the receipt of dental care at the end of 1st grade.
Children in the lowest academic quartile at baseline showed benefits of Head Start in the social-emotional domain through 1st grade. At the end of the Head Start year, there were favorable impacts for the lowest quartile children compared to their non-lowest quartile counterparts on parent’s report of their relationship with the child. In the school years, teacher reports showed more favorable impacts for lowest quartile children on oppositional behavior, problems with peer interaction, conflict, and positive relationships with the teacher than non-lowest quartile children.
14 The Benjamini-Hochberg test of multiple comparisons was also applied to the subgroup analysis and the results
are included in the Chapter 8 tables of this report.

xxiv
In addition, Black children experienced favorable impacts in the social-emotional domain at the end of kindergarten as reported by teachers. Black children in the Head Start group were reported to have reduced inattentiveness, fewer problems with structured learning, peer interactions, or teacher interactions, and better relationships with teachers.
3-Year-Old Cohort
Children with special needs benefited from Head Start in the math and social-emotional areas at the end of the 1st grade. As a result of Head Start, special needs children showed a reduction in inattention/hyperactivity, in problems with structured learning, and in conflict with teachers, as well as an increase in positive teacher relationships.
Children of parents with no depressive symptoms experienced sustained benefits of Head Start in the cognitive, social-emotional, and parenting domains through the end of 1st grade. In the cognitive domain, children of parents with no reported depressive symptoms benefited from Head Start on many direct assessments of language, literacy, and math skills in all years, and especially at the end of 1st grade.
Children from high-risk households showed sustained favorable cognitive impacts through the end of 1st grade. Children from high-risk households experienced benefits in five direct assessments of academic skills at the end of 1st grade.
Children in non-urban settings showed sustained cognitive benefits from Head Start through the end of 1st grade and some benefits in the social-emotional domain during the Head Start years. Children in non-urban settings demonstrated favorable cognitive impacts at the end of their Head Start year on three measures of language and literacy and one pre-writing measure. Additionally, favorable math impacts were demonstrated at the end of the age 4 year and favorable spelling impacts at the end of kindergarten. At the end of 1st grade, there were favorable impacts on six language and literacy measures and one math measure.
There were also several groups with favorable impacts in the earlier years of followup that faded by the 1st grade, including children in the lowest quartile at baseline and Dual Language Learners.
There were also a few subgroups that experienced a pattern of mixed or unfavorable impacts by 1st grade. For example, White children in the 4-year-old cohort experienced unfavorable impacts on several teacher-reported social-emotional measures in the 1st grade year and one unfavorable impact on parenting in the kindergarten year. Within the 3-year-old cohort, children of parents with moderate depressive symptoms experienced sustained negative impacts of Head Start in the cognitive, social-emotional, and health domains and mixed impacts in the parenting domain through 1st grade. These children were less likely to be promoted to the next grade, as reported by their parents. This group is of particular concern because the unfavorable impacts were found across domains and methods of assessment.
xxv
Final Thoughts
Head Start has the ambitious mandate of improving educational and developmental outcomes for children from economically disadvantaged families. Head Start’s mandate requires that it meet the needs of the whole child, including the cognitive, social-emotional, and health needs of children, and positively influence the parenting practices of their parents. This study examined the impacts of Head Start on these four domains.
The study shows that providing access to Head Start led to improvements in the quality of the early childhood settings and programs children experienced. On nearly every measure of quality traditionally used in early childhood research, the Head Start group had more positive experiences than those in the control group.
These impacts on children’s experiences translated into favorable impacts at the end of one year in the domains of children’s cognitive development and health, as well as in parenting practices. There were more significant findings across the measures within these domains for 3-year-olds in that first year (and only the 3-year-old cohort experienced improvements in the social-emotional domain.) Yet, by the end of 1st grade, there were few significant differences between the Head Start group as a whole and the control group as a whole for either cohort.
The few differences at the end of 1st grade included a favorable impact on the receipt of health insurance for the four-year-old cohort, consistent with earlier impacts on health insurance for both cohorts. Further, there are longer-term favorable impacts related to children’s social-emotional development and relationships with their parents for the 3-year-old cohort. According to parent reports, this younger group experienced favorable impacts on behavioral and social-emotional outcomes during the early years of the program and into kindergarten. By 1st grade, these impacts were limited to outcomes related to parent-child relationships and parenting practices. It is possible that these benefits in the parent-child relationship are both related to earlier improvements in behavior and may lead to longer term benefits for children. However, this is only one hypothesis, and the issue requires further analysis.
This study evaluated the Head Start program against a mixture of alternative care settings rather than against a condition of “no services” or parental care only condition. About 40 percent of the non-Head Start group did not receive formal preschool education, and for those who did, quality was generally lower than in Head Start. Nevertheless, many of the control group children did receive child care or early childhood education. Further, among those that participated in non-parental care, the control group children were actually in non-parental care for more hours than the Head Start group—on average, children in the control group who participated in some type of non-parental care attended care about four to five hours more per week for the Head Start year. Consequently, to achieve measurable impacts, Head Start (as noted above) has to outperform what control group children received. Improved childcare and pre-K standards across the nation may have reduced the differences found between the Head Start and control group children.
Although the quality is high on average, Head Start programs vary in terms of instruction in the key areas measured as part of this study, i.e., early development of language and literacy and mathematics skills. The inclusion of programs across the full spectrum in this study’s nationally representative sample may help to explain why impacts in the cognitive domain are not stronger.
xxvi
Head Start has always had a particular emphasis on young children with special needs, and indeed, though exploratory, we see impacts through 1st grade in the two subgroups of relevance: children whose parents have been told their child has special needs or disabilities (for 3-year-olds) and children with the lowest cognitive skills upon entering Head Start. Head Start has benefits for these groups of children that last into early elementary school.
Similarly, the Head Start performance standards emphasize the importance of respecting children and individualizing services as needed based on their cultural and linguistic backgrounds. Indeed, among the 3-year-old treatment group, parents were more likely to enroll their children for a second year of Head Start if they found the program supportive of their culture, if they were immigrants, and if English was not the primary language used in the home. Likewise, the findings from this study demonstrate that Black children (in the 4-year-old cohort) and Dual Language Learners are among the groups that benefited more than other groups from access to Head Start. However, most of these impacts only lasted through the end of kindergarten.
The subgroup findings do not present a consistent picture of favorable impacts for groups that have traditionally been emphasized as higher risk. While the children from higher risk households benefited in the 3-year-old group, there were no differences in impacts by household risk for the 4-year-olds. Further, it was the children of caregivers with less severe depressive symptoms that experienced favorable impacts through 1st grade in both cohorts. There also appears to be a pattern for the 3-year-old cohort where the children from families in the middle of the risk categories (neither highest nor lowest) actually experienced some negative impacts. This pattern is particularly strong, and concerning, for children of caregivers with moderate levels of depressive symptoms. The explanation for these patterns is unclear and warrants more attention.
This study also found that, in the 3-year-old cohort, Head Start had benefits through 1st grade for children from non-urban communities. It is possible that this finding represents the difficulties that children and families in non-urban communities have in getting comprehensive services and in finding quality early care and education for their children, absent Head Start. Indeed, children were more likely to participate in a second year of Head Start if there was less competition from other preschools in the area. These are questions that should be pursued in future research.
In sum, this report finds that providing access to Head Start has benefits for both 3-year-olds and 4-year-olds in the cognitive, health, and parenting domains, and for 3-year-olds in the social-emotional domain. However, the benefits of access to Head Start at age four are largely absent by 1st grade for the program population as a whole. For 3-year-olds, there are few sustained benefits, although access to the program may lead to improved parent-child relationships through 1st grade, a potentially important finding for children’s longer term development. Moreover, several subgroups of children in this study experience benefits of Head Start into 1st grade. It will be important in future research to examine whether the positive parent-child relationships for the 3-year-old cohort translate into improved outcomes as children get older, as well as whether the findings for subgroups of children persist over the longer term. To that end, the study children have been followed through 3rd grade. The 3rd grade report will examine the extent to which impacts of Head Start on initial school readiness are altered or maintained as children enter pre-adolescence. Further, that report will provide a greater focus on

xxvii
how children’s later experiences in the school and community affect their outcomes at 1st and 3rd grades.
Finally, this study leaves many important questions about Head Start unanswered. These questions include, but are certainly not limited to, questions such as: Is there a benefit to having two years of Head Start rather than one year? What types of programs, centers, classrooms, and other experiences relate to more positive impacts for children and families? What accounts for the subgroup patterns observed in this report? Are there some later experiences that help to sustain impacts through the early elementary grades? Hopefully, researchers will take advantage of the data from this study, which will be made available through a data archive, to further the understanding of the role Head Start plays in the well-being of children and families.
Related Documents