2007 IIM Indore Abhishek Anand Team Name: Analyst 09833167105 [email protected] [REAL ESTATE VALUATION CASE STUDY] Valuation of HDIL

HDIL
Nov 13, 2014
Valuation of HDIL, a real estate firm of India
Welcome message from author
This document is posted to help you gain knowledge. Please leave a comment to let me know what you think about it! Share it to your friends and learn new things together.
Transcript
2007
IIM Indore Abhishek Anand Team Name: Analyst 09833167105 [email protected]
[REAL ESTATE VALUATION CASE STUDY] Valuation of HDIL
2 | P a g e
Contents Executive Summary ...................................................................................................................................... 3
Industry Profile ............................................................................................................................................. 4
Residential Real Estate- Demand exceeds supply .................................................................................... 4
Commercial Real Estate development- Demand Supply balance ............................................................. 4
Retail Real Estate development- Untapped potential ................................................................................ 5
Slum Rehabilitation Scheme ..................................................................................................................... 5
HDIL profile ................................................................................................................................................. 6
Business segments: ................................................................................................................................... 7
Residential business .............................................................................................................................. 7
Commercial business ............................................................................................................................ 8
Retail business ...................................................................................................................................... 8
Slum rehabilitation and development ................................................................................................... 8
SEZ ....................................................................................................................................................... 9
Timeline of project completion (2008 – 12): ............................................................................................ 9
Strengths ................................................................................................................................................... 9
Concerns ................................................................................................................................................. 10
Valuations ................................................................................................................................................... 12
DCF ......................................................................................................................................................... 12
Sensitivity Analysis: ................................................................................................................................. 14
Sensitivity of share price to per square feet realization ..................................................................... 14
Sensitivity to terminal growth rate and WACC ................................................................................... 14
Sensitivity to operating Expense as a percentage of Sales: ................................................................ 15
Competitors: ................................................................................................................................................ 15
DLF: ........................................................................................................................................................ 17
Mahindra Gesco ...................................................................................................................................... 17
Omaxe Ltd. ............................................................................................................................................. 18
Parsvnath Developers Ltd ....................................................................................................................... 18
Sobha Developers ................................................................................................................................... 19
Unitech .................................................................................................................................................... 19
References: ................................................................................................................................................. 20

3 | P a g e
Executive Summary
The analysis is done as follows:
Industry analysis
The study involves analysis of the real estate industry in relation to the various business
segments existing in the sector like commercial, residential, retail and Slum rehabilitation
schemes projects. Residential segment has a demand supply gap hence a lot of potential
exists in the segment. On the other hand retail segment is an untapped segment where
immense potential exists for the firm.
HDIL analysis
The next phase of the study involves analysis of the HDIL and its business divisions:
retail, residential, commercial and Slums Rehabilitation Scheme (SRS) projects. HDIL
follows a build and sell business model. The company has an expertise in SRS projects.
The study identifies the areas of strength and areas of concern for the firm. The study also
analyzes the various projects undertaken by HDIL till date and proposed/planned
projects.
Valuations:
Discounted Cash Flow technique is used to find the value of the firm using three stage
DCF model. The Enterprise value obtained under the assumptions was Rs. 14,986.7 crore
and the share value obtained was Rs. 811.7. Further sensitivity analysis was performed on
the variables like realization per square feet, terminal growth rate, cost of capital and
operating expenditure to find the impact on enterprise value.
Final part of the report analyzes various companies in the real estate sector and compares
the business model and area of operation of these firms. Parameters like profit after tax,
EV/EBITDA, P/E, Sales growth are compared across the firms. The section also
discusses each of the company briefly.
4 | P a g e
Industry Profile
The Indian real estate sector involves development of commercial offices, industrial facilities,
hotels, restaurants, cinemas, residential housing, trading spaces such as retail outlets and the
purchase and sale of land and land development rights. Over the past three years, the amount of
investment in the real estate sector and the total amount of constructed square footage has
increased significantly having recovered from a severe recession between 1995 and 1999.
Investment in real estate construction in India during the three-year period from financial year
2006 through 2008 is estimated to be over Rs 5,106 billion compared to investment of
approximately Rs 4,504 billion during the three-year period from financial year 2003 through
2005. Constructed square footage during the period from financial year 2006 through 2008 will
be approximately 8.3million sq. ft. compared to constructed square footage of approximately
7.4million sq. ft during the period from financial year 2003 through 2005.
Residential Real Estate- Demand exceeds supply
Demand for housing in India today exceeds supply due to various factors including: a growing
population, increasing urbanisation, increasing affluence and disposable income as a result of
growth in employment opportunities and work force, and a general trend away from India‟s
tradition of joint or extended family residences towards nuclear or individual family residences.
According to India‟s current “five year plan”, there will be a housing shortage of approximately
22.7million housing units in financial year 2007.
Commercial Real Estate development- Demand Supply balance
In cities with diverse economic sectors such as Mumbai, the demand for commercial real estate
has been driven by industries such as banking, finance and insurance institutions, consulting
firms, pharmaceutical companies, shipping firms and other service businesses. Capital flow into
commercial property in 2004 increased by more than 40% over the previous year, leading to
record levels of new office development. Inspite of this, the demand by certain sectors have
resulted in the balance of demand and supply. The rapidly growing sectors of IT/ITES and
related sectors were particularly estimated to account for over 70% of net demand in 2004.
5 | P a g e
Retail Real Estate development- Untapped potential
Real estate development in the retail sector is a relatively new phenomenon in India. The Indian
retail market has the largest growth potential of the worldwide retail markets. The growth rate for
retail space also has led to high demand for shopping mall space. There are 219 operational
shopping malls in the six largest cities of India, spread over 66 million square feet of land at an
average size of 0.3 million square feet per mall (CRIS INFAC Annual Review on Retailing
Industry – September 2005). It is expected that the number of shopping malls will double in the
next three to five years.
Slum Rehabilitation Scheme
The SRS was established in 1995 with a mission to re-develop and rehabilitate slum dwellers in
Greater Mumbai. Through the scheme, rehabilitation flats are built free of cost for the slum
dwellers by cross-subsidization provided by free-sale flats. Developers are allowed to construct
sale flats on slum land in exchange for the construction of flats for slum dwellers. On the cleared
slum land, the developer may then construct commercial, residential or retail buildings as per the
preference of the developer, subject to approvals of the site plan. In the event further
construction is not possible due to insufficient space on the re-developed slum land or any
applicable planning restrictions, the developer is issued a transferable development rights
("TDR") by the Government of Maharashtra (GoM) for the balance of the undeveloped building
area, which the developer may use in respect of another development elsewhere in certain areas
in Mumbai or may sell to a third party. The principal financial advantage of the SRS is that the
developers are not required to pay any substantial, one-off land purchase costs at the beginning
of each project to acquire the use of such land.
6 | P a g e
HDIL profile
HDIL focuses on Real Estate development including construction and development of
Residential projects, Commercial and Retail Projects, Slum Rehabilitation projects including
clearing slum land and re-housing the slum-dwellers and land development by creating the
required infrastructure on land which the company then sells to other property developers.
HDIL is the flagship Construction and Real Estate development company of the Wadhawan
Group, formerly known as Dheeraj Group, who have been involved in Real Estate development
in the Mumbai Metropolitan Region for more than three decades and have developed more than
72.8 million sq. ft. of saleable area and 5.5 million sq. ft. of Rehabilitation area.
Through March 31, 2007, the Company has developed 24 projects covering approximately 11.0
million square feet of saleable area. The Company also has constructed an additional 2.0 million
square feet of rehabilitation area under slum rehabilitation schemes.
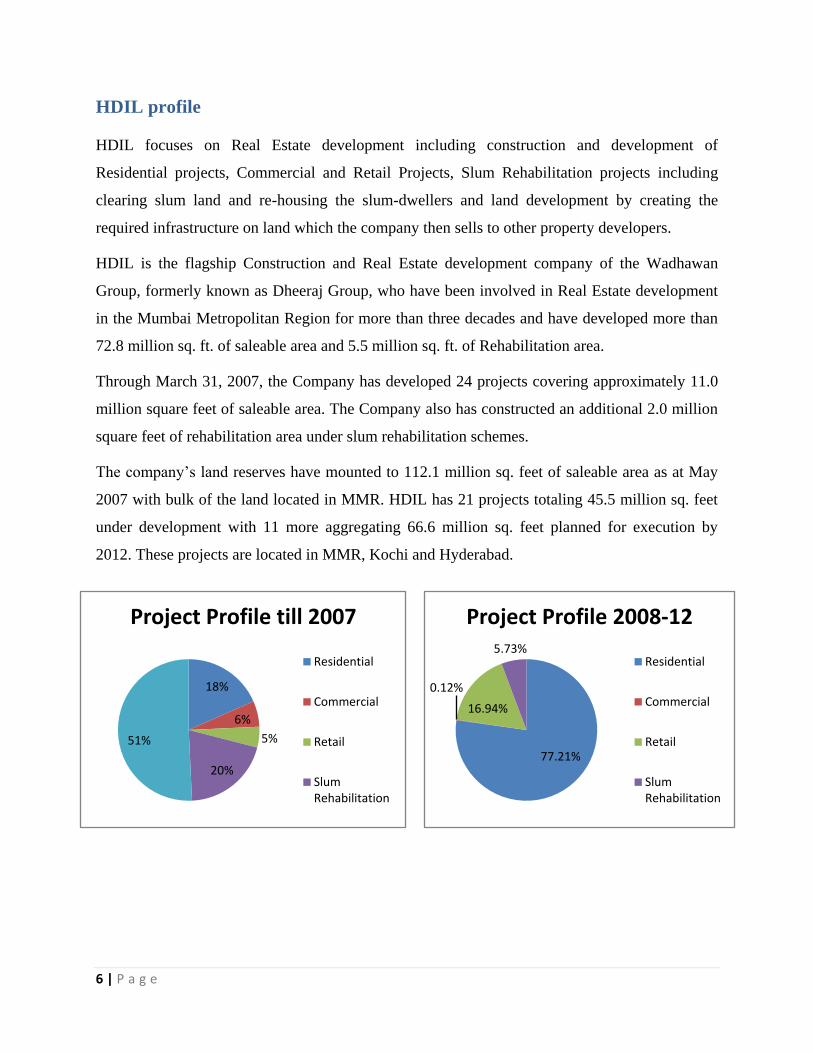
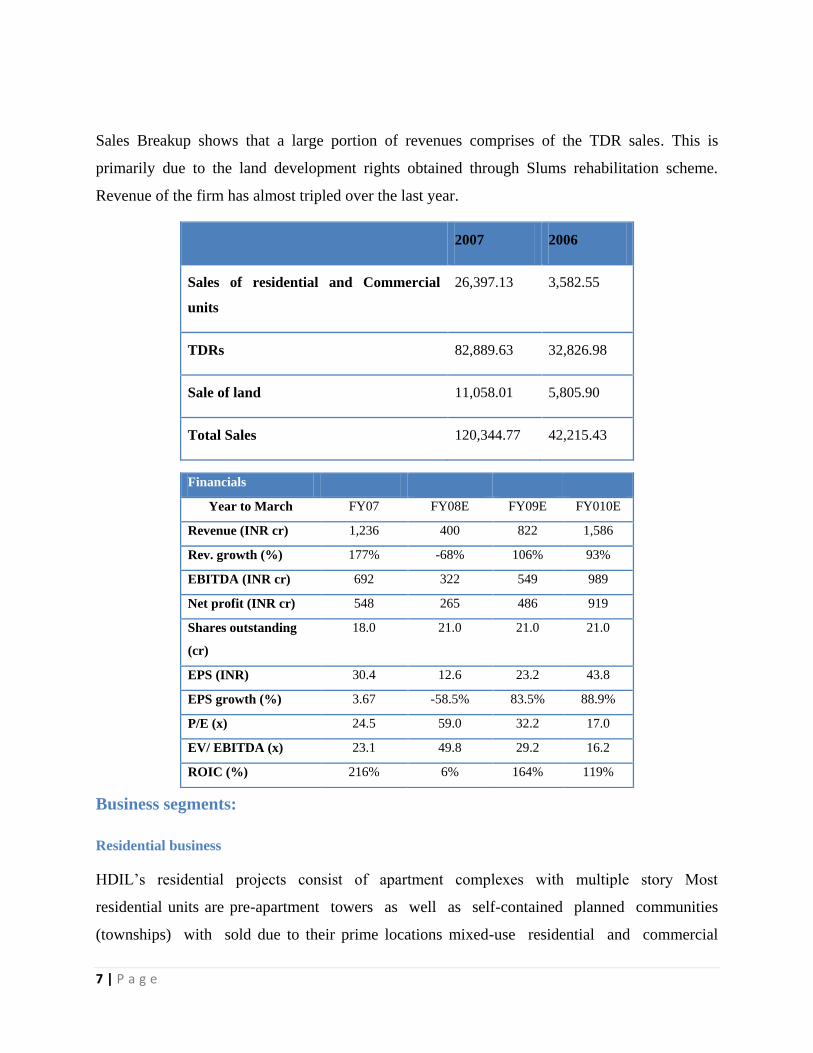
The company‟s land reserves have mounted to 112.1 million sq. feet of saleable area as at May
2007 with bulk of the land located in MMR. HDIL has 21 projects totaling 45.5 million sq. feet
under development with 11 more aggregating 66.6 million sq. feet planned for execution by
2012. These projects are located in MMR, Kochi and Hyderabad.
77.21%
0.12%
16.94%
5.73%
Project Profile 2008-12
Residential
Commercial
Retail
Slum Rehabilitation
18%
6%
5%
20%
51%
Project Profile till 2007
Residential
Commercial
Retail
Slum Rehabilitation
7 | P a g e
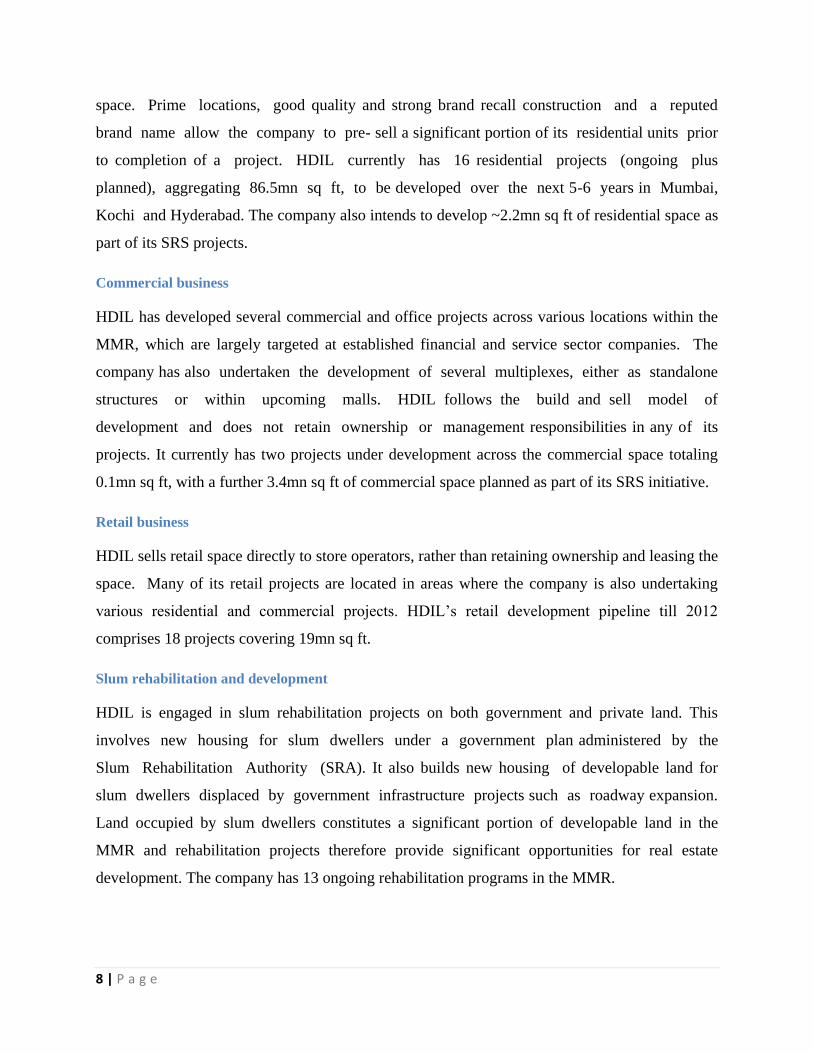
Sales Breakup shows that a large portion of revenues comprises of the TDR sales. This is
primarily due to the land development rights obtained through Slums rehabilitation scheme.
Revenue of the firm has almost tripled over the last year.
2007 2006
Sales of residential and Commercial
units
26,397.13 3,582.55
TDRs 82,889.63 32,826.98
Sale of land 11,058.01 5,805.90
Total Sales 120,344.77 42,215.43
Business segments:
Residential business
HDIL‟s residential projects consist of apartment complexes with multiple story Most
residential units are pre-apartment towers as well as self-contained planned communities
(townships) with sold due to their prime locations mixed-use residential and commercial
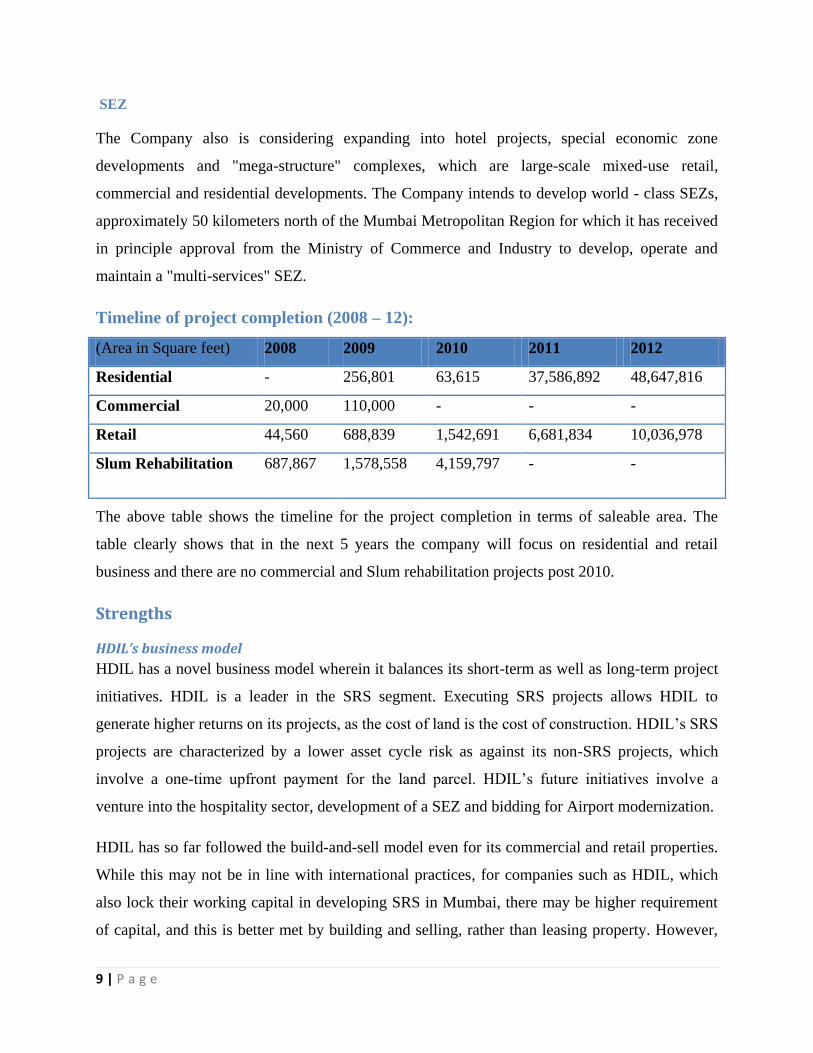
Financials
Year to March FY07 FY08E FY09E FY010E
Revenue (INR cr) 1,236 400 822 1,586
Rev. growth (%) 177% -68% 106% 93%
EBITDA (INR cr) 692 322 549 989
Net profit (INR cr) 548 265 486 919
Shares outstanding
(cr)
18.0 21.0 21.0 21.0
EPS (INR) 30.4 12.6 23.2 43.8
EPS growth (%) 3.67 -58.5% 83.5% 88.9%
P/E (x) 24.5 59.0 32.2 17.0
EV/ EBITDA (x) 23.1 49.8 29.2 16.2
ROIC (%) 216% 6% 164% 119%
8 | P a g e
space. Prime locations, good quality and strong brand recall construction and a reputed
brand name allow the company to pre- sell a significant portion of its residential units prior
to completion of a project. HDIL currently has 16 residential projects (ongoing plus
planned), aggregating 86.5mn sq ft, to be developed over the next 5-6 years in Mumbai,
Kochi and Hyderabad. The company also intends to develop ~2.2mn sq ft of residential space as
part of its SRS projects.
Commercial business
HDIL has developed several commercial and office projects across various locations within the
MMR, which are largely targeted at established financial and service sector companies. The
company has also undertaken the development of several multiplexes, either as standalone
structures or within upcoming malls. HDIL follows the build and sell model of
development and does not retain ownership or management responsibilities in any of its
projects. It currently has two projects under development across the commercial space totaling
0.1mn sq ft, with a further 3.4mn sq ft of commercial space planned as part of its SRS initiative.
Retail business
HDIL sells retail space directly to store operators, rather than retaining ownership and leasing the
space. Many of its retail projects are located in areas where the company is also undertaking
various residential and commercial projects. HDIL‟s retail development pipeline till 2012
comprises 18 projects covering 19mn sq ft.
Slum rehabilitation and development
HDIL is engaged in slum rehabilitation projects on both government and private land. This
involves new housing for slum dwellers under a government plan administered by the
Slum Rehabilitation Authority (SRA). It also builds new housing of developable land for
slum dwellers displaced by government infrastructure projects such as roadway expansion.
Land occupied by slum dwellers constitutes a significant portion of developable land in the
MMR and rehabilitation projects therefore provide significant opportunities for real estate
development. The company has 13 ongoing rehabilitation programs in the MMR.
9 | P a g e
SEZ
The Company also is considering expanding into hotel projects, special economic zone
developments and "mega-structure" complexes, which are large-scale mixed-use retail,
commercial and residential developments. The Company intends to develop world - class SEZs,
approximately 50 kilometers north of the Mumbai Metropolitan Region for which it has received
in principle approval from the Ministry of Commerce and Industry to develop, operate and
maintain a "multi-services" SEZ.
Timeline of project completion (2008 – 12):
(Area in Square feet) 2008 2009 2010 2011 2012
Residential - 256,801 63,615 37,586,892 48,647,816
Commercial 20,000 110,000 - - -
Retail 44,560 688,839 1,542,691 6,681,834 10,036,978
Slum Rehabilitation 687,867 1,578,558 4,159,797 - -
The above table shows the timeline for the project completion in terms of saleable area. The
table clearly shows that in the next 5 years the company will focus on residential and retail
business and there are no commercial and Slum rehabilitation projects post 2010.
Strengths
HDIL’s business model
HDIL has a novel business model wherein it balances its short-term as well as long-term project
initiatives. HDIL is a leader in the SRS segment. Executing SRS projects allows HDIL to
generate higher returns on its projects, as the cost of land is the cost of construction. HDIL‟s SRS
projects are characterized by a lower asset cycle risk as against its non-SRS projects, which
involve a one-time upfront payment for the land parcel. HDIL‟s future initiatives involve a
venture into the hospitality sector, development of a SEZ and bidding for Airport modernization.
HDIL has so far followed the build-and-sell model even for its commercial and retail properties.
While this may not be in line with international practices, for companies such as HDIL, which
also lock their working capital in developing SRS in Mumbai, there may be higher requirement
of capital, and this is better met by building and selling, rather than leasing property. However,
10 | P a g e
this model has its disadvantages, as it would lead to bunching of revenues in some years. . This
would also result in fluctuating operating costs and negative cash flows. HDIL has, however,
offset this to some extent by regular sale of transferable development rights that it earns thorough
the slum rehab projects.
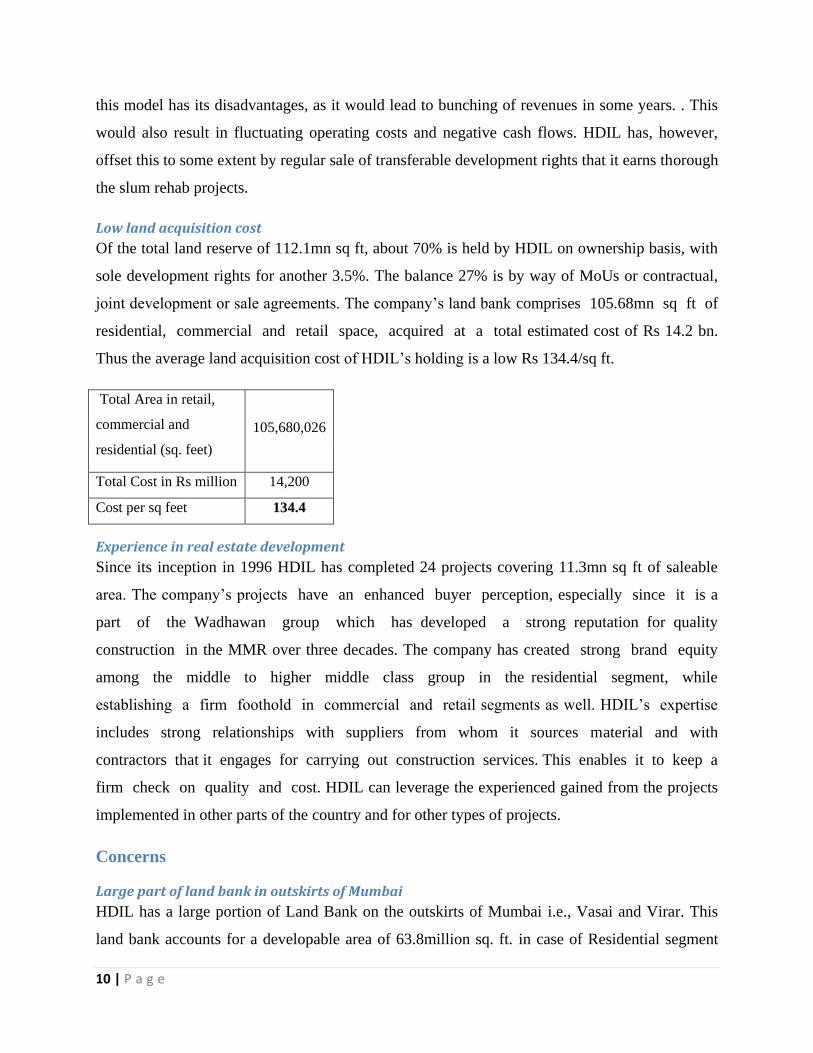
Low land acquisition cost
Of the total land reserve of 112.1mn sq ft, about 70% is held by HDIL on ownership basis, with
sole development rights for another 3.5%. The balance 27% is by way of MoUs or contractual,
joint development or sale agreements. The company‟s land bank comprises 105.68mn sq ft of
residential, commercial and retail space, acquired at a total estimated cost of Rs 14.2 bn.
Thus the average land acquisition cost of HDIL‟s holding is a low Rs 134.4/sq ft.
Total Area in retail,
commercial and
residential (sq. feet)
105,680,026
Total Cost in Rs million 14,200
Cost per sq feet 134.4
Experience in real estate development
Since its inception in 1996 HDIL has completed 24 projects covering 11.3mn sq ft of saleable
area. The company‟s projects have an enhanced buyer perception, especially since it is a
part of the Wadhawan group which has developed a strong reputation for quality
construction in the MMR over three decades. The company has created strong brand equity
among the middle to higher middle class group in the residential segment, while
establishing a firm foothold in commercial and retail segments as well. HDIL‟s expertise
includes strong relationships with suppliers from whom it sources material and with
contractors that it engages for carrying out construction services. This enables it to keep a
firm check on quality and cost. HDIL can leverage the experienced gained from the projects
implemented in other parts of the country and for other types of projects.
Concerns
Large part of land bank in outskirts of Mumbai
HDIL has a large portion of Land Bank on the outskirts of Mumbai i.e., Vasai and Virar. This
land bank accounts for a developable area of 63.8million sq. ft. in case of Residential segment
11 | P a g e
(i.e. 73.7% of the total developable area of this segment) and 13 million sq. ft. in case of Retail
projects. There might be lower realization than expected. Also there can be issues related to
occupancy in these areas.
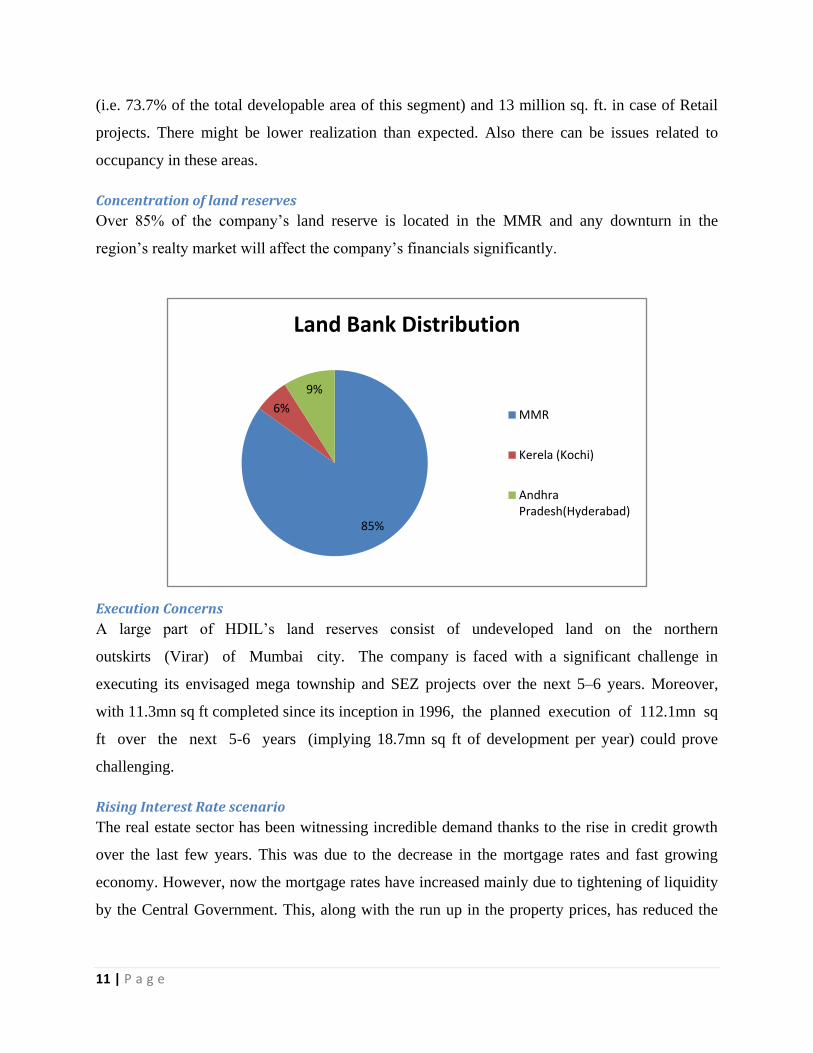
Concentration of land reserves
Over 85% of the company‟s land reserve is located in the MMR and any downturn in the
region‟s realty market will affect the company‟s financials significantly.
Execution Concerns
A large part of HDIL‟s land reserves consist of undeveloped land on the northern
outskirts (Virar) of Mumbai city. The company is faced with a significant challenge in
executing its envisaged mega township and SEZ projects over the next 5–6 years. Moreover,
with 11.3mn sq ft completed since its inception in 1996, the planned execution of 112.1mn sq
ft over the next 5-6 years (implying 18.7mn sq ft of development per year) could prove
challenging.
Rising Interest Rate scenario
The real estate sector has been witnessing incredible demand thanks to the rise in credit growth
over the last few years. This was due to the decrease in the mortgage rates and fast growing
economy. However, now the mortgage rates have increased mainly due to tightening of liquidity
by the Central Government. This, along with the run up in the property prices, has reduced the
85%
6%
9%
Land Bank Distribution
MMR
Kerela (Kochi)
Andhra Pradesh(Hyderabad)
12 | P a g e
transaction volume in the last few months. This is likely to dampen residential demand and could
affect the overall real estate market.
Valuations
The firm is valued using the DCF approach. With the time line of projects available, the cash
flow for the next 5 years can be determined with relative ease by considering a rate for per
square feet sales. However considering the next portion of sales requires assumptions on growth
rate. A growth rate of 10% was considered based on the sustainability
DCF
A three step valuation model was used to value the company. The key issue in valuing the firm
was post 2012. The company is considered a going concern and hence the profile of projects for
the period 2012 to 2017 is considered similar to those in the period 2008- 2012. The average
saleable area per year for the period 2008-2012 is 43.56 million square feet. The company can
sustain a growth of 10% with similar investment in the stocks of land in the next 5 years. For
terminal value calculation a growth rate of 5% was assumed and in order to see the variability of
share value with the terminal growth rate, sensitivity analysis was done.
Expenditure:
Operational expenditure was assumed on the basis of historical expense as a percentage of sales.
The expense was taken as 53% of sales for the period of 2008 – 2012. However the expense was
increased to 60% of sales on account of no SRS projects being scheduled post 2012. Also this
percentage was maintained as I believe that additional expenditure is required to sustain a 10%
growth for the period 2013-2017.
Discount rate:
The weighted average cost of capital method was used to determine the discount rate. CAPM
model was used to fine the cost of equity and cost of debt was taken as the interest payment on
the most recent debt raised by the company (Indian Overseas Bank, PLR + 1.5%). For beta,
bottom up beta calculation approach was used. Following were the values obtained
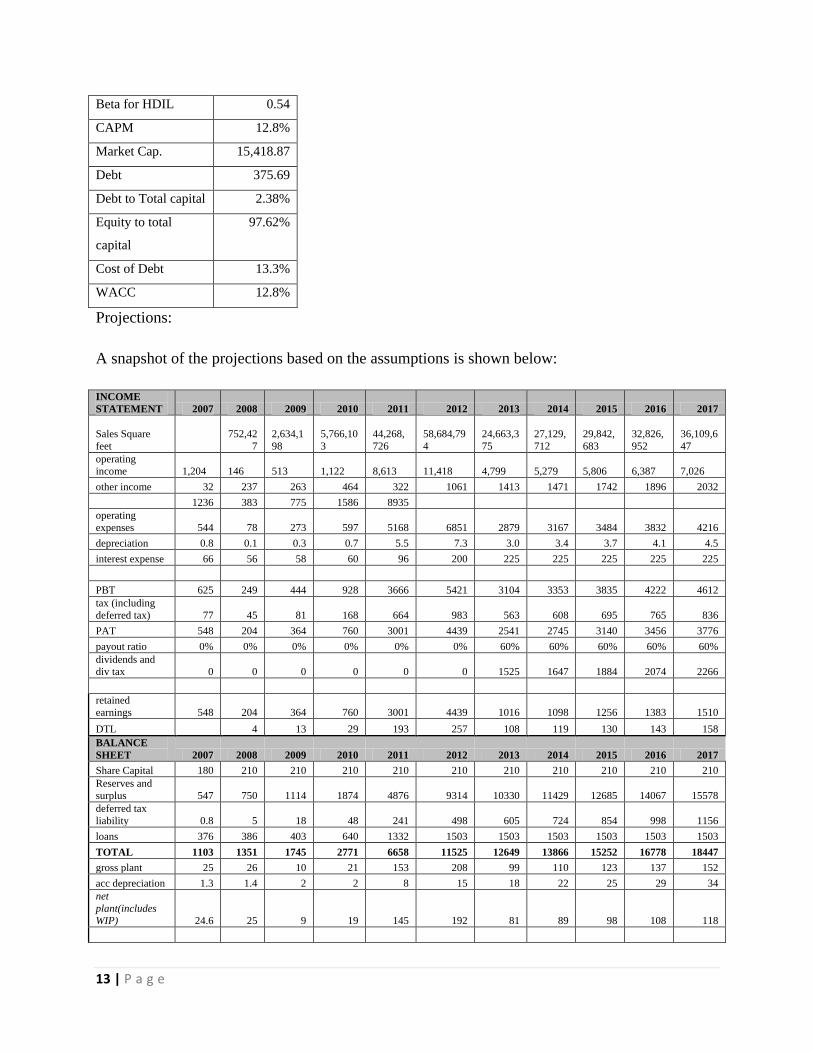
13 | P a g e
Beta for HDIL 0.54
CAPM 12.8%
Market Cap. 15,418.87
Debt 375.69
Debt to Total capital 2.38%
Equity to total
capital
97.62%
Cost of Debt 13.3%
WACC 12.8%
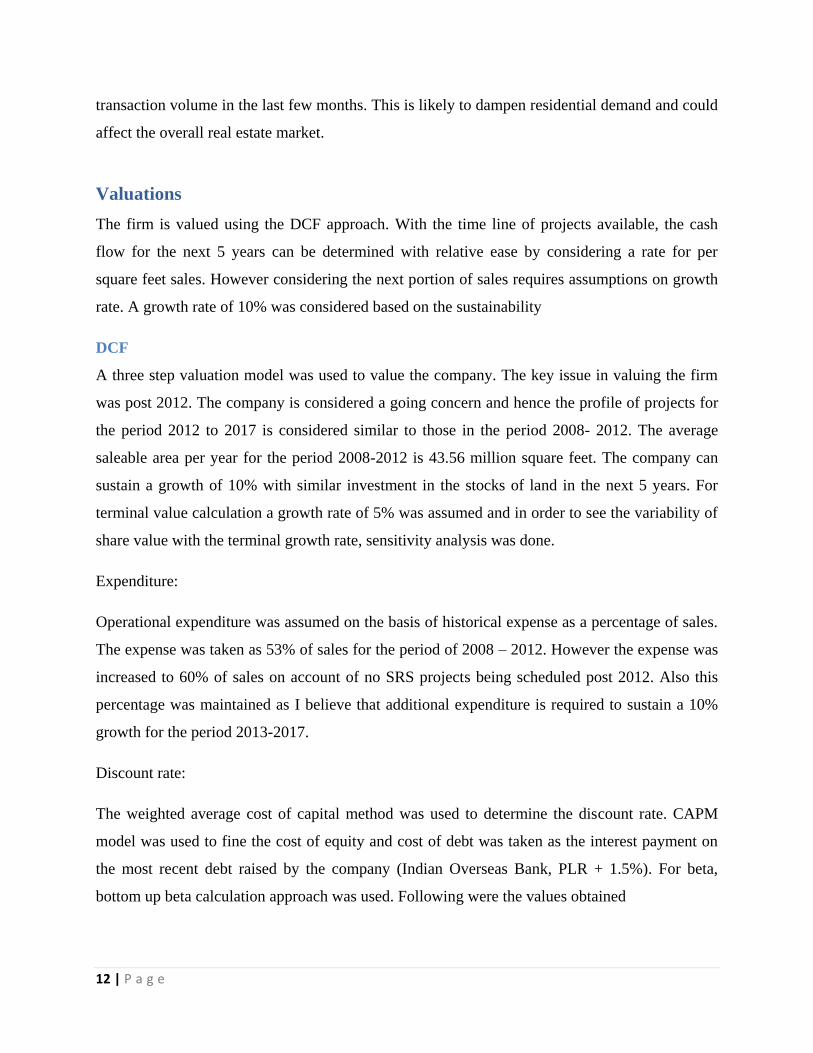
Projections:
A snapshot of the projections based on the assumptions is shown below:
INCOME
STATEMENT 2007 2008 2009 2010 2011 2012 2013 2014 2015 2016 2017
Sales Square
feet
752,42
7
2,634,1
98
5,766,10
3
44,268,
726
58,684,79
4
24,663,3
75
27,129,
712
29,842,
683
32,826,
952
36,109,6
47
operating
income
1,204
146
513
1,122
8,613
11,418
4,799
5,279
5,806
6,387
7,026
other income 32 237 263 464 322 1061 1413 1471 1742 1896 2032
1236 383 775 1586 8935
operating
expenses 544 78 273 597 5168 6851 2879 3167 3484 3832 4216
depreciation 0.8 0.1 0.3 0.7 5.5 7.3 3.0 3.4 3.7 4.1 4.5
interest expense 66 56 58 60 96 200 225 225 225 225 225
PBT 625 249 444 928 3666 5421 3104 3353 3835 4222 4612
tax (including
deferred tax) 77 45 81 168 664 983 563 608 695 765 836
PAT 548 204 364 760 3001 4439 2541 2745 3140 3456 3776
payout ratio 0% 0% 0% 0% 0% 0% 60% 60% 60% 60% 60%
dividends and
div tax 0 0 0 0 0 0 1525 1647 1884 2074 2266
retained
earnings 548 204 364 760 3001 4439 1016 1098 1256 1383 1510
DTL 4 13 29 193 257 108 119 130 143 158
BALANCE
SHEET 2007 2008 2009 2010 2011 2012 2013 2014 2015 2016 2017
Share Capital 180 210 210 210 210 210 210 210 210 210 210
Reserves and
surplus 547 750 1114 1874 4876 9314 10330 11429 12685 14067 15578
deferred tax
liability 0.8 5 18 48 241 498 605 724 854 998 1156
loans 376 386 403 640 1332 1503 1503 1503 1503 1503 1503
TOTAL 1103 1351 1745 2771 6658 11525 12649 13866 15252 16778 18447
gross plant 25 26 10 21 153 208 99 110 123 137 152
acc depreciation 1.3 1.4 2 2 8 15 18 22 25 29 34
net
plant(includes
WIP) 24.6 25 9 19 145 192 81 89 98 108 118
14 | P a g e
operatin assets 24.6 25 25 25 145 192 81 89 98 108 118
investments 165 1223 1358 2400 1663 5482 7300 7600 9000 9800 10500
operating WC 913 103 362 792 6084 8066 3390 3729 4102 4512 4963
non operating
WC 0 1879 2448 2053 2359 2865
TOTAL 1103 1351 1745 3217 7892 13740 12649 13866 15252 16778 18447
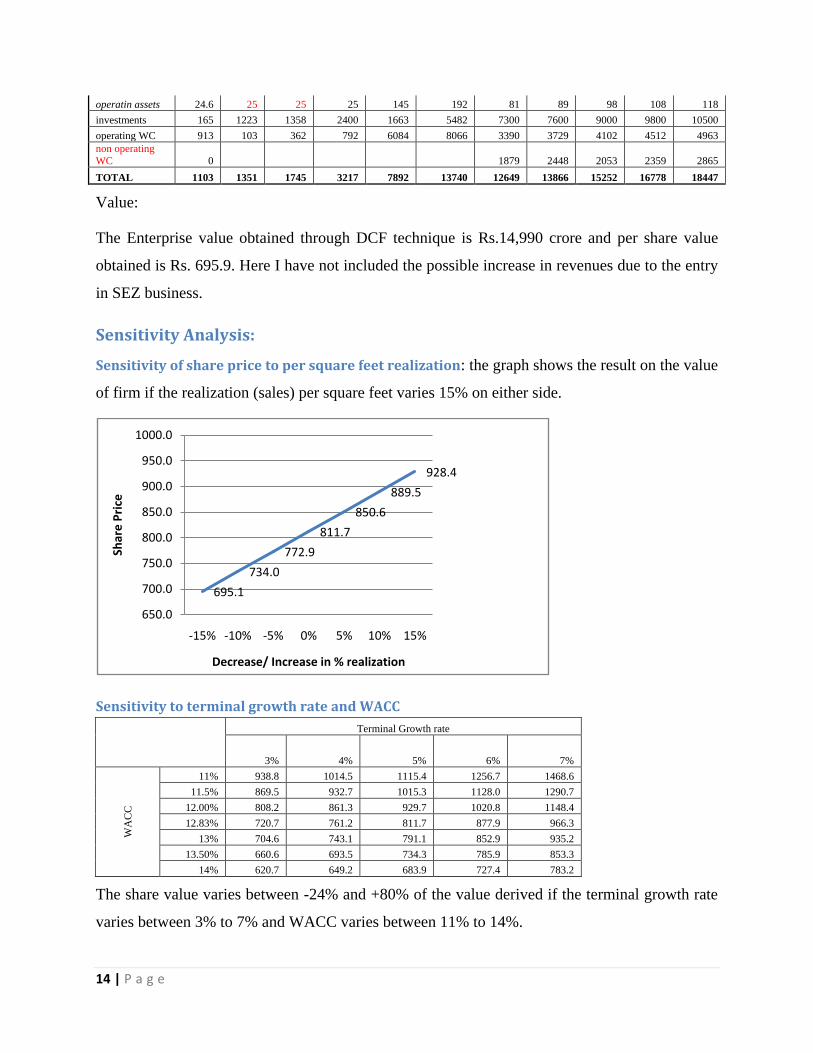
Value:
The Enterprise value obtained through DCF technique is Rs.14,990 crore and per share value
obtained is Rs. 695.9. Here I have not included the possible increase in revenues due to the entry
in SEZ business.
Sensitivity Analysis:
Sensitivity of share price to per square feet realization: the graph shows the result on the value
of firm if the realization (sales) per square feet varies 15% on either side.
Sensitivity to terminal growth rate and WACC
811.7
Terminal Growth rate
3% 4% 5% 6% 7%
WA
CC
11% 938.8 1014.5 1115.4 1256.7 1468.6
11.5% 869.5 932.7 1015.3 1128.0 1290.7
12.00% 808.2 861.3 929.7 1020.8 1148.4
12.83% 720.7 761.2 811.7 877.9 966.3
13% 704.6 743.1 791.1 852.9 935.2
13.50% 660.6 693.5 734.3 785.9 853.3
14% 620.7 649.2 683.9 727.4 783.2
The share value varies between -24% and +80% of the value derived if the terminal growth rate
varies between 3% to 7% and WACC varies between 11% to 14%.
695.1
734.0
772.9
811.7
850.6
889.5
928.4
650.0
700.0
750.0
800.0
850.0
900.0
950.0
1000.0
-15% -10% -5% 0% 5% 10% 15%
Shar
e P
rice
Decrease/ Increase in % realization
15 | P a g e
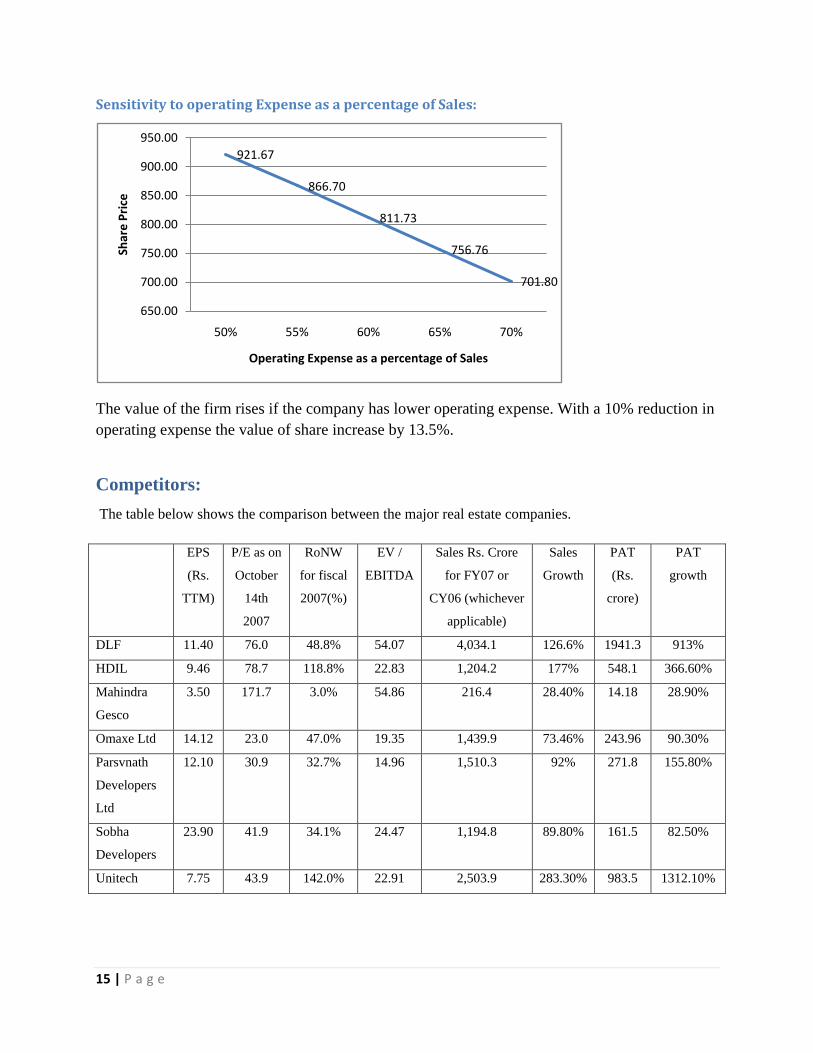
Sensitivity to operating Expense as a percentage of Sales:
The value of the firm rises if the company has lower operating expense. With a 10% reduction in
operating expense the value of share increase by 13.5%.
Competitors:
The table below shows the comparison between the major real estate companies.
EPS
(Rs.
TTM)
P/E as on
October
14th
2007
RoNW
for fiscal
2007(%)
EV /
EBITDA
Sales Rs. Crore
for FY07 or
CY06 (whichever
applicable)
Sales
Growth
PAT
(Rs.
crore)
PAT
growth
DLF 11.40 76.0 48.8% 54.07 4,034.1 126.6% 1941.3 913%
HDIL 9.46 78.7 118.8% 22.83 1,204.2 177% 548.1 366.60%
Mahindra
Gesco
3.50 171.7 3.0% 54.86 216.4 28.40% 14.18 28.90%
Omaxe Ltd 14.12 23.0 47.0% 19.35 1,439.9 73.46% 243.96 90.30%
Parsvnath
Developers
Ltd
12.10 30.9 32.7% 14.96 1,510.3 92% 271.8 155.80%
Sobha
Developers
23.90 41.9 34.1% 24.47 1,194.8 89.80% 161.5 82.50%
Unitech 7.75 43.9 142.0% 22.91 2,503.9 283.30% 983.5 1312.10%
921.67
866.70
811.73
756.76
701.80
650.00
700.00
750.00
800.00
850.00
900.00
950.00
50% 55% 60% 65% 70%
Shar
e P
rice
Operating Expense as a percentage of Sales
16 | P a g e
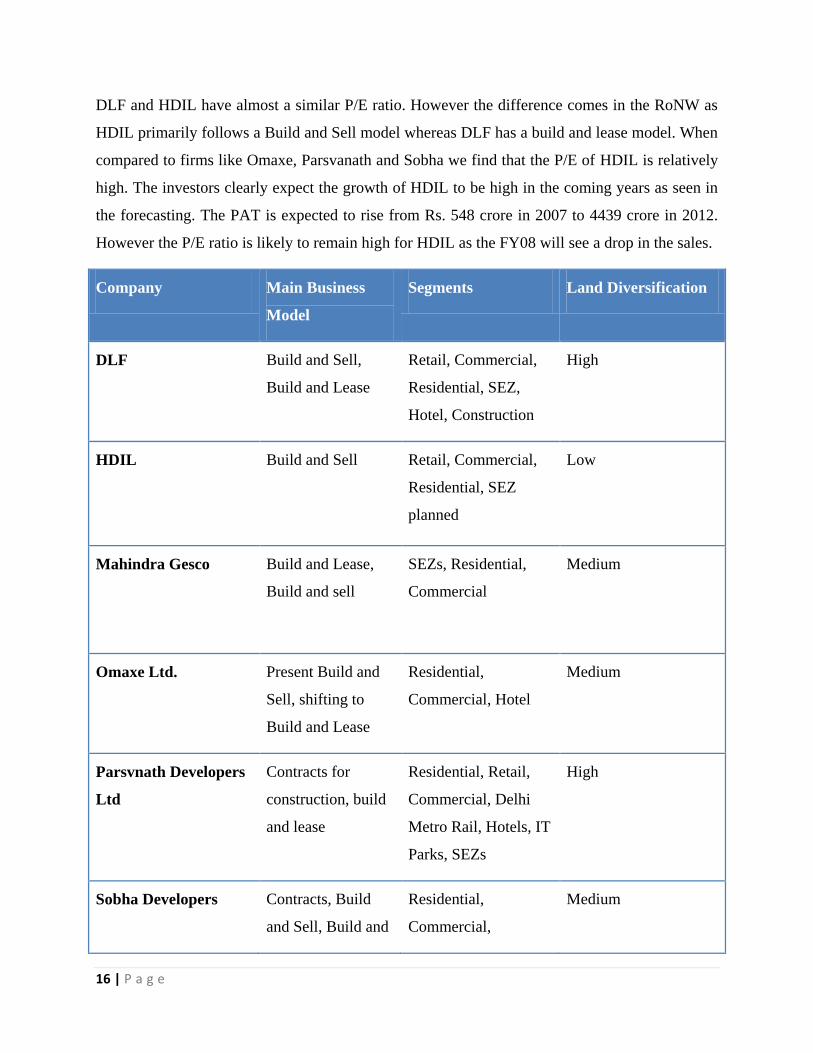
DLF and HDIL have almost a similar P/E ratio. However the difference comes in the RoNW as
HDIL primarily follows a Build and Sell model whereas DLF has a build and lease model. When
compared to firms like Omaxe, Parsvanath and Sobha we find that the P/E of HDIL is relatively
high. The investors clearly expect the growth of HDIL to be high in the coming years as seen in
the forecasting. The PAT is expected to rise from Rs. 548 crore in 2007 to 4439 crore in 2012.
However the P/E ratio is likely to remain high for HDIL as the FY08 will see a drop in the sales.
Company Main Business
Model
Segments Land Diversification
DLF Build and Sell,
Build and Lease
Retail, Commercial,
Residential, SEZ,
Hotel, Construction
High
HDIL Build and Sell Retail, Commercial,
Residential, SEZ
planned
Low
Mahindra Gesco Build and Lease,
Build and sell
SEZs, Residential,
Commercial
Medium
Omaxe Ltd. Present Build and
Sell, shifting to
Build and Lease
Residential,
Commercial, Hotel
Medium
Parsvnath Developers
Ltd
Contracts for
construction, build
and lease
Residential, Retail,
Commercial, Delhi
Metro Rail, Hotels, IT
Parks, SEZs
High
Sobha Developers Contracts, Build
and Sell, Build and
Residential,
Commercial,
Medium
17 | P a g e
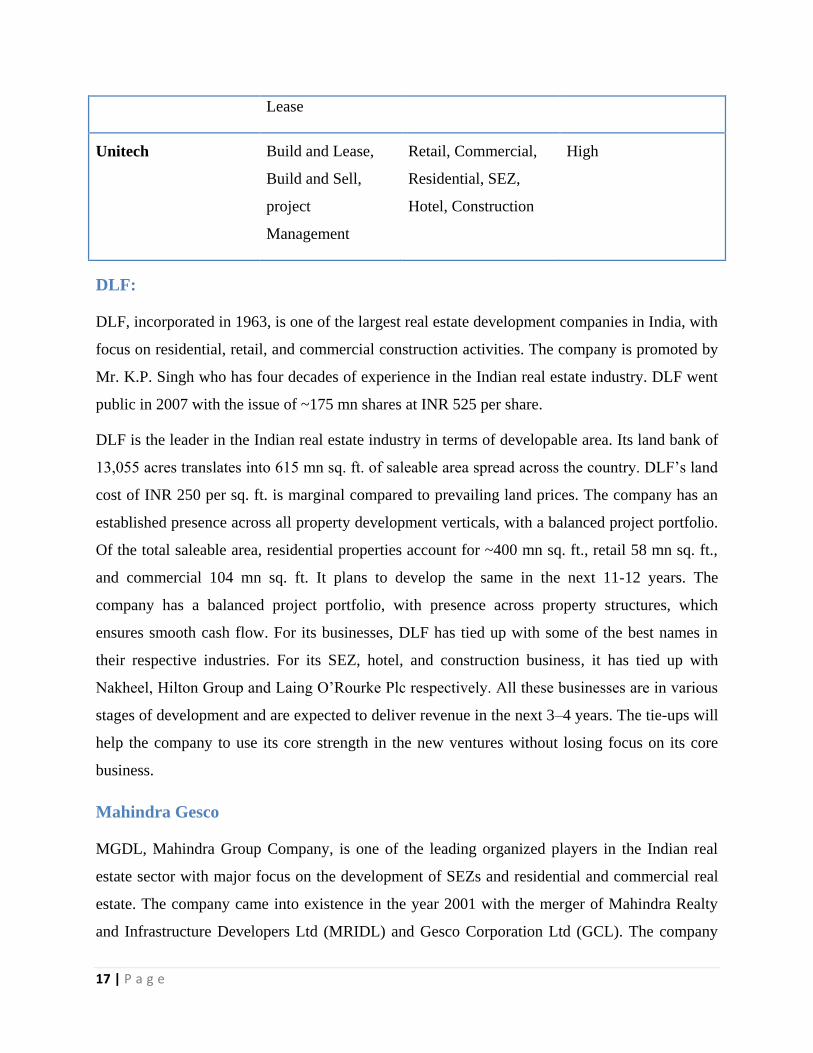
Lease
Unitech Build and Lease,
Build and Sell,
project
Management
Retail, Commercial,
Residential, SEZ,
Hotel, Construction
High
DLF:
DLF, incorporated in 1963, is one of the largest real estate development companies in India, with
focus on residential, retail, and commercial construction activities. The company is promoted by
Mr. K.P. Singh who has four decades of experience in the Indian real estate industry. DLF went
public in 2007 with the issue of ~175 mn shares at INR 525 per share.
DLF is the leader in the Indian real estate industry in terms of developable area. Its land bank of
13,055 acres translates into 615 mn sq. ft. of saleable area spread across the country. DLF‟s land
cost of INR 250 per sq. ft. is marginal compared to prevailing land prices. The company has an
established presence across all property development verticals, with a balanced project portfolio.
Of the total saleable area, residential properties account for ~400 mn sq. ft., retail 58 mn sq. ft.,
and commercial 104 mn sq. ft. It plans to develop the same in the next 11-12 years. The
company has a balanced project portfolio, with presence across property structures, which
ensures smooth cash flow. For its businesses, DLF has tied up with some of the best names in
their respective industries. For its SEZ, hotel, and construction business, it has tied up with
Nakheel, Hilton Group and Laing O‟Rourke Plc respectively. All these businesses are in various
stages of development and are expected to deliver revenue in the next 3–4 years. The tie-ups will
help the company to use its core strength in the new ventures without losing focus on its core
business.
Mahindra Gesco
MGDL, Mahindra Group Company, is one of the leading organized players in the Indian real
estate sector with major focus on the development of SEZs and residential and commercial real
estate. The company came into existence in the year 2001 with the merger of Mahindra Realty
and Infrastructure Developers Ltd (MRIDL) and Gesco Corporation Ltd (GCL). The company
18 | P a g e
executes various projects through its subsidiaries and joint ventures. It has four subsidiaries, out
of which three are incorporated for development of SEZ projects and one for its infrastructure
projects. The company drives more than 87 percent of its revenues from development of SEZ
and commercial and residential real estate. Additionally, it is also into the business of
implementing projects in the water and solid waste management.
Industry outlook for the real estate sector remains robust on the back of growing economy, huge
infrastructure investments expected in commercial & residential real estate and SEZs going
forward. MGDL, being the top five players in the real estate sector in India in terms of total land
bank, is best positioned to take the advantage of positive investment driven environment.
Omaxe Ltd.
Omaxe is a real estate development and construction company with presence in 30 cities and 9
states across India. It was established in 1989 as a construction and contracting company, which
diversified in to real estate development business after 2001 and currently has land bank of 3,255
acre. The company intends to diversify geographically by focusing on tier 2 and tier 3 cities.
The current land reserves of the company stands at 3,255 acre, out of which 3,096 acre relate to
the projects which are being executed or are under various stages of approval, and the remaining
159 acre relate to its future development plans. As at 31st March 2007, the developed area of its
completed projects was 5.13 million square feet, out of which about 73% developed area was for
its township projects and the remaining area was developed / built for its group housing projects
and commercial projects. The current projects under various stages of development and
approvals would provide saleable area of 149.82 million square feet
Parsvnath Developers Ltd
PDL has a land bank of around 259 mn sq feet, to develop the land bank through 109 project
consisting of 35 residential, 22 commercial, 18 township, seven Delhi Metro Rail Corporation
(DMRC), 17 hotels, five IT parks and five SEZs. Of the total land bank, 34% is in the national
capital region (NCR), 17% in Haryana, 11% in Punjab, 7% each in Rajasthan and Uttar Pradesh
(UP), 6% in Madhya Pradesh (MP), 4% in Kerala, 3% in Karnataka, 2% each in Delhi and Tamil
Nadu and 7% in other states. The company also plans to enter offshore real estate projects along
with Al-Hassan Group of Industries, Muscat, Oman.
19 | P a g e
There are 56 ongoing projects, totaling to 74mn sq ft under various stages of development to be
completed by 2010. The company recently launched „Parsvnath PrideAsia‟ a premium township
project in Chandigarh, spread over 123 acres. In Mumbai, the company recently received an
order to develop 40,000sq ft for BEST, at Mahim with estimated realizable value of around
Rs.700mn over the next 2 years. Earlier it had also bagged a project for re-development of Kurla
bus terminus, which will have modern passenger facilities and a commercial shopping complex.
Sobha Developers
Incorporated in 1965, Sobha Developers Limited (Sobha) is one of the leading premium real
estate developers in India. The Bangalore-based company has completed over 21 residential
projects with built up area of 2.98 mn sq ft and 75 contractual projects having a built up area of
8.42 mn sq ft. It has a land bank of 2,747 acres and land agreements for another 3,373 acres.
Most of the company‟s projects have been either residential or contractual and spread across
Bangalore, Mysore and Hyderabad. The company is now looking to diversify into other
geographies and across other segments.
Unitech
Started in 1972, Unitech is one of India‟s largest, most diversified realty companies with ~30
years of experience in infrastructure and realty development. A leading player in the National
Capital Region (NCR) and Kolkata markets, Unitech is now establishing a strong presence
across India with particular focus on Chennai, Hyderabad, Bangalore, Kochi, Mohali and Agra.
Unitech currently has land reserves of ~10,761 acres totaling ~500mn sq. ft. across the
residential, commercial, retail, hospitality and SEZ space. The company currently has ~50mn sq.
ft. under development (~21mn commercial; ~2mn retail; ~27mn residential). Unitech's thrust is a
low-risk/ high-return business model. It focuses on residential development (70% of future
revenues) where working capital requirements are low and has a strategy of acquiring large tracts
of land on the outskirts of cities & gradually developing them. This lowers price volatility and
drives price appreciation.

20 | P a g e
References:
CRIS INFAC “Construction Annual Review” – February 2006 for Sector information
For HDIL information
HDIL Website - http://www.hdil.in/
HDIL IPO red herring prospectus
HDIL annual report FY2007
Aswath Damodaran: Investment Valuation for DCF technique and Cost of capital computation
Sites visited for financials:
Omaxe Website - http://www.omaxe.com/main.php
Parsvnath Developers website - http://www.parsvnath.com/
DLF website at http://www.dlf-group.com/
Puravankara Website - http://www.puravankara.com/
Capitaline database
Related Documents


