HCCI and Stratified-Charge CI Engine Combustion Research John E. Dec Yi Yang and Nicolas Dronniou Sandia National Laboratories May 15, 2012 – 9:30 a.m. U.S. DOE, Office of Vehicle Technologies Annual Merit Review and Peer Evaluation Program Manager: Gurpreet Singh Project ID: ACE004 This presentation does not contain any proprietary, confidential, or otherwise restricted information.

Welcome message from author
This document is posted to help you gain knowledge. Please leave a comment to let me know what you think about it! Share it to your friends and learn new things together.
Transcript

HCCI and Stratified-Charge CI Engine Combustion Research
John E. Dec Yi Yang and Nicolas Dronniou
Sandia National Laboratories
May 15, 2012 – 9:30 a.m.
U.S. DOE, Office of Vehicle Technologies Annual Merit Review and Peer Evaluation
Program Manager: Gurpreet Singh Project ID: ACE004
This presentation does not contain any proprietary, confidential, or otherwise restricted information.

Timeline ● Project provides fundamental
research to support DOE/Industry advanced engine projects.
● Project directions and continuation are evaluated annually.
Budget ● Project funded by DOE/VT:
FY11 – $750k FY12 – $760k
Barriers ● Increase the efficiency of HCCI
(LTC). ● Extend HCCI (LTC) operating
range to higher loads. ● Improve the understanding of
in-cylinder processes.
Partners / Collaborators ● Project Lead: Sandia ⇒ John E. Dec ● Part of Advanced Engine Combustion
working group – 15 industrial partners ● General Motors – specific collaboration ● LLNL – support kinetic modeling ● Univ. of Michigan – thermal strat. ● Univ. of New South Wales, Australia ● Chevron – advanced fuels for HCCI ● LDRD – advanced biofuels project
(internal Sandia funding)
Overview
Objectives - Relevance
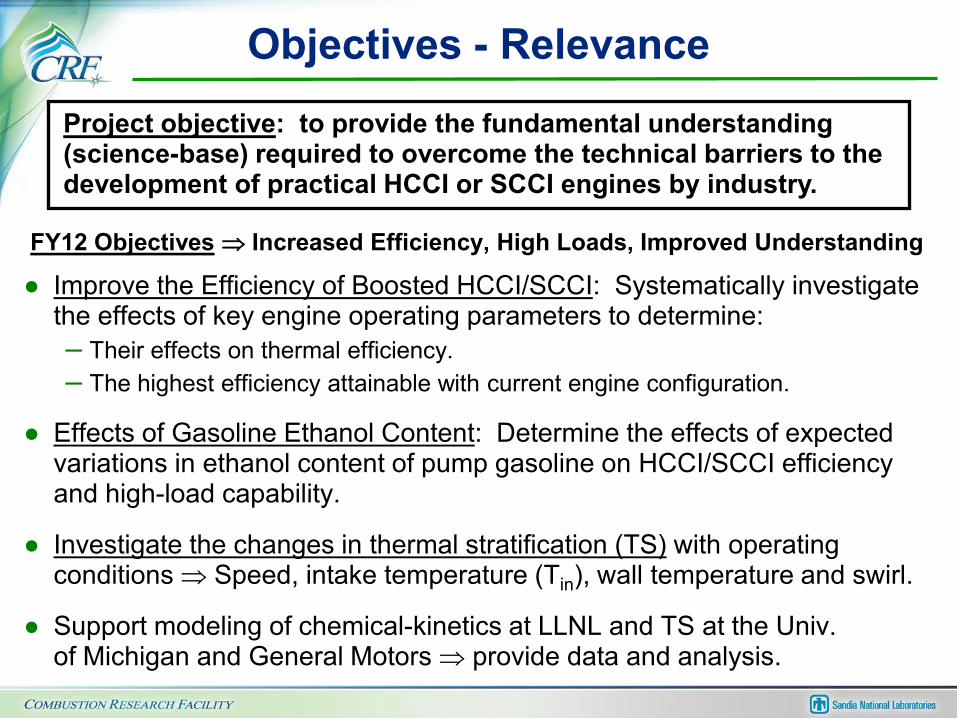
FY12 Objectives ⇒ Increased Efficiency, High Loads, Improved Understanding
● Improve the Efficiency of Boosted HCCI/SCCI: Systematically investigate the effects of key engine operating parameters to determine: – Their effects on thermal efficiency. – The highest efficiency attainable with current engine configuration.
● Effects of Gasoline Ethanol Content: Determine the effects of expected variations in ethanol content of pump gasoline on HCCI/SCCI efficiency and high-load capability.
● Investigate the changes in thermal stratification (TS) with operating conditions ⇒ Speed, intake temperature (Tin), wall temperature and swirl.
● Support modeling of chemical-kinetics at LLNL and TS at the Univ. of Michigan and General Motors ⇒ provide data and analysis.
Project objective: to provide the fundamental understanding (science-base) required to overcome the technical barriers to the development of practical HCCI or SCCI engines by industry.
Approach
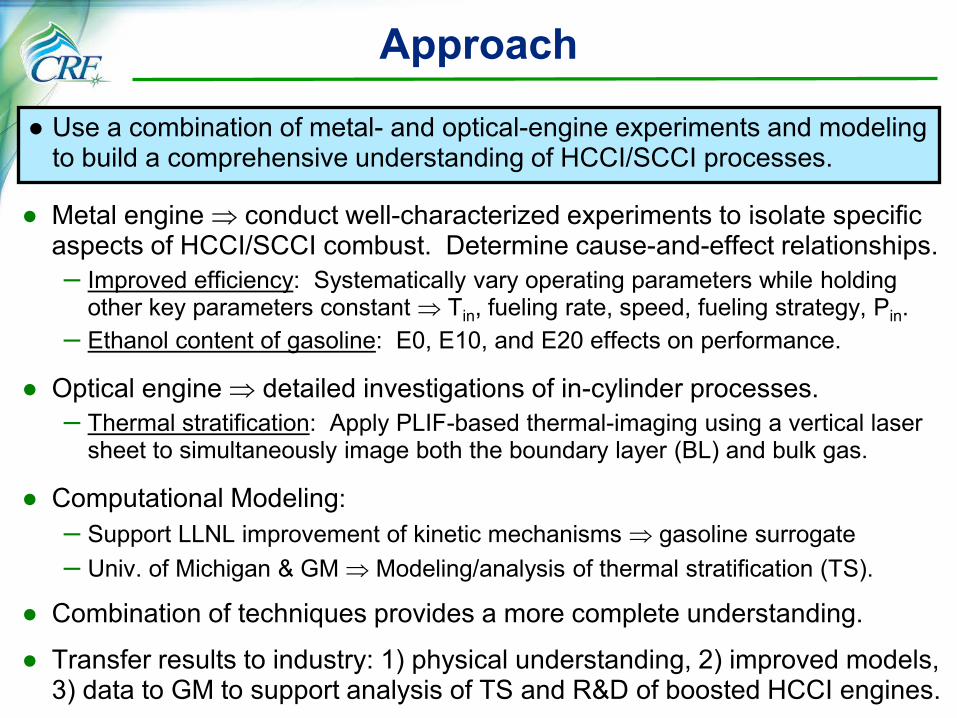
● Metal engine ⇒ conduct well-characterized experiments to isolate specific aspects of HCCI/SCCI combust. Determine cause-and-effect relationships. – Improved efficiency: Systematically vary operating parameters while holding
other key parameters constant ⇒ Tin, fueling rate, speed, fueling strategy, Pin. – Ethanol content of gasoline: E0, E10, and E20 effects on performance.
● Optical engine ⇒ detailed investigations of in-cylinder processes. – Thermal stratification: Apply PLIF-based thermal-imaging using a vertical laser
sheet to simultaneously image both the boundary layer (BL) and bulk gas.
● Computational Modeling: – Support LLNL improvement of kinetic mechanisms ⇒ gasoline surrogate – Univ. of Michigan & GM ⇒ Modeling/analysis of thermal stratification (TS).
● Combination of techniques provides a more complete understanding.
● Transfer results to industry: 1) physical understanding, 2) improved models, 3) data to GM to support analysis of TS and R&D of boosted HCCI engines.
● Use a combination of metal- and optical-engine experiments and modeling to build a comprehensive understanding of HCCI/SCCI processes.
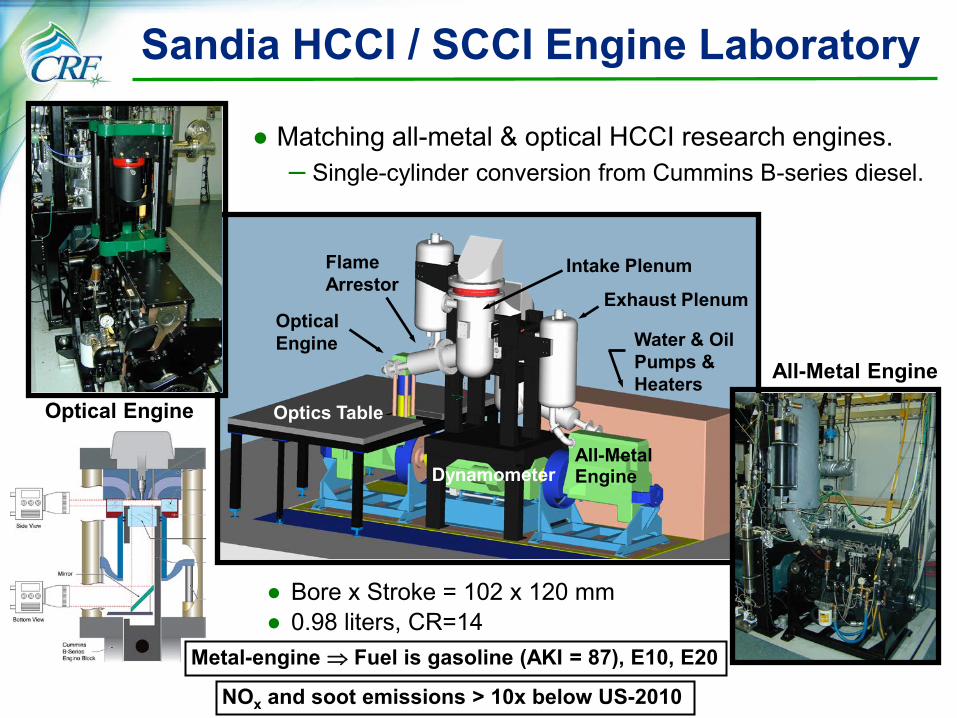
Sandia HCCI / SCCI Engine Laboratory
All-Metal Engine
Optical Engine
Optics Table
Dynamometer
Intake Plenum
Exhaust Plenum
Water & Oil Pumps & Heaters
Flame Arrestor
● Matching all-metal & optical HCCI research engines. – Single-cylinder conversion from Cummins B-series diesel.
Optical Engine
All-Metal Engine
● Bore x Stroke = 102 x 120 mm ● 0.98 liters, CR=14
Metal-engine ⇒ Fuel is gasoline (AKI = 87), E10, E20
NOx and soot emissions > 10x below US-2010

Accomplishments ● Determined effects of all main operating parameters on thermal efficiency.
(Tin, fueling rate, engine speed, fuel-type, fueling strategy, and Pin) – Found optimal values within constraints (i.e. acceptable ringing, emissions, etc.) – Combined optimal values to obtain highest eff. for current engine config. & fuels.
● Demonstrated indicated thermal efficiencies of 47 – 48% for loads from 8 to 16 bar IMEPg ⇒ for current CR = 14:1 configuration.
● Evaluated performance affects of increasing ethanol content of gasoline, from E0 E10 E20. (E10 complete, E20 initial results ⇒ on track for FY) – Showed max. load increase from 16.3 18.1 20.0 bar IMEPg, respectively.
● Significantly improved temperature-map imaging ⇒ 1) resolution, 2) SNR (signal/noise), & 3) post-processing to remove laser-sheet schlieren effects.
● Quantified variations in TS over range of conditions ⇒ speed, Tin, Twall, swirl – Conducted a PDF analysis of the TS at various conditions. – Initiated analysis of cold-pocket size.
● Supported chemical-kinetic model development at LLNL, and TS modeling at U. Michigan & General Motors ⇒ provided data and analysis.

43.544.044.545.045.546.046.547.047.548.0
20 30 40 50 60 70 80 90 100Intake Temperature [°C]
Gro
ss In
dica
ted
Ther
mal
Eff.
[%]
DI, Ringing = 5DI, CA50 = 376.7PM, Ringing = 5PM, CA50 = 376.7
Early DI vs. PreMixedFueling = 55 mg/inj
Pin = 2 bar, Gasoline
Improving Thermal Efficiency ● Advanced engines using HCCI or partially stratified variations termed
“SCCI” provide high efficiencies (~30% improvement over SI). – Use light-end distillates efficiently, and no aftertreatment for NOX and PM.
● Although thermal efficiencies of HCCI/SCCI are already very good, further increases are desirable.
● Conduct a systematic study of factors affecting thermal efficiency (T-E) and seek the highest efficiency for our current engine configuration.
● Initial work presented last year showed T-E increased with reduced Tin. 1. Const. CA50 ⇒ Moderate increase in T-E
> Higher γ (↓EGR & ↓T) & less heat loss.
2. Const. ringing = 5 MW/m2 (const. PRR) ⇒ Premixed: T-E similar to const. CA50 ⇒ Early-DI: large increase in T-E. > Fuel not completely mixed ⇒ partial fuel
stratification (PFS) effect reduces HRR to allow CA50 advance (discussed later).
● Conclusion: Use the lowest Tin possible.
● Early-DI ⇒ use Tin = 30°
C. Premixed ⇒ Tin = 60°
C, no fuel condensation.

Fueling-Rate Effects ● Increase fueling from lowest φm for
stable combustion with EGR = 0%. – T-E increases with improved C-E. – Ringing increases due to higher φm
and more advanced CA50. – R > 5 or 6 ⇒ knock & incr. heat loss.
● Trade-off between improved C-E and heat loss ⇒ T-E drops for φm > 0.32. – T-E peaks at 47.6%, IMEPg ~9.5 bar
● Hold Ringing = 5 using EGR to retard CA50 ⇒ much higher loads.
● Initial CA50 retard hardly affects T-E, but reduction in T-E increases for CA50 > ~370°
CA. EGR also up.
44.5
45.0
45.5
46.0
46.5
47.0
47.5
48.0
0.3 0.32 0.34 0.36 0.38 0.4Charge-mass Equiv. Ratio [φm]
Indi
cate
d Th
erm
al E
ff. [%
]
93
94
95
96
97
98
99
100
Com
bust
ion
Eff.
[%]
T-E, EGR = 0
C-E, EGR = 044.5
45.0
45.5
46.0
46.5
47.0
47.5
48.0
0.3 0.32 0.34 0.36 0.38 0.4Charge-mass Equiv. Ratio [φm]
Indi
cate
d Th
erm
al E
ff. [%
]
93
94
95
96
97
98
99
100
Com
bust
ion
Eff.
[%]
T-E, EGR = 0T-E, Ringing = 5C-E, EGR = 0C-E, Ringing = 5
Gasoline, Pin = 2 bar, Tin = 30°
C, DI-60°
CA
0.0
2.0
4.0
6.0
8.0
10.0
0.3 0.32 0.34 0.36 0.38 0.4Charge-mass Equiv. Ratio [φm]
Rin
ging
Inte
nsity
[MW
/m2 ]
364
366
368
370
372
374
CA
50 [°
CA
]
Ringing, EGR = 0
CA50, EGR = 0
0.0
2.0
4.0
6.0
8.0
10.0
0.3 0.32 0.34 0.36 0.38 0.4Charge-mass Equiv. Ratio [φm]
Rin
ging
Inte
nsity
[MW
/m2 ]
364
366
368
370
372
374
CA
50 [°
CA
]
Ringing, EGR = 0Ringing, Ringing = 5CA50, EGR = 0CA50, Ringing = 5
~75% of max. load
● Best T-E ⇒ Adv. CA50 up to R ≈ 5 for each load (φm). ⇒ Lower loads give higher T-E as long as C-E ≥ ~96.5%.
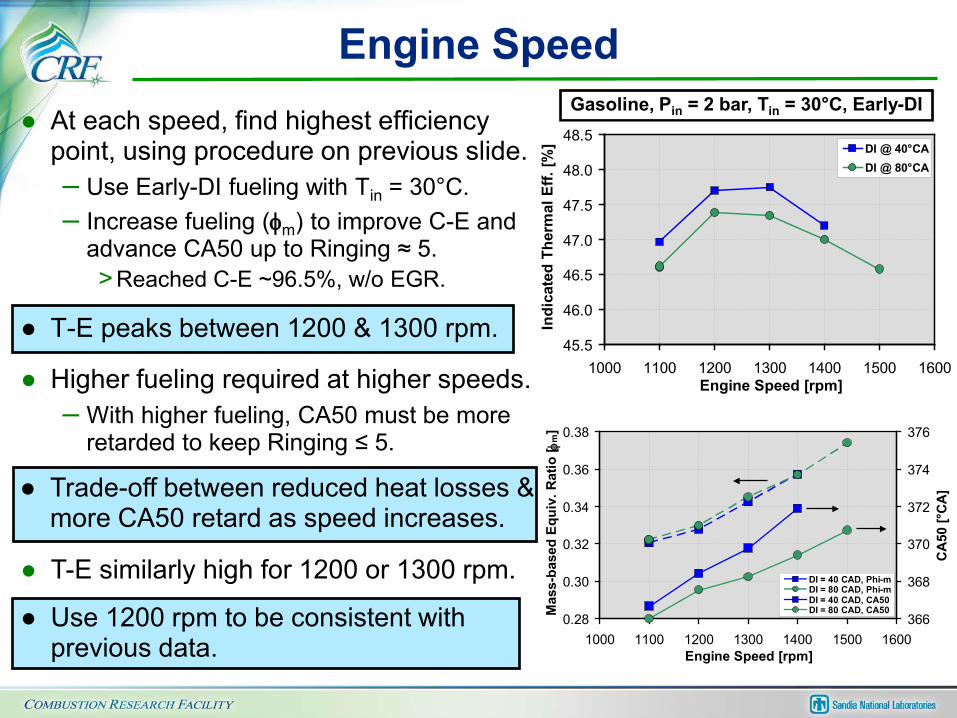
● At each speed, find highest efficiency point, using procedure on previous slide. – Use Early-DI fueling with Tin = 30°
C.
– Increase fueling (φm) to improve C-E and advance CA50 up to Ringing ≈ 5. > Reached C-E ~96.5%, w/o EGR.
● T-E peaks between 1200 & 1300 rpm.
● Higher fueling required at higher speeds. – With higher fueling, CA50 must be more
retarded to keep Ringing ≤ 5.
● T-E similarly high for 1200 or 1300 rpm.
● Use 1200 rpm to be consistent with previous data.
Engine Speed Gasoline, Pin = 2 bar, Tin = 30°C, Early-DI
45.5
46.0
46.5
47.0
47.5
48.0
48.5
1000 1100 1200 1300 1400 1500 1600Engine Speed [rpm]
Indi
cate
d Th
erm
al E
ff. [%
] DI @ 40°CADI @ 80°CA
0.28
0.30
0.32
0.34
0.36
0.38
1000 1100 1200 1300 1400 1500 1600Engine Speed [rpm]
Mas
s-ba
sed
Equi
v. R
atio
[ φm
]
366
368
370
372
374
376
CA
50 [°
CA
]
DI = 40 CAD, Phi-mDI = 80 CAD, Phi-mDI = 40 CAD, CA50DI = 80 CAD, CA50
● Trade-off between reduced heat losses & more CA50 retard as speed increases.
Fuel Type: E10 vs. Gasoline
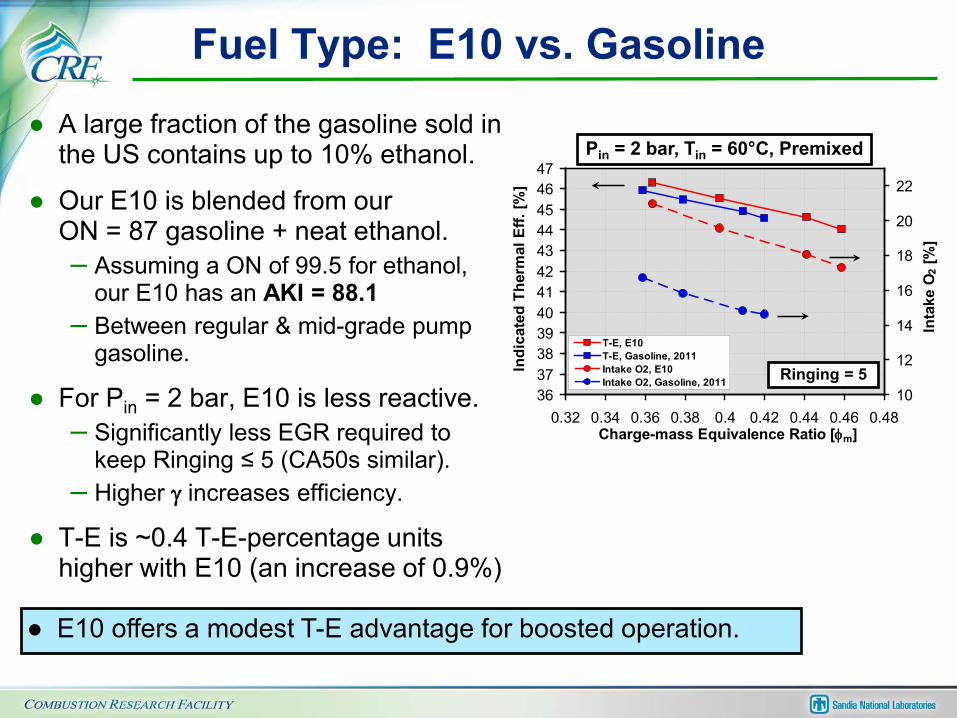
● A large fraction of the gasoline sold in the US contains up to 10% ethanol.
● Our E10 is blended from our ON = 87 gasoline + neat ethanol. – Assuming a ON of 99.5 for ethanol,
our E10 has an AKI = 88.1 – Between regular & mid-grade pump
gasoline.
● For Pin = 2 bar, E10 is less reactive. – Significantly less EGR required to
keep Ringing ≤ 5 (CA50s similar). – Higher γ increases efficiency.
● T-E is ~0.4 T-E-percentage units higher with E10 (an increase of 0.9%)
● E10 offers a modest T-E advantage for boosted operation.
363738394041424344454647
0.32 0.34 0.36 0.38 0.4 0.42 0.44 0.46 0.48Charge-mass Equivalence Ratio [φm]
Indi
cate
d Th
erm
al E
ff. [%
]
10
12
14
16
18
20
22
Inta
ke O
2 [%
]
T-E, E10T-E, Gasoline, 2011Intake O2, E10Intake O2, Gasoline, 2011
Pin = 2 bar, Tin = 60°
C, Premixed
Ringing = 5

43
44
45
46
47
48
49
900 1000 1100 1200 1300 1400 1500 1600IMEPg [kPa]
Indi
cate
d Th
erm
al E
ff. [%
]Pin = 2.4 bar, PM
43
44
45
46
47
48
49
900 1000 1100 1200 1300 1400 1500 1600IMEPg [kPa]
Indi
cate
d Th
erm
al E
ff. [%
]Pin = 2.4 bar, PFS
Pin = 2.4 bar, PM
43
44
45
46
47
48
49
900 1000 1100 1200 1300 1400 1500 1600IMEPg [kPa]
Indi
cate
d Th
erm
al E
ff. [%
]Pin = 2.4 bar, DI-60
Pin = 2.4 bar, PFS
Pin = 2.4 bar, PM
Fueling Strategy: PM, PFS, Early-DI Previous work, SAE 2011-01-0897 ● Gasoline autoignition becomes
sensitive to local φ with intake boost. ● Allows use of partial fuel stratification
(PFS) to significantly reduce PRRmax. – Premix ≥ 80% of fuel, late-DI for rest. – Higher loads for same CA50. – Advance CA50 for higher efficiency.
Recent Results with E10 (C-E ≥ 96%) ● PFS is also effective with E10 (~9%DI).
– Higher T-E and higher load.
● Early-DI fueling, further increases T-E. – Mixture similar to PFS, and Tin reduced
to 30°
C, less heat loss & higher γ. ● Example at Pin = 2.8 bar, const. fueling
shows increased T-E with increasing PFS and early-DI with Tin = 30°
C .
50
60
70
80
90
100
110
340 350 360 370 380 390Crank Angle [°CA]
Pres
sure
[bar
]
3% DI @ 300°CA6% DI @ 300°CA9% DI @ 300°CA13% DI @ 300°CA17% DI @ 300°CA20% DI @ 300°CA
Gasoline, φm = 0.44, Tin = 60°
C, CA50 = 374°
CA
43
44
45
46
47
48
49
900 1000 1100 1200 1300 1400 1500 1600IMEPg [kPa]
Indi
cate
d Th
erm
al E
ff. [%
]Pin = 2.4 bar, DI-60Pin = 2.4 bar, PFSPin = 2.4 bar, PMPin = 2.8 bar, DI-60Pin = 2.8 bar, PFSPin = 2.8 bar, PM
Early DI Tin=30°
C
PFS PreMixed
Increase Fueling
● PFS and Early-DI fueling increase T-E significantly for the same load.
E10, Tin = 60°
C
Pin = 2 bar

42
43
44
45
46
47
48
49
800 1000 1200 1400 1600 1800IMEPg [kPa]
Indi
cate
d Th
erm
al E
ff. [%
]
Pin = 2.4 bar, PM
Pin = 2.4 bar, PFS
Pin = 2.4 bar, DI-60
42
43
44
45
46
47
48
49
800 1000 1200 1400 1600 1800IMEPg [kPa]
Indi
cate
d Th
erm
al E
ff. [%
]
Pin = 2.0 bar, PMPin = 2.0 bar, PFSPin = 2.4 bar, PMPin = 2.4 bar, PFSPin = 2.4 bar, DI-60Pin = 2.8 bar, PMPin = 2.8 bar, PFSPin = 2.8 bar, DI-60Pin = 3.0 bar, PMPin = 3.0 bar, PFSPin = 3.2 bar, PMPin = 3.3 bar, PMPin = 3.4 bar, PM
Intake Pressure and Fueling Strategy ● Data acquired for wide range of intake pressures (Pin = 2.0 to 3.4 bar),
and three fueling strategies (PM, PFS, and Early-DI) show similar trends. – Load increases with boost, but curve shape is similar.
E10, Ringing = 5 MW/m2, C-E ≥ 96%
● For each Pin, T-E decreases with increased load mainly due to requirement to retard CA50 to prevent excessive ringing. EGR also increases with load.
● Replot T-E data against CA50.
42
43
44
45
46
47
48
49
364 366 368 370 372 374 376 378 380CA50 [°CA]
Indi
cate
d Th
erm
al E
ff. [%
]
Pin = 2.0 bar, PMPin = 2.0 bar, PFSPin = 2.4 bar, PMPin = 2.4 bar, PFSPin = 2.8 bar, PMPin = 2.8 bar, PFSPin = 3.0 bar, PMPin = 3.0 bar, PFSPin = 3.2 bar, PMPin = 3.3 bar, PMPin = 3.4 bar, PM
42
43
44
45
46
47
48
49
364 366 368 370 372 374 376 378 380CA50 [°CA]
Indi
cate
d Th
erm
al E
ff. [%
]
47
48
49
50
51
52
53
54
Sim
ulat
ed T
herm
al E
ff. [%
]
Pin = 2.0 bar, PMPin = 2.0 bar, PFSPin = 2.4 bar, PMPin = 2.4 bar, PFSPin = 2.8 bar, PMPin = 2.8 bar, PFSPin = 3.0 bar, PMPin = 3.0 bar, PFSPin = 3.2 bar, PMPin = 3.3 bar, PMPin = 3.4 bar, PMSimulation
42
43
44
45
46
47
48
49
364 366 368 370 372 374 376 378 380CA50 [°CA]
Indi
cate
d Th
erm
al E
ff. [%
]
Pin = 2.0 bar, PMPin = 2.0 bar, PFSPin = 2.4 bar, PMPin = 2.4 bar, PFSPin = 2.4 bar, DI-60Pin = 2.8 bar, PMPin = 2.8 bar, PFSPin = 2.8 bar, DI-60Pin = 3.0 bar, PMPin = 3.0 bar, PFSPin = 3.2 bar, PMPin = 3.3 bar, PMPin = 3.4 bar, PM
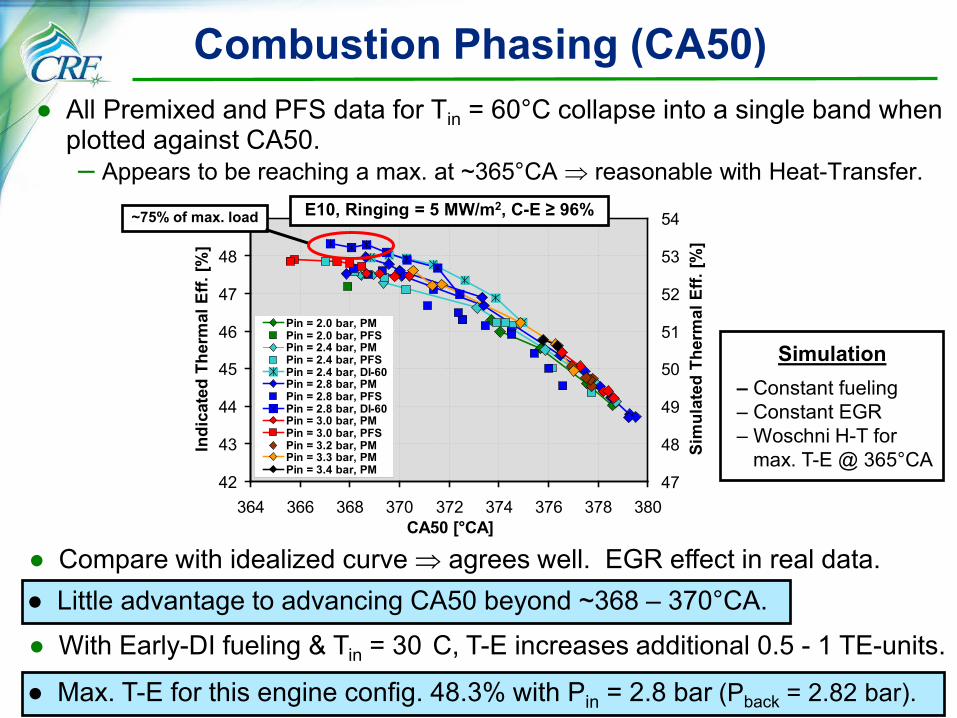
Combustion Phasing (CA50) ● All Premixed and PFS data for Tin = 60°
C collapse into a single band when plotted against CA50. – Appears to be reaching a max. at ~365°
CA ⇒ reasonable with Heat-Transfer.
● Compare with idealized curve ⇒ agrees well. EGR effect in real data.
● With Early-DI fueling & Tin = 30
C, T-E increases additional 0.5 - 1 TE-units.
E10, Ringing = 5 MW/m2, C-E ≥ 96%
Simulation – Constant fueling – Constant EGR – Woschni H-T for max. T-E @ 365°
CA
● Max. T-E for this engine config. 48.3% with Pin = 2.8 bar (Pback = 2.82 bar).
● Little advantage to advancing CA50 beyond ~368 – 370°
CA.
~75% of max. load

4142434445464748495051
4 6 8 10 12 14 16 18IMEPg [bar]
Indi
cate
d Th
erm
al E
ffici
ency
[%]
E0, Pin = 1.0 bar, Tin = 142°C E0, Pin = 1.3 bar, Tin = 121°CE0, Pin = 1.6 bar, Tin = 92°C E0, Pin = 2.0 bar, Tin = 30, 45 & 60°CE0, Pin = 2.4 bar, Tin = 30, 40 & 50°C E0, Pin = 2.8 bar, Tin = 50°C, PME10, Pin = 2.0 bar, Tin = 60°C E10, Pin = 2.4 bar, Tin = 60°CE10, Pin = 2.8 bar, Tin = 60°C E10, Pin = 3.0 bar, Tin = 60°CE10, Pin = 3.3 bar, Tin = 60°C E10, Pin = 2.4 bar, Tin = 30°CE10, Pin = 2.8 bar, Tin = 30°C Max. Load E10, Pin = 3.4 bar, Tin=60°CMax. Load, Gas., SAE 2010-01-1086
Summary of Efficiency Improvements ● T-E increased well above the values for the high-load limit from initial
boost study in SAE 2010-01-1086.
● Gasoline ⇒ reached T-Es of 47 - 47.8% from 8 to 13.5 bar IMEPg.
● E10 ⇒ reached T-Es of 47 – 48.3% from 9.5 to 16 bar IMEPg – Achieve 16 bar IMEPg, 47% T-E with Pin = 2.8 bar, vs. 3.25 bar for gasoline.
High-Efficiency Points, Ringing ≤ 5
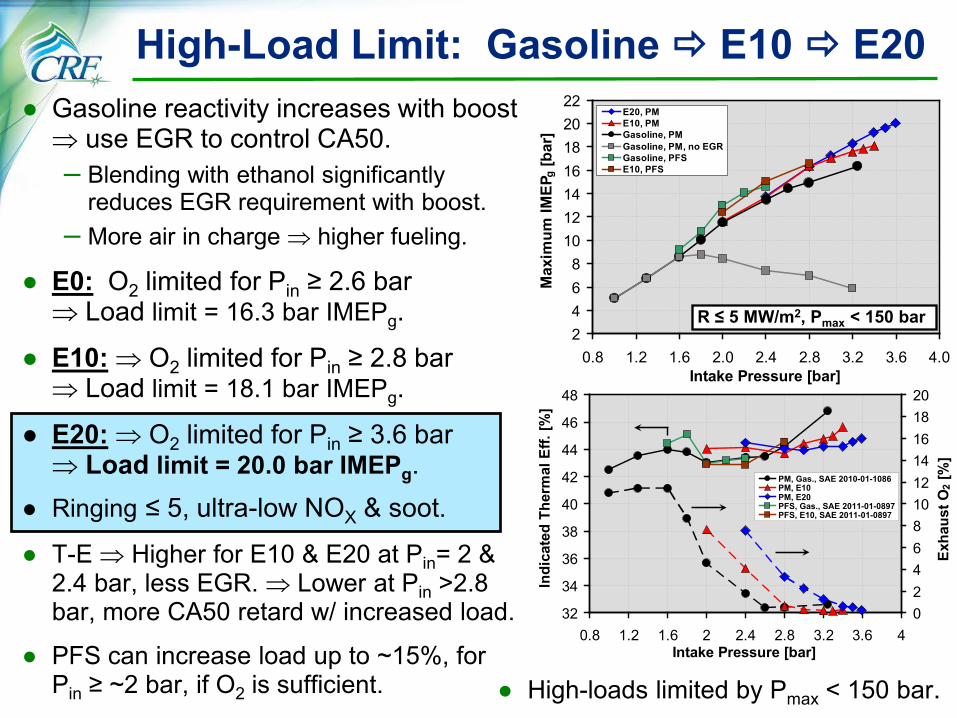
● Gasoline reactivity increases with boost ⇒ use EGR to control CA50. – Blending with ethanol significantly
reduces EGR requirement with boost. – More air in charge ⇒ higher fueling.
● E0: O2 limited for Pin ≥ 2.6 bar ⇒ Load limit = 16.3 bar IMEPg.
● E10: ⇒ O2 limited for Pin ≥ 2.8 bar ⇒ Load limit = 18.1 bar IMEPg.
● E20: ⇒ O2 limited for Pin ≥ 3.6 bar ⇒ Load limit = 20.0 bar IMEPg.
● Ringing ≤ 5, ultra-low NOX & soot.
● T-E ⇒ Higher for E10 & E20 at Pin= 2 & 2.4 bar, less EGR. ⇒ Lower at Pin >2.8 bar, more CA50 retard w/ increased load.
● PFS can increase load up to ~15%, for Pin ≥ ~2 bar, if O2 is sufficient.
High-Load Limit: Gasoline E10 E20
2468
10121416182022
0.8 1.2 1.6 2.0 2.4 2.8 3.2 3.6 4.0Intake Pressure [bar]
Max
imum
IMEP
g [b
ar]
Gasoline, PM
Gasoline, PM, no EGR
2468
10121416182022
0.8 1.2 1.6 2.0 2.4 2.8 3.2 3.6 4.0Intake Pressure [bar]
Max
imum
IMEP
g [b
ar]
E10, PM
Gasoline, PM
Gasoline, PM, no EGR
2468
10121416182022
0.8 1.2 1.6 2.0 2.4 2.8 3.2 3.6 4.0Intake Pressure [bar]
Max
imum
IMEP
g [b
ar]
E20, PM
E10, PMGasoline, PM
Gasoline, PM, no EGR
2468
10121416182022
0.8 1.2 1.6 2.0 2.4 2.8 3.2 3.6 4.0Intake Pressure [bar]
Max
imum
IMEP
g [b
ar]
E20, PME10, PMGasoline, PMGasoline, PM, no EGRGasoline, PFSE10, PFS
R ≤ 5 MW/m2, Pmax < 150 bar
● High-loads limited by Pmax < 150 bar.
32
34
36
38
40
42
44
46
48
0.8 1.2 1.6 2 2.4 2.8 3.2 3.6 4Intake Pressure [bar]
Indi
cate
d Th
erm
al E
ff. [%
]
02468101214161820
Exha
ust O
2 [%
]
PM, Gas., SAE 2010-01-1086
32
34
36
38
40
42
44
46
48
0.8 1.2 1.6 2 2.4 2.8 3.2 3.6 4Intake Pressure [bar]
Indi
cate
d Th
erm
al E
ff. [%
]
02468101214161820
Exha
ust O
2 [%
]
PM, Gas., SAE 2010-01-1086
PM, E10
32
34
36
38
40
42
44
46
48
0.8 1.2 1.6 2 2.4 2.8 3.2 3.6 4Intake Pressure [bar]
Indi
cate
d Th
erm
al E
ff. [%
]
02468101214161820
Exha
ust O
2 [%
]
PM, Gas., SAE 2010-01-1086
PM, E10
PM, E20
32
34
36
38
40
42
44
46
48
0.8 1.2 1.6 2 2.4 2.8 3.2 3.6 4Intake Pressure [bar]
Indi
cate
d Th
erm
al E
ff. [%
]
02468101214161820
Exha
ust O
2 [%
]
PM, Gas., SAE 2010-01-1086PM, E10PM, E20PFS, Gas., SAE 2011-01-0897PFS, E10, SAE 2011-01-0897

Intake valve recess Firedeck Injector blank recess
Quartz window Aluminum
New shot-to-shot beam steering correction.
ΔT (K)
before
after
Improved Thermal-Stratification Imaging ● Temperature-maps (T-maps) derived
from PLIF images with toluene tracer.
● Switch to non-intensified, back-illum. CCD camera, mounted closer. ⇒ Greatly improves resolution & S/N.
● Allows accurate image analysis.
● Improved image correction techniques remove stripes with less effect on T. ⇒ Accurate Std-Dev of T-maps.
● TS results mainly from cold structures.
Field of view
CCD vs ICCD doubles resolution and reduces shot noise at TDC by 2.4x
Side-view imaging shows bulk-gas & wall regions
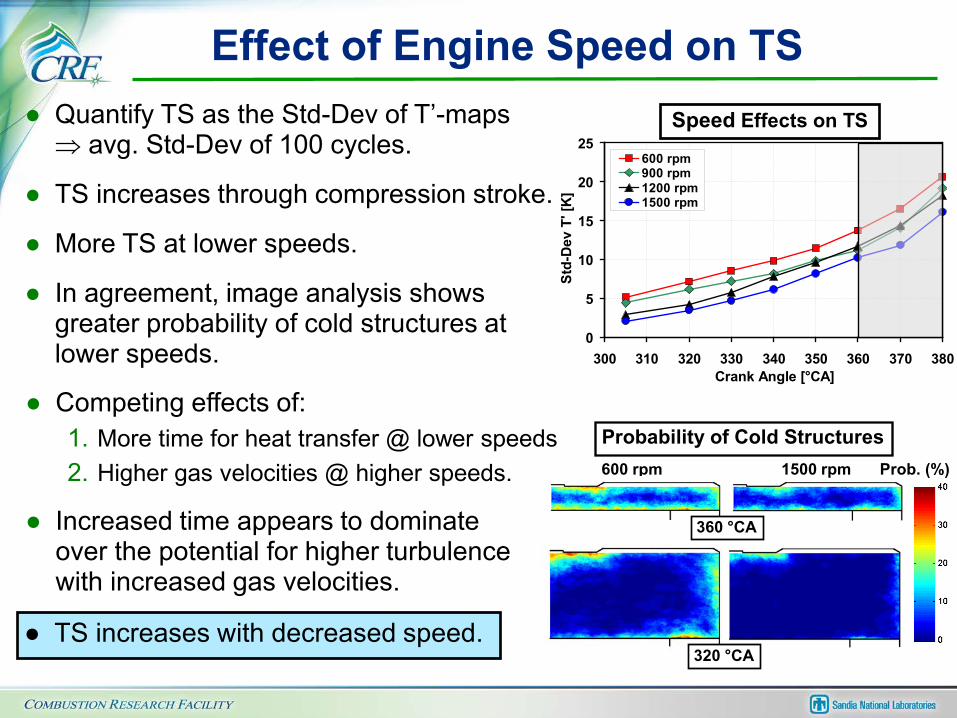
● Quantify TS as the Std-Dev of T’-maps ⇒ avg. Std-Dev of 100 cycles.
● TS increases through compression stroke.
● More TS at lower speeds.
● In agreement, image analysis shows greater probability of cold structures at lower speeds.
Effect of Engine Speed on TS
Probability of Cold Structures
Prob. (%)
320 °CA
600 rpm 1500 rpm
360 °CA
0
5
10
15
20
25
300 310 320 330 340 350 360 370 380Crank Angle [°CA]
Std-
Dev
T' [
K]
600 rpm900 rpm1200 rpm1500 rpm
Speed Effects on TS
● Competing effects of: 1. More time for heat transfer @ lower speeds 2. Higher gas velocities @ higher speeds.
● Increased time appears to dominate over the potential for higher turbulence with increased gas velocities.
● TS increases with decreased speed.

Effects of Tin and Tcoolant on TS
● TS increases with increasing Tin ⇒ also with decreased Tcoolant
● Expected that increased ∆T = Tbulk-gas – Twall would increase TS.
● However, TS converges for CA ≥ 340°
– Mainly because TS curves for the higher
Tin (and greater ∆T) begin to flatten.
● Possibly due to over mixing reducing the TS. ⇒ Effect should be larger for larger ∆T.
● PDFs of temperature distribution also indicate that over mixing could be occurring. – Negative skewness indicates that the PDF
width is increased by mixing in cold gases. – Less skewness for CA > 330°
suggests mixing
out bulk-gas faster than bringing in new cold gas.
● TS increases with increased Tin & lower Tcoolant, but gain appears less than expected by TDC.
Temp. PDFs
Skewness of PDFs
Tin Effects on TS

Collaborations ● Project is conducted in close cooperation with U.S. Industry through the
Advanced Engine Combustion (AEC) / HCCI Working Group, under a memorandum of understanding (MOU). – Ten OEMs, Five energy companies, Four national labs, & Several universities.
● LLNL: Support development of chemical-kinetic mechanism for gasoline surrogate mixture, Pitz et al.
● General Motors: Frequent internet meetings ⇒ in-depth discussions. – Provide data to support GM efforts on boosted HCCI & in modeling TS (with UM).
● U. of Michigan: Collaborate on modeling and analysis of TS and boundary-layer development ⇒ provide data and in-depth discussions (with GM).
● U. of New South Wales: Support modeling of ethanol-fueled HCCI.
● Chevron: Funds-In project on advanced petroleum-based fuels for HCCI.
● SNL-LDRD: Funds-In project on biofuels produced by fungi ⇒ collab. with researchers in basic chemistry (C. Taatjes et al.) & Biofuels (M. Hadi et al.).

Future Work Increased Efficiency and Performance of Boosted HCCI ● Explore increasing the thermal efficiency of boosted HCCI by raising the
compression ratio (or expansion-ratio only using a Miller-cycle cam).
● Determine the performance potential of various realistic fuels: – Complete investigation of effects of ethanol content of gasoline (E0 E20). – Expand study to include premium gasoline ⇒ potential compared to E10 or E20.
● Work w/ Cummins to modify cyl. head for spark plug for studies of SA-HCCI. Thermal Stratification ● Expand current studies to: 1) further investigate whether over-mixing limits
TS at some conditions, 2) include variation of piston-top T, & 3) flow effects. – Potential collaboration with J. Oefelein et al. for LES modeling of TS.
● Investigate the potential of obtaining Boundary-Layer Profiles at the piston-top surface from T-map images ⇒ simultaneous Twall & heat-flux data.
Support of HCCI Modeling ● Continue collab. with GM & U. of Mich. on modeling TS and boosted HCCI. ● Continue to collaborate with LLNL on improving chemical-kinetic
mechanisms of single components and gasoline-surrogate mixture.

Summary ● Results presented have significantly improved fundamental understanding
of HCCI / SCCI with respect to the barriers of: 1) increased efficiency, 2) increased load, and 3) improved understanding of in-cylinder processes.
● Examined all key operating parameters affecting thermal efficiency (T-E) of boosted HCCI / SCCI engines ⇒ determined tradeoffs and limits. – Achieved highest gross-ind. T-E for current engine config. and fuel-set of 48.3%. – Demonstrated T-Es of 47-48% from 8 – 16 bar IMEPg using E0 & E10 gasolines.
● Showed that Partial Fuel Stratification significantly improves T-E across the fuel-load range for various Pin ⇒ and it increased high-load limit for given Pin.
● Early-DI fueling gives a PFS-like mixture with similar benefits, and it allows a lower Tin = 30°
C without fuel condensation for a further increase in T-E.
● For boosted HCCI/SCCI, E10 gives higher T-E and higher loads than E0.
● Extended the high-load limit by increasing ethanol content E0 E10 E20. ⇒ Achieved high-loads of 18.1 & 20.0 bar IMEPg for E10 & E20, respect’ly.
● Showed TS increases with engine speed, Tin, lower Tcoolant, and swirl. – Discovered that over mixing may be reducing the TS during late compression for
higher Tin and lower Tcoolant conditions.

Technical Backup Slides

Definitions of T-maps T-map
Average thermal stratification T-map (T=T+T’)
Total thermal stratification
RMS of the 100 T-maps.
Shows the location of the cycle-to-cycle temperature variations.
Average of the 100 T-maps.
Shows only the consistent TS patterns.
Includes both the consistent boundary layers at the walls and the fluctuating TS in the bulk gas.
Driven by in-cylinder turbulence.
Most important for controlling PRR by sequential auto-ignition in HCCI engines.
T’-map Fluctuating thermal stratification
TRMS Cycle-to-cycle variation σ (K)
ΔT (K)
Related Documents