HAZUS-MH: Earthquake Event Report Region Name: Earthquake Scenario: Print Date: Disclaimer: The estimates of social and economic impacts contained in this report were produced using HAZUS loss estimation methodology software which is based on current scientific and engineering knowledge. There are uncertainties inherent in any loss estimation technique. Therefore, there may be significant differences between the modeled results contained in this report and the actual social and economic losses following a specific earthquake. These results can be improved by using enhanced inventory, geotechnical, and observed ground motion data. Magna Earthquake Mw 5.2 ShakeMap Scenario Magna Earthquake Mw 5.2 ShakeMap Scenario October 16, 2009 Totals only reflect data for those census tracts/blocks included in the user’s study region.

Welcome message from author
This document is posted to help you gain knowledge. Please leave a comment to let me know what you think about it! Share it to your friends and learn new things together.
Transcript
HAZUS-MH: Earthquake Event Report
Region Name:
Earthquake Scenario:
Print Date:
Disclaimer:The estimates of social and economic impacts contained in this report were produced using HAZUS loss estimation methodology software
which is based on current scientific and engineering knowledge. There are uncertainties inherent in any loss estimation technique.
Therefore, there may be significant differences between the modeled results contained in this report and the actual social and economic
losses following a specific earthquake. These results can be improved by using enhanced inventory, geotechnical, and observed ground
motion data.
Magna Earthquake Mw 5.2 ShakeMap Scenario
Magna Earthquake Mw 5.2 ShakeMap Scenario
October 16, 2009
Totals only reflect data for those census tracts/blocks included in the user’s study region.

Table of Contents
Section Page #
General Description of the Region
Building and Lifeline Inventory 4
3
Building Inventory
Critical Facility Inventory
Transportation and Utility Lifeline Inventory
Earthquake Scenario Parameters 6
Direct Earthquake Damage 7
Buildings Damage
Critical Facilities Damage
Transportation and Utility Lifeline Damage
Induced Earthquake Damage 11
Fire Following Earthquake
Debris Generation
Social Impact
Shelter Requirements
Casualties
Economic Loss
12
Building Losses
Transportation and Utility Lifeline Losses
Long-term Indirect Economic Impacts
Appendix A: County Listing for the Region
Appendix B: Regional Population and Building Value Data
13
Page 2 of 20Earthquake Event Summary Report

HAZUS is a regional earthquake loss estimation model that was developed by the Federal Emergency Management Agency
and the National Institute of Building Sciences. The primary purpose of HAZUS is to provide a methodology and software
application to develop earthquake losses at a regional scale. These loss estimates would be used primarily by local, state
and regional officials to plan and stimulate efforts to reduce risks from earthquakes and to prepare for emergency response
and recovery.
The earthquake loss estimates provided in this report was based on a region that includes 17 county(ies) from the following
state(s):
General Description of the Region
Utah
Note:
Appendix A contains a complete listing of the counties contained in the region.
The geographical size of the region is 45,195.05 square miles and contains 444 census tracts. There are over 693
thousand households in the region and has a total population of 2,230,893 people (2005 Census Bureau data). The
distribution of population by State and County is provided in Appendix B.
There are an estimated 572 thousand buildings in the region with a total building replacement value (excluding contents) of
118,840 (millions of dollars). Approximately 94.00 % of the buildings (and 0.00% of the building value) are associated with
residential housing.
The replacement value of the transportation and utility lifeline systems is estimated to be 35,756 and 6,886 (millions of
dollars) , respectively.
Page 3 of 20Earthquake Event Summary Report
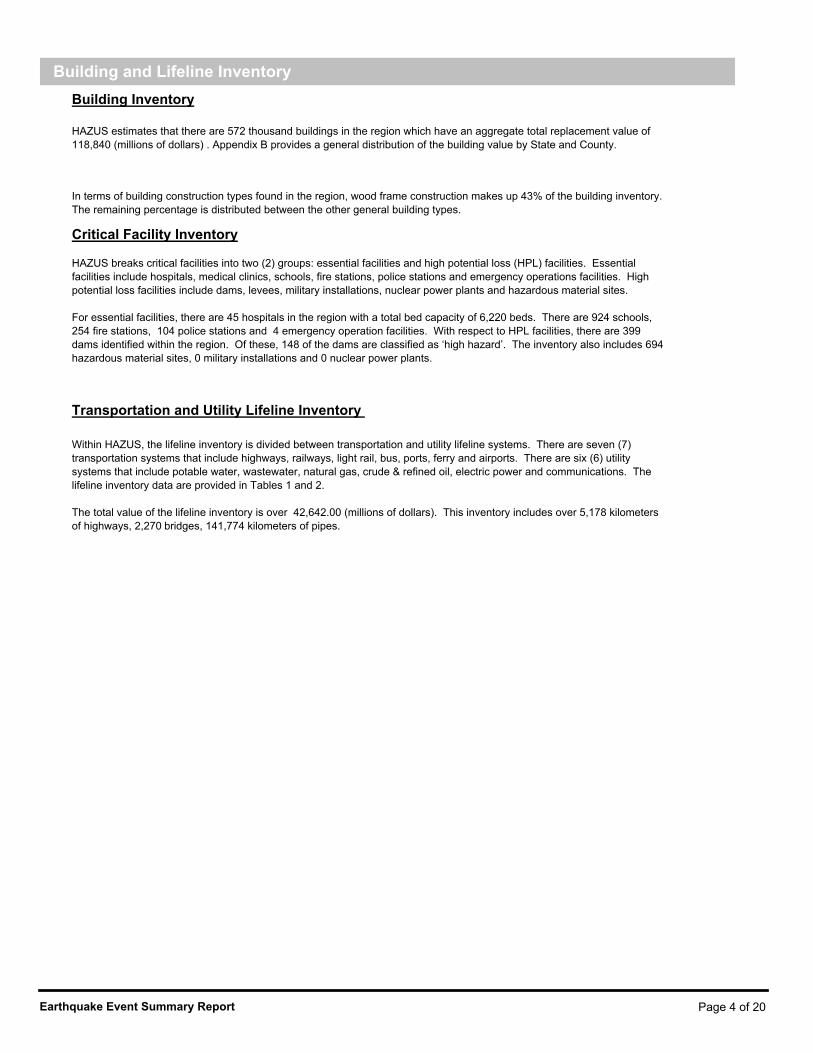
HAZUS estimates that there are 572 thousand buildings in the region which have an aggregate total replacement value of
118,840 (millions of dollars) . Appendix B provides a general distribution of the building value by State and County.
Building and Lifeline Inventory
Building Inventory
In terms of building construction types found in the region, wood frame construction makes up 43% of the building inventory.
The remaining percentage is distributed between the other general building types.
Critical Facility Inventory
HAZUS breaks critical facilities into two (2) groups: essential facilities and high potential loss (HPL) facilities. Essential
facilities include hospitals, medical clinics, schools, fire stations, police stations and emergency operations facilities. High
potential loss facilities include dams, levees, military installations, nuclear power plants and hazardous material sites.
For essential facilities, there are 45 hospitals in the region with a total bed capacity of 6,220 beds. There are 924 schools,
254 fire stations, 104 police stations and 4 emergency operation facilities. With respect to HPL facilities, there are 399
dams identified within the region. Of these, 148 of the dams are classified as ‘high hazard’. The inventory also includes 694
hazardous material sites, 0 military installations and 0 nuclear power plants.
Within HAZUS, the lifeline inventory is divided between transportation and utility lifeline systems. There are seven (7)
transportation systems that include highways, railways, light rail, bus, ports, ferry and airports. There are six (6) utility
systems that include potable water, wastewater, natural gas, crude & refined oil, electric power and communications. The
lifeline inventory data are provided in Tables 1 and 2.
The total value of the lifeline inventory is over 42,642.00 (millions of dollars). This inventory includes over 5,178 kilometers
of highways, 2,270 bridges, 141,774 kilometers of pipes.
Transportation and Utility Lifeline Inventory
Page 4 of 20Earthquake Event Summary Report
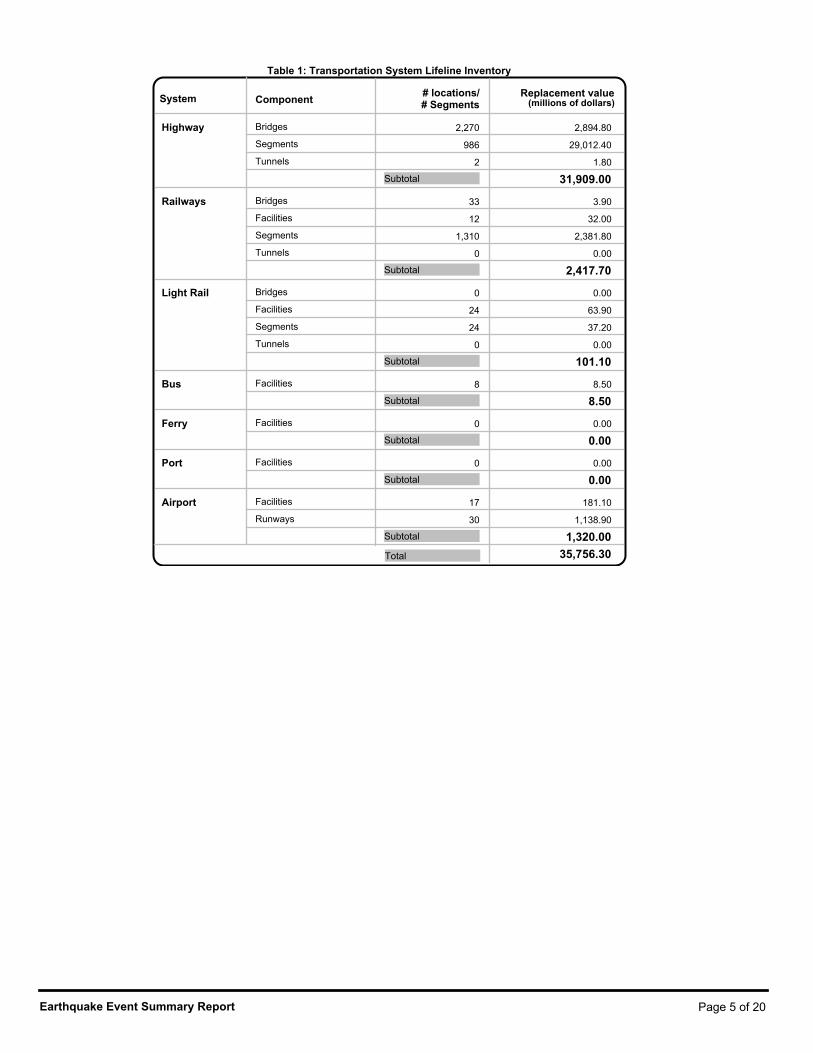
Table 1: Transportation System Lifeline Inventory
System Component# locations/# Segments
Replacement value(millions of dollars)
Bridges 2,270 2,894.80 Highway
Segments 986 29,012.40
Tunnels 2 1.80
31,909.00 Subtotal
Bridges 33 3.90 Railways
Facilities 12 32.00
Segments 1,310 2,381.80
Tunnels 0 0.00
2,417.70 Subtotal
Bridges 0 0.00 Light Rail
Facilities 24 63.90
Segments 24 37.20
Tunnels 0 0.00
101.10 Subtotal
Facilities 8 8.50 Bus
8.50 Subtotal
Facilities 0 0.00 Ferry
0.00 Subtotal
Facilities 0 0.00 Port
0.00 Subtotal
Facilities 17 181.10 Airport
Runways 30 1,138.90
1,320.00 Subtotal
Total 35,756.30
Page 5 of 20Earthquake Event Summary Report

Table 2: Utility System Lifeline Inventory
System Component# Locations /
Segments
Replacement value(millions of dollars)
Potable Water Distribution Lines 1,721.50 NA
Facilities 65.30 2
Pipelines 0.00 0
Subtotal 1,786.80
Waste Water Distribution Lines 1,032.90 NA
Facilities 3,067.60 47
Pipelines 0.00 0
Subtotal 4,100.50
Natural Gas Distribution Lines 688.60 NA
Facilities 2.10 2
Pipelines 1,341.60 479
Subtotal 2,032.40
Oil Systems Facilities 2.40 24
Pipelines 348.90 257
Subtotal 351.20
Electrical Power Facilities 2,048.20 19
Subtotal 2,048.20
Communication Facilities 10.20 104
Subtotal 10.20
Total 10,329.30
Page 6 of 20Earthquake Event Summary Report

Earthquake Scenario
HAZUS uses the following set of information to define the earthquake parameters used for the earthquake loss estimate
provided in this report.
Scenario Name
Latitude of Epicenter
Earthquake Magnitude
Depth (Km)
Attenuation Function
Type of Earthquake
Fault Name
Historical Epicenter ID #
Longitude of Epicenter
Probabilistic Return Period
Rupture Length (Km)
Rupture Orientation (degrees)
Magna Earthquake Mw 5.2 ShakeMap Scenario
User-defined
NA
NA
NA
NA
NA
5.20
NA
NA
NA
NA
Page 7 of 20Earthquake Event Summary Report
Building Damage
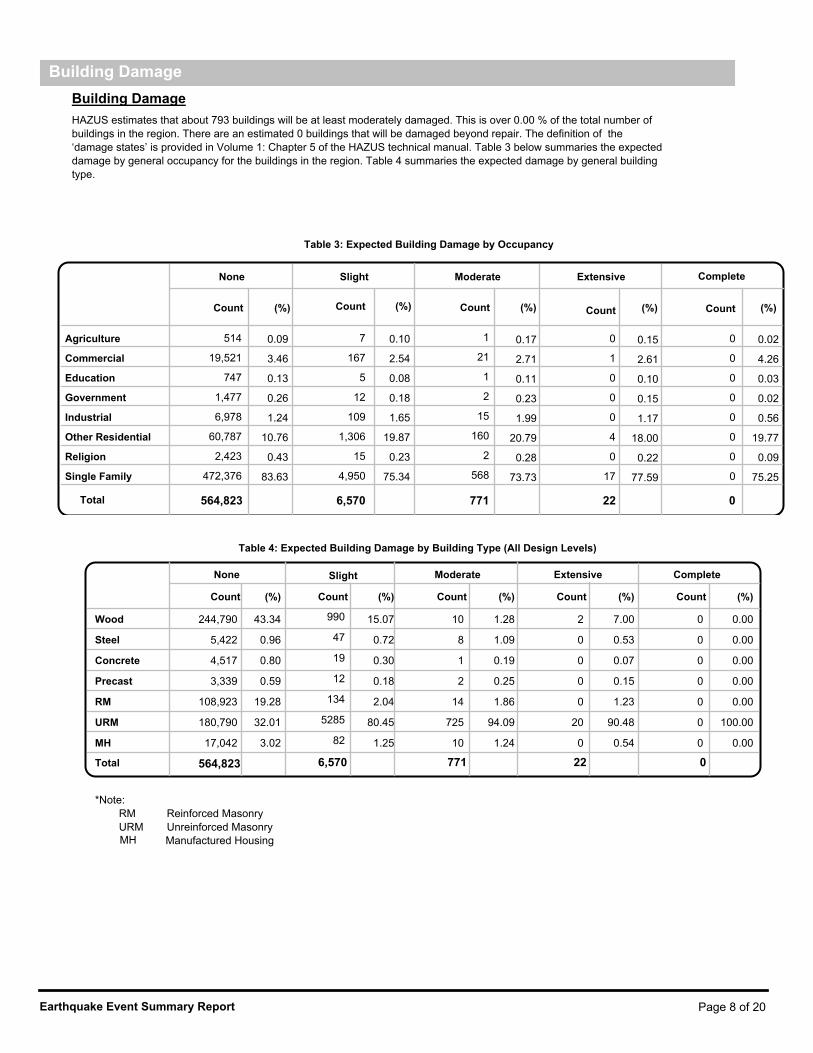
HAZUS estimates that about 793 buildings will be at least moderately damaged. This is over 0.00 % of the total number of
buildings in the region. There are an estimated 0 buildings that will be damaged beyond repair. The definition of the
‘damage states’ is provided in Volume 1: Chapter 5 of the HAZUS technical manual. Table 3 below summaries the expected
damage by general occupancy for the buildings in the region. Table 4 summaries the expected damage by general building
type.
Building Damage
Table 3: Expected Building Damage by Occupancy
None Slight
Count (%)Count
Moderate Extensive
(%)Count
Complete
(%) Count Count (%)(%)
Agriculture 514 7 0.02 0.15 0.17 0.10 0.09 0 0 1
Commercial 19,521 167 4.26 2.61 2.71 2.54 3.46 0 1 21
Education 747 5 0.03 0.10 0.11 0.08 0.13 0 0 1
Government 1,477 12 0.02 0.15 0.23 0.18 0.26 0 0 2
Industrial 6,978 109 0.56 1.17 1.99 1.65 1.24 0 0 15
Other Residential 60,787 1,306 19.77 18.00 20.79 19.87 10.76 0 4 160
Religion 2,423 15 0.09 0.22 0.28 0.23 0.43 0 0 2
Single Family 472,376 4,950 75.25 77.59 73.73 75.34 83.63 0 17 568
Total 564,823 6,570 771 22 0
Table 4: Expected Building Damage by Building Type (All Design Levels)
Extensive
Count
Complete
(%)Count(%)Count
Moderate
(%)Count
Slight
(%)Count
None
(%)
Wood 244,790 990 10 2 0 43.34 15.07 1.28 7.00 0.00
Steel 5,422 47 8 0 0 0.96 0.72 1.09 0.53 0.00
Concrete 4,517 19 1 0 0 0.80 0.30 0.19 0.07 0.00
Precast 3,339 12 2 0 0 0.59 0.18 0.25 0.15 0.00
RM 108,923 134 14 0 0 19.28 2.04 1.86 1.23 0.00
URM 180,790 5285 725 20 0 32.01 80.45 94.09 90.48 100.00
MH 17,042 82 10 0 0 3.02 1.25 1.24 0.54 0.00
Total
*Note:
RM Reinforced Masonry
URM Unreinforced Masonry
Manufactured HousingMH
6,570 564,823 771 22 0
Page 8 of 20Earthquake Event Summary Report

Essential Facility Damage
Before the earthquake, the region had 6,220 hospital beds available for use. On the day of the earthquake, the model
estimates that only 6,212 hospital beds (100.00%) are available for use by patients already in the hospital and those injured
by the earthquake. After one week, 100.00% of the beds will be back in service. By 30 days, 100.00% will be operational.
Table 5: Expected Damage to Essential Facilities
Total
Damage > 50%
At Least Moderate
# Facilities
Complete
Damage > 50%
Classification With Functionality
> 50% on day 1
Hospitals 45 0 0 45
Schools 924 0 0 924
EOCs 4 0 0 4
PoliceStations 104 0 0 104
FireStations 254 0 0 254
Page 9 of 20Earthquake Event Summary Report

Transportation and Utility Lifeline Damage
Table 6 provides damage estimates for the transportation system.
Table 6: Expected Damage to the Transportation Systems
Number of Locations
Locations/ With at Least
After Day 7After Day 1
With Functionality > 50 %
Damage
With CompleteSystem Component
Mod. DamageSegments
Highway Segments 986 0 0 986 986
Bridges 2,270 0 0 2,270 2,270
Tunnels 2 0 0 2 2
Railways Segments 1,310 0 0 1,310 1,310
Bridges 33 0 0 33 33
Tunnels 0 0 0 0 0
Facilities 12 0 0 12 12
Light Rail Segments 24 0 0 24 24
Bridges 0 0 0 0 0
Tunnels 0 0 0 0 0
Facilities 24 0 0 24 24
Bus Facilities 8 0 0 8 8
Ferry Facilities 0 0 0 0 0
Port Facilities 0 0 0 0 0
Airport Facilities 17 0 0 17 17
Runways 30 0 0 30 30
Tables 7-9 provide information on the damage to the utility lifeline systems. Table 7 provides damage to the utility system
facilities. Table 8 provides estimates on the number of leaks and breaks by the pipelines of the utility systems. For electric
power and potable water, HAZUS performs a simplified system performance analysis. Table 9 provides a summary of the
system performance information.
Note: Roadway segments, railroad tracks and light rail tracks are assumed to be damaged by ground failure only. If ground
failure maps are not provided, damage estimates to these components will not be computed.
Page 10 of 20Earthquake Event Summary Report
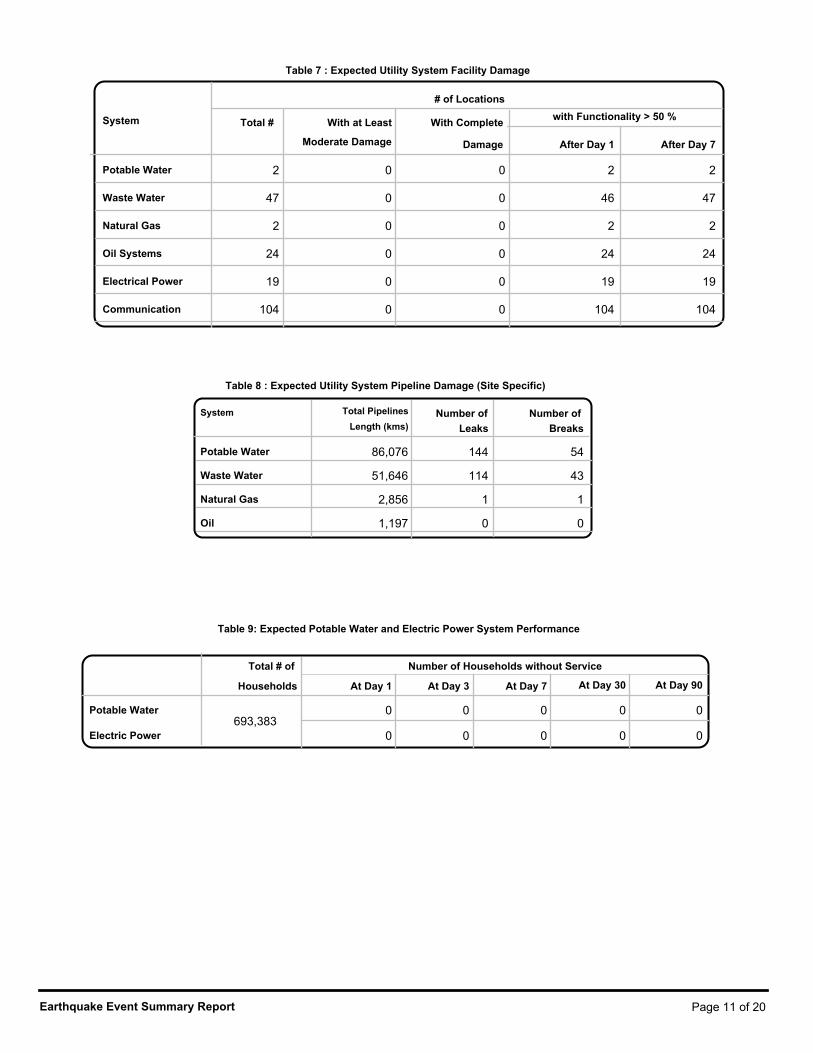
Table 7 : Expected Utility System Facility Damage
With at Leastwith Functionality > 50 %
After Day 7After Day 1
With Complete
Damage
System
# of Locations
Moderate Damage
Total #
Potable Water 2 0 0 2 2
Waste Water 47 0 0 46 47
Natural Gas 2 0 0 2 2
Oil Systems 24 0 0 24 24
Electrical Power 19 0 0 19 19
Communication 104 0 0 104 104
Table 8 : Expected Utility System Pipeline Damage (Site Specific)
System
Breaks
Number of
Leaks
Number ofLength (kms)
Total Pipelines
Potable Water 86,076 144 54
Waste Water 51,646 114 43
Natural Gas 2,856 1 1
Oil 1,197 0 0
Potable Water
Electric Power
Total # of
Households At Day 3 At Day 7 At Day 30
Number of Households without Service
Table 9: Expected Potable Water and Electric Power System Performance
At Day 90
693,383 0 0 0 0 0
0 0 0 0 0
At Day 1
Page 11 of 20Earthquake Event Summary Report
Fire Following Earthquake
Fires often occur after an earthquake. Because of the number of fires and the lack of water to fight the fires, they can often
burn out of control. HAZUS uses a Monte Carlo simulation model to estimate the number of ignitions and the amount of
burnt area. For this scenario, the model estimates that there will be 32 ignitions that will burn about 0.79 sq. mi 0.00 % of
the region’s total area.) The model also estimates that the fires will displace about 3,417 people and burn about 166
(millions of dollars) of building value.
Debris Generation
HAZUS estimates the amount of debris that will be generated by the earthquake. The model breaks the debris into two
general categories: a) Brick/Wood and b) Reinforced Concrete/Steel. This distinction is made because of the different types
of material handling equipment required to handle the debris.
The model estimates that a total of 0.050 million tons of debris will be generated. Of the total amount, Brick/Wood
comprises 89.00% of the total, with the remainder being Reinforced Concrete/Steel. If the debris tonnage is converted to an
estimated number of truckloads, it will require 2,160 truckloads (@25 tons/truck) to remove the debris generated by the
earthquake.
Induced Earthquake Damage
Page 12 of 20Earthquake Event Summary Report

Shelter Requirement
HAZUS estimates the number of households that are expected to be displaced from their homes due to the earthquake and
the number of displaced people that will require accommodations in temporary public shelters. The model estimates 5
households to be displaced due to the earthquake. Of these, 4 people (out of a total population of 2,230,893) will seek
temporary shelter in public shelters.
Casualties
HAZUS estimates the number of people that will be injured and killed by the earthquake. The casualties are broken down
into four (4) severity levels that describe the extent of the injuries. The levels are described as follows;
· Severity Level 1: Injuries will require medical attention but hospitalization is not needed.
· Severity Level 2: Injuries will require hospitalization but are not considered life-threatening
· Severity Level 3: Injuries will require hospitalization and can become life threatening if not
promptly treated.
· Severity Level 4: Victims are killed by the earthquake.
The casualty estimates are provided for three (3) times of day: 2:00 AM, 2:00 PM and 5:00 PM. These times represent the
periods of the day that different sectors of the community are at their peak occupancy loads. The 2:00 AM estimate
considers that the residential occupancy load is maximum, the 2:00 PM estimate considers that the educational, commercial
and industrial sector loads are maximum and 5:00 PM represents peak commute time.
Table 10 provides a summary of the casualties estimated for this earthquake
Social Impact
Page 13 of 20Earthquake Event Summary Report

Table 10: Casualty Estimates
Level 4Level 3Level 2Level 1
0Commercial 0 0 02 AM
0Commuting 0 0 0
0Educational 0 0 0
0Hotels 0 0 0
0Industrial 0 0 0
5Other-Residential 0 0 0
16Single Family 1 0 0
21 1 0 0Total
6Commercial 0 0 02 PM
0Commuting 0 0 0
1Educational 0 0 0
0Hotels 0 0 0
2Industrial 0 0 0
1Other-Residential 0 0 0
3Single Family 0 0 0
13 1 0 0Total
5Commercial 0 0 05 PM
0Commuting 0 0 0
0Educational 0 0 0
0Hotels 0 0 0
1Industrial 0 0 0
2Other-Residential 0 0 0
6Single Family 0 0 0
14 1 0 0Total
Page 14 of 20Earthquake Event Summary Report
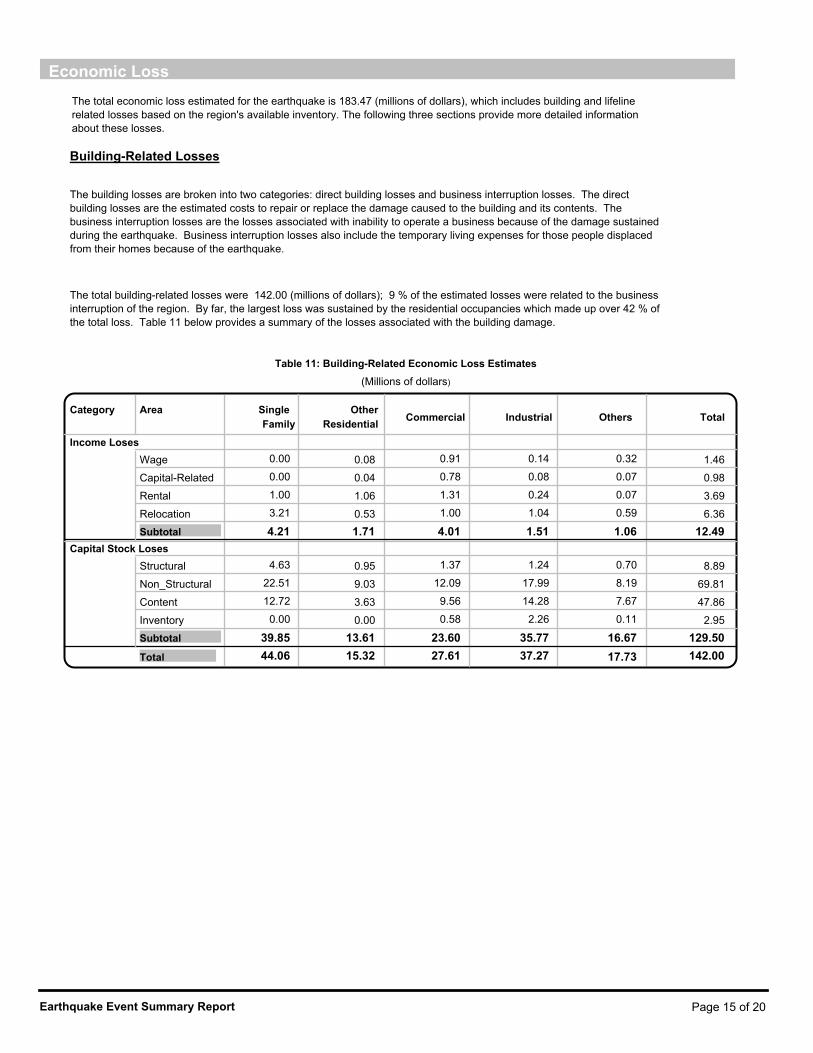
Economic Loss
The total economic loss estimated for the earthquake is 183.47 (millions of dollars), which includes building and lifeline
related losses based on the region's available inventory. The following three sections provide more detailed information
about these losses.
Building-Related Losses
The building losses are broken into two categories: direct building losses and business interruption losses. The direct
building losses are the estimated costs to repair or replace the damage caused to the building and its contents. The
business interruption losses are the losses associated with inability to operate a business because of the damage sustained
during the earthquake. Business interruption losses also include the temporary living expenses for those people displaced
from their homes because of the earthquake.
The total building-related losses were 142.00 (millions of dollars); 9 % of the estimated losses were related to the business
interruption of the region. By far, the largest loss was sustained by the residential occupancies which made up over 42 % of
the total loss. Table 11 below provides a summary of the losses associated with the building damage.
Table 11: Building-Related Economic Loss Estimates
(Millions of dollars)
Total OthersIndustrialCommercialOther
Residential
Area Single
Family
Category
Income Loses
Wage 0.00 0.91 0.14 0.32 1.46 0.08
Capital-Related 0.00 0.78 0.08 0.07 0.98 0.04
Rental 1.00 1.31 0.24 0.07 3.69 1.06
Relocation 3.21 1.00 1.04 0.59 6.36 0.53
4.21 Subtotal 1.71 4.01 1.51 1.06 12.49
Capital Stock Loses
Structural 4.63 1.37 1.24 0.70 8.89 0.95
Non_Structural 22.51 12.09 17.99 8.19 69.81 9.03
Content 12.72 9.56 14.28 7.67 47.86 3.63
Inventory 0.00 0.58 2.26 0.11 2.95 0.00
39.85 Subtotal 13.61 23.60 35.77 16.67 129.50
Total 44.06 15.32 27.61 37.27 17.73 142.00
Page 15 of 20Earthquake Event Summary Report

Transportation and Utility Lifeline Losses
For the transportation and utility lifeline systems, HAZUS computes the direct repair cost for each component only. There
are no losses computed by HAZUS for business interruption due to lifeline outages. Tables 12 & 13 provide a detailed
breakdown in the expected lifeline losses.
HAZUS estimates the long-term economic impacts to the region for 15 years after the earthquake. The model quantifies this
information in terms of income and employment changes within the region. Table 14 presents the results of the region for
the given earthquake.
Table 12: Transportation System Economic Losses
(Millions of dollars)
System Loss Ratio (%)Economic LossInventory ValueComponent
Highway Segments 29,012.41 $0.03 0.00
Bridges 2,894.82 $0.19 0.01
Tunnels 1.76 $0.00 0.00
31909.00 Subtotal 0.20
Railways Segments 2,381.81 $0.00 0.00
Bridges 3.92 $0.00 0.00
Tunnels 0.00 $0.00 0.00
Facilities 31.96 $1.13 3.55
2417.70 Subtotal 1.10
Light Rail Segments 37.15 $0.00 0.00
Bridges 0.00 $0.00 0.00
Tunnels 0.00 $0.00 0.00
Facilities 63.91 $3.37 5.28
101.10 Subtotal 3.40
Bus Facilities 8.55 $0.12 1.43
8.50 Subtotal 0.10
Ferry Facilities 0.00 $0.00 0.00
0.00 Subtotal 0.00
Port Facilities 0.00 $0.00 0.00
0.00 Subtotal 0.00
Airport Facilities 181.07 $2.67 1.47
Runways 1,138.92 $0.00 0.00
1320.00 Subtotal 2.70
35756.30 Total 7.50
Page 16 of 20Earthquake Event Summary Report

Table 13: Utility System Economic Losses
(Millions of dollars)
Component Inventory Value Economic LossSystem Loss Ratio (%)
Potable Water 0.00 Pipelines 0.00$0.00
65.30 Facilities 0.04$0.02
1,721.50 Distribution Lines 0.05$0.83
1,786.79 Subtotal $0.86
Waste Water 0.00 Pipelines 0.00$0.00
3,067.60 Facilities 0.46$14.18
1,032.90 Distribution Lines 0.06$0.66
4,100.51 Subtotal $14.84
Natural Gas 1,341.60 Pipelines 0.00$0.01
2.10 Facilities 0.04$0.00
688.60 Distribution Lines 0.10$0.70
2,032.35 Subtotal $0.71
Oil Systems 348.90 Pipelines 0.00$0.00
2.40 Facilities 0.31$0.01
351.25 Subtotal $0.01
Electrical Power 2,048.20 Facilities 0.85$17.47
2,048.20 Subtotal $17.47
Communication 10.20 Facilities 0.66$0.07
10.19 Subtotal $0.07
Total 10,329.29 $33.95
Page 17 of 20Earthquake Event Summary Report
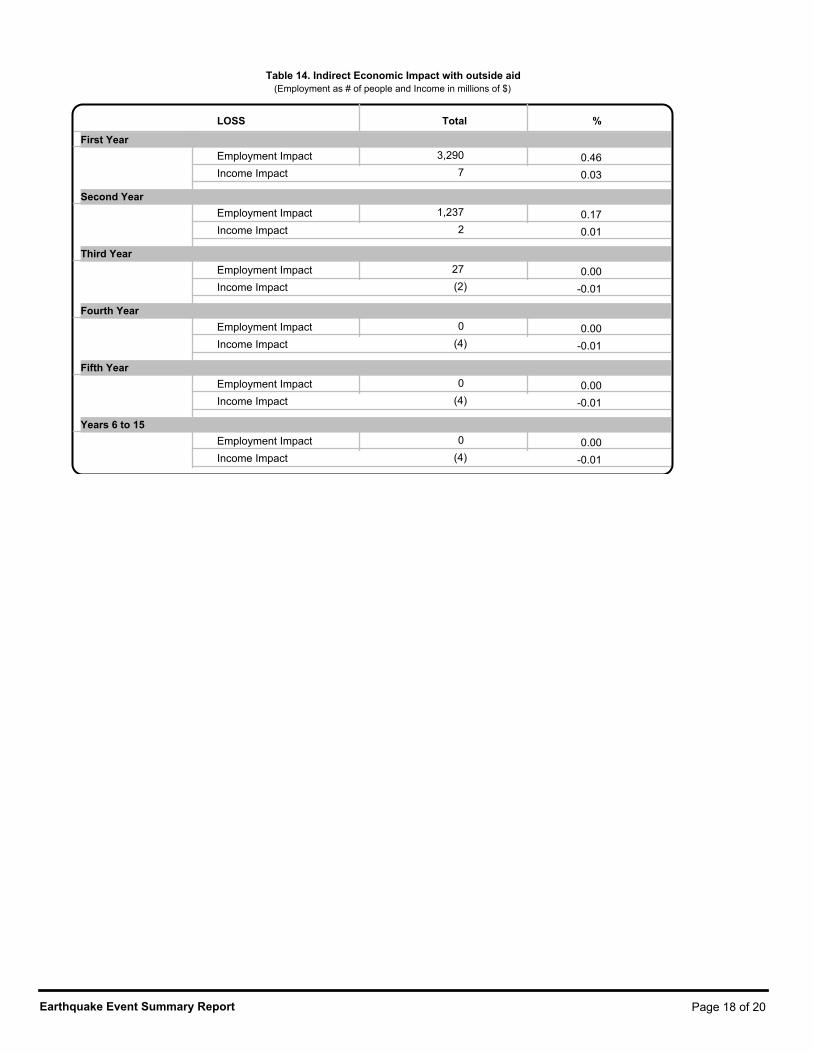
Table 14. Indirect Economic Impact with outside aid(Employment as # of people and Income in millions of $)
LOSS Total %
First Year
Employment Impact 3,290 0.46
Income Impact 7 0.03
Second Year
Employment Impact 1,237 0.17
Income Impact 2 0.01
Third Year
Employment Impact 27 0.00
Income Impact (2) -0.01
Fourth Year
Employment Impact 0 0.00
Income Impact (4) -0.01
Fifth Year
Employment Impact 0 0.00
Income Impact (4) -0.01
Years 6 to 15
Employment Impact 0 0.00
Income Impact (4) -0.01
Page 18 of 20Earthquake Event Summary Report

Box Elder,UT
Cache,UT
Carbon,UT
Davis,UT
Duchesne,UT
Emery,UT
Juab,UT
Millard,UT
Morgan,UT
Rich,UT
Salt Lake,UT
Sanpete,UT
Summit,UT
Tooele,UT
Utah,UT
Wasatch,UT
Weber,UT
Appendix A: County Listing for the Region
Page 19 of 20Earthquake Event Summary Report

TotalNon-ResidentialResidential
Building Value (millions of dollars)PopulationCounty NameState
Utah
Box Elder 45,659 1,658 687 2,346
Cache 100,585 3,382 1,703 5,085
Carbon 19,947 825 395 1,220
Davis 270,344 10,230 3,870 14,101
Duchesne 15,233 496 248 744
Emery 10,885 403 142 546
Juab 9,240 291 190 481
Millard 12,713 447 233 681
Morgan 7,910 305 139 444
Rich 2,327 249 38 288
Salt Lake 962,837 39,526 18,636 58,162
Sanpete 24,037 708 387 1,095
Summit 35,804 2,598 708 3,307
Tooele 50,184 1,782 564 2,347
Utah 429,727 9,780 6,285 16,065
Wasatch 18,879 0 89 89
Weber 214,582 8,462 3,369 11,831
2,230,893 81,142 37,683 118,832Total State
Total Region 2,230,893 81,142 37,683 118,832
Appendix B: Regional Population and Building Value Data
Page 20 of 20Earthquake Event Summary Report

TOOELE
DAVIS
UTAH
SALT LAKE
WEBER
MORGAN
BOX ELDER
SUMMIT
WASATCH
SUMMIT
IDOR
NV COUT
CA
WY NE
0 2.5 5 7.5 10 12.5 15
Miles
12-21-09 FEMA & URS Corporation
Direct Building Economic Loss -Earthquake Scenario: Magna Segment, UT
M 5.2 MagnaSegment Earthquake
Ü
* All values are thousands of dollars
1 Dot =$1,000,000
< 0.02
0.02 - 0.04
0.04 - 0.09
0.09 - 0.18
> 0.18
PGA (% g's)§̈¦15
§̈¦15
§̈¦80
§̈¦80
§̈¦84
County
CostStructural
Damage
Cost Non-Structural
Damage
Total Loss(IncludingContents)
Utah 8 162 313Wasatch 0 1 2Tooele 25 87 180Salt Lake 8,535 67,269 137,002Weber 9 109 204Summit 0 6 10Morgan 0 1 1Davis 314 2,175 4,285Total $8,891 $69,810 $141,997
City Boundaries
Major Roads
Interstate
Counties

TOOELE
DAVIS
UTAH
SALT LAKE
WEBER
MORGAN
BOX ELDER
SUMMIT
WASATCH
SUMMIT
IDOR
NV COUT
CA
WY NE
0 2.5 5 7.5 10 12.5 15
Miles
12-21-09 FEMA & URS Corporation
Estimated Displaced Households & Short Term Public Shelter Needs -Earthquake Scenario: Magna Segment, UT
M 5.2 MagnaSegment Earthquake
Ü
§̈¦15
§̈¦15
§̈¦80
§̈¦80
§̈¦84
City Boundaries
Major Roads
Interstate
Counties
1 Dot = 1 DisplacedHousehold*
1 Dot = 1 Public ShelterNeed (Individuals)*
* delineated by census tract
Total #Public Shelter
Needs(Individuals)
4
DisplacedHouseholds 5

®v®v
®v
®v
®v
®v
®v
®v
®v ®v®v®v
®v
®v
®v
®v
®v
®v
®v
®v
®v
®v
®v
®v
®v
®v
®v
®v®v
®v
TOOELE
DAVIS
UTAH
SALT LAKE
WEBER
MORGAN
BOX ELDER
SUMMIT
WASATCH
SUMMIT
IDOR
NV COUT
CA
WY NE
0 2.5 5 7.5 10 12.5 15
Miles
12-21-09 FEMA & URS Corporation
Distribution of Elderly, Impaired Hospitals (Day 1) & Hospital BedAvailability - Earthquake Scenario: Magna Segment, UT
M 5.2 MagnaSegment Earthquake
Ü
1 Dot = 30People Over 65
NursingHome
CountyTotal #
HospitalBeds
HospitalBeds
Available
InjuriesRequiring
HospitalTreatment 2pm
Utah 1,013 1,013 0Wasatch 20 20 0Tooele 118 118 0Salt Lake 3,440 3,433 1Weber 655 655 0Davis 468 468 0Total 5,714 5,707 1
Damage is expressed as the probability that a given bridgeor highway segment will realize at least moderate damage.
Highway Damage
Highway SegmentImpact
Major RoadwayBridge Impact
Low
Moderate
High
Low
Moderate
High
Impaired Hospitals (Day 1)Damage is expressed asthe probablility thata given hospital will realizeat least moderate damage. ®v
Low
®v Moderate®v
High

!?!?!?
!?
!?
!?
!?
!?
!?
ë
ëëëëëë
ë
ë
ë
ë
ë
ë
o
TOOELE
DAVIS
UTAH
SALT LAKE
WEBER
MORGAN
BOX ELDER
SUMMIT
WASATCH
SUMMIT
IDOR
NV COUT
CA
WY NE
0 2.5 5 7.5 10 12.5 15
Miles
12-21-09 FEMA & URS Corporation
Electrical, Natural Gas & Oil Facility Damage -Earthquake Scenario: Magna Segment, UT
M 5.2 MagnaSegment Earthquake
Ü
< 0.02
0.02 - 0.04
0.04 - 0.09
0.09 - 0.18
> 0.18
PGA (% g's)
City Boundaries
Major Roads
Interstate
Counties
§̈¦15
§̈¦15
§̈¦80
§̈¦80
§̈¦84 Damage is expressed as the probability chance that a givenutility system will realize at least moderate damage.
Utility Damage(at least moderate)
Natural GasFacility
o
o
o
ElectricPower Facility
!? Low
!? Moderate
!? High
ë
ë
ë
OilFacility
Low
Moderate
High
Low
Moderate
High
TOOELE
DAVIS
UTAH
SALT LAKE
WEBER
MORGAN
BOX ELDER
SUMMIT
WASATCH
SUMMIT
IDOR
NV COUT
CA
WY NE
0 2.5 5 7.5 10 12.5 15
Miles
12-21-09 FEMA & URS Corporation
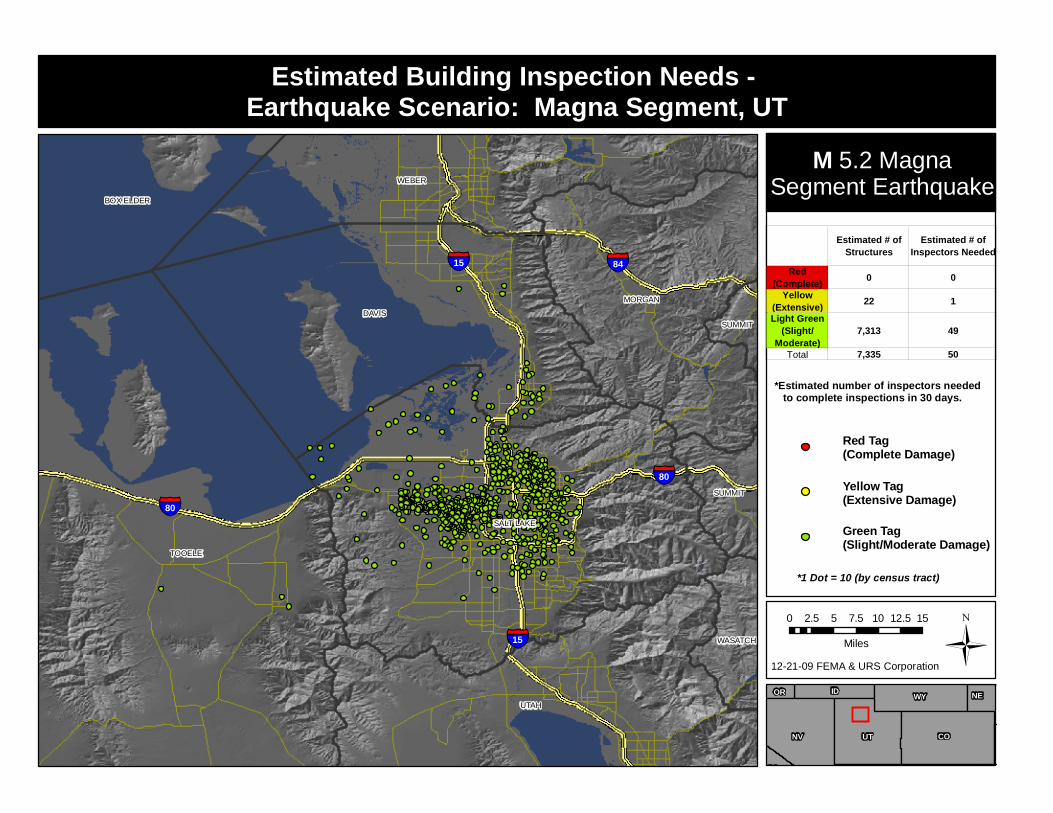
Estimated Building Inspection Needs -Earthquake Scenario: Magna Segment, UT
M 5.2 MagnaSegment Earthquake
Ü
§̈¦15
§̈¦15
§̈¦80
§̈¦80
§̈¦84
Red Tag(Complete Damage)
Yellow Tag(Extensive Damage)
Green Tag(Slight/Moderate Damage)
*Estimated number of inspectors neededto complete inspections in 30 days.
*1 Dot = 10 (by census tract)
Estimated # ofStructures
Estimated # ofInspectors Needed
Red(Complete) 0 0
Yellow(Extensive) 22 1
Light Green(Slight/
Moderate)7,313 49
Total 7,335 50

TOOELE
DAVIS
UTAH
SALT LAKE
WEBER
MORGAN
BOX ELDER
SUMMIT
WASATCH
SUMMIT
IDOR
NV COUT
CA
WY NE
0 2.5 5 7.5 10 12.5 15
Miles
12-22-09 FEMA & URS Corporation
Estimated Concrete, Steel Debris & Highway Damage -Earthquake Scenario: Magna Segment, UT
M 5.2 MagnaSegment Earthquake
Ü
§̈¦15
§̈¦15
§̈¦80
§̈¦80
§̈¦84
1 Dot = 1 thousand tons ofConcrete and Steel Debris(by census tract)
City Boundaries
Major Roads
Interstate
Counties
CountyBrick and
Wood(tons)
Concreteand Steel
(tons)
*EstimatedTruck Loads
Davis 1,000 0 40Morgan 0 0 0Salt Lake 47,000 6,000 2,110Summit 0 0 0Tooele 0 0 0Utah 0 0 0Wasatch 0 0 0Weber 0 0 0Total 48,000 6,000 2,150

®v®v
®v
®v
®v
®v
®v
®v
®v ®v®v®v
®v
®v
®v
®v
®v
®v
®v
®v
®v
®v
®v
®v
®v
®v
®v
®v®v
®v
TOOELE
DAVIS
UTAH
SALT LAKE
WEBER
MORGAN
BOX ELDER
SUMMIT
WASATCH
SUMMIT
IDOR
NV COUT
CA
WY NE
0 2.5 5 7.5 10 12.5 15
Miles
12-22-09 FEMA & URS Corporation
Demographic Distribution & Highway Damage -Earthquake Scenario: Magna Segment, UT
M 5.2 MagnaSegment Earthquake
Ü
*1 Dot = 500 People (by census tract)
DemographicsEnglish SpeakingPotentially Non-EnglishSpeaking
City Boundaries
Counties
Damage is expressed as the probability that a given bridgeor highway segment will realize at least moderate damage.
Highway Damage
Highway SegmentImpact
Major RoadwayBridge Impact
Low
Moderate
High
Low
Moderate
High
Impaired Hospitals (Day 1)Damage is expressed asthe probablility thata given hospital will realizeat least moderate damage. ®v
Low
®v Moderate®v
High
TOOELE
DAVIS
UTAH
SALT LAKE
WEBER
MORGAN
BOX ELDER
SUMMIT
WASATCH
SUMMIT
IDOR
NV COUT
CA
WY NE
0 2.5 5 7.5 10 12.5 15
Miles
12-22-09 FEMA & URS Corporation
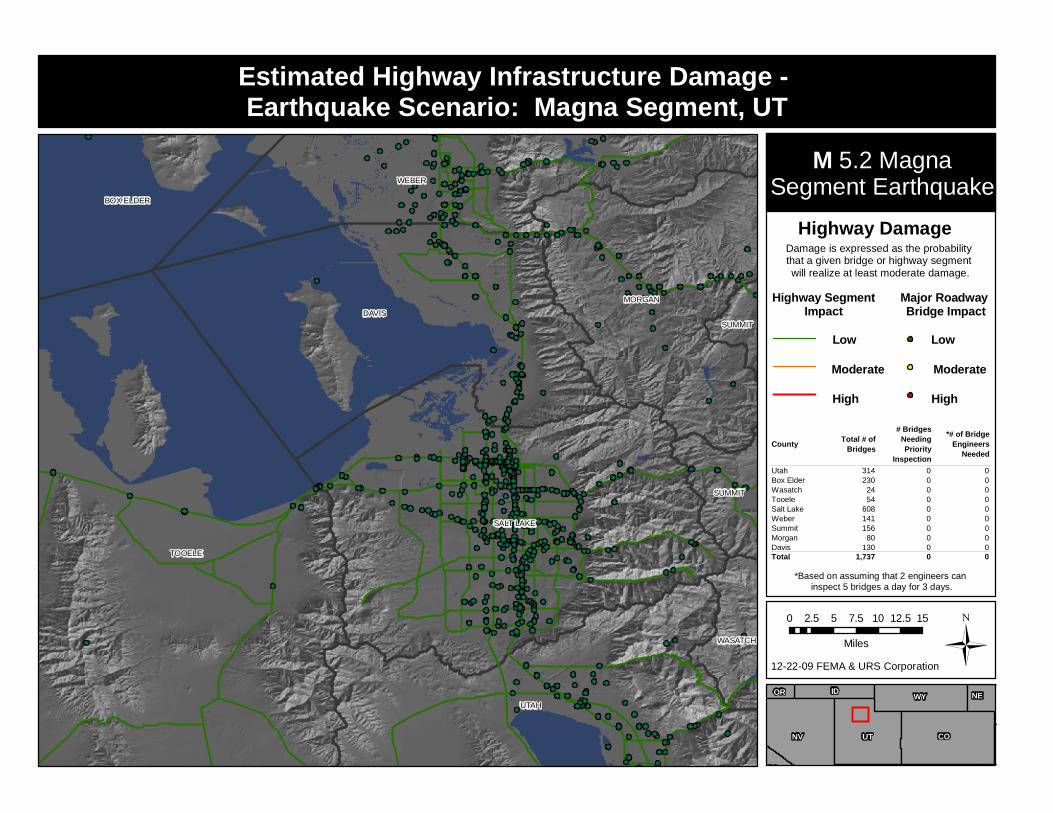
Estimated Highway Infrastructure Damage -Earthquake Scenario: Magna Segment, UT
M 5.2 MagnaSegment Earthquake
Ü
*Based on assuming that 2 engineers caninspect 5 bridges a day for 3 days.
Highway SegmentImpact
Damage is expressed as the probabilitythat a given bridge or highway segmentwill realize at least moderate damage.
Major RoadwayBridge Impact
Highway Damage
Low
Moderate
High
Low
Moderate
High
County Total # ofBridges
# BridgesNeedingPriority
Inspection
*# of BridgeEngineers
Needed
Utah 314 0 0Box Elder 230 0 0Wasatch 24 0 0Tooele 54 0 0Salt Lake 608 0 0Weber 141 0 0Summit 156 0 0Morgan 80 0 0Davis 130 0 0Total 1,737 0 0

®v®v
®v
®v
®v
®v
®v
®v
®v ®v®v®v
®v
®v
®v
®v
®v
®v
®v
®v
®v
®v
®v
®v
®v
®v
®v
®v®v
®v
TOOELE
DAVIS
UTAH
SALT LAKE
WEBER
MORGAN
BOX ELDER
SUMMIT
WASATCH
SUMMIT
IDOR
NV COUT
CA
WY NE
0 2.5 5 7.5 10 12.5 15
Miles
12-22-09 FEMA & URS Corporation
Impaired Hospitals (Day 1), Hospital Availability & HighwayFunctionality - Earthquake Scenario: Magna Segment, UT
M 5.2 MagnaSegment Earthquake
Ü
CountyTotal #
HospitalBeds
HospitalBeds
Available
InjuriesRequiring
HospitalTreatment 2pm
Utah 1,013 1,013 0Wasatch 20 20 0Tooele 118 118 0Salt Lake 3,440 3,433 1Weber 655 655 0Davis 468 468 0Total 5,714 5,707 1
Impaired Hospitals (Day 1)Damage is expressed asthe probablility thata given hospital will realizeat least moderate damage.
Damage is expressed as the probability that a given bridgeor highway segment will realize at least moderate damage.
Highway Damage
Highway SegmentImpact
Major RoadwayBridge Impact
Low
Moderate
High
Low
Moderate
High
®v
Low
®v Moderate®v
High

3] 3]
3]
3]
3]
3]
3]
3]
3]
3]
3]
gW
gW
gW
gWgWgWgWgW
gW
gWgW
gW
gWgW gW
gW
gW
gW
gW
gW
gWgW
gW
gW
gW
gW
gW
gW
gW
gW
gW
gW
gW
gW
gW
gWgW
gW
gW
gW
gW
gW
gWgW
gW
gW
gW
gWgW
gWgW
gWgW
gW
gW
gW
gW
gW
gW
gW
gWgW
gW
gW
gW
gWgWgW
gW
gW
gW
gW
gW
gW
gW
gW
gW
gW
gW
gW
gW
gW
gW
gW
gW gW
gW
gWgW
gW
gW
gW
gW
gW
gW
gW
gW
gW
gW
gW
gW
gW
gW
gW
gWgW
gW
gW
gWgW gW
gW
gW
gW
gW
gW
gW
gW
gWgW
gW
gW
gW
gW
gW
gW gWgW
gWgWgW
gWgW gW
gW
gW
gW
gW
gW
gW
gW
gW
gW
gW
gW
gWgW gW
gW
gW
gWgWgW
gW
gWgWgWgWgW
gW
TOOELE
DAVIS
UTAH
SALT LAKE
WEBER
MORGAN
BOX ELDER
SUMMIT
WASATCH
SUMMIT
IDOR
NV COUT
CA
WY NE
0 2.5 5 7.5 10 12.5 15
Miles
12-22-09 FEMA & URS Corporation
Water Line, Sewage Treatment Facility Distribution and LiquefactionSusceptibility - Earthquake Scenario: Magna Segment, UT
M 5.2 MagnaSegment Earthquake
ܧ̈¦15
§̈¦80
§̈¦84§̈¦15
§̈¦80
* Based on U.S. Army Corp Mission Guidebook(Daily water is based on an esimated 3 people per household at a gallon per day per person.One truck can transport an esimated 5000 gallons of water.)
Liquefaction Susceptibility
Low
Medium
High
Very High
Counties
InterstateMajor Roads
gW Dams
3] SewageTreatment Facilities
County
# Householdswithout
Potable Water(at Day 1)
Daily PotableWater Needs
Per Person(Gallons/day)
Number ofTruckloads
needed Daily
Utah 0 0 0Wasatch 0 0 0Tooele 0 0 0Salt Lake 0 0 0Weber 0 0 0Summit 0 0 0Morgan 0 0 0Davis 0 0 0Total 0 0 0

®v
®v®v®v
®v
®v
®v
®v
®v
®v
®v
®v
®v
®v
®v
®v®v
®v
®v
®v
®v
®v
®v
®v
®v ®v
®v
®v
®v®v
TOOELE
DAVIS
UTAH
SALT LAKE
WEBER
MORGAN
BOX ELDER
SUMMIT
WASATCH
SUMMIT
IDOR
NV COUT
CA
WY NE
0 2.5 5 7.5 10 12.5 15
Miles
12-22-09 FEMA & URS Corporation
Potential Search & Rescue Needs -Earthquake Scenario: Magna Segment, UT
M 5.2 MagnaSegment Earthquake
ܧ̈¦15
§̈¦80
§̈¦84§̈¦15
§̈¦80
< 0.02
0.02 - 0.04
0.04 - 0.09
0.09 - 0.18
> 0.18
PGA (% g's)
*Severity Level 3 isdefined as injuries thatrequire hospitalizationand can become lifethreatening if notpromptly treated.
1 Dot = 1 LifeThreatening Injury(Severity Level 3)
Structure Type Red (Complete)Collapse Ratesfor Complete
DamageTotal Collapse
Wood 0 3% 0Steel 0 6% 0Concrete 0 10% 0Precast 0 13% 0ReinforcedMasonry 0 10% 0UnreinforcedMasonry 0 15% 0ManufacturedHousing 0 3% 0Total 0 0
Requiring HospitalTreatment
Immediate LifeThreatening Injuries
3 0
Impaired Hospitals (Day 1)Damage is expressed asthe probablility thata given hospital will realizeat least moderate damage. ®v
Low
®v Moderate®v
High

-±°̄-±°̄
-±°̄
-±°̄
-±°̄-±°̄-±°̄-±°̄-±°̄ -±°̄
-±°̄
-±°̄
-±°̄
-±°̄-±°̄-±°̄-±°̄-±°̄-±°̄-±°̄
-±°̄-±°̄
-±°̄
-±°̄-±°̄
-±°̄
-±°̄-±°̄
-±°̄-±°̄
-±°̄-±°̄
-±°̄-±°̄
-±°̄
-±°̄
-±°̄-±°̄ -±°̄
-±°̄
-±°̄-±°̄-±°̄-±°̄
-±°̄
-±°̄
-±°̄
-±°̄
-±°̄-±°̄-±°̄
-±°̄-±°̄
-±°̄
-±°̄-±°̄-±°̄-±°̄-±°̄ -±°̄
-±°̄-±°̄-±°̄
-±°̄
-±°̄-±°̄
-±°̄-±°̄
-±°̄
-±°̄-±°̄
-±°̄
-±°̄-±°̄-±°̄-±°̄
-±°̄
-±°̄ -±°̄-±°̄-±°̄-±°̄-±°̄
-±°̄-±°̄-±°̄-±°̄ -±°̄-±°̄
-±°̄
-±°̄-±°̄
-±°̄
-±°̄ -±°̄-±°̄-±°̄
-±°̄-±°̄
-±°̄-±°̄
-±°̄-±°̄
-±°̄-±°̄
-±°̄-±°̄
-±°̄-±°̄-±°̄-±°̄
-±°̄-±°̄
-±°̄-±°̄-±°̄-±°̄-±°̄
-±°̄
-±°̄-±°̄ -±°̄
-±°̄-±°̄-±°̄
-±°̄-±°̄ -±°̄-±°̄-±°̄
-±°̄
-±°̄-±°̄
-±°̄ -±°̄-±°̄
-±°̄
-±°̄
-±°̄-±°̄-±°̄
-±°̄
-±°̄
-±°̄
-±°̄-±°̄-±°̄
-±°̄
-±°̄
-±°̄-±°̄
-±°̄
-±°̄-±°̄
-±°̄-±°̄
-±°̄-±°̄
-±°̄
-±°̄
-±°̄-±°̄-±°̄-±°̄-±°̄-±°̄
-±°̄-±°̄-±°̄
-±°̄-±°̄
-±°̄-±°̄
-±°̄-±°̄-±°̄-±°̄-±°̄-±°̄
-±°̄-±°̄
-±°̄-±°̄
-±°̄-±°̄-±°̄-±°̄
-±°̄
-±°̄-±°̄-±°̄-±°̄
-±°̄
-±°̄-±°̄
-±°̄
-±°̄
-±°̄-±°̄-±°̄-±°̄ -±°̄-±°̄
-±°̄-±°̄-±°̄
-±°̄-±°̄-±°̄
-±°̄-±°̄
-±°̄-±°̄-±°̄
-±°̄
-±°̄
-±°̄
-±°̄-±°̄-±°̄
-±°̄-±°̄-±°̄-±°̄
-±°̄ -±°̄-±°̄-±°̄-±°̄-±°̄
-±°̄
-±°̄ -±°̄-±°̄-±°̄
-±°̄
-±°̄-±°̄-±°̄
-±°̄-±°̄
-±°̄-±°̄
-±°̄
-±°̄
-±°̄-±°̄-±°̄
-±°̄-±°̄-±°̄
-±°̄
-±°̄
-±°̄-±°̄
-±°̄-±°̄ -±°̄-±°̄
-±°̄
-±°̄ -±°̄-±°̄
-±°̄-±°̄-±°̄-±°̄
-±°̄
-±°̄
-±°̄-±°̄
-±°̄-±°̄-±°̄ -±°̄
-±°̄
-±°̄
-±°̄
-±°̄
-±°̄
-±°̄-±°̄
-±°̄-±°̄
-±°̄-±°̄
-±°̄-±°̄-±°̄-±°̄
-±°̄-±°̄
-±°̄-±°̄ -±°̄
-±°̄
-±°̄-±°̄
-±°̄-±°̄
-±°̄-±°̄-±°̄
-±°̄
-±°̄-±°̄ -±°̄-±°̄ -±°̄
-±°̄
-±°̄ -±°̄-±°̄
-±°̄-±°̄
-±°̄-±°̄
-±°̄-±°̄-±°̄-±°̄
-±°̄-±°̄-±°̄
-±°̄
-±°̄
-±°̄
-±°̄-±°̄
-±°̄
-±°̄
-±°̄-±°̄-±°̄-±°̄-±°̄-±°̄-±°̄ -±°̄
-±°̄-±°̄
-±°̄
-±°̄
-±°̄-±°̄-±°̄
-±°̄
-±°̄ -±°̄-±°̄-±°̄ -±°̄
-±°̄
-±°̄
-±°̄-±°̄
-±°̄-±°̄
-±°̄-±°̄-±°̄
-±°̄-±°̄-±°̄
-±°̄-±°̄-±°̄-±°̄
-±°̄
-±°̄-±°̄
-±°̄
-±°̄
-±°̄-±°̄
-±°̄
-±°̄
-±°̄ -±°̄-±°̄
-±°̄-±°̄-±°̄-±°̄
-±°̄-±°̄-±°̄
-±°̄
-±°̄-±°̄
-±°̄-±°̄
-±°̄-±°̄-±°̄
-±°̄
-±°̄
-±°̄
-±°̄
-±°̄-±°̄
-±°̄-±°̄-±°̄
-±°̄
-±°̄
-±°̄
-±°̄-±°̄-±°̄
-±°̄
-±°̄
-±°̄-±°̄
-±°̄
í
í
í
í
í
í
í
í
í
íí
í
í
í
íí
í
íí
íí
í
®v
®v®v®v
®v
®v
®v
®v
®v
®v
®v
®v
®v
®v
®v
®v®v
®v
®v
®v
®v
®v
®v
®v
®v ®v
®v
®v
®v®v
TOOELE
DAVIS
UTAH
SALT LAKE
WEBER
MORGAN
BOX ELDER
SUMMIT
WASATCH
SUMMIT
IDOR
NV COUT
CA
WY NE
0 2.5 5 7.5 10 12.5 15
Miles
12-22-09 FEMA & URS Corporation
Correctional and Daycare Facilities, Impaired Hospitals (Day 1) andHighway Functionality - Earthquake Scenario: Magna Segment, UT
M 5.2 MagnaSegment Earthquake
Ü
-±°̄ Daycare Facilities
í Correctional Facilities
Highway SegmentImpact
Damage is expressed as the probabilitythat a given bridge or highway segmentwill realize at least moderate damage.
Major RoadwayBridge Impact
Highway Damage
Low
Moderate
High
Low
Moderate
High
Impaired Hospitals (Day 1)Damage is expressed asthe probablility thata given hospital will realizeat least moderate damage. ®v
Low
®v Moderate®v
High
Related Documents