Ninth Canadian Conference on Earthquake Engineering Ottawa, Ontario, Canada 26-29 June 2007 HAZARD CHARACTERIZATION FOR THE KASHMIR (PAKISTAN) EARTHQUAKE OF 8 OCTOBER 2005 S.J. Kim 1 and A.S. Elnashai 2 ABSTRACT The magnitude 7.6 Kashmir (Pakistan) earthquake of 8 October 2005 inflicted enormous damage and loss of life on the north-eastern region of the populous country. Studying ground shaking characteristics from such rare earthquakes is of utmost importance for future risk mitigation efforts. The available earthquake records are very limited even though the earthquake ranks amongst the worst natural disasters in the history of Pakistan and the Indian subcontinent. In this paper, the seismic hazard in the affected region is meticulously reconstructed using the limited data available (a single three-component acceleration record and three peak ground acceleration values). To evaluate the characteristics of the Kashmir earthquake records, inelastic acceleration spectra, and shaking duration are assessed. It is observed that the signal from the Kashmir earthquake has higher amplification factors than usual in the long period range and exceptionally long duration, compared with records from comparable past events. The paper presents a complete earthquake hazard characterization comprising peak ground parameter maps and carefully selected acceleration time histories. The paper is important for the current reconstruction activity in Pakistan and the methods used to reconstruct the hazard from sparse data is applicable to other earthquakes where sufficient measured data does not exist. Introduction At 8:50 am Pakistan Standard Time on October 8, 2005, an earthquake of magnitude M w 7.6 shook northern and north-eastern Pakistan. The location coordinates are 34.493N-73.629E, with a focal depth of 26 km. A very large number of aftershocks were recorded, reaching more than 1000 in the first few weeks, of magnitudes up to 6. With over 70,000 dead, 80,000 injured, and more than two million people made homeless, the earthquake ranks among the worst natural disasters in the history of Pakistan and the Indian subcontinent. According to some estimates (WB-ADB, 2005), the total bill is in excess of five billion dollars in direct losses. The Government of Pakistan census data indicates that about 272,019 buildings including hosing units, educational institutes, medical facilities and government were completely destroyed, while 182,886 were damaged to various degrees. Reconnaissance reports (Durrani et al, 2005) indicated that the structural damage was caused by the poor quality of construction of traditional housing and non-seismic design of modern RC structures. The engineered structures were fairly well 1 Research Assistant, Dept. of Civil and Environmental Engineering, University of Illinois at Urbana-Champaign, Urbana, IL, USA. Email: [email protected] 2 Bill and Elaine Hall Endowed Professor, Director of Mid-America Earthquake Center, Dept. of Civil and Environmental Engineering, University of Illinois at Urbana-Champaign, Urbana, IL, USA. Email: [email protected] 201

Welcome message from author
This document is posted to help you gain knowledge. Please leave a comment to let me know what you think about it! Share it to your friends and learn new things together.
Transcript
Ninth Canadian Conference on Earthquake EngineeringOttawa, Ontario, Canada
26-29 June 2007
HAZARD CHARACTERIZATION FOR THE KASHMIR (PAKISTAN) EARTHQUAKE OF 8 OCTOBER 2005
S.J. Kim1 and A.S. Elnashai2
ABSTRACT The magnitude 7.6 Kashmir (Pakistan) earthquake of 8 October 2005 inflicted enormous damage and loss of life on the north-eastern region of the populous country. Studying ground shaking characteristics from such rare earthquakes is of utmost importance for future risk mitigation efforts. The available earthquake records are very limited even though the earthquake ranks amongst the worst natural disasters in the history of Pakistan and the Indian subcontinent. In this paper, the seismic hazard in the affected region is meticulously reconstructed using the limited data available (a single three-component acceleration record and three peak ground acceleration values). To evaluate the characteristics of the Kashmir earthquake records, inelastic acceleration spectra, and shaking duration are assessed. It is observed that the signal from the Kashmir earthquake has higher amplification factors than usual in the long period range and exceptionally long duration, compared with records from comparable past events. The paper presents a complete earthquake hazard characterization comprising peak ground parameter maps and carefully selected acceleration time histories. The paper is important for the current reconstruction activity in Pakistan and the methods used to reconstruct the hazard from sparse data is applicable to other earthquakes where sufficient measured data does not exist.
Introduction At 8:50 am Pakistan Standard Time on October 8, 2005, an earthquake of magnitude Mw 7.6 shook northern and north-eastern Pakistan. The location coordinates are 34.493N-73.629E, with a focal depth of 26 km. A very large number of aftershocks were recorded, reaching more than 1000 in the first few weeks, of magnitudes up to 6. With over 70,000 dead, 80,000 injured, and more than two million people made homeless, the earthquake ranks among the worst natural disasters in the history of Pakistan and the Indian subcontinent. According to some estimates (WB-ADB, 2005), the total bill is in excess of five billion dollars in direct losses. The Government of Pakistan census data indicates that about 272,019 buildings including hosing units, educational institutes, medical facilities and government were completely destroyed, while 182,886 were damaged to various degrees. Reconnaissance reports (Durrani et al, 2005) indicated that the structural damage was caused by the poor quality of construction of traditional housing and non-seismic design of modern RC structures. The engineered structures were fairly well
1Research Assistant, Dept. of Civil and Environmental Engineering, University of Illinois at Urbana-Champaign, Urbana, IL, USA. Email: [email protected] 2Bill and Elaine Hall Endowed Professor, Director of Mid-America Earthquake Center, Dept. of Civil and Environmental Engineering, University of Illinois at Urbana-Champaign, Urbana, IL, USA. Email: [email protected]
201

constructed, and cases of failure were due mainly to layout defects, such as soft ground storey, short columns, irregular plans and elevations, as well as lack of maintenance on a few cases. The inherent weakness of the exposed stock was exploited by the intense shaking from this large magnitude earthquake that seems to have lasted longer than expected. This paper reconstructs the regional hazard for the Kashmir earthquake based upon analysis of the available strong-motion data and published attenuation relationships. Due to the dearth of available strong motion data near the damaged areas, a suite of strong motion records from previous earthquakes were selected using measured features such as magnitude, fault depth and distance, peak ground motion and spectral ordinate attenuation relationships, energy characteristics and duration of records.
Tectonic Setting and Fault Mechanism The collision of India with Asia has resulted in the flexural deformation of the Indian sub-continent with a half-wavelength of approximately 670 km, giving rise to stresses that are responsible for many of the earthquakes in central India. The largest of India’s earthquakes, however, occur on the northern boundary of the Indian plate where it descends beneath southern Tibet (Bilham and Ambraseys, 2005). The Kashmir earthquake is associated with the great plate boundary region as shown in Figure 1, where the Indian Plate is subducting under the Asian Plate. The tectonic movement in the region is responsible for the creation of the Himalayan mountain ranges through compressive and bending stresses. The subduction mechanism has triggered a few great and several intermediate earthquakes in a band of about 50-80 km width and an arc length of about 2500 km (Bilham, http://cires.colorado.edu/~bilham/). The recent event lies at the western tip of the active subduction Himalayan belt.
Figure 1. Global tectonic setting within the Indian-Asian plates subduction region.
Table 1 lists historical earthquakes in the region with those close to the location of the recent Kashmir earthquake highlighted in red. The Kashmir earthquake fits the pattern and fills a gap identified through GPS measurements and long-term geodetic observations of the Himalayan arc. Its association with a particular fault is still an issue of debate. This is typical of collision regions, as opposed to strike-slip or normal faulting where the causative fault is often well-delineated. A definitive identification of surface manifestations of the fault rupture has not been possible thus far, and is unlikely to occur in the future. It is likely that the fault rupture is ‘blind’, i.e. it stopped a few kilometers short of the surface. The fractures reported in the literature are secondary and not associated directly with the fault rupture (Durrani et al, 2005). Moreover, the extensive land sliding observed is also not directly associated with the fault rupture. Satellite imaging (COMET; http://comet.nerc.ac.uk/) provided a reasonable estimate of the location of the fault and its extent by mapping the shortening on the surface. The presumed fault trace is shown in Figure 2. The direction of the fault, being N27E to N30E, is confirmed from more than one source. The length of the rupture is reported by Harvard Seismology to be
202

about 90 km, with a width of about 50 km. The fault plane dips about 37 degrees and the mechanism is mostly thrust (Harvard and others fault plane solution shows a mildly oblique fault mechanism). The average slip is between 2-4 meters, confirmed from several sources (COMET, Harvard, Bilham, 2005). As shown in Figure 3, a closer examination of the rupture region indicates an axis running through Muzaffarabad and Balakot which are two of the most heavily damaged regions.
Table 1. Historical earthquakes associated with the subduction region (Bilham and Ambraseys, 2005).
Event Mw Lat. (°N) Long. (°E) Year Month Day Moment Cum moment Rate (mm/yr) Lo Mustang 8.2 29.5 83 1505 June 6 2.14E + 28 2.14E + 28 79.2 Srinagar 7.6 33.5 75.5 1555 September 2.69E + 27 2.41E + 28 8.1 Uttarpradesh 7.5 30 80 1720 July 15 1.91E + 27 2.60E + 28 2.2 Uttarpradesh 8.1 31.5 79 1803 September 1 1.51E + 28 4.11E + 28 2.5 Nepal 7.7 27.7 85.7 1833 August 26 3.80E + 27 4.49E + 28 2.5 Srinagar 6.4 34.1 74.6 1885 May 29 4.27E + 25 4.50E + 28 2.2 Kangra 7.8 33 76 1905 April 4 6.03E + 27 5.10E + 28 2.3 Bashahr 6.4 31.5 77.5 1906 February 27 5.13E + 25 5.10E + 28 2.3 Uttaranchal 7.3 29.9 80.5 1916 August 28 8.32E + 26 5.19E + 28 2.3 Uttaranchal 6.5* 30.3 80 1926 July 26 6.00E + 25 5.19E + 28 2.3 Nepal-Bihar 8.1 27.6 87.1 1934 January 15 1.82E + 28 7.01E + 28 3.0 West Nepal 7* 28.5 83.5 1936 May 7 1.00E + 27 7.11E + 28 3.0 Shillong 6.8 27 92 1941 January 21 5.01E + 25 7.12E + 28 3.0 Uttaranchal 6.5* 30.3 80 1945 June 4 6.00E + 25 7.12E + 28 3.0 Chamba 6.3 32.8 76.1 1945 June 22 3.16E + 25 7.13E + 28 3.0 Assam 7.3* 28.8 93.7 1947 July 29 8.30E + 26 7.21E + 28 3.0 Assam-Tibet 8.5 28.7 96.6 1950 August 15 5.62E + 28 1.28E + 29 5.3 Anantnang 5.6 33.6 75.3 1967 February 20 3.16E + 24 1.28E + 29 5.1 West Nepal 6.5* 29.6 81.1 1980 July 29 6.00E + 25 1.28E + 29 5.0 Uttarkashi 6.8* 30.8 78.8 1991 October 21 1.80E + 26 1.29E + 29 4.8 Chamoli 6.4* 30.5 79.4 1999 March 29 5.20E + 25 1.29E + 29 4.8
*Indicates magnitude adapted from other catalogues.
Figure 2. Location and extent of fault rupture
(COMET). Figure 3. Rupture region (adapted from R. Bilham web
site, http://cires.colorado.edu/~bilham/).
Characteristics of Strong Ground Motion Acceleration Spectra Only three strong-motion acceleration records were publicly available, and none are from the heavily damaged regions of Balakot and Muzaffarabad. Three records, each with three components, are
203

available for Nilore, Murree and Abbottabad; the latter location had serious damage, but is not comparable to Balakot and Muzaffarabad.
-0.3-0.2
-0.10
0.1
0.20.3
Acc
eler
atio
n (g
) 0.231g, EW
-0.3
-0.2
-0.1
0
0.1
0.2
0.3
Acc
eler
atio
n (g
) 0.197g, NS
-0.3-0.2
-0.10
0.1
0.20.3
0 10 20 30 40 50 60 70 80Time (sec)
Acc
eler
atio
n (g
) 0.087g, Vert
0
0.1
0.2
0.3
0.4
0.5
0.6
0.7
0.8
0.9
1
0 1 2 3 4Period (sec)
Resp
onse
Acc
eler
atio
n (g
)
ElasticDuct.=2Duct.=4Duct.=6
Figure 4. Strong Motion Records at Abbottabad. Figure 5. Spectra for EW component of Abbottabad. The signal from Abbottabad is the most usable of the three available records, since it is obtained from an area where significant damage has occurred and is of reasonable amplitudes. Figure 4 illustrates the strong motion records of Abbottabad. The PGAs are 0.231g, 0.197g, and 0.087g for EW, NS, and Vertical components, respectively. The elastic and inelastic spectra for horizontal component (EW) are given in Figure 5 with elastic (5%) and ductility 2, 4 and 6. The 5% elastic spectrum shows a relatively broad range of high amplification, from 0.4 to 2.0 seconds. The highest amplification is about 4.0. This is compared to the value of 2.6, which is the 84 percentile amplification factor given by Newmark and Hall (1982), thus indicating the relative severity of the Abbottabad record. The range of periods corresponding to high amplification is also unusual, extending to 2.0 seconds. Such a feature would result in relatively high demand imposed on both short and intermediate-long period structures. The constant ductility spectra shown in Figure 5 indicate rather low strength demand for highly ductile structures (of ductility 4.0 or more), and average demands for intermediate ductility structures (of ductility around 2.0). Table 2 contrasts amplification factors from the Abbottabad acceleration signal with records from the Northridge (USA, 1994), Hyogo-ken (Japan, 1995) and Kocaeli (Turkey, 1999) earthquakes. Table 2 shows that the Abbottabad record is less demanding than the known rich records of JMA Kobe and Sylmar Northridge for short periods, but close to them in the long period range. It is as demanding as the Yarimca record, known to have devastated the area hit by the Kocaeli earthquake of August 1999 (Elnashai, 2000). Taking into account how far Abbottabad is from the epicentral region, the overall impression the above brief review yields is that the built environment in the region affected was hit by very powerful strong ground motion.
Table 2. Acceleration response for ductility=2, at given periods, in g.
Earthquake-Record T=0.5 s T=1.0 s T=1.5 s T=2.0 s H-K Nanbu, JMA 1.50 0.80 0.40 0.20 Northridge, Sylmar 1.27 0.43 0.49 0.37 Northridge, Arleta 0.29 0.21 0.11 0.08 Kocaeli, Yarimca 0.29 0.27 0.19 0.14 Kashmir, Abbottabad 0.45 0.30 0.26 0.19
204

Duration of Record The duration of shaking is of significant effect on the inelastic deformational and energy dissipation demands on the structure. If a structure is deformed beyond its elastic limit during earthquake, the amount of permanent deformation will depend on how long the shaking is sustained. Therefore, the duration of earthquake shaking is a very important measure of the damage potential of ground motion. Bommer and Martinez–Pereira (1999), who reviewed 30 different definitions of strong ground motion duration, classify this general parameter into three generic classes: bracketed, uniform and significant durations. The latter researchers also proposed a definition, namely, effective duration which is also based on the significant duration concept, but both the start and end of the strong shaking phase are identified by absolute criteria. Table 3 shows a comparison of duration of the Abbottabad record and records from other known earthquakes. The bracketed duration with several criteria and significant duration were employed and compared with Arias Intensity (AI). The significant duration which has 95% of Arias Intensity, yields a duration for the Abbottabad record of 47.21 sec. In contrast, the duration of records in other earthquakes ranges between 11.42 and 17.84 sec. Therefore, the record obtained for Kashmir earthquake shows exceptionally long duration, a feature than must have compounded damage.
Table 3. Comparison of durations for record of Abbottabad (EW), Kashmir Earthquake.
Kashmir, Abbottabad
H-K Nanbu, JMA
Northridge, Arleta
Kocaeli, Yarimca Duration
Method Criterion Duration
(sec) % of AI
Duration (sec)
% of AI
Duration (sec)
% of AI
Duration (sec)
% of AI
5% of PGA 123.00 99.88 21.44 99.74 35.94 99.95 26.04 99.92 0.025g 59.68 98.03 37.74 99.98 24.88 99.02 25.16 99.82 Bracketed 0.05g 42.16 95.19 21.42 99.73 14.86 95.30 17.62 96.50
5% of AI 35.09 89.99 8.36 89.98 13.46 89.33 15.61 89.64 Significant 2.5% of AI 47.21 94.99 11.42 94.51 17.84 94.95 17.14 94.95
Figure 6 shows the duration of Abbottabad record for the various classifications above. For example, from the bars that represent the durations, bracketed duration with 0.05g threshold is most reasonable. Other bracketed assumptions overestimate the duration, whereas significant and effective durations underestimate it. Table 3 indicates that bracketed duration with 0.025g threshold includes 98% of the total energy in the record although it is associated with 1/3rd of the duration of the original record. Figure 7 shows that there is no change in elastic and inelastic spectra of original and truncated records, hence the bracketed duration is used to select relevant records, as below.
-0.3
-0.2
-0.1
0
0.1
0.2
0.3
0 20 40 60 80 100 120 140 160
Time (sec)
Acc
eler
atio
n (g
)
Bracketed_5 and 95 % of PGABracketed_0.025gBracketed_0.05gSignificant_5% of AISignificant_ 2.5% of AIEffective
Figure 6. Durations for record of Abbottabad (EW), Kashmir Earthquake.
205

0
0.1
0.2
0.3
0.4
0.5
0.6
0.7
0.8
0.9
1
0 0.5 1 1.5 2 2.5 3 3.5 4
Period (sec)
Spec
tral
Acc
eler
atio
n (g
)Original RecordBracketed with 0.025g
Elastic
2μ =
4μ =
6μ =0
0.1
0.2
0.3
0.4
0.5
0.6
0.7
0.8
0.9
1
0 0.5 1 1.5 2 2.5 3 3.5 4
Period (sec)
Spec
tral
Acc
eler
atio
n (g
)Original RecordBracketed with 0.025g
Elastic
2μ =
4μ =
6μ =0
50
100
150
200
250
300
350
400
450
0 0.5 1 1.5 2 2.5 3 3.5 4
Period (sec)
Spec
tral D
ispl
acem
ent (
mm
)
Original RecordBracketed with 0.025g
Elastic 2μ =
4μ =6μ =
Figure 7. Comparison of spectra between original and selected durations.
Attenuation Relationship of PGA
Firstly, the available PGAs from the five sites in Pakistan and response spectra of ground motion at Abbottabad were used to select attenuation relationships of PGA. The selection criteria were (i) subduction zones, thrust mechanisms, (ii) large magnitude, and (iii) large and uniformly processed data base. The candidate attenuation relationships with predictions for the various important sites are given in Table 4. The relationships are plotted for the Kashmir earthquake characteristics for the horizontal component, assuming stiff and soft soil, as shown in Figure 8. The PGA values from Tarbela, Barotha, Abbottabad, Nilore and Murree are also shown along with the distance error bars of +/- 10 km. Distances are measured from the presumed fault zone. Based on the fidelity of prediction of the peak ground acceleration values, two attenuation relationships are feasible; Campbell (1997) and Ambraseys et al (2005). The former tends to give lower estimates than the latter. Taking into account that the PGA at Nilore is probably affected by the dimensions of the raft where the instrument was anchored, and adopting a conservative approach, the relationship of Ambraseys et al (2005) is selected. It is noteworthy that the relationship of Campbell (1997) would give marginally higher PGA in the near-source region. Finally it is noteworthy that the vertical ground motion is very well predicted by the selected attenuation relationship, an observation that supports the effect of the raft foundation.
Table 4. Prediction of horizontal peak ground acceleration for each attenuation relationship.
Krinitzsky et al (1988)
Dahle et al (1995)
Campbell (1997)
Schmidt et al (1997)
Ambraseys et al (2005) Location
(distance from fault) Stiff Soft Stiff Soft Stiff Soft Stiff Soft Stiff Soft
Tarbela (80 km) 0.061 0.757 0.094 0.130 0.042 0.055 0.114 0.127 0.111 0.135 Barotha P. C. (140km) 0.046 0.563 0.057 0.079 0.017 0.023 0.065 0.072 0.071 0.087 Muzaffarabad (4 km) 0.079 0.968 0.458 0.635 0.720 0.800 0.751 0.835 0.659 0.805
Balakot (10 km) 0.078 0.964 0.345 0.478 0.471 0.548 0.531 0.591 0.486 0.594 Abbottabod (39 km) 0.073 0.903 0.16 0.221 0.124 0.155 0.21 0.234 0.194 0.237 Islabamad (98 km) 0.056 0.692 0.079 0.110 0.031 0.04 0.094 0.104 0.094 0.115
206
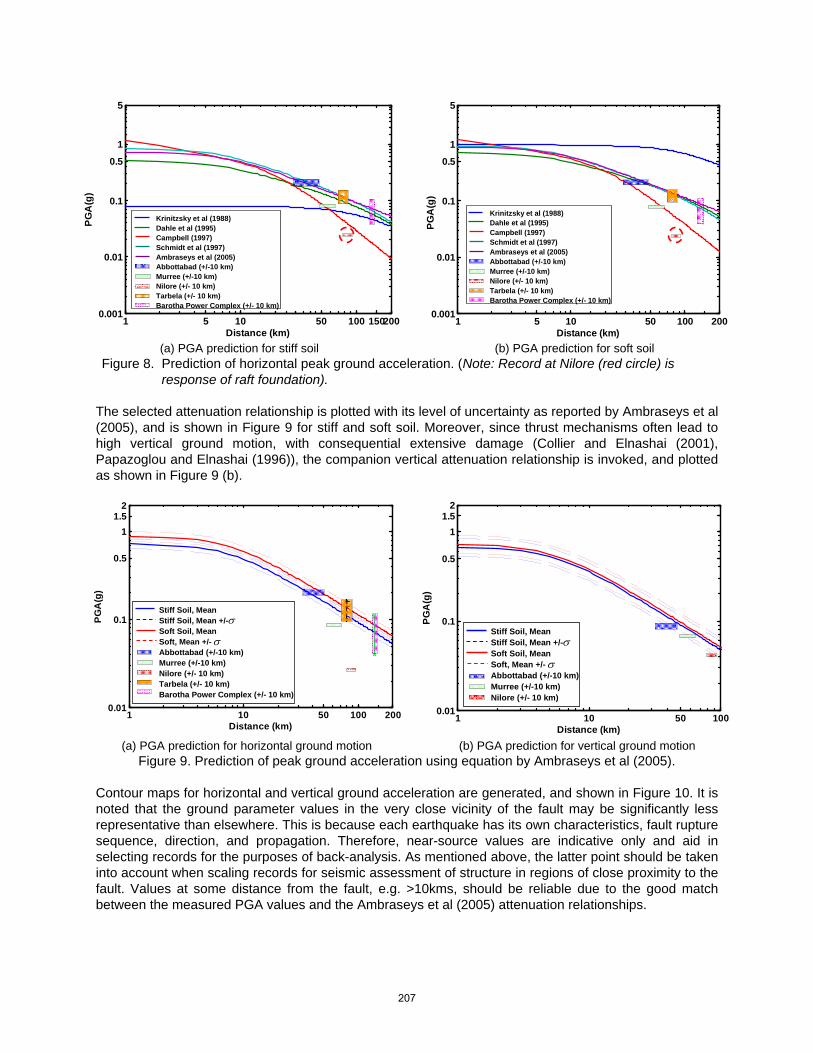
(a) PGA prediction for stiff soil (b) PGA prediction for soft soil
Figure 8. Prediction of horizontal peak ground acceleration. (Note: Record at Nilore (red circle) is response of raft foundation).
The selected attenuation relationship is plotted with its level of uncertainty as reported by Ambraseys et al (2005), and is shown in Figure 9 for stiff and soft soil. Moreover, since thrust mechanisms often lead to high vertical ground motion, with consequential extensive damage (Collier and Elnashai (2001), Papazoglou and Elnashai (1996)), the companion vertical attenuation relationship is invoked, and plotted as shown in Figure 9 (b).
(a) PGA prediction for horizontal ground motion (b) PGA prediction for vertical ground motion
Figure 9. Prediction of peak ground acceleration using equation by Ambraseys et al (2005). Contour maps for horizontal and vertical ground acceleration are generated, and shown in Figure 10. It is noted that the ground parameter values in the very close vicinity of the fault may be significantly less representative than elsewhere. This is because each earthquake has its own characteristics, fault rupture sequence, direction, and propagation. Therefore, near-source values are indicative only and aid in selecting records for the purposes of back-analysis. As mentioned above, the latter point should be taken into account when scaling records for seismic assessment of structure in regions of close proximity to the fault. Values at some distance from the fault, e.g. >10kms, should be reliable due to the good match between the measured PGA values and the Ambraseys et al (2005) attenuation relationships.
1 5 10 50 100 2000.001
0.01
0.1
0.5
1
5
Distance (km)
PGA
(g)
Krinitzsky et al (1988)Dahle et al (1995) Campbell (1997)Schmidt et al (1997)Ambraseys et al (2005)Abbottabad (+/-10 km)Murree (+/-10 km)Nilore (+/- 10 km)Tarbela (+/- 10 km)Barotha Power Complex (+/- 10 km)
1 5 10 100 20050 1500.001
0.01
0.1
0.5
1
5
Distance (km)
PG
A(g
)
Krinitzsky et al (1988)Dahle et al (1995) Campbell (1997)Schmidt et al (1997)Ambraseys et al (2005)Abbottabad (+/-10 km)Murree (+/-10 km)Nilore (+/- 10 km)Tarbela (+/- 10 km)Barotha Power Complex (+/- 10 km)
1 10 50 1000.01
0.1
0.5
11.5
2
Distance (km)
PGA
(g)
Stiff Soil, MeanStiff Soil, Mean +/-Soft Soil, MeanSoft, Mean +/-Abbottabad (+/-10 km)Murree (+/-10 km)Nilore (+/- 10 km)
σ
σ
1 10 50 100 2000.01
0.1
0.5
11.5
2
Distance (km)
PG
A(g
)
Stiff Soil, MeanStiff Soil, Mean +/-Soft Soil, MeanSoft, Mean +/-Abbottabad (+/-10 km)Murree (+/-10 km)Nilore (+/- 10 km)Tarbela (+/- 10 km)Barotha Power Complex (+/- 10 km)
σ
σ
207
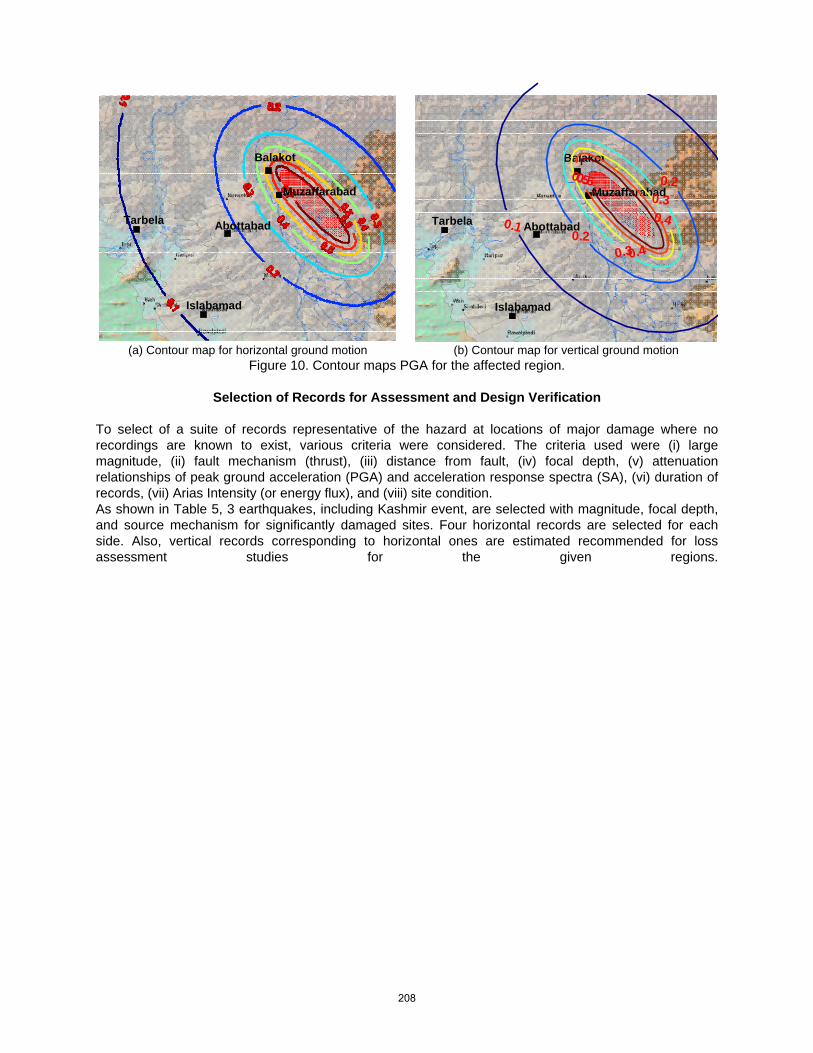
(a) Contour map for horizontal ground motion (b) Contour map for vertical ground motion
Figure 10. Contour maps PGA for the affected region.
Selection of Records for Assessment and Design Verification To select of a suite of records representative of the hazard at locations of major damage where no recordings are known to exist, various criteria were considered. The criteria used were (i) large magnitude, (ii) fault mechanism (thrust), (iii) distance from fault, (iv) focal depth, (v) attenuation relationships of peak ground acceleration (PGA) and acceleration response spectra (SA), (vi) duration of records, (vii) Arias Intensity (or energy flux), and (viii) site condition. As shown in Table 5, 3 earthquakes, including Kashmir event, are selected with magnitude, focal depth, and source mechanism for significantly damaged sites. Four horizontal records are selected for each side. Also, vertical records corresponding to horizontal ones are estimated recommended for loss assessment studies for the given regions.
Tarbela Abottabad
Islabamad
Balakot
Muzaffarabad0.6
0
0.1
0.2
0.2
0.3
0.3
0.4
0.4
0.5
Tarbela Abottabad
Islabamad
Balakot
Muzaffarabad
208

Table 6 shows the characteristics of the selected records and selection criteria such as PGA, fault distance, and duration. Additionally, attenuation relationship of spectra ordinates using the method suggested by Ambraseys et al (2005) were compared including the level of uncertainty. As shown in Figure 11, the spectra for selected records have a good match with the prediction. Moreover, the Arias Intensity shown in Figure 12 indicates that the selected records show similar energy trend with the record from the Kashmir earthquake. Clearly, some of records do not match the selection criteria but are sufficiently close.
Table 5. Selected earthquakes for heavily damaged regions.
Earthquake
Name Country Date Depth(km) Mw
Source Mechanism
Station Applied Area Reference Name
Tabas Iran 9/16/1978 5 7.4 thrust Tabas Muzaffarabad M-Ta-Taba Chi Chi Taiwan 9/20/1999 33 7.6 thrust Chiayi (CHY080) M-Ch-C080
Taichung (TCU129) Balakot B-Ch-T129 Taichung (TCU079) B-Ch-T079 Chiayi (CHY046) Abbottabad A-Ch-C046 Chiayi (CHY047) A-Ch-C047
Kashmir Pakistan 10/8/2005 26 7.6 thrust Abbottabad A-Ka-Abbo
209

Table 6. Selected records with criteria for back-analysis, based on available information.
PGA (g) Criteria
Ambraseys et al (2004) Campbell (1997) Reference
Name
Fault Distance
(km)
Soil Type EW NS Vert
Hor Vert Hor Vert
Duration
(sec)
A-Ka-Abbo 39.0 Soft 0.231 0.197 0.087 59.00A-Ch-C046 29.5 Soft - 0.182 0.079 0.209~0.269 0.096~0.153 0.143~0.356 0.074~0.221 43.60A-Ch-C047 29.4 Soft - 0.186 0.086 53.53B-Ch-T129 13.5 Soft 1.010 0.634 0.341 0.524~0.674 0.302~0.478 0.387~0.896 0.206~0.749 55.42B-Ch-T079 11.0 Soft 0.742 0.393 0.388 53.69M-Ch-C080 3.10 Stiff 0.968 0.902 0.724 0.581~0.747 0.449~0.711 0.489~1.413 0.259~1.163 53.21M-Ta-Taba 3.0 Stiff 0.927 1.103 0.840 53.22
* Italic font is the criterion value
0
0.2
0.4
0.6
0.8
1
1.2
0 0.5 1 1.5 2 2.5
Period (sec)
Spec
tral
Acc
eler
atio
n (g
)
Ambrasyes (2004)A-Ka-Abbo_EWA-Ka-Abbo_NSA-Ch-C046_NSA-Ch-C047_NS
0
0.5
1
1.5
2
2.5
3
3.5
0 0.5 1 1.5 2 2.5
Period (sec)
Spe
ctra
l Acc
eler
atio
n (g
)
Ambrasyes (2004)M-Ch-C080_VertM-Ta-Taba_Vert
(a) Horizontal ground motion at Abbottabad (soft soil) (b) Vertical ground motion at Muzaffarabad (stiff soil) Figure 11. Comparison of spectral acceleration from attenuation relationship and selected records.
0 10 20 30 40 50 600
10
20
30
40
50
60
70
80
90
100
Time (sec)
Aria
s In
tens
ity (%
)
A-Ka-AbboA-Ch-C046A-Ch-C047
0 10 20 30 40 50 600
10
20
30
40
50
60
70
80
90
100
Time (sec)
Aria
s In
tens
ity (%
)
A-Ka-AbboA-Ch-C046A-Ch-C047
0 10 20 30 40 50 60
0
10
20
30
40
50
60
70
80
90
100
110
Time (sec)
Aria
s In
tens
ity (%
)
AbbottabadChiChi TCU079 N-SChiChi TCU079 E-WChiChi TCU129 N-SChiChi TCU129 E-W
A-Ka-AbboB-Ch-T079 NSB-Ch-T079 EWB-Ch-T129 NSB-Ch-T129 EW
0 10 20 30 40 50 600
10
20
30
40
50
60
70
80
90
100
110
Time (sec)
Aria
s In
tens
ity (%
)
AbbottabadChiChi TCU079 N-SChiChi TCU079 E-WChiChi TCU129 N-SChiChi TCU129 E-W
A-Ka-AbboB-Ch-T079 NSB-Ch-T079 EWB-Ch-T129 NSB-Ch-T129 EW
(a) Horizontal ground motions for Abbottabad site (b) Horizontal ground motions for Balakot site
Figure 12. Comparison of Arias Intensity for selected records and Abbottabad record.
Implications for Future Earthquake Hazard and Needs The Kashmir earthquake, in a regional setting, is considered to be a moderate earthquake, since the region is susceptible to great earthquakes of magnitudes > 8.0. Estimates of slip rates vary considerably, and it is not the objective of this paper to resolve the differences or re-interpret their underlying assumptions. The most reliable estimates suggest an average slip of ~18 mm/year (Bilham and
210
Ambraseys, 2005), averaged over the entire India-Tibet collision zone. The average slip observed in earthquakes over the past 5 centuries amounts to less than 3 mm/year. Whereas other interpretations exist, the most likely outcome of the above is that there are massive earthquakes awaited nucleating in the Himalayan arc. In the latter publication, it is estimated that four earthquakes of magnitude > 8.4 are required to make up for the slip deficit between GPS-calculated strains, and slip during earthquakes observed from year 1500 to 2000. With the Kashmir earthquake releasing less than 10% of the energy stored in the collision region, many large population centers throughout northern Pakistan and India are exposed to serious seismic risk. The dearth of strong ground motion records points to the need for a well developed seismic monitoring network of not only the area affected by the recent earthquake, but for all of Pakistan. Moreover, a clearing house should be established to disseminate such data, and other earthquake information, to encourage the community to undertake analysis and assessments, thus enriching the knowledge base and aiding in the better understanding of Himalayan earthquakes and their effects.
Conclusions The Kashmir earthquake of October 8, 2005 inflicted a heavy toll on lives and livelihoods in a large region in northern and north-eastern Pakistan, and even parts of northern India. It is in an active tectonic region where the Indian plate subducts under the Asian plate, creating an arc of high seismicity that is responsible for major earthquakes in the past. Whilst the earthquake had a magnitude of 7.6, the capability of the faults in the Himalayan region is for earthquakes of magnitude > 8.0, of which several are expected in the future. In this paper, the reconstructed seismic hazard in the affected region using the very limited data available is presented. It is observed that the acceleration spectra exhibit higher amplification factors than average code spectra and other records from previous damaging earthquakes. The duration of the Abbottabad record is 2.6 to 4.1 times longer than those of other earthquake records which caused extensive damage. Suitable records which represent earthquake hazard in the most affected areas are suggested considering (i) magnitude, (ii) fault mechanism, (iii) distance from fault, (iv) focal depth, (v) attenuation relationships, (vi) duration of shaking, (vii) Arias Intensity, and (viii) site condition. The records are recommended for use in seismic assessment of structures in this region. The paper therefore provides a complete definition of hazard for regional impact assessment as well as analysis and design studies.
Acknowledgments The field mission resulting in this paper was funded by the Mid-America Earthquake Center, a National Science Foundation Engineering Research Center funded under grant EEC-9701785.
References Ambraseys, N. N., Douglas, J., Sarma and Smit, P. M., 2005. Equation for the Estimation of strong
Ground Motions from Shallow Crustal Earthquakes Using Data From Europe and the Middle East: Horizontal Peak Ground Acceleration and Spectral Acceleration, Bulletin of Earthquake Engineering 3:1-53,
Ambraseys, N. N., Douglas, J., Sarma and Smit, P. M., 2004. Equation for the Estimation of strong
Ground Motions from Shallow Crustal Earthquakes Using Data From Europe and the Middle East: Vertical Peak Ground Acceleration and Spectral Acceleration, Imperial College, London.
Asian Development Bank and World Bank, 2005. Preliminary Damage and Needs Assessment, Nov. 12. Bilham, R. and Ambraseys, N. N., 2005. Apparent Himalayan slip deficit from the summation of seismic
moments for Himalayan earthquakes, 1500-2000, Current Science, VOL. 88, NO 10, 1658-1663.
211

Bommer, J. J. and Martinez-Pereira, A., 1999. The Effective Duration of Earthquake Strong Motion,
Journal of Earthquake Engineering, Vol. 3, No. 2,127-172 Campbell, K. W., 1997. Empirical near-source attenuation relationships for horizontal and vertical
components of peak ground acceleration, peak ground velocity, and pseudo-absolute acceleration response spectra, Seismological Research Letters, 68(1), 154–179.
Collier, C. J. and Elnashai, A. S., 2001. A Procedure for Combining Vertical and Horizontal Seismic
Action Effects, Journal of Earthquake Engineering, Vol. 5 (4), 521-539. Elnashai, A. S., 2000. Analysis of the damage potential of the Kocaeli (Turkey) earthquake of August
1999, Journal of Engineering Structures, Vol. 22, 744 -754. Papazoglou, A. J. and Elnashai, A. S., 1996. Analytical and field evidence of the damaging effect of
vertical earthquake ground motion, Earthquake Engineering and Structural Dynamics, Vol. 25, 1109-1137.
Dahle, A., Climent, A., Taylor, W., Bungum, H., Santos, P., Ciudad Real, M., Linholm, C., Strauch, W., &
Segura, F.,1995, New spectral strong motion attenuation models for Central America, Proceedings of the Fifth International Conference on Seismic Zonation, vol. II., 1005–1012.
Durrani, A., Elnashai A. S., Hashash, Y., Kim, S. J., and Masud, A., 2005. The Kashmir Earthquake of
October 8, 2005: A Quicklook Report, Mid-America Earrthquake Center, Report No. 05-04. Newmark, N. M., and Hall, W. J., 1982. Earthquake Spectra and Design, Earthquake Engineering
Research Institute, Berkeley, California, 103 pp. Schmidt, V., Dahle, A., and Bungum, H., 1997. Costa Rican spectral strong motion attenuation. Tech.
rept. NORSAR, Kjeller, Norway. Reduction of Natural Disasters in central America Earthquake Preparedness and Hazard Mitigation Phase II: 1996–2000, Part 2, 1997.
212
Related Documents