An Emission Inventory for Natural Gas Development in the Haynesville Shale and Evaluation of Ozone Impacts 19 th International Emission Inventory Conference September 28, 2010 Susan Kemball-Cook, Amnon Bar-Ilan, John Grant, Lynsey Parker, Jaegun Jung, Wilson Santamaria, and Greg Yarwood ENVIRON Template Template [email protected]

Welcome message from author
This document is posted to help you gain knowledge. Please leave a comment to let me know what you think about it! Share it to your friends and learn new things together.
Transcript
An Emission Inventory for Natural Gas Development in the Haynesville Shale
and Evaluation of Ozone Impacts
19th International Emission Inventory Conference
September 28, 2010
Susan Kemball-Cook, Amnon Bar-Ilan, John Grant, Lynsey Parker, Jaegun Jung, Wilson Santamaria, and Greg Yarwood
ENVIRON
TemplateTemplate
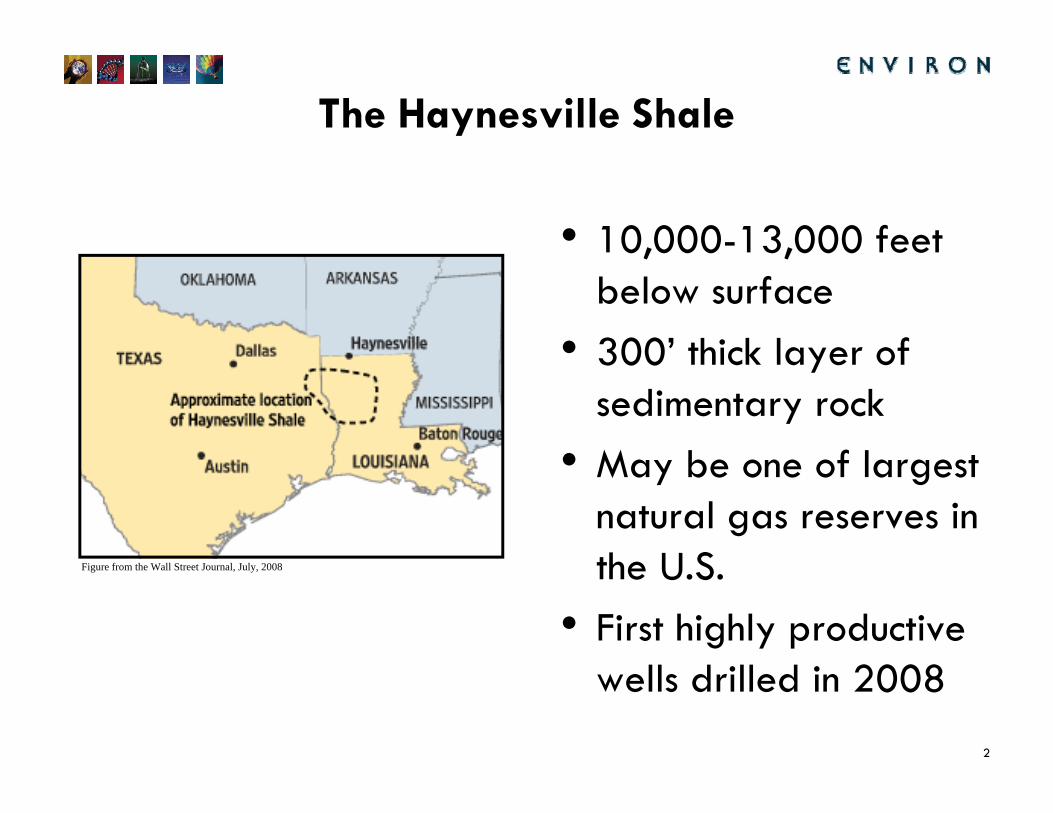
The Haynesville Shale
• 10,000-13,000 feet 0,000 3,000below surface
• 300’ thick layer of 300 thick layer of sedimentary rock
• M b f l t • May be one of largest natural gas reserves in th U Sthe U.S.
• First highly productive
Figure from the Wall Street Journal, July, 2008
2
wells drilled in 2008
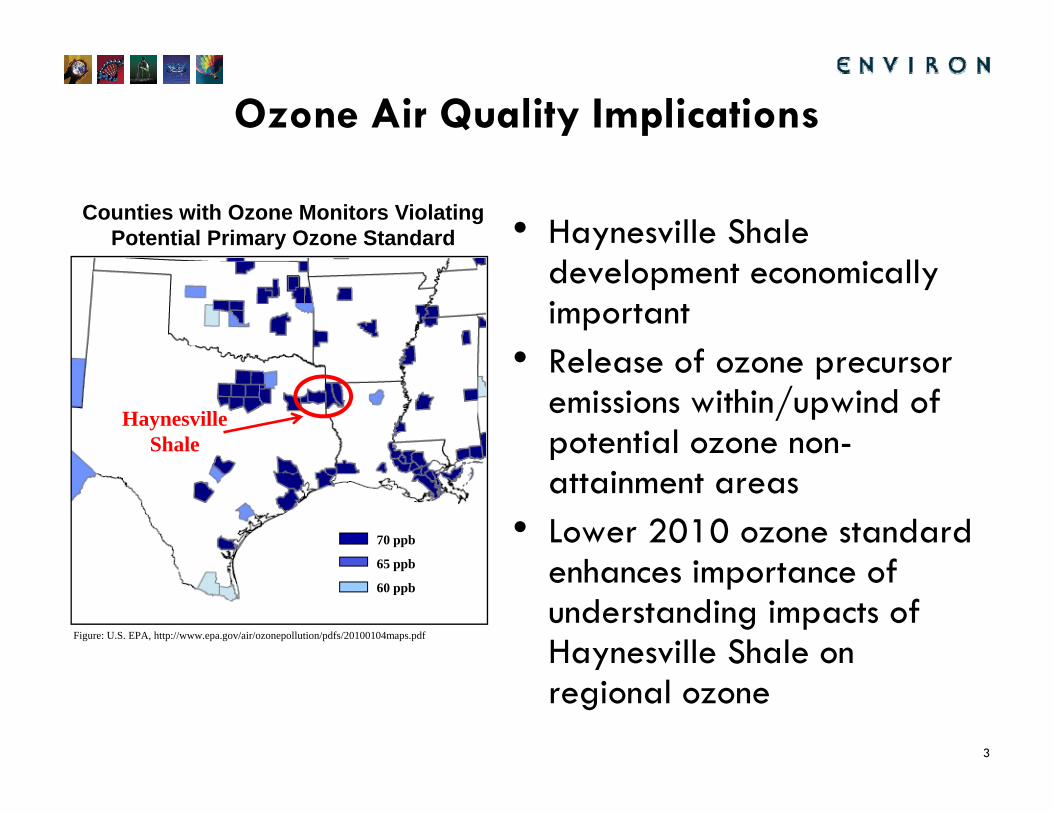
Ozone Air Quality Implications
• Haynesville Shale Counties with Ozone Monitors Violating
Potential Primary Ozone Standard
development economically important
• R l f • Release of ozone precursor emissions within/upwind of potential ozone non-
HaynesvilleShale p
attainment areas• Lower 2010 ozone standard
h i f 70 ppb
65 b enhances importance of understanding impacts of Haynesville Shale on
Figure: U.S. EPA, http://www.epa.gov/air/ozonepollution/pdfs/20100104maps.pdf
65 ppb
60 ppb
3
ay esv e S a e o regional ozone

Emissions from Exploration
Figure from geology.com
Figure from http://www.axpc.us/field/index.html
4
• Drilling, completion, fracing

Horizontal Drilling and Hydraulic Fracturing
5
Figure from energyindustryphotos.com
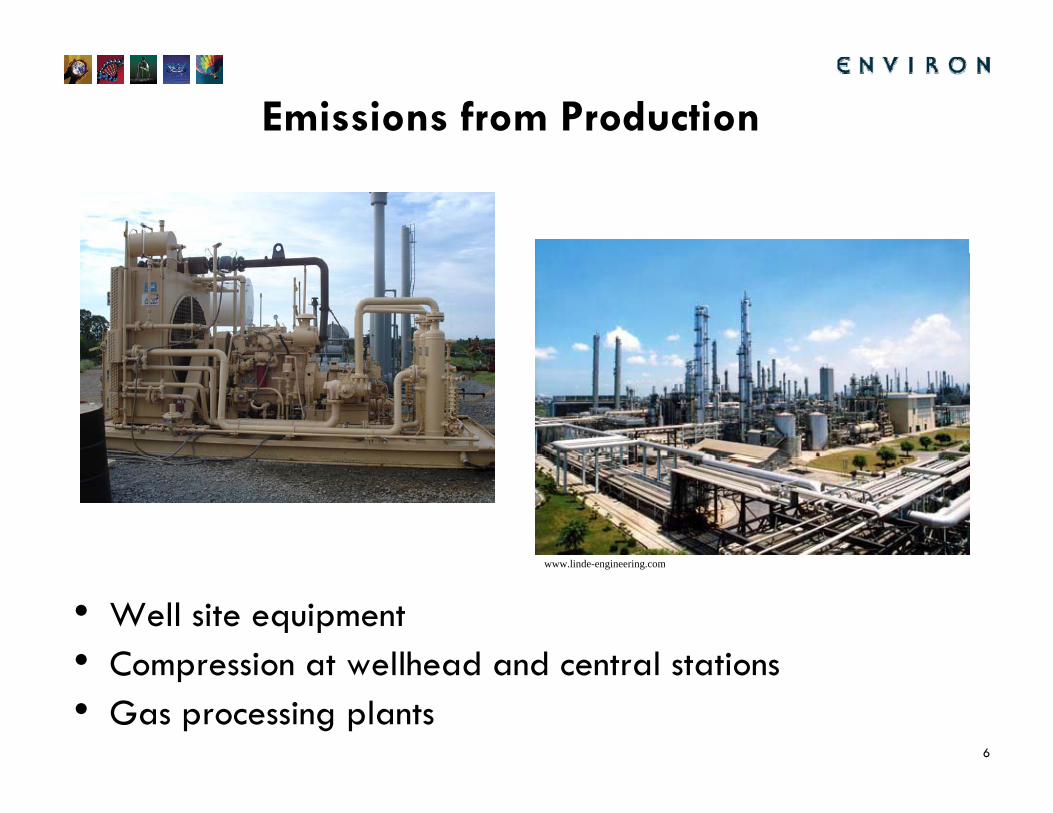
Emissions from Production
li d i i
• Well site equipment• Compression at wellhead and central stations
www.linde-engineering.com
6
• Compression at wellhead and central stations• Gas processing plants

Study of Haynesville Development
• Estimate future development to 2020• Calculate associated emissions of ozone precursors• Model ozone impacts in 2012p• Study performed in 2009-new information now
available available
7
Projecting Future Development and Emissions
• Future year activity based onN b f ll d ill d h – Number of new wells drilled each year
– Well productivity• All l l i f f i id• Allows calculation of formation-wide
– Well countG d i– Gas production
• Once well count and gas production are forecast, d l i i i t f l ti can develop an emission inventory for exploration
and production activity for the entire Haynesville Shale
8
Shale
Projecting Future Activity
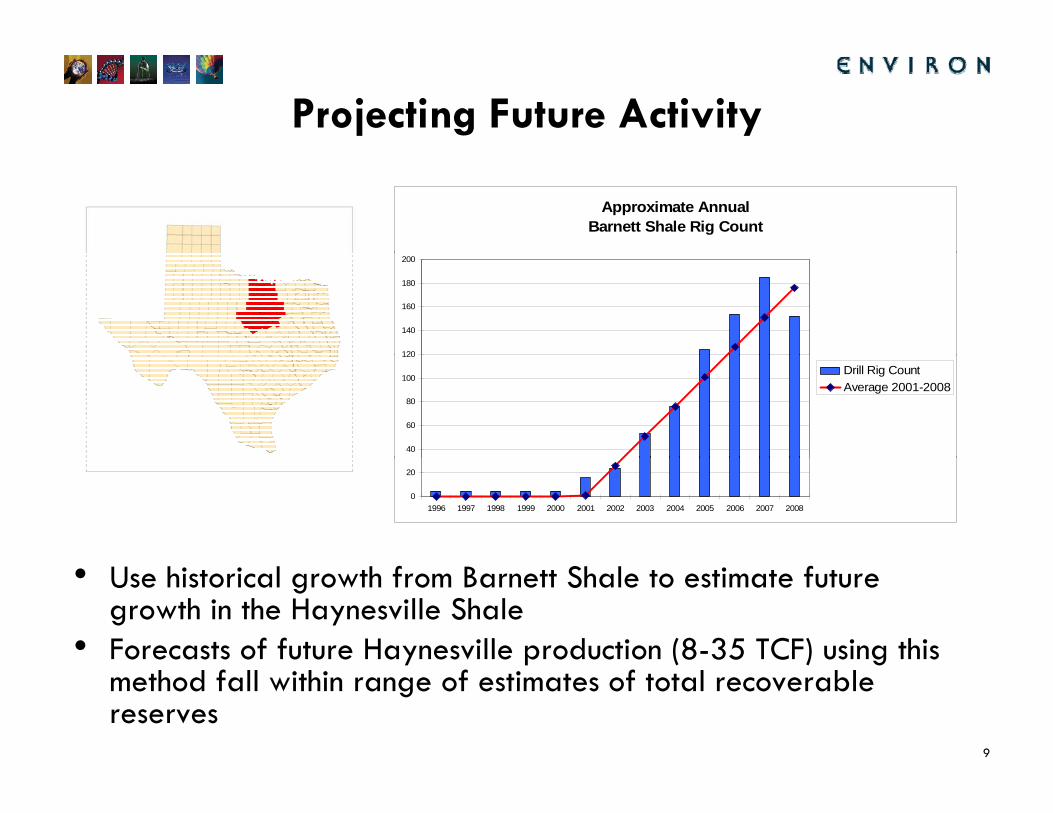
Approximate AnnualBarnett Shale Rig Count
120
140
160
180
200
40
60
80
100
120
Drill Rig CountAverage 2001-2008
0
20
1996 1997 1998 1999 2000 2001 2002 2003 2004 2005 2006 2007 2008
• Use historical growth from Barnett Shale to estimate future growth in the Haynesville Shale
• Forecasts of future Haynesville production (8-35 TCF) using this y p ( ) gmethod fall within range of estimates of total recoverable reserves
9

Drill Rig Projections: 3 Scenarios
Average Annual Drill Rig Count
250
150
200
250
lSept. 2010
50
100
150 lowmediumhigh
March 2009
Sept 0 0~145 Rigs
0
50
2009 2010 2011 2012 2013 2014 2015 2016 2017 2018 2019 2020
95 Rigs
• Low scenario: leave March 2009 drill rig count fixed• High scenario: use 2001-2008 Barnett Shale rig count growth, cap
10
growth at 200 rigs• Moderate: 50% of high scenario
Well Number Projections
Cumulative Number of Active Wells
8000
10000
12000
l
4000
6000lowmediumhigh
0
2000
2009 2010 2011 2012 2013 2014 2015 2016 2017 2018 2019 2020
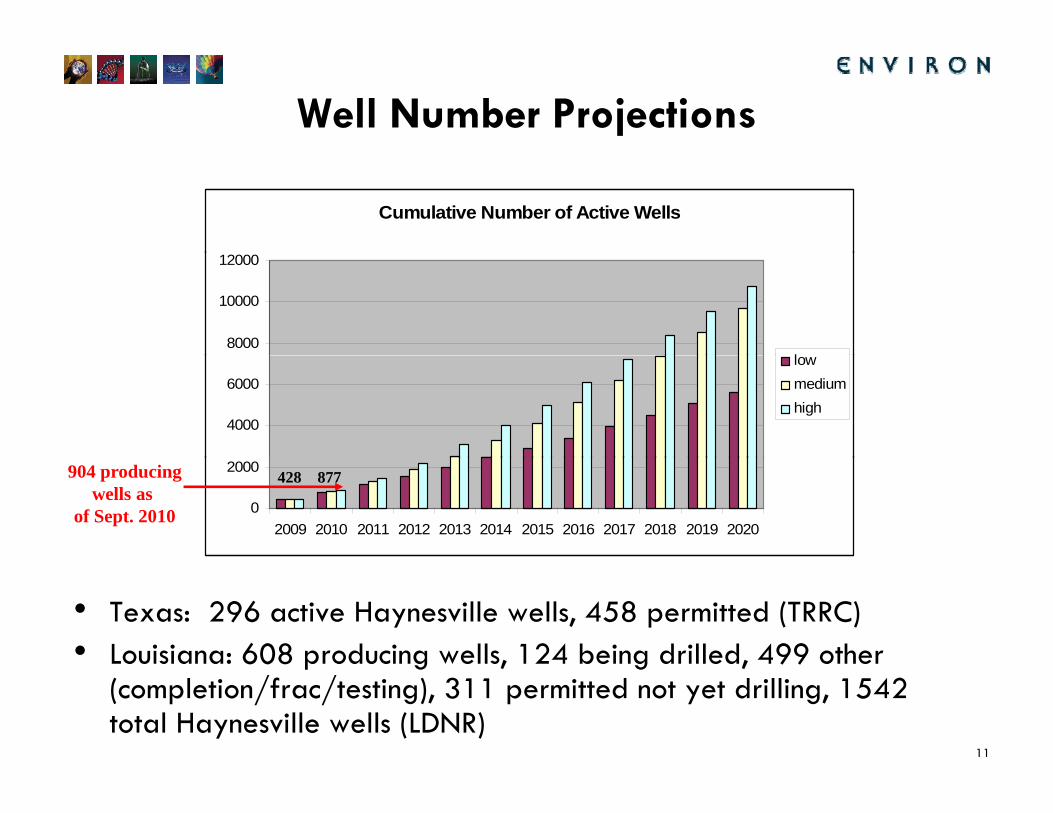
904 producingwells as
of Sept. 2010
877428
• Texas: 296 active Haynesville wells, 458 permitted (TRRC)• Louisiana: 608 producing wells, 124 being drilled, 499 other
11
Louisiana: 608 producing wells, 124 being drilled, 499 other (completion/frac/testing), 311 permitted not yet drilling, 1542 total Haynesville wells (LDNR)

Formation-Wide Emissions: Moderate Scenario
NOx Emissions VOC Emissions
• Gas processing plants, compressor stations, drill rigs Gas p ocess g p a s, co p esso s a o s, d gsare important sources of NOx and VOCs
• Drill rig emissions fall off after 2017 due to controls
12
• Haynesville development likely to continue past 2020
Projected Haynesville Shale NOx Emissions
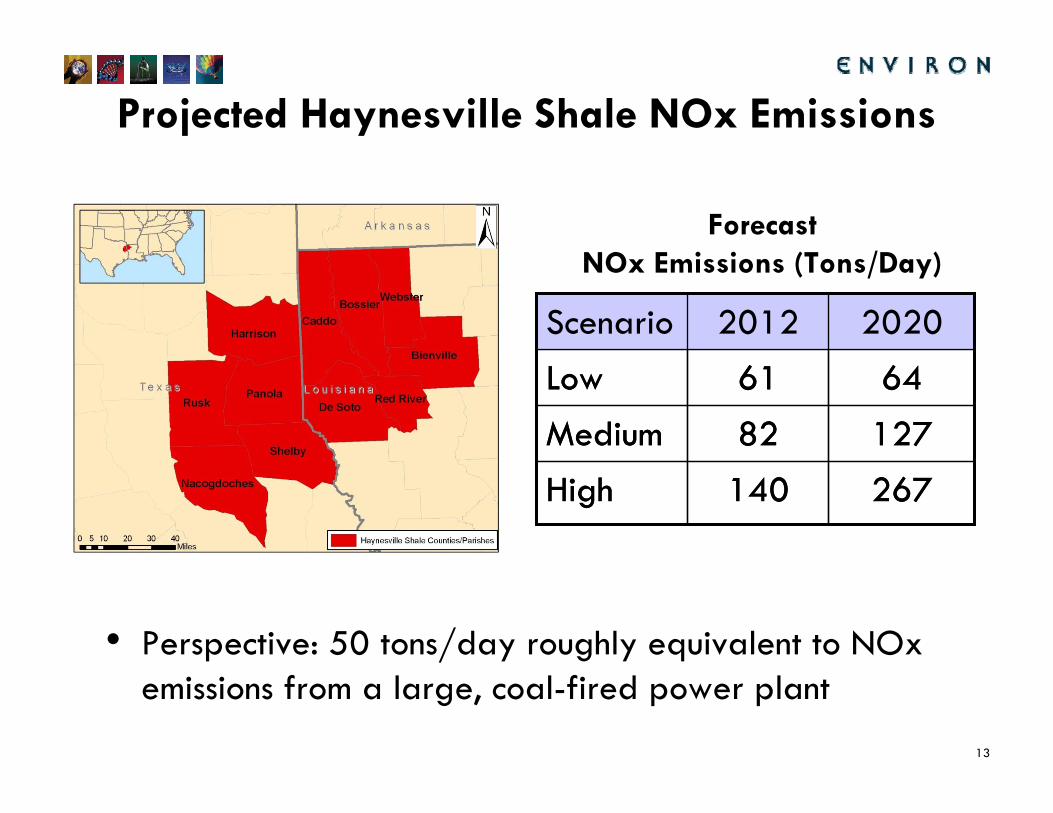
ForecastNO E i i (T /D )
20202012Scenario 20202012Scenario
NOx Emissions (Tons/Day)
12782Medium
6461Low
12782Medium
6461Low
267140High 267140High
• Perspective: 50 tons/day roughly equivalent to NOx
13
emissions from a large, coal-fired power plant
CAMx Ozone Model
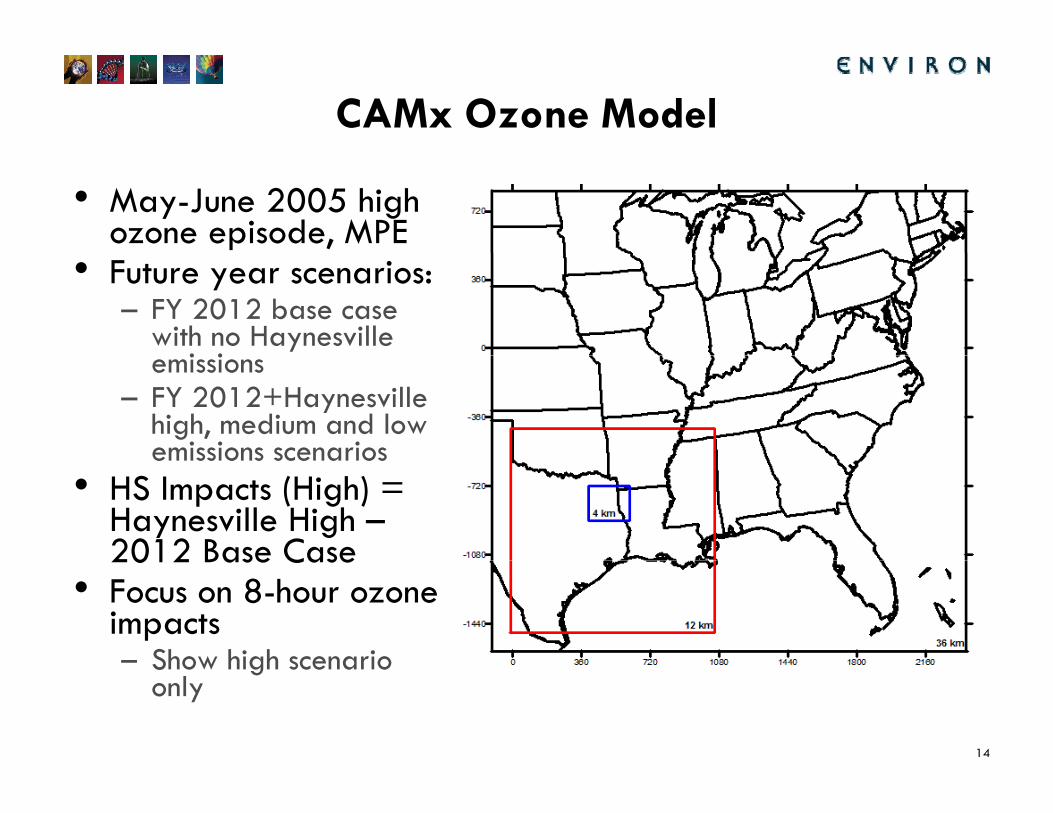
• May-June 2005 high ozone episode, MPE
• Future year scenarios:– FY 2012 base case
with no Haynesville i i emissions
– FY 2012+Haynesville high, medium and low emissions scenariosemissions scenarios
• HS Impacts (High) = Haynesville High –2012 Base Case2012 Base Case
• Focus on 8-hour ozone impacts– Show high scenario
14
Show high scenario only

Average Regional 8-Hour Ozone Impacts in 2012
• Average impacts > 1 ppb restricted to Northeast Texas,
15
Average impacts > 1 ppb restricted to Northeast Texas, Louisiana, Arkansas and Oklahoma
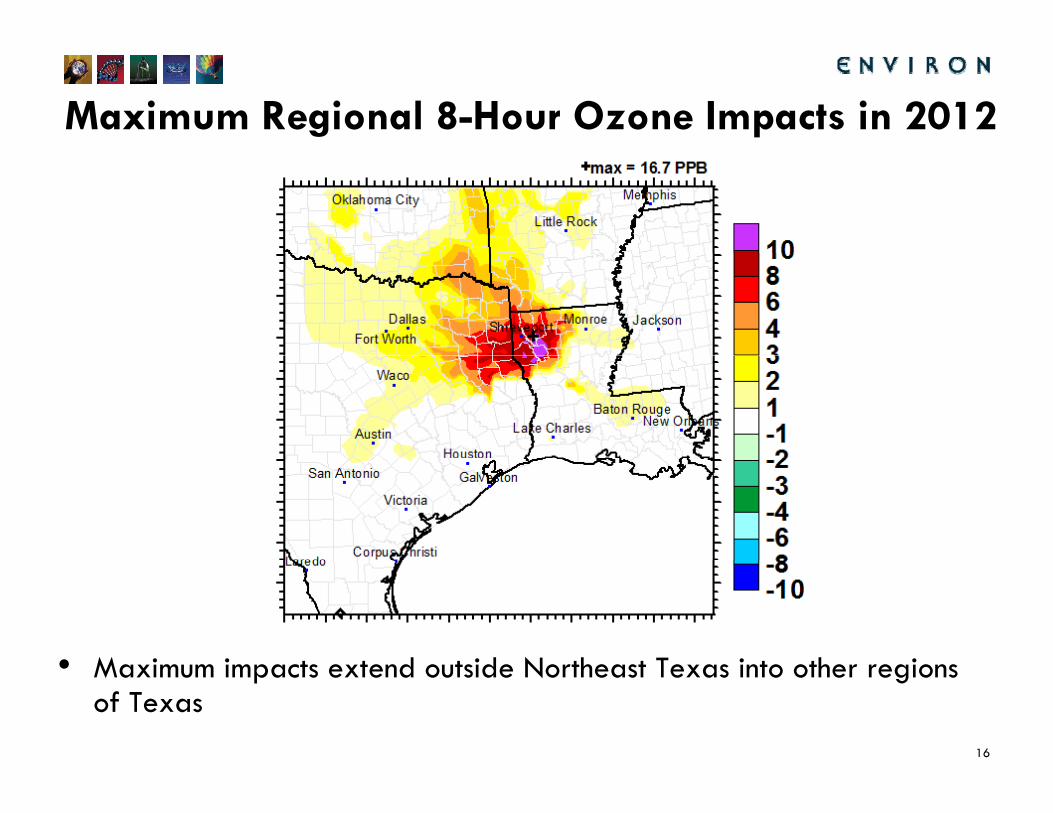
Maximum Regional 8-Hour Ozone Impacts in 2012
• M i i t t d t id N th t T i t th i
16
• Maximum impacts extend outside Northeast Texas into other regions of Texas
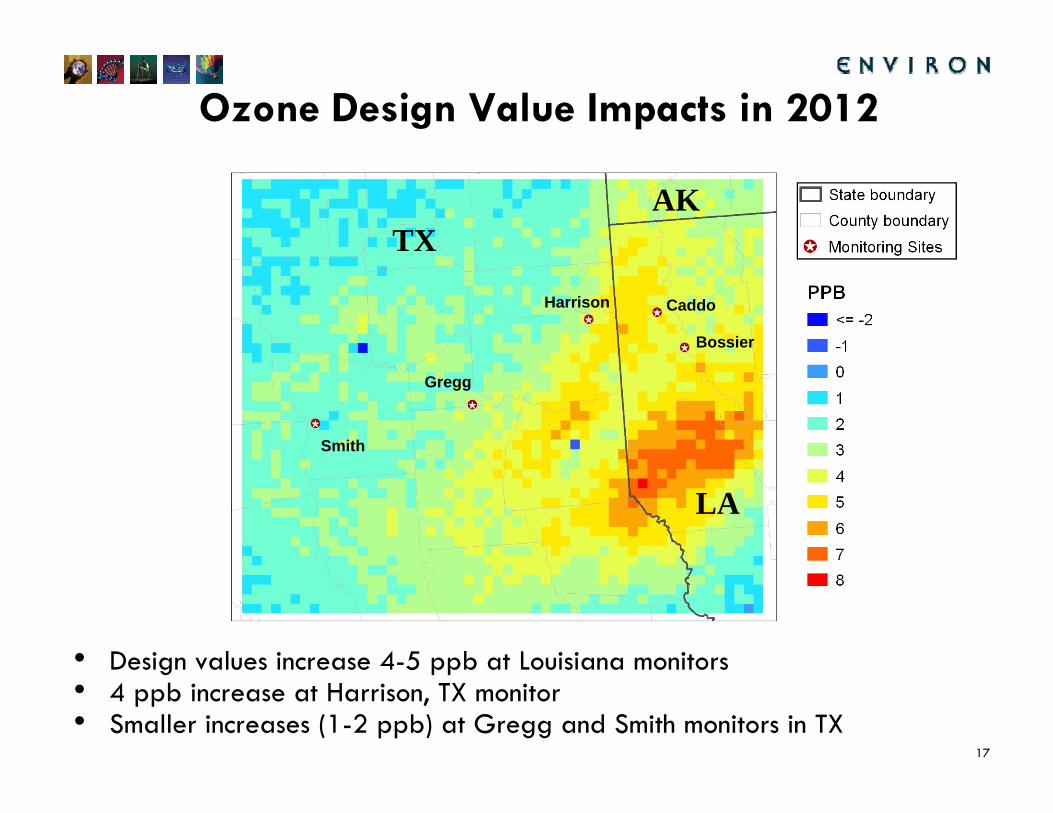
Ozone Design Value Impacts in 2012
TXAK
Caddo
Bossier
Harrison
Gregg
Smith
LA
• Design values increase 4-5 ppb at Louisiana monitors
17
Design values increase 4-5 ppb at Louisiana monitors• 4 ppb increase at Harrison, TX monitor• Smaller increases (1-2 ppb) at Gregg and Smith monitors in TX
Summary
• Haynesville Shale development is a concern for future regional air qualityfuture regional air quality
• Early estimates presented here are uncertainMay underestimate NOx because assumed little well– May underestimate NOx because assumed little well-head compression
– May over- or underestimate emissions for other reasonsM y• Additional study is planned and will benefit from
more data regarding well site compression, well g g p ,decline curves, etc.– Input from energy companies would be very useful in
18
constraining the emissions projections

Acknowledgement
• This work was performed on behalf of Northeast A C h f hTexas Air Care, with support from the Texas
Commission on Environmental Quality
19
Related Documents


