National Park Service U.S. Department of the Interior Natural Resource Stewardship and Science Hawai‘i Volcanoes National Park Acoustical Monitoring Report 2013 Natural Resource Report NPS/NRSS/NSNS/NRR—2018/1578

Welcome message from author
This document is posted to help you gain knowledge. Please leave a comment to let me know what you think about it! Share it to your friends and learn new things together.
Transcript
National Park Service
U.S. Department of the Interior
Natural Resource Stewardship and Science
Hawai‘i Volcanoes National Park
Acoustical Monitoring Report 2013
Natural Resource Report NPS/NRSS/NSNS/NRR—2018/1578

ON THE COVER
Photograph of acoustic equipment located in HAVO at the Kahuku Rainforest site.
Photograph courtesy of the National Park Service and Chris Garsha
Hawai‘i Volcanoes National Park
Acoustical Monitoring Report 2013
Natural Resource Report NPS/NRSS/NSNS/NRR—2018/1578
J. Adam Beeco and Ashley R. Pipkin
National Park Service
Natural Sounds and Night Skies Division
1201 Oakridge Drive, Suite 100
Fort Collins, Colorado 80525
January 2018
U.S. Department of the Interior
National Park Service
Natural Resource Stewardship and Science
Fort Collins, Colorado
ii
The National Park Service, Natural Resource Stewardship and Science office in Fort Collins,
Colorado, publishes a range of reports that address natural resource topics. These reports are of
interest and applicability to a broad audience in the National Park Service and others in natural
resource management, including scientists, conservation and environmental constituencies, and the
public.
The Natural Resource Report Series is used to disseminate comprehensive information and analysis
about natural resources and related topics concerning lands managed by the National Park Service.
The series supports the advancement of science, informed decision-making, and the achievement of
the National Park Service mission. The series also provides a forum for presenting more lengthy
results that may not be accepted by publications with page limitations.
All manuscripts in the series receive the appropriate level of peer review to ensure that the
information is scientifically credible, technically accurate, appropriately written for the intended
audience, and designed and published in a professional manner.
Data in this report were collected and analyzed using methods based on established, peer-reviewed
protocols and were analyzed and interpreted within the guidelines of the protocols.
Views, statements, findings, conclusions, recommendations, and data in this report do not necessarily
reflect views and policies of the National Park Service, U.S. Department of the Interior. Mention of
trade names or commercial products does not constitute endorsement or recommendation for use by
the U.S. Government.
This report is available in digital format from the Natural Resource Publications Management
website. To receive this report in a format that is optimized to be accessible using screen readers for
the visually or cognitively impaired, please email [email protected].
Please cite this publication as:
Beeco, J. A., and A. R. Pipkin. 2018. Hawai‘i Volcanoes National Park: Acoustic monitoring report
2013. Natural Resource Report NPS/NRSS/NSNS/NRR—2018/1578. National Park Service, Fort
Collins, Colorado.
NPS 124/141804, January 2018
iii
Contents
Page
Figures.................................................................................................. Error! Bookmark not defined.
Tables ..................................................................................................................................................... v
Executive Summary .............................................................................................................................. vi
Acknowledgments .................................................................................................................................. x
List of Acoustic Terms .......................................................................................................................... xi
Introduction ............................................................................................................................................ 1
The NPS Visitor ............................................................................................................................. 1
National Park Service Natural Sounds and Night Skies Division .................................................. 1
Soundscape Planning Authorities ................................................................................................... 1
Study Area ............................................................................................................................................. 3
Methods .................................................................................................................................................. 6
Automated Monitoring ................................................................................................................... 6
On-Site Listening............................................................................................................................ 6
Calculation of Metrics .................................................................................................................... 6
Off-Site Listening/ Audibility Analysis ......................................................................................... 7
Results .................................................................................................................................................... 9
On-site Listening ............................................................................................................................ 9
Off-Site Data Analysis ................................................................................................................. 10
Metrics .......................................................................................................................................... 11
Audibility ...................................................................................................................................... 15
Discussion ............................................................................................................................................ 21
Aircraft ......................................................................................................................................... 23
Literature Cited .................................................................................................................................... 25
iv
Figures
Page
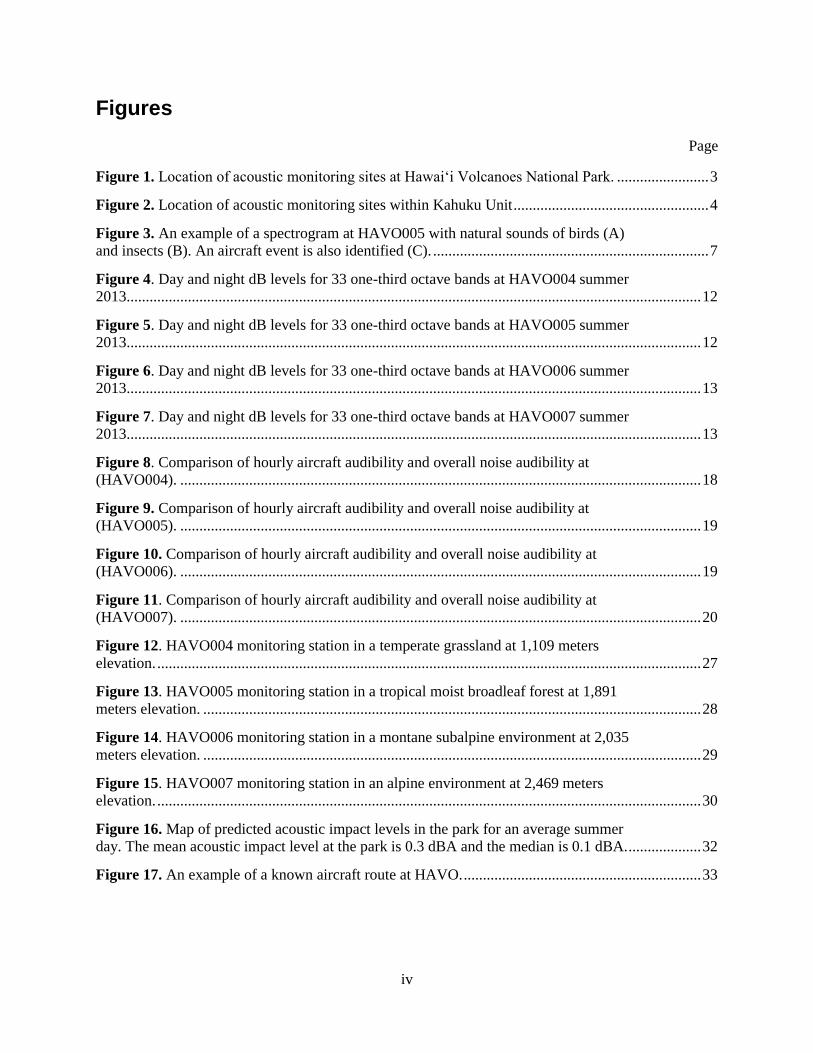
Figure 1. Location of acoustic monitoring sites at Hawai‘i Volcanoes National Park. ........................ 3
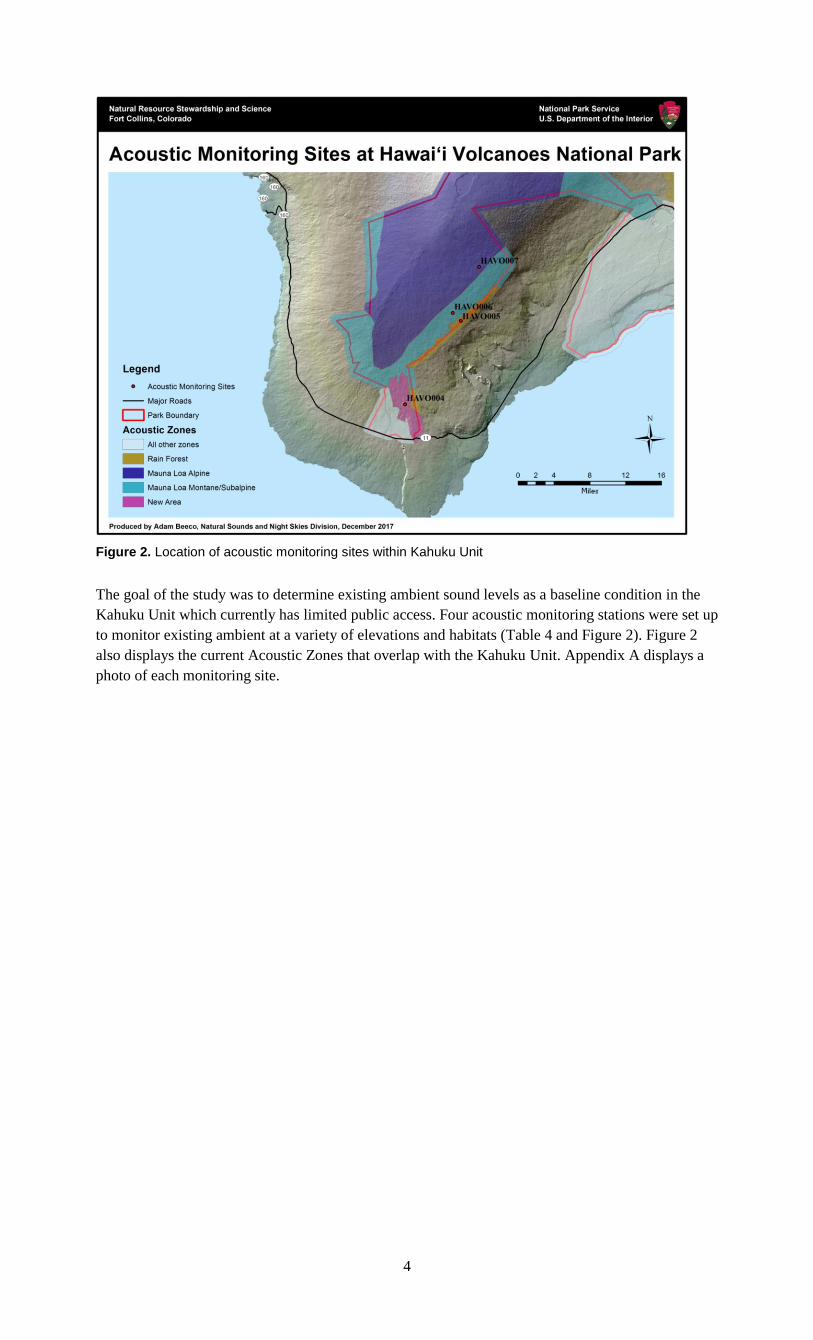
Figure 2. Location of acoustic monitoring sites within Kahuku Unit ................................................... 4
Figure 3. An example of a spectrogram at HAVO005 with natural sounds of birds (A) and insects (B). An aircraft event is also identified (C). ........................................................................ 7
Figure 4. Day and night dB levels for 33 one-third octave bands at HAVO004 summer 2013...................................................................................................................................................... 12
Figure 5. Day and night dB levels for 33 one-third octave bands at HAVO005 summer 2013...................................................................................................................................................... 12
Figure 6. Day and night dB levels for 33 one-third octave bands at HAVO006 summer 2013...................................................................................................................................................... 13
Figure 7. Day and night dB levels for 33 one-third octave bands at HAVO007 summer 2013...................................................................................................................................................... 13
Figure 8. Comparison of hourly aircraft audibility and overall noise audibility at (HAVO004). ........................................................................................................................................ 18
Figure 9. Comparison of hourly aircraft audibility and overall noise audibility at (HAVO005). ........................................................................................................................................ 19
Figure 10. Comparison of hourly aircraft audibility and overall noise audibility at (HAVO006). ........................................................................................................................................ 19
Figure 11. Comparison of hourly aircraft audibility and overall noise audibility at (HAVO007). ........................................................................................................................................ 20
Figure 12. HAVO004 monitoring station in a temperate grassland at 1,109 meters
elevation. .............................................................................................................................................. 27
Figure 13. HAVO005 monitoring station in a tropical moist broadleaf forest at 1,891
meters elevation. .................................................................................................................................. 28
Figure 14. HAVO006 monitoring station in a montane subalpine environment at 2,035
meters elevation. .................................................................................................................................. 29
Figure 15. HAVO007 monitoring station in an alpine environment at 2,469 meters elevation. .............................................................................................................................................. 30
Figure 16. Map of predicted acoustic impact levels in the park for an average summer day. The mean acoustic impact level at the park is 0.3 dBA and the median is 0.1 dBA. ................... 32
Figure 17. An example of a known aircraft route at HAVO. .............................................................. 33
v
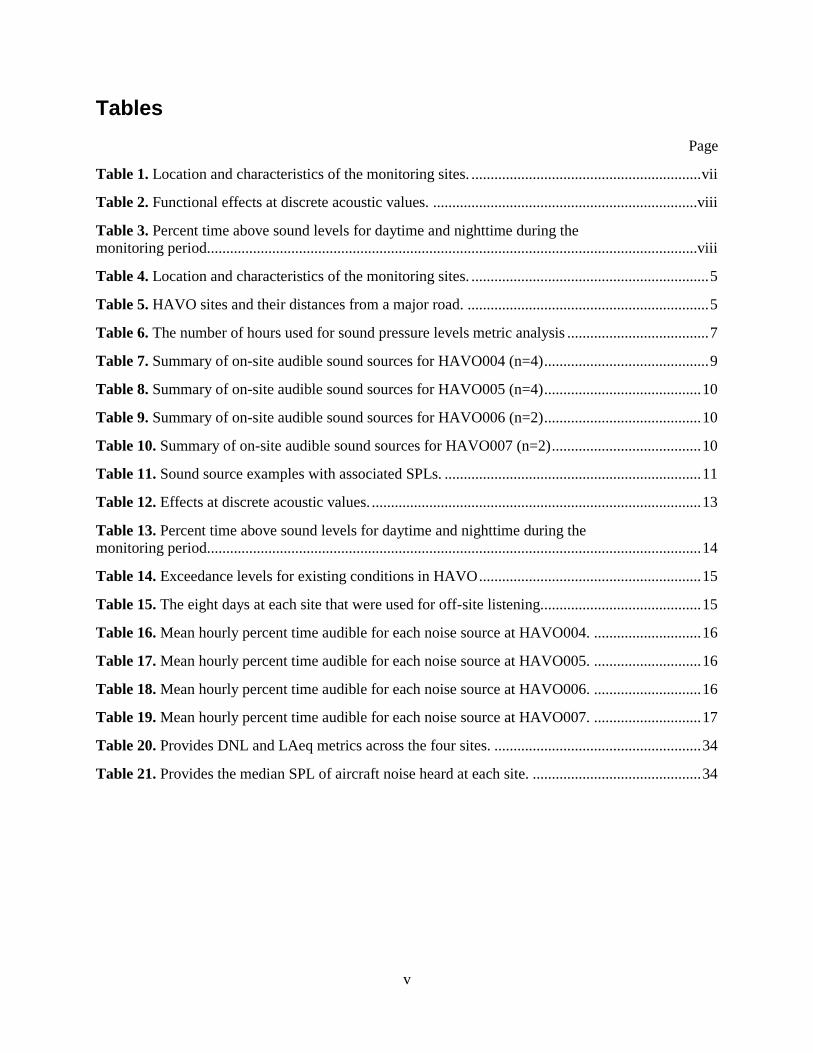
Tables
Page
Table 1. Location and characteristics of the monitoring sites. ............................................................ vii
Table 2. Functional effects at discrete acoustic values. .....................................................................viii
Table 3. Percent time above sound levels for daytime and nighttime during the monitoring period. ...............................................................................................................................viii
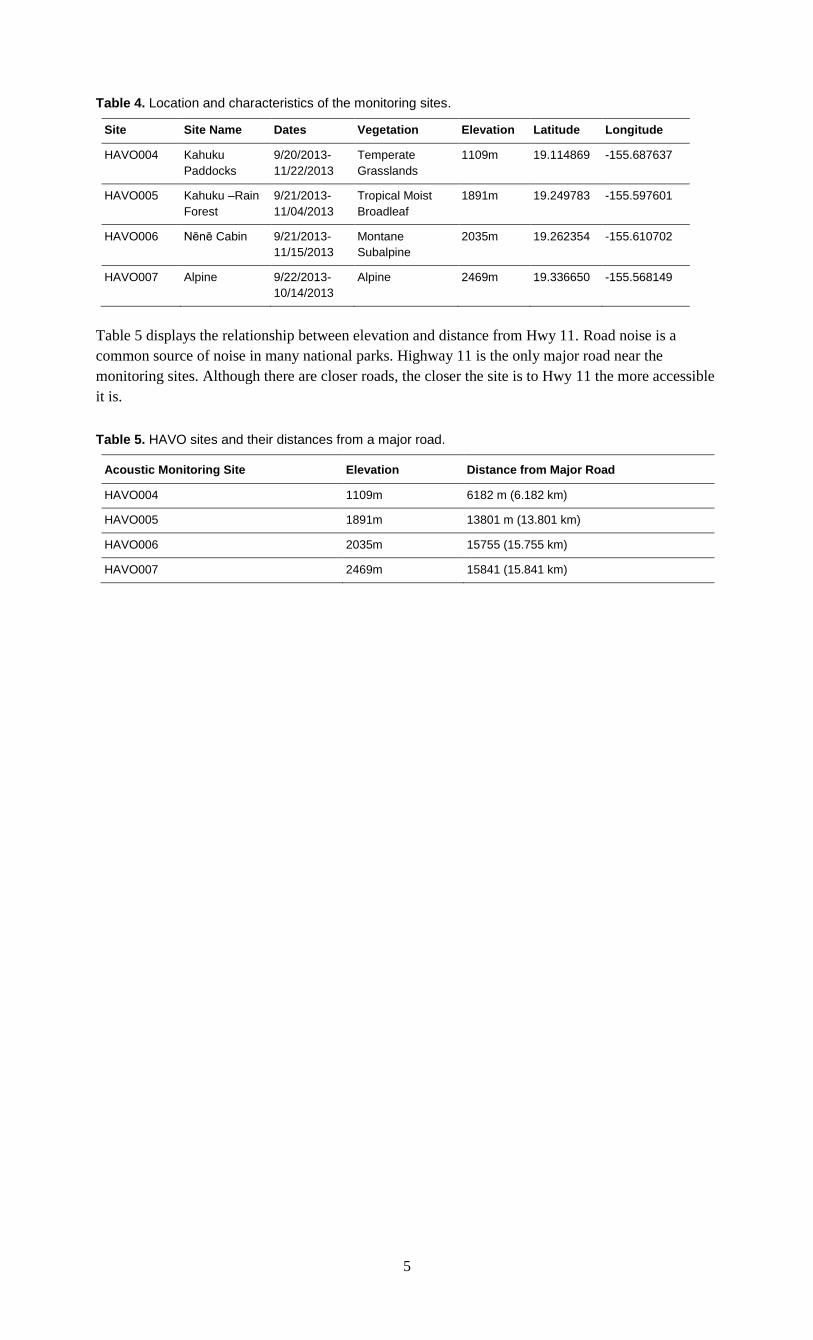
Table 4. Location and characteristics of the monitoring sites. .............................................................. 5
Table 5. HAVO sites and their distances from a major road. ............................................................... 5
Table 6. The number of hours used for sound pressure levels metric analysis ..................................... 7
Table 7. Summary of on-site audible sound sources for HAVO004 (n=4) ........................................... 9
Table 8. Summary of on-site audible sound sources for HAVO005 (n=4) ......................................... 10
Table 9. Summary of on-site audible sound sources for HAVO006 (n=2) ......................................... 10
Table 10. Summary of on-site audible sound sources for HAVO007 (n=2) ....................................... 10
Table 11. Sound source examples with associated SPLs. ................................................................... 11
Table 12. Effects at discrete acoustic values. ...................................................................................... 13
Table 13. Percent time above sound levels for daytime and nighttime during the
monitoring period. ................................................................................................................................ 14
Table 14. Exceedance levels for existing conditions in HAVO .......................................................... 15
Table 15. The eight days at each site that were used for off-site listening. ......................................... 15
Table 16. Mean hourly percent time audible for each noise source at HAVO004. ............................ 16
Table 17. Mean hourly percent time audible for each noise source at HAVO005. ............................ 16
Table 18. Mean hourly percent time audible for each noise source at HAVO006. ............................ 16
Table 19. Mean hourly percent time audible for each noise source at HAVO007. ............................ 17
Table 20. Provides DNL and LAeq metrics across the four sites. ...................................................... 34
Table 21. Provides the median SPL of aircraft noise heard at each site. ............................................ 34
vi
Appendices
Page
Appendix A: Site Photos ...................................................................................................................... 27
Appendix B: Modeled Impact Levels .................................................................................................. 31
Appendix C: Example Air Tour Route ................................................................................................ 33
Appendix D: Additional Acoustic Metrics .......................................................................................... 34
vii
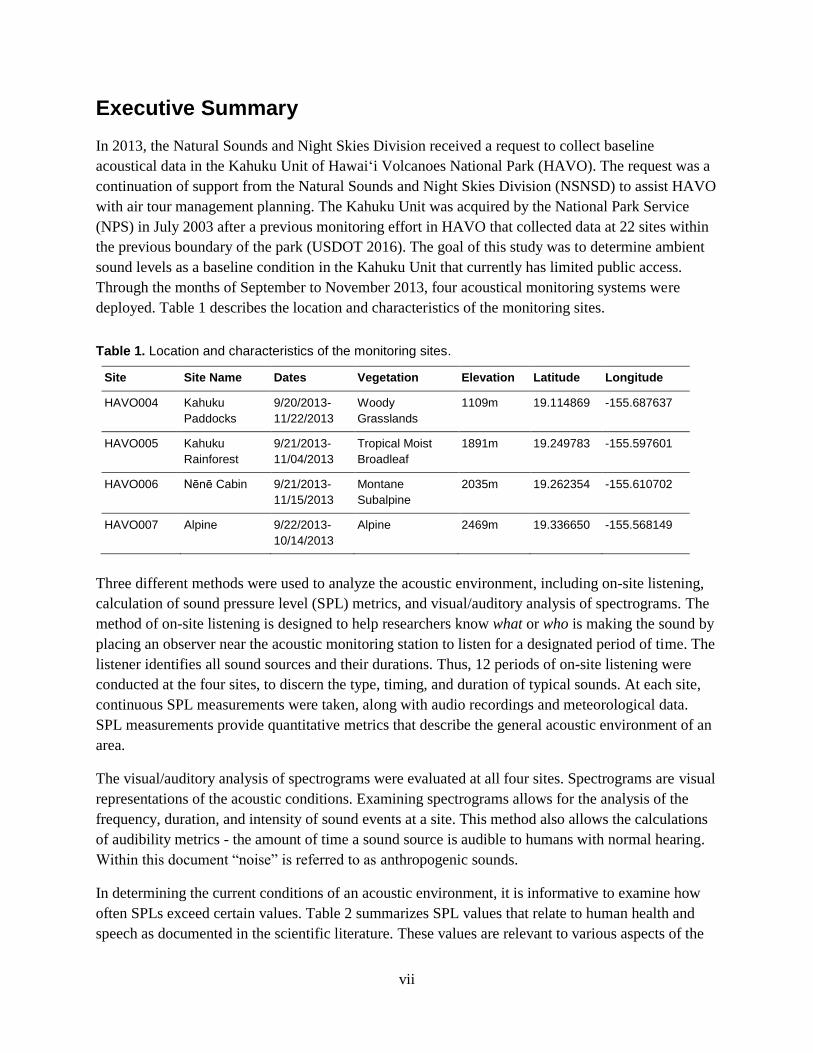
Executive Summary
In 2013, the Natural Sounds and Night Skies Division received a request to collect baseline
acoustical data in the Kahuku Unit of Hawai‘i Volcanoes National Park (HAVO). The request was a
continuation of support from the Natural Sounds and Night Skies Division (NSNSD) to assist HAVO
with air tour management planning. The Kahuku Unit was acquired by the National Park Service
(NPS) in July 2003 after a previous monitoring effort in HAVO that collected data at 22 sites within
the previous boundary of the park (USDOT 2016). The goal of this study was to determine ambient
sound levels as a baseline condition in the Kahuku Unit that currently has limited public access.
Through the months of September to November 2013, four acoustical monitoring systems were
deployed. Table 1 describes the location and characteristics of the monitoring sites.
Table 1. Location and characteristics of the monitoring sites.
Site Site Name Dates Vegetation Elevation Latitude Longitude
HAVO004 Kahuku
Paddocks
9/20/2013-
11/22/2013
Woody
Grasslands
1109m 19.114869 -155.687637
HAVO005 Kahuku
Rainforest
9/21/2013-
11/04/2013
Tropical Moist
Broadleaf
1891m 19.249783 -155.597601
HAVO006 Nēnē Cabin 9/21/2013-
11/15/2013
Montane
Subalpine
2035m 19.262354 -155.610702
HAVO007 Alpine 9/22/2013-
10/14/2013
Alpine 2469m 19.336650 -155.568149
Three different methods were used to analyze the acoustic environment, including on-site listening,
calculation of sound pressure level (SPL) metrics, and visual/auditory analysis of spectrograms. The
method of on-site listening is designed to help researchers know what or who is making the sound by
placing an observer near the acoustic monitoring station to listen for a designated period of time. The
listener identifies all sound sources and their durations. Thus, 12 periods of on-site listening were
conducted at the four sites, to discern the type, timing, and duration of typical sounds. At each site,
continuous SPL measurements were taken, along with audio recordings and meteorological data.
SPL measurements provide quantitative metrics that describe the general acoustic environment of an
area.
The visual/auditory analysis of spectrograms were evaluated at all four sites. Spectrograms are visual
representations of the acoustic conditions. Examining spectrograms allows for the analysis of the
frequency, duration, and intensity of sound events at a site. This method also allows the calculations
of audibility metrics - the amount of time a sound source is audible to humans with normal hearing.
Within this document “noise” is referred to as anthropogenic sounds.
In determining the current conditions of an acoustic environment, it is informative to examine how
often SPLs exceed certain values. Table 2 summarizes SPL values that relate to human health and
speech as documented in the scientific literature. These values are relevant to various aspects of the
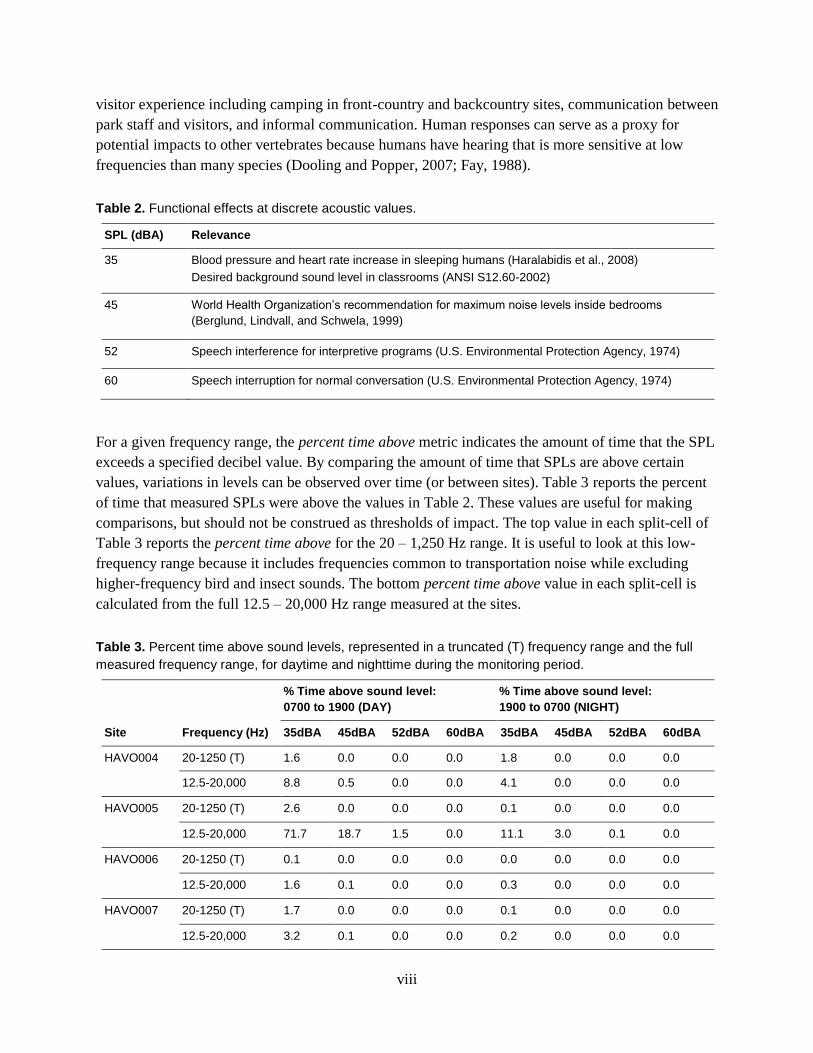
viii
visitor experience including camping in front-country and backcountry sites, communication between
park staff and visitors, and informal communication. Human responses can serve as a proxy for
potential impacts to other vertebrates because humans have hearing that is more sensitive at low
frequencies than many species (Dooling and Popper, 2007; Fay, 1988).
Table 2. Functional effects at discrete acoustic values.
SPL (dBA) Relevance
35 Blood pressure and heart rate increase in sleeping humans (Haralabidis et al., 2008)
Desired background sound level in classrooms (ANSI S12.60-2002)
45 World Health Organization’s recommendation for maximum noise levels inside bedrooms
(Berglund, Lindvall, and Schwela, 1999)
52 Speech interference for interpretive programs (U.S. Environmental Protection Agency, 1974)
60 Speech interruption for normal conversation (U.S. Environmental Protection Agency, 1974)
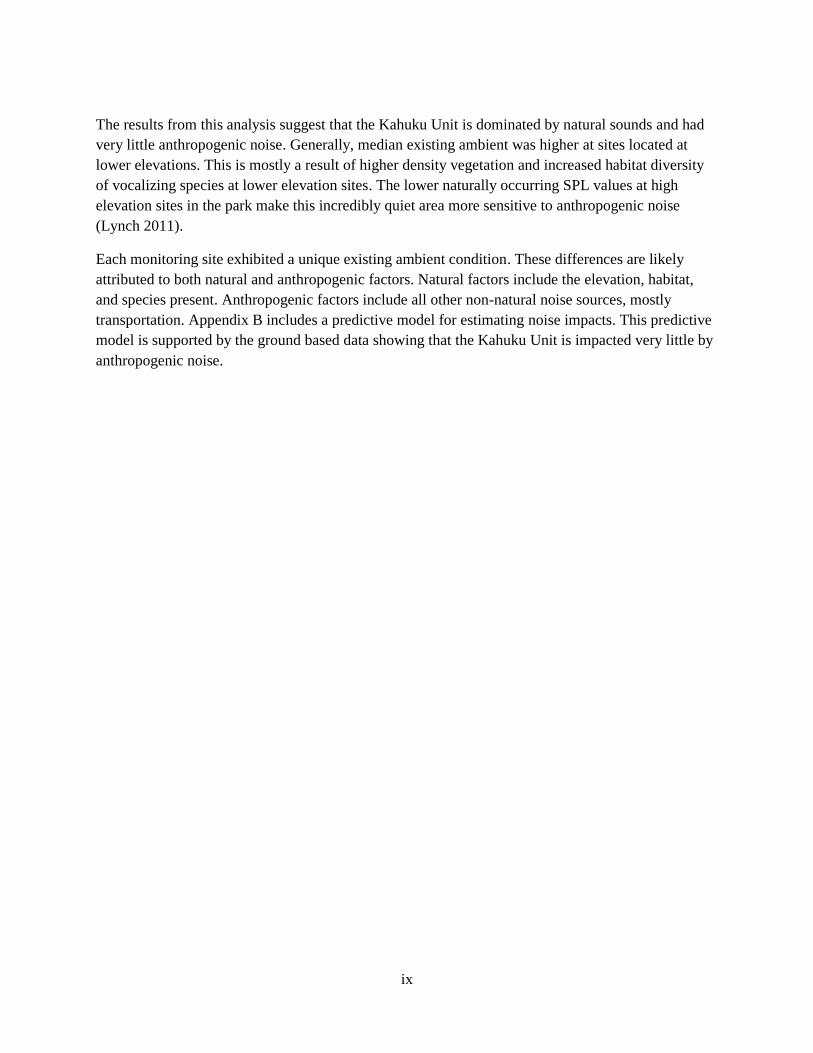
For a given frequency range, the percent time above metric indicates the amount of time that the SPL
exceeds a specified decibel value. By comparing the amount of time that SPLs are above certain
values, variations in levels can be observed over time (or between sites). Table 3 reports the percent
of time that measured SPLs were above the values in Table 2. These values are useful for making
comparisons, but should not be construed as thresholds of impact. The top value in each split-cell of
Table 3 reports the percent time above for the 20 – 1,250 Hz range. It is useful to look at this low-
frequency range because it includes frequencies common to transportation noise while excluding
higher-frequency bird and insect sounds. The bottom percent time above value in each split-cell is
calculated from the full 12.5 – 20,000 Hz range measured at the sites.
Table 3. Percent time above sound levels, represented in a truncated (T) frequency range and the full
measured frequency range, for daytime and nighttime during the monitoring period.
Site Frequency (Hz)
% Time above sound level:
0700 to 1900 (DAY)
% Time above sound level:
1900 to 0700 (NIGHT)
35dBA 45dBA 52dBA 60dBA 35dBA 45dBA 52dBA 60dBA
HAVO004 20-1250 (T) 1.6 0.0 0.0 0.0 1.8 0.0 0.0 0.0
12.5-20,000 8.8 0.5 0.0 0.0 4.1 0.0 0.0 0.0
HAVO005 20-1250 (T) 2.6 0.0 0.0 0.0 0.1 0.0 0.0 0.0
12.5-20,000 71.7 18.7 1.5 0.0 11.1 3.0 0.1 0.0
HAVO006 20-1250 (T) 0.1 0.0 0.0 0.0 0.0 0.0 0.0 0.0
12.5-20,000 1.6 0.1 0.0 0.0 0.3 0.0 0.0 0.0
HAVO007 20-1250 (T) 1.7 0.0 0.0 0.0 0.1 0.0 0.0 0.0
12.5-20,000 3.2 0.1 0.0 0.0 0.2 0.0 0.0 0.0
ix
The results from this analysis suggest that the Kahuku Unit is dominated by natural sounds and had
very little anthropogenic noise. Generally, median existing ambient was higher at sites located at
lower elevations. This is mostly a result of higher density vegetation and increased habitat diversity
of vocalizing species at lower elevation sites. The lower naturally occurring SPL values at high
elevation sites in the park make this incredibly quiet area more sensitive to anthropogenic noise
(Lynch 2011).
Each monitoring site exhibited a unique existing ambient condition. These differences are likely
attributed to both natural and anthropogenic factors. Natural factors include the elevation, habitat,
and species present. Anthropogenic factors include all other non-natural noise sources, mostly
transportation. Appendix B includes a predictive model for estimating noise impacts. This predictive
model is supported by the ground based data showing that the Kahuku Unit is impacted very little by
anthropogenic noise.
x
Acknowledgments
Funding, equipment, and technical support for this study was provided by the NPS’ Natural Sounds
and Night Skies Division (NSNSD). Project coordination was provided by Chris Garsha and Jessica
Briggs who worked with NSNSD. On-site logistical assistance was provided by park staff – Danielle
Foster; Mark Wasser, Josh Vandemark and the Division of Natural Resources Management at
HAVO. We also thankful for help from Emma Brown and Vicki Ward of NSNSD for peer reviewing
the draft manuscript. Jacob Job coordinated students at the Colorado State University Listening Lab,
and Sean Williams and Tyler Asnicar helped analyze the recordings.
xi
List of Acoustic Terms
Acoustic Environment- A combination of all the physical sound resources within a given area. This
includes natural sounds and cultural sounds, and non-natural human-caused sounds. The acoustic
environment of a park can be divided into two main categories: intrinsic and extrinsic.
Acoustic Resources- Includes both natural sounds like wind, water, & wildlife and cultural and
historic sounds like tribal ceremonies, quiet reverence, and battle reenactments.
Amplitude- The relative strength of a sound wave, described in decibels (dB). Amplitude is related
to what we commonly call loudness or volume.
Audibility- The ability of animals with normal hearing, including humans, to hear a given sound. It
can vary depending upon the frequency content and amplitude of sound and by an individual
animal’s hearing ability.
Decibel (dB)- A unit of sound energy. Every 10 dB increase represents a tenfold increase in energy.
Therefore, a 20 dB increase represents a hundredfold increase in energy. When sound levels are
adjusted for human hearing they are expressed as dBA.
DNL (or Ldn)- Day-Night Average Sound Level. Average equivalent sound level over a 24-hour
period, with a 10-dB penalty added for sound levels between 10 p.m. and 7 a.m
Extrinsic Sound- Any sounds not forming an essential part of the park unit, or a sound originating
from outside the park boundary. This could include voices, radio music, or jets flying thousands of
feet above the park.
Frequency- Related to the pitch of a sound, it is defined as the number of times per second that the
wave of sound repeats itself and is expressed in terms of hertz (Hz). Sound levels are often adjusted
("weighted") to match the hearing abilities of a given animal. In other words, humans and different
species of animals are capable or hearing (or not hearing) at different frequencies. Humans with
normal hearing can hear sounds between 20 Hz and 20,000 Hz, and as low as 0 dB at 1,000 Hz. Bats,
on the other hand, can hear sounds between 20 Hz and 200,000 Hz.
Intrinsic Sound- Belongs to a park by the park’s very nature, based on its purposes, values, and
establishing legislation. Intrinsic sounds can include natural, cultural, and historic sounds that
contribute to the acoustic environment of the park.
L50, L90- Metrics used to describe sound pressure levels (L), in decibels, exceeded 50 and 90
percent of the time, respectively. Put another way, half the time the measured levels of sound are
greater than the L50 value, while 90 percent of the time the measured levels are higher than the L90
value.
LAeq- The A-weighted energy equivalent sound level. The sound energy level averaged over the
measurement period. For example LAeq12 measures energy equivalent sound level over 12 hours.
xii
Lnat (Natural Ambient Sound Level)- The natural sound conditions in parks which exist in the
absence of any human-produced noise.
Noise Free Interval (NFI)- The length of the continuous period of time during which no human-
caused sounds are audible.
Percent Time Above Natural Ambient- The amount of time that various sound sources are above
the natural ambient sound pressure levels in a given area. It is most commonly used to measure the
amount of time that human-caused sounds are above natural ambient levels. This measure is not
specific to the hearing ability of a given animal, but a measure of when and how long human-caused
sounds exceed natural ambient levels.
Percent Time Audible (TA%)- The amount of time that various sound sources are audible to
humans with normal hearing. A sound may be above natural ambient sound pressure levels, but still
not audible. Similarly, some sounds that are below the natural ambient can be audible. Percent Time
Audible is useful because of its simplicity. It is a measure that correlates well with visitor complaints
of excessive noise and annoyance. Most noise sources are audible to humans at lower levels than
virtually all wildlife species. Therefore percent time audible is a protective proxy for wildlife. These
data can be collected by either a trained observer (on-site listening) or by making high-quality digital
recordings for later playback (off-site listening).
Sound Pressure- Minute change in atmospheric pressure due to passage of sound that can be
detected by microphones.
Sound vs. Noise- The NSNSD differentiates between the use of sound and noise, since these
definitions have been used inconsistently in the literature. Although sound is sometimes incorrectly
used as a synonym for noise, it is in fact noise that is undesired or extraneous to an environment.
Humans perceive sound as an auditory sensation created by pressure variations that move through a
medium such as water or air and are measured in terms of amplitude and frequency (Harris, 1998;
Templeton, 1997).
Soundscape- The human perception of the physical sound resource.
1
Introduction
The NPS Visitor
A 1998 survey of the American public revealed that 72 percent of respondents thought that providing
opportunities to experience natural quiet and the sounds of nature was a very important reason for
having national parks, while another 23 percent thought that it was somewhat important (Haas &
Wakefield 1998). In another survey specific to park visitors, 91 percent of respondents considered
enjoyment of natural quiet and the sounds of nature as compelling reasons for visiting national parks
(McDonald et al. 1995). Acoustical monitoring provides a scientific basis for assessing the current
status of acoustic resources, identifying trends in resource conditions, quantifying impacts from
actions within and outside of the park, assessing consistency with park management objectives and
standards, and informing management decisions regarding desired future conditions.
National Park Service Natural Sounds and Night Skies Division
The Natural Sounds and Night Skies Division (NSNSD) helps parks manage sounds in a way that
protects park resources and the visitor experience. The NSNSD addresses acoustical issues raised by
Congress (such as air tour management), NPS Management Policies, and NPS Director’s Orders. The
NSNSD works to protect, maintain, or restore acoustical environments throughout the National Park
System. Its goal is to provide coordination, guidance, and a consistent approach to soundscape
protection with respect to park resources and visitor use. The program also provides technical
assistance to parks in the form of acoustical monitoring, data processing, noise modeling, park
planning support, and comparative analyses and interpretation of acoustical environments.
Soundscape Planning Authorities
The National Park Service Organic Act of 1916 states that the purpose of national parks is "… to
conserve the scenery and the natural and historic objects and the wild life therein and to provide for
the enjoyment of the same in such manner and by such means as will leave them unimpaired for the
enjoyment of future generations." In addition to the NPS Organic Act, the Redwoods Act of 1978
affirmed that, "the protection, management, and administration of these areas shall be conducted in
light of the high value and integrity of the National Park System and shall not be exercised in
derogation of the values and purposes for which these various areas have been established, except as
may have been or shall be directly and specifically provided by Congress."
Direction for management of natural soundscapes is represented in 2006 Management Policy 4.9:
The Service will restore to the natural condition wherever possible those park soundscapes
that have become degraded by unnatural sounds (noise), and will protect natural
soundscapes from unacceptable impacts. Using appropriate management planning,
superintendents will identify what levels and types of unnatural sound constitute acceptable
impacts on park natural soundscapes. The frequencies, magnitudes, and durations of
acceptable levels of unnatural sound will vary throughout a park, being generally greater in
developed areas. In and adjacent to parks, the Service will monitor human activities that
generate noise that adversely affects park soundscapes [acoustic resources], including noise
caused by mechanical or electronic devices. The Service will take action to prevent or
minimize all noise that through frequency, magnitude, or duration adversely affects the
natural soundscape [acoustic resource] or other park resources or values, or that exceeds
levels that have been identified through monitoring as being acceptable to or appropriate for
visitor uses at the sites being monitored (NPS 2006a).
It should be noted that “the natural ambient sound level—that is, the environment of sound that exists
in the absence of human-caused noise—is the baseline condition, and the standard against which
current conditions in a soundscape [acoustic resource] will be measured and evaluated” (NPS
2006b). However, the desired acoustical condition may also depend upon the resources and the
values of the park. For instance, Management Policies 5.3.1.7 Cultural Soundscapes, states that
“culturally appropriate sounds are important elements of the national park experience in many
parks.” In this case, “the Service will preserve soundscape resources and values of the parks to the
greatest extent possible to protect opportunities for appropriate transmission of cultural and historic
2
sounds that are fundamental components of the purposes and values for which the parks were
established” (NPS 2006c).
Further guidance is provided in 2006 Management Policies 4.1.4 Partnerships, 4.1.5 Restoration of
Natural Systems, 8.2 Visitor Use, 8.2.2 Recreational Activities, , and 8.4 Overflights and Aviation
Uses.
Directors Order 47, Preservation of the Acoustic Environment and Noise Management (NPS, 2000)
builds on the principles set out in Management Policies, but goes on to direct how and when to
consider acoustic resources in park management. Through this order, parks are guided to manage
noise by: identifying noise sources, minimizing noise from park operations, considering the acoustic
environment in park planning documents, and promoting park sounds and noise management through
communication, education, and outreach.
National Parks Air Tour Management Act (NPATMA) was passed on April 5, 2000 to manage
commercial air tour operations for each unit of the National Park System, or abutting tribal land,
where such operations occur or are proposed. The Act required the Federal Aviation Administration
(FAA), in cooperation with the NPS, to develop an Air Tour Management Plan (ATMP) for each unit
of the National Park System to provide acceptable and effective measures to mitigate or prevent the
significant adverse impacts, if any, of commercial air tour operations upon natural and cultural
resources and visitor experiences. In 2012, NPATMA was amended to allow the FAA and NPS to
enter into voluntary agreements with a commercial air tour operator as an alternative to an ATMP.
3
Study Area
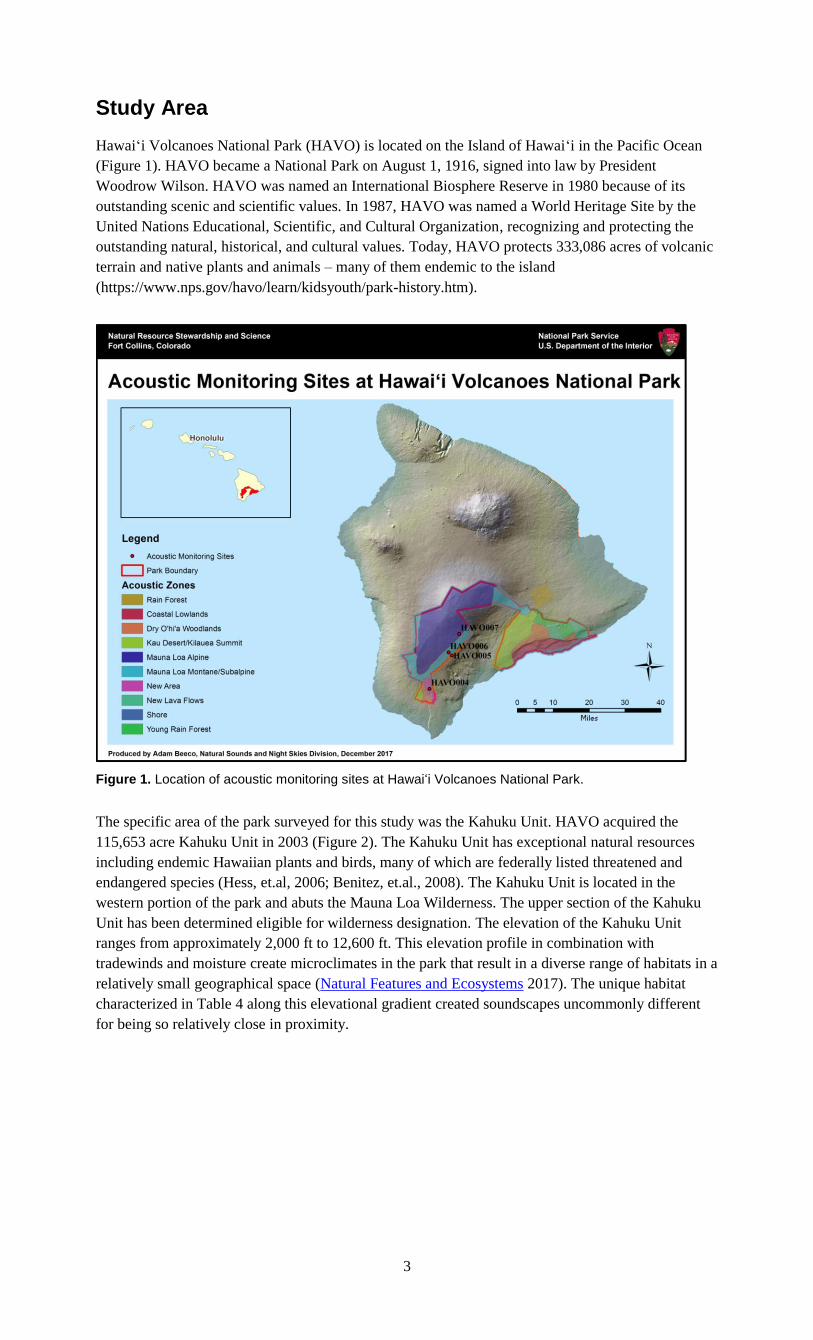
Hawai‘i Volcanoes National Park (HAVO) is located on the Island of Hawai‘i in the Pacific Ocean
(Figure 1). HAVO became a National Park on August 1, 1916, signed into law by President
Woodrow Wilson. HAVO was named an International Biosphere Reserve in 1980 because of its
outstanding scenic and scientific values. In 1987, HAVO was named a World Heritage Site by the
United Nations Educational, Scientific, and Cultural Organization, recognizing and protecting the
outstanding natural, historical, and cultural values. Today, HAVO protects 333,086 acres of volcanic
terrain and native plants and animals – many of them endemic to the island
(https://www.nps.gov/havo/learn/kidsyouth/park-history.htm).
Figure 1. Location of acoustic monitoring sites at Hawai‘i Volcanoes National Park.
The specific area of the park surveyed for this study was the Kahuku Unit. HAVO acquired the
115,653 acre Kahuku Unit in 2003 (Figure 2). The Kahuku Unit has exceptional natural resources
including endemic Hawaiian plants and birds, many of which are federally listed threatened and
endangered species (Hess, et.al, 2006; Benitez, et.al., 2008). The Kahuku Unit is located in the
western portion of the park and abuts the Mauna Loa Wilderness. The upper section of the Kahuku
Unit has been determined eligible for wilderness designation. The elevation of the Kahuku Unit
ranges from approximately 2,000 ft to 12,600 ft. This elevation profile in combination with
tradewinds and moisture create microclimates in the park that result in a diverse range of habitats in a
relatively small geographical space (Natural Features and Ecosystems 2017). The unique habitat
characterized in Table 4 along this elevational gradient created soundscapes uncommonly different
for being so relatively close in proximity.
4
Figure 2. Location of acoustic monitoring sites within Kahuku Unit
The goal of the study was to determine existing ambient sound levels as a baseline condition in the
Kahuku Unit which currently has limited public access. Four acoustic monitoring stations were set up
to monitor existing ambient at a variety of elevations and habitats (Table 4 and Figure 2). Figure 2
also displays the current Acoustic Zones that overlap with the Kahuku Unit. Appendix A displays a
photo of each monitoring site.
5
Table 4. Location and characteristics of the monitoring sites.
Site Site Name Dates Vegetation Elevation Latitude Longitude
HAVO004 Kahuku
Paddocks
9/20/2013-
11/22/2013
Temperate
Grasslands
1109m 19.114869 -155.687637
HAVO005 Kahuku –Rain
Forest
9/21/2013-
11/04/2013
Tropical Moist
Broadleaf
1891m 19.249783 -155.597601
HAVO006 Nēnē Cabin 9/21/2013-
11/15/2013
Montane
Subalpine
2035m 19.262354 -155.610702
HAVO007 Alpine 9/22/2013-
10/14/2013
Alpine 2469m 19.336650 -155.568149
Table 5 displays the relationship between elevation and distance from Hwy 11. Road noise is a
common source of noise in many national parks. Highway 11 is the only major road near the
monitoring sites. Although there are closer roads, the closer the site is to Hwy 11 the more accessible
it is.
Table 5. HAVO sites and their distances from a major road.
Acoustic Monitoring Site Elevation Distance from Major Road
HAVO004 1109m 6182 m (6.182 km)
HAVO005 1891m 13801 m (13.801 km)
HAVO006 2035m 15755 (15.755 km)
HAVO007 2469m 15841 (15.841 km)
6
Methods
Automated Monitoring
Larson Davis 831 sound level meters (SLM) were employed at each of the HAVO sites. The Larson
Davis SLM is a hardware-based, real-time analyzer which constantly records one second SPL and
1/3 octave band data. These Larson Davis-based sites met American National Standards Institute
(ANSI) Type 1 standards. The sound level meters provided the information needed to calculate
metrics described below in Off-Site Listening/Calculation of Metrics.
The sampling stations consisted of:
Microphone with environmental shroud
Preamplifier
6 V alkaline lantern batteries
Anemometer (wind speed and direction)
Temperature and humidity probe
MP3 recorder
The sampling stations collected:
SPL data in the form of A-weighted decibel readings (dBA) every second
Continuous digital audio recordings
One third octave band data every second ranging from 12.5 Hz – 20,000 Hz
Meteorological data including wind speed, direction, temperature, and relative humidity
On-Site Listening
While the sound level meter provides information about how loud or quiet the acoustic environment
is at a given time, we need .mp3 recordings or on-site listening sessions to identify the sound source.
On-site listening is the practice of placing an observer near the acoustic monitoring station with a
handheld personal digital assistant (Apple iTouch®). The observer listens for a designated period of
time (in this case, one hour) and identifies all sound sources and their durations. On-site listening
takes full advantage of human binaural hearing capabilities, and closely matches the experience of
most park visitors. Logistic constraints prevent comprehensive sampling by this technique, but
selective samples of on-site listening provide a basis for relating the results of off-site listening, from
audio recorders, to the probable auditory perception of events by park visitors and wildlife. On-site
listening sessions are also an excellent screening tool for parks initiating acoustic research. They
produce an extensive inventory of sound sources, require little equipment or training, and can help
educate park staff and volunteers. Four sessions were conducted at HAVO004 and HAVO005, and
two sessions at both HAVO006 and HAVO007 were completed. As recommended by NSNSD
protocol (NPS 2005), these sessions lasted for one hour each. These listening sessions were split
between two different listeners. Staff recorded the beginning and ending times of all audible sound
sources using custom-designed software (SoundLog). These on-site listening sessions provided the
basis for the calculation of metrics including the period of time between noise events (average noise
free interval), percent time each sound source was audible, and maximum, minimum, and mean
length (in seconds) of sound source events. The results of these on-site listening sessions are
summarized in Tables 7-10 in the Results section.
Calculation of Metrics
The status of the acoustical environment can be characterized by spectral measurements, durations,
and overall sound levels (intensities). The NSNSD uses descriptive figures and metrics to interpret
these characteristics. A fundamental descriptor is existing ambient (L50) sound levels. Existing
ambient or L50 is an example of an exceedance level, where an Lx value refers to the SPLs that are
exceeded x% of the time. The L50 represents the median sound pressure level, and is comprised of
spectra (in dB) drawn from a full dataset (removing data with wind speed > 5m/s to eliminate error
from microphone distortion). Another example, the L90, represents the sound pressure level that is
exceeded 90% of the time, therefore, only 10% of the sound levels that occur are below the L90. The
natural ambient (Lnat) is an estimate of what the ambient sound level for a site would be if all
7
extrinsic or anthropogenic sources were removed. Unlike the existing ambient, the natural ambient is
comprised of spectra drawn from a subset of the original data.
For a given hour (or other specified time period), Lnat is calculated to be the decibel level exceeded x
percent of the time, where x is defined by equation (1):
HH P
Px
2
100
and PH is the percentage of samples containing extrinsic or anthropogenic sounds for the hour. For
example, if human caused sounds are present 30% of the hour, x = 65, and the Lnat is equal to the L65,
or the level exceeded 65% of the time. Additional metrics can be found in Appendix D that are not
discussed in this section but the park may find useful.
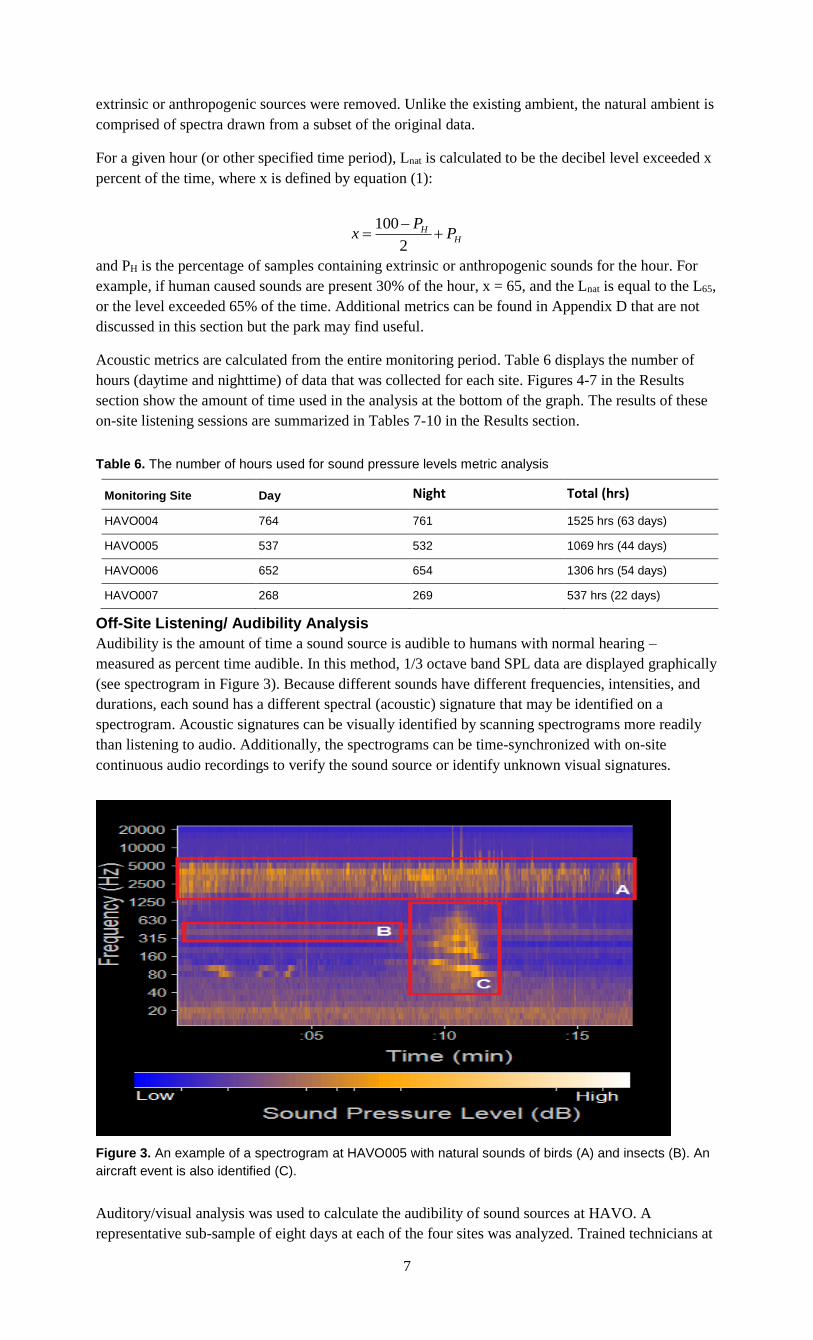
Acoustic metrics are calculated from the entire monitoring period. Table 6 displays the number of
hours (daytime and nighttime) of data that was collected for each site. Figures 4-7 in the Results
section show the amount of time used in the analysis at the bottom of the graph. The results of these
on-site listening sessions are summarized in Tables 7-10 in the Results section.
Table 6. The number of hours used for sound pressure levels metric analysis
Monitoring Site Day Night Total (hrs)
HAVO004 764 761 1525 hrs (63 days)
HAVO005 537 532 1069 hrs (44 days)
HAVO006 652 654 1306 hrs (54 days)
HAVO007 268 269 537 hrs (22 days)
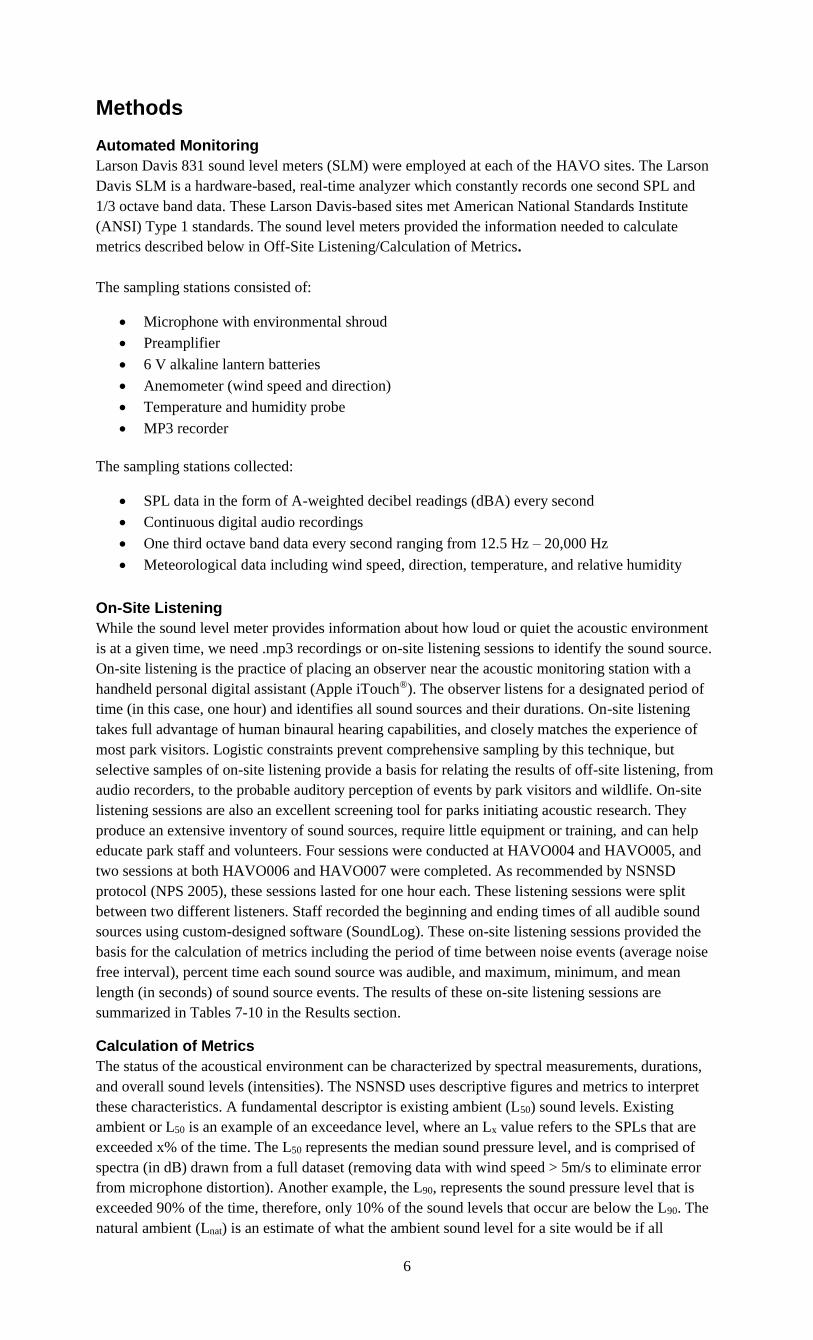
Off-Site Listening/ Audibility Analysis
Audibility is the amount of time a sound source is audible to humans with normal hearing –
measured as percent time audible. In this method, 1/3 octave band SPL data are displayed graphically
(see spectrogram in Figure 3). Because different sounds have different frequencies, intensities, and
durations, each sound has a different spectral (acoustic) signature that may be identified on a
spectrogram. Acoustic signatures can be visually identified by scanning spectrograms more readily
than listening to audio. Additionally, the spectrograms can be time-synchronized with on-site
continuous audio recordings to verify the sound source or identify unknown visual signatures.
Figure 3. An example of a spectrogram at HAVO005 with natural sounds of birds (A) and insects (B). An
aircraft event is also identified (C).
Auditory/visual analysis was used to calculate the audibility of sound sources at HAVO. A
representative sub-sample of eight days at each of the four sites was analyzed. Trained technicians at
8
Colorado State University visually analyzed data using the custom built software Sound Pressure
Level Annotation Tool (SPLAT). Noise sources with unique visual signatures on a spectrogram were
annotated within SPLAT (Figure 3) to gather information about the timing, duration, frequency, and
amplitude of these sources. The technicians focused on annotating all anthropogenic sounds (e.g.,
mechanized noise such as vehicles or aircraft). This dataset also included continuous audio that can
be played for events with questionable sound signatures. Bose Quiet Comfort noise canceling
headphones were used for off-site audio playback to minimize limitations imposed by the office
acoustic environment. For the complete results of this thorough audibility analysis, see Tables 15-18,
and Figures 8-11 in the Audibility sub-section of the Results below.
9
Results
On-site Listening
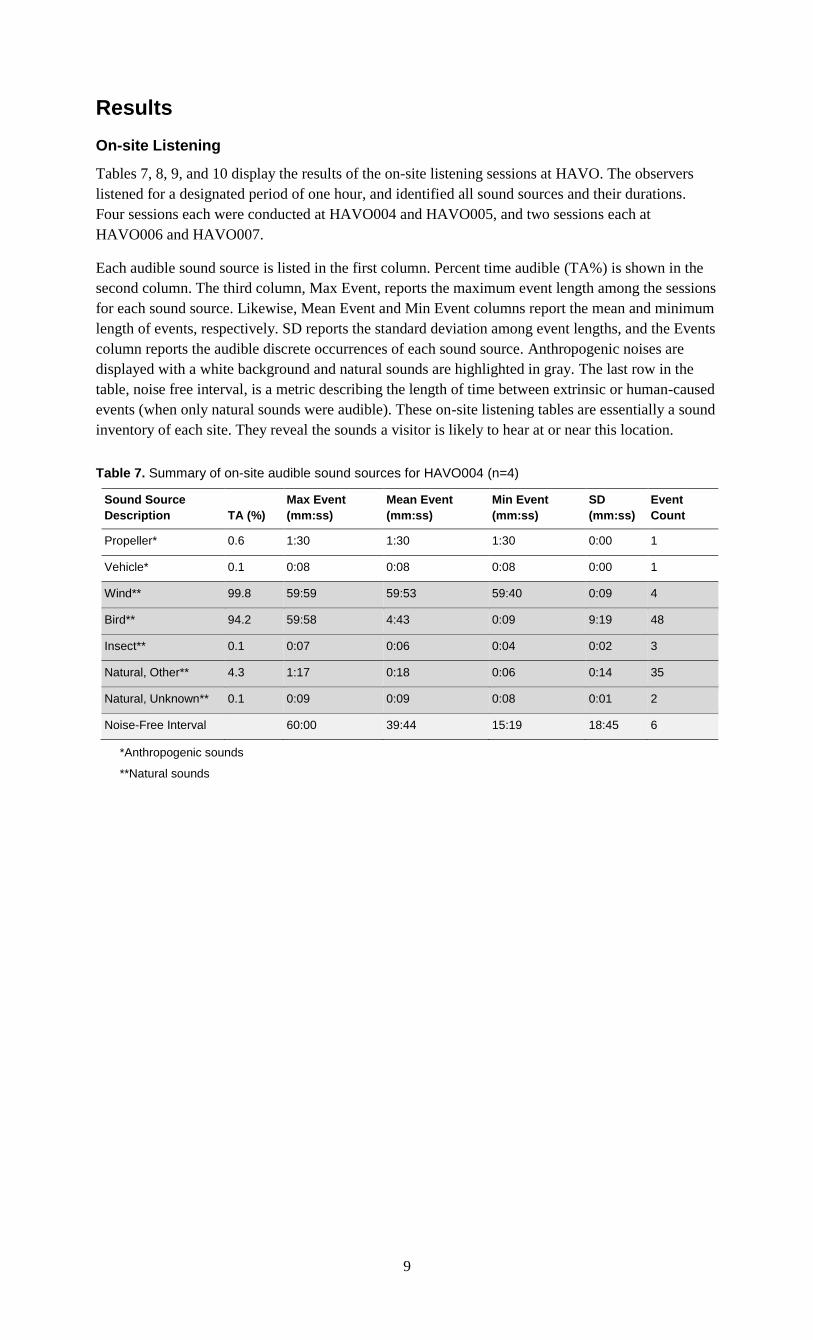
Tables 7, 8, 9, and 10 display the results of the on-site listening sessions at HAVO. The observers
listened for a designated period of one hour, and identified all sound sources and their durations.
Four sessions each were conducted at HAVO004 and HAVO005, and two sessions each at
HAVO006 and HAVO007.
Each audible sound source is listed in the first column. Percent time audible (TA%) is shown in the
second column. The third column, Max Event, reports the maximum event length among the sessions
for each sound source. Likewise, Mean Event and Min Event columns report the mean and minimum
length of events, respectively. SD reports the standard deviation among event lengths, and the Events
column reports the audible discrete occurrences of each sound source. Anthropogenic noises are
displayed with a white background and natural sounds are highlighted in gray. The last row in the
table, noise free interval, is a metric describing the length of time between extrinsic or human-caused
events (when only natural sounds were audible). These on-site listening tables are essentially a sound
inventory of each site. They reveal the sounds a visitor is likely to hear at or near this location.
Table 7. Summary of on-site audible sound sources for HAVO004 (n=4)
Sound Source
Description TA (%)
Max Event
(mm:ss)
Mean Event
(mm:ss)
Min Event
(mm:ss)
SD
(mm:ss)
Event
Count
Propeller* 0.6 1:30 1:30 1:30 0:00 1
Vehicle* 0.1 0:08 0:08 0:08 0:00 1
Wind** 99.8 59:59 59:53 59:40 0:09 4
Bird** 94.2 59:58 4:43 0:09 9:19 48
Insect** 0.1 0:07 0:06 0:04 0:02 3
Natural, Other** 4.3 1:17 0:18 0:06 0:14 35
Natural, Unknown** 0.1 0:09 0:09 0:08 0:01 2
Noise-Free Interval 60:00 39:44 15:19 18:45 6
*Anthropogenic sounds
**Natural sounds
10
Table 8. Summary of on-site audible sound sources for HAVO005 (n=4)
Sound Source
Description TA (%)
Max Event
(mm:ss)
Mean Event
(mm:ss)
Min Event
(mm:ss)
SD
(mm:ss)
Event
Count
Wind* 90.7 59:58 6:36 0:13 11:37 33
Rain, Fog Drip* 2.2 2:28 0:44 0:10 0:47 7
Bird* 99.7 59:58 26:35 0:40 28:23 9
Insect* 0.6 0:13 0:09 0:06 0:02 10
Natural, Other* 6.4 1:08 0:17 0:04 0:15 55
Noise-Free Interval* 60:00 60:00 60:00 0:00 4
*Natural sounds (No anthropogenic sounds for HAVO005).
Table 9. Summary of on-site audible sound sources for HAVO006 (n=2)
Sound Source
Description TA (%)
Max Event
(mm:ss)
Mean Event
(mm:ss)
Min Event
(mm:ss)
SD
(mm:ss)
Event
Count
Wind* 99.8 59:55 29:57 0:39 24:38 4
Bird* 94.9 23:00 5:42 0:14 6:21 20
Natural, Other* 7.5 1:15 0:27 0:01 0:18 20
Noise-Free Interval 60:00 60:00 60:00 0:00 2
*Natural sounds (No anthropogenic sounds for HAVO005).
Table 10. Summary of on-site audible sound sources for HAVO007 (n=2)
Sound Source
Description TA (%)
Max Event
(mm:ss)
Mean Event
(mm:ss)
Min Event
(mm:ss) SD (mm:ss)
Event
Count
Wind* 91.1 20:24 5:45 0:20 6:04 19
Rain, Fog Drip* 3.4 1:21 0:49 0:08 0:29 5
Bird* 5.2 0:45 0:09 0:02 0:08 41
Insect* 0.5 0:08 0:07 0:06 0:01 6
Noise-Free Interval 60:00 60:00 60:00 0:00 2
*Natural sounds (No anthropogenic sounds for HAVO005).
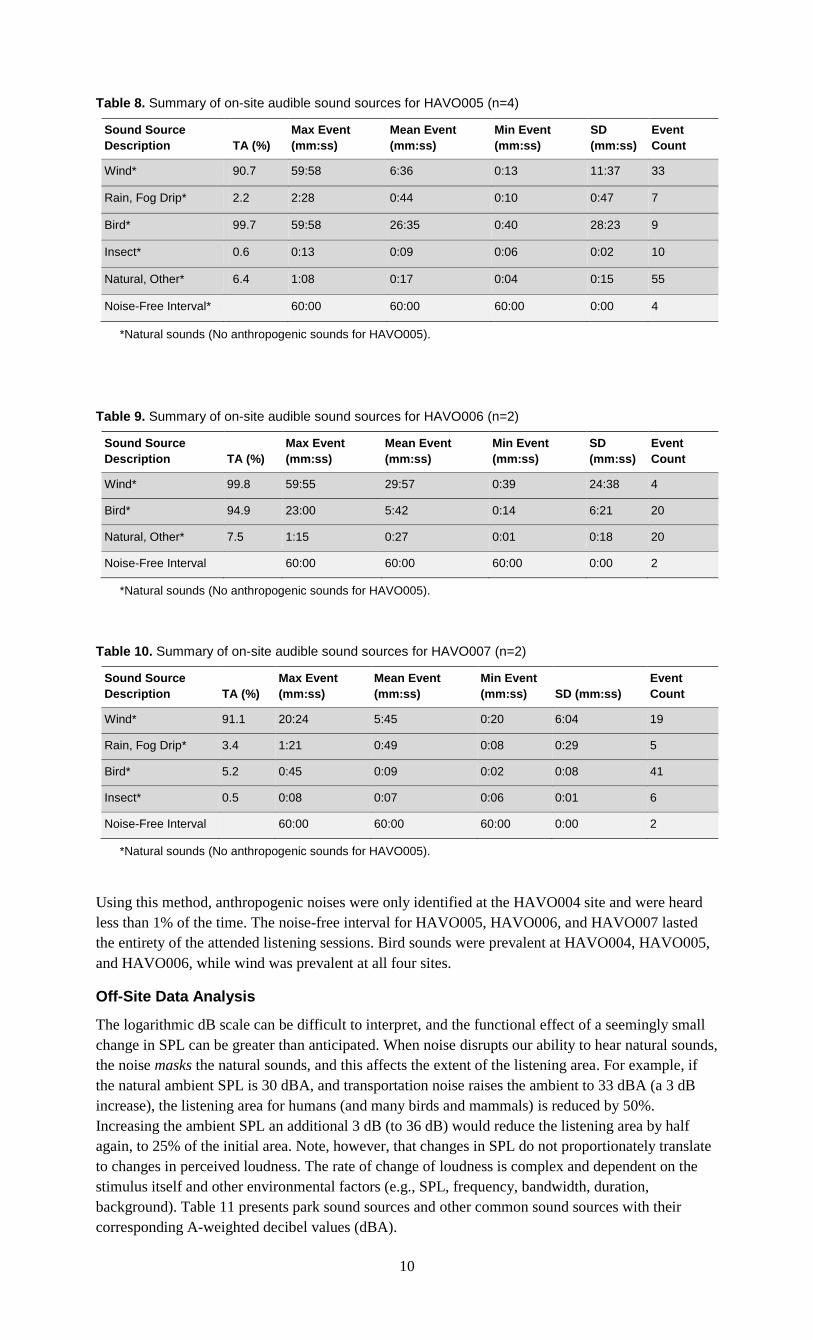
Using this method, anthropogenic noises were only identified at the HAVO004 site and were heard
less than 1% of the time. The noise-free interval for HAVO005, HAVO006, and HAVO007 lasted
the entirety of the attended listening sessions. Bird sounds were prevalent at HAVO004, HAVO005,
and HAVO006, while wind was prevalent at all four sites.
Off-Site Data Analysis
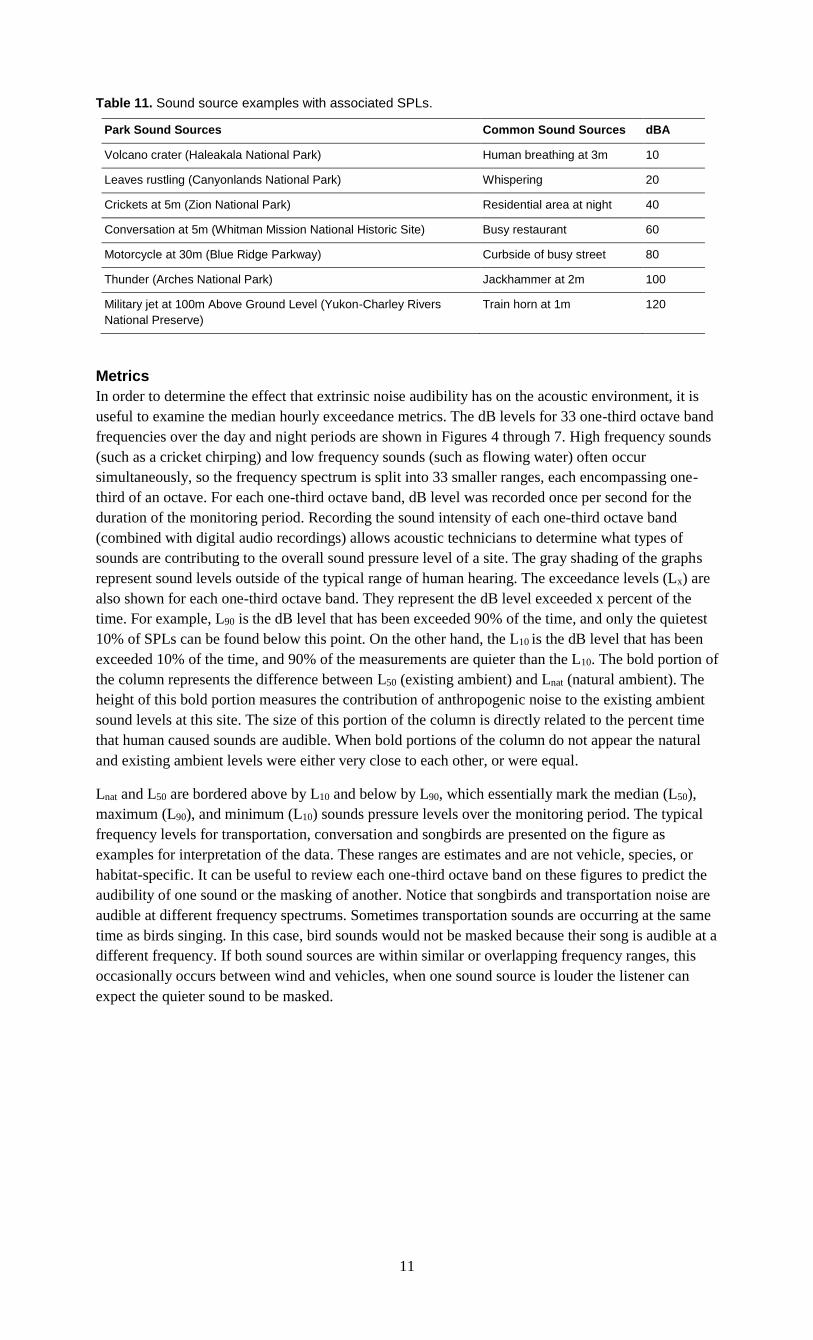
The logarithmic dB scale can be difficult to interpret, and the functional effect of a seemingly small
change in SPL can be greater than anticipated. When noise disrupts our ability to hear natural sounds,
the noise masks the natural sounds, and this affects the extent of the listening area. For example, if
the natural ambient SPL is 30 dBA, and transportation noise raises the ambient to 33 dBA (a 3 dB
increase), the listening area for humans (and many birds and mammals) is reduced by 50%.
Increasing the ambient SPL an additional 3 dB (to 36 dB) would reduce the listening area by half
again, to 25% of the initial area. Note, however, that changes in SPL do not proportionately translate
to changes in perceived loudness. The rate of change of loudness is complex and dependent on the
stimulus itself and other environmental factors (e.g., SPL, frequency, bandwidth, duration,
background). Table 11 presents park sound sources and other common sound sources with their
corresponding A-weighted decibel values (dBA).
11
Table 11. Sound source examples with associated SPLs.
Park Sound Sources Common Sound Sources dBA
Volcano crater (Haleakala National Park) Human breathing at 3m 10
Leaves rustling (Canyonlands National Park) Whispering 20
Crickets at 5m (Zion National Park) Residential area at night 40
Conversation at 5m (Whitman Mission National Historic Site) Busy restaurant 60
Motorcycle at 30m (Blue Ridge Parkway) Curbside of busy street 80
Thunder (Arches National Park) Jackhammer at 2m 100
Military jet at 100m Above Ground Level (Yukon-Charley Rivers
National Preserve)
Train horn at 1m 120
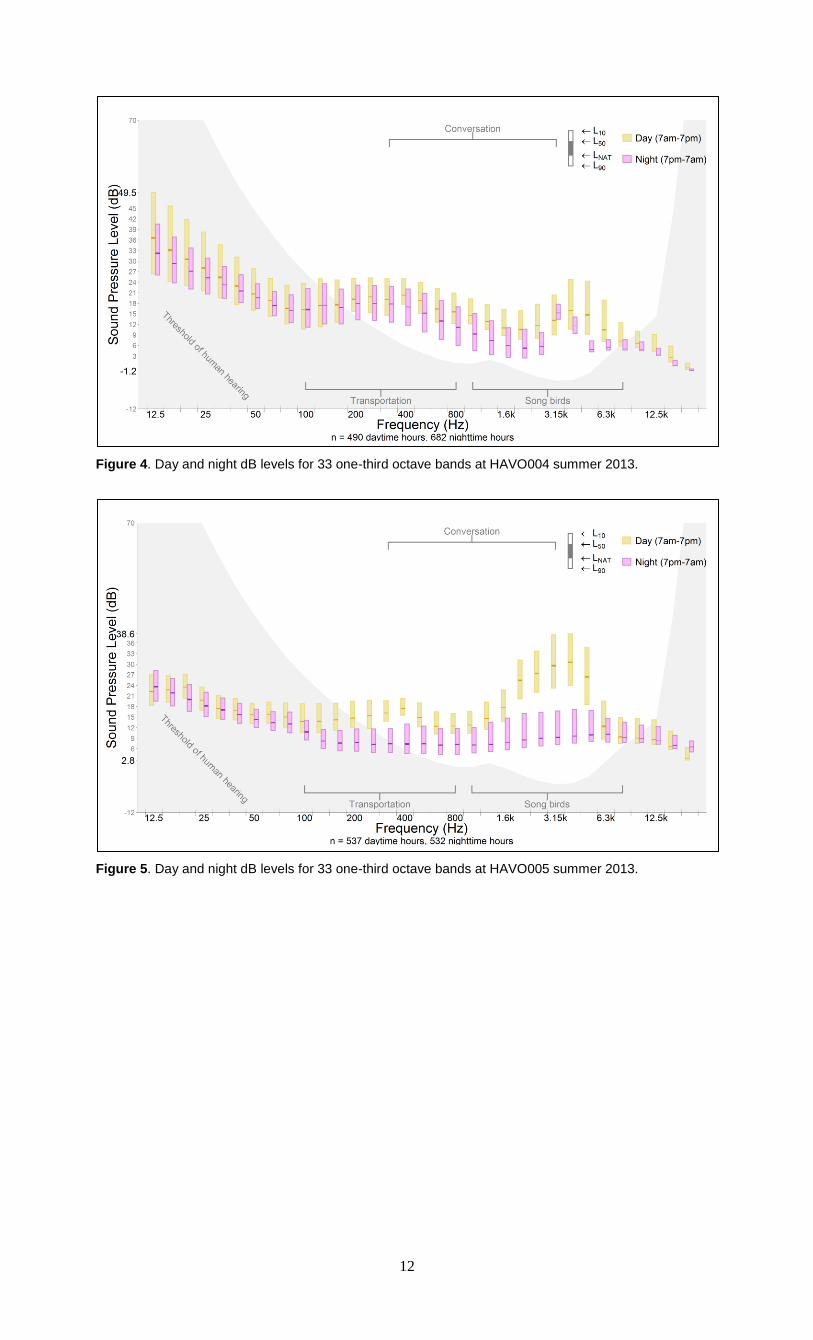
Metrics
In order to determine the effect that extrinsic noise audibility has on the acoustic environment, it is
useful to examine the median hourly exceedance metrics. The dB levels for 33 one-third octave band
frequencies over the day and night periods are shown in Figures 4 through 7. High frequency sounds
(such as a cricket chirping) and low frequency sounds (such as flowing water) often occur
simultaneously, so the frequency spectrum is split into 33 smaller ranges, each encompassing one-
third of an octave. For each one-third octave band, dB level was recorded once per second for the
duration of the monitoring period. Recording the sound intensity of each one-third octave band
(combined with digital audio recordings) allows acoustic technicians to determine what types of
sounds are contributing to the overall sound pressure level of a site. The gray shading of the graphs
represent sound levels outside of the typical range of human hearing. The exceedance levels (Lx) are
also shown for each one-third octave band. They represent the dB level exceeded x percent of the
time. For example, L90 is the dB level that has been exceeded 90% of the time, and only the quietest
10% of SPLs can be found below this point. On the other hand, the L10 is the dB level that has been
exceeded 10% of the time, and 90% of the measurements are quieter than the L10. The bold portion of
the column represents the difference between L50 (existing ambient) and Lnat (natural ambient). The
height of this bold portion measures the contribution of anthropogenic noise to the existing ambient
sound levels at this site. The size of this portion of the column is directly related to the percent time
that human caused sounds are audible. When bold portions of the column do not appear the natural
and existing ambient levels were either very close to each other, or were equal.
Lnat and L50 are bordered above by L10 and below by L90, which essentially mark the median (L50),
maximum (L90), and minimum (L10) sounds pressure levels over the monitoring period. The typical
frequency levels for transportation, conversation and songbirds are presented on the figure as
examples for interpretation of the data. These ranges are estimates and are not vehicle, species, or
habitat-specific. It can be useful to review each one-third octave band on these figures to predict the
audibility of one sound or the masking of another. Notice that songbirds and transportation noise are
audible at different frequency spectrums. Sometimes transportation sounds are occurring at the same
time as birds singing. In this case, bird sounds would not be masked because their song is audible at a
different frequency. If both sound sources are within similar or overlapping frequency ranges, this
occasionally occurs between wind and vehicles, when one sound source is louder the listener can
expect the quieter sound to be masked.
12
Figure 4. Day and night dB levels for 33 one-third octave bands at HAVO004 summer 2013.
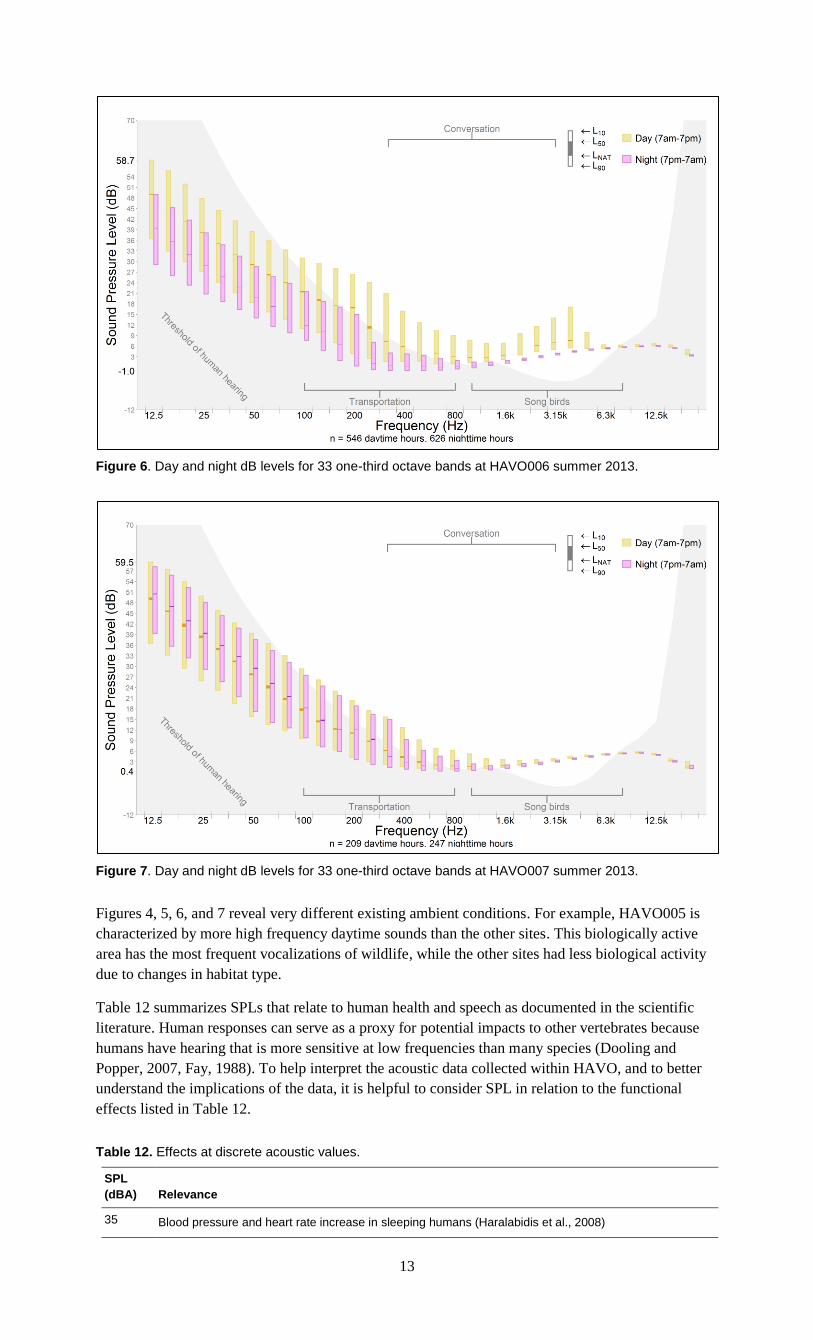
Figure 5. Day and night dB levels for 33 one-third octave bands at HAVO005 summer 2013.
13
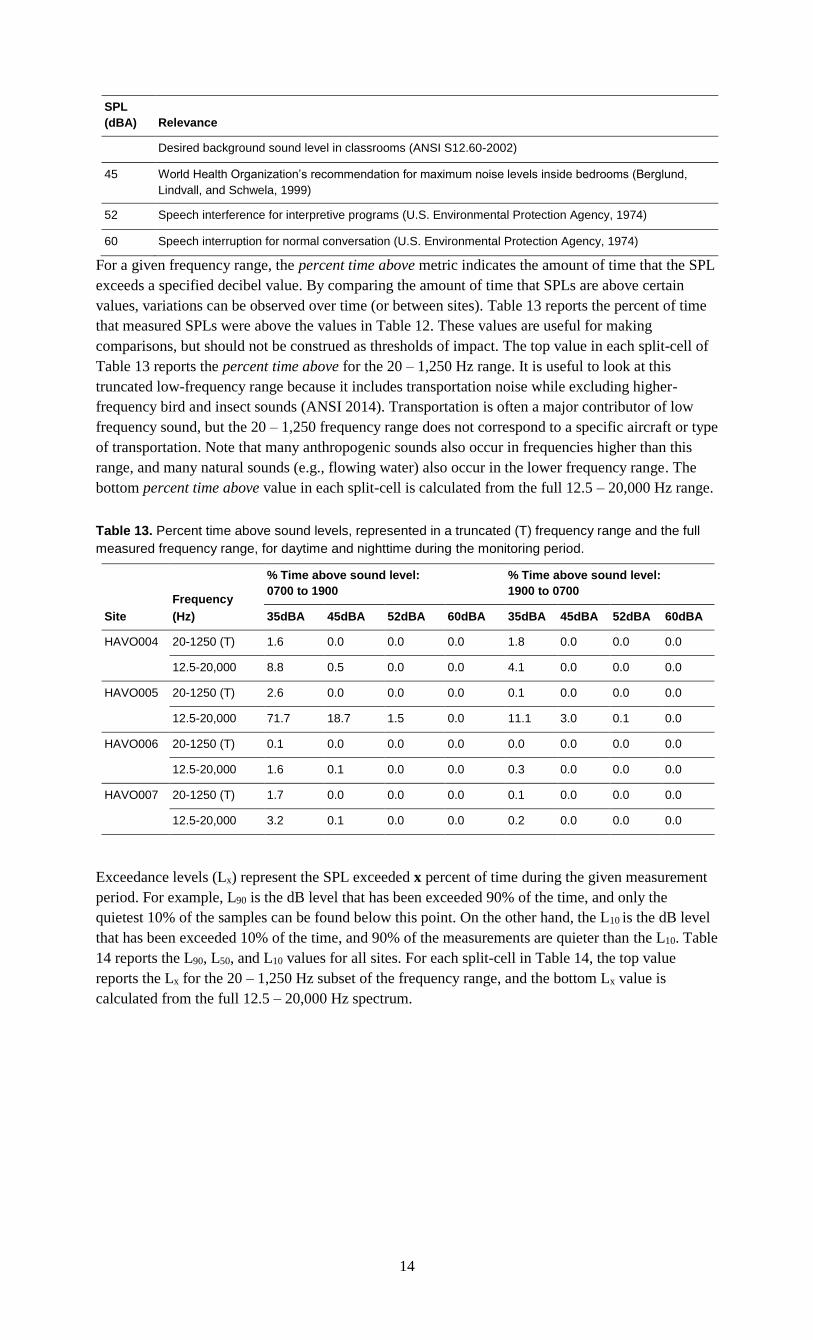
Figure 6. Day and night dB levels for 33 one-third octave bands at HAVO006 summer 2013.
Figure 7. Day and night dB levels for 33 one-third octave bands at HAVO007 summer 2013.
Figures 4, 5, 6, and 7 reveal very different existing ambient conditions. For example, HAVO005 is
characterized by more high frequency daytime sounds than the other sites. This biologically active
area has the most frequent vocalizations of wildlife, while the other sites had less biological activity
due to changes in habitat type.
Table 12 summarizes SPLs that relate to human health and speech as documented in the scientific
literature. Human responses can serve as a proxy for potential impacts to other vertebrates because
humans have hearing that is more sensitive at low frequencies than many species (Dooling and
Popper, 2007, Fay, 1988). To help interpret the acoustic data collected within HAVO, and to better
understand the implications of the data, it is helpful to consider SPL in relation to the functional
effects listed in Table 12.
Table 12. Effects at discrete acoustic values.
SPL
(dBA) Relevance
35 Blood pressure and heart rate increase in sleeping humans (Haralabidis et al., 2008)
14
SPL
(dBA) Relevance
Desired background sound level in classrooms (ANSI S12.60-2002)
45 World Health Organization’s recommendation for maximum noise levels inside bedrooms (Berglund,
Lindvall, and Schwela, 1999)
52 Speech interference for interpretive programs (U.S. Environmental Protection Agency, 1974)
60 Speech interruption for normal conversation (U.S. Environmental Protection Agency, 1974)
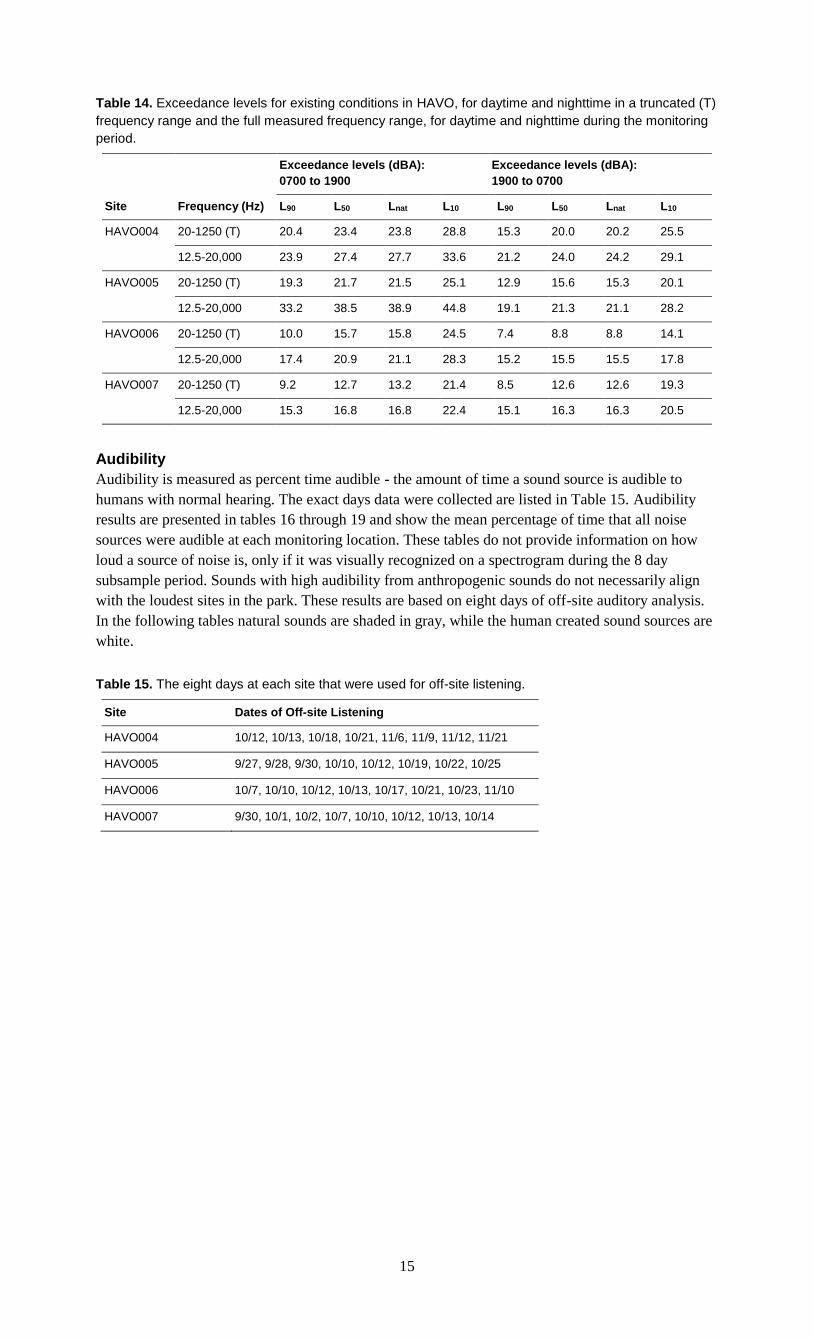
For a given frequency range, the percent time above metric indicates the amount of time that the SPL
exceeds a specified decibel value. By comparing the amount of time that SPLs are above certain
values, variations can be observed over time (or between sites). Table 13 reports the percent of time
that measured SPLs were above the values in Table 12. These values are useful for making
comparisons, but should not be construed as thresholds of impact. The top value in each split-cell of
Table 13 reports the percent time above for the 20 – 1,250 Hz range. It is useful to look at this
truncated low-frequency range because it includes transportation noise while excluding higher-
frequency bird and insect sounds (ANSI 2014). Transportation is often a major contributor of low
frequency sound, but the 20 – 1,250 frequency range does not correspond to a specific aircraft or type
of transportation. Note that many anthropogenic sounds also occur in frequencies higher than this
range, and many natural sounds (e.g., flowing water) also occur in the lower frequency range. The
bottom percent time above value in each split-cell is calculated from the full 12.5 – 20,000 Hz range.
Table 13. Percent time above sound levels, represented in a truncated (T) frequency range and the full
measured frequency range, for daytime and nighttime during the monitoring period.
Site
Frequency
(Hz)
% Time above sound level:
0700 to 1900
% Time above sound level:
1900 to 0700
35dBA 45dBA 52dBA 60dBA 35dBA 45dBA 52dBA 60dBA
HAVO004 20-1250 (T) 1.6 0.0 0.0 0.0 1.8 0.0 0.0 0.0
12.5-20,000 8.8 0.5 0.0 0.0 4.1 0.0 0.0 0.0
HAVO005 20-1250 (T) 2.6 0.0 0.0 0.0 0.1 0.0 0.0 0.0
12.5-20,000 71.7 18.7 1.5 0.0 11.1 3.0 0.1 0.0
HAVO006 20-1250 (T) 0.1 0.0 0.0 0.0 0.0 0.0 0.0 0.0
12.5-20,000 1.6 0.1 0.0 0.0 0.3 0.0 0.0 0.0
HAVO007 20-1250 (T) 1.7 0.0 0.0 0.0 0.1 0.0 0.0 0.0
12.5-20,000 3.2 0.1 0.0 0.0 0.2 0.0 0.0 0.0
Exceedance levels (Lx) represent the SPL exceeded x percent of time during the given measurement
period. For example, L90 is the dB level that has been exceeded 90% of the time, and only the
quietest 10% of the samples can be found below this point. On the other hand, the L10 is the dB level
that has been exceeded 10% of the time, and 90% of the measurements are quieter than the L10. Table
14 reports the L90, L50, and L10 values for all sites. For each split-cell in Table 14, the top value
reports the Lx for the 20 – 1,250 Hz subset of the frequency range, and the bottom Lx value is
calculated from the full 12.5 – 20,000 Hz spectrum.
15
Table 14. Exceedance levels for existing conditions in HAVO, for daytime and nighttime in a truncated (T)
frequency range and the full measured frequency range, for daytime and nighttime during the monitoring
period.
Site Frequency (Hz)
Exceedance levels (dBA):
0700 to 1900
Exceedance levels (dBA):
1900 to 0700
L90 L50 Lnat L10 L90 L50 Lnat L10
HAVO004 20-1250 (T) 20.4 23.4 23.8 28.8 15.3 20.0 20.2 25.5
12.5-20,000 23.9 27.4 27.7 33.6 21.2 24.0 24.2 29.1
HAVO005 20-1250 (T) 19.3 21.7 21.5 25.1 12.9 15.6 15.3 20.1
12.5-20,000 33.2 38.5 38.9 44.8 19.1 21.3 21.1 28.2
HAVO006 20-1250 (T) 10.0 15.7 15.8 24.5 7.4 8.8 8.8 14.1
12.5-20,000 17.4 20.9 21.1 28.3 15.2 15.5 15.5 17.8
HAVO007 20-1250 (T) 9.2 12.7 13.2 21.4 8.5 12.6 12.6 19.3
12.5-20,000 15.3 16.8 16.8 22.4 15.1 16.3 16.3 20.5
Audibility
Audibility is measured as percent time audible - the amount of time a sound source is audible to
humans with normal hearing. The exact days data were collected are listed in Table 15. Audibility
results are presented in tables 16 through 19 and show the mean percentage of time that all noise
sources were audible at each monitoring location. These tables do not provide information on how
loud a source of noise is, only if it was visually recognized on a spectrogram during the 8 day
subsample period. Sounds with high audibility from anthropogenic sounds do not necessarily align
with the loudest sites in the park. These results are based on eight days of off-site auditory analysis.
In the following tables natural sounds are shaded in gray, while the human created sound sources are
white.
Table 15. The eight days at each site that were used for off-site listening.
Site Dates of Off-site Listening
HAVO004 10/12, 10/13, 10/18, 10/21, 11/6, 11/9, 11/12, 11/21
HAVO005 9/27, 9/28, 9/30, 10/10, 10/12, 10/19, 10/22, 10/25
HAVO006 10/7, 10/10, 10/12, 10/13, 10/17, 10/21, 10/23, 11/10
HAVO007 9/30, 10/1, 10/2, 10/7, 10/10, 10/12, 10/13, 10/14
16
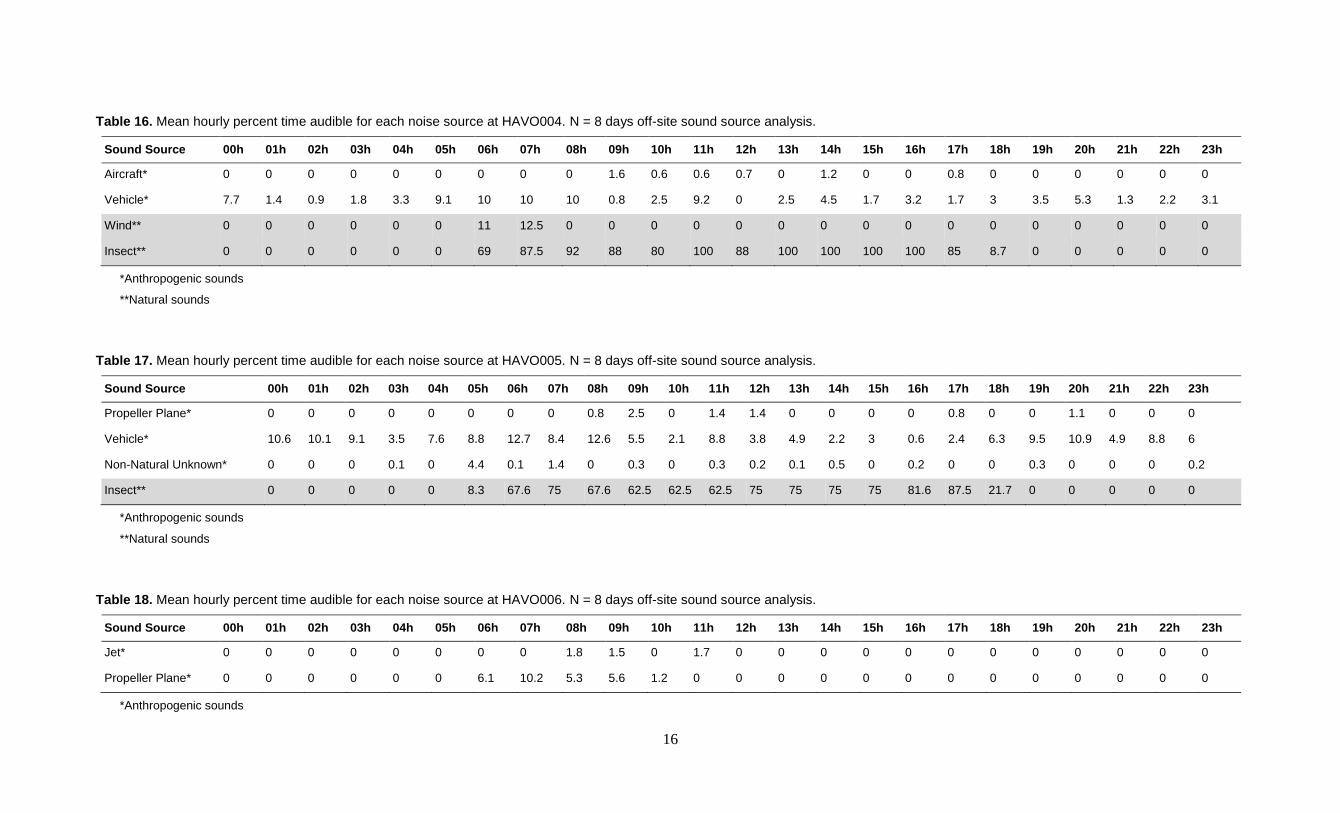
Table 16. Mean hourly percent time audible for each noise source at HAVO004. N = 8 days off-site sound source analysis.
Sound Source 00h 01h 02h 03h 04h 05h 06h 07h 08h 09h 10h 11h 12h 13h 14h 15h 16h 17h 18h 19h 20h 21h 22h 23h
Aircraft* 0 0 0 0 0 0 0 0 0 1.6 0.6 0.6 0.7 0 1.2 0 0 0.8 0 0 0 0 0 0
Vehicle* 7.7 1.4 0.9 1.8 3.3 9.1 10 10 10 0.8 2.5 9.2 0 2.5 4.5 1.7 3.2 1.7 3 3.5 5.3 1.3 2.2 3.1
Wind** 0 0 0 0 0 0 11 12.5 0 0 0 0 0 0 0 0 0 0 0 0 0 0 0 0
Insect** 0 0 0 0 0 0 69 87.5 92 88 80 100 88 100 100 100 100 85 8.7 0 0 0 0 0
*Anthropogenic sounds
**Natural sounds
Table 17. Mean hourly percent time audible for each noise source at HAVO005. N = 8 days off-site sound source analysis.
Sound Source 00h 01h 02h 03h 04h 05h 06h 07h 08h 09h 10h 11h 12h 13h 14h 15h 16h 17h 18h 19h 20h 21h 22h 23h
Propeller Plane* 0 0 0 0 0 0 0 0 0.8 2.5 0 1.4 1.4 0 0 0 0 0.8 0 0 1.1 0 0 0
Vehicle* 10.6 10.1 9.1 3.5 7.6 8.8 12.7 8.4 12.6 5.5 2.1 8.8 3.8 4.9 2.2 3 0.6 2.4 6.3 9.5 10.9 4.9 8.8 6
Non-Natural Unknown* 0 0 0 0.1 0 4.4 0.1 1.4 0 0.3 0 0.3 0.2 0.1 0.5 0 0.2 0 0 0.3 0 0 0 0.2
Insect** 0 0 0 0 0 8.3 67.6 75 67.6 62.5 62.5 62.5 75 75 75 75 81.6 87.5 21.7 0 0 0 0 0
*Anthropogenic sounds
**Natural sounds
Table 18. Mean hourly percent time audible for each noise source at HAVO006. N = 8 days off-site sound source analysis.
Sound Source 00h 01h 02h 03h 04h 05h 06h 07h 08h 09h 10h 11h 12h 13h 14h 15h 16h 17h 18h 19h 20h 21h 22h 23h
Jet* 0 0 0 0 0 0 0 0 1.8 1.5 0 1.7 0 0 0 0 0 0 0 0 0 0 0 0
Propeller Plane* 0 0 0 0 0 0 6.1 10.2 5.3 5.6 1.2 0 0 0 0 0 0 0 0 0 0 0 0 0
*Anthropogenic sounds
17
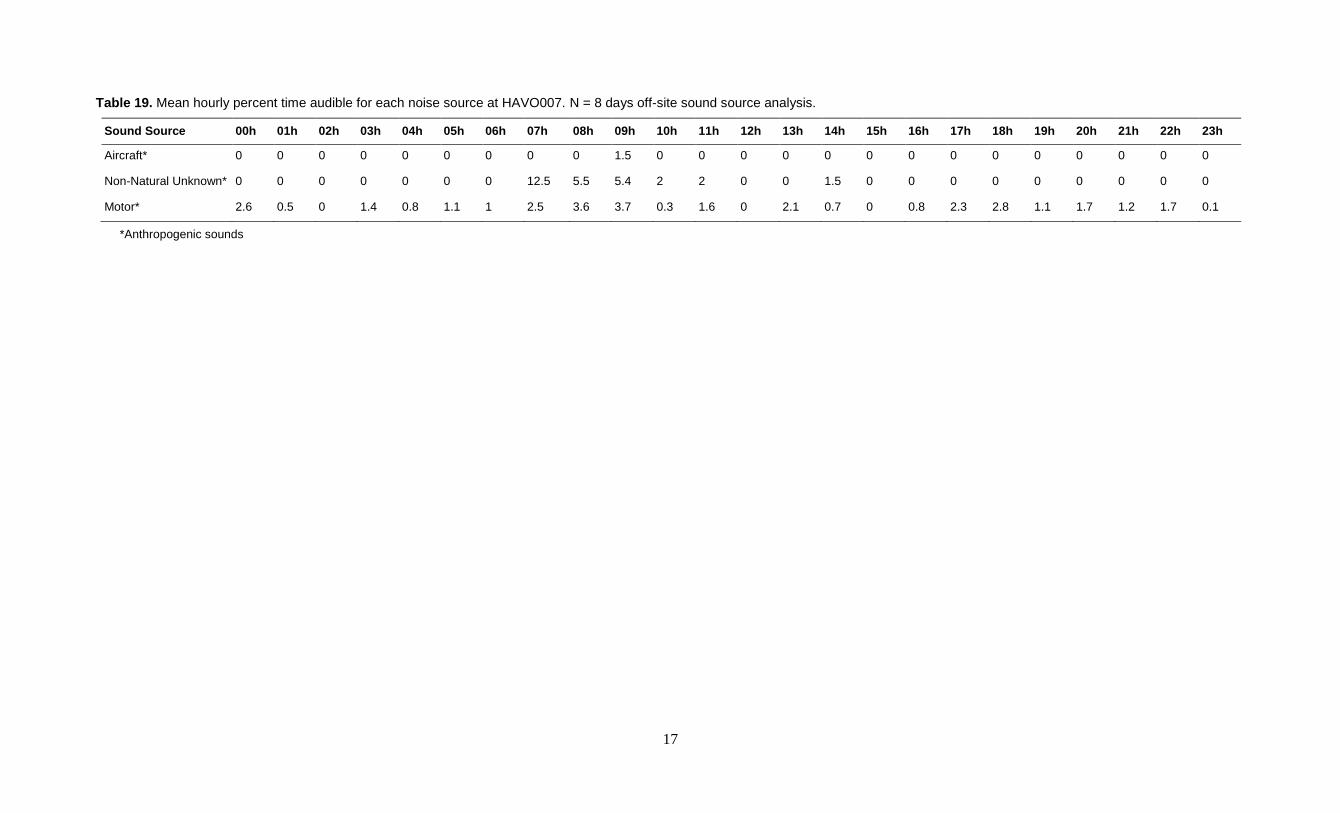
Table 19. Mean hourly percent time audible for each noise source at HAVO007. N = 8 days off-site sound source analysis.
Sound Source 00h 01h 02h 03h 04h 05h 06h 07h 08h 09h 10h 11h 12h 13h 14h 15h 16h 17h 18h 19h 20h 21h 22h 23h
Aircraft* 0 0 0 0 0 0 0 0 0 1.5 0 0 0 0 0 0 0 0 0 0 0 0 0 0
Non-Natural Unknown* 0 0 0 0 0 0 0 12.5 5.5 5.4 2 2 0 0 1.5 0 0 0 0 0 0 0 0 0
Motor* 2.6 0.5 0 1.4 0.8 1.1 1 2.5 3.6 3.7 0.3 1.6 0 2.1 0.7 0 0.8 2.3 2.8 1.1 1.7 1.2 1.7 0.1
*Anthropogenic sounds
18
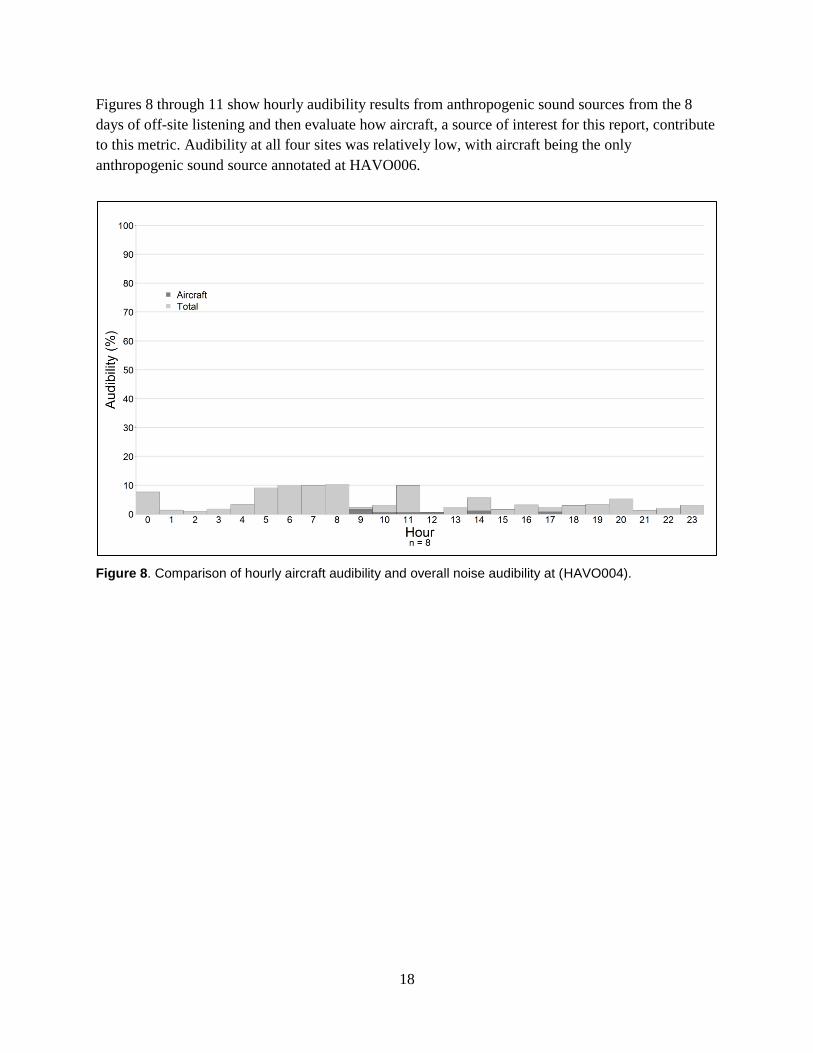
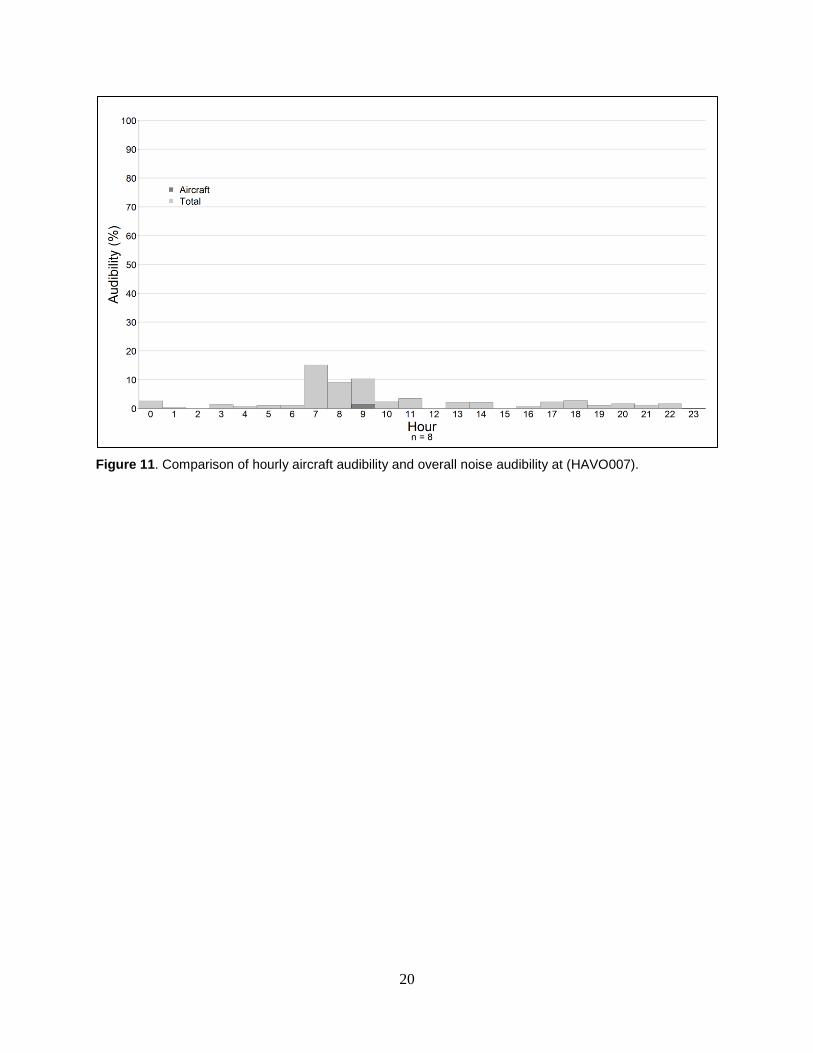
Figures 8 through 11 show hourly audibility results from anthropogenic sound sources from the 8
days of off-site listening and then evaluate how aircraft, a source of interest for this report, contribute
to this metric. Audibility at all four sites was relatively low, with aircraft being the only
anthropogenic sound source annotated at HAVO006.
Figure 8. Comparison of hourly aircraft audibility and overall noise audibility at (HAVO004).
19
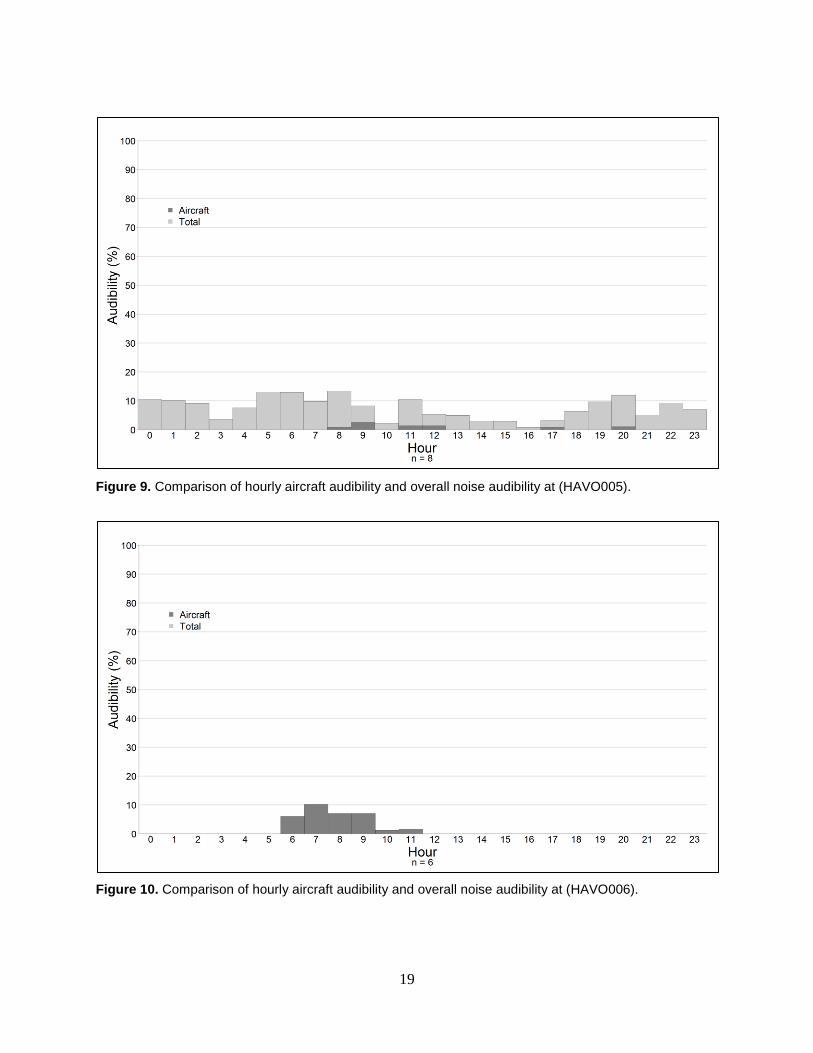
Figure 9. Comparison of hourly aircraft audibility and overall noise audibility at (HAVO005).
Figure 10. Comparison of hourly aircraft audibility and overall noise audibility at (HAVO006).
20
Figure 11. Comparison of hourly aircraft audibility and overall noise audibility at (HAVO007).
21
Discussion
The purpose of this study was to assess current conditions of the acoustical environment at HAVO,
specifically the Kahuku Unit of the park. Monitoring results characterizing the existing sound levels
are intended to provide the park with baseline information as well as to inform management
decisions. SPL data, meteorological conditions, continuous audio, and on-site listening were
collected from four different sites. Data was analyzed using visual/auditory analysis of spectrograms
and summarized using a suite of metrics. Acoustic technicians listened while visiting the sites to
provide a small sample of on-site listening that could be used to describe the full suite of
anthropogenic and natural sounds while at the site. The acoustical monitoring site locations were
chosen to best assess noise impacts to sites at varying elevations and habitats within the Kahuku Unit
of the park. The goal of the study was to determine existing ambient sound levels as a baseline
condition in the Kahuku Unit, which currently has limited public access.
Overall, results indicate that the Kahuku Unit contains remarkable natural soundscapes with
infrequent anthropogenic sounds. Each monitoring site exhibited a unique existing ambient. These
differences are likely attributed to both natural and human-caused factors. Natural factors include the
elevation, habitat, and species present. Human-caused factors include the sounds of aircraft and
vehicles. Appendix B includes a predictive model for estimating noise impacts. This predictive
model supports the conclusions that the Kahuku Unit is only minimally exposed to anthropogenic
noise.
HAVO004 is characterized by abundant natural sounds during the daytime and nights. The daytime
L50 for the site was 23.4 dBA for the truncated frequencies and 27.4 dBA for all frequencies
measured (Table 14). The Lnat was 0.3 dBA higher during the day and 0.2 dBA higher at night than
the respective L50. Vehicles were the most common anthropogenic sound source and were audible
during each hour of the day. This site is also the closest to Highway 11, being approximately 6,182
meters (3.84 miles) away (Table 19 and Figure 7). Other nearby roads, like Lorenzo Road also make
this site more accessible than the other four sites. The differences between daytime and nighttime
SPL’s are likely a result of biological and human activity as shown in Figure 4. There is a spike in
the amount of daytime high frequency sounds that can be attributed to birds. Additionally, a
harmonic insect chorus that occurred primarily during the day was notable in the spectrograms.
Nighttime insect activity was also audible in the recordings. The level, frequency, and duration of
natural sounds at this site may have masked anthropogenic noise at the site.
HAVO005 recorded the highest ambient SPL of all sites monitored. The HAVO005 site was
characterized by a predominantly natural soundscape that was especially biologically active during
the day. The daytime L50 for HAVO005 was 21.7 dBA at truncated frequencies and 38.5 dBA for all
measured frequencies (Table 14). This is the largest difference in ambient and truncated ambient
between all sites. This difference is due to the dominance of high frequency birds and insect activity
during the daytime period and small amount of low frequency sounds. Like HAVO004 there was
also a lot of harmonic daytime insect sound during the day. HAVO005 has very little exposure to
anthropogenic noise, with vehicles being the predominant noise. The Lnat was 0.4 dBA higher during
22
the day and 0.2 dBA higher at night. Low frequency natural sound sources, like water and wind were
present according to onsite listening (Table 8) but this site had the smallest range of low frequency
sound (Figure 5). This site recorded a large amount of bird vocalization, enough to substantially raise
the overall ambient of the site. The tropical broadleaf habitat would be expected to have a louder
avian chorus than the other three areas. Finally, no noise events were noted during on-site listening
sessions (Table 8).
HAVO006 had a lower daytime ambient than the previous two sites and the lowest nighttime
ambient SPL, 8.8 dBA, of all the sites. The daytime full spectrum L50 was 20.9 dBA and the
truncated frequency L50 was 15.7 dBA. The daytime had an elevated L50 only 0.3 dBA above Lnat and
the nighttime ambient was not elevated by anthropogenic noise. There was a fairly consistent
difference between ambient SPL during the day and night for this site most notable in the lower
frequencies (Figure 6 and Table 14). A dawn chorus was still strong enough to change the acoustic
frequencies heard at the site (Figure 6). This site was in a subalpine location of HAVO006 so we
might expect to hear less biological activity at this location than the Temperate Grassland or Tropical
Broadleaf forest. The only anthropogenic noise recorded at the site was from aircraft.
The differences between HAVO005 and HAVO006 are notable. A distance of only 1,957 meters (1.2
miles) and an elevation of 144 meters (472 feet) separate these two sites. Habitats vary quickly over
this landscape and these two sites vary widely. The existing ambient conditions differed considerably
between these two sites. HAVO005 recorded higher levels of noise audibility because of its
proximity to the road (Figure 9), higher levels of higher frequency noise, because of the bird and
insect activity heard frequently here (Figure 5 and 6), and a higher full spectrum daytime ambient
(L50; Table 14). The L50 for HAVO005 was 38.9 dBA and HAVO006 was 21.9 dBA, a difference of
17 dBA, this means that the amount and consistency for interspecies and intraspecies communication
between wildlife is very different between each site. HAVO005 was placed in tropical moist
broadleaf forest, which provides more opportunities to record natural sounds, such as birds or
vegetation rustling, while HAVO006 was located in a montane subalpine habitat.
HAVO007 was the quietest daytime site out of the four with the least amount of difference between
day and night ambient SPL. This is likely due to limited vocal biological activity typical of high
elevation alpine zone sites with sparse vegetation, and harsh conditions. Daytime full frequency
ambient was 16.8 dBA and truncated ambient was 13.2 dBA. There was no difference in existing
ambient and natural ambient SPL. This location had very low levels of noise from a non-natural
unknown anthropogenic sound source (the sound source was so quiet it could not be identified by our
technicians; Table 18). The natural soundscape at this site still included biological activity with the
presence of wind and water playing a larger role. This site differs the most from the other three sites
acoustically.
All four sites had nearly untouched natural soundscapes with no more than 0.3 dBA added to the
ambient SPL from anthropogenic sound sources. HAVO004 and HAVO005 stood out as locations
with an abundance of high frequency bird song. Aircraft was audible at all four sites but very few
flights were heard. HAVO006 that had the highest peak TA% (10.2% during the 7:00am hour) and
only had 20 events over the 8 day period; this value is much lower than in other zones previously
23
monitored. For example HAVO002, monitored in 2008, had a peak of 50.2 TA% and 233 events
over an 8 day period. Vehicle noise was audible only at HAVO004 and HAVO005. These two sites
are nearest to Highway 11 and other nearby access roads and are at the lowest elevation. However,
noise at all sites was of low intensity and did not contribute to large increases above natural ambient.
Aircraft
In the audibility portion of this study, listeners identified aircraft at all four sites (Tables 16-19;
Figures 8-11). It should be noted that ‘aircraft’ is a term which includes jets, propeller aircraft, and
helicopters. Aircraft is used as the coding term when the listener cannot distinguish which type of
aircraft they are hearing.
Understanding how HAVO’s frequent air tours impact the acoustic environment and the resources
the NPS protects was of interest in this study. In September, October, and November of 2013, 3,500
air tours were reported to take place over the park. Reporting commercial air tours is required as part
of U.S Code– Overflights of national parks (49 U.S.C. § 40128(d)) – and operators submit quarterly
reports. The reported data were extracted from calendar year 2013, third and fourth quarter reports
submitted to FAA and NPS by eight air tour operators.1 Of the reported air tours during this period,
3,483 were reports as helicopter flights and 17 from fixed wing/propeller aircraft.
Both the on-site listening and auditory/visual analysis of spectrograms identified propeller aircraft as
a noise source. The on-site listening method identified a single event that included a propeller aircraft
at HAVO004. No other sites identified aircraft using the on-site listening method. The
auditory/visual analysis of spectrograms identified propeller aircraft noise at two sites (Tables 16 and
17). However, the percent time audible for propeller aircraft was limited at all sites. HAVO006
(Table 17) recorded the highest amount of percent time audible for aircraft.
The discrepancy between the large number of air tours and the lack and type of aircraft noise in the
Kahuku Unit may be explained by reporting data from September, October, and November of 2013
and further detailed in Appendix C. Reporting data and other outreach efforts with operators suggest
that most helicopter air tours fly over the eastern/northeastern portion of the park where Kīlauea
Caldera is located and lava flows are common. For example, Appendix C presents two known, actual
travel patterns along a single route that were flown on May 9, 2017 by a Bell 407 helicopter. The
route travels over HAVO near the northeast boundary of the park and continues to the southeastern
section of the park, while the acoustic monitoring sites are located in the western section of the park.
Take note of the substantial terrain shielding by Mauna Loa Volcano between the air tour route and
the acoustic monitoring sites. Of the four monitoring sites, the closest portion of the air tour route is
near HAVO007, which is over 20 kilometers (13 miles) away. The aircraft noise picked up by our
audio equipment in this study was mostly likely from a different route. Some of the known routes
conducted by helicopters are similar to this pattern of flight, which mostly avoid the study area.
However, past information on air tour routes indicate that a fixed-wing, propeller driven aircraft flies
a different route closer to the study area (17 reported flights during the monitoring period). This
1 Note: Eight air tour operators submitted reports, but only five conducted air tours.
24
information gives a possible explanation why no helicopters were detected in this study, but some
propeller aircraft were identified.
Overall, these results suggest that at the time of the study, the monitoring sites had only low
audibility of anthropogenic noise, including aircraft. These data will help establish baseline
information about soundscapes in the Kahuku Unit that can be used to inform park planning efforts
such as an air tour management plan or agreement. Additionally, HAVO park staff have identified
the coqui frog (Eleutherodactylus coqui) as an invasive species that has the potential to heavily
influence the acoustic environment. Specifically, the frog has a high decibel call (80 – 90 dBA at 0.5
meter; Beard and Pitt, 2005), can have a high density population (90,000 frogs per hectare; Pitt et al.,
2012), and makes frequent vocalizations (21 calls per minute; Benevides Jr., et al, 2017). In addition
to its’ predatory impacts on native insects, park staff are concerned that the frog’s range in the park
could significantly alter the natural acoustic environment. These acoustic data serve as a baseline to
evaluate future changes to the acoustic environment caused by coqui frogs and other invasive
species.
25
Literature Cited
ANSI. 2014. Methods to define and measure the residual sound in protected natural and quiet
residential areas. ANSI-ASA_S3-SC1.100_S12.100-2014.
Barber J.R., C. Crooks, and K. Fristrup. 2010. The costs of chronic noise exposure for terrestrial
organisms. Trends in Ecology and Evolution 25:180–189.
Beard, K.H. and Pitt, W.C. 2005. Potential consequences of the coqui frog invasion in Hawaii.
USDA National Wildlife Research Center - Staff Publications. 52.
Benevides Jr., F.L., Mautz, W.J., Jacobsen, C.J., & Hara, A.H. (2017): Estimating density of calling
male Eleutherodactylus coqui in Hawaii from audio recordings of the nighttime frog chorus,
Bioacoustics, DOI: 10.1080/09524622.2017.1399467
Benitez, D.M., Belfield, T., Loh, R., Pratt, L., and Christie, A. D. June 2008. Inventory of vascular
plants of the Kahuku addition, Hawai'i Volcanoes National Park. Retrieved November 1, 2017 at
http://scholarspace.manoa.hawaii.edu/bitstream/handle/10125/27159/157.pdf?sequence=1.
Berglund, B., T. Lindvall, and D. H. Schwela (Eds.). 1999. HWO. Guidelines for community noise.
World Health Organization, Geneva.
Dooling, R. and Popper, A. 2007. The effects of highway noise on birds. Report for the California
Department of Transportation, Division of Environmental Analysis. Retrieved from
http://www.dot.ca.gov/hq/env/bio/files/caltrans_birds_10-7-2007b.pdf October, 2017.
Fay, R. R. 1988. Hearing in Vertebrates: A Psychophysics Databook. Winnetka, IL: Hill-Fay
Associates.
"Flight Tracker / Flight Status / Flight Tracking." FlightAware. N.p., n.d. Web. 23 May 2017.
https://flightaware.com/
Haas, G.E., and T. J. Wakefield. 1998. National parks and the American public: A national public
opinion survey on the national park system. Washington D.C. and Fort Collins, CO.: National
Parks and Conservation Association and Colorado State University.
Haralabidis Alexandros, S., et. al. 2008. “Acute effects of night-time noise exposure on blood
pressure in populations living near airports” European Heart Journal Advance Access. Published
online February 12, 2008.
Harris, C. M. (1998). Handbook of Acoustical Measurements and Noise Control, 3rd ed. McGraw-
Hill, New York.
Hess S., Kawakami, B. Jr., Okita, D., and Medeiros, K., 2006. A Preliminary Assessment of Mouflon
Abundance at the Kahuku Unit of Hawaii Volcanoes National Park: U.S. Geological Survey
Open File Report 2006–1193.
26
Lee C.S.Y et. al., 2016. Hawaii Volcanoes National Park: Baseline Ambient Sound Levels 2003,
USDOT. Final Report.
Lynch, E., D. Joyce, and K. Fristrup. 2011. An assessment of noise audibility and sound levels in
U.S. National Parks. Landscape Ecology 26: 1297-1309.
Mason, J. T. 2015. The Impact of Anthropogenic Noise on Northern Saw-whet Owl (Aegolius
acadius) Hunting Behavior. Boise State University Theses and Dissertations. Paper 892.
http://scholarworks.boisestate.edu/td/892
McDonald, C. D., R. M. Baumgarten, and R. Iachan. 1995. Aircraft management studies: National
Park Service Visitors Survey. HMMH Report No. 290940.12; NPOA Report No. 94-2, National
Park Service, U.S. Department of the Interior.
Mennitt, D., K. Sherrill, and K. Fristrup. 2014. A geospatial model of ambient sound pressure levels
in the contiguous United States. Journal of the Acoustical Society of America 135:2746-2764.
National Park Service. 2005. Acoustic and Soundscape Studies in National Parks: Draft. Fort Collins,
CO: NPS Natural Sounds and Night Skies Division.
National Park Service. 2006a. Management Policy 4.9: Soundscape Management.
National Park Service. 2006b. Management Policy 8.2.3: Use of Motorized Equipment.
National Park Service. 2006c. Management Policy 5.3.1.7: Cultural Soundscape Management.
National Park Service. 2000. Director’s Order 47: Soundscape Preservation and Noise Management.
"Natural Features & Ecosystems." National Parks Service. U.S. Department of the Interior, n.d. Web.
14 June 2017. https://www.nps.gov/havo/learn/nature/naturalfeaturesandecosystems.htm
Pitt, W.C., Beard, K.H., Doratt, R.E. 2012. Management of invasive coqui frog populations in
Hawaii. Outlooks on Pest Management. August 2012.
Templeton, D. (Ed.). 1997. Acoustics in the built environment: Advice for the design team.
Architectural Press, Oxford.
US Department of Transportation. 2016. Hawai‘i Volcanoes National Park: Baseline Ambient Sound
Levels 2003. Report number DOT/FAA/AEE/2016-05.
U.S. Environmental Protection Agency (EPA). 1974. Information on levels of environmental noise
requisite to protect public health and welfare with an adequate margin of safety. EPA,
Washington, D.C.
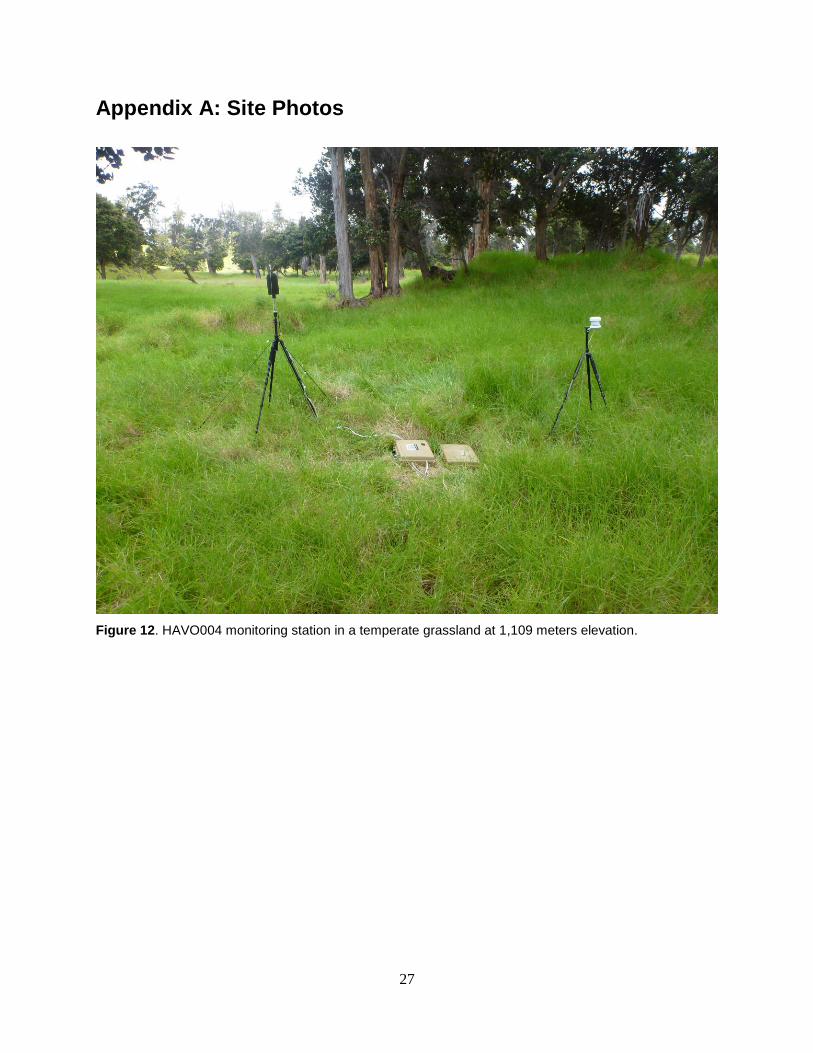
27
Appendix A: Site Photos
Figure 12. HAVO004 monitoring station in a temperate grassland at 1,109 meters elevation.
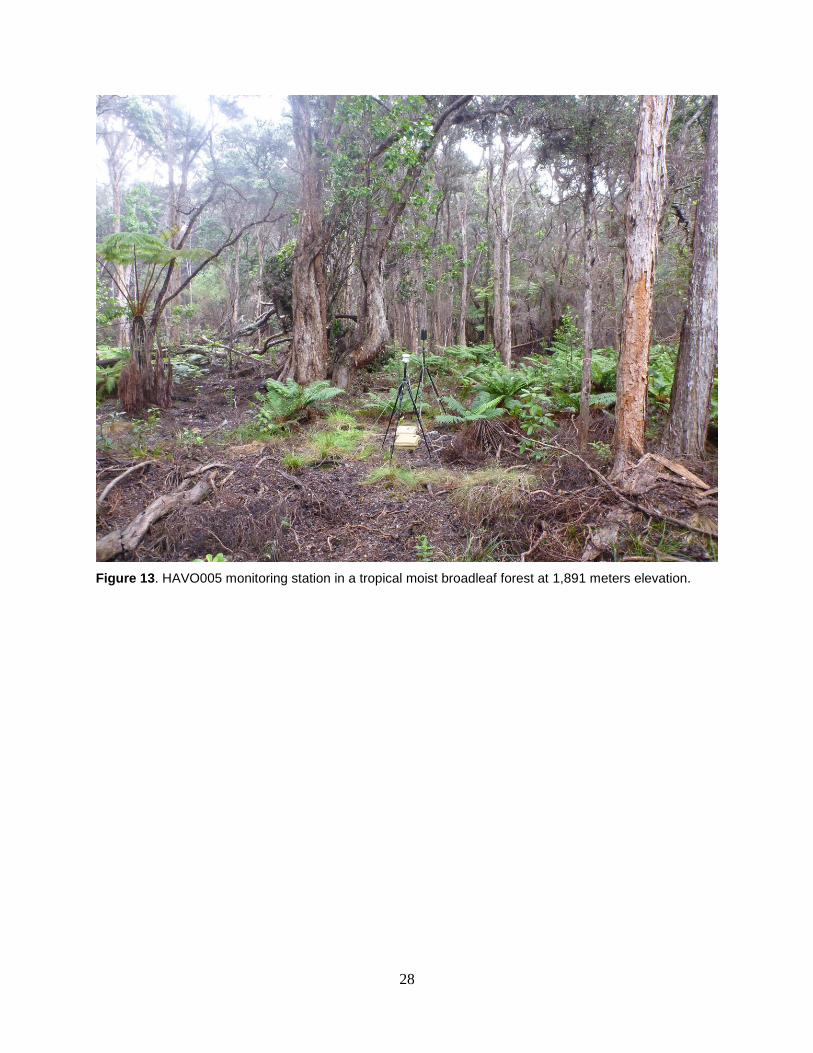
28
Figure 13. HAVO005 monitoring station in a tropical moist broadleaf forest at 1,891 meters elevation.
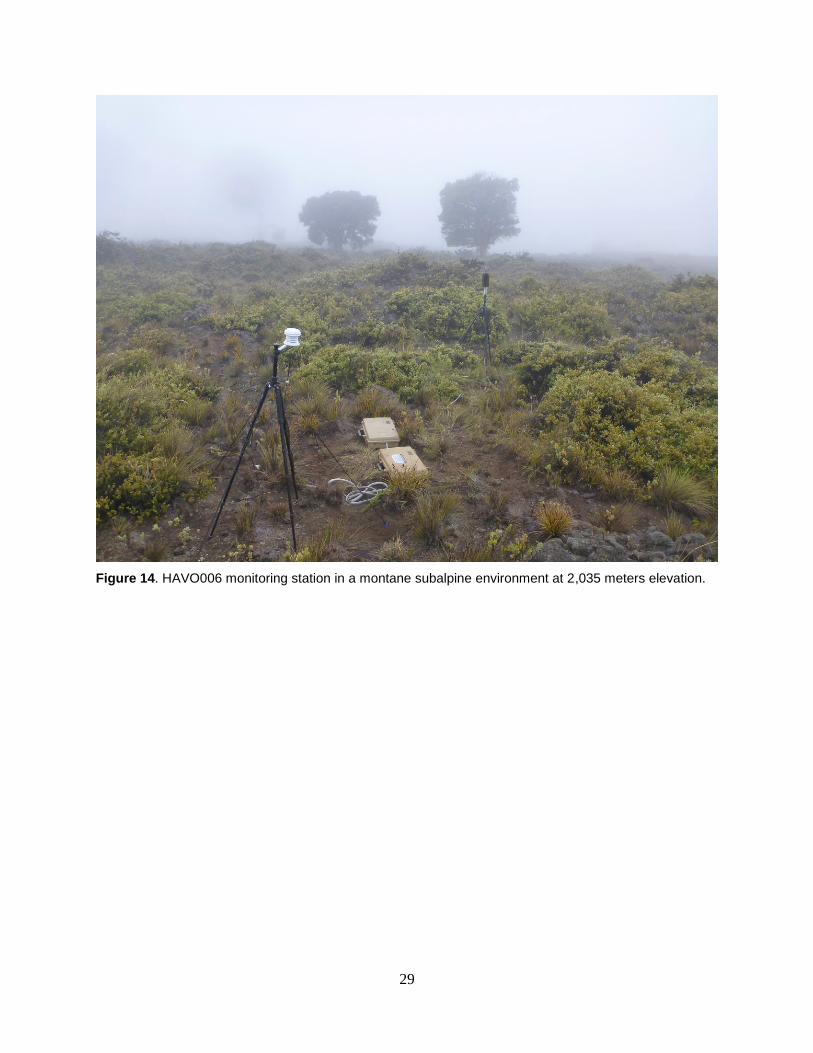
29
Figure 14. HAVO006 monitoring station in a montane subalpine environment at 2,035 meters elevation.
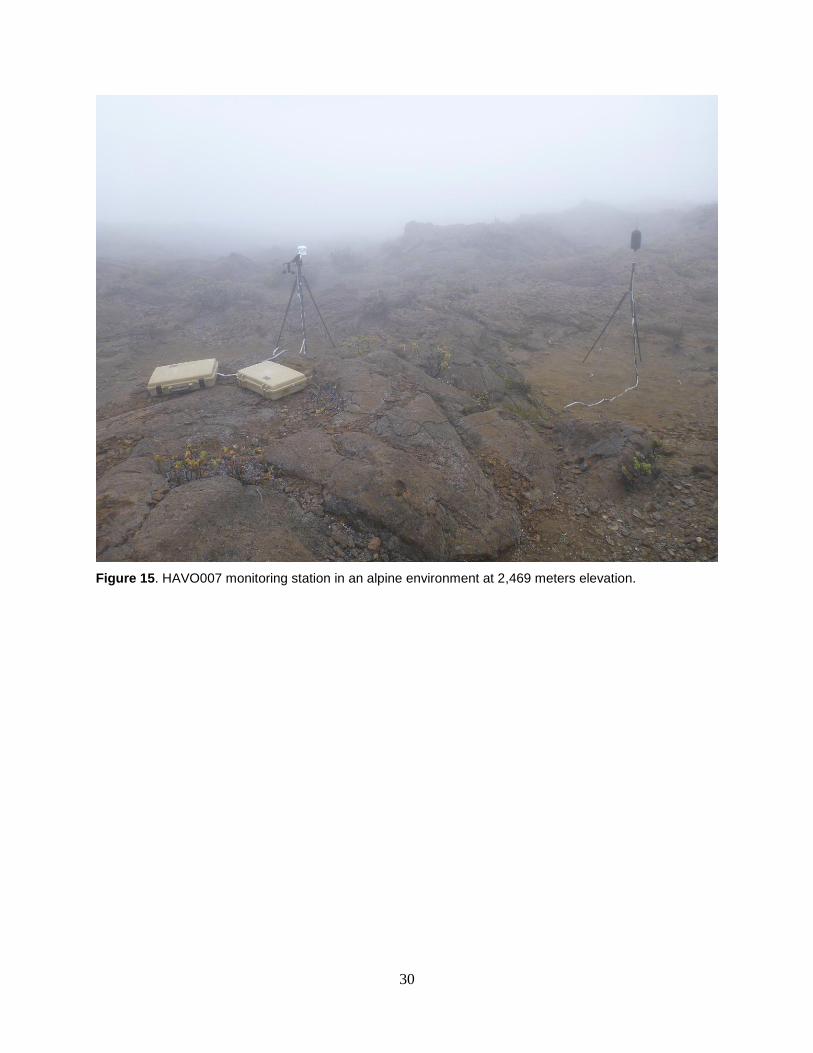
30
Figure 15. HAVO007 monitoring station in an alpine environment at 2,469 meters elevation.
31
Appendix B: Modeled Impact Levels
NSNSD developed a model (Mennitt et al. 2014) that predicts the median sound level using
measurements made in hundreds of national park sites as well as 109 explanatory variables such as
location, climate, land cover, hydrology, wind speed, and proximity to noise sources such as roads,
railroads, and airports. It is important to note that the model does not account for air traffic, including
air tours. Unlike roads, air traffic has more variability in routes and noise, which is why it was not
included in the model.
The resulting model (Mennitt et al. 2014) predicts sound levels anywhere in the contiguous U. S.,
and also estimates how much lower these sound levels would be in the absence of human activities.
The same methods were used to create a model for Hawaii, although certain base-layer data were
from different sources than the original model (for example the vegetation maps layers were
designed differently). The difference between the modeled existing and modeled natural sound level
(L50 impact) at HAVO is shown in Figure 16, and provides a measure of how much anthropogenic
noise is increasing the existing sound level above the natural sound level, on an average summer day.
At HAVO, the mean modeled sound level impact is 0.3 dBA (ranging from 0 decibels (dBA) in the
least impacted areas to 7.4 decibels (dBA) in the most impacted areas). The average existing sound
level is predicted to be 0.3 dBA above natural conditions. Figure 16 shows a map of predicted
acoustic impact levels in the park for an average summer day. The color scale indicates how much
man-made noise increases the sound level (in A-weighted decibels, or dBA), with 270 meter
resolution. Black or dark blue colors indicate low impacts while yellow or white colors indicate
greater impacts. Note that this graphic may not reflect recent localized changes such as new access
roads or development and does not include air traffic. The mean acoustic impact level at the park is
0.3 dBA and the median is 0.1 dBA. Each pixel in the graphic shown in Figure 16 represents 270 m.
For reference in translating sound level impacts into functional effects (for human visitors and
resident wildlife), an increase in background sound level of 3 dB produces an approximate decrease
in listening area of 50%. In other words, by raising the sound level at HAVO by just 3 dB, the ability
of listeners to hear the sounds around them is effectively cut in half. Furthermore, an increase of 7 dB
leads to an approximate decrease in listening area of 80%. An increase of 0.3 dBA would reduce the
listening area for wildlife and visitors by 6.7%. For example, if a predator can hear a potential prey
animal in an area of 100 square feet in a setting with natural ambient sounds, that animal’s ability to
hear would be reduced to 93 square feet if the sound levels were increased by 0.3 dBA.
Modeled metrics and on the ground park-based metrics were similar. This modeled data continues to
demonstrate that sounds intrinsic to the park are a resource important to protect in the park
environment. Compared to parks throughout the national park system, this is a low number and
shows a prominence of natural sounds and natural quiet that should be preserved and protected.
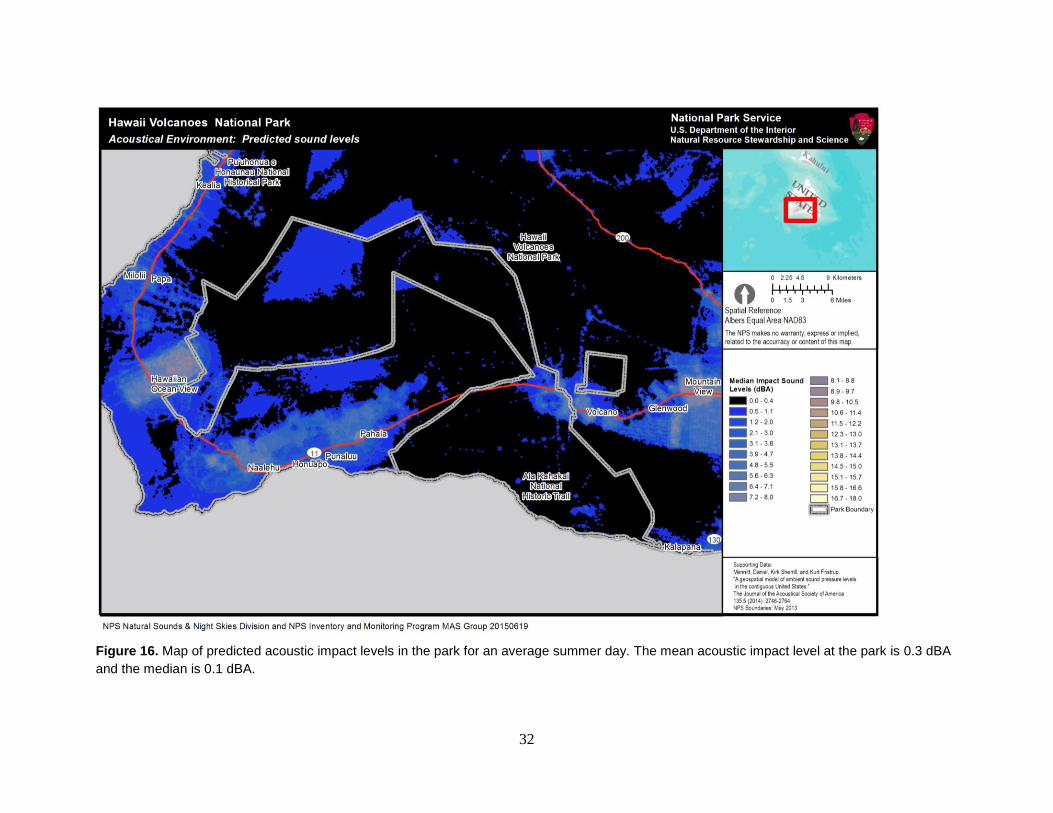
32
Figure 16. Map of predicted acoustic impact levels in the park for an average summer day. The mean acoustic impact level at the park is 0.3 dBA
and the median is 0.1 dBA.
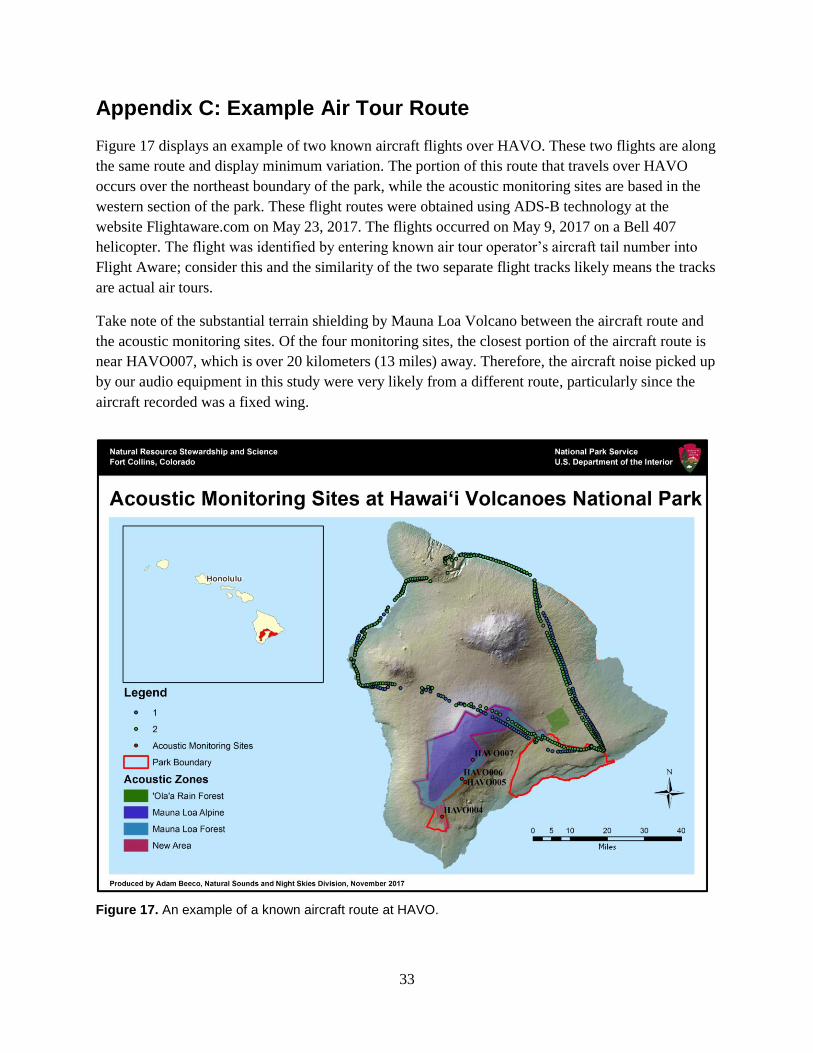
33
Appendix C: Example Air Tour Route
Figure 17 displays an example of two known aircraft flights over HAVO. These two flights are along
the same route and display minimum variation. The portion of this route that travels over HAVO
occurs over the northeast boundary of the park, while the acoustic monitoring sites are based in the
western section of the park. These flight routes were obtained using ADS-B technology at the
website Flightaware.com on May 23, 2017. The flights occurred on May 9, 2017 on a Bell 407
helicopter. The flight was identified by entering known air tour operator’s aircraft tail number into
Flight Aware; consider this and the similarity of the two separate flight tracks likely means the tracks
are actual air tours.
Take note of the substantial terrain shielding by Mauna Loa Volcano between the aircraft route and
the acoustic monitoring sites. Of the four monitoring sites, the closest portion of the aircraft route is
near HAVO007, which is over 20 kilometers (13 miles) away. Therefore, the aircraft noise picked up
by our audio equipment in this study were very likely from a different route, particularly since the
aircraft recorded was a fixed wing.
Figure 17. An example of a known aircraft route at HAVO.
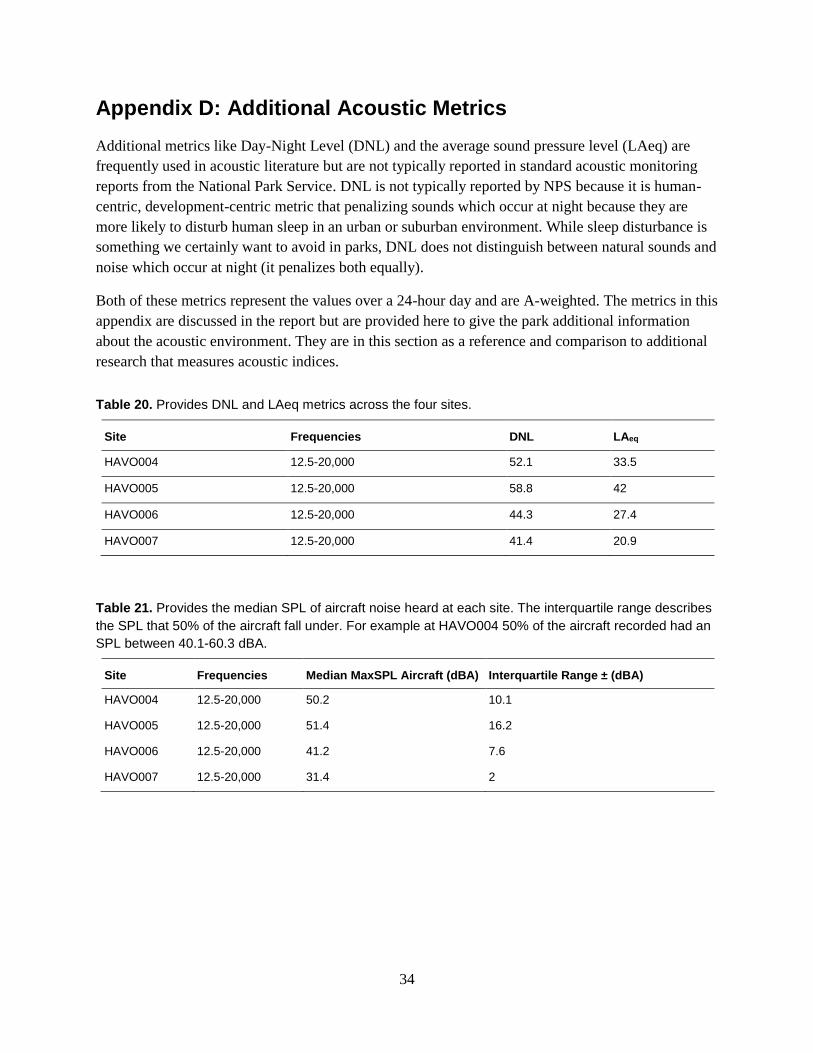
34
Appendix D: Additional Acoustic Metrics
Additional metrics like Day-Night Level (DNL) and the average sound pressure level (LAeq) are
frequently used in acoustic literature but are not typically reported in standard acoustic monitoring
reports from the National Park Service. DNL is not typically reported by NPS because it is human-
centric, development-centric metric that penalizing sounds which occur at night because they are
more likely to disturb human sleep in an urban or suburban environment. While sleep disturbance is
something we certainly want to avoid in parks, DNL does not distinguish between natural sounds and
noise which occur at night (it penalizes both equally).
Both of these metrics represent the values over a 24-hour day and are A-weighted. The metrics in this
appendix are discussed in the report but are provided here to give the park additional information
about the acoustic environment. They are in this section as a reference and comparison to additional
research that measures acoustic indices.
Table 20. Provides DNL and LAeq metrics across the four sites.
Site Frequencies DNL LAeq
HAVO004 12.5-20,000 52.1 33.5
HAVO005 12.5-20,000 58.8 42
HAVO006 12.5-20,000 44.3 27.4
HAVO007 12.5-20,000 41.4 20.9
Table 21. Provides the median SPL of aircraft noise heard at each site. The interquartile range describes
the SPL that 50% of the aircraft fall under. For example at HAVO004 50% of the aircraft recorded had an
SPL between 40.1-60.3 dBA.
Site Frequencies Median MaxSPL Aircraft (dBA) Interquartile Range ± (dBA)
HAVO004 12.5-20,000 50.2 10.1
HAVO005 12.5-20,000 51.4 16.2
HAVO006 12.5-20,000 41.2 7.6
HAVO007 12.5-20,000 31.4 2

The Department of the Interior protects and manages the nation’s natural resources and cultural heritage; provides scientific
and other information about those resources; and honors its special responsibilities to American Indians, Alaska Natives, and
affiliated Island Communities.
NPS 124/141804, January 2018
National Park Service
U.S. Department of the Interior
Natural Resource Stewardship and Science
1201 Oakridge Drive, Suite 150
Fort Collins, CO 80525
EXPERIENCE YOUR AMERICA TM
Related Documents