HOSTEL MANAGEMENT SYSTEM A PROJECT REPORT Submitted by NAME REGISTER NUMBER E.B.ARUN 96207205006 P.BALAMURUGAN 96207205007 P.BOOPATHY 96207205008

Welcome message from author
This document is posted to help you gain knowledge. Please leave a comment to let me know what you think about it! Share it to your friends and learn new things together.
Transcript
HOSTEL MANAGEMENT SYSTEM
A PROJECT REPORT
Submitted by
NAME REGISTER NUMBER
E.B.ARUN
96207205006
P.BALAMURUGAN
96207205007
P.BOOPATHY
96207205008
A. CHITRA
96207205009
M.DEEPIKA
96207205010
ABSTRACT
Hostel management by manual way is tedious process,
since it involves work load and time consumption.
In this system, we can easily manage the hostel
details, room details, student records, mess
expenditure, mess bill calculation, easy way of
room allocation and hostel attendance.
The main feature of this project is easy to
allocate for the student and also easy to calculate
mess bill.
This project is carried out using Visual Basic as
front end and oracle as back end.
TABLE OF CONTENTS
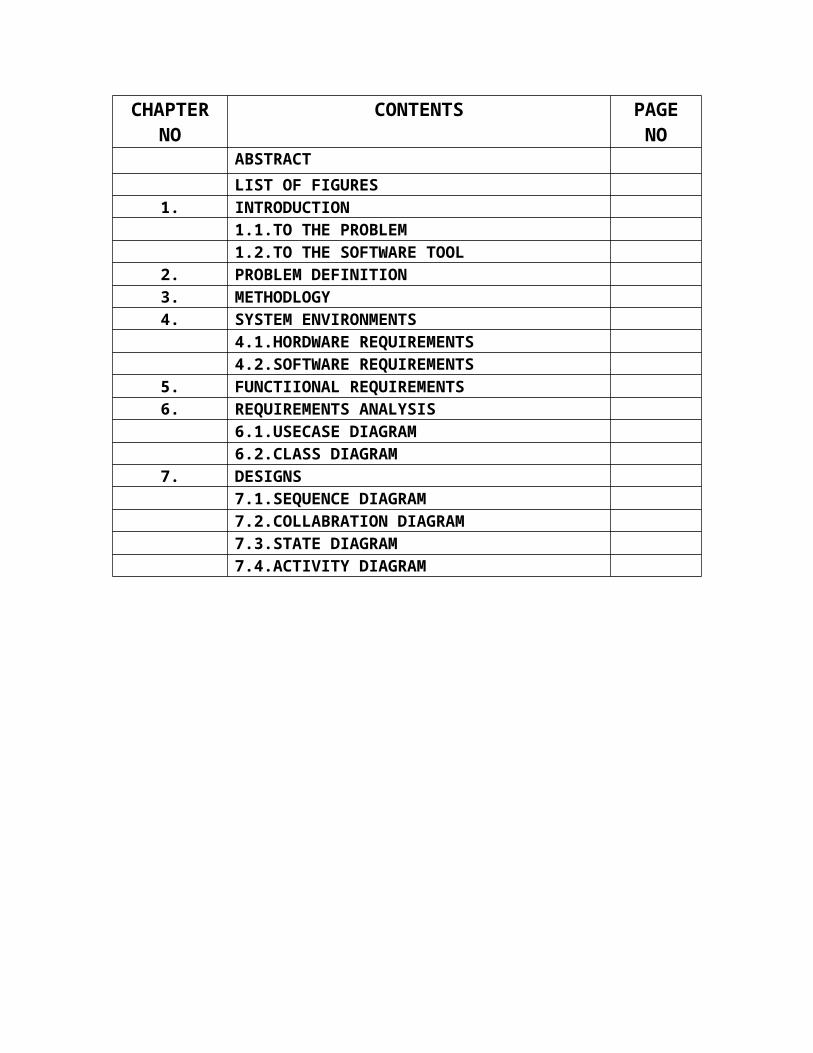
CHAPTERNO
CONTENTS PAGENO
ABSTRACTLIST OF FIGURES
1. INTRODUCTION1.1.TO THE PROBLEM1.2.TO THE SOFTWARE TOOL
2. PROBLEM DEFINITION3. METHODLOGY4. SYSTEM ENVIRONMENTS
4.1.HORDWARE REQUIREMENTS4.2.SOFTWARE REQUIREMENTS
5. FUNCTIIONAL REQUIREMENTS6. REQUIREMENTS ANALYSIS
6.1.USECASE DIAGRAM6.2.CLASS DIAGRAM
7. DESIGNS7.1.SEQUENCE DIAGRAM7.2.COLLABRATION DIAGRAM7.3.STATE DIAGRAM7.4.ACTIVITY DIAGRAM

LIST OF TABLES
CHAPTER 1
INTRODUCTION
1.1.TO THE PROBLEM
Hostel management gives on idea about how the students
details, room allocation, mess expenditure are maintained in
the particular concern. The hostel management system also
includes some special features. The administration has the
unique identity for each members as well as students
details. The stock management has also held by mess
expenditure, the mess expenditure that used to calculate the
mess bills of each of the students. The modules of this
project are student details, attendance details, room
details, mess modules.
Visual Basic6.0 is used as the front end tool and
Oracle is used as a backend tool. Visual Basic is one of the

driven programming languages. The application wizards, menu
editor and data reports etc is very much useful for creating
very good professional software.
1.2. TO THE SOFTWARE TOOL
The “visual” part refers to the method used to create
the graphical user interface (GUI). Rather than writing
numerous lines of code to describe the appearance and
location of interface elements, you simply drag and drop
pre-built objects into place on screen. If you’ve ever used
a drawing program such as paint, you already have most of
the skills necessary to create an effective user interface.
It revolves around ready-made objects and it is event-
driven that is all the activities in a program are triggered
by one event or another. Each object has its own properties,
determining its position, size, color, appearance and nature
of its text and much more. Each object also has its own
event-handling procedures.
Visual basic knows what a button is and how it works?
It also works how to handle images, menus, dialog boxes,
drive and directory list and much else. The programmer does
not have to write code to trap these events the system does
that automatically because the program code runs in response
to events. The flow of execution is not as fixed in a
traditional program.
Operations do not have to follow a set of sequence and
can be easily interrupted, suspended or abandoned. The
process of program design reflects the nature of the system.
You begin by the screen layout events and then any necessary
code to co-ordinate the whole program.
Overall Diagram:
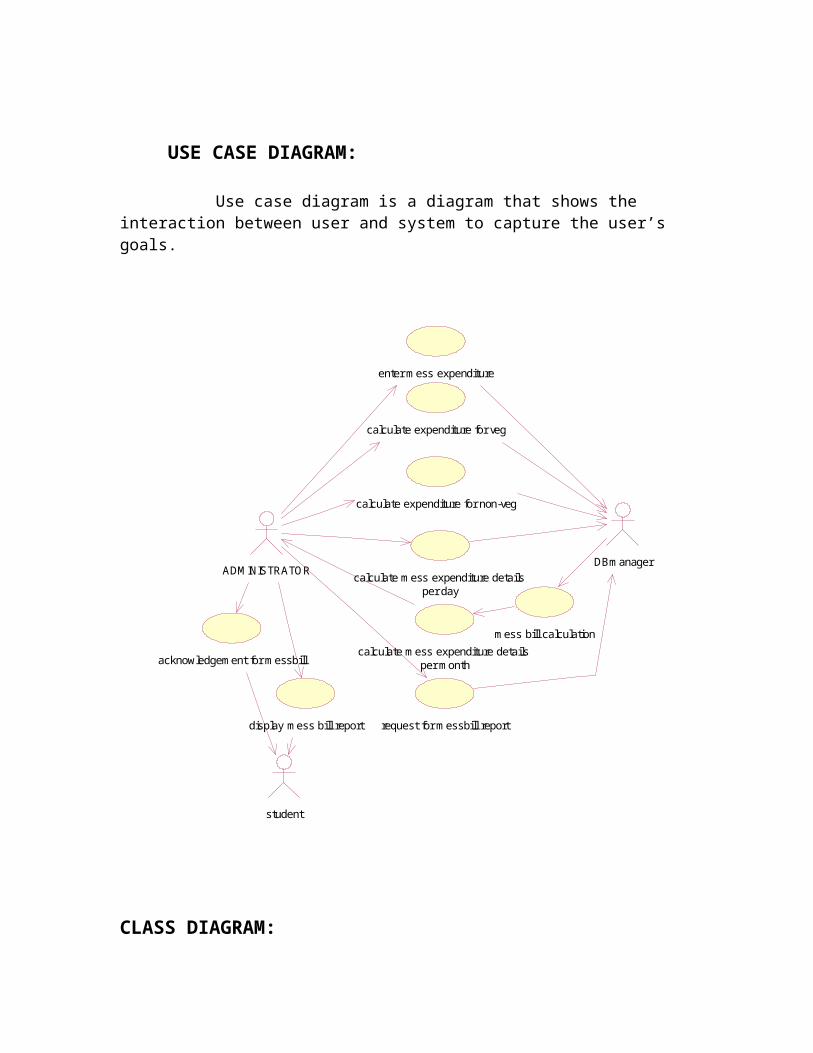
USE CASE DIAGRAM:
Use case diagram is a diagram that shows the interaction between user and system to
capture the user’s goals.
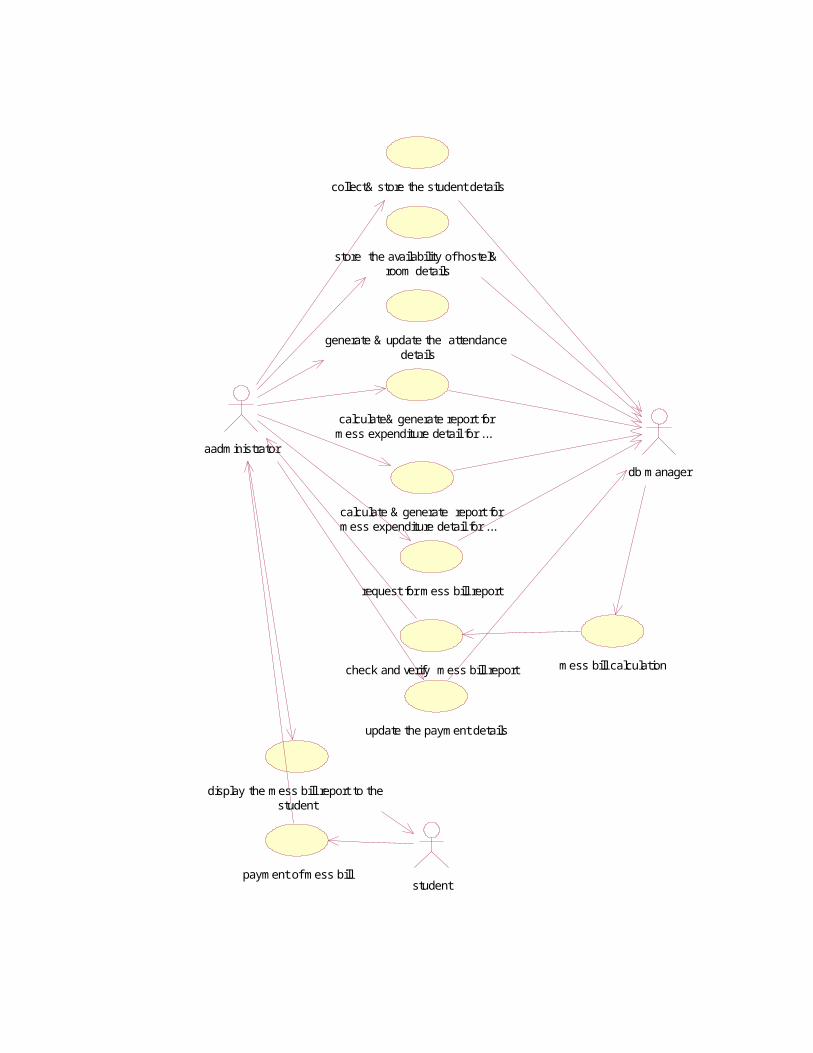
student
display the m ess bill report to the student
paym ent of m ess bill
check and verify m ess bill report
collect& store the student details
store the availability of hostel& room details
generate & update the attendance details
calculate& generate report for m ess expenditure detail for ...
calculate & generate report for m ess expenditure detail for ...
request for m ess bill report
m ess bill calculation
aadm inistratordb m anager
update the paym ent details
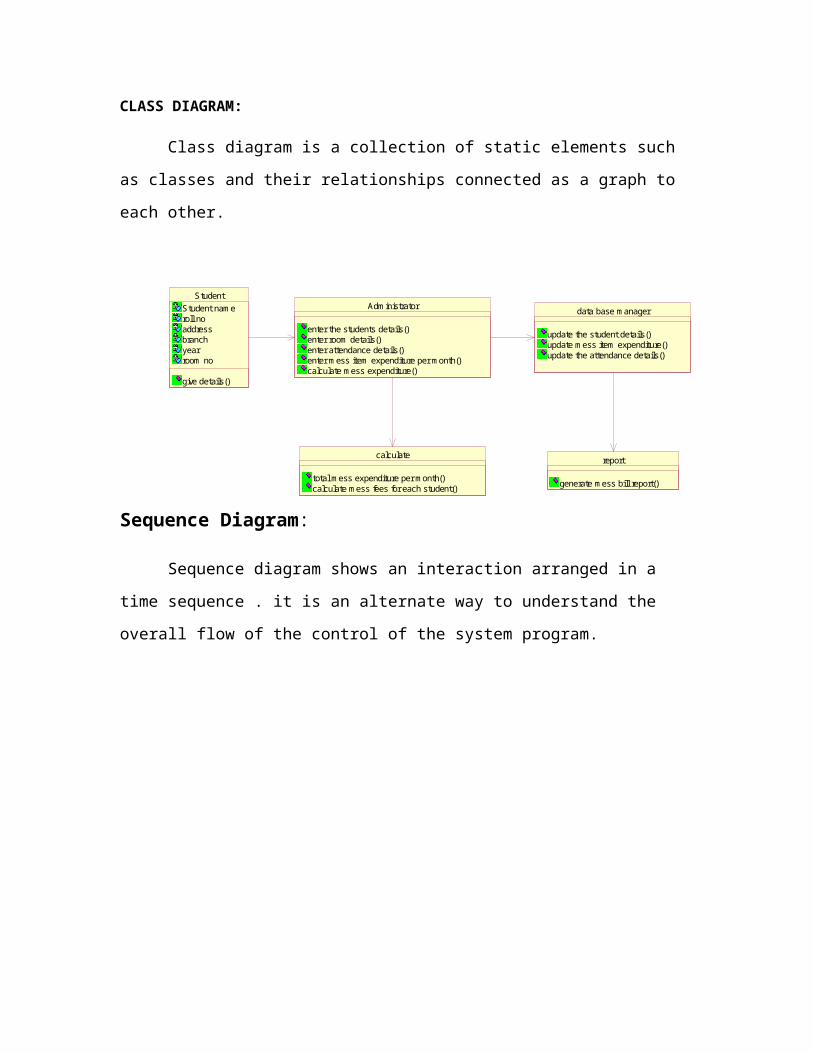
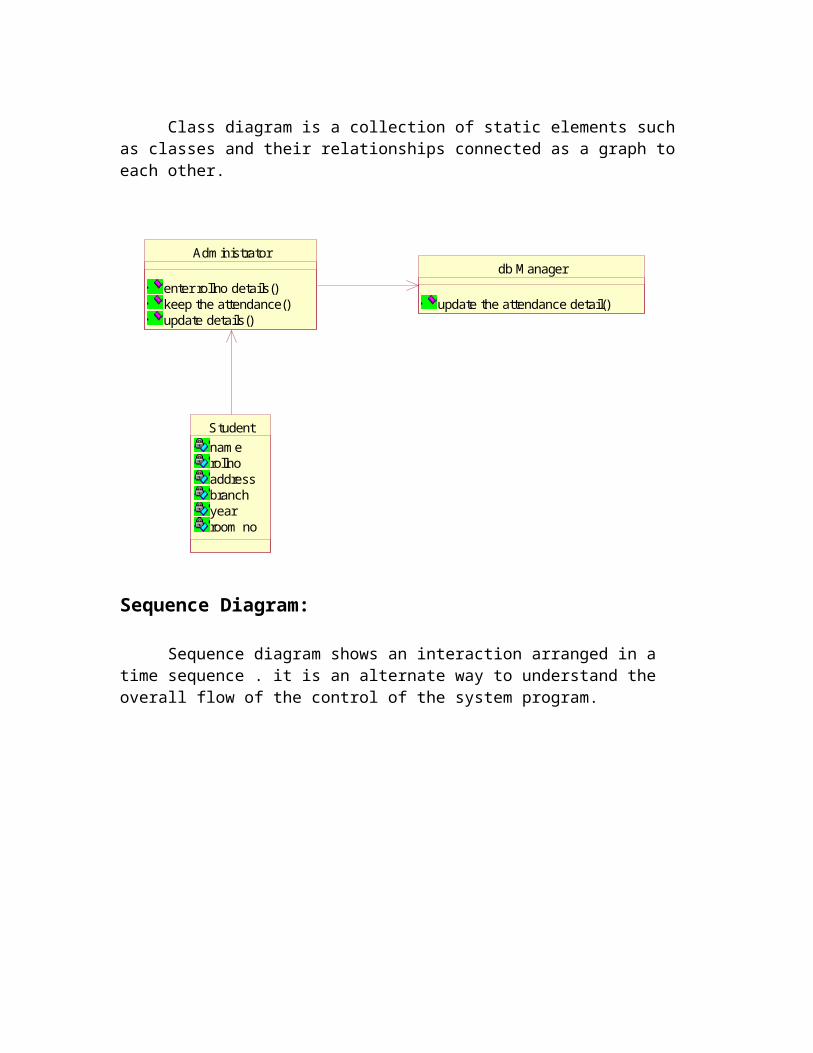
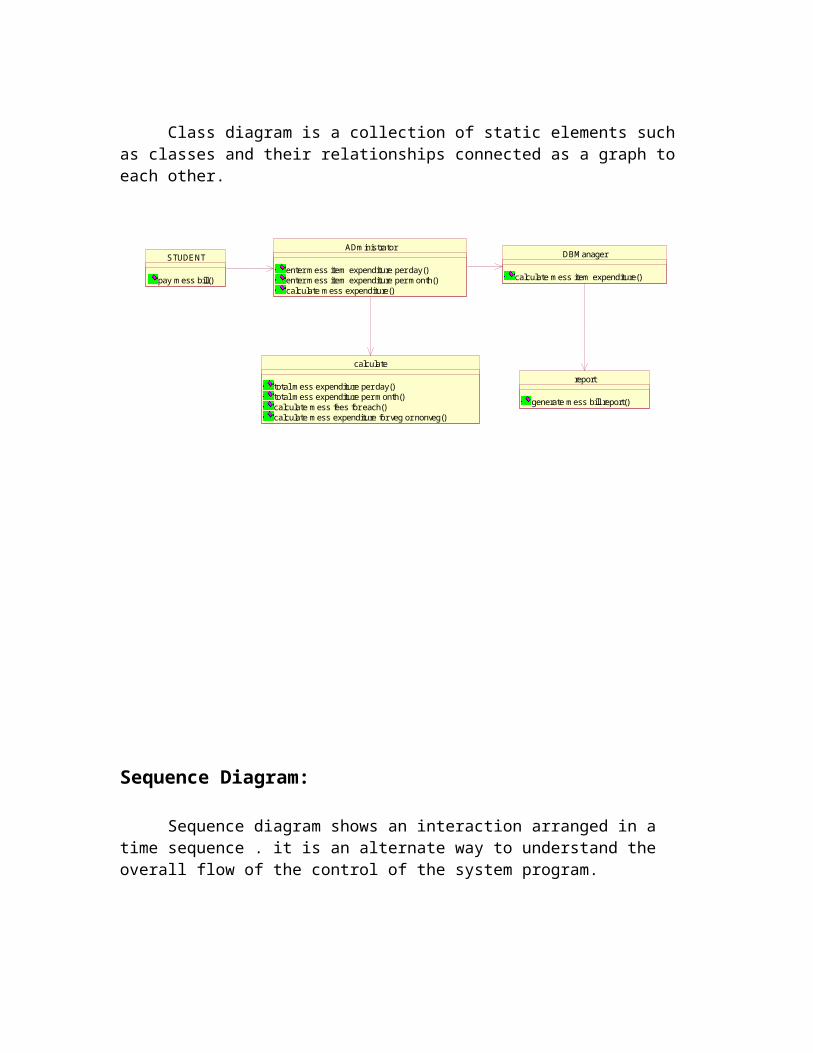
CLASS DIAGRAM:
Class diagram is a collection of static elements such
as classes and their relationships connected as a graph to
each other.
StudentStudent nam eroll noaddressbranchyearroom no
give details()
calculate
total m ess expenditure per m onth()calculate m ess fees for each student()
Adm inistrator
enter the students details()enter room details()enter attendance details()enter m ess item expenditure per m onth()calculate m ess expenditure()
report
generate m ess bill report()
data base m anager
update the student details()update m ess item expenditure()update the attendance details()
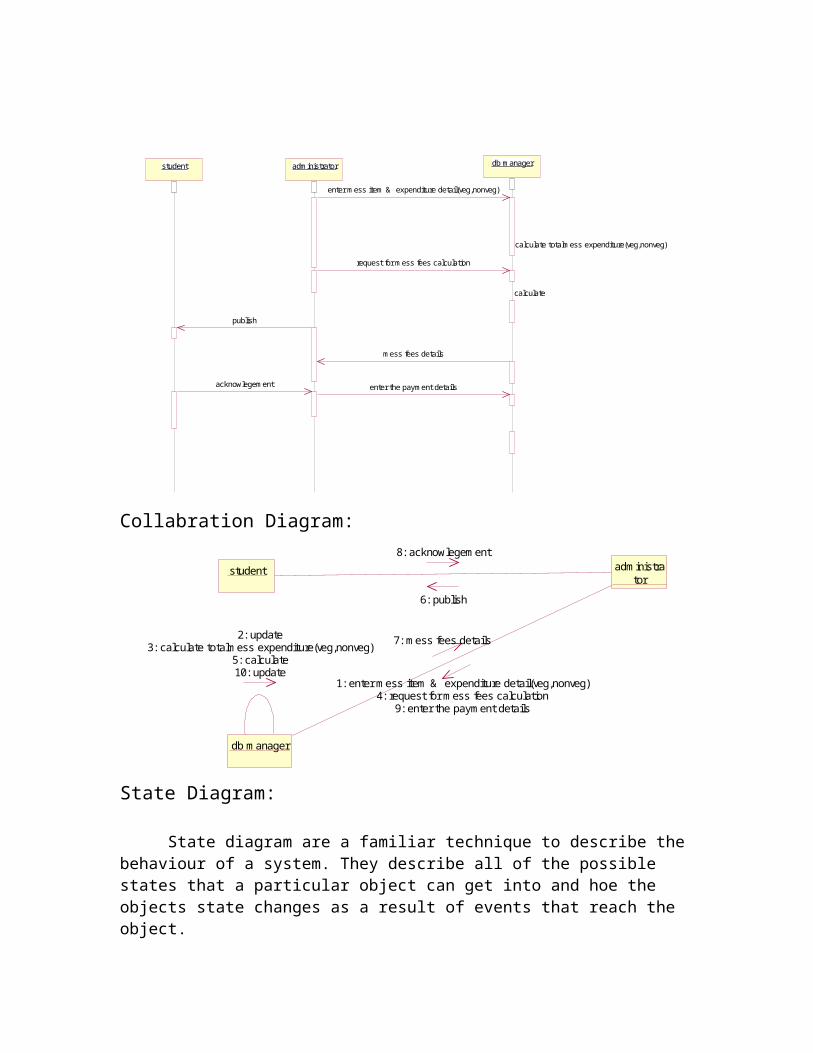
Sequence Diagram:
Sequence diagram shows an interaction arranged in a
time sequence . it is an alternate way to understand the
overall flow of the control of the system program.
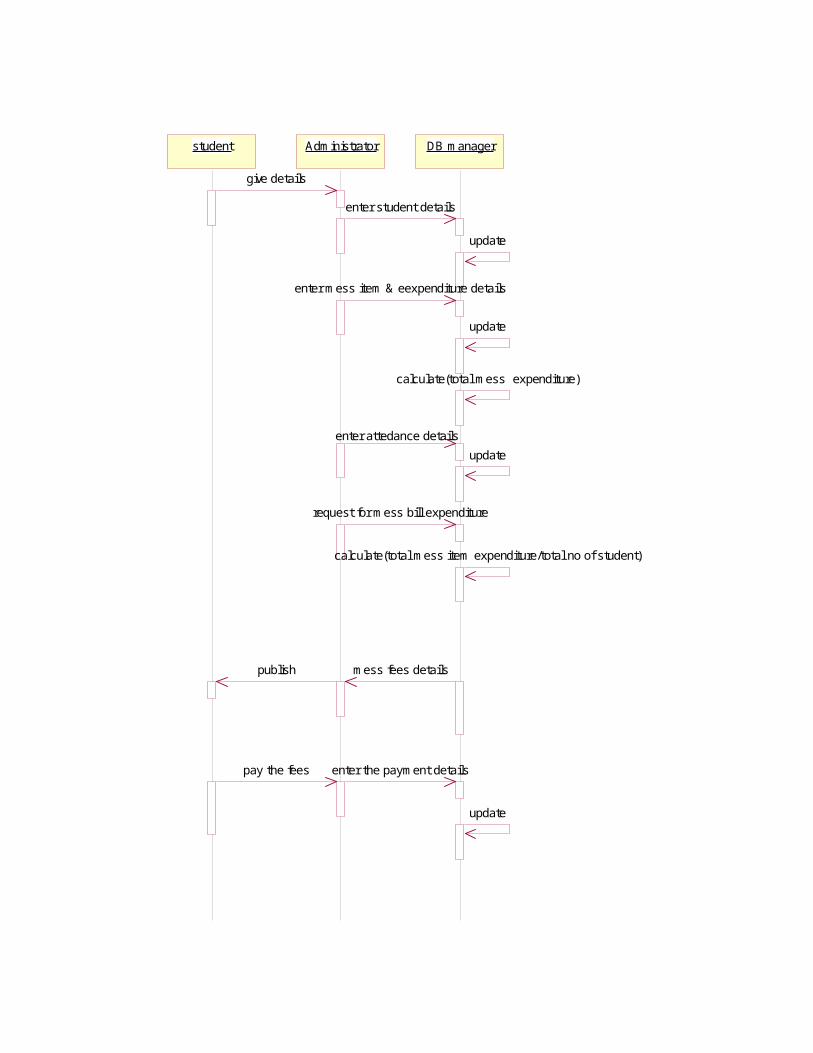
student Adm inistrator DB m anager
give details
enter student details
update
enter m ess item & eexpenditure details
update
calculate(total m ess expenditure)
enter attedance detailsupdate
request for m ess bill expenditure
calculate(total m ess item expenditure/total no of student)
m ess fees detailspublish
pay the fees enter the paym ent details
update
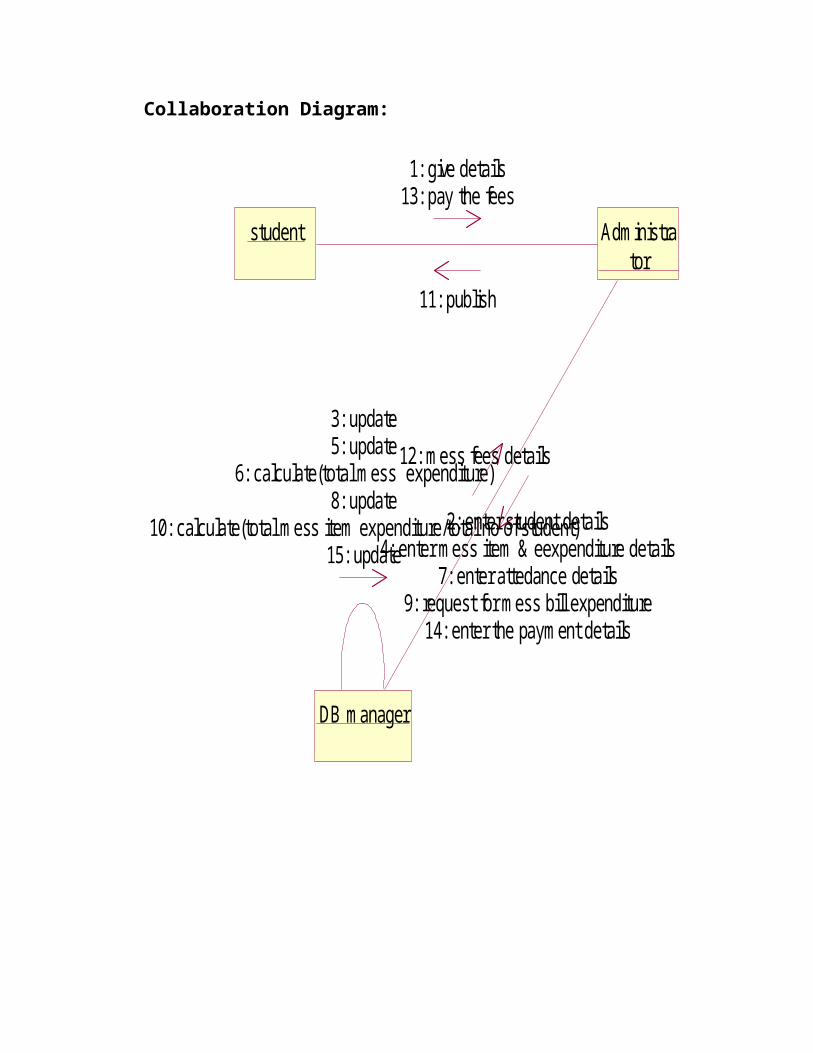
Collaboration Diagram:
student Adm inistrator
DB m anager
3: update5: update
6: calculate(total m ess expenditure)8: update
10: calculate(total m ess item expenditure/total no of student)15: update
2: enter student details4: enter m ess item & eexpenditure details
7: enter attedance details9: request for m ess bill expenditure
14: enter the paym ent details
12: m ess fees details
1: give details13: pay the fees
11: publish
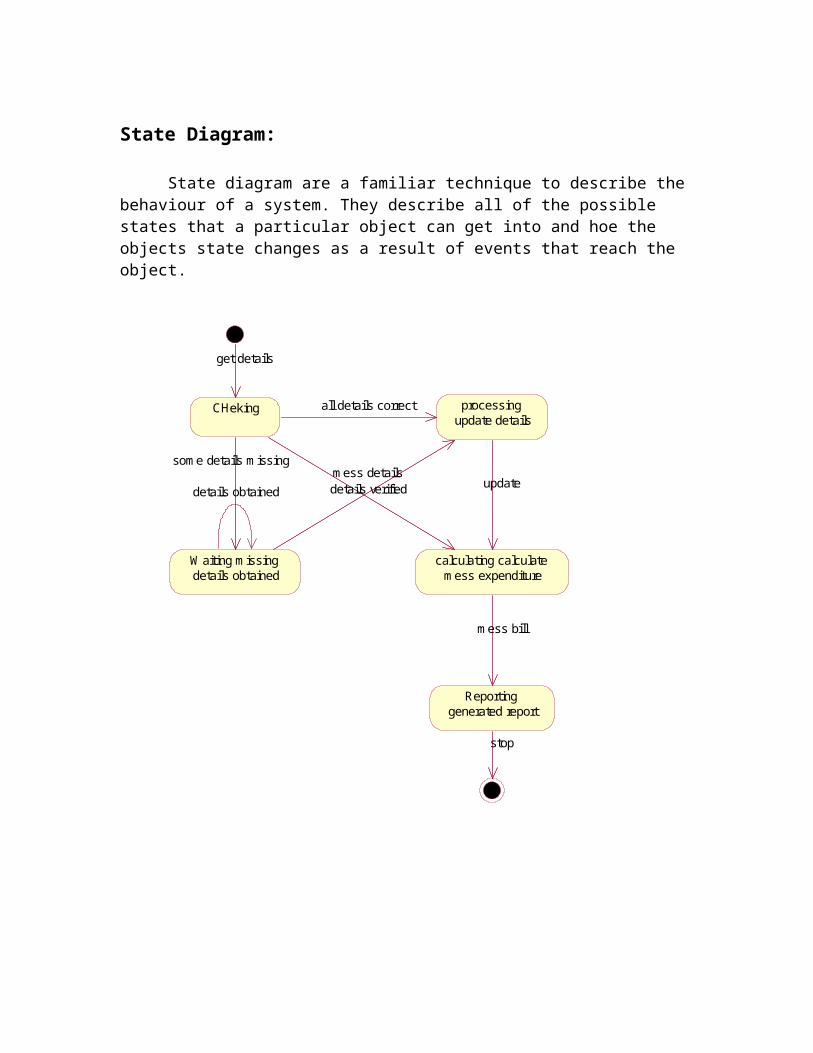
State Diagram:
State diagram are a familiar technique to describe the behaviour of a system. They describe all of the possible states that a particular object can get into and hoe the objects state changes as a result of events that reach the object.
CHeking processing update details
W aiting m issing details obtained
calculating calculate m ess expenditure
Reporting generated report
get details
all details correct
update
m ess bill
stop
som e details m issingm ess detailsdetails verifieddetails obtained
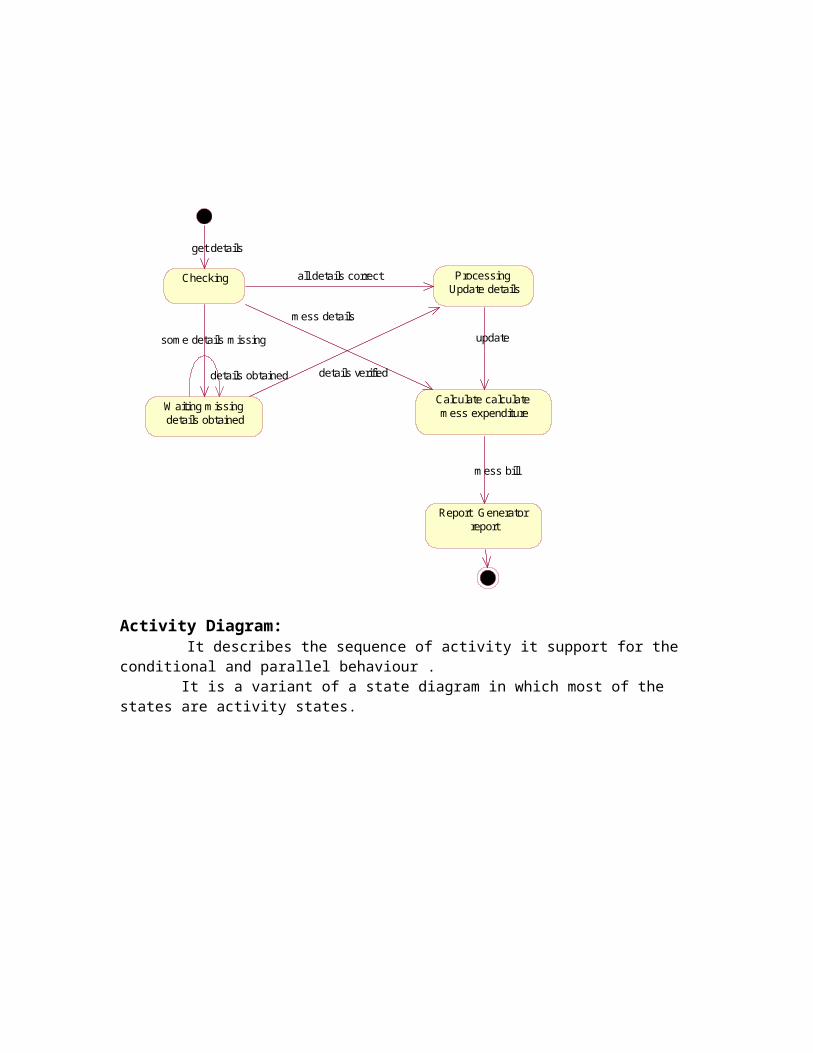
Activity Diagram:
It describes the sequence of activity it support for
the conditional and parallel behaviour .
It is a variant of a state diagram in which most of
the states are activity states.
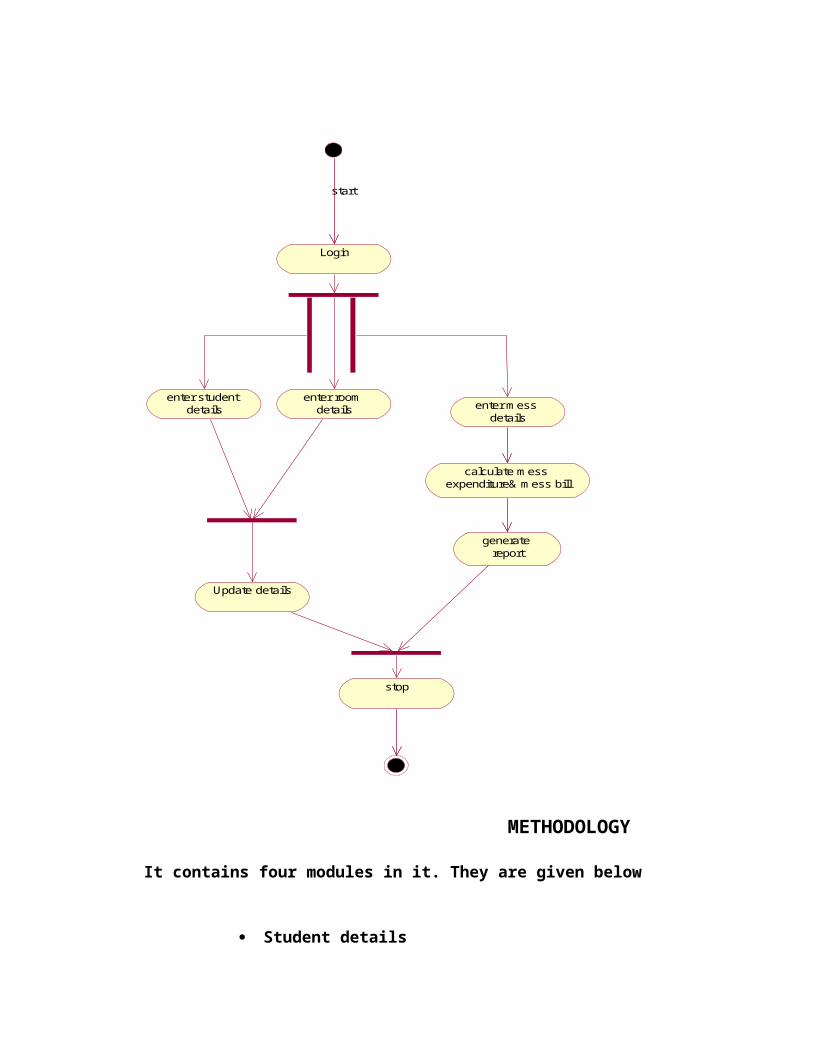
Login
enter student details
enter room details enter m ess
details
start
calculate m ess expenditure& m ess bill
generate report
stop
Update details
METHODOLOGY
It contains four modules in it. They are given below
Student details
Attendance details Room details Mess modules
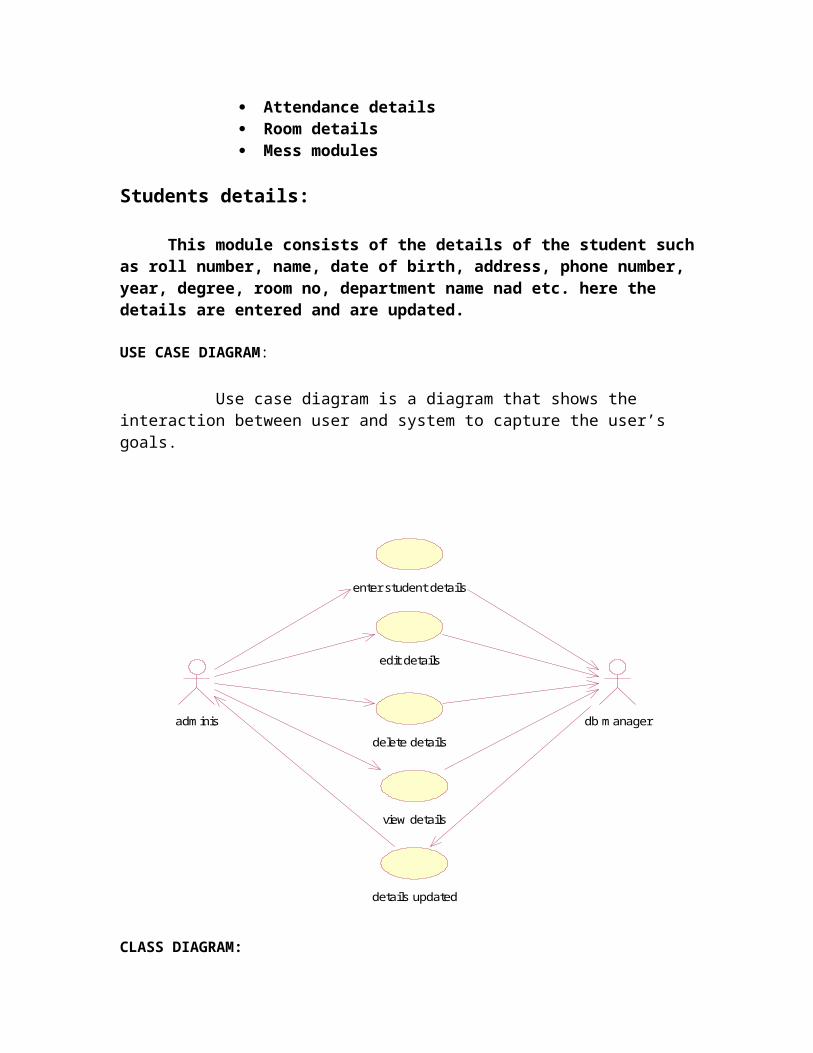
Students details:
This module consists of the details of the student suchas roll number, name, date of birth, address, phone number, year, degree, room no, department name nad etc. here the details are entered and are updated.
USE CASE DIAGRAM:
Use case diagram is a diagram that shows the interaction between user and system to capture the user’s goals.
adm inis
enter student details
edit details
delete details
view details
details updated
db m anager
CLASS DIAGRAM:
Class diagram is a collection of static elements such as classes and their relationships connected as a graph to each other.
db M anager
update the attendance detail()
Adm inistrator
enter rollno details()keep the attendance()update details()
Studentnam erollnoaddressbranchyearroom no
Sequence Diagram:
Sequence diagram shows an interaction arranged in a time sequence . it is an alternate way to understand the overall flow of the control of the system program.
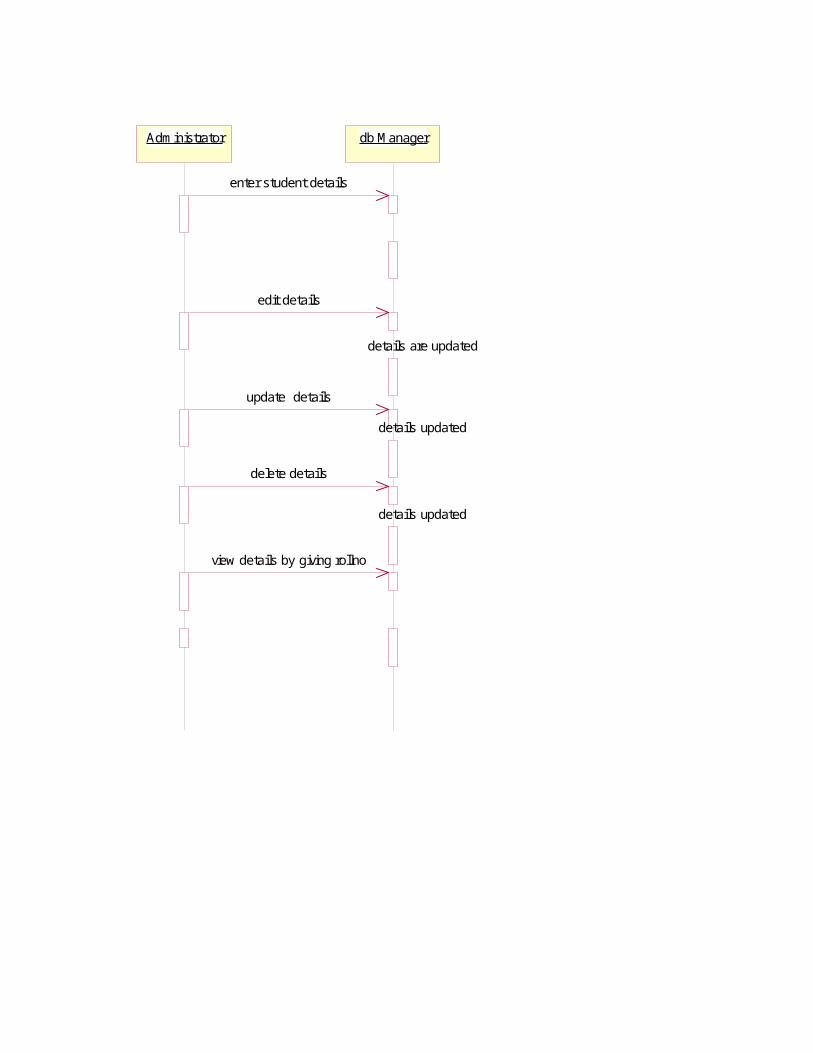
Adm inistrator db M anager
enter student details
edit details
details are updated
update details
details updated
delete details
details updated
view details by giving rollno
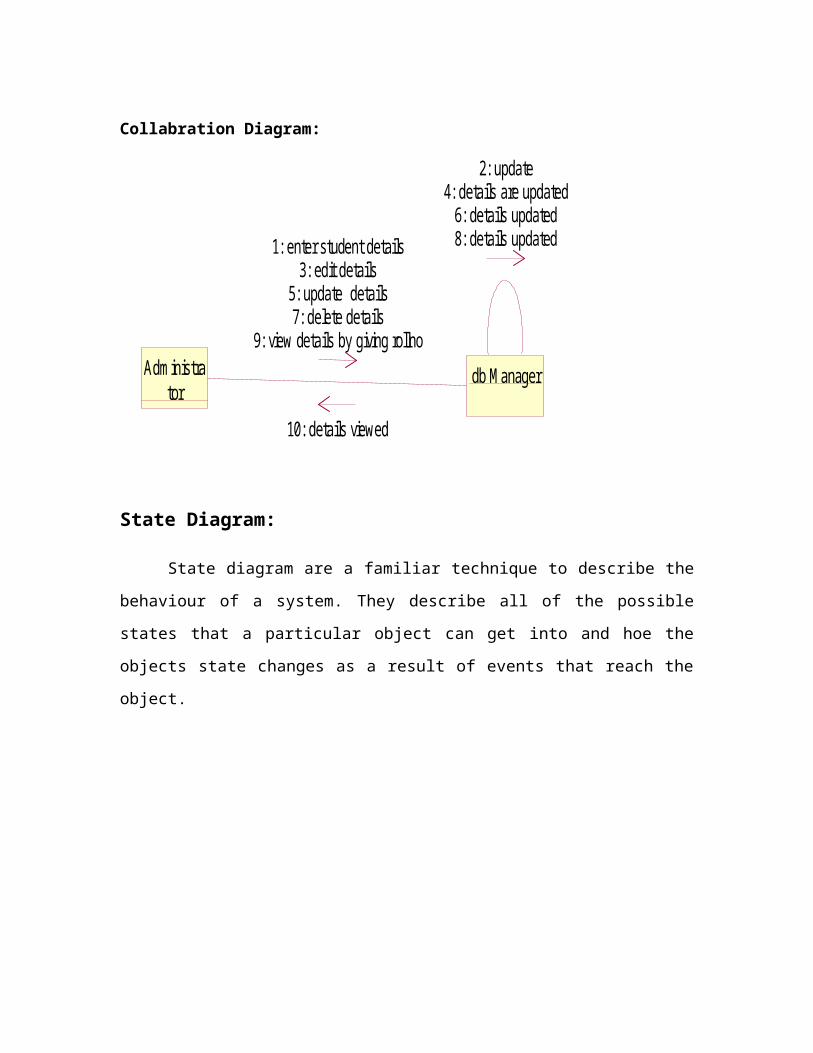
Collabration Diagram:
Adm inistrator
db M anager
2: update4: details are updated6: details updated8: details updated1: enter student details
3: edit details5: update details7: delete details
9: view details by giving rollno
10: details viewed
State Diagram:
State diagram are a familiar technique to describe the
behaviour of a system. They describe all of the possible
states that a particular object can get into and hoe the
objects state changes as a result of events that reach the
object.
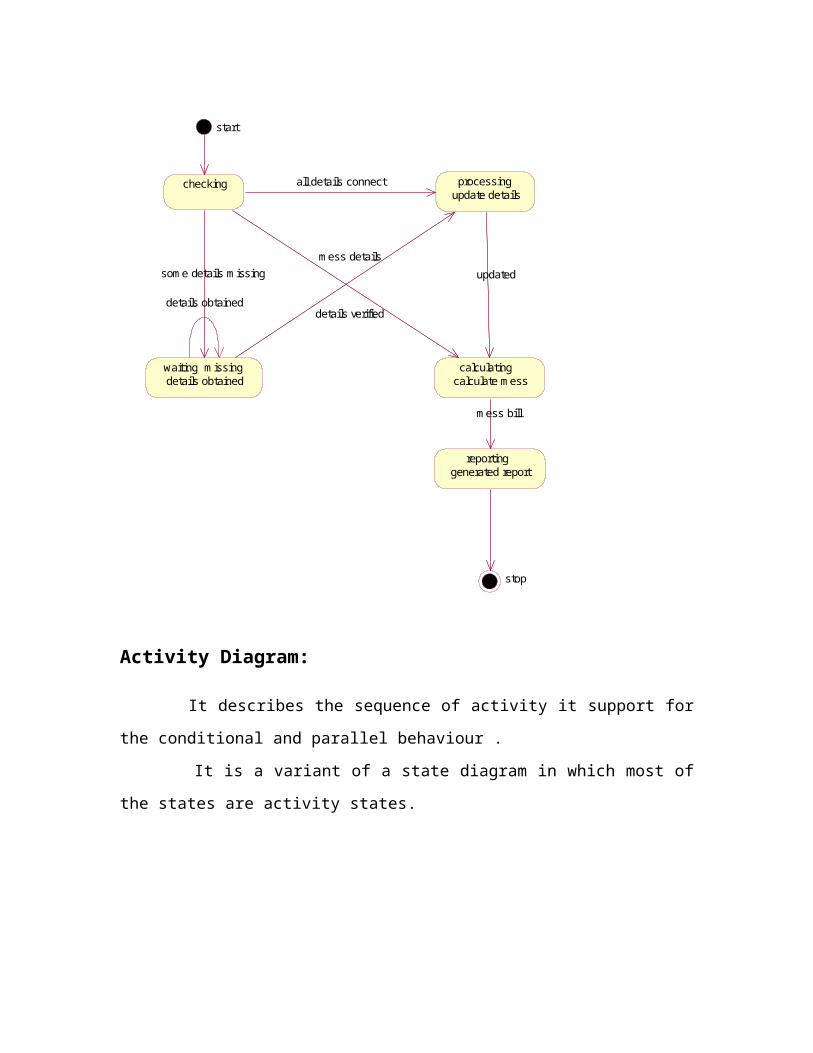
checking processing update details
waiting m issing details obtained
calculating calculate m ess
reporting generated report
all details connect
som e details m issingm ess details
details verified
updated
m ess bill
stop
start
details obtained
Activity Diagram:
It describes the sequence of activity it support for
the conditional and parallel behaviour .
It is a variant of a state diagram in which most of
the states are activity states.
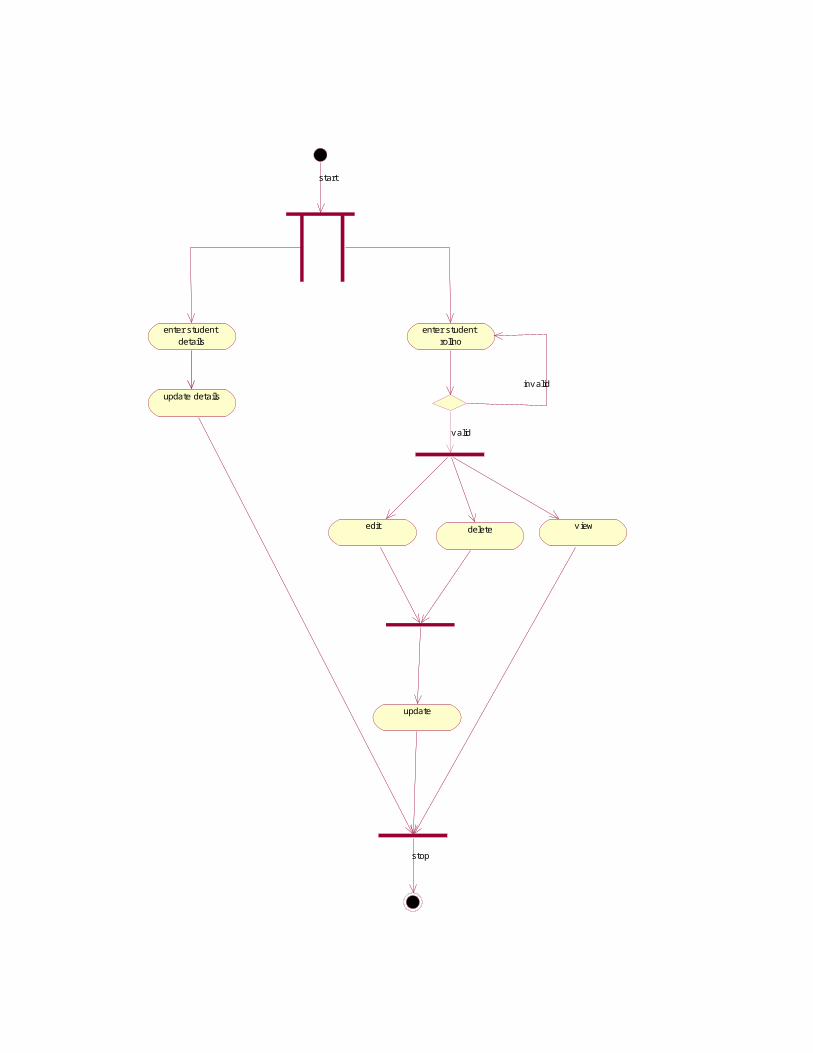
enter student details
enter student rollno
update detailsinvalid
edit delete view
update
start
valid
stop
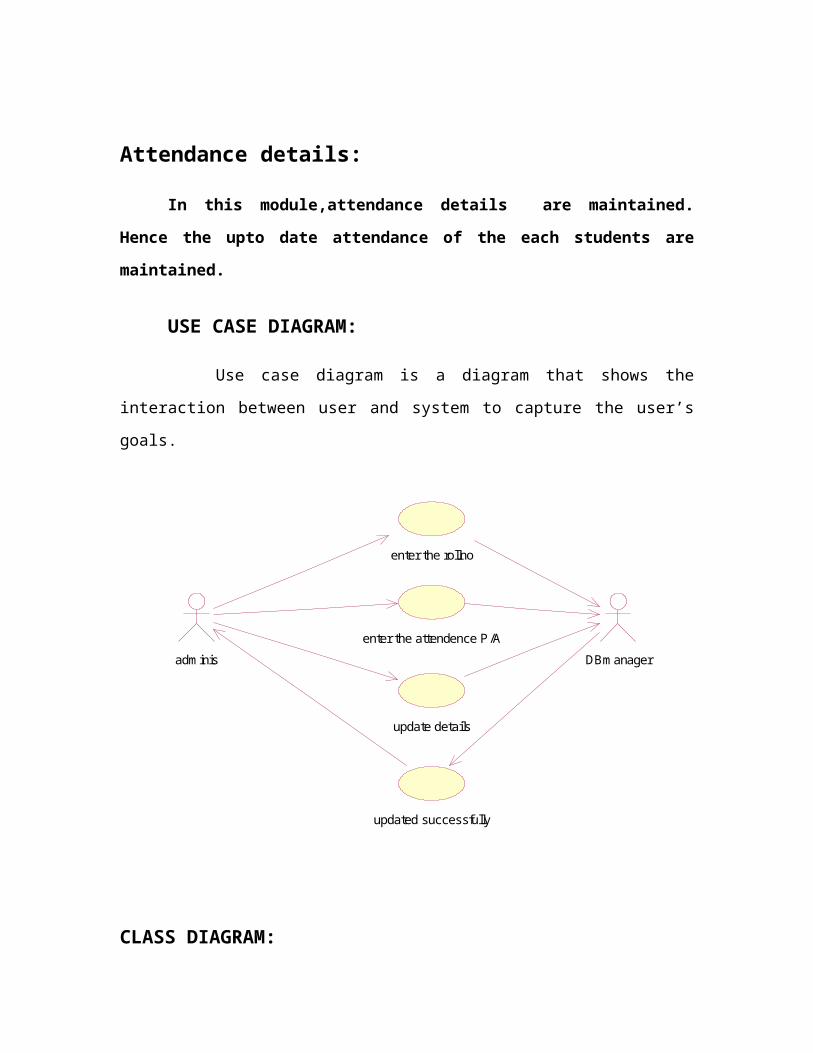
Attendance details:
In this module,attendance details are maintained.
Hence the upto date attendance of the each students are
maintained.
USE CASE DIAGRAM:
Use case diagram is a diagram that shows the
interaction between user and system to capture the user’s
goals.
adm inis
enter the rollno
enter the attendence P/A
update details
updated successfully
DBm anager
CLASS DIAGRAM:
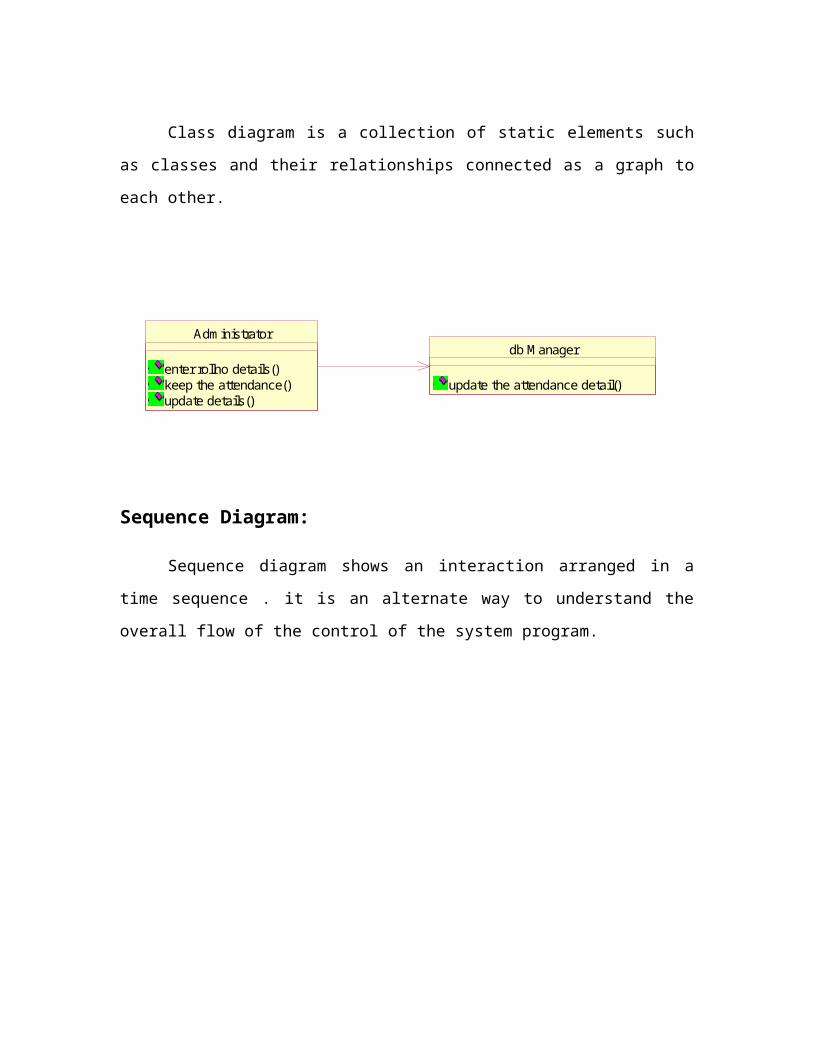
Class diagram is a collection of static elements such
as classes and their relationships connected as a graph to
each other.
db M anager
update the attendance detail()
Adm inistrator
enter rollno details()keep the attendance()update details()
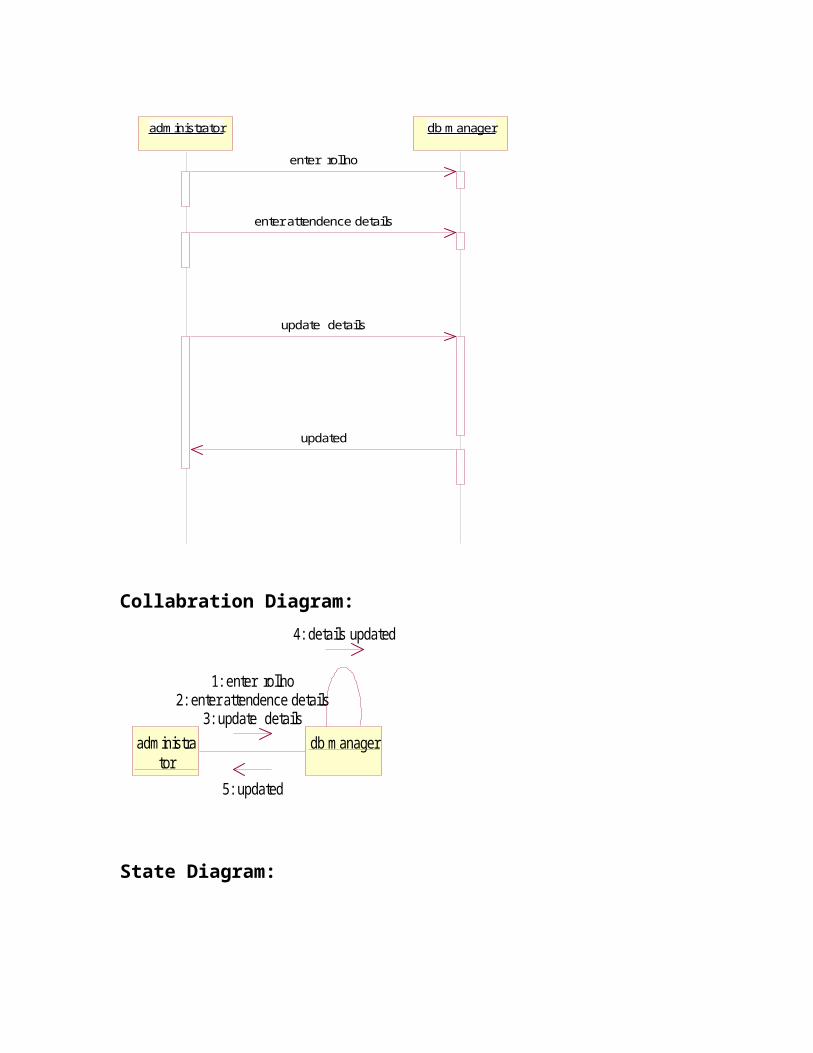
Sequence Diagram:
Sequence diagram shows an interaction arranged in a
time sequence . it is an alternate way to understand the
overall flow of the control of the system program.
adm inistrator db m anager
enter rollno
enter attendence details
update details
updated
Collabration Diagram:
adm inistrator
db m anager
1: enter rollno2: enter attendence details
3: update details
4: details updated
5: updated
State Diagram:
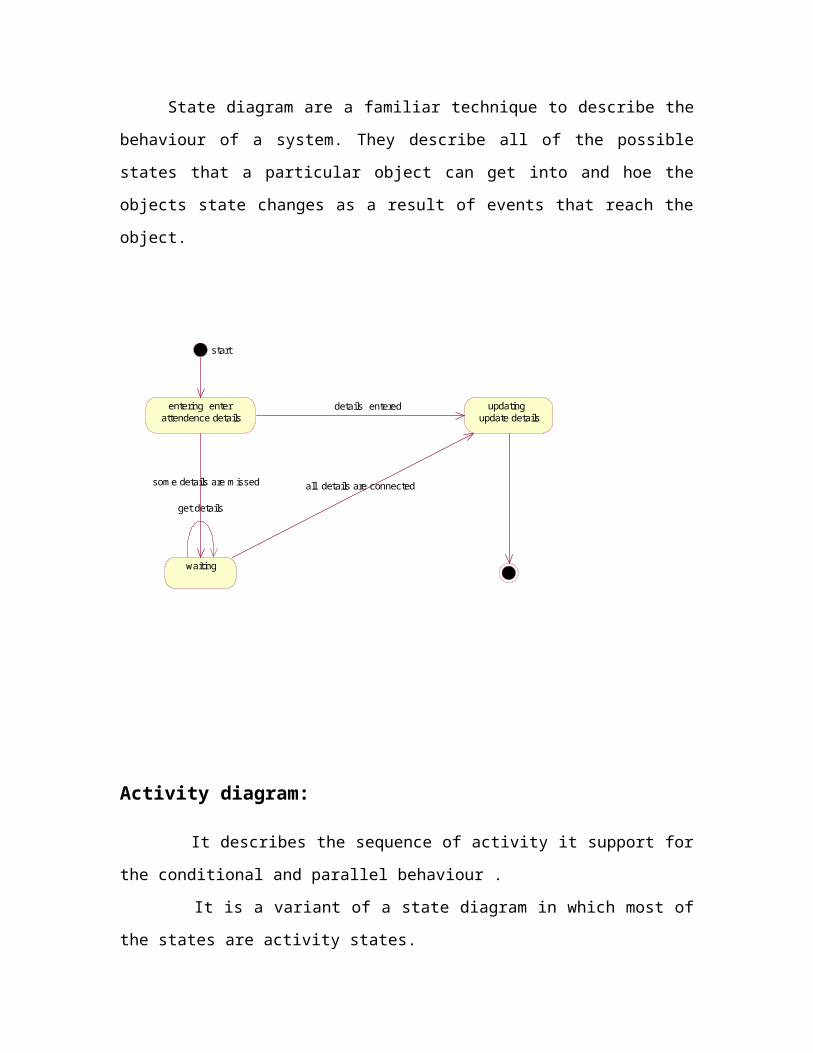
State diagram are a familiar technique to describe the
behaviour of a system. They describe all of the possible
states that a particular object can get into and hoe the
objects state changes as a result of events that reach the
object.
entering enter attendence details
updating update details
waiting
details entered
som e details are m issed
start
get details
all details are connected
Activity diagram:
It describes the sequence of activity it support for
the conditional and parallel behaviour .
It is a variant of a state diagram in which most of
the states are activity states.
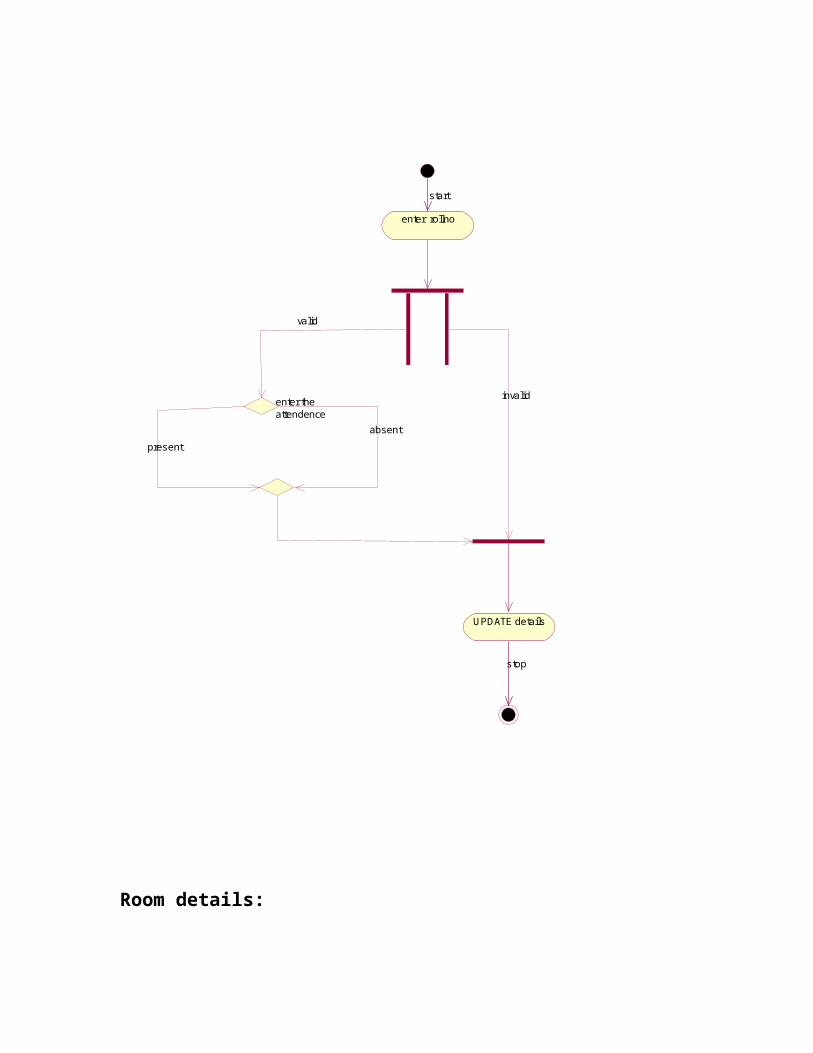
enter rollno
enter the attendence
UPDATE details
valid
stop
absentpresent
start
invalid
Room details:
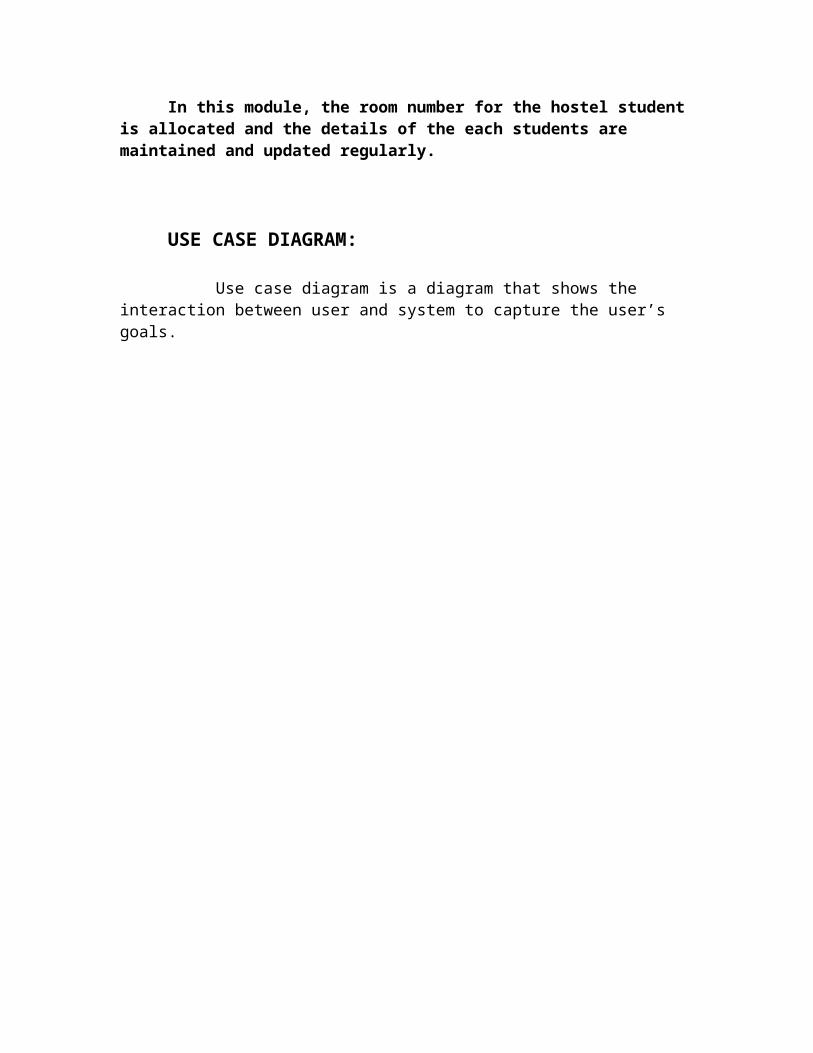
In this module, the room number for the hostel student is allocated and the details of the each students are maintained and updated regularly.
USE CASE DIAGRAM:
Use case diagram is a diagram that shows the interaction between user and system to capture the user’s goals.
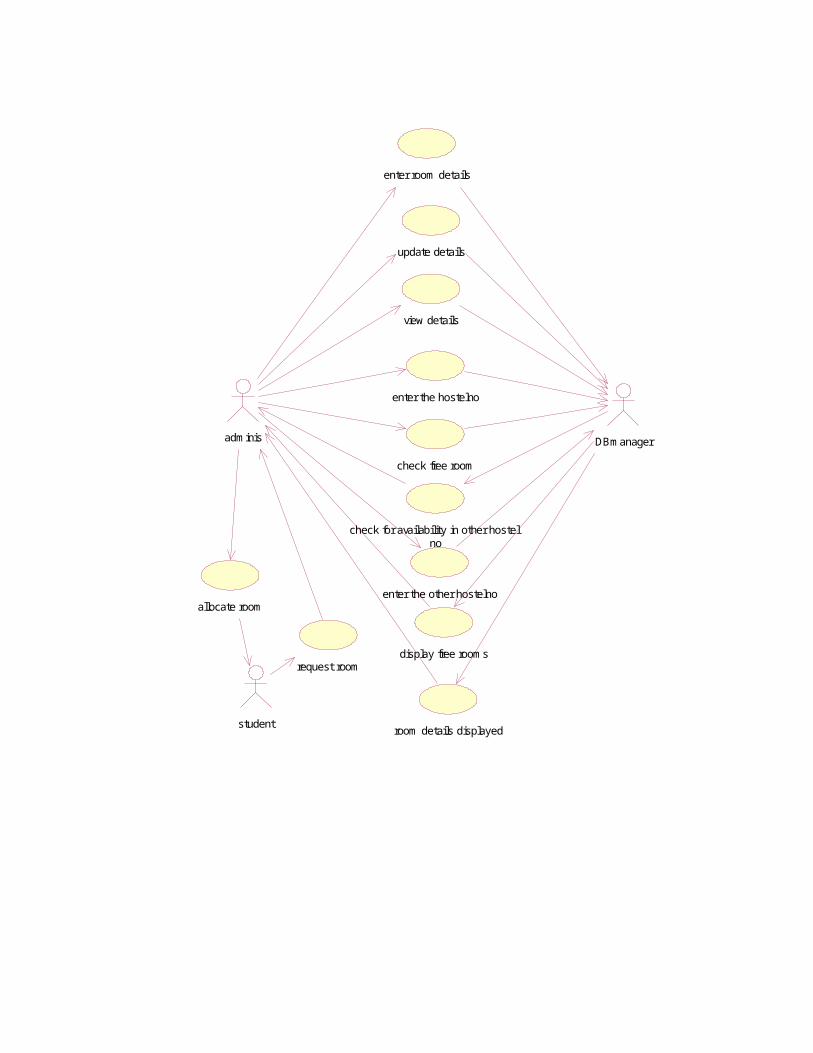
DBm anager
update details
view details
enter the hostelno
check free room
check for availability in other hostel no
enter the other hostelno
display free room s
room details displayed
enter room details
request room
adm inis
student
allocate room
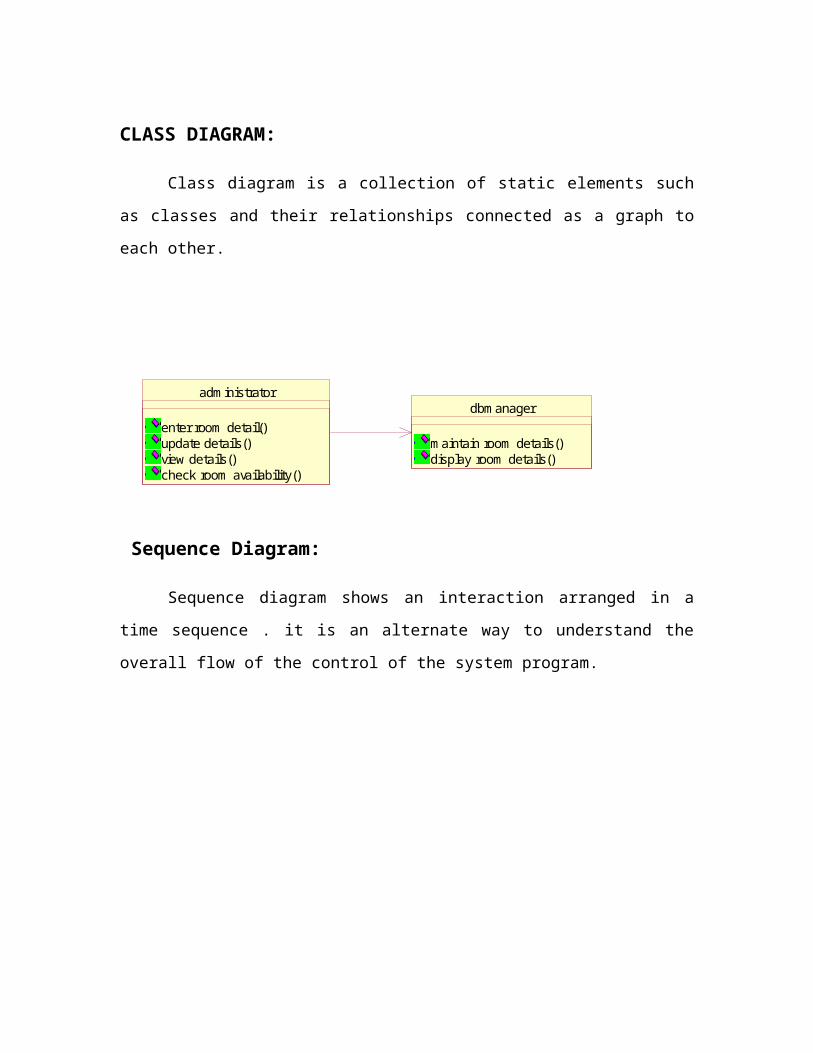
CLASS DIAGRAM:
Class diagram is a collection of static elements such
as classes and their relationships connected as a graph to
each other.
dbm anager
m aintain room details()display room details()
adm inistrator
enter room detail()update details()view details()check room availability()
Sequence Diagram:
Sequence diagram shows an interaction arranged in a
time sequence . it is an alternate way to understand the
overall flow of the control of the system program.
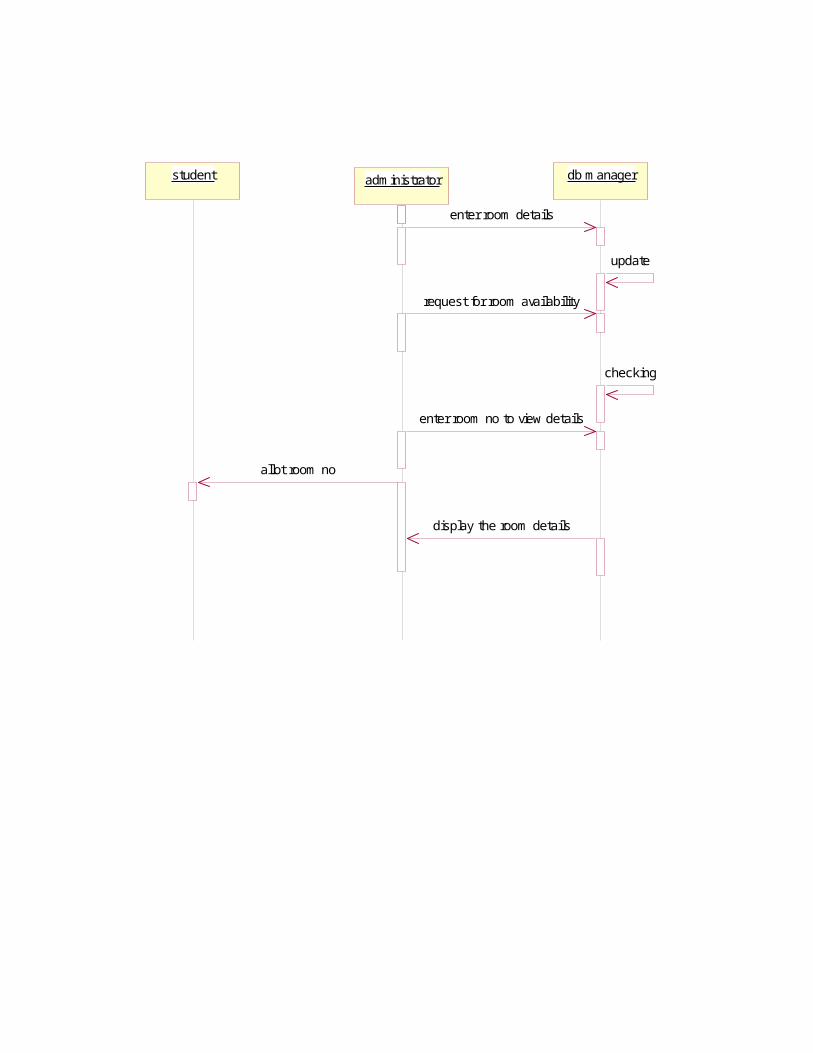
student adm inistrator db m anager
enter room details
update
request for room availability
checking
enter room no to view details
display the room details
allot room no
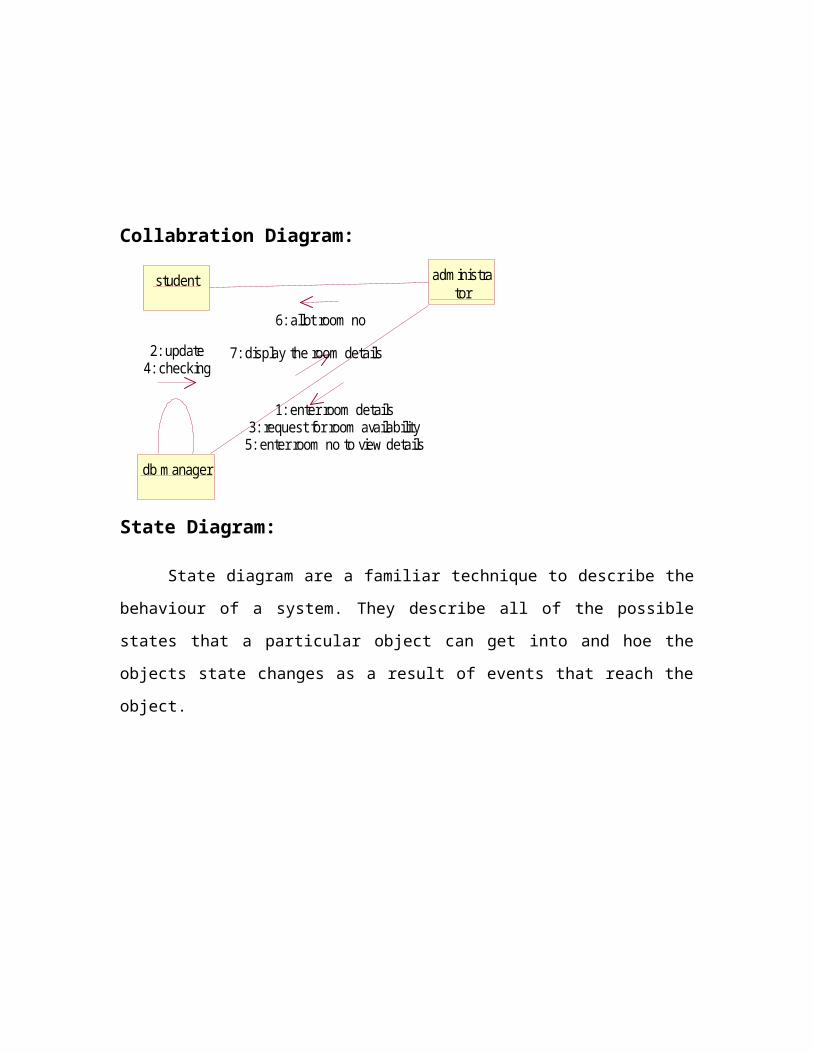
Collabration Diagram:
student adm inistrator
db m anager
1: enter room details
2: update
3: request for room availability
4: checking
5: enter room no to view details
6: allot room no
7: display the room details
State Diagram:
State diagram are a familiar technique to describe the
behaviour of a system. They describe all of the possible
states that a particular object can get into and hoe the
objects state changes as a result of events that reach the
object.
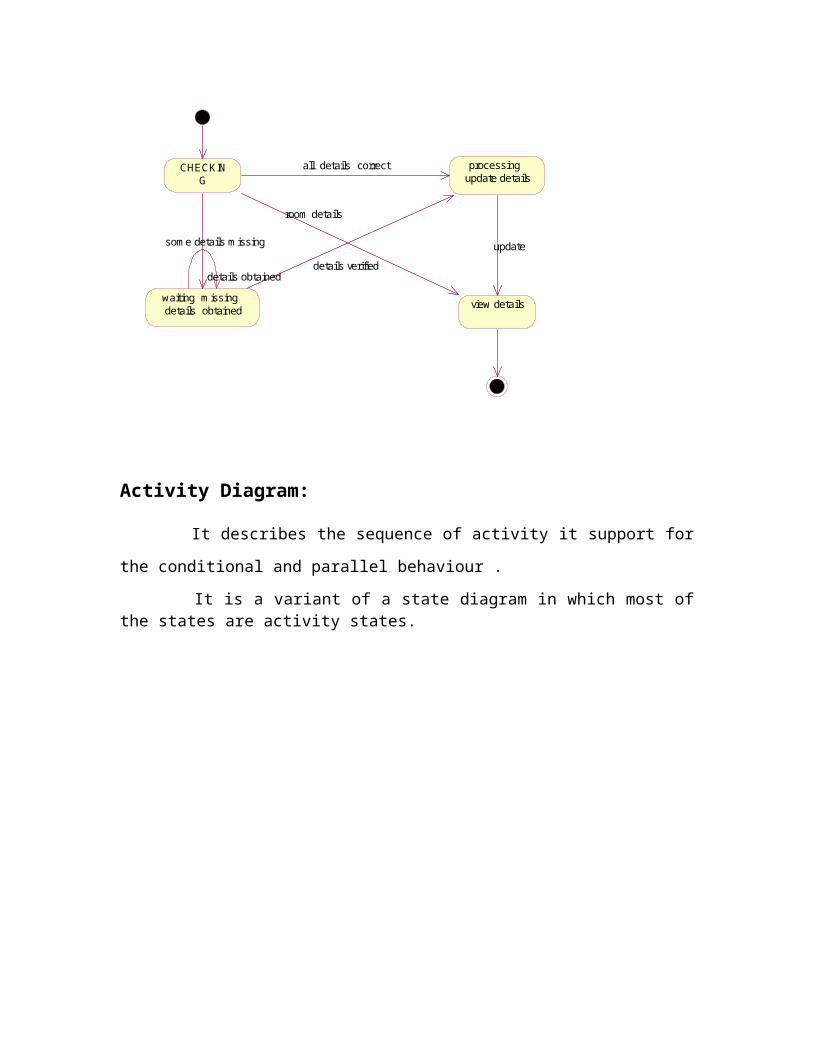
CHECKING
processing update details
waiting m issing details obtained view details
all details correct
som e details m issing update
room details
details verifieddetails obtained
Activity Diagram:
It describes the sequence of activity it support for
the conditional and parallel behaviour .
It is a variant of a state diagram in which most ofthe states are activity states.
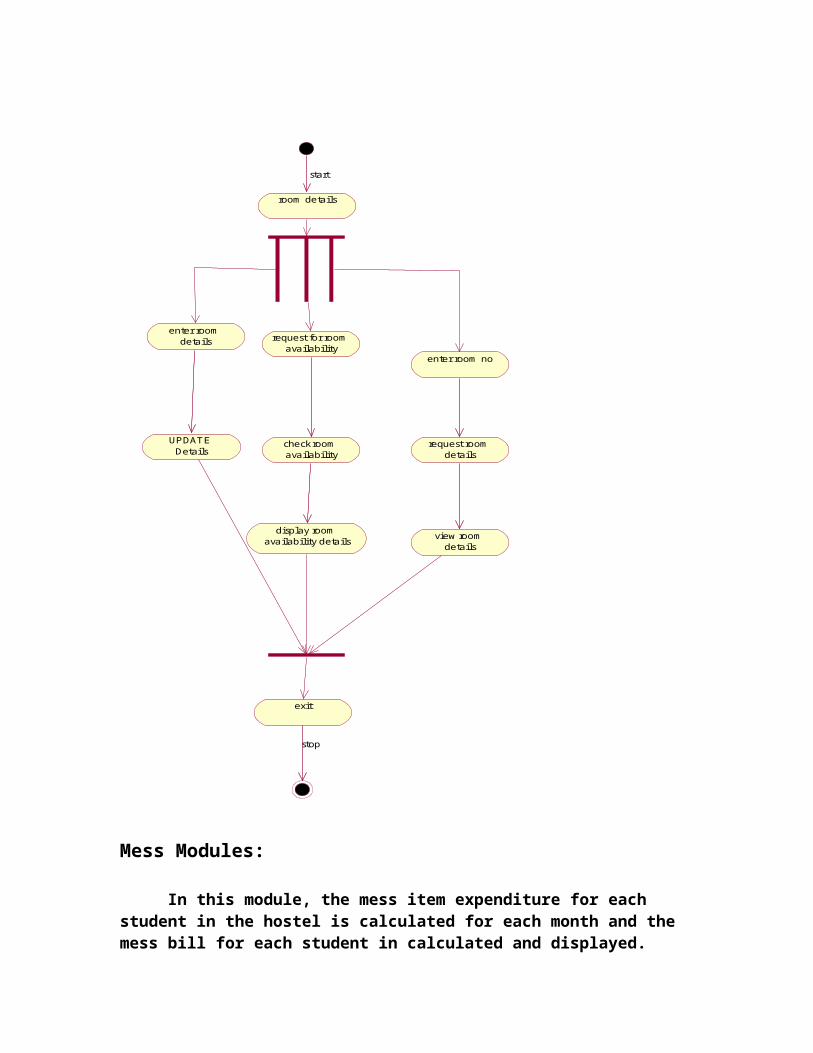
enter room details request for room
availabilityenter room no
UPDATE Details
check room availability
request room details
display room availability details view room
details
exit
stop
room details
start
Mess Modules:
In this module, the mess item expenditure for each student in the hostel is calculated for each month and the mess bill for each student in calculated and displayed.
USE CASE DIAGRAM:
Use case diagram is a diagram that shows the interaction between user and system to capture the user’s goals.
student
calculate m ess expenditure details per m onthacknowledgem ent for m essbill
display m ess bill report
m ess bill calculation
request for m essbill report
enter m ess expenditure
calculate expenditure for veg
calculate expenditure for non-veg
ADM INISTRATOR DBm anagercalculate m ess expenditure details
per day
CLASS DIAGRAM:
Class diagram is a collection of static elements such as classes and their relationships connected as a graph to each other.
STUDENT
pay m ess bill()
calculate
total m ess expenditure per day()total m ess expenditure per m onth()calculate m ess fees for each()calculate m ess expenditure for veg or nonveg()
ADm inistrator
enter m ess item expenditure per day()enter m ess item expenditure per m onth()calculate m ess expenditure()
report
generate m ess bill report()
DBM anager
calculate m ess item expenditure()
Sequence Diagram:
Sequence diagram shows an interaction arranged in a time sequence . it is an alternate way to understand the overall flow of the control of the system program.
student adm inistrator db m anager
enter m ess item & expenditure detail(veg,nonveg)
request for m ess fees calculation
calculate totalm ess expenditure(veg,nonveg)
calculate
m ess fees details
acknowlegem ent enter the paym ent details
publish
Collabration Diagram:
student adm inistrator
db m anager
1: enter m ess item & expenditure detail(veg,nonveg)
2: update3: calculate totalm ess expenditure(veg,nonveg)
4: request for m ess fees calculation
5: calculate
6: publish
7: m ess fees details
8: acknowlegem ent
9: enter the paym ent details
10: update
State Diagram:
State diagram are a familiar technique to describe the behaviour of a system. They describe all of the possible states that a particular object can get into and hoe the objects state changes as a result of events that reach the object.
Checking Processing Update details
W aiting m issing details obtained
Calculate calculate m ess expenditure
Report Generator report
get details
som e details m issing
details obtained
update
m ess bill
all details correct
m ess details
details verified
Activity Diagram: It describes the sequence of activity it support for the conditional and parallel behaviour . It is a variant of a state diagram in which most of the states are activity states.
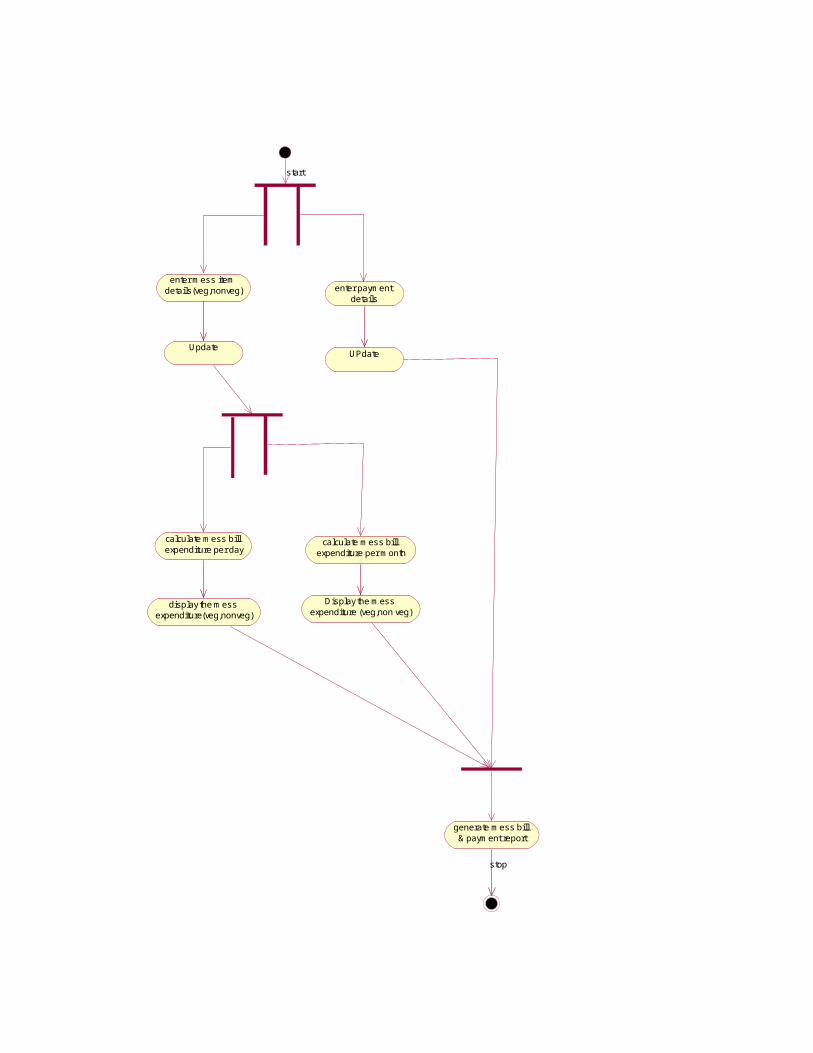
enter m ess item details(veg,nonveg) enter paym ent
details
Update UPdate
calculate m ess bill expenditure per day
calculate m ess bill expenditure per m onth
display the m ess expenditure(veg,nonveg)
Display the m ess expenditure (veg,non veg)
generate m ess bill & paym ent report
stop
start
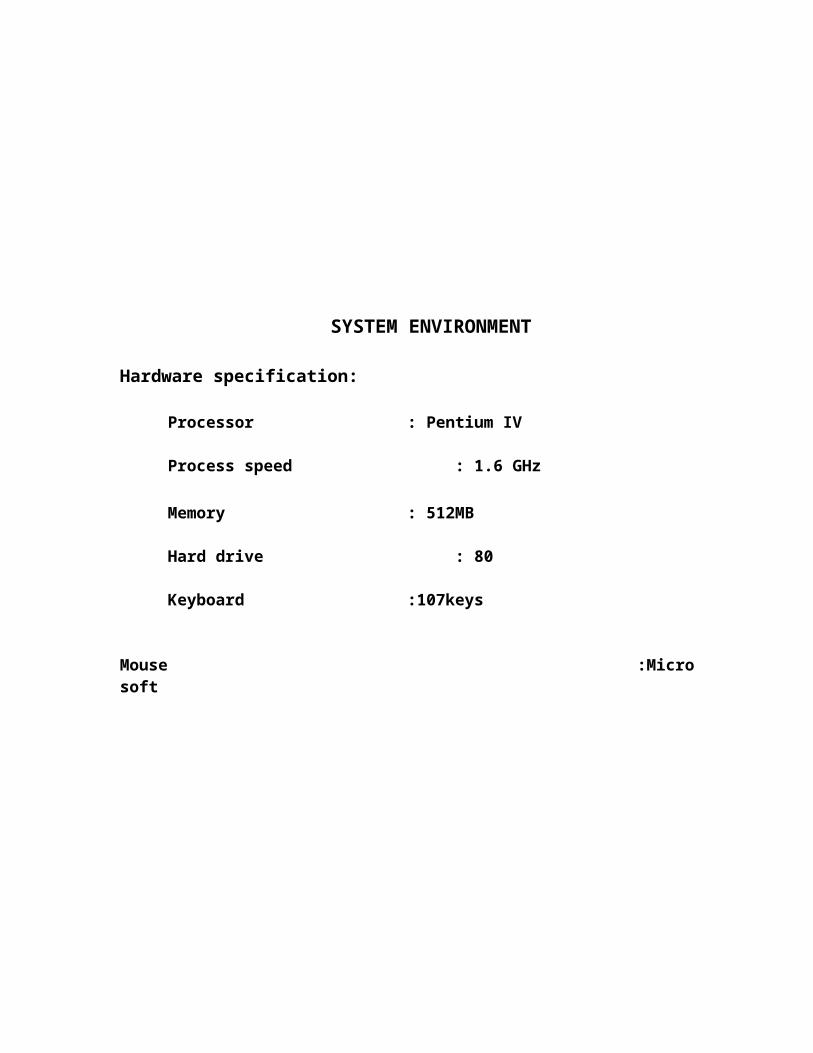
SYSTEM ENVIRONMENT
Hardware specification:
Processor : Pentium IV
Process speed : 1.6 GHz
Memory : 512MB
Hard drive : 80
Keyboard :107keys
Mouse :Microsoft
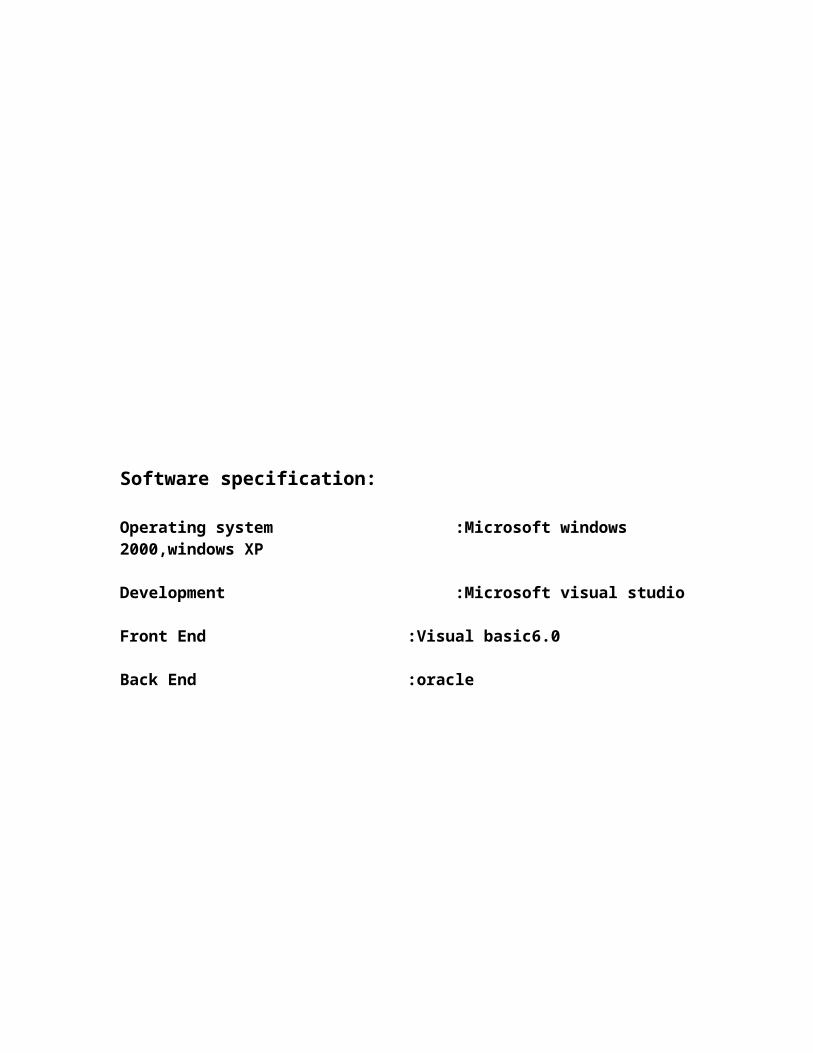
Software specification:
Operating system :Microsoft windows 2000,windows XP
Development :Microsoft visual studio
Front End :Visual basic6.0
Back End :oracle
PROBLEM DESCROPTION
The project HOSTEL MANAGEMENT SYSTEM has been developedto reduce manual effort and making things faster and efficient.
REQUIREMENT ANALYSIS
6.1.USE CASE DIAGRAM:

Use case diagram is a diagram that shows the interaction between user and system to capture the user’s goals.
CLASS DIAGRAM:
Class diagram is a collection of static elements such as classes and their relationships connected as a graph to each other.
DESIGN
7.1. Sequence Diagram:
Sequence diagram shows an interaction arranged in a time sequence . it is an alternate way to understand the overall flow of the control of the system program.
7.2. State Diagram:
State diagram are a familiar technique to describe the behaviour of a system. They describe all of the possible states that a particular object can get into and hoe the objects state changes as a result of events that reach the object.
7.3. ACTIVITY DIAGRAMS:
Related Documents