Hasil Penelitian Jurnal Teknologi Pertanian Semi Arida, Vol.1 Nomor 1 (2013) 83 The Effect of Elevation on Planting Calendar in West Timor Using Agricultural Rainfall Index (ARI) Methods Jonathan E.Koehuan 1 dan Juli Setyanto 2 1 Dept. of Agricultural Engineering UKAW Kupang-NTT Email : [email protected] 2 Lasiana Climatology Station – BMKG NTT Abstract Climate is one of the essential factors effecting agricultural production. Better understanding it potential and characteristic would pave the way to gain the optimal agricultural production. The variation of elevation effected rainfall that furthermore determined the dynamic of soil water availability and planting calendar. In dry land farming, the ultimate source of agriculture water is from the rainfall. It is understandable that to secure the farming process and/or to boost the production, the optimal use of climate resources is essential. The research with the aims to determine a planting calendar using Agricultural Rainfall Index (ARI) method and to determine the effect of elevation on planting calendar in West Timor has been conducted. The backbone of the study is by the analysis of climatology data that consists of rainfall, temperature and evapotranspiration data. The data based on the ten days series data of 20 consecutive years. The data was covered 16 climatology local stations that disperse in four districts namely Kupang, Timor Tengah Selatan (TTS), Timor Tengah Utara (TTU) and Belu. Total coverage rain fed areas is 14,635 Ha from total potential agricultural areas of 48,509 Ha. The planting calendar was determined using ARI Method while the identification of the relation regarding elevation and planting calendar was using statistical approached of regression and correlation. The results show that planting calendar has a variation from 130.25 – 190.25 days; furthermore there is a strong correlation between elevation and planting calendar that indicated in correlation coefficient of 0.81. Moreover, the research shows that with the increase of elevation there is an increase of planting calendar. The strong relation meet the polynomial function of Y = 13.54 – 0.04X + 9x10 -6 X 2 with the determination coefficient (R 2 ) of 0.820. Keywords: Planting Calendar, West Timor, Elevation, Agriculture Rainfall Index, Correlation, Polynomial function

Welcome message from author
This document is posted to help you gain knowledge. Please leave a comment to let me know what you think about it! Share it to your friends and learn new things together.
Transcript
Hasil Penelitian Jurnal Teknologi Pertanian Semi Arida, Vol.1 Nomor 1 (2013)
83
The Effect of Elevation on Planting Calendar in West Timor Using Agricultural Rainfall Index (ARI) Methods
Jonathan E.Koehuan1 dan Juli Setyanto2
1 Dept. of Agricultural Engineering UKAW Kupang-NTT
Email : [email protected] 2 Lasiana Climatology Station – BMKG NTT
Abstract
Climate is one of the essential factors effecting agricultural production. Better understanding it potential and characteristic would pave the way to gain the optimal agricultural production. The variation of elevation effected rainfall that furthermore determined the dynamic of soil water availability and planting calendar. In dry land farming, the ultimate source of agriculture water is from the rainfall. It is understandable that to secure the farming process and/or to boost the production, the optimal use of climate resources is essential. The research with the aims to determine a planting calendar using Agricultural Rainfall Index (ARI) method and to determine the effect of elevation on planting calendar in West Timor has been conducted. The backbone of the study is by the analysis of climatology data that consists of rainfall, temperature and evapotranspiration data. The data based on the ten days series data of 20 consecutive years. The data was covered 16 climatology local stations that disperse in four districts namely Kupang, Timor Tengah Selatan (TTS), Timor Tengah Utara (TTU) and Belu. Total coverage rain fed areas is 14,635 Ha from total potential agricultural areas of 48,509 Ha. The planting calendar was determined using ARI Method while the identification of the relation regarding elevation and planting calendar was using statistical approached of regression and correlation. The results show that planting calendar has a variation from 130.25 – 190.25 days; furthermore there is a strong correlation between elevation and planting calendar that indicated in correlation coefficient of 0.81. Moreover, the research shows that with the increase of elevation there is an increase of planting calendar. The strong relation meet the polynomial function of Y = 13.54 – 0.04X + 9x10-6 X2 with the determination coefficient (R2) of 0.820.
Keywords: Planting Calendar, West Timor, Elevation, Agriculture Rainfall Index, Correlation, Polynomial
function
Hasil Penelitian Jurnal Teknologi Pertanian Semi Arida, Vol.1 Nomor 1 (2013)
84
Introduction
Climate is one of the essential factors
effecting agricultural production process. Better
understanding it potential and characteristic
would pave the way to gain the optimal
agricultural production. Rainfall and
evapotranspiration are the main climate’s
component that effecting plant development
and production. Estiningsih and Gatot (2003),
stated that climate especially rainfall is the
main constraint factor in the development of dry
land farming in NTT Province. The amount of
rainfall basically is sufficient for the dry land
farming in NTT, however due to the disperse
distribution and high intensity in the short
period prone to cause a cropping failure.
The hypothesis is that there are the
difference among the initial and the amount of
rainfall every year in the difference altitude in
West Timor – NTT. These phenomena
explained that elevation is one of the prime
climate controls in tropical areas, the highest
the altitude, the rainfall is higher to the certainty
limit and then would decrease (Tadjang, 1992).
The variation of rainfall furthermore affected the
infiltration that would determine the dynamic of
soil water availability. The variation of soil water
availability determine the variation of planting
calendar, especially in the rain fed farming in
semiarid areas ( Stasiun Klimatologi Lasiana,
2000). In rain fed farming or dry land farming,
the ultimate source of agriculture water is from
the rainfall. It is understandable that to secure
the farming process and/or to boost the
production, the optimal use of climate
resources is essential.
Understanding the importance and
problems, this researched aimed are to
determine the planting calendar in West Timor
based on elevation and to understand the
relation among planting calendar with elevation
in West Timor.
Basically, climate is the variation
pattern of temperature, humidity, atmospheric
pressure, wind, precipitation, atmospheric
particle count and other meteorological
variables in a given region over long periods.
The important climate component for the
agricultural process according to Soepriyo,
(1993) including rainfall, evapotranspiration,
temperature, soil temperature, sunshine
radiation, wind velocity, and air humidity.
Furthermore, climate components that are
affected in planting calendar include rainfall,
temperature, and evapotranspiration.
Supangat (1990), underline that rainfall
is a common form of precipitation in tropical
areas. Temperature is the degree of heat and
cold of various gasses in atmosphere. The
temperature various form place to place
depend on factors such as sun radiation, land
and sea dispersion, elevation, wind and
geographic location. Manan et al (1980) stated
that evaportranspiration is a combination of
evaporation and transpiration. So, the
evapotranspiration is the amount of water that
evaporates from soils, water bodies, and living
Hasil Penelitian Jurnal Teknologi Pertanian Semi Arida, Vol.1 Nomor 1 (2013)
85
organisms. Furthermore, the potential
evapotranspiration is determined by
temperature, wind, humidity, and sunshine
radiation.
Elevation is a one of the climate
controlling factors in tropical areas, mainly to
rainfall and temperature ( Tadjang, 1992). The
highest the elevations tend to increase rainfall
to the certain limit the rainfall would decrease.
Sosodarsono and Tekeda (1997) stated that
rainfall in mountain areas more than in plain
areas with the linear relationship. Manan et all
(1980) underline that the highest the elevation
the lower the temperature.
Planting calendar is a timescale in
which soil moisture support the development of
corps. Soil water balance in the dry land mostly
depends on rainfall as an input and
evapotranspiration as an output from soil and
crops. In order to reduce the water stress
during the growing period, it is important to
determine the timescale in which the rainfall
filling up soil moisture that can be sufficient for
the crops growth and harvesting.
Agricultural rainfall index is a
parameter to determine the availability of soil
moisture for the crops growth (FAO, 1984).
During the dry season, mostly in West Timor
the soil moisture become dramatically
decrease due to lack of rainfall, on the other
hand the evapotranspiration become high that
can accelerate the permanent wilting point.
Growing season in dry land can be
implemented after the soil obtains the supply
form the optimal rainfall so it can be in field
capacity. The rainfall that can supply the water
availability is known as effective rainfall. The
effective rainfall furthermore is statistically a
80% of the rainfall. Soil water availability in the
dry land can be estimated using Agricultural
Rainfall Index (ARI) method. Planting calendar
can be determined based on the index between
0 – 1, where the suitable soil water condition
for crop growth is above 1. In Indonesia the
seasonal period is from September to August in
a year period.
Methods
The population is West Timor dry land
areas from the elevation of 5 MSL to 1,129
MSL in which it sampling by the purposive
sampling technique. There are 16 climatology
observation posts that disperse in four districts
namely Kupang, Timor Tengah Selatan, Timor
Tengah Utara and Belu with four degree of
elevation. The elevation and observation posts
are:
1. 0 – 300 MSL consists of four posts that
are Naikliu (5 MSL) ; Lasiana (20
MSL); Panite (44 MSL) and Betun (53
MSL).
2. 301 – 600 MSL consists of four posts
of Nenuk ( 365 MSL); Kefamenanu (
381 MSL); Oekabiti (415 MSL) and
Oe’ekam (537 MSL).
Hasil Penelitian Jurnal Teknologi Pertanian Semi Arida, Vol.1 Nomor 1 (2013)
86
3. 601 – 900 MSL consists of four posts
of So’e (742 MSL); Niki-niki (793 MSL);
Lelogama (872 MSL) and Kesetnana
(882 MSL).
4. 901 – 1,200 MSL consists of Nulle
(919 MSL); Oelbubuk ( 1007 MSL);
Netpala (1010 MSL) and Eban (1129
MSL).
Agricultural Rainfall Index (ARI) is
calculating using the formula of:
ARI = P / ETo ........................... (1)
Where:
ARI = Agricultural Rainfall Index P = Rainfall (mm) ETo = Potential Evapotranspiration (mm)
Furthermore the potential
evapotranspiration is calculating using the
formula:
ETo = Eo x Kp …………………………… (2)
Where:
ETo = Potential evapotranspiration (mm) Eo = Potential evaporation (mm) Kp = Pan evaporation coefficient
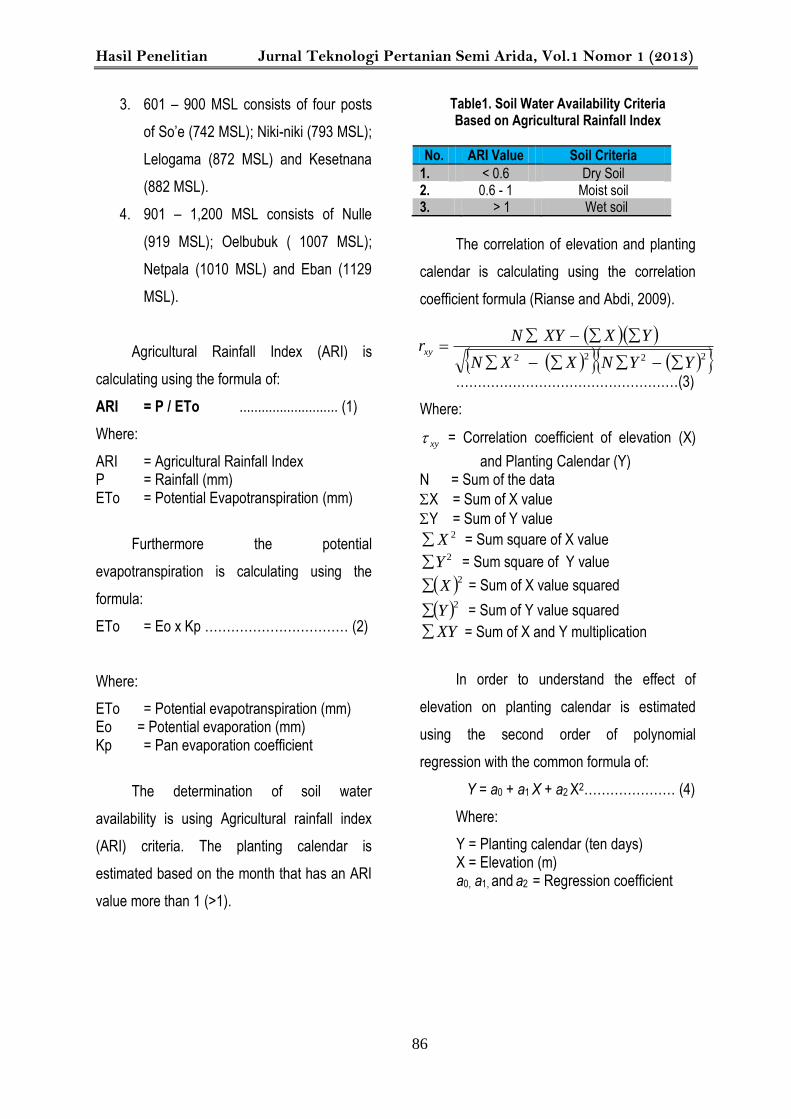
The determination of soil water
availability is using Agricultural rainfall index
(ARI) criteria. The planting calendar is
estimated based on the month that has an ARI
value more than 1 (>1).
Table1. Soil Water Availability Criteria Based on Agricultural Rainfall Index
No. ARI Value Soil Criteria
1. < 0.6 Dry Soil 2. 0.6 - 1 Moist soil 3. > 1 Wet soil
The correlation of elevation and planting
calendar is calculating using the correlation
coefficient formula (Rianse and Abdi, 2009).
……………………………………………(3)
Where:
xy = Correlation coefficient of elevation (X)
and Planting Calendar (Y) N = Sum of the data
X = Sum of X value
Y = Sum of Y value 2X = Sum square of X value
2Y = Sum square of Y value
2X = Sum of X value squared
2Y = Sum of Y value squared
XY = Sum of X and Y multiplication
In order to understand the effect of
elevation on planting calendar is estimated
using the second order of polynomial
regression with the common formula of:
Y = a0 + a1 X + a2 X2………………… (4)
Where:
Y = Planting calendar (ten days) X = Elevation (m) a0, a1, and a2 = Regression coefficient
2222 YYNXXN
YXXYNrxy
Hasil Penelitian Jurnal Teknologi Pertanian Semi Arida, Vol.1 Nomor 1 (2013)
87
Result and Discussion
Geographically West Timor is located
in 1230 27’ 40” – 1250 11’ 59” East Longitude
and 080 56’ 17” – 100 21’ 56” South Latitude.
According to BPS NTT (2009), West Timor has
a potential dry land area of 30% or 14,635 Ha
from total potential agricultural land of 48,509
Ha. The topography in the area is variety from
plain, hilly and mountainous areas. The plain
area is utilized as farm land in Kupang, TTU
and Belu districts. Hilly and mountainous areas
are utilized as plantation that mainly in TTS
district.
As a semi arid region, West Timor has
two seasons yearly that are rain and dry
seasons. Rain season occur in November to
February due to the Asian monsoon that carry
steam from Asia. On the other hand, dry
season occur during Mei to August due to the
dry monsoon from Australia. There are also
transition periods on September to October and
March to April.
Rainfall
Average ten days rainfall in 20 years of
elevation 0-300 MSL between 33 mm to 45
mm, with minimal 0 mm and maximum of 168
mm. The average rainfall in Naikliu (5 MSL) is
36 mm with the maximum of 124 mm. The
average rainfall in Lasiana (20 MSL) is 45 mm
with the maximum of 168 mm. The average
rainfall in Panite (44 MSL) is 33 mm with the
maximum of 80 mm, and the average in Betun
(53 MSL) is 38 mm with the maximum of 131
mm.
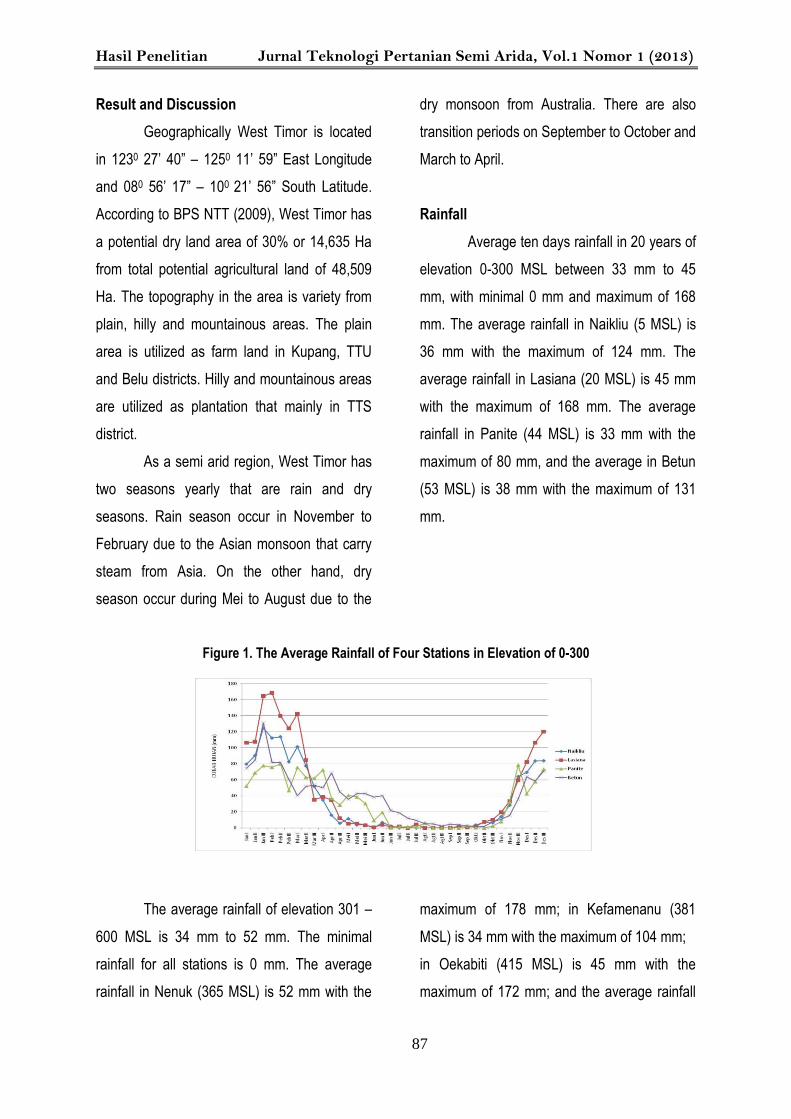
Figure 1. The Average Rainfall of Four Stations in Elevation of 0-300
The average rainfall of elevation 301 –
600 MSL is 34 mm to 52 mm. The minimal
rainfall for all stations is 0 mm. The average
rainfall in Nenuk (365 MSL) is 52 mm with the
maximum of 178 mm; in Kefamenanu (381
MSL) is 34 mm with the maximum of 104 mm;
in Oekabiti (415 MSL) is 45 mm with the
maximum of 172 mm; and the average rainfall
Hasil Penelitian Jurnal Teknologi Pertanian Semi Arida, Vol.1 Nomor 1 (2013)
88
in Oe’ekam (537 MSL) is 37 mm with the maximum of 105 mm.
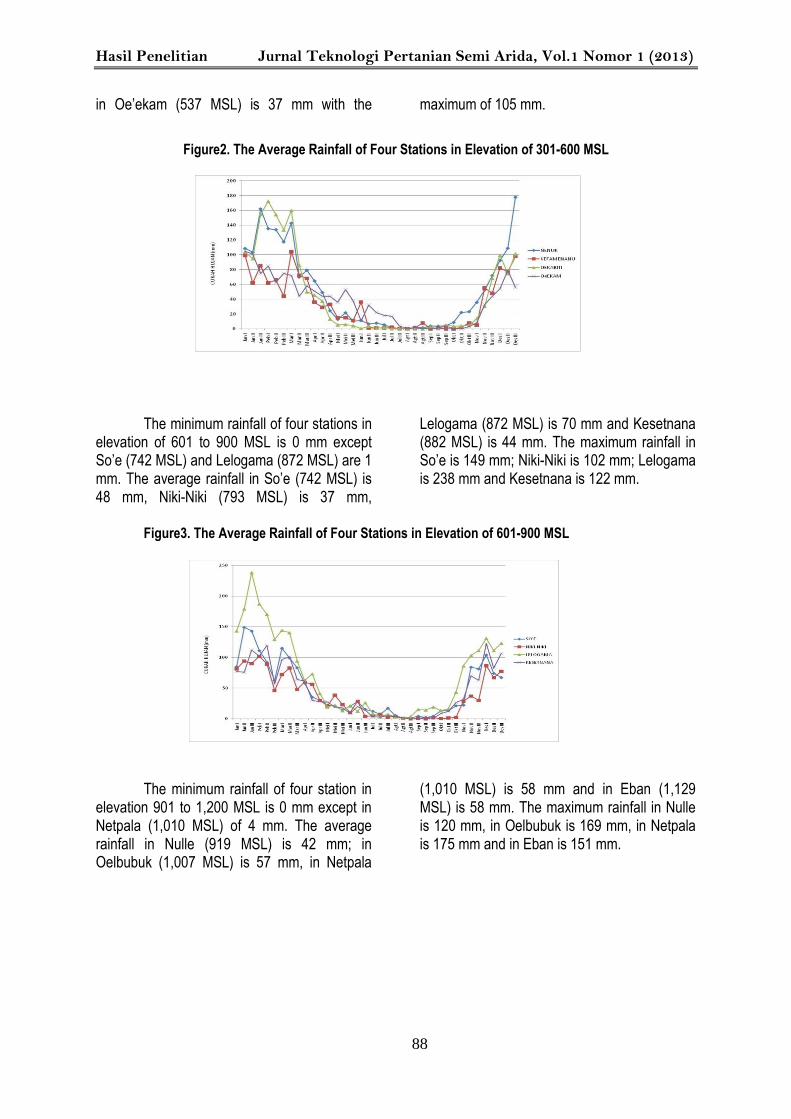
Figure2. The Average Rainfall of Four Stations in Elevation of 301-600 MSL
The minimum rainfall of four stations in elevation of 601 to 900 MSL is 0 mm except So’e (742 MSL) and Lelogama (872 MSL) are 1 mm. The average rainfall in So’e (742 MSL) is 48 mm, Niki-Niki (793 MSL) is 37 mm,
Lelogama (872 MSL) is 70 mm and Kesetnana (882 MSL) is 44 mm. The maximum rainfall in So’e is 149 mm; Niki-Niki is 102 mm; Lelogama is 238 mm and Kesetnana is 122 mm.
Figure3. The Average Rainfall of Four Stations in Elevation of 601-900 MSL
The minimum rainfall of four station in elevation 901 to 1,200 MSL is 0 mm except in Netpala (1,010 MSL) of 4 mm. The average rainfall in Nulle (919 MSL) is 42 mm; in Oelbubuk (1,007 MSL) is 57 mm, in Netpala
(1,010 MSL) is 58 mm and in Eban (1,129 MSL) is 58 mm. The maximum rainfall in Nulle is 120 mm, in Oelbubuk is 169 mm, in Netpala is 175 mm and in Eban is 151 mm.
Hasil Penelitian Jurnal Teknologi Pertanian Semi Arida, Vol.1 Nomor 1 (2013)
89
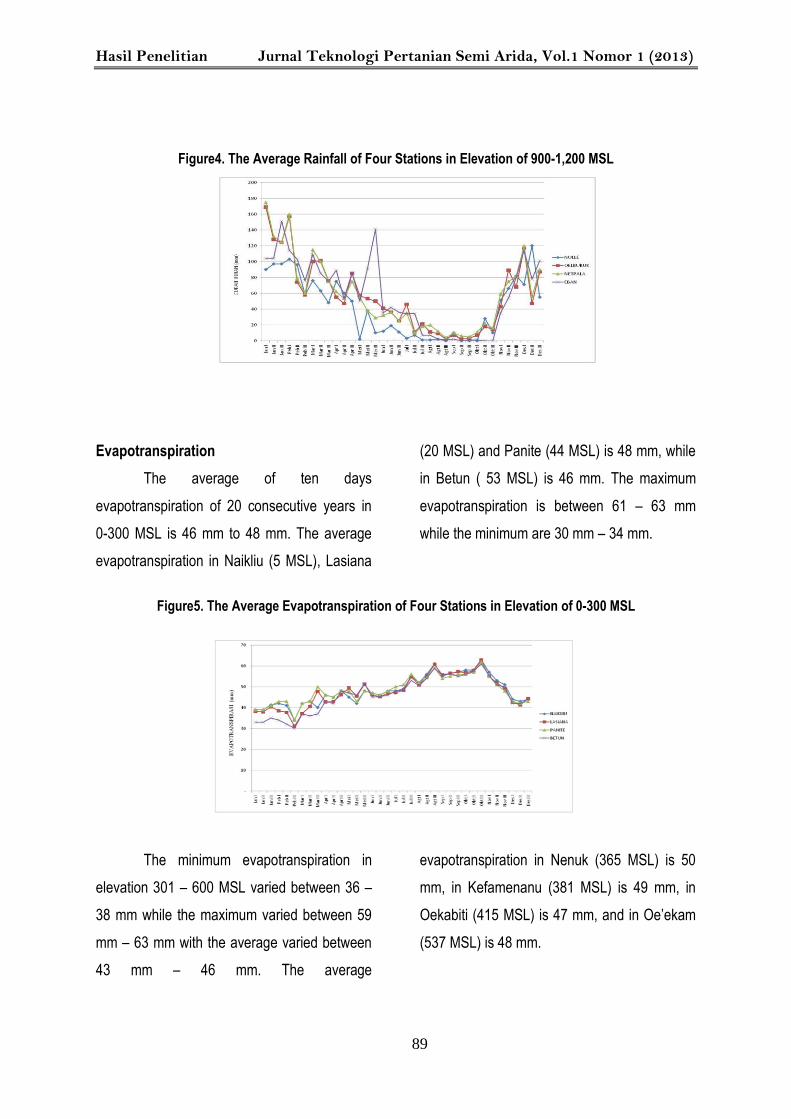
Figure4. The Average Rainfall of Four Stations in Elevation of 900-1,200 MSL
Evapotranspiration
The average of ten days
evapotranspiration of 20 consecutive years in
0-300 MSL is 46 mm to 48 mm. The average
evapotranspiration in Naikliu (5 MSL), Lasiana
(20 MSL) and Panite (44 MSL) is 48 mm, while
in Betun ( 53 MSL) is 46 mm. The maximum
evapotranspiration is between 61 – 63 mm
while the minimum are 30 mm – 34 mm.
Figure5. The Average Evapotranspiration of Four Stations in Elevation of 0-300 MSL
The minimum evapotranspiration in
elevation 301 – 600 MSL varied between 36 –
38 mm while the maximum varied between 59
mm – 63 mm with the average varied between
43 mm – 46 mm. The average
evapotranspiration in Nenuk (365 MSL) is 50
mm, in Kefamenanu (381 MSL) is 49 mm, in
Oekabiti (415 MSL) is 47 mm, and in Oe’ekam
(537 MSL) is 48 mm.
Hasil Penelitian Jurnal Teknologi Pertanian Semi Arida, Vol.1 Nomor 1 (2013)
90
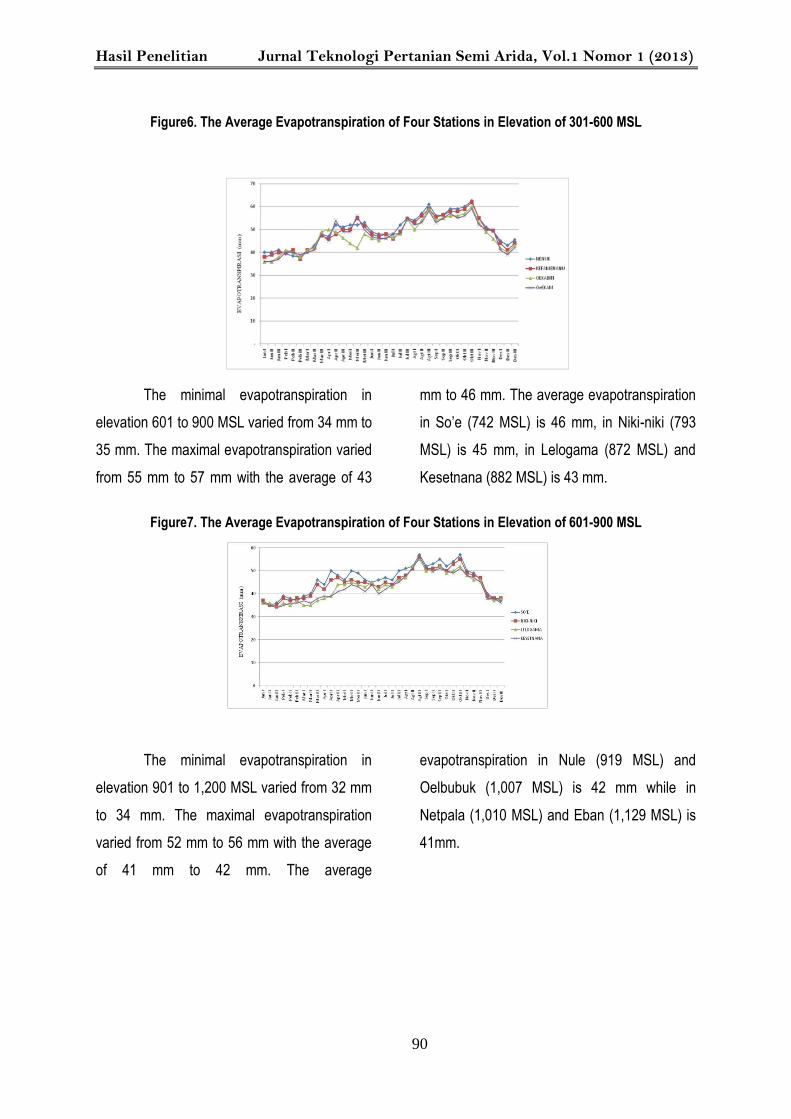
Figure6. The Average Evapotranspiration of Four Stations in Elevation of 301-600 MSL
The minimal evapotranspiration in
elevation 601 to 900 MSL varied from 34 mm to
35 mm. The maximal evapotranspiration varied
from 55 mm to 57 mm with the average of 43
mm to 46 mm. The average evapotranspiration
in So’e (742 MSL) is 46 mm, in Niki-niki (793
MSL) is 45 mm, in Lelogama (872 MSL) and
Kesetnana (882 MSL) is 43 mm.
Figure7. The Average Evapotranspiration of Four Stations in Elevation of 601-900 MSL
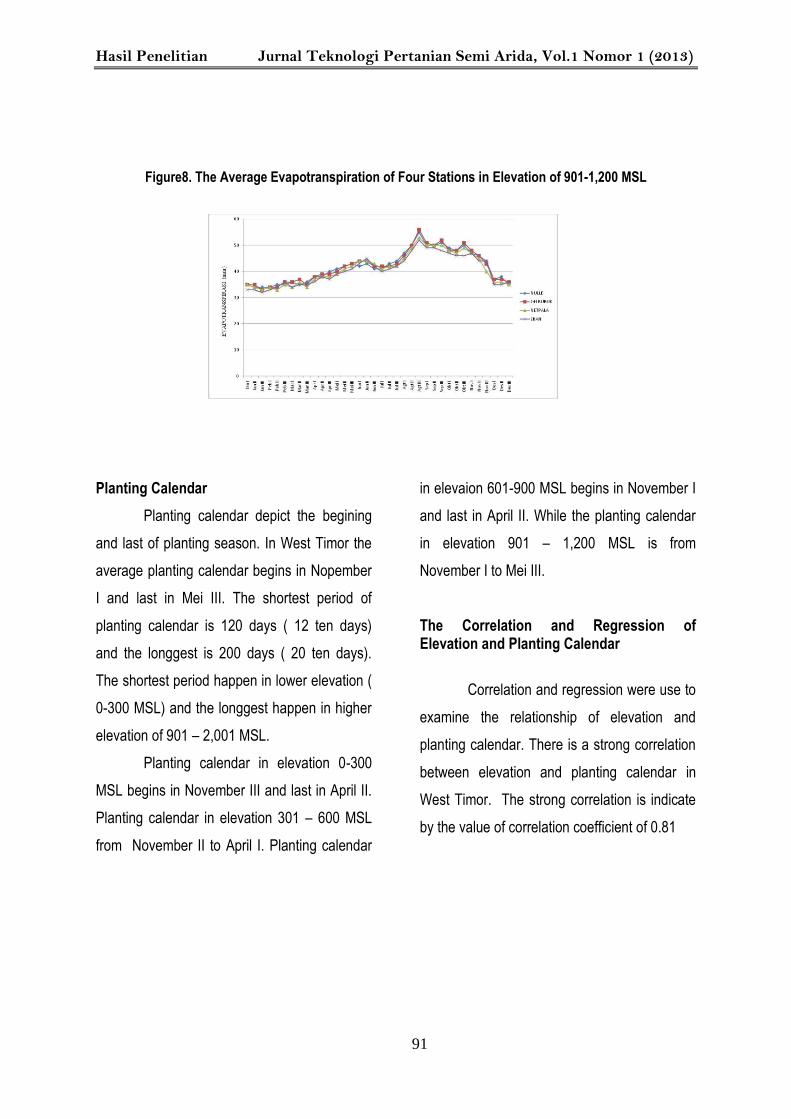
The minimal evapotranspiration in
elevation 901 to 1,200 MSL varied from 32 mm
to 34 mm. The maximal evapotranspiration
varied from 52 mm to 56 mm with the average
of 41 mm to 42 mm. The average
evapotranspiration in Nule (919 MSL) and
Oelbubuk (1,007 MSL) is 42 mm while in
Netpala (1,010 MSL) and Eban (1,129 MSL) is
41mm.
Hasil Penelitian Jurnal Teknologi Pertanian Semi Arida, Vol.1 Nomor 1 (2013)
91
Figure8. The Average Evapotranspiration of Four Stations in Elevation of 901-1,200 MSL
Planting Calendar
Planting calendar depict the begining
and last of planting season. In West Timor the
average planting calendar begins in Nopember
I and last in Mei III. The shortest period of
planting calendar is 120 days ( 12 ten days)
and the longgest is 200 days ( 20 ten days).
The shortest period happen in lower elevation (
0-300 MSL) and the longgest happen in higher
elevation of 901 – 2,001 MSL.
Planting calendar in elevation 0-300
MSL begins in November III and last in April II.
Planting calendar in elevation 301 – 600 MSL
from November II to April I. Planting calendar
in elevaion 601-900 MSL begins in November I
and last in April II. While the planting calendar
in elevation 901 – 1,200 MSL is from
November I to Mei III.
The Correlation and Regression of Elevation and Planting Calendar
Correlation and regression were use to
examine the relationship of elevation and
planting calendar. There is a strong correlation
between elevation and planting calendar in
West Timor. The strong correlation is indicate
by the value of correlation coefficient of 0.81
Hasil Penelitian Jurnal Teknologi Pertanian Semi Arida, Vol.1 Nomor 1 (2013)
92
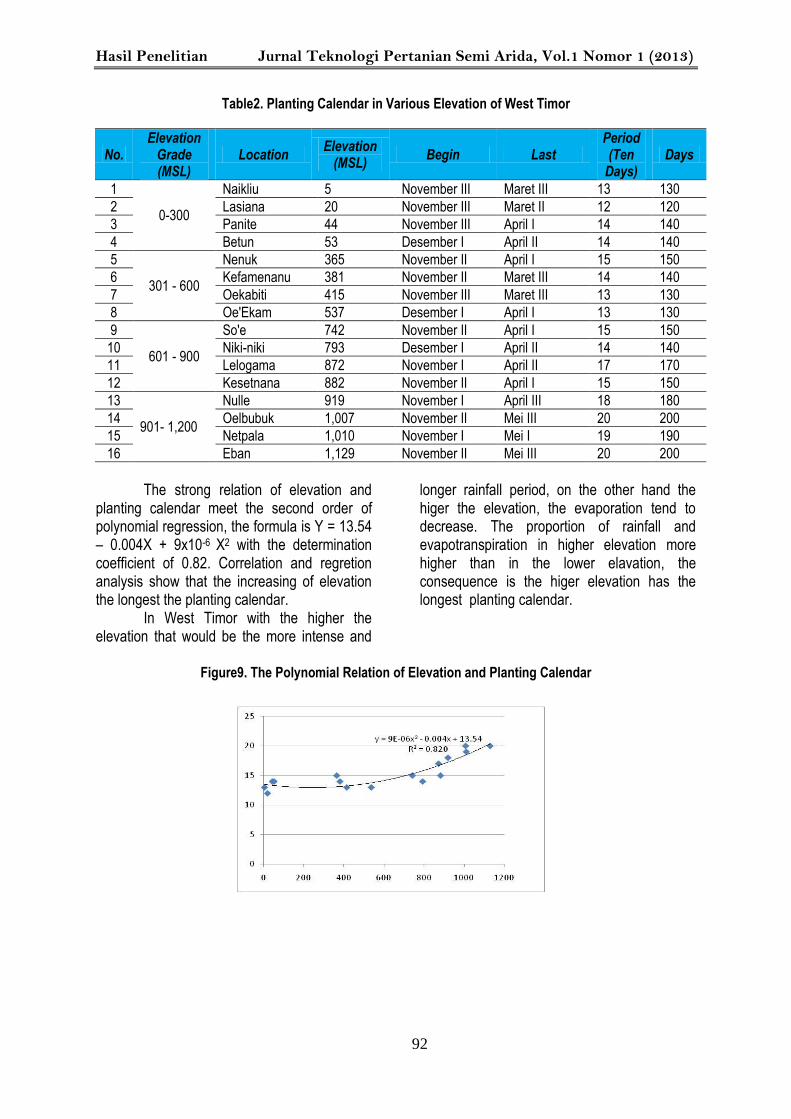
Table2. Planting Calendar in Various Elevation of West Timor
No. Elevation
Grade (MSL)
Location Elevation
(MSL) Begin Last
Period (Ten
Days) Days
1
0-300
Naikliu 5 November III Maret III 13 130 2 Lasiana 20 November III Maret II 12 120 3 Panite 44 November III April I 14 140 4 Betun 53 Desember I April II 14 140 5
301 - 600
Nenuk 365 November II April I 15 150 6 Kefamenanu 381 November II Maret III 14 140 7 Oekabiti 415 November III Maret III 13 130 8 Oe'Ekam 537 Desember I April I 13 130 9
601 - 900
So'e 742 November II April I 15 150 10 Niki-niki 793 Desember I April II 14 140 11 Lelogama 872 November I April II 17 170 12 Kesetnana 882 November II April I 15 150 13
901- 1,200
Nulle 919 November I April III 18 180 14 Oelbubuk 1,007 November II Mei III 20 200 15 Netpala 1,010 November I Mei I 19 190 16 Eban 1,129 November II Mei III 20 200
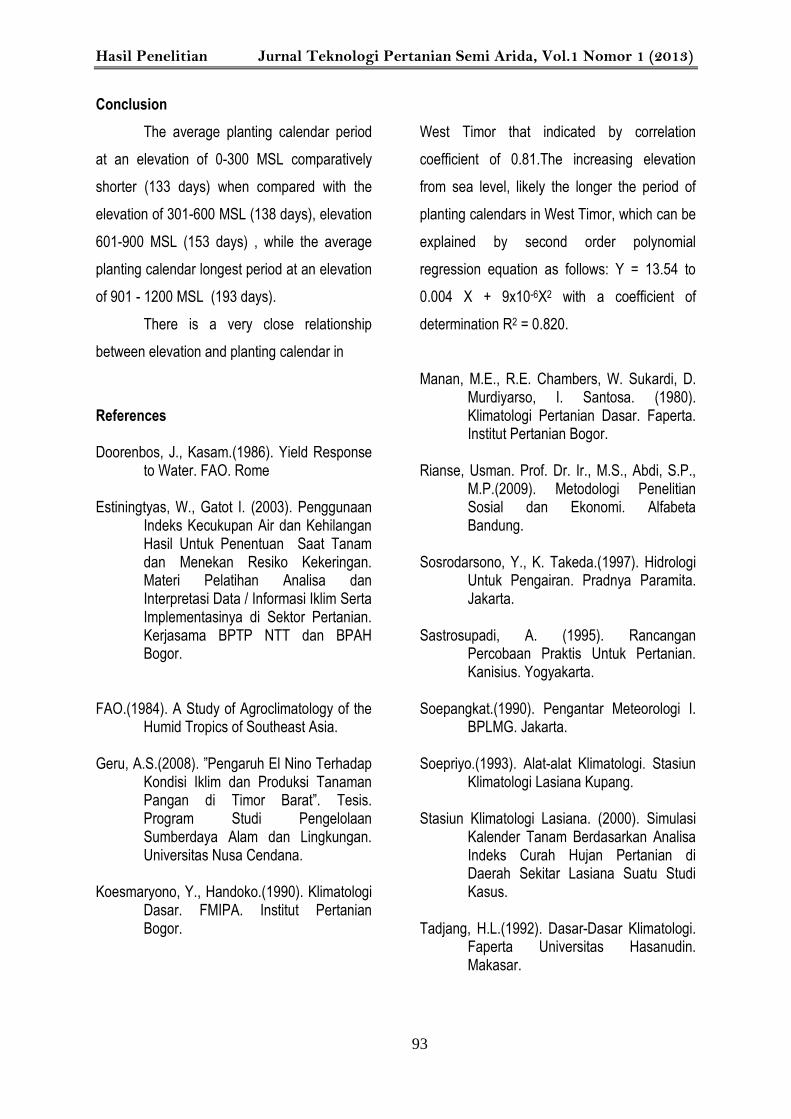
The strong relation of elevation and planting calendar meet the second order of polynomial regression, the formula is Y = 13.54 – 0.004X + 9x10-6 X2 with the determination coefficient of 0.82. Correlation and regretion analysis show that the increasing of elevation the longest the planting calendar.
In West Timor with the higher the elevation that would be the more intense and
longer rainfall period, on the other hand the higer the elevation, the evaporation tend to decrease. The proportion of rainfall and evapotranspiration in higher elevation more higher than in the lower elavation, the consequence is the higer elevation has the longest planting calendar.
Figure9. The Polynomial Relation of Elevation and Planting Calendar
Hasil Penelitian Jurnal Teknologi Pertanian Semi Arida, Vol.1 Nomor 1 (2013)
93
Conclusion
The average planting calendar period
at an elevation of 0-300 MSL comparatively
shorter (133 days) when compared with the
elevation of 301-600 MSL (138 days), elevation
601-900 MSL (153 days) , while the average
planting calendar longest period at an elevation
of 901 - 1200 MSL (193 days).
There is a very close relationship
between elevation and planting calendar in
West Timor that indicated by correlation
coefficient of 0.81.The increasing elevation
from sea level, likely the longer the period of
planting calendars in West Timor, which can be
explained by second order polynomial
regression equation as follows: Y = 13.54 to
0.004 X + 9x10-6X2 with a coefficient of
determination R2 = 0.820.
References Doorenbos, J., Kasam.(1986). Yield Response
to Water. FAO. Rome Estiningtyas, W., Gatot I. (2003). Penggunaan
Indeks Kecukupan Air dan Kehilangan Hasil Untuk Penentuan Saat Tanam dan Menekan Resiko Kekeringan. Materi Pelatihan Analisa dan Interpretasi Data / Informasi Iklim Serta Implementasinya di Sektor Pertanian. Kerjasama BPTP NTT dan BPAH Bogor.
FAO.(1984). A Study of Agroclimatology of the
Humid Tropics of Southeast Asia. Geru, A.S.(2008). ”Pengaruh El Nino Terhadap
Kondisi Iklim dan Produksi Tanaman Pangan di Timor Barat”. Tesis. Program Studi Pengelolaan Sumberdaya Alam dan Lingkungan. Universitas Nusa Cendana.
Koesmaryono, Y., Handoko.(1990). Klimatologi
Dasar. FMIPA. Institut Pertanian Bogor.
Manan, M.E., R.E. Chambers, W. Sukardi, D. Murdiyarso, I. Santosa. (1980). Klimatologi Pertanian Dasar. Faperta. Institut Pertanian Bogor.
Rianse, Usman. Prof. Dr. Ir., M.S., Abdi, S.P.,
M.P.(2009). Metodologi Penelitian Sosial dan Ekonomi. Alfabeta Bandung.
Sosrodarsono, Y., K. Takeda.(1997). Hidrologi
Untuk Pengairan. Pradnya Paramita. Jakarta.
Sastrosupadi, A. (1995). Rancangan
Percobaan Praktis Untuk Pertanian. Kanisius. Yogyakarta.
Soepangkat.(1990). Pengantar Meteorologi I.
BPLMG. Jakarta. Soepriyo.(1993). Alat-alat Klimatologi. Stasiun
Klimatologi Lasiana Kupang. Stasiun Klimatologi Lasiana. (2000). Simulasi
Kalender Tanam Berdasarkan Analisa Indeks Curah Hujan Pertanian di Daerah Sekitar Lasiana Suatu Studi Kasus.
Tadjang, H.L.(1992). Dasar-Dasar Klimatologi.
Faperta Universitas Hasanudin. Makasar.
Related Documents