Supporting information for: Harvesting greenish blue luminescence in Gold(I) complexes and their application as promising bioactive molecules and cellular bioimaging agents. Lis R. V. Favarin [a] , G. B. Laranjeira [a] , Cristiane F. A. Teixeira [a] , Heveline Silva [b] , A. C. Micheletti [a] , Lucas Pizzuti [a] , Amilcar Machulek Júnior [a] , Anderson R. L. Caires [a] , Victor M. Deflon [c] , Rafaela B. P. Pesci [e] , C. N. Lima Rocha [d] , J. R. Correa [d] , L. M. C. Pinto [a] , and Gleison Antônio Casagrande* [a] [a] Grupo de Pesquisa em Síntese e Caracterização Molecular de Mato Grosso do Sul, Instituto de Química, Universidade Federal de Mato Grosso do Sul (Laboratório 2); Av. Senador Filinto Muller, 1555, Campo Grande, MS 79074-460, Brazil. [b] Departamento de Química, ICEx, Universidade Federal de Minas Gerais; Belo Horizonte, MG 31270-901, Brazil. [c] Instituto de Química de São Carlos, Universidade de São Paulo; Av. Trabalhador São- Carlense, 400, São Carlos, SP 13566-590, Brazil. [d] Laboratório de Microscopia e Microanálises, Grupo Quimioterápicos e Sondas Fluorescentes, Instituto de Ciências Biológicas, Universidade de Brasília; Av. L3 Norte, s.n., Campus Darcy Ribeiro, Brasília, DF 70910-900, Brazil. [e] Departamento de Química, Universidade Federal da Paraíba – UFPB, 58051-900 João Pessoa – PB, Brazil. ______________________________________ *Corresponding author. Tel. +55 67 3345 3595; fax +55 67 3345 7190; e-mail addresses: [email protected], [email protected] Electronic Supplementary Material (ESI) for New Journal of Chemistry. This journal is © The Royal Society of Chemistry and the Centre National de la Recherche Scientifique 2020

Welcome message from author
This document is posted to help you gain knowledge. Please leave a comment to let me know what you think about it! Share it to your friends and learn new things together.
Transcript
Supporting information for:
Harvesting greenish blue luminescence in Gold(I) complexes and their
application as promising bioactive molecules and cellular bioimaging
agents.
Lis R. V. Favarin[a], G. B. Laranjeira[a], Cristiane F. A. Teixeira[a], Heveline Silva[b], A.
C. Micheletti[a], Lucas Pizzuti[a], Amilcar Machulek Júnior[a], Anderson R. L. Caires[a],
Victor M. Deflon[c], Rafaela B. P. Pesci[e], C. N. Lima Rocha[d], J. R. Correa[d], L. M. C.
Pinto[a], and Gleison Antônio Casagrande*[a]
[a] Grupo de Pesquisa em Síntese e Caracterização Molecular de Mato Grosso do Sul,
Instituto de Química, Universidade Federal de Mato Grosso do Sul (Laboratório 2);
Av. Senador Filinto Muller, 1555, Campo Grande, MS 79074-460, Brazil.
[b] Departamento de Química, ICEx, Universidade Federal de Minas Gerais; Belo
Horizonte, MG 31270-901, Brazil.
[c] Instituto de Química de São Carlos, Universidade de São Paulo; Av. Trabalhador São-
Carlense, 400, São Carlos, SP 13566-590, Brazil.
[d] Laboratório de Microscopia e Microanálises, Grupo Quimioterápicos e Sondas
Fluorescentes, Instituto de Ciências Biológicas, Universidade de Brasília; Av. L3
Norte, s.n., Campus Darcy Ribeiro, Brasília, DF 70910-900, Brazil.
[e] Departamento de Química, Universidade Federal da Paraíba – UFPB, 58051-900 João
Pessoa – PB, Brazil.
______________________________________
*Corresponding author. Tel. +55 67 3345 3595; fax +55 67 3345 7190; e-mail addresses: [email protected], [email protected]
Electronic Supplementary Material (ESI) for New Journal of Chemistry.This journal is © The Royal Society of Chemistry and the Centre National de la Recherche Scientifique 2020

Table S1. Crystal data and structure refinement for complexes 1, 2 and 3
Compound 1 2 3Empirical formula C36H36AuF6N3OP2S C35H34AuF6N3OP2S C36H36AuO2N3SP2F6
Formula weight 931.64 917.62 947.70Temperature (K) 296(2) 296(2) 296(2)Radiation, (Å) 0.71073 0.71073 0.71073Crystal system Monoclinic (P21/n) Monoclinic (P21/n) Monoclinic (P21/n)Unit cell dimensions
a (Å) 15.6260(6) 15.5446(3) 15.730(4)b (Å) 15.1781(6) 14.8994(3) 14.896(5)c (Å) 16.3393(6) 16.1594(4) 16.543(5)α (º) (º)γ (º)
90.000(0)104.658(2)90.000(0)
90.000(0)105.9130(10)
90.000(0)
90.000(0)105.515(10)90.000(0)
Volume (Å3) 3749.1(2) 3599.18(13) 3734.8(19)Z / density calculated (g cm3) 4/1.651 4/1.693 4/1.402Absorption coefficient (mm1) 4.128 4.298 4.087
F(000) 1840 1808 1528Crystal size (mm) 0.41 0.18 0.18 0.82 0.56 0.28 0.22 0.22 0.14Range for data collection, (º) 1.86 to 26.42 1.61 to 26.41 2.495 to 30.176
Index ranges –19 ≤ h ≤ 19–18 ≤ k ≤ 18–20 ≤ l ≤ 20
–16 ≤ h ≤ 19–15 ≤ k ≤ 18–16 ≤ l ≤ 20
–22 ≤ h ≤ 22–20 ≤ k ≤ 20–22 ≤ l ≤ 23
Reflections collected 28644 27388 53312Independent reflections 7690[R(int) =
0.0244]7382[R(int) = 0.0364] 10998[R(int) =
0.0408]Completeness to max 99.7% 99.9 % 99.7%Absorption correction Multi-scan Multi-scan Multi-scanData/restraints/parameters 7690 / 0 / 518 7382 / 36 / 444 10998 / 0 / 460Goodness-of-fit, F2 1.019 1.027 1.032Final R indices (I>2(I)) R1 = 0.0254
wR2 = 0.0670R1 = 0.0302
wR2 = 0.0720R1 = 0.0405
wR2 = 0.0980R indices (all data) R1 = 0.0333
wR2 = 0.0718R1 = 0.0391
wR2 = 0.0756R1 = 0.0732
wR2 = 0.1122Largest peak-and-hole difference (e Å3) 1.192 and –0.694 0.921 and –0.875 1.021 and –0.644
*R1= |F0–Fc|/|F0|; wR2= [w(F02–Fc
2)2/(wF02)]–1/2
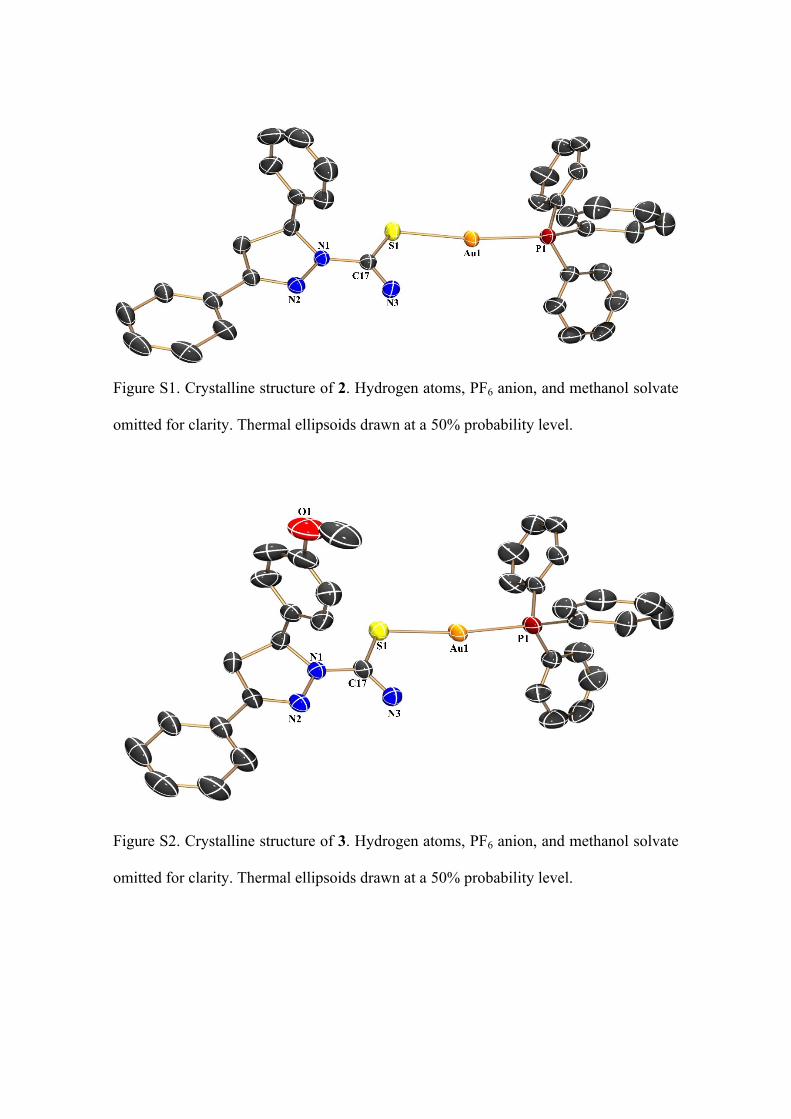
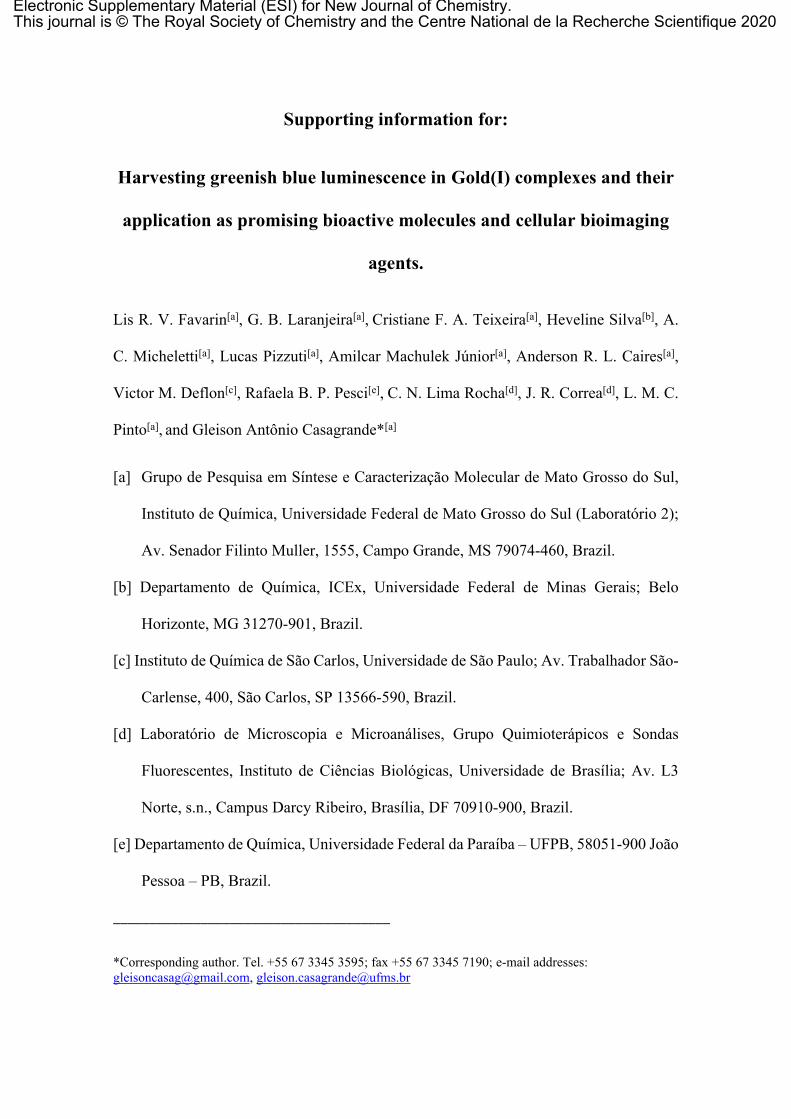
Figure S1. Crystalline structure of 2. Hydrogen atoms, PF6 anion, and methanol solvate
omitted for clarity. Thermal ellipsoids drawn at a 50% probability level.
Figure S2. Crystalline structure of 3. Hydrogen atoms, PF6 anion, and methanol solvate
omitted for clarity. Thermal ellipsoids drawn at a 50% probability level.
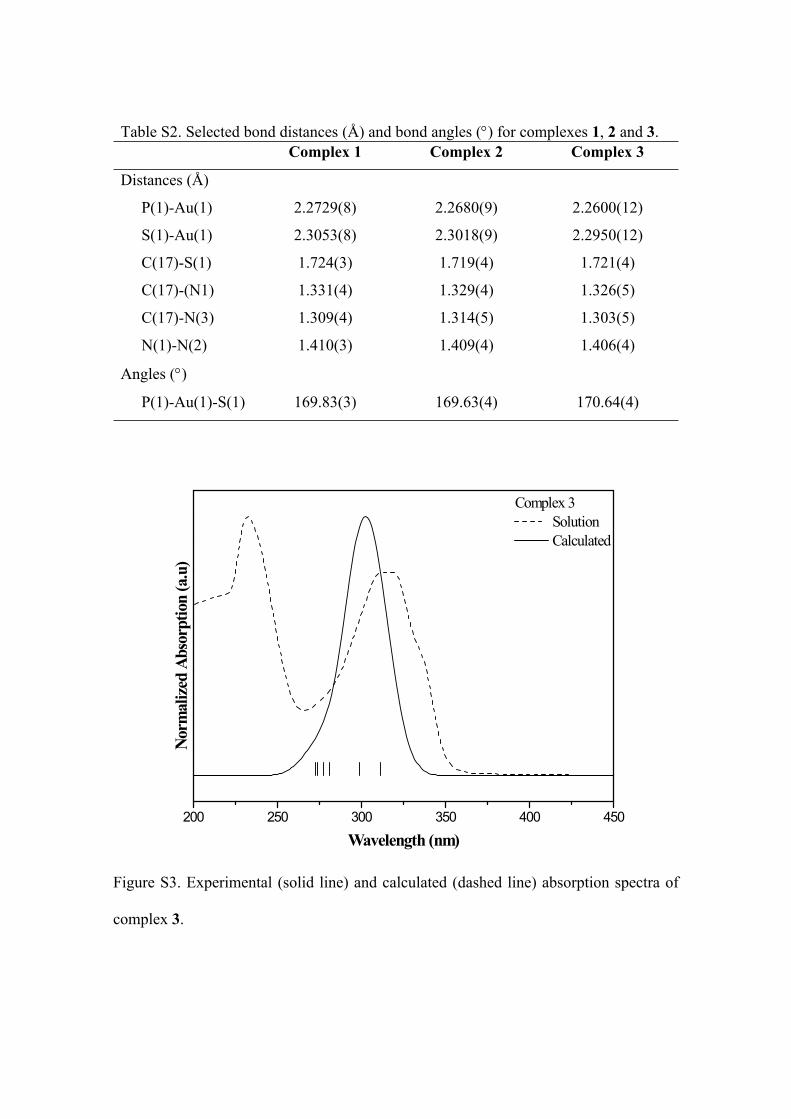
Table S2. Selected bond distances (Å) and bond angles () for complexes 1, 2 and 3.Complex 1 Complex 2 Complex 3
Distances (Å)
P(1)-Au(1) 2.2729(8) 2.2680(9) 2.2600(12)
S(1)-Au(1) 2.3053(8) 2.3018(9) 2.2950(12)
C(17)-S(1) 1.724(3) 1.719(4) 1.721(4)
C(17)-(N1) 1.331(4) 1.329(4) 1.326(5)
C(17)-N(3) 1.309(4) 1.314(5) 1.303(5)
N(1)-N(2) 1.410(3) 1.409(4) 1.406(4)
Angles ()
P(1)-Au(1)-S(1) 169.83(3) 169.63(4) 170.64(4)
200 250 300 350 400 450
Norm
alize
d Ab
sorp
tion
(a.u
)
Wavelength (nm)
Complex 3 Solution Calculated
Figure S3. Experimental (solid line) and calculated (dashed line) absorption spectra of
complex 3.
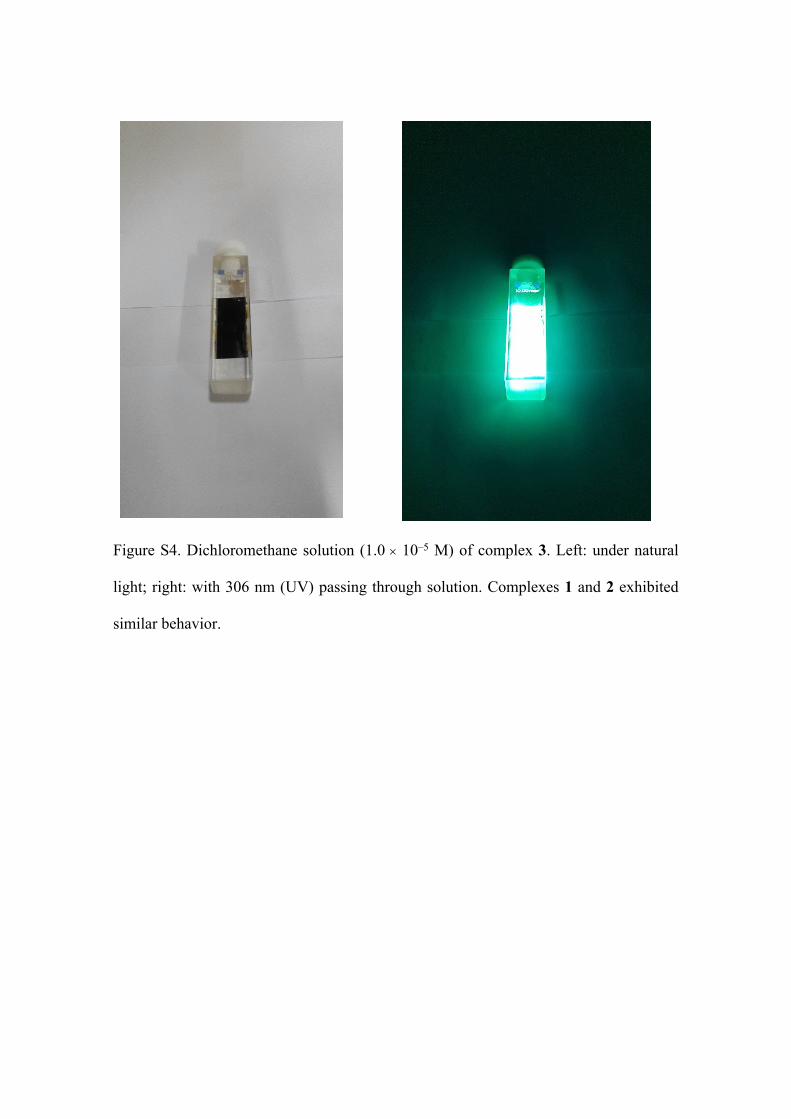
Figure S4. Dichloromethane solution (1.0 10–5 M) of complex 3. Left: under natural
light; right: with 306 nm (UV) passing through solution. Complexes 1 and 2 exhibited
similar behavior.
225 250 275 300 325 350 375 400 425 450 475 500 525
Norm
alize
d In
tens
ity (a
.u)
Wavelength (nm)
Complex 1 Excitation Emission
61 nmΔStokes
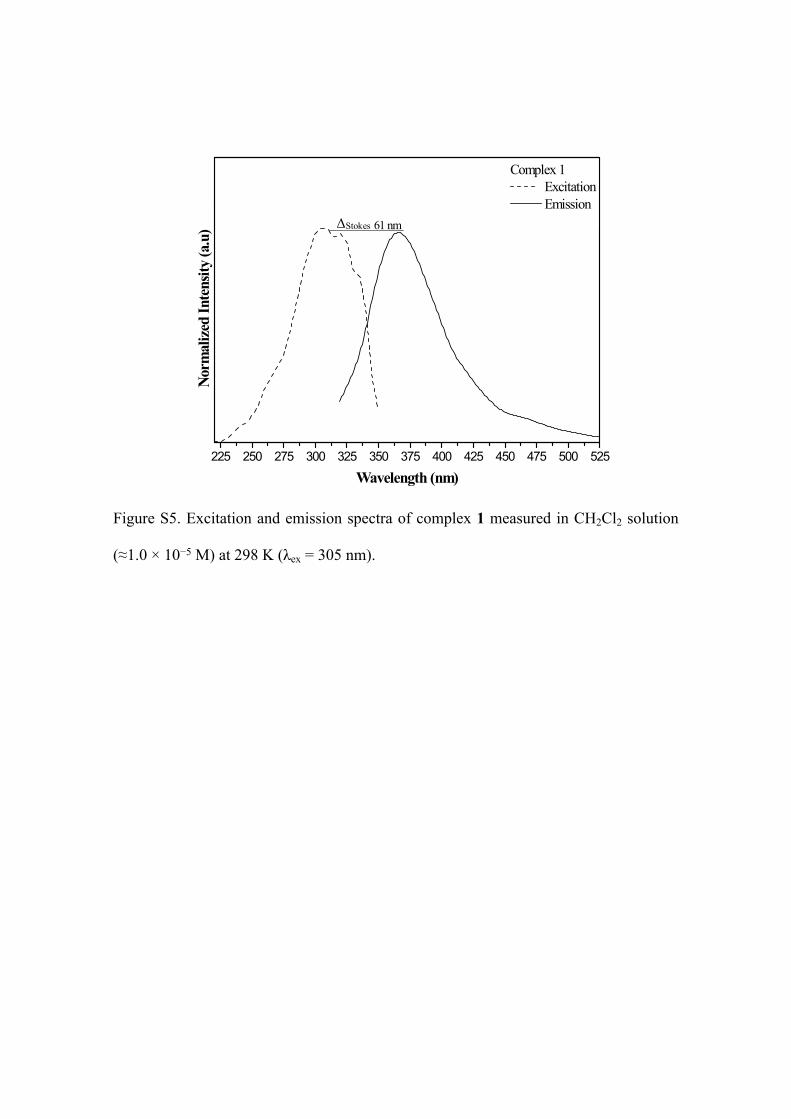
Figure S5. Excitation and emission spectra of complex 1 measured in CH2Cl2 solution
(≈1.0 × 10⁻⁵ M) at 298 K (λex = 305 nm).
225 250 275 300 325 350 375 400 425 450 475 500 525
ΔStokes No
rmal
ized
Inte
nsity
(a.u
)
Wavelength (nm)
Complex 2 Excitation Emission58 nm
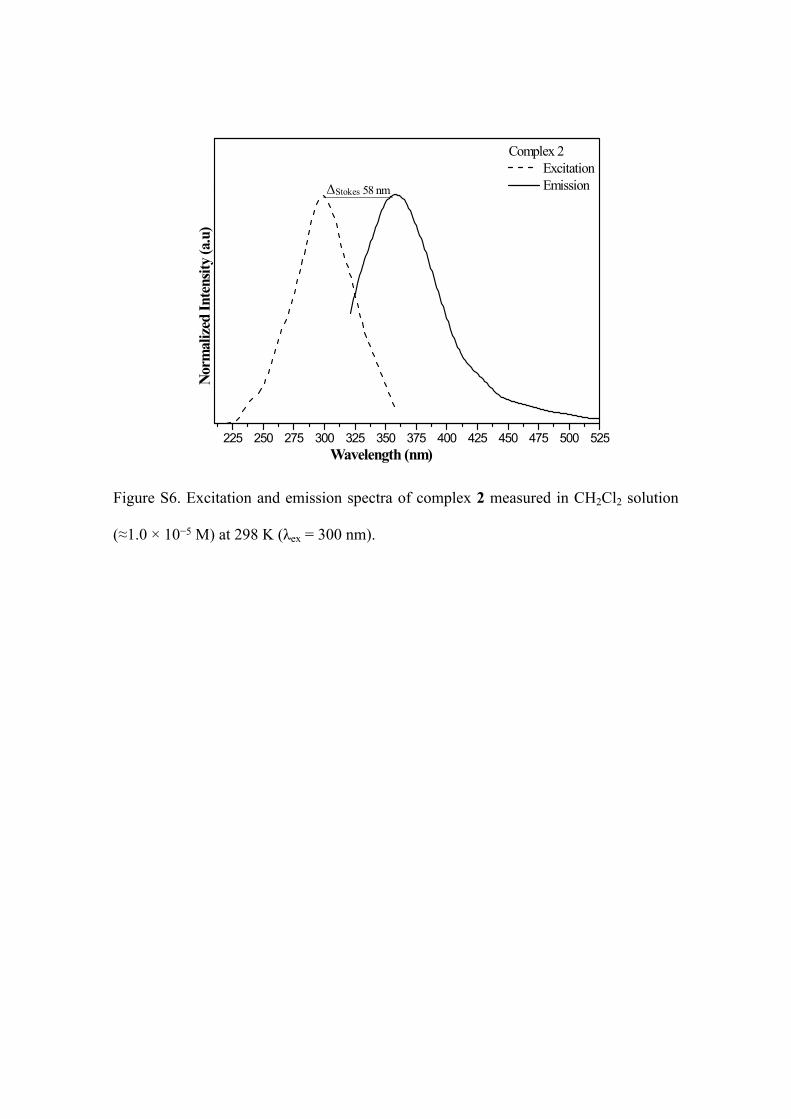
Figure S6. Excitation and emission spectra of complex 2 measured in CH2Cl2 solution
(≈1.0 × 10⁻⁵ M) at 298 K (λex = 300 nm).
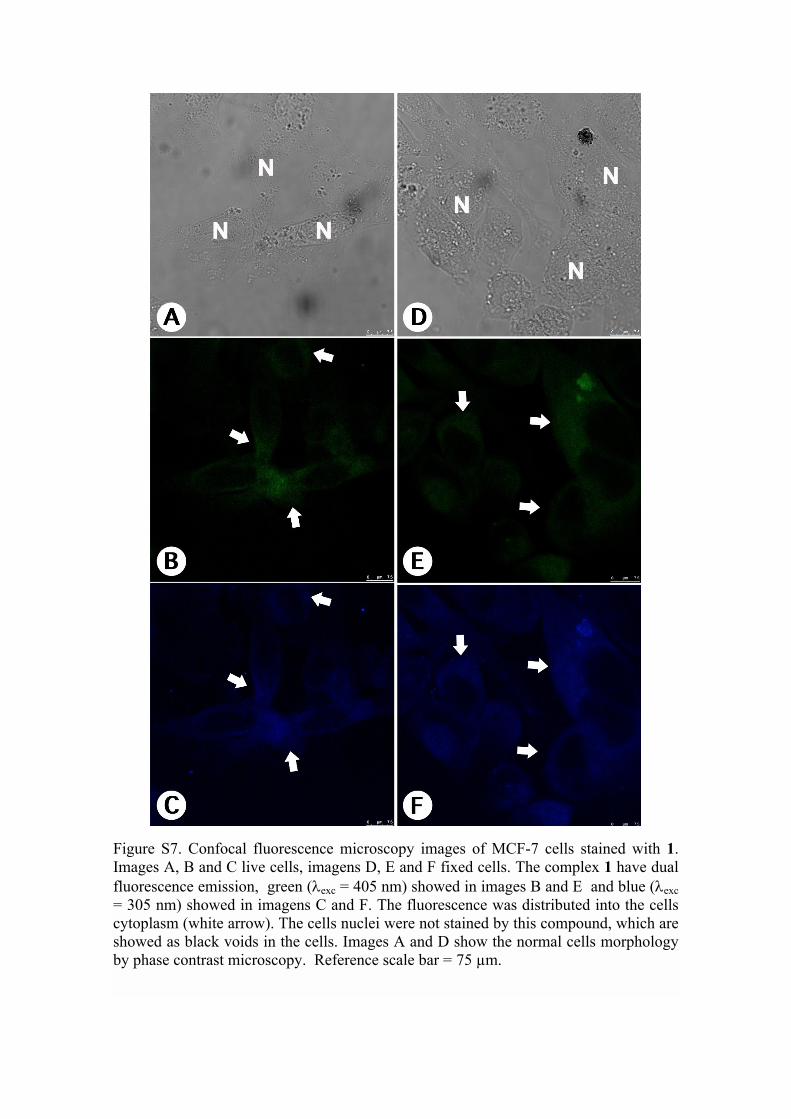
Figure S7. Confocal fluorescence microscopy images of MCF-7 cells stained with 1. Images A, B and C live cells, imagens D, E and F fixed cells. The complex 1 have dual fluorescence emission, green (exc = 405 nm) showed in images B and E and blue (exc = 305 nm) showed in imagens C and F. The fluorescence was distributed into the cells cytoplasm (white arrow). The cells nuclei were not stained by this compound, which are showed as black voids in the cells. Images A and D show the normal cells morphology by phase contrast microscopy. Reference scale bar = 75 µm.
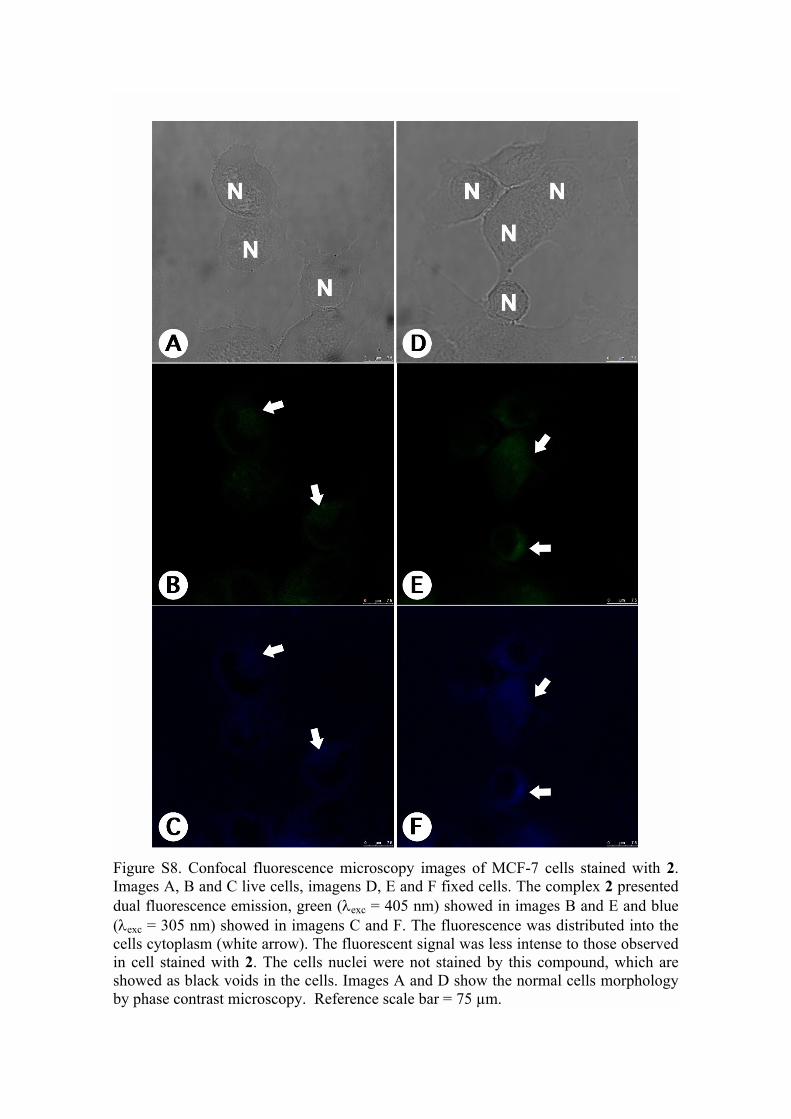
Figure S8. Confocal fluorescence microscopy images of MCF-7 cells stained with 2. Images A, B and C live cells, imagens D, E and F fixed cells. The complex 2 presented dual fluorescence emission, green (exc = 405 nm) showed in images B and E and blue (exc = 305 nm) showed in imagens C and F. The fluorescence was distributed into the cells cytoplasm (white arrow). The fluorescent signal was less intense to those observed in cell stained with 2. The cells nuclei were not stained by this compound, which are showed as black voids in the cells. Images A and D show the normal cells morphology by phase contrast microscopy. Reference scale bar = 75 µm.

4000 3500 3000 2500 2000 1500 1000 500
3393
3269
3155
2917
1578
1467
834 69
158
1 495
1365
Inte
nsity
(a.u
)
Wavelength number (cm-1)
3025
N
N
S NH2
Figure S9. Infrared spectrum of ligand 1.
4000 3500 3000 2500 2000 1500 1000 500
3484
3350
3048
1575
1472 13
64
1070
819
753
689
529
Inte
nsity
(a.u
)
Wavelength number (cm-1)
N
N
S NH2
Figure S10. Infrared spectrum of ligand 2.
4000 3500 3000 2500 2000 1500 1000 500
3377 32
6631
6930
50
1617
1471
1380 1176
1091
1019
842
760
685
598
530
1250
Inte
nsity
(a.u
)
Wavelength number (cm-1)
2946
N
N
S NH2H3CO
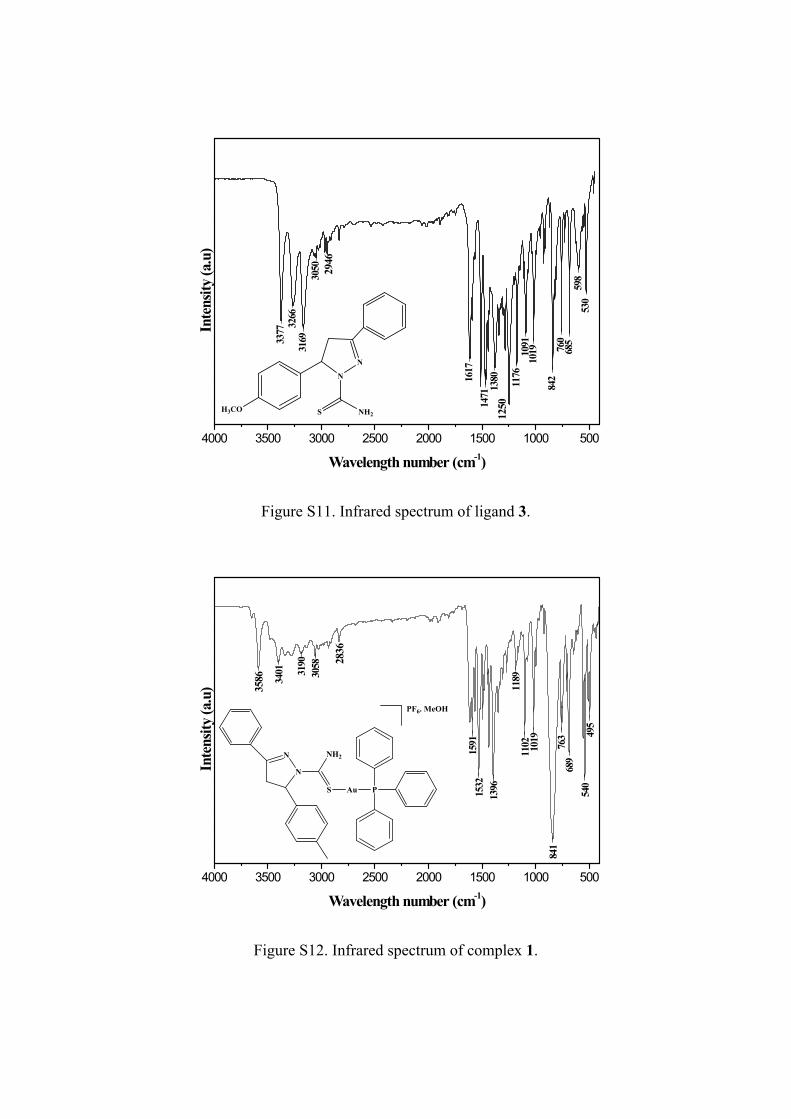
Figure S11. Infrared spectrum of ligand 3.
4000 3500 3000 2500 2000 1500 1000 500
3401 31
9030
58
1591
1532
1396
1189
1102 1019
841
763
689
540
495
Inte
nsity
(a.u
)
Wavelength number (cm-1)
3586
2836
N
N
S
NH2
Au P
PF6. MeOH
Figure S12. Infrared spectrum of complex 1.
4000 3500 3000 2500 2000 1500 1000 500
540690748
837
10181103
13961531
1593
3055
3394
Inte
nsity
(a.u
)
Wavelength number (cm-1)
2836
3590
N
N
S
NH2
Au P
PF6. MeOH
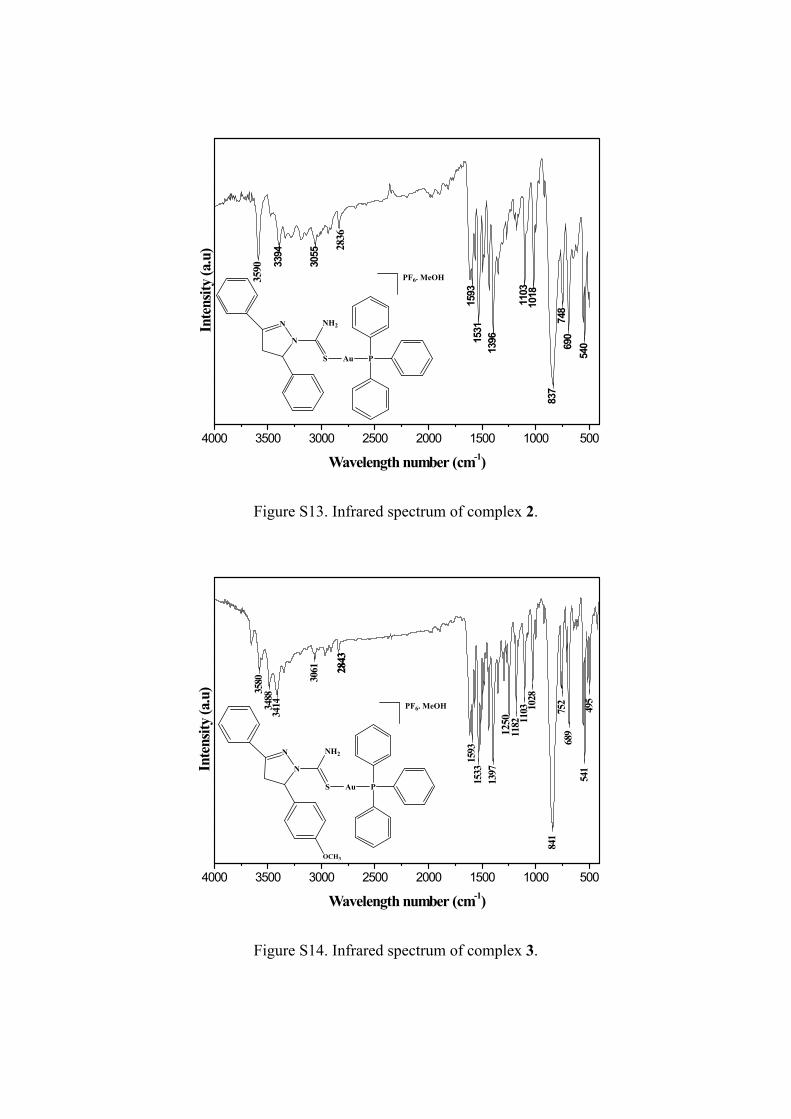
Figure S13. Infrared spectrum of complex 2.
4000 3500 3000 2500 2000 1500 1000 500
3580
3488
3414
3061
1593
1533
1397
1182 11
03 1028
841
752
689
541
495
1250
2843
Inte
nsity
(a.u
)
Wavelength number (cm-1)
2843
N
N
S
NH2
OCH3
Au P
PF6. MeOH
Figure S14. Infrared spectrum of complex 3.
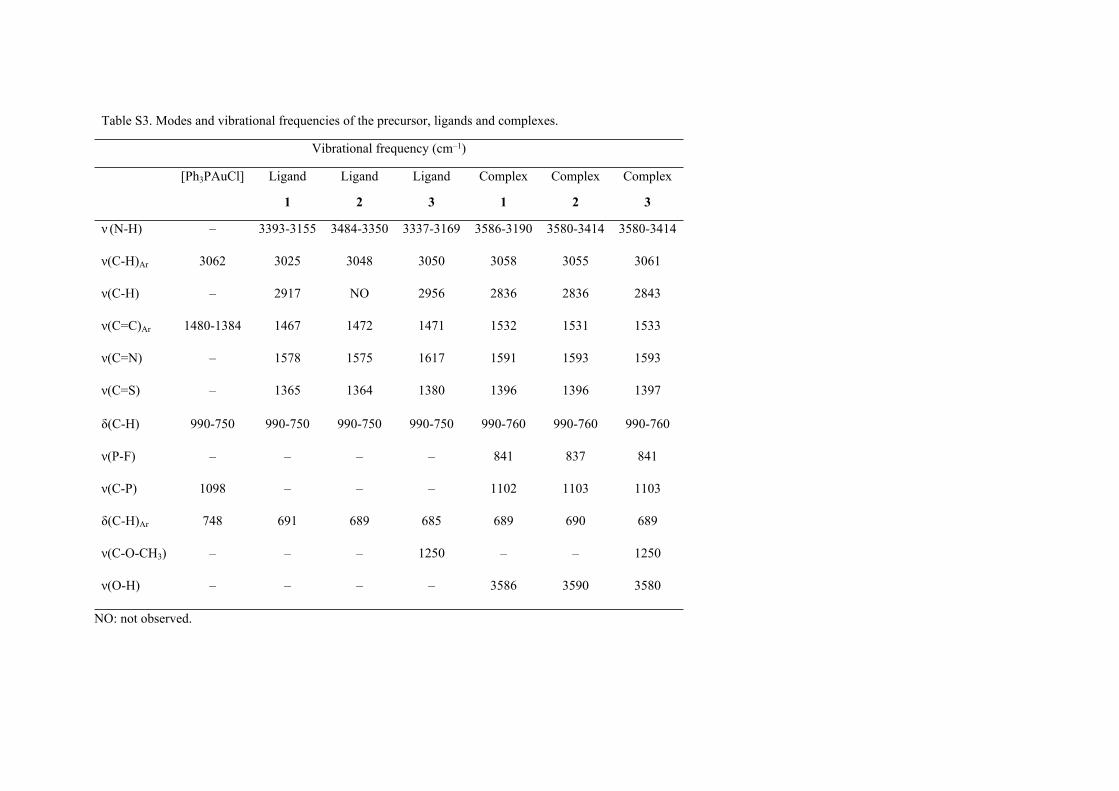
Table S3. Modes and vibrational frequencies of the precursor, ligands and complexes.
Vibrational frequency (cm–1)
[Ph3PAuCl] Ligand
1
Ligand
2
Ligand
3
Complex
1
Complex
2
Complex
3
ν (N-H) – 3393-3155 3484-3350 3337-3169 3586-3190 3580-3414 3580-3414
ν(C-H)Ar 3062 3025 3048 3050 3058 3055 3061
ν(C-H) – 2917 NO 2956 2836 2836 2843
ν(C=C)Ar 1480-1384 1467 1472 1471 1532 1531 1533
ν(C=N) – 1578 1575 1617 1591 1593 1593
ν(C=S) – 1365 1364 1380 1396 1396 1397
δ(C-H) 990-750 990-750 990-750 990-750 990-760 990-760 990-760
ν(P-F) – – – – 841 837 841
ν(C-P) 1098 – – – 1102 1103 1103
δ(C-H)Ar 748 691 689 685 689 690 689
ν(C-O-CH3) – – – 1250 – – 1250
ν(O-H) – – – – 3586 3590 3580
NO: not observed.
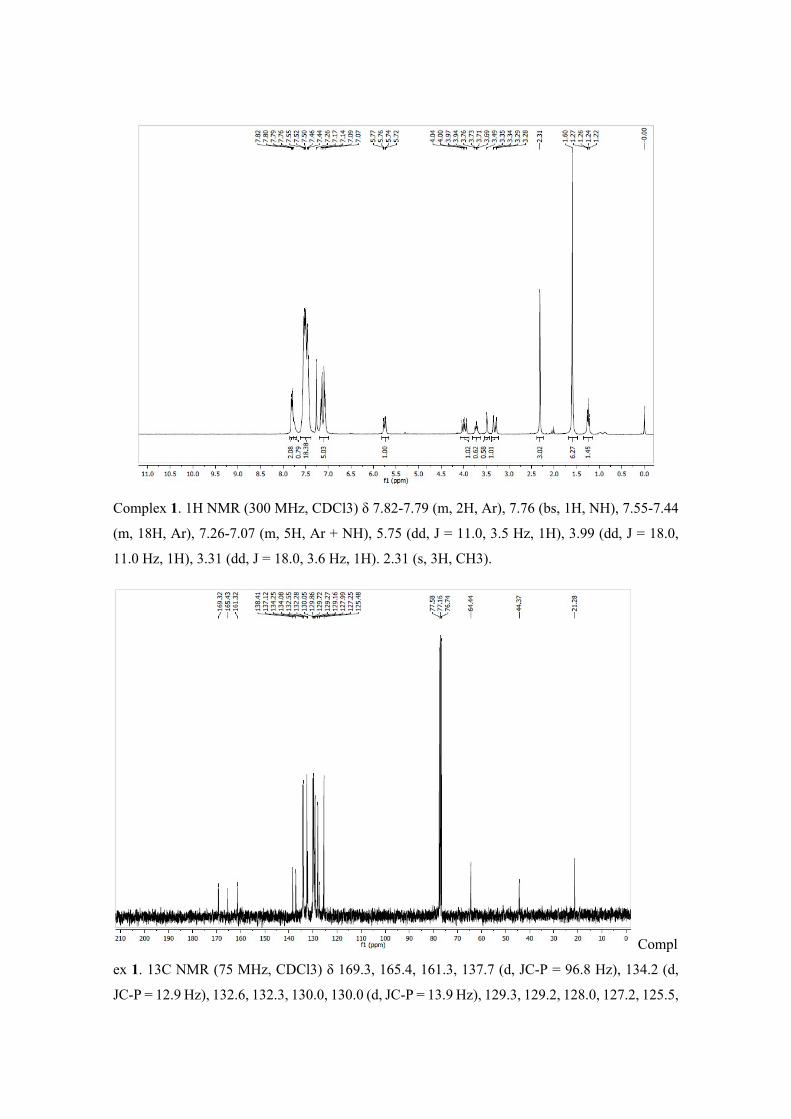
Complex 1. 1H NMR (300 MHz, CDCl3) δ 7.82-7.79 (m, 2H, Ar), 7.76 (bs, 1H, NH), 7.55-7.44
(m, 18H, Ar), 7.26-7.07 (m, 5H, Ar + NH), 5.75 (dd, J = 11.0, 3.5 Hz, 1H), 3.99 (dd, J = 18.0,
11.0 Hz, 1H), 3.31 (dd, J = 18.0, 3.6 Hz, 1H). 2.31 (s, 3H, CH3).
Compl
ex 1. 13C NMR (75 MHz, CDCl3) δ 169.3, 165.4, 161.3, 137.7 (d, JC-P = 96.8 Hz), 134.2 (d,
JC-P = 12.9 Hz), 132.6, 132.3, 130.0, 130.0 (d, JC-P = 13.9 Hz), 129.3, 129.2, 128.0, 127.2, 125.5,

64.4, 44.4, 21.3.
Complex 2. 1H NMR (300 MHz, CDCl3) δ 7.80-7.78 (m, 2H, Ar), 7.74 (bs, 1H, NH), 7.58-7.41 (m, 18H, Ar), 7.35-7.26 (m, 3H, Ar), 7.18-7.16 (m, 2H, Ar), 7.04 (bs, 1H, NH), 5.77 (dd, J = 11.0, 3.6 Hz), 4.02 (dd, J = 18.2, 11.0 Hz), 3.31 (dd, J = 18.1, 3.4 Hz).
Complex 2. 13C NMR (75 MHz, CDCl3) δ 169.3, 161.4, 140.0, 134.3, 134.1, 132.6, 132.4, 129.9, 129.8, 129.5, 129.2, 128.6, 128.1, 125.6, 64.7, 44.4.
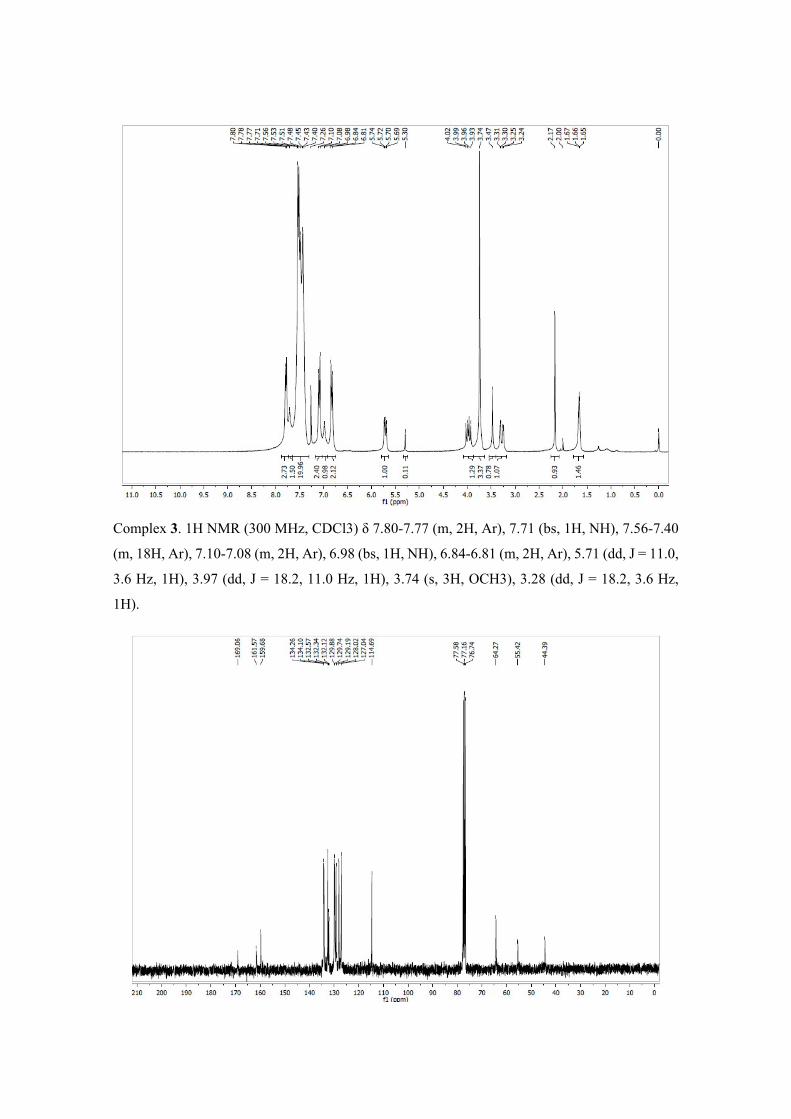
Complex 3. 1H NMR (300 MHz, CDCl3) δ 7.80-7.77 (m, 2H, Ar), 7.71 (bs, 1H, NH), 7.56-7.40
(m, 18H, Ar), 7.10-7.08 (m, 2H, Ar), 6.98 (bs, 1H, NH), 6.84-6.81 (m, 2H, Ar), 5.71 (dd, J = 11.0,
3.6 Hz, 1H), 3.97 (dd, J = 18.2, 11.0 Hz, 1H), 3.74 (s, 3H, OCH3), 3.28 (dd, J = 18.2, 3.6 Hz,
1H).
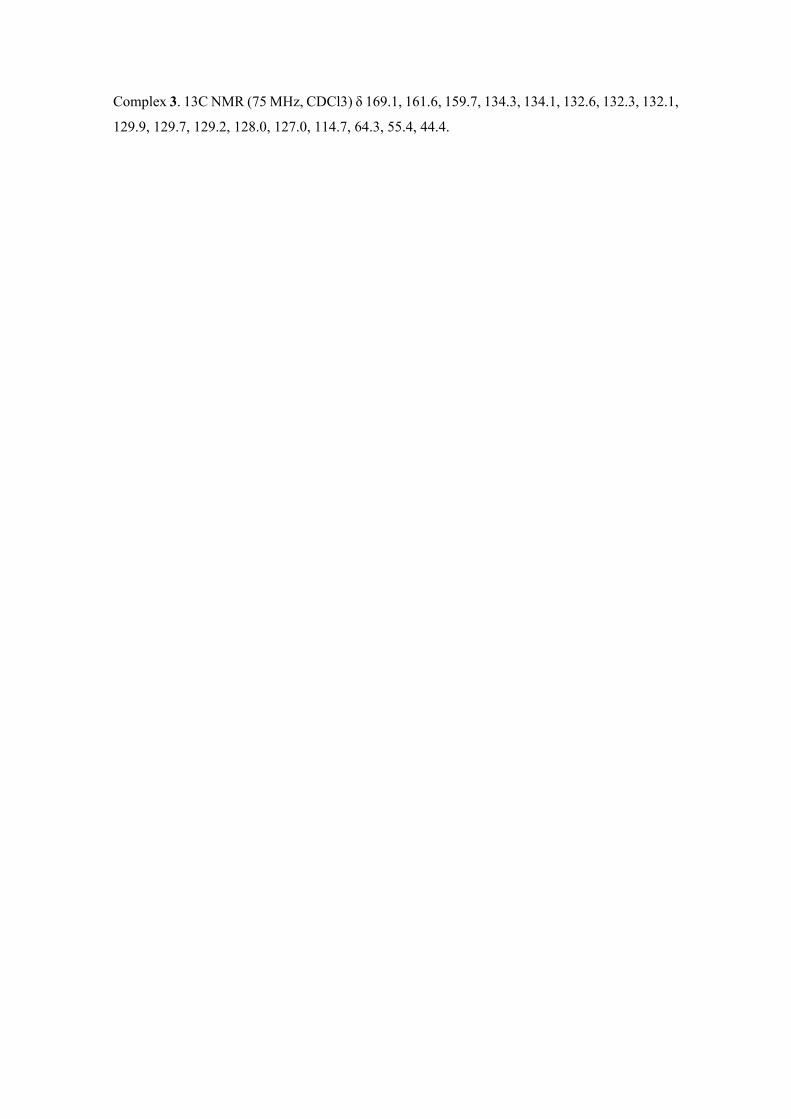
Complex 3. 13C NMR (75 MHz, CDCl3) δ 169.1, 161.6, 159.7, 134.3, 134.1, 132.6, 132.3, 132.1,
129.9, 129.7, 129.2, 128.0, 127.0, 114.7, 64.3, 55.4, 44.4.
Related Documents