Warvard Brain Atlas: A Teaching and Visualization Tool M.E. Shenton', R. Kikinis', R. W. McCarley', P. Saiviroonpom2, H.H. Hokama', A. Robatino2, D. MetcalfL, C.G. Wible', C.M. Portas', D.V. Iosifescu', R. Domino', J.M. Goldstein', F.A. Jolesz2 'Clinical Neuroscience Division, Neuroscience Laboratory, Department of Psychiatry, Harvard Medical School; 2Surgical Planning Laboratory, MRI Division, Department of Radiology, Brigham and Women's Hospital, Harvard Medical School 1: Introduction Abstract Key Words: Brain atlas; Magnetic resonance imaging (MRI); 30 visualization; 30 surface rendering We here present initial datafiom a computerized three-dimensional (30) human brain atlas project that employs automated segmentation methods, 30 slice editing techniques, region of interest deJinitions based on neuroanatomical knowledge, and 30 surface rendering techniques. For illustrative purposes, we show 30 representations of cerebral cortical gray matter (subdivided by lobe), cerebellum, corpus callosum, basal ganglia structures, limbic system structures, eyes and optic chiasm, and the ventricular system. Part of the white matter, including the corticospinal tract, is also reconstructed in 30. This digitized human brain atlas will be expanded and later used to automatically register new MR data sets in order to assess 30 volumes of interest. Currently, it serves as a powerful teaching tool, since spatial relationships among neuroanatomical structures can be more readily envisioned when the user is able to view and rotare the structures in 30 space, and where each element of the brain atlas is associated with a name tag that is displayed by a user-controlled pointer. Until quite recently, the application of 3D visualization techniques to MRI was difficult because the quality of the images was not adequate. Quality was compromised by: 1) the ability to acquire high resolution images; 2) movement artifact which degraded the quality of the images; and, 3) inhomogeneities in the magnetic field, resulting in different signal intensities for the same tissue type in different areas of the scanner [l, 231. These limitations have now been attenuated by upgrades in both the hardware and software of MR scanners and it is has now become possible to apply 3D visualization techniques to MR images. Such an improvement in image quality results not only in more accurate measurement [ 12, 3 1, 401, but also makes possible the application of multivariate image processing techniques, adapted from multichannel methods used in remote sensing in satellite images [38], as well as other methods borrowed from computer vision research [e.g., 13, 18, 281, to access new information about morphology and tissue characteristics of the brain from in vivo MR images. The use of new 3DFT (or volume) imaging methods also offers several advantages over 2DFT images. These advantages include: 3DFT slices are contiguous, there is no inter-slice gap, and the signal-to-noise (SN) ratio is considerably improved since the signal comes from the whole volume rather than the slice [24]. Thus it becomes possible to obtain isotropic, or nearly isotropic, data sets in a short period of time. Moreover, with these techniques it is possible to improve the quality of the images so that 3D 0-8186-7198-X/95 $04.00 0 1995 IEEE 10 (See color plate CP-2, p. 81)

Welcome message from author
This document is posted to help you gain knowledge. Please leave a comment to let me know what you think about it! Share it to your friends and learn new things together.
Transcript

Warvard Brain Atlas: A Teaching and Visualization Tool
M.E. Shenton', R. Kikinis', R. W. McCarley', P. Saiviroonpom2, H.H. Hokama', A. Robatino2, D. MetcalfL, C.G. Wible', C.M. Portas', D.V. Iosifescu',
R. Domino', J.M. Goldstein', F.A. Jolesz2 'Clinical Neuroscience Division, Neuroscience Laboratory, Department of Psychiatry,
Harvard Medical School; 2Surgical Planning Laboratory, MRI Division, Department of Radiology, Brigham and Women's Hospital, Harvard Medical School
1: Introduction Abstract
Key Words: Brain atlas; Magnetic resonance imaging (MRI); 3 0 visualization; 3 0 surface rendering
We here present initial data fiom a computerized three-dimensional (30) human brain atlas project that employs automated segmentation methods, 3 0 slice editing techniques, region of interest deJinitions based on neuroanatomical knowledge, and 3 0 surface rendering techniques. For illustrative purposes, we show 3 0 representations of cerebral cortical gray matter (subdivided by lobe), cerebellum, corpus callosum, basal ganglia structures, limbic system structures, eyes and optic chiasm, and the ventricular system. Part of the white matter, including the corticospinal tract, is also reconstructed in 30. This digitized human brain atlas will be expanded and later used to automatically register new MR data sets in order to assess 3 0 volumes of interest. Currently, it serves as a powerful teaching tool, since spatial relationships among neuroanatomical structures can be more readily envisioned when the user is able to view and rotare the structures in 3 0 space, and where each element of the brain atlas is associated with a name tag that is displayed by a user-controlled pointer.
Until quite recently, the application of 3D visualization techniques to MRI was difficult because the quality of the images was not adequate. Quality was compromised by: 1) the ability to acquire high resolution images; 2) movement artifact which degraded the quality of the images; and, 3) inhomogeneities in the magnetic field, resulting in different signal intensities for the same tissue type in different areas of the scanner [l, 231. These limitations have now been attenuated by upgrades in both the hardware and software of MR scanners and it is has now become possible to apply 3D visualization techniques to MR images. Such an improvement in image quality results not only in more accurate measurement [ 12, 3 1, 401, but also makes possible the application of multivariate image processing techniques, adapted from multichannel methods used in remote sensing in satellite images [38], as well as other methods borrowed from computer vision research [e.g., 13, 18, 281, to access new information about morphology and tissue characteristics of the brain from in vivo MR images.
The use of new 3DFT (or volume) imaging methods also offers several advantages over 2DFT images. These advantages include: 3DFT slices are contiguous, there is no inter-slice gap, and the signal-to-noise ( S N ) ratio is considerably improved since the signal comes from the whole volume rather than the slice [24]. Thus it becomes possible to obtain isotropic, or nearly isotropic, data sets in a short period of time. Moreover, with these techniques it is possible to improve the quality of the images so that 3D
0-8186-7198-X/95 $04.00 0 1995 IEEE 10
(See color plate CP-2, p . 81)

segmentation and 3D visualization techniques can be used to develop a true three dimensional (3D) atlas of the human brain. This possibility represents a radical change as it means that for the first time in medical imaging, detailed 3D anatomy can be appreciated instead of being restricted to 2D images of 3D structures.
Interest in developing a 3D atlas of the human brain has, therefore, not surprisingly, received considerable attention by a number of research laboratories (e.g., 11, 15, 19-20,27,30,33, 351. Likewise, interest in automatically identifying regions of interest (ROIs) in multiple brains, starting with ROI identification in one brain, has also received recent attention by a number of investigators [e.g., 1-3, 9, 11, 16-17, 25, 27, 36-37]. Some of the latter research involves the construction of a brain atlas to be used as a template, which is the first step towards the automatic identification of 3D brain regions on new MR brain data sets. Currently, such identification is painstakingly slow and involves a cadre of workers who laboriously outline, and edit, each ROI. The application of a digitized anatomy atlas for registering new MR data sets would thus provide us with capabilities that have heretofore not been possible.
In our laboratory, we have created an MR based 3D brain atlas using a single normal subject whose @1 X 1 X 1.5 voxel dimensions from 3DFT SPGR images were classified by several operators (CGW, DI, CMP, HH, JMG, MES) into distinct anatomical regions (see below). The boundaries of the ROI, and the selection of neuroanatomical landmarks, were aided by using the textbook of Crosby et al. [ 101 and the structure-hnctional correlational review of Radamacher et al. [32] as references. Automated segmentation methods, 3D slice editing techniques which allow reformatting of slices in three different planes, and 3D surface rendering techniques, were applied to MR data from this single normal control subject to create 3D representations of neuroanatomy. These procedures will be detailed below. To illustrate these methods we selected several neuroanatomical regions, including: cerebral cortical gray matter (subdivided by lobes and gyri), cerebellum, corpus callosum, basal ganglia structures, limbic system structures, eyes and optic chiasm, and the ventricular system. While this neuroanatomy list is by no means exhaustive, we selected these regions because of their likely interest to neurologists and to schizophrenia researchers.
2: Basic Methods
2.1: Image Acquisition. The MR images were acquired on a 1.5-tesla General Electric Signa System (GE Medical Systems, Milwaukee). Sagittal localizer images were acquired, followed by three-dimensional Fourier-transform (3DFT) spoiled-gradient-recalled acquisition (SPGR), with a repetition time of 35 msec, an echo time of 5 msec with one repetition, a flip angle of 45 degrees, a field of view of 24 cm, and a matrix of 256 by 256 (192 phase-encoding steps, with zero filling) by 124. The data were stored and analyzed as 124 coronal slices of 1.5 mm thickness. Voxel dimensions were @ 1 X 1 X 1.5. To reduce flow-related artifact from cerebrospinal fluid (CSF) and blood, presaturation of a slab inferior to the head was performed.
A white, 25 year old, right-handed male was the normal control subject selected. This case was selected from 15 normal controls who had been screened for any psychiatric, neurological, or drug/alcohol abuse. This case was selected because, overall, the images obtained showed the best gray-white matter contrast and the least amount of artifact. The MR data set was transferred through the Ethernet connection to our Sun workstations (SUN Microsystems, Mountain View, CA) where the images were processed using image processing techniques.
2.2: Image Processing Techniques. Segmentation procedures are a prerequisite for both 3D visualization and for building a brain atlas based on knowledge of neuroanatomy. We have developed several algorithms that involve multiple steps (see below), which we have used successfully in several studies, and in more than 1200 cases [e.g., 22,341.
2.2.1: Post-Processing Filter to Improve Signal-To-Noise Ratio. The first step involved using a post-processing filter to reduce noise without blurring fine morphometric details [13-141. This filter is based on a simulation of anisotropic diffusion of heat, originally reported by Perona and Malik [29], but latter applied to MR images by Gerig and colleagues [ 13- 141.
2.2.2: Segmentation into Different Tissue Classes. Following the filtering, a supervised segmentation of the images was done to delineate tissue classes. Here, the gray-
11

scale images were translated into labelled tissue classes by the operator (i.e., gray matter, white matter, and CSF). The operator defined the seed points for each tissue class, thus providing the initial information, and then the actual classification was performed by an algorithm. [For more information see 4-8,22, and 341.
2.2.3: Connectivity Program. The connectivity program was used to subdivide further the tissue classes into specific neuroanatomical ROIs. Accordingly, specific voxels were relabelled to represent specific neuroanatomical ROIs such as the basal ganglia, cingulate gyrus, etc. These labels were then preserved and when the cursor was placed on them, the label name appeared which identified the structure.
2.2.4: Region of Interest Definitions (ROIs). A complete description of the landmarks used to delineate specific neuroanatomical ROIs is provided elsewhere and will be made available to the reader upon request. Individual areas such as temporal lobe structures [34], prefrontal cortex [39], and basal ganglia structures [21] are defined in detail in previous publications. Briefly, the regions delineated included: cerebral cortical gray matter (subdivided by lobe), cerebellum, corpus callosum, basal ganglia structures (subdivided), limbic system structures, eyes and optic chiasm, and the ventricular system. Also, part of the white matter structure, including the corticospinal tract, was delineated and reconstructed in 3D.
Following the definition of ROIs, the connectivity program was used to relabel new structures defined within the new boundaries. As noted previously, we used both Crosby et al. [ 101 and Radamacher et al. [32] as references to assist in the definition of these ROIs. The ROIs were evaluated by several investigators who were knowledgeable concerning neuroanatomy (e.g., CGW, DVI, FAJ, HH, CMP, MES, RK, RWM).
The connectivity program was thus used to connect all voxels within a clearly def ied region of the brain. For example, once gray matter outside the amygdala was delineated from other structures by breaking bridges to these structures with lines, then the connectivity program worked much like a drop of water falling into a bucket (amygdala) which then filled the entire enclosed region. The bucket, or in this case the amygdala, was then color coded separately from the rest of the brain.
2.2.5: 3D Slice Editor. The 3D slice editor allowed the original reformatted 124 coronal 1.5 mm slices to be visualized, in the coronal, axial, or sagittal planes. This program also enabled the operator to see the results of the segmentations, including the further subdivisions into specific neuroanatomical ROIs, which were originally defined and highlighted in color on the coronal slices, but could be viewed as well in both the axial and sagittal planes. The representation of ROIs in three different planes allowed a further appreciation of neuroanatomy as well as enabling the operator to edit them. This editing capability was particularly useful for structures such as the thalamus which were harder to delineate in the coronal plane but easier to delineate and edit in the axial plane.
2.2.6: 3D Surface Rendering. By using the dividing cubes algorithm, and the marching cubes algorithm, surface models of the different neuroanatomical ROIs were generated [5, 261. These models were then interactively evaluated alone or in relation to other tissue classes and/or structures. Further editing was then possible based on a review of the neuroanatomical structures observed in 3D.
2.2.7: Volume Determination. Volumes were determined for the labelled structures by adding up the number of voxels (pixel volumes) in each structure and multiplying it by the millimeters of each voxel, across all relevant slices.
2.2.8: Reliability. The reliability of the segmentation procedures has been shown to be excellent for both the spin echo whole brain volume data [see 221 as well as for 3D SPGR volume data from small structures, i.e., hippocampus, parahippocampal gyrus, amygdala, and superior temporal gyrus (STG). For the latter, we have observed less than 4% difference in the re-scan volumes for the aforementioned small brain structures in a normal control subject (scanned and then re-scanned the same day) using the same landmarks as in OUT previous study [34].
2.2.9: Summary. We employed an image filter, automated segmentation methods, 3D slice editing techniques, and ROI definitions based on neuroanatomical knowledge in order to define specific ROIs in the brain. We also employed 3D surface rendering tools to visualize 3D representations of neuroanatomy. Additionally, we were able to sum the
12
voxels to compute volumes for all identified ROIs. To utilize this information in an interactive brain atlas, however, it was necessary to create a hierarchical text file to organize the labels assigned to the parcellated brain regions. The implementation of this hierarchical labelling, and the integration of this information with the graphics interface, are described below.
3: Implementation.
Our next goal was to create a user friendly framework for visualizing the different brain regions. A further objective was to preserve the spatial representation of the neuroanatomical regions of interest and to integrate this information with knowledge about the relations among neuroanatomical structures.
Accordingly, we wanted to create a labelling system for each of the neuroanatomical structures that was based on hierarchical relations. We also wanted to make this labelling system as flexible as possible so that the relations among structures could be changed by simply editing a text file and/or saving several different text files that preserved different groupings among neuroanatomical structures. Such flexibility is desired because there are many ways of organizing complex neuroanatomical relations and a flexible system allows the user to change the criteria for organizing relations among structures.
We used shades of the same colors to show related structures, and different colors to highlight unrelated structures. These colors were keyed to the hierarchical labels and thus changed as the hierarchical relations among structures changed. The user also had the option of viewing the group of related structures as one color or viewing the separate entities that comprised the hierarchical grouping as individual colors.
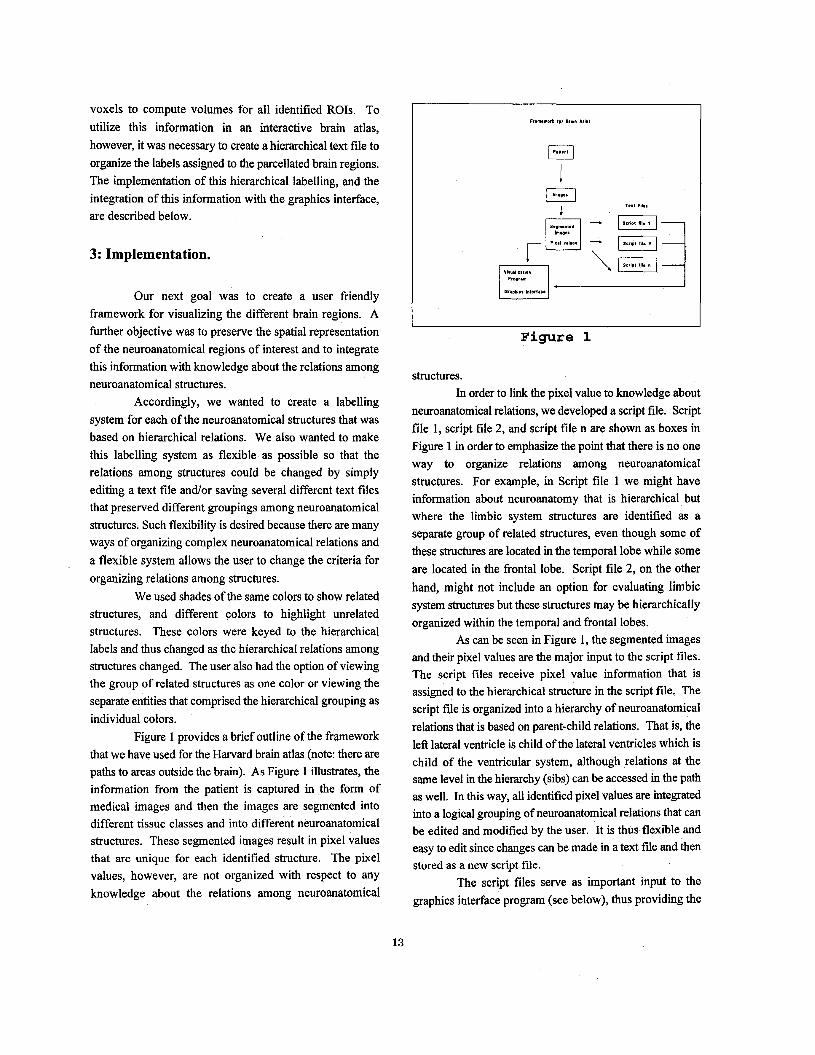
Figure 1 provides a brief outline of the framework that we have used for the Harvard brain atlas (note: there are paths to areas outside the brain). As Figure 1 illustrates, the information from the patient is captured in the form of medical images and then the images are segmented into different tissue classes and into different neuroanatomical structures. These segmented images result in pixel values that are unique for each identified structure. The pixel values, however, are not organized with respect to any knowledge about the relations among neuroanatomical
I I T.., Fii.,
Figure 1
structures. In order to link the pixel value to knowledge about
neuroanatomical relations, we developed a script file. Script file 1, script file 2, and script file n are shown as boxes in Figure 1 in order to emphasize the point that there is no one way to organize relations among neuroanatomical structures. For example, in Script file 1 we might have information about neuroanatomy that is hierarchical but where the limbic system structures are identified as a separate group of related structures, even though some of these structures are located in the temporal lobe while some are located in the fiontal lobe. Script file 2, on the other hand, might not include an option for evaluating limbic system structures but these structures may be hierarchically organized within the temporal and frontal lobes.
As can be seen in Figure 1, the segmented images and their pixel values are the major input to the script files. The script files receive pixel value information that is assigned to the hierarchical structure in the script file. The script file is organized into a hierarchy of neuroanatomical relations that is based on parent-child relations. That is, the left lateral ventricle is child of the lateral ventricles which is child of the ventricular system, although relations at the same level in the hierarchy (sibs) can be accessed in the path as well. In this way, all identified pixel values are integrated into a logical grouping of neuroanatomical relations that can be edited and modified by the user. It is thus flexible and easy to edit since changes can be made in a text file and then stored as a new script file.
The script files serve as important input to the graphics interface program (see below), thus providing the
13
user with a unique opportunity to visualize different hierarchical relations among neuroanatomical structures in a 3D environment. More specifically, information from the script file, and from the segmented images is used by the graphics interface program for visualizing the structures of the atlas. Visualization attributes such as color are then added along with other definitions such as parent-child relationships, place labels, visualization in any dimension, and creating and saving new script files (see below). In addition, the label names are preserved so that when the cursor is placed on a 3D structure that is visualized in the 3D environment, the label name for that structure appears and the structure is thereby identified immediately for the user.
4: Visualization Program and Navigational Tools
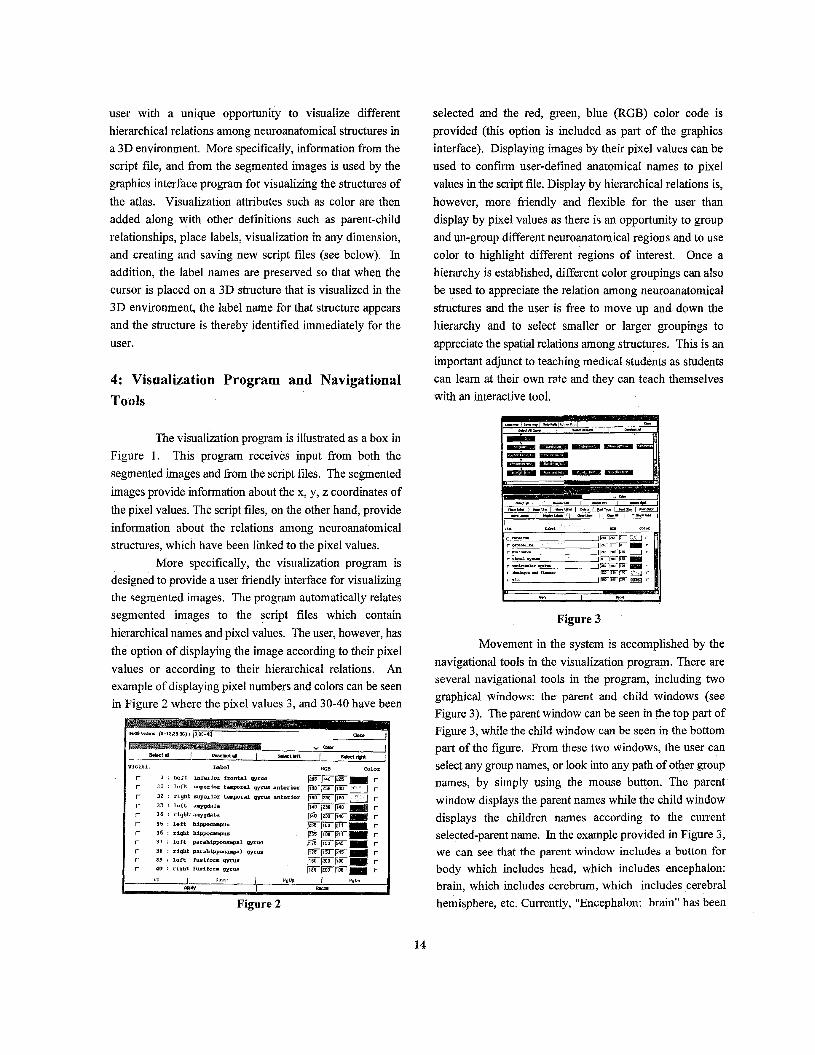
selected and the red, green, blue (RGB) color code is provided (this option is included as part of the graphics interface). Displaying images by their pixel values can be used to confirm user-defined anatomical names to pixel values in the script file. Display by hierarchical relations is, however, more friendly and flexible for the user than display by pixel values as there is an opportunity to group and un-group different neuroanatomical regions and to use color to highlight different regions of interest. Once a hierarchy is established, different color groupings can also be used to appreciate the relation among neuroanatomical structures and the user is free to move up and down the hierarchy and to select smaller or larger groupings to appreciate the spatial relations among structures. This is an important adjunct to teaching medical students as students can learn at their own rate and they can teach themselves with an interactive tool.
The visualization program is illustrated as a box in Figure 1. This program receives input from both the segmented images and from the script files. The segmented images provide information about the x, y, z coordinates of the pixel values. The script files, on the other hand, provide information about the relations among neuroanatomical structures, which have been linked to the pixel values.
More specifically, the visualization program is designed to provide a user friendly interface for visualizing the segmented images. The program automatically relates segmented images to the script files which contain hierarchical names and pixel values. The user, however, has the option of displaying the image according to their pixel values or according to their hierarchical relations. An example of displaying pixel numbers and colors can be seen in Figure 2 where the pixel values 3, and 30-40 have been
I I
" - - Figure 3
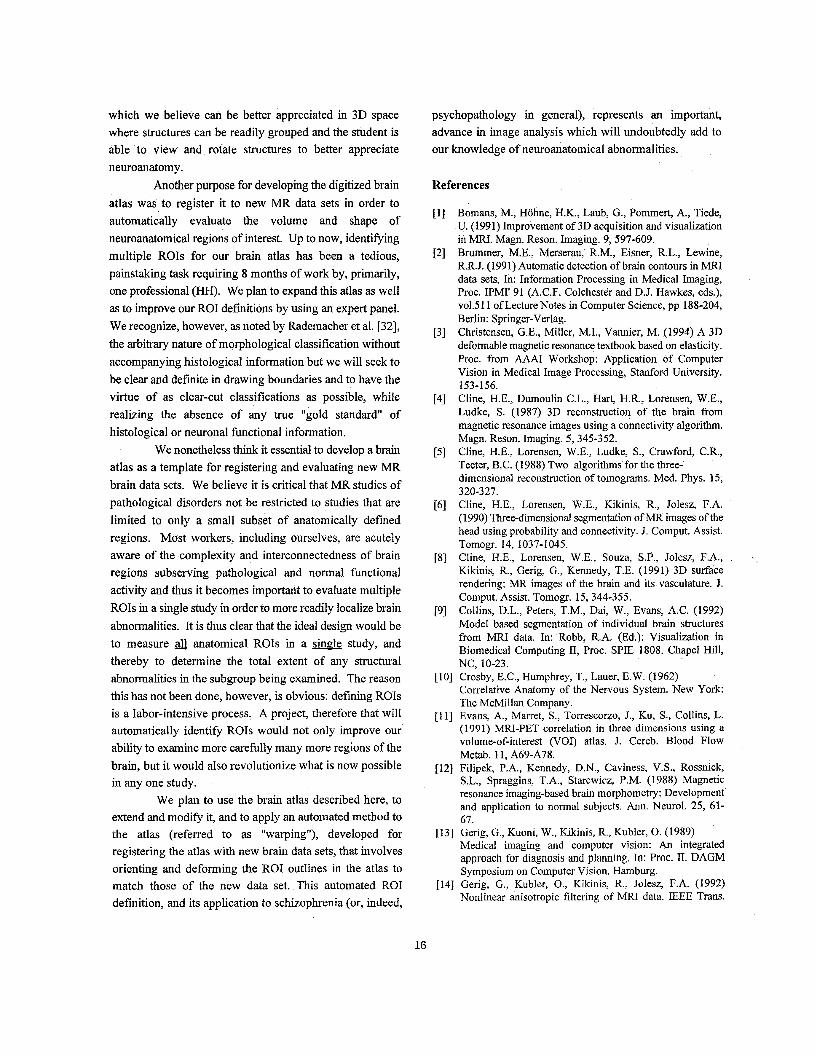
Movement in the system is accomplished by the navigational tools in the visualization program. There are several navigational tools in the program, including two graphical windows: the parent and child windows (see Figure 3). The parent window can be seen in the top part of Figure 3 , while the child window can be seen in the bottom part of the figure. From these two windows, the user can select any group names, or look into any path of other group names, by simply using the mouse button. The parent window displays the parent names while the child window displays the children names according to the current selected-parent name. In the example provided in Figure 3, we can see that the parent window includes a button for body which includes head, which includes encephalon: brain, which includes cerebrum, which includes cerebral hemisphere, etc. Currently, "Encephalon: brain" has been
14

selected in the parent window and in the child window we see cerebrum, cerebellum, brainstem, visual system, ventricular system, and meninges and sinuses.
Figure 4 These two graphical windows, parent and child,
provide the user with the ability to navigate through any part of the hierarchical structures as well as the ability to select any desired anatomy structures to display in 3D. These two windows are generally open on the screen at the same time that the following display windows are open: 1) interactive atlas render window, which provides the ability to visualize structures in any direction; 2) a label map window, for saving or loading a script file or pixel list; and, 3) a color map window, for changing colors (all of these windows can be seen in Figure 4).
There are also a number of 3D display tools that provide the user with the ability to: (1) view the image in any direction (angle, elevation, and rotation) (see Figure 4); (2) scale the size of the image (for visualizing small objects); (3) clip part of an image in any dimension (to display hidden objects); (4) display hierarchical structures as a group or by individual colors; (5) change colors of the image by using rgb slide bars (see Figure 4); (6) place labels on image to annotate parts of 3D display; (7) show grid on image for editing place labels; (8) change font color, font type, font size of place labels; (9) draw lines on 3D display to assist in pointing to brain regions identified by place labels; and, (10) save labels, script files, and images for slides, videotape, or future use of brain atlas.
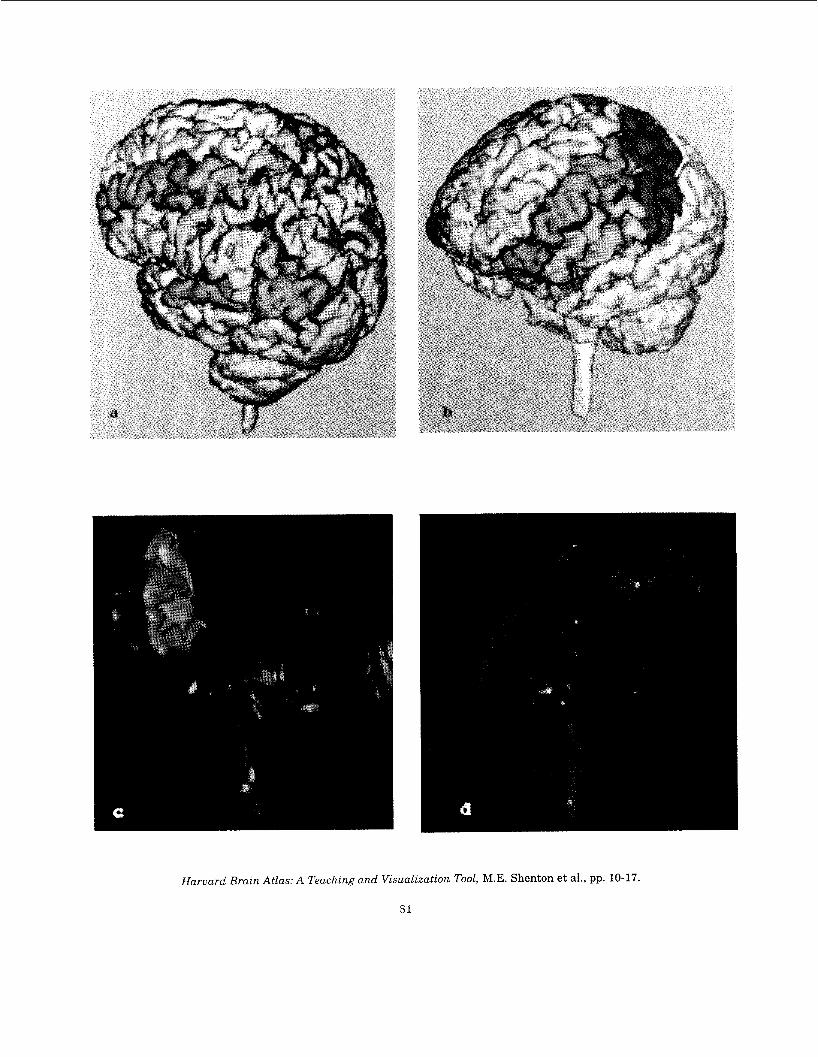
Examples of some of these functions can be seen in the color plate included at the end of these proceedings. Here, the neocortex can be seen in different orientations (panel a & b) with different color renderings for the different gyri. Superior frontal gyrus, for example, is shown in Yellow, middle frontal gyrus in Purple, inferior frontal gyrus in Peach, and pre- and post- central gyri in Turquoise. Panel a & b were created using the dividing cubes algorithm with a rotate program provided by General Electric
Corporation, while panel c & d were created using the marching cubes algorithm with leotool, a program provided by Sun Microsystems. In panel c & d, the limbic system structures can be appreciated as well as the optic pathway. Here we see the eyeball (Gray), the optic nerve (Green), and the lateral geniculate bodies (Bright Green), which are slightly posterior and superior to the fourth ventricle. The corticospinal tract is also visible (Pale Yellow) as are the pre- and post- central gyri (Pink area surrounding corticospinal tract). The caudate nucleus (Red) can be seen superior to the putamen (Brown). In Panel d, the entire ventricular system can be seen. Its different component parts are presented in different shades of blue.
In summary, these tools enable the user to link information in a script file that contains hierarchical information about neuroanatomical relations with information from segmented images in order to display this information using a graphics interface. The high points of the atlas include the flexibility in grouping and un-grouping elements in the system and the ability to store new script files which are as easy to create and edit as a text file.
5: DISCUSSION
We have presented initial data from a digitized MR brain atlas that we are developing. This can serve as both an educational tool and as a method for the automatic identification of ROIs for new MR data sets. By linking labels to a set of voxels, we were able to display many specific neuroanatomical structures. This labelling system also incorporated a hierarchical organization so that neuroanatomical structures could be grouped according to specified relations among structures. Thus cortical gyri were subdivided into frontal, middle, and inferior frontal gyri, etc. and the ventricular system was subdivided into lateral, third, and fourth ventricles, and so forth, with the labelling of component tissues being hierarchically arranged. Additionally, certain hctionally related systems, such as the corticospinal tract, were included.
All of these features make the digitized human brain atlas particularly useful as a basis for teaching neuroanatomy, an implementation that has been discussed extensively by numerous investigators. We plan to expand the data base of this atlas and to allow medical students to use it to evaluate the spatial relationships among structures
15
which we believe can be better appreciated in 3D space where structures can be readily grouped and the student is able to view and rotate structures to better appreciate neuroanatomy.
Another purpose for developing the digitized brain atlas was,to register it to new MR data sets in order to automatically evaluate the volume and shape of neuroanatomical regions of interest. Up to now, identifying multiple ROIs for our brain atlas has been a tedious, painstaking task requiring 8 months of work by, primarily, one professional (HH). We plan to expand this atlas as well as to improve our ROI definitions by using an expert panel. We recognize, however, as noted by Rademacher et al. [32], the arbitrary nature of morphological classification without accompanying histological information but we will seek to be clear and definite in drawing boundaries and to have the virtue of as clear-cut classifications as possible, while realizing the absence of any true “gold standard” of histological or neuronal functional information.
We nonetheless think it essential to develop a brain atlas as a template for registering and evaluating new MR brain data sets. We believe it is critical that MR studies of pathological disorders not be restricted to studies that are limited to only a small subset of anatomically defined regions. Most workers, including ourselves, are acutely aware of the complexity and interconnectedness of brain regions subserving pathological and normal functional activity and thus it becomes important to evaluate multiple ROIs in a single study in order to more readily localize brain abnormalities. It is thus clear that the ideal design would be to measure anatomical ROIs in a single study, and thereby to determine the total extent of any structural abnormalities in the subgroup being examined. The reason this has not been done, however, is obvious: defining ROIs is a labor-intensive process. A project, therefore that will automatically identify ROIs would not only improve our ability to examine more carefully many more regions of the brain, but it would also revolutionize what is now possible in any one study.
We plan to use the brain atlas described here, to extend and modify it, and to apply an automated method to the atlas (referred to as “warping”), developed for registering the atlas with new brain data sets, that involves orienting and deforming the ROI outlines in the atlas to match those of the new data set. This automated ROI definition, and its application to schizophrenia (or, indeed,
psychopathology in general), represents an important, advance in image analysis which will undoubtedly add to our knowledge of neuroanatomical abnormalities.
References
Bomans, M., Hohne, H.K., Laub, G., Pommert, A., Tiede, U. (1991) Improvement of 3D acquisition and visualization in MRI. Magn. Reson. Imaging. 9, 597-609. Brummer, M.E., Merserau, R.M., Eisner, R.L., Lewine, R.R.J. (1991) Automatic detection of brain contours in MRI data sets, In: Information Processing in Medical Imaging, Proc. IPMI’ 91 (A.C.F. Colchester and D.J. Hawkes, eds.), vo1.511 of Lecture Notes in Computer Science, pp 188-204, Berlin: Springer-Verlag. Christensen, G.E., Miller, M.I., Vannier, M. (1994) A 3D deformable magnetic resonance textbook based on elasticity. Proc. from AAA1 Workshop: Application of Computer Vision in Medical Image Processing, Stanford University.
Cline, H.E., Dumoulin C.L., Hart, H.R., Lorensen, W.E., Ludke, S. (1987) 3D reconstruction of the brain from magnetic resonance images using a connectivity algorithm. Magn. Reson. Imaging. 5, 345-352. Cline, H.E., Lorensen, W.E., Ludke, S., Crawford, C.R., Teeter, B.C. (1988) Two algorithms for the three- dimensional reconstruction of tomograms. Med. Phys. 15,
Cline, H.E., Lorensen, W.E., Kikinis, R., Jolesz, F.A. (1990) Three-dimensional segmentation of MR images of the head using probability and connectivity. J. Comput. Assist. Tomogr. 14, 1037-1045. Cline, H.E., Lorensen, W.E., Souza, S.P., Jolesz, F.A., Kikinis, R., Gerig, G., Kennedy, T.E. (1991) 3D surface rendering: MR images of the brain and its vasculature. J. Comput. Assist. Tomogr. 15, 344-355. Collins, D.L., Peters, T.M., Dai, W., Evans, A.C. (1992) Model based segmentation of individual brain structures from MRI data. In: Robb, R.A. (Ed.): Visualization in Biomedical Computing 11, Proc. SPIE 1808. Chapel Hill,
Crosby, E.C., Humphrey, T., Lauer, E. W. (1 962) Correlative Anatomy of the Nervous System. New York: The McMillan Company. Evans, A., Marret, S., Torrescorzo, J., Ku, S., Collins, L. (1991) MRI-PET correlation in three dimensions using a volume-of-interest (VOI) atlas. J. Cereb. Blood Flow Metab. 11, A69-A78. Filipek, P.A., Kennedy, D.N., Caviness, V.S., Rossnick, S.L., Spraggins, T.A., Starewicz, P.M. (1988) Magnetic resonance imaging-based brain morphometry: Development and application to normal subjects. Ann. Neurol. 25, 61- 67. Gerig, G., Kuoni, W., Kikinis, R., Kubler, 0. (1989) Medical imaging and computer vision: An integrated approach for diagnosis and plannmg. In: Proc. 11. DAGM Symposium on Computer Vision. Hamburg.
153-156.
320-327.
NC, 10-23.
[14] Gerig, G., Kubler, -O., Kikinis, R., Jolesz, F.A. (1992) Nonlinear anisotropic filtering of MRI data. IEEE Trans.
16

Med. Imaging. 11,221-232. 1151 Greitz, T., Bohm, C., Holte, S., Eriksson, L. (1991) A
computerized brain atlas: Construction, anatomical content, and some applications. J. Comput. Assist. Tomogr. 15, 26- 38.
[16] Hermann, G.T., Liu, H.K. (1979) Dynamic boundary surface detection. Comp. Graphics Image Process. 9, 130- 138.
[17] Hohne, K.H., DeLaPa, R.L., Bernstein, R., Taylor, R.C. (1 987) Combined surface display and reformatting for the 3D-analysis of tomographic data. Invest. Radio]. 22, 658- 664.
[18] Hohne, K.H., Bomans M, Pommert A., Riemer M., Schiers, C., Tiede, U., Wiebecke, G. (1990) 3D- Visualization of tomographic volume data using the generalized voxel-model. Visual Comput. 6, 28-36.
[19] Hahne, K.H., Bomans, M., Riemer M., Schubert, R., Tiede, U., Lierse, W. A 3D anatomical atlas based on a volume model. (1992a) IEEE Comput. Graphics Appl. 12,
[20] Hohne, K.H., Pommert, A., Riemer, M., Schiemann, T., Schubert, R., Tiede, U., Lierse, W. (1992b) Framework for the generation of 3D anatomical atlases. In: Robb, R.A. (Ed.): Visualization in Biomedical Computing 11, Proc. SPIE 1808. Chapel Hill, NC. 510-520.
[21] Hokama, H., Shenton, M.E., Kikinis, R., Jolesz, F.A., McCarley, R.W. (1994) Basal ganglia volume in schizophrenia: An MR study. Biological Psychiatry. 381.
[22] Kikinis, R., Shenton, M.E., Jolesz, F.A., Gerig, G., Martin, J., Anderson, M., Metcalf, D., Guttman, C., McCarley, R.W., Lorensen, W.E., Cline, H.E. (1992) Routine quantitative analysis of brain and cerebrospinal fluid spaces with MR imaging. J. Mag. Res. Imaging. 2,
[23] Kohn, M.I., Tanna, N.K., Herman, G.T., Resnick, S.M., Mosley, P.D., Gur, R.E., Alavi, A., Zimmerman, R.A., Gur, R.C. (1991) Analysis of brain and cerebrospinal fluid volumes with MR imaging. Radiology. 178, 115-122.
1241 Kumar, A., Welti, D., Ernst, R. (1975) NMR fourier zeugmatography. Magn. Reson. Imaging. 18,69-83.
[25] Lehmann, E.D., Hawkes D.J., Hill D.L., Bird C.F., Robinson G.P., Colchester A.C., Maisey, M.N. (1991) Computer-aided interpretation of SPECT images of the brain using an MRI-derived 3D neuroanatomical atlas. Med. Inf. 16, 15 1 - 166.
[26] Lorensen, W.E., Cline, H.E. (1987) Marching cubes: A high resolution 3D surface construction algorithm. Comput. Graphics. 21, 163-169.
Computerized three-dimensional normal atlas. Radiat. Med.
72-78.
619-629.
[27] Mano I., Suto, Y., Suzuki M., Iio M. (1990)
8, 50-54. [28] Marr, D. (1982) Vision. NY: Freeman. [29] Perona, P., Malik, J. (1987) Scale space and edge detection
using anisotropic diffusion. Proc IEEE Workshop on Computer Vision. 16-22.
[30] Pommert, A., Schubert, R., Riemer, M., Schiemann, T., Tiede U., Hohne, K.H. (1994) Symbolic modeling of human anatomy for visualization and simulation. IEEE: Visualization in Biomedical Computing. 2359,412-423.
[31] Pfefferbaum, A., Lim, K.O., Rosenblum, M., Zipursky,
R.B. (1990) Brain magnetic resonance imaging: Approaches for investigating schizophrenia. Schizophr. Bull. 16, 453-476.
[32] Radamacher, J., Galaburda, A.M., Kennedy, D.N., Filipek, P.A., Caviness, V.S.J. (1992) Human cerebral cortex: Localization, parcellation and morphometry with magnetic resonance imaging. J. of Cognitive Neuroscience.
[33] Schiemann, T., Htihne, K.H., Koch, C., Pommert, A., Riemer, M., Schubert, R., Tiede, U. (1994) Interpretation of tomographic images using automatic atlas lookup. IEEE: Visualization in Biomedical Computing. vol 2359,
[34] Shenton, M.E., Kikinis, R., Jolesz, F.A., Pollak, S.D.,
4,352-374.
457-465.
LeMay, M., Wible, C.G., Hokama, H.H., Martin, J., Metcalf, D., Coleman, M., McCarley, R. W. (1 992) Abnormalities of the left temporal lobe and thought disorder in schizophrenia: A quantitative magnetic resonance imaging study. N. Eng. J. Med. 327,604-612.
[35] Subsol, G, Thirion J., Ayach, N. (1994) Steps towards automatic building of anatomical atlases. IEEE: Visualization in Biomedical Computing. ~012359,435-446.
[36] Tjede, U., Bomans, M., Hbhne, K.H., Pommert, A., Riemer, M., Schiemann, T., Schubert, R., Lierse, W. A computerized three-dimensional atlas of the human skull and brain. (1993) Am. J. Neuroradiology. 14, 551-559.
[37] Vannier, M.W., Gado, M.H., Marsh, J.L. (1983) Three- dimensional display of intracranial soft tissue structures. Am. J. Neuroradiology. 4, 520-521.
(1985) Multispectral analysis of magnetic resonance images. Radiology. 154,22 1-224.
[39] Wible, C.G., Shenton, M.E., Hokama, H.H., Kikinis, R., Jolesz, F.A., Metcalf, D., McCarley, R.W. (1995) Prefrontal cortex, positive symptoms, and schizophrenia: A quantitative MRI study. Arch. Gen. Psychiatry. 52:279-288.
[40] Wyper, D.J., Pickard, J.D., Matheson, M. (1979) Accuracy of ventricular volume estimation. J. Neurol. Neurosurg. Psychiatry. 42, 345-350.
[38] Vannier, M.W., Butterfield, R.L., Jordan, D., et al.
ACKNOWLEDGEMENTS
This research was supported in part by a Research Scientist Development Award (KO2-MH-0110-01 W S ] ) from the National Institute of Mental Health, a 1R29 MH-50747-01 (MES) from the National Institute of Mental Health, an RO1 MH-40-799 (RWM) from the National Institute of Mental Health, the Department of Veterans Affairs (RWM), Brockton Schizophrenia Center of the Department of Veterans Affairs (RWM), and by the Commonwealth of Massachusetts Research Center (RWM).
17
Harvard Brain Atlas: A Teaching and Visualization Tool, M.E. Shenton et al., pp. 10-17
81
Related Documents