Harry Williams, Earth Science 1 CLIMATIC REGIONS Climate = "Long-term average weather, including an indication of temperature levels, rainfall totals and their seasonality and extremes". 4 major elements of climate: temperature, precipitation, winds, humidity. Temperature and moisture are the two most prominent elements; not surprisingly, the controls on climate are all factors which determine the input and output of heat and moisture for a specific location. 7 controlling factors: latitude, altitude, distribution of land and sea, ocean currents, distribution of

Harry Williams, Earth Science1 CLIMATIC REGIONS Climate = "Long-term average weather, including an indication of temperature levels, rainfall totals and.
Dec 29, 2015
Welcome message from author
This document is posted to help you gain knowledge. Please leave a comment to let me know what you think about it! Share it to your friends and learn new things together.
Transcript

Harry Williams, Earth Science 1
CLIMATIC REGIONS
Climate = "Long-term average weather, including an indication of temperature levels, rainfall totals and their seasonality and extremes".4 major elements of climate: temperature, precipitation, winds, humidity.Temperature and moisture are the two most prominent elements; not surprisingly, the controls on climate are all factors which determine the input and output of heat and moisture for a specific location.7 controlling factors: latitude, altitude, distribution of land and sea, ocean currents, distribution of mountains, wind patterns, location of major centers of high and low pressure.
Harry Williams, Earth Science 2
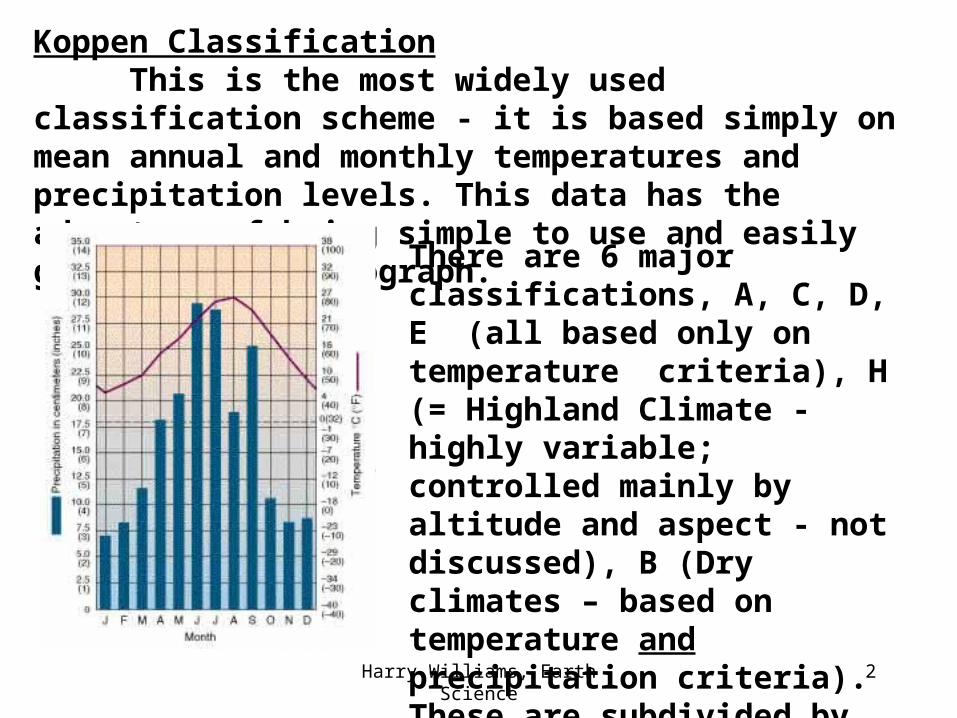
Koppen ClassificationThis is the most widely used classification scheme - it is
based simply on mean annual and monthly temperatures and precipitation levels. This data has the advantage of being simple to use and easily graphed as a climograph.
There are 6 major classifications, A, C, D, E (all based only on temperature criteria), H (= Highland Climate - highly variable; controlled mainly by altitude and aspect - not discussed), B (Dry climates – based on temperature and precipitation criteria). These are subdivided by 2nd and 3rd letters (based on temperature or precipitation).

Harry Williams, Earth Science 3
Fig 10.4
The climate zones clearly correspond to LATITUDE, but there are some obvious exceptions.

Harry Williams, Earth Science 4
“A” Climates

Harry Williams, Earth Science 5
A: Tropical Climates Average temperature of each month > 180 C. Characteristics: Low latitudes (ca. 20N-20S); warm year-round (no winter); Abundant rainfall. 2nd Letters: f: rain forest - average rainfall each month at least 6 cmm: monsoon - 1-3 months with < 6 cm rainfallw: savanna; 3-6 months with < 6 cm rainfall

Harry Williams, Earth Science 6
Fig. 10.7
Harry Williams, Earth Science 7
Controls On “A” Climates
Mainly equatorial; warm and wet every day -> seasonless; very small annual temperature range (2-30 C). Average temperatures usually about 800 F. Controlled by latitude -> constant high insolation. Usually 60-100 inches rainfall per year. Located close to ITCZ -> convergence of Trade Winds and convergent uplift. Heating -> convection. Onshore winds on east coasts -> orographic rainfall e.g. world record average annual rainfall = 460 inches in Hawaii (Denton gets about 33 inches). Major areas = Amazon Basin; Zaire Basin; East Indies.

Harry Williams, Earth Science 8
“B” Climates
Harry Williams, Earth Science 9
B: Dry Climates Potential evapotranspiration > precipitationCharacteristics: cover 30% of land surface (largest of any group); no rain due to lack of uplift associated with subtropical highs - descending air). 2nd Letters: W: arid; precipitation less than half potential evapotranspiration. S: semi-arid; precipitation more than half potential evapotranspiration. 3rd Letters: h: hot - average annual temperature > 180 C.k: cold - average annual temperature < 180 C.

Harry Williams, Earth Science 10
Bwhclimateeg.jpg

Harry Williams, Earth Science 11
Fig. 10.25a

Harry Williams, Earth Science 12
Controls On “B” Climates.
- descending air, little precipitation. STH's are most pronounced on eastern side of ocean basins -> strongest effect on western edge of adjacent continents (deserts do not extend to eastern side of continents). The presence of Asia makes North Africa like a continent without an east coast (no source of moisture), therefore desert conditions extend further inland.- Atacama desert is created by high pressure; cold Humboldt current offshore -> stable air; Andes Mountains to east -> rainshadow for air coming from east.- the clear skies and tropical latitudes result in intense insolation in summer -> world record highest temperature (1360 F) world record daily temperature range (1000 F); world record highest average annual temperature (940 F); world record least annual average precipitation (0.03 inches).

Harry Williams, Earth Science 13

Harry Williams, Earth Science 14
“C” Climates

Harry Williams, Earth Science 15
C: Mild Midlatitude ClimatesAverage temperature warmest month > 10 0 C; average temperature of coldest month > 00 C. Pronounced seasons and variability (meeting of tropical and polar air).2nd Letters:s: summer dry - driest summer month has < 1/3 average precipitation of wettest winter month.w: winter dry - driest winter month has < 1/10 average precipitation of wettest summer month.f: moist - no dry season (doesn't fit either above)3rd Letters:a: hot summers - average temperature of warmest month >220C.b: warm summers - average temperature of warmest month < 220C. At least 4 months with average temperatures > 100 C.c: cool summers – 1 to 3 months with average temperatures > 100C.

Harry Williams, Earth Science 16

Harry Williams, Earth Science 17
Controls On “C” ClimatesHumid Subtropical (Cfa)- on eastern side of continents in midlatitudes away from influence of STH's. Hot humid summers, mild winters with occasional severe cold outbursts.e.g. winter temperatures minimums can be 10-200 F lower than in west coasts climates (Mediterranean) at similar latitudes. Summer maximum rainfall due to convection (thunderstorms in North Texas) and cyclonic storms; onshore air flows.Mediterranean (Csb)Influenced by STH’s in summer - west coast of large continents. Pronounced summer drought. Warm year-round.

Harry Williams, Earth Science 18

Harry Williams, Earth Science 19“D” Climates

Harry Williams, Earth Science 20
D: Severe Midlatitude ClimatesWarmest month average > 100 C; coldest month average < 00 C. Continentality -> large annual temperature range. Pronounced seasons. Summer maximum rainfall due to convection; winter rainfall due to cyclonic activity.2nd and 3rd Letters same as for C climates, plus d = very cold winters - average temperature of coldest month < -380 C.

Harry Williams, Earth Science 21
Harry Williams, Earth Science 22
Controls on “D” Climates:Central-East side of continents in the higher midlatitudes; Day to day weather, especially in winter, characterized by variability associated with passage of pressure systems, cyclonic storms. Much winter precipitation is snow - especially further north. Inland locations exhibit continentality (NOT moderated by oceans - more “extreme” climates).

Harry Williams, Earth Science 23
“E” Climates

Harry Williams, Earth Science 24
E: Polar ClimatesNo month with average temperature > 100 C; no true summer. Precipitation is very low, but so is evaporation, so the whole group is classified as humid. Low insolation -> coldest summers, lowest annual and absolute temperatures.2nd Letter:T: tundra - at least 1 month with average temperature > 00 C < 100 C. F: frost - no month with average temperature > 00 C.

Harry Williams, Earth Science 25
Harry Williams, Earth Science 26
The tundra climate zone is defined mainly on the basis of vegetation: its equator-ward boundary is the 100 C average temperature of the warmest month isotherm - this is the poleward limit of tree growth (the tree line); its poleward limit is the 00 C average temperature of the warmest month isotherm - this is the poleward limit of vegetation growth. Found mostly in the northern hemisphere - little land at suitable latitudes in southern hemisphere.
Related Documents