Welcome message from author
This document is posted to help you gain knowledge. Please leave a comment to let me know what you think about it! Share it to your friends and learn new things together.
Transcript

8/14/2019 HARRIS COUNTY - Pasadena ISD - 1998 Texas School Survey of Drug and Alcohol Use
http://slidepdf.com/reader/full/harris-county-pasadena-isd-1998-texas-school-survey-of-drug-and-alcohol 1/213

8/14/2019 HARRIS COUNTY - Pasadena ISD - 1998 Texas School Survey of Drug and Alcohol Use
http://slidepdf.com/reader/full/harris-county-pasadena-isd-1998-texas-school-survey-of-drug-and-alcohol 2/213
PasadenaSpring 1998
______________________________________________________________________________________________
Table T-1: How recently, if ever, have you used...
Past School Ever NeverMonth Year Used Used
_____________________________________________________________________________________Any tobacco product All 26.4% 36.2% 55.5% 44.5%
Grade 7 15.9% 22.9% 39.5% 60.5%Grade 8 23.9% 33.2% 53.9% 46.1%Grade 9 26.6% 38.6% 57.3% 42.7%Grade 10 33.6% 42.4% 63.0% 37.0%Grade 11 29.3% 41.1% 62.3% 37.7%Grade 12 33.8% 44.3% 62.8% 37.2%
_____________________________________________________________________________________
Cigarettes All 25.1% 34.8% 54.1% 45.9%Grade 7 14.9% 22.6% 38.6% 61.4%Grade 8 22.8% 32.0% 52.4% 47.6%Grade 9 25.7% 37.0% 56.7% 43.3%Grade 10 30.9% 40.4% 59.6% 40.4%Grade 11 28.1% 39.0% 61.2% 38.8%Grade 12 32.3% 43.0% 61.5% 38.5%
_____________________________________________________________________________________Smokeless tobacco All 4.5% 7.2% 13.2% 86.8%
Grade 7 2.6% 4.5% 9.0% 91.0%Grade 8 4.8% 6.6% 11.3% 88.7%Grade 9 3.5% 6.0% 10.9% 89.1%Grade 10 6.2% 9.9% 18.5% 81.5%Grade 11 6.1% 10.3% 18.4% 81.6%Grade 12 4.6% 6.9% 13.3% 86.7%
______________________________________________________________________________________________
Table T-2: How often do you normally use...
Any tobacco product?
Several Several About About Less Than
Never Every Times Times Once a Once a Once aUsed Day a Week a Month Month Year Year

8/14/2019 HARRIS COUNTY - Pasadena ISD - 1998 Texas School Survey of Drug and Alcohol Use
http://slidepdf.com/reader/full/harris-county-pasadena-isd-1998-texas-school-survey-of-drug-and-alcohol 3/213
All 46.6% 8.2% 5.2% 7.5% 10.6% 9.1% 12.9%Grade 7 59.7% 1.9% 6.2% 5.4% 8.7% 8.1% 10.0%Grade 8 49.1% 4.4% 5.5% 6.8% 10.8% 11.0% 12.3%Grade 9 44.0% 6.4% 4.0% 8.7% 12.1% 10.2% 14.7%Grade 10 40.1% 13.9% 6.5% 9.2% 9.9% 7.8% 12.6%Grade 11 42.8% 13.4% 3.6% 6.8% 9.8% 8.9% 14.7%Grade 12 39.8% 12.9% 4.9% 8.0% 12.5% 8.2% 13.8%
Cigarettes?
Several Several About About Less ThanNever Every Times Times Once a Once a Once aUsed Day a Week a Month Month Year Year
All 47.3% 7.6% 5.1% 7.6% 10.4% 9.0% 13.0%Grade 7 60.7% 2.0% 6.3% 5.1% 8.6% 7.6% 9.8%Grade 8 49.5% 3.9% 5.2% 6.7% 11.5% 10.8% 12.3%Grade 9 44.1% 6.3% 3.9% 8.9% 11.1% 10.4% 15.4%Grade 10 41.6% 12.8% 6.4% 9.4% 9.8% 7.7% 12.4%
Grade 11 42.9% 12.1% 4.1% 7.6% 9.5% 8.7% 15.2%Grade 12 40.4% 12.1% 4.6% 8.6% 12.5% 7.9% 13.8%

8/14/2019 HARRIS COUNTY - Pasadena ISD - 1998 Texas School Survey of Drug and Alcohol Use
http://slidepdf.com/reader/full/harris-county-pasadena-isd-1998-texas-school-survey-of-drug-and-alcohol 4/213
PasadenaSpring 1998
______________________________________________________________________________________________
Smokeless tobacco?
Several Several About About Less ThanNever Every Times Times Once a Once a Once aUsed Day a Week a Month Month Year Year
All 85.7% 1.0% 1.1% 1.2% 2.7% 2.8% 5.4%Grade 7 90.0% 0.2% 0.5% 2.2% 2.0% 1.7% 3.4%Grade 8 89.4% 0.9% 1.1% 0.9% 2.5% 2.2% 2.9%Grade 9 86.3% 0.3% 1.1% 0.6% 3.7% 2.8% 5.1%Grade 10 79.3% 1.8% 1.8% 1.5% 3.3% 4.6% 7.7%Grade 11 83.2% 2.0% 1.3% 1.3% 2.5% 2.3% 7.5%Grade 12 84.4% 1.4% 1.2% 1.0% 1.9% 3.4% 6.7%
______________________________________________________________________________________________
Table T-3: In the past 30 days, how many cigarettes have you smoked?
>1 But >10 But >1 Pack<1 Per <10 Per <1 Pack But <2 >2 Packs
None Day Day Per Day Packs/Day Per Day
All 72.5% 14.7% 8.2% 2.4% 1.8% 0.3%Grade 7 81.2% 11.9% 4.9% 0.7% 0.9% 0.4%Grade 8 74.8% 16.4% 6.6% 1.1% 1.1% * %Grade 9 73.7% 13.9% 7.4% 1.8% 2.5% 0.7%Grade 10 65.3% 17.5% 10.9% 4.0% 2.0% 0.2%Grade 11 69.6% 12.4% 12.0% 3.7% 2.2% 0.2%Grade 12 65.9% 17.0% 9.4% 4.8% 2.3% 0.6%
______________________________________________________________________________________________
Table T-4: Average age of first use of:
Grade 7 Grade 8 Grade 9 Grade 10 Grade 11 Grade 12
Tobacco 10.7 11.4 11.9 12.6 13.1 13.9

8/14/2019 HARRIS COUNTY - Pasadena ISD - 1998 Texas School Survey of Drug and Alcohol Use
http://slidepdf.com/reader/full/harris-county-pasadena-isd-1998-texas-school-survey-of-drug-and-alcohol 5/213
______________________________________________________________________________________________
Table T-5: If you wanted some, how difficult would it be to get...
Cigarettes?
Never Very Somewhat Somewhat VeryHeard Of Impossible Difficult Difficult Easy Easy
All 6.9% 9.3% 3.3% 7.8% 19.5% 53.3%Grade 7 9.9% 20.7% 6.5% 11.0% 22.8% 29.1%Grade 8 9.4% 11.7% 3.5% 10.8% 22.3% 42.3%Grade 9 7.0% 6.1% 3.4% 7.7% 20.0% 55.8%Grade 10 5.4% 5.0% 1.6% 6.8% 19.9% 61.2%Grade 11 4.7% 4.7% 2.2% 3.9% 18.9% 65.7%Grade 12 2.5% 3.5% 0.8% 3.7% 8.9% 80.5%
Smokeless Tobacco?
Never Very Somewhat Somewhat Very
Heard Of Impossible Difficult Difficult Easy Easy
All 19.1% 14.4% 6.7% 9.7% 16.5% 33.6%Grade 7 27.5% 27.9% 11.8% 10.7% 10.1% 12.0%Grade 8 25.6% 20.8% 7.9% 9.0% 16.5% 20.2%Grade 9 16.7% 9.5% 6.5% 12.1% 22.3% 32.8%Grade 10 15.0% 10.0% 6.1% 10.2% 17.7% 40.9%Grade 11 12.2% 7.8% 2.3% 8.6% 21.0% 48.2%Grade 12 13.9% 4.9% 2.8% 6.0% 9.6% 62.9%

8/14/2019 HARRIS COUNTY - Pasadena ISD - 1998 Texas School Survey of Drug and Alcohol Use
http://slidepdf.com/reader/full/harris-county-pasadena-isd-1998-texas-school-survey-of-drug-and-alcohol 6/213
PasadenaSpring 1998
______________________________________________________________________________________________
Table T-6: About how many of your close friends...
Use any tobacco product?
Never heardNone A Few Some Most All
All 21.7% 32.2% 23.1% 19.1% 3.9%Grade 7 35.8% 32.0% 17.5% 11.9% 2.8%Grade 8 24.2% 34.8% 19.9% 17.6% 3.5%Grade 9 18.9% 31.0% 26.9% 19.2% 4.0%Grade 10 16.1% 28.2% 26.4% 24.5% 4.8%Grade 11 16.0% 33.4% 23.6% 22.2% 4.8%
Grade 12 14.2% 34.6% 25.4% 22.0% 3.9%
Smoke cigarettes?
Never heardNone A Few Some Most All
All 22.5% 33.0% 22.3% 18.7% 3.6%Grade 7 36.8% 32.5% 16.2% 11.9% 2.7%Grade 8 24.8% 35.3% 19.5% 17.0% 3.3%Grade 9 18.8% 32.5% 26.7% 18.6% 3.4%Grade 10 17.5% 29.0% 25.4% 23.7% 4.4%Grade 11 17.0% 33.9% 22.6% 22.0% 4.4%Grade 12 14.9% 35.4% 24.4% 21.4% 3.9%
Use a smokeless tobacco product?
Never heardNone A Few Some Most All
All 65.5% 20.4% 9.8% 3.4% 1.0%Grade 7 76.2% 13.8% 7.2% 1.9% 0.9%Grade 8 71.7% 17.9% 6.6% 3.2% 0.5%
Grade 9 63.0% 21.9% 10.2% 3.3% 1.6%Grade 10 57.7% 23.3% 12.6% 4.9% 1.6%

8/14/2019 HARRIS COUNTY - Pasadena ISD - 1998 Texas School Survey of Drug and Alcohol Use
http://slidepdf.com/reader/full/harris-county-pasadena-isd-1998-texas-school-survey-of-drug-and-alcohol 7/213
Grade 11 60.4% 21.2% 13.2% 4.3% 0.8%Grade 12 59.1% 27.8% 10.0% 2.9% 0.2%
______________________________________________________________________________________________
Table T-7: How do your parents feel about kids your age smoking cigarettes?
Strongly Mildly Mildly Strongly Don't
Disapprove Disapprove Neither Approve Approve Know
All 64.8% 14.5% 10.2% 1.7% 0.8% 8.0%Grade 7 72.2% 6.9% 3.8% 1.1% 1.0% 14.9%Grade 8 68.3% 11.5% 8.2% 1.1% 0.6% 10.3%Grade 9 65.6% 14.9% 11.4% 0.9% 0.7% 6.4%Grade 10 61.5% 18.0% 12.1% 2.3% 1.0% 5.0%Grade 11 61.7% 18.3% 12.0% 2.2% 1.1% 4.7%Grade 12 54.4% 21.2% 16.4% 3.2% 0.6% 4.1%

8/14/2019 HARRIS COUNTY - Pasadena ISD - 1998 Texas School Survey of Drug and Alcohol Use
http://slidepdf.com/reader/full/harris-county-pasadena-isd-1998-texas-school-survey-of-drug-and-alcohol 8/213
PasadenaSpring 1998
______________________________________________________________________________________________
Table T-8: How dangerous do you think it is for kids your age to use tobacco?
Very Somewhat Not Very Not at All Do NotDangerous Dangerous Dangerous Dangerous Know
All 39.7% 36.0% 15.4% 3.1% 5.8%Grade 7 48.1% 30.5% 12.0% 2.2% 7.1%Grade 8 42.1% 33.1% 14.2% 2.2% 8.5%Grade 9 38.5% 37.5% 14.7% 3.5% 5.8%Grade 10 36.8% 37.6% 17.8% 3.5% 4.3%Grade 11 34.7% 38.9% 19.1% 3.1% 4.2%Grade 12 34.2% 41.1% 16.2% 5.1% 3.4%

8/14/2019 HARRIS COUNTY - Pasadena ISD - 1998 Texas School Survey of Drug and Alcohol Use
http://slidepdf.com/reader/full/harris-county-pasadena-isd-1998-texas-school-survey-of-drug-and-alcohol 9/213
PasadenaSpring 1998
______________________________________________________________________________________________
Table A-1: How recently, if ever, have you used...
Past School Ever NeverMonth Year Used Used
_____________________________________________________________________________________Any alcohol product All 40.1% 55.6% 74.3% 25.7%
Grade 7 27.7% 37.1% 59.1% 40.9%Grade 8 36.9% 51.6% 72.1% 27.9%Grade 9 38.1% 56.5% 73.2% 26.8%Grade 10 44.3% 62.3% 81.6% 18.4%Grade 11 47.0% 64.1% 81.5% 18.5%Grade 12 55.0% 71.0% 85.7% 14.3%
_____________________________________________________________________________________
Beer All 28.2% 41.3% 59.7% 40.3%Grade 7 17.4% 25.8% 41.9% 58.1%Grade 8 24.7% 36.6% 56.9% 43.1%Grade 9 25.9% 40.4% 59.1% 40.9%Grade 10 31.4% 46.2% 66.9% 33.1%Grade 11 36.8% 51.3% 68.5% 31.5%Grade 12 40.3% 56.4% 72.7% 27.3%
_____________________________________________________________________________________Wine coolers All 29.0% 45.1% 63.6% 36.4%
Grade 7 21.0% 28.7% 46.1% 53.9%Grade 8 26.6% 42.2% 61.5% 38.5%Grade 9 27.8% 46.4% 60.6% 39.4%Grade 10 32.0% 50.2% 72.5% 27.5%Grade 11 32.9% 52.1% 71.8% 28.2%Grade 12 39.3% 58.7% 77.9% 22.1%
_____________________________________________________________________________________Wine All 18.3% 32.7% 52.3% 47.7%
Grade 7 13.9% 23.8% 38.4% 61.6%Grade 8 17.9% 28.1% 48.8% 51.2%Grade 9 18.8% 35.1% 53.6% 46.4%Grade 10 21.2% 37.3% 58.3% 41.7%Grade 11 18.9% 37.3% 58.5% 41.5%Grade 12 20.9% 39.0% 62.1% 37.9%
_____________________________________________________________________________________Liquor All 26.0% 38.8% 54.6% 45.4%

8/14/2019 HARRIS COUNTY - Pasadena ISD - 1998 Texas School Survey of Drug and Alcohol Use
http://slidepdf.com/reader/full/harris-county-pasadena-isd-1998-texas-school-survey-of-drug-and-alcohol 10/213
Grade 7 14.3% 22.5% 33.0% 67.0%Grade 8 21.8% 31.5% 48.5% 51.5%Grade 9 26.2% 37.8% 55.0% 45.0%Grade 10 29.8% 45.6% 62.4% 37.6%Grade 11 32.5% 48.8% 67.1% 32.9%Grade 12 38.3% 56.6% 73.0% 27.0%
______________________________________________________________________________________________
Table A-2: How often do you normally use...
Any alcohol product?
Several Several About About Less ThanNever Every Times Times Once a Once a Once aUsed Day a Week a Month Month Year Year
All 25.5% 0.9% 7.4% 18.7% 21.0% 16.5% 10.0%Grade 7 39.7% 1.2% 6.1% 11.2% 14.7% 14.9% 12.3%Grade 8 28.5% 0.9% 10.4% 13.2% 19.4% 17.2% 10.4%
Grade 9 24.8% 0.7% 6.1% 19.0% 24.6% 15.3% 9.5%Grade 10 21.1% 0.4% 8.3% 21.3% 21.3% 20.3% 7.2%Grade 11 18.3% 0.9% 5.9% 25.9% 21.7% 17.2% 10.2%Grade 12 13.7% 1.5% 7.9% 26.8% 26.2% 13.9% 9.9%

8/14/2019 HARRIS COUNTY - Pasadena ISD - 1998 Texas School Survey of Drug and Alcohol Use
http://slidepdf.com/reader/full/harris-county-pasadena-isd-1998-texas-school-survey-of-drug-and-alcohol 11/213
PasadenaSpring 1998
______________________________________________________________________________________________
Beer?
Several Several About About Less ThanNever Every Times Times Once a Once a Once aUsed Day a Week a Month Month Year Year
All 32.0% 0.7% 6.0% 15.4% 19.3% 14.0% 12.5%Grade 7 46.2% 0.7% 4.6% 8.7% 14.0% 12.8% 12.8%Grade 8 32.4% 0.6% 8.5% 9.8% 17.5% 16.2% 14.9%Grade 9 32.4% 0.6% 4.2% 16.6% 20.8% 14.6% 10.7%Grade 10 29.1% 0.5% 7.1% 18.4% 19.6% 13.7% 11.6%Grade 11 25.7% 0.7% 5.5% 20.9% 23.0% 11.8% 12.5%Grade 12 22.7% 1.6% 6.3% 21.1% 22.2% 14.1% 12.0%
Wine coolers?
Several Several About About Less ThanNever Every Times Times Once a Once a Once aUsed Day a Week a Month Month Year Year
All 30.3% 0.2% 4.9% 14.7% 20.9% 18.5% 10.5%Grade 7 47.7% 0.2% 4.6% 10.1% 14.4% 12.9% 10.1%Grade 8 31.8% 0.6% 5.8% 12.2% 20.0% 17.8% 11.8%Grade 9 31.1% 0.3% 4.7% 15.1% 21.3% 17.8% 9.8%Grade 10 24.2% * % 4.8% 16.6% 21.2% 24.7% 8.6%Grade 11 22.0% * % 4.1% 18.0% 23.3% 20.5% 12.2%Grade 12 19.3% * % 5.1% 18.3% 28.1% 18.1% 11.0%
Wine?
Several Several About About Less ThanNever Every Times Times Once a Once a Once aUsed Day a Week a Month Month Year Year
All 43.0% 0.2% 2.8% 8.0% 14.8% 20.0% 11.4%Grade 7 58.4% 0.2% 2.4% 5.9% 10.7% 14.3% 8.1%
Grade 8 43.2% 0.7% 2.8% 6.6% 13.8% 19.4% 13.5%Grade 9 41.4% * % 3.2% 10.2% 15.2% 21.9% 8.2%

8/14/2019 HARRIS COUNTY - Pasadena ISD - 1998 Texas School Survey of Drug and Alcohol Use
http://slidepdf.com/reader/full/harris-county-pasadena-isd-1998-texas-school-survey-of-drug-and-alcohol 12/213
Grade 10 39.0% * % 3.1% 8.5% 16.5% 22.3% 10.7%Grade 11 34.8% * % 2.5% 9.8% 16.5% 23.3% 13.0%Grade 12 37.0% 0.2% 2.4% 6.8% 17.3% 19.5% 16.8%
Liquor?
Several Several About About Less ThanNever Every Times Times Once a Once a Once a
Used Day a Week a Month Month Year Year
All 42.1% 0.4% 4.4% 12.4% 17.2% 14.3% 9.3%Grade 7 63.8% 0.5% 3.7% 5.1% 10.3% 9.8% 6.8%Grade 8 48.8% 0.2% 5.4% 10.2% 12.5% 12.7% 10.2%Grade 9 41.1% 0.3% 3.1% 13.0% 19.0% 14.2% 9.3%Grade 10 33.5% 0.2% 5.0% 16.4% 17.9% 18.9% 8.2%Grade 11 30.5% 0.7% 4.4% 14.8% 23.6% 14.8% 11.1%Grade 12 25.4% 0.5% 4.6% 18.0% 23.7% 17.1% 10.7%

8/14/2019 HARRIS COUNTY - Pasadena ISD - 1998 Texas School Survey of Drug and Alcohol Use
http://slidepdf.com/reader/full/harris-county-pasadena-isd-1998-texas-school-survey-of-drug-and-alcohol 13/213
PasadenaSpring 1998
______________________________________________________________________________________________
Table A-3: When you drink the following alcoholic beverages, how many drinks do you usually
have at one time, on average?
Beer
Never Ever 5 or More 1 to 4 Less Than 1
All 40.0% 60.0% 16.8% 29.1% 14.1%Grade 7 55.2% 44.8% 7.0% 22.9% 14.9%Grade 8 40.5% 59.5% 15.9% 29.0% 14.6%Grade 9 39.9% 60.1% 14.2% 31.1% 14.9%Grade 10 36.0% 64.0% 20.6% 30.5% 12.9%Grade 11 34.5% 65.5% 23.4% 29.6% 12.5%
Grade 12 27.7% 72.3% 25.4% 32.9% 14.0%
Wine Coolers
Never Ever 5 or More 1 to 4 Less Than 1
All 35.0% 65.0% 17.0% 39.2% 8.7%Grade 7 51.1% 48.9% 10.3% 27.1% 11.5%Grade 8 36.4% 63.6% 17.3% 38.2% 8.2%Grade 9 35.9% 64.1% 16.6% 39.2% 8.3%Grade 10 28.8% 71.2% 21.7% 41.2% 8.3%Grade 11 28.4% 71.6% 17.9% 46.9% 6.8%Grade 12 21.6% 78.4% 20.8% 48.7% 8.9%
Wine
Never Ever 5 or More 1 to 4 Less Than 1
All 47.3% 52.7% 6.5% 30.8% 15.4%Grade 7 59.5% 40.5% 4.2% 21.8% 14.6%Grade 8 47.2% 52.8% 5.8% 30.5% 16.5%Grade 9 47.5% 52.5% 8.1% 30.4% 14.0%Grade 10 43.6% 56.4% 8.1% 33.7% 14.6%
Grade 11 40.4% 59.6% 6.8% 37.1% 15.7%Grade 12 40.6% 59.4% 6.7% 34.6% 18.1%

8/14/2019 HARRIS COUNTY - Pasadena ISD - 1998 Texas School Survey of Drug and Alcohol Use
http://slidepdf.com/reader/full/harris-county-pasadena-isd-1998-texas-school-survey-of-drug-and-alcohol 14/213
Liquor
Never Ever 5 or More 1 to 4 Less Than 1
All 44.4% 55.6% 13.7% 29.2% 12.7%Grade 7 64.1% 35.9% 6.0% 16.7% 13.2%Grade 8 49.3% 50.7% 11.0% 25.2% 14.4%
Grade 9 44.3% 55.7% 13.1% 29.0% 13.6%Grade 10 37.8% 62.2% 18.5% 34.2% 9.5%Grade 11 34.0% 66.0% 20.1% 34.8% 11.1%Grade 12 27.2% 72.8% 16.8% 42.0% 14.0%
______________________________________________________________________________________________
Table A-4: During the past twelve months, how often have you had five or more drinks at onetime?
BeerSeveral Several Less Than
Never Ever Times/Week Times/Month Once/Month
All 61.5% 38.5% 3.8% 17.8% 16.9%Grade 7 72.6% 27.4% 2.9% 8.8% 15.6%Grade 8 62.9% 37.1% 4.5% 14.5% 18.1%Grade 9 64.8% 35.2% 2.3% 16.2% 16.7%Grade 10 57.9% 42.1% 3.1% 23.0% 16.0%Grade 11 53.6% 46.4% 5.1% 24.9% 16.4%Grade 12 49.8% 50.2% 6.1% 24.5% 19.7%

8/14/2019 HARRIS COUNTY - Pasadena ISD - 1998 Texas School Survey of Drug and Alcohol Use
http://slidepdf.com/reader/full/harris-county-pasadena-isd-1998-texas-school-survey-of-drug-and-alcohol 15/213
PasadenaSpring 1998
______________________________________________________________________________________________
Wine Coolers
Several Several Less ThanNever Ever Times/Week Times/Month Once/Month
All 57.6% 42.4% 3.3% 21.1% 18.1%Grade 7 69.7% 30.3% 3.2% 14.0% 13.1%Grade 8 58.8% 41.2% 5.0% 20.0% 16.2%Grade 9 60.4% 39.6% 3.1% 19.8% 16.7%Grade 10 50.8% 49.2% 2.5% 27.1% 19.6%Grade 11 52.9% 47.1% 2.5% 23.3% 21.4%Grade 12 45.9% 54.1% 3.0% 25.4% 25.6%
Wine
Several Several Less ThanNever Ever Times/Week Times/Month Once/Month
All 65.7% 34.3% 1.7% 11.8% 20.8%Grade 7 75.9% 24.1% 2.0% 8.1% 14.0%Grade 8 65.6% 34.4% 1.7% 12.0% 20.6%Grade 9 64.0% 36.0% 2.0% 11.5% 22.5%Grade 10 64.5% 35.5% 1.1% 14.8% 19.6%Grade 11 59.5% 40.5% 1.8% 14.2% 24.5%Grade 12 61.1% 38.9% 1.7% 10.9% 26.2%
Liquor
Several Several Less ThanNever Ever Times/Week Times/Month Once/Month
All 61.7% 38.3% 3.0% 17.5% 17.8%Grade 7 78.1% 21.9% 2.2% 8.0% 11.7%Grade 8 67.3% 32.7% 2.9% 14.6% 15.2%Grade 9 62.6% 37.4% 2.5% 16.1% 18.8%Grade 10 55.5% 44.5% 3.3% 22.1% 19.1%Grade 11 51.2% 48.8% 3.7% 23.6% 21.4%Grade 12 46.6% 53.4% 4.2% 25.4% 23.9%
______________________________________________________________________________________________

8/14/2019 HARRIS COUNTY - Pasadena ISD - 1998 Texas School Survey of Drug and Alcohol Use
http://slidepdf.com/reader/full/harris-county-pasadena-isd-1998-texas-school-survey-of-drug-and-alcohol 16/213
Table A-5: Average age of first use of:
Grade 7 Grade 8 Grade 9 Grade 10 Grade 11 Grade 12
Alcohol 10.7 11.1 11.7 12.6 13.0 13.9Beer 10.7 11.3 11.7 12.7 13.1 14.0Wine Coolers 11.0 11.5 12.2 13.1 13.5 14.4Wine 11.1 11.7 12.1 13.2 13.5 14.4
Liquor 11.5 12.0 12.6 13.6 14.0 14.8
______________________________________________________________________________________________
Table A-6: If you wanted some, how difficult would it be to get...
Beer?
Never Very Somewhat Somewhat VeryHeard Of Impossible Difficult Difficult Easy Easy
All 5.7% 8.5% 4.9% 9.9% 24.1% 47.0%
Grade 7 8.7% 16.9% 9.8% 13.9% 22.3% 28.4%Grade 8 7.6% 11.3% 6.1% 10.7% 22.0% 42.4%Grade 9 5.7% 5.2% 5.0% 8.7% 22.0% 53.4%Grade 10 4.7% 5.8% 2.5% 9.3% 24.9% 52.9%Grade 11 3.4% 5.1% 1.7% 6.5% 25.7% 57.6%Grade 12 1.9% 3.8% 2.3% 8.5% 30.6% 52.8%

8/14/2019 HARRIS COUNTY - Pasadena ISD - 1998 Texas School Survey of Drug and Alcohol Use
http://slidepdf.com/reader/full/harris-county-pasadena-isd-1998-texas-school-survey-of-drug-and-alcohol 17/213
PasadenaSpring 1998
______________________________________________________________________________________________
Wine coolers?
Never Very Somewhat Somewhat VeryHeard Of Impossible Difficult Difficult Easy Easy
All 7.1% 7.9% 4.7% 11.4% 23.7% 45.1%Grade 7 11.8% 18.1% 9.7% 14.9% 20.1% 25.5%Grade 8 9.7% 9.5% 4.9% 13.4% 22.2% 40.3%Grade 9 6.4% 5.1% 4.9% 12.0% 22.5% 49.1%Grade 10 5.5% 3.2% 3.2% 10.1% 25.8% 52.2%Grade 11 3.5% 4.6% 1.8% 7.2% 26.1% 56.8%Grade 12 3.3% 4.0% 1.8% 7.9% 28.6% 54.4%
Wine?
Never Very Somewhat Somewhat VeryHeard Of Impossible Difficult Difficult Easy Easy
All 7.9% 11.7% 7.3% 12.4% 22.2% 38.5%Grade 7 11.7% 24.5% 13.6% 13.6% 15.0% 21.7%Grade 8 9.1% 17.5% 8.7% 14.0% 21.3% 29.4%Grade 9 8.9% 7.0% 7.0% 10.6% 24.8% 41.7%Grade 10 7.2% 5.9% 5.5% 14.0% 21.0% 46.4%Grade 11 4.2% 5.3% 3.5% 11.2% 25.2% 50.8%Grade 12 3.7% 5.5% 2.6% 10.3% 28.7% 49.1%
Liquor?
Never Very Somewhat Somewhat VeryHeard Of Impossible Difficult Difficult Easy Easy
All 7.5% 12.3% 7.3% 12.6% 20.8% 39.4%Grade 7 13.1% 25.4% 11.7% 16.1% 14.7% 18.9%Grade 8 8.5% 16.9% 9.9% 12.2% 20.0% 32.4%Grade 9 7.7% 8.9% 6.6% 13.0% 20.2% 43.6%Grade 10 5.6% 6.3% 5.2% 13.0% 21.9% 47.9%
Grade 11 4.0% 5.6% 4.5% 10.3% 23.4% 52.2%Grade 12 3.6% 5.8% 3.8% 9.4% 27.9% 49.4%

8/14/2019 HARRIS COUNTY - Pasadena ISD - 1998 Texas School Survey of Drug and Alcohol Use
http://slidepdf.com/reader/full/harris-county-pasadena-isd-1998-texas-school-survey-of-drug-and-alcohol 18/213
______________________________________________________________________________________________
Table A-7: Since school began in the fall, on how many days (if any) have you...
Attended class while drunk on alcohol?
None 1-3 Days 4-9 Days 10+ Days
All 90.6% 7.1% 1.4% 1.0%Grade 7 90.5% 8.0% 1.1% 0.4%Grade 8 89.9% 7.4% 1.3% 1.3%Grade 9 90.4% 6.7% 1.4% 1.4%Grade 10 91.0% 6.9% 1.9% 0.2%Grade 11 89.9% 6.6% 1.3% 2.1%Grade 12 92.2% 6.5% 1.1% 0.2%
Gotten into trouble with teachers because of your drinking?
None 1-3 Days 4-9 Days 10+ Days
All 98.7% 0.9% 0.2% 0.2%Grade 7 99.3% 0.4% 0.2% 0.2%Grade 8 97.8% 1.6% 0.5% * %Grade 9 99.1% 0.7% * % 0.2%Grade 10 98.2% 1.4% 0.2% 0.2%Grade 11 98.9% 0.6% 0.2% 0.2%Grade 12 98.9% 0.8% * % 0.2%

8/14/2019 HARRIS COUNTY - Pasadena ISD - 1998 Texas School Survey of Drug and Alcohol Use
http://slidepdf.com/reader/full/harris-county-pasadena-isd-1998-texas-school-survey-of-drug-and-alcohol 19/213
PasadenaSpring 1998
______________________________________________________________________________________________
Table A-8: School year use of alcohol by absences and conduct problems:
Average days absent due to illness or other reasons:
Alcohol Users: 4.5 days per studentAlcohol Non-users: 3.4 days per student
Average days conduct problems reported:
Alcohol Users: 3.6 days per studentAlcohol Non-users: 1.3 days per student
______________________________________________________________________________________________
Table A-9: During the past twelve months, how many times have you...
Driven a car when you've had a good bit to drink?
None 1-3 Times 4-9 Times 10+ Times
All 87.6% 9.5% 1.9% 1.1%Grade 9 94.8% 4.5% 0.7% * %Grade 10 89.8% 7.9% 1.9% 0.4%Grade 11 83.6% 11.6% 2.6% 2.2%Grade 12 77.1% 17.7% 2.8% 2.4%
Gotten into trouble with the police because of drinking?
None 1-3 Times 4-9 Times 10+ Times
All 96.6% 3.1% 0.2% 0.2%Grade 7 97.8% 1.8% 0.2% 0.2%Grade 8 96.2% 3.4% 0.2% 0.2%Grade 9 97.5% 2.0% 0.3% 0.3%Grade 10 95.8% 4.0% 0.2% * %Grade 11 95.5% 3.8% 0.5% 0.2%
Grade 12 95.9% 4.1% * % * %

8/14/2019 HARRIS COUNTY - Pasadena ISD - 1998 Texas School Survey of Drug and Alcohol Use
http://slidepdf.com/reader/full/harris-county-pasadena-isd-1998-texas-school-survey-of-drug-and-alcohol 20/213
______________________________________________________________________________________________
Table A-10: About how many of your close friends use...
Any alcohol product?
Never heardNone A Few Some Most All
All 15.4% 21.9% 21.1% 28.5% 13.1%Grade 7 31.6% 27.5% 17.0% 16.4% 7.5%Grade 8 17.4% 23.5% 22.6% 24.2% 12.2%Grade 9 12.1% 21.6% 22.9% 31.9% 11.5%Grade 10 10.2% 18.4% 24.0% 30.7% 16.8%Grade 11 9.6% 21.0% 20.2% 34.0% 15.2%Grade 12 5.7% 16.3% 19.8% 39.3% 18.9%
Beer?
Never heard
None A Few Some Most All
All 20.3% 22.8% 22.1% 25.3% 9.5%Grade 7 38.5% 28.1% 17.5% 12.4% 3.5%Grade 8 23.9% 25.2% 23.2% 19.4% 8.3%Grade 9 17.4% 22.6% 23.3% 28.8% 8.0%Grade 10 13.9% 19.8% 25.3% 28.9% 12.1%Grade 11 12.2% 21.8% 20.4% 32.2% 13.4%Grade 12 8.8% 16.5% 23.3% 36.2% 15.2%
8/14/2019 HARRIS COUNTY - Pasadena ISD - 1998 Texas School Survey of Drug and Alcohol Use
http://slidepdf.com/reader/full/harris-county-pasadena-isd-1998-texas-school-survey-of-drug-and-alcohol 21/213
PasadenaSpring 1998
______________________________________________________________________________________________
Wine coolers?
Never heardNone A Few Some Most All
All 24.9% 22.8% 21.8% 22.5% 8.1%Grade 7 44.3% 23.1% 14.0% 13.8% 4.8%Grade 8 26.8% 24.4% 20.5% 19.9% 8.4%Grade 9 23.6% 22.4% 21.0% 24.8% 8.2%Grade 10 17.6% 20.2% 28.6% 24.3% 9.4%Grade 11 17.9% 24.9% 23.9% 24.1% 9.1%Grade 12 10.8% 21.1% 25.6% 33.0% 9.5%
Wine?
Never heardNone A Few Some Most All
All 40.5% 25.0% 16.9% 12.9% 4.6%Grade 7 56.9% 21.4% 11.6% 8.1% 2.0%Grade 8 42.5% 26.6% 14.1% 12.9% 3.9%Grade 9 37.7% 23.7% 18.4% 15.6% 4.6%Grade 10 35.4% 24.8% 21.1% 12.0% 6.6%Grade 11 33.9% 26.1% 19.9% 13.6% 6.6%Grade 12 30.6% 29.7% 18.4% 16.5% 4.9%
Liquor?
Never heardNone A Few Some Most All
All 31.1% 20.8% 18.8% 21.4% 7.9%Grade 7 53.1% 20.0% 13.6% 10.6% 2.6%Grade 8 35.3% 24.0% 17.0% 16.8% 6.8%Grade 9 27.2% 22.5% 20.6% 22.0% 7.7%Grade 10 23.1% 19.0% 20.2% 26.4% 11.3%Grade 11 23.2% 18.6% 21.3% 25.9% 10.9%Grade 12 15.9% 19.7% 22.0% 32.2% 10.2%
8/14/2019 HARRIS COUNTY - Pasadena ISD - 1998 Texas School Survey of Drug and Alcohol Use
http://slidepdf.com/reader/full/harris-county-pasadena-isd-1998-texas-school-survey-of-drug-and-alcohol 22/213
______________________________________________________________________________________________
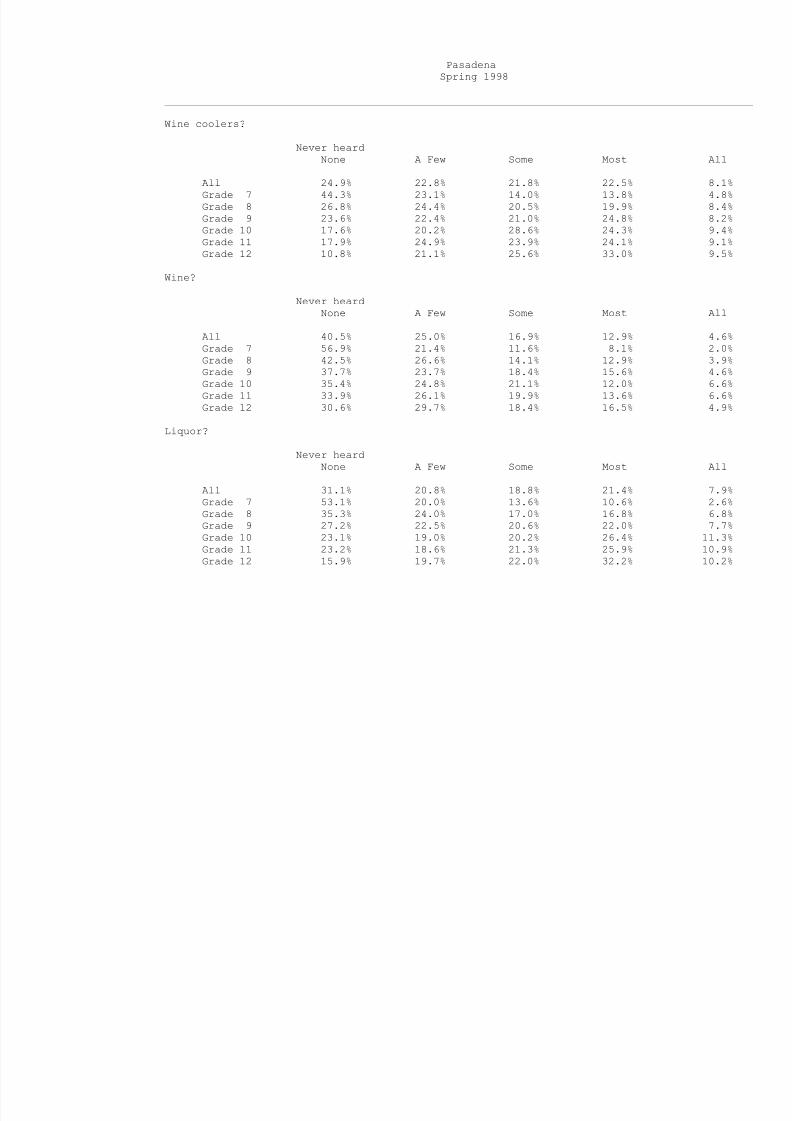
Table A-11: During the past twelve months, how many times have you...
Had difficulties of any kind with your friends because of your drinking?
None 1-3 Times 4-9 Times 10+ Times
All 92.3% 6.3% 0.9% 0.4%Grade 7 95.1% 3.6% 0.7% 0.5%Grade 8 94.1% 4.9% 0.5% 0.4%Grade 9 91.1% 7.3% 1.1% 0.5%Grade 10 91.7% 6.9% 0.8% 0.6%Grade 11 91.7% 7.3% 0.6% 0.4%Grade 12 88.6% 9.5% 1.7% 0.2%
Been criticized by someone you were dating because of drinking?
None 1-3 Times 4-9 Times 10+ Times
All 92.9% 5.5% 1.0% 0.6%Grade 7 96.9% 2.3% 0.4% 0.4%Grade 8 94.4% 3.9% 0.9% 0.8%Grade 9 93.2% 4.7% 0.9% 1.2%Grade 10 92.1% 6.2% 1.7% * %Grade 11 90.5% 7.3% 1.3% 0.9%Grade 12 87.6% 11.1% 0.9% 0.4%

8/14/2019 HARRIS COUNTY - Pasadena ISD - 1998 Texas School Survey of Drug and Alcohol Use
http://slidepdf.com/reader/full/harris-county-pasadena-isd-1998-texas-school-survey-of-drug-and-alcohol 23/213
PasadenaSpring 1998
______________________________________________________________________________________________
Table A-12: Thinking of parties you attended this school year, how often was alcohol used?
Half Most Of Don't Didn'tNever Seldom the Time the Time Always Know Attend
All 27.2% 11.3% 8.9% 16.5% 25.6% 2.4% 8.0%Grade 7 49.8% 11.8% 6.9% 10.1% 9.0% 4.5% 7.9%Grade 8 33.7% 18.3% 11.2% 15.4% 13.0% 3.3% 5.1%Grade 9 21.5% 13.0% 11.1% 19.0% 23.8% 1.9% 9.7%Grade 10 20.6% 8.9% 8.5% 18.0% 33.1% 2.6% 8.3%Grade 11 15.4% 7.1% 8.3% 19.3% 40.3% 0.4% 9.1%Grade 12 13.8% 5.6% 6.3% 18.8% 46.5% 0.8% 8.3%
______________________________________________________________________________________________
Table A-13: How often, if ever, do you get alcoholic beverages from...
At home
Do Not Most ofDrink Never Seldom the time Always
All 35.6% 29.7% 23.6% 8.0% 3.1%Grade 7 47.4% 22.2% 19.2% 8.2% 2.9%Grade 8 38.3% 27.2% 24.1% 8.3% 2.2%
Grade 9 33.7% 32.1% 22.2% 8.3% 3.7%Grade 10 30.5% 31.4% 26.1% 8.6% 3.5%Grade 11 33.0% 33.4% 24.1% 7.5% 2.0%Grade 12 25.5% 35.0% 28.4% 6.8% 4.3%
From friends
Do Not Most ofDrink Never Seldom the time Always
All 26.8% 14.7% 19.0% 27.4% 12.1%Grade 7 40.5% 24.3% 13.4% 17.7% 4.1%Grade 8 29.2% 17.6% 21.5% 22.9% 8.8%

8/14/2019 HARRIS COUNTY - Pasadena ISD - 1998 Texas School Survey of Drug and Alcohol Use
http://slidepdf.com/reader/full/harris-county-pasadena-isd-1998-texas-school-survey-of-drug-and-alcohol 24/213

8/14/2019 HARRIS COUNTY - Pasadena ISD - 1998 Texas School Survey of Drug and Alcohol Use
http://slidepdf.com/reader/full/harris-county-pasadena-isd-1998-texas-school-survey-of-drug-and-alcohol 25/213
PasadenaSpring 1998
______________________________________________________________________________________________
Other source
Do Not Most ofDrink Never Seldom the time Always
All 30.6% 26.3% 19.6% 11.9% 11.7%Grade 7 42.0% 26.7% 14.5% 8.8% 8.0%Grade 8 35.2% 22.4% 19.4% 12.4% 10.6%Grade 9 32.3% 27.1% 19.2% 9.5% 11.9%Grade 10 24.3% 27.3% 22.8% 11.5% 14.1%Grade 11 24.8% 26.3% 21.2% 14.6% 13.1%Grade 12 17.2% 29.0% 22.2% 17.4% 14.2%
______________________________________________________________________________________________
Table A-14: How do your parents feel about kids your age drinking beer?
Strongly Mildly Mildly Strongly Don'tDisapprove Disapprove Neither Approve Approve Know
All 60.1% 17.6% 10.8% 3.1% 1.1% 7.2%Grade 7 70.7% 9.4% 3.3% 1.5% 0.8% 14.2%Grade 8 63.4% 14.7% 7.8% 2.9% 1.4% 9.8%Grade 9 58.5% 18.6% 13.4% 2.6% 0.8% 6.2%Grade 10 58.2% 19.5% 13.2% 3.9% 1.6% 3.6%
Grade 11 56.1% 20.9% 13.8% 4.1% 1.4% 3.7%Grade 12 48.8% 26.5% 16.1% 4.8% 0.9% 2.9%
______________________________________________________________________________________________
Table A-15: How dangerous do you think it is for kids your age to use alcohol?
Very Somewhat Not Very Not at All Do NotDangerous Dangerous Dangerous Dangerous Know
All 41.2% 38.7% 14.7% 2.2% 3.2%Grade 7 44.7% 32.4% 14.8% 2.3% 5.8%Grade 8 40.1% 36.0% 17.6% 2.6% 3.6%

8/14/2019 HARRIS COUNTY - Pasadena ISD - 1998 Texas School Survey of Drug and Alcohol Use
http://slidepdf.com/reader/full/harris-county-pasadena-isd-1998-texas-school-survey-of-drug-and-alcohol 26/213
Grade 9 37.7% 39.9% 16.5% 2.7% 3.2%Grade 10 43.3% 39.4% 13.1% 1.5% 2.6%Grade 11 38.8% 44.2% 13.4% 2.0% 1.6%Grade 12 43.0% 43.0% 10.8% 1.8% 1.3%

8/14/2019 HARRIS COUNTY - Pasadena ISD - 1998 Texas School Survey of Drug and Alcohol Use
http://slidepdf.com/reader/full/harris-county-pasadena-isd-1998-texas-school-survey-of-drug-and-alcohol 27/213

8/14/2019 HARRIS COUNTY - Pasadena ISD - 1998 Texas School Survey of Drug and Alcohol Use
http://slidepdf.com/reader/full/harris-county-pasadena-isd-1998-texas-school-survey-of-drug-and-alcohol 28/213
PasadenaSpring 1998
______________________________________________________________________________________________
Table D-1: How recently, if ever, have you used...
Past School Ever NeverMonth Year Used Used
_____________________________________________________________________________________Marijuana? All 14.7% 22.5% 34.2% 65.8%
Grade 7 9.3% 13.9% 22.1% 77.9%Grade 8 13.0% 21.5% 34.3% 65.7%Grade 9 14.9% 21.8% 30.3% 69.7%Grade 10 18.2% 26.1% 41.1% 58.9%Grade 11 20.3% 30.1% 42.8% 57.2%Grade 12 13.9% 24.9% 40.7% 59.3%
_____________________________________________________________________________________
Cocaine? All 2.3% 4.2% 7.5% 92.5%Grade 7 1.4% 3.0% 4.5% 95.5%Grade 8 2.3% 4.1% 7.3% 92.7%Grade 9 1.7% 2.9% 5.8% 94.2%Grade 10 3.2% 5.3% 9.0% 91.0%Grade 11 2.8% 4.8% 9.5% 90.5%Grade 12 2.9% 6.4% 10.6% 89.4%
_____________________________________________________________________________________Crack? All 0.7% 1.3% 2.4% 97.6%
Grade 7 0.6% 1.4% 2.9% 97.1%Grade 8 1.6% 2.5% 4.5% 95.5%Grade 9 0.7% 1.2% 1.7% 98.3%
Grade 10 0.2% 0.9% 1.6% 98.4%Grade 11 0.7% 0.7% 2.0% 98.0%Grade 12 * % 0.2% 1.1% 98.9%
_____________________________________________________________________________________Hallucinogens? All 3.6% 6.8% 10.0% 90.0%
Grade 7 1.2% 3.1% 3.8% 96.2%Grade 8 2.6% 4.5% 6.9% 93.1%Grade 9 3.8% 7.6% 10.2% 89.8%Grade 10 5.4% 9.6% 14.6% 85.4%Grade 11 5.8% 10.7% 15.6% 84.4%Grade 12 3.5% 6.4% 11.7% 88.3%
_____________________________________________________________________________________Uppers? All 2.8% 5.2% 8.3% 91.7%

8/14/2019 HARRIS COUNTY - Pasadena ISD - 1998 Texas School Survey of Drug and Alcohol Use
http://slidepdf.com/reader/full/harris-county-pasadena-isd-1998-texas-school-survey-of-drug-and-alcohol 29/213
Grade 7 1.3% 2.5% 3.8% 96.2%Grade 8 1.5% 2.9% 6.0% 94.0%Grade 9 3.8% 6.1% 9.4% 90.6%Grade 10 3.7% 8.3% 12.0% 88.0%Grade 11 4.6% 7.0% 10.8% 89.2%Grade 12 2.2% 4.9% 8.8% 91.2%
_____________________________________________________________________________________Downers? All 2.6% 4.2% 7.0% 93.0%
Grade 7 0.6% 1.4% 3.3% 96.7%Grade 8 2.6% 3.4% 5.0% 95.0%Grade 9 2.9% 4.7% 6.8% 93.2%Grade 10 4.7% 8.1% 12.3% 87.7%Grade 11 3.3% 4.9% 9.1% 90.9%Grade 12 1.9% 2.9% 6.2% 93.8%
_____________________________________________________________________________________Rohypnol? All 2.6% 4.1% 7.3% 92.7%
Grade 7 3.6% 5.4% 7.0% 93.0%Grade 8 2.3% 3.4% 6.6% 93.4%Grade 9 2.2% 3.4% 6.1% 93.9%Grade 10 3.0% 5.1% 9.6% 90.4%
Grade 11 2.8% 4.1% 8.1% 91.9%Grade 12 1.6% 2.4% 6.5% 93.5%_____________________________________________________________________________________Steroids? All 0.4% 0.6% 1.8% 98.2%
Grade 7 0.2% 0.4% 1.3% 98.7%Grade 8 0.4% 0.4% 2.0% 98.0%Grade 9 0.5% 0.8% 1.8% 98.2%Grade 10 0.5% 0.7% 1.4% 98.6%Grade 11 0.5% 0.9% 2.3% 97.7%Grade 12 0.2% 0.7% 2.0% 98.0%

8/14/2019 HARRIS COUNTY - Pasadena ISD - 1998 Texas School Survey of Drug and Alcohol Use
http://slidepdf.com/reader/full/harris-county-pasadena-isd-1998-texas-school-survey-of-drug-and-alcohol 30/213
PasadenaSpring 1998
______________________________________________________________________________________________
Past School Ever NeverMonth Year Used Used
_____________________________________________________________________________________Ecstasy? All 1.2% 2.5% 5.0% 95.0%
Grade 7 0.4% 1.6% 2.2% 97.8%Grade 8 1.2% 2.0% 4.2% 95.8%Grade 9 0.8% 1.8% 4.7% 95.3%Grade 10 1.6% 3.3% 6.5% 93.5%Grade 11 2.4% 3.5% 6.8% 93.2%Grade 12 1.4% 3.3% 6.4% 93.6%
_____________________________________________________________________________________Heroin? All 0.5% 1.0% 2.1% 97.9%
Grade 7 1.2% 2.4% 3.6% 96.4%
Grade 8 0.2% 1.2% 4.1% 95.9%Grade 9 0.5% 0.5% 1.0% 99.0%Grade 10 0.2% 0.7% 1.4% 98.6%Grade 11 0.4% 0.7% 1.3% 98.7%Grade 12 * % 0.2% 0.5% 99.5%
______________________________________________________________________________________________
Table D-2: How often do you normally use...
Marijuana?
Several Several About About Less ThanNever Every Times Times Once a Once a Once aUsed Day a Week a Month Month Year Year
All 59.1% 3.2% 4.5% 7.3% 8.9% 7.9% 9.1%Grade 7 72.1% 2.3% 3.4% 6.8% 6.5% 4.2% 4.7%Grade 8 60.3% 2.9% 4.8% 8.0% 6.5% 9.9% 7.5%Grade 9 61.8% 3.6% 5.2% 6.1% 10.0% 6.5% 6.8%Grade 10 53.3% 3.9% 4.4% 8.3% 11.6% 9.1% 9.4%Grade 11 49.0% 3.7% 6.1% 8.6% 10.7% 7.8% 14.1%Grade 12 52.3% 2.6% 2.9% 5.6% 8.5% 11.7% 16.4%
Cocaine?

8/14/2019 HARRIS COUNTY - Pasadena ISD - 1998 Texas School Survey of Drug and Alcohol Use
http://slidepdf.com/reader/full/harris-county-pasadena-isd-1998-texas-school-survey-of-drug-and-alcohol 31/213
Several Several About About Less Than
Never Every Times Times Once a Once a Once aUsed Day a Week a Month Month Year Year
All 91.8% 0.1% 0.8% 1.1% 1.7% 2.0% 2.5%Grade 7 96.3% 0.3% 0.3% 0.8% 1.1% 1.3% * %Grade 8 92.0% * % 0.9% 0.5% 2.1% 2.1% 2.3%Grade 9 93.3% * % 1.0% 1.0% 1.9% 1.3% 1.6%Grade 10 90.1% 0.3% 1.1% 2.1% 1.3% 2.1% 2.9%Grade 11 88.0% 0.3% 0.9% 1.4% 1.7% 3.4% 4.3%Grade 12 88.9% * % 0.9% 0.9% 2.0% 2.0% 5.2%
Crack?
Several Several About About Less ThanNever Every Times Times Once a Once a Once aUsed Day a Week a Month Month Year Year
All 97.3% * % 0.1% 0.4% 0.3% 1.0% 0.8%
Grade 7 96.8% * % 0.3% 0.3% 0.5% 1.6% 0.5%Grade 8 95.7% * % 0.5% 0.7% 0.7% 1.2% 1.2%Grade 9 97.6% * % * % 0.7% 0.3% 1.0% 0.3%Grade 10 98.3% * % * % * % * % 0.9% 0.9%Grade 11 97.9% * % * % 0.6% * % 0.3% 1.2%Grade 12 98.5% * % * % 0.3% * % 0.3% 0.9%
8/14/2019 HARRIS COUNTY - Pasadena ISD - 1998 Texas School Survey of Drug and Alcohol Use
http://slidepdf.com/reader/full/harris-county-pasadena-isd-1998-texas-school-survey-of-drug-and-alcohol 32/213
PasadenaSpring 1998
______________________________________________________________________________________________
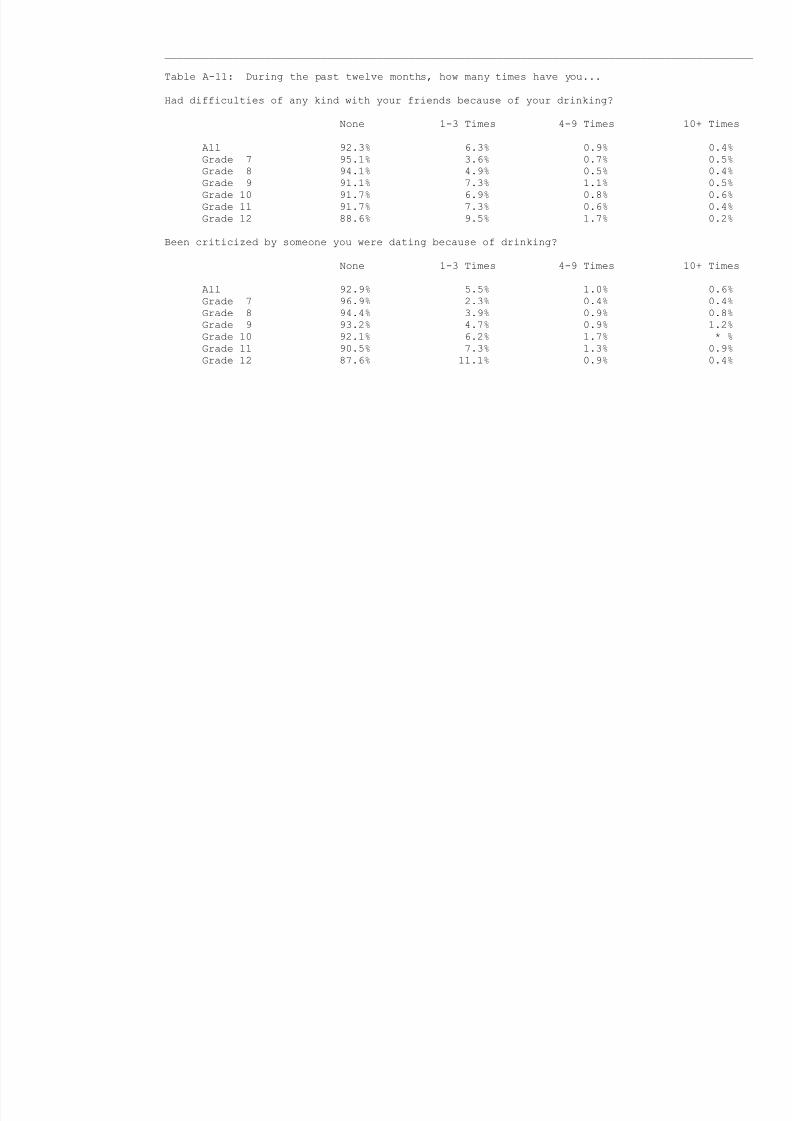
Hallucinogens?
Several Several About About Less ThanNever Every Times Times Once a Once a Once aUsed Day a Week a Month Month Year Year
All 90.1% 0.1% 0.4% 1.4% 2.9% 2.8% 2.4%Grade 7 95.9% * % 0.8% 0.2% 1.7% 1.2% 0.2%Grade 8 93.5% * % 0.4% 0.4% 3.0% 0.8% 2.0%Grade 9 88.8% 0.3% 0.3% 2.1% 3.4% 3.6% 1.6%Grade 10 86.0% * % 0.5% 2.6% 4.4% 2.6% 4.0%Grade 11 85.6% * % * % 2.1% 3.2% 5.0% 4.1%Grade 12 88.7% * % * % 1.4% 1.6% 4.4% 3.9%
Uppers?
Several Several About About Less ThanNever Every Times Times Once a Once a Once aUsed Day a Week a Month Month Year Year
All 90.6% 0.2% 0.5% 1.1% 3.2% 2.4% 1.9%Grade 7 94.2% 0.3% 0.3% 0.8% 2.6% 1.6% 0.3%Grade 8 94.3% 0.2% * % 1.0% 1.7% 1.2% 1.7%Grade 9 89.5% * % 1.2% 1.2% 4.0% 1.9% 2.2%Grade 10 87.0% 0.6% 0.3% 1.1% 5.1% 4.0% 2.0%
Grade 11 86.5% * % 1.1% 1.4% 4.0% 3.4% 3.4%Grade 12 90.9% * % * % 1.1% 2.0% 3.1% 2.8%
Downers?
Several Several About About Less ThanNever Every Times Times Once a Once a Once aUsed Day a Week a Month Month Year Year
All 92.5% 0.1% 0.3% 1.3% 2.7% 1.6% 1.6%Grade 7 95.5% * % 0.3% 0.8% 2.0% 1.0% 0.5%Grade 8 95.8% * % 0.2% 1.4% 0.9% 0.7% 0.9%Grade 9 91.8% * % 0.3% 1.5% 2.7% 0.9% 2.7%

8/14/2019 HARRIS COUNTY - Pasadena ISD - 1998 Texas School Survey of Drug and Alcohol Use
http://slidepdf.com/reader/full/harris-county-pasadena-isd-1998-texas-school-survey-of-drug-and-alcohol 33/213
Grade 10 88.1% 0.3% 0.3% 1.9% 5.2% 2.5% 1.7%Grade 11 89.4% 0.3% 0.6% 1.1% 3.4% 2.9% 2.3%Grade 12 93.7% * % * % 0.8% 1.9% 2.2% 1.4%
Rohypnol?
Several Several About About Less ThanNever Every Times Times Once a Once a Once aUsed Day a Week a Month Month Year Year
All 93.5% 0.2% 0.4% 1.0% 1.7% 1.6% 1.6%Grade 7 93.7% 0.2% 1.3% 1.3% 2.3% 0.8% 0.4%Grade 8 94.8% 0.2% 0.4% 0.8% 1.4% 1.6% 0.8%Grade 9 93.8% * % * % 1.3% 1.3% 1.6% 2.1%Grade 10 91.2% 0.5% 0.5% 1.4% 2.3% 2.3% 1.9%Grade 11 92.5% * % * % 0.2% 2.1% 2.4% 2.8%Grade 12 94.6% * % * % 0.7% 0.9% 1.4% 2.4%
Steroids?
Several Several About About Less ThanNever Every Times Times Once a Once a Once aUsed Day a Week a Month Month Year Year
All 98.2% 0.1% 0.0% 0.1% 0.4% 0.8% 0.5%Grade 7 98.7% * % * % * % 0.3% 1.1% * %Grade 8 98.5% * % * % * % 0.2% 0.5% 0.7%Grade 9 97.4% * % * % 0.3% 0.7% 1.0% 0.7%Grade 10 98.5% 0.3% * % * % 0.3% 0.6% 0.3%Grade 11 98.2% 0.3% * % * % 0.6% 0.3% 0.6%Grade 12 97.7% * % 0.3% * % * % 1.2% 0.9%

8/14/2019 HARRIS COUNTY - Pasadena ISD - 1998 Texas School Survey of Drug and Alcohol Use
http://slidepdf.com/reader/full/harris-county-pasadena-isd-1998-texas-school-survey-of-drug-and-alcohol 34/213
PasadenaSpring 1998
______________________________________________________________________________________________
Ecstasy?
Several Several About About Less ThanNever Every Times Times Once a Once a Once aUsed Day a Week a Month Month Year Year
All 94.5% 0.0% 0.1% 0.7% 1.5% 1.4% 1.8%Grade 7 97.5% * % * % 1.0% 0.5% 0.5% 0.5%Grade 8 94.4% 0.2% * % 0.7% 1.2% 0.9% 2.6%Grade 9 95.1% * % * % 0.3% 1.8% 1.2% 1.5%Grade 10 93.6% * % 0.3% 1.1% 1.6% 1.6% 1.9%Grade 11 91.6% * % 0.3% 0.8% 3.4% 2.2% 1.7%Grade 12 93.5% * % 0.3% 0.3% 0.5% 2.4% 3.0%
Heroin?
Several Several About About Less ThanNever Every Times Times Once a Once a Once aUsed Day a Week a Month Month Year Year
All 97.8% 0.0% 0.3% 0.2% 0.1% 0.5% 1.1%Grade 7 96.0% 0.2% 0.7% * % 0.5% 0.9% 1.6%Grade 8 96.5% * % 0.7% 0.2% * % 1.1% 1.5%Grade 9 99.1% * % * % 0.3% * % * % 0.6%Grade 10 98.1% * % * % 0.3% * % 0.3% 1.3%
Grade 11 98.4% * % * % 0.5% * % 0.3% 0.8%Grade 12 99.7% * % * % * % * % 0.3% * %
______________________________________________________________________________________________
Table D-3: Average age of first use of:
Grade 7 Grade 8 Grade 9 Grade 10 Grade 11 Grade 12
Marijuana 11.7 12.3 12.9 13.6 14.3 15.1Cocaine 12.3 13.1 14.0 14.6 15.2 16.1Crack 12.6 12.8 * * 15.5 *Hallucinogens 12.1 12.8 13.8 14.3 15.2 15.8

8/14/2019 HARRIS COUNTY - Pasadena ISD - 1998 Texas School Survey of Drug and Alcohol Use
http://slidepdf.com/reader/full/harris-county-pasadena-isd-1998-texas-school-survey-of-drug-and-alcohol 35/213
Uppers 12.1 12.3 13.4 14.1 15.0 15.7Downers 12.3 13.0 13.3 14.0 15.0 15.6Rohypnol 12.1 12.4 13.8 14.3 15.0 15.7Steroids * 13.2 * * * 15.2Ecstasy * 12.7 14.2 14.0 15.6 16.3Heroin 12.5 13.1 * * * *
______________________________________________________________________________________________
Table D-4: Age of first use of marijuana by family situation:
Two parent family
Never 9 or Under 10-11 12-13 14-15 16-17 18 or Over
All 66.8% 1.0% 3.0% 12.8% 11.3% 4.8% 0.4%Grade 7 80.1% 1.7% 5.0% 13.0% 0.3% * % * %Grade 8 68.9% 1.3% 5.2% 17.2% 7.4% * % * %Grade 9 69.4% 0.4% 2.6% 13.5% 13.1% 0.9% * %Grade 10 61.4% 0.7% 1.4% 13.9% 17.1% 5.4% * %
Grade 11 56.1% 1.4% 1.8% 9.1% 18.6% 13.0% * %Grade 12 58.7% * % 0.8% 7.2% 14.4% 15.5% 3.4%

8/14/2019 HARRIS COUNTY - Pasadena ISD - 1998 Texas School Survey of Drug and Alcohol Use
http://slidepdf.com/reader/full/harris-county-pasadena-isd-1998-texas-school-survey-of-drug-and-alcohol 36/213
PasadenaSpring 1998
______________________________________________________________________________________________
Other family situation
Never 9 or Under 10-11 12-13 14-15 16-17 18 or Over
All 52.2% 2.9% 8.1% 18.0% 13.7% 4.3% 0.7%Grade 7 66.7% 4.3% 12.3% 14.5% 2.2% * % * %Grade 8 48.3% 4.1% 13.4% 26.2% 8.1% * % * %Grade 9 58.5% 4.4% 6.7% 15.6% 14.1% 0.7% * %Grade 10 44.6% 1.4% 6.8% 24.3% 18.9% 4.1% * %Grade 11 46.5% 1.6% 3.1% 11.8% 24.4% 12.6% * %Grade 12 44.3% * % 2.9% 11.4% 20.0% 15.7% 5.7%
______________________________________________________________________________________________
Table D-5: If you wanted some, how difficult would it be to get...
Marijuana?
Never Very Somewhat Somewhat VeryHeard Of Impossible Difficult Difficult Easy Easy
All 9.7% 20.2% 7.4% 13.3% 17.7% 31.7%Grade 7 12.9% 39.7% 9.8% 11.4% 9.6% 16.6%Grade 8 11.7% 25.2% 5.6% 14.1% 15.4% 28.0%
Grade 9 9.6% 13.6% 8.9% 13.6% 17.5% 36.8%Grade 10 8.2% 14.5% 6.9% 11.5% 22.9% 35.9%Grade 11 7.4% 10.5% 6.3% 13.5% 20.5% 41.8%Grade 12 6.4% 10.9% 5.8% 17.1% 24.0% 35.8%
Cocaine?
Never Very Somewhat Somewhat VeryHeard Of Impossible Difficult Difficult Easy Easy
All 14.3% 30.0% 14.3% 16.4% 12.7% 12.3%Grade 7 17.9% 49.9% 11.9% 9.9% 4.7% 5.7%
Grade 8 17.5% 35.9% 10.2% 13.7% 10.6% 12.1%

8/14/2019 HARRIS COUNTY - Pasadena ISD - 1998 Texas School Survey of Drug and Alcohol Use
http://slidepdf.com/reader/full/harris-county-pasadena-isd-1998-texas-school-survey-of-drug-and-alcohol 37/213
Grade 9 14.0% 23.9% 16.7% 18.2% 14.3% 12.8%Grade 10 10.8% 24.8% 14.2% 18.9% 16.6% 14.6%Grade 11 12.4% 18.0% 17.8% 18.6% 18.2% 15.0%Grade 12 11.1% 20.8% 16.7% 21.5% 14.1% 15.8%
Crack?
Never Very Somewhat Somewhat VeryHeard Of Impossible Difficult Difficult Easy Easy
All 16.2% 32.0% 16.4% 16.1% 9.8% 9.5%Grade 7 19.2% 50.4% 11.4% 9.6% 3.5% 5.9%Grade 8 19.0% 38.0% 10.7% 14.8% 8.4% 9.0%Grade 9 14.6% 25.9% 19.4% 16.6% 13.4% 10.1%Grade 10 13.9% 27.2% 18.1% 17.3% 11.7% 11.7%Grade 11 14.2% 20.6% 19.9% 20.8% 13.1% 11.4%Grade 12 15.0% 23.9% 21.7% 20.3% 9.6% 9.6%
Hallucinogens?
Never Very Somewhat Somewhat VeryHeard Of Impossible Difficult Difficult Easy Easy
All 29.1% 24.4% 12.2% 11.1% 10.4% 12.7%Grade 7 42.3% 35.1% 9.5% 4.4% 4.4% 4.4%Grade 8 40.4% 26.3% 8.9% 9.1% 7.4% 8.0%Grade 9 24.2% 21.3% 13.9% 13.4% 12.0% 15.3%Grade 10 22.3% 24.2% 10.6% 11.9% 12.7% 18.2%Grade 11 17.5% 16.9% 15.4% 15.4% 15.9% 18.8%Grade 12 21.3% 18.7% 17.6% 15.5% 12.5% 14.4%

8/14/2019 HARRIS COUNTY - Pasadena ISD - 1998 Texas School Survey of Drug and Alcohol Use
http://slidepdf.com/reader/full/harris-county-pasadena-isd-1998-texas-school-survey-of-drug-and-alcohol 38/213
PasadenaSpring 1998
______________________________________________________________________________________________
Uppers?
Never Very Somewhat Somewhat VeryHeard Of Impossible Difficult Difficult Easy Easy
All 34.1% 20.9% 10.6% 11.6% 10.6% 12.3%Grade 7 46.5% 30.5% 7.4% 5.6% 4.4% 5.6%Grade 8 45.2% 22.7% 7.6% 9.5% 6.6% 8.5%Grade 9 30.6% 19.4% 10.2% 12.9% 11.7% 15.2%Grade 10 25.1% 19.9% 10.7% 14.0% 14.8% 15.5%Grade 11 24.2% 12.2% 15.5% 14.6% 16.6% 17.0%Grade 12 26.6% 16.7% 15.3% 15.3% 12.0% 14.0%
Downers?
Never Very Somewhat Somewhat VeryHeard Of Impossible Difficult Difficult Easy Easy
All 33.9% 21.3% 10.8% 11.6% 10.6% 11.8%Grade 7 45.6% 31.3% 8.0% 5.9% 4.2% 5.0%Grade 8 45.3% 24.2% 6.9% 8.5% 6.9% 8.3%Grade 9 31.0% 18.6% 12.1% 11.9% 11.4% 15.0%Grade 10 24.7% 20.5% 10.9% 14.0% 14.3% 15.6%Grade 11 23.8% 12.6% 14.6% 15.5% 16.6% 16.9%Grade 12 26.9% 16.9% 14.6% 16.7% 13.2% 11.6%
Rohypnol?
Never Very Somewhat Somewhat VeryHeard Of Impossible Difficult Difficult Easy Easy
All 40.3% 18.8% 10.6% 10.1% 8.8% 11.3%Grade 7 47.8% 28.3% 8.2% 4.7% 4.1% 7.0%Grade 8 46.0% 22.5% 6.4% 7.7% 8.7% 8.7%Grade 9 38.4% 15.5% 14.1% 12.2% 7.2% 12.6%Grade 10 34.0% 17.4% 11.3% 10.9% 12.2% 14.3%Grade 11 34.6% 11.4% 12.0% 12.9% 13.8% 15.3%
Grade 12 38.2% 14.5% 12.6% 14.7% 8.8% 11.1%

8/14/2019 HARRIS COUNTY - Pasadena ISD - 1998 Texas School Survey of Drug and Alcohol Use
http://slidepdf.com/reader/full/harris-county-pasadena-isd-1998-texas-school-survey-of-drug-and-alcohol 39/213
Steroids?
Never Very Somewhat Somewhat VeryHeard Of Impossible Difficult Difficult Easy Easy
All 20.0% 31.1% 13.9% 13.6% 10.2% 11.2%Grade 7 24.9% 47.1% 12.4% 7.3% 4.9% 3.4%Grade 8 25.4% 39.3% 11.6% 10.7% 5.8% 7.2%
Grade 9 19.8% 25.9% 15.1% 17.3% 10.2% 11.7%Grade 10 16.1% 27.2% 15.5% 14.6% 13.7% 13.0%Grade 11 14.7% 20.5% 16.5% 17.9% 13.6% 16.7%Grade 12 15.8% 19.6% 12.7% 15.4% 16.3% 20.1%
Ecstasy?
Never Very Somewhat Somewhat VeryHeard Of Impossible Difficult Difficult Easy Easy
All 35.2% 22.0% 11.3% 10.9% 8.9% 11.7%
Grade 7 47.9% 31.8% 8.9% 4.4% 3.2% 3.8%Grade 8 44.2% 25.5% 7.5% 8.1% 6.7% 8.1%Grade 9 31.5% 19.7% 12.7% 14.4% 8.9% 12.7%Grade 10 27.5% 20.6% 12.3% 12.6% 11.0% 16.0%Grade 11 27.7% 14.2% 14.0% 11.8% 14.6% 17.7%Grade 12 26.9% 16.1% 14.1% 16.3% 11.7% 15.0%

8/14/2019 HARRIS COUNTY - Pasadena ISD - 1998 Texas School Survey of Drug and Alcohol Use
http://slidepdf.com/reader/full/harris-county-pasadena-isd-1998-texas-school-survey-of-drug-and-alcohol 40/213
PasadenaSpring 1998
______________________________________________________________________________________________
Heroin?
Never Very Somewhat Somewhat VeryHeard Of Impossible Difficult Difficult Easy Easy
All 19.5% 35.9% 16.6% 12.8% 6.6% 8.7%Grade 7 21.6% 50.3% 12.3% 6.2% 3.3% 6.2%Grade 8 25.2% 40.9% 11.7% 9.0% 5.5% 7.7%Grade 9 18.7% 32.3% 16.7% 15.3% 6.8% 10.2%Grade 10 16.7% 32.1% 18.6% 15.6% 6.6% 10.5%Grade 11 15.9% 25.9% 22.4% 16.5% 9.8% 9.6%Grade 12 16.3% 28.0% 21.5% 16.6% 9.2% 8.4%
______________________________________________________________________________________________
Table D-6: Since school began in the fall, on how many days (if any) have you...
Attended class while high from marijuana use?
None 1-3 Days 4-9 Days 10+ Days
All 88.2% 7.0% 2.0% 2.8%Grade 7 87.7% 8.4% 1.0% 2.9%Grade 8 88.4% 6.7% 3.1% 1.8%Grade 9 87.3% 8.1% 2.0% 2.5%
Grade 10 87.2% 7.2% 2.5% 3.1%Grade 11 87.4% 5.6% 1.9% 5.1%Grade 12 92.3% 4.7% 0.9% 2.0%
Attended class while high from use of some other drug?
None 1-3 Days 4-9 Days 10+ Days
All 93.4% 4.7% 1.1% 0.8%Grade 7 92.7% 5.5% 1.0% 0.8%Grade 8 95.0% 3.7% 1.2% 0.2%Grade 9 93.3% 4.0% 1.5% 1.2%
Grade 10 91.9% 5.7% 1.5% 0.9%
8/14/2019 HARRIS COUNTY - Pasadena ISD - 1998 Texas School Survey of Drug and Alcohol Use
http://slidepdf.com/reader/full/harris-county-pasadena-isd-1998-texas-school-survey-of-drug-and-alcohol 41/213
Grade 11 93.5% 5.2% 0.4% 0.9%Grade 12 94.4% 4.4% 0.4% 0.7%
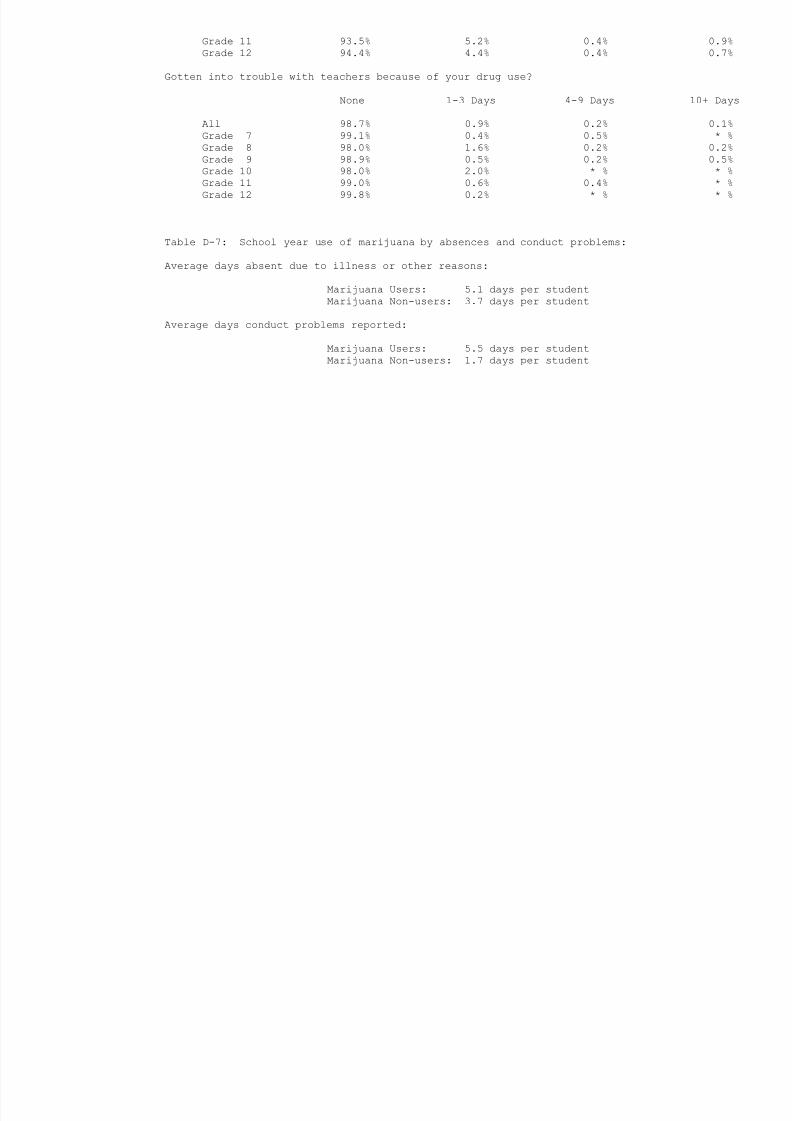
Gotten into trouble with teachers because of your drug use?
None 1-3 Days 4-9 Days 10+ Days
All 98.7% 0.9% 0.2% 0.1%Grade 7 99.1% 0.4% 0.5% * %
Grade 8 98.0% 1.6% 0.2% 0.2%Grade 9 98.9% 0.5% 0.2% 0.5%Grade 10 98.0% 2.0% * % * %Grade 11 99.0% 0.6% 0.4% * %Grade 12 99.8% 0.2% * % * %
______________________________________________________________________________________________
Table D-7: School year use of marijuana by absences and conduct problems:
Average days absent due to illness or other reasons:
Marijuana Users: 5.1 days per studentMarijuana Non-users: 3.7 days per student
Average days conduct problems reported:
Marijuana Users: 5.5 days per studentMarijuana Non-users: 1.7 days per student

8/14/2019 HARRIS COUNTY - Pasadena ISD - 1998 Texas School Survey of Drug and Alcohol Use
http://slidepdf.com/reader/full/harris-county-pasadena-isd-1998-texas-school-survey-of-drug-and-alcohol 42/213

8/14/2019 HARRIS COUNTY - Pasadena ISD - 1998 Texas School Survey of Drug and Alcohol Use
http://slidepdf.com/reader/full/harris-county-pasadena-isd-1998-texas-school-survey-of-drug-and-alcohol 43/213
______________________________________________________________________________________________
Table D-10: During the past twelve months, how many times have you...
Had difficulties of any kind with your friends because of your drug use?
None 1-3 Times 4-9 Times 10+ Times
All 94.5% 4.3% 0.8% 0.4%Grade 7 96.4% 2.1% 0.8% 0.8%Grade 8 93.5% 5.2% 1.1% 0.2%Grade 9 94.6% 4.0% 0.9% 0.5%Grade 10 93.7% 5.2% 0.6% 0.4%Grade 11 92.7% 6.0% 1.1% 0.2%Grade 12 96.1% 3.9% * % * %
Been criticized by someone you were dating because of drug use?
None 1-3 Times 4-9 Times 10+ Times
All 94.1% 4.5% 0.7% 0.7%Grade 7 96.5% 3.1% * % 0.4%Grade 8 93.5% 5.1% 0.6% 0.8%Grade 9 93.2% 4.5% 1.0% 1.3%Grade 10 92.0% 6.5% 1.3% 0.2%Grade 11 94.2% 3.7% 1.2% 0.9%Grade 12 95.2% 4.1% 0.2% 0.5%

8/14/2019 HARRIS COUNTY - Pasadena ISD - 1998 Texas School Survey of Drug and Alcohol Use
http://slidepdf.com/reader/full/harris-county-pasadena-isd-1998-texas-school-survey-of-drug-and-alcohol 44/213
PasadenaSpring 1998
______________________________________________________________________________________________
Table D-11: Thinking of parties you attended this school year, how often was marijuana used?
Half Most Of Don't Didn'tNever Seldom the Time the Time Always Know Attend
All 41.7% 14.0% 10.4% 10.7% 11.6% 3.7% 8.0%Grade 7 62.6% 8.3% 5.3% 7.2% 6.0% 3.0% 7.5%Grade 8 47.1% 13.2% 11.5% 11.2% 8.4% 3.5% 5.1%Grade 9 37.1% 15.8% 9.0% 11.4% 13.5% 3.9% 9.3%Grade 10 34.3% 15.0% 11.0% 10.8% 15.9% 4.1% 8.9%Grade 11 29.5% 14.3% 14.9% 14.3% 14.9% 2.9% 9.3%Grade 12 32.1% 19.5% 12.5% 10.4% 12.3% 5.1% 8.2%
______________________________________________________________________________________________
Table D-12: How often, if ever, do you smoke marijuana in...
Joints?
Half the Most of Don'tNever Seldom Time the Time Always Know
All 67.7% 9.4% 5.7% 10.4% 5.7% 1.1%Grade 7 78.0% 5.3% 3.0% 7.3% 5.1% 1.3%Grade 8 65.9% 10.0% 5.1% 10.0% 7.4% 1.5%
Grade 9 68.8% 8.9% 6.0% 11.6% 3.9% 0.9%Grade 10 63.6% 10.0% 7.9% 11.3% 5.8% 1.3%Grade 11 62.2% 11.0% 6.7% 12.3% 7.2% 0.5%Grade 12 64.8% 12.7% 6.2% 10.4% 4.9% 1.0%
Blunts?
Half the Most of Don'tNever Seldom Time the Time Always Know
All 77.5% 9.3% 4.8% 3.8% 3.0% 1.5%Grade 7 86.3% 5.5% 1.8% 2.4% 2.4% 1.6%
Grade 8 78.4% 9.5% 5.8% 3.2% 2.1% 1.1%

8/14/2019 HARRIS COUNTY - Pasadena ISD - 1998 Texas School Survey of Drug and Alcohol Use
http://slidepdf.com/reader/full/harris-county-pasadena-isd-1998-texas-school-survey-of-drug-and-alcohol 45/213
Grade 9 77.3% 9.3% 4.7% 4.0% 3.1% 1.6%Grade 10 73.7% 9.7% 5.4% 5.1% 3.2% 2.9%Grade 11 71.5% 12.0% 6.4% 4.5% 5.3% 0.3%Grade 12 75.6% 10.7% 5.6% 4.0% 2.4% 1.6%
Bongs or water pipes?
Half the Most of Don'tNever Seldom Time the Time Always Know
All 80.2% 8.6% 4.5% 3.4% 1.9% 1.4%Grade 7 89.7% 3.2% 2.6% 1.6% 1.3% 1.6%Grade 8 82.7% 8.2% 3.4% 2.3% 1.3% 2.1%Grade 9 78.6% 6.1% 5.8% 5.5% 3.1% 0.9%Grade 10 74.1% 11.7% 6.4% 4.3% 1.3% 2.1%Grade 11 77.1% 12.7% 4.4% 3.6% 2.2% * %Grade 12 77.0% 12.3% 4.5% 2.7% 2.1% 1.3%
Pipes?
Half the Most of Don'tNever Seldom Time the Time Always Know
All 80.4% 10.3% 3.8% 3.0% 1.5% 1.0%Grade 7 90.3% 4.5% 1.8% 1.6% 1.0% 0.8%Grade 8 83.3% 9.5% 2.9% 2.4% 0.3% 1.6%Grade 9 79.7% 8.4% 5.0% 4.1% 2.2% 0.6%Grade 10 73.0% 14.5% 4.5% 4.2% 2.2% 1.7%Grade 11 75.7% 13.9% 4.1% 3.8% 2.2% 0.3%Grade 12 78.3% 12.8% 4.5% 1.9% 1.3% 1.1%

8/14/2019 HARRIS COUNTY - Pasadena ISD - 1998 Texas School Survey of Drug and Alcohol Use
http://slidepdf.com/reader/full/harris-county-pasadena-isd-1998-texas-school-survey-of-drug-and-alcohol 46/213
PasadenaSpring 1998
______________________________________________________________________________________________
Some other way?
Half the Most of Don'tNever Seldom Time the Time Always Know
All 84.3% 7.2% 2.3% 2.1% 2.0% 2.1%Grade 7 88.8% 3.9% 1.6% 1.0% 2.6% 2.1%Grade 8 87.2% 4.6% 2.3% 2.8% 1.0% 2.0%Grade 9 84.5% 5.8% 3.3% 2.1% 2.4% 1.8%Grade 10 78.4% 10.7% 2.1% 2.9% 2.7% 3.2%Grade 11 82.2% 11.4% 2.2% 2.2% 1.1% 0.8%Grade 12 83.5% 8.2% 2.4% 1.3% 2.1% 2.4%
______________________________________________________________________________________________
Table D-13: How do your parents feel about kids your age using marijuana?
Strongly Mildly Mildly Strongly Don'tDisapprove Disapprove Neither Approve Approve Know
All 81.1% 5.7% 4.3% 0.9% 1.3% 6.7%Grade 7 80.8% 2.2% 1.4% 1.0% 1.2% 13.3%Grade 8 80.6% 5.3% 3.9% 1.2% 1.6% 7.5%Grade 9 79.5% 7.3% 4.8% 0.8% 1.8% 5.8%Grade 10 80.8% 7.3% 5.4% 0.6% 1.1% 4.7%
Grade 11 82.3% 6.0% 4.9% 1.3% 1.6% 4.0%Grade 12 83.6% 6.8% 6.1% 0.7% 0.7% 2.2%
______________________________________________________________________________________________
Table D-14: How dangerous do you think it is for kids your age to use...
Marijuana?
Very Somewhat Not Very Not at All Do NotDangerous Dangerous Dangerous Dangerous Know
All 58.3% 21.9% 11.4% 5.5% 2.9%

8/14/2019 HARRIS COUNTY - Pasadena ISD - 1998 Texas School Survey of Drug and Alcohol Use
http://slidepdf.com/reader/full/harris-county-pasadena-isd-1998-texas-school-survey-of-drug-and-alcohol 47/213
Grade 7 69.3% 16.5% 7.6% 2.9% 3.8%Grade 8 60.2% 19.6% 11.6% 4.4% 4.2%Grade 9 55.8% 22.6% 12.1% 6.3% 3.2%Grade 10 54.2% 25.2% 12.1% 6.2% 2.3%Grade 11 53.3% 23.8% 14.1% 7.2% 1.6%Grade 12 54.5% 25.6% 11.7% 6.6% 1.6%
Cocaine?
Very Somewhat Not Very Not at All Do NotDangerous Dangerous Dangerous Dangerous Know
All 87.5% 7.3% 1.5% 0.5% 3.3%Grade 7 86.5% 7.2% 1.7% 0.2% 4.4%Grade 8 85.3% 9.1% 1.2% 0.2% 4.2%Grade 9 86.7% 7.4% 1.8% 1.3% 2.8%Grade 10 86.4% 8.3% 2.0% * % 3.4%Grade 11 90.2% 5.9% 0.7% 0.5% 2.7%Grade 12 91.8% 4.5% 1.4% 0.5% 1.8%
Crack?
Very Somewhat Not Very Not at All Do NotDangerous Dangerous Dangerous Dangerous Know
All 89.1% 6.0% 0.8% 0.2% 3.9%Grade 7 86.5% 7.6% 1.8% 0.2% 3.8%Grade 8 86.6% 7.0% 0.6% 0.2% 5.6%Grade 9 88.3% 7.4% 0.5% 0.5% 3.3%Grade 10 89.7% 5.8% 0.9% * % 3.5%Grade 11 91.3% 3.8% 0.2% 0.2% 4.5%Grade 12 95.0% 2.6% 0.2% * % 2.1%

8/14/2019 HARRIS COUNTY - Pasadena ISD - 1998 Texas School Survey of Drug and Alcohol Use
http://slidepdf.com/reader/full/harris-county-pasadena-isd-1998-texas-school-survey-of-drug-and-alcohol 48/213
PasadenaSpring 1998
______________________________________________________________________________________________
Ecstasy?
Very Somewhat Not Very Not at All Do NotDangerous Dangerous Dangerous Dangerous Know
All 74.1% 9.4% 3.2% 1.2% 12.1%Grade 7 72.1% 7.2% 2.1% 0.9% 17.7%Grade 8 73.5% 8.2% 2.4% 0.6% 15.2%Grade 9 70.8% 10.7% 3.7% 2.9% 12.0%Grade 10 75.3% 10.1% 4.5% 1.3% 8.8%Grade 11 76.9% 9.5% 3.4% 1.1% 9.1%Grade 12 78.2% 11.6% 3.2% 0.2% 6.8%
Steroids?
Very Somewhat Not Very Not at All Do NotDangerous Dangerous Dangerous Dangerous Know
All 76.3% 12.8% 2.5% 0.7% 7.8%Grade 7 74.8% 12.1% 1.7% 0.4% 11.0%Grade 8 73.9% 13.2% 1.9% 0.4% 10.7%Grade 9 75.7% 11.9% 2.6% 1.8% 7.9%Grade 10 78.7% 13.0% 2.7% 0.2% 5.3%Grade 11 77.0% 14.9% 1.9% 0.5% 5.8%Grade 12 78.8% 12.1% 4.9% 0.2% 4.0%
Heroin?
Very Somewhat Not Very Not at All Do NotDangerous Dangerous Dangerous Dangerous Know
All 89.3% 4.8% 0.5% 0.2% 5.2%Grade 7 86.4% 5.5% 0.4% 0.4% 7.3%Grade 8 85.3% 6.6% 0.8% * % 7.3%Grade 9 89.1% 5.8% 0.5% 0.5% 4.0%Grade 10 92.1% 3.9% 0.2% 0.2% 3.5%Grade 11 91.6% 3.1% 0.9% * % 4.4%
Grade 12 93.5% 2.2% 0.2% * % 4.0%

8/14/2019 HARRIS COUNTY - Pasadena ISD - 1998 Texas School Survey of Drug and Alcohol Use
http://slidepdf.com/reader/full/harris-county-pasadena-isd-1998-texas-school-survey-of-drug-and-alcohol 49/213

8/14/2019 HARRIS COUNTY - Pasadena ISD - 1998 Texas School Survey of Drug and Alcohol Use
http://slidepdf.com/reader/full/harris-county-pasadena-isd-1998-texas-school-survey-of-drug-and-alcohol 50/213

8/14/2019 HARRIS COUNTY - Pasadena ISD - 1998 Texas School Survey of Drug and Alcohol Use
http://slidepdf.com/reader/full/harris-county-pasadena-isd-1998-texas-school-survey-of-drug-and-alcohol 51/213
PasadenaSpring 1998
______________________________________________________________________________________________
Table I-1: How recently, if ever, have you used...
Past School Ever NeverMonth Year Used Used
_____________________________________________________________________________________Any inhalant? All 6.9% 10.8% 18.9% 81.1%
Grade 7 12.1% 17.3% 25.5% 74.5%Grade 8 9.6% 14.7% 24.0% 76.0%Grade 9 5.3% 8.6% 14.8% 85.2%Grade 10 5.1% 8.5% 18.7% 81.3%Grade 11 4.0% 7.2% 16.4% 83.6%Grade 12 2.4% 5.3% 10.1% 89.9%
_____________________________________________________________________________________Liquid or spray paint? All 1.8% 3.5% 8.7% 91.3%
Grade 7 3.4% 5.0% 11.1% 88.9%Grade 8 1.6% 5.0% 12.1% 87.9%Grade 9 1.8% 3.8% 7.4% 92.6%Grade 10 1.6% 3.0% 8.5% 91.5%Grade 11 1.0% 1.2% 6.1% 93.9%Grade 12 0.4% 1.3% 4.6% 95.4%
_____________________________________________________________________________________Whiteout, correction fluid? All 2.4% 4.3% 9.3% 90.7%
Grade 7 5.4% 8.3% 14.8% 85.2%Grade 8 2.3% 5.8% 12.2% 87.8%Grade 9 2.4% 3.8% 8.1% 91.9%
Grade 10 1.3% 2.4% 8.3% 91.7%Grade 11 0.4% 1.3% 5.2% 94.8%Grade 12 1.6% 2.0% 4.1% 95.9%
_____________________________________________________________________________________Gasoline? All 1.2% 2.0% 4.8% 95.2%
Grade 7 3.1% 4.0% 6.7% 93.3%Grade 8 1.5% 2.5% 6.0% 94.0%Grade 9 0.2% 1.4% 4.1% 95.9%Grade 10 0.9% 1.3% 4.3% 95.7%Grade 11 0.4% 1.1% 4.1% 95.9%Grade 12 0.9% 0.9% 2.5% 97.5%
_____________________________________________________________________________________
Freon? All 0.5% 1.0% 2.0% 98.0%

8/14/2019 HARRIS COUNTY - Pasadena ISD - 1998 Texas School Survey of Drug and Alcohol Use
http://slidepdf.com/reader/full/harris-county-pasadena-isd-1998-texas-school-survey-of-drug-and-alcohol 52/213
Grade 7 1.0% 1.8% 2.8% 97.2%Grade 8 0.6% 0.6% 1.9% 98.1%Grade 9 0.5% 0.7% 1.2% 98.8%Grade 10 0.2% 1.3% 2.4% 97.6%Grade 11 0.2% 1.1% 2.2% 97.8%Grade 12 * % 0.5% 1.6% 98.4%
_____________________________________________________________________________________Poppers, Locker Room, etc.? All 0.7% 1.6% 2.4% 97.6%
Grade 7 1.5% 2.3% 2.7% 97.3%
Grade 8 0.6% 1.5% 2.6% 97.4%Grade 9 0.7% 1.4% 1.9% 98.1%Grade 10 1.1% 3.0% 4.3% 95.7%Grade 11 0.2% 0.4% 1.3% 98.7%Grade 12 * % 0.2% 1.1% 98.9%
_____________________________________________________________________________________Glue? All 1.0% 1.8% 5.1% 94.9%
Grade 7 2.0% 2.4% 6.2% 93.8%Grade 8 1.5% 2.7% 7.0% 93.0%Grade 9 0.2% 2.2% 5.1% 94.9%Grade 10 1.1% 2.2% 4.8% 95.2%Grade 11 0.2% 0.2% 3.1% 96.9%Grade 12 0.5% 0.5% 3.0% 97.0%
_____________________________________________________________________________________Paint, lacquer thinner, etc.? All 1.3% 2.5% 5.4% 94.6%
Grade 7 2.9% 4.6% 7.5% 92.5%Grade 8 1.8% 3.5% 7.6% 92.4%Grade 9 1.2% 2.9% 5.1% 94.9%Grade 10 0.4% 1.7% 4.5% 95.5%Grade 11 0.2% 0.2% 3.5% 96.5%Grade 12 0.5% 0.5% 2.0% 98.0%

8/14/2019 HARRIS COUNTY - Pasadena ISD - 1998 Texas School Survey of Drug and Alcohol Use
http://slidepdf.com/reader/full/harris-county-pasadena-isd-1998-texas-school-survey-of-drug-and-alcohol 53/213

8/14/2019 HARRIS COUNTY - Pasadena ISD - 1998 Texas School Survey of Drug and Alcohol Use
http://slidepdf.com/reader/full/harris-county-pasadena-isd-1998-texas-school-survey-of-drug-and-alcohol 54/213
Several Several About About Less Than
Never Every Times Times Once a Once a Once aUsed Day a Week a Month Month Year Year
All 90.0% 0.2% 0.6% 0.8% 2.2% 2.4% 3.9%Grade 7 83.8% 0.6% 1.9% 1.5% 3.8% 3.6% 4.8%Grade 8 88.2% * % 1.0% 0.8% 2.9% 4.1% 3.1%Grade 9 92.5% 0.3% * % 1.3% 1.8% 1.8% 2.5%
Grade 10 89.5% * % * % 0.9% 2.1% 1.4% 6.2%Grade 11 93.1% * % * % * % 0.7% 1.8% 4.4%Grade 12 95.8% * % 0.2% * % 1.2% 0.7% 2.1%
______________________________________________________________________________________________
Table I-3: Number of different kinds of inhalants used:
0 1 2-3 4+
All 83.3% 5.7% 6.5% 4.5%Grade 7 77.1% 7.5% 9.4% 5.9%Grade 8 79.4% 6.6% 7.6% 6.4%Grade 9 86.8% 3.3% 5.7% 4.2%Grade 10 82.9% 6.5% 6.3% 4.3%Grade 11 86.4% 6.1% 4.9% 2.6%Grade 12 90.5% 4.0% 3.0% 2.4%

8/14/2019 HARRIS COUNTY - Pasadena ISD - 1998 Texas School Survey of Drug and Alcohol Use
http://slidepdf.com/reader/full/harris-county-pasadena-isd-1998-texas-school-survey-of-drug-and-alcohol 55/213
PasadenaSpring 1998
______________________________________________________________________________________________
Table I-4: Average age of first use of:
Grade 7 Grade 8 Grade 9 Grade 10 Grade 11 Grade 12
Inhalants 11.2 11.4 11.9 12.3 13.2 14.6
______________________________________________________________________________________________
Table I-5: Since school began in the fall, on how many days (if any) have you attendedclass while high from inhalant use?
None 1-3 Days 4-9 Days 10+ Days
All 97.4% 2.1% 0.3% 0.2%Grade 7 95.2% 3.6% 0.8% 0.4%Grade 8 96.3% 2.9% 0.4% 0.4%Grade 9 97.5% 2.0% 0.3% 0.3%Grade 10 98.6% 1.4% * % * %Grade 11 98.9% 1.1% * % * %Grade 12 99.3% 0.5% 0.2% * %
______________________________________________________________________________________________
Table I-6: School year use of inhalants by absences and conduct problems:
Average days absent due to illness or other reasons:
Inhalants Users: 5.0 days per studentInhalants Non-users: 3.9 days per student
Average days conduct problems reported:
Inhalants Users: 6.1 days per studentInhalants Non-users: 2.1 days per student
______________________________________________________________________________________________
Table I-7: About how many of your close friends use inhalants?

8/14/2019 HARRIS COUNTY - Pasadena ISD - 1998 Texas School Survey of Drug and Alcohol Use
http://slidepdf.com/reader/full/harris-county-pasadena-isd-1998-texas-school-survey-of-drug-and-alcohol 56/213
Never heard
None A Few Some Most All
All 78.5% 14.8% 4.7% 1.6% 0.3%Grade 7 69.3% 17.7% 9.4% 2.8% 0.7%Grade 8 74.2% 15.8% 6.2% 3.2% 0.5%Grade 9 78.3% 17.4% 3.7% 0.7% * %Grade 10 81.2% 14.1% 2.8% 1.2% 0.6%
Grade 11 85.1% 11.0% 3.3% 0.6% * %Grade 12 89.1% 9.5% 0.8% 0.6% * %
______________________________________________________________________________________________
Table I-8: How dangerous do you think it is for kids your age to use inhalants?
Very Somewhat Not Very Not at All Do NotDangerous Dangerous Dangerous Dangerous Know
All 79.0% 13.0% 2.4% 0.7% 4.9%Grade 7 74.2% 14.3% 3.7% 1.2% 6.4%Grade 8 75.7% 14.2% 3.2% 1.2% 5.7%Grade 9 78.1% 14.0% 2.5% 0.8% 4.6%Grade 10 81.2% 13.3% 1.3% 0.2% 4.0%Grade 11 83.1% 11.4% 1.1% 0.4% 4.0%Grade 12 85.1% 8.9% 1.8% * % 4.2%

8/14/2019 HARRIS COUNTY - Pasadena ISD - 1998 Texas School Survey of Drug and Alcohol Use
http://slidepdf.com/reader/full/harris-county-pasadena-isd-1998-texas-school-survey-of-drug-and-alcohol 57/213

8/14/2019 HARRIS COUNTY - Pasadena ISD - 1998 Texas School Survey of Drug and Alcohol Use
http://slidepdf.com/reader/full/harris-county-pasadena-isd-1998-texas-school-survey-of-drug-and-alcohol 58/213
PasadenaSpring 1998
______________________________________________________________________________________________
Table X-1: Since school began in the fall, have you gotten any information on drugs oralcohol from the following sources?
Health class
No Yes
All 48.5% 51.5%Grade 7 58.1% 41.9%Grade 8 54.1% 45.9%Grade 9 25.1% 74.9%Grade 10 42.9% 57.1%Grade 11 56.8% 43.2%Grade 12 62.2% 37.8%
An assembly program
No Yes
All 48.2% 51.8%Grade 7 51.9% 48.1%Grade 8 50.0% 50.0%Grade 9 46.7% 53.3%Grade 10 48.1% 51.9%Grade 11 48.8% 51.2%
Grade 12 42.1% 57.9%
Guidance counselor
No Yes
All 82.3% 17.7%Grade 7 83.6% 16.4%Grade 8 75.7% 24.3%Grade 9 81.7% 18.3%Grade 10 83.8% 16.2%Grade 11 87.0% 13.0%
Grade 12 82.9% 17.1%

8/14/2019 HARRIS COUNTY - Pasadena ISD - 1998 Texas School Survey of Drug and Alcohol Use
http://slidepdf.com/reader/full/harris-county-pasadena-isd-1998-texas-school-survey-of-drug-and-alcohol 59/213
Science class
No Yes
All 60.2% 39.8%Grade 7 26.3% 73.7%Grade 8 56.7% 43.3%Grade 9 67.3% 32.7%
Grade 10 63.5% 36.5%Grade 11 76.2% 23.8%Grade 12 80.1% 19.9%
Social studies class
No Yes
All 90.4% 9.6%Grade 7 87.5% 12.5%Grade 8 88.0% 12.0%Grade 9 91.3% 8.7%Grade 10 93.5% 6.5%Grade 11 91.0% 9.0%Grade 12 91.6% 8.4%

8/14/2019 HARRIS COUNTY - Pasadena ISD - 1998 Texas School Survey of Drug and Alcohol Use
http://slidepdf.com/reader/full/harris-county-pasadena-isd-1998-texas-school-survey-of-drug-and-alcohol 60/213
PasadenaSpring 1998
______________________________________________________________________________________________
Student group session
No Yes
All 82.4% 17.6%Grade 7 80.4% 19.6%Grade 8 77.8% 22.2%Grade 9 82.3% 17.7%Grade 10 86.8% 13.2%Grade 11 84.6% 15.4%Grade 12 83.2% 16.8%
An invited school guest
No Yes
All 54.9% 45.1%Grade 7 51.4% 48.6%Grade 8 52.6% 47.4%Grade 9 53.0% 47.0%Grade 10 60.6% 39.4%Grade 11 59.9% 40.1%Grade 12 52.4% 47.6%
Some other school source
No Yes
All 62.1% 37.9%Grade 7 61.4% 38.6%Grade 8 60.8% 39.2%Grade 9 61.3% 38.7%Grade 10 65.5% 34.5%Grade 11 64.6% 35.4%Grade 12 58.8% 41.2%
Any school source
No Yes

8/14/2019 HARRIS COUNTY - Pasadena ISD - 1998 Texas School Survey of Drug and Alcohol Use
http://slidepdf.com/reader/full/harris-county-pasadena-isd-1998-texas-school-survey-of-drug-and-alcohol 61/213
o es
All 32.5% 67.5%Grade 7 30.2% 69.8%Grade 8 41.6% 58.4%Grade 9 26.2% 73.8%Grade 10 30.0% 70.0%Grade 11 37.2% 62.8%Grade 12 30.2% 69.8%
______________________________________________________________________________________________
Table X-2: If you had a drug or alcohol problem and needed help, who would you go to?
A counselor or program in school
No Yes
All 66.5% 33.5%Grade 7 61.0% 39.0%Grade 8 58.8% 41.2%
Grade 9 67.6% 32.4%Grade 10 67.5% 32.5%Grade 11 73.5% 26.5%Grade 12 76.1% 23.9%

8/14/2019 HARRIS COUNTY - Pasadena ISD - 1998 Texas School Survey of Drug and Alcohol Use
http://slidepdf.com/reader/full/harris-county-pasadena-isd-1998-texas-school-survey-of-drug-and-alcohol 62/213
PasadenaSpring 1998
______________________________________________________________________________________________
Another adult in school (such as a nurse or teacher)
No Yes
All 68.6% 31.4%Grade 7 61.8% 38.2%Grade 8 66.2% 33.8%Grade 9 73.7% 26.3%Grade 10 71.1% 28.9%Grade 11 71.1% 28.9%Grade 12 69.2% 30.8%
A counselor or program outside of school
No Yes
All 57.8% 42.2%Grade 7 55.1% 44.9%Grade 8 56.9% 43.1%Grade 9 57.9% 42.1%Grade 10 57.0% 43.0%Grade 11 63.8% 36.2%Grade 12 57.9% 42.1%
Your parents
No Yes
All 40.2% 59.8%Grade 7 38.0% 62.0%Grade 8 44.3% 55.7%Grade 9 39.1% 60.9%Grade 10 39.4% 60.6%Grade 11 39.2% 60.8%Grade 12 41.1% 58.9%
A medical doctor
No Yes

8/14/2019 HARRIS COUNTY - Pasadena ISD - 1998 Texas School Survey of Drug and Alcohol Use
http://slidepdf.com/reader/full/harris-county-pasadena-isd-1998-texas-school-survey-of-drug-and-alcohol 63/213
All 58.1% 41.9%Grade 7 52.4% 47.6%Grade 8 59.5% 40.5%Grade 9 60.4% 39.6%Grade 10 59.0% 41.0%Grade 11 60.1% 39.9%Grade 12 57.0% 43.0%
Your friends
No Yes
All 24.6% 75.4%Grade 7 38.2% 61.8%Grade 8 28.8% 71.2%Grade 9 17.4% 82.6%Grade 10 22.5% 77.5%Grade 11 18.3% 81.7%Grade 12 19.1% 80.9%
Another adult (a relative, clergyman, or other family friend)
No Yes
All 36.0% 64.0%Grade 7 37.2% 62.8%Grade 8 36.9% 63.1%Grade 9 37.6% 62.4%Grade 10 35.4% 64.6%Grade 11 32.0% 68.0%
Grade 12 35.8% 64.2%

8/14/2019 HARRIS COUNTY - Pasadena ISD - 1998 Texas School Survey of Drug and Alcohol Use
http://slidepdf.com/reader/full/harris-county-pasadena-isd-1998-texas-school-survey-of-drug-and-alcohol 64/213
PasadenaSpring 1998
______________________________________________________________________________________________
Table X-3: Since school began in the fall, have you sought help, other than from family orfriends, for problems in any way connected with your use of alcohol, marijuana,
or other drugs?
No Yes
All 92.2% 7.8%Grade 7 91.3% 8.7%Grade 8 90.2% 9.8%Grade 9 90.6% 9.4%Grade 10 92.8% 7.2%Grade 11 92.4% 7.6%Grade 12 98.0% 2.0%
______________________________________________________________________________________________
Table X-4: About how many of your friends:
Feel close to their parents?
None A Few Some Most All
All 4.6% 30.9% 30.2% 29.4% 4.8%Grade 7 8.0% 32.1% 28.2% 25.0% 6.6%Grade 8 5.3% 29.8% 31.4% 27.5% 6.0%
Grade 9 3.8% 33.3% 29.5% 30.4% 3.1%Grade 10 4.5% 33.4% 31.2% 27.3% 3.6%Grade 11 2.4% 27.8% 32.9% 31.7% 5.2%Grade 12 1.8% 27.0% 28.4% 38.4% 4.3%
Sometimes carry weapons?
None A Few Some Most All
All 58.5% 23.9% 10.9% 5.1% 1.6%Grade 7 64.2% 18.7% 10.0% 5.8% 1.3%Grade 8 50.4% 29.5% 13.2% 5.5% 1.5%
Grade 9 57.1% 26.1% 9.8% 5.1% 1.9%
8/14/2019 HARRIS COUNTY - Pasadena ISD - 1998 Texas School Survey of Drug and Alcohol Use
http://slidepdf.com/reader/full/harris-county-pasadena-isd-1998-texas-school-survey-of-drug-and-alcohol 65/213

8/14/2019 HARRIS COUNTY - Pasadena ISD - 1998 Texas School Survey of Drug and Alcohol Use
http://slidepdf.com/reader/full/harris-county-pasadena-isd-1998-texas-school-survey-of-drug-and-alcohol 66/213
PasadenaSpring 1998
______________________________________________________________________________________________
Wish they could drop out of school?
None A Few Some Most All
All 49.4% 31.6% 11.6% 5.2% 2.2%Grade 7 51.5% 25.9% 11.7% 8.2% 2.7%Grade 8 46.7% 30.9% 14.4% 5.1% 2.9%Grade 9 44.1% 35.9% 12.9% 5.2% 1.9%Grade 10 44.8% 36.4% 10.7% 5.7% 2.3%Grade 11 52.9% 32.6% 9.4% 3.3% 1.7%Grade 12 60.8% 27.1% 8.7% 2.3% 1.1%

8/14/2019 HARRIS COUNTY - Pasadena ISD - 1998 Texas School Survey of Drug and Alcohol Use
http://slidepdf.com/reader/full/harris-county-pasadena-isd-1998-texas-school-survey-of-drug-and-alcohol 67/213
Pasadenai 1998

8/14/2019 HARRIS COUNTY - Pasadena ISD - 1998 Texas School Survey of Drug and Alcohol Use
http://slidepdf.com/reader/full/harris-county-pasadena-isd-1998-texas-school-survey-of-drug-and-alcohol 68/213
Spring 1998
Table B1: Prevalence and recency of use of selected substances by grade--> All students
Past School Ever NeverMonth Year Used Used
_____________________________________________________________________________________
Tobacco All 26.4% 36.2% 55.5% 44.5%Grade 7 15.9% 22.9% 39.5% 60.5%Grade 8 23.9% 33.2% 53.9% 46.1%Grade 9 26.6% 38.6% 57.3% 42.7%Grade 10 33.6% 42.4% 63.0% 37.0%Grade 11 29.3% 41.1% 62.3% 37.7%Grade 12 33.8% 44.3% 62.8% 37.2%
_____________________________________________________________________________________Alcohol All 40.1% 55.6% 74.3% 25.7%
Grade 7 27.7% 37.1% 59.1% 40.9%Grade 8 36.9% 51.6% 72.1% 27.9%Grade 9 38.1% 56.5% 73.2% 26.8%
Grade 10 44.3% 62.3% 81.6% 18.4%Grade 11 47.0% 64.1% 81.5% 18.5%Grade 12 55.0% 71.0% 85.7% 14.3%
_____________________________________________________________________________________Inhalants All 6.9% 10.8% 18.9% 81.1%
Grade 7 12.1% 17.3% 25.5% 74.5%Grade 8 9.6% 14.7% 24.0% 76.0%Grade 9 5.3% 8.6% 14.8% 85.2%Grade 10 5.1% 8.5% 18.7% 81.3%Grade 11 4.0% 7.2% 16.4% 83.6%Grade 12 2.4% 5.3% 10.1% 89.9%
_____________________________________________________________________________________Any Illicit Drug All 16.4% 24.0% 35.3% 64.7%
Grade 7 11.1% 15.2% 23.3% 76.7%Grade 8 15.4% 23.4% 35.1% 64.9%Grade 9 15.2% 23.2% 31.9% 68.1%Grade 10 20.5% 28.3% 42.6% 57.4%Grade 11 23.0% 31.1% 43.7% 56.3%Grade 12 15.6% 26.7% 41.2% 58.8%
_____________________________________________________________________________________Marijuana All 14.7% 22.5% 34.2% 65.8%
Grade 7 9.3% 13.9% 22.1% 77.9%Grade 8 13.0% 21.5% 34.3% 65.7%
Grade 9 14.9% 21.8% 30.3% 69.7%
Grade 10 18.2% 26.1% 41.1% 58.9%G d 11 20 3% 30 1% 42 8% 57 2%

8/14/2019 HARRIS COUNTY - Pasadena ISD - 1998 Texas School Survey of Drug and Alcohol Use
http://slidepdf.com/reader/full/harris-county-pasadena-isd-1998-texas-school-survey-of-drug-and-alcohol 69/213
Grade 11 20.3% 30.1% 42.8% 57.2%Grade 12 13.9% 24.9% 40.7% 59.3%
_____________________________________________________________________________________Marijuana Only All 5.3% 9.4% 17.3% 82.7%
Grade 7 4.2% 6.3% 12.2% 87.8%Grade 8 4.7% 9.2% 18.0% 82.0%Grade 9 4.6% 9.0% 14.7% 85.3%Grade 10 6.5% 10.0% 19.6% 80.4%
Grade 11 8.1% 13.0% 21.3% 78.7%Grade 12 4.2% 10.5% 20.9% 79.1%
_____________________________________________________________________________________Cocaine or Crack All 2.6% 4.6% 7.9% 92.1%
Grade 7 1.5% 3.3% 5.0% 95.0%Grade 8 3.1% 5.1% 8.7% 91.3%Grade 9 2.1% 3.3% 6.1% 93.9%Grade 10 3.3% 5.8% 9.1% 90.9%Grade 11 3.2% 5.1% 10.0% 90.0%Grade 12 2.8% 6.1% 10.2% 89.8%
_____________________________________________________________________________________Cocaine All 2.3% 4.2% 7.5% 92.5%
Grade 7 1.4% 3.0% 4.5% 95.5%Grade 8 2.3% 4.1% 7.3% 92.7%Grade 9 1.7% 2.9% 5.8% 94.2%Grade 10 3.2% 5.3% 9.0% 91.0%Grade 11 2.8% 4.8% 9.5% 90.5%Grade 12 2.9% 6.4% 10.6% 89.4%
PasadenaS i 1998

8/14/2019 HARRIS COUNTY - Pasadena ISD - 1998 Texas School Survey of Drug and Alcohol Use
http://slidepdf.com/reader/full/harris-county-pasadena-isd-1998-texas-school-survey-of-drug-and-alcohol 70/213
Spring 1998
Table B1 continued from previous page
Past School Ever NeverMonth Year Used Used
_____________________________________________________________________________________Crack All 0.7% 1.3% 2.4% 97.6%
Grade 7 0.6% 1.4% 2.9% 97.1%Grade 8 1.6% 2.5% 4.5% 95.5%Grade 9 0.7% 1.2% 1.7% 98.3%Grade 10 0.2% 0.9% 1.6% 98.4%Grade 11 0.7% 0.7% 2.0% 98.0%Grade 12 * % 0.2% 1.1% 98.9%
_____________________________________________________________________________________Hallucinogens All 3.6% 6.8% 10.0% 90.0%
Grade 7 1.2% 3.1% 3.8% 96.2%Grade 8 2.6% 4.5% 6.9% 93.1%Grade 9 3.8% 7.6% 10.2% 89.8%Grade 10 5.4% 9.6% 14.6% 85.4%
Grade 11 5.8% 10.7% 15.6% 84.4%Grade 12 3.5% 6.4% 11.7% 88.3%
_____________________________________________________________________________________Uppers All 2.8% 5.2% 8.3% 91.7%
Grade 7 1.3% 2.5% 3.8% 96.2%Grade 8 1.5% 2.9% 6.0% 94.0%Grade 9 3.8% 6.1% 9.4% 90.6%Grade 10 3.7% 8.3% 12.0% 88.0%Grade 11 4.6% 7.0% 10.8% 89.2%Grade 12 2.2% 4.9% 8.8% 91.2%
_____________________________________________________________________________________Downers All 2.6% 4.2% 7.0% 93.0%
Grade 7 0.6% 1.4% 3.3% 96.7%Grade 8 2.6% 3.4% 5.0% 95.0%Grade 9 2.9% 4.7% 6.8% 93.2%Grade 10 4.7% 8.1% 12.3% 87.7%Grade 11 3.3% 4.9% 9.1% 90.9%Grade 12 1.9% 2.9% 6.2% 93.8%
_____________________________________________________________________________________Rohypnol All 2.6% 4.1% 7.3% 92.7%
Grade 7 3.6% 5.4% 7.0% 93.0%Grade 8 2.3% 3.4% 6.6% 93.4%Grade 9 2.2% 3.4% 6.1% 93.9%
Grade 10 3.0% 5.1% 9.6% 90.4%
Grade 11 2.8% 4.1% 8.1% 91.9%Grade 12 1 6% 2 4% 6 5% 93 5%

8/14/2019 HARRIS COUNTY - Pasadena ISD - 1998 Texas School Survey of Drug and Alcohol Use
http://slidepdf.com/reader/full/harris-county-pasadena-isd-1998-texas-school-survey-of-drug-and-alcohol 71/213
Grade 12 1.6% 2.4% 6.5% 93.5%_____________________________________________________________________________________Steroids All 0.4% 0.6% 1.8% 98.2%
Grade 7 0.2% 0.4% 1.3% 98.7%Grade 8 0.4% 0.4% 2.0% 98.0%Grade 9 0.5% 0.8% 1.8% 98.2%Grade 10 0.5% 0.7% 1.4% 98.6%Grade 11 0.5% 0.9% 2.3% 97.7%
Grade 12 0.2% 0.7% 2.0% 98.0%_____________________________________________________________________________________Ecstasy All 1.2% 2.5% 5.0% 95.0%
Grade 7 0.4% 1.6% 2.2% 97.8%Grade 8 1.2% 2.0% 4.2% 95.8%Grade 9 0.8% 1.8% 4.7% 95.3%Grade 10 1.6% 3.3% 6.5% 93.5%Grade 11 2.4% 3.5% 6.8% 93.2%Grade 12 1.4% 3.3% 6.4% 93.6%
_____________________________________________________________________________________Heroin All 0.5% 1.0% 2.1% 97.9%
Grade 7 1.2% 2.4% 3.6% 96.4%
Grade 8 0.2% 1.2% 4.1% 95.9%Grade 9 0.5% 0.5% 1.0% 99.0%Grade 10 0.2% 0.7% 1.4% 98.6%Grade 11 0.4% 0.7% 1.3% 98.7%Grade 12 * % 0.2% 0.5% 99.5%

8/14/2019 HARRIS COUNTY - Pasadena ISD - 1998 Texas School Survey of Drug and Alcohol Use
http://slidepdf.com/reader/full/harris-county-pasadena-isd-1998-texas-school-survey-of-drug-and-alcohol 72/213
Grade 10 24.9% 32.9% 50.7% 49.3%Grade 11 26 2% 38 0% 50 2% 49 8%

8/14/2019 HARRIS COUNTY - Pasadena ISD - 1998 Texas School Survey of Drug and Alcohol Use
http://slidepdf.com/reader/full/harris-county-pasadena-isd-1998-texas-school-survey-of-drug-and-alcohol 73/213
Grade 11 26.2% 38.0% 50.2% 49.8%Grade 12 14.9% 28.9% 46.7% 53.3%
_____________________________________________________________________________________Marijuana Only All 6.3% 10.5% 20.3% 79.7%
Grade 7 5.6% 8.8% 15.1% 84.9%Grade 8 4.3% 9.6% 21.6% 78.4%Grade 9 4.7% 6.8% 14.7% 85.3%Grade 10 9.4% 12.8% 25.5% 74.5%
Grade 11 10.9% 15.5% 23.4% 76.6%Grade 12 4.0% 11.2% 23.2% 76.8%
_____________________________________________________________________________________Cocaine or Crack All 3.7% 5.8% 9.1% 90.9%
Grade 7 1.3% 3.6% 5.4% 94.6%Grade 8 4.9% 7.1% 9.8% 90.2%Grade 9 2.8% 3.4% 6.2% 93.8%Grade 10 4.5% 6.8% 10.4% 89.6%Grade 11 4.4% 6.7% 11.1% 88.9%Grade 12 4.2% 8.0% 13.0% 87.0%
_____________________________________________________________________________________Cocaine All 3.2% 5.6% 8.8% 91.2%
Grade 7 1.4% 3.7% 5.5% 94.5%Grade 8 3.1% 6.2% 8.9% 91.1%Grade 9 2.3% 2.9% 5.7% 94.3%Grade 10 4.6% 6.9% 10.6% 89.4%Grade 11 4.1% 6.4% 10.5% 89.5%Grade 12 4.4% 8.3% 13.5% 86.5%
PasadenaSpring 1998

8/14/2019 HARRIS COUNTY - Pasadena ISD - 1998 Texas School Survey of Drug and Alcohol Use
http://slidepdf.com/reader/full/harris-county-pasadena-isd-1998-texas-school-survey-of-drug-and-alcohol 74/213
Spring 1998
Table B2 continued from previous page
Past School Ever NeverMonth Year Used Used
_____________________________________________________________________________________Crack All 1.0% 1.3% 2.5% 97.5%
Grade 7 0.5% 1.0% 1.9% 98.1%Grade 8 3.2% 3.6% 4.9% 95.1%Grade 9 0.6% 1.2% 2.4% 97.6%Grade 10 * % 0.5% 1.0% 99.0%Grade 11 1.0% 1.0% 2.4% 97.6%Grade 12 * % * % 1.3% 98.7%
_____________________________________________________________________________________Hallucinogens All 4.3% 8.4% 12.6% 87.4%
Grade 7 0.9% 3.2% 5.0% 95.0%Grade 8 3.6% 7.1% 10.3% 89.7%Grade 9 4.5% 8.0% 10.2% 89.8%Grade 10 5.7% 11.0% 18.1% 81.9%
Grade 11 8.1% 15.7% 22.4% 77.6%Grade 12 3.5% 6.2% 11.5% 88.5%
_____________________________________________________________________________________Uppers All 2.6% 5.6% 8.4% 91.6%
Grade 7 0.5% 1.0% 3.1% 96.9%Grade 8 2.1% 4.2% 6.8% 93.2%Grade 9 2.5% 4.9% 8.6% 91.4%Grade 10 3.0% 10.2% 14.2% 85.8%Grade 11 6.7% 9.7% 12.8% 87.2%Grade 12 1.0% 4.4% 5.3% 94.7%
_____________________________________________________________________________________Downers All 2.8% 5.2% 7.8% 92.2%
Grade 7 * % 1.5% 2.9% 97.1%Grade 8 4.6% 5.9% 6.7% 93.3%Grade 9 1.9% 4.4% 6.3% 93.7%Grade 10 4.4% 9.4% 14.8% 85.2%Grade 11 4.6% 7.6% 11.7% 88.3%Grade 12 1.0% 2.4% 5.2% 94.8%
_____________________________________________________________________________________Rohypnol All 2.8% 4.8% 8.1% 91.9%
Grade 7 1.9% 4.7% 6.6% 93.4%Grade 8 2.8% 4.8% 7.5% 92.5%Grade 9 3.5% 5.2% 8.1% 91.9%
Grade 10 3.3% 6.1% 10.4% 89.6%
Grade 11 3.8% 5.6% 9.9% 90.1%Grade 12 1.3% 1.8% 6.3% 93.7%

8/14/2019 HARRIS COUNTY - Pasadena ISD - 1998 Texas School Survey of Drug and Alcohol Use
http://slidepdf.com/reader/full/harris-county-pasadena-isd-1998-texas-school-survey-of-drug-and-alcohol 75/213
Grade 12 1.3% 1.8% 6.3% 93.7%_____________________________________________________________________________________Steroids All 0.5% 1.1% 3.0% 97.0%
Grade 7 0.5% 1.1% 1.6% 98.4%Grade 8 * % * % 2.1% 97.9%Grade 9 1.2% 1.9% 4.3% 95.7%Grade 10 0.5% 1.0% 2.5% 97.5%Grade 11 0.5% 1.5% 3.6% 96.4%
Grade 12 0.5% 1.5% 4.0% 96.0%_____________________________________________________________________________________Ecstasy All 1.5% 2.9% 5.5% 94.5%
Grade 7 0.5% 1.1% 1.1% 98.9%Grade 8 0.8% 1.2% 3.3% 96.7%Grade 9 1.3% 2.5% 5.6% 94.4%Grade 10 1.5% 4.1% 7.7% 92.3%Grade 11 3.9% 5.9% 11.3% 88.7%Grade 12 1.4% 3.4% 5.3% 94.7%
_____________________________________________________________________________________Heroin All 0.5% 0.9% 2.3% 97.7%
Grade 7 1.4% 2.4% 3.8% 96.2%
Grade 8 0.4% 1.2% 4.5% 95.5%Grade 9 0.6% 0.6% 1.2% 98.8%Grade 10 * % * % 0.5% 99.5%Grade 11 0.5% 0.9% 2.3% 97.7%Grade 12 * % * % 0.5% 99.5%
PasadenaSpring 1998

8/14/2019 HARRIS COUNTY - Pasadena ISD - 1998 Texas School Survey of Drug and Alcohol Use
http://slidepdf.com/reader/full/harris-county-pasadena-isd-1998-texas-school-survey-of-drug-and-alcohol 76/213
Spring 1998
Table B3: Prevalence and recency of use of selected substances by grade--> Female students
Past School Ever NeverMonth Year Used Used
_____________________________________________________________________________________
Tobacco All 23.6% 32.8% 51.6% 48.4%Grade 7 16.3% 19.8% 31.9% 68.1%Grade 8 22.5% 32.2% 51.2% 48.8%Grade 9 25.0% 37.5% 57.8% 42.2%Grade 10 27.8% 37.0% 57.0% 43.0%Grade 11 25.4% 36.9% 57.7% 42.3%Grade 12 27.2% 37.4% 60.2% 39.8%
_____________________________________________________________________________________Alcohol All 38.2% 54.1% 73.1% 26.9%
Grade 7 27.9% 35.6% 57.5% 42.5%Grade 8 35.6% 51.4% 71.9% 28.1%Grade 9 39.1% 58.1% 73.3% 26.7%
Grade 10 39.5% 58.3% 78.6% 21.4%Grade 11 41.4% 60.5% 80.1% 19.9%Grade 12 53.1% 70.6% 86.1% 13.9%
_____________________________________________________________________________________Inhalants All 6.5% 10.0% 18.0% 82.0%
Grade 7 12.0% 17.1% 25.3% 74.7%Grade 8 8.6% 15.1% 24.7% 75.3%Grade 9 4.6% 7.2% 13.3% 86.7%Grade 10 5.5% 7.7% 16.9% 83.1%Grade 11 3.1% 4.6% 14.5% 85.5%Grade 12 2.4% 4.5% 8.5% 91.5%
_____________________________________________________________________________________Any Illicit Drug All 13.9% 21.4% 30.9% 69.1%
Grade 7 11.1% 13.4% 20.4% 79.6%Grade 8 13.4% 20.9% 29.8% 70.2%Grade 9 13.8% 24.6% 31.2% 68.8%Grade 10 15.1% 23.6% 35.1% 64.9%Grade 11 16.9% 25.3% 38.3% 61.7%Grade 12 14.2% 22.8% 35.8% 64.2%
_____________________________________________________________________________________Marijuana All 12.2% 19.5% 29.2% 70.8%
Grade 7 8.2% 11.5% 18.8% 81.2%Grade 8 10.8% 18.8% 28.2% 71.8%
Grade 9 14.2% 23.3% 29.6% 70.4%
Grade 10 12.7% 20.5% 32.8% 67.2%Grade 11 15.2% 23.4% 36.7% 63.3%
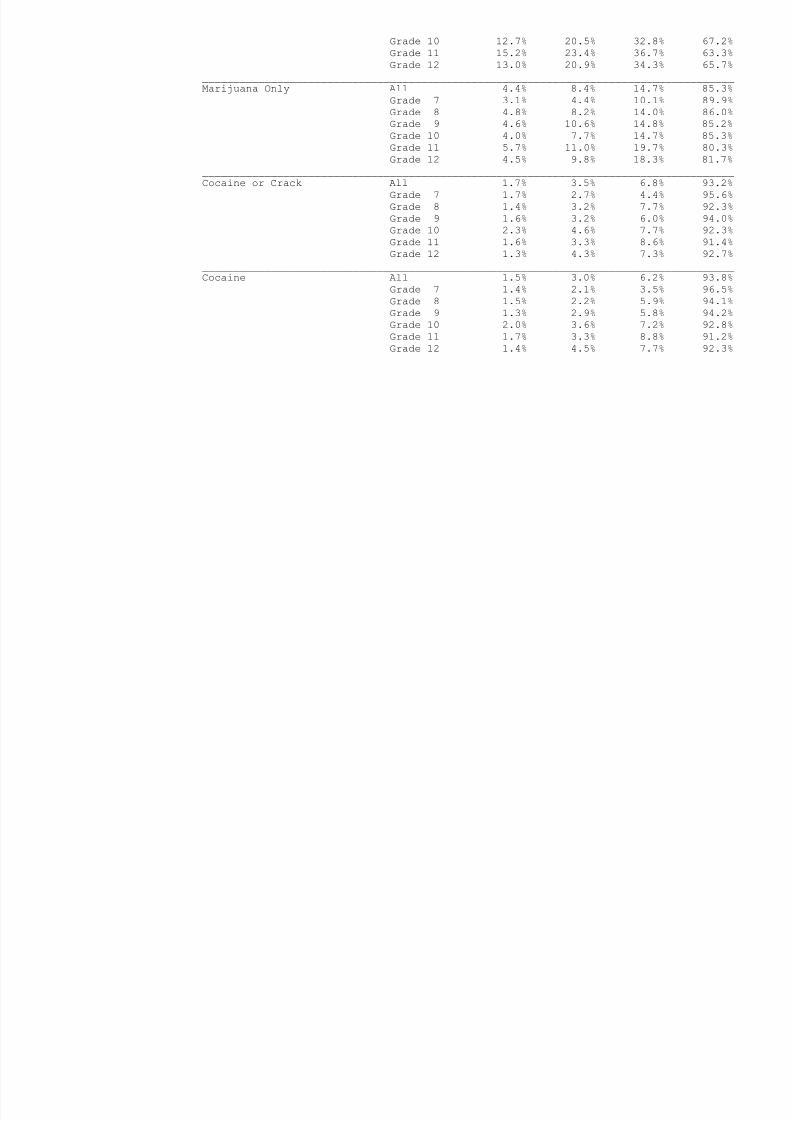
8/14/2019 HARRIS COUNTY - Pasadena ISD - 1998 Texas School Survey of Drug and Alcohol Use
http://slidepdf.com/reader/full/harris-county-pasadena-isd-1998-texas-school-survey-of-drug-and-alcohol 77/213
Grade 12 13.0% 20.9% 34.3% 65.7%_____________________________________________________________________________________Marijuana Only All 4.4% 8.4% 14.7% 85.3%
Grade 7 3.1% 4.4% 10.1% 89.9%Grade 8 4.8% 8.2% 14.0% 86.0%Grade 9 4.6% 10.6% 14.8% 85.2%Grade 10 4.0% 7.7% 14.7% 85.3%
Grade 11 5.7% 11.0% 19.7% 80.3%Grade 12 4.5% 9.8% 18.3% 81.7%_____________________________________________________________________________________Cocaine or Crack All 1.7% 3.5% 6.8% 93.2%
Grade 7 1.7% 2.7% 4.4% 95.6%Grade 8 1.4% 3.2% 7.7% 92.3%Grade 9 1.6% 3.2% 6.0% 94.0%Grade 10 2.3% 4.6% 7.7% 92.3%Grade 11 1.6% 3.3% 8.6% 91.4%Grade 12 1.3% 4.3% 7.3% 92.7%
_____________________________________________________________________________________Cocaine All 1.5% 3.0% 6.2% 93.8%
Grade 7 1.4% 2.1% 3.5% 96.5%Grade 8 1.5% 2.2% 5.9% 94.1%Grade 9 1.3% 2.9% 5.8% 94.2%Grade 10 2.0% 3.6% 7.2% 92.8%Grade 11 1.7% 3.3% 8.8% 91.2%Grade 12 1.4% 4.5% 7.7% 92.3%
PasadenaSpring 1998

8/14/2019 HARRIS COUNTY - Pasadena ISD - 1998 Texas School Survey of Drug and Alcohol Use
http://slidepdf.com/reader/full/harris-county-pasadena-isd-1998-texas-school-survey-of-drug-and-alcohol 78/213
p g
Table B3 continued from previous page
Past School Ever NeverMonth Year Used Used
_____________________________________________________________________________________Crack All 0.4% 1.1% 2.2% 97.8%
Grade 7 0.7% 1.8% 3.2% 96.8%Grade 8 * % 1.5% 4.1% 95.9%Grade 9 0.8% 1.3% 1.3% 98.7%Grade 10 0.4% 1.2% 2.0% 98.0%Grade 11 * % * % 1.3% 98.7%Grade 12 * % 0.4% 0.9% 99.1%
_____________________________________________________________________________________Hallucinogens All 3.0% 5.4% 7.9% 92.1%
Grade 7 1.3% 2.7% 2.7% 97.3%Grade 8 1.8% 2.1% 3.9% 96.1%Grade 9 3.3% 7.3% 10.2% 89.8%Grade 10 5.1% 8.6% 11.7% 88.3%
Grade 11 3.7% 6.1% 9.4% 90.6%Grade 12 3.5% 6.6% 11.9% 88.1%
_____________________________________________________________________________________Uppers All 3.0% 4.8% 8.1% 91.9%
Grade 7 1.8% 3.2% 3.9% 96.1%Grade 8 0.8% 1.6% 5.3% 94.7%Grade 9 4.8% 7.0% 10.0% 90.0%Grade 10 4.2% 6.8% 10.2% 89.8%Grade 11 2.7% 4.6% 9.1% 90.9%Grade 12 3.4% 5.4% 12.3% 87.7%
_____________________________________________________________________________________Downers All 2.5% 3.4% 6.2% 93.8%
Grade 7 1.1% 1.4% 3.2% 96.8%Grade 8 0.8% 1.2% 3.5% 96.5%Grade 9 3.6% 4.9% 7.1% 92.9%Grade 10 4.9% 7.0% 10.3% 89.7%Grade 11 2.2% 2.6% 7.0% 93.0%Grade 12 2.9% 3.3% 7.2% 92.8%
_____________________________________________________________________________________Rohypnol All 2.4% 3.4% 6.5% 93.5%
Grade 7 4.5% 5.5% 6.9% 93.1%Grade 8 1.8% 2.2% 5.8% 94.2%Grade 9 1.3% 2.1% 4.6% 95.4%
Grade 10 2.7% 4.3% 9.0% 91.0%
Grade 11 2.0% 2.9% 6.6% 93.4%Grade 12 1.8% 3.1% 6.7% 93.3%

8/14/2019 HARRIS COUNTY - Pasadena ISD - 1998 Texas School Survey of Drug and Alcohol Use
http://slidepdf.com/reader/full/harris-county-pasadena-isd-1998-texas-school-survey-of-drug-and-alcohol 79/213
_____________________________________________________________________________________Steroids All 0.3% 0.3% 0.8% 99.2%
Grade 7 * % * % 1.1% 98.9%Grade 8 0.8% 0.8% 1.9% 98.1%Grade 9 * % * % * % 100.0%Grade 10 0.4% 0.4% 0.4% 99.6%Grade 11 0.4% 0.4% 1.3% 98.7%
Grade 12 * % * % * % 100.0%_____________________________________________________________________________________Ecstasy All 1.0% 2.1% 4.5% 95.5%
Grade 7 0.4% 1.5% 2.7% 97.3%Grade 8 1.6% 2.8% 5.1% 94.9%Grade 9 0.5% 1.4% 4.1% 95.9%Grade 10 1.7% 2.6% 5.6% 94.4%Grade 11 0.9% 1.4% 2.7% 97.3%Grade 12 1.4% 3.3% 7.5% 92.5%
_____________________________________________________________________________________Heroin All 0.4% 1.0% 1.9% 98.1%
Grade 7 1.0% 2.1% 3.1% 96.9%
Grade 8 * % 1.1% 3.8% 96.2%Grade 9 0.4% 0.4% 0.9% 99.1%Grade 10 0.4% 1.3% 2.1% 97.9%Grade 11 0.4% 0.4% 0.4% 99.6%Grade 12 * % 0.5% 0.5% 99.5%
PasadenaSpring 1998

8/14/2019 HARRIS COUNTY - Pasadena ISD - 1998 Texas School Survey of Drug and Alcohol Use
http://slidepdf.com/reader/full/harris-county-pasadena-isd-1998-texas-school-survey-of-drug-and-alcohol 80/213
Table B4: Prevalence and recency of use of selected substances by grade--> White students
Past School Ever NeverMonth Year Used Used
_____________________________________________________________________________________
Tobacco All 34.3% 44.2% 62.2% 37.8%Grade 7 13.7% 19.0% 35.3% 64.7%Grade 8 32.2% 40.9% 59.1% 40.9%Grade 9 33.0% 43.6% 61.7% 38.3%Grade 10 44.6% 51.8% 71.3% 28.7%Grade 11 43.5% 56.9% 75.5% 24.5%Grade 12 35.5% 49.3% 66.4% 33.6%
_____________________________________________________________________________________Alcohol All 42.1% 61.2% 77.3% 22.7%
Grade 7 19.6% 30.1% 51.6% 48.4%Grade 8 38.0% 57.3% 73.3% 26.7%Grade 9 40.3% 63.4% 75.3% 24.7%
Grade 10 45.6% 67.2% 88.2% 11.8%Grade 11 49.1% 71.8% 86.1% 13.9%Grade 12 59.1% 73.0% 86.5% 13.5%
_____________________________________________________________________________________Inhalants All 7.5% 12.6% 21.4% 78.6%
Grade 7 11.0% 19.4% 27.1% 72.9%Grade 8 13.4% 20.1% 32.2% 67.8%Grade 9 8.5% 12.8% 16.5% 83.5%Grade 10 5.0% 10.1% 22.1% 77.9%Grade 11 4.6% 8.8% 21.2% 78.8%Grade 12 3.2% 6.0% 12.5% 87.5%
_____________________________________________________________________________________Any Illicit Drug All 20.4% 29.6% 40.7% 59.3%
Grade 7 6.5% 11.0% 18.8% 81.2%Grade 8 21.6% 29.7% 39.2% 60.8%Grade 9 17.0% 25.5% 34.6% 65.4%Grade 10 27.0% 37.2% 52.0% 48.0%Grade 11 29.8% 40.9% 52.6% 47.4%Grade 12 19.7% 32.1% 46.3% 53.7%
_____________________________________________________________________________________Marijuana All 18.6% 28.1% 39.1% 60.9%
Grade 7 4.7% 9.4% 17.4% 82.6%Grade 8 19.9% 28.8% 38.4% 61.6%
Grade 9 17.4% 24.5% 31.5% 68.5%
Grade 10 23.6% 33.8% 50.3% 49.7%Grade 11 26.7% 40.5% 52.4% 47.6%

8/14/2019 HARRIS COUNTY - Pasadena ISD - 1998 Texas School Survey of Drug and Alcohol Use
http://slidepdf.com/reader/full/harris-county-pasadena-isd-1998-texas-school-survey-of-drug-and-alcohol 81/213
Grade 12 17.8% 30.5% 44.6% 55.4%_____________________________________________________________________________________Marijuana Only All 6.3% 11.4% 18.8% 81.2%
Grade 7 1.9% 4.5% 11.0% 89.0%Grade 8 7.9% 13.2% 19.2% 80.8%Grade 9 4.3% 9.0% 14.4% 85.6%Grade 10 8.0% 12.5% 23.0% 77.0%
Grade 11 8.7% 15.6% 22.9% 77.1%Grade 12 7.3% 14.2% 23.4% 76.6%_____________________________________________________________________________________Cocaine or Crack All 2.8% 4.6% 8.5% 91.5%
Grade 7 0.7% 2.1% 4.2% 95.8%Grade 8 1.4% 2.8% 7.0% 93.0%Grade 9 3.3% 3.8% 6.0% 94.0%Grade 10 4.3% 6.4% 9.6% 90.4%Grade 11 3.5% 5.5% 13.9% 86.1%Grade 12 2.9% 6.8% 10.6% 89.4%
_____________________________________________________________________________________Cocaine All 2.4% 4.1% 7.8% 92.2%
Grade 7 0.7% 1.5% 2.2% 97.8%Grade 8 * % 1.5% 4.4% 95.6%Grade 9 2.9% 3.4% 5.7% 94.3%Grade 10 3.8% 5.5% 9.3% 90.7%Grade 11 3.1% 5.1% 13.8% 86.2%Grade 12 3.0% 7.0% 11.1% 88.9%
PasadenaSpring 1998

8/14/2019 HARRIS COUNTY - Pasadena ISD - 1998 Texas School Survey of Drug and Alcohol Use
http://slidepdf.com/reader/full/harris-county-pasadena-isd-1998-texas-school-survey-of-drug-and-alcohol 82/213
Table B4 continued from previous page
Past School Ever NeverMonth Year Used Used
_____________________________________________________________________________________Crack All 0.9% 1.6% 2.8% 97.2%
Grade 7 0.8% 1.5% 3.0% 97.0%Grade 8 1.5% 2.9% 5.1% 94.9%Grade 9 1.2% 2.3% 2.3% 97.7%Grade 10 0.6% 1.1% 2.9% 97.1%Grade 11 1.1% 1.1% 2.6% 97.4%Grade 12 * % 0.5% 1.5% 98.5%
_____________________________________________________________________________________Hallucinogens All 6.1% 10.2% 14.9% 85.1%
Grade 7 1.4% 2.1% 2.1% 97.9%Grade 8 4.5% 7.5% 11.3% 88.7%Grade 9 7.3% 11.2% 14.5% 85.5%Grade 10 8.1% 13.0% 20.5% 79.5%
Grade 11 9.2% 17.0% 22.8% 77.2%Grade 12 4.0% 7.0% 15.1% 84.9%
_____________________________________________________________________________________Uppers All 5.2% 8.9% 12.9% 87.1%
Grade 7 1.6% 3.1% 4.7% 95.3%Grade 8 2.4% 4.0% 8.1% 91.9%Grade 9 6.6% 9.6% 13.8% 86.2%Grade 10 7.1% 14.3% 17.3% 82.7%Grade 11 7.7% 11.0% 15.9% 84.1%Grade 12 3.9% 9.0% 15.2% 84.8%
_____________________________________________________________________________________Downers All 4.8% 7.3% 10.4% 89.6%
Grade 7 0.7% 0.7% 3.7% 96.3%Grade 8 5.6% 6.4% 8.8% 91.2%Grade 9 5.0% 7.5% 9.4% 90.6%Grade 10 8.2% 14.7% 17.6% 82.4%Grade 11 5.9% 8.1% 12.4% 87.6%Grade 12 2.6% 4.8% 9.0% 91.0%
_____________________________________________________________________________________Rohypnol All 3.2% 5.0% 8.2% 91.8%
Grade 7 3.7% 5.9% 6.7% 93.3%Grade 8 1.5% 2.9% 6.6% 93.4%Grade 9 3.0% 5.4% 7.8% 92.2%
Grade 10 3.8% 5.5% 9.3% 90.7%
Grade 11 5.0% 6.4% 10.9% 89.1%Grade 12 1.5% 3.0% 7.5% 92.5%

8/14/2019 HARRIS COUNTY - Pasadena ISD - 1998 Texas School Survey of Drug and Alcohol Use
http://slidepdf.com/reader/full/harris-county-pasadena-isd-1998-texas-school-survey-of-drug-and-alcohol 83/213
_____________________________________________________________________________________Steroids All 0.5% 1.1% 3.0% 97.0%
Grade 7 0.8% 0.8% 4.0% 96.0%Grade 8 * % * % 3.2% 96.8%Grade 9 0.6% 1.2% 3.7% 96.3%Grade 10 0.6% 1.2% 1.8% 98.2%Grade 11 0.5% 1.6% 2.7% 97.3%
Grade 12 * % 1.1% 2.7% 97.3%_____________________________________________________________________________________Ecstasy All 1.6% 3.4% 7.6% 92.4%
Grade 7 * % * % 0.8% 99.2%Grade 8 0.8% 2.4% 7.9% 92.1%Grade 9 1.2% 3.1% 6.8% 93.2%Grade 10 2.4% 5.5% 9.8% 90.2%Grade 11 2.7% 3.8% 10.2% 89.8%Grade 12 2.1% 4.7% 9.4% 90.6%
_____________________________________________________________________________________Heroin All 0.5% 0.8% 2.0% 98.0%
Grade 7 0.7% 1.5% 1.5% 98.5%
Grade 8 * % * % 2.3% 97.7%Grade 9 1.2% 1.2% 2.3% 97.7%Grade 10 0.6% 1.2% 2.9% 97.1%Grade 11 * % * % 1.6% 98.4%Grade 12 * % 0.5% 1.0% 99.0%
PasadenaSpring 1998

8/14/2019 HARRIS COUNTY - Pasadena ISD - 1998 Texas School Survey of Drug and Alcohol Use
http://slidepdf.com/reader/full/harris-county-pasadena-isd-1998-texas-school-survey-of-drug-and-alcohol 84/213
Table B5: Prevalence and recency of use of selected substances by grade--> Black students
Past School Ever NeverMonth Year Used Used
_____________________________________________________________________________________
Tobacco All 12.5% 19.0% 41.3% 58.7%Grade 7 10.3% 17.9% 33.3% 66.7%Grade 8 6.7% 10.0% 36.7% 63.3%Grade 9 16.0% 20.0% 52.0% 48.0%Grade 10 20.0% 30.0% 50.0% 50.0%Grade 11 9.4% 18.8% 40.6% 59.4%Grade 12 14.3% 14.3% 28.6% 71.4%
_____________________________________________________________________________________Alcohol All 31.3% 43.9% 65.9% 34.1%
Grade 7 32.5% 40.0% 62.5% 37.5%Grade 8 30.0% 43.3% 73.3% 26.7%Grade 9 20.0% 24.0% 48.0% 52.0%
Grade 10 36.7% 56.7% 76.7% 23.3%Grade 11 37.5% 56.3% 68.8% 31.3%Grade 12 35.7% 57.1% 78.6% 21.4%
_____________________________________________________________________________________Inhalants All 2.3% 4.9% 14.3% 85.7%
Grade 7 7.5% 10.0% 25.0% 75.0%Grade 8 * % 6.7% 13.3% 86.7%Grade 9 * % * % 7.7% 92.3%Grade 10 * % * % 9.7% 90.3%Grade 11 3.1% 6.2% 15.6% 84.4%Grade 12 * % 6.7% 6.7% 93.3%
_____________________________________________________________________________________
Any Illicit Drug All 9.5% 14.5% 28.0% 72.0%Grade 7 2.5% 2.5% 12.5% 87.5%Grade 8 3.3% 13.3% 20.0% 80.0%Grade 9 11.5% 15.4% 34.6% 65.4%Grade 10 10.0% 16.7% 36.7% 63.3%Grade 11 25.0% 31.3% 37.5% 62.5%Grade 12 6.7% 13.3% 40.0% 60.0%
_____________________________________________________________________________________Marijuana All 9.3% 14.5% 26.6% 73.4%
Grade 7 2.6% 2.6% 7.9% 92.1%Grade 8 3.3% 13.3% 20.0% 80.0%
Grade 9 12.5% 16.7% 37.5% 62.5%
Grade 10 10.0% 16.7% 33.3% 66.7%Grade 11 21.9% 28.1% 34.4% 65.6%G d 12 7 1% 14 3% 42 9% 57 1%

8/14/2019 HARRIS COUNTY - Pasadena ISD - 1998 Texas School Survey of Drug and Alcohol Use
http://slidepdf.com/reader/full/harris-county-pasadena-isd-1998-texas-school-survey-of-drug-and-alcohol 85/213
Grade 12 7.1% 14.3% 42.9% 57.1%_____________________________________________________________________________________Marijuana Only All 6.6% 11.6% 22.6% 77.4%
Grade 7 * % * % 2.5% 97.5%Grade 8 * % 10.0% 16.7% 83.3%Grade 9 7.7% 11.5% 30.8% 69.2%Grade 10 9.7% 16.1% 32.3% 67.7%
Grade 11 21.9% 28.1% 34.4% 65.6%Grade 12 * % 6.7% 33.3% 66.7%_____________________________________________________________________________________Cocaine or Crack All * % * % * % 100.0%
Grade 7 * % * % * % 100.0%Grade 8 * % * % * % 100.0%Grade 9 * % * % * % 100.0%Grade 10 * % * % * % 100.0%Grade 11 * % * % * % 100.0%Grade 12 * % * % * % 100.0%
_____________________________________________________________________________________Cocaine All * % * % * % 100.0%
Grade 7 * % * % * % 100.0%Grade 8 * % * % * % 100.0%Grade 9 * % * % * % 100.0%Grade 10 * % * % * % 100.0%Grade 11 * % * % * % 100.0%Grade 12 * % * % * % 100.0%
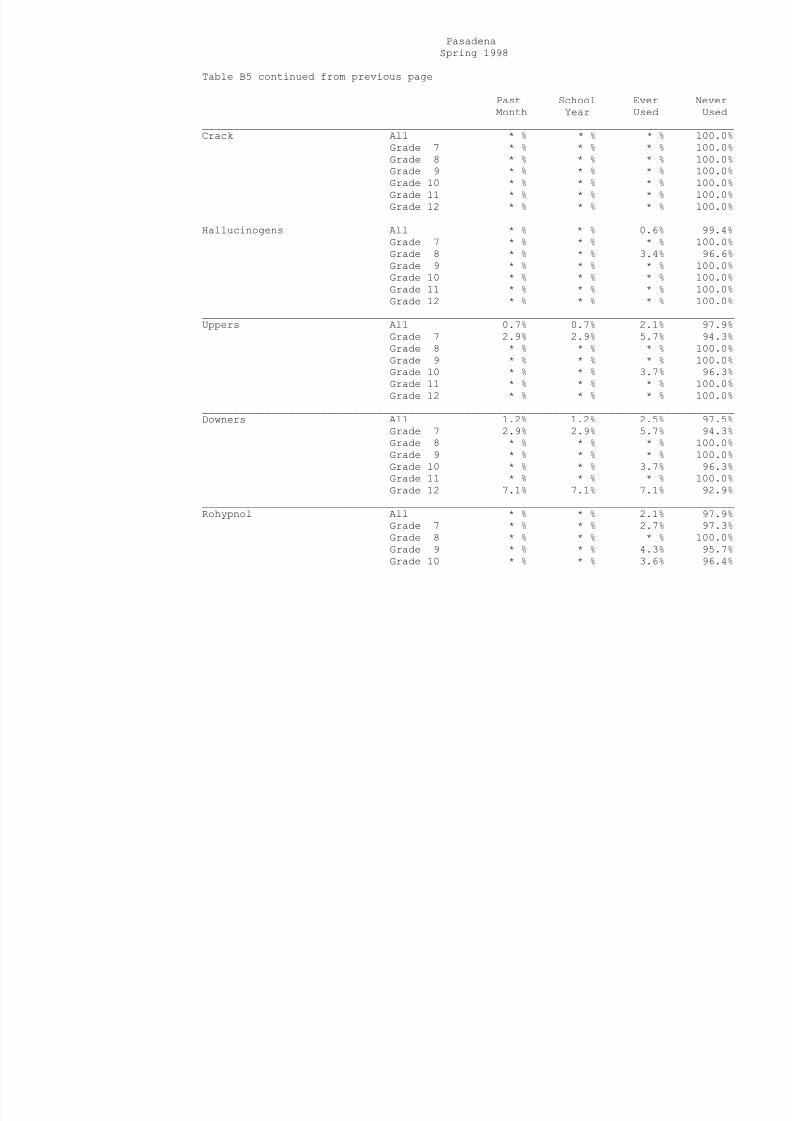
8/14/2019 HARRIS COUNTY - Pasadena ISD - 1998 Texas School Survey of Drug and Alcohol Use
http://slidepdf.com/reader/full/harris-county-pasadena-isd-1998-texas-school-survey-of-drug-and-alcohol 86/213
Grade 11 * % * % * % 100.0%Grade 12 * % * % * % 100.0%

8/14/2019 HARRIS COUNTY - Pasadena ISD - 1998 Texas School Survey of Drug and Alcohol Use
http://slidepdf.com/reader/full/harris-county-pasadena-isd-1998-texas-school-survey-of-drug-and-alcohol 87/213
_____________________________________________________________________________________Steroids All 0.6% 0.6% 0.6% 99.4%
Grade 7 * % * % * % 100.0%Grade 8 * % * % * % 100.0%Grade 9 * % * % * % 100.0%Grade 10 * % * % * % 100.0%Grade 11 3.8% 3.8% 3.8% 96.2%
Grade 12 * % * % * % 100.0%_____________________________________________________________________________________Ecstasy All * % * % 0.7% 99.3%
Grade 7 * % * % * % 100.0%Grade 8 * % * % * % 100.0%Grade 9 * % * % * % 100.0%Grade 10 * % * % 3.6% 96.4%Grade 11 * % * % * % 100.0%Grade 12 * % * % * % 100.0%
_____________________________________________________________________________________Heroin All 0.6% 0.6% 1.3% 98.7%
Grade 7 * % * % 2.6% 97.4%
Grade 8 * % * % * % 100.0%Grade 9 * % * % * % 100.0%Grade 10 * % * % * % 100.0%Grade 11 3.8% 3.8% 3.8% 96.2%Grade 12 * % * % * % 100.0%
PasadenaSpring 1998
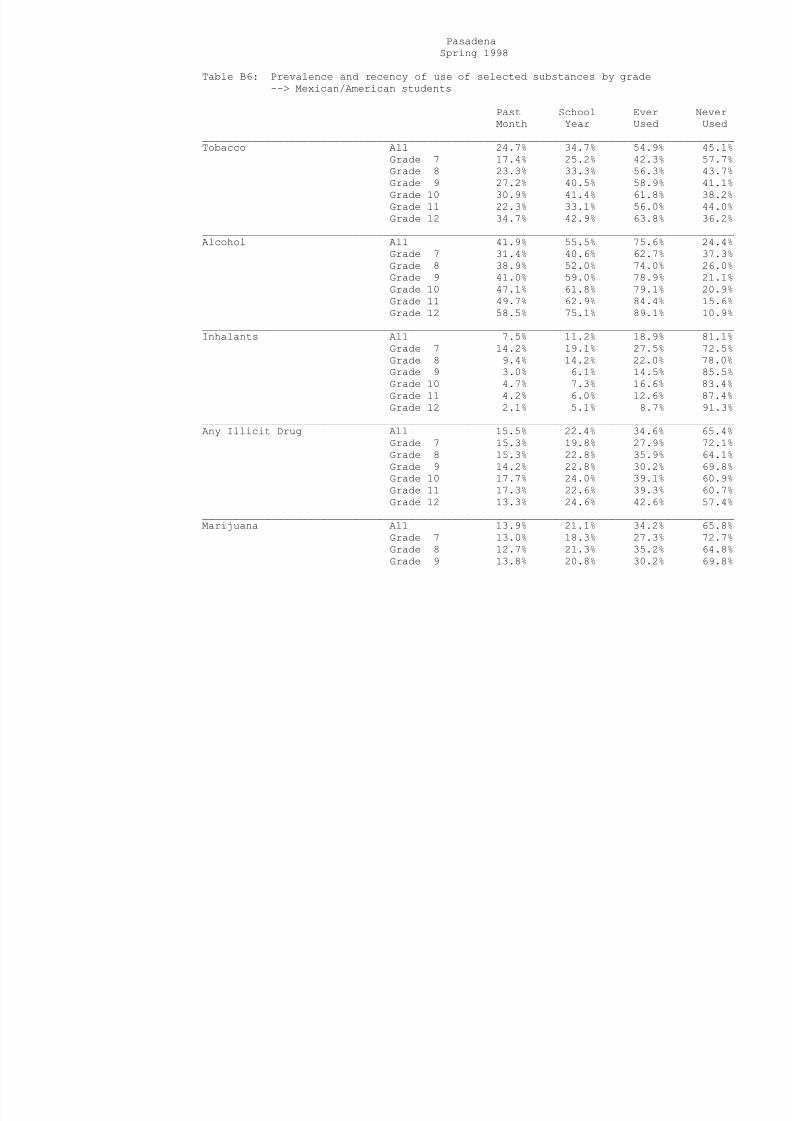
8/14/2019 HARRIS COUNTY - Pasadena ISD - 1998 Texas School Survey of Drug and Alcohol Use
http://slidepdf.com/reader/full/harris-county-pasadena-isd-1998-texas-school-survey-of-drug-and-alcohol 88/213
Table B6: Prevalence and recency of use of selected substances by grade--> Mexican/American students
Past School Ever NeverMonth Year Used Used
_____________________________________________________________________________________
Tobacco All 24.7% 34.7% 54.9% 45.1%Grade 7 17.4% 25.2% 42.3% 57.7%Grade 8 23.3% 33.3% 56.3% 43.7%Grade 9 27.2% 40.5% 58.9% 41.1%Grade 10 30.9% 41.4% 61.8% 38.2%Grade 11 22.3% 33.1% 56.0% 44.0%Grade 12 34.7% 42.9% 63.8% 36.2%
_____________________________________________________________________________________Alcohol All 41.9% 55.5% 75.6% 24.4%
Grade 7 31.4% 40.6% 62.7% 37.3%Grade 8 38.9% 52.0% 74.0% 26.0%Grade 9 41.0% 59.0% 78.9% 21.1%
Grade 10 47.1% 61.8% 79.1% 20.9%Grade 11 49.7% 62.9% 84.4% 15.6%Grade 12 58.5% 75.1% 89.1% 10.9%
_____________________________________________________________________________________Inhalants All 7.5% 11.2% 18.9% 81.1%
Grade 7 14.2% 19.1% 27.5% 72.5%Grade 8 9.4% 14.2% 22.0% 78.0%Grade 9 3.0% 6.1% 14.5% 85.5%Grade 10 4.7% 7.3% 16.6% 83.4%Grade 11 4.2% 6.0% 12.6% 87.4%Grade 12 2.1% 5.1% 8.7% 91.3%
_____________________________________________________________________________________
Any Illicit Drug All 15.5% 22.4% 34.6% 65.4%Grade 7 15.3% 19.8% 27.9% 72.1%Grade 8 15.3% 22.8% 35.9% 64.1%Grade 9 14.2% 22.8% 30.2% 69.8%Grade 10 17.7% 24.0% 39.1% 60.9%Grade 11 17.3% 22.6% 39.3% 60.7%Grade 12 13.3% 24.6% 42.6% 57.4%
_____________________________________________________________________________________Marijuana All 13.9% 21.1% 34.2% 65.8%
Grade 7 13.0% 18.3% 27.3% 72.7%Grade 8 12.7% 21.3% 35.2% 64.8%Grade 9 13.8% 20.8% 30.2% 69.8%
Grade 10 17.1% 23.5% 38.5% 61.5%Grade 11 15.9% 22.6% 39.0% 61.0%Grade 12 12 6% 22 5% 42 9% 57 1%

8/14/2019 HARRIS COUNTY - Pasadena ISD - 1998 Texas School Survey of Drug and Alcohol Use
http://slidepdf.com/reader/full/harris-county-pasadena-isd-1998-texas-school-survey-of-drug-and-alcohol 89/213
Grade 12 12.6% 22.5% 42.9% 57.1%_____________________________________________________________________________________Marijuana Only All 5.1% 8.5% 17.1% 82.9%
Grade 7 6.4% 8.3% 14.4% 85.6%Grade 8 4.4% 8.4% 19.0% 81.0%Grade 9 5.5% 9.7% 13.9% 86.1%Grade 10 5.7% 7.7% 17.0% 83.0%
Grade 11 5.3% 7.7% 18.3% 81.7%Grade 12 2.6% 8.7% 22.4% 77.6%_____________________________________________________________________________________Cocaine or Crack All 2.9% 5.7% 9.3% 90.7%
Grade 7 2.5% 4.6% 6.7% 93.3%Grade 8 4.2% 7.2% 11.1% 88.9%Grade 9 1.3% 3.2% 6.5% 93.5%Grade 10 2.2% 6.0% 9.8% 90.2%Grade 11 4.4% 6.9% 10.6% 89.4%Grade 12 2.7% 6.9% 12.8% 87.2%
_____________________________________________________________________________________Cocaine All 2.7% 5.4% 9.1% 90.9%
Grade 7 2.1% 4.3% 6.8% 93.2%Grade 8 3.6% 6.0% 9.9% 90.1%Grade 9 1.3% 3.3% 6.6% 93.4%Grade 10 2.2% 6.2% 10.1% 89.9%Grade 11 4.5% 7.1% 10.3% 89.7%Grade 12 2.8% 7.3% 13.5% 86.5%
PasadenaSpring 1998

8/14/2019 HARRIS COUNTY - Pasadena ISD - 1998 Texas School Survey of Drug and Alcohol Use
http://slidepdf.com/reader/full/harris-county-pasadena-isd-1998-texas-school-survey-of-drug-and-alcohol 90/213
Table B6 continued from previous page
Past School Ever NeverMonth Year Used Used
_____________________________________________________________________________________Crack All 0.6% 1.2% 2.5% 97.5%
Grade 7 0.7% 1.9% 3.4% 96.6%Grade 8 1.7% 2.8% 4.5% 95.5%Grade 9 * % * % 1.4% 98.6%Grade 10 * % 0.6% 0.6% 99.4%Grade 11 * % * % 1.9% 98.1%Grade 12 * % * % 1.1% 98.9%
_____________________________________________________________________________________Hallucinogens All 2.1% 5.3% 7.9% 92.1%
Grade 7 1.1% 3.9% 5.3% 94.7%Grade 8 2.3% 4.3% 6.0% 94.0%Grade 9 1.3% 6.7% 8.7% 91.3%Grade 10 3.3% 7.8% 11.7% 88.3%
Grade 11 2.6% 5.8% 11.5% 88.5%Grade 12 2.8% 5.1% 8.5% 91.5%
_____________________________________________________________________________________Uppers All 1.6% 3.7% 6.6% 93.4%
Grade 7 1.2% 2.3% 3.5% 96.5%Grade 8 1.5% 3.3% 6.2% 93.8%Grade 9 2.1% 4.9% 7.7% 92.3%Grade 10 0.6% 5.5% 10.3% 89.7%Grade 11 3.5% 4.2% 8.4% 91.6%Grade 12 1.2% 2.5% 5.5% 94.5%
_____________________________________________________________________________________Downers All 1.3% 2.6% 5.5% 94.5%
Grade 7 0.4% 1.9% 3.0% 97.0%Grade 8 1.8% 2.8% 4.6% 95.4%Grade 9 1.4% 3.6% 5.7% 94.3%Grade 10 1.2% 2.9% 9.3% 90.7%Grade 11 2.1% 3.4% 8.3% 91.7%Grade 12 1.2% 1.2% 4.9% 95.1%
_____________________________________________________________________________________Rohypnol All 3.0% 4.4% 8.0% 92.0%
Grade 7 4.4% 6.6% 8.1% 91.9%Grade 8 3.4% 4.4% 7.0% 93.0%Grade 9 2.0% 2.6% 6.6% 93.4%Grade 10 2.8% 5.0% 10.5% 89.5%
Grade 11 1.3% 3.2% 9.0% 91.0%Grade 12 2.3% 2.9% 7.5% 92.5%

8/14/2019 HARRIS COUNTY - Pasadena ISD - 1998 Texas School Survey of Drug and Alcohol Use
http://slidepdf.com/reader/full/harris-county-pasadena-isd-1998-texas-school-survey-of-drug-and-alcohol 91/213
_____________________________________________________________________________________Steroids All 0.2% 0.3% 1.1% 98.9%
Grade 7 * % 0.4% 0.4% 99.6%Grade 8 0.7% 0.7% 2.1% 97.9%Grade 9 * % * % * % 100.0%Grade 10 * % * % 0.6% 99.4%Grade 11 * % * % 1.4% 98.6%
Grade 12 0.6% 0.6% 1.9% 98.1%_____________________________________________________________________________________Ecstasy All 0.9% 2.0% 3.4% 96.6%
Grade 7 0.8% 2.5% 2.9% 97.1%Grade 8 1.4% 1.8% 2.5% 97.5%Grade 9 * % 0.7% 3.7% 96.3%Grade 10 * % 1.2% 3.0% 97.0%Grade 11 2.1% 3.5% 4.9% 95.1%Grade 12 1.2% 3.0% 4.9% 95.1%
_____________________________________________________________________________________Heroin All 0.6% 1.4% 2.7% 97.3%
Grade 7 1.9% 3.4% 5.3% 94.7%
Grade 8 0.3% 2.0% 5.5% 94.5%Grade 9 * % * % * % 100.0%Grade 10 * % * % * % 100.0%Grade 11 0.6% 1.3% 1.3% 98.7%Grade 12 * % * % * % 100.0%
PasadenaSpring 1998

8/14/2019 HARRIS COUNTY - Pasadena ISD - 1998 Texas School Survey of Drug and Alcohol Use
http://slidepdf.com/reader/full/harris-county-pasadena-isd-1998-texas-school-survey-of-drug-and-alcohol 92/213
Table B7: Prevalence and recency of use of selected substances by grade--> Students reporting A and B grades
Past School Ever NeverMonth Year Used Used
_____________________________________________________________________________________Tobacco All 23.8% 33.2% 52.1% 47.9%
Grade 7 13.0% 18.5% 34.8% 65.2%Grade 8 20.6% 30.0% 49.4% 50.6%Grade 9 23.5% 34.5% 54.2% 45.8%Grade 10 31.5% 40.6% 60.9% 39.1%Grade 11 26.8% 38.5% 58.3% 41.7%Grade 12 32.2% 42.3% 60.7% 39.3%
_____________________________________________________________________________________Alcohol All 38.3% 53.7% 72.5% 27.5%
Grade 7 26.1% 34.6% 56.1% 43.9%Grade 8 35.6% 48.2% 69.7% 30.3%Grade 9 34.4% 53.8% 70.8% 29.2%
Grade 10 42.6% 61.9% 80.7% 19.3%Grade 11 45.6% 63.0% 80.2% 19.8%Grade 12 53.5% 69.8% 85.1% 14.9%
_____________________________________________________________________________________Inhalants All 5.5% 9.2% 16.9% 83.1%
Grade 7 9.2% 14.4% 23.6% 76.4%Grade 8 7.6% 12.4% 22.1% 77.9%Grade 9 4.8% 7.7% 11.9% 88.1%Grade 10 4.0% 6.7% 15.2% 84.8%Grade 11 2.8% 6.0% 15.0% 85.0%Grade 12 2.7% 5.9% 10.8% 89.2%
_____________________________________________________________________________________
Any Illicit Drug All 13.9% 20.5% 30.9% 69.1%Grade 7 7.7% 11.5% 19.2% 80.8%Grade 8 13.1% 20.0% 29.9% 70.1%Grade 9 12.4% 19.3% 26.8% 73.2%Grade 10 17.7% 24.6% 39.0% 61.0%Grade 11 20.3% 26.8% 38.8% 61.2%Grade 12 14.9% 24.4% 37.4% 62.6%
_____________________________________________________________________________________Marijuana All 12.4% 19.2% 29.9% 70.1%
Grade 7 6.6% 10.3% 18.3% 81.7%Grade 8 11.0% 18.9% 29.4% 70.6%Grade 9 12.0% 17.9% 24.9% 75.1%

8/14/2019 HARRIS COUNTY - Pasadena ISD - 1998 Texas School Survey of Drug and Alcohol Use
http://slidepdf.com/reader/full/harris-county-pasadena-isd-1998-texas-school-survey-of-drug-and-alcohol 93/213
PasadenaSpring 1998

8/14/2019 HARRIS COUNTY - Pasadena ISD - 1998 Texas School Survey of Drug and Alcohol Use
http://slidepdf.com/reader/full/harris-county-pasadena-isd-1998-texas-school-survey-of-drug-and-alcohol 94/213
Table B7 continued from previous page
Past School Ever NeverMonth Year Used Used
_____________________________________________________________________________________Crack All 0.6% 1.0% 1.9% 98.1%
Grade 7 0.5% 1.6% 2.3% 97.7%Grade 8 1.0% 1.8% 3.6% 96.4%Grade 9 0.9% 0.9% 0.9% 99.1%Grade 10 0.3% 0.8% 1.7% 98.3%Grade 11 0.3% 0.3% 1.7% 98.3%Grade 12 * % 0.3% 0.8% 99.2%
_____________________________________________________________________________________Hallucinogens All 3.0% 5.6% 8.4% 91.6%
Grade 7 0.2% 1.0% 1.7% 98.3%Grade 8 2.4% 3.7% 5.4% 94.6%Grade 9 3.0% 5.8% 7.9% 92.1%Grade 10 5.4% 9.4% 14.2% 85.8%
Grade 11 4.7% 9.3% 13.2% 86.8%Grade 12 3.2% 6.1% 11.2% 88.8%
_____________________________________________________________________________________Uppers All 2.2% 4.2% 6.9% 93.1%
Grade 7 0.8% 1.1% 2.7% 97.3%Grade 8 0.3% 1.6% 5.2% 94.8%Grade 9 2.9% 4.8% 7.7% 92.3%Grade 10 3.5% 7.8% 9.3% 90.7%Grade 11 4.1% 6.0% 9.1% 90.9%Grade 12 2.3% 5.0% 8.5% 91.5%
_____________________________________________________________________________________Downers All 2.1% 3.3% 5.4% 94.6%
Grade 7 * % * % 1.3% 98.7%Grade 8 1.3% 1.8% 3.9% 96.1%Grade 9 2.7% 4.0% 5.6% 94.4%Grade 10 4.8% 7.9% 9.9% 90.1%Grade 11 2.4% 3.9% 7.8% 92.2%Grade 12 2.0% 2.9% 5.1% 94.9%
_____________________________________________________________________________________Rohypnol All 1.6% 2.7% 5.3% 94.7%
Grade 7 1.8% 2.5% 3.5% 96.5%Grade 8 1.0% 2.0% 5.2% 94.8%Grade 9 0.9% 2.2% 3.8% 96.2%Grade 10 2.4% 4.5% 8.2% 91.8%
Grade 11 2.2% 2.8% 6.1% 93.9%Grade 12 1.6% 2.4% 5.9% 94.1%
_____________________________________________________________________________________

8/14/2019 HARRIS COUNTY - Pasadena ISD - 1998 Texas School Survey of Drug and Alcohol Use
http://slidepdf.com/reader/full/harris-county-pasadena-isd-1998-texas-school-survey-of-drug-and-alcohol 95/213
_____________________________________________________________________________________Steroids All 0.3% 0.5% 1.5% 98.5%
Grade 7 0.3% 0.3% 1.4% 98.6%Grade 8 0.3% 0.3% 1.3% 98.7%Grade 9 0.7% 1.0% 2.3% 97.7%Grade 10 0.3% 0.6% 0.9% 99.1%Grade 11 * % 0.3% 1.8% 98.2%Grade 12 * % 0.6% 1.5% 98.5%
_____________________________________________________________________________________Ecstasy All 1.1% 2.0% 4.0% 96.0%
Grade 7 0.3% 0.6% 0.9% 99.1%Grade 8 0.5% 1.3% 3.7% 96.3%Grade 9 1.0% 1.7% 4.3% 95.7%Grade 10 1.5% 2.9% 5.2% 94.8%Grade 11 2.1% 3.3% 5.1% 94.9%Grade 12 1.4% 2.9% 5.4% 94.6%
_____________________________________________________________________________________Heroin All 0.3% 0.8% 2.0% 98.0%
Grade 7 0.8% 1.5% 3.1% 96.9%
Grade 8 * % 1.3% 4.3% 95.7%Grade 9 0.3% 0.3% 1.0% 99.0%Grade 10 0.3% 0.8% 1.4% 98.6%Grade 11 0.3% 0.3% 0.6% 99.4%Grade 12 * % 0.3% 0.5% 99.5%
PasadenaSpring 1998

8/14/2019 HARRIS COUNTY - Pasadena ISD - 1998 Texas School Survey of Drug and Alcohol Use
http://slidepdf.com/reader/full/harris-county-pasadena-isd-1998-texas-school-survey-of-drug-and-alcohol 96/213
Table B8: Prevalence and recency of use of selected substances by grade--> Students reporting C, D, and F grades
Past School Ever NeverMonth Year Used Used
_____________________________________________________________________________________Tobacco All 36.9% 48.4% 69.0% 31.0%
Grade 7 27.8% 40.0% 59.1% 40.9%Grade 8 33.8% 42.9% 67.7% 32.3%Grade 9 39.8% 54.8% 69.9% 30.1%Grade 10 44.8% 52.1% 71.9% 28.1%Grade 11 37.2% 49.6% 75.2% 24.8%Grade 12 42.9% 56.0% 75.0% 25.0%
_____________________________________________________________________________________Alcohol All 47.6% 63.7% 81.6% 18.4%
Grade 7 33.6% 47.8% 71.7% 28.3%Grade 8 40.3% 61.2% 79.1% 20.9%Grade 9 53.3% 68.5% 82.6% 17.4%
Grade 10 52.6% 67.0% 86.6% 13.4%Grade 11 52.7% 68.2% 85.5% 14.5%Grade 12 63.4% 78.0% 90.2% 9.8%
_____________________________________________________________________________________Inhalants All 11.9% 16.4% 26.6% 73.4%
Grade 7 23.5% 28.7% 33.9% 66.1%Grade 8 15.0% 20.3% 28.6% 71.4%Grade 9 7.3% 12.5% 26.0% 74.0%Grade 10 10.2% 15.3% 33.7% 66.3%Grade 11 8.0% 10.7% 20.5% 79.5%Grade 12 1.2% 2.4% 7.2% 92.8%
_____________________________________________________________________________________
Any Illicit Drug All 25.8% 37.5% 52.4% 47.6%Grade 7 25.4% 30.7% 40.4% 59.6%Grade 8 20.9% 32.8% 50.0% 50.0%Grade 9 25.3% 37.9% 51.6% 48.4%Grade 10 32.7% 43.9% 59.2% 40.8%Grade 11 31.3% 44.6% 59.8% 40.2%Grade 12 19.3% 38.6% 60.2% 39.8%
_____________________________________________________________________________________Marijuana All 23.1% 35.0% 51.0% 49.0%
Grade 7 20.7% 28.8% 38.7% 61.3%Grade 8 18.2% 28.8% 48.5% 51.5%Grade 9 25.6% 36.7% 51.1% 48.9%
Grade 10 27.1% 41.7% 57.3% 42.7%Grade 11 28.2% 41.8% 57.3% 42.7%Grade 12 18.8% 36.3% 60.0% 40.0%

8/14/2019 HARRIS COUNTY - Pasadena ISD - 1998 Texas School Survey of Drug and Alcohol Use
http://slidepdf.com/reader/full/harris-county-pasadena-isd-1998-texas-school-survey-of-drug-and-alcohol 97/213
_____________________________________________________________________________________Marijuana Only All 7.7% 13.1% 23.7% 76.3%
Grade 7 6.0% 8.6% 17.2% 82.8%Grade 8 4.5% 11.2% 27.6% 72.4%Grade 9 5.2% 9.4% 19.8% 80.2%Grade 10 15.3% 18.4% 23.5% 76.5%Grade 11 10.6% 17.7% 25.7% 74.3%Grade 12 7.1% 17.9% 33.3% 66.7%
_____________________________________________________________________________________Cocaine or Crack All 4.2% 8.4% 13.0% 87.0%
Grade 7 2.9% 6.7% 10.5% 89.5%Grade 8 5.5% 7.1% 11.0% 89.0%Grade 9 3.4% 9.1% 12.5% 87.5%Grade 10 5.4% 9.8% 14.1% 85.9%Grade 11 4.8% 10.5% 17.1% 82.9%Grade 12 2.5% 7.6% 15.2% 84.8%
_____________________________________________________________________________________Cocaine All 4.1% 7.9% 12.3% 87.7%
Grade 7 2.9% 6.8% 9.7% 90.3%Grade 8 4.8% 5.6% 8.8% 91.2%Grade 9 3.5% 8.1% 11.6% 88.4%Grade 10 5.7% 9.1% 13.6% 86.4%Grade 11 4.9% 10.7% 17.5% 82.5%Grade 12 2.7% 8.1% 16.2% 83.8%
PasadenaSpring 1998

8/14/2019 HARRIS COUNTY - Pasadena ISD - 1998 Texas School Survey of Drug and Alcohol Use
http://slidepdf.com/reader/full/harris-county-pasadena-isd-1998-texas-school-survey-of-drug-and-alcohol 98/213
Table B8 continued from previous page
Past School Ever NeverMonth Year Used Used
_____________________________________________________________________________________Crack All 0.9% 1.9% 4.0% 96.0%
Grade 7 1.0% 1.0% 5.2% 94.8%Grade 8 2.5% 4.2% 5.9% 94.1%Grade 9 * % 2.6% 5.2% 94.8%Grade 10 * % 1.2% 1.2% 98.8%Grade 11 1.0% 1.0% 2.1% 97.9%Grade 12 * % * % 2.7% 97.3%
_____________________________________________________________________________________Hallucinogens All 5.8% 11.4% 16.4% 83.6%
Grade 7 4.8% 11.5% 12.5% 87.5%Grade 8 3.3% 6.6% 11.5% 88.5%Grade 9 6.9% 14.9% 19.5% 80.5%Grade 10 5.7% 11.5% 17.2% 82.8%
Grade 11 9.6% 15.4% 24.0% 76.0%Grade 12 5.2% 7.8% 14.3% 85.7%_____________________________________________________________________________________Uppers All 5.1% 9.1% 14.1% 85.9%
Grade 7 3.1% 8.3% 8.3% 91.7%Grade 8 5.3% 7.0% 8.8% 91.2%Grade 9 7.9% 11.8% 17.1% 82.9%Grade 10 4.9% 11.0% 24.4% 75.6%Grade 11 6.3% 10.5% 16.8% 83.2%Grade 12 1.4% 4.3% 10.1% 89.9%
_____________________________________________________________________________________Downers All 4.3% 7.5% 12.9% 87.1%
Grade 7 3.2% 7.4% 11.6% 88.4%Grade 8 6.2% 8.0% 8.0% 92.0%Grade 9 3.8% 7.7% 11.5% 88.5%Grade 10 3.5% 8.2% 22.4% 77.6%Grade 11 6.6% 8.8% 14.3% 85.7%Grade 12 1.4% 2.9% 11.6% 88.4%
_____________________________________________________________________________________Rohypnol All 6.2% 9.0% 14.4% 85.6%
Grade 7 11.0% 17.0% 20.0% 80.0%Grade 8 5.6% 7.3% 10.5% 89.5%Grade 9 6.8% 8.0% 14.8% 85.2%Grade 10 4.7% 7.0% 15.1% 84.9%
Grade 11 5.1% 9.1% 15.2% 84.8%Grade 12 1.3% 2.7% 9.3% 90.7%
_____________________________________________________________________________________S id ll 0 9% 1 2% 2 8% 97 2%

8/14/2019 HARRIS COUNTY - Pasadena ISD - 1998 Texas School Survey of Drug and Alcohol Use
http://slidepdf.com/reader/full/harris-county-pasadena-isd-1998-texas-school-survey-of-drug-and-alcohol 99/213
Steroids All 0.9% 1.2% 2.8% 97.2%Grade 7 * % 1.1% 1.1% 98.9%Grade 8 0.9% 0.9% 4.4% 95.6%Grade 9 * % * % * % 100.0%Grade 10 1.2% 1.2% 3.7% 96.3%Grade 11 2.2% 3.3% 4.4% 95.6%Grade 12 1.5% 1.5% 4.4% 95.6%
_____________________________________________________________________________________Ecstasy All 1.8% 4.3% 8.9% 91.1%
Grade 7 1.1% 5.4% 7.5% 92.5%Grade 8 3.4% 4.3% 6.0% 94.0%Grade 9 * % 2.8% 6.9% 93.1%Grade 10 1.3% 3.8% 11.5% 88.5%Grade 11 3.3% 4.3% 13.0% 87.0%Grade 12 1.4% 5.8% 11.6% 88.4%
_____________________________________________________________________________________Heroin All 1.1% 1.9% 2.9% 97.1%
Grade 7 3.0% 6.1% 6.1% 93.9%
Grade 8 0.9% 0.9% 3.4% 96.6%Grade 9 1.2% 1.2% 1.2% 98.8%Grade 10 * % * % 1.2% 98.8%Grade 11 1.0% 2.0% 4.0% 96.0%Grade 12 * % * % * % 100.0%
PasadenaSpring 1998
T bl B9 P l d f f l t d b t b d

8/14/2019 HARRIS COUNTY - Pasadena ISD - 1998 Texas School Survey of Drug and Alcohol Use
http://slidepdf.com/reader/full/harris-county-pasadena-isd-1998-texas-school-survey-of-drug-and-alcohol 100/213
Table B9: Prevalence and recency of use of selected substances by grade--> Students living with two parents
Past School Ever NeverMonth Year Used Used
_____________________________________________________________________________________Tobacco All 23.3% 32.3% 50.6% 49.4%
Grade 7 12.7% 19.3% 34.6% 65.4%Grade 8 19.3% 27.8% 47.4% 52.6%Grade 9 24.0% 34.6% 53.0% 47.0%Grade 10 30.2% 39.0% 60.4% 39.6%Grade 11 27.7% 38.3% 57.1% 42.9%Grade 12 31.4% 41.2% 58.2% 41.8%
_____________________________________________________________________________________Alcohol All 37.6% 52.5% 71.0% 29.0%
Grade 7 25.9% 34.0% 56.6% 43.4%Grade 8 33.9% 47.2% 68.3% 31.7%Grade 9 36.6% 55.3% 70.8% 29.2%
Grade 10 41.5% 58.5% 76.8% 23.2%Grade 11 43.5% 61.1% 76.9% 23.1%Grade 12 52.5% 69.6% 85.1% 14.9%
_____________________________________________________________________________________Inhalants All 6.3% 9.8% 16.9% 83.1%
Grade 7 11.0% 16.0% 24.2% 75.8%Grade 8 7.9% 13.1% 19.6% 80.4%Grade 9 5.2% 8.0% 13.5% 86.5%Grade 10 4.5% 7.2% 15.9% 84.1%Grade 11 4.3% 6.3% 14.7% 85.3%Grade 12 2.2% 4.4% 9.1% 90.9%
_____________________________________________________________________________________
Any Illicit Drug All 13.4% 20.2% 30.6% 69.4%Grade 7 8.5% 13.1% 19.3% 80.7%Grade 8 10.4% 17.2% 27.5% 72.5%Grade 9 13.9% 20.9% 29.3% 70.7%Grade 10 16.7% 22.2% 36.8% 63.2%Grade 11 19.4% 26.9% 39.3% 60.7%Grade 12 13.5% 25.2% 37.7% 62.3%
_____________________________________________________________________________________Marijuana All 12.0% 19.4% 29.7% 70.3%
Grade 7 7.0% 12.2% 18.5% 81.5%Grade 8 8.9% 16.7% 27.5% 72.5%Grade 9 13.8% 19.9% 27.3% 72.7%
Grade 10 15.0% 21.2% 35.3% 64.7%Grade 11 17.2% 26.6% 39.1% 60.9%Grade 12 11.6% 23.5% 37.3% 62.7%

8/14/2019 HARRIS COUNTY - Pasadena ISD - 1998 Texas School Survey of Drug and Alcohol Use
http://slidepdf.com/reader/full/harris-county-pasadena-isd-1998-texas-school-survey-of-drug-and-alcohol 101/213
_____________________________________________________________________________________Marijuana Only All 4.7% 8.4% 15.7% 84.3%
Grade 7 2.7% 4.7% 9.2% 90.8%Grade 8 4.1% 7.8% 15.9% 84.1%Grade 9 4.5% 8.7% 14.9% 85.1%Grade 10 6.6% 9.6% 18.8% 81.2%Grade 11 7.4% 11.9% 19.9% 80.1%Grade 12 3.4% 9.7% 18.8% 81.2%
_____________________________________________________________________________________Cocaine or Crack All 1.9% 3.5% 6.0% 94.0%
Grade 7 1.4% 2.8% 4.4% 95.6%Grade 8 2.0% 4.0% 5.7% 94.3%Grade 9 1.5% 2.6% 4.8% 95.2%Grade 10 1.3% 2.8% 5.4% 94.6%Grade 11 2.8% 4.0% 8.3% 91.7%Grade 12 3.0% 5.6% 8.9% 91.1%
_____________________________________________________________________________________Cocaine All 1.7% 3.1% 5.5% 94.5%
Grade 7 1.1% 2.6% 4.0% 96.0%Grade 8 1.8% 3.2% 4.4% 95.6%Grade 9 1.1% 1.9% 4.2% 95.8%Grade 10 1.3% 2.6% 5.2% 94.8%Grade 11 2.5% 3.8% 7.9% 92.1%Grade 12 3.1% 5.9% 9.3% 90.7%
PasadenaSpring 1998
Table B9 continued from previous page
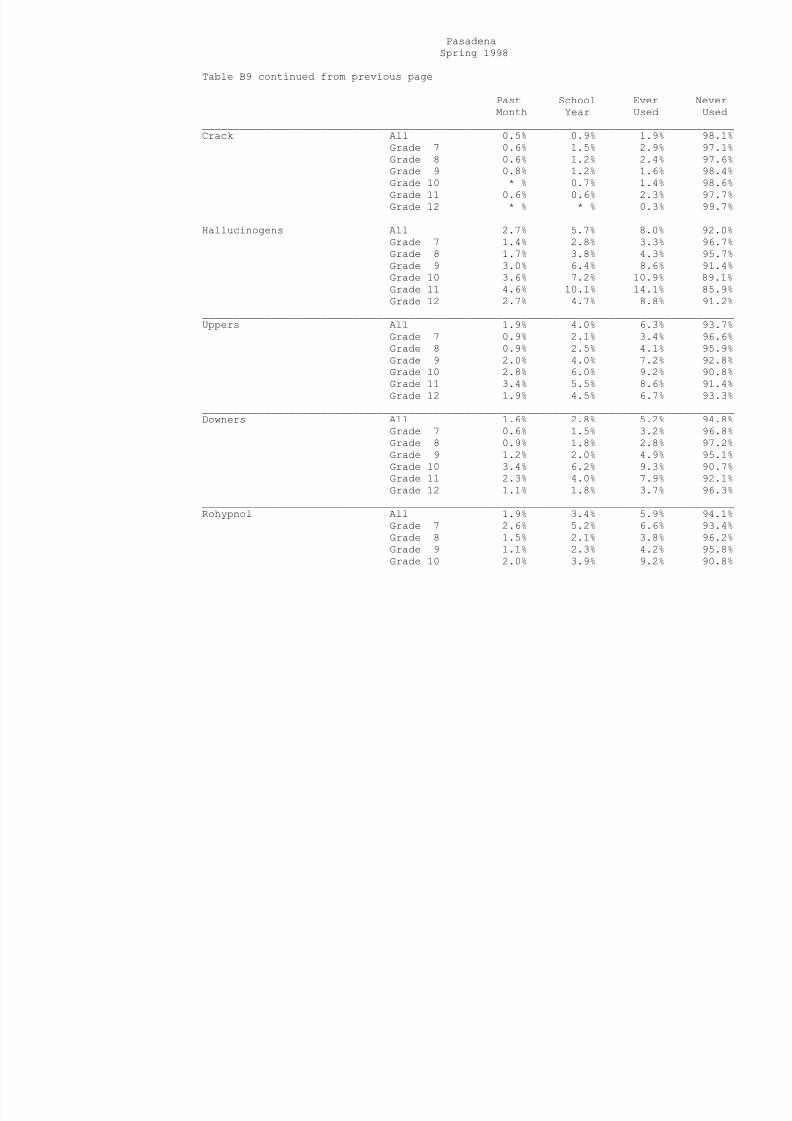
8/14/2019 HARRIS COUNTY - Pasadena ISD - 1998 Texas School Survey of Drug and Alcohol Use
http://slidepdf.com/reader/full/harris-county-pasadena-isd-1998-texas-school-survey-of-drug-and-alcohol 102/213
Table B9 continued from previous page
Past School Ever NeverMonth Year Used Used
_____________________________________________________________________________________Crack All 0.5% 0.9% 1.9% 98.1%
Grade 7 0.6% 1.5% 2.9% 97.1%Grade 8 0.6% 1.2% 2.4% 97.6%Grade 9 0.8% 1.2% 1.6% 98.4%Grade 10 * % 0.7% 1.4% 98.6%Grade 11 0.6% 0.6% 2.3% 97.7%Grade 12 * % * % 0.3% 99.7%
_____________________________________________________________________________________Hallucinogens All 2.7% 5.7% 8.0% 92.0%
Grade 7 1.4% 2.8% 3.3% 96.7%Grade 8 1.7% 3.8% 4.3% 95.7%Grade 9 3.0% 6.4% 8.6% 91.4%Grade 10 3.6% 7.2% 10.9% 89.1%
Grade 11 4.6% 10.1% 14.1% 85.9%Grade 12 2.7% 4.7% 8.8% 91.2%_____________________________________________________________________________________Uppers All 1.9% 4.0% 6.3% 93.7%
Grade 7 0.9% 2.1% 3.4% 96.6%Grade 8 0.9% 2.5% 4.1% 95.9%Grade 9 2.0% 4.0% 7.2% 92.8%Grade 10 2.8% 6.0% 9.2% 90.8%Grade 11 3.4% 5.5% 8.6% 91.4%Grade 12 1.9% 4.5% 6.7% 93.3%
_____________________________________________________________________________________Downers All 1.6% 2.8% 5.2% 94.8%
Grade 7 0.6% 1.5% 3.2% 96.8%Grade 8 0.9% 1.8% 2.8% 97.2%Grade 9 1.2% 2.0% 4.9% 95.1%Grade 10 3.4% 6.2% 9.3% 90.7%Grade 11 2.3% 4.0% 7.9% 92.1%Grade 12 1.1% 1.8% 3.7% 96.3%
_____________________________________________________________________________________Rohypnol All 1.9% 3.4% 5.9% 94.1%
Grade 7 2.6% 5.2% 6.6% 93.4%Grade 8 1.5% 2.1% 3.8% 96.2%Grade 9 1.1% 2.3% 4.2% 95.8%Grade 10 2.0% 3.9% 9.2% 90.8%

8/14/2019 HARRIS COUNTY - Pasadena ISD - 1998 Texas School Survey of Drug and Alcohol Use
http://slidepdf.com/reader/full/harris-county-pasadena-isd-1998-texas-school-survey-of-drug-and-alcohol 103/213
PasadenaSpring 1998
Table B10: Prevalence and recency of use of selected substances by grade

8/14/2019 HARRIS COUNTY - Pasadena ISD - 1998 Texas School Survey of Drug and Alcohol Use
http://slidepdf.com/reader/full/harris-county-pasadena-isd-1998-texas-school-survey-of-drug-and-alcohol 104/213
Table B10: Prevalence and recency of use of selected substances by grade--> Students not living with two parents
Past School Ever NeverMonth Year Used Used
_____________________________________________________________________________________Tobacco All 32.8% 44.0% 65.3% 34.7%
Grade 7 24.1% 32.1% 51.9% 48.1%Grade 8 32.2% 43.1% 65.8% 34.2%Grade 9 31.0% 45.6% 64.6% 35.4%Grade 10 40.8% 47.9% 67.5% 32.5%Grade 11 33.3% 48.0% 74.7% 25.3%Grade 12 37.6% 49.7% 71.1% 28.9%
_____________________________________________________________________________________Alcohol All 45.5% 61.6% 80.8% 19.2%
Grade 7 31.9% 44.4% 65.0% 35.0%Grade 8 42.6% 59.8% 79.4% 20.6%Grade 9 41.4% 58.6% 77.1% 22.9%
Grade 10 50.6% 68.8% 90.6% 9.4%Grade 11 55.1% 71.4% 91.8% 8.2%Grade 12 58.8% 72.9% 86.5% 13.5%
_____________________________________________________________________________________Inhalants All 7.9% 12.7% 22.7% 77.3%
Grade 7 14.9% 19.9% 28.0% 72.0%Grade 8 12.8% 17.7% 32.0% 68.0%Grade 9 5.6% 10.0% 16.9% 83.1%Grade 10 5.9% 10.6% 24.1% 75.9%Grade 11 3.3% 8.7% 20.0% 80.0%Grade 12 2.3% 6.4% 11.6% 88.4%
_____________________________________________________________________________________
Any Illicit Drug All 22.7% 31.9% 45.1% 54.9%Grade 7 17.9% 21.0% 34.0% 66.0%Grade 8 24.4% 34.6% 48.8% 51.2%Grade 9 17.1% 27.2% 36.7% 63.3%Grade 10 28.2% 40.6% 54.1% 45.9%Grade 11 31.3% 40.7% 53.3% 46.7%Grade 12 19.5% 29.9% 47.7% 52.3%
_____________________________________________________________________________________Marijuana All 20.1% 28.9% 43.4% 56.6%
Grade 7 15.0% 18.1% 31.2% 68.8%Grade 8 20.3% 30.2% 46.5% 53.5%Grade 9 16.6% 25.2% 35.8% 64.2%
Grade 10 24.7% 36.1% 52.4% 47.6%Grade 11 27.9% 38.8% 51.7% 48.3%Grade 12 18.3% 27.8% 46.7% 53.3%
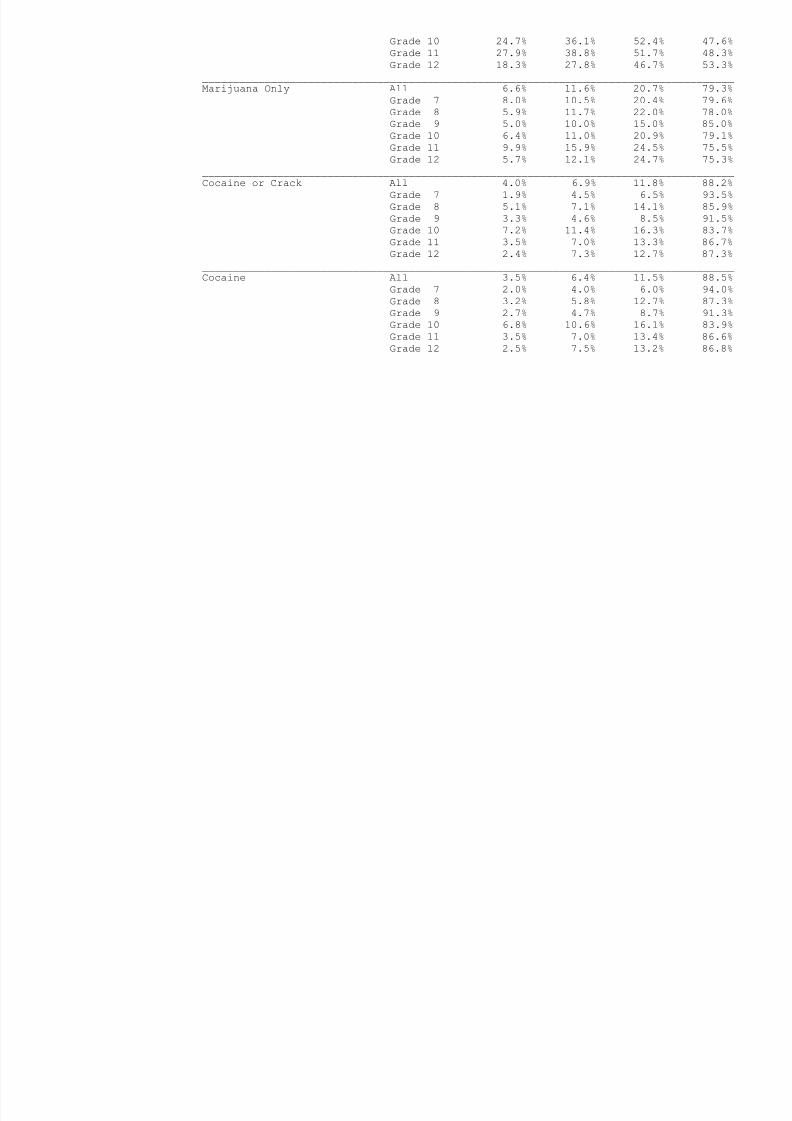
8/14/2019 HARRIS COUNTY - Pasadena ISD - 1998 Texas School Survey of Drug and Alcohol Use
http://slidepdf.com/reader/full/harris-county-pasadena-isd-1998-texas-school-survey-of-drug-and-alcohol 105/213
_____________________________________________________________________________________Marijuana Only All 6.6% 11.6% 20.7% 79.3%
Grade 7 8.0% 10.5% 20.4% 79.6%Grade 8 5.9% 11.7% 22.0% 78.0%Grade 9 5.0% 10.0% 15.0% 85.0%Grade 10 6.4% 11.0% 20.9% 79.1%Grade 11 9.9% 15.9% 24.5% 75.5%Grade 12 5.7% 12.1% 24.7% 75.3%
_____________________________________________________________________________________Cocaine or Crack All 4.0% 6.9% 11.8% 88.2%
Grade 7 1.9% 4.5% 6.5% 93.5%Grade 8 5.1% 7.1% 14.1% 85.9%Grade 9 3.3% 4.6% 8.5% 91.5%Grade 10 7.2% 11.4% 16.3% 83.7%Grade 11 3.5% 7.0% 13.3% 86.7%Grade 12 2.4% 7.3% 12.7% 87.3%
_____________________________________________________________________________________Cocaine All 3.5% 6.4% 11.5% 88.5%
Grade 7 2.0% 4.0% 6.0% 94.0%Grade 8 3.2% 5.8% 12.7% 87.3%Grade 9 2.7% 4.7% 8.7% 91.3%Grade 10 6.8% 10.6% 16.1% 83.9%Grade 11 3.5% 7.0% 13.4% 86.6%Grade 12 2.5% 7.5% 13.2% 86.8%
PasadenaSpring 1998
Table B10 continued from previous page

8/14/2019 HARRIS COUNTY - Pasadena ISD - 1998 Texas School Survey of Drug and Alcohol Use
http://slidepdf.com/reader/full/harris-county-pasadena-isd-1998-texas-school-survey-of-drug-and-alcohol 106/213
Table B10 continued from previous page
Past School Ever NeverMonth Year Used Used
_____________________________________________________________________________________Crack All 1.0% 1.8% 3.3% 96.7%
Grade 7 0.7% 1.4% 2.8% 97.2%Grade 8 3.3% 4.9% 8.2% 91.8%Grade 9 0.7% 1.4% 2.1% 97.9%Grade 10 0.7% 1.3% 2.0% 98.0%Grade 11 * % * % 0.8% 99.2%Grade 12 * % 0.6% 2.6% 97.4%
_____________________________________________________________________________________Hallucinogens All 5.3% 9.0% 14.2% 85.8%
Grade 7 0.6% 3.9% 5.2% 94.8%Grade 8 4.3% 5.9% 11.8% 88.2%Grade 9 5.3% 9.9% 13.2% 86.8%Grade 10 8.7% 14.3% 21.7% 78.3%
Grade 11 8.5% 12.1% 19.1% 80.9%Grade 12 5.1% 9.6% 17.2% 82.8%_____________________________________________________________________________________Uppers All 4.6% 7.5% 12.1% 87.9%
Grade 7 2.1% 3.5% 4.9% 95.1%Grade 8 2.4% 3.7% 9.8% 90.2%Grade 9 7.2% 9.4% 12.9% 87.1%Grade 10 5.3% 12.7% 17.3% 82.7%Grade 11 7.4% 10.7% 16.4% 83.6%Grade 12 2.9% 5.8% 12.9% 87.1%
_____________________________________________________________________________________Downers All 4.8% 6.8% 10.4% 89.6%
Grade 7 0.7% 1.4% 3.4% 96.6%Grade 8 5.9% 6.5% 9.4% 90.6%Grade 9 5.9% 8.8% 9.6% 90.4%Grade 10 7.1% 11.6% 18.1% 81.9%Grade 11 5.6% 7.3% 12.1% 87.9%Grade 12 3.4% 4.8% 10.9% 89.1%
_____________________________________________________________________________________Rohypnol All 4.0% 5.5% 10.0% 90.0%
Grade 7 5.9% 5.9% 7.9% 92.1%Grade 8 3.7% 5.8% 11.5% 88.5%Grade 9 4.2% 5.6% 9.7% 90.3%Grade 10 5.0% 7.5% 10.6% 89.4%
Grade 11 3.1% 3.8% 10.7% 89.3%Grade 12 1.3% 3.2% 9.6% 90.4%
_____________________________________________________________________________________Steroids All 0.3% 0.7% 2.4% 97.6%

8/14/2019 HARRIS COUNTY - Pasadena ISD - 1998 Texas School Survey of Drug and Alcohol Use
http://slidepdf.com/reader/full/harris-county-pasadena-isd-1998-texas-school-survey-of-drug-and-alcohol 107/213
Ste o ds 0.3 0. . 9 .6Grade 7 * % 0.7% 1.4% 98.6%Grade 8 * % * % 2.3% 97.7%Grade 9 * % 0.7% 2.9% 97.1%Grade 10 0.7% 1.3% 1.3% 98.7%Grade 11 0.8% 0.8% 4.1% 95.9%Grade 12 0.7% 0.7% 2.9% 97.1%
_____________________________________________________________________________________Ecstasy All 1.6% 4.2% 7.8% 92.2%
Grade 7 0.8% 2.3% 3.1% 96.9%Grade 8 1.7% 3.4% 5.7% 94.3%Grade 9 0.8% 3.9% 8.5% 91.5%Grade 10 2.0% 6.0% 9.9% 90.1%Grade 11 2.4% 4.7% 10.2% 89.8%Grade 12 2.7% 5.4% 10.7% 89.3%
_____________________________________________________________________________________Heroin All 0.6% 1.7% 3.4% 96.6%
Grade 7 1.3% 4.6% 6.6% 93.4%
Grade 8 0.6% 1.1% 5.1% 94.9%Grade 9 * % * % 0.7% 99.3%Grade 10 0.6% 1.9% 3.2% 96.8%Grade 11 1.5% 2.2% 3.7% 96.3%Grade 12 * % 0.6% 0.6% 99.4%
PasadenaSpring 1998
Table B11: Prevalence and recency of use of selected substances by grade

8/14/2019 HARRIS COUNTY - Pasadena ISD - 1998 Texas School Survey of Drug and Alcohol Use
http://slidepdf.com/reader/full/harris-county-pasadena-isd-1998-texas-school-survey-of-drug-and-alcohol 108/213
y y g--> Students who would seek help from adults for substance abuse problems
Past School Ever NeverMonth Year Used Used
_____________________________________________________________________________________Tobacco All 24.4% 33.5% 53.1% 46.9%
Grade 7 13.4% 19.0% 37.1% 62.9%Grade 8 20.0% 27.9% 49.2% 50.8%Grade 9 26.8% 38.1% 56.3% 43.7%Grade 10 31.2% 39.8% 60.2% 39.8%Grade 11 26.9% 39.2% 60.0% 40.0%Grade 12 32.8% 43.3% 62.1% 37.9%
_____________________________________________________________________________________Alcohol All 38.0% 53.0% 71.9% 28.1%
Grade 7 25.2% 33.5% 54.8% 45.2%Grade 8 32.6% 46.7% 68.9% 31.1%Grade 9 36.0% 55.7% 72.0% 28.0%
Grade 10 42.1% 58.1% 78.9% 21.1%Grade 11 47.9% 63.9% 79.9% 20.1%Grade 12 53.1% 70.7% 85.5% 14.5%
_____________________________________________________________________________________Inhalants All 5.7% 9.2% 16.9% 83.1%
Grade 7 9.9% 13.9% 21.2% 78.8%Grade 8 7.3% 12.2% 21.7% 78.3%Grade 9 4.4% 6.7% 11.7% 88.3%Grade 10 4.5% 7.8% 17.6% 82.4%Grade 11 4.1% 7.7% 17.1% 82.9%Grade 12 1.8% 4.3% 9.9% 90.1%
_____________________________________________________________________________________
Any Illicit Drug All 14.2% 21.4% 31.9% 68.1%Grade 7 8.0% 11.3% 17.9% 82.1%Grade 8 12.6% 19.6% 30.2% 69.8%Grade 9 14.1% 22.4% 29.7% 70.3%Grade 10 17.9% 25.0% 39.1% 60.9%Grade 11 21.3% 29.3% 42.2% 57.8%Grade 12 13.7% 25.6% 39.0% 61.0%
_____________________________________________________________________________________Marijuana All 12.7% 20.0% 31.0% 69.0%
Grade 7 6.6% 10.2% 16.6% 83.4%Grade 8 10.3% 17.7% 29.6% 70.4%Grade 9 14.1% 21.0% 28.5% 71.5%
Grade 10 15.6% 23.0% 38.0% 62.0%Grade 11 19.7% 28.7% 41.6% 58.4%Grade 12 11.7% 23.4% 38.4% 61.6%

8/14/2019 HARRIS COUNTY - Pasadena ISD - 1998 Texas School Survey of Drug and Alcohol Use
http://slidepdf.com/reader/full/harris-county-pasadena-isd-1998-texas-school-survey-of-drug-and-alcohol 109/213
_____________________________________________________________________________________Marijuana Only All 4.7% 8.7% 16.1% 83.9%
Grade 7 3.3% 4.8% 9.7% 90.3%Grade 8 3.7% 7.3% 16.3% 83.7%Grade 9 5.0% 9.6% 14.6% 85.4%Grade 10 5.5% 9.0% 18.5% 81.5%Grade 11 7.4% 12.4% 20.6% 79.4%
Grade 12 3.8% 10.6% 19.9% 80.1%_____________________________________________________________________________________Cocaine or Crack All 2.1% 3.9% 7.0% 93.0%
Grade 7 1.2% 2.4% 3.6% 96.4%Grade 8 2.7% 4.8% 7.9% 92.1%Grade 9 1.8% 2.4% 4.6% 95.4%Grade 10 2.9% 4.7% 7.9% 92.1%Grade 11 1.9% 4.1% 10.1% 89.9%Grade 12 2.4% 5.9% 9.8% 90.2%
_____________________________________________________________________________________Cocaine All 2.0% 3.8% 6.8% 93.2%
Grade 7 1.2% 2.2% 3.0% 97.0%Grade 8 2.1% 4.5% 7.5% 92.5%Grade 9 1.6% 2.5% 4.7% 95.3%Grade 10 2.7% 4.3% 7.8% 92.2%Grade 11 2.0% 4.2% 10.1% 89.9%Grade 12 2.5% 6.1% 10.3% 89.7%
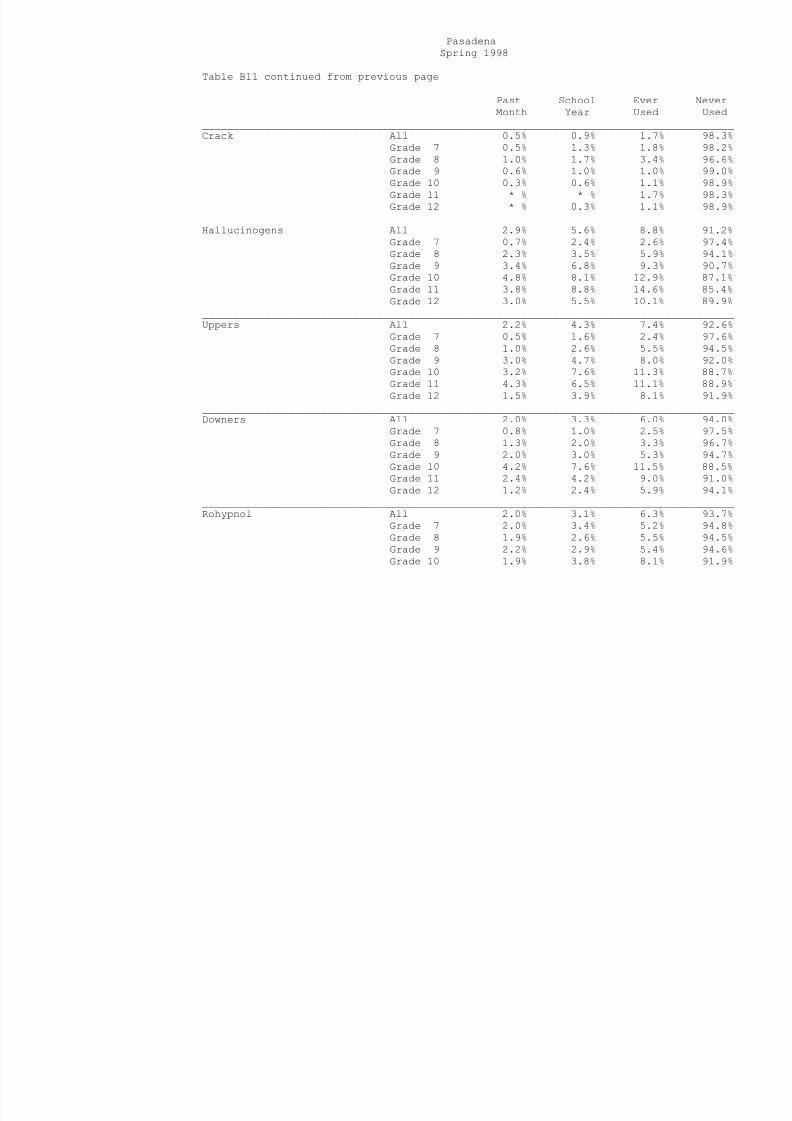
8/14/2019 HARRIS COUNTY - Pasadena ISD - 1998 Texas School Survey of Drug and Alcohol Use
http://slidepdf.com/reader/full/harris-county-pasadena-isd-1998-texas-school-survey-of-drug-and-alcohol 110/213
Grade 11 2.2% 3.9% 8.3% 91.7%Grade 12 1.4% 2.2% 6.4% 93.6%
_____________________________________________________________________________________Steroids All 0.3% 0.5% 1.3% 98.7%

8/14/2019 HARRIS COUNTY - Pasadena ISD - 1998 Texas School Survey of Drug and Alcohol Use
http://slidepdf.com/reader/full/harris-county-pasadena-isd-1998-texas-school-survey-of-drug-and-alcohol 111/213
Grade 7 * % 0.3% 0.8% 99.2%Grade 8 0.3% 0.3% 2.0% 98.0%Grade 9 0.3% 0.7% 0.7% 99.3%Grade 10 0.6% 0.9% 1.5% 98.5%Grade 11 0.3% 0.6% 1.5% 98.5%Grade 12 * % 0.3% 1.5% 98.5%
_____________________________________________________________________________________Ecstasy All 0.9% 1.9% 4.2% 95.8%
Grade 7 * % 0.6% 1.1% 98.9%Grade 8 1.3% 2.3% 3.8% 96.2%Grade 9 0.7% 1.3% 3.3% 96.7%Grade 10 1.2% 2.7% 5.9% 94.1%Grade 11 1.8% 2.7% 6.7% 93.3%Grade 12 0.9% 2.7% 5.6% 94.4%
_____________________________________________________________________________________Heroin All 0.2% 0.7% 1.8% 98.2%
Grade 7 0.8% 1.8% 2.8% 97.3%
Grade 8 * % 1.2% 3.9% 96.1%Grade 9 0.3% 0.3% 0.6% 99.4%Grade 10 * % * % 0.6% 99.4%Grade 11 0.3% 0.6% 1.4% 98.6%Grade 12 * % 0.3% 0.6% 99.4%
PasadenaSpring 1998
Table B12: Prevalence and recency of use of selected substances by grade

8/14/2019 HARRIS COUNTY - Pasadena ISD - 1998 Texas School Survey of Drug and Alcohol Use
http://slidepdf.com/reader/full/harris-county-pasadena-isd-1998-texas-school-survey-of-drug-and-alcohol 112/213
--> Students who wouldn't seek help from adults for substance abuse problems
Past School Ever NeverMonth Year Used Used
_____________________________________________________________________________________Tobacco All 33.9% 47.2% 65.3% 34.7%
Grade 7 25.3% 39.1% 49.4% 50.6%Grade 8 36.5% 53.1% 70.8% 29.2%Grade 9 26.7% 41.9% 61.6% 38.4%Grade 10 42.5% 51.7% 73.6% 26.4%Grade 11 36.7% 49.4% 70.9% 29.1%Grade 12 41.8% 51.9% 69.6% 30.4%
_____________________________________________________________________________________Alcohol All 48.7% 66.5% 83.5% 16.5%
Grade 7 34.5% 48.3% 74.7% 25.3%Grade 8 54.6% 72.2% 85.6% 14.4%Grade 9 49.4% 63.2% 79.3% 20.7%
Grade 10 51.2% 76.7% 91.9% 8.1%Grade 11 42.3% 69.2% 87.2% 12.8%Grade 12 63.6% 74.0% 85.7% 14.3%
_____________________________________________________________________________________Inhalants All 11.2% 17.0% 26.2% 73.8%
Grade 7 20.9% 31.4% 44.2% 55.8%Grade 8 17.5% 22.7% 32.0% 68.0%Grade 9 7.8% 15.6% 26.7% 73.3%Grade 10 6.8% 10.2% 21.6% 78.4%Grade 11 5.0% 6.2% 10.0% 90.0%Grade 12 6.3% 11.4% 13.9% 86.1%
_____________________________________________________________________________________
Any Illicit Drug All 25.3% 34.6% 48.8% 51.2%Grade 7 22.1% 29.1% 43.0% 57.0%Grade 8 26.8% 41.2% 52.6% 47.4%Grade 9 21.3% 28.1% 42.7% 57.3%Grade 10 31.0% 40.2% 54.0% 46.0%Grade 11 26.3% 37.5% 51.2% 48.8%Grade 12 26.6% 34.2% 53.2% 46.8%
_____________________________________________________________________________________Marijuana All 23.1% 33.3% 47.3% 52.7%
Grade 7 20.5% 27.7% 43.4% 56.6%Grade 8 26.3% 42.1% 53.7% 46.3%Grade 9 20.0% 25.9% 38.8% 61.2%
Grade 10 28.9% 38.6% 51.8% 48.2%Grade 11 17.7% 34.2% 48.1% 51.9%Grade 12 26.0% 33.8% 51.9% 48.1%
_____________________________________________________________________________________

8/14/2019 HARRIS COUNTY - Pasadena ISD - 1998 Texas School Survey of Drug and Alcohol Use
http://slidepdf.com/reader/full/harris-county-pasadena-isd-1998-texas-school-survey-of-drug-and-alcohol 113/213
Marijuana Only All 6.9% 12.2% 21.9% 78.1%Grade 7 5.7% 10.3% 20.7% 79.3%Grade 8 9.3% 19.6% 26.8% 73.2%Grade 9 3.3% 6.7% 15.6% 84.4%Grade 10 10.2% 13.6% 22.7% 77.3%Grade 11 7.5% 13.7% 25.0% 75.0%
Grade 12 6.3% 10.1% 24.1% 75.9%_____________________________________________________________________________________Cocaine or Crack All 4.9% 8.3% 12.6% 87.4%
Grade 7 3.7% 8.6% 12.3% 87.7%Grade 8 4.4% 6.7% 12.2% 87.8%Grade 9 3.7% 7.3% 13.4% 86.6%Grade 10 3.5% 9.4% 12.9% 87.1%Grade 11 10.3% 10.3% 11.5% 88.5%Grade 12 5.3% 7.9% 13.2% 86.8%
_____________________________________________________________________________________Cocaine All 3.9% 6.5% 11.0% 89.0%
Grade 7 2.5% 7.6% 12.7% 87.3%Grade 8 3.4% 3.4% 8.0% 92.0%Grade 9 2.5% 4.9% 11.1% 88.9%Grade 10 3.7% 8.7% 12.5% 87.5%Grade 11 7.8% 7.8% 9.1% 90.9%Grade 12 5.4% 8.1% 13.5% 86.5%
PasadenaSpring 1998
Table B12 continued from previous page

8/14/2019 HARRIS COUNTY - Pasadena ISD - 1998 Texas School Survey of Drug and Alcohol Use
http://slidepdf.com/reader/full/harris-county-pasadena-isd-1998-texas-school-survey-of-drug-and-alcohol 114/213
Past School Ever NeverMonth Year Used Used
_____________________________________________________________________________________Crack All 1.8% 3.2% 5.5% 94.5%
Grade 7 1.4% 2.7% 8.1% 91.9%
Grade 8 3.6% 6.0% 8.3% 91.7%Grade 9 1.3% 2.7% 5.3% 94.7%Grade 10 * % 2.5% 3.8% 96.2%Grade 11 4.3% 4.3% 4.3% 95.7%Grade 12 * % * % 1.4% 98.6%
_____________________________________________________________________________________Hallucinogens All 6.0% 11.4% 15.6% 84.4%
Grade 7 2.5% 5.1% 8.9% 91.1%Grade 8 2.3% 8.1% 11.6% 88.4%Grade 9 6.0% 10.8% 14.5% 85.5%Grade 10 7.8% 15.6% 20.8% 79.2%Grade 11 12.0% 18.7% 20.0% 80.0%Grade 12 7.0% 12.7% 22.5% 77.5%
_____________________________________________________________________________________Uppers All 5.2% 8.8% 12.1% 87.9%
Grade 7 2.9% 5.7% 8.6% 91.4%Grade 8 2.5% 3.8% 7.6% 92.4%Grade 9 7.9% 13.2% 17.1% 82.9%Grade 10 5.3% 9.3% 13.3% 86.7%Grade 11 6.0% 10.4% 11.9% 88.1%Grade 12 6.2% 9.4% 12.5% 87.5%
_____________________________________________________________________________________Downers All 5.5% 8.1% 11.0% 89.0%
Grade 7 * % 2.7% 5.5% 94.5%Grade 8 8.4% 9.6% 12.0% 88.0%Grade 9 6.9% 12.5% 13.9% 86.1%Grade 10 5.3% 8.0% 14.7% 85.3%Grade 11 6.0% 7.5% 10.4% 89.6%Grade 12 6.0% 6.0% 7.5% 92.5%
_____________________________________________________________________________________Rohypnol All 5.1% 7.9% 11.3% 88.7%
Grade 7 9.1% 11.7% 13.0% 87.0%Grade 8 4.5% 8.0% 12.5% 87.5%Grade 9 2.6% 6.4% 10.3% 89.7%Grade 10 7.4% 11.1% 16.0% 84.0%
Grade 11 4.2% 4.2% 5.6% 94.4%Grade 12 2.8% 4.2% 8.3% 91.7%
_____________________________________________________________________________________Steroids All 0.9% 1.3% 3.6% 96.4%
G d 7 * % * % * % 100 0%

8/14/2019 HARRIS COUNTY - Pasadena ISD - 1998 Texas School Survey of Drug and Alcohol Use
http://slidepdf.com/reader/full/harris-county-pasadena-isd-1998-texas-school-survey-of-drug-and-alcohol 115/213
Grade 7 * % * % * % 100.0%Grade 8 1.2% 1.2% 2.4% 97.6%Grade 9 1.5% 1.5% 6.1% 93.9%Grade 10 * % * % 1.4% 98.6%Grade 11 1.5% 3.0% 7.6% 92.4%Grade 12 1.6% 3.1% 4.7% 95.3%
_____________________________________________________________________________________Ecstasy All 2.4% 4.6% 8.8% 91.2%
Grade 7 3.0% 6.0% 7.5% 92.5%Grade 8 * % * % 4.8% 95.2%Grade 9 1.5% 4.6% 12.3% 87.7%Grade 10 2.7% 5.3% 9.3% 90.7%Grade 11 4.2% 7.0% 8.5% 91.5%Grade 12 4.7% 6.2% 10.9% 89.1%
_____________________________________________________________________________________Heroin All 1.4% 2.3% 4.0% 96.0%
Grade 7 3.9% 6.5% 9.1% 90.9%Grade 8 1.1% 1.1% 4.6% 95.4%Grade 9 1.4% 1.4% 2.9% 97.1%Grade 10 * % 2.6% 3.8% 96.2%Grade 11 1.4% 1.4% 1.4% 98.6%Grade 12 * % * % * % 100.0%
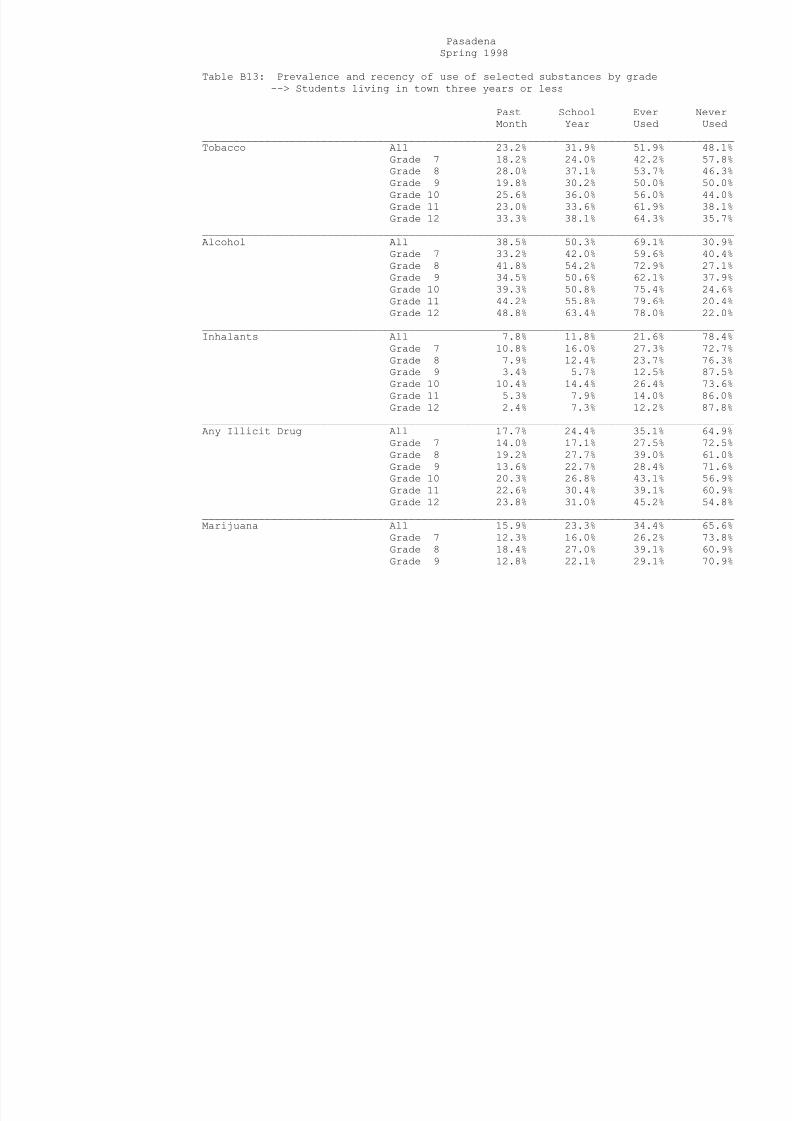
8/14/2019 HARRIS COUNTY - Pasadena ISD - 1998 Texas School Survey of Drug and Alcohol Use
http://slidepdf.com/reader/full/harris-county-pasadena-isd-1998-texas-school-survey-of-drug-and-alcohol 116/213
Grade 10 17.6% 25.2% 42.9% 57.1%Grade 11 19.5% 29.2% 37.2% 62.8%Grade 12 19.5% 26.8% 39.0% 61.0%
_____________________________________________________________________________________Marijuana Only All 5 0% 9 2% 16 7% 83 3%

8/14/2019 HARRIS COUNTY - Pasadena ISD - 1998 Texas School Survey of Drug and Alcohol Use
http://slidepdf.com/reader/full/harris-county-pasadena-isd-1998-texas-school-survey-of-drug-and-alcohol 117/213
Marijuana Only All 5.0% 9.2% 16.7% 83.3%Grade 7 6.1% 8.7% 15.3% 84.7%Grade 8 3.4% 8.4% 16.9% 83.1%Grade 9 3.4% 9.1% 13.6% 86.4%Grade 10 5.6% 8.7% 19.0% 81.0%Grade 11 8.5% 13.7% 20.5% 79.5%
Grade 12 * % 4.8% 14.3% 85.7%_____________________________________________________________________________________Cocaine or Crack All 3.4% 6.3% 9.9% 90.1%
Grade 7 2.2% 5.0% 6.1% 93.9%Grade 8 3.6% 6.5% 13.7% 86.3%Grade 9 2.5% 3.7% 4.9% 95.1%Grade 10 6.8% 11.1% 14.5% 85.5%Grade 11 2.8% 5.6% 8.4% 91.6%Grade 12 2.4% 7.3% 17.1% 82.9%
_____________________________________________________________________________________Cocaine All 3.1% 5.6% 9.3% 90.7%
Grade 7 1.7% 4.0% 5.7% 94.3%Grade 8 3.8% 6.4% 13.4% 86.6%Grade 9 2.5% 3.7% 4.9% 95.1%Grade 10 6.4% 9.2% 13.8% 86.2%Grade 11 1.9% 4.7% 6.6% 93.4%Grade 12 2.6% 7.7% 17.9% 82.1%
PasadenaSpring 1998
Table B13 continued from previous page

8/14/2019 HARRIS COUNTY - Pasadena ISD - 1998 Texas School Survey of Drug and Alcohol Use
http://slidepdf.com/reader/full/harris-county-pasadena-isd-1998-texas-school-survey-of-drug-and-alcohol 118/213
Past School Ever NeverMonth Year Used Used
_____________________________________________________________________________________Crack All 0.8% 1.8% 3.4% 96.6%
Grade 7 1.1% 2.3% 4.0% 96.0%
Grade 8 0.6% 2.6% 5.2% 94.8%Grade 9 * % * % * % 100.0%Grade 10 0.9% 2.8% 3.7% 96.3%Grade 11 1.0% 1.0% 3.0% 97.0%Grade 12 * % * % 2.6% 97.4%
_____________________________________________________________________________________Hallucinogens All 3.5% 6.9% 10.6% 89.4%
Grade 7 0.6% 2.8% 5.1% 94.9%Grade 8 3.1% 5.6% 9.9% 90.1%Grade 9 4.9% 7.3% 11.0% 89.0%Grade 10 6.2% 10.6% 15.0% 85.0%Grade 11 4.8% 10.6% 13.5% 86.5%Grade 12 5.1% 12.8% 23.1% 76.9%
_____________________________________________________________________________________Uppers All 3.1% 5.4% 8.7% 91.3%
Grade 7 1.2% 2.4% 4.8% 95.2%Grade 8 1.4% 5.1% 8.7% 91.3%Grade 9 5.3% 5.3% 7.9% 92.1%Grade 10 5.8% 11.5% 16.3% 83.7%Grade 11 4.2% 5.2% 8.3% 91.7%Grade 12 2.9% 2.9% 8.6% 91.4%
_____________________________________________________________________________________Downers All 3.2% 5.2% 8.3% 91.7%
Grade 7 * % 1.2% 3.6% 96.4%Grade 8 4.9% 7.0% 9.2% 90.8%Grade 9 4.1% 4.1% 6.8% 93.2%Grade 10 4.7% 9.4% 15.1% 84.9%Grade 11 4.1% 5.1% 9.2% 90.8%Grade 12 2.9% 8.6% 11.4% 88.6%
_____________________________________________________________________________________Rohypnol All 3.1% 3.6% 7.0% 93.0%
Grade 7 4.7% 5.3% 6.5% 93.5%Grade 8 2.5% 3.1% 6.9% 93.1%Grade 9 2.4% 2.4% 3.7% 96.3%Grade 10 3.6% 4.5% 10.0% 90.0%
Grade 11 1.0% 1.0% 6.7% 93.3%Grade 12 2.9% 5.7% 14.3% 85.7%
_____________________________________________________________________________________Steroids All 0.5% 0.8% 1.7% 98.3%
Grade 7 * % 0 6% 1 2% 98 8%

8/14/2019 HARRIS COUNTY - Pasadena ISD - 1998 Texas School Survey of Drug and Alcohol Use
http://slidepdf.com/reader/full/harris-county-pasadena-isd-1998-texas-school-survey-of-drug-and-alcohol 119/213
Grade 7 % 0.6% 1.2% 98.8%Grade 8 0.7% 0.7% 3.5% 96.5%Grade 9 * % * % * % 100.0%Grade 10 1.0% 1.0% 1.0% 99.0%Grade 11 1.0% 2.0% 3.1% 96.9%Grade 12 * % * % * % 100.0%
_____________________________________________________________________________________Ecstasy All 1.5% 3.4% 6.0% 94.0%
Grade 7 1.3% 2.6% 2.6% 97.4%Grade 8 2.0% 3.4% 5.4% 94.6%Grade 9 1.5% 2.9% 4.4% 95.6%Grade 10 2.0% 5.9% 11.9% 88.1%Grade 11 * % 1.0% 5.2% 94.8%Grade 12 2.9% 8.6% 17.1% 82.9%
_____________________________________________________________________________________Heroin All 0.8% 2.0% 3.2% 96.8%
Grade 7 1.7% 4.0% 5.8% 94.2%Grade 8 * % 1.3% 3.3% 96.7%Grade 9 * % * % * % 100.0%Grade 10 1.0% 2.9% 2.9% 97.1%Grade 11 1.0% 1.0% 1.9% 98.1%Grade 12 * % * % 2.6% 97.4%
PasadenaSpring 1998
Table B14: Prevalence and recency of use of selected substances by grade--> Students living in town more than three years

8/14/2019 HARRIS COUNTY - Pasadena ISD - 1998 Texas School Survey of Drug and Alcohol Use
http://slidepdf.com/reader/full/harris-county-pasadena-isd-1998-texas-school-survey-of-drug-and-alcohol 120/213
> Students living in town more than three years
Past School Ever NeverMonth Year Used Used
_____________________________________________________________________________________Tobacco All 27.5% 37.4% 56.7% 43.3%
Grade 7 14.9% 22.4% 38.4% 61.6%Grade 8 21.8% 31.3% 54.1% 45.9%Grade 9 28.4% 40.0% 58.8% 41.2%Grade 10 36.3% 44.4% 65.3% 34.7%Grade 11 30.9% 43.2% 62.6% 37.4%Grade 12 34.0% 45.0% 62.4% 37.6%
_____________________________________________________________________________________Alcohol All 40.7% 57.4% 76.0% 24.0%
Grade 7 24.9% 34.9% 59.0% 41.0%Grade 8 34.4% 50.3% 71.7% 28.3%Grade 9 39.6% 58.4% 75.7% 24.3%Grade 10 45.3% 65.7% 83.6% 16.4%Grade 11 47.6% 66.3% 81.8% 18.2%Grade 12 55.8% 72.0% 86.5% 13.5%
_____________________________________________________________________________________Inhalants All 6.6% 10.5% 18.0% 82.0%
Grade 7 13.0% 18.2% 24.9% 75.1%Grade 8 10.5% 15.9% 24.4% 75.6%Grade 9 5.4% 9.0% 15.0% 85.0%Grade 10 3.5% 6.4% 15.7% 84.3%Grade 11 3.7% 7.0% 17.0% 83.0%Grade 12 2.5% 5.1% 10.0% 90.0%
_____________________________________________________________________________________
Any Illicit Drug All 16.0% 24.0% 35.5% 64.5%Grade 7 9.8% 14.4% 21.5% 78.5%Grade 8 13.8% 21.7% 33.8% 66.2%Grade 9 15.4% 23.4% 32.9% 67.1%Grade 10 20.4% 28.7% 42.4% 57.6%Grade 11 22.8% 31.0% 44.9% 55.1%Grade 12 15.0% 26.6% 40.6% 59.4%
_____________________________________________________________________________________Marijuana All 14.3% 22.3% 34.3% 65.7%
Grade 7 7.9% 13.0% 20.3% 79.7%Grade 8 10.7% 19.3% 32.6% 67.4%Grade 9 15.3% 21.8% 30.6% 69.4%
Grade 10 18.7% 26.3% 40.4% 59.6%Grade 11 20.2% 30.1% 44.4% 55.6%Grade 12 13.5% 25.0% 40.6% 59.4%
_____________________________________________________________________________________Marijuana Only All 5.4% 9.6% 17.6% 82.4%

8/14/2019 HARRIS COUNTY - Pasadena ISD - 1998 Texas School Survey of Drug and Alcohol Use
http://slidepdf.com/reader/full/harris-county-pasadena-isd-1998-texas-school-survey-of-drug-and-alcohol 121/213
Marijuana Only All 5.4% 9.6% 17.6% 82.4%Grade 7 3.3% 5.1% 10.8% 89.2%Grade 8 5.3% 9.6% 18.8% 81.2%Grade 9 5.1% 9.3% 15.2% 84.8%Grade 10 6.9% 10.6% 19.8% 80.2%Grade 11 7.8% 12.7% 21.6% 78.4%
Grade 12 4.7% 11.1% 21.1% 78.9%_____________________________________________________________________________________Cocaine or Crack All 2.4% 4.1% 7.3% 92.7%
Grade 7 1.2% 2.4% 4.5% 95.5%Grade 8 2.9% 4.5% 6.6% 93.4%Grade 9 2.1% 3.3% 6.2% 93.8%Grade 10 2.2% 4.2% 7.5% 92.5%Grade 11 3.3% 5.0% 10.2% 89.8%Grade 12 2.8% 6.1% 9.6% 90.4%
_____________________________________________________________________________________Cocaine All 2.1% 3.9% 6.9% 93.1%
Grade 7 1.2% 2.5% 4.0% 96.0%Grade 8 1.6% 3.2% 4.9% 95.1%Grade 9 1.5% 2.8% 5.8% 94.2%Grade 10 2.3% 4.2% 7.6% 92.4%Grade 11 3.1% 4.8% 10.2% 89.8%Grade 12 2.9% 6.4% 10.0% 90.0%
PasadenaSpring 1998
Table B14 continued from previous page

8/14/2019 HARRIS COUNTY - Pasadena ISD - 1998 Texas School Survey of Drug and Alcohol Use
http://slidepdf.com/reader/full/harris-county-pasadena-isd-1998-texas-school-survey-of-drug-and-alcohol 122/213
Past School Ever NeverMonth Year Used Used
_____________________________________________________________________________________Crack All 0.7% 1.1% 2.1% 97.9%
Grade 7 0.3% 1.0% 2.3% 97.7%
Grade 8 2.0% 2.5% 4.2% 95.8%Grade 9 0.9% 1.6% 2.2% 97.8%Grade 10 * % 0.3% 0.9% 99.1%Grade 11 0.6% 0.6% 1.8% 98.2%Grade 12 * % 0.2% 1.0% 99.0%
_____________________________________________________________________________________Hallucinogens All 3.6% 6.7% 9.8% 90.2%
Grade 7 1.5% 3.3% 3.3% 96.7%Grade 8 2.5% 4.1% 5.7% 94.3%Grade 9 3.6% 7.6% 9.7% 90.3%Grade 10 4.9% 8.9% 14.0% 86.0%Grade 11 6.1% 10.8% 16.3% 83.7%Grade 12 3.4% 5.8% 10.7% 89.3%
_____________________________________________________________________________________Uppers All 2.7% 5.1% 8.1% 91.9%
Grade 7 1.3% 2.6% 3.3% 96.7%Grade 8 1.5% 2.1% 5.0% 95.0%Grade 9 3.6% 6.5% 9.7% 90.3%Grade 10 3.1% 7.1% 10.2% 89.8%Grade 11 4.7% 7.6% 11.7% 88.3%Grade 12 2.1% 5.1% 8.8% 91.2%
_____________________________________________________________________________________Downers All 2.5% 3.9% 6.5% 93.5%
Grade 7 0.9% 1.6% 3.1% 96.9%Grade 8 1.7% 2.0% 3.4% 96.6%Grade 9 2.7% 5.0% 6.7% 93.3%Grade 10 4.8% 7.5% 11.0% 89.0%Grade 11 3.1% 4.9% 9.2% 90.8%Grade 12 1.8% 2.4% 5.8% 94.2%
_____________________________________________________________________________________Rohypnol All 2.5% 4.2% 7.4% 92.6%
Grade 7 3.0% 5.5% 7.3% 92.7%Grade 8 2.2% 3.5% 6.5% 93.5%Grade 9 2.2% 3.8% 6.9% 93.1%Grade 10 2.5% 5.1% 9.3% 90.7%

8/14/2019 HARRIS COUNTY - Pasadena ISD - 1998 Texas School Survey of Drug and Alcohol Use
http://slidepdf.com/reader/full/harris-county-pasadena-isd-1998-texas-school-survey-of-drug-and-alcohol 123/213
PasadenaSpring 1998
GENDER

8/14/2019 HARRIS COUNTY - Pasadena ISD - 1998 Texas School Survey of Drug and Alcohol Use
http://slidepdf.com/reader/full/harris-county-pasadena-isd-1998-texas-school-survey-of-drug-and-alcohol 124/213
Q1 Frequency Percent____________________________Female 1670.695 53.8Male 1433.071 46.2
Frequency Missing = 13.23379772
GRADE
Q2 Frequency Percent_________________________________Grade 7 602.6892 19.3Grade 8 580.2108 18.6Grade 9 619.0196 19.9Grade 10 507.9726 16.3Grade 11 440.3454 14.1Grade 12 366.7624 11.8
LIVE WITH BOTH PARENTS
Q3 Frequency Percent________________________________
No 1025.637 33.2Yes 2065.263 66.8
Frequency Missing = 26.10022048
AGE
Q4 Frequency Percent___________________________________
11 or younger 1.9239 0.112 128.5456 4.113 476.6623 15.314 586.9244 18.915 614.5382 19.8

8/14/2019 HARRIS COUNTY - Pasadena ISD - 1998 Texas School Survey of Drug and Alcohol Use
http://slidepdf.com/reader/full/harris-county-pasadena-isd-1998-texas-school-survey-of-drug-and-alcohol 125/213
16 513.9774 16.517 434.6359 14.018 295.8452 9.519 or older 54.21669 1.7
Frequency Missing = 9.73056057
ETHNICITY
Q5 Frequency Percent______________________________________African/American 177.4796 5.8Asian/American 140.5436 4.6Mexican/American 1360.945 44.6Native/American 35.15729 1.2Other 217.5117 7.1White 1120.72 36.7
Frequency Missing = 64.6433676
The frequencies have been weighted so that the
analysis reflects the distribution of students by gradelevel in the district
PasadenaSpring 1998
ON AVERAGE WHAT GRADESDO YOU GET

8/14/2019 HARRIS COUNTY - Pasadena ISD - 1998 Texas School Survey of Drug and Alcohol Use
http://slidepdf.com/reader/full/harris-county-pasadena-isd-1998-texas-school-survey-of-drug-and-alcohol 126/213
Q6 Frequency Percent________________________________Mostly A's 969.7119 31.5Mostly B's 1461.033 47.5
Mostly C's 514.0209 16.7Mostly D's 98.16136 3.2Mostly F's 33.32991 1.1
Frequency Missing = 40.74282339
LENGTH OF TIME IN THIS DISTRICT
Q7 Frequency Percent_______________________________<1 year 255.7259 8.32-3 years 507.8151 16.5>4 years 2311.583 75.2
Frequency Missing = 41.87608537
DO YOU HAVE A JOB
Q8 Frequency Percent________________________________No 2212.77 71.7Yes 873.5777 28.3
Frequency Missing = 30.65200889
DO YOU GET AN ALLOWANCE

8/14/2019 HARRIS COUNTY - Pasadena ISD - 1998 Texas School Survey of Drug and Alcohol Use
http://slidepdf.com/reader/full/harris-county-pasadena-isd-1998-texas-school-survey-of-drug-and-alcohol 127/213
PasadenaSpring 1998
QUALIFY FOR FREE/REDUCEDPRICE LUNCH

8/14/2019 HARRIS COUNTY - Pasadena ISD - 1998 Texas School Survey of Drug and Alcohol Use
http://slidepdf.com/reader/full/harris-county-pasadena-isd-1998-texas-school-survey-of-drug-and-alcohol 128/213
Q11 Frequency Percent________________________________Don't Know 343.6937 11.2No 1637.851 53.2
Yes 1098.277 35.7
Frequency Missing = 37.17838167
PARTICIPATE IN ATHLETICS
Q12A Frequency Percent________________________________No 1516.83 52.4
Yes 1378.055 47.6
Frequency Missing = 222.11452067
PARTICIPATE IN BAND/ORCHESTRA
Q12B Frequency Percent________________________________
No 2050.498 80.0Yes 512.2041 20.0
Frequency Missing = 554.29787908
PARTICIPATE IN CHOIR
Q12C Frequency Percent________________________________
No 2138.799 83.6Yes 421.0411 16.4
Frequency Missing = 557.15970098

8/14/2019 HARRIS COUNTY - Pasadena ISD - 1998 Texas School Survey of Drug and Alcohol Use
http://slidepdf.com/reader/full/harris-county-pasadena-isd-1998-texas-school-survey-of-drug-and-alcohol 129/213
PARTICIPATE IN DRAMA/SPEECH
Q12D Frequency Percent________________________________No 2223.922 87.2Yes 327.8893 12.8
Frequency Missing = 565.18868199
PARTICIPATE IN DRILLTEAM/CHEERLEADING
Q12E Frequency Percent________________________________No 2280.16 87.3Yes 331.559 12.7
Frequency Missing = 505.28153997
The frequencies have been weighted so that theanalysis reflects the distribution of students by grade
level in the district
PasadenaSpring 1998
PARTICIPATE IN STUDENTGOVERNMENT

8/14/2019 HARRIS COUNTY - Pasadena ISD - 1998 Texas School Survey of Drug and Alcohol Use
http://slidepdf.com/reader/full/harris-county-pasadena-isd-1998-texas-school-survey-of-drug-and-alcohol 130/213
Q12F Frequency Percent________________________________No 2382.593 95.0Yes 125.05 5.0
Frequency Missing = 609.3568158
PARTICIPATE IN SCHOOLNEWSPAPER/YEARBOOK
Q12G Frequency Percent________________________________No 2351.498 92.6
Yes 188.1873 7.4
Frequency Missing = 577.3148045
PARTICIPATE IN ACADEMICCLUBS/SOCIETIES
Q12H Frequency Percent
________________________________No 1883.116 74.8Yes 635.9817 25.2
Frequency Missing = 597.90194675
PARTICIPATE IN SERVICE CLUBS
Q12I Frequency Percent
________________________________No 2264.793 91.3Yes 215.3696 8.7
Frequency Missing = 636.83737955

8/14/2019 HARRIS COUNTY - Pasadena ISD - 1998 Texas School Survey of Drug and Alcohol Use
http://slidepdf.com/reader/full/harris-county-pasadena-isd-1998-texas-school-survey-of-drug-and-alcohol 131/213
PARTICIPATE IN VOE/DE/WORK-STUDY
Q12J Frequency Percent________________________________No 2264.72 94.6Yes 128.8487 5.4
Frequency Missing = 723.43101534
PARTICIPATE IN OTHER CLUBS
Q12K Frequency Percent________________________________No 1749.948 67.1Yes 857.653 32.9
Frequency Missing = 509.39898371
The frequencies have been weighted so that theanalysis reflects the distribution of students by grade
level in the district
PasadenaSpring 1998
DO YOU FEEL SAFE IN YOUR HOME
Q13A Frequency Percent

8/14/2019 HARRIS COUNTY - Pasadena ISD - 1998 Texas School Survey of Drug and Alcohol Use
http://slidepdf.com/reader/full/harris-county-pasadena-isd-1998-texas-school-survey-of-drug-and-alcohol 132/213
Q13A Frequency Percent_____________________________________Very Safe 2231.398 72.1Somewhat Safe 749.6177 24.2Not Very Safe 50.90113 1.6
Not Safe At All 16.09677 0.5Don't Know 46.79649 1.5
Frequency Missing = 22.19035355
DO YOU FEEL SAFE IN YOUR NEIGHBORHOOD
Q13B Frequency Percent_____________________________________
Very Safe 875.8406 28.8Somewhat Safe 1661.953 54.7Not Very Safe 353.9824 11.7Not Safe At All 87.55327 2.9Don't Know 58.41644 1.9
Frequency Missing = 79.25477176
DO YOU FEEL SAFE AT SCHOOL Q13C Frequency Percent
_____________________________________Very Safe 1050.784 34.3Somewhat Safe 1590.123 51.9Not Very Safe 257.7182 8.4Not Safe At All 77.50344 2.5Don't Know 89.85148 2.9
Frequency Missing = 51.01976146
FRIENDS FEELING CLOSETO THEIR PARENTS

8/14/2019 HARRIS COUNTY - Pasadena ISD - 1998 Texas School Survey of Drug and Alcohol Use
http://slidepdf.com/reader/full/harris-county-pasadena-isd-1998-texas-school-survey-of-drug-and-alcohol 133/213
Q14A Frequency Percent___________________________None 140.7026 4.6A Few 949.1475 30.9
Some 927.8546 30.2Most 903.226 29.4All 148.273 4.8
Frequency Missing = 47.79635865
The frequencies have been weighted so that theanalysis reflects the distribution of students by grade
level in the district
PasadenaSpring 1998
HOW MANY FRIENDSCARRY WEAPONS

8/14/2019 HARRIS COUNTY - Pasadena ISD - 1998 Texas School Survey of Drug and Alcohol Use
http://slidepdf.com/reader/full/harris-county-pasadena-isd-1998-texas-school-survey-of-drug-and-alcohol 134/213
Q14B Frequency Percent___________________________None 1718.619 58.5A Few 702.3684 23.9
Some 318.6284 10.9Most 149.0407 5.1All 48.008 1.6
Frequency Missing = 180.33581563
HOW MANY FRIENDS CAREABOUT GOOD GRADES
Q14C Frequency Percent___________________________None 75.53311 2.5A Few 466.2311 15.6Some 729.5089 24.4Most 1300.585 43.6All 412.0343 13.8
Frequency Missing = 133.10732507
HOW MANY FRIENDSBELONG TO A GANG
Q14D Frequency Percent___________________________None 1962.181 65.6A Few 569.4538 19.0Some 266.903 8.9Most 151.8435 5.1All 42.5517 1.4
Frequency Missing = 124.06700509

8/14/2019 HARRIS COUNTY - Pasadena ISD - 1998 Texas School Survey of Drug and Alcohol Use
http://slidepdf.com/reader/full/harris-county-pasadena-isd-1998-texas-school-survey-of-drug-and-alcohol 135/213
FRIENDS WISHING TODROP OUT OF SCHOOL
Q14E Frequency Percent
___________________________None 1453.973 49.4A Few 930.5094 31.6Some 341.9144 11.6Most 154.4349 5.2All 64.3857 2.2
Frequency Missing = 171.78238109
The frequencies have been weighted so that theanalysis reflects the distribution of students by grade
level in the district
PasadenaSpring 1998
PARENTS ATTEND PTA/SCHOOLOPEN HOUSES

8/14/2019 HARRIS COUNTY - Pasadena ISD - 1998 Texas School Survey of Drug and Alcohol Use
http://slidepdf.com/reader/full/harris-county-pasadena-isd-1998-texas-school-survey-of-drug-and-alcohol 136/213
Q15 Frequency Percent________________________________No 1684.15 58.5Yes 1195.434 41.5
Frequency Missing = 237.41572745
EVER INHALED SPRAY PAINT FOR KICKS
Q16A Frequency Percent________________________________________Never Heard/Used 2771.75 91.3In Your Lifetime 157.4004 5.2
Since School Began 51.62718 1.7In the Past Month 53.74868 1.8
Frequency Missing = 82.47404466
EVER INHALED WHITEOUT FOR KICKS
Q16B Frequency Percent________________________________________Never Heard/Used 2572.109 90.7In Your Lifetime 143.7008 5.1Since School Began 53.01043 1.9In the Past Month 68.05618 2.4
Frequency Missing = 280.12408378
EVER INHALED GASOLINE FOR KICKS
Q16C Frequency Percent
________________________________________Never Heard/Used 2705.489 95.2In Your Lifetime 80.11566 2.8Since School Began 21.70129 0.8

8/14/2019 HARRIS COUNTY - Pasadena ISD - 1998 Texas School Survey of Drug and Alcohol Use
http://slidepdf.com/reader/full/harris-county-pasadena-isd-1998-texas-school-survey-of-drug-and-alcohol 137/213
Since School Began 21.70129 0.8In the Past Month 34.93984 1.2
Frequency Missing = 274.75395566
EVER INHALED FREON FOR KICKS
Q16D Frequency Percent________________________________________Never Heard/Used 2765.446 98.0In Your Lifetime 28.04931 1.0Since School Began 15.51211 0.5In the Past Month 12.87219 0.5
Frequency Missing = 295.12058905
The frequencies have been weighted so that theanalysis reflects the distribution of students by grade
level in the district
PasadenaSpring 1998
EVER INHALED POPPERS, ETC. FOR KICKS
Q16E Frequency Percent

8/14/2019 HARRIS COUNTY - Pasadena ISD - 1998 Texas School Survey of Drug and Alcohol Use
http://slidepdf.com/reader/full/harris-county-pasadena-isd-1998-texas-school-survey-of-drug-and-alcohol 138/213
Q q y________________________________________Never Heard/Used 2781.908 97.6In Your Lifetime 23.27061 0.8Since School Began 23.8963 0.8
In the Past Month 21.37773 0.7
Frequency Missing = 266.54718836
EVER INHALED GLUE FOR KICKS
Q16F Frequency Percent________________________________________Never Heard/Used 2646.509 94.9
In Your Lifetime 90.85617 3.3Since School Began 24.00468 0.9In the Past Month 27.2678 1.0
Frequency Missing = 328.36221653
EVER INHALED PAINT THINNERS FOR KICKS
Q16G Frequency Percent________________________________________Never Heard/Used 2695.356 94.6In Your Lifetime 81.33926 2.9Since School Began 34.03248 1.2In the Past Month 37.00105 1.3
Frequency Missing = 269.27144919
EVER INHALED NITROUS OXIDE FOR KICKS
Q16H Frequency Percent________________________________________Never Heard/Used 2614.51 94.2In Your Lifetime 79.7627 2.9

8/14/2019 HARRIS COUNTY - Pasadena ISD - 1998 Texas School Survey of Drug and Alcohol Use
http://slidepdf.com/reader/full/harris-county-pasadena-isd-1998-texas-school-survey-of-drug-and-alcohol 139/213
Since School Began 33.79591 1.2In the Past Month 47.68712 1.7
Frequency Missing = 341.24409505
EVER INHALED OCTANE BOOSTER FOR KICKS
Q16I Frequency Percent________________________________________Never Heard/Used 2791.489 98.6In Your Lifetime 16.80888 0.6Since School Began 13.67763 0.5In the Past Month 8.898617 0.3
Frequency Missing = 286.12603404
The frequencies have been weighted so that theanalysis reflects the distribution of students by grade
level in the district
PasadenaSpring 1998
EVER INHALED OTHER SPRAYS FOR KICKS
Q16J Frequency Percent

8/14/2019 HARRIS COUNTY - Pasadena ISD - 1998 Texas School Survey of Drug and Alcohol Use
http://slidepdf.com/reader/full/harris-county-pasadena-isd-1998-texas-school-survey-of-drug-and-alcohol 140/213
q y________________________________________Never Heard/Used 2679.537 94.8In Your Lifetime 83.23745 2.9Since School Began 25.64244 0.9
In the Past Month 37.21722 1.3
Frequency Missing = 291.3655051
EVER INHALED OTHER INHALANTS FOR KICKS
Q16K Frequency Percent________________________________________Never Heard/Used 2631.662 89.9
In Your Lifetime 130.8085 4.5Since School Began 64.76188 2.2In the Past Month 99.93865 3.4
Frequency Missing = 189.82947744
RECENT CIGARETTE USE
Q17A Frequency Percent________________________________________Never Heard/Used 1402.44 45.9In Your Lifetime 588.1521 19.3Since School Began 298.5386 9.8In the Past Month 765.8286 25.1
Frequency Missing = 62.04118654
RECENT SMOKELESS TOBACCO USE
Q17B Frequency Percent________________________________________Never Heard/Used 2558.698 86.8In Your Lifetime 177.9138 6.0

8/14/2019 HARRIS COUNTY - Pasadena ISD - 1998 Texas School Survey of Drug and Alcohol Use
http://slidepdf.com/reader/full/harris-county-pasadena-isd-1998-texas-school-survey-of-drug-and-alcohol 141/213
Since School Began 79.00836 2.7In the Past Month 132.6559 4.5
Frequency Missing = 168.72429034
RECENT BEER USE
Q17C Frequency Percent________________________________________Never Heard/Used 1192.5 40.3In Your Lifetime 541.5375 18.3Since School Began 387.7108 13.1In the Past Month 834.814 28.2
Frequency Missing = 160.43742477
The frequencies have been weighted so that theanalysis reflects the distribution of students by grade
level in the district

8/14/2019 HARRIS COUNTY - Pasadena ISD - 1998 Texas School Survey of Drug and Alcohol Use
http://slidepdf.com/reader/full/harris-county-pasadena-isd-1998-texas-school-survey-of-drug-and-alcohol 142/213
RECENT MARIJUANA USE
Q18A Frequency Percent________________________________________Never Heard/Used 1978.198 65.8In Your Lifetime 353.8985 11.8

8/14/2019 HARRIS COUNTY - Pasadena ISD - 1998 Texas School Survey of Drug and Alcohol Use
http://slidepdf.com/reader/full/harris-county-pasadena-isd-1998-texas-school-survey-of-drug-and-alcohol 143/213
Since School Began 235.1512 7.8In the Past Month 440.8135 14.7
Frequency Missing = 108.93853324
RECENT COCAINE USE
Q18B Frequency Percent________________________________________Never Heard/Used 2622.197 92.5In Your Lifetime 91.94858 3.2Since School Began 54.887 1.9In the Past Month 64.8127 2.3
Frequency Missing = 283.15476439
The frequencies have been weighted so that theanalysis reflects the distribution of students by grade
level in the district
PasadenaSpring 1998
RECENT CRACK USE
Q18C Frequency Percent

8/14/2019 HARRIS COUNTY - Pasadena ISD - 1998 Texas School Survey of Drug and Alcohol Use
http://slidepdf.com/reader/full/harris-county-pasadena-isd-1998-texas-school-survey-of-drug-and-alcohol 144/213
________________________________________Never Heard/Used 2674.961 97.6In Your Lifetime 31.31355 1.1Since School Began 15.68943 0.6
In the Past Month 18.89369 0.7
Frequency Missing = 376.14268113
RECENT HALLUCINOGEN USE
Q18E Frequency Percent________________________________________Never Heard/Used 2578.805 90.0
In Your Lifetime 92.88739 3.2Since School Began 91.88947 3.2In the Past Month 102.3721 3.6
Frequency Missing = 251.04581409
RECENT UPPER USE
Q18F Frequency Percent________________________________________Never Heard/Used 2398.163 91.7In Your Lifetime 80.75926 3.1Since School Began 62.34566 2.4In the Past Month 72.88079 2.8
Frequency Missing = 502.85134825
RECENT DOWNER USE
Q18G Frequency Percent________________________________________Never Heard/Used 2476.359 93.0In Your Lifetime 73.33152 2.8i h l 41 74416 1 6

8/14/2019 HARRIS COUNTY - Pasadena ISD - 1998 Texas School Survey of Drug and Alcohol Use
http://slidepdf.com/reader/full/harris-county-pasadena-isd-1998-texas-school-survey-of-drug-and-alcohol 145/213
Since School Began 41.74416 1.6In the Past Month 70.20222 2.6
Frequency Missing = 455.36353559
RECENT ROHYPNOL USE
Q18H Frequency Percent________________________________________Never Heard/Used 2613.794 92.7In Your Lifetime 90.35326 3.2Since School Began 40.45222 1.4In the Past Month 73.7001 2.6
Frequency Missing = 298.7005832
The frequencies have been weighted so that theanalysis reflects the distribution of students by grade
level in the district
PasadenaSpring 1998
RECENT STEROID USE
Q18I Frequency Percent

8/14/2019 HARRIS COUNTY - Pasadena ISD - 1998 Texas School Survey of Drug and Alcohol Use
http://slidepdf.com/reader/full/harris-county-pasadena-isd-1998-texas-school-survey-of-drug-and-alcohol 146/213
________________________________________Never Heard/Used 2560.813 98.2In Your Lifetime 29.60038 1.1Since School Began 6.626561 0.3
In the Past Month 10.25625 0.4
Frequency Missing = 509.70420429
RECENT ECSTASY USE
Q18J Frequency Percent________________________________________Never Heard/Used 2466.482 95.0
In Your Lifetime 64.90868 2.5Since School Began 31.95948 1.2In the Past Month 32.32451 1.2
Frequency Missing = 521.32582069
RECENT HEROIN USE
Q18K Frequency Percent________________________________________Never Heard/Used 2679.953 97.9In Your Lifetime 30.46312 1.1Since School Began 14.94999 0.5In the Past Month 12.78497 0.5
Frequency Missing = 378.84945753

8/14/2019 HARRIS COUNTY - Pasadena ISD - 1998 Texas School Survey of Drug and Alcohol Use
http://slidepdf.com/reader/full/harris-county-pasadena-isd-1998-texas-school-survey-of-drug-and-alcohol 147/213
PasadenaSpring 1998
INHALANT USE IN PAST MONTH
Q19C Frequency Percent

8/14/2019 HARRIS COUNTY - Pasadena ISD - 1998 Texas School Survey of Drug and Alcohol Use
http://slidepdf.com/reader/full/harris-county-pasadena-isd-1998-texas-school-survey-of-drug-and-alcohol 148/213
______________________________________Never Heard/Used 2756.043 94.41-2 times 126.6858 4.33-10 times 23.60156 0.8
11+ times 11.88521 0.4
Frequency Missing = 198.78473501
MARIJUANA USE IN PAST MONTH
Q19D Frequency Percent______________________________________Never Heard/Used 2099.077 78.9
1-2 times 261.511 9.83-10 times 150.2709 5.611+ times 150.6445 5.7
Frequency Missing = 455.49671385
COCAINE USE IN PAST MONTH
Q19E Frequency Percent______________________________________Never Heard/Used 2556.178 96.11-2 times 63.07441 2.43-10 times 24.57361 0.911+ times 16.79617 0.6
Frequency Missing = 456.3782717
CRACK USE IN PAST MONTH
Q19F Frequency Percent______________________________________Never Heard/Used 2747.794 98.71-2 times 29.09516 1.03-10 times 5 785747 0 2

8/14/2019 HARRIS COUNTY - Pasadena ISD - 1998 Texas School Survey of Drug and Alcohol Use
http://slidepdf.com/reader/full/harris-county-pasadena-isd-1998-texas-school-survey-of-drug-and-alcohol 149/213
3-10 times 5.785747 0.211+ times 2.011129 0.1
Frequency Missing = 332.31382794
CLOSE FRIENDS USE CIGARETTES
Q20A Frequency Percent______________________________________Never heard/None 689.663 22.5A few 1013.102 33.0Some 683.781 22.3Most 572.7938 18.7
All 110.3969 3.6
Frequency Missing = 47.26335714
The frequencies have been weighted so that theanalysis reflects the distribution of students by grade
level in the district
PasadenaSpring 1998
CLOSE FRIENDS USE SMOKELESS TOBACCO
Q20B Frequency Percent

8/14/2019 HARRIS COUNTY - Pasadena ISD - 1998 Texas School Survey of Drug and Alcohol Use
http://slidepdf.com/reader/full/harris-county-pasadena-isd-1998-texas-school-survey-of-drug-and-alcohol 150/213
______________________________________Never heard/None 1951.61 65.5A few 608.7382 20.4Some 291.0307 9.8
Most 100.1946 3.4All 29.99548 1.0
Frequency Missing = 135.43116098
CLOSE FRIENDS USE BEER
Q20C Frequency Percent______________________________________
Never heard/None 615.1467 20.3A few 690.5092 22.8Some 667.5709 22.1Most 763.4917 25.3All 286.7042 9.5
Frequency Missing = 93.57751359
CLOSE FRIENDS USE WINE COOLERS
Q20D Frequency Percent
______________________________________Never heard/None 739.1197 24.9A few 676.7714 22.8Some 646.8399 21.8Most 670.3193 22.5All 239.5893 8.1
Frequency Missing = 144.36046032
CLOSE FRIENDS USE WINE
Q20E Frequency Percent

8/14/2019 HARRIS COUNTY - Pasadena ISD - 1998 Texas School Survey of Drug and Alcohol Use
http://slidepdf.com/reader/full/harris-county-pasadena-isd-1998-texas-school-survey-of-drug-and-alcohol 151/213
______________________________________Never heard/None 1208.936 40.5A few 746.2783 25.0Some 504.8688 16.9
Most 384.0403 12.9All 137.6159 4.6
Frequency Missing = 135.26046045
CLOSE FRIENDS USE LIQUOR
Q20F Frequency Percent______________________________________
Never heard/None 911.465 31.1A few 611.7384 20.8Some 552.2257 18.8Most 626.9726 21.4All 232.3089 7.9
Frequency Missing = 182.28944751
The frequencies have been weighted so that theanalysis reflects the distribution of students by grade
level in the district
PasadenaSpring 1998
CLOSE FRIENDS USE INHALANTS
Q20G Frequency Percent

8/14/2019 HARRIS COUNTY - Pasadena ISD - 1998 Texas School Survey of Drug and Alcohol Use
http://slidepdf.com/reader/full/harris-county-pasadena-isd-1998-texas-school-survey-of-drug-and-alcohol 152/213
______________________________________Never heard/None 2353.057 78.5A few 443.0953 14.8Some 141.5189 4.7
Most 48.78715 1.6All 10.21938 0.3
Frequency Missing = 120.32241212
CLOSE FRIENDS USE MARIJUANA
Q20H Frequency Percent______________________________________
Never heard/None 1239.416 41.4A few 639.4192 21.4Some 492.5258 16.5Most 456.0961 15.2All 165.8117 5.5
Frequency Missing = 123.73112581
DIFFICULT TO GET CIGARETTES
Q21A Frequency Percent
____________________________________Never heard of 209.1846 6.9Impossible 281.7318 9.3Very difficult 98.94276 3.3Somewhat diff 235.5514 7.8Somewhat easy 591.5089 19.5Very easy 1618.512 53.3
Frequency Missing = 81.5688276
DIFFICULT TO GET SMOKELESS TOBACCO
Q21B Frequency Percent

8/14/2019 HARRIS COUNTY - Pasadena ISD - 1998 Texas School Survey of Drug and Alcohol Use
http://slidepdf.com/reader/full/harris-county-pasadena-isd-1998-texas-school-survey-of-drug-and-alcohol 153/213
Q21B Frequency Percent____________________________________Never heard of 559.6093 19.1Impossible 420.2231 14.4
Very difficult 194.7101 6.7Somewhat diff 284.1704 9.7Somewhat easy 481.8455 16.5Very easy 981.8941 33.6
Frequency Missing = 194.54764515
The frequencies have been weighted so that theanalysis reflects the distribution of students by grade
level in the district
PasadenaSpring 1998
DIFFICULT TO GET BEER
Q21C Frequency Percent

8/14/2019 HARRIS COUNTY - Pasadena ISD - 1998 Texas School Survey of Drug and Alcohol Use
http://slidepdf.com/reader/full/harris-county-pasadena-isd-1998-texas-school-survey-of-drug-and-alcohol 154/213
____________________________________Never heard of 166.8755 5.7Impossible 249.2102 8.5Very difficult 144.6291 4.9
Somewhat diff 289.0014 9.9Somewhat easy 705.5798 24.1Very easy 1376.526 47.0
Frequency Missing = 185.17798447
DIFFICULT TO GET WINE COOLERS
Q21D Frequency Percent
____________________________________Never heard of 202.8246 7.1Impossible 225.396 7.9Very difficult 133.8429 4.7Somewhat diff 323.2892 11.4Somewhat easy 675.4148 23.7Very easy 1283.428 45.1
Frequency Missing = 272.80485539
DIFFICULT TO GET WINE
Q21E Frequency Percent____________________________________Never heard of 224.7689 7.9Impossible 332.9552 11.7Very difficult 208.1417 7.3Somewhat diff 352.8327 12.4Somewhat easy 630.2465 22.2Very easy 1095.569 38.5
Frequency Missing = 272.48617647
DIFFICULT TO GET LIQUOR

8/14/2019 HARRIS COUNTY - Pasadena ISD - 1998 Texas School Survey of Drug and Alcohol Use
http://slidepdf.com/reader/full/harris-county-pasadena-isd-1998-texas-school-survey-of-drug-and-alcohol 155/213
Q21F Frequency Percent
____________________________________
Never heard of 207.9687 7.5Impossible 339.7962 12.3Very difficult 202.6766 7.3Somewhat diff 348.8679 12.6Somewhat easy 572.5022 20.8Very easy 1086.778 39.4
Frequency Missing = 358.41055864
The frequencies have been weighted so that theanalysis reflects the distribution of students by grade
level in the district
PasadenaSpring 1998
DIFFICULT TO GET INHALANTS
Q21G Frequency Percent

8/14/2019 HARRIS COUNTY - Pasadena ISD - 1998 Texas School Survey of Drug and Alcohol Use
http://slidepdf.com/reader/full/harris-county-pasadena-isd-1998-texas-school-survey-of-drug-and-alcohol 156/213
____________________________________Never heard of 491.8004 16.8Impossible 404.6381 13.8Very difficult 108.1635 3.7
Somewhat diff 179.0729 6.1Somewhat easy 322.2668 11.0Very easy 1418.076 48.5
Frequency Missing = 192.98199135
DIFFICULT TO GET MARIJUANA
Q21H Frequency Percent
____________________________________Never heard of 274.7885 9.7Impossible 570.14 20.2Very difficult 208.1237 7.4Somewhat diff 375.9283 13.3Somewhat easy 498.7659 17.7Very easy 895.3507 31.7
Frequency Missing = 293.90299828
DIFFICULT TO GET COCAINE
Q21I Frequency Percent____________________________________Never heard of 405.9027 14.3Impossible 852.2327 30.0Very difficult 406.8727 14.3Somewhat diff 464.2277 16.4Somewhat easy 360.1352 12.7Very easy 349.1708 12.3
Frequency Missing = 278.45830284
DIFFICULT TO GET CRACK

8/14/2019 HARRIS COUNTY - Pasadena ISD - 1998 Texas School Survey of Drug and Alcohol Use
http://slidepdf.com/reader/full/harris-county-pasadena-isd-1998-texas-school-survey-of-drug-and-alcohol 157/213
Q21J Frequency Percent
____________________________________
Never heard of 446.2607 16.2Impossible 882.7589 32.0Very difficult 452.5213 16.4Somewhat diff 444.2592 16.1Somewhat easy 270.9987 9.8Very easy 262.0109 9.5
Frequency Missing = 358.1903734
The frequencies have been weighted so that theanalysis reflects the distribution of students by grade
level in the district
PasadenaSpring 1998
DIFFICULT TO GET HALLUCINOGENS
Q21L Frequency Percent____________________________________

8/14/2019 HARRIS COUNTY - Pasadena ISD - 1998 Texas School Survey of Drug and Alcohol Use
http://slidepdf.com/reader/full/harris-county-pasadena-isd-1998-texas-school-survey-of-drug-and-alcohol 158/213
Never heard of 843.4489 29.1Impossible 708.1594 24.4Very difficult 354.6952 12.2
Somewhat diff 323.1278 11.1Somewhat easy 301.3081 10.4Very easy 368.0932 12.7
Frequency Missing = 218.16754033
DIFFICULT TO GET UPPERS
Q21M Frequency Percent
____________________________________Never heard of 945.3557 34.1Impossible 578.9582 20.9Very difficult 294.7555 10.6Somewhat diff 321.753 11.6Somewhat easy 294.2922 10.6Very easy 341.0867 12.3
Frequency Missing = 340.79872477
DIFFICULT TO GET DOWNERS
Q21N Frequency Percent____________________________________Never heard of 911.5879 33.9Impossible 572.8721 21.3Very difficult 291.0386 10.8Somewhat diff 311.253 11.6Somewhat easy 286.3363 10.6Very easy 318.3173 11.8
Frequency Missing = 425.59491659
DIFFICULT TO GET ROHYPNOL

8/14/2019 HARRIS COUNTY - Pasadena ISD - 1998 Texas School Survey of Drug and Alcohol Use
http://slidepdf.com/reader/full/harris-county-pasadena-isd-1998-texas-school-survey-of-drug-and-alcohol 159/213
Q21O Frequency Percent
____________________________________
Never heard of 1157.153 40.3Impossible 540.9008 18.8Very difficult 304.7695 10.6Somewhat diff 290.8273 10.1Somewhat easy 252.9185 8.8Very easy 324.1839 11.3
Frequency Missing = 246.24670847
The frequencies have been weighted so that theanalysis reflects the distribution of students by grade
level in the district
PasadenaSpring 1998
DIFFICULT TO GET STEROIDS
Q21P Frequency Percent____________________________________
h d f 554 0681 20 0

8/14/2019 HARRIS COUNTY - Pasadena ISD - 1998 Texas School Survey of Drug and Alcohol Use
http://slidepdf.com/reader/full/harris-county-pasadena-isd-1998-texas-school-survey-of-drug-and-alcohol 160/213
Never heard of 554.0681 20.0Impossible 860.3018 31.1Very difficult 385.14 13.9Somewhat diff 376.108 13.6Somewhat easy 281.3041 10.2Very easy 310.8709 11.2
Frequency Missing = 349.20717077
DIFFICULT TO GET ECSTASY
Q21Q Frequency Percent
____________________________________Never heard of 993.3526 35.2Impossible 619.8525 22.0Very difficult 318.3871 11.3Somewhat diff 307.4199 10.9Somewhat easy 251.612 8.9Very easy 329.7409 11.7
Frequency Missing = 296.63508383
DIFFICULT TO GET HEROIN
Q21R Frequency Percent____________________________________Never heard of 553.7607 19.5Impossible 1019.891 35.9Very difficult 472.6834 16.6Somewhat diff 363.3654 12.8Somewhat easy 186.9369 6.6Very easy 247.9616 8.7
Frequency Missing = 272.40114756
AGE WHEN FIRST USED CIGARETTES

8/14/2019 HARRIS COUNTY - Pasadena ISD - 1998 Texas School Survey of Drug and Alcohol Use
http://slidepdf.com/reader/full/harris-county-pasadena-isd-1998-texas-school-survey-of-drug-and-alcohol 161/213
Q22A Frequency Percent
___________________________________Never used it 1289.329 43.09 or younger 263.2277 8.810 years old 168.8119 5.611 years old 204.2809 6.812 years old 283.5332 9.513 years old 293.5169 9.814 years old 198.5296 6.615 years old 160.0504 5.316 years old 83.44839 2.817 years old 34.05477 1.118 or older 17.97545 0.6
Frequency Missing = 120.24135495
The frequencies have been weighted so that theanalysis reflects the distribution of students by grade
level in the district
PasadenaSpring 1998
AGE WHEN FIRST USEDSMOKELESS TOBACCO
Q22B Frequency Percent

8/14/2019 HARRIS COUNTY - Pasadena ISD - 1998 Texas School Survey of Drug and Alcohol Use
http://slidepdf.com/reader/full/harris-county-pasadena-isd-1998-texas-school-survey-of-drug-and-alcohol 162/213
___________________________________Never used it 2364.372 85.29 or younger 41.3061 1.510 years old 27.41604 1.011 years old 41.8996 1.512 years old 57.78546 2.113 years old 65.31508 2.414 years old 66.83281 2.415 years old 53.97501 1.916 years old 38.54723 1.417 years old 15.5463 0.618 or older 3.219422 0.1
Frequency Missing = 340.78543678
AGE WHEN FIRST USED BEER
Q22C Frequency Percent___________________________________Never used it 926.9204 32.69 or younger 383.6144 13.510 years old 152.3979 5.411 years old 213.3281 7.512 years old 284.5555 10.0
13 years old 268.7611 9.514 years old 254.1484 8.915 years old 202.7192 7.116 years old 121.2335 4.317 years old 18.49811 0.718 or older 17.55092 0.6
Frequency Missing = 273.27246555

8/14/2019 HARRIS COUNTY - Pasadena ISD - 1998 Texas School Survey of Drug and Alcohol Use
http://slidepdf.com/reader/full/harris-county-pasadena-isd-1998-texas-school-survey-of-drug-and-alcohol 163/213
PasadenaSpring 1998
AGE WHEN FIRST USED WINE
Q22E Frequency Percent___________________________________Never used it 1193 036 43 4

8/14/2019 HARRIS COUNTY - Pasadena ISD - 1998 Texas School Survey of Drug and Alcohol Use
http://slidepdf.com/reader/full/harris-county-pasadena-isd-1998-texas-school-survey-of-drug-and-alcohol 164/213
Never used it 1193.036 43.49 or younger 185.2929 6.710 years old 127.218 4.611 years old 162.645 5.912 years old 244.0028 8.913 years old 253.0495 9.214 years old 261.2914 9.515 years old 166.8852 6.116 years old 103.0622 3.717 years old 37.4324 1.418 or older 15.42053 0.6
Frequency Missing = 367.66454592
AGE WHEN FIRST USED LIQUOR
Q22F Frequency Percent___________________________________Never used it 1168.064 43.39 or younger 120.0309 4.410 years old 80.9494 3.011 years old 134.3924 5.012 years old 212.9114 7.913 years old 276.488 10.2
14 years old 264.7165 9.815 years old 239.7107 8.916 years old 138.6881 5.117 years old 42.55878 1.618 or older 19.36184 0.7
Frequency Missing = 419.12812275
AGE WHEN FIRST USED INHALANTS
Q22G Frequency Percent___________________________________Never used it 2462.32 88.59 or younger 47.66842 1.710 years old 26.27457 0.911 years old 49 4099 1 8

8/14/2019 HARRIS COUNTY - Pasadena ISD - 1998 Texas School Survey of Drug and Alcohol Use
http://slidepdf.com/reader/full/harris-county-pasadena-isd-1998-texas-school-survey-of-drug-and-alcohol 165/213
11 years old 49.4099 1.812 years old 75.9744 2.713 years old 60.93805 2.214 years old 25.01046 0.915 years old 20.48893 0.716 years old 8.557147 0.317 years old 4.56001 0.218 or older 1.743517 0.1
Frequency Missing = 334.05434833
The frequencies have been weighted so that theanalysis reflects the distribution of students by grade
level in the district
PasadenaSpring 1998
AGE WHEN FIRST USED MARIJUANA
Q22H Frequency Percent___________________________________Never used it 1565 11 61 8
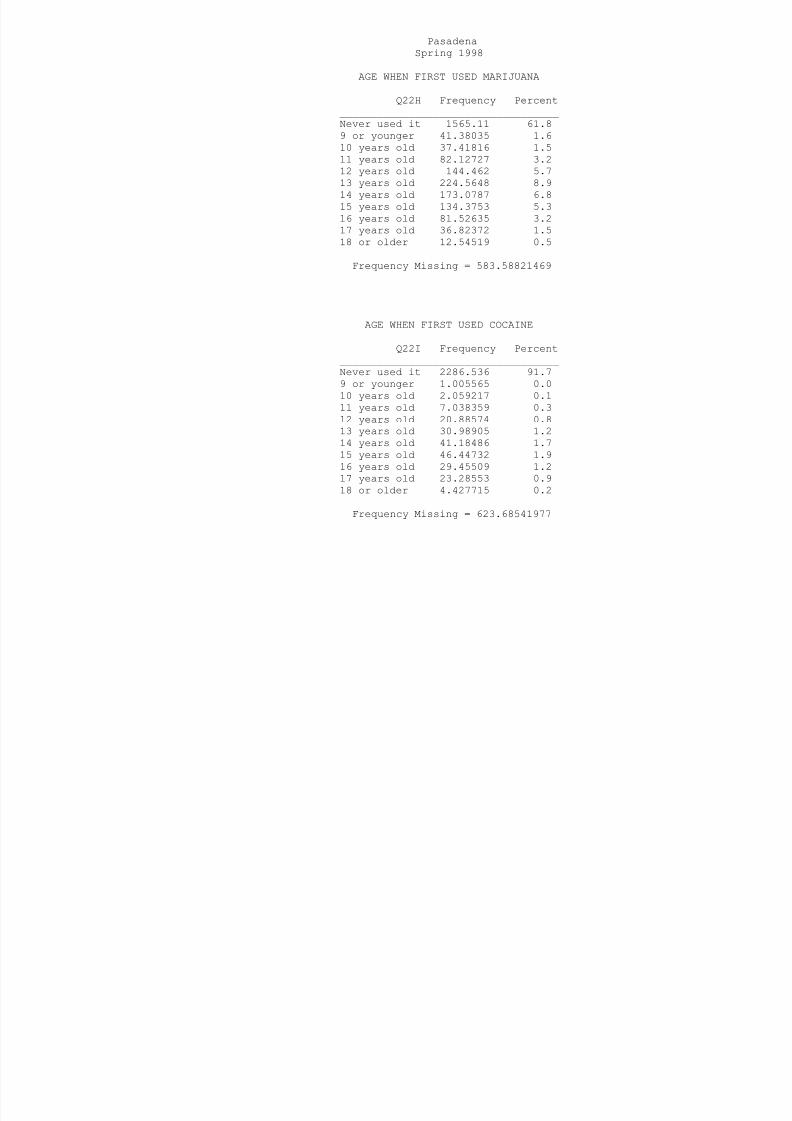
8/14/2019 HARRIS COUNTY - Pasadena ISD - 1998 Texas School Survey of Drug and Alcohol Use
http://slidepdf.com/reader/full/harris-county-pasadena-isd-1998-texas-school-survey-of-drug-and-alcohol 166/213
Never used it 1565.11 61.89 or younger 41.38035 1.610 years old 37.41816 1.511 years old 82.12727 3.212 years old 144.462 5.713 years old 224.5648 8.914 years old 173.0787 6.815 years old 134.3753 5.316 years old 81.52635 3.217 years old 36.82372 1.518 or older 12.54519 0.5
Frequency Missing = 583.58821469
AGE WHEN FIRST USED COCAINE
Q22I Frequency Percent___________________________________Never used it 2286.536 91.79 or younger 1.005565 0.010 years old 2.059217 0.111 years old 7.038359 0.312 years old 20.88574 0.813 years old 30.98905 1.2
14 years old 41.18486 1.715 years old 46.44732 1.916 years old 29.45509 1.217 years old 23.28553 0.918 or older 4.427715 0.2
Frequency Missing = 623.68541977
AGE WHEN FIRST USED CRACK
Q22J Frequency Percent___________________________________Never used it 2261.773 97.49 or younger 2.059217 0.110 years old 2.011129 0.111 years old 2.011129 0.1

8/14/2019 HARRIS COUNTY - Pasadena ISD - 1998 Texas School Survey of Drug and Alcohol Use
http://slidepdf.com/reader/full/harris-county-pasadena-isd-1998-texas-school-survey-of-drug-and-alcohol 167/213
11 years old 2.011129 0.112 years old 9.155204 0.413 years old 11.18639 0.514 years old 10.01807 0.415 years old 8.712358 0.416 years old 5.572908 0.217 years old 4.528126 0.218 or older 4.08967 0.2
Frequency Missing = 795.88332469
The frequencies have been weighted so that theanalysis reflects the distribution of students by grade
level in the district
PasadenaSpring 1998
AGE WHEN FIRST USED HALLUCINOGENS
Q22L Frequency Percent___________________________________Never used it 2392.586 89.7

8/14/2019 HARRIS COUNTY - Pasadena ISD - 1998 Texas School Survey of Drug and Alcohol Use
http://slidepdf.com/reader/full/harris-county-pasadena-isd-1998-texas-school-survey-of-drug-and-alcohol 168/213
Never used it 2392.586 89.79 or younger 3.064782 0.110 years old 3.11287 0.111 years old 6.264957 0.212 years old 31.49925 1.213 years old 47.13997 1.814 years old 54.97434 2.115 years old 61.05016 2.316 years old 47.7847 1.817 years old 15.6786 0.618 or older 4.695327 0.2
Frequency Missing = 449.14872722
AGE WHEN FIRST USED UPPERS
Q22M Frequency Percent___________________________________Never used it 2102.786 90.99 or younger 2.059217 0.110 years old 3.11287 0.111 years old 14.90396 0.612 years old 27.72749 1.213 years old 37.2016 1.6
14 years old 53.44968 2.315 years old 32.58062 1.416 years old 22.91936 1.017 years old 15.60212 0.718 or older 2.213858 0.1
Frequency Missing = 802.44305756
AGE WHEN FIRST USED DOWNERS
Q22N Frequency Percent___________________________________Never used it 2067.862 92.39 or younger 5.65043 0.311 years old 6.780287 0.312 years old 22.6325 1.0

8/14/2019 HARRIS COUNTY - Pasadena ISD - 1998 Texas School Survey of Drug and Alcohol Use
http://slidepdf.com/reader/full/harris-county-pasadena-isd-1998-texas-school-survey-of-drug-and-alcohol 169/213
y13 years old 31.58872 1.414 years old 44.60795 2.015 years old 28.70012 1.316 years old 21.2365 0.917 years old 9.781498 0.418 or older 2.48147 0.1
Frequency Missing = 875.67860654
The frequencies have been weighted so that theanalysis reflects the distribution of students by grade
level in the district
PasadenaSpring 1998
AGE WHEN FIRST USED ROHYPNOL
Q22O Frequency Percent___________________________________Never used it 2442.523 93.0
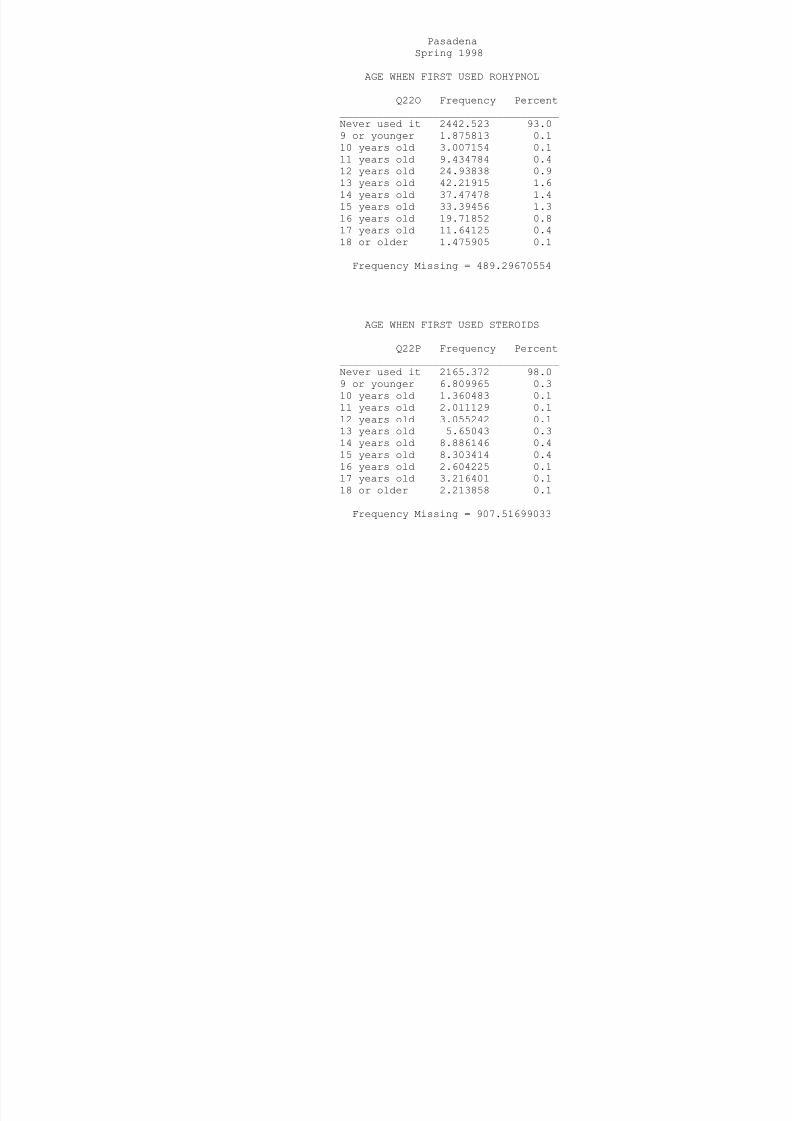
8/14/2019 HARRIS COUNTY - Pasadena ISD - 1998 Texas School Survey of Drug and Alcohol Use
http://slidepdf.com/reader/full/harris-county-pasadena-isd-1998-texas-school-survey-of-drug-and-alcohol 170/213
9 or younger 1.875813 0.110 years old 3.007154 0.111 years old 9.434784 0.412 years old 24.93838 0.913 years old 42.21915 1.614 years old 37.47478 1.415 years old 33.39456 1.316 years old 19.71852 0.817 years old 11.64125 0.418 or older 1.475905 0.1
Frequency Missing = 489.29670554
AGE WHEN FIRST USED STEROIDS
Q22P Frequency Percent___________________________________Never used it 2165.372 98.09 or younger 6.809965 0.310 years old 1.360483 0.111 years old 2.011129 0.112 years old 3.055242 0.113 years old 5.65043 0.3
14 years old 8.886146 0.415 years old 8.303414 0.416 years old 2.604225 0.117 years old 3.216401 0.118 or older 2.213858 0.1
Frequency Missing = 907.51699033

8/14/2019 HARRIS COUNTY - Pasadena ISD - 1998 Texas School Survey of Drug and Alcohol Use
http://slidepdf.com/reader/full/harris-county-pasadena-isd-1998-texas-school-survey-of-drug-and-alcohol 171/213
PasadenaSpring 1998
AGE WHEN FIRST USED HEROIN
Q22R Frequency Percent___________________________________Never used it 2333.378 97.9

8/14/2019 HARRIS COUNTY - Pasadena ISD - 1998 Texas School Survey of Drug and Alcohol Use
http://slidepdf.com/reader/full/harris-county-pasadena-isd-1998-texas-school-survey-of-drug-and-alcohol 172/213
9 or younger 3.11287 0.110 years old 2.001589 0.111 years old 0.870248 0.012 years old 8.284956 0.313 years old 16.13594 0.714 years old 11.02363 0.515 years old 5.727616 0.216 years old 1.866273 0.117 years old 1.053652 0.018 or older 1.005565 0.0
Frequency Missing = 732.5393679
HOW OFTEN NORMALLY USE CIGARETTES
Q23A Frequency Percent______________________________________Every day 216.1087 7.6Several times/wk 145.5529 5.1Several times/mo 216.9971 7.6About once/month 297.4593 10.4About once/year 255.149 9.0< once/year 371.2986 13.0
Never used 1346.452 47.3
Frequency Missing = 267.98296856
HOW OFTEN NORMALLY USESMOKELESS TOBACCO
Q23B Frequency Percent
______________________________________Every day 24.79827 1.0Several times/wk 27.59023 1.1Several times/mo 29.50529 1.2About once/month 64.73113 2.7About once/year 67.12805 2.8< once/year 128.963 5.4Never used 2056.764 85.7

8/14/2019 HARRIS COUNTY - Pasadena ISD - 1998 Texas School Survey of Drug and Alcohol Use
http://slidepdf.com/reader/full/harris-county-pasadena-isd-1998-texas-school-survey-of-drug-and-alcohol 173/213
Frequency Missing = 717.52000346
HOW OFTEN NORMALLY USE BEER
Q23C Frequency Percent______________________________________Every day 18.66708 0.7Several times/wk 150.4704 6.0Several times/mo 385.0111 15.4About once/month 481.3012 19.3
About once/year 348.4383 14.0< once/year 310.3631 12.5Never used 798.4959 32.0
Frequency Missing = 624.25311986
The frequencies have been weighted so that the
analysis reflects the distribution of students by gradelevel in the district
PasadenaSpring 1998
HOW OFTEN NORMALLY USE WINE COOLERS
Q23D Frequency Percent______________________________________Every day 5.430829 0.2

8/14/2019 HARRIS COUNTY - Pasadena ISD - 1998 Texas School Survey of Drug and Alcohol Use
http://slidepdf.com/reader/full/harris-county-pasadena-isd-1998-texas-school-survey-of-drug-and-alcohol 174/213
Several times/wk 117.2828 4.9Several times/mo 353.8269 14.7About once/month 503.2848 20.9About once/year 444.6971 18.5< once/year 253.3 10.5Never used 730.9793 30.3
Frequency Missing = 708.19841587
HOW OFTEN NORMALLY USE WINE
Q23E Frequency Percent______________________________________Every day 4.808299 0.2Several times/wk 67.6045 2.8Several times/mo 193.5884 8.0About once/month 359.0707 14.8About once/year 486.3541 20.0< once/year 276.2594 11.4Never used 1044.982 43.0
Frequency Missing = 684.33261679
HOW OFTEN NORMALLY USE LIQUOR
Q23F Frequency Percent______________________________________Every day 9.556026 0.4Several times/wk 107.5745 4.4Several times/mo 307.5962 12.4About once/month 424.6859 17.2
About once/year 353.1864 14.3< once/year 229.2244 9.3Never used 1039.34 42.1
Frequency Missing = 645.83626567

8/14/2019 HARRIS COUNTY - Pasadena ISD - 1998 Texas School Survey of Drug and Alcohol Use
http://slidepdf.com/reader/full/harris-county-pasadena-isd-1998-texas-school-survey-of-drug-and-alcohol 175/213
HOW OFTEN NORMALLY USE INHALANTS
Q23G Frequency Percent______________________________________Every day 4.52144 0.2Several times/wk 15.24865 0.6Several times/mo 22.18434 0.8About once/month 58.83732 2.2About once/year 63.70432 2.4< once/year 103.9968 3.9Never used 2425.084 90.0
Frequency Missing = 423.42327069
The frequencies have been weighted so that theanalysis reflects the distribution of students by grade
level in the district
PasadenaSpring 1998
HOW OFTEN NORMALLY USE MARIJUANA
Q23H Frequency Percent______________________________________Every day 68.4141 3.2S l ti / k 97 16763 4 5

8/14/2019 HARRIS COUNTY - Pasadena ISD - 1998 Texas School Survey of Drug and Alcohol Use
http://slidepdf.com/reader/full/harris-county-pasadena-isd-1998-texas-school-survey-of-drug-and-alcohol 176/213
Several times/wk 97.16763 4.5Several times/mo 156.437 7.3About once/month 191.0994 8.9
About once/year 171.1799 7.9< once/year 196.5407 9.1Never used 1274.368 59.1
Frequency Missing = 961.79345604
HOW OFTEN NORMALLY USE COCAINE
Q23I Frequency Percent______________________________________Every day 2.919925 0.1Several times/wk 17.96606 0.8Several times/mo 23.78683 1.1About once/month 36.79487 1.7About once/year 43.33712 2.0< once/year 54.1512 2.5Never used 2007.471 91.8
Frequency Missing = 930.57357534
HOW OFTEN NORMALLY USE CRACK
Q23J Frequency Percent______________________________________Several times/wk 3.064782 0.1Several times/mo 9.26976 0.4About once/month 6.484482 0.3About once/year 20.02746 1.0
< once/year 17.17853 0.8Never used 2048.899 97.3
Frequency Missing = 1012.0757013
HOW OFTEN NORMALLY USE HALLUCINOGENS

8/14/2019 HARRIS COUNTY - Pasadena ISD - 1998 Texas School Survey of Drug and Alcohol Use
http://slidepdf.com/reader/full/harris-county-pasadena-isd-1998-texas-school-survey-of-drug-and-alcohol 177/213
HOW OFTEN NORMALLY USE HALLUCINOGENS
Q23L Frequency Percent
______________________________________Every day 1.360483 0.1Several times/wk 9.578271 0.4Several times/mo 37.16486 1.4About once/month 77.47257 2.9About once/year 73.51375 2.8< once/year 64.41427 2.4Never used 2403.607 90.1
Frequency Missing = 449.88934427
The frequencies have been weighted so that theanalysis reflects the distribution of students by grade
level in the district
PasadenaSpring 1998
HOW OFTEN NORMALLY USE UPPERS
Q23M Frequency Percent______________________________________Every day 4.051267 0.2Several times/wk 10 9726 0 5

8/14/2019 HARRIS COUNTY - Pasadena ISD - 1998 Texas School Survey of Drug and Alcohol Use
http://slidepdf.com/reader/full/harris-county-pasadena-isd-1998-texas-school-survey-of-drug-and-alcohol 178/213
Several times/wk 10.9726 0.5Several times/mo 23.9123 1.1About once/month 70.53934 3.2
About once/year 52.01743 2.4< once/year 42.41066 1.9Never used 1973.025 90.6
Frequency Missing = 940.07190309
HOW OFTEN NORMALLY USE DOWNERS
Q23N Frequency Percent______________________________________Every day 1.866273 0.1Several times/wk 6.15622 0.3Several times/mo 28.66378 1.3About once/month 59.22894 2.7About once/year 34.88307 1.6< once/year 35.0018 1.6Never used 2059.285 92.5
Frequency Missing = 891.91461916
HOW OFTEN NORMALLY USE ROHYPNOL
Q23O Frequency Percent______________________________________Every day 4.051267 0.2Several times/wk 10.32509 0.4Several times/mo 26.20684 1.0About once/month 46.17583 1.7
About once/year 43.51247 1.6< once/year 42.80412 1.6Never used 2472.926 93.5
Frequency Missing = 470.99818981

8/14/2019 HARRIS COUNTY - Pasadena ISD - 1998 Texas School Survey of Drug and Alcohol Use
http://slidepdf.com/reader/full/harris-county-pasadena-isd-1998-texas-school-survey-of-drug-and-alcohol 179/213
HOW OFTEN NORMALLY USE STEROIDS
Q23P Frequency Percent______________________________________Every day 1.866273 0.1Several times/wk 0.737953 0.0Several times/mo 1.360483 0.1About once/month 7.516703 0.4About once/year 16.12129 0.8< once/year 10.68804 0.5Never used 2063.565 98.2
Frequency Missing = 1015.144011
The frequencies have been weighted so that theanalysis reflects the distribution of students by grade
level in the district
PasadenaSpring 1998
HOW OFTEN NORMALLY USE ECSTASY
Q23Q Frequency Percent______________________________________Every day 1.005565 0.0Several times/wk 2 604225 0 1

8/14/2019 HARRIS COUNTY - Pasadena ISD - 1998 Texas School Survey of Drug and Alcohol Use
http://slidepdf.com/reader/full/harris-county-pasadena-isd-1998-texas-school-survey-of-drug-and-alcohol 180/213
Several times/wk 2.604225 0.1Several times/mo 15.92458 0.7About once/month 33.19305 1.5
About once/year 31.1512 1.4< once/year 40.28207 1.8Never used 2126.094 94.5
Frequency Missing = 866.74492126
HOW OFTEN NORMALLY USE HEROIN
Q23R Frequency Percent______________________________________Every day 1.053652 0.0Several times/wk 6.177651 0.3Several times/mo 5.102568 0.2About once/month 2.107305 0.1About once/year 11.84666 0.5< once/year 24.72635 1.1Never used 2297.494 97.8
Frequency Missing = 768.49149889
HOW MANY CIGARETTES IN PAST 30 DAYS
Q24 Frequency Percent______________________________________None 2183.554 72.5Less than 1 443.9334 14.7> 1 and < 10 247.5278 8.2> 10 and < 1pk 73.68972 2.4
> 1pk and < 2pks 53.91741 1.8More than 2pks 10.26888 0.3
Frequency Missing = 104.10942429
AMOUNT OF BEER AT ONE TIME

8/14/2019 HARRIS COUNTY - Pasadena ISD - 1998 Texas School Survey of Drug and Alcohol Use
http://slidepdf.com/reader/full/harris-county-pasadena-isd-1998-texas-school-survey-of-drug-and-alcohol 181/213
AMOUNT OF BEER AT ONE TIME
Q25A Frequency Percent
______________________________________Never drink this 1207.09 40.012+ drinks 157.1058 5.29-11 drinks 105.0394 3.55-8 drinks 245.4051 8.13-4 drinks 281.9478 9.42 drinks 278.3818 9.21 drink 315.6264 10.5< 1 drink 424.4702 14.1
Frequency Missing = 101.93353838
The frequencies have been weighted so that theanalysis reflects the distribution of students by grade
level in the district
PasadenaSpring 1998
AMOUNT OF WINE COOLERS AT ONE TIME
Q25B Frequency Percent______________________________________Never drink this 1021.454 35.012+ drinks 131 1042 4 5

8/14/2019 HARRIS COUNTY - Pasadena ISD - 1998 Texas School Survey of Drug and Alcohol Use
http://slidepdf.com/reader/full/harris-county-pasadena-isd-1998-texas-school-survey-of-drug-and-alcohol 182/213
12+ drinks 131.1042 4.59-11 drinks 109.2406 3.75-8 drinks 257.495 8.8
3-4 drinks 435.5866 14.92 drinks 365.7667 12.51 drink 344.6634 11.8< 1 drink 254.9498 8.7
Frequency Missing = 196.73993078
AMOUNT OF WINE AT ONE TIME
Q25C Frequency Percent______________________________________Never drink this 1372.709 47.312+ drinks 53.45882 1.89-11 drinks 32.97917 1.15-8 drinks 103.6149 3.63-4 drinks 177.4855 6.12 drinks 261.8951 9.01 drink 453.7965 15.6< 1 drink 447.7475 15.4
Frequency Missing = 213.31326401
AMOUNT OF LIQUOR AT ONE TIME
Q25D Frequency Percent______________________________________Never drink this 1281.177 44.412+ drinks 106.9994 3.7
9-11 drinks 76.64985 2.75-8 drinks 210.669 7.33-4 drinks 298.6665 10.42 drinks 242.8896 8.41 drink 300.7855 10.4< 1 drink 366.3311 12.7
Frequency Missing = 232.8319534

8/14/2019 HARRIS COUNTY - Pasadena ISD - 1998 Texas School Survey of Drug and Alcohol Use
http://slidepdf.com/reader/full/harris-county-pasadena-isd-1998-texas-school-survey-of-drug-and-alcohol 183/213
BEERS, FIVE OR MORE AT ONE TIME
Q26A Frequency Percent______________________________________Never drink this 1283.224 42.9Never 5+ at time 556.8159 18.6Every day 11.43184 0.4Several times/wk 102.2677 3.4Several times/mo 281.4346 9.4About once/month 251.2511 8.4< once/month 244.1137 8.2< once/year 263.0013 8.8
Frequency Missing = 123.46008429
The frequencies have been weighted so that the
analysis reflects the distribution of students by gradelevel in the district
PasadenaSpring 1998
WINE COOLERS, FIVE OR MORE AT ONE TIME
Q26B Frequency Percent______________________________________Never drink this 1120.699 38.5Never 5+ at time 556.0717 19.1

8/14/2019 HARRIS COUNTY - Pasadena ISD - 1998 Texas School Survey of Drug and Alcohol Use
http://slidepdf.com/reader/full/harris-county-pasadena-isd-1998-texas-school-survey-of-drug-and-alcohol 184/213
Every day 10.86166 0.4Several times/wk 84.61356 2.9
Several times/mo 298.1946 10.2About once/month 315.6449 10.8< once/month 304.3367 10.4< once/year 222.4801 7.6
Frequency Missing = 204.09750733
WINE, FIVE OR MORE AT ONE TIME
Q26C Frequency Percent______________________________________Never drink this 1354.471 48.2Never 5+ at time 490.343 17.5Several times/wk 48.31619 1.7Several times/mo 139.91 5.0About once/month 191.7765 6.8< once/month 284.5407 10.1< once/year 299.6983 10.7
Frequency Missing = 307.94457997
LIQUOR, FIVE OR MORE AT ONE TIME
Q26D Frequency Percent______________________________________Never drink this 1283.805 45.8Never 5+ at time 446.2565 15.9Every day 4.892583 0.2
Several times/wk 79.14157 2.8Several times/mo 236.82 8.4About once/month 252.3697 9.0< once/month 253.497 9.0< once/year 245.8817 8.8
Frequency Missing = 314.33589395

8/14/2019 HARRIS COUNTY - Pasadena ISD - 1998 Texas School Survey of Drug and Alcohol Use
http://slidepdf.com/reader/full/harris-county-pasadena-isd-1998-texas-school-survey-of-drug-and-alcohol 185/213
GET ALCOHOLIC BEVERAGES FROM HOME
Q27A Frequency Percent______________________________________Do not Drink 1067.734 35.6Never 890.132 29.7Seldom 708.1357 23.6Most of the Time 241.0324 8.0Always 91.82484 3.1
Frequency Missing = 118.14122099
The frequencies have been weighted so that theanalysis reflects the distribution of students by grade
level in the district
PasadenaSpring 1998
GET ALCOHOLIC BEVERAGES FROM FRIENDS
Q27B Frequency Percent______________________________________Do not Drink 792.3893 26.8Never 435.5365 14.7

8/14/2019 HARRIS COUNTY - Pasadena ISD - 1998 Texas School Survey of Drug and Alcohol Use
http://slidepdf.com/reader/full/harris-county-pasadena-isd-1998-texas-school-survey-of-drug-and-alcohol 186/213
Seldom 562.3628 19.0Most of the Time 812.5045 27.4
Always 357.8208 12.1
Frequency Missing = 156.38624232
GET ALCOHOLIC BEVERAGES FROM A STORE
Q27C Frequency Percent______________________________________Do not Drink 848.8211 28.9Never 1239.551 42.2Seldom 417.6939 14.2Most of the Time 284.863 9.7Always 146.0589 5.0
Frequency Missing = 180.01228611
GET ALCOHOLIC BEVERAGES AT PARTIES
Q27D Frequency Percent______________________________________Do not Drink 756.0075 26.0Never 344.4829 11.8Seldom 441.5584 15.2Most of the Time 661.7042 22.8Always 704.3104 24.2
Frequency Missing = 208.9366532
GET ALCOHOLIC BEVERAGES FROM OTHER
Q27E Frequency Percent______________________________________Do not Drink 881.5505 30.6Never 757.8293 26.3

8/14/2019 HARRIS COUNTY - Pasadena ISD - 1998 Texas School Survey of Drug and Alcohol Use
http://slidepdf.com/reader/full/harris-county-pasadena-isd-1998-texas-school-survey-of-drug-and-alcohol 187/213
Seldom 564.7316 19.6Most of the Time 343.1288 11.9
Always 337.2546 11.7
Frequency Missing = 232.50526055
DANGEROUS FOR KIDSTO USE TOBACCO
Q28A Frequency Percent
________________________________Very 1169.707 39.7Somewhat 1061.69 36.0Not very 454.1119 15.4Not at all 92.81485 3.1Don't know 170.4356 5.8
The frequencies have been weighted so that theanalysis reflects the distribution of students by grade
level in the district
PasadenaSpring 1998
Frequency Missing = 168.24060151
DANGEROUS FOR KIDS

8/14/2019 HARRIS COUNTY - Pasadena ISD - 1998 Texas School Survey of Drug and Alcohol Use
http://slidepdf.com/reader/full/harris-county-pasadena-isd-1998-texas-school-survey-of-drug-and-alcohol 188/213
TO USE ALCOHOL
Q28B Frequency Percent________________________________Very 1123.607 41.2Somewhat 1056.532 38.7Not very 400.2213 14.7Not at all 60.33585 2.2Don't know 87.76045 3.2
Frequency Missing = 388.54390487
DANGEROUS FOR KIDSTO USE INHALANTS
Q28C Frequency Percent
________________________________Very 2141.945 79.0Somewhat 351.5803 13.0Not very 64.89061 2.4Not at all 19.17327 0.7Don't know 132.9217 4.9
Frequency Missing = 406.48945251
DANGEROUS FOR KIDSTO USE MARIJUANA
Q28D Frequency Percent
________________________________
Very 1511.99 58.3Somewhat 568.1244 21.9Not very 296.4845 11.4Not at all 141.9989 5.5Don't know 75.56683 2.9
Frequency Missing = 522.83557956

8/14/2019 HARRIS COUNTY - Pasadena ISD - 1998 Texas School Survey of Drug and Alcohol Use
http://slidepdf.com/reader/full/harris-county-pasadena-isd-1998-texas-school-survey-of-drug-and-alcohol 189/213
DANGEROUS FOR KIDSTO USE COCAINE
Q28E Frequency Percent
________________________________Very 2346.642 87.5Somewhat 194.767 7.3Not very 39.98867 1.5Not at all 12.07803 0.5Don't know 89.49584 3.3
Frequency Missing = 434.02878307
The frequencies have been weighted so that theanalysis reflects the distribution of students by grade
level in the district

8/14/2019 HARRIS COUNTY - Pasadena ISD - 1998 Texas School Survey of Drug and Alcohol Use
http://slidepdf.com/reader/full/harris-county-pasadena-isd-1998-texas-school-survey-of-drug-and-alcohol 190/213
Frequency Missing = 488.24407887
DANGEROUS FOR KIDS TO USE HEROIN
Q28I Frequency Percent________________________________
2461 663 89 3

8/14/2019 HARRIS COUNTY - Pasadena ISD - 1998 Texas School Survey of Drug and Alcohol Use
http://slidepdf.com/reader/full/harris-county-pasadena-isd-1998-texas-school-survey-of-drug-and-alcohol 191/213
Very 2461.663 89.3Somewhat 131.4204 4.8
Not very 14.0655 0.5Not at all 5.824295 0.2Don't know 144.5352 5.2
Frequency Missing = 359.49210219
The frequencies have been weighted so that theanalysis reflects the distribution of students by grade
level in the district
PasadenaSpring 1998
USE MARIJUANA AS JOINTS
Q29A Frequency Percent______________________________________Never 1524.708 67.7Seldom 211.847 9.4H lf th ti 129 3126 5 7

8/14/2019 HARRIS COUNTY - Pasadena ISD - 1998 Texas School Survey of Drug and Alcohol Use
http://slidepdf.com/reader/full/harris-county-pasadena-isd-1998-texas-school-survey-of-drug-and-alcohol 192/213
Half the time 129.3126 5.7Most of the time 235.2103 10.4
Always 127.351 5.7Don't know 25.05553 1.1
Frequency Missing = 863.51580469
USE MARIJUANA AS BLUNTS
Q29B Frequency Percent______________________________________Never 1686.395 77.5Seldom 201.9372 9.3Half the time 105.3384 4.8Most of the time 83.15365 3.8Always 66.2608 3.0Don't know 33.40082 1.5
Frequency Missing = 940.51403249
USE MARIJUANA IN BONGS OR WATER PIPES
Q29C Frequency Percent______________________________________Never 1762.713 80.2Seldom 189.8339 8.6Half the time 99.83179 4.5Most of the time 74.48983 3.4Always 41.74664 1.9Don't know 30.10584 1.4
Frequency Missing = 918.27902995
USE MARIJUANA IN PIPES
Q29D Frequency Percent

8/14/2019 HARRIS COUNTY - Pasadena ISD - 1998 Texas School Survey of Drug and Alcohol Use
http://slidepdf.com/reader/full/harris-county-pasadena-isd-1998-texas-school-survey-of-drug-and-alcohol 193/213
______________________________________Never 1745.288 80.4
Seldom 222.4431 10.3Half the time 81.73981 3.8Most of the time 65.34778 3.0Always 33.3635 1.5Don't know 21.71352 1.0
Frequency Missing = 947.10441568
The frequencies have been weighted so that theanalysis reflects the distribution of students by grade
level in the district

8/14/2019 HARRIS COUNTY - Pasadena ISD - 1998 Texas School Survey of Drug and Alcohol Use
http://slidepdf.com/reader/full/harris-county-pasadena-isd-1998-texas-school-survey-of-drug-and-alcohol 194/213
OTHER DAYS MISSEDSINCE SEPTEMBER
Q30C Frequency Percent
______________________________None 1298.769 43.81-3 days 1372.42 46.34-9 days 236 3813 8 0

8/14/2019 HARRIS COUNTY - Pasadena ISD - 1998 Texas School Survey of Drug and Alcohol Use
http://slidepdf.com/reader/full/harris-county-pasadena-isd-1998-texas-school-survey-of-drug-and-alcohol 195/213
4-9 days 236.3813 8.010+ days 58.4599 2.0
Frequency Missing = 150.97067894
SENT TO PRINCIPAL/DEANSINCE SEPTEMBER
Q30D Frequency Percent
______________________________None 2316.153 77.01-3 days 462.1697 15.44-9 days 131.3985 4.410+ days 96.59682 3.2
Frequency Missing = 110.68239503
The frequencies have been weighted so that the
analysis reflects the distribution of students by gradelevel in the district
PasadenaSpring 1998
SOMEONE CALLED HOMESINCE SEPTEMBER
Q30E Frequency Percent
______________________________None 2497.862 83.61-3 days 370 5171 12 4

8/14/2019 HARRIS COUNTY - Pasadena ISD - 1998 Texas School Survey of Drug and Alcohol Use
http://slidepdf.com/reader/full/harris-county-pasadena-isd-1998-texas-school-survey-of-drug-and-alcohol 196/213
1 3 days 370.5171 12.44-9 days 79.22304 2.7
10+ days 41.04597 1.4
Frequency Missing = 128.35232716
IN TROUBLE FOR DRINKINGSINCE SEPTEMBER
Q30F Frequency Percent
______________________________
None 2918.689 98.71-3 days 27.77356 0.94-9 days 5.936619 0.210+ days 5.01836 0.2
Frequency Missing = 159.58296058
IN TROUBLE FOR DRUG
USE SINCE SEPTEMBER Q30G Frequency Percent
______________________________None 2940.532 98.71-3 days 27.1873 0.94-9 days 7.2675 0.210+ days 3.72653 0.1
Frequency Missing = 138.28694863
DAYS SKIPPED IN PAST MONTH
Q31A Frequency Percent______________________________None 2483.677 83.01-3 days 437.5123 14.64-9 days 46 58672 1 6

8/14/2019 HARRIS COUNTY - Pasadena ISD - 1998 Texas School Survey of Drug and Alcohol Use
http://slidepdf.com/reader/full/harris-county-pasadena-isd-1998-texas-school-survey-of-drug-and-alcohol 197/213
4 9 days 46.58672 1.610+ days 24.58943 0.8
Frequency Missing = 124.63417889
DAYS ILL IN PAST MONTH
Q31B Frequency Percent______________________________None 1876.364 64.41-3 days 923.0029 31.7
4-9 days 88.70663 3.010+ days 26.13693 0.9
Frequency Missing = 202.78982516
The frequencies have been weighted so that the
analysis reflects the distribution of students by gradelevel in the district
PasadenaSpring 1998
OTHER DAYS MISSEDIN PAST MONTH
Q31C Frequency Percent
______________________________None 2049.328 70.11-3 days 781.5277 26.7

8/14/2019 HARRIS COUNTY - Pasadena ISD - 1998 Texas School Survey of Drug and Alcohol Use
http://slidepdf.com/reader/full/harris-county-pasadena-isd-1998-texas-school-survey-of-drug-and-alcohol 198/213
1 3 days 781.5277 26.74-9 days 73.59952 2.5
10+ days 17.29696 0.6
Frequency Missing = 195.2481039
SENT TO PRINCIPAL/DEANIN PAST MONTH
Q31D Frequency Percent
______________________________
None 2616.328 88.81-3 days 255.5648 8.74-9 days 49.27134 1.710+ days 25.88105 0.9
Frequency Missing = 169.95498659
SOMEONE CALLED HOME
IN PAST MONTH Q31E Frequency Percent
______________________________None 2759.23 92.81-3 days 166.8802 5.64-9 days 22.23805 0.710+ days 25.09587 0.8
Frequency Missing = 143.55551779
TROUBLE WITH FRIENDSBECAUSE OF DRINKING
Q32A Frequency Percent
_______________________________None 2753.057 92.31-3 times 189.2901 6.3

8/14/2019 HARRIS COUNTY - Pasadena ISD - 1998 Texas School Survey of Drug and Alcohol Use
http://slidepdf.com/reader/full/harris-county-pasadena-isd-1998-texas-school-survey-of-drug-and-alcohol 199/213
1 3 times 189.2901 6.34-9 times 26.53218 0.9
10+ times 13.35957 0.4
Frequency Missing = 134.76114509
DRIVEN A CAR AFTERA GOOD BIT TO DRINK
Q32B Frequency Percent
_______________________________
None 2587.365 90.81-3 times 197.9259 6.94-9 times 42.22829 1.510+ times 21.97296 0.8
Frequency Missing = 267.50836696
The frequencies have been weighted so that theanalysis reflects the distribution of students by grade
level in the district
PasadenaSpring 1998
CRITICIZED BY DATEBECAUSE OF DRINKING
Q32C Frequency Percent
_______________________________None 2681.005 92.91-3 times 158.0751 5.5

8/14/2019 HARRIS COUNTY - Pasadena ISD - 1998 Texas School Survey of Drug and Alcohol Use
http://slidepdf.com/reader/full/harris-county-pasadena-isd-1998-texas-school-survey-of-drug-and-alcohol 200/213
4-9 times 28.71855 1.0
10+ times 17.88887 0.6
Frequency Missing = 231.31235005
TROUBLE WITH POLICEBECAUSE OF DRINKING
Q32D Frequency Percent
_______________________________
None 2610.925 96.61-3 times 82.59689 3.14-9 times 6.15622 0.210+ times 4.289948 0.2
Frequency Missing = 413.03231933
TROUBLE WITH FRIENDS
BECAUSE OF DRUG USE Q32E Frequency Percent
_______________________________None 2731.917 94.51-3 times 125.4249 4.34-9 times 23.02924 0.810+ times 10.80344 0.4
Frequency Missing = 225.82545506

8/14/2019 HARRIS COUNTY - Pasadena ISD - 1998 Texas School Survey of Drug and Alcohol Use
http://slidepdf.com/reader/full/harris-county-pasadena-isd-1998-texas-school-survey-of-drug-and-alcohol 201/213
PasadenaSpring 1998
TROUBLE WITH POLICEBECAUSE OF DRUG USE
Q32H Frequency Percent
_______________________________None 2703.164 97.41-3 times 56.27235 2.0

8/14/2019 HARRIS COUNTY - Pasadena ISD - 1998 Texas School Survey of Drug and Alcohol Use
http://slidepdf.com/reader/full/harris-county-pasadena-isd-1998-texas-school-survey-of-drug-and-alcohol 202/213
4-9 times 10.9364 0.4
10+ times 4.644866 0.2
Frequency Missing = 341.98252059
CLASS DAYS DRUNK ONALCOHOL SINCE SEPT
Q33A Frequency Percent
______________________________
None 2601.374 90.61-3 days 203.549 7.14-9 days 39.39924 1.410+ days 27.74561 1.0
Frequency Missing = 244.9319836
CLASS DAYS HIGH ON MARIJUANASINCE SEPT
Q33B Frequency Percent
______________________________None 2387.821 88.21-3 days 189.1801 7.04-9 days 53.11122 2.010+ days 77.13742 2.8
Frequency Missing = 409.75034171
CLASS DAYS HIGH ON INHALANTSSINCE SEPT
Q33C Frequency Percent
______________________________None 2661.475 97.41-3 days 56.73637 2.1

8/14/2019 HARRIS COUNTY - Pasadena ISD - 1998 Texas School Survey of Drug and Alcohol Use
http://slidepdf.com/reader/full/harris-county-pasadena-isd-1998-texas-school-survey-of-drug-and-alcohol 203/213
4-9 days 8.324174 0.3
10+ days 5.478917 0.2
Frequency Missing = 384.98551196
CLASS DAYS HIGHON OTHER DRUG(S)
Q33D Frequency Percent
______________________________
None 2583.696 93.41-3 days 129.9935 4.74-9 days 29.65312 1.110+ days 21.70154 0.8
Frequency Missing = 351.95579916
The frequencies have been weighted so that theanalysis reflects the distribution of students by grade
level in the district
PasadenaSpring 1998
ALCOHOL USE AT PARTIESTHIS SCHOOL YEAR
Q34A Frequency Percent
______________________________________Never 806.5181 27.2Seldom 336.4618 11.3

8/14/2019 HARRIS COUNTY - Pasadena ISD - 1998 Texas School Survey of Drug and Alcohol Use
http://slidepdf.com/reader/full/harris-county-pasadena-isd-1998-texas-school-survey-of-drug-and-alcohol 204/213
Half the time 264.4093 8.9
Most of the time 488.9192 16.5Always 758.8397 25.6Don't know 71.91231 2.4Didn't attend 238.1955 8.0
Frequency Missing = 151.74416021
DRUG USE AT PARTIES THIS SCHOOL YEAR
Q34B Frequency Percent______________________________________Never 1230.862 41.7Seldom 412.9188 14.0Half the time 305.8941 10.4Most of the time 317.038 10.7Always 342.0299 11.6Don't know 108.9072 3.7Didn't attend 236.4876 8.0
Frequency Missing = 162.86225097
SOUGHT HELP FOR DRUG/ALCOHOLPROBLEM
Q35 Frequency Percent________________________________No 2542.259 92.2Yes 215.3769 7.8
Frequency Missing = 359.36410566
WOULD SEEK HELP FROMSCHOOL COUNSELOR
Q36A Frequency Percent
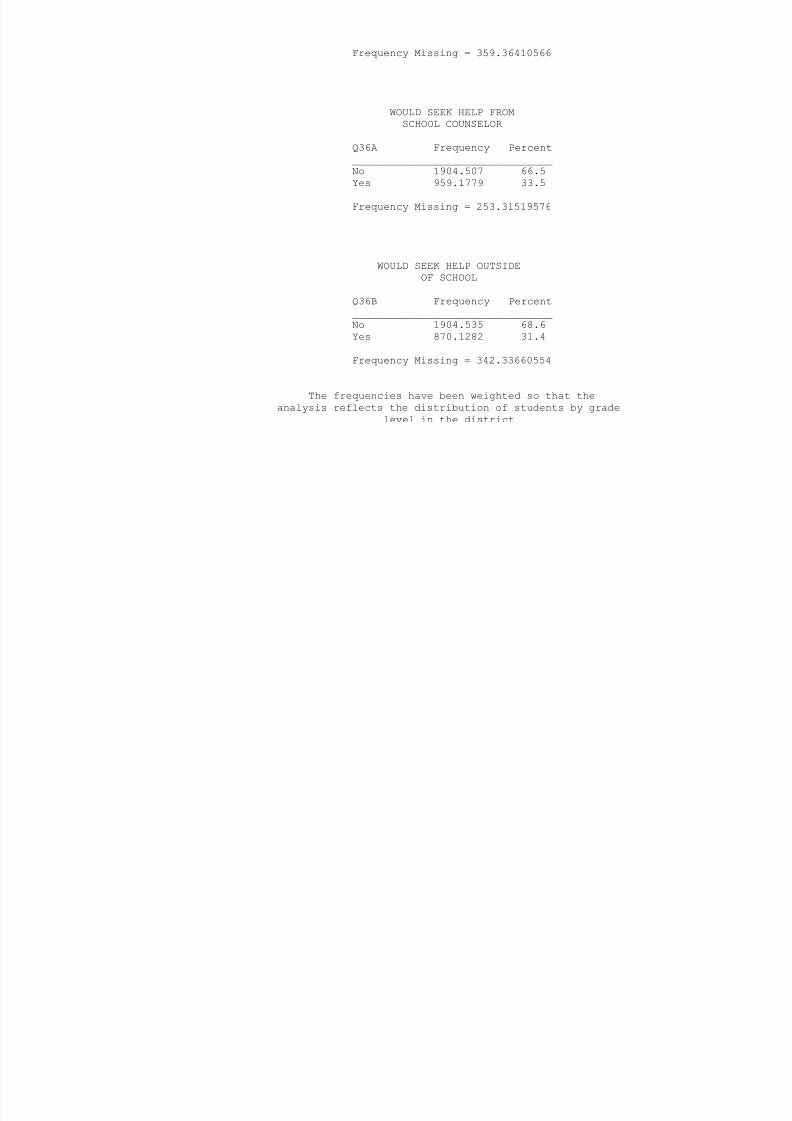
8/14/2019 HARRIS COUNTY - Pasadena ISD - 1998 Texas School Survey of Drug and Alcohol Use
http://slidepdf.com/reader/full/harris-county-pasadena-isd-1998-texas-school-survey-of-drug-and-alcohol 205/213
________________________________
No 1904.507 66.5Yes 959.1779 33.5
Frequency Missing = 253.31519576
WOULD SEEK HELP OUTSIDEOF SCHOOL
Q36B Frequency Percent
________________________________No 1904.535 68.6Yes 870.1282 31.4
Frequency Missing = 342.33660554
The frequencies have been weighted so that the
analysis reflects the distribution of students by gradelevel in the district
PasadenaSpring 1998
WOULD SEEK HELP FROMOTHER COUNSELOR
Q36C Frequency Percent________________________________No 1494.752 57.8Yes 1089.99 42.2

8/14/2019 HARRIS COUNTY - Pasadena ISD - 1998 Texas School Survey of Drug and Alcohol Use
http://slidepdf.com/reader/full/harris-county-pasadena-isd-1998-texas-school-survey-of-drug-and-alcohol 206/213
Frequency Missing = 532.2581595
WOULD SEEK HELP FROM PARENTS
Q36D Frequency Percent________________________________No 1039.591 40.2Yes 1548.266 59.8
Frequency Missing = 529.14279002
WOULD SEEK HELP FROMA MEDICAL DOCTOR
Q36E Frequency Percent________________________________No 1478.828 58.1Yes 1068.655 41.9
Frequency Missing = 569.51680769
WOULD SEEK HELP FROM FRIENDS
Q36F Frequency Percent________________________________
No 646.3461 24.6Yes 1979.622 75.4
Frequency Missing = 491.03155719
WOULD SEEK HELP FROMANOTHER ADULT

8/14/2019 HARRIS COUNTY - Pasadena ISD - 1998 Texas School Survey of Drug and Alcohol Use
http://slidepdf.com/reader/full/harris-county-pasadena-isd-1998-texas-school-survey-of-drug-and-alcohol 207/213
Q36G Frequency Percent________________________________No 990.3253 36.0Yes 1757.401 64.0
Frequency Missing = 369.27350191
WOULD NOT SEEK HELP
Q36H Frequency Percent________________________________No 2085.371 83.4Yes 416.3022 16.6
Frequency Missing = 615.32661151
The frequencies have been weighted so that theanalysis reflects the distribution of students by grade
level in the district
PasadenaSpring 1998
DRUG/ALCOHOL INFO--HEALTH CLASS
Q37A Frequency Percent________________________________No 1235.722 48.5Yes 1313.061 51.5
F Mi i 568 21704784
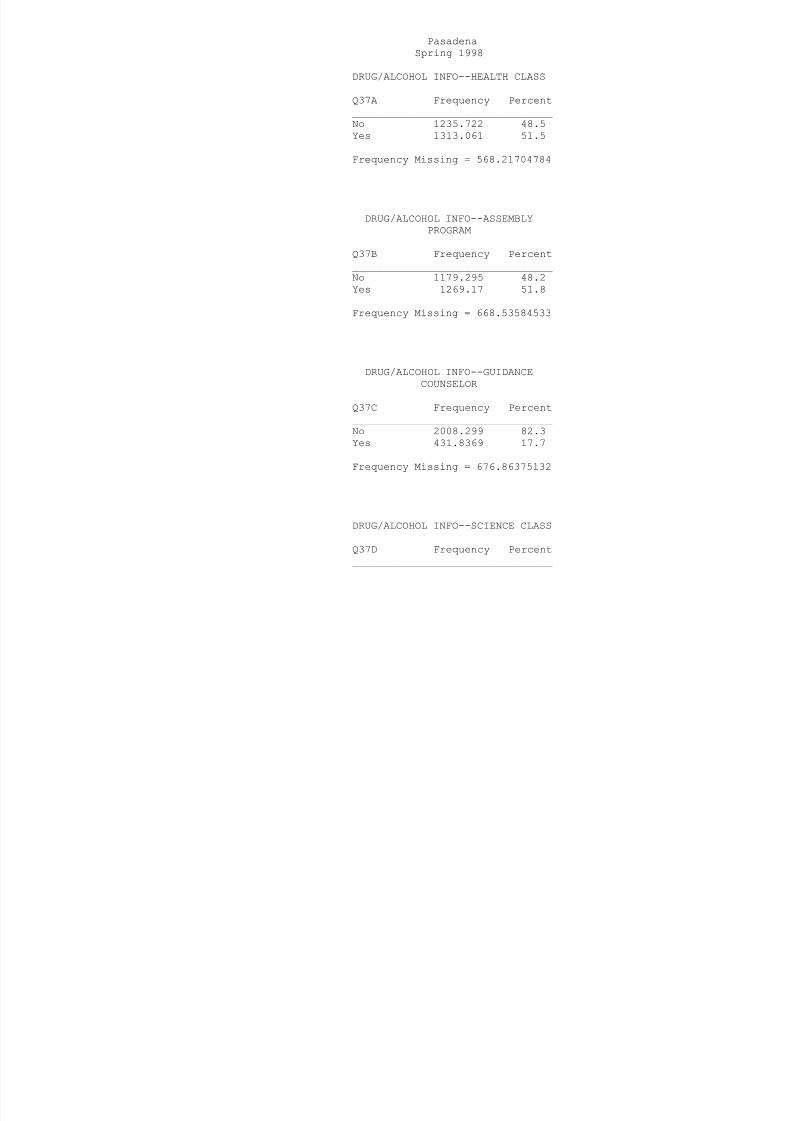
8/14/2019 HARRIS COUNTY - Pasadena ISD - 1998 Texas School Survey of Drug and Alcohol Use
http://slidepdf.com/reader/full/harris-county-pasadena-isd-1998-texas-school-survey-of-drug-and-alcohol 208/213
Frequency Missing = 568.21704784
DRUG/ALCOHOL INFO--ASSEMBLYPROGRAM
Q37B Frequency Percent________________________________No 1179.295 48.2Yes 1269.17 51.8
Frequency Missing = 668.53584533
DRUG/ALCOHOL INFO--GUIDANCECOUNSELOR
Q37C Frequency Percent________________________________No 2008.299 82.3Yes 431.8369 17.7
Frequency Missing = 676.86375132
DRUG/ALCOHOL INFO--SCIENCE CLASS
Q37D Frequency Percent________________________________
No 1444.599 60.2Yes 955.9881 39.8
Frequency Missing = 716.41325139
DRUG/ALCOHOL INFO--SOCIALSTUDIES CLASS

8/14/2019 HARRIS COUNTY - Pasadena ISD - 1998 Texas School Survey of Drug and Alcohol Use
http://slidepdf.com/reader/full/harris-county-pasadena-isd-1998-texas-school-survey-of-drug-and-alcohol 209/213
Q37E Frequency Percent________________________________No 2182.054 90.4Yes 232.2114 9.6
Frequency Missing = 702.7348809
DRUG/ALCOHOL INFO--DRUGRAP SESSION
Q37F Frequency Percent________________________________No 1935.329 82.4Yes 413.8377 17.6
The frequencies have been weighted so that theanalysis reflects the distribution of students by grade
level in the district
PasadenaSpring 1998
Frequency Missing = 767.83349772
DRUG/ALCOHOL INFO--INVITEDSCHOOL GUEST

8/14/2019 HARRIS COUNTY - Pasadena ISD - 1998 Texas School Survey of Drug and Alcohol Use
http://slidepdf.com/reader/full/harris-county-pasadena-isd-1998-texas-school-survey-of-drug-and-alcohol 210/213
Q37G Frequency Percent________________________________No 1322.367 54.9Yes 1087.137 45.1
Frequency Missing = 707.49569726
DRUG/ALCOHOL INFO--OTHERSCHOOL SOURCE
Q37H Frequency Percent________________________________No 1475.84 62.1Yes 899.879 37.9
Frequency Missing = 741.28089291
PARENTS FEEL ABOUT KIDS SMOKING CIGARET
Q38A Frequency Percent_______________________________________Strong disapprove 1861.624 64.8Mild disapprove 415.9243 14.5Neither 292.2032 10.2Mildly approve 48.52527 1.7Strongly approve 23.91163 0.8Don't know 230.2896 8.0
Frequency Missing = 244.52238398
PARENTS FEEL ABOUT KIDS DRINKING BEER
Q38B Frequency Percent_______________________________________Strong disapprove 1602.672 60.1Mild disapprove 468 9609 17 6

8/14/2019 HARRIS COUNTY - Pasadena ISD - 1998 Texas School Survey of Drug and Alcohol Use
http://slidepdf.com/reader/full/harris-county-pasadena-isd-1998-texas-school-survey-of-drug-and-alcohol 211/213
Mild disapprove 468.9609 17.6
Neither 288.1939 10.8Mildly approve 83.15219 3.1Strongly approve 30.48048 1.1Don't know 192.0208 7.2
Frequency Missing = 451.5200346
The frequencies have been weighted so that theanalysis reflects the distribution of students by grade
level in the district
PasadenaSpring 1998
PARENTS FEEL ABOUT KIDS USING MARIJUANA
Q38C Frequency Percent_______________________________________Strong disapprove 2239.826 81.1Mild disapprove 158.4325 5.7Neither 118.0448 4.3Mildly approve 25 80652 0 9

8/14/2019 HARRIS COUNTY - Pasadena ISD - 1998 Texas School Survey of Drug and Alcohol Use
http://slidepdf.com/reader/full/harris-county-pasadena-isd-1998-texas-school-survey-of-drug-and-alcohol 212/213
Mildly approve 25.80652 0.9
Strongly approve 37.17553 1.3Don't know 184.0002 6.7
Frequency Missing = 353.71493954
PURCHASED LOTTERY TICKETIN PAST YEAR
Q39 Frequency Percent
________________________________No 1853.36 63.9Yes 1048.614 36.1
Frequency Missing = 215.02633444
NON-LOTTERY GAMBLINGIN PAST YEAR
Q40 Frequency Percent________________________________No 1696.495 58.3Yes 1215.214 41.7
Frequency Missing = 205.29090435
MONEY SPENT ON GAMBLINGIN PAST YEAR
Q41 Frequency Percent
________________________________$0 1461.081 50.1$1 - $10 742.0139 25.4$11 - $50 441.303 15.1$51 - $100 133.6537 4.6$100+ 140.5166 4.8

8/14/2019 HARRIS COUNTY - Pasadena ISD - 1998 Texas School Survey of Drug and Alcohol Use
http://slidepdf.com/reader/full/harris-county-pasadena-isd-1998-texas-school-survey-of-drug-and-alcohol 213/213
Frequency Missing = 198.43217626
The frequencies have been weighted so that theanalysis reflects the distribution of students by grade
level in the district
Related Documents