1 HARP –Small District’s Perspective Joe Sunday Tehama County APCD Emission Inventory Workshop Air Resources Board March 13, 2006

HARP –Small District’s Perspective
Dec 30, 2015
HARP –Small District’s Perspective. Joe Sunday Tehama County APCD Emission Inventory Workshop Air Resources Board March 13, 2006. TopoZone is useful for getting utm coordinates anywhere in your District. Receptor proximity is important for prioritization. - PowerPoint PPT Presentation
Welcome message from author
This document is posted to help you gain knowledge. Please leave a comment to let me know what you think about it! Share it to your friends and learn new things together.
Transcript
1
HARP –Small District’s Perspective
Joe SundayTehama County APCD
Emission Inventory WorkshopAir Resources Board
March 13, 2006
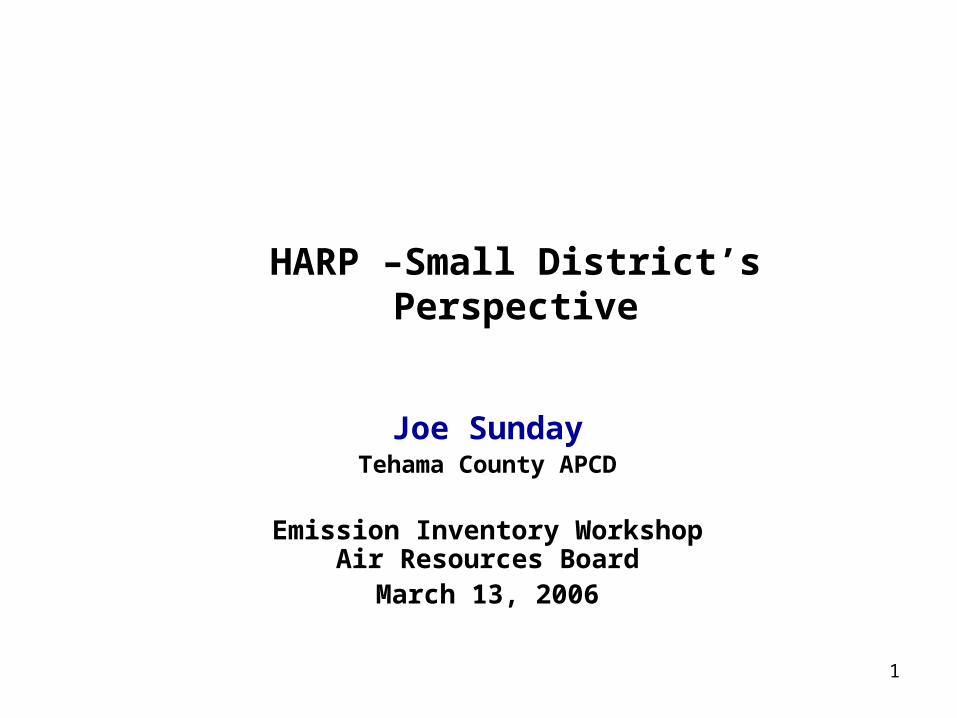
2

3
TopoZone is useful for getting utm coordinates anywhere in your District.

4Receptor proximity is important for prioritization.

5Priority calls attention to need for further risk analysis.
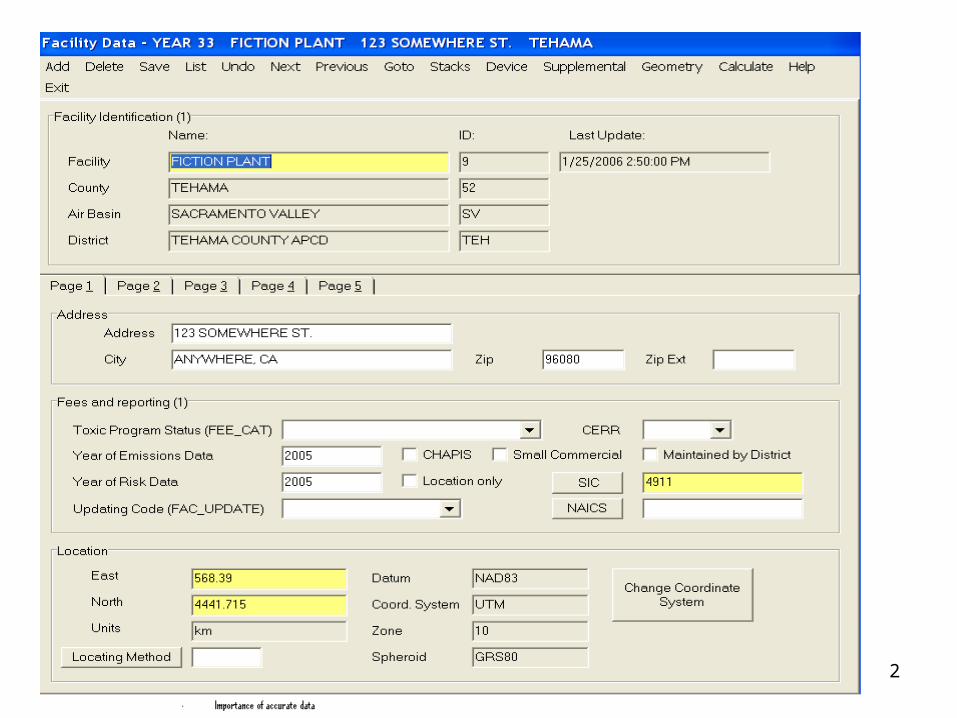
6
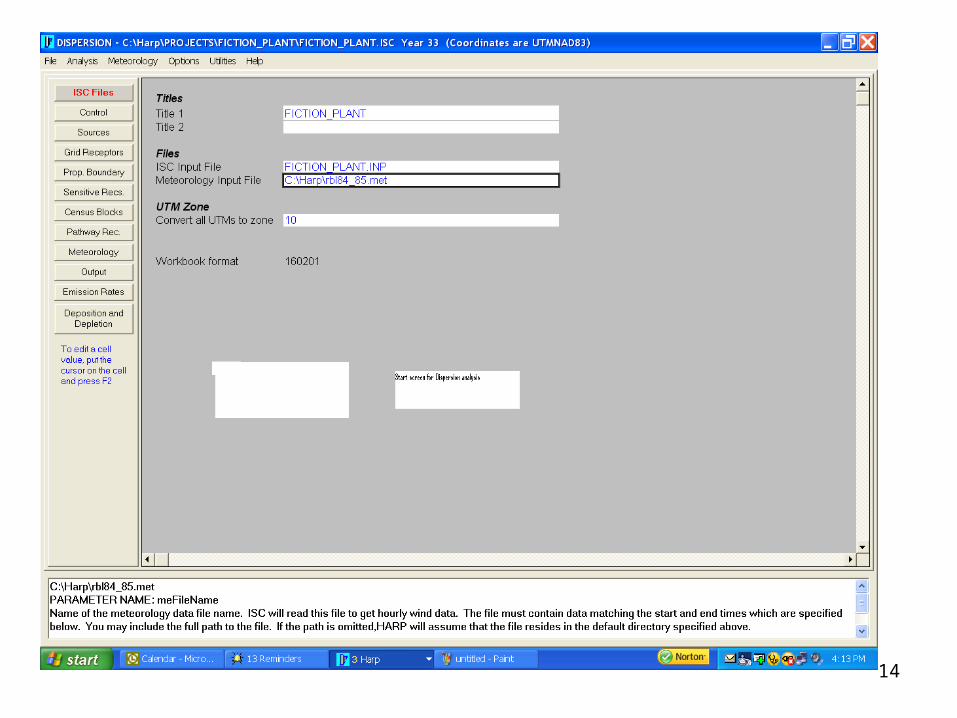
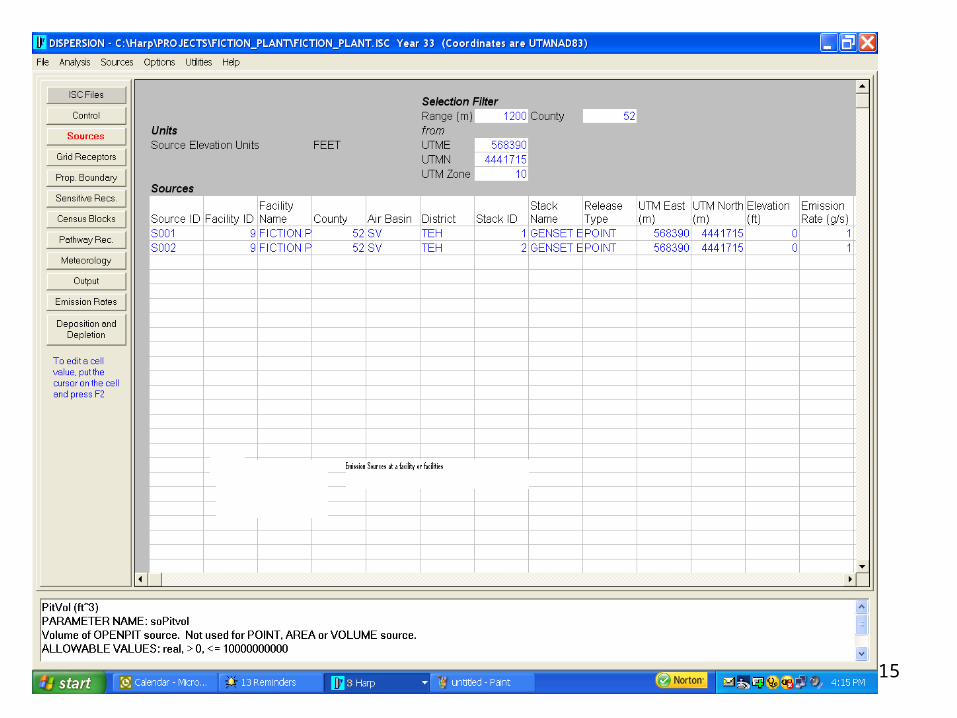
Release height of stack is very important in the dispersion of emissions.

7
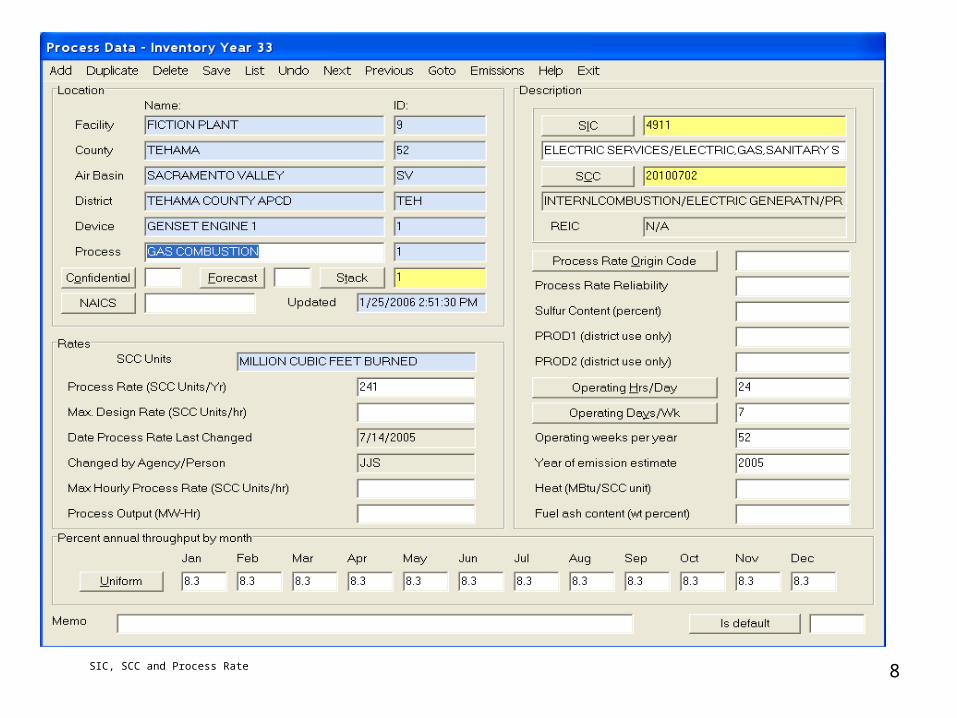
8SIC, SCC and Process Rate
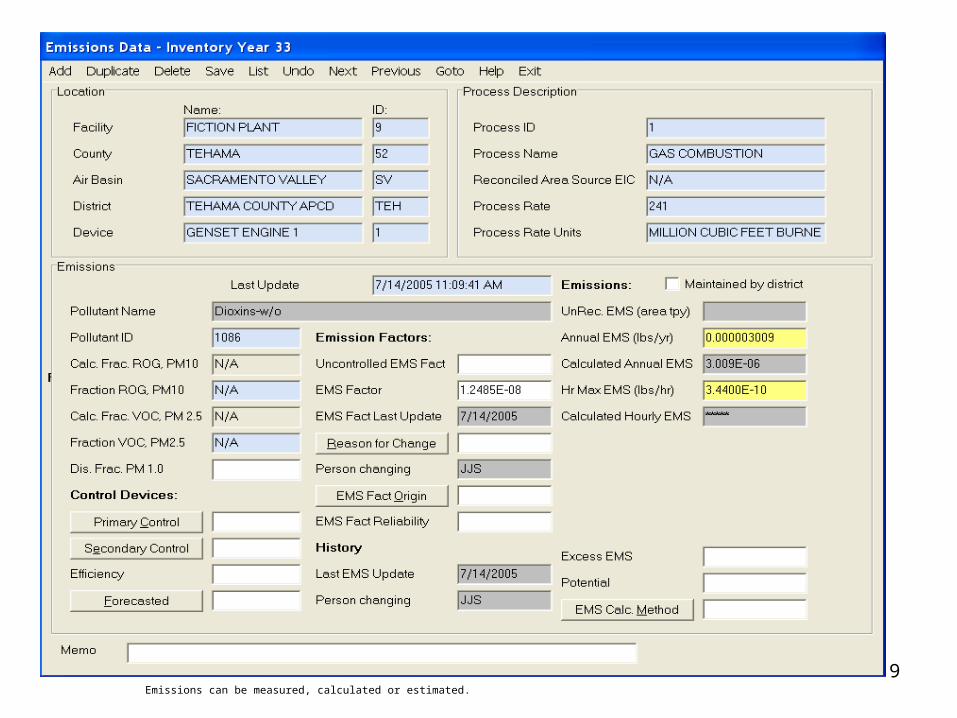
9Emissions can be measured, calculated or estimated.
10
11
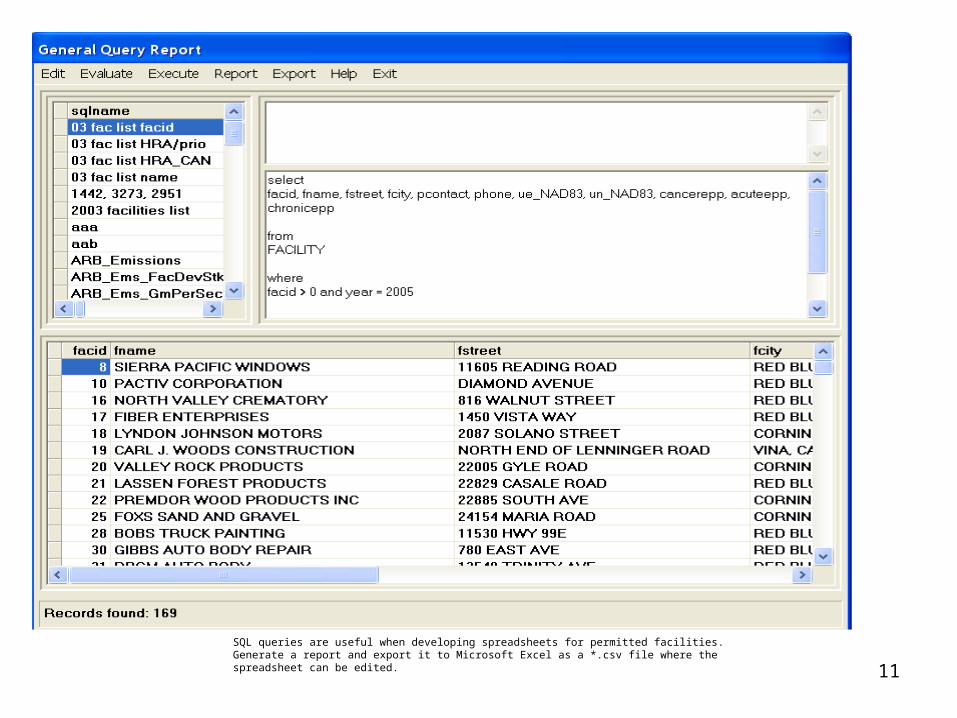
SQL queries are useful when developing spreadsheets for permitted facilities. Generate a report and export it to Microsoft Excel as a *.csv file where the spreadsheet can be edited.
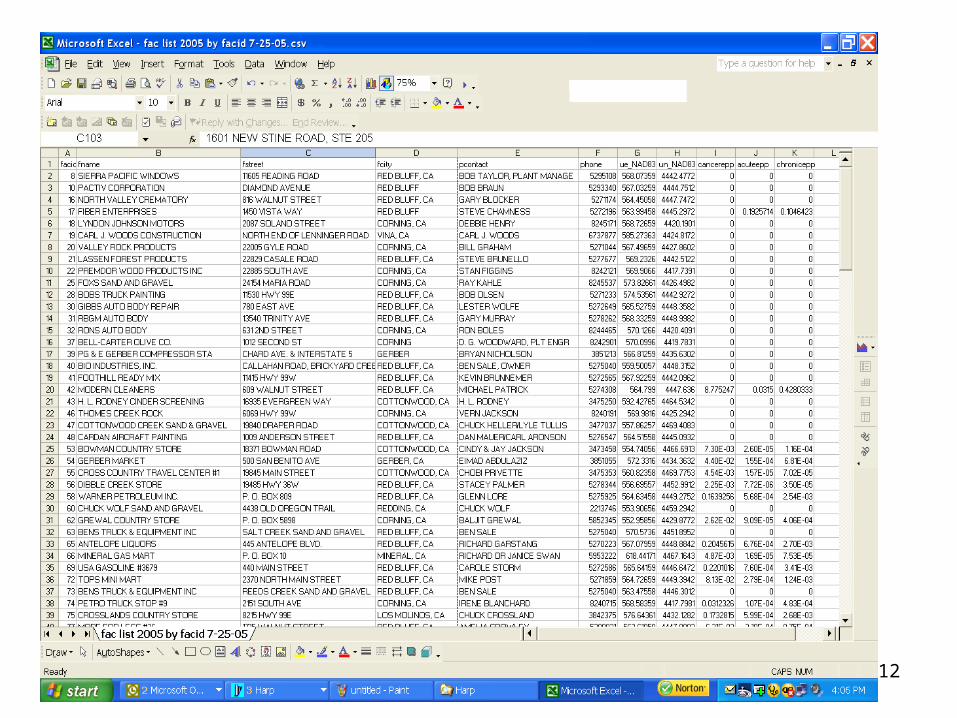
12
13
14
15
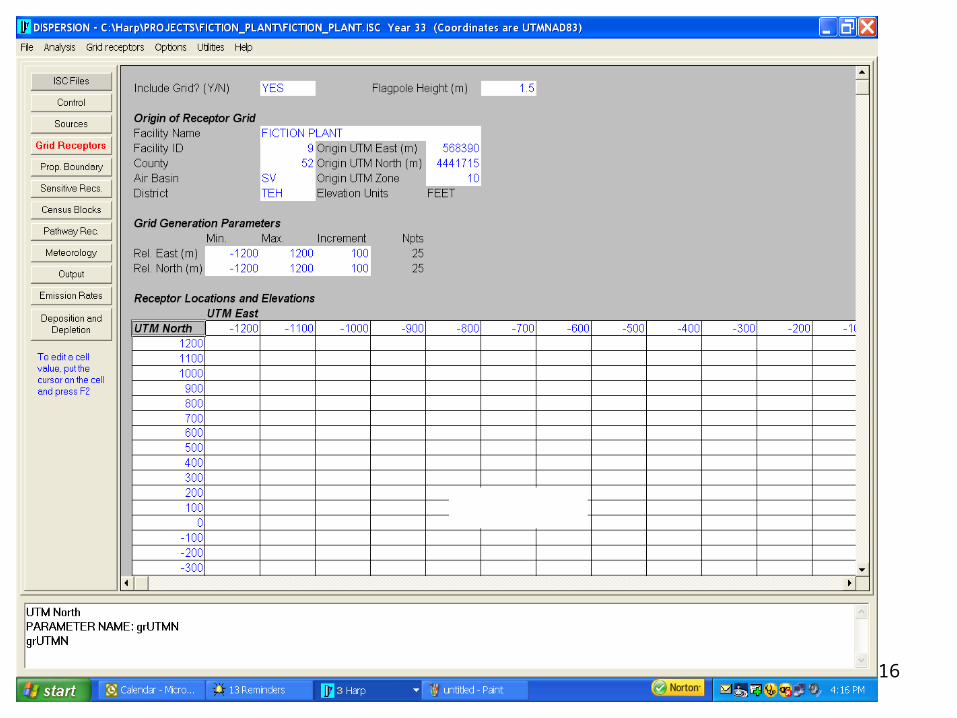
16
17
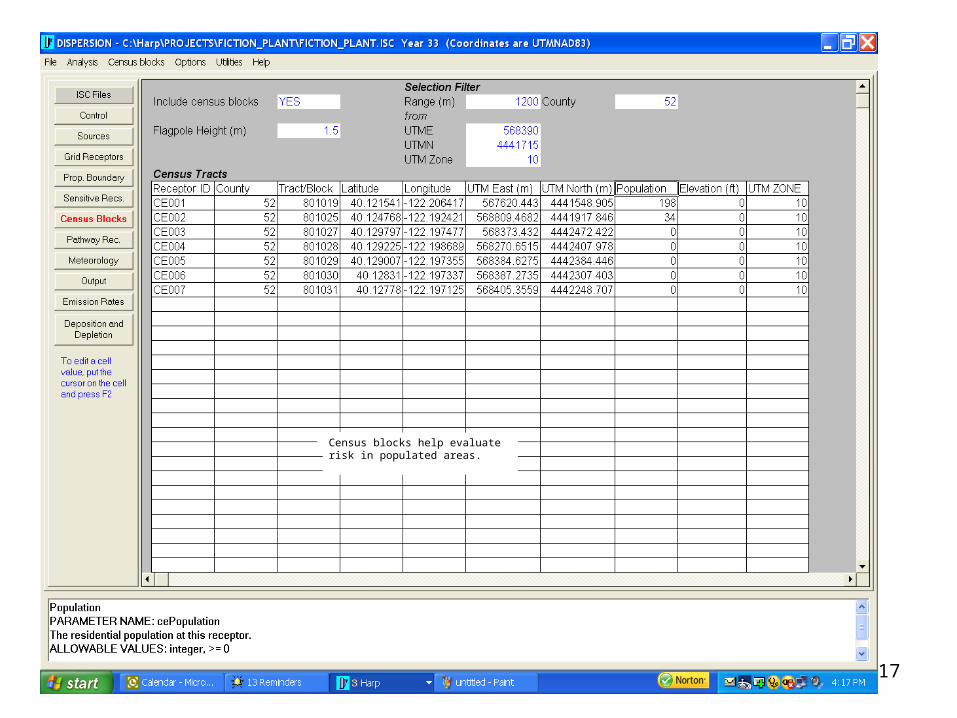
Census blocks help evaluate risk in populated areas.

18
19
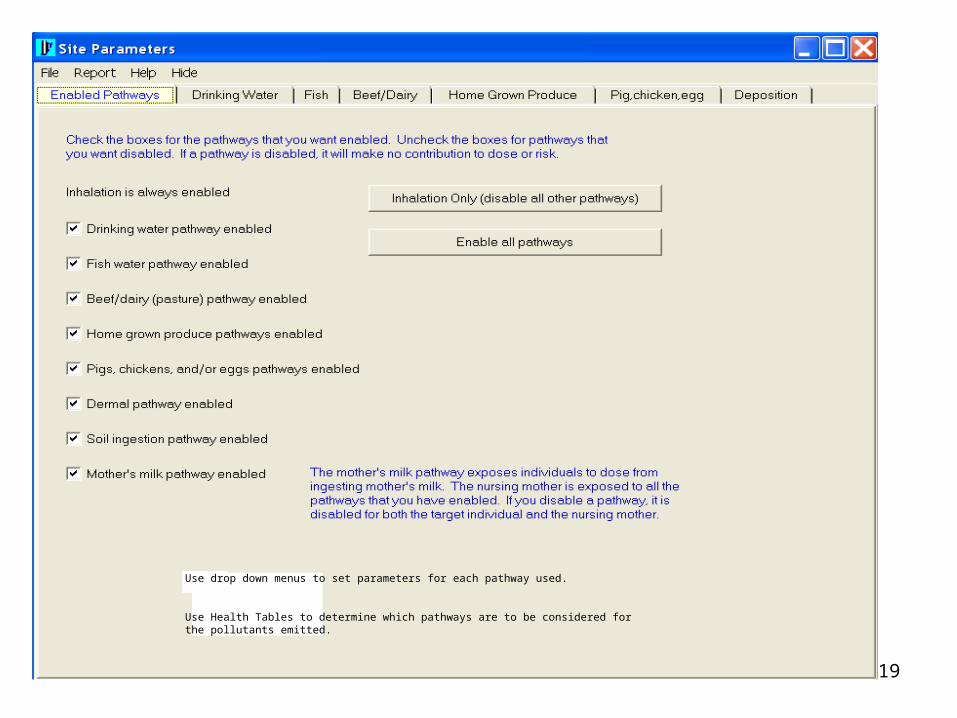
Use drop down menus to set parameters for each pathway used.
Use Health Tables to determine which pathways are to be considered for the pollutants emitted.
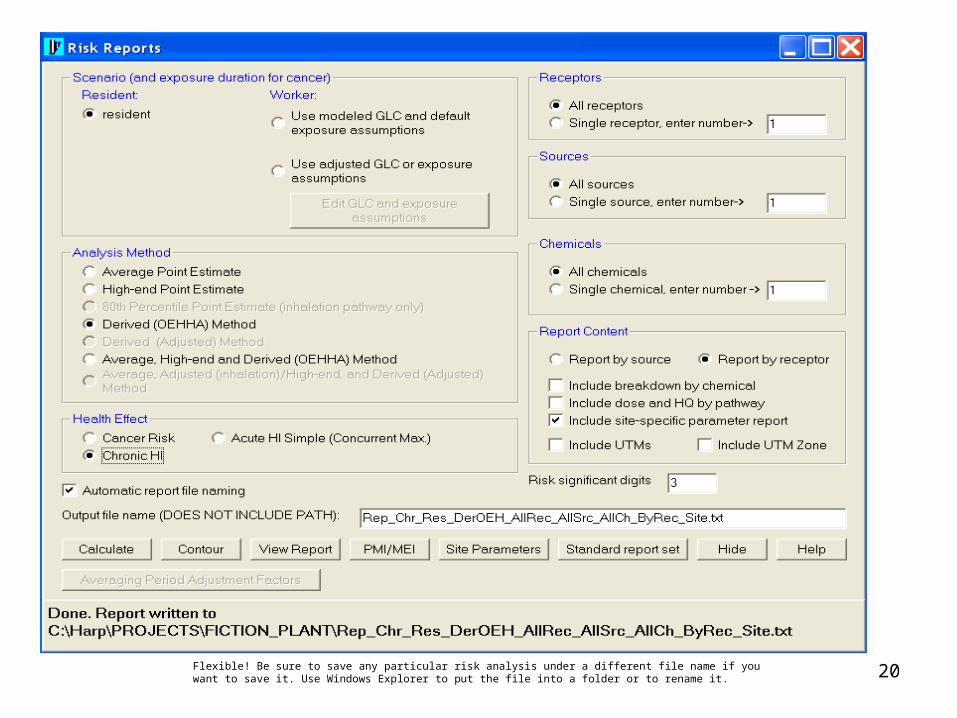
20Flexible! Be sure to save any particular risk analysis under a different file name if you want to save it. Use Windows Explorer to put the file into a folder or to rename it.
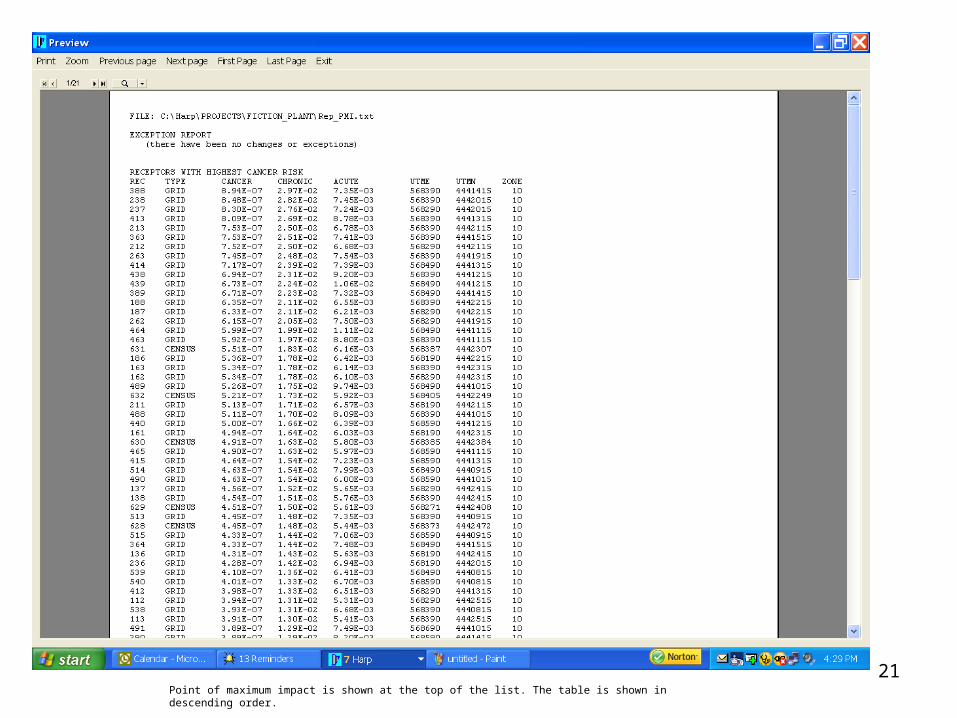
21Point of maximum impact is shown at the top of the list. The table is shown in descending order.
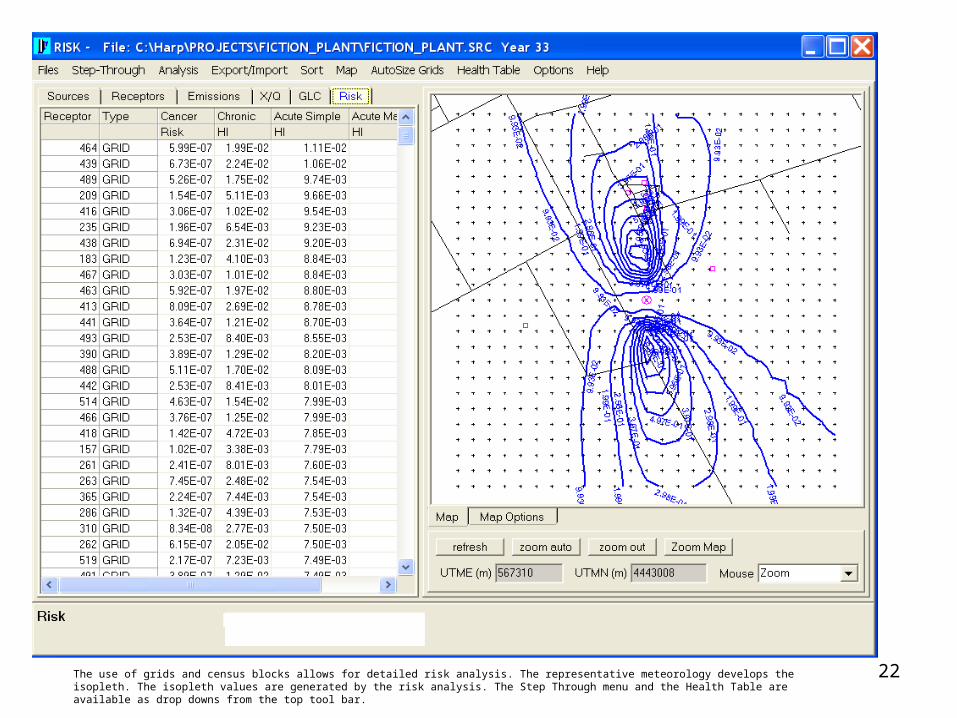
22The use of grids and census blocks allows for detailed risk analysis. The representative meteorology develops the isopleth. The isopleth values are generated by the risk analysis. The Step Through menu and the Health Table are available as drop downs from the top tool bar.
23
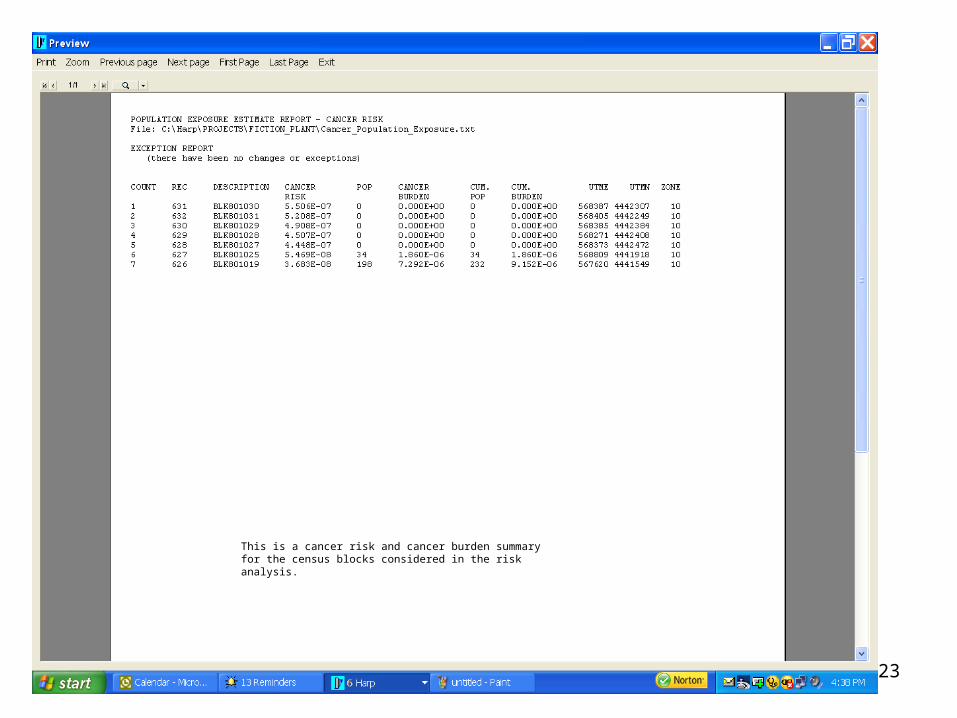
This is a cancer risk and cancer burden summary for the census blocks considered in the risk analysis.

24
25
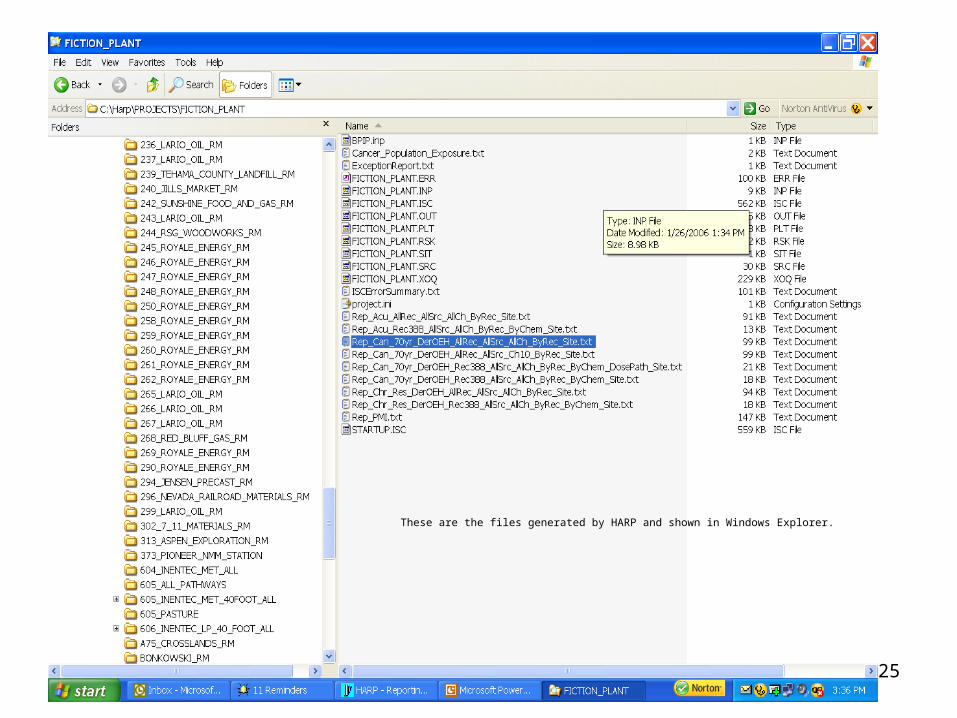
These are the files generated by HARP and shown in Windows Explorer.
26
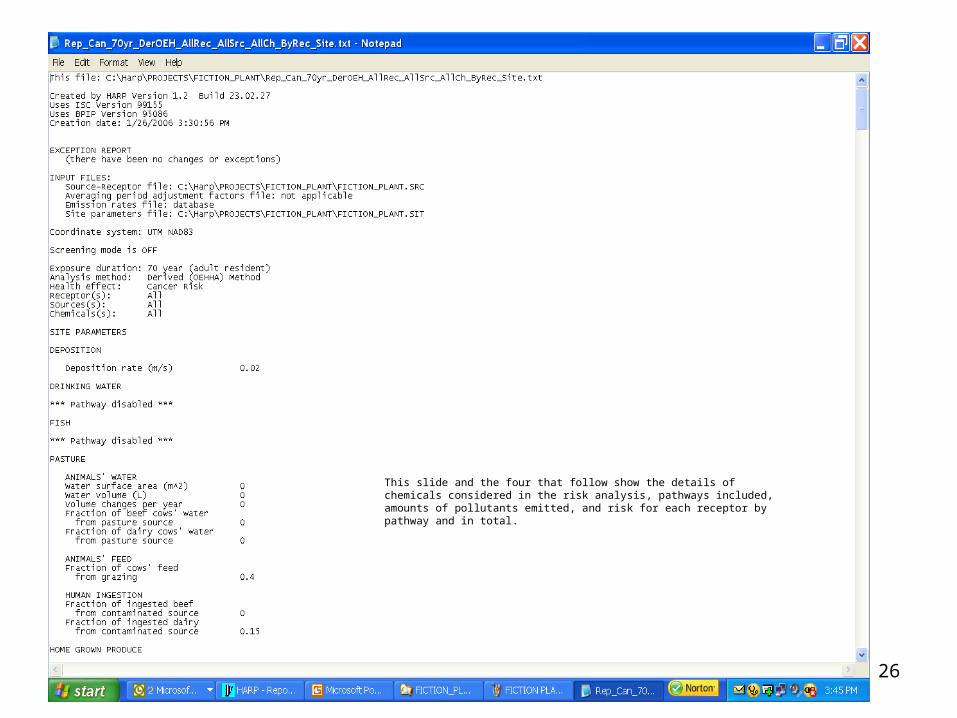
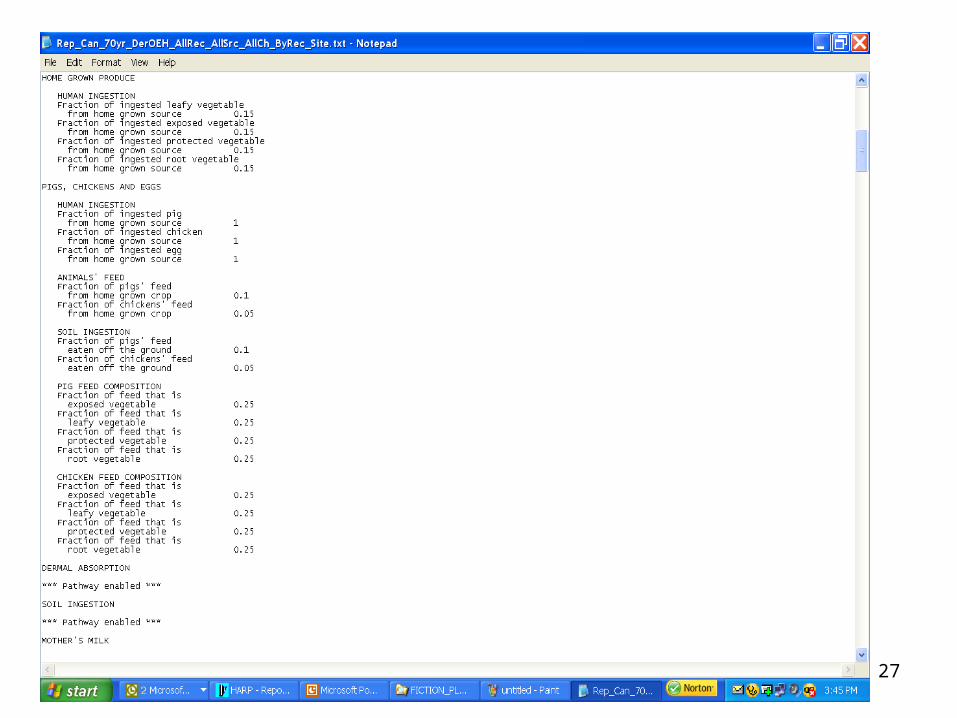
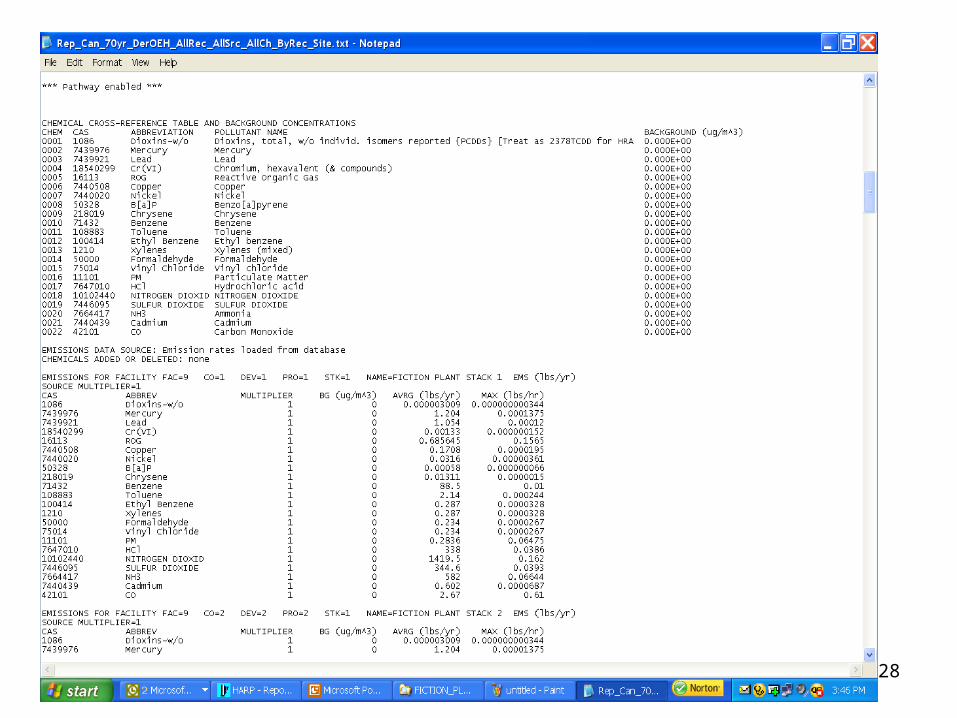
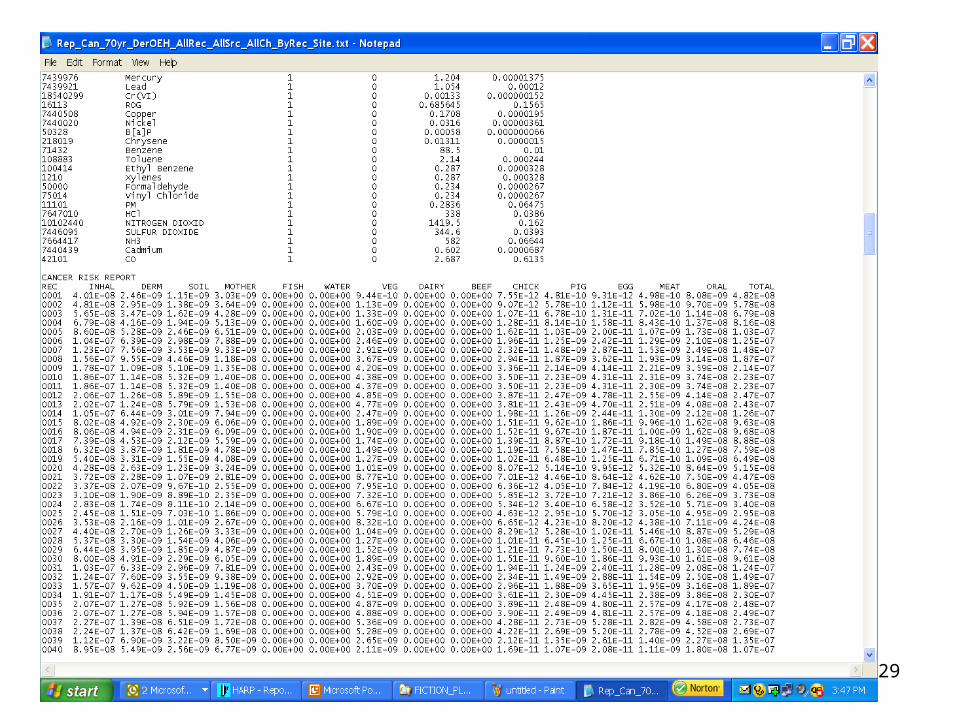
This slide and the four that follow show the details of chemicals considered in the risk analysis, pathways included, amounts of pollutants emitted, and risk for each receptor by pathway and in total.
27
28
29
30
Related Documents