Harnessing Mechanisms of Immune Modulation by Sorafenib to Augment the Efficacy of Cellular Immunotherapy by Melek Michelle Erdinc Sunay A dissertation submitted to Johns Hopkins University in conformity with the requirements for the degree of Doctor of Philosophy Baltimore, Maryland February, 2015 © 2015 Melek Sunay All Rights Reserved

Welcome message from author
This document is posted to help you gain knowledge. Please leave a comment to let me know what you think about it! Share it to your friends and learn new things together.
Transcript
Harnessing Mechanisms of Immune Modulation by Sorafenib to Augment
the Efficacy of Cellular Immunotherapy
by
Melek Michelle Erdinc Sunay
A dissertation submitted to Johns Hopkins University in conformity with the
requirements for the degree of Doctor of Philosophy
Baltimore, Maryland
February, 2015
© 2015 Melek Sunay
All Rights Reserved
ii
Abstract:
The tumor microenvironment is established and maintained through the complex
interactions of tumor cells with host stromal elements. Therefore, therapies that target
multiple cellular components of the tumor may be most effective. Sorafenib, a multi-kinase
inhibitor, alters signaling pathways in tumor cells and host stromal cells. Thus, we explored
the potential immune-modulating effects of Sorafenib in a murine HER-2-(neu)
overexpressing breast tumor model alone and in combination with a HER-2 targeted
granulocyte-macrophage colony-stimulating factor (GM-CSF)-secreting vaccine. In vitro,
Sorafenib inhibited the growth of HER-2 overexpressing NT2.5 tumor cells, inducing
apoptosis. Western blot analysis revealed that Sorafenib interfered with ERK MAPK, p38
MAPK, and STAT3 signaling, but not HER-2 or Akt signaling. It also decreased D-type
cyclin expression. In vivo, single agent Sorafenib disrupted the tumor-associated
vasculature and induced tumor apoptosis, effectively inducing the regression of established
NT2.5 tumors in immune competent FVB/N mice. Immune depletion studies demonstrated
that tumor rejection was mediated by both CD4+ and CD8+ T cells. Sorafenib treatment
enhanced tumor clearance induced by vaccination with a GM-CSF-secreting, HER-2-
expressing cellular vaccine in tumor-bearing FVB/N mice relative to either drug treatment
or vaccination alone. Although the magnitude of the peripheral antigen-specific T cell
response was unchanged, Sorafenib appeared to enhance antigen-specific T cell
accumulation at the tumor site. Overall, these findings suggest that dendritic cell-based
immunotherapy can be integrated with Sorafenib, resulting in enhanced therapeutic
response

iii
Acknowledgements:
This thesis is dedicated to the memory of my mother, Mary Agnes Erdinc and my
grandfather, Robert Anthony Kaschenbach. They have been and always will be my heroes
and my inspiration.
I believe that much like what is said about raising children, “it takes a village” to
“raise” a graduate student. There are many people who have played important role in my
journey through graduate school. First and foremost, I would like to thank my husband,
Cagatay Sunay, for his unending love and support throughout my graduate career.
Secondly, I would like to thank Dr. Leisha Emens, my thesis advisor and mentor, for all of
her guidance in science and otherwise. Her leadership has fostered my transformation from
a student into a scientist. She has been especially patient not only with my scientific
development, but also with the many obstacles in my personal life that inevitably trickled
into the lab throughout the years. I would like to thank all the Emens’ lab members, past
and present, for their scientific, technical, and moral support in conducting the experiments
necessary to complete my thesis, especially James Leatherman. I am grateful to my
program director, Dr. Noel Rose, for his excellent leadership and support in my training,
and for his help in reading my thesis. I would like to acknowledge all the Pathobiology
program members, my fellow students in training; it has been a pleasure to take this journey
together. I would also like to thank Dr. Allan Scott and Dr. Ivan Borrello for their support
as members of my thesis committee. I would like to also thank Dr. Charles G. Drake for
reading my thesis.
I am especially thankful to Anne Macgregor for her friendship throughout the
years. I would like to thank all of the new friends and mentors, especially Dr. Todd

iv
Armstrong that I have made on the 4th floor of CRB I, some of my greatest ideas came from
just sitting around and talking science. Last but certainly not least, I would like to thank
my family for their support in my education. My success is a mere reflection of their
support- I could not have done it without them.
v
Table of Contents
Abstract………………………………..…………………………………………………..ii
Acknowledgements…………….……..………………………………………………….iii
(Table of Contents)……………………………………………………………………….iv
List of Figures……………………………………………………………………………..v
Chapter 1: Introduction………………………………..…………………………………..1
Chapter 2: Characterizing the Mechanism of Therapeutic Activity of Sorafenib in HER2+
Breast Cancer in FVB/N mice…………………… .....…………………………………29
Chapter 3: The Immunomodulatory Effect of Sorafenib on T cells……………………..58
Chapter 4: The Immunomodulatory Effect of Sorafenib on Tumor-associated
Macrophages…………………… .....…………………………………………………...87
Chapter 5: Sorafenib Can Be Effective Combined with Cellular Immunotherapy……111
CURRICULUM VITAE………………………………………………………...........132
vi
List of Figures:
Figure 1– Sorafenib Inhibits growth of HER2-overexpressing cells in vitro……………40
Figure 2 – Sorafenib inhibits growth of breast cancer cells in vivo.…………...………...43
Figure 3 – T cells are required for Sorafenib targeting of NT2.5 cells.………….............46
Figure 4 – Sorafenib inhibits antigen specific T cell proliferation and cytokine production
in vitro…………………………………….……………………………………..……….69
Figure 5- Sorafenib inhibits cytokine production of Th1-skewed cell in vitro….…...…..72
Figure 6 – Sorafenib alters the proliferation, activation, and function of Tregs in vitro
.………………………………………………………………………………...…………74
Figure 7 – Sorafenib does not alter tumor-infiltrating T cell number or cytokine
production in vivo……………………………………………...………………………...78
Figure 8: Schema for Macrophages isolation from FVB/N tumors..……………..……...98
Figure 9: Sorafenib treatment increased F480+ cells in the tumor and alters TAM
morphology……………………………………………………………………………..100
Figure 10: Sorafenib treatment enhances M1 cytokine expression in TAMs………….102
Figure 11: TAMs from Sorafenib treated tumors enhance CD4+ T cell proliferation
…………………………………………………………………………………………..104
Figure 12: Sorafenib can be effectively combined with vaccine in FVB/N mice….......121
Figure 13: Sorafenib does not impede immune cell infiltration into the tumor...………123
Figure 14: Sorafenib increases HER-2-specific T cells in the tumor…………………..125

1
Chapter 1: Introduction
HER2
The human epidermal growth factor receptor 2 (HER2, also known as c-erbB-2, or
HER2/neu) is a member of HER family of transmembrane receptor tyrosine kinases. The
HER family is comprised of four homologous epidermal growth factor receptors:
HER1(EGFR/erb1), HER2 (erb2), HER3 (erb3), and HER4 (erb4). These receptors are
involved in regulating cell growth, differentiation, and survival through signaling via
PI3K/Akt and Ras/Raf/MEK/MAPK pathways1, 2. While there are many ligands that have
been identified that can activate individual HER receptors, no ligand has yet been identified
for HER2. Upon ligand binding, HER receptors form homodimers and heterodimers with
other members of the HER family, of which HER2 is the preferential dimerization partner.
The heterodimerization between HER2 and the other HER receptors in the family allow its
participation in signal transduction in the absence of a ligand. Heterodimers involving
HER2 seem to show particularly high signaling potency compared to other dimerization
combinations within the HER2 family3.
In vitro and animal studies have indicated that HER2 gene amplification and protein
overexpression plays an essential role in oncogenic transformation, tumorigenesis, and
metastasis4-6. Normal epithelial cells possess two copies of the HER2 gene and expresses
low levels of HER2 protein on the cell surface. With oncogenic transformation, HER2
gene amplification generates more than two gene copies and increased mRNA
transcription, which results in 10-100 fold increases in HER2 homodimer formation on the
cell surface. Therefore, overexpression of the HER2 protein leads to constitutive activation
2
of downstream signaling pathways, which ultimately results in oncogenic transformation
of cells to cause cancer7.
HER2+ breast cancer
Breast cancer is currently the most common cancer in women and is leading cause of cancer
death in women in Western countries after lung cancer. Amplification of the HER2 gene
in addition to overexpression at the messenger RNA or protein levels occur in about 20%
of invasive breast cancers and corresponds to more aggressive disease and poor prognosis8.
HER2 status has been shown to be a predictive marker of therapeutic response to HER2-
targeted therapy9. Also, the accessibility of HER2 on the cell surface makes it a druggable
target.
HER2-targeted treatments
Standard therapy for breast cancer includes surgery, radiation therapy, chemotherapy and
endocrine therapy10. Optimal integration of these therapies has led to improvements in
clinical outcome for breast cancer patients. More recently, some targeted therapies have
improved overall survival for those women affected with metastatic disease. In this
category, HER2+ breast cancer patients have seen small overall survival benefit with the
development and FDA-approval of therapies available that target HER2. Trastuzumab
(Herceptin) is a HER2-specific monoclonal antibody that binds to the extracellular domain
of the HER2 protein. Lapatinib (Tykerb) is a dual HER2/EGFR1 tyrosine kinase inhibitor.
Pertuzumab (Perjeta) is a monoclonal antibody that binds to the surface HER2 and works
by inhibiting receptor dimerization and downstream signaling potential. Trastuzumab

3
emtansine (T-DMI, Kadcyla) is the HER2-specific monoclonal antibody, Trastuzumab,
conjugated to cytotoxic molecules11.
The development of these new therapies has improved clinical outcome for patients with
HER2-positive breast cancer. However, relapse still occurs with current therapies,
reflecting acquired resistance in some patients. Additionally, patients with metastatic
cancer still eventually progress in their disease and metastatic breast cancer remains
incurable. The limitations of current therapies lie in the common toxicities of treatments
to both malignant and normal tissues and the occurrence of relapse due to outgrowth of
resistant cancer cells. Therefore, the ability to successfully combat the disease will rely
heavily on the development of unique targeted therapies with distinct mechanisms of action
that preferably impact malignant tissue.
Immunotherapy for Cancer Treatment
Immunotherapy provides an attractive option to overcome these distinct resistance
mechanisms through the utilization the patient’s own immune system to combat their
disease. Additionally, immunotherapy allows a mechanism for targeting the malignant
cells specifically while leaving normal cells unharmed. Using immunotherapy as a means
of treating cancer dates back to 1891, when William B. Coley found that killed bacteria
injected into bone sarcoma resulted in reduced tumor size. Similar crude bacterial
mixtures, called “Coley’s toxins,” were used to treat a variety of different cancers from
1893 to 1963 with varying clinical benefit 12. Further data to support immunotherapy came
from clinical trials carried out in the 1980’s in metastatic melanoma and renal cell
carcinoma. In these trials, patients were treated with interleukin-2 (IL-2). Uniquely, it was
4
known that IL-2 would have no direct cytotoxic effects on the tumor. Instead it was used
specifically to stimulate the proliferation of cytotoxic T cells (CTLs) 13. In these studies
15% of patients showed response and about half of the responsive patients were cured of
their disease. This led to the approval of IL-2 by the FDA in the 1990’s as the first
immunotherapy to treat cancer. More recently, immunotherapy has gained momentum
with the FDA approval of sipuleucel-T (Provenge), a dendritic cell based vaccine, for the
treatment of prostate cancer; and ipilimumab (Yervoy), a monoclonal antibody against
cytotoxic T lymphocyte antigen-4 (CTLA-4), and Prembrolizumab (Kaytruda), a
monoclonal antibody specific for PD-1 (programmed cell death-1). These two monoclonal
antibodies are approved for the treatment of metastatic melanoma 14,15.
Currently, there is little doubt of immune system’s role both in cancer development and
successful disease eradication. As we have gained a deeper understanding of the complex
molecular and cellular mechanisms that comprise the immune system, we have
subsequently enhanced the development of new therapies to induce and manipulate the
anti-tumor immune response. One of these immunotherapeutic approaches has been cancer
vaccines.
Cancer Vaccines
Successful therapeutic cancer vaccines will result in both primary activation of the immune
system to recognize and attack cancer cells within the host, and the development of
secondary immunological memory that prevents reoccurrence. In order to accomplish this,
cancer vaccines consist of an immunogenic tumor antigen to stimulate the activation of
5
helper T cells and CTLs that can recognize tumor cells and initiate tumor cell destruction
mechanisms16.
Because it remains unclear what the most potent tumor antigens are, one approach has been
to use whole cells for vaccination. Early generation cancer vaccines took the form of killed
tumor cells or tumor cell lysates mixed with bacteria adjuvants in an attempt to amplify
anti-tumor immunity17, 18. Next generation vaccines replaced the crude bacteria-lysate
mixtures with genetically modified tumor vaccines. In the 1960’s, Lindermann and Klien
were able to show that tumor cells infected with influenza virus were able to generate
enhanced tumor cell immunogenicity19. Cells have also been transduced with viral genes
or allogeneic MHC genes in an attempt to enhance systemic immune responses 20, 21.
Another class of genetically modified cell-based vaccines takes advantage of the ability of
cytokines and co-stimulatory molecules constitutively expressed on the vaccine cells to
activate local inflammatory response, sparing systemic toxicity. Specifically, granulocyte-
macrophage colony stimulating factor (GM-CSF) has been shown to be most potent in its
ability to modify tumor immunogenicity22.
The activity of GM-CSF modified vaccines lies in their effectiveness at promoting the
activation and maturation of dendritic cells (DCs) at the vaccine site. DCs are central to
activation of naïve T cells in peripheral lymphoid tissues to mount a successful immune
response. A large number of clinical trials in a variety of cancers have proven the efficacy
of GM-CSF transduced vaccines to boost patient’s anti-tumor immune responses23-26 .
These trials also pointed to an important role of conventional therapies, such as
chemotherapy, to have an effect on vaccine-induced immune responses. This was clearly
demonstrated in patients with metastatic breast cancer, where GM-CSF-secreting whole

6
cell vaccination in the presence of immune-modulating doses of cyclophosphamide and
doxorubicin enhanced HER2-specific antibodies and HER2-specific DTH responses27 .
In order to effectively implement cancer vaccines in the clinic, it is necessary to have a
basic understanding of the anti-tumor immune response and the subsequent dysregulation
that can occur in cancer patients. Successful cancer vaccination therapies must reprogram
the immune response to actively target cancer cells and simultaneously relieve suppressive
mechanisms that can hinder productive anti-tumor immune responses.
The anti-tumor immune response- T cell activation and Antigen Presenting Cells
The immune response mounted against a tumor relies on both the innate and adaptive arms
of the immune system. Cells in the innate immune system are not antigen specific. Instead,
innate immune cells actively survey the host and recognize cell-surface stress-associated
and danger-associated molecular patterns. For example, natural killer (NK) cells can
recognize “non-self” or “stressed self” cells in the host28. Additionally, antigen presenting
cells (APCs), such as DCs present in the periphery, can recognize danger signals through
interaction of cell surface receptors. These danger signals include: Toll receptor or NOD-
like receptors (NLRs) ligation; retinoic acid-inducible gene 1 (RIG1) sensing of RNA; or
stimulator of interferon genes (STING) pathway activation as a result of cytosolic DNA
recognition 29, 30. Upon activation, DCs undergo maturation to upregulate co-stimulatory
molecules and act as messengers to relay the danger signals to secondary lymphoid tissues
where they stimulate the activation of the adaptive arm of the immune response.
The adaptive immune response, unlike innate immunity, is antigen specific. There are two
arms to adaptive immune responses, humoral immunity and cell-mediated immunity. The

7
humoral response is dependent on B cells and ultimately leads to the production of
antibodies. Cell-mediated immune responses depend on T cells. Whereas B cells only
respond to intact antigen and thus recognize extracellular antigenic epitopes to mount a
response, T cells are able to respond to both extracellular and intracellular proteins. T cell-
mediated immune responses require multiple steps including: the clonal selection of
antigen-specific cells, activation and proliferation of the selected cells in secondary
lymphoid tissues, subsequent trafficking to the tumor site, and lastly, the ability to execute
their specific effector functions once within the tumor31.
There are two major functionally different types of T cells defined by the cell surface
expression of distinct co-receptors proteins: CD4+ helper T cells and CD8+ cytotoxic T
cells. As their name implies, cytotoxic CD8+ T cells are able to kill target cells directly
whereas CD4+ helper T cells activate APCs and provide “help” to enhance CD8+ T cell
activation. CD4+ T cells also provide help to B cells to stimulate antibody production. A
major differentiating factor between CD4+ and CD8+ T cells is the context by which their
T cell receptors recognize and bind to antigenic peptides on histocompatibility complex
(MHC) molecules. There are two types of MHC molecules, MHC class I and MHC class
II, which differ in their structure and expression levels within the body. MHC class I
molecules are expressed on all nucleated cells in the body and present intracellular peptides
to CD8+ T cells. The proteasome pathway within the cell processes proteins and cleaves
them into peptide fragments ranging between 8-12 amino acids in length. These peptide
fragments are loaded on the MHC class I molecules for presentation to CD8+ T cells32, 33.
MHC class II molecules are expressed only on a specialized subset of APCs, including B
cells, DCs, and macrophages. APCs take up exogenous proteins (or extracellular microbes)
8
and process these proteins through the lysosomal degradation pathway. This pathway
results in protein processing into peptides ranging from 10-25 amino acids in length 32, 34.
These peptides are loaded onto MHC class II molecules and presented on the surface of
APCs to activate CD4+ T helper cells.
During development, T cells undergo a selection process in the thymus. Positive selection,
also known as MHC restriction, ensures only those T cells expressing T cell receptors
(TCRs) that recognize and bind self-MHC molecules are allowed to survive. Thymic
stromal cells are responsible for mediating positive selection. CD4+ or CD8+ cell fate is
determined by the specificity of the TCR to recognize and bind invariant sites on either
MHC class I or MHC class II 35, as binding of both the TCR and a single co-receptor is
necessary to promote T cell survival. The cellular signals that promote one cell lineage
over the other seems to depend, at least in part, through differential leukocyte-specific
tyrosine kinase (Lck) signals upon engagement of the TCR receptor with either co-receptor.
Additionally, T cells also undergo negative selection which eliminates T cells with very
high avidity for self-MHC/peptide complexes. The process of negative selection is
mediated primarily by APCs in the thymus, such as DCs and macrophages. T cells that
react too strongly with self-antigen are induced to die by apoptosis. Under normal
circumstances, this prevents the maturation of T cells that would attack the host’s own
cells, thereby avoiding autoimmunity35.
T cells that have survived selection in the thymus are then carried in the blood to peripheral
lymphoid tissues to interact with their specific antigens and undergo proliferation. T cells
require two signals for activation. Signal 1 is the result of the interaction of an antigenic
9
peptide with the TCR-CD3 complex36. The CD3 complex is associated with the TCR and
is required for proper TCR expression and signal transduction upon activation. The CD3
complex is composed of the molecules CD3CD3andCD3δ in addition to a chain,
which is a disulfide-linked homodimer37. Antigen recognition in the context of
peptide:MHC initiates tyrosine phosphorylation of immune-receptor tyrosine–based
activation motifs (ITAMs) on the intracellular regions of the CD3 complex and the chain
by the Src kinase LcK38. These phosphorylated ITAMs provide a docking point for the
recruitment of Syk family kinase, Zeta-activated protein 70kDa (Zap70). Zap70 then
phosphorylates the protein linker for the activation of T cells (LAT), recruiting Slp76,
which complexes with LAT proteins after phosphorylation by Zap70 39. This LAT-Slp76
interaction provides a docking site for several signaling effectors through binding to the
phosphotyrosine binding sites. One of these effectors, phospholipase Ctransduces
signals resulting in activation of Ras and mitogen-activating protein kinase (MAPK) as
well as the influx of calcium into the cytosol. This signaling results in the activation of
transcription factors Fos and Jun that form the AP-1 complex, the translocation of nuclear
factor of activated T cells (NFAT), and nuclear factor-NF-These three factors act
together to activate the transcription of interleukin-2 (IL-2) gene40.
Engagement of the TCR-CD3 complex alone is insufficient for T cell activation. A second
signal is required to achieve optimal T cell activation and proliferation. The principal
“second signal” is provided by interactions between the CD28 molecule on T cells and B7
proteins on APCs41. Ligands for B7 are CD28 and CTLA-4 (CD 152), which act
antagonistically with each other. Signaling through CD28 and B7 leads to the
phosphorylation of Src-family resulting in the recruitment of several downstream proteins,
10
including Grb2, Vav, and ITK that ultimately augment IL-2 production and activate T cell
proliferation. Conversely, engagement of CTLA-4 attenuates T cell proliferation signals40.
T cell tolerance
T cell tolerance, which is the ability of the immune cells to differentiate self from non-self,
is the foundation of a healthy functioning immune response. As mentioned previously, this
prevents reacting to self-antigens and resulting autoimmunity. However, these self-
protective mechanisms also provide the biggest challenge for successful cancer vaccines.
As tumors arise from altered “self” cells; an inadequate immune response to “self” permits
tumor growth. Therefore, successful vaccination requires breaking immune tolerance to
recognize and attack host tumor cells.
T cell tolerance is maintained at two levels, central and peripheral tolerance. Central
tolerance occurs by deletion of self- reactive T cells in the thymus. As described earlier,
thymocytes expressing TCRs that have high-avidity for self-peptide-MHC are induced to
undergo apoptosis, thus preventing potentially self-reactive T cells from entering the
circulation 42. As all potential self-antigens are not expressed in the thymus, peripheral
tolerance mechanisms come into play to inhibit circulating self-reactive T cells. Three
major mechanisms of peripheral tolerance include: deletion, ignorance, and anergy.
Deletion of self-reactive T cells in the periphery occurs by a mechanism similar to that in
the thymus- induction of apoptosis. Both Bim signaling and Fas-mediated death receptor
signaling cooperate in tandem to ensure killing of T cells that respond too strongly to self-
antigens in the circulation. Fas (CD95) is a death-domain-containing receptor that is
activated by binding to its corresponding ligand FasL (CD95L). The activation of the Fas
11
receptor on T cells by cells containing FasL, induce both the up-regulation of FasL on T
cells themselves as well as that activation of an intracellular death-inducing signaling
complex (DISC). DISC activates caspases to promote apoptosis by activation-induced cell
death 43,44. Concurrently, Bim activates Bax/Bak, which causes mitochondrial
permeabilization to induce apoptosis45.
Ignorance occurs as a result of low level antigen expression or antigen sequestration, which
results in T cells that remain naïve due to lack of antigen exposure46. T cell activation in
the absence of a second signal results in hyporesponsiveness, termed “anergy.” Anergy
results in repression of TCR signaling and decreased IL-2 expression42. Additionally,
inhibitory signaling molecules can be engaged as a second signal on T cells. One such
example is programmed cell death 1 (PD-1) and its ligands PD-L1 and PD-L2. PD-1
association with its ligand results in PD-1 ligation with the TCR. This ligation activates
phosphatases that attenuate T cell proliferation pathways 47. In this way, PD-1 interactions
can limit the expansion of self-reactive T cells. PD-1 signaling can be manipulated by the
tumor to prevent expansion of tumor-reactive T cells as well 48.
Regulatory T cells
CD4+ T regulatory cells (Tregs) are produced in the thymus, forming a functionally distinct
T-cell subpopulation in the periphery. A distinguishing feature of Tregs is their expression
of the transcription factor, forkhead box p3 (FoxP3)49. FoxP3 controls the expression of
several characteristic genes for cell surface molecules, such as the alpha chain of the IL-2
receptor, CD25, glucocorticoid-induced tumor necrosis factor (TNF) receptor (GITR)
family regulated gene and CTLA-4, which are also highly expressed in conventional T

12
cells after TCR stimulation50,51. FoxP3 inhibits TCR-activation-dependent production of
effector cytokines including IL-2 and IFN-γ. As possible mechanisms of suppression, it
has been shown that FoxP3+ Tregs exert suppression by cell-to-cell contact with APCs,
such as DCs. FoxP3+ Tregs are also able to secrete immunosuppressive cytokines such as
interleukin 10 (IL-10), transforming growth factor β (TGF-β) and interleukin 35 (IL-35)52.
In this way, Tregs are capable of suppressing a wide variety of immune responses against
self-antigens, including tumor antigens.
Immune System Evasion- Immunoregulatory Components of the Tumor
Microenvironment
The host antitumor immune response can sculpt tumor growth, invasion, and metastasis in
a variety of ways. The prevention of immune cell access into the tumor, the accumulation
of inhibitory Tregs and/or other suppressive cells, the activation of negative
immunoregulatory pathways, and the dysregulation of effector T cells are all mechanisms
by which tumors evade the host immune system.
Notably, the presence of large numbers of tumor infiltrating T lymphocytes (TILs) has
been reported to be an indicator of good prognosis in multiple solid tumors53-56. Therefore,
it is not surprising that physically preventing effector CD8+ T cell infiltration or inhibiting
their activity once they gain access to the tumor might be a means by which tumors protect
themselves from immune attack, enabling them to persist within the host. Additionally,
distinct components of the tumor microenvironment can suppress active antitumor T cell
responses in multiple ways. Tumor endothelial cells (TECs) present at the blood-tumor
barrier act as gatekeepers, regulating the homing, adhesion and trans-endothelial migration

13
of lymphocytes into the tumor57. TECs can create a protective barrier to block or disrupt
trans-endothelial T cell migration and survival within the tumor microenvironment. Many
TECs express FasL and induce the death of Fas-expressing T cells attempting to gain
access to the tumor57.
Additionally, both innate and adaptive immune cells that gain access to the tumor site can
contribute to disease progression by corruption of the inherent protective inflammatory
response mounted against the tumor to promote immune evasion. For example, alterations
in tumor cell biology can lead to decreased susceptibility to killing, and alterations in APCs
can lead to faulty T cell priming and promote T cell dysfunction. Both the induction of
suppressive cytokines and the expression of negative immunomodulatory molecules within
the tumor microenvironment can dampen immune responses. High levels of IL-10 and/or
transforming growth factor (TGF-β), the expression of FAS or FASL, PDL-1 PDL-2,
and the expression of immunomodulatory enzymes like indoleamine 2,3-dioxygenase,
(IDO), arginase (ARG) or inducible nitric-oxide synthase (iNOS) can inhibit tumor
immunity58. The major producers of these immunoregulatory molecules include
tolerogenic DCs, Tregs, myeloid-derived suppressor cells (MDSCs), and tumor-associated
macrophages (TAMs).
Of these suppressive cell types, breast cancer is characterized by having a large population
of TAMs, and experimental models have shown multiple pathways by which TAMs can
influence the surrounding tumor microenvironment59. TAMs have been shown to secrete
pro-angiogenic factors, such as VEGF, that support the development of neo-vasculature
paramount to tumor survival and metastases to distant sites. Additionally, TAMs can
14
secrete cytokines and other factors that can suppress the induction of local pro-
inflammatory antitumor response60 .
Vaccine strategies to reprogram the immune response to cancer
Despite the many immunosuppressive mechanisms that blunt productive anti-tumor
responses, it is clear that the presence of immune cell infiltrates are associated with
improved survival and response to therapy in some patients. These observations imply that
the tumor microenvironment represents a therapeutic target that can be manipulated to
promote tumor regression in more patients. Therefore, preclinical work has aimed to
integrate tumor vaccines with established cancer drugs in an effort to target cancer cells
directly through cytotoxic effects, as well as potentially augmenting vaccine-induced
immune responses through modulating immune cells within the tumor microenvironment.
A Preclinical Model of Antigen-Specific Immune Tolerance
The neu-N transgenic mouse was derived from parental FVB/N mice by placing the rat neu
proto-oncogene under the control of the mammary specific promoter, mouse mammary
tumor virus (MMTV), resulting in mammary tissue specific expression of the rat HER-2
protein. As a result of overexpressing HER-2, neu-N mice spontaneously develop
mammary tumors at about 4-6 months 61. These tumors were used to develop cell lines
that express high levels of rat HER-2, called NT2.5. These cell lines are used for orthotopic
tumor implants to examine HER2 responses in parental FVB/N where rat HER-2 is
immunogenic, and in neu-N mice where it is not due to immune tolerance.
A whole cell vaccine was created from 3T3 fibroblast cells genetically modified to
constitutively secrete GM-CSF and deliver high amounts of tumor antigen through the
15
overexpression of rat HER-262. Tumors were orthotopically implanted into the mammary
fat pads of FVB/N mice and allowed to reach ~0.5 centimeter in size (about 1 week
following implant). Vaccination of these mice with the HER-2 overexpressing GM-CSF-
secreting 3T3 vaccine cells inhibited tumor cell growth and ultimately resulted in 100%
tumor resolution in these mice. Evaluation of specific anti-tumor responses in these mice
showed that FVB/N mice develop high levels of antibodies that are specific for HER-2 in
addition to a population of high avidity T cells that are specific for the immunodominant
epitope of rat HER-2, RNEU420-429 also called, p50 63,
64
.
To this end, previous successful animal and human studies have examined combining
vaccination with chemotherapy and Trastuzumab27,62,65-68. These combinations were
shown to enhance vaccine induced immune responses, through measuring both HER-2
specific antibody production and HER-2 specific T cell responses. Studies in these models
have led to clinical trials that have examined the use of a human vaccine in the clinic for
patients with HER-2 positive as well as HER-2 negative disease and have seen some
success27.
These preclinical studies were also expanded to explore the potential use of angiogenesis
inhibitors in combination with vaccine. Despite many efforts to incorporate anti-
angiogenic therapy into a treatment standard for breast cancer, they have not been
successful. Therefore, antiangiogenic therapy may work best in combination therapy rather
than as single agents69. Previous published work focused on the immune based activity of
DC101, a monoclonal antibody that targets vascular endothelial growth factor receptor 2
(VEGFR-2). VEGFR-2 is found on endothelial cells and has been shown to play a critical
role in initiating the formation of new vessels that is hallmark of cancer development.

16
Treating tumor-bearing FVB/N mice with DC101 resulted in tumor regression when
compared with IgG controls. Tumor resolution was accompanied by increased HER-2
specific T cells even in the absence of vaccination. T cell depletion studies in mice treated
with DC101 demonstrated a dependence on both CD4+ and CD8+ T cells for drug
efficacy70. Giving DC101 sequenced with HER-2 targeted GM-CSF vaccination resulted
in both further enhancement of tumor resolution compared to either single therapy agent,
and enhanced T cell responses against the tumor, specifically, against the immunodominant
epitope of HER2.
Given the problem of development of acquired resistance with many VEGF- targeted
therapies, multi-tyrosine kinase inhibitors (TKIs) are an attractive option to target
angiogenesis given their ability to concurrently target other compensatory pathways
important in the growth and development of cancer cells. One such TKI, Sorafenib
(Nexavar) is a multiple serine/threonine kinase inhibitor that was originally designed to
inhibit Ras kinase activity but was later shown to have significant activity against several
other receptor tyrosine kinases involved in neovascularization and tumor progression,
VEGFR-2, VEGFR-3, platelet-derived growth factor (PDGFR)- Flt-3, and c-KIT 71.
Sorafenib has been approved for the treatment of renal cell carcinoma (RCC),
hepatocellular carcinoma (HCC) and more recently for the treatment of differentiated
thyroid cancer (RTC)72-74.
Objectives:
The hypothesis of this thesis was Sorafenib modulates immune cells within the tumor
microenvironment to enhance tumor rejection and support the anti-tumor immune response
17
to improve the efficacy of DC-based, HER-2 targeted, GM-CSF-secreting vaccination.
This was investigated first by examining the effect of single agent Sorafenib on immune
cells within the breast tumor microenvironment. The HER2-overexpressing cell line,
NT2.5, was be used to analyze the effect of Sorafenib on HER-2 over-expressing breast
cancer cells both in vitro and in vivo. Given the reported potential immune modulating
effects of TKIs on cells within the tumor microenvironment, the interaction of Sorafenib
with immune cells was determined. Specifically, the effect of Sorafenib on T cells and
macrophages was analyzed. Finally, the therapeutic and immune effects of partnering
Sorafenib with DC-based vaccination were investigated. These studies support the
hypothesis that Sorafenib can be successfully re-purposed as a partner for immunotherapy,
not only by inducing increased cell death and inhibiting angiogenesis, but by acting through
an immune-based mechanism to accelerate tumor clearance.
18
References
1. Riese DJ, Stern DF. Specificity within the EGF family/ErbB receptor family signaling
network. Bioessays. 1998;20(1):41-48.
2. Arteaga CL, Sliwkowski MX, Osborne CK, Perez EA, Puglisi F, Gianni L. Treatment
of HER2-positive breast cancer: Current status and future perspectives. Nature
Reviews.Clinical Oncology. 2012;9(1):16-32.
3. Yarden Y. Biology of HER2 and its importance in breast cancer. Oncology.
2001;61(supp 2):1-13.
4. Hudziak RM, Schlessinger J, Ullrich A. Increased expression of the putative growth
factor receptor p185HER2 causes transformation and tumorigenesis of NIH 3T3 cells. Proc
Natl Acad Sci U S A. 1987;84(20):7159-7163.
5. Chazin VR, Kaleko M, Miller AD, Slamon DJ. Transformation mediated by the human
HER-2 gene independent of the epidermal growth factor receptor. Oncogene.
1992;7(9):1859-1866.
6. Benz C, Scott G, Sarup J, et al. Estrogen-dependent, tamoxifen-resistant tumorigenic
growth of MCF-7 cells transfected with HER2/neu. Breast Cancer Research and
Treatment. 19925;24(2):85-95.
7. Fiore PPD, Pierce JH, Kraus MH, Segatto O, King CR, Aaronson SA. erbB-2 is a potent
oncogene when overexpressed in NIH/3T3 cells. Science. 1987;237(4811):178-182.
19
8. Slamon DJ, Clark GM, Wong SG, Levin WJ, Ullrich A, McGuire WL. Human breast
cancer: Correlation of relapse and survival with amplification of the HER-2/neu oncogene.
Science. 1987;235(4785):177-182.
9. Ménard S, Tagliabue E, Campiglio M, Pupa SM. Role of HER2 gene overexpression in
breast carcinoma. J Cell Physiol. 2000;182(2):150-162.
10. Emens LA. Breast cancer immunobiology driving immunotherapy: Vaccines and
immune checkpoint blockade. Expert Review of Anticancer Therapy. 2012;12(12):1597-
611.
11. Jelovac D, MD, Emens, Leisha A,MD, PhD. HER2-directed therapy for metastatic
breast cancer. Oncology. 2013;27(3):166-75.
12. Coley W, B. The treatment of malignant tumors by repeated inoculations of erysipelas.
with a report of ten original cases. The American Journal of Medical Sciences.
1893;105:487-511.
13. Rosenberg SA, Lotze MT. Cancer immunotherapy using interleukin-2 and interleukin-
2-activated lymphocytes. Annu Rev Immunol. 1986;4:681-709.
14. Kantoff PW, Higano CS, Shore ND, et al. Sipuleucel-T immunotherapy for castration-
resistant prostate cancer. N Engl J Med. 2010;363(5):411-422.
15. Hodi FS, O'Day SJ, McDermott DF, et al. Improved survival with ipilimumab in
patients with metastatic melanoma. N Engl J Med. 2010;363(8):711-723.

20
16. Lizée G, Overwijk WW, Radvanyi L, Gao J, Sharma P, Hwu P. Harnessing the power
of the immune system to target cancer. Annu Rev Med. 2013;64(1):71-90.
17. Livingston PO, Albino AP, Chung TJC, et al. Serological response of melanoma
patients to vaccines prepared from VSV lysates of autologous and allogeneic cultured
melanoma cells. Cancer. 1985;55(4):713-720.
18. Berd D, Maguire HC, McCue P, Mastrangelo MJ. Treatment of metastatic melanoma
with an autologous tumor-cell vaccine: Clinical and immunologic results in 64 patients.
Journal of Clinical Oncology. 1990;8(11):1858-1867.
19. Lindenmann J, Klein PA. Viral oncolysis: Increased immunogenicity of host cell
antigen associated with influenza virus. J Exp Med. 1967;126(1):93-108.
20. Itaya T, Yamagiwa S, Okada F, et al. Xenogenization of a mouse lung carcinoma (3LL)
by transfection with an allogeneic class I major histocompatibility complex gene (H-2Ld).
Cancer Res. 1987;47(12):3136-3140.
21. Plautz GE, Yang ZY, Wu BY, Gao X, Huang L, Nabel GJ. Immunotherapy of
malignancy by in vivo gene transfer into tumors. Proc Natl Acad Sci U S A.
1993;90(10):4645-4649.
22. Dranoff G, Jaffee E, Lazenby A, et al. Vaccination with irradiated tumor cells
engineered to secrete murine granulocyte-macrophage colony-stimulating factor stimulates
potent, specific, and long-lasting anti-tumor immunity. Proc Natl Acad Sci U S A.
1993;90(8):3539-3543.

21
23. Simons JW, Jaffee EM, Weber CE, et al. Bioactivity of autologous irradiated renal cell
carcinoma vaccines generated by ex vivo granulocyte-macrophage colony-stimulating
factor gene transfer. Cancer Res. 1997;57(8):1537-1546.
24. Soiffer R, Lynch T, Mihm M, et al. Vaccination with irradiated autologous melanoma
cells engineered to secrete human granulocyte-macrophage colony-stimulating factor
generates potent antitumor immunity in patients with metastatic melanoma. Proc Natl Acad
Sci U S A. 1998;95(22):13141-13146.
25. Simons JW, Mikhak B, Chang JF, et al. Induction of immunity to prostate cancer
antigens: Results of a clinical trial of vaccination with irradiated autologous prostate tumor
cells engineered to secrete granulocyte-macrophage colony-stimulating factor using ex
vivo gene transfer. Cancer Res. 1999;59(20):5160-5168.
26. Jaffee EM, Hruban RH, Biedrzycki B, et al. Novel allogeneic granulocyte-macrophage
colony-stimulating factor-secreting tumor vaccine for pancreatic cancer: A phase I trial of
safety and immune activation. J Clin Oncol. 2001;19(1):145-156.
27. Emens LA, Asquith JM, Leatherman JM, et al. Timed sequential treatment with
cyclophosphamide, doxorubicin, and an allogeneic granulocyte-macrophage colony-
stimulating factor-secreting breast tumor vaccine: A chemotherapy dose-ranging factorial
study of safety and immune activation. J Clin Oncol. 2009;27(35):5911-5918.
28. Diefenbach A, Raulet DH. The innate immune response to tumors and its role in the
induction of T-cell immunity. Immunol Rev. 2002;188:9-21.

22
29. Gajewski TF, Fuertes MB, Woo SR. Innate immune sensing of cancer: Clues from an
identified role for type I IFNs. Cancer Immunol Immunother. 2012;61(8):1343-1347.
30. Barber GN. Cytoplasmic DNA innate immune pathways. Immunol Rev.
2011;243(1):99-108.
31. Pardoll D. Cancer immunology. In: Niederhuber J, Armitage J, Doroshow J, Kastan
M, and Tepper J, eds. Abeloff's clinical oncology. 5th ed. ; 2014:78-97.
32. Murphy K. Antigen recognition by B-cell and T-cell receptors. In: Janeway's
immunobiology. 8th ed. Garland Science Taylor and Francis Group; 2012:140-151.
33. Germain RN, Margulies DH. The biochemistry and cell biology of antigen processing
and presentation. Annu Rev Immunol. 1993;11(1):403-450.
34. Wolf PR, Ploegh HL. How MHC class II molecules acquire peptide cargo: Biosynthesis
and trafficking through the endocytic pathway. Annu Rev Cell Dev Biol. 1995;11(1):267-
306.
35. Murphy K. The development of T lymphocytes in the thymus. In: Janeway's
immunobiology. 8th ed. Garland Science Taylor and Francis Group; 2012:290-316.
36. Lafferty KJ, Misko IS, Cooley MA. Allogeneic stimulation modulates the in vitro
response of T cells to transplantation antigen. Nature. 1974;249(454):275-276.
37. Alarcón B, Gil D, Delgado P, Schamel WWA. Initiation of TCR signaling: Regulation
within CD3 dimers. Immunol Rev. 2003;191(1):38-46.

23
38. Kane LP, Lin J, Weiss A. Signal transduction by the TCR for antigen. Curr Opin
Immunol. 2000;12(3):242-249.
39. Koretzky GA, Abtahian F, Silverman MA. SLP76 and SLP65: Complex regulation of
signalling in lymphocytes and beyond. Nat Rev Immunol. 2006;6(1):67-78.
40. Huse M. The T-cell-receptor signaling network. Journal of Cell Science.
2009;122(9):1269-1273.
41. Acuto O, and Michel F. CD28-mediated co-stimulation: A quantitative support for TCR
signalling. Nature Reviews Immunology. 2003;3(12):939-951.
42. Xing Y, Hogquist KA. T-cell tolerance: Central and peripheral. Cold Spring Harbor
Perspectives in Biology. 2012;4(6).
43. Strasser A, Pellegrini M. T-lymphocyte death during shutdown of an immune response.
Trends Immunol. 2004;25(11):610-615.
44. Itoh N, Yonehara S, Ishii A, et al. The polypeptide encoded by the cDNA for human
cell surface antigen fas can mediate apoptosis. Cell. 1991;66(2):233-243.
45. Certo M, Moore VDG, Nishino M, et al. Mitochondria primed by death signals
determine cellular addiction to antiapoptotic BCL-2 family members. Cancer Cell.
2006;9(5):351-365.
46. Parish IA, Heath WR. Too dangerous to ignore: Self-tolerance and the control of
ignorant autoreactive T cells. Immunol Cell Biol. 2008;86(2):146-152.
24
47. Butte MJ, Keir ME, Phamduy TB, Sharpe AH, Freeman GJ. Programmed death-1
ligand 1 interacts specifically with the B7-1 costimulatory molecule to inhibit T cell
responses. Immunity. 2007;27(1):111-122.
48. Keir ME, Butte MJ, Freeman GJ, Sharpe AH. PD-1 and its ligands in tolerance and
immunity. Annu Rev Immunol. 2008;26(1):677-704.
49. Hori S, Nomura T, Sakaguchi S. Control of regulatory T cell development by the
transcription factor Foxp3. Science. 2003;299(5609):1057-1061.
50. Gavin MA, Rasmussen JP, Fontenot JD, et al. Foxp3-dependent programme of
regulatory T-cell differentiation. Nature. 2007;445(7129):771-775.
51. Zheng Y, Josefowicz SZ, Kas A, Chu TT, Gavin MA, Rudensky AY. Genome-wide
analysis of Foxp3 target genes in developing and mature regulatory T cells. Nature.
2007;445(7130):936-940.
52. Vignali DA, Collison LW, Workman CJ. How regulatory T cells work. Nat Rev
Immunol. 2008;8(7):523-532.
53. Schumacher K, Haensch W, Röefzaad C, Schlag PM. Prognostic significance of
activated CD8+ T cell infiltrations within esophageal carcinomas. Cancer Research.
2001;61(10):3932-3936.
54. Pages F, Galon J, Dieu-Nosjean MC, Tartour E, Sautes-Fridman C, Fridman WH.
Immune infiltration in human tumors: A prognostic factor that should not be ignored.
Oncogene. 2010;29(8):1093-1102.
25
55. Naito Y, Saito K, Shiiba K, et al. CD8+ T cells infiltrated within cancer cell nests as a
prognostic factor in human colorectal cancer. Cancer Res. 1998;58(16):3491-3494.
56. Zhang L, Conejo-Garcia J, Katsaros D, et al. Intratumoral T cells, recurrence, and
survival in epithelial ovarian cancer. N Engl J Med. 2003;348(3):203-213.
57. Buckanovich RJ, Facciabene A, Kim S, et al. Endothelin B receptor mediates the
endothelial barrier to T cell homing to tumors and disables immune therapy. Nat Med.
2008;14(1):28-36.
58. Mellor AL, Munn DH. Creating immune privilege: Active local suppression that
benefits friends, but protects foes. Nat Rev Immunol. 2008;8(1):74-80.
59. Allavena P, Mantovani A. Immunology in the clinic review series; focus on cancer:
Tumour-associated macrophages: Undisputed stars of the inflammatory tumour
microenvironment. Clin Exp Immunol. 2012;167(2):195-205.
60. Obeid E, Nanda R, Fu YX, Olopade OI. The role of tumor-associated macrophages in
breast cancer progression (review). Int J Oncol. 2013;43(1):5-12.
61. Guy CT, Webster MA, Schaller M, Parsons TJ, Cardiff RD, Muller WJ. Expression of
the neu protooncogene in the mammary epithelium of transgenic mice induces metastatic
disease. Proc Natl Acad Sci U S A. 1992;89(22):10578-10582.
62. Reilly RT, Gottlieb MBC, Ercolini AM, et al. HER-2/neu is a tumor rejection target in
tolerized HER-2/neu transgenic mice. Cancer Research. 2000;60(13):3569-3576.
26
63. Ercolini AM, Machiels JH, Chen YC, et al. Identification and characterization of the
immunodominant rat HER-2/neu MHC class I epitope presented by spontaneous mammary
tumors from HER-2/neu-transgenic mice. The Journal of Immunology. 2003;170(8):4273-
4280.
64. Machiels JH, Reilly RT, Emens LA, et al. Cyclophosphamide, doxorubicin, and
paclitaxel enhance the antitumor immune response of granulocyte/macrophage-colony
stimulating factor-secreting whole-cell vaccines in HER-2/neu tolerized mice. Cancer
Research. 2001;61(9):3689-3697.
65. Wolpoe ME, Lutz ER, Ercolini AM, et al. HER-2/neu-specific monoclonal antibodies
collaborate with HER-2/neu-targeted granulocyte macrophage colony-stimulating factor
secreting whole cell vaccination to augment CD8+ T cell effector function and tumor-free
survival in her-2/neu-transgenic mice. The Journal of Immunology. 2003;171(4):2161-
2169.
66. Machiels JH, Reilly RT, Emens LA, et al. Cyclophosphamide, doxorubicin, and
paclitaxel enhance the antitumor immune response of granulocyte/macrophage-colony
stimulating factor-secreting whole-cell vaccines in HER-2/neu tolerized mice. Cancer
Research. 2001;61(9):3689-3697.
67. Emens LA, Gupta R, and et. al. A feasibility study of combination therapy with
trastuzumab (T), cyclophosphamide (cy), and an allogeneic GM-CSF secreting breast
tumor vaccine for the treatment of HER2+ breast cancer. Pro Am Soc Clin Oncol. 2011.

27
68. Emens LA, Asquith JM, Leatherman JM, et al. Timed sequential treatment with
cyclophosphamide, doxorubicin, and an allogeneic granulocyte-macrophage colony-
stimulating Factor–Secreting breast tumor vaccine: A chemotherapy dose-ranging factorial
study of safety and immune activation. Journal of Clinical Oncology. 2009;27(35):5911-
5918.
69. Giuliano S, Pagès G. Mechanisms of resistance to anti-angiogenesis therapies.
Biochimie. 2013;95(6):1110-1119.
70. Manning EA, Ullman JGM, Leatherman JM, et al. A vascular endothelial growth factor
receptor-2 inhibitor enhances antitumor immunity through an immune-based mechanism.
Clinical Cancer Research. 2007;13(13):3951-3959.
71. Wilhelm SM, Carter C, Tang L, et al. BAY 43-9006 exhibits broad spectrum oral
antitumor activity and targets the RAF/MEK/ERK pathway and receptor tyrosine kinases
involved in tumor progression and angiogenesis. Cancer Research. 2004;64(19):7099-
7109.
72. Kane RC, Farrell AT, Madabushi R, et al. Sorafenib for the treatment of unresectable
hepatocellular carcinoma. Oncologist. 2009;14(1):95-100.
73. Kane RC, Farrell AT, Saber H, et al. Sorafenib for the treatment of advanced renal cell
carcinoma. Clin Cancer Res. 2006;12(24):7271-7278.

28
74. U.S. Department of Health and Human Services. Sorafenib (NEXAVAR).
http://www.fda.gov/Drugs/InformationOnDrugs/ApprovedDrugs/ucm376547.htm.
Updated 11/25/2013. Accessed 02/18, 2014.
29
Chapter 2: Characterizing the Mechanism of Therapeutic Activity of Sorafenib in
HER2+ Breast Cancer in FVB/N mice
Introduction:
The tumor microenvironment is established and maintained through the complex
interactions of tumors cells with host stromal elements. Therefore, multi-targeted drugs
and combination therapies that target multiple cellular components of the
microenvironment may be the most effective strategy to improve survival in patients with
breast cancer. One principle targetable component of the tumor microenvironment is the
vascular niche, where angiogenesis occurs.
Angiogenesis is defined as the development of a neo-vasculature from pre-existing blood
vessels. Angiogenesis is now recognized as a hallmark of cancer development since the
ability of cancer cells to acquire new blood vessels is paramount to support tumor cell
proliferation and growth by providing necessary oxygen and nutrients to the tumor site1.
Angiogenesis is also necessary for the metastasis of cancer cells to distant sites. Beginning
in the 1970’s when Judah Folkman first recognized that tumor growth is dependent on
angiogenesis, significant investments have been made in the development of anti-
angiogenic therapy for the treatment of cancer in the clinic2. As a result of this research,
inhibitors of angiogenesis have been developed.
In cancer development, VEGF signaling is a major player in the “angiogenic switch” which
is the rapid increase in blood vessel formation to support tumor growth and development
when tumors reach a size beyond 2mm2 3. Therefore, one strategy to target angiogenesis
is through the use of therapies that target various aspects of VEGF signaling. Most notable
30
is the first clinically approved inhibitor of angiogenesis, Bevacizumab (Avastin).
Bevacizumab, a humanized monoclonal antibody, works mainly by binding to the
biologically active forms of VEGF thereby preventing its interactions with VEGF
receptors4. Despite a modest increase in progression free survival with the use of single
agent Bevacizumab, many patients do ultimately progress due to therapeutic resistance5,6.
Given the problem of acquired resistance to anti-VEGF therapy, TKIs are an attractive
option to target angiogenesis in their ability to also target other compensatory pathways
important in the growth and development of cancer cells7,8. Notably, targeting the immune
system has been shown to play a role in the antitumor effect of many conventional cancer
therapies, including angiogenesis inhibitors, such as TKIs9 .
Previously, the impact of standard and novel cancer drugs on the immune system was
explored10. It was reported that the VEGFR-2-specific monoclonal antibody DC101 not
only disrupts the tumor-associated vasculature, but also promotes T cell-dependent,
immune-mediated tumor rejection11. These observations suggest that therapies targeting
multiple cellular components of the tumor may be more effective than therapies that only
target a single cellular element within the tumor. Several groups have investigated the
immune-modulating effect of the TKI, Sunitinib, but less is known about the effects of
Sorafenib on the immune system12,13. Accordingly, these studies have been expanded to
explore the immune-based activity of Sorafenib, a promiscuous small molecule kinase
inhibitor that blocks signaling in both tumor cells and host endothelial cells14.
Sorafenib is a small molecular inhibitor of angiogenesis designed to inhibit
RAF/MEK/ERK signaling, with a number of off- target effects including the inhibition of

31
wildtype and mutant BRAF, STAT3, and the receptor tyrosine kinases VEGFR2,
VEGFR3, and PDGFR-. It is FDA- approved for the treatment of HCC, RCC, and DTC
15-17, and is under investigation in other tumor types as well. Sorafenib has been reported
to support tumor immunity by decreasing the frequency of CD4+CD25+FoxP3+ Tregs
without impacting the function of peripheral effector T cells in patients with RCC18.
Conversely, Sorafenib has been shown to inhibit DC function, reducing DC maturation,
migration, and T cell priming19. Most data support an inhibitory effect of Sorafenib on
tumor-specific immunity 19-21 but the variable immune effects of Sorafenib suggest they
could be context-dependent.
Given the established clinical indications for Sorafenib, the increasing use of
immunotherapy in the clinic, and the complex immune effects of Sorafenib, the immune-
modulating effects of Sorafenib were investigated. First, the effect of Sorafenib on the
growth characteristics and signaling pathways of HER-2-expressing NT2.5 mammary
tumor cells in vitro was determined. In vivo tumor regression with Sorafenib treatment was
examined. Finally, the effect of Sorafenib on the immune system was analyzed through
depletion studies. The results of these studies identified a unique immune-based
mechanism of Sorafenib to promote tumor cell clearance in FVB/N mice.

32
Materials and Methods:
Mice
FVB/N mice were purchased from Harlan (Frederick, MD) and 8 to 12 week old mice were
used in experiments. Animals were housed in pathogen-free conditions and were treated
in accordance with institutional and AAALAC policies. All protocols were approved by
the Animal Care and Use Committee of Johns Hopkins University.
Reagents
Sorafenib was purchased from LC Laboratories (Woburn, MA). For in vitro studies,
sorafenib was dissolved in dimethyl sulfoxide (DMSO) and further diluted in culture
medium to the required concentration with the final concentration of DMSO concentration
less than 0.2%. The p38 pathway inhibitor SB203580 was purchased from Sigma-Aldrich
(St. Louis, MO). The ERK pathway inhibitor U0126 was purchased from Invitrogen
(Carlsbad, CA). Antibodies for p-STAT3 (Tyr705), STAT3, p-ERK1/2 (Thr202/Tyr204),
ERK1/2, p-p38 (Thr180/Tyr182), p38, p-AKT (Ser473), AKT, p-HER2 (Tyr877), HER2,
Cyclin D1, Cyclin D2, Cyclin D3, BCLXL, BCL2, and activated caspase 3 were all
purchased from Cell Signaling Technologies (Beverly, MA). The actin antibody was
purchased from Calbiochem (San Diego, CA). Rabbit anti-mouse PECAM/CD31 antibody
was purchased from Abcam (Cambridge, MA). Clodronate liposomes were provided by
Dr. Nico van Rooijen (Vrije Universiteit, VUMC, The Netherlands). The α-asialo GM1
antibody was purchased from Wako Chemical (Richmond, VA).
33
Cell Lines and Media
The NT2.5 tumor cell line, derived from a spontaneous tumor of a neu-N transgenic
mouse, was grown as previously described22.
Cell Proliferation Assays
NT2.5 cells were placed in 96-well plates at 104 cells per well in complete growth media
overnight. During drug treatments, media was replaced with media containing 0.5% FBS
and 0μM-10μM Sorafenib in a final volume of 200μl. Final concentrations of DMSO were
normalized within each experiment. At each time point, 100μl of media was removed and
20μl of CellTiter 96 Aqueous One Solution (Promega) was added for 2 hours at 37oC.
Measurements were made at 2, 24, 48, and 72 hours at 490nm. Cell free wells containing
media and CellTiter solution were used as blank controls.
Western Blotting
2×10⁶ NT2.5 cells were placed in 6-well plates overnight in complete growth media. To
analyze the effects of Sorafenib on HER-2, ERK, MAPK, p38 MAPK, STAT3 and AKT
signaling, media was changed to media containing 0.5% FBS and incubated for 2 hours
with 0M-10of Sorafenib. To analyze cyclin expression, cells were incubated for 6-7
hours with 5andM Sorafenib, U0126 (MEK/ERK inhibitor) or SB203580 (p38
inhibitor). After the incubation period, cells were lysed in ice-cold CellLytic cell lysis
reagent (Sigma) supplemented with Phosphatase Inhibitor Cocktail 2 (Sigma) and EDTA-
free protease inhibitor cocktail from Roche Diagnostics (Basel, Switzerland) for 5-10
minutes on ice. Cell lysates were scraped from 6-well plates, collected and centrifuged for
10 minutes at 10,000 RPM. Lysates were mixed 1:1 with Laemmli sample buffer and
boiled for 8 minutes. Samples were subjected to SDS-PAGE on 4-15% gradient gels
34
(BioRad, Hercules, CA) and transferred to Amersham Hybond-ECL (GE Healthcare,
Piscataway, NJ). Membranes were blocked for 1 hour in 5% Milk in TBS-Tween (w/v),
and then incubated overnight with primary antibodies in 5% BSA in TBS-Tween (w/v) at
the dilution recommended on the product data sheet. After washing, membranes were
incubated with HRP-conjugated Goat--Rabbit IgG (Cell Signaling Technologies) for 30
minutes at room temperature, washed, and developed using HyGLO Quickspray (Denville
Scientific, Metuchen, NJ). Membranes were stripped with Restore Western Blot Stripping
Buffer (Thermo Scientific, Rockford, IL) according to the manufacturer’s instructions,
then blocked and reprobed.
Immunohistochemical staining
Tumors were fixed in formalin for 24 hours, paraffin- embedded and sectioned at 5uM by
the JHMI Pathology Core. Sections were stained with H&E or retained for
immunohistochemistry at the JHMI Oncology Tissue Service Center. Vascularization and
apoptosis were analyzed with antibodies specific for PECAM/CD31 (Cell Signaling) and
cleaved caspase-3 (Abcam) respectively. Antigen retrieval was carried out for 45 minutes
in HTTR steam (Target Retrieval Solution; Dako) followed by incubation with primary
antibody for 45 minutes at room temperature. Slides were incubated with Power Vision
Poly-HRP anti-rabbit IgG secondary antibody for 30 minutes at room temperature. Slides
were developed with 3, 3’ diaminobenzidine (Sigma Fast DAB tablets) and slides were
counterstained with Mayers hematoxylin (Dako). Images were captured under light
microscopy at 10x magnification (E600, Nikon). Three independent high-powered
viewing fields were captured and staining was quantified using AR-Elements Microscope
Imaging Software (Nikon).

35
Drug treatment
FVB/N mice were challenged subcutaneously with 5×10⁶ NT2.5 tumor cells in the right
mammary fat pad, followed by vaccination 10-14 days later. Sorafenib (30mg/kg) was
administered in 100μl daily Monday through Friday by oral gavage with a feeding needle
beginning the day of vaccination. A viscous vehicle composed of 30% (w/v) Cremophor
EL, 30% (w/v) PEG 400, and 10% ethanol, 10% glucose (Sigma-Aldrich) was used both
to dissolve Sorafenib and administered as the vehicle treatment control. Mice were
monitored for tumor growth and onset twice weekly. Tumor growth was determined by
measuring tumor diameter in two perpendicular dimensions with calipers. Mean tumor size
for an experimental group included only those mice with measureable tumors.
Depletion Experiments
CD4+ and CD8+ T cells were continuously depleted using GK1.5 and 2.43 antibodies as
previously described22. Natural killer cells were depleted by twice weekly intraperitoneal
(i.p.) injections of α-asialo GM1antibody. Macrophages were depleted by i.p. injection of
clodronate liposomes weekly. Depletions were initiated one week prior to tumor challenge
and maintained throughout the experiment.
Statistical Analysis
Statistical analysis was conducted either in Microsoft Excel or GraphPad Software using
an unpaired, two-tailed Student’s t-test, assuming equal population variances to determine
the statistical significance between treatment groups. P<0.05 was considered significant.

36
Results:
Sorafenib inhibits the growth of HER-2 over-expressing breast tumor cells in vitro
First, the effect of Sorafenib on the HER-2 over-expressing breast tumor cell line NT2.5 in
vitro was examined. Sorafenib treatment inhibited NT2.5 cell growth, with a decrease in
cell viability observed at concentrations between 1 to 10μM (Figure 1A). Flow cytometric
analysis of Sorafenib treated NT2.5 cells stained with Annexin V and 7-AAD revealed a
concentration-dependent increase in apoptosis (Figure 1B). The effect of Sorafenib on
downstream targets of the HER-2 pathway was also investigated. Sorafenib interfered with
ERK/MAPK, p38 MAPK, and STAT3 signaling, shown by decreased expression of the
phosphorylated proteins at higher treatment concentrations. HER-2 or AKT signaling were
not affected by Sorafenib treatment (Figure 1C). Sorafenib also decreased the expression
of the G1/S cyclins D1, D2, and D3 in NT2.5 cells, whereas Bcl2 and BclXL expression
were not affected (Figure 1D).
MAPK signaling is required for the expression of cyclin D1, whereas cyclin D3 can be
controlled by additional pathways23. Therefore, the effect of Sorafenib on these D-type
cyclins relative to specific inhibitors of the ERK/MAPK and the p38 MAPK pathways was
analyzed. Sorafenib inhibited cyclin D1 to a greater extent than either of the two specific
MAPK pathway inhibitors, suggesting that the mechanism of NT2.5 growth inhibition by
Sorafenib is dependent on both arms of the MAPK signaling pathway. However, unlike
the either single arm MAPK inhibitors, Sorafenib also inhibited cyclin D3 (Figure 1D).
Collectively, these data demonstrate that Sorafenib treatment induced apoptosis and
inhibited cell growth of NT2.5 cells in vitro through MAPK-dependent and -independent
mechanisms.
37
Sorafenib causes regression of HER-2 over-expressing breast tumors in vivo
The ability of Sorafenib to inhibit the growth of established NT2.5 tumors in vivo was then
examined in immune competent FVB/N mice. Sorafenib monotherapy enhanced NT2.5
tumor regression in tumor-bearing FVB/N mice compared with vehicle-treated control
mice (Figure 2A and B). Immunohistochemistry analyses of tumors harvested 12 days
post-treatment showed that Sorafenib treatment increased the disruption of tumor-
associated vasculature. Decreased endothelial cell-specific PECAM/CD31 staining was
observed in tumors from Sorafenib treated mice compared to tumors from vehicle treated
mice (Figure 2C). Sorafenib treatment also resulted in an increase in tumor cell death.
Tumors from Sorafenib treated mice showed an increase in staining for cleaved caspase-3
compared to the tumors of mice receiving vehicle treatment (Figure 2D). Taken together,
these data suggest that Sorafenib inhibits NT2.5 breast tumor cell growth by inhibiting
angiogenesis and inducing apoptosis in vivo.
Sorafenib-mediated tumor clearance is T cell dependent
Studies selectively depleting distinct immune cells were conducted to evaluate the potential
immune-dependent effects of Sorafenib. Selectively depleting either CD4+ or CD8+ T
cells partially inhibited the efficacy of Sorafenib, whereas depleting both T cell subsets
completely abrogated the anti-tumor effect of Sorafenib (Figure 3A and 3B). Depletion of
NK cells or macrophages had no effect on the ability of Sorafenib to inhibit tumor growth
(Figure 3C and 3D). In animals cured of their tumors by Sorafenib treatment, drug was
withdrawn for one week and mice were re-challenged with 5×10⁶ NT2.5 cells on the
contralateral side. No new tumor development was observed at the secondary tumor

38
challenge site. 2 out of 6 mice developed recurrence at the original tumor site, most likely
through aquired drug resistance or the activation of immune evasion pathways (Figure 3B
and C). These data indicate that Sorafenib treatment induces tumor rejection that is in part
dependent on T cells. Moreover, protection from a second tumor challenge suggests that
Sorafenib also supports effective T cell memory responses.

39
Figures:
Figure 1: Sorafenib Inhibits growth of HER2-overexpressing cells in vitro
A,NT2.5 cells were treated in vitro with varying concentration of Sorafenib from 0-10uM
and analyzed for growth by MTT assay 24, 48 or 72 hours post-treatment. B, NT2.5 cells
were treated with Sorafenib for 24hrs and stained for Annexin V and 7-AAD and analyzed
by flow cytometry. C, NT2.5 cells were treated with Sorafenib for 2 hours and then cells
were harvested for protein and analyzed by Western blot for HER2 pathway targets. D,
NT2.5 cells were treated with 5M and 10M Sorafenib or MAPK inhibitors for 6-7 hours
and then cells were harvested for protein and analyzed by Western blot for cyclin
expression.

40
A.
B.
0
0.2
0.4
0.6
0.8
1
1.2
1.4
1.6
1.8
0 20 40 60 80
Op
tica
l d
ensi
ty (
OD
)
Time (Hours)
0uM
0.05u
M0.1
0.2
1uM
2uM
5uM
10uM

41
C.
D.
.
42
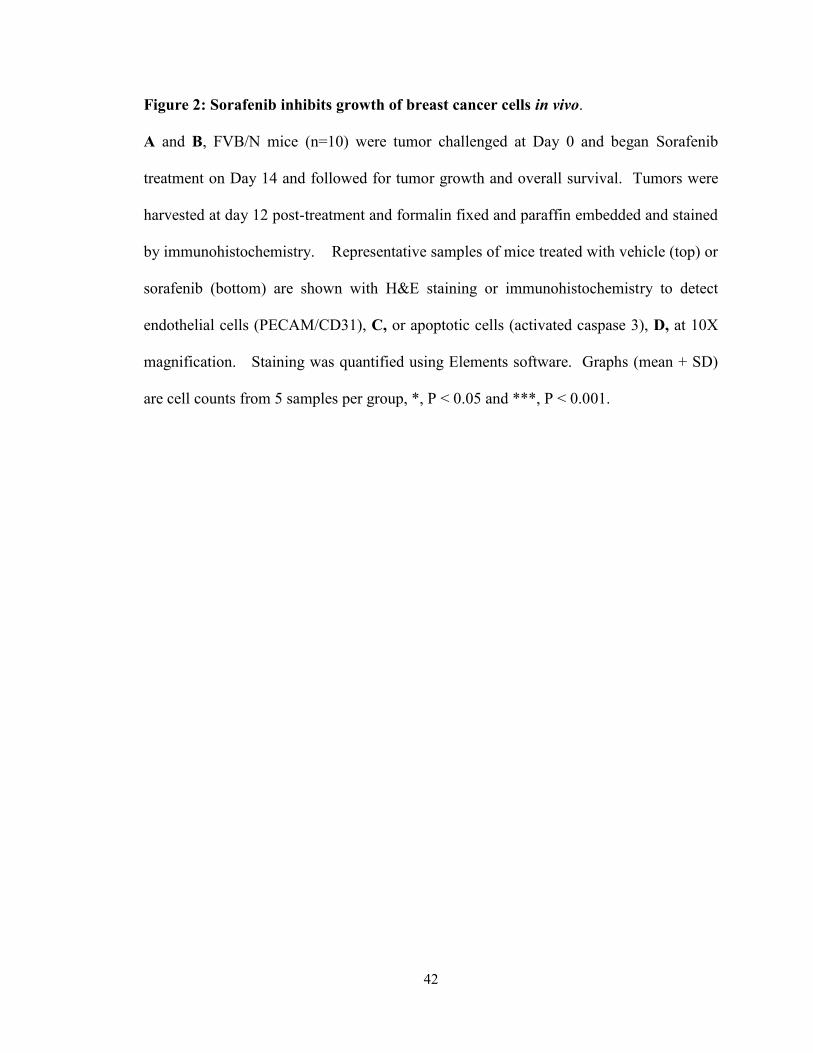
Figure 2: Sorafenib inhibits growth of breast cancer cells in vivo.
A and B, FVB/N mice (n=10) were tumor challenged at Day 0 and began Sorafenib
treatment on Day 14 and followed for tumor growth and overall survival. Tumors were
harvested at day 12 post-treatment and formalin fixed and paraffin embedded and stained
by immunohistochemistry. Representative samples of mice treated with vehicle (top) or
sorafenib (bottom) are shown with H&E staining or immunohistochemistry to detect
endothelial cells (PECAM/CD31), C, or apoptotic cells (activated caspase 3), D, at 10X
magnification. Staining was quantified using Elements software. Graphs (mean + SD)
are cell counts from 5 samples per group, *, P < 0.05 and ***, P < 0.001.

43
A.
B.
0
10
20
30
40
50
60
70
80
90
100
0 10 20 30 40
Mea
n t
um
or
size
(m
m2
)
Days post tumor implant
VehicleSorafenib
0
25
50
75
100
0 10 20 30 40 50
% T
um
or
free
Days post treatment
VehicleSorafenib

44
C.
H&E PECAM/CD31 Activated Caspase 3
PECAM/CD31 Staining
Veh
icle
Sora
fenib
0
10
20
30
40Vehicle
Sorafenib
***
# C
D3
1+
mic
ro
ve
ss
els
/ fie
ld
Activated caspase 3
Veh
icle
Sora
fenib
0
100
200
300
400Vehicle
Sorafenib
*
ac
tiv
ate
d c
as
pa
se
3 p
os
itiv
e c
ells
/ fie
ld
Vehicle
Sorafenib
D.
45
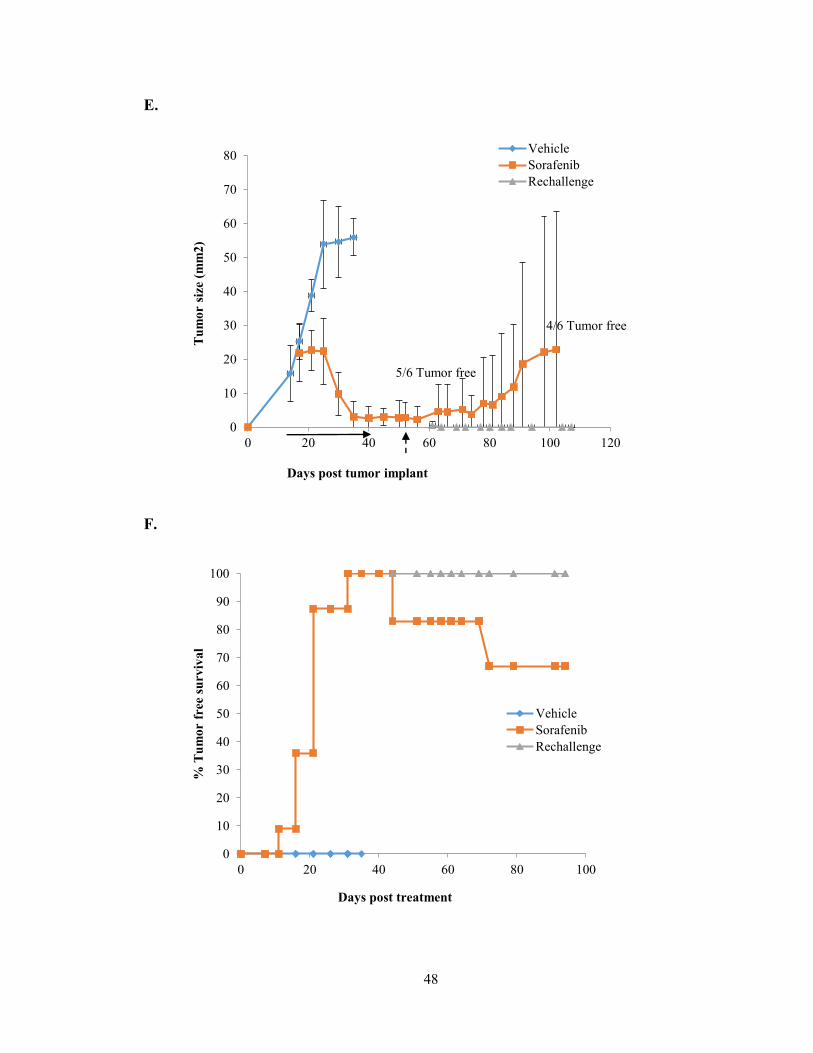
Figure 3: T cells are required for Sorafenib targeting of NT2.5 cells.
A, the experiment in Fig. 2A was repeated in the setting of immune cell depletion. Prior
to beginning Sorafenib, NK cells or macrophages (Sor-NK, Sor-Mac) were depleted or C,
CD4+ or CD8+ T cells (Sor-CD4, Sor-CD8) were depleted alone or together (Sor-
CD4/CD8) and followed for tumor growth and, B and D, overall survival. E, in a separate
experiment, FVB/N (n=6) were tumor challenged treated with Sorafenib treated or vehicle
control until the Sorafenib treated tumors had completely regressed, upon which point the
vehicle group was sacrificed and the Sorafenib treatment ceased. After 1 week mice were
re-challenged on the contralateral side and followed for tumor growth at the original site
and the re-challenge site and F, overall survival.

46
A.
.
B.
0
20
40
60
80
100
120
0 7 14 21 28 35 42
Mea
n T
um
or
Are
a (
mm
2)
Days post tumor implant
VehicleSorafenibSor-NKSor-Mac
Depletion Start: Day -7
Drug Treatment Start: Day 10
0
5
10
15
20
25
30
35
40
45
0 7 14 21 28 35 42
% T
um
or-
free
surv
iva
l
Days post treatment
Vehicle
Sorafenib
Sor-NK
Sor-Mac

47
C.
.
D.
0
20
40
60
80
100
120
0 7 14 21 28 35 42
Mea
n T
um
or
Are
a (
mm
2)
Days post tumor implant
Vehicle
Sorafenib
Sor-CD4
Sor-CD8
Sor-CD4/8
Depletion Start: Day -7
Drug Treatment Start: Day 10
0
5
10
15
20
25
30
35
40
45
0 7 14 21 28 35 42
% T
um
or-
free
surv
iva
l
Days post treatment
Vehicle
Sorafenib
Sor-CD4
Sor-CD8
Sor-CD4/CD8
48
E.
F.
0
10
20
30
40
50
60
70
80
0 20 40 60 80 100 120
Tu
mo
r si
ze (
mm
2)
Days post tumor implant
Vehicle
Sorafenib
Rechallenge
4/6 Tumor free
5/6 Tumor free
0
10
20
30
40
50
60
70
80
90
100
0 20 40 60 80 100
% T
um
or
free
surv
iva
l
Days post treatment
Vehicle
Sorafenib
Rechallenge

49
Conclusions:
The data presented here support two new findings. First, the tyrosine kinase inhibitor
Sorafenib inhibits the growth of breast cancer cells in vitro and in vivo by both MAPK
dependent and independent mechanisms. Second, Sorafenib-induced tumor rejection is, in
part, T cell-mediated. Both CD4+ and CD8+ T cells are required for tumor regression with
single agent Sorafenib treatment. Additionally, treatment with Sorafenib supports the
development of immunological memory, preventing the outgrowth of a tumor challenge.
Although many studies have investigated the effect of Sorafenib on immune cells, this is
the first study showing immune cell dependence for drug efficacy.
Given the multiple components of the dynamic host-tumor cell interactions within the
tumor microenvironment, therapies successfully targeting multiple pathways will likely
result in the most effective treatments. Here, it is demonstrated that Sorafenib inhibits the
growth of HER-2-overexpressing breast tumors by a variety of mechanisms, including
inhibition of cell growth, induction of cell death, and inhibition of angiogenesis. In vitro,
clinically relevant concentrations of Sorafenib (5μM-10μM) induced marked inhibition of
cell growth. Additionally, Sorafenib inhibited MAPK signaling in NT2.5 cells, likely
resulting in decreased cell growth and increased cell death. These data are consistent with
reported effects of Sorafenib on the Ras/MEK/ERK pathway in other cancer models 14,24-
28. These findings were extended to show that decreased expression of the MAPK
downstream target, cyclin D1, was greatest with Sorafenib treatment compared to treatment
with inhibitors specific for either p38 MAPK or ERK MAPK. Unlike individual p38
MAPK or ERK MAPK inhibitors, Sorafenib treatment also decreased cyclin D3
expression. These findings suggest that Sorafenib also targets MAPK independent
50
pathways essential for cell cycle progression and proliferation, and is consistent with
previously published reports showing that cyclin D1 and cyclin D3 are differentially
regulated23. Therapies targeting both cyclins will likely be most effective at inhibiting cell
growth and successfully decreasing breast tumor burden.29. In support of this, Sorafenib
treatment resulted in a significant increase in cell death by increase in apoptotic cell
markers in vitro.
In vivo, Sorafenib has been shown to inhibit tumor growth in numerous murine cancer
models30. Here, it is shown that daily Sorafenib treatment enhanced tumor clearance in
FVB/N mice implanted with HER-2-overexpressing NT2.5 tumors. Sorafenib mediated
tumor destruction through inducing cell death through apoptosis, as reflected by increased
staining of activated caspase 3 in Sorafenib treated tumors. In addition to its direct tumor
cell cytotoxicity, Sorafenib potently inhibits angiogenesis in NT2.5 tumors. Sorafenib
treated tumors displayed substantial reduction in the number of CD31/PECAM positive
microvessels, consistent with reported anti-angiogenic effects of the drug14.
In addition to its direct anti-angiogenic and cytotoxic effects, these data demonstrate that
Sorafenib requires T cells to mediate durable anti-tumor activity. Simultaneously removing
both CD4+ and CD8+ T cells completely abrogated the therapeutic effect of Sorafenib.
Additionally, Sorafenib treatment protected mice from tumor growth after re-challenge,
demonstrating immunologic memory effect. While several studies have reported on the
impact of Sorafenib on the immune system18,20,21,31-33, this is the first study showing a direct
T cell- dependent mechanism of action for Sorafenib-mediated tumor clearance. These
data build upon previously published work illustrating the influence of the immune system,
specifically T cells, on the activity of anti-angiogenic therapies. Additionally, Sorafenib
51
can elicit long-lasting systemic immunity reflected by rejection of a second tumor
challenge. Re-growth was observed in a few of the original tumors once treatment ceased.
This demonstrates the dynamic immune resistance mechanisms that are active within the
tumor microenvironment and suggests that it may be advantageous to combine other
immune-modulating therapies with Sorafenib to enhance therapeutic benefit in patients.
Angiogenesis causes the formation of abnormal vascular networks resulting in hypoxia,
increased tumor pressure, and acidosis within the tumor microenvironment. These
conditions activate anti-inflammatory signals within the tumor microenvironment that
support the recruitment of suppressive immune cell populations subsequently inhibiting
effector cell activation. Resultant impaired APC cell maturation and migration and
impaired T cell trafficking and activation dampens productive anti-tumor responses34.
Therefore, inhibiting angiogenesis may work to remodel the tumor microenvironment to
one that is more immunosupportive rather than immunosuppressive34-36.
Given the established clinical indications for Sorafenib and the complex immune effects
reported on Sorafenib, further studies are necessary to elucidate the T cell-dependent
mechanism of Sorafenib. The later chapters of this thesis explore the effects of Sorafenib
on two important immune cell types within the breast tumor microenvironment, T cells and
TAMs. The final chapter will address these immune mechanisms in the context of using
Sorafenib in combination with DC-based cellular immunotherapy.

52
References
1. Hanahan D, Weinberg R. Hallmarks of cancer: The next generation. Cell.
2011;144(5):646-674.
2. Folkman J. Tumor angiogenesis: Therapeutic implications. N Engl J Med.
1971;285(21):1182-1186.
3. Folkman J. Role of angiogenesis in tumor growth and metastasis. Semin Oncol.
2002;29(6 Suppl 16):15-18.
4. Presta LG, Chen H, O'Connor SJ, et al. Humanization of an anti-vascular endothelial
growth factor monoclonal antibody for the therapy of solid tumors and other disorders.
Cancer Res. 1997;57(20):4593-4599.
5. Casanovas O, Hicklin DJ, Bergers G, Hanahan D. Drug resistance by evasion of
antiangiogenic targeting of VEGF signaling in late-stage pancreatic islet tumors. Cancer
Cell. 2005;8(4):299-309.
6. Ferrara N, Hillan KJ, Gerber HP, Novotny W. Discovery and development of
bevacizumab, an anti-VEGF antibody for treating cancer. Nat Rev Drug Discov.
2004;3(5):391-400.
7. Fan F, Schimming A, Jaeger D, Podar K. Targeting the tumor microenvironment:
Focus on angiogenesis. J Oncol. 2012;2012:281261.
53
8. Petrelli A, Giordano S. From single- to multi-target drugs in cancer therapy: When
aspecificity becomes an advantage. Curr Med Chem. 2008;15(5):422-432.
9. Zitvogel L, Apetoh L, Ghiringhelli F, Andre F, Tesniere A, Kroemer G. The anticancer
immune response: Indispensable for therapeutic success? J Clin Invest.
2008;118(6):1991-2001.
10. Emens LA. Re-purposing cancer therapeutics for breast cancer immunotherapy.
Cancer Immunol Immunother. 2012;61(8):1299-1305.
11. Manning EA, Ullman JGM, Leatherman JM, et al. A vascular endothelial growth
factor receptor-2 inhibitor enhances antitumor immunity through an immune-based
mechanism. Clinical Cancer Research. 2007;13(13):3951-3959.
12. Ozao-Choy J, Ma G, Kao J, et al. The novel role of tyrosine kinase inhibitor in the
reversal of immune suppression and modulation of tumor microenvironment for immune-
based cancer therapies. Cancer Res. 2009;69(6):2514-2522.
13. Abe F, Younos I, Westphal S, et al. Therapeutic activity of sunitinib for Her2/neu
induced mammary cancer in FVB mice. Int Immunopharmacol. 2010;10(1):140-145.
14. Wilhelm SM, Carter C, Tang L, et al. BAY 43-9006 exhibits broad spectrum oral
antitumor activity and targets the RAF/MEK/ERK pathway and receptor tyrosine kinases
involved in tumor progression and angiogenesis. Cancer Research. 2004;64(19):7099-
7109.

54
15. Kane RC, Farrell AT, Saber H, et al. Sorafenib for the treatment of advanced renal
cell carcinoma. Clin Cancer Res. 2006;12(24):7271-7278.
16. Kane RC, Farrell AT, Madabushi R, et al. Sorafenib for the treatment of unresectable
hepatocellular carcinoma. Oncologist. 2009;14(1):95-100.
17. U.S. Department of Health and Human Services. Sorafenib (NEXAVAR).
http://www.fda.gov/Drugs/InformationOnDrugs/ApprovedDrugs/ucm376547.htm.
Updated 11/25/2013. Accessed 02/18, 2014.
18. Busse A, Asemissen AM, Nonnenmacher A, et al. Immunomodulatory effects of
sorafenib on peripheral immune effector cells in metastatic renal cell carcinoma. Eur J
Cancer. 2011;47(5):690-696.
19. Hipp MM, Hilf N, Walter S, et al. Sorafenib, but not sunitinib, affects function of
dendritic cells and induction of primary immune responses. Blood. 2008;111(12):5610-
5620.
20. Houben R, Voigt H, Noelke C, Hofmeister V, Becker JC, Schrama D. MAPK-
independent impairment of T-cell responses by the multikinase inhibitor sorafenib. Mol
Cancer Ther. 2009;8(2):433-440.
21. Zhao W, Gu YH, Song R, Qu BQ, Xu Q. Sorafenib inhibits activation of human
peripheral blood T cells by targeting LCK phosphorylation. Leukemia. 2008;22(6):1226-
1233.

55
22. Reilly RT, Gottlieb MBC, Ercolini AM, et al. HER-2/neu is a tumor rejection target
in tolerized HER-2/neu transgenic mice. Cancer Research. 2000;60(13):3569-3576.
23. Anderson AA, Child ES, Prasad A, Elphick LM, Mann DJ. Cyclin D1 and cyclin D3
show divergent responses to distinct mitogenic stimulation. J Cell Physiol.
2010;225(3):638-645.
24. Liu L, Cao Y, Chen C, et al. Sorafenib blocks the RAF/MEK/ERK pathway, inhibits
tumor angiogenesis, and induces tumor cell apoptosis in hepatocellular carcinoma model
PLC/PRF/5. Cancer Res. 2006;66(24):11851-11858.
25. Ambrosini G, Cheema HS, Seelman S, et al. Sorafenib inhibits growth and mitogen-
activated protein kinase signaling in malignant peripheral nerve sheath cells. Mol Cancer
Ther. 2008;7(4):890-896.
26. Peng CL, Guo W, Ji T, et al. Sorafenib induces growth inhibition and apoptosis in
human synovial sarcoma cells via inhibiting the RAF/MEK/ERK signaling pathway.
Cancer Biol Ther. 2009;8(18):1729-1736.
27. Ou DL, Shen YC, Liang JD, et al. Induction of bim expression contributes to the
antitumor synergy between sorafenib and mitogen-activated protein kinase/extracellular
signal-regulated kinase kinase inhibitor CI-1040 in hepatocellular carcinoma. Clin
Cancer Res. 2009;15(18):5820-5828.
56
28. Carlo-Stella C, Locatelli SL, Giacomini A, et al. Sorafenib inhibits lymphoma
xenografts by targeting MAPK/ERK and AKT pathways in tumor and vascular cells.
PLoS One. 2013;8(4):e61603.
29. Zhang Q, Sakamoto K, Liu C, et al. Cyclin D3 compensates for the loss of cyclin D1
during ErbB2-induced mammary tumor initiation and progression. Cancer Res.
2011;71(24):7513-7524.
30. Wilhelm S, Chien DS. BAY 43-9006: Preclinical data. Curr Pharm Des.
2002;8(25):2255-2257.
31. Cabrera R, Ararat M, Xu Y, et al. Immune modulation of effector CD4+ and
regulatory T cell function by sorafenib in patients with hepatocellular carcinoma. Cancer
Immunol Immunother. 2013;62(4):737-746.
32. Lin JC, Liu CL, Lee JJ, et al. Sorafenib induces autophagy and suppresses activation
of human macrophage. Int Immunopharmacol. 2013;15(2):333-339.
33. Chen ML, Yan BS, Lu WC, et al. Sorafenib relieves cell-intrinsic and cell-extrinsic
inhibitions of effector T cells in tumor microenvironment to augment antitumor
immunity. Int J Cancer. 2014;134(2):319-331.
34. Schoenfeld JD, Dranoff G. Anti-angiogenesis immunotherapy. Hum Vaccin.
2011;7(9):976-981.
35. Ott PA, Adams S. Small-molecule protein kinase inhibitors and their effects on the
immune system: Implications for cancer treatment. Immunotherapy. 2011;3(2):213-227.

57
36. Huang Y, Goel S, Duda DG, Fukumura D, Jain RK. Vascular normalization as an
emerging strategy to enhance cancer immunotherapy. Cancer Res. 2013;73(10):2943-
2948.
58
Chapter 3: The Immunomodulatory Effects of Sorafenib on T cells
Introduction:
Anti-tumor responses mediated by T cells are essential for successful tumor cell
destruction. Antigen-targeted CTLs can exit the thymus and may be able to recognize
altered self-antigens that are present on the tumor. However, peripheral immune tolerance
and escape mechanisms active within the tumor microenvironment often result in impaired
T cell function such as reduced cytokine production as well as hypo-responsiveness to
antigenic re-stimulation1,2.
In addition to overall decreased T effector cell function within the tumor, the presence of
Tregs characterized by the expression of FoxP3 can also hinder productive effector T cell
(Teff) responses. Tregs are a subset of CD4+ T cells that are specialized in suppressing T
cell proliferation through the production of cytokines such as IL-10 and TGF. Under
normal conditions, Tregs represent up to 5% to 10% of peripheral CD4+ T cells and are
responsible for maintaining and controlling immunological self-tolerance4. Increased
peripheral blood CD4+ CD25+ Tregs have been reported in breast cancer patients 5.
In addition to its cytotoxic and anti-angiogenic properties, the TKI, Sorafenib, has been
reported to have T cell-modulating activity. For example, RCC patients receiving
Sorafenib treatment were reported to have decreased tumor-promoting T regulatory cells
in peripheral blood as well as within the tumor, resulting in increased Teff responses. Low
doses of Sorafenib have been shown to increase Teff proliferation and IL-2 secretion in
vitro and induce a Th1 dominant response in vivo in patients with HCC6-8. Conversely,
studies have also shown that Sorafenib may inhibit T cell responses through inhibiting
59
peripheral T cell proliferation and altering LCK phosphorylation9. Reports also show a
decrease in antigen specific T cell responses with Sorafenib treatment10. It is unknown
whether or not these immune modulating effects are present during Sorafenib treatment of
breast cancer.
In Chapter 2, it was demonstrated that Sorafenib treatment is effective as a single agent in
enhancing tumor resolution in FVB/N mice with orthotopically implanted NT2.5
mammary tumors. Additionally, depletion studies showed the mechanism of Sorafenib is,
at least in part, dependent on the presence of both CD4+ and CD8+ T cells (Ch2, Figure
3A & 3B). These studies aim to determine the effect of Sorafenib on both effector and
regulatory T cells using both in vitro and in vivo murine models of HER2 over-expressing
breast tumors.
It was hypothesized that Sorafenib would augment anti-tumor effector T cell responses to
promote tumor clearance. To address this hypothesis, the effects of Sorafenib on CD4+
and CD8+ T cells in vitro were characterized. The effect of Sorafenib on Teff and Treg
activation, proliferation, and cytokine production was also examined. The effect of
Sorafenib on Th1 cell cytokine production specifically was examined. Finally, the effect
of Sorafenib on tumor infiltrating T cells in vivo was analyzed. While in vitro studies
suggest that Sorafenib inhibits T cell proliferation and cytokine secretion, in vivo data does
not corroborate these results. Therefore, the environments in which experiments are
carried out are an important factor in evaluating the effect of Sorafenib on immune cells,
specifically T cells. These results reiterate the complexities of the cellular interactions
within the tumor microenvironment and suggest that there may be other, yet undetermined,
immune mechanisms of Sorafenib-mediated tumor clearance.

60
Materials and Methods:
Mice
FVB/N mice were purchased from Harlan (Frederick, MD). FVB/N FoxP3-GFP mice were
maintained in house. OT-1 OVA TCR transgenic mice and 6.5 HA-TCR transgenic mice
were donated from the laboratory of Dr. Charles Drake at Johns Hopkins School of
Medicine. Experiments were done with 8 to 12 week old mice. Animals were housed in
pathogen-free conditions and were treated in accordance with institutional and AAALAC
policies. All protocols were approved by the Animal Care and Use Committee of Johns
Hopkins University.
Reagents
Sorafenib was purchased from LC Laboratories (Woburn, MA). CD4 Pacific Blue, CD8
FITC, FoxP3 PE, CD25 PE, IFNg-PeCy7, IL-17 Percp5.5, TNF AF700, IL-2 APC, Tbet
PE antibodies were obtained from eBioscience. Dynabeads Mouse T-Activator
CD3/CD28 for T-Cell Expansion and Activation (Anti-CD3/anti-CD28 beads) and
Carboxyfluorescein succinimidyl ester (CFSE) were purchased from Life Technologies.
Human recombinant IL-2 was purchased from R&D Systems. Mouse recombinant soluble
anti-mouse CD3 and CD28, and mouse recombinant IFN, IL-2 and IL-12 were donated
by the laboratory of Dr. Jonathon Powell at Johns Hopkins School of Medicine. OVA and
HA peptides were donated by the laboratory of Dr. Charles Drake at Johns Hopkins School
of Medicine.
Cell Lines and Media
The NT2.5 tumor cell line, derived from a spontaneous tumor of a neu-N transgenic mouse,
was grown as previously described11.
61
Antigen Specific T Cell Proliferation Assays
Splenic CD8+ T cells from OT-1 mice or CD4+ T cells from HA transgenic mice were
isolated by negative isolation following the package instructions (Dynabeads, Life
Technologies). Cells were labeled with CFSE as per package instructions and cells were
plated in 96 well at 106 cells/ml with 20ng/l IL-2 in the presence or absence of 1ng/ml of
peptide (OVA, CD8+ T cells and HA, CD4+ T cells) in the presence or absence of 0.1uM,
1uM, or 10uM Sorafenib. Control wells contained equivalent amounts of DMSO. Cells
were incubated at 37oC for 3 days and samples were run on Beckman Coulter Galios Flow
Cytometer to analyze CFSE incorporation. 7-AAD was used to stain for live cells and
analysis was performed on live cells based on 7-AAD negativity. For CD8+ T cell assays,
half of the cells were fixed and permeabilized with FoxP3- staining buffer set (eBioscience)
and stained with IFN APC.
Th1 skewing experiments
3g/ml anti-CD3 in PBS was added to 6 well plates and incubated for 2 hours at 37oC.
Splenic CD4+ T cells were negatively isolated from FVB/N mice using Dynabeads No
Touch CD4+ T cell isolation kit (Invitrogen). 2 × 10⁵ cells were placed in each well of a
96 well plate. IFNIL-12 and IL-2 were added to induce Th1 cytokine production. All
wells received 2g/ml soluble anti-mouse CD28. Sorafenib treated wells received 8M
Sorafenib. The amount of DMSO was normalized for all wells in the experiment. Cells
were incubated at 37oC for 3 days and cells were stained for CD4 and fixed and
permeabilized with FoxP3 Staining Buffer Kit (eBioscience) and stained for IL-2 APC,
IFN PECy7, TNF AF700, and Tbet PE and run on Beckman Coulter Galios Flow
Cytometer. Results were analyzed using FlowJo Analysis software.

62
Treg proliferation Experiments
Splenic CD4+ T cells from FVB/N-FoxP3-GFP were isolated by negative isolation.
FoxP3+GFP+ cells (Tregs) were sorted using Cell Sorting Facility at Johns Hopkins School
of Medicine. CD4+ FoxP3- cells (Teff) were also collected. Cells were labeled with Cell
Proliferation Dye eFluor® 670 (Ebioscience) and 105 Tregs or Teff were plated in the
presence of 4M or 8M Sorafenib with anti-CD3/anti-CD28 beads and 30U/ml rIL-2.
The amount of DMSO was normalized for all wells in the experiment. Separately, 2×10⁵
cells were plated in triplicate for overnight culture without anti-CD3/anti-CD28 stimulation
for analysis of surface marker staining of FoxP3 and CD25. After 3 days, stimulation at
37oC, the cells were stained for surface CD4 and CD4+ FoxP3+ cells were analyzed for
proliferation by running samples on the Beckman Coulter Galios Flow Cytometer.
Treg Suppression Assay
Splenic CD4+ T cell were isolated from FVB/N mice by negative isolation. Tregs were
then selected for using CD4+CD25+ Regulatory T Cell Isolation Kit (MACs Miltenyi
Biotec). Tregs were treated for 24 hours with 0mM, 0.1M, 1M, or 10M Sorafenib.
The following day CD4+ Teff were isolated from the spleens of FVB/N mice by negative
isolation. Teffs were labeled with CFSE. Sorafenib was removed from Treg cultures and
cells were washed with serum-free media and 105 Teff cells were plated with the following
ratio Teff: Treg: 1:0, 1:1, 2:1, and 5:1 in the presence 0.5l anti-CD3/anti-CD28 beads.
This amount was experimentally determined to be appropriate to allow suppression of
proliferation in the presence of Treg cells at a 1:1 ratio of Tregs to Teffs. Teffs were
analyzed for CFSE after 3 days in culture by flow cytometry.

63
Tumor-infiltrating T cell analysis
FVB/N mice were challenged subcutaneously with 5×10⁶ NT2.5 tumor cells in the right
mammary fat pad, followed by treatment 10-14 days later. Sorafenib (30mg/kg) was
administered in 100μl daily Monday through Friday by oral gavage with a feeding needle.
A viscous vehicle composed of 30% (w/v) Cremophor EL, 30% (w/v) PEG 400, and 10%
ethanol, 10% glucose (Sigma-Aldrich) was used both to dissolve Sorafenib and
administered as the vehicle treatment control. Mice were monitored for tumor growth and
onset twice weekly. Tumor growth was determined by measuring tumor diameter in two
perpendicular dimensions with calipers Mice were treated for 12 days and then tumors and
spleens were harvested. At this time point, there was a statistically significant difference
in tumor size between vehicle and Sorafenib treated tumors (Chapter 2, Figure 3A & 3B).
Tumors were digested with Liberase TM (Roche) for 30 minutes and the single cell
suspension was stained for CD4 and CD8 and then fixed and permeabilized and stained for
intracellular IL2, IFN, FoxP3, IL17, and TNFeBioscience) and run on the Beckman
Coulter Galios Flow Cytometer. Results were analyzed with FlowJo analysis software.
Statistical Analysis
Statistical analysis was conducted either in Microsoft Excel or GraphPad Software using
an unpaired, two-tailed Student’s t-test, assuming equal population variances to determine
the statistical significance between treatment groups. P<0.05 was considered to be
significant
64
Results:
Sorafenib inhibits antigen specific T cell proliferation in vitro
In order to determine potential immunomodulatory effect of Sorafenib on T cells, the effect
of Sorafenib on T cell proliferation, cytokine production, and function in vitro was
examined. OT-1 splenic CD8+ T cells pulsed with OVA peptide were used to analyze
antigen-specific CD8+ T cells as it is a well-established model of antigen-specific CD8+
T cell proliferation and it has been previously used to study the effect of Sorafenib on T
cell proliferation in vitro10,12. There was a concentration dependent decrease in the amount
of OVA-specific CD8+ T cell proliferation with increasing concentrations of Sorafenib
(Figure 4A). Sorafenib treatment also resulted in a decrease in proliferation of CD8+ T
cells in culture in the absence of peptide. IFN production by CD8+ T pulsed with OVA
peptide also decreased with Sorafenib treatment (Figure 4B).
To analyze antigen-specific CD4+ T cell responses, HA-specific T cell responses were
measured in 6.5 splenic CD4+ T cells. This model is a well-established model of antigen-
specific CD4+ T cell proliferation in vitro13. High concentrations of Sorafenib resulted in
decreased proliferation in CD4+ T cells pulsed with HA peptide (Figure 4C). Taken
together, these data confirm previous studies that Sorafenib can impair T cell proliferation
in vitro6,9,10.
Sorafenib inhibits cytokine production of Th1 CD4+ T cells in vitro
Productive anti-tumor immune responses usually coincide with a Th1-type immune
response, indicated by the presence of Th1- CD4+ T helper cells that secrete pro-
inflammatory cytokines such as IFN, TNF, IL-2, and lymphotoxin14. Therefore, the
65
ability of Sorafenib to promote the production of Th1 cytokines, TNF, IL-2, and IFN in
CD4+ T cells was examined in vitro. CD4+ T cells in the presence of Th1 cytokines and
soluble CD28 showed increased IFN when compared to control cells that received
soluble CD28 alone. Treatment of splenic CD4+ T cells with Th1 skewing cytokines and
soluble CD28 in the presence of Sorafenib resulted in decreased production of TNF, IL-
2, and IFN Specifically, IFNproduction decreased from 35% to 15% with Sorafenib
treatment. CD4+ T cells that received only CD28 alone displayed increased TNF and IL-
2 production when compared to cells treated with Th1 skewing cytokines in the presence
of Sorafenib. (Figure 5A-5C). The effect of Sorafenib treatment on Tbet, the master-
regulator transcription factor of Th1 cell fates, was also analyzed (Figure 5D). Treatment
with Sorafenib did not alter Tbet expression in the CD4+ T cells in the presence of Th1
cytokines and soluble CD28.
Sorafenib alters the proliferation, activation, and function of Tregs in vitro
Reduction in number or function of suppressive Treg populations can result in enhanced T
cell-mediated tumor clearance. Preferentially targeting Tregs, leaving effector cell
populations unharmed, have been shown to be an effective mechanism to improve anti-
tumor immunity in Sorafenib- treated HCC patients8. Therefore, the ability of Sorafenib
to target CD4+ Treg proliferation was explored in vitro. Sorafenib treatment of splenic
CD4+ FoxP3+Tregs resulted in decreased cell proliferation in response to TCR stimulus
with CD3/ CD28 beads. A decrease in proliferation was similarly observed in CD4+
FoxP3- T effector cells treated with Sorafenib (Figure 6A). Taken together, these data
66
indicate that in vitro treatment of CD4+ T cells with Sorafenib results in diminished cell
proliferation, irrespective of cell function.
Phenotypic markers CD25 and FoxP3 have been shown to correlate with the suppressive
capacity of Tregs15,16. Therefore, the effect of Sorafenib treatment on the expression of
CD25 and FoxP3 in Tregs was also analyzed. The percentage of CD25+ FoxP3+ Tregs
was largely unchanged after 24 hours treatment with Sorafenib (Figure 6B & 6C).
However, increasing concentrations of Sorafenib did cause a significant decrease in
relative expression of both CD25 and FoxP3 measured by decreased mean fluorescence
intensity by flow cytometry analysis (Figure 6D & 6E).
To further examine if the observed decrease in these Treg phenotypic markers
corresponded to altered Treg suppressive activity in this system, Sorafenib-treated Tregs
were analyzed for suppressive function in vitro. Tregs were treated with Sorafenib 24
hours prior to the addition of CFSE-labeled CD4+ effector cells (Teff) at increasing cell
ratios of Tregs to effector cells. At lower Treg to Teff cell ratios (1:5), higher
concentrations of Sorafenib significantly decreased the suppressive capacity of Tregs in
culture compared to untreated Tregs as evidenced by increased CD4+ effector T cell
proliferation at these ratios(Figure 6F). Taken together, these data indicate that Sorafenib
decreased the proliferation and activation of Tregs in vitro as well as decreased their
suppressive capacity at physiological Treg to Teff cell ratios. However, Sorafenib is not
potent enough to inhibit Tregs at high Treg to Teff cell ratios (1:1).

67
Sorafenib does not affect infiltration or cytokine production of TILs
The effect of Sorafenib on tumor-infiltrating T cells (TILs) was then examined. TILs from
NT2.5 tumors in FVB/N mice treated with Sorafenib or vehicle control were analyzed by
flow cytometry. TILs isolated from tumors of Sorafenib-treated mice and vehicle treated
mice showed a relatively similar composition of both CD8+ T cells and CD4+ T cells.
Intracellular staining showed no differences in the cytokine profiles of CD8+ or CD4+ T
cells. Finally, there was no difference in the percentage of CD4+FoxP3+ T cells infiltrating
the tumors of either treatment group.

68
Figures:
Figure 4: Sorafenib inhibits antigen specific T cell proliferation and cytokine
production in vitro.
A, Proliferation of CFSE-labeled splenic CD8+ from OT-1 transgenic mice in response to
OVA peptide stimulation for 3 days in the presence or absence of Sorafenib. B, IFN
production of the CD8+ T cells from A. C, Proliferation of CD4+ T cells from 6.5
transgenic mice in response to HA peptide stimulation for 3 days in the presence of
Sorafenib.
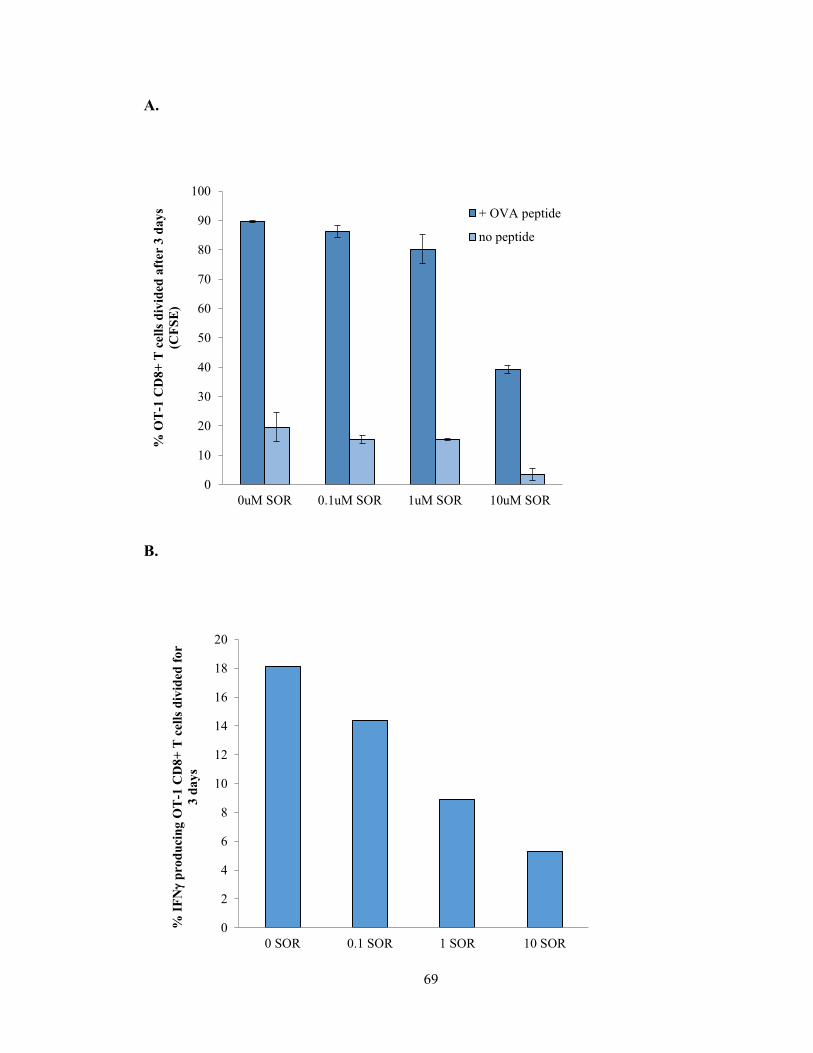
69
A.
B.
0
10
20
30
40
50
60
70
80
90
100
0uM SOR 0.1uM SOR 1uM SOR 10uM SOR
% O
T-1
CD
8+
T c
ell
s d
ivid
ed a
fter
3 d
ay
s
(CF
SE
)
+ OVA peptide
no peptide
0
2
4
6
8
10
12
14
16
18
20
0 SOR 0.1 SOR 1 SOR 10 SOR
% I
FN
pro
du
cin
g O
T-1
CD
8+
T c
ell
s d
ivid
ed f
or
3 d
ay
s

70
C.
0
10
20
30
40
50
60
70
80
90
no peptide 0uM SOR 0.1uM SOR 1uM SOR 10uM SOR% 6
.5 C
D4
+ T
cell
pro
life
rati
on
aft
er 3
d w
ith
HA
pep
tid
e (C
FS
E)
71
Figure 5: Sorafenib inhibits cytokine production of Th1-skewed cells in vitro
FVB/N splenic CD4+ T cells were negatively isolated and plated at with or without Th1-
skewing cytokines IFN, IL-12 and IL-2 in the presence of 2g/ml soluble anti-mouse
CD28 and plate-bound anti-mouse CD3. Sorafenib treated wells received 8M Sorafenib.
After 3 days cells were analyzed by ICS for IFNA, TNF, B, and IL-2, C. Tbet levels,
D, and relative expression was also analyzed, E.

72
A. B. C.
D. E.
73
Figure 6: Sorafenib alters the proliferation, activation, and function of Tregs in vitro
A, Splenic FoxP3+GFP+ CD4+ T cells (Tregs) and CD4+ FoxP3- CD4+ T cells (Teff)
were collected. 105 Tregs or Teff were plated in the presence of 4M or 8M Sorafenib
with 0.5l anti-CD3/anti-CD28 beads and proliferation was analyzed after 3 days in
culture. B, 2×10⁵ FoxP3+GFP+ CD4+ cells were plated in triplicate for overnight culture
with Sorafenib and stained for surface markers FoxP3 and CD25. Relative expression of
FoxP3, C, and CD25, D, was also analyzed. CD4+ CD25+ cells were used as Tregs and
treated overnight in culture with 0M, 0.1M, 1M, and 10M Sorafenib. After 24 hours,
CD4+ Teff were isolated and were labeled with CFSE. Sorafenib was removed from Treg
cultures and Teff cells were plated at the following ratios of Treg:Teff, with 105 Teff
staying constant: 0:1, 1:1, 1:2, and 1:5 in the presence of 0.5l of anti-CD3/anti-CD28
beads. E, Proliferation was analyzed after 3 days by CFSE incorporation in Teffs. *, P <
0.05, **, P < 0.005, ***, P < 0.001.
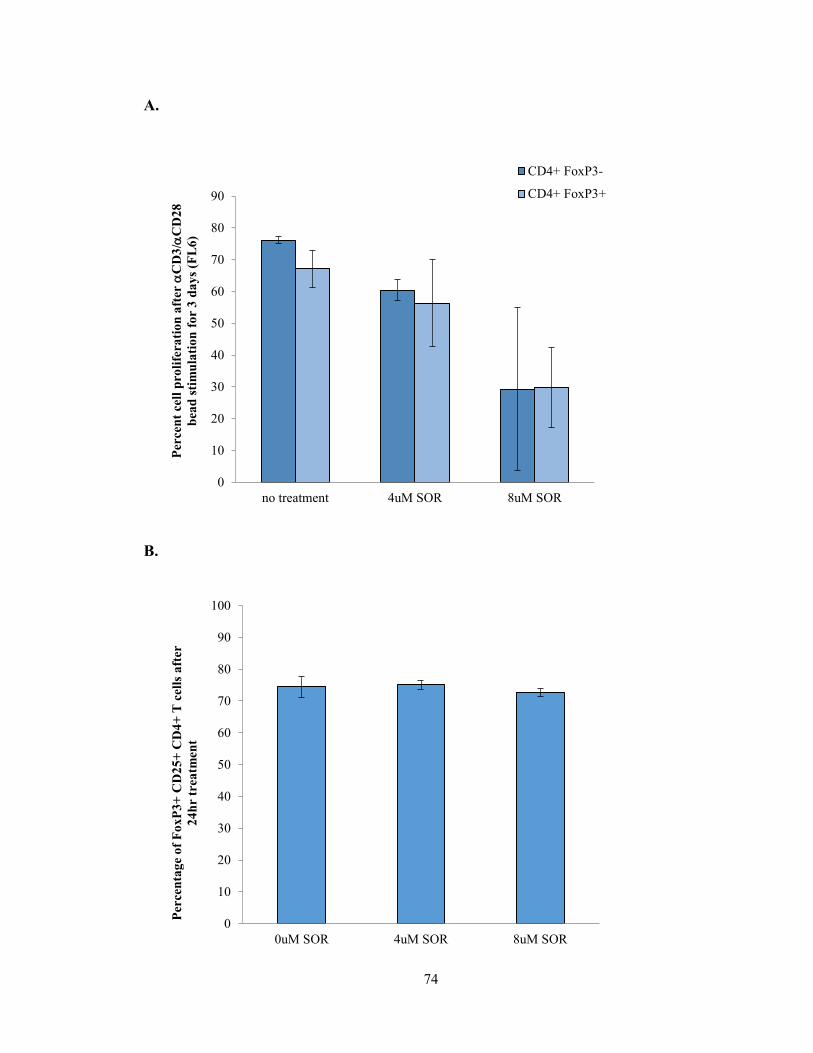
74
A.
B.
0
10
20
30
40
50
60
70
80
90
no treatment 4uM SOR 8uM SOR
Per
cen
t ce
ll p
roli
fera
tio
n a
fter
C
D3
/C
D2
8
bea
d s
tim
ula
tio
n f
or
3 d
ay
s (F
L6
)
CD4+ FoxP3-
CD4+ FoxP3+
0
10
20
30
40
50
60
70
80
90
100
0uM SOR 4uM SOR 8uM SOR
Per
cen
tag
e o
f F
oxP
3+
CD
25
+ C
D4
+ T
cell
s a
fter
24
hr
trea
tmen
t
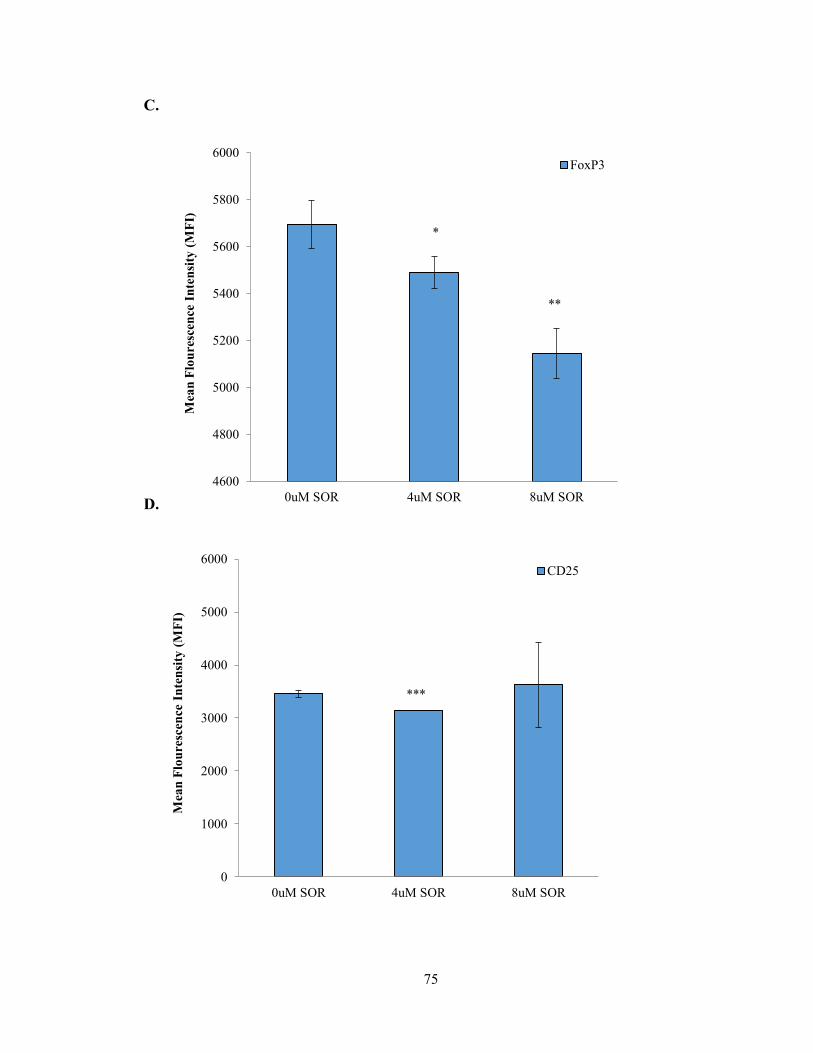
75
C.
D.
4600
4800
5000
5200
5400
5600
5800
6000
0uM SOR 4uM SOR 8uM SOR
Mea
n F
lou
resc
ence
In
ten
sity
(M
FI)
FoxP3
*
**
0
1000
2000
3000
4000
5000
6000
0uM SOR 4uM SOR 8uM SOR
Mea
n F
lou
resc
ence
In
ten
sity
(M
FI)
CD25
***
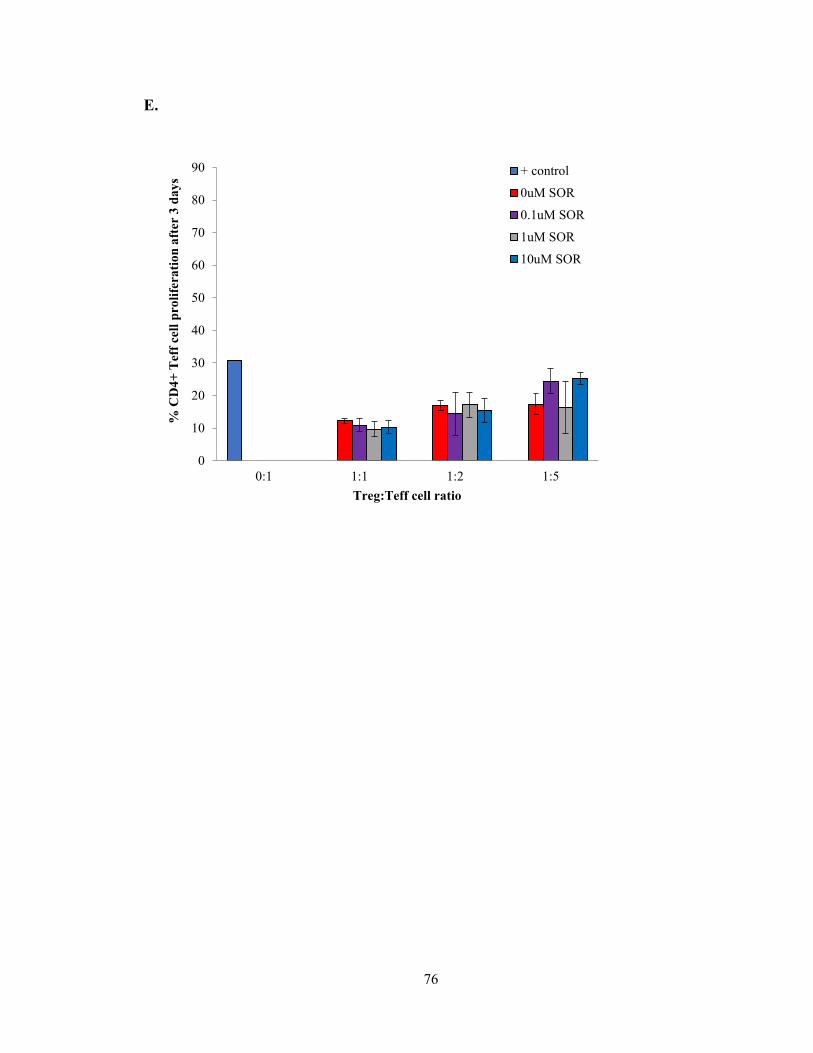
76
E.
0
10
20
30
40
50
60
70
80
90
0:1 1:1 1:2 1:5
% C
D4
+ T
eff
cell
pro
life
rati
on
aft
er 3
da
ys
Treg:Teff cell ratio
+ control
0uM SOR
0.1uM SOR
1uM SOR
10uM SOR
77
Figure 7: Sorafenib does not alter tumor-infiltrating T cell number or cytokine
production in vivo
FVB/N mice were challenged subcutaneously with 5×10⁶ NT2.5 tumor cells. After 10
days, mice were treated with Sorafenib (30mg/kg) for 12 days and then tumors were
harvested and digested. Single cell suspension was stained for A, CD4 and B, CD8 and
then fixed and permeabilized and stained for intracellular , IFN, C and F, TNFD and
G, IL2, E and H, and FoxP3, I.
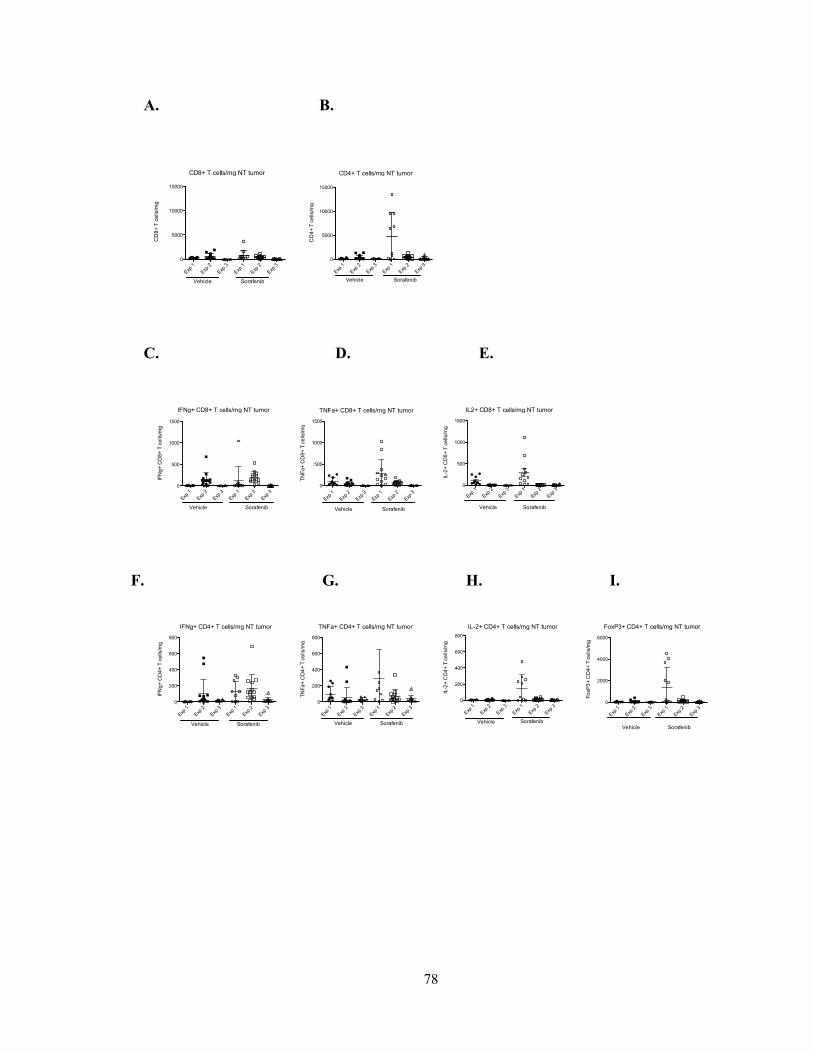
78
A. B.
C. D. E.
CD8+ T cells/mg NT tumor
Exp
1
Exp
2
Exp
3
Exp
1
Exp
2
Exp
3
0
5000
10000
15000
Vehicle Sorafenib
CD
8+
T c
ells
/mg
CD4+ T cells/mg NT tumor
Exp
1
Exp
2
Exp
3
Exp
1
Exp
2
Exp
3
0
5000
10000
15000
Vehicle Sorafenib
CD
4+
T c
ells
/mg
IFNg+ CD8+ T cells/mg NT tumor
Exp
1
Exp
2
Exp
3
Exp
1
Exp
2
Exp
3
0
500
1000
1500
Vehicle Sorafenib
IFN
g+
CD
8+
T c
ells/m
g
IFNg+ CD4+ T cells/mg NT tumor
Exp 1
Exp 2
Exp 3
Exp 1
Exp 2
Exp 3
0
200
400
600
800
Vehicle Sorafenib
IFN
g+
CD
4+
T c
ells
/mg
TNFa+ CD8+ T cells/mg NT tumor
Exp 1
Exp 2
Exp 3
Exp 1
Exp 2
Exp 3
0
500
1000
1500
Vehicle Sorafenib
TN
Fa
+ C
D8
+ T
ce
lls/m
g
TNFa+ CD4+ T cells/mg NT tumor
Exp
1
Exp
2
Exp
3
Exp
1
Exp
2
Exp
3
0
200
400
600
800
Vehicle Sorafenib
TN
Fa
+ C
D4
+ T
ce
lls/m
g
IL2+ CD8+ T cells/mg NT tumor
Exp
1
Exp
2
Exp
3
Exp
1
Exp
2
Exp
30
500
1000
1500
Vehicle Sorafenib
IL-2
+ C
D8
+ T
ce
lls/m
g
IL-2+ CD4+ T cells/mg NT tumor
Exp
1
Exp
2
Exp
3
Exp
1
Exp
2
Exp
3
0
200
400
600
800
Vehicle Sorafenib
IL-2
+ C
D4
+ T
ce
lls/m
g
FoxP3+ CD4+ T cells/mg NT tumor
Exp 1
Exp 2
Exp 3
Exp 1
Exp 2
Exp 3
0
2000
4000
6000
Vehicle Sorafenib
Fo
xP
3+
CD
4+
T c
ells/m
gF. G. H. I.

79
Conclusions:
The data presented here confirm previous findings that Sorafenib inhibits T cell
proliferation and cytokine production in vitro. Additionally, these data expand upon
previous studies, elucidating a potential mechanism by which Sorafenib may inhibit Tregs
in vitro through alterations in activation markers, CD25 and FoxP3, decreasing suppressor
function. Lastly, these data support a new finding that, in contrast to in vitro observations,
Sorafenib treatment does not inhibit T cell infiltration or cytokine production at the tumor
site in vivo.
The ability of Sorafenib to inhibit T cells has been well documented. In 2008, Hipp et al.
showed inhibition of OVA-specific CD8+ T cell responses in vivo in mice pre-treated with
Sorafenib followed by peptide vaccination with adjuvant10. In the same year, W. Zhoa and
colleagues published that off target effects of Sorafenib target LCK phosphorylation,
thereby inhibiting the activation of human peripheral T cells9. In 2009, R. Houben and
colleagues showed a decrease in survivin-specific T cell responses in melanoma patients
vaccinated against survivin with Sorafenib treatment6. In Chapter 2, it was reported that
Sorafenib treatment augmented NT2.5 tumor clearance in FVB/N mice by a T cell-
dependent mechanism. Given the myriad proposed T cell effects potentiated by Sorafenib,
it was necessary to evaluate the in vitro and in vivo effects of Sorafenib in this model
system.
The previously published OT-1-OVA system and 6.5-HA system were used to analyze in
vitro effects of Sorafenib on T cell proliferation. Both antigen specific CD8+ and CD4+ T
cells showed decrease in proliferation in response to peptide with Sorafenib treatment.
80
CD8+ IFN production also decreased in the presence of Sorafenib. These data are
consistent with prior studies demonstrating that Sorafenib decreased T cell proliferation
and cytokine production in vitro6,9,10. The data presented here also expands upon these
studies to analyze the effect of Sorafenib specifically on Th1 cytokine production. While
Sorafenib treatment decreased the production of Th1 cytokines, specifically, IFN
does not affect the expression of Tbet. This suggests that Sorafenib may not be
permanently affecting licensing of CD4+ T cells to become Th1 cells, however this remains
unknown.
Conversely, several groups have shown a positive impact of Sorafenib treatment through
modulating T regulatory cells both in mice and humans 7,8,17-19. In HCC patients receiving
Sorafenib therapy, decreased peripheral Tregs corresponded to increased clinical benefit18.
The in vitro data presented here support these previous findings showing that Sorafenib
can decrease Treg proliferation, phenotypic activation markers, and function. In vitro,
Sorafenib inhibits proliferation and significantly decreases the expression of CD25 and
FoxP3 on Tregs. This decrease in expression of activation marker corresponds to a
decrease in suppressive function. At physiologically relevant cell ratios of Treg to Teff,
Sorafenib treatment results in a significant decrease in the ability of Tregs to suppressive
the proliferation of CD4+ T effector cells. It is also possible that at lower ratios of
Tregs:Teff, Sorafenib pre-treatment of Tregs altered cell viability, therefore, these results
may also be explained by a diminished number of Tregs rather than decreased suppressive
capacity. This could be reconciled in the future by verifying the viability of the Tregs at
the assay endpoint.
81
In contrast to in vitro observations, in vivo, there were no differences between the absolute
numbers of infiltrating T cells, nor were there measurable differences in the cytokine
profiles of CD4+ or CD8+ T cells as a result of Sorafenib treatment. Sorafenib treatment
does not inhibit T cell alter trafficking of T cells to the tumor, nor does it modify cytokine
production by T cells at the tumor site. Additionally, there were no differences in the
number of tumor-infiltrating FoxP3+ T cells, contrasting reports published in HCC18,19. It
remains unknown as to whether Sorafenib treatment affects the function of tumor-
infiltrating Tregs in vivo.
Mounting a successful immune response within the tumor microenvironment is complex,
the mechanisms of which are still under active investigation. Immune-mediated tumor
clearance relies on the ability of effector T cells to enter the tumor, secrete cytokines and
actively kill tumor cells. According to the data presented here, Sorafenib does not improve
T cell infiltration into the tumor nor does it enhance cytokine production by effector cells.
Additionally, it does not reduce the percentage of suppressive Treg at the tumor site.
However, the effect of Sorafenib on other effector functions of the infiltrating cells besides
cytokine secretion, such as killing, remains unknown. Additionally, it is possible that
Sorafenib may be targeting other cells within the tumor to enhance clearance by T cells.
For example, Sorafenib-mediated tumor cell death may elicit increased danger signals to
promote enhanced tumor clearance20,21. Additionally, Sorafenib may be altering co-
stimulatory molecules to augment recognition of the tumor22. Also, Sorafenib treatment
may induce changes within antigen presenting cells in the tumor microenvironment,
allowing for improved priming and increased antigen presentation within the tumor. To

82
this end, the next chapter explores the immunomodulatory effects of Sorafenib on tumor-
associated macrophages.
83
References:
1. Pardoll D. DOES THE IMMUNE SYSTEM SEE TUMORS AS FOREIGN OR SELF?
Annu Rev Immunol. 2003;21(1):807-839.
2. Mittendorf EA, Sharma P. Mechanisms of T-cell inhibition: Implications for cancer
immunotherapy. Expert Rev Vaccines. 2010;9(1):89-105.
3. Vignali DA, Collison LW, Workman CJ. How regulatory T cells work. Nat Rev
Immunol. 2008;8(7):523-532.
4. Shevach EM. Biological functions of regulatory T cells. Adv Immunol. 2011;112:137-
176.
5. Liyanage UK, Moore TT, Joo HG, et al. Prevalence of regulatory T cells is increased in
peripheral blood and tumor microenvironment of patients with pancreas or breast
adenocarcinoma. J Immunol. 2002;169(5):2756-2761.
6. Houben R, Voigt H, Noelke C, Hofmeister V, Becker JC, Schrama D. MAPK-
independent impairment of T-cell responses by the multikinase inhibitor sorafenib. Mol
Cancer Ther. 2009;8(2):433-440.
7. Busse A, Asemissen AM, Nonnenmacher A, et al. Immunomodulatory effects of
sorafenib on peripheral immune effector cells in metastatic renal cell carcinoma. Eur J
Cancer. 2011;47(5):690-696.

84
8. Cabrera R, Ararat M, Xu Y, et al. Immune modulation of effector CD4+ and regulatory
T cell function by sorafenib in patients with hepatocellular carcinoma. Cancer Immunol
Immunother. 2013;62(4):737-746.
9. Zhao W, Gu YH, Song R, Qu BQ, Xu Q. Sorafenib inhibits activation of human
peripheral blood T cells by targeting LCK phosphorylation. Leukemia. 2008;22(6):1226-
1233.
10. Hipp MM, Hilf N, Walter S, et al. Sorafenib, but not sunitinib, affects function of
dendritic cells and induction of primary immune responses. Blood. 2008;111(12):5610-
5620.
11. Reilly RT, Gottlieb MBC, Ercolini AM, et al. HER-2/neu is a tumor rejection target in
tolerized HER-2/neu transgenic mice. Cancer Research. 2000;60(13):3569-3576.
12. Clarke SR, Barnden M, Kurts C, Carbone FR, Miller JF, Heath WR. Characterization
of the ovalbumin-specific TCR transgenic line OT-I: MHC elements for positive and
negative selection. Immunol Cell Biol. 2000;78(2):110-117.
13. Bot A, Casares S, Bot S, von Boehmer H, Bona C. Cellular mechanisms involved in
protection against influenza virus infection in transgenic mice expressing a TCR receptor
specific for class II hemagglutinin peptide in CD4+ and CD8+ T cells. J Immunol.
1998;160(9):4500-4507.

85
14. Mosmann TR, Cherwinski H, Bond MW, Giedlin MA, Coffman RL. Two types of
murine helper T cell clone. I. definition according to profiles of lymphokine activities and
secreted proteins. 1986. J Immunol. 2005;175(1):5-14.
15. Hori S, Nomura T, Sakaguchi S. Control of regulatory T cell development by the
transcription factor Foxp3. Science. 2003;299(5609):1057-1061.
16. Martin B, Banz A, Bienvenu B, et al. Suppression of CD4+ T lymphocyte effector
functions by CD4+CD25+ cells in vivo. J Immunol. 2004;172(6):3391-3398.
17. Cao M, Xu Y, Youn JI, et al. Kinase inhibitor sorafenib modulates immunosuppressive
cell populations in a murine liver cancer model. Lab Invest. 2011;91(4):598-608.
18. Desar IM, Jacobs JH, Hulsbergen-vandeKaa CA, et al. Sorafenib reduces the
percentage of tumour infiltrating regulatory T cells in renal cell carcinoma patients. Int J
Cancer. 2011;129(2):507-512.
19. Wang Q, Yu T, Yuan Y, et al. Sorafenib reduces hepatic infiltrated regulatory T cells
in hepatocellular carcinoma patients by suppressing TGF-beta signal. J Surg Oncol.
2013;107(4):422-427.
20. Abdulghani J, Allen JE, Dicker DT, et al. Sorafenib sensitizes solid tumors to
Apo2L/TRAIL and Apo2L/TRAIL receptor agonist antibodies by the Jak2-Stat3-Mcl1
axis. PLoS One. 2013;8(9):e75414.
86
21. Park MA, Reinehr R, Haussinger D, et al. Sorafenib activates CD95 and promotes
autophagy and cell death via src family kinases in gastrointestinal tumor cells. Mol Cancer
Ther. 2010;9(8):2220-2231.
22. Chen ML, Yan BS, Lu WC, et al. Sorafenib relieves cell-intrinsic and cell-extrinsic
inhibitions of effector T cells in tumor microenvironment to augment antitumor immunity.
Int J Cancer. 2014;134(2):319-331.

87
Chapter 4: The Immunomodulatory Effects of Sorafenib on Tumor-associated
Macrophages
Introduction:
Macrophages are mononuclear phagocytes of the innate immune system that defend the
host against harmful pathogens and heal tissues after injury. Macrophages also regulate
tissue growth, homeostasis and repair through the expression and release of a variety of
growth factors and cytokines. Macrophages phagocytose microbes and present antigens to
T cells, orchestrating the acute inflammatory response to eliminate the invading pathogens
1. Additionally, macrophages play a role as scavengers that clear tissue debris. Given
their diverse function, macrophages play a central role in inflammation, tissue remodeling,
cell growth and angiogenesis; many of these roles are known to promote tumor progression
2,3.
Macrophages are grouped into subsets based on the acquisition of distinct morphological
and functional properties directed by particular tissues or immunological
microenvironment 4,5. Classically activated inflammatory macrophages (M1) are induced
by IFNγ alone or combined with microbial stimuli, such as lipopolysaccharide (LPS), or
with other cytokines such as TNF and GM-CSF. These cells have an IL-12high, IL-23high,
IL-10low phenotype 6. Moreover, these cells are also efficient producers of effector
molecules such as reactive oxygen and nitrogen intermediates and inflammatory cytokines
such as IL-1β, TNF and IL-6. Consistent with these functional characteristics, M1
macrophages participate in Th1 responses and help mediate resistance to intracellular
infections and tumors 7.

88
In contrast, M2 or alternatively activated tissue tropic macrophages differentiate in
microenvironments rich in Th2 cytokines such as IL-4 and IL-13 and in tissues to promote
growth and development 8. These cells generally have high levels of scavenger, mannose,
and galactose-type receptors 4. Arginase expression is also increased as result in a shift in
arginine metabolism to produce ornithine and polyamines. In general, M2 cells participate
in Th2 reactions, that promote killing and encapsulation of parasites, tissue repair, and
remodeling 9-11.
Lastly, a third subset of regulatory macrophages has been described. Regulatory
macrophages exhibit an IL-12low, IL-23low, IL-10high phenotype. This results in the
secretion of high levels of anti-inflammatory interleukin IL-10 and low levels of pro-
inflammatory IL-12/23. Prostaglandin E2 (PGE2), extracellular adenosine, immune
complexes, VEGF, IL-10, and TGF-β, can all drive the regulatory macrophage phenotype
12. It has been shown that mitogen-activated protein kinase ERK plays a key role in this
process 13-15. Under conditions of strong ERK activation, the anti-inflammatory cytokine
IL-10 is upregulated and pro-inflammatory IL-12/23 is suppressed 16. Because IL-10 can
inhibit the production and activity of various pro-inflammatory cytokines, these regulatory
macrophages are potent inhibitors of inflammation.
Macrophages are a major cellular component of breast tumors, where they have been
reported to compose as much as fifty percent of the infiltrating cells. In the tumor, they
are commonly termed tumor-associated macrophages (TAMs). These macrophages change
their physiology and take on a phenotype that more closely resembles regulatory
macrophages 17. The tumor-derived agents that induce the development of these regulatory
macrophages have not been identified, but candidates include prostaglandins, hypoxia,
89
extracellular nucleotides, apoptotic cells, hyaluronan fragments and IgG 18-20, which may
work synergistically within the tumor microenvironment. Irrespective of the stimulus,
these tumor-associated macrophages produce high levels of IL-10, can inhibit immune
responses to neo-antigens expressed by tumor cells, and can de-activate neighboring
macrophages 21. Recent studies also suggest that regulatory macrophages can contribute to
angiogenesis and thereby promote tumor growth 18. Clinical and experimental evidence has
shown that cancer tissues with high infiltration of TAM are associated with poor patient
prognosis and resistance to therapies 22. There is also evidence that macrophage depletion
in some cases may even be beneficial to the host 23. Given the role of TAMs in tumor
progression, targeting of macrophages in tumors is considered a promising therapeutic
strategy, whereby depletion of TAMs or their ‘re-education’ as anti-tumor effectors is
under current investigation.
Accumulating data suggest that, in addition to inhibiting tumor cell proliferation and
angiogenesis, Sorafenib can modulate immune cell function, specifically macrophage
function. It has been previously shown that Sorafenib treatment can shift bone-marrow
derived macrophages activated with LPS and PGE2 from the pro-tumorigenic IL-10
secreting phenotype to the anti-tumor IL-12 secreting phenotype 24. Additionally it was
found that Sorafenib treatment enhances proinflammatory activity of TAMs and
subsequently induces antitumor NK cell responses in a cytokine and NF-κB-dependent
fashion. 25. Conversely, in a murine HCC model Sorafenib treatment significantly
increased peripheral recruitment and intratumoral infiltration of F4/80+CD11b+ cells and
elevated pro-tumoral and pro-angiogenic factors in the tumor and peripheral blood,
suggesting a role of macrophages in tumor progression under Sorafenib treatment.
90
Depletion of macrophages in combination with Sorafenib treatment significantly inhibited
tumor progression, tumor angiogenesis, and metastasis compared with mice treated with
Sorafenib alone. Here, these studies are extended to explore the effect of Sorafenib on
TAMs in a murine model of breast cancer.
First, the impact of Sorafenib on TAM recruitment within the tumor was analyzed. Then,
the effect of Sorafenib treatment on TAM cytokine production was examined. Finally,
functional analysis on Sorafenib-treated TAMs was performed. These data suggest that
Sorafenib may alter the activation state of TAMs to increase pro-immunogenic cytokines
and enhance CD4+ T cell proliferation.
91
Materials and Methods:
Mice
FVB/N mice were purchased from Harlan (Frederick, MD). Experiments were done with
8 to 12 week old mice. Animals were housed in pathogen-free conditions and were treated
in accordance with institutional and AAALAC policies. All protocols were approved by
the Animal Care and Use Committee of Johns Hopkins University.
Reagents
Sorafenib was purchased from LC Laboratories (Woburn, MA). CD11b FITC, MHCII PE,
CD4 Pacific Blue, and CD8 Pacific Blue antibodies were obtained from eBioscience.
Carboxyfluorescein succinimidyl ester (CFSE) were purchased from Life Technologies.
Mouse recombinant soluble anti-mouse CD3 and CD28 were donated by the laboratory of
Dr. Jonathon Powell at Johns Hopkins School of Medicine.
Cell Lines and Media
The NT2.5 tumor cell line, derived from a spontaneous tumor of a neu-N transgenic mouse,
was grown as previously described 26.
Drug treatment
FVB/N mice were challenged subcutaneously with 5×10⁶ NT2.5 tumor cells in the right
mammary fat pad, followed by vaccination 10-14 days later. Sorafenib (30mg/kg) was
administered in 100μl daily Monday through Friday by oral gavage with a feeding needle
beginning the day of vaccination. A viscous vehicle composed of 30% (w/v) Cremophor
EL, 30% (w/v) PEG 400, and 10% ethanol, 10% glucose (Sigma-Aldrich) was used both
to dissolve Sorafenib and administered as the vehicle treatment control.
92
Immunohistochemistry
Tumors harvested at day 12 post-treatment were fixed in formalin for 24 hours, paraffin-
embedded, and sectioned at 5uM by the JHMI Pathology Core. Sections were stained with
H&E or retained for immunohistochemistry at the JHMI Oncology Tissue Service Center.
F480 was analyzed with antibodies specific for F480 (Cell Signaling). Antigen retrieval
was carried out for 45 minutes in HTTR steam (Target Retrieval Solution; Dako) followed
by incubation with primary antibody for 45 minutes at room temperature. Slides were
incubated with Power Vision Poly-HRP anti-rabbit IgG secondary antibody for 30 minutes
at room temperature. Slides were developed with 3, 3’ diaminobenzidine (Sigma Fast DAB
tablets) and slides were counterstained with Mayers hematoxylin (Dako). Images were
captured under light microscopy at 20x magnification (E600, Nikon).
Tumor-associated macrophage preparations
Tumors were harvested day 12 post-treatment and suspended in 5 ml RPMI 1640
containing Liberase TM (Roche). Tumors were minced and incubated at 37°C for 30 min.
Suspensions were then passed through a 100-μm mesh nylon cell strainer (BD Falcon) to
obtain single cell suspensions. Single cell suspensions were incubated with in ACK lysing
buffer (Sigma) for 2 min at room temperature and washed twice in FACS-staining buffer
(PBS, 2% heat-inactivated FCS). Pellets were resuspended in FACs staining buffer
containing Fc Block (MACs Miltenyi Biotec) and incubated on at 40C for 20 minutes.
TAMs were incubated with FACs buffer containing biotinylated anti-F480 (eBioscience)
and isolated by positive selection (MACs Miltenyi Biotec).
Cytospins
93
104 TAMs were resuspended in 1ml PBS. Cells were spun onto chambered microscope
slides at maximum speed for 5 minutes. Slides were allowed to dry and stained with Diff-
Quick, following the manufacturers instructions, to visualize morphology.
Quantitative real-time PCR
mRNA was extracted from T cells with TRIzol Reagent (Life Technologies) following the
manufacturer’s protocol. cDNA was synthesized with a RNA to cDNA with EcoDry
Premix kit (Clontech). All primers were purchased from Life Technologies-Applied
Biosystems; reactions were performed in triplicate using an Applied Biosystems
StepOnePlus Instrument.
TAM Suppression Assay
Splenic CD4+ T cells or CD8+ T cells were isolated from FVB/N mice by negative
isolation. Tregs were then selected from the CD4+ T cell population using CD4+CD25+
Regulatory T Cell Isolation Kit (MACs Miltenyi Biotec). Tumors were harvested from
FVB/N mice on day 12 post-treatment. Tumors were minced and digested in Liberase TM
(Roche) for 45 minutes. Cells were filtered through 100M filters to obtain a single cell
suspension. Red blood cells were lysed using ACK lysis buffer (Sigma). TAMs were
isolated by positive selection for F480 using biotinylated anti- (MACs Miltenyi Biotec). T
cells were labeled with CFSE. 105 T cells were plated with the following ratio T cell:
TAM: 1:0, 1:1, 2:1, and 5:1 in the presence 1g/ml of anti-CD3 2g/ml anti-CD28. T cells
were also plated with at a 1:1 ratio with Tregs as a suppression control for the assay. T
cells were analyzed for CFSE after 4 days in culture by flow cytometry.
Statistical Analysis

94
Statistical analysis was conducted either in Microsoft Excel or GraphPad Software using
an unpaired, two-tailed Student’s t-test, assuming equal population variances to determine
the statistical significance between treatment groups. P<0.05 was considered significant.

95
Results:
Sorafenib treated tumors seemed to show an increase in F480+ tumor-infiltrating
macrophages with increased activation morphology
First, the purity of TAMs isolated from tumor tissue had to be verified (Figure 8A-C).
TAMs were obtained through F480+ isolation. FACs analysis post-isolation showed a
population of cells that were ninety percent CD11b+ and fifty percent positive for MHC
class II. Morphology of TAMs was confirmed by cytospin (Figure 8C).
The effect of Sorafenib treatment on TAM infiltration was analyzed by
immunohistochemistry. TAMs were isolated from the NT2.5 tumors that were implanted
into FVB/N mice on day 12 post-treatment with Sorafenib or vehicle control. This
timepoint has been shown previously to result in tumor sizes that are significantly different
between Sorafenib and vehicle treated mice (Chapter 2, Figure 2). Tumors of Sorafenib
treated mice showed an increase in F480+ cells by immunohistochemistry analysis (Figure
9A). Additionally, TAMs from Sorafenib treated tumors showed an increased in activated
morphology upon analysis of cytospin compared to TAMs isolated from vehicle treated
mice (Figure 9B).
Sorafenib enhances M1 cytokine secretion in tumor-associated macrophages
The effect of Sorafenib on the expression of macrophage polarity genes was then analyzed
by qrt-PCR. Qrt-PCR analysis of TAMs isolated from Sorafenib treated tumors showed
an increase in expression of two M1 genes, IL-12 and IL-6, when compared to TAMs
isolated from vehicle treated tumors (Figure 10A-D). Sorafenib treatment also resulted in
a modest increase in arg1 expression in TAMs (Figure 10E). IL-10 expression, a marker
96
of regulatory macrophages, was decreased in TAMs isolated from Sorafenib treated tumors
compared with the vehicle control (Figure 10F).
Sorafenib treated macrophages increase CD4+ T cell activation
To determine if the observed changes in cytokine gene expression corresponded to altered
function, the effect of Sorafenib treatment on TAM suppressive function was then
analyzed. Increasing ratio of TAMs from Sorafenib-treated tumors resulted in increased
CD4+ T cell proliferation in response to CD3/CD28 stimulus compared to vehicle
control TAMs and CD4+ T cells cultured in the absence of TAMs (Figure 11A). TAMs
from vehicle treated tumors suppressed CD4+ T cell proliferation at all cell ratios.
However, TAMs do not seem to suppress CD8+ T cell proliferation (Figure 11B). The
presence of TAMs from either vehicle-treated or Sorafenib-treated tumors resulted in
enhanced CD8+ T cell proliferation in response to CD3/CD28 stimulus.

97
Figures:
Figure 8: Schema for Macrophages isolation from FVB/N tumors. A, Splenocytes were
isolated from an FVB/N tumor bearing mouse and analyzed by flow cytometry for CD11b
and MHC class II as a staining control for macrophages isolated from tumors. B, F480+
isolated TAMs were stained for Cd11b and MHC class II. C, Cytospin of F480+ cells was
performed to confirm macrophage morphology.

98
MHC-II PE
CD11b-FITC
A.
B. C.
99
Figure 9: Sorafenib treatment increased F480+ cells in the tumor and alters TAM
morphology. Tumors were harvested at day 12 post-treatment and formalin fixed and
paraffin embedded and stained by immunohistochemistry for F480. Representative
samples of mice treated with vehicle, A, or Sorafenib, B, are shown at 20X magnification.
F480+ were cells were isolated from tumors at day 12-post treatment and cytospins were
performed on 104 F480+ TAMs from the tumors of vehicle, C, or Sorafenib, D, treated
mice.
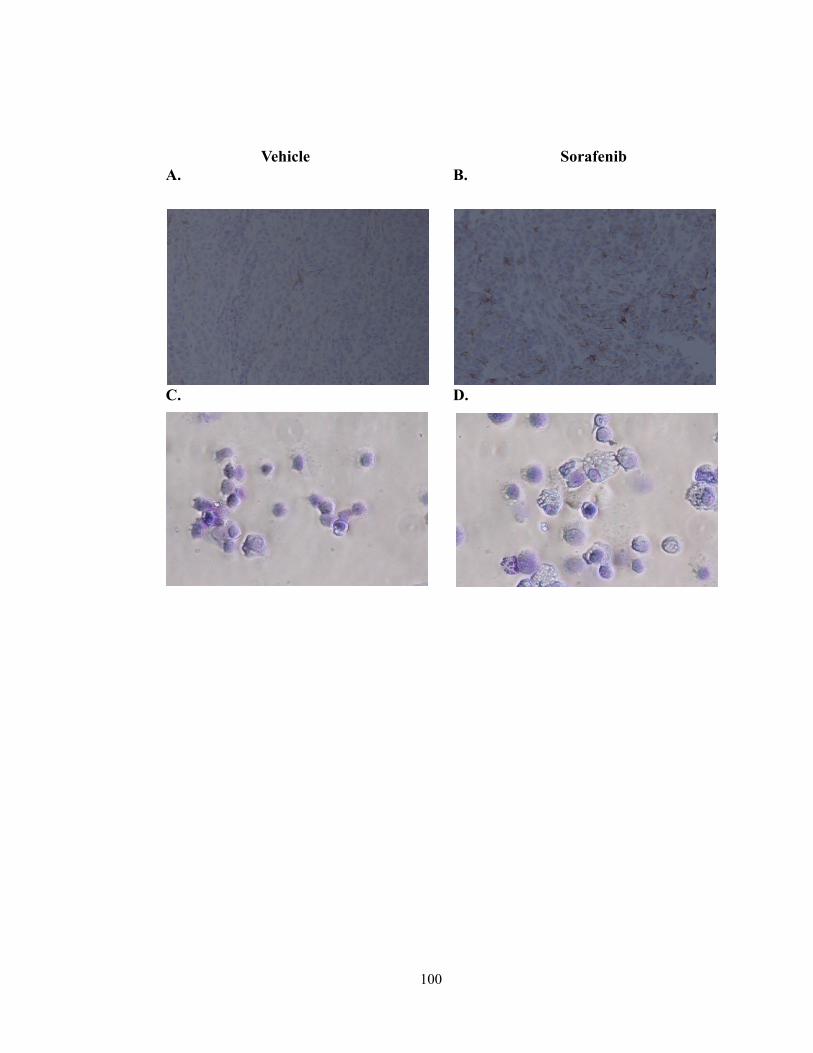
100
A. B.
D. C.
Vehicle Sorafenib

101
Figure 10: Sorafenib treatment enhances M1 cytokine expression in TAMs. Cytokine
gene expression to analyze macrophage polarity in F480+ TAMs isolated from tumors of
vehicle (white bars) or Sorafenib (black bars) treated mice was performed by qrt-PCR. M1
markers IL-12, A, IL-1, B, iNOS, C, and IL-6, D, were by analyzed. M2 marker, arg1,
E, was analyzed. Regulatory marker, IL-10, F, was analyzed.
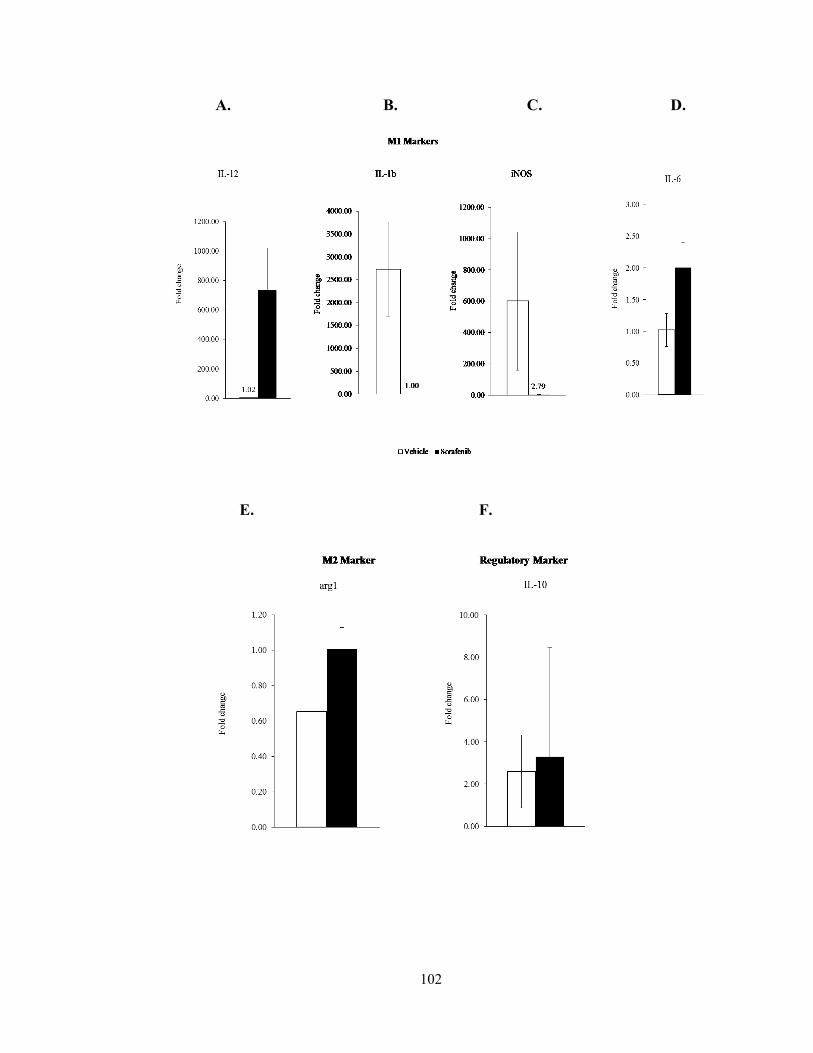
102
A. B. C. D.
E. F.

103
Figure 11: TAMs from Sorafenib treated tumors enhance CD4+ T cell proliferation.
A, F480+ TAMs were isolated from tumors of vehicle (white bar) or Sorafenib (black bar)
treated mice. Splenic CD4+ T cells were isolated and labeled with CFSE. 105 CD4+ T
cells were plated in the presence of TAMs at the following cell ratios, with 105 T cells
staying constant: 0:1 (blue bar-Proliferation control), 1:1, 1:2, and 1:5 in the presence of
0.5l of anti-CD3/anti-CD28 beads. Proliferation was analyzed after 3 days by CFSE
incorporation in CD4+ T cells. Tregs (gray bar) were also isolated and plated with CD4+
T cells as a suppression control for the assay, *, P< 0.05, ***, P < 0.001. B, the experiment
in A, was repeated with CD8+ T cells as effector cells.

104
A.
B.
0
10
20
30
40
50
60
70
80
90
100
10050200
% C
D8
+ T
cell
po
life
rati
on
aft
er 4
da
ys
(CF
SE
)
number of TAMs per 100 CD8+ T cells
Proliferation control
Tregs-negative control
Sorafenib
Vehicle
* ***
105
Conclusions:
The present study supports three new findings. First, the tyrosine kinase inhibitor,
Sorafenib, induces increased infiltration of F480+ TAMs into NT2.5 tumors implanted into
FVB/N mice. Second, Sorafenib is able to alter cytokine expression of TAMs to increase
IL-12 and decrease IL-10. Lastly, Sorafenib treated TAMs may enhance the proliferation
of CD4+ T cells.
Studies have reported on the role of TAMs in tumor progression, therefore, therapies that
can target TAMs may prove to have a therapeutic benefit. Sorafenib has been reported to
increase the recruitment of TAMs into the peripheral blood of HCC patients. The data
shown here agrees with the previous reports, showing an increase infiltration of F480+
TAMs in the tumor of FVB/N mice treated with Sorafenib.
However, in contrast to previous data, prt-PCR of inflammatory cytokine shows that while
TAMs from vehicle treated mice have a regulatory phenotype (IL-10 hi IL-12 low),
Sorafenib treatment alters this gene expression to resemble classically activated
macrophages (IL-12 high and IL-10 low). Therefore, macrophages that enter the tumor in
Sorafenib treated mice may be playing a beneficial role in supporting tumor clearance
through enhanced secretion of pro-inflammatory cytokines. Edwards, et al, has previously
published on the ability of Sorafenib to skew bone marrow derived macrophages in vitro
24. These data support these findings and extend them to include macrophages within the
tumor.
Additionally, functional analysis of TAMs shows in the absence of Sorafenib, vehicle
treated TAMs suppress CD4+ T cell proliferation, supporting the suppressive nature of
106
regulatory macrophages within the microenvironment of breast tumors. Treatment with
Sorafenib enhanced the ability of TAMs to stimulate CD4+ T cell proliferation. TAMs
isolated from the tumors of both treatment groups equally enhanced CD8+ T cell
proliferation. This may be explained by the strength of CD3/CD28 stimulus on inducing
CD8+ T cell proliferation. Alternatively, this data may indicate that antigen presentation
on MHC class I molecules remains unhindered on TAMs to promote CD8+ T cell
proliferation. However, inhibitory interactions between macrophages and CD4+ T cells
within the tumor microenvironment may prevent necessary T cell help to sustain CD8+ T
cell proliferation. The induction of pro-inflammatory cytokines or other co-stimulatory
molecules may promote CD4+ T cells to provide enhanced CD8+ T cell help to enhance
tumor clearance. This would suggest that Sorafenib may have an effect on MHC class II
expression, but that remains unknown. While the mechanism of Sorafenib does not rely
solely on macrophages (Chapter 2), this data suggests that Sorafenib may be re-educating
TAMs to support more potent anti-tumor responses.

107
References:
1. De Palma M, Lewis CE. Macrophage regulation of tumor responses to anticancer
therapies. Cancer Cell. 2013;23(3):277-286.
2. Murphy J. Modulation of angiogenesis by tumor associated macrophages in the tumor
microenvironment. MOJ Immunology. 2014;1(3):00016.
3. Lin EY, Nguyen AV, Russell RG, Pollard JW. Colony-stimulating factor 1 promotes
progression of mammary tumors to malignancy. J Exp Med. 2001;193(6):727-740.
4. Gordon S. Alternative activation of macrophages. Nat Rev Immunol. 2003;3(1):23-35.
5. Mantovani A, Sica A, Sozzani S, Allavena P, Vecchi A, Locati M. The chemokine
system in diverse forms of macrophage activation and polarization. Trends Immunol.
2004;25(12):677-686.
6. Gordon S. Alternative activation of macrophages. Nat Rev Immunol. 2003;3(1):23-35.
7. Martinez FO, Sica A, Mantovani A, Locati M. Macrophage activation and polarization.
Front Biosci. 2008;13:453-461.
8. Pollard JW. Tumour-educated macrophages promote tumour progression and
metastasis. Nat Rev Cancer. 2004;4(1):71-78.
9. Noel W, Raes G, Hassanzadeh Ghassabeh G, De Baetselier P, Beschin A.
Alternatively activated macrophages during parasite infections. Trends Parasitol.
2004;20(3):126-133.

108
10. Wynn TA. Fibrotic disease and the T(H)1/T(H)2 paradigm. Nat Rev Immunol.
2004;4(8):583-594.
11. Gordon S, Martinez FO. Alternative activation of macrophages: Mechanism and
functions. Immunity. 2010;32(5):593-604.
12. Mosser DM, Edwards JP. Exploring the full spectrum of macrophage activation. Nat
Rev Immunol. 2008;8(12):958-969.
13. Chandra D, Naik S. Leishmania donovani infection down-regulates TLR2-stimulated
IL-12p40 and activates IL-10 in cells of macrophage/monocytic lineage by modulating
MAPK pathways through a contact-dependent mechanism. Clin Exp Immunol.
2008;154(2):224-234.
14. Figueiredo AS, Hofer T, Klotz C, et al. Modelling and simulating interleukin-10
production and regulation by macrophages after stimulation with an immunomodulator of
parasitic nematodes. FEBS J. 2009;276(13):3454-3469.
15. Lucas M, Zhang X, Prasanna V, Mosser DM. ERK activation following macrophage
FcgammaR ligation leads to chromatin modifications at the IL-10 locus. J Immunol.
2005;175(1):469-477.
16. Edwards JP, Zhang X, Frauwirth KA, Mosser DM. Biochemical and functional
characterization of three activated macrophage populations. J Leukoc Biol.
2006;80(6):1298-1307.
109
17. Pollard JW. Macrophages define the invasive microenvironment in breast cancer. J
Leukoc Biol. 2008;84(3):623-630.
18. Liu CH, Chang SH, Narko K, et al. Overexpression of cyclooxygenase-2 is sufficient
to induce tumorigenesis in transgenic mice. J Biol Chem. 2001;276(21):18563-18569.
19. Knowles HJ, Harris AL. Hypoxia and oxidative stress in breast cancer. hypoxia and
tumourigenesis. Breast Cancer Res. 2001;3(5):318-322.
20. Kuang DM, Wu Y, Chen N, Cheng J, Zhuang SM, Zheng L. Tumor-derived
hyaluronan induces formation of immunosuppressive macrophages through transient
early activation of monocytes. Blood. 2007;110(2):587-595.
21. Biswas SK, Gangi L, Paul S, et al. A distinct and unique transcriptional program
expressed by tumor-associated macrophages (defective NF-kappaB and enhanced IRF-
3/STAT1 activation). Blood. 2006;107(5):2112-2122.
22. Qian BZ, Pollard JW. Macrophage diversity enhances tumor progression and
metastasis. Cell. 2010;141(1):39-51.
23. Lin EY, Pollard JW. Tumor-associated macrophages press the angiogenic switch in
breast cancer. Cancer Res. 2007;67(11):5064-5066.
24. Edwards JP, Emens LA. The multikinase inhibitor sorafenib reverses the suppression
of IL-12 and enhancement of IL-10 by PGE(2) in murine macrophages. Int
Immunopharmacol. 2010;10(10):1220-1228.
110
25. Sprinzl MF, Reisinger F, Puschnik A, et al. Sorafenib perpetuates cellular anticancer
effector functions by modulating the crosstalk between macrophages and natural killer
cells. Hepatology. 2013;57(6):2358-2368.
26. Reilly RT, Gottlieb MBC, Ercolini AM, et al. HER-2/neu is a tumor rejection target
in tolerized HER-2/neu transgenic mice. Cancer Research. 2000;60(13):3569-3576.
111
Chapter 5: Sorafenib Can Be Effective Combined with Cellular Immunotherapy
Introduction:
Advances in the treatment for metastatic breast cancer have improved the quality of life
and conferred a small survival benefit for some patients. However, disease relapse often
occurs due to development of drug resistance and, ultimately, metastatic disease remains
incurable1. Therefore, there is a need for new therapeutic strategies to evade the
development of drug resistance in these patients. Consequently, ongoing efforts have
focused on recruiting patients’ own immune cells as a therapeutic partner to combat
disease.
Cancer vaccines aim to reprogram host immune cells to become more efficient at targeting
and killing cancer cells, leaving normal cell unharmed. A whole cell granulocyte
macrophage colony-stimulating factor (GM-CSF)-secreting vaccine targeting HER-2 was
designed to enhance the immune response to breast cancer2. However, central and
peripheral tolerance mechanisms limit the efficacy of vaccination. Multiple studies have
shown an increase in vaccine activity by strategically combining vaccine with other cancer
therapeutics to take advantage of both the cytoreductive potential of cancer drugs and the
ability to interrupt immunoregulatory networks and support productive anti-tumor immune
responses3-5.
Accordingly, a vaccination strategy incorporating multi-kinase inhibitors that target both
the tumor cells, and other distinct cellular components within the tumor microenvironment
is being developed. A novel immune-modulating activity for the Sorafenib has been
112
previously reported (Chapter 2). Sorafenib alone alone cures tumor-bearing FVB/N mice
through both anti-angiogenic and immune effects.
These studies have been extended to explore the activity the small molecule multi-kinase
inhibitor, Sorafenib. This study aims to determine the efficacy of combining Sorafenib
with whole cell GMSCF-secreting breast cancer vaccine in a pre-clinical model. Anti-
tumor immunity and tumor regression were characterized following Sorafenib treatment in
combination with vaccine. Additionally, immune cell infiltrate was analyzed in single
agent and combination therapy tumors. Sorafenib in combination with vaccine enhanced
tumor clearance and promoted increased overall survival relative to single agent therapy.
Additionally, Sorafenib treatment did not inhibit productive vaccine-induced immune
responses. Finally, Sorafenib treatment enhanced vaccine-induced tumor clearance by
increasing the accumulation of antigen-specific T cells at the tumor site.
113
Materials and Methods:
Mice
FVB/N mice were purchased from Harlan (Frederick, MD). Clone 100 T-cell receptor
(TCR) transgenic mice, derived from FVB/N mice, express the high-avidity, RNEU420-429–
specific TCR in the majority of peripheral CD8+ T cells, and were generated as previously
described6. Eight to twelve week old mice were used in the experiments. Animals were
housed in pathogen-free conditions and were treated in accordance with institutional and
AAALAC policies. All protocols were approved by the Animal Care and Use Committee
of Johns Hopkins University.
Reagents
Sorafenib was purchased from LC Laboratories (Woburn, MA). FoxP3 PE-Cy5, CD25 PE,
CD4 FITC, CD8 PE, GR1 PE, CD11b FITC, and Thy1.2 APC antibodies were obtained
from eBioscience.
Cell Lines and Media
The HER-2-expressing NT2.5 breast tumor cell line (derived from a spontaneous tumor
explanted from a neu-N transgenic mouse), the GM-CSF–secreting vaccine cell lines,
3T3GM (mock) and 3T3neuGM (HER-2-specific), and the T2Dq line were grown as
previously described2. The cell lines used as T-cell targets, 3T3neuB7.1 and NT2.5B7.1,
were produced via retroviral transduction as previously described7.
114
Immunohistochemical staining
Tumors were fixed in formalin for 24 hours and paraffin embedded and sectioned at 5uM
at the JHMI Pathology Core. Sections were stained with H&E or retained for
immunohistochemistry at the JHMI Oncology Tissue Service Center. Cellular infiltrate
staining was performed using antibodies for CD3, FoxP3, Gr1, and F480 (Cell Signaling).
Immunohistochemistry was done with the Power Vision+ poly-HRP IHC Kit
(ImmunoVision Inc). Antigen retrieval was carried out for 45 minutes in HTTR steam
(Target Retrieval Solution; Dako) followed by incubation of primary antibody for 45
minutes at room temperature. Slides were incubated with Power Vision Poly-HRP anti-
rabbit IgG secondary antibody for 30 minutes at room temperature. Slides were developed
with 3, 3’diaminobenzidine (Sigma Fast DAB tablets) and slides were counterstained with
Dako Mayer’s hematoxylin (Sigma). Images were captured under light microscopy at 20X
magnification (E600, Nikon). Three independent viewing fields were captured and
staining was quantified using AR-Elements Microscope Imaging Software (Nikon).
Drug treatment, vaccinations, and chemotherapy
FVB/N mice were challenged subcutaneously with 5×10⁶ NT2.5 tumor cells in the right
mammary fat pad, followed by treatment 10-14 days later. Sorafenib (30 mg/kg) was
administered daily Monday through Friday by oral gavage with a feeding needle. A viscous
vehicle composed of 30% (w/v) Cremophor EL, 30% (w/v) PEG 400, and 10% ethanol,
10% glucose (Sigma-Aldrich) was used as the Sorafenib diluent, and also administered as
the vehicle treatment control. 3×10⁶ vaccine cells per mouse were irradiated before
subcutaneous injection in both hind limbs and the left front limb. Doses and timing for
115
tumor cells and vaccinations have been previously optimized2. For combination treatment
studies, Sorafenib treatment began on the day of vaccination. Mice were monitored for
tumor growth and onset twice weekly. Tumor growth was determined by measuring tumor
diameter in two perpendicular dimensions with calipers. Mean tumor size for an
experimental group included only those mice with measureable tumors.
ELISPOTS
ELISPOTS were performed 14-17 days post-vaccination. Splenic CD8+ T cells were
isolated from individual mice (not pooled) using the Dynabeads Untouched Mouse CD8
Cell Negative Isolation Kit (Life Technologies). RNEU420-429 (PDSLRDLSVF) and NP118–
126 (RPQASGVYM) peptides were synthesized at 95% purity by the Oncology Peptide
Synthesis Facility (Johns Hopkins, Baltimore, MD). 105 CD8+ T cells were incubated in
triplicate with 104 peptide loaded T2Dq, NT2.5B7.1, or 3T3neuB7.1 target cells.
NT2.5B7.1 and 3T3neuB7.1 cells were stimulated with IFN for 2 days prior to co-culture.
T cell/T2Dq cells were co-cultured for 16 hours and T cell/NT2.5B7.1 or T
cell/3T3neuB7.1 cells were co-cultured for 24 hours on pre-coated IFN-γ ELISPOT
Multiscreen-HA plates (Millipore) according to the manufacturer’s protocols
(Ebioscience). ELISPOT plates were developed using an AEC staining kit (Sigma)
according to the manufacturers’ instructions. IFN-secreting CD8+ T cells were
enumerated using the Immunospot counter (Cellular Technology, Ltd.). The average
number of spots in control wells was subtracted from the average number of spots in each
well containing both CD8+ T cells and targets.

116
Adoptive Transfer Experiment
Adoptive transfer was carried out as described previously8. Briefly, FVB/N mice received
subcutaneous injections of 5×10⁶ NT2.5 cells into the right upper mammary fat pad. One
week post tumor challenge, mice were vaccinated with 3×10⁶ irradiated 3T3neuGM cells
or 3T3GM cells. Sorafenib (30 mg/kg) or vehicle was given by daily gavage starting on
the day of vaccination. CD8+ T cells were isolated from Clone 100 TCR transgenic mice
by CD8 negative selection using Dynabeads Untouched Mouse CD8 negative isolation kit
(Life Technologies). 4×10⁶ CD8+ T cells per mouse were adoptively transferred via tail
vein injection one day following initiation of treatment. Spleens, lymph nodes, and tumors
from adoptively transferred mice were harvested five days after adoptive transfer. Spleens
and lymph nodes were collected and mashed through a 70uM cell strainer. Tumors were
minced and digested with Liberase TM (Roche) for 30 minutes and mashed through 70uM
cell strainers. Isolated single cell suspensions were analyzed for Thy1.2+ CD8+ cells on a
Galios Flow Cytometer (BD Coulter) and data was analyzed with FlowJo software
(Treestar, Inc.)
Statistical Analysis
Statistical analysis was conducted using GraphPad Prism Software using an unpaired, two-
tailed Student’s t-test, assuming equal population variances to determine the statistical
significance between treatment groups. p<0.05 was considered to be significant.

117
Results:
Sorafenib can be effectively combined with GM-CSF-secreting cellular
immunotherapy in FVB/N mice
The therapeutic activity of Sorafenib was analyzed in the context of a GM-CSF-secreting,
HER-2-overexpressing vaccine. NT2.5 tumor regression was accelerated in FVB/N mice
that received the HER-2-specific vaccine in combination with Sorafenib relative to mice
treated with either single agent Sorafenib, mock vaccine, or vehicle control alone (Figure
12A). Mice receiving combination therapy also showed improved tumor-free survival
compared with mice receiving either single agent therapy (Figure 12B).
Sorafenib does not hinder vaccine-induced immune response
Next, the effect of Sorafenib on vaccine-induced immune responses was analyzed. Splenic
CD8+ T cell IFNproduction in response to tumor and vaccine cell targets was used to
assay vaccine-induced immunity. IFNγ production by splenic CD8+ T cells co-cultured
with NT2.5 tumor cells or 3T3neu vaccine cells expressing B7.1 as targets was measured
by ELISPOT. Sorafenib treatment alone did not induce a CD8+ T cell response to either
NT2.5 tumor cells or vaccine cells; in contrast GM-CSF-secreting vaccination resulted in
a robust CD8+ T cell response. Adding Sorafenib to vaccination did not inhibit the vaccine-
induced CD8+ T cell response to HER-2-expressing target cells (3T3neuB7.1 or
NT2.5B7.1, Figure 12C). Additionally, vaccinated mice receiving Sorafenib developed
RNEU420-429-specific CD8+ T cell responses as well as mice that received vaccine alone
(Figure 12D). These data show that Sorafenib does not interfere with vaccine-induced

118
immune responses and can be successfully combined with vaccination to enhance NT2.5
tumor clearance in immune competent FVB/N mice.
Sorafenib does not impede tumor infiltrating immune cells
The effect of Sorafenib treatment on the ability of immune cells to infiltrate the tumor was
also analyzed. Tumors from vaccinated mice showed increased amounts of CD3+ T cells
and CD68+ macrophages. Sorafenib treatment did not alter the infiltration of these cells
into the tumor as similar numbers of each cell type were present in both treatment settings
(Figure 13A and C). Treatment with vaccine alone or in combination with Sorafenib did
not alter infiltrating Treg numbers relative to treatment control tumors. Staining for
Ly6C/Ly6G, indicating the presence of granulocytic myeloid cells, was increased in mice
that received vaccination in combination with Sorafenib.
Sorafenib increases HER-2-specific T cell accumulation in the tumor
To further evaluate the possible effect of Sorafenib therapy on the magnitude of the
vaccine-induced locoregional T cell responses, adoptive T cell transfers with Clone 100
TCR transgenic T cells specific for RNEU420-429 were performed. Vaccination alone was
sufficient to increase the number of adoptively transferred antigen-specific Thy1.2+ CD8+
T cells in the spleen and vaccine-draining lymph nodes relative to either mock vaccination
or Sorafenib added to mock vaccination. HER-2 targeted vaccination also increased the
number of T cells in the tumor relative to mock vaccination controls (Figure 14A-C).
Combining Sorafenib with vaccine did not diminish the numbers of Thy1.2+ CD8+ cells
found in the spleen and vaccine-draining lymph nodes (Figure 14A and B). Integrating
Sorafenib with vaccination modestly increased the number of HER-2-specific T cells found

119
in the tumor (Figure 13C). These data suggest that Sorafenib may augment the ability of
antigen-specific T cells generated by vaccination to accumulate in the tumor, thereby
resulting in enhanced tumor clearance and tumor-free survival. Taken together, these data
show that Sorafenib treatment may be effectively combined with HER-2 targeted DC-
based vaccination to enhance tumor regression.
120
Figures:
Figure 12: Sorafenib can be effectively combined with vaccine in FVB/N mice. A,
FVB/N mice (n=10) were tumor challenged on Day 0 and vaccinated and began daily
Sorafenib or vehicle treatment on day 7 and followed for tumor growth and B, overall
survival. C, FVB/N mice (n=10) were tumor challenged and at day 7 were vaccinated and
began daily Sorafenib or vehicle treatment and 2 weeks post-vaccination, splenic CD8+
effector T cells were isolated and used for IFN ELISPOT with NT2.5B7.1 or 3T3neuB7.1
as targets or D, with p50 or NP peptide pulsed T2dq cells as targets. **, P < 0.01 and ***,
P < 0.001.
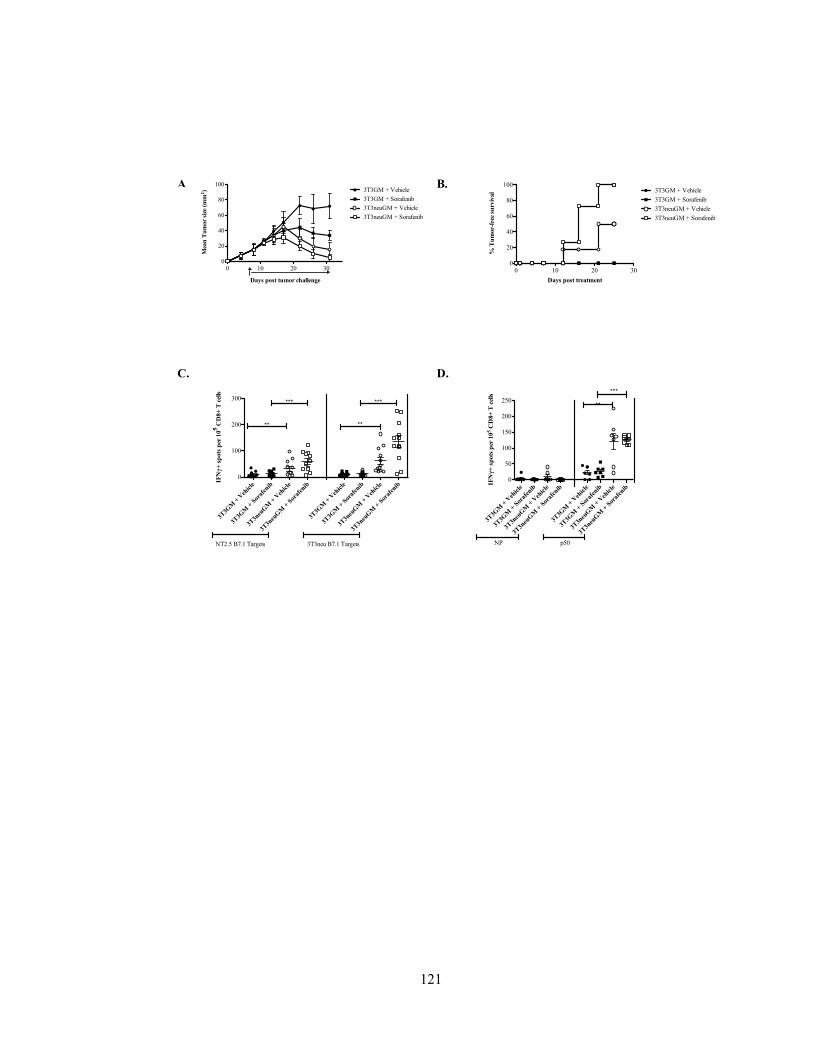
121
Figures:
0 10 20 300
20
40
60
80
1003T3GM + Vehicle
3T3GM + Sorafenib
3T3neuGM + Vehicle
3T3neuGM + Sorafenib
Days post tumor challenge
Mea
n T
um
or
size
(m
m2)
0 10 20 300
20
40
60
80
1003T3GM + Vehicle
3T3GM + Sorafenib
3T3neuGM + Vehicle
3T3neuGM + Sorafenib
Days post treatment
% T
um
or-
free
su
rviv
al
Figure 4.
A
.
B.
C. D.
3T3G
M +
Veh
icle
3T3G
M +
Sor
afen
ib
3T3n
euG
M +
Veh
icle
3T3n
euG
M +
Sor
afen
ib
3T3G
M +
Veh
icle
3T3G
M +
Sor
afen
ib
3T3n
euG
M +
Veh
icle
3T3n
euG
M +
Sor
afen
ib
0
100
200
300
NT2.5 B7.1 Targets 3T3neu B7.1 Targets
***
**
***
**
IFNγ+
sp
ots
per
105 C
D8+
T c
ells
3T3G
M +
Veh
icle
3T3G
M +
Sor
afen
ib
3T3n
euG
M +
Veh
icle
3T3n
euG
M +
Sor
afen
ib
3T3G
M +
Veh
icle
3T3G
M +
Sor
afen
ib
3T3n
euG
M +
Veh
icle
3T3n
euG
M +
Sor
afen
ib
0
50
100
150
200
250
NP p50
***
**
IFNγ+
sp
ots
per
10
5 C
D8+
T c
ells
122
Figure 13: Sorafenib does not impede immune cell infiltration into the tumor. FVB/N
mice (n=5) were tumor challenged on Day 0 and vaccinated and began daily Sorafenib or
vehicle treatment on day 7. Tumors were prepared for histological examination 3 weeks
after drug treatment. Immunohistochemistry to detect A, CD3, B, FoxP3, C, CD68, and
D, Ly6C/Ly6G was performed at 20X magnification. Staining was quantified using
Elements software. Graphs (mean + SD) are cell counts from 3-5 samples per group, *, P
< 0.05, **, P<0.01, ***, P < 0.001.
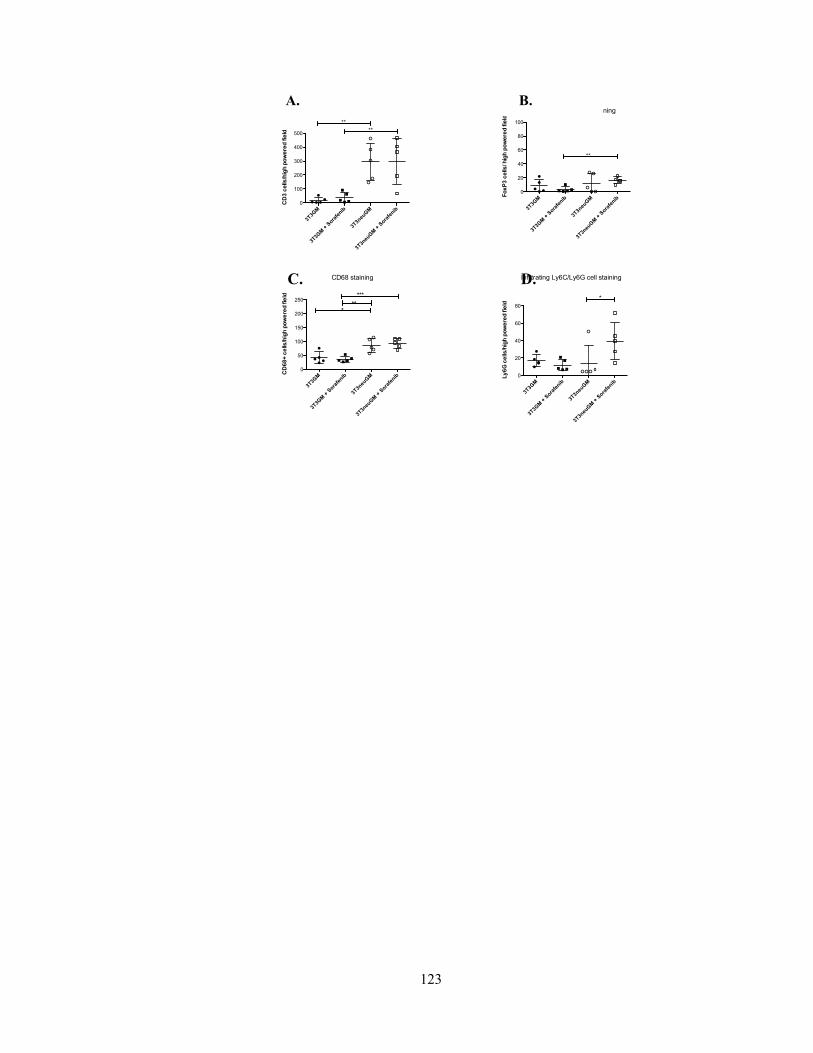
123
Infiltrating CD3 cell staining
3T3G
M
3T3G
M +
Sora
fenib
3T3n
euG
M
3T3n
euGM
+ S
orafe
nib
0
100
200
300
400
500
**
**
CD
3 c
ells
/hig
h p
ow
ere
d fie
ldCD68 staining
3T3G
M
3T3G
M +
Sora
fenib
3T3n
euG
M
3T3n
euGM
+ S
orafe
nib
0
50
100
150
200
250***
***
CD
68
+ c
ells
/hig
h p
ow
ere
d fie
ld
Infiltrating FoxP3 cell staining
3T3G
M
3T3G
M +
Sora
fenib
3T3n
euG
M
3T3n
euG
M +
Sora
fenib
0
20
40
60
80
100
**
Fo
xP
3 c
ells
/ hig
h p
ow
ere
d f
ield
Infiltrating Ly6C/Ly6G cell staining
3T3G
M
3T3G
M +
Sora
fenib
3T3n
euGM
3T3n
euGM
+ S
orafe
nib
0
20
40
60
80
*
Ly
6G
ce
lls
/hig
h p
ow
ere
d f
ield
A. B.
C. D.

124
Figure 14: Sorafenib increases HER-2-specific T cells in the tumor. FVB/N mice (n=3)
were tumor challenged and vaccinated and began daily Sorafenib treatment on day 7.
Splenic CD8+ T cells were isolated from Clone100 mice and were adoptively transferred
one day post-treatment. A, spleen, B, vaccine-draining lymph nodes and C, tumor were
harvested 5 days post adoptive transfer and stained for antibodies specific for Thy1.2 and
CD8. Samples were analyzed by flow cytometry, with the number of positive cells
normalized to the tissue weight.
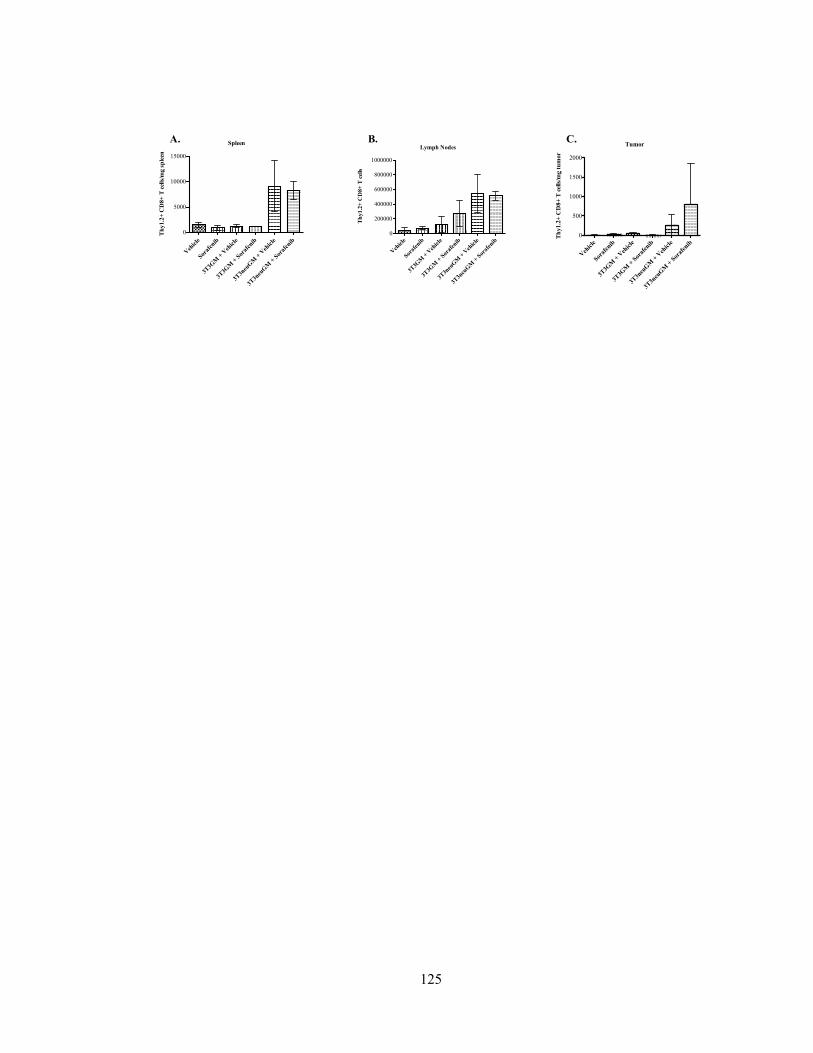
125
Spleen
Veh
icle
Soraf
enib
3T3G
M +
Veh
icle
3T3G
M +
Sor
afen
ib
3T3n
euG
M +
Veh
icle
3T3n
euG
M +
Sor
afen
ib
0
5000
10000
15000T
hy1.2
+ C
D8+
T c
ells
/mg s
ple
en
Lymph Nodes
Veh
icle
Soraf
enib
3T3G
M +
Veh
icle
3T3G
M +
Sor
afen
ib
3T3n
euG
M +
Veh
icle
3T3n
euG
M +
Sor
afen
ib
0
200000
400000
600000
800000
1000000
Th
y1.2
+ C
D8+
T c
ells
Tumor
Veh
icle
Soraf
enib
3T3G
M +
Veh
icle
3T3G
M +
Sor
afen
ib
3T3n
euG
M +
Veh
icle
3T3n
euG
M +
Sor
afen
ib
0
500
1000
1500
2000
Th
y1.2
+ C
D8+
T c
ells
/mg t
um
or
A. B. C.
Figure 5.

126
Conclusions:
The data presented here show two important new findings. First, the multi-kinase inhibitor
of angiogenesis, Sorafenib, can be effectively combined with a DC-based vaccine in breast
cancer. Second, combining vaccine with Sorafenib does not inhibit and may enhance
vaccine-induced immunity. Although past studies have discouraged the use of Sorafenib
in combination with immunotherapy, these studies add to the recently accumulating
literature supporting partnering Sorafenib with immunotherapy. Given that single agent
Sorafenib is often ineffective at producing lasting responses in breast cancer patients, these
finding support repurposing Sorafenib in combination with immunotherapy as a new
treatment avenue for breast cancer patients9.
The observed immune dependent mechanism for Sorafenib supports its use in combination
with immune activating therapy such as vaccination. Therefore, the effect of combining
Sorafenib with DC-based whole cell GM-CSF-secreting vaccine was examined. Many
reports have discouraged the use of Sorafenib as a partner with immunotherapy as it has
been found to inhibit DC function, reducing maturation and migration, and inhibit the
production of OVA-specific CD8+ T cell responses in vivo in mice pre-treated with
Sorafenib followed by peptide vaccination with adjuvant10. In vitro studies of
lymphocytes from hepatocellular carcinoma patients demonstrated that pharmacologic
doses of Sorafenib decreased effector T cell activation, whereas subpharmacologic doses
selectively promoted the activation of effector T cells while blocking Treg function11.
However, a growing body of evidence has since been published supporting the use of
Sorafenib with combination immunotherapy. Sorafenib was shown to have a therapeutic
127
benefit in murine colon cancer when combined with MC38-CEA TRICOM vaccine12. In
an E.G7/OT-1 murine model of adoptive cell therapy with low dose Sorafenib, Sorafenib
decreased the expression of immunosuppressive factors, and enhanced functions and
migrations of transferred CD8+ T cells through inhibition of STAT3 and other
immunosuppressive factors13.
The data reported here support the latter publications, demonstrating that incorporating
Sorafenib with vaccine resulted in enhanced tumor clearance compared to single agent
therapy. Additionally, vaccine-induced immune response was effectively maintained with
the addition of Sorafenib. Sorafenib did not prevent vaccine-induced recruitment of CD3+
T cells to the tumor, suggesting that Sorafenib does not negatively affect the ability of T
cells to gain access to the tumor to exert effector function. Finally, combining Sorafenib
with vaccine increased the accumulation of adoptively transferred tumor-specific CD8+ T
cells in the tumor with combination therapy than with either single agent. These data also
support previous studies showing that angiogenesis inhibitors improve cellular
immunotherapy14-16.
Sorafenib treatment combined with vaccine also increased Ly6G/Ly6C+ cell infiltrate.
Enhanced tumor clearance as a combination therapy would suggest that these cells are not
myeloid-derived suppressor cells, although this needs to be further examined. The
increased in Ly6G/Ly6C staining may also suggest an increased neutrophilic infiltration in
these tumors. Prior reports have shown enhanced T cell dependent, tumor-specific
protective immunity as a result of increased Fas mediated-neutrophilic interactions with
FasL expressing cells within the tumor17,18. It is possible that Sorafenib may alter the
expression of FasL, a known chemoattractant of Fas-expressing neutrophils, within the

128
tumor microenvironment. Therefore, Sorafenib could be promoting a local neutrophil-
induced inflammatory response in the tumor based on the Fas/FasL interaction that when
combined with increased antigen-specific T cells induced by vaccine, results in enhanced
rate of tumor clearance. However, this still has to be investigated.
In conclusion, it is shown here for the first time, that Sorafenib can be effectively combined
with DC-based, HER2-targeted cellular immunotherapy to enhance breast tumor clearance
and improve tumor-free survival. Due to its ability to target multiple aspects of the tumor
microenvironment, including host tumor cells, endothelial cells, and immune cells, further
studies utilizing Sorafenib in combination with other immunomodulatory treatments, such
as vaccination, are warranted.
129
References:
1. National Cancer Institute. Cancer statistics.
http://seer.cancer.gov/statfacts/html/breast.html. Updated 2014. Accessed 11/06, 2014.
2. Reilly RT, Gottlieb MBC, Ercolini AM, et al. HER-2/neu is a tumor rejection target in
tolerized HER-2/neu transgenic mice. Cancer Research. 2000;60(13):3569-3576.
3. Emens LA, Asquith JM, Leatherman JM, et al. Timed sequential treatment with
cyclophosphamide, doxorubicin, and an allogeneic granulocyte-macrophage colony-
stimulating factor-secreting breast tumor vaccine: A chemotherapy dose-ranging factorial
study of safety and immune activation. J Clin Oncol. 2009;27(35):5911-5918.
4. Manning EA, Ullman JGM, Leatherman JM, et al. A vascular endothelial growth factor
receptor-2 inhibitor enhances antitumor immunity through an immune-based mechanism.
Clinical Cancer Research. 2007;13(13):3951-3959.
5. Machiels JH, Reilly RT, Emens LA, et al. Cyclophosphamide, doxorubicin, and
paclitaxel enhance the antitumor immune response of granulocyte/macrophage-colony
stimulating factor-secreting whole-cell vaccines in HER-2/neu tolerized mice. Cancer
Research. 2001;61(9):3689-3697.
6. Manning EA, Ullman JG, Leatherman JM, et al. A vascular endothelial growth factor
receptor-2 inhibitor enhances antitumor immunity through an immune-based mechanism.
Clin Cancer Res. 2007;13(13):3951-3959.

130
7. Dranoff G, Jaffee E, Lazenby A, et al. Vaccination with irradiated tumor cells engineered
to secrete murine granulocyte-macrophage colony-stimulating factor stimulates potent,
specific, and long-lasting anti-tumor immunity. Proc Natl Acad Sci U S A.
1993;90(8):3539-3543.
8. Weiss VL, Lee TH, Song H, et al. Trafficking of high avidity HER-2/neu-specific T cells
into HER-2/neu-expressing tumors after depletion of effector/memory-like regulatory T
cells. PLoS One. 2012;7(2):e31962.
9. Moreno-Aspitia A, Morton RF, Hillman DW, et al. Phase II trial of sorafenib in patients
with metastatic breast cancer previously exposed to anthracyclines or taxanes: North
central cancer treatment group and mayo clinic trial N0336. J Clin Oncol. 2009;27(1):11-
15.
10. Hipp MM, Hilf N, Walter S, et al. Sorafenib, but not sunitinib, affects function of
dendritic cells and induction of primary immune responses. Blood. 2008;111(12):5610-
5620.
11. Cabrera R, Ararat M, Xu Y, et al. Immune modulation of effector CD4+ and regulatory
T cell function by sorafenib in patients with hepatocellular carcinoma. Cancer Immunol
Immunother. 2013;62(4):737-746.
12. Farsaci B, Donahue RN, Coplin MA, et al. Immune consequences of decreasing tumor
vasculature with antiangiogenic tyrosine kinase inhibitors in combination with therapeutic
vaccines. Cancer Immunol Res. 2014;2(11):1090-1102.
131
13. Chuang HY, Chang YF, Liu RS, Hwang JJ. Serial low doses of sorafenib enhance
therapeutic efficacy of adoptive T cell therapy in a murine model by improving tumor
microenvironment. PLoS One. 2014;9(10):e109992.
14. Huang Y, Yuan J, Righi E, et al. Vascular normalizing doses of antiangiogenic
treatment reprogram the immunosuppressive tumor microenvironment and enhance
immunotherapy. Proc Natl Acad Sci U S A. 2012;109(43):17561-17566.
15. Shrimali RK, Yu Z, Theoret MR, Chinnasamy D, Restifo NP, Rosenberg SA.
Antiangiogenic agents can increase lymphocyte infiltration into tumor and enhance the
effectiveness of adoptive immunotherapy of cancer. Cancer Res. 2010;70(15):6171-6180.
16. Shi S, Chen L, Huang G. Antiangiogenic therapy improves the antitumor effect of
adoptive cell immunotherapy by normalizing tumor vasculature. Med Oncol.
2013;30(4):698-013-0698-1. Epub 2013 Aug 28.
17. Buonocore S, Haddou NO, Moore F, et al. Neutrophil-dependent tumor rejection and
priming of tumoricidal CD8+ T cell response induced by dendritic cells overexpressing
CD95L. J Leukoc Biol. 2008;84(3):713-720.
18. Seino K, Kayagaki N, Okumura K, Yagita H. Antitumor effect of locally produced
CD95 ligand. Nat Med. 1997;3(2):165-170.

132
CURRICULUM VITAE
MELEK M. ERDINC SUNAY
Ph.D. candidate
Department of Pathology
School of Medicine
The Johns Hopkins University
DATE OF BIRTH
January 7, 1984
ADDRESS
154 North Potomac Street
Baltimore, MD 21224
Phone: (443) 629-3043
E-mail: [email protected]
EDUCATION
2008- 2015 Ph.D. in Pathobiology, Johns Hopkins School of Medicine,
Baltimore, MD.
Thesis: Repurposing Tyrosine Kinase Inhibitors to Augment
Cellular Immunotherapy
2006 B.S. in Cell Biology and Molecular Genetics, University of
Maryland, College Park, MD
EMPLOYMENT AND TEACHING HISTORY
8/2009~7/2010 Pathobiology Program Chief Graduate Student, Johns Hopkins
University School of Medicine. Baltimore, MD
7/2006~7/2008 Senior Research Technician, Department of Pathology, Johns
Hopkins School of Medicine, Baltimore, MD
8/2004~5/2006 Howard Hughes Undergraduate Research Fellow, Department of
Cell Biology and Molecular Genetics, University of Maryland,
College Park

133
AWARDS/HONORS
2013 Second Place Poster for Translational Research, Sydney Kimmel
Comprehensive Cancer Center Breast Program
2012 Pathology Young Investigator’s Day Research Award, Johns
Hopkins Department of Pathology
2011 Chief Graduate Student Award, Johns Hopkins Pathobiology
Graduate Program
2011 Runner Up Poster for Translational Research, Sydney Kimmel
Comprehensive Cancer Center Breast Program
PUBLICATIONS
PEER REVIEWED PUBLICATIONS
1. Erdinc Sunay MM, Fox-Talbot K, Velidedeoglu E, Baldwin WM 3rd, Wasowska
BA. Absence of FcγRIII results in increased proinflammatory response in FcγRIII-
KO cardiac recipients. Transplantation. 2013 Oct 15;96(7):601-8.
2. Sunay ME, Marincola, F., Khleif, SN., Silverstein,SC., Fox, B, Galon, J and
Emens, LA. Focus on the Target: The Tumor Microenvironment, Society for
Immunotherapy of Cancer Annual Meeting Workshop, October 24th-25th 2012,
Journal for ImmunoTherapy of Cancer. 2013 1:9
3. Asano H, Lee CY, Fox-Talbot K, Koh CM, Erdinc MM, Marschner S, Keil S,
Goodrich RP, Baldwin WM 3rd. Treatment with Riboflavin and Ultraviolet Light
Prevents Alloimmunization to Platelet Transfusions and Cardiac Transplants.
Transplantation. 2007 Nov 15;84(9):1174-82.
4. Lee CY, Lotfi-Emran S, Erdinc M, Murata K, Velidedeoglu E, Fox-Talbot K, Liu
J, Garyu J, Baldwin WM 3rd, Wasowska BA. The Involvement of FcR Mechanisms
in Antibody-Mediated Rejection. Transplantation. 2007 Nov 27;84(10):1324-34.
ABSTRACTS

134
1. Neale, D. Erdinc, M, and Baldwin, WM 3rd. 275: Further evidence that
trophoblast derived microparticles cause endothelial activation—A role in the
pathogenesis of preeclampsia. SMFM abstract. American Journal of Obstetrics and
Gynecology Volume 199, Issue 6, Supplement 1, December 2008, Page S88 Society
for Maternal-Fetal Medicine: 2009 29th Annual Meeting
ORAL PRESENTATIONS
5/21/2011 Invited talk at Middle Atlantic Regional Meeting of the American
Chemical Society, College Park, MD. “Can Anti-angiogenic
tyrosine kinase inhibitors enhance cancer vaccines?”
6/25/2010 3rd Annual Safeway Breast Cancer Retreat Mount Washington,
MD. “Deciphering the Signaling Networks in the Breast Cancer
Microenvironment.”
6/14/2010 Invited talk at Pathology Grand Rounds Johns Hopkins Hospital,
Baltimore MD. “Identification of Novel Tumor Antigens by
Vaccine-Induced Antibody Analysis in Patients with Metastatic
Breast Cancer.”
POSTERS
1. Sunay, ME et al. Sorafenib Modulates Macrophages to Promote T Helper Type 1
Immunity, AACR Annual Meeting, 2013.
2. Sunay, ME et al. Sorafenib Modulates Macrophages to Promote T Helper Type 1
Immunity, Johns Hopkins Pathology Young Investigator’s Day, 2013.
3. Sunay, ME et al. Mechanisms of Immune Modulation by Sorafenib in a HER2+
Breast Cancer Model, Johns Hopkins Pathology Young Investigator’s Day, 2012.

135
4. Sunay, ME et al. Elucidating Mechanisms of Immune Modulation by Sorafenib in
Breast Cancer, Johns Hopkins Pathobiology Training Program Annual Retreat,
2012.
5. Sunay, ME et al. Understanding Mechanisms of Immune Modulation by Sorafenib
in HER2+ Breast Cancer, Johns Hopkins Sydney Kimmel Comprehensive Cancer
Center Breast Program Retreat, 2012.
6. Sunay, ME et al. Determining the Immune Mechanisms of Using Small Molecular
Inhibitors to Improve the Efficacy of HER2/Neu Vaccination, Johns Hopkins
Pathology Young Investigator’s Day, 2011.
7. Sunay, ME et al. Immune Modulation by Sorafenib in a HER2+ Breast Cancer,
Johns Hopkins Pathobiology Training Program Annual Retreat. Baltimore, MD, “
8. Sunay, ME et al. Mechanisms of Immune Modulation by Sorafenib in a Mouse
HER2+ Breast Cancer Model, Sydney Kimmel Comprehensive Cancer Center
Breast Program Retreat. 2011.
9. Sunay, ME et al. Determining Mechanisms of Immune Modulation by Sorafenib
in a HER2+ Breast Cancer Model, MARM ACS Annual Meeting. 2011.
10. Sunay, ME et al. Identification of Novel Tumor Antigens by Vaccine-Induced
Antibody Analysis in Patients with Metastatic Breast Cancer, Sydney Kimmel
Comprehensive Cancer Center Breast Program Retreat, 2010.
11. Erdinc, MM et al. Vaccine-Induced Antibody Analysis in Patients with Metastatic
Breast Cancer, The Pathobiology Training Program Annual Retreat, 2009.
12. Erdinc, MM et al. Identifying Novel Tumor Antigens by Vaccine-Induced
Antibody Analysis, Sydney Kimmel Comprehensive Cancer Center Breast
Program Retreat. 2009.
Related Documents