RESEARCH ARTICLE Open Access Gene expression profiling in gills of the great spider crab Hyas araneus in response to ocean acidification and warming Lars Harms 1* , Stephan Frickenhaus 2 , Melanie Schiffer 1 , Felix Christopher Mark 1 , Daniela Storch 1 , Christoph Held 3 , Hans-Otto Pörtner 1 and Magnus Lucassen 1 Abstract Background: Hypercapnia and elevated temperatures resulting from climate change may have adverse consequences for many marine organisms. While diverse physiological and ecological effects have been identified, changes in those molecular mechanisms, which shape the physiological phenotype of a species and limit its capacity to compensate, remain poorly understood. Here, we use global gene expression profiling through RNA-Sequencing to study the transcriptional responses to ocean acidification and warming in gills of the boreal spider crab Hyas araneus exposed medium-term (10 weeks) to intermediate (1,120 μatm) and high (1,960 μatm) PCO 2 at different temperatures (5°C and 10°C). Results: The analyses reveal shifts in steady state gene expression from control to intermediate and from intermediate to high CO 2 exposures. At 5°C acid–base, energy metabolism and stress response related genes were upregulated at intermediate PCO 2 , whereas high PCO 2 induced a relative reduction in expression to levels closer to controls. A similar pattern was found at elevated temperature (10°C). There was a strong coordination between acid–base, metabolic and stress-related processes. Hemolymph parameters at intermediate PCO 2 indicate enhanced capacity in acid–base compensation potentially supported by upregulation of a V-ATPase. The likely enhanced energy demand might be met by the upregulation of the electron transport system (ETS), but may lead to increased oxidative stress reflected in upregulated antioxidant defense transcripts. These mechanisms were attenuated by high PCO 2 , possibly as a result of limited acid–base compensation and metabolic down-regulation. Conclusion: Our findings indicate a PCO 2 dependent threshold beyond which compensation by acclimation fails progressively. They also indicate a limited ability of this stenoecious crustacean to compensate for the effects of ocean acidification with and without concomitant warming. Keywords: Hyas araneus, RNA-Seq, Ocean acidification, Warming, Gene expression, Crustaceans Background Increasing anthropogenic emissions of CO 2 induce ocean warming and acidification. These changes in environ- mental conditions may have adverse effects on marine organisms [1-5]. However, the responses to ocean acid- ification (OA) are highly variable between organisms [4,5] based on the fact that various animals differ in their capacities to compensate for acid–base disturbances caused by elevated seawater CO 2 and resulting blood hypercapnia for review see [5]. Organisms with low compensation abilities show depressed metabolism, altered energy budgets, and as a result, lower rates of growth or development [6-9]. In contrast, organisms compensating for acid–base disturbances through active ion transport, such as fish, cephalopods and some crustaceans are projected to be more tolerant towards OA [3,10]. In parallel to these differential capacities, sensitivities within a phylum seem to be related to differ- ences in lifestyle and associated energy turnover [5,11]. Furthermore, species or populations from highly variable environments with natural variations in PCO 2 may have * Correspondence: [email protected] 1 Integrative Ecophysiology, Alfred Wegener Institute, Bremerhaven, Germany Full list of author information is available at the end of the article © 2014 Harms et al.; licensee BioMed Central Ltd. This is an Open Access article distributed under the terms of the Creative Commons Attribution License (http://creativecommons.org/licenses/by/2.0), which permits unrestricted use, distribution, and reproduction in any medium, provided the original work is properly credited. The Creative Commons Public Domain Dedication waiver (http://creativecommons.org/publicdomain/zero/1.0/) applies to the data made available in this article, unless otherwise stated. Harms et al. BMC Genomics 2014, 15:789 http://www.biomedcentral.com/1471-2164/15/789

Welcome message from author
This document is posted to help you gain knowledge. Please leave a comment to let me know what you think about it! Share it to your friends and learn new things together.
Transcript

Harms et al. BMC Genomics 2014, 15:789http://www.biomedcentral.com/1471-2164/15/789
RESEARCH ARTICLE Open Access
Gene expression profiling in gills of the greatspider crab Hyas araneus in response to oceanacidification and warmingLars Harms1*, Stephan Frickenhaus2, Melanie Schiffer1, Felix Christopher Mark1, Daniela Storch1, Christoph Held3,Hans-Otto Pörtner1 and Magnus Lucassen1
Abstract
Background: Hypercapnia and elevated temperatures resulting from climate change may have adverse consequencesfor many marine organisms. While diverse physiological and ecological effects have been identified, changes in thosemolecular mechanisms, which shape the physiological phenotype of a species and limit its capacity to compensate,remain poorly understood. Here, we use global gene expression profiling through RNA-Sequencing to study thetranscriptional responses to ocean acidification and warming in gills of the boreal spider crab Hyas araneus exposedmedium-term (10 weeks) to intermediate (1,120 μatm) and high (1,960 μatm) PCO2 at different temperatures(5°C and 10°C).
Results: The analyses reveal shifts in steady state gene expression from control to intermediate and from intermediateto high CO2 exposures. At 5°C acid–base, energy metabolism and stress response related genes were upregulated atintermediate PCO2, whereas high PCO2 induced a relative reduction in expression to levels closer to controls. A similarpattern was found at elevated temperature (10°C). There was a strong coordination between acid–base, metabolic andstress-related processes. Hemolymph parameters at intermediate PCO2 indicate enhanced capacity in acid–basecompensation potentially supported by upregulation of a V-ATPase. The likely enhanced energy demand might bemet by the upregulation of the electron transport system (ETS), but may lead to increased oxidative stress reflectedin upregulated antioxidant defense transcripts. These mechanisms were attenuated by high PCO2, possibly as aresult of limited acid–base compensation and metabolic down-regulation.
Conclusion: Our findings indicate a PCO2 dependent threshold beyond which compensation by acclimation failsprogressively. They also indicate a limited ability of this stenoecious crustacean to compensate for the effects ofocean acidification with and without concomitant warming.
Keywords: Hyas araneus, RNA-Seq, Ocean acidification, Warming, Gene expression, Crustaceans
BackgroundIncreasing anthropogenic emissions of CO2 induce oceanwarming and acidification. These changes in environ-mental conditions may have adverse effects on marineorganisms [1-5]. However, the responses to ocean acid-ification (OA) are highly variable between organisms[4,5] based on the fact that various animals differ intheir capacities to compensate for acid–base disturbancescaused by elevated seawater CO2 and resulting blood
* Correspondence: [email protected] Ecophysiology, Alfred Wegener Institute, Bremerhaven, GermanyFull list of author information is available at the end of the article
© 2014 Harms et al.; licensee BioMed CentralCommons Attribution License (http://creativecreproduction in any medium, provided the orDedication waiver (http://creativecommons.orunless otherwise stated.
hypercapnia for review see [5]. Organisms with lowcompensation abilities show depressed metabolism,altered energy budgets, and as a result, lower rates ofgrowth or development [6-9]. In contrast, organismscompensating for acid–base disturbances through activeion transport, such as fish, cephalopods and somecrustaceans are projected to be more tolerant towardsOA [3,10]. In parallel to these differential capacities,sensitivities within a phylum seem to be related to differ-ences in lifestyle and associated energy turnover [5,11].Furthermore, species or populations from highly variableenvironments with natural variations in PCO2 may have
Ltd. This is an Open Access article distributed under the terms of the Creativeommons.org/licenses/by/2.0), which permits unrestricted use, distribution, andiginal work is properly credited. The Creative Commons Public Domaing/publicdomain/zero/1.0/) applies to the data made available in this article,
Harms et al. BMC Genomics 2014, 15:789 Page 2 of 17http://www.biomedcentral.com/1471-2164/15/789
evolved to be more tolerant than species from relativelystable environments. As an extreme example, the shallowliving crab Cancer magister can compensate within 24 hfor hypercapnia-induced acidosis, while the extracellularacidosis in the deep-sea crab Chionoecetes tanneri remainsmostly uncompensated during this time [12]. However,such short-term studies have limited value if it comes tothe projection of long-term ocean acidification effects.The great spider crab Hyas araneus is an osmocon-
forming, slow-moving and inactive species living in rela-tively stable physical conditions and is thus an excellentcandidate to study the medium to long-term effects ofabiotic stressors. A number of physiological studies havealready investigated the effects of elevated seawater PCO2
on this species: CO2 induced decreases in growth ratesand fitness of larvae were demonstrated in a North Seapopulation, whereas an Arctic population seemed moresensitive towards thermal stress [13]. In the Spitsbergenpopulation elevated seawater PCO2 (1,100 μatm) causedan increase in metabolic rate during larval developmentpointing to higher metabolic costs [14]. Adult H. araneusbecame more heat intolerant under elevated CO2 with po-tential consequences for biogeographical distribution [15].In the Arctic population synergistic effects of increasedtemperature and PCO2 adversely influenced the capacitiesfor activity associated with disturbances in acid–basestatus [16].To understand organismal sensitivities and tolerance-
limits to OA with and without concomitant warming itis important to identify and differentiate between themechanisms that shape an organism’s capacity to copewith the projected changes. At the whole organism level,crustaceans are impacted by OA with and without con-comitant warming with effects ranging from changes inacid–base homeostasis [12,16,17], metabolism [9,18,19],growth [7,13,20,21], to development [13,14,22,23] and evensurvival [21,24]. These processes are highly interdependent.While active acid–base regulation is an energy-consumingprocess [25], eventually leading to enhanced metabolicrequirements [26], uncompensated extracellular pHcan elicit metabolic depression [27] via effects on trans-membrane ion exchange [25]. Furthermore, low pH cantrigger a decrease in protein synthesis [28]; this may resultin reduction of growth under hypercapnic conditions [6].These previous studies provide us with important insightsinto the mechanistic background of responses to ongoingOA and warming, but also highlight the complexity ofthe processes involved. To elaborate the sensitivitiesand potential tolerance limits further, it is important toinvestigate the key regulatory mechanisms shaping affectedprocesses and the tradeoffs between them.A transcriptomic approach makes it possible to sim-
ultaneously investigate the genetic response of a widerange of cellular processes, and thus to identify the
early responses to environmental changes [29]. Geneexpression analyses can be used to characterize themolecular phenotype and the cellular changes thatunderpin physiological responses. They can also beused to uncover molecular mechanisms that might definephysiological plasticity. Transcriptomic analysis can fur-ther reveal the connections between response mechanismsto environmental changes such as OA or temperature thatmay otherwise be overlooked [30]. Due to technologicaladvances in recent years, analyses of the whole transcrip-tome have become increasingly attractive to study non-model (marine) organisms, and their molecular responsesto a variety of environmental changes such as warming[31,32], salinity fluctuations [33], hypoxia [34,35] or OA[29,36,37] in marine organisms.In the present study, we used gene expression profiling
to explore the molecular response in gills of H. araneusexposed to hypercapnia at different temperatures. Inmarine crustaceans, gills are the first line of defenceagainst acid–base disturbances of body fluids and thusthe most important regulatory tissue for CO2 inducedacidification of the hemolymph [38,39]. We used a quan-titative transcriptomic approach based on direct cDNAsequencing using high-throughput Illumina sequencing[40]. Since the present study focuses on the mechanismsinvolved and the potential sensitivity of H. araneus toclimate changes, we selected CO2 concentrations projectedfor the year 2100 and 2300 by the Intergovernmental Panelon Climate Change (IPCC) as well as two different tem-peratures (5°C as the summer control temperature forthe Arctic population and 10°C as the median habitattemperature of the species considering the whole distribu-tion range. This study provides comprehensive insightsinto the transcriptional changes involved in the responsesto warming and OA.
MethodsAnimals, experimental treatments and tissue samplingAdult specimens of the Arctic spider crab H. araneus(Linnaeus 1758) were collected by scientific divers inMay 2009 in Kongsfjord at the west coast of Spitsbergenat 7–12 m depth (N 78°58.635'; E 11°29.454') and trans-ferred to the Alfred Wegener Institute, Bremerhaven,Germany. Animals were maintained at 5°C in flow throughaquaria with natural seawater prior to experimentation.During this period, seawater was aerated with ambientair and animals were fed ad libitum twice per week withfrozen mussels and cockles (Mytilus edulis and Cerasto-derma edule).For the medium-term experiment, male spider crabs
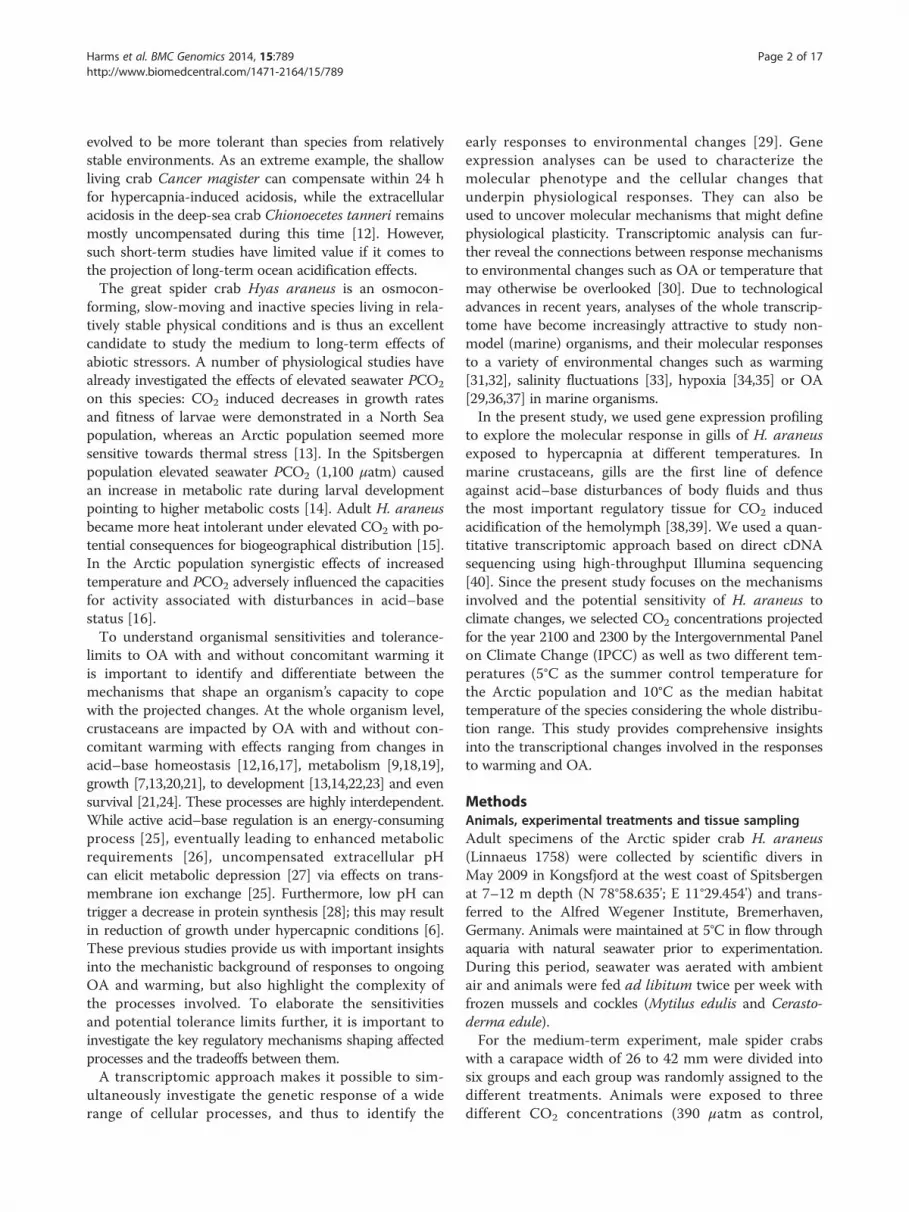
with a carapace width of 26 to 42 mm were divided intosix groups and each group was randomly assigned to thedifferent treatments. Animals were exposed to threedifferent CO2 concentrations (390 μatm as control,
Harms et al. BMC Genomics 2014, 15:789 Page 3 of 17http://www.biomedcentral.com/1471-2164/15/789
1,120 μatm as intermediate concentration and 1,960 μatmas high CO2 treatment) and two different temperatures(5°C as control and 10°C as elevated temperature) for10 weeks (Figure 1). For each treatment, 5–7 animalswere individually placed in 2 l wide-mouth containers(Kautex, Bonn, Germany).Experiments were carried out in recirculating seawater
CO2 manipulation systems of 1 cubic meter volume each.Seawater of the storage tank was pumped to a header tankat a rate of 20 l min−1, which supplied the wide-mouthcontainer by gravity feed at a flow rate of 200 ml min−1.Water of experimental containers was retained in acollection tank and pumped back to the storage tank ata flow rate of 20 l min−1. Ambient air temperature inthe experimental rooms was thermostated to keep watertemperature constant. Seawater CO2 manipulation wasaccomplished by constantly aerating the storage andheader tanks with a defined air/CO2 mixture using anautomatic mass flow controller (HTK 6 channel, HTKHamburg GmbH, Germany). A light–dark cycle of 12:12 hwas established. Water was partly changed every week byrefilling the storage tank with pre-equilibrated seawater(PCO2 and temperature). Experimental animals were fedonce a week ad libitum with frozen mussels (C. edule).To monitor water physicochemistry, seawater samples
were collected in airtight glass vials to prevent exchangewith the atmosphere, and total dissolved carbon (DIC)concentration was immediately measured with a SealQuAAtro SFA Analyzer (Seal Analytical, Mequon, UnitedStates of America). Temperature, salinity and pH weremeasured at the time of collection and, together with DIC,used to calculate the PCO2 in seawater using CO2SYS [41].Seawater pH was measured using a pH electrode (ProfiLinepH 3310, WTW Wissenschaftlich-Technische WerkstättenGmbH, Weilheim, Germany) calibrated at the respectivetemperature with National Institute of Standards andTechnology (NIST) standard pH buffer and salinity with
treatment (IV) - PCO2 1,12
treatment (V) - PCO2 1,960
treatment (III) - PCO2 390 µ
treatment (II) - PCO2 1,960
treatment (I) - PCO2 1,120
control - PCO2 390 µatm; 5
animal collectionmaintainance/acclimation
(aerated with ambient air; 5°C)
exposure - 10 w2009 start exposure
Figure 1 Overview of the experimental design used in the differentiauntil the start of experimentation. Subsequently, exposure experiments weexposure, tissue samples were taken and total RNA was extracted for analySequencing. Sequencing data were used for differential expression analysis
a conductivity meter (ProfiLine Cond 1970i, WTWWissenschaftlich-Technische Werkstätten GmbH, Weilheim,Germany). For CO2SYS, NBS (NIST) scale of seawaterpH and constants of Mehrbach et al. [41] refitted byDickson and Millero [41] were used. A summary ofwater physicochemistry data is given in Table 1.After experimental exposure, all 6 gill pairs were col-
lected from 5–7 animals in each treatment. Tissuesamples were immediately frozen in liquid nitrogenand stored at −80°C until usage.
Hemolymph sampling and measurementsDirectly before tissue sampling, around 1 ml ofhemolymph was extracted at the coxa of the thirdwalking leg using a 1 ml sterile syringe (Henke-Sass,Wolf GmbH, Tuttlingen, Germany). Hemolymph wasimmediately transferred to a 1.5 ml tube (AG Eppendorf,Hamburg, Germany), placed in a thermostatted waterbath and pH was measured at acclimation temperatureusing a pH microelectrode (PHM 93 Reference pH meter,Radiometer, Copenhagen, Denmark; InLab Micro, MettlerToledo GmbH, Germany). The pH meter was calibratedat the respective temperature with NIST standard pH buf-fer. A hemolymph subsample was withdrawn using a gas-tight 200 μl syringe (Hamilton Company, Reno, UnitedStates of America) and total dissolved inorganic carbon(CCO2) of extracellular fluid was analysed according tothe modified gas chromatographic method [42,43]. Extra-cellular fluid was injected in gas tight glass vials containing3 ml of air equilibrated 0.1 M hydrogen chloride (HCl)and analysed by gas chromatography in an Agilent 6890 NGC System (Agilent Technologies, Santa Clara, UnitedStates of America). The bicarbonate (HCO3
−) concen-tration of the extracellular fluid was calculated fromCCO2 and pH using equations derived from theHenderson-Hasselbalch equation. PCO2 was calculated asPCO2 =CCO2 * (10
ph-pkIII * αCO2 + αCO2)−1 and HCO3
−
0 µatm; 10°C
µatm; 10°C
atm; 10°C
µatm; 5°C
µatm; 5°C
°C
tissuesampling(each treatmentseparately)
RNA exraction(each treatmentseparately)
RNA exraction/sequencing(each treatmentseparately)
qRT-PCR
DESeqanalysis
eeks
l expression. Animals were collected in 2009 and acclimated to 5°Cre conducted for a time period of 10 weeks for all treatments. Afterses by quantitative real-time polymerase chain reaction (qRT-PCR) andby DESeq.

Table 1 Summary of the seawater physiochemical conditions during experiments with Hyas araneus
Parameter Control Treatment (I) Treatment (II) Treatment (III) Treatment (IV) Treatment (V)
Temperature (°C) 5.3 ± 0.2 4.2 ± 0.2 4.5 ± 0.2 9.9 ± 0.2 9.7 ± 0.3 9.8 ± 0.2
Salinity (‰) 32.1 ± 0.7 32.2 ± 0.7 32.2 ± 0.6 33.6 ± 0.4 33.5 ± 0.4 33.6 ± 0.3
pH (NBS scale) 8.15 ± 0.03 7.81 ± 0.04 7.55 ± 0.06 8.22 ± 0.04 7.85 ± 0.04 7.54 ± 0.05
DIC (mmol kg−1) 2,366 ± 42 2,436 ± 14 2,520 ± 39 2,295 ± 28 2,395 ± 14 2,488 ± 22
PCO2 (μatm) 441 ± 35 991 ± 96 1,878 ± 246 366 ± 30 942 ± 59 2,015 ± 147
Total alkalinity (mmol kg−1) 2,479 ± 13 2,479 ± 14 2,491 ± 14 2,484 ± 10 2,469 ± 13 2,473 ± 15
Temperature, Salinity, pH and dissolved inorganic carbon (DIC) were measured and partial pressure of CO2 (PCO2) and total alkalinity were calculated usingCO2SYS [41]. Data are mean ± SD with N = 24 (5°C), N = 16–20 (10°C).
Harms et al. BMC Genomics 2014, 15:789 Page 4 of 17http://www.biomedcentral.com/1471-2164/15/789
as HCO3− =CCO2- αCO2 * PCO2, with CCO2 being the
total CO2 concentration in mM, αCO2 the physicalsolubility of CO2, PCO2 the partial pressure of CO2 inkPa and pK the apparent dissociation constant of theCO2/apparent HCO3
− system. αCO2 and pK were cal-culated according to Pörtner et al. [44]. Raw data ofhemolymph sampling and measurements are availableat http://doi.org/10.1594/PANGAEA.833705.
RNA extraction and sequencingTotal tissue RNA of gills was extracted using the RNeasyMini Kit according to the Purification of Total RNAfrom Animal Tissue protocol (QIAGEN, Hilden, Germany).RNA quantities were determined by a NanoDrop 2000cspectrometer (PeqLab, Erlangen, Germany), and RNA wasanalysed for quality by microfluidic electrophoresis in anAgilent 2100 Bioanalyzer (Agilent Technologies, SantaClara, United States of America). Total RNA from all gillpairs of 4 animals was pooled for each treatment, and usedfor library constructions and sequencing by GATC Biotech(Konstanz, Germany). The cDNA libraries for each treat-ment were constructed according to the SMART protocolfor Illumina sequencing (Clontech, Mountain View, USA)and after adapter ligation pooled into two samples. Toobtain appropriate deep sequencing results, sampleswere sequenced at least twice. Illumina sequencing wasperformed on a HiSeq 2000 Sequencer by GATC Biotech(Konstanz, Germany). Raw reads were quality controlledby FastQC (Babraham Institute, Cambridge, UK) andcleaned using the FastX-Toolkit (Hannon Lab - ColdSpring Harbor Laboratory, New York, USA). Qualitycontrol and trimming was performed using the follow-ing parameters: Minimum quality score of 20, mini-mum percentage of bases within the quality score of 90and a minimum length of 25 bases. The cleaned rawdata of the Illumina sequencing were deposited in theEuropean Nucleotide Archive (ENA) at the EuropeanMolecular Biological Laboratory – European Bioinformat-ics Institute (EMBL-EBI) (http://www.ebi.ac.uk/ena/data/view/ERP002128). A summary of the cleaned sequen-cing results for all samples is given in Additional file 1:Table S1.
Mapping and identification of differentially expressedgenesShort reads of each sample were separately aligned againstthe annotated H. araneus transcriptome [40], using theBurrows-Wheeler Aligner (BWA) (version 0.5.9) withdefault parameters [45]. Obtained files were processedinto bam files for further analysis, using SAMTools(version 0.1.18) [46]. An overview of the mapping andefficiency is described in Additional file 1: Table S1.Differential expression analysis was conducted withthe R statistic software [47]. Read counts were summedup for all sequencing runs of each sample and used forthe differential expression analysis without biologicalreplicates. Differential expression of genes was evalu-ated using a test based on the negative binomial distri-bution as integrated in the Bioconductor R packageDESeq [48], with a standard level of p ≤ 0.05 indicatingsignificance. Control (control PCO2/control temperature)was compared to five treatments: (I) elevated temperature;(II) intermediate PCO2 at control temperature; (III) highPCO2 at control temperature (IV) intermediate PCO2
at elevated temperature; (V) high PCO2 at elevatedtemperature. The previously annotated transcriptomemade a Gene Ontology enrichment analysis possible totest for particular affected terms, using Fisher’s exacttest (FDR ≤ 0.05) as implemented in the Blast2GO soft-ware (version 2.6.0) [49,50]. All subsets of significantlyregulated genes identified by the binominal distributiontest were tested against the full set of annotated sequencesof the H. araneus transcriptome. To cut down on redun-dancy, GO terms were summarized into a more represen-tative subset of terms using the web-based clustering toolREVIGO [51].
Validation by quantitative real-time polymerase chainreaction (qRT-PCR)A set of transcript sequences known to be involved inacid–base regulation and/or transcripts that showeddifferential expression in one or more treatments wasselected for validation of RNA-Seq results. Primers weredesigned using the PrimerExpress software (version 3.0)(Applied Biosystems, Darmstadt, Germany) with the

Harms et al. BMC Genomics 2014, 15:789 Page 5 of 17http://www.biomedcentral.com/1471-2164/15/789
Taq-Man MGB Quantification method and default pa-rameters (Additional file 2: Table S2). Primer specifi-city was given by using sequences of the annotated H.araneus transcriptome [40]. All primer pairs weretested for performance and efficiency across a series ofcDNA dilutions (1:20; 1:40; 1: 100; 1:200; 1:1000; 1:2000).Primers used displayed a suitable per cycle amplificationrate, with an efficiency (E) of 2.0 ± 0.1 and R2 > 0.98.Efficiency was calculated as E = 10(−1/S), with s beingthe slope of linear regression.Total RNA was extracted from gills as described
above. Ten micrograms of total RNA per sample wastreated with DNAse for DNA digestion using the TurboDNA-free kit (Ambion, Darmstadt, Germany) and 0.4 μgDNA free RNA was transcribed into cDNA with theHigh-Capacity cDNA Reverse Transcription kit (AppliedBiosystems, Darmstadt, Germany). Real-time PCR wasperformed on a 7500 Real-time PCR System (AppliedBiosystems, Darmstadt, Germany) and SYBR® Green PCRmaster mix (Applied Biosystems, Darmstadt, Germany).All genes were finally analysed in a 40-fold dilution andamplified with 300 nM of primer. To verify the amplifica-tion specificity of fragments a melting curve analysis wasperformed for each reaction.Gene expression calculation was based on the CT-
threshold. Absolute mRNA quantities were calculatedas QX = E(CT) and normalized with the formula QN(X) =QX/QX(HK), with QX(HK) being the absolute mRNAquantity of the housekeeping gene sodium bicarbonatecotransporter (NBC). The housekeeping gene was deter-mined using geNorm implemented in the software qbase-Plus (version 2.1) (Biogazelle, Zwijnaarde, Belgium) with arelative expression stability of M ≤ 0.42 (high referencestability is given at an average geNorm of M ≤ 0.5). Toensure consistency with the differential expression resultsof the DESeq analysis, gene expression results of the qRT-PCR were calculated as log2 fold change (log2FC) of meannormalized quantities of treatment and control.
StatisticsTo identify significant differences in the sum of all sig-nificantly up- and down-regulated transcripts betweentreatments, significantly changed transcripts in one ormore treatment, identified by the DESeq analysis, weretransformed into a matrix with 1 = significantly up-regulated, −1 = significantly down-regulated and 0 = notsignificantly regulated transcript. Treatments were ana-lysed for statistical differences applying the Wilcoxonmatched pairs test as implemented in SigmaPlot (Version12.0, Systat Software Inc., San Jose, USA) with p < 0.05.Data from each treatment were tested against each other.The correlation between the differential expression
results of the DESeq analysis and the correspondinggene expression results of the qRT-PCR was determined
by Pearson Correlation as implemented in SigmaPlot 12.0(Systat Software Inc., San Jose, USA).A one-way ANOVA was used to identify the effect of
seawater PCO2 on hemolymph pH and bicarbonate(HCO3
−). Data obtained under various PCO2 levels weretested against each other for each temperature separately.A Holm Sidak test for multiple comparisons was used fora posteriori analyses. Tests were performed in SigmaPlot(Version 12.0, Systat Software Inc., San Jose, UnitedStates of America) with p < 0.05 indicating significantdifferences.
Results and discussionA total of 55 million reads (56%) from initial Illuminasequencing passed the quality filter and was used for thedifferential expression analysis. After processing, anaverage of 9.2 million high quality reads were producedfor each sample from 2–3 sequencing runs per sample(Additional file 1: Table S1). To obtain the differentialexpression of each gene, high quality reads were alignedon the H. araneus transcriptome [40]. An average of 5.2million reads for each sample produced distinct align-ments. The alignment process yielded an average effi-ciency of 56% for the high quality reads (Additional file 1:Table S1). The achieved mapping efficiency is actuallyhigher than in a comparable study of a non-model or-ganism, which used an analogous approach for differentialexpression analysis (41% efficiency) [52]. Furthermore,96.5% of all transcript sequences in the H. araneus tran-scriptome were detected in the RNA-Seq data. However,the occurrence of a large amount of unmapped readsmight result from sequencing errors, repetitive sequencesor inadequate quality filtering of the Illumina reads. Fur-thermore, it has to be considered that transcripts sup-ported by only a small number of aligned reads (≤10) mayreflect incompletely assembled transcripts in the refer-ence. Those poorly supported transcript sequences wereexcluded from the subsequent analysis, and a final test-setof 16,201 transcripts sequences was used for the differen-tial expression analysis. As there were no biological repli-cates, it has to be considered that the variance for genescan only be estimated by comparing the mean-variancerelationship between samples/treatments, as if they werereplicates, resulting in an overestimation of the varianceand thus make this approach more conservative. Fur-thermore, expression levels of stable and highly expressedgenes, based on the RNA-Seq data, were analysed byquantitative real-time PCR (qRT-PCR) confirming theRNA-Seq methodology used in this study (Additional file3: Figure S1 and Additional file 4: Figure S2).We could identify 864 (5.3%) out of the 16,202
tested transcripts to be differentially expressed aftermedium-term (10 weeks) exposure to the abiotic effectors(Additional file 5: Table S3). Out of these differentially
Harms et al. BMC Genomics 2014, 15:789 Page 6 of 17http://www.biomedcentral.com/1471-2164/15/789
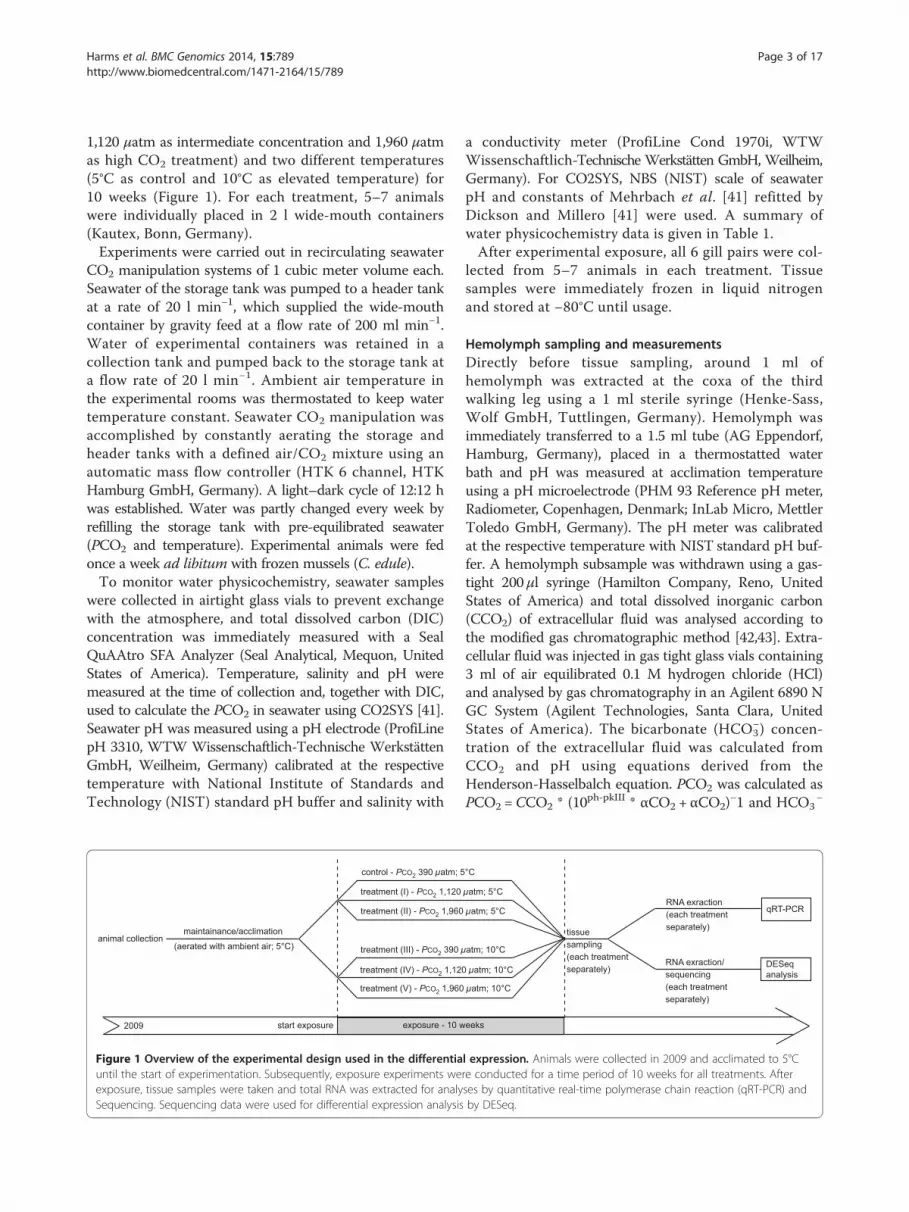
expressed genes (DEG) 40.0% and 31.3% were differen-tially expressed under intermediate CO2 (treatment I) andhigh CO2 (treatment II; Additional file 6: Figure S3A, B),respectively. For the high temperature (treatment III),41.0% showed significantly different expression levels(Additional file 6: Figure S3C). The combination of factorsintermediate CO2 (treatment IV) and high CO2 (treatmentV) with elevated temperature revealed 38.7% and 29.4%DEG, respectively (Additional file 6: Figure S3D, E). Whilethe total amount of significant DEGs was similar in alltreatments, individual genes displayed large differences inup- or down-regulation (Figure 2). Intermediate CO2 (I)led to strongly up-regulated transcript levels, while hightemperature (III) caused strong down-regulation.These general results, especially the strong up-regulation
of gene expression under intermediate CO2 (I), suggestthat the regulatory capacity is high at moderately elevatedPCO2 in adult H. araneus but reduced at higher CO2
levels. Up-regulation was also reduced at intermediateCO2 when combined with elevated temperature (IV) ra-ther than at control temperature. Down-regulation inDEG predominated under warming alone (treatment III,high temperature) when compared to control temperature(I). 137 of the 177 genes that displayed significantlychanged transcripts in the intermediate CO2/elevatedtemperature treatment (IV) were also differentially ex-pressed in the high temperature treatment (III) sup-porting a strong temperature-dependent response, in
Figure 2 Differences in the sum of all significantly regulatedtranscripts of Hyas araneus after exposure experiments. Foreach treatment, up- and down-regulated transcripts were countedand represented as bars (black bars = up-regulated; grey bars =down-regulated). Treatments were tested for statistical differencesusing the Wilcoxon signed rank test (p < 0.05). Letters denote thesignificant differences. Differing letters indicate significantdifferences; identical letters indicate no significant difference.
line with the hypothesis that temperature affects mostbiochemical processes. Faced with a long-term temperaturechange, ectothermal organisms retain physiological homeo-stasis by several acclimation strategies, which can be ofquantitative, qualitative or modifying nature [53]. Theenhanced down-regulation seen in the high temperaturetreatments suggest that H. araneus may adopt a quanti-tative strategy to maintain physiological rates by down-regulating the concentrations of enzymes between 5 and10°C [54].To identify processes actually responding to elevated
PCO2 and temperature, a first analysis was carried outusing gene ontology (GO) terms. The set of GO-annotateddifferentially expressed genes was statistically tested for theover- and underrepresentation of GO terms to identifymolecular functions, cellular components and biologicalprocesses affected most by the experimental treatments(Additional file 7: Table S4). The GO enrichment analysisrevealed a variety of significantly over-represented GOterms that can primarily be summarized underneath themore generic categories ‘metabolism’ and ‘cell structure’.23 and 25 over-represented GO terms, respectively, couldbe associated with these categories. It is important tomention that both intermediate CO2 treatments (I, IV)constitute 57% and 27% of the over-represented GOterms, respectively, representing compensation mecha-nisms mentioned above. The only over-representedGO term under high CO2, trehalose metabolic process,was evaluated for the down-regulated genes of thecombined stress treatment (V). The fact that it wasover-represented in all treatments indicates that enhancedexpression of trehalose metabolism can be rated as aunifying response to both elevated CO2 and elevatedtemperature.Within the ‘cell structure’ related GO-terms, intermedi-
ate CO2 (I, IV) led to significant up-regulation of genesconcerning cell surface, extracellular matrix, structuralmolecule activity or brush border membrane, suggesting astructural modification of the gills. Some GO terms werefound underrepresented at high temperature and in com-bined, intermediate CO2 and high temperature treatments(III, IV), and are assigned mainly to intracellular structuressuch as organelles. The over-representation of ‘cellstructure’ related GO terms suggests that gill epithelialstructure is adjusted in response to PCO2 disturbances.Gills are the principal organs for gas exchange and, to-gether with the excretory organs, responsible for osmoticand ionic regulation in crustaceans [55]. As passive iontransport is influenced by the conductivity of gill epithelia[56], their structural modification might lead to a changein conductivity and would change the diffusion rate ofions. Structural changes were in fact identified in gills ofCarcinus maenas during salinity exposure, with a modifi-cation of the apical plasma membrane system and an
Harms et al. BMC Genomics 2014, 15:789 Page 7 of 17http://www.biomedcentral.com/1471-2164/15/789
enlargement of the subcuticular compartment [57]. As en-vironmental hypercapnia and salinity changes can causesimilar mechanistic responses [39], similar transcriptomicmodifications may occur. This is supported by an over-representation of the GO term response to salt stress inthe intermediate CO2 treatment (I).Although a GO enrichment analysis offers initial in-
sights into processes affected by hypercapnia exposureand elevated temperature, a strong bias exists towardsconserved and well-characterized processes, functionsand cellular components in model organisms. This biasparticularly applies to H. araneus, with a lack of GO an-notation for about 76% of the transcripts. Additionally,many genes are grouped into more than one GO termdepending on their resolution and are thus difficult tointerpret. In light of these contraints, GO analysis canonly provide a general overview of possibly affected pro-cesses and make a more detailed look indispensible.For a more comprehensive understanding of the mecha-
nisms responding to PCO2 and temperature changes, weperformed a second analysis. Here, all genes included inthe most affected categories ‘metabolism’ and ‘structuralmodification’, identified by the GO enrichment analysis,were considered. Additionally, we integrated all genesrelated to ‘acid–base and ion regulation’ and ‘response tostress’ into our analysis, as adjustments in these mecha-nisms are likely relevant in shaping resistance to hyper-capnia exposure or heat stress.For the interpretation of transcriptomic results, it has
to be considered that expression profiles represent oneregulatory level in the response to environmental changesand thus do not necessarily reflect the changes of otherregulatory levels, e.g. protein abundances and activities. Atleast 25% of the proteome cannot be covered by geneexpression profiling [30]. However, there was a positivecorrelation between transcription and translation in 87%of genes that changed ≥ twofold in living cells of yeaststrains [58]. Certainly, a lower correlation has to beconsidered for more complex organisms, however anadditional proteomics study on H. araneus revealed acomparable correlation between gene expression andprotein abundance of ~70% for the intermediate treat-ment at 5°C (unpublished). A transcriptomic approachcan provide first insights into the regulatory processesresponding to environmental changes such as OA ortemperature.
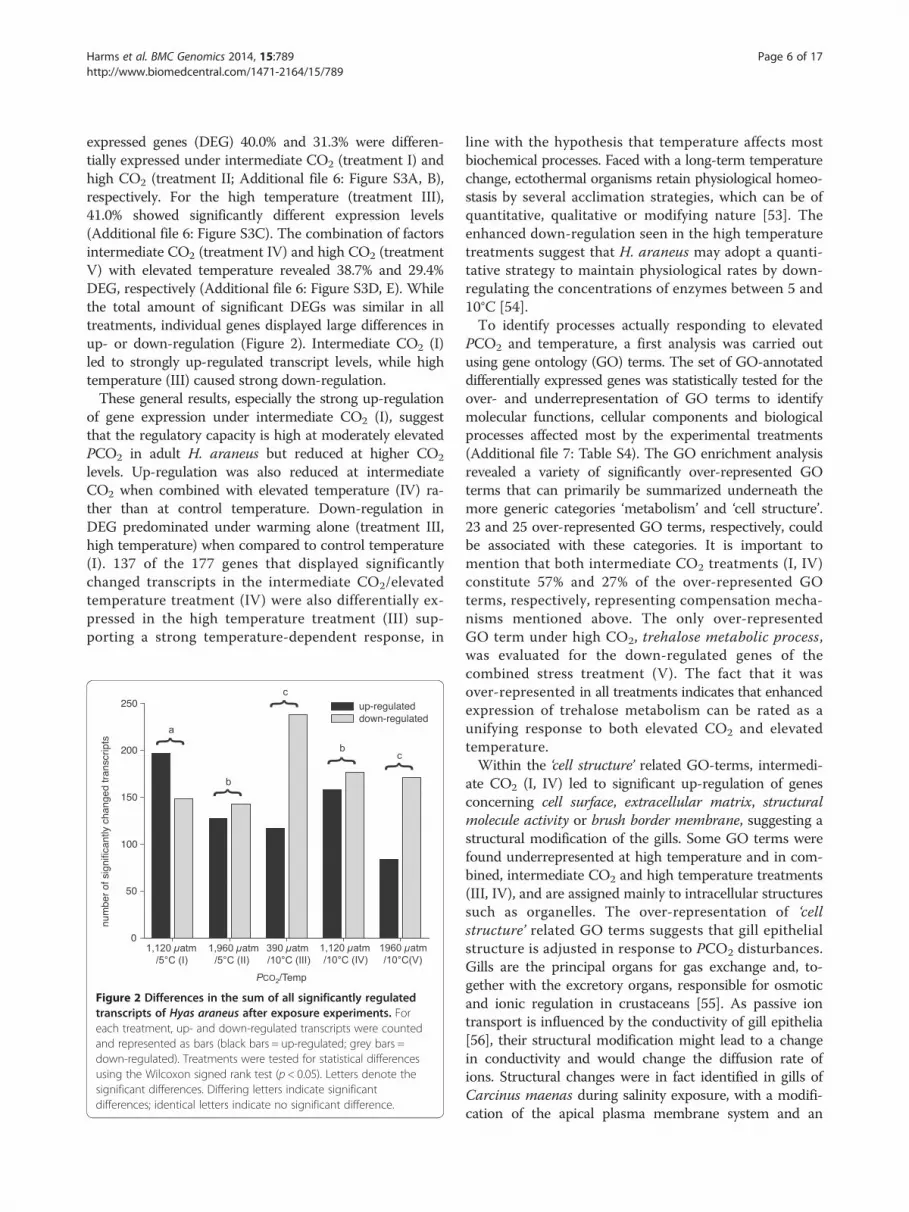
Response of specific groupsAcid–base regulationThe extracellular pH (pHe) measured in the hemolymphof adult H. araneus showed partial compensation underintermediate CO2 levels (I, IV) involving an increase inbicarbonate (HCO3
−) concentration (Figure 3A,B). Underhigh CO2 (II, V), reduction in pHe was greater and the
increase in HCO‐3 was reduced (Figure 3A,B). These
findings suggest a limited capability to compensate for pHe
disturbances caused by high seawater PCO2. According toa crustacean model by Freire et al. [55], proton (H+) excre-tion is generated by apical vacuolar-type (H+)-ATPase(V(H+)-ATPase) and/or sodium/proton exchanger (NHE),the latter dependent on sodium/potassium-ATPase(Na+/K+-ATPase). HCO3
− is enriched in the hemolymphby basolateral anion exchangers. Enzymes that support ac-tive ion transport are the intracellular carbonic anhydrase(CA) and, in terms of a general support of energy con-suming mechanisms, arginine kinase (AK). CA is assumedto accelerate the dissociation of carbonic acid (H2CO3)and provide the substrate for H+ and HCO3
− transporters[55]. AK catalyses the reversible dephosphorylation ofphosphoarginine, contributing to the restoration of ad-enosine triphosphate (ATP) used in energy consumingprocesses [59]. The expression of corresponding genes,V(H+)-ATPase, AK and partial sequences of two alphaCAs was significantly up-regulated at intermediateCO2, whereas such mRNA concentrations were onlymoderately increased at high CO2 (II) (Table 2). Theseexpression levels follow the course of the hemolymphHCO3
− parameters and the more effective acid–baseregulation of adult H. araneus under moderately elevatedCO2. However, only a few sequences encoding forNa+/K+-ATPase were up-regulated under CO2, in con-trast to their response to elevated temperature treatment(III). Under the combined effect of temperature and CO2
Na+/K+-ATPase was also up-regulated. Another enzyme,DOPA decarboxylase, which catalyses the biosynthesis ofdopamine by decarboxylation of L-DOPA, was founddown-regulated at moderate (intermediate) CO2 eleva-tions (I). Elevated dopamine leads to increased sodium in-flux and concomitantly, increased Na+/K+-ATPase activityin gills of C. maenas [60]. In light of this finding constantmRNA levels of Na+/K+-ATPase at intermediate CO2 (I)indicate that the down-regulation of DOPA decarboxylasemay even prevent an activation of Na+/K+-ATPase (Table 2).The gene expression of other transporters, supposed tobe involved in acid–base regulation, such as NHE and/or bicarbonate/chloride co-transporter were not influ-enced at all by elevated PCO2 values or temperature.Acid–base regulation predominantly via the V(H+)-ATPase(as seen in the present transcriptome) might involve min-imal disturbance to ionic composition, e.g. cellular sodiumhomeostasis which would be affected by strong involve-ment of Na+/K+-ATPase. In the sipunculid S. nudus,extracellular acidosis induced a shift in ion transportersduring hypercapnia from high to low energy cost mech-anisms of acid–base regulation, resulting in decreasedNa+/K+-ATPase activity due to lower requirement forsodium regulation [25,27]. In line with our present ob-servations these results suggest a pH regulation system
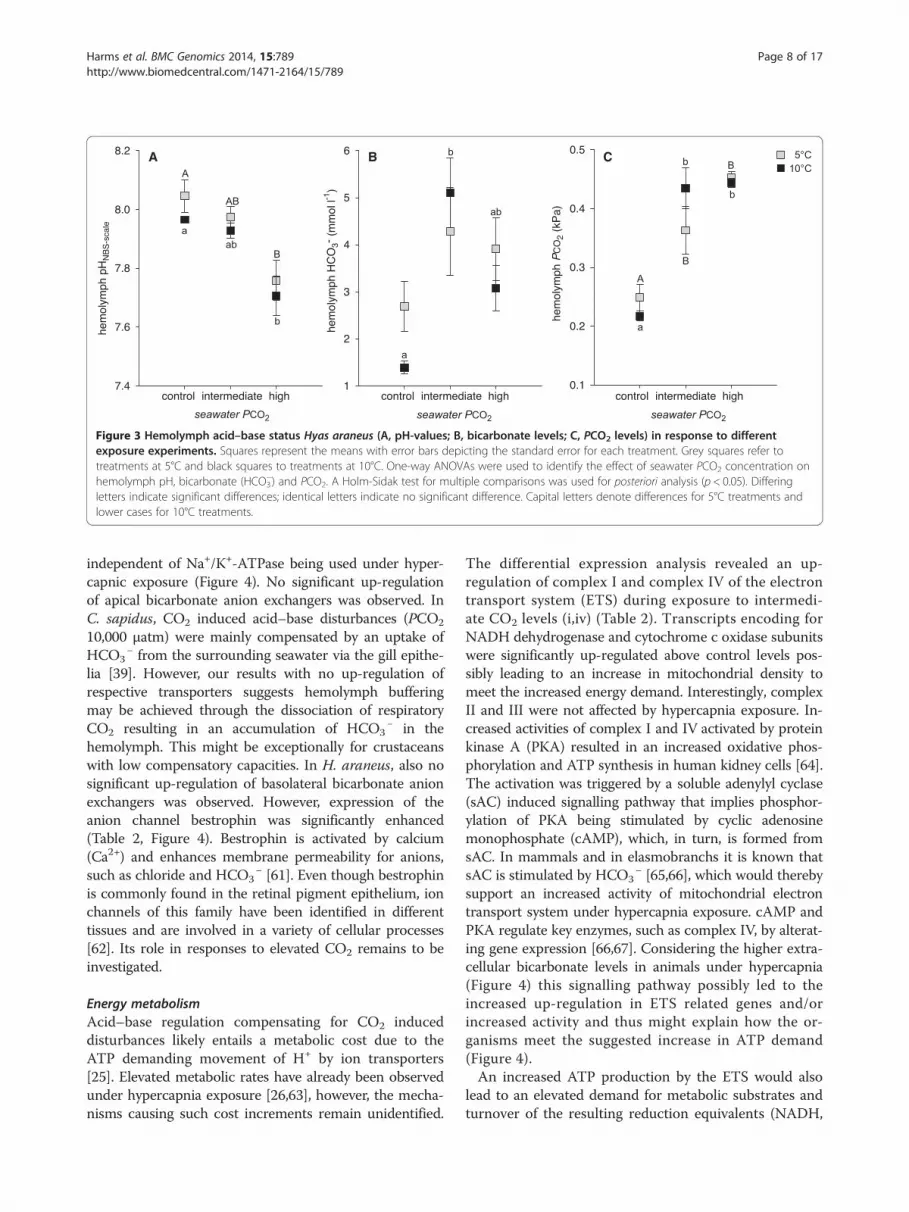
Figure 3 Hemolymph acid–base status Hyas araneus (A, pH-values; B, bicarbonate levels; C, PCO2 levels) in response to differentexposure experiments. Squares represent the means with error bars depicting the standard error for each treatment. Grey squares refer totreatments at 5°C and black squares to treatments at 10°C. One-way ANOVAs were used to identify the effect of seawater PCO2 concentration onhemolymph pH, bicarbonate (HCO3
−) and PCO2. A Holm-Sidak test for multiple comparisons was used for posteriori analysis (p < 0.05). Differingletters indicate significant differences; identical letters indicate no significant difference. Capital letters denote differences for 5°C treatments andlower cases for 10°C treatments.
Harms et al. BMC Genomics 2014, 15:789 Page 8 of 17http://www.biomedcentral.com/1471-2164/15/789
independent of Na+/K+-ATPase being used under hyper-capnic exposure (Figure 4). No significant up-regulationof apical bicarbonate anion exchangers was observed. InC. sapidus, CO2 induced acid–base disturbances (PCO2
10,000 μatm) were mainly compensated by an uptake ofHCO3
− from the surrounding seawater via the gill epithe-lia [39]. However, our results with no up-regulation ofrespective transporters suggests hemolymph bufferingmay be achieved through the dissociation of respiratoryCO2 resulting in an accumulation of HCO3
− in thehemolymph. This might be exceptionally for crustaceanswith low compensatory capacities. In H. araneus, also nosignificant up-regulation of basolateral bicarbonate anionexchangers was observed. However, expression of theanion channel bestrophin was significantly enhanced(Table 2, Figure 4). Bestrophin is activated by calcium(Ca2+) and enhances membrane permeability for anions,such as chloride and HCO3
− [61]. Even though bestrophinis commonly found in the retinal pigment epithelium, ionchannels of this family have been identified in differenttissues and are involved in a variety of cellular processes[62]. Its role in responses to elevated CO2 remains to beinvestigated.
Energy metabolismAcid–base regulation compensating for CO2 induceddisturbances likely entails a metabolic cost due to theATP demanding movement of H+ by ion transporters[25]. Elevated metabolic rates have already been observedunder hypercapnia exposure [26,63], however, the mecha-nisms causing such cost increments remain unidentified.
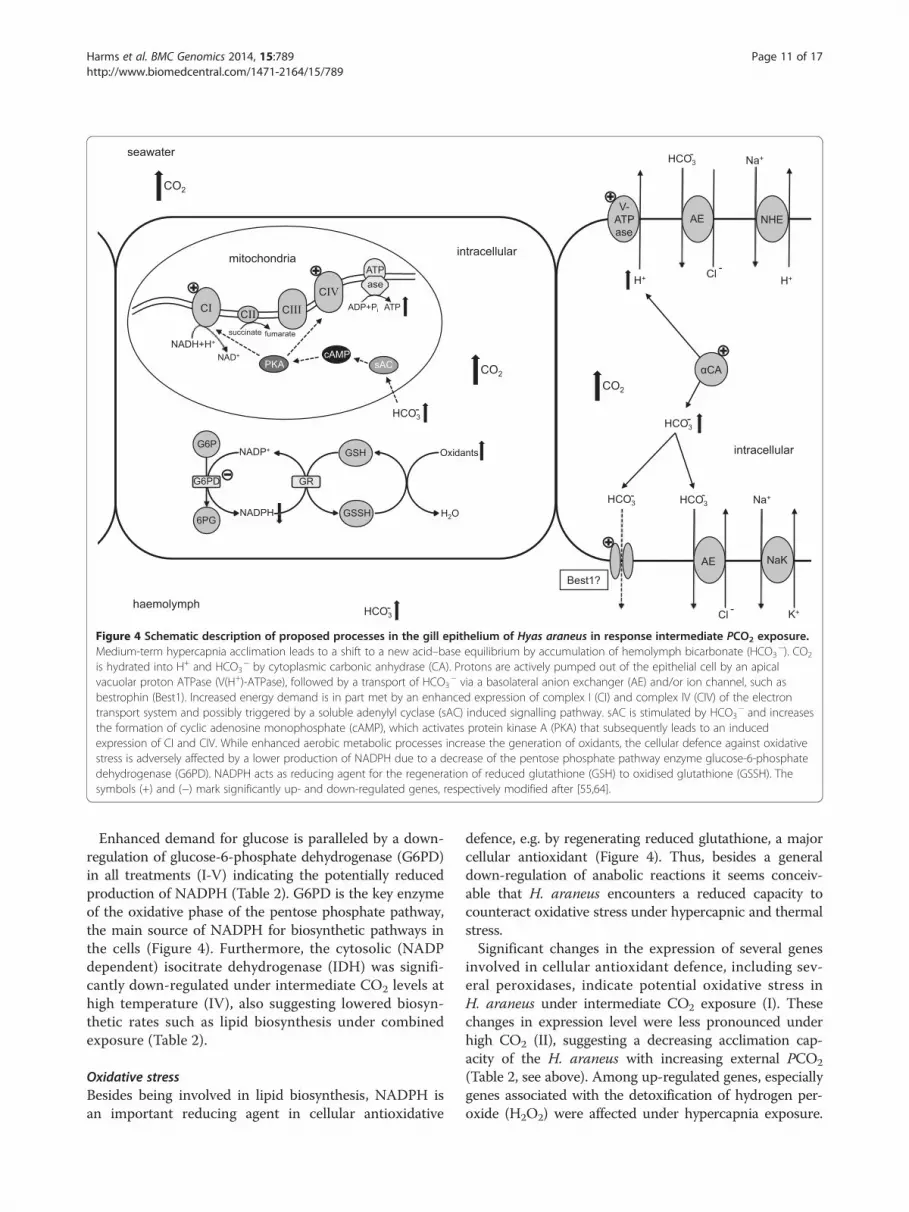
The differential expression analysis revealed an up-regulation of complex I and complex IV of the electrontransport system (ETS) during exposure to intermedi-ate CO2 levels (i,iv) (Table 2). Transcripts encoding forNADH dehydrogenase and cytochrome c oxidase subunitswere significantly up-regulated above control levels pos-sibly leading to an increase in mitochondrial density tomeet the increased energy demand. Interestingly, complexII and III were not affected by hypercapnia exposure. In-creased activities of complex I and IV activated by proteinkinase A (PKA) resulted in an increased oxidative phos-phorylation and ATP synthesis in human kidney cells [64].The activation was triggered by a soluble adenylyl cyclase(sAC) induced signalling pathway that implies phosphor-ylation of PKA being stimulated by cyclic adenosinemonophosphate (cAMP), which, in turn, is formed fromsAC. In mammals and in elasmobranchs it is known thatsAC is stimulated by HCO3
− [65,66], which would therebysupport an increased activity of mitochondrial electrontransport system under hypercapnia exposure. cAMP andPKA regulate key enzymes, such as complex IV, by alterat-ing gene expression [66,67]. Considering the higher extra-cellular bicarbonate levels in animals under hypercapnia(Figure 4) this signalling pathway possibly led to theincreased up-regulation in ETS related genes and/orincreased activity and thus might explain how the or-ganisms meet the suggested increase in ATP demand(Figure 4).An increased ATP production by the ETS would also
lead to an elevated demand for metabolic substrates andturnover of the resulting reduction equivalents (NADH,

Table 2 Regulation of transcripts of specific interest in the hypercapnia and elevated temperature experiments onHyas araneus
Accession no. Description Rank Treatment (I) Treatment (II) Treatment (III) Treatment (IV) Treatment (V)
HAAI01016321 uricase 10 −5.24 −4.27 −3.68 −7.10 −6.20
HAAI01006676 trehalose-6-phosphate synthase 1a 21 −4.45 −2.42 −2.13 −6.05 −4.57
HAAI01003297 cuticle proprotein 24 5.88 1.22 2.81 3.98 1.87
HAAI01001762 actin 53 −1.65 0.48 5.06 −0.34 −1.03
HAAI01004150 trehalose 6-phosphate synthase 1 61 −4.35 −1.68 −2.73 −4.88 −3.99
HAAI01015640 vitellogenin like 66 4.82 3.35 0.68 3.28 −0.13
HAAI01018061 peroxiredoxin 79 4.67 4.31 1.81 3.92 4.09
HAAI01010911 enoyl COA hydratase 80 −1.11 −0.65 0.34 −0.47 −4.67
HAAI01016834 like adducin related protein 83 4.62 3.22 0.81 3.30 0.29
HAAI01016838 GSH peroxidase like 87 3.67 4.61 2.81 3.92 4.19
HAAI01015788 vitellogenin like 100 4.48 3.61 1.22 3.60 −0.71
HAAI01000380 glucose-6-phosphat dehydrogenase 105 −3.16 −4.45 −2.56 −3.41 −2.87
HAAI01017747 sodium glucose cotransporter 113 2.94 4.36 0.64 1.98 1.29
HAAI01002706 trehalose 6-phosphate synthase 1b 117 −3.87 −1.10 −2.20 −4.32 −3.11
HAAI01012389 isocitrate dehydrogenase I 128 −1.18 −2.36 −0.55 −4.19 −2.88
HAAI01000602 dopa decarboxylase 138 −3.37 −2.78 −2.26 −2.80 −4.09
HAAI01003033 troponin I 175 −0.33 1.22 3.78 −0.02 0.29
HAAI01015542 heat shock protein 90 192 −3.07 1.07 −3.68 −0.09 −3.30
HAAI01002164 alpha carbonic anhydrase 197 3.67 1.80 1.64 3.45 1.87
HAAI01019079 ascorbate peroxidase 198 3.67 2.11 1.17 2.23 −2.52
HAAI01009105 heat shock protein 90 203 3.61 2.42 0.36 1.98 −2.03
HAAI01019113 vitellogenin like 226 3.52 2.39 −0.36 2.48 −1.56
HAAI01018669 vitellogenin like 234 3.50 2.29 0.15 2.00 −2.03
HAAI01016527 cytochrome p450 like 236 3.23 2.03 0.07 3.47 2.61
HAAI01009026 cuticle protein like 291 −0.47 3.20 0.01 0.98 −0.36
HAAI01010727 gelsolin precursor 303 1.67 0.68 3.13 0.64 1.29
HAAI01018844 alpha tubulin 309 3.11 1.41 1.46 2.74 −0.20
HAAI01008700 arginine kinase 338 3.01 2.27 1.43 2.76 2.14
HAAI01019135 carbohydrate phosphorylase like 344 2.67 1.48 1.26 2.99 1.21
HAAI01004058 cuticle protein 359 2.93 0.22 −0.55 0.20 −0.71
HAAI01015598 heat shock protein 90 367 2.90 1.47 −0.19 1.85 −0.71
HAAI01019120 bestrophin like 368 2.89 1.8 2.13 1.56 1.16
HAAI01000761 heat shock protein 70 381 2.84 1.94 1.30 2.61 1.37
HAAI01005842 cuticle protein like 386 2.81 0.48 1.54 0.63 −0.45
HAAI01001265 beta tubulin 403 2.77 1.77 0.97 1.98 1.02
HAAI01018645 V1-ATPase subunit 427 2.69 1.80 1.27 2.54 1.46
HAAI01018783 cuticle protein 435 2.67 0.71 1.49 1.50 1.61
HAAI01004930 heat shock protein 90 447 2.63 1.86 1.24 2.58 0.92
HAAI01007246 vitellogenin like 455 2.61 2.15 −1.10 0.98 −1.45
HAAI01003327 actin 461 2.53 2.26 1.06 2.60 1.72
HAAI01000796 alpha tubulin 466 2.59 2.06 1.09 2.34 1.70
HAAI01018213 alpha-glucosidase 477 1.83 1.26 1.56 2.55 2.39
HAAI01005237 alpha carbonic anhydrase like 478 2.55 1.80 0.52 2.42 0.91
Harms et al. BMC Genomics 2014, 15:789 Page 9 of 17http://www.biomedcentral.com/1471-2164/15/789
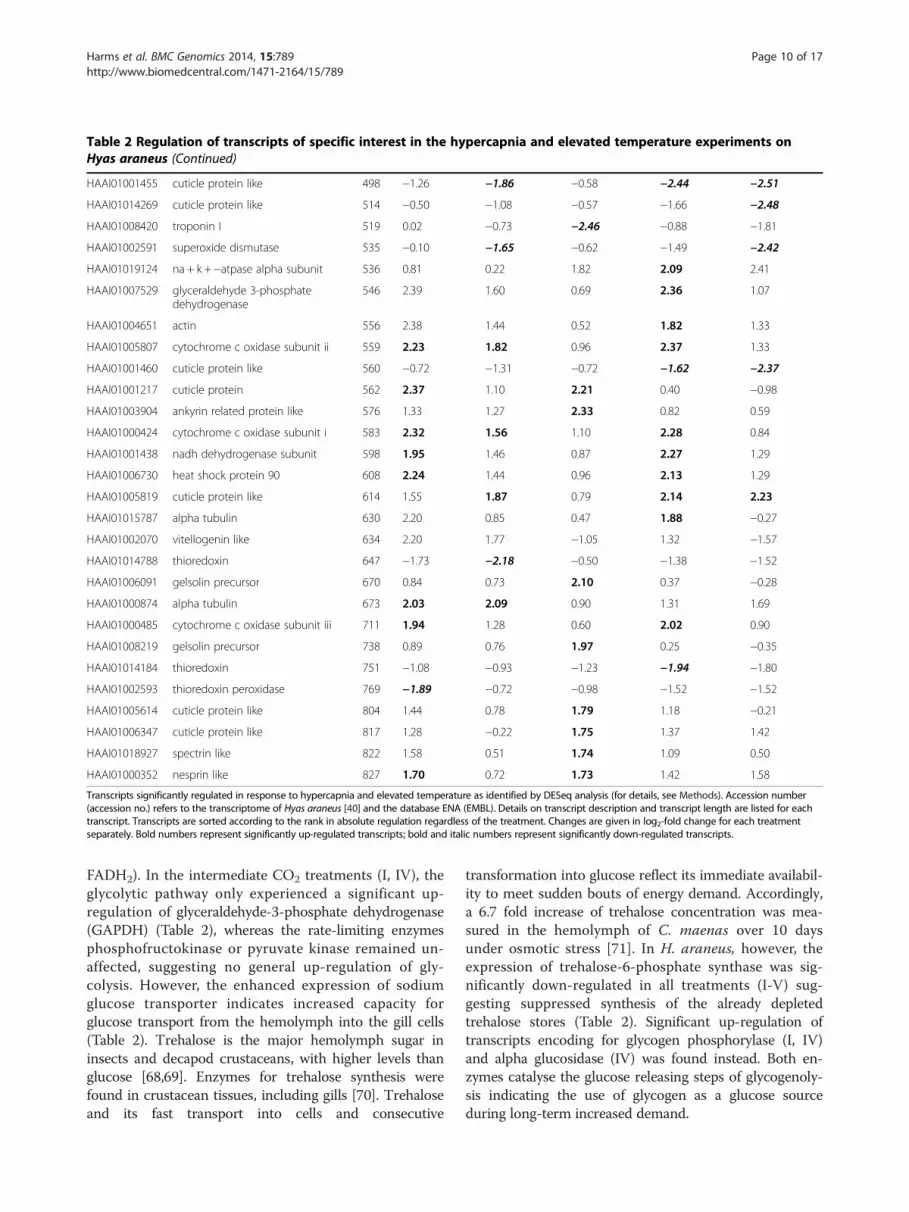
Table 2 Regulation of transcripts of specific interest in the hypercapnia and elevated temperature experiments onHyas araneus (Continued)
HAAI01001455 cuticle protein like 498 −1.26 −1.86 −0.58 −2.44 −2.51
HAAI01014269 cuticle protein like 514 −0.50 −1.08 −0.57 −1.66 −2.48
HAAI01008420 troponin I 519 0.02 −0.73 −2.46 −0.88 −1.81
HAAI01002591 superoxide dismutase 535 −0.10 −1.65 −0.62 −1.49 −2.42
HAAI01019124 na + k + −atpase alpha subunit 536 0.81 0.22 1.82 2.09 2.41
HAAI01007529 glyceraldehyde 3-phosphatedehydrogenase
546 2.39 1.60 0.69 2.36 1.07
HAAI01004651 actin 556 2.38 1.44 0.52 1.82 1.33
HAAI01005807 cytochrome c oxidase subunit ii 559 2.23 1.82 0.96 2.37 1.33
HAAI01001460 cuticle protein like 560 −0.72 −1.31 −0.72 −1.62 −2.37
HAAI01001217 cuticle protein 562 2.37 1.10 2.21 0.40 −0.98
HAAI01003904 ankyrin related protein like 576 1.33 1.27 2.33 0.82 0.59
HAAI01000424 cytochrome c oxidase subunit i 583 2.32 1.56 1.10 2.28 0.84
HAAI01001438 nadh dehydrogenase subunit 598 1.95 1.46 0.87 2.27 1.29
HAAI01006730 heat shock protein 90 608 2.24 1.44 0.96 2.13 1.29
HAAI01005819 cuticle protein like 614 1.55 1.87 0.79 2.14 2.23
HAAI01015787 alpha tubulin 630 2.20 0.85 0.47 1.88 −0.27
HAAI01002070 vitellogenin like 634 2.20 1.77 −1.05 1.32 −1.57
HAAI01014788 thioredoxin 647 −1.73 −2.18 −0.50 −1.38 −1.52
HAAI01006091 gelsolin precursor 670 0.84 0.73 2.10 0.37 −0.28
HAAI01000874 alpha tubulin 673 2.03 2.09 0.90 1.31 1.69
HAAI01000485 cytochrome c oxidase subunit iii 711 1.94 1.28 0.60 2.02 0.90
HAAI01008219 gelsolin precursor 738 0.89 0.76 1.97 0.25 −0.35
HAAI01014184 thioredoxin 751 −1.08 −0.93 −1.23 −1.94 −1.80
HAAI01002593 thioredoxin peroxidase 769 −1.89 −0.72 −0.98 −1.52 −1.52
HAAI01005614 cuticle protein like 804 1.44 0.78 1.79 1.18 −0.21
HAAI01006347 cuticle protein like 817 1.28 −0.22 1.75 1.37 1.42
HAAI01018927 spectrin like 822 1.58 0.51 1.74 1.09 0.50
HAAI01000352 nesprin like 827 1.70 0.72 1.73 1.42 1.58
Transcripts significantly regulated in response to hypercapnia and elevated temperature as identified by DESeq analysis (for details, see Methods). Accession number(accession no.) refers to the transcriptome of Hyas araneus [40] and the database ENA (EMBL). Details on transcript description and transcript length are listed for eachtranscript. Transcripts are sorted according to the rank in absolute regulation regardless of the treatment. Changes are given in log2-fold change for each treatmentseparately. Bold numbers represent significantly up-regulated transcripts; bold and italic numbers represent significantly down-regulated transcripts.
Harms et al. BMC Genomics 2014, 15:789 Page 10 of 17http://www.biomedcentral.com/1471-2164/15/789
FADH2). In the intermediate CO2 treatments (I, IV), theglycolytic pathway only experienced a significant up-regulation of glyceraldehyde-3-phosphate dehydrogenase(GAPDH) (Table 2), whereas the rate-limiting enzymesphosphofructokinase or pyruvate kinase remained un-affected, suggesting no general up-regulation of gly-colysis. However, the enhanced expression of sodiumglucose transporter indicates increased capacity forglucose transport from the hemolymph into the gill cells(Table 2). Trehalose is the major hemolymph sugar ininsects and decapod crustaceans, with higher levels thanglucose [68,69]. Enzymes for trehalose synthesis werefound in crustacean tissues, including gills [70]. Trehaloseand its fast transport into cells and consecutive
transformation into glucose reflect its immediate availabil-ity to meet sudden bouts of energy demand. Accordingly,a 6.7 fold increase of trehalose concentration was mea-sured in the hemolymph of C. maenas over 10 daysunder osmotic stress [71]. In H. araneus, however, theexpression of trehalose-6-phosphate synthase was sig-nificantly down-regulated in all treatments (I-V) sug-gesting suppressed synthesis of the already depletedtrehalose stores (Table 2). Significant up-regulation oftranscripts encoding for glycogen phosphorylase (I, IV)and alpha glucosidase (IV) was found instead. Both en-zymes catalyse the glucose releasing steps of glycogenoly-sis indicating the use of glycogen as a glucose sourceduring long-term increased demand.
CI CII CIII
CIV
ATP ase
NADH+H+ NAD+
succinate fumarate
ADP+Pi ATP
sAC PKA
HCO3 -
cAMP
mitochondria
NHE
CA
HCO3 -
H+
HCO3 - HCO3 -
Cl -
Na+
K+
CO2
seawater
haemolymph
CO2
Best1?
V- ATP ase
AE NaK
G6P
6PG
H+
Na+
NADP+
NADPH
GSH
GSSH H2O
Oxidants
GR G6PD
intracellular
intracellular
CO2
HCO3 -
HCO3 -
Cl -
AE
Figure 4 Schematic description of proposed processes in the gill epithelium of Hyas araneus in response intermediate PCO2 exposure.Medium-term hypercapnia acclimation leads to a shift to a new acid–base equilibrium by accumulation of hemolymph bicarbonate (HCO3
−). CO2
is hydrated into H+ and HCO3− by cytoplasmic carbonic anhydrase (CA). Protons are actively pumped out of the epithelial cell by an apical
vacuolar proton ATPase (V(H+)-ATPase), followed by a transport of HCO3− via a basolateral anion exchanger (AE) and/or ion channel, such as
bestrophin (Best1). Increased energy demand is in part met by an enhanced expression of complex I (CI) and complex IV (CIV) of the electrontransport system and possibly triggered by a soluble adenylyl cyclase (sAC) induced signalling pathway. sAC is stimulated by HCO3
− and increasesthe formation of cyclic adenosine monophosphate (cAMP), which activates protein kinase A (PKA) that subsequently leads to an inducedexpression of CI and CIV. While enhanced aerobic metabolic processes increase the generation of oxidants, the cellular defence against oxidativestress is adversely affected by a lower production of NADPH due to a decrease of the pentose phosphate pathway enzyme glucose-6-phosphatedehydrogenase (G6PD). NADPH acts as reducing agent for the regeneration of reduced glutathione (GSH) to oxidised glutathione (GSSH). Thesymbols (+) and (−) mark significantly up- and down-regulated genes, respectively modified after [55,64].
Harms et al. BMC Genomics 2014, 15:789 Page 11 of 17http://www.biomedcentral.com/1471-2164/15/789
Enhanced demand for glucose is paralleled by a down-regulation of glucose-6-phosphate dehydrogenase (G6PD)in all treatments (I-V) indicating the potentially reducedproduction of NADPH (Table 2). G6PD is the key enzymeof the oxidative phase of the pentose phosphate pathway,the main source of NADPH for biosynthetic pathways inthe cells (Figure 4). Furthermore, the cytosolic (NADPdependent) isocitrate dehydrogenase (IDH) was signifi-cantly down-regulated under intermediate CO2 levels athigh temperature (IV), also suggesting lowered biosyn-thetic rates such as lipid biosynthesis under combinedexposure (Table 2).
Oxidative stressBesides being involved in lipid biosynthesis, NADPH isan important reducing agent in cellular antioxidative
defence, e.g. by regenerating reduced glutathione, a majorcellular antioxidant (Figure 4). Thus, besides a generaldown-regulation of anabolic reactions it seems conceiv-able that H. araneus encounters a reduced capacity tocounteract oxidative stress under hypercapnic and thermalstress.Significant changes in the expression of several genes
involved in cellular antioxidant defence, including sev-eral peroxidases, indicate potential oxidative stress inH. araneus under intermediate CO2 exposure (I). Thesechanges in expression level were less pronounced underhigh CO2 (II), suggesting a decreasing acclimation cap-acity of the H. araneus with increasing external PCO2
(Table 2, see above). Among up-regulated genes, especiallygenes associated with the detoxification of hydrogen per-oxide (H2O2) were affected under hypercapnia exposure.

Harms et al. BMC Genomics 2014, 15:789 Page 12 of 17http://www.biomedcentral.com/1471-2164/15/789
An ascorbate peroxidase (APX) was significantly up-regulated under intermediate CO2 concentrations (I).APX is a peroxidase that utilizes ascorbate as electrondonor to detoxify H2O2 into water (Table 2). Additionally,a glutathione peroxidase (GPX) that reduces H2O2, usingglutathione as substrate, was up-regulated under highCO2 exposure (II). This contrasts the down-regulation oftwo thiol-specific peroxiredoxin-1, at intermediate CO2
concentration (I), indicating a balanced response possiblyby differential transcription of different splice variants.Peroxiredoxins are ubiquitous enzymes detoxifying perox-ides, such as H2O2, by oxidising their active cysteine siteusing peroxide as substrate and are regenerated by oxida-tion of a thiol-containing electron donor, commonly thior-edoxin [72]. However, only two sequences encoding for athiol-containing protein (thioredoxin-1) were significantlydown-regulated (II, IV).The up-regulation of genes for anti-oxidants, such as
glutathione peroxidase and peroxiredoxin, may indicatecompensation for enhanced ROS (reactive oxygen species)production and concomitantly oxidative stress in the gilltissue of H. araneus under CO2 exposure. This is furthersupported by a significant up-regulation of a ribosomalcytochrome p450 like gene in the intermediate CO2 treat-ment (I). Cytochrome p450 is involved in the oxidativemetabolism of a variety of organic substrates and incom-plete catalytic processes can result in a continuous releaseof ROS [73,74]. In contrast, a transcript encoding for urateoxidase (uricase) was significantly down-regulated in alltreatments (I-V) (Table 2). Uricase is commonly located inthe peroxisomes of the hepatopancreas tissue, however,uricase activity has also been detected in gill tissue of thekuruma shrimp Marsupenaeus japonicas [75]. Uricase ca-talyses the reaction from urate to allantoin and contrib-utes to the generation of H2O2 by the oxidation of uricacid [76]. Consequently, a down-regulation of uricase maycontribute to alleviate the generation of ROS. Interest-ingly, CO2 exposure also led to an increase in severalvitellogenin like transcripts (Table 2). Although expres-sion of vitellogenins is generally sex- and tissue-specific,the expression in both sexes of the mud shrimp Upogebiamajor [77], revealed a positive effect on oxidative stressresistance regardless of the developmental stage. Vi-tellogenin is also beneficial for oxidative stress resistancein honeybees, Apis mellifera [78]. Even if the function ofvitellogenin in oxidative stress resistance is far from beingcompletely understood and further investigations areneeded to validate this hypothesis, the strong up-regulationof vitellogenin under CO2 (I, II, IV) may indicate thatvitellogenin is an important protein in the resistance toCO2-induced oxidative stress (see below).Hypercapnia induced enhancement of oxidative stress
defence was recently demonstrated in the Eastern oyster,Crassostrea virginica [79]. In a proteomic approach, an
up-regulation of several proteins, e.g. superoxide dismut-ase and several peroxiredoxins, was detected after expos-ure to high PCO2 (~3,520 μatm) for 2 weeks. The authorssuggested several ways of how increased CO2 levels coulddirectly or indirectly cause oxidative stress. On the onehand, a reaction of CO2 with peroxynitrite, a ROS formedthrough the reaction between superoxide anions and nitricoxide, resulting in the formation of reactive carbonate andnitrogen species, can lead to oxidative stress by oxidizingmolecular compounds [80]. On the other hand, an indir-ect influence of elevated CO2 and/or pH could adverselyaffect mitochondrial functions and/or the non-enzymaticproduction of ROS [79]. However, our findings cannotsupport a direct influence of CO2 on oxidative stress gen-eration, as one would assume an increase in the responseto oxidative stress with increasing seawater CO2. Our datarather indicate an indirect influence of elevated CO2 onROS production, likely by enhanced ROS production dueto metabolic stimulation. The suggested increase in oxida-tive metabolic processes might cause enhanced ROS pro-duction and would also explain why the oxidative stressresponse was higher under intermediate CO2 than in thehigh CO2 treatment.
Cell structureIt is well known that the formation of ROS can damagelipids, proteins and DNA e.g. [81]. A large group of genesthat belong to the functional category ‘cytoskeleton’ includeseveral actins and tubulins which are up-regulated to-gether with the antioxidant genes under CO2 exposure.The cytoskeleton is one major target for oxidative stress(Table 2) when the exposed cysteine component of actinforms oxidized derivates, such as intermolecular disulfidebridges [82]. This presumably has adverse effects on theinteraction between actin and actin binding proteins andleads to changes in the structure of the actin cytoskeleton.The up-regulation of two transcripts encoding for actin inboth intermediate CO2 treatments (I, IV) and the highCO2 treatment (II) may counter the damages caused byoxidative stress. An additional up-regulation of two actinbinding proteins, nesprin and adducin, further supportsthe need for structural adaptation under oxidative stresstriggered by CO2 exposure (Table 2). There is strong evi-dence that ROS induce the expression of tubulin [83],which could explain the up-regulation of β-tubulin andthree transcript sequences encoding forα-tubulin in bothintermediate CO2 treatments (I, IV) and the high CO2 (II)treatment (Table 2). Although the effect of oxidative stresson the cytoskeleton is still poorly understood and needsfurther investigation, an interaction of oxidative stress andadaptive changes in the cytoskeleton is well recognized[79,82] and supported by our findings.Besides enhanced antioxidative defence, a reorganisation
of the cytoskeleton may occur in gill epithelia during the

Harms et al. BMC Genomics 2014, 15:789 Page 13 of 17http://www.biomedcentral.com/1471-2164/15/789
initial stage of hypercapnia acclimation. In C. maenas, areorganisation of gill epithelia was observed after short-term exposure to very high PCO2 (~4,340 μatm; 7 days),but not after medium-term exposure to high PCO2
(~2,270 μatm; 11 weeks) [36]. Similarly, a reorganizationof the cytoskeleton may not occur during medium-termCO2 acclimation of H. araneus (10 weeks). The responseof genes that belong to the functional category ‘cytoskel-eton’ was higher at intermediate CO2 (I, IV) than at highCO2 (II), in line with the findings in antioxidative defence.This also suggests that the changes observed result fromoxidative stress via enhanced metabolic rate at intermedi-ate CO2 with the cytoskeleton as a direct target of ROSformation.Cytoskeletal genes also responded to elevated tem-
perature (III). Several genes encoding for actin-bindingproteins as well as membrane and cuticle proteins weresignificantly up-regulated (Table 2). Three transcriptsof gelsolin, an actin-binding protein and regulator ofactin filament assembly, were significantly up-regulated.The expression of an actin-binding nesprin, a membrane-binding ankyrin and an actin-related cytoskeletal structureprotein spectrin was also increased. Warming affects vari-ous cellular processes, including stability and/or dynamicsof the cytoskeleton for review see [84]. An increase incytoskeletal gene expression despite the general down-regulation of expression levels indicates a requirement forthe stabilization of the cytoskeleton, possibly elicited bythe warm-induced stimulation of metabolic rate and asso-ciated ROS formation. Interestingly, such up-regulation ofcytoskeletal gene expression could not be seen in undercombined intermediate PCO2 and high temperature (IV,V), suggesting that the general down-regulation inducedby high CO2 also affects cytoskeleton assembly.Commonly, stresses such as temperature extremes,
cellular energy depletion, and extreme concentrationsof ions, osmolytes and gases induce the synthesis ofheat-shock proteins (HSP) for review see [85]. However,HSP expression levels being unchanged in the hightemperature treatment (III) suggest that 10°C is not atemperature extreme for the Arctic H. araneus popula-tion. In contrast, the expression of several HSPs was up-regulated under CO2 exposure (Table 2). One HSP70was up-regulated in both the intermediate and the highCO2 treatments (I, II, IV). Four transcripts encoding forHSP90 were significantly up-regulated in the intermedi-ate CO2 treatment (I) and two in the intermediate CO2
plus high temperature treatment (IV). In treatments I,III, and V one HSP90 showed decreased expression.Acting as molecular chaperones, HSPs can play animportant role in maintaining proteins in a folded orunfolded state, controlling the unintended aggregationof proteins or target proteins for degradation [86]. Theirinduced expression, especially under intermediate CO2
concentrations, paired with increases in mRNA transcriptsfor proteins involved in antioxidant defence suggest an in-creased capacity to defend the cell against cellular damage.The up-regulation specifically of HSP90 suggests HSP90to be of particular importance in maintaining proteinhomeostasis.
ConclusionsBased on a comprehensive expression analysis of genesrelated to acid–base regulation, metabolism, cell struc-ture and their coupling to the stress response, this studyhas identified moderate, but distinct responses to oceanacidification in gills of adult H. araneus. We could dem-onstrate that the molecular response strongly dependson the CO2 concentration. At PCO2 values proposed forthe end of the century, changes in expression suggestelevated metabolism caused by stimulated acid–baseregulation and associated with increased oxidative stress.This up-regulation was attenuated at even higher PCO2
(business as usual scenario for Year 2300) with expres-sion levels closer to control values (Figure 5), indicatingdown-regulation of these processes. Responses in tran-scripts related to acid–base regulation and energy me-tabolism were in line with those observed at elevatedtemperature. Observations under hypercapnia in theblue mussel M. edulis are in line with these conclusions.An increase in aerobic metabolism under intermediatePCO2 exposure (<2,400 μatm) was followed by a decreaseat higher PCO2 [87,88]. In earlier studies on marine in-vertebrates, high PCO2 exposure (~3,200-5,000 μatm)induced a decrease in metabolic rates. In the musselMytilus galloprovincialis and the decapod crab Necorapuber, a decrease in respiration rates was seen in re-sponse to long-term exposure at a PCO2 of approx.5,000 and 3,200 μatm, respectively [6,9]. Our findingssuggest a PCO2 dependent threshold where metabolicstimulation might turn into metabolic depression. InH. araneus this threshold may be reached at a PCO2 ofapproximately 2,000 μatm. Although further examina-tions besides transcriptomics covering a broader rangeof PCO2 concentrations are certainly needed to confirm apossible threshold, a recent meta-analysis revealed that50% of all marine crustacean species were negatively af-fected at this PCO2 [5].Changes in the expression of genes related to energy
metabolism paralleled the expression of those related toacid–base regulation and both paralleled the changes inextracellular pH (pHe), indicating a feedback regulationbetween pH and metabolic rate (Figure 5). In the marineworm S. nudus and the mussel M. galloprovincialis,metabolic depression under CO2 was caused by a dropin pHe [6,27,89]. H. araneus was able to partially com-pensate for the acidosis via bicarbonate (HCO3
−) accu-mulation, but capacities were not sufficient to fully

Seawater PCO2
hgihetaidemretnilortnoc
Cel
l org
aniz
atio
nR
espo
nse
to s
tres
sM
etab
olis
mA
cid-
base
regu
latio
n 5°C 10°C
Figure 5 Schematic description of the response of Hyas araneus to different exposure experiments for specific categories. For eachtreatment, log2-fold changes of all up-regulated transcripts within one specific category were summed and plotted as a line (gray line = 5°C; blackline = 10°C). Scales are harmonized for all categories. The figure shows how acclimation to warming reduces the transcriptomic response of ‘cellorganization’ and ‘response to stress’ to elevated CO2 tensions.
Harms et al. BMC Genomics 2014, 15:789 Page 14 of 17http://www.biomedcentral.com/1471-2164/15/789
compensate. At both experimental temperatures (5°Cand 10°C) hemolymph acidosis was compensated tothe same extent. At high CO2 concentrations, the capacityto fully compensate may be even more limited related todecreased ion transporter expression and activities. Sinceacid–base regulation is an ATP-consuming process, thedecreased expression of metabolism related genes mightat least in part be explained by a pHe-triggered inhibition.These shifts cause changes in energy balance which
can therefore reflect the limits in stress tolerance [90]. Abioenergetic framework [90] builds on the physiologicalconcepts of oxygen- and capacity-limited thermal tolerance
(OCLTT) [91-93] and the dynamic energy budget (DEB)[94]. Two cases distinguished between physiological re-sponses to moderate and extreme environmental stress.Moderate stress induces additional ATP turnover alongwith a higher metabolic rate, in H. araneus exemplified inenhanced acid–base regulation and cellular damage repairfrom oxidative stress at intermediate PCO2. These mecha-nisms support long-term persistence at the expense of ashift in energy budget (pejus range) [95]. Even if the en-hanced energy demand of stress resistance can be met byincreased feeding, it may still result in a reallocation of en-ergy from fitness-related functions such as reproduction

Harms et al. BMC Genomics 2014, 15:789 Page 15 of 17http://www.biomedcentral.com/1471-2164/15/789
and growth to maintenance and damage repair [90]. Moreextreme stress exacerbates the disturbances in homeosta-sis, exemplified in stronger disturbances in acid–basestatus as seen in H. araneus favouring a suppression ofmetabolic rate [27] which preserve energy resources andlessen the generation of detrimental metabolic by-products [90]. In H. araneus the respective response tohigh PCO2 was paralleled by a lower expression of tran-scripts associated with energy metabolism, stress responseand cellular organization. Depressed metabolism wouldresult in insufficient energy balance and time-limited tol-erance to environmental stress making long-term survivalimpossible (pessimum range) [90,93].To our knowledge, we report the first gene expression
profiling study analysing the responses to a combinationof two drivers in an osmoconforming crustacean. Thestudy confirms the interdependence of physiologicalprocesses affected by elevated seawater PCO2 andtemperature. Furthermore, the study demonstrates theimportance of considering projected climate scenariosin experimental work, as responses to increasing sea-water CO2 concentrations are not necessarily linear, aspresented here.
Additional files
Additional file 1: Table S1. Summary of sequencing and mappingresults for Hyas araneus. Details on treatment, filename and location ofsequencing raw data, used sequencer, read count, read length and totalsize in base pairs (bp), used alignment tool, aligned reads andpercentage of aligned reads are listed separately.
Additional file 2: Table S2. Details on primers for quantitative real-timepolymerase chain reaction (qRT-PCR) to validate RNASeq data of Hyasaraneus. Forward and backward primer sequences and descriptions oftarget genes used in the qRT-PCR. Accession number (accession no.) referto the transcriptome of Hyas araneus [40] and the database ENA (EMBL).R2 and efficiency was tested in a qRT-PCR dilution series (for details, seeMethods).
Additional file 3: Figure S1. Changes of expression levels of transcriptsin gills of Hyas araneus responding to medium-term exposure (10 weeks)at intermediate PCO2 (≈1,000 μatm) and high temperature (10°C), analysedby DESeq (gray bars) and quantitative real-time polymerase chain reaction(qRT-PCR) (black bars). Bars represent the mean log2-fold change andstandard error (error bars) of the respective gene. Transcripts correspond toprimers and genes used in the qRT-PCR (see Additional file 5: Table S3).
Additional file 4: Figure S2. Linear regression between expressionlevels of transcripts in gills of Hyas araneus responding to medium-termexposure (10 weeks) at intermediate PCO2 (≈1,000 μatm) and hightemperature (10°C), analysed by DESeq and quantitative real-timepolymerase chain reaction (qRT-PCR). Black dots represent the meanlog2-fold change of transcripts analysed by DESeq plotted against thecorresponding mean log2-fold change analysed by qRT-PCR. r wasdetermined by Pearson Correlation using SigmaPlot 12.0 (Systat SoftwareInc., San Jose, USA).
Additional file 5: Table S3. Transcript levels changing significantly ingills of Hyas araneus responding to hypercapnia and elevated temperature.Transcripts regulated significantly in response to hypercapnia and elevatedtemperature as identified by DESeq analysis (for details, see Methods). IDand accession number (accession no.) refer to the transcriptome of Hyasaraneus [40] and the database ENA (EMBL). Details on transcript descriptionand transcript length are listed for each transcript. Transcripts are sorted
according to the rank in absolute regulation regardless of the treatment.Changes are given in log2-fold change for each treatment separately. Fordetails on treatments, see Methods). Bold numbers represent significantlyup-regulated transcripts and bold and underlined numbers significantlydown-regulated transcripts.
Additional file 6: Figure S3. Smearplot of differentially expressedtranscripts in gills of Hyas araneus. All transcripts changed in response tohypercapnia and elevated temperature. Log2-fold changes are plottedagainst mean readcount (log10). Blue dots represent transcripts withnon-significant changes, red dots depict transcripts significantly regulated asidentified by DESeq analysis (p < 0.05) and green triangles are transcriptschanged significantly and identified by annotation Numbers refer to thetotal number of significantly up-/down-regulated transcripts. A) treatment(I) = 1,120 μatm PCO2 5°C; B) treatment (II) = 1,960 μatm PCO2 5°C; C)treatment (III) = 390 μatm PCO2 10°C; D) treatment (IV) = 1,120 μatmPCO2 10°C; E) treatment (V) = 1,960 μatm PCO2 10°C.
Additional file 7: Table S4. Enrichment analysis in the RNASeq studyon Hyas araneus. Results of the enrichment analysis (Fisher’s Exact Test;FDR < 0.05) as implemented in Blast2GO [49,50] and reduced by web-basedclustering tool REVIGO [51]. Tested were subsets of all significantly regulatedtranscripts as identified by DESeq (separated by up- and down-regulatedtranscripts). Reference-set was the full set of annotated sequences of the H.araneus transcriptome [40]. Listed is the Gene Ontology term (GO-term),the name of the functional group (description), the category (molecularfunction, biological process or cellular component), the false discovery rate(FDR) and whether GO-terms are over- or under-represented (a GO-term isconsidered over-/under-represented if it appears significantly more often/less often in the test-set than in the reference-set.
Competing interestsThe authors declare that they have no competing interests.
Authors’ contributionsLH and MS conducted lab experiments. LH and SF performed bioinformaticsanalysis. LH, FCM, DS, CH, HOP and ML conceived the study and coordinatedresearch activities. LH wrote the manuscript; all authors revised andapproved the final manuscript.
AcknowledgementsThe authors would like to thank Max Schwanitz for animal collection andLaura Stapp for useful discussions. Financial support was provided by FederalMinistry of Education and Research (BMBF), within phase I of the BIOACIDresearch programme (FKZ 03F0608B, subproject 2.2.1).
Author details1Integrative Ecophysiology, Alfred Wegener Institute, Bremerhaven, Germany.2Scientific Computing, Alfred Wegener Institute, Bremerhaven, Germany.3Functional Ecology, Alfred Wegener Institute, Bremerhaven, Germany.
Received: 13 January 2014 Accepted: 9 September 2014Published: 12 September 2014
References1. Pörtner HO, Langenbuch M, Michaelidis B: Synergistic effects of
temperature extremes, hypoxia, and increases in CO2 on marine animals:from Earth history to global change. J Geophys Res 2005, 110(C9):1–15.
2. Fabry VJ, Seibel BA, Feely RA, Orr JC: Impacts of ocean acidification onmarine fauna and ecosystem processes. ICES J Mar Sci 2008, 65:414–432.
3. Melzner F, Gutowska MA, Langenbuch M, Dupont S, Lucassen M, ThorndykeMC, Bleich M, Pörtner H-O: Physiological basis for high CO2 tolerance inmarine ectothermic animals: pre-adaption through lifestyle and on-togeny? Biogeosciences 2009, 6:1–19.
4. Kroeker KJ, Kordas RL, Crim R, Hendriks IE, Ramajo L, Singh GS, Duarte CM,Gattuso JP: Impacts of ocean acidification on marine organisms:quantifying sensitivities and interaction with warming. Glob Chang Biol2013, 19(6):1884–1896.
5. Wittmann A, Pörtner H-O: Sensitivities of extant animal taxa to oceanacidification. Nat Clim Chang 2013, doi:10.1038/NCLIMATE1982.
Harms et al. BMC Genomics 2014, 15:789 Page 16 of 17http://www.biomedcentral.com/1471-2164/15/789
6. Michaelidis B, Ouzounis C, Paleras A, Pörtner H-O: Effects of long-termmoderate hypercapnia on acid–base balance and growth rate in marinemussels Mytilus galloprovincialis. Mar Ecol Prog Ser 2005, 293:109–118.
7. Kurihara H: Effects of CO2-driven ocean acidification on the earlydevelopmental stages of invertebrates. Mar Ecol Prog Ser 2008,373:275–284.
8. Wood HL, Spicer JI, Widdicombe S: Ocean acidification may increasecalcification rates, but at a cost. Proc Biol Sci/ Royal Soc 2008,275(1644):1767–1773.
9. Small D, Calosi P, White D, Spicer JI, Widdicombe S: Impact of medium-termexposure to CO2 enriched seawater on the physiological functions of thevelvet swimming crab Necora puber. Aquat Biol 2010, 10(1):11–21.
10. Gutowska MA, Pörtner HO, Melzner F: Growth and calcification in thecephalopod Sepia officinalis under elevated seawater pCO2. Mar Ecol ProgSer 2008, 373:303–309.
11. Whiteley NM: Physiological and ecological responses of crustaceans toocean acidification. Mar Ecol Prog Ser 2011, 430:257–271.
12. Pane EF, Barry JP: Extracellular acid–base regulation during short-termhypercapnia is effective in a shallow-water crab, but ineffective in adeep-sea crab. Mar Ecol Prog Ser 2007, 334:1–9.
13. Walther K, Anger K, Pörtner H-O: Effects of ocean acidification and warmingon the larval development of the spider crab Hyas araneus from differentlatitudes (54° vs. 79°N). Mar Ecol Prog Ser 2010, 417:159–170.
14. Schiffer M, Harms L, Pörtner HO, Lucassen M, Mark FC, Storch D: Toleranceof Hyas araneus zoea I larvae to elevated seawater PCO2 despiteelevated metabolic costs. Mar Biol 2012, 160(8):1943–1953.
15. Walther K, Sartoris F-J, Bock C, Pörtner H-O: Impact of anthropogenicocean acidification on thermal tolerance of the spider crab Hyas araneus.Biogeosciences 2009, 6:2207–2215.
16. Zittier ZMC, Hirse T, Pörtner H-O: The synergistic effects of increasingtemperature and CO2 levels on activity capacity and acid–base balancein the spider crab, Hyas araneus. Mar Biol 2013, 160(8):2049–2062.
17. Spicer JI, Raffo A, Widdicombe S: Influence of CO2-related seawateracidification on extracellular acid–base balance in the velvet swimmingcrab Necora puber. Mar Biol 2006, 151(3):1117–1125.
18. Dissanayake A, Ishimatsu A: Synergistic effects of elevated CO2 andtemperature on the metabolic scope and activity in a shallow-watercoastal decapod (Metapenaeus joyneri; Crustacea: Penaeidae). ICES J MarSci 2011, 68(6):1147–1154.
19. Carter HA, Ceballos-Osuna L, Miller NA, Stillman JH: Impact of ocean acidifi-cation on metabolism and energetics during early life stages of theintertidal porcelain crab Petrolisthes cinctipes. J Exp Biol 2013,216(Pt 8):1412–1422.
20. Wickins JF: The effect of hypercapnia sea water on growth andmineralization in Penaid prawns. Aquaculture 1984, 41:37–48.
21. Long WC, Swiney KM, Harris C, Page HN, Foy RJ: Effects of OceanAcidification on Juvenile Red King Crab (Paralithodes camtschaticus) andTanner Crab (Chionoecetes bairdi) growth, condition, calcification, andsurvival. PLoS One 2013, 8(4):e60959.
22. Kurihara H, Shimode S, Shirayama Y: Effects of raised CO2 concentrationon the egg production rate and early development of two marinecopepods (Acartia steueri and Acartia erythraea). Mar Pollut Bull 2004,49(9–10):721–727.
23. Findlay HS, Kendall MA, Spicer JI, Widdicombe S: Future high CO2 in theintertidal may compromise adult barnacle Semibalanus balanoidessurvival and embryonic development rate. Mar Ecol Prog Ser 2009,389:193–202.
24. Watanabe Y, Yamaguchi A, Ishida H, Harimoto T, Suzuki S, Sekido Y, Ikeda T,Shirayama Y, Mac Takahashi M, Ohsumi T, Ishizaka J: Lethality of increasingCO2 levels on deep-sea copepods in the Western North Pacific.J Oceanogr 2006, 62:185–196.
25. Pörtner H-O, Bock C, Reipschläger A: Modulation of the cost of pHi regulationduring metabolic depression: a 31P-NMR study in invertebrate (Sipunculusnudus) isolated muscle. J Exp Biol 2000, 203:2417–2428.
26. Stumpp M, Wren J, Melzner F, Thorndyke MC, Dupont ST: CO2 inducedseawater acidification impacts sea urchin larval development I: elevatedmetabolic rates decrease scope for growth and induce developmentaldelay. Comp Biochem Physiol A Mol Integr Physiol 2011, 160(3):331–340.
27. Reipschläger A, Pörtner H-O: Metabolic depression during environmentalstress: the role of extracellular versus intracellular pH in Sipunculusnudus. J Exp Biol 1996, 199:1801–1807.
28. Langenbuch M, Pörtner H-O: Changes in metabolic rate and N excreationin marine invertebrate Sipunculus nudus under conditions ofenvironmental hypercapnia: identifying effective acid–base variables.J Exp Biol 2002, 205:1153–1160.
29. Todgham AE, Hofmann GE: Transcriptomic response of sea urchin larvaeStrongylocentrotus purpuratus to CO2-driven seawater acidification. J ExpBiol 2009, 212(Pt 16):2579–2594.
30. Gracey AY: Interpreting physiological responses to environmental changethrough gene expression profiling. J Exp Biol 2007, 210(Pt 9):1584–1592.
31. Stillman JH, Tagmount A: Seasonal and latitudinal acclimatization ofcardiac transcriptome responses to thermal stress in porcelain crabs,Petrolisthes cinctipes. Mol Ecol 2009, 18(20):4206–4226.
32. Lockwood BL, Sanders JG, Somero GN: Transcriptomic responses to heatstress in invasive and native blue mussels (genus Mytilus): molecularcorrelates of invasive success. J Exp Biol 2010, 213(Pt 20):3548–3558.
33. Lockwood BL, Somero G: Transcriptomic responses to salinity stress ininvasive and native blue mussels (genus Mytilus). Mol Ecol 2010,20(3):517–529.
34. Gracey AY, Troll JV, Somero G: Hypoxia-induced gene expression profilingin the euryoxic fish Gillichthys mirabilis. PNAS 2001, 98(4):1993–1998.
35. Sussarellu R, Fabiouxa C, Le Moullacb G, Fleuryc E, Moragaa D:Transcriptomic response of the Pacific oyster Crassostrea gigas tohypoxia. Mar Genomics 2010, 3(3–4):133–143.
36. Fehsenfeld S, Kiko R, Appelhans Y, Towle DW, Zimmer M, Melzner F: Effectsof elevated seawater pCO(2) on gene expression patterns in the gills ofthe green crab, Carcinus maenas. BMC Genomics 2011, 12:488.
37. Evans TG, Chan F, Menge BA, Hofmann GE: Transcriptomic responses toocean acidification in larval sea urchins from a naturally variable pHenvironment. Mol Ecol 2013, 22(6):1609–1625.
38. Henry RP, Cameron JN: The role of carbonic anhydrase in respiration, ionregulation and acid–base balance in the aquatic crab Callinectes sapidusand the terrestrial crab Gecarcinus lateralis. J Exp Biol 1983, 103:205–223.
39. Henry RP, Wheatly MG: Interaction of respiration, ion regulation, andacid–base balance in the everyday life of aquatic crustaceans. Am Zool1992, 32:407–416.
40. Harms L, Frickenhaus S, Schiffer M, Mark FC, Storch D, Pörtner H-O, Held C,Lucassen M: Characterization and analysis of a transcriptome from theboreal spider crab Hyas araneus. Comp Biochem Physiol Part D GenomicsProteomics 2013, 8(4):344–351.
41. Lewis E, Wallace D: Program Developed for CO2 System Calculations. InORNL/CDIAC-105a. Oak Ridge, Tennesse: Carbon Dioxide InformationAnalysis Center, Oak Ridge National Laboratory, U.S. Department ofEnergy; 1998.
42. Lenfant C, Aucutt C: Measurement of blood gasses by gaschromatography. Respir Physiol 1966, 1:398–407.
43. Pörtner H-O, Boutillier RG, Tang Y, Toews DP: Determination of intracellularpH and PCO2 after metabolic inhibition by fluoride and nitrilotraceticacid. Respir Physiol 1990, 81:255–274.
44. Pörtner H-O, Bickmeyer U, Bleich M, Bock C, Brownlee C, Melzner F, MichaelidisB, Sartoris F-J, Storch D: Studies of acid–base status and regulation. In Guideof Best Practise for Ocean Acidification Research and Data Reporting. Edited byRiebesell U, Fabry VJ, Hansson L, Gattuso J-P. Luxembourg: Publications Officeof the European Union; 2010:137–166.
45. Li H, Durbin R: Fast and accurate short read alignment with Burrows-Wheelertransform. Bioinformatics 2009, 25(14):1754–1760.
46. Li H, Handsaker B, Wysoker A, Fennell T, Ruan J, Homer N, Marth G, AbecasisG, Durbin R, Genome Project Data Processing S: The sequence alignment/map format and SAMtools. Bioinformatics 2009, 25(16):2078–2079.
47. R Core Team: R: A Language and Environment for Statistical Computing.Vienna, Austria: R Foundation for Statistical Computing; 2012.
48. Anders S, Huber W: Differential expression analysis for sequence countdata. Genome Biol 2010, 11:R106.
49. Conesa A, Gotz S, Garcia-Gomez JM, Terol J, Talon M, Robles M: Blast2GO: auniversal tool for annotation, visualization and analysis in functionalgenomics research. Bioinformatics 2005, 21(18):3674–3676.
50. Gotz S, Garcia-Gomez JM, Terol J, Williams TD, Nagaraj SH, Nueda MJ, RoblesM, Talon M, Dopazo J, Conesa A: High-throughput functional annotationand data mining with the Blast2GO suite. Nucleic Acids Res 2008,36(10):3420–3435.
51. Supek F, Bošnjak M, Škunca N, Šmuc T: REVIGO summarizes and visualizeslong lists of gene ontology terms. PLoS One 2011, 6(7):e21800.
Harms et al. BMC Genomics 2014, 15:789 Page 17 of 17http://www.biomedcentral.com/1471-2164/15/789
52. Kawahara-Miki R, Wada K, Azuma N, Chiba S: Expression profiling withoutgenome sequence information in a non-model species, pandalid shrimp(Pandalus latirotris), by next-generation sequencing. PLoS One 2011,6(11):e26043.
53. Somero G, Hochachka W: Biochemical adaptation to the environment. AmZool 1971, 11:159–167.
54. Peterson ME, Daniel RM, Danson MJ, Eisenthal R: The dependence ofenzyme activity on temperature: determination and validation ofparameters. Biochem J 2007, 402(2):331–337.
55. Freire CA, Onken H, McNamara JC: A structure-function analysis of iontransport in crustacean gills and excretory organs. Comp Biochem PhysiolA Mol Integr Physiol 2008, 151(3):272–304.
56. Henry RP, Lucu C, Onken H, Weihrauch D: Multiple functions of thecrustacean gill: osmotic/ionic regulation, acid–base balance, ammoniaexcretion, and bioaccumulation of toxic metals. Front Physiol 2012, 3:431.
57. Compere P, Wanson S, Pequeux A, Gilles R, Goffinet G: Ultrastructuralchanges in the gill epithelium of the green crab Carcinus maenas inrelation to the external salinity. Tissue Cell 1989, 21(2):299–318.
58. Newman JR, Ghaemmaghami S, Ihmels J, Breslow DK, Noble M, DeRisi JL,Weissman JS: Single-cell proteomic analysis of S. cerevisiae reveals thearchitecture of biological noise. Nature 2006, 441(7095):840–846.
59. Kotlyar S, Weihrauch D, Paulsen RS, Towle DW: Expression of argininekinase enzymatic activity and mRNA in gills of the euryhaline crabsCarcinus maenas and Callinectes sapidus. J Exp Biol 2000, 205:2395–2404.
60. Sommer MJ, Mantel LH: Effect of dopamine, cyclic AMP, and pericardialorgans on sodium uptake and Na/K-ATPase activity in gills of the greencrab Carcinus maenas. J Exp Zool 1988, 248:272–277.
61. Lee S, Yoon BE, Berglund K, Oh SJ, Park H, Shin HS, Augustine GJ, Lee CJ:Channel-mediated tonic GABA release from glia. Science 2010,330(6005):790–796.
62. Tsunenari T, Sun H, Williams J, Cahill H, Smallwood P, Yau KW, Nathans J:Structure-function analysis of the bestrophin family of anion channels.J Biol Chem 2003, 278(42):41114–41125.
63. Beniash E, Ivanina A, Lieb NS, Kurochkin I, Sokolova IM: Elevated level ofcarbon dioxide affects metabolism and shell formation in oystersCrassostrea virginica (Gmelin). Mar Ecol Prog Ser 2010, 419:95–108.
64. Acin-Perez R, Salazar E, Kamenetsky M, Buck J, Levin LR, Manfredi G: CyclicAMP produced inside mitochondria regulates oxidative phosphorylation.Cell Metab 2009, 9(3):265–276.
65. Tresguerres M, Parks SK, Salazar E, Levin LR, Goss GG, Buck J: Bicarbonate-sensing soluble adenylyl cyclase is an essential sensor for acid/basehomeostasis. Proc Natl Acad Sci U S A 2010, 107(1):442–447.
66. Zippin JH, Levin LR, Buck J: CO2/HCO3−responsive soluble adenylyl cyclase
as a putative metabolic sensor. Endocrinol Metab 2001, 12(8):366–370.67. Gopalakrishnan L, Scarpulla RC: Differential regulation of respiratory chain
subunits by a CREB-dependent signal transduction pathway. J Biol Chem1993, 269(1):105–113.
68. Wyatt GR, Kalf GF: The chemistry of insect hemolymph. J Gen Physiol 1957,40(6):833–847.
69. Johnston MA, Davies PS: Carbohydrates of the hepatopancreas and bloodtissue of Carcinus. Comp Biochem Physiol 1971, 41B:433–443.
70. Chung JS: A trehalose 6-phosphate synthase gene of the hemocytes of theblue crab, Callinectes sapidus: cloning, the expression, its enzyme activityand relationship to hemolymph trehalose levels. Saline Syst 2008, 4:18.
71. Siebers D, Lucu C, Sperling K-R, Eberlein K: Kinetics of osmoregulation inthe crab Carcinus maenas. Mar Biol 1972, 17:291–303.
72. Hofmann B, Hecht H-J, Flohé L: Peroxiredoxins. Biol Chem 2002, 383:347–364.73. Premereur N, Van den Branden C, Roels F: Cytochrome P-450-dependent
H2O2 production demonstrated in vivo. Funct Ecol 1986, 199(1):415–424.74. Livingstone DR, Marth PG, Michel X, Narbonne JF, O'hara S, Ribera D,
Winston GW: Oxyradical production as a pollution-mediated mechanismof toxicity in the common mussel, Mytilus edulis L., and other molluscs.Funct Ecol 1990, 4(3):415–424.
75. Cheng SY, Lee WC, Chen JC: Increase of uricogenesis in the kurumashrimp Marsupenaeus japonicus reared under hyper-osmotic conditions.Comp Biochem Physiol B Biochem Mol Biol 2004, 138(3):245–253.
76. Boveris A, Oshino N, Chance B: The cellular production of hydrogenperoxide. Biochem J 1972, 128:617–630.
77. Kang BJ, Nanri T, Lee JM, Saito H, Han CH, Hatakeyama M, Saigusa M:Vitellogenesis in both sexes of gonochoristic mud shrimp, Upogebiamajor (Crustacea): analyses of vitellogenin gene expression and
vitellogenin processing. Comp Biochem Physiol B Biochem Mol Biol 2008,149(4):589–598.
78. Seehuus SC, Norberg K, Gimsa U, Krekling T, Amdam GV: Reproductiveprotein protects functionally sterile honey bee workers from oxidativestress. Proc Natl Acad Sci U S A 2006, 103(4):962–967.
79. Tomanek L, Zuzow MJ, Ivanina AV, Beniash E, Sokolova IM: Proteomicresponse to elevated PCO2 level in eastern oysters, Crassostrea virginica:evidence for oxidative stress. J Exp Biol 2011, 214(Pt 11):1836–1844.
80. Denicola A, Freeman BA, Trujillo M, Radi R: Peroxynitrite reaction withcarbon dioxide/bicarbonate: kinetics and influence on peroxynitrite-mediated oxidations. Arch Biochem Biophys 1996, 333(1):49–58.
81. Livingstone DR: Contaminant-stimulated reactive oxygen speciesproduction and oxidative damage in aquatic organisms. Mar Pollut Bull2001, 42(8):656–666.
82. Dalle-Donne I, Rossi R, Milzani A, Simplicio PD, Colombo R: The actincytoskeleton response to oxidants: from small heat shock proteinphosphorilation to changes in the redox state of actin itself. Free RadicBiol Med 2001, 31(12):1624–1632.
83. Courgeon A-M, Maingourd M, Maisonhaute C, Montmory C, Rollet E,Tanguay RM, Best-Bellpomme M: Effect of hydrogen peroxide oncytoskeletal proteins of Drosophila cells: comparison with heat shockand other stressors. Exp Cell Res 1993, 204:30–37.
84. Lindquist S: The heat-shock response. Ann Rev Biochemistry 1986,55:1151–1191.
85. Feder ME, Hofmann GE: Heat-shock proteins, molecular chaperones andthe stress response: evolutionary and ecological physiology. Ann RevPhysiol 1999, 61:243–282.
86. Wickner S: Posttranslational quality control: folding, refolding, anddegrading proteins. Science 1999, 286(5446):1888–1893.
87. Thomsen J, Melzner F: Moderate seawater acidification does not elicitlong-term metabolic depression in the blue mussel Mytilus edulis. MarBiol 2010, 157(12):2667–2676.
88. Hüning AK, Melzner F, Thomsen J, Gutowska MA, Krämer L, Frickenhaus S,Rosenstiel P, Pörtner H-O, Philipp EER, Lucassen M: Impacts of seawateracidification on mantle gene expression patterns of the Baltic Sea bluemussel: implications for shell formation and energy metabolism. Mar Biol2013, 160(8):1845–1861.
89. Pörtner H-O, Reipschläger A, Heisler N: Acid–base regulation, metabolismand energetics in Sipunculus nudus as a function of ambiant carbondioxide level. J Exp Biol 1998, 201:43–55.
90. Sokolova IM, Frederich M, Bagwe R, Lannig G, Sukhotin AA: Energyhomeostasis as an integrative tool for assessing limits of environmentalstress tolerance in aquatic invertebrates. Mar Environ Res 2012, 79:1–15.
91. Frederich M, Pörtner H-O: Oxygen limitation of thermal tolerance definedby cardiac and ventilatory performance in spider crab, Maja squinado.Am J Physiol Regul Integr Comp Physiol 2000, 279:R1531–R1538.
92. Pörtner H-O: Climate change and temperature-dependent biogeography:oxygen limitation of thermal tolerance in animals. Naturwissenschaften2001, 88(4):137–146.
93. Pörtner H-O: Oxygen- and capacity-limitation of thermal tolerance: amatrix for integrating climate-related stressor effects in marineecosystems. J Exp Biol 2010, 213(6):881–893.
94. Kooijman SALM: Dynamic Energy Budget Theory for Metabolic Organisation,Volume 3. Cambridge, United Kingdom: Cambridge University Press; 2010.
95. Pörtner H-O, Farrell AP: Physiology and climate change. Science 2008,322:690–692.
doi:10.1186/1471-2164-15-789Cite this article as: Harms et al.: Gene expression profiling in gills of thegreat spider crab Hyas araneus in response to ocean acidification andwarming. BMC Genomics 2014 15:789.
Related Documents