1 Abstract-- Advances in power electronics have led to the use of non-linear devices in power systems. Such devices significantly distort the voltage and current waveforms, injecting current harmonics into the distribution network. This paper reports on measurements of the voltage and current harmonic levels for a total period of three weeks, conducted at the low voltage bus of two higher education institutions, feeding several types of loads. The findings are the voltage and current profiles of the most significant harmonic components. The recorded data are also statistically processed using box plots. Index Terms-- Higher education buildings, harmonics, harmonic measurements, power quality. I. INTRODUCTION HE use of non-linear and power electronic interfaced devices in power systems is increasing significantly during the last decades. These devices are sources of power quality disturbances, since they inject current harmonics and as a consequence distort the voltage and current waveforms [1] - [3]. Power quality problems, due to harmonic pollution, may occur also in office buildings, where loads are mainly computer-type and fluorescent lamps [4]. Several surveys and investigations have been conducted, in order to measure and monitor the voltage and current harmonic levels at distribution buses [1] - [3] and most specifically in cases of educational institutions [5] - [8]. Scope of this paper is to present measurements conducted at an educational building in the campus of the Aristotle University of Thessaloniki (AUTH) in Thessaloniki, Greece and at the campus of the Technological Education Institution of Western Macedonia (TEI-WM) in Kozani, Greece. The paper reports on measurements of the voltage and current profiles of the most significant harmonic components as well as a statistical analysis of the recorded data. II. EXAMINED INSTALLATIONS In this paper harmonic measurements and monitoring are conducted in the following two locations: a) at an educational building, (Building D in the campus of AUTH) and b) at the campus of the TEI-WM. T. A. Papadopoulos, G. C. Christoforidis, and K. Ch. Chatzisavvas are with the Dept. of Electrical Engineering, Technological Education Institution of Western Macedonia, Greece (e-mail: [email protected]). T. A. Papadopoulos and G. K. Papagiannis are with the Dept. of Electrical & Computer Engineering, Aristotle University of Thessaloniki (AUTH), Greece (email: [email protected], [email protected]). K. Ch. Chatzisavvas is also with the Dept. of Informatics & Telecomm. Engineering, University of Western Macedonia, Greece, and the Dept. of Theoretical Physics, AUTH, Greece (e-mail: [email protected]). A. Building D of AUTH Building D of the Polytechnic School is a nine-storey building, where offices and some laboratories of three Departments (Chemical Engineering, Electrical & Computer Engineering and Mechanical Engineering) are located. The main electric loads are lighting, and different power electronic and non-linear devices such as computers, peripherals, office equipment (copiers, phones, faxes etc) and split type individual air-conditioning units. In the basement of the building the Laboratories of the Departments of the Electrical & Computer Engineering and of the Mechanical Engineering are located as well as the boiler room. Building D is connected to the 20 kV grid via a Dyn11 20 kV/0.4 kV, 50 Hz transformer with rated power 1 MVA. The low voltage (LV) side of the installation is a TN-C-S system. Harmonic measurements have been conducted using a Power Logger instrument at the LV busbar of the transformer with a sampling rate of 10 minutes. The average rms voltage and current of the fundamental and the 2 nd to 25 th harmonic components are determined, using the Fast Fourier Transform (FFT). From the above data the voltage and current total harmonic distortion terms (THD) are calculated, using (1). ( ) () max 2 2 1 THD (%) 1 h h h Α Α Α = = ∑ where h is the harmonic component order, taking values from 1 to h max and index A stands for the voltage V and current I. The total harmonic measurements duration is three weeks and is subdivided to three recording periods as shown in Table I. TABLE I RECORDING PERIODS TIME TABLE Recording period Building D (AUTH) TEI-WM Starting End Starting End #1 6/6/11 (Mon) 12/6/11 (Sun) 13/2/12 (Mon) 19/2/12 (Sun) #2 13/6/11 (Mon) 19/6/11 (Sun) 20/2/12 (Mon) 26/2/12 (Sun) #3 4/7/11 (Mon) 10/7/11 (Sun) 27/2/12 (Mon) 4/3/12 (Sun) B. TEI-WM campus The TEI-WM campus was built in 1976. It consists of several buildings, where lecture halls, offices, laboratories, dormitories and a student restaurant are lodged. The campus is supplied by an 800 kVA Dyn11, 20 kV/0.4 kV transformer and the LV side is a TN-S system. The same Harmonic Level Measurements and Analysis at Higher Education Buildings Theofilos A. Papadopoulos, Georgios C. Christoforidis, Konstantinos Ch. Chatzisavvas and Grigoris K. Papagiannis T

Welcome message from author
This document is posted to help you gain knowledge. Please leave a comment to let me know what you think about it! Share it to your friends and learn new things together.
Transcript

1
Abstract-- Advances in power electronics have led to the use
of non-linear devices in power systems. Such devices significantly distort the voltage and current waveforms, injecting current harmonics into the distribution network. This paper reports on measurements of the voltage and current harmonic levels for a total period of three weeks, conducted at the low voltage bus of two higher education institutions, feeding several types of loads. The findings are the voltage and current profiles of the most significant harmonic components. The recorded data are also statistically processed using box plots.
Index Terms-- Higher education buildings, harmonics, harmonic measurements, power quality.
I. INTRODUCTION HE use of non-linear and power electronic interfaced devices in power systems is increasing significantly
during the last decades. These devices are sources of power quality disturbances, since they inject current harmonics and as a consequence distort the voltage and current waveforms [1] - [3]. Power quality problems, due to harmonic pollution, may occur also in office buildings, where loads are mainly computer-type and fluorescent lamps [4]. Several surveys and investigations have been conducted, in order to measure and monitor the voltage and current harmonic levels at distribution buses [1] - [3] and most specifically in cases of educational institutions [5] - [8]. Scope of this paper is to present measurements conducted at an educational building in the campus of the Aristotle University of Thessaloniki (AUTH) in Thessaloniki, Greece and at the campus of the Technological Education Institution of Western Macedonia (TEI-WM) in Kozani, Greece. The paper reports on measurements of the voltage and current profiles of the most significant harmonic components as well as a statistical analysis of the recorded data.
II. EXAMINED INSTALLATIONS In this paper harmonic measurements and monitoring are
conducted in the following two locations: a) at an educational building, (Building D in the campus of AUTH) and b) at the campus of the TEI-WM.
T. A. Papadopoulos, G. C. Christoforidis, and K. Ch. Chatzisavvas are
with the Dept. of Electrical Engineering, Technological Education Institution of Western Macedonia, Greece (e-mail: [email protected]).
T. A. Papadopoulos and G. K. Papagiannis are with the Dept. of Electrical & Computer Engineering, Aristotle University of Thessaloniki (AUTH), Greece (email: [email protected], [email protected]).
K. Ch. Chatzisavvas is also with the Dept. of Informatics & Telecomm. Engineering, University of Western Macedonia, Greece, and the Dept. of Theoretical Physics, AUTH, Greece (e-mail: [email protected]).
A. Building D of AUTH Building D of the Polytechnic School is a nine-storey
building, where offices and some laboratories of three Departments (Chemical Engineering, Electrical & Computer Engineering and Mechanical Engineering) are located. The main electric loads are lighting, and different power electronic and non-linear devices such as computers, peripherals, office equipment (copiers, phones, faxes etc) and split type individual air-conditioning units. In the basement of the building the Laboratories of the Departments of the Electrical & Computer Engineering and of the Mechanical Engineering are located as well as the boiler room.
Building D is connected to the 20 kV grid via a Dyn11 20 kV/0.4 kV, 50 Hz transformer with rated power 1 MVA. The low voltage (LV) side of the installation is a TN-C-S system. Harmonic measurements have been conducted using a Power Logger instrument at the LV busbar of the transformer with a sampling rate of 10 minutes. The average rms voltage and current of the fundamental and the 2nd to 25th harmonic components are determined, using the Fast Fourier Transform (FFT). From the above data the voltage and current total harmonic distortion terms (THD) are calculated, using (1).
( )( )
max2
2
1
THD (%) 1
h
hh
Α
Α
Α==
∑
where h is the harmonic component order, taking values from 1 to hmax and index A stands for the voltage V and current I. The total harmonic measurements duration is three weeks and is subdivided to three recording periods as shown in Table I.
TABLE I RECORDING PERIODS TIME TABLE
Recording period Building D (AUTH) TEI-WM Starting End Starting End
#1 6/6/11 (Mon)
12/6/11 (Sun)
13/2/12 (Mon)
19/2/12 (Sun)
#2 13/6/11 (Mon)
19/6/11 (Sun)
20/2/12 (Mon)
26/2/12 (Sun)
#3 4/7/11 (Mon)
10/7/11 (Sun)
27/2/12 (Mon)
4/3/12 (Sun)
B. TEI-WM campus The TEI-WM campus was built in 1976. It consists of
several buildings, where lecture halls, offices, laboratories, dormitories and a student restaurant are lodged. The campus is supplied by an 800 kVA Dyn11, 20 kV/0.4 kV transformer and the LV side is a TN-S system. The same
Harmonic Level Measurements and Analysis at Higher Education Buildings
Theofilos A. Papadopoulos, Georgios C. Christoforidis, Konstantinos Ch. Chatzisavvas and Grigoris K. Papagiannis
T

2
harmonic measurements are conducted as previously and the monitoring instrument is installed at the LV side of the campus power house. The recording periods are defined in Table I, with a total time of three weeks.
III. TOTAL CURRENT PROFILE Figs. 1 and 2 present the rms total current profiles of the
three phases (a, b, c) of Building D and the TEI-WM campus, respectively, for a whole week. Measurements for Building D correspond to the recording period #2, while for the TEI-WM campus to the recording period #3. In both cases the starting day Monday is a holiday. The rms current is defined in (2).
( ) ( )max
2
12
h
rms hh
IΙ=
= ∑
Typical forms of weekday load profiles are presented, with peak and base load values recorded at 11:00 – 12:00 and 00:00 – 06:00, respectively, in both cases. Therefore, in both buildings it can be assumed that the working hours correspond to the period of 08:00-20:00, while the rest hours are the non-working hours.
The Building D load profile presents a rather complex behavior, especially considering the base load during the whole week. This type of behavior is attributed to the stochastic operation of a 100 kW motor in a laboratory of the Department of Mechanical Engineering, used for destructive testing. The power factor of the building is generally high, since during non-working is on average 0.96 lagging, while during working hours the average recorded value is 0.9 lagging. On the contrary, the TEI-WM installation presents a significant high power factor during the working hours, reaching almost unity in some cases, while during non-working hours a low power factor is recorded with minimum values equal to 0.6 lagging.
In both installations, significant levels of base load currents are observed during the weekdays as well as during the weekend and the holiday. In the case of Building D this is mainly due to lighting, computers and other devices not switched-off during the night [9]. In the TEI-WM campus the average base load current is higher than 200 A per phase. Moreover, this is attributed to non switched-off devices as previously, as well as to the operation of the restaurant equipment, e.g. refrigerators and to the student dormitory.
0
100
200
300
400
500
600
13/6 14/6 15/6 16/6 17/6 18/6 19/6 20/6date
Cur
rent
(A)
phase aphase bphase c
Holiday Weekdays Weekend
Fig. 1. Building D phase currents from 13/6/11 to 20/6/11.
100
200
300
400
500
600
27/2 28/2 29/2 1/3 2/3 3/3 4/3 5/3date
Cur
rent
(A)
phase aphase bphase c
Holiday Weekdays Weekend
Fig. 2. TEI-WM campus phase currents from 27/2/12 to 5/3/12.
IV. VOLTAGE HARMONIC PROFILE MEASUREMENTS The voltage harmonic spectrum as a function of time for
the recording period #2 is analyzed in Figs. 3 and 4 for Building D and the TEI-WM campus, respectively. In both installations the 3rd, 5th and 7th voltage harmonics are the most significant, whereas the level of the higher order odd and all even harmonics is generally considerably lower than 1 %. The total harmonic voltage distortion (THDV) is on average equal to 2 % and 3 % for Building D and the TEI-WM campus, respectively. Therefore, it is in both cases within the 5 % IEEE 519 limit [10] and the 8 % limit during the 95 % of one week, according to the EN 50160 [11].
0
0.5
1
1.5
2
2.5
13/06 14/06 15/06 16/06 17/06 18/06 19/06 20/06day
% v
olta
ge h
arm
onic
3rd5th7th
Fig. 3. Voltage harmonic profile against time for Building D.
0
0.5
1
1.5
2
2.5
3
3.5
4
20/02 21/02 22/02 23/02 24/02 25/02 26/02 27/02day
% v
olta
ge h
arm
onic
3rd5th7th
Fig. 4. Voltage harmonic profile against time for the TEI-WM campus.
In both figures, voltage profiles reveal that the dominant
component is the fifth harmonic, a similar finding with [12], followed by the seventh voltage harmonic for the whole recording period. Both installations are, also, compliant with the individual harmonic component levels of EN 50160 Std.,

3
defined for the 95 % of one week [11]. This is depicted in more detail in Fig. 5 using the 5th voltage harmonic cumulative distribution curve [3]. It is shown that for Building D and the TEI-WM campus the 95 % of the weekly values does not exceed 1.8 % (point A) and 2.8 % (point B), respectively, while the corresponding EN 50160 limit is 6 %.
0
20
40
60
80
100
1 1.4 1.8 2.2 2.6 3 3.45th voltage harmonic (%)
dist
ribut
ion
(%)
TEI-WMBuilding D
AB
Fig. 5. 5th voltage harmonic cumulative distribution curve.
V. CURRENT HARMONIC PROFILE MEASUREMENTS Findings on harmonic current measurements are reported
in this section. First, the total harmonic current distortion (THDI) of both installations is analyzed, expressed as a percentage, i.e. THDI (%), using (2) and also as an rms value, i.e. THDI (rms), given in (3) [13].
( ) ( )max
2I
2THD (rms) 3
h
hh
I=
= ∑
In addition the harmonic spectrum of the obtained measurements against time is analyzed. For the investigation, each day is subdivided to periods of working hours and non-working hours, with indexes ON and OF in the figures, respectively. Box plots are adopted for the statistical analysis of the above groups of data. The minimum and maximum samples, the lower, median and upper quartiles as well as outliers are presented [14].
A. THD analysis In Figs. 6 and 7 the phase a THDI (%) box plot and the
THDI (rms) curve against time for the case of Building D are presented, respectively. The corresponding graphs for the TEI-WM campus are shown in Figs. 8 and 9. In the box plots the measurements of all recording periods are used, whereas in Figs. 7 and 9 only from period #2.
In Building D the THDI (%) acquires values from 5 % to 25 %, while in the TEI-WM campus from 10 % to 20 %, presenting a smaller dispersion. Similar results are recorded for phases b and c as well. Non-working hour data present a significantly higher dispersion than the corresponding working hour data for Building D during the first two periods, while the opposite behavior is observed for the TEI-WM campus for period #3. For the rest recording periods, both installations exhibit almost the same dispersion in the results.
THD
I (%
)
period #1 period #2 period #3
THD
I (%
)
period #1 period #2 period #3
Fig. 6. THDI(%) box plot for Building D.
0
10
20
30
40
13/06 14/06 15/06 16/06 17/06 18/06 19/06 20/06date
THD
I(rm
s) (A
)
phase aphase bphase c
Holiday Weekdays Weekend
Fig. 7. THDI(rms) against time for Building D for recording period #2.
period #1 period #2 period #3
THD
I (%
)
period #1 period #2 period #3
THD
I (%
)
Fig. 8. THDI(%) whisker plot for the TEI-WM campus.
10
20
30
40
50
60
27/2 28/2 29/2 1/3 2/3 3/3 4/3 5/3date
THD
I(rm
s) (A
)
phase aphase bphase c
Holiday Weekdays Weekend
Fig. 9. THDI(rms) against time for the TEI-WM campus for recording period #3.
In both installations the highest THDI(%) is generally
observed during the non-working hours, in contrast to the working hours when the THDI(%) is low. This is more intense in the case of Building D and especially for

4
recording period #2. For the case of the TEI-WM campus, the differences between the working and non-working hours are less severe. In fact, almost similar THDI (%) levels are recorded for the first two periods, whereas higher values are observed during the non-working hours of period #3. This recording period was a typical operating period of the TEI-WM campus, where all classes and laboratories were normally in operation. On the contrary, during periods #1 and #2 the TEI-WM was less intensively employed, since it was an examination period and no classes or laboratories took place. The above are summarized in Table II, where the median values of the THDI(%) for the corresponding cases are given.
The use of THDI (%) may lead to misleading remarks and conclusions, for the evaluation of current harmonic distortion, since it is strongly depended on the fundamental harmonic current. This mainly occurs in cases where the harmonic current distortion, expressed in the numerator of (1), varies slightly, due to the continuous operation of non-linear devices, while the fundamental current component in the denominator of (1) has significantly changed [3], [13]. Therefore, the THDI (rms) is adopted, expressing the level of the current harmonic distortion as an rms value. Comparing the THDI (%) and THDI (rms) results an opposite behavior is observed for both installations, since the highest levels of THDI (rms) are recorded during working hours, while low THDI (rms) distortion is observed during the non-working hours. More specifically, in the case of Building D the THDI (rms) curve, shown in Fig.7, presents local maxima during working hours and (approximately at 13:00), while the average value of the THDI (%) is 7.4 %.
A better index for the current harmonic distortion, instead of THDI (%), would be the total current demand distortion, i.e. TDDI (%), which expresses the current harmonic distortion in reference to the maximum short-circuit (Isc) and demand load current (IL) at the Point of Common Coupling (PCC) [1]. However, the accurate values of both Isc and IL are usually unknown and have to be provided by the supplier company [13]. Furthermore, for our cases, measurements at the MV busbar would be required.
TABLE II
THDI(%) MEDIAN
Recording period
Building D (AUTH) TEI-WM
Working hours (ON)
Non-working
hours (OF)
Working hours (ON)
Non-working
hours (OF)
#1 7.6 10.42 14.3 16.64 #2 6.62 12 14.5 17.65 #3 5.6 7.5 14 18.14
B. Building D harmonic spectrum analysis The harmonic spectrum of the current waveforms for the
case of Building D is further analyzed, using box plots for the 3rd, 5th, 7th and 9th components in Figs. 10 – 13, respectively. The current harmonic spectrum is expressed as a percentage to the rms current fundamental component.
The 3rd harmonic acquires values from 4 % to 20 %, while the 5th harmonic from 1 % to 15 %. For both harmonic components the highest values of the maximum and median
are recorded during non-working hours and especially during recording period #2. The median of the 3rd harmonic is 6 % for working hours and 8.7 % for non-working hours, while for the 5th harmonic the corresponding values are 2 % and 4.31 %.
period #1 period #2 period #3Cur
rent
3rd
Har
mon
ic (%
)
period #1 period #2 period #3Cur
rent
3rd
Har
mon
ic (%
)
Fig. 10. 3rd harmonic box plot for Building D.
period #1 period #2 period #3
Cur
rent
5th
Har
mon
ic (%
)
period #1 period #2 period #3
Cur
rent
5th
Har
mon
ic (%
)
Fig. 11. 5th harmonic box plot for Building D.
period #1 period #2 period #3
Cur
rent
7th
Har
mon
ic (%
)
period #1 period #2 period #3
Cur
rent
7th
Har
mon
ic (%
)
Fig. 12. 7th harmonic whisker plot for Building D.
period #1 period #2 period #3
Cur
rent
9th
Har
mon
ic (%
)
period #1 period #2 period #3
Cur
rent
9th
Har
mon
ic (%
)
Fig. 13. 9th harmonic whisker plot for Building D.
For the 7th and 9th current harmonic it is shown that both

5
acquire values lower than 10 % and the corresponding maxima are again observed during non-working hours of period #2, where also the higher dispersion in data is observed.
C. TEI-WM harmonic spectrum analysis For the current harmonic analysis of the TEI-WM campus
the rms 3rd, 5th, 7th and 9th current harmonic components are presented in Figs. 14 –17, respectively.
With the rms expression of the current harmonics, the higher components are recorded during working hours instead of non-working hours, as shown for the case of Building D. The 3rd, 5th and 7th harmonics acquire similar levels and the corresponding data present a high dispersion taking values in general from a few Amperes to 40 A. The highest variation in results is observed in the 3rd harmonic, since the working hours median current during the three recording periods is equal to 30 A, while the non-working hours median is 24 A. The median values for the 5th and the 7th harmonics are 19 A and 17 A for the working and 21 A and 21.5 A for the non-working hours, respectively.
The 9th harmonic current level is significantly reduced, compared to the rest lower order components; since maximum values lower than 12.5 A are recorded and the median harmonic current is about 8 A, i.e. 3 % against the fundamental component.
period #1 period #2 period #3
Cur
rent
3rd
Har
mon
ic (A
)
period #1 period #2 period #3
Cur
rent
3rd
Har
mon
ic (A
)
Fig. 14. 3rd harmonic whisker plot for TEI-WM campus.
period #1 period #2 period #3
Cur
rent
5th
Har
mon
ic (A
)
period #1 period #2 period #3
Cur
rent
5th
Har
mon
ic (A
)
Fig. 15. 5th harmonic whisker plot for TEI-WM campus.
period #1 period #2 period #3
Cur
rent
7th
Har
mon
ic (A
)
period #1 period #2 period #3
Cur
rent
7th
Har
mon
ic (A
)
Fig. 16. 7th harmonic whisker plot for TEI-WM campus.
period #1 period #2 period #3
Cur
rent
9th
Har
mon
ic (A
)
period #1 period #2 period #3
Cur
rent
9th
Har
mon
ic (A
)
Fig. 17. 9th harmonic whisker plot for TEI-WM campus.
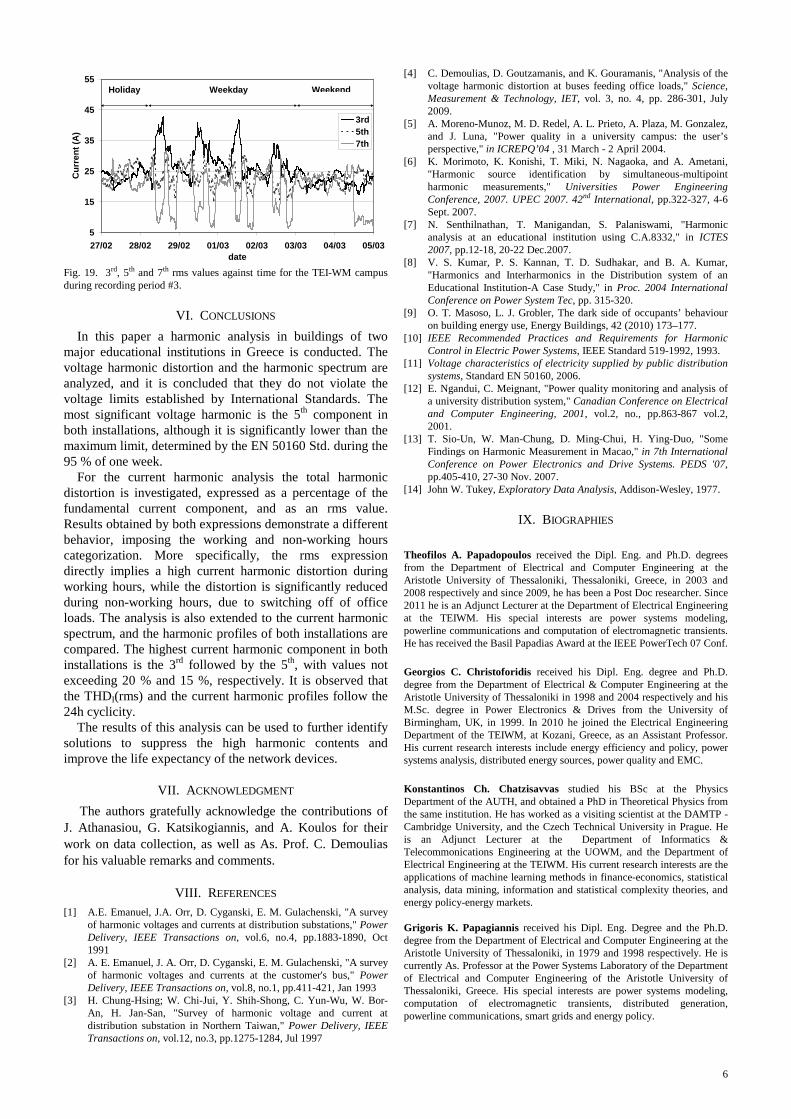
D. Harmonic component profiles of both installations Finally, the rms curves of the most significant current
harmonic components, i.e. 3rd, 5th and 7th against time are plotted in Figs. 18 and 19 for Building D and the TEI-WM campus, respectively. The 3rd harmonic is the most significant component followed by the 5th and the 7th in both installations. All current harmonic curves follow the 24h cyclicity, apart from the 7th harmonic of the TEI-WM campus [1], [2]. The rms maximum value of all current harmonic components is recorded during the working hours and more specifically for Building D during 12:30-13:30, while for the TEI-WM campus during 10:30 – 12:30.
0
5
10
15
20
25
30
13/06 14/06 15/06 16/06 17/06 18/06 19/06 20/06date
Cur
rent
(A)
3rd5th7th
Holiday Weekdays Weekend
Fig. 18. 3rd, 5th and 7th rms values against time for Building D during recording period #2.
6
5
15
25
35
45
55
27/02 28/02 29/02 01/03 02/03 03/03 04/03 05/03date
Cur
rent
(A)
3rd5th7th
Holiday Weekday Weekend
Fig. 19. 3rd, 5th and 7th rms values against time for the TEI-WM campus during recording period #3.
VI. CONCLUSIONS In this paper a harmonic analysis in buildings of two
major educational institutions in Greece is conducted. The voltage harmonic distortion and the harmonic spectrum are analyzed, and it is concluded that they do not violate the voltage limits established by International Standards. The most significant voltage harmonic is the 5th component in both installations, although it is significantly lower than the maximum limit, determined by the EN 50160 Std. during the 95 % of one week.
For the current harmonic analysis the total harmonic distortion is investigated, expressed as a percentage of the fundamental current component, and as an rms value. Results obtained by both expressions demonstrate a different behavior, imposing the working and non-working hours categorization. More specifically, the rms expression directly implies a high current harmonic distortion during working hours, while the distortion is significantly reduced during non-working hours, due to switching off of office loads. The analysis is also extended to the current harmonic spectrum, and the harmonic profiles of both installations are compared. The highest current harmonic component in both installations is the 3rd followed by the 5th, with values not exceeding 20 % and 15 %, respectively. It is observed that the THDI(rms) and the current harmonic profiles follow the 24h cyclicity.
The results of this analysis can be used to further identify solutions to suppress the high harmonic contents and improve the life expectancy of the network devices.
VII. ACKNOWLEDGMENT The authors gratefully acknowledge the contributions of
J. Athanasiou, G. Katsikogiannis, and A. Koulos for their work on data collection, as well as As. Prof. C. Demoulias for his valuable remarks and comments.
VIII. REFERENCES [1] A.E. Emanuel, J.A. Orr, D. Cyganski, E. M. Gulachenski, "A survey
of harmonic voltages and currents at distribution substations," Power Delivery, IEEE Transactions on, vol.6, no.4, pp.1883-1890, Oct 1991
[2] A. E. Emanuel, J. A. Orr, D. Cyganski, E. M. Gulachenski, "A survey of harmonic voltages and currents at the customer's bus," Power Delivery, IEEE Transactions on, vol.8, no.1, pp.411-421, Jan 1993
[3] H. Chung-Hsing; W. Chi-Jui, Y. Shih-Shong, C. Yun-Wu, W. Bor-An, H. Jan-San, "Survey of harmonic voltage and current at distribution substation in Northern Taiwan," Power Delivery, IEEE Transactions on, vol.12, no.3, pp.1275-1284, Jul 1997
[4] C. Demoulias, D. Goutzamanis, and K. Gouramanis, "Analysis of the voltage harmonic distortion at buses feeding office loads," Science, Measurement & Technology, IET, vol. 3, no. 4, pp. 286-301, July 2009.
[5] A. Moreno-Munoz, M. D. Redel, A. L. Prieto, A. Plaza, M. Gonzalez, and J. Luna, "Power quality in a university campus: the user’s perspective," in ICREPQ’04 , 31 March - 2 April 2004.
[6] K. Morimoto, K. Konishi, T. Miki, N. Nagaoka, and A. Ametani, "Harmonic source identification by simultaneous-multipoint harmonic measurements," Universities Power Engineering Conference, 2007. UPEC 2007. 42nd International, pp.322-327, 4-6 Sept. 2007.
[7] N. Senthilnathan, T. Manigandan, S. Palaniswami, "Harmonic analysis at an educational institution using C.A.8332," in ICTES 2007, pp.12-18, 20-22 Dec.2007.
[8] V. S. Kumar, P. S. Kannan, T. D. Sudhakar, and B. A. Kumar, "Harmonics and Interharmonics in the Distribution system of an Educational Institution-A Case Study," in Proc. 2004 International Conference on Power System Tec, pp. 315-320.
[9] O. T. Masoso, L. J. Grobler, The dark side of occupants’ behaviour on building energy use, Energy Buildings, 42 (2010) 173–177.
[10] IEEE Recommended Practices and Requirements for Harmonic Control in Electric Power Systems, IEEE Standard 519-1992, 1993.
[11] Voltage characteristics of electricity supplied by public distribution systems, Standard EN 50160, 2006.
[12] E. Ngandui, C. Meignant, "Power quality monitoring and analysis of a university distribution system," Canadian Conference on Electrical and Computer Engineering, 2001, vol.2, no., pp.863-867 vol.2, 2001.
[13] T. Sio-Un, W. Man-Chung, D. Ming-Chui, H. Ying-Duo, "Some Findings on Harmonic Measurement in Macao," in 7th International Conference on Power Electronics and Drive Systems. PEDS '07, pp.405-410, 27-30 Nov. 2007.
[14] John W. Tukey, Exploratory Data Analysis, Addison-Wesley, 1977.
IX. BIOGRAPHIES
Theofilos A. Papadopoulos received the Dipl. Eng. and Ph.D. degrees from the Department of Electrical and Computer Engineering at the Aristotle University of Thessaloniki, Thessaloniki, Greece, in 2003 and 2008 respectively and since 2009, he has been a Post Doc researcher. Since 2011 he is an Adjunct Lecturer at the Department of Electrical Engineering at the TEIWM. His special interests are power systems modeling, powerline communications and computation of electromagnetic transients. He has received the Basil Papadias Award at the IEEE PowerTech 07 Conf.
Georgios C. Christoforidis received his Dipl. Eng. degree and Ph.D. degree from the Department of Electrical & Computer Engineering at the Aristotle University of Thessaloniki in 1998 and 2004 respectively and his M.Sc. degree in Power Electronics & Drives from the University of Birmingham, UK, in 1999. In 2010 he joined the Electrical Engineering Department of the TEIWM, at Kozani, Greece, as an Assistant Professor. His current research interests include energy efficiency and policy, power systems analysis, distributed energy sources, power quality and EMC.
Konstantinos Ch. Chatzisavvas studied his BSc at the Physics Department of the AUTH, and obtained a PhD in Theoretical Physics from the same institution. He has worked as a visiting scientist at the DAMTP -Cambridge University, and the Czech Technical University in Prague. He is an Adjunct Lecturer at the Department of Informatics & Telecommonications Engineering at the UOWM, and the Department of Electrical Engineering at the TEIWM. His current research interests are the applications of machine learning methods in finance-economics, statistical analysis, data mining, information and statistical complexity theories, and energy policy-energy markets.
Grigoris K. Papagiannis received his Dipl. Eng. Degree and the Ph.D. degree from the Department of Electrical and Computer Engineering at the Aristotle University of Thessaloniki, in 1979 and 1998 respectively. He is currently As. Professor at the Power Systems Laboratory of the Department of Electrical and Computer Engineering of the Aristotle University of Thessaloniki, Greece. His special interests are power systems modeling, computation of electromagnetic transients, distributed generation, powerline communications, smart grids and energy policy.
Related Documents


