Hard X-Ray Microanalysis with Parabolic Refractive Lenses. Von der Fakult¨ at f¨ ur Mathematik, Informatik und Naturwissenschaften der Rheinisch Westf¨ alischen Technischen Hochschule Aachen zur Erlangung des akademischen Grades eines Doktors der Naturwissenschaften genehmigte Dissertation vorgelegt von Diplom-Physikerin Marion Kuhlmann aus Bramsche. Berichter: Universit¨ atsprofessor Dr. B. Lengeler Universit¨ atsprofessor Dr. H. L¨ uth Tag der m¨ undlichen Pr¨ ufung: 13. August 2004 Diese Dissertation ist auf den Internetseiten der Hochschulbibliothek online verf¨ ugbar.

Welcome message from author
This document is posted to help you gain knowledge. Please leave a comment to let me know what you think about it! Share it to your friends and learn new things together.
Transcript
Hard X-Ray Microanalysis with Parabolic Refractive Lenses.
Von der Fakultat fur Mathematik, Informatik und Naturwissenschaftender Rheinisch Westfalischen Technischen Hochschule Aachen
zur Erlangung des akademischen Gradeseines Doktors der Naturwissenschaften genehmigte Dissertation
vorgelegt von
Diplom-Physikerin Marion Kuhlmannaus Bramsche.
Berichter: Universitatsprofessor Dr. B. LengelerUniversitatsprofessor Dr. H. Luth
Tag der mundlichen Prufung: 13. August 2004
Diese Dissertation ist auf den Internetseiten der Hochschulbibliothek online verfugbar.


Contents
1 Introduction 1
2 Optics for Hard X-Rays 32.1 Interaction of X-Rays with Matter . . . . . . . . . . . . . . . . . . . . . . . . 32.2 Focusing Optics for Hard X-Rays . . . . . . . . . . . . . . . . . . . . . . . . . 92.3 Parabolic Refractive Lenses as Hard X-Ray Optic . . . . . . . . . . . . . . . . 10
2.3.1 Historical Note . . . . . . . . . . . . . . . . . . . . . . . . . . . . . . . 102.3.2 Design . . . . . . . . . . . . . . . . . . . . . . . . . . . . . . . . . . . . 112.3.3 Principal Geometries . . . . . . . . . . . . . . . . . . . . . . . . . . . . 12
3 Parabolic Refractive Lenses: Properties 153.1 Parabolic Shape . . . . . . . . . . . . . . . . . . . . . . . . . . . . . . . . . . 153.2 Surface Roughness . . . . . . . . . . . . . . . . . . . . . . . . . . . . . . . . . 163.3 Focal Length . . . . . . . . . . . . . . . . . . . . . . . . . . . . . . . . . . . . 173.4 Transmission and Gain . . . . . . . . . . . . . . . . . . . . . . . . . . . . . . . 183.5 Effective and Numerical Aperture . . . . . . . . . . . . . . . . . . . . . . . . 203.6 Depth of Field and Depth of Focus . . . . . . . . . . . . . . . . . . . . . . . . 203.7 Resolution . . . . . . . . . . . . . . . . . . . . . . . . . . . . . . . . . . . . . . 203.8 Chromatic Aberration . . . . . . . . . . . . . . . . . . . . . . . . . . . . . . . 213.9 Example Experiment . . . . . . . . . . . . . . . . . . . . . . . . . . . . . . . . 22
4 Beryllium Lenses: Properties and Performance 254.1 Improvements due to Beryllium . . . . . . . . . . . . . . . . . . . . . . . . . . 264.2 Material Quality and Shape Control . . . . . . . . . . . . . . . . . . . . . . . 304.3 Comparison of Beryllium Lenses and Aluminium Lenses . . . . . . . . . . . . 33
5 Beryllium Lenses: Methods and Applications 355.1 Imaging and Microscopy . . . . . . . . . . . . . . . . . . . . . . . . . . . . . . 355.2 Focusing and Microprobing . . . . . . . . . . . . . . . . . . . . . . . . . . . . 405.3 Tomography . . . . . . . . . . . . . . . . . . . . . . . . . . . . . . . . . . . . . 41
5.3.1 Scanning Tomography . . . . . . . . . . . . . . . . . . . . . . . . . . . 425.3.2 Magnifying Tomography . . . . . . . . . . . . . . . . . . . . . . . . . . 44
5.4 Hard X-Ray Lithography . . . . . . . . . . . . . . . . . . . . . . . . . . . . . 465.5 Micro Small Angle X-Ray Scattering . . . . . . . . . . . . . . . . . . . . . . . 495.6 Beam Conditioning . . . . . . . . . . . . . . . . . . . . . . . . . . . . . . . . . 505.7 Refractive Lenses for X-Ray Free Electron Lasers . . . . . . . . . . . . . . . . 505.8 Comparison and Outlook . . . . . . . . . . . . . . . . . . . . . . . . . . . . . 51

CONTENTS
6 XANES Microtomography 536.1 X-Ray Absorption Fine Structure (XAFS) . . . . . . . . . . . . . . . . . . . . 536.2 The Goal: XANES Microtomography . . . . . . . . . . . . . . . . . . . . . . . 576.3 Experimental Implementation . . . . . . . . . . . . . . . . . . . . . . . . . . . 576.4 Results of XANES Microtomography . . . . . . . . . . . . . . . . . . . . . . . 58
6.4.1 Feasibility Test . . . . . . . . . . . . . . . . . . . . . . . . . . . . . . . 586.4.2 Catalyst Science . . . . . . . . . . . . . . . . . . . . . . . . . . . . . . 626.4.3 Biological and Environmental Science . . . . . . . . . . . . . . . . . . 64
6.5 Conclusions . . . . . . . . . . . . . . . . . . . . . . . . . . . . . . . . . . . . . 67
7 Nanofocusing 697.1 Design and Manufacturing of Nanofocusing Lenses . . . . . . . . . . . . . . . 697.2 Experimental Implementation . . . . . . . . . . . . . . . . . . . . . . . . . . . 737.3 NFL Characterization . . . . . . . . . . . . . . . . . . . . . . . . . . . . . . . 747.4 First Nanofocusing Results . . . . . . . . . . . . . . . . . . . . . . . . . . . . 767.5 Nanofocusing Lenses: Summary and Outlook . . . . . . . . . . . . . . . . . . 82
8 Summary 83
A The Choice of Lens Material A1

Chapter 1
Introduction
Since their discovery by Wilhelm Conrad Rontgen in 1895 X-rays have been used in analyticalapplications. Most common, X-rays are known as medical diagnostic tools due to their abilityto non-destructively pass through matter which cannot be penetrated by visible light.Beside this, many physical analysis methods rely on the properties of X-rays. Hard X-rayscover the energy range from about 1000 eV to 200 keV, which correspond to a large part ofthe spectrum of electronic and a few nuclear transitions in atoms. Therefore, the elementalcomposition of a sample can be analyzed by its emitted fluorescence radiation. Likewiseabsorption spectroscopy can describe the chemical state and the short range environment ofan element. Further, the hard X-rays wavelengths of 10 A to 0.05 A allow to study the structureof condensed matter, as they are in the range of characteristic interatomic distances. This isthe foundation of X-ray crystallography.As powerful as these analytical methods may be, many applications need a focused X-raybeam. Especially, heterogeneous samples and complex structures benefit from the higherspatial resolution of a micro focused beam. Some focusing optics are able to implement highresolution imaging. For soft X-rays, full field and scanning microscopy have been realized bymeans of Fresnel zone plates as optical elements. However most optics (like mirrors, multilayers, capillaries, Fresnel zone plates, and Bragg-Fresnel optics) become less efficient withhigher X-ray energies.This thesis follows the development of microscopy, micro probing, and micro diffraction in thehard X-ray range based on parabolic refractive lenses. Obviously, refractive lenses for visiblelight are most successful. But the weak refraction and strong absorption of hard X-rays inmatter make the realization of refractive lenses difficult. The first refraction experiment byRontgen led to the conclusion that there are non refractive lenses for X-rays. Since then,the concept have been controversially discussed and was mainly considered as unrealistic.Highly brilliant X-ray sources and advanced instrumentation are the foundation for the firstexperiment, which used refractive X-ray lenses, by Snigirev, et al., in 1996. The apertureof refractive lenses for hard X-rays is comparable to their radius of curvature. Therefore,spherical refractive lenses suffer from aberration and are not appropriate for microscopy andother imaging applications. Parabolic refractive hard X-ray lenses have solved this problem.A full field hard X-ray microscope which used a stack of parabolic refractive aluminium lenseswas first implemented in 1999 by Lengeler, et al.To improve the imaging application of parabolic refractive lenses and to enhance the mean-ingful energy range beryllium lenses have been developed. Their benefits for analytical appli-
1
2 CHAPTER 1. INTRODUCTION
cation are outlined in the chapters 4 and 5.Microanalysis with hard X-rays has benefited from the high brilliance of 3rd generation syn-chrotron radiation sources. The experiments were carried out at the European SynchrotronRadiation Facility ESRF in Grenoble, France, and at the Advanced Photon Source APS atArgonne National Laboratory, USA. The next generation of synchrotron radiation sourceswill be the X-ray free electron laser XFEL, whose spectral brilliance is expected to be sev-eral orders of magnitude higher than that of present synchrotron radiation sources. Berylliumrefractive lenses will probably allow microanalysis despite the high power of these new sources.Arranging the individual lenses in a stack gives the refractive X-ray lenses a high degree offlexibility concerning choice of energy and spot size. In that way, standard small angle scatter-ing experiments were improved. Also, parabolic beryllium lenses were used in implementingXANES microtomography. This combination of near edge absorption spectroscopy with twodimensional scanning microscopy allows to examine the chemical state and the local environ-ment of a given atomic species in a virtual slice through a sample without really cutting it.The opportunities of this powerful approach are outlined in chapter 6.The demand for X-ray microprobes with still smaller spot size is growing. For this reasonnanofocusing refractive lenses have been designed in Aachen. A prototype made out of siliconis presented in chapter 7. With this first nanofocusing hard X-ray lens we were able to enhancethe results of fluorescence nanotomography experiments and nanodiffraction, already. In thenear future focusing of hard X-rays with refractive lenses below 100 nm is a realistic goal,opening the way to study biologic cells and structures of nanotechnologic devices.

Chapter 2
Optics for Hard X-Rays
The interaction of X-ray with matter is discussed in this chapter. Then, hard X-ray optics willbe introduced, followed by a general presentation of refractive lenses, including their designconcept, the choice of material, and their classification as hard X-ray optic.
2.1 Interaction of X-Rays with Matter
At a boundary between vacuum to matter X-rays are refracted and reflected. Inside thematter they are attenuated by absorption and scattering. If the material has a periodicstructure diffraction can occur. Further, inhomogeneities in the material generate small anglescattering.The propagation of an electromagnetic wave in matter depends on its wavelength λ and onthe material to interact with. Different phase velocities for different materials are expressedby the index of refraction n [1].
n = 1 − δ + iβ. (2.1)
The refraction is described by the real part 1-δ whereas the attenuation of X-rays in matteris described by β.
visible light X-rays
n1 = 1 n1 = 1
n2 = 1-δ+iβn2 > 1 θ2
θ1θ1
θ2
Figure 2.1: Refraction at the boundary between vacuum and matter for visible light andfor X-rays according to Snell’s law, equation (2.2). In contrast to visible light, X-rays arerefracted away from the surface normal.
3

4 CHAPTER 2. OPTICS FOR HARD X-RAYS
Refraction: the change in direction of a beam at the boundary between two media is ex-pressed by Snell’s law [2]. It is common for X-rays to consider the incident angle between theray and the surface of the boundary and not to the surface normal. Therefore, Snell’s lawappears as
n1 cos θ1 = n2 cos θ2. (2.2)
The indices of refraction n1 and n2 refer to the two materials, respectively, between which theboundary is considered. The incident angle is θ1, whereas θ2 is the refracted angle.The differences of the refraction in case of visible light and X-rays are illustrated in figure 2.1.The index of refraction in vacuum is unity. For visible light, n in matter is always larger thanunity. Hence, a beam is refracted to the surface normal. Contrarily, for X-rays in matter, 1-δis smaller than unity. In this respect the beam is refracted away from the surface normal.The index of refraction decrement δ is given by
δ =NA
2πr0λ
2
A· (Z + f ′) (2.3)
material parameter: A atomic mass [g/mol]Z atomic number the densityf = f0(Q) + f ′ + if ′′ atomic scattering factor
= Z + f ′ + if ′′ in forward direction, listed in [3]physical constants: NA = 6.022 ·1023 mol−1 Avogadro number
r0 = e2/mc2
= 2.818 · 10−15m classical radius of the electron
Typically, δ is of the order 10−6 [e. g., δBe(12 keV) = 2.4·10−6 or δAl(23.3 keV) = 1·10−6]. As aconsequence, a focusing lens for X-rays must have a concave form, whereas it is convex forvisible light. In addition, the change of angle is very small. With θ1 = 45 and δ = 10−6 thechange in beam direction at the the boundary between vacuum and matter is only ∆θ =0.2”.Thus, many refractive X-ray lenses are needed in order to achieve a small focal length, below1 m.
Attenuation: the imaginary part β of the refractive index is linked to the linear attenuationcoefficient µ by equation (2.5).
β =NA
2πr0λ
2
A· f ′′ (2.4)
=µλ
4π(2.5)
The attenuation of the transmitted intensity I passing though a homogeneous material ofthickness d is described by the Lambert-Beer law
I = I0 · e−µd. (2.6)
Here, I0 represents the incident intensity and the linear attenuation coefficient µ is the inverseof the characteristic length of the exponential decay.
2.1. INTERACTION OF X-RAYS WITH MATTER 5
Different effects contribute to the attenuation: photoabsorption coefficient τ , scattering pro-cesses µS , and pair production µP . For energies below 120 keV µP is zero.
µ = τ + µS + µP . (2.7)
In the context of refractive hard X-ray lenses the photoabsorption is dominant. A stronglybound electron in an atom absorbs a photon, while the nucleus accounts for the momentumbalance in the process. The stronger the electron is bound, the higher is the probabilitythat a photoabsorption process occurs. This corresponds to a photoabsorption coefficient τincreasing with a strong power of Z and decreasing with a strong power of E the X-ray energy
τ ∼ Z3
E3 . (2.8)
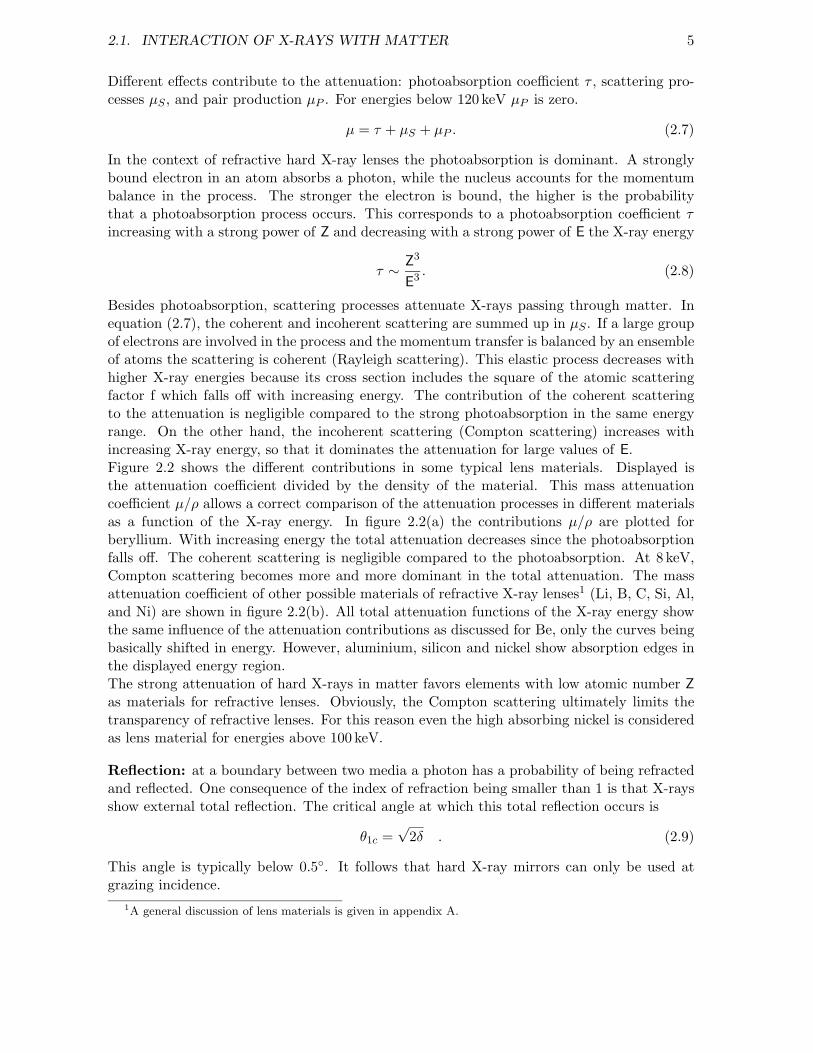
Besides photoabsorption, scattering processes attenuate X-rays passing through matter. Inequation (2.7), the coherent and incoherent scattering are summed up in µS . If a large groupof electrons are involved in the process and the momentum transfer is balanced by an ensembleof atoms the scattering is coherent (Rayleigh scattering). This elastic process decreases withhigher X-ray energies because its cross section includes the square of the atomic scatteringfactor f which falls off with increasing energy. The contribution of the coherent scatteringto the attenuation is negligible compared to the strong photoabsorption in the same energyrange. On the other hand, the incoherent scattering (Compton scattering) increases withincreasing X-ray energy, so that it dominates the attenuation for large values of E.Figure 2.2 shows the different contributions in some typical lens materials. Displayed isthe attenuation coefficient divided by the density of the material. This mass attenuationcoefficient µ/ρ allows a correct comparison of the attenuation processes in different materialsas a function of the X-ray energy. In figure 2.2(a) the contributions µ/ρ are plotted forberyllium. With increasing energy the total attenuation decreases since the photoabsorptionfalls off. The coherent scattering is negligible compared to the photoabsorption. At 8 keV,Compton scattering becomes more and more dominant in the total attenuation. The massattenuation coefficient of other possible materials of refractive X-ray lenses1 (Li, B, C, Si, Al,and Ni) are shown in figure 2.2(b). All total attenuation functions of the X-ray energy showthe same influence of the attenuation contributions as discussed for Be, only the curves beingbasically shifted in energy. However, aluminium, silicon and nickel show absorption edges inthe displayed energy region.The strong attenuation of hard X-rays in matter favors elements with low atomic number Zas materials for refractive lenses. Obviously, the Compton scattering ultimately limits thetransparency of refractive lenses. For this reason even the high absorbing nickel is consideredas lens material for energies above 100 keV.
Reflection: at a boundary between two media a photon has a probability of being refractedand reflected. One consequence of the index of refraction being smaller than 1 is that X-raysshow external total reflection. The critical angle at which this total reflection occurs is
θ1c =√
2δ . (2.9)
This angle is typically below 0.5. It follows that hard X-ray mirrors can only be used atgrazing incidence.
1A general discussion of lens materials is given in appendix A.

6 CHAPTER 2. OPTICS FOR HARD X-RAYS
0.1
1
10
100
1000
1 10 100
0.01
0.1
1
10
100
12 3 4 5 6 7 8
102 3 4 5 6 7 8
100
(a)
(b)
photon energy / keV
photon energy / keV
LiBe
BC
Al
Be
Ni
Si
total attenuation
photoabsorption
incoherent scattering
coherent scattering
atte
nuat
ion
/
cm2
g µ ρ
atte
nuat
ion
/
cm2
g µ ρ
Figure 2.2: The mass attenuation coefficient µ/ρ in the range of 1 keV - 100 keV for differentlens materials: (a) in Be, with the different contributions, and (b) for the possible lensmaterials Li, Be, B, C, Si, Al, and Ni. The data are taken from [4].
2.1. INTERACTION OF X-RAYS WITH MATTER 7
d sin θd sin θ
θθθ θ
dθ θ
(a)
k
k'
Q = G
d = ___2πG0
G0
(b)_ _
_
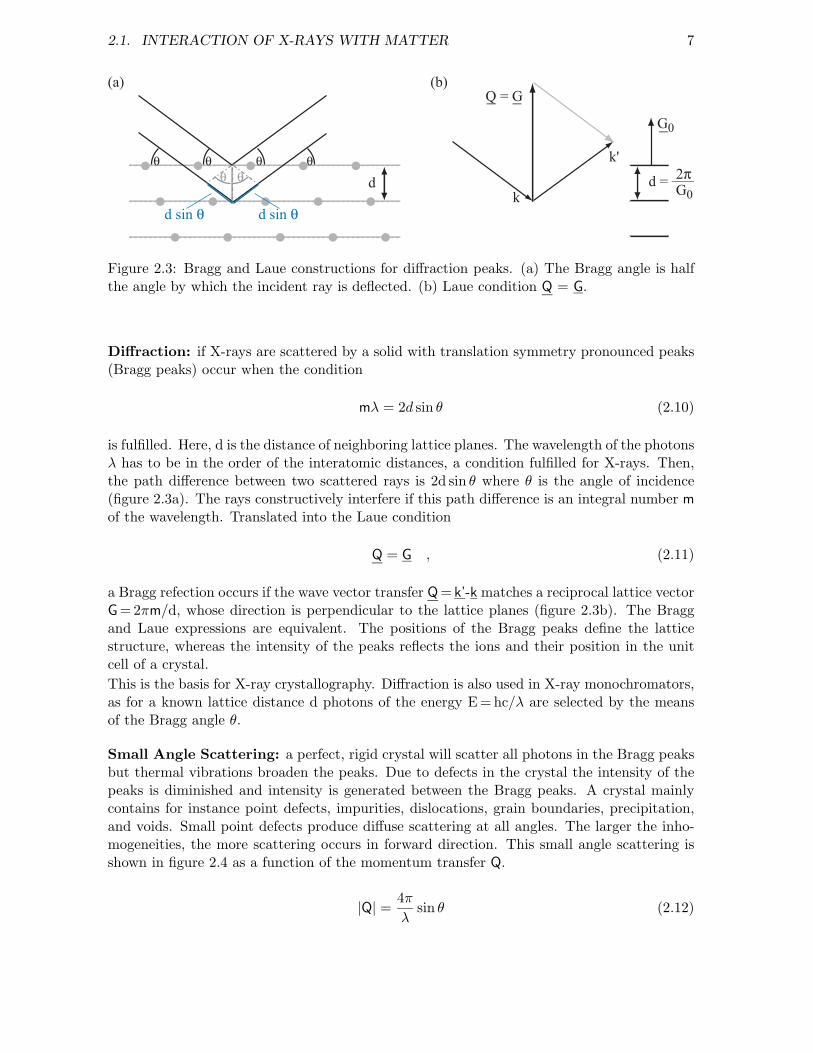
Figure 2.3: Bragg and Laue constructions for diffraction peaks. (a) The Bragg angle is halfthe angle by which the incident ray is deflected. (b) Laue condition Q = G.
Diffraction: if X-rays are scattered by a solid with translation symmetry pronounced peaks(Bragg peaks) occur when the condition
mλ = 2d sin θ (2.10)
is fulfilled. Here, d is the distance of neighboring lattice planes. The wavelength of the photonsλ has to be in the order of the interatomic distances, a condition fulfilled for X-rays. Then,the path difference between two scattered rays is 2d sin θ where θ is the angle of incidence(figure 2.3a). The rays constructively interfere if this path difference is an integral number mof the wavelength. Translated into the Laue condition
Q = G , (2.11)
a Bragg refection occurs if the wave vector transfer Q = k’-k matches a reciprocal lattice vectorG = 2πm/d, whose direction is perpendicular to the lattice planes (figure 2.3b). The Braggand Laue expressions are equivalent. The positions of the Bragg peaks define the latticestructure, whereas the intensity of the peaks reflects the ions and their position in the unitcell of a crystal.This is the basis for X-ray crystallography. Diffraction is also used in X-ray monochromators,as for a known lattice distance d photons of the energy E = hc/λ are selected by the meansof the Bragg angle θ.
Small Angle Scattering: a perfect, rigid crystal will scatter all photons in the Bragg peaksbut thermal vibrations broaden the peaks. Due to defects in the crystal the intensity of thepeaks is diminished and intensity is generated between the Bragg peaks. A crystal mainlycontains for instance point defects, impurities, dislocations, grain boundaries, precipitation,and voids. Small point defects produce diffuse scattering at all angles. The larger the inho-mogeneities, the more scattering occurs in forward direction. This small angle scattering isshown in figure 2.4 as a function of the momentum transfer Q.
|Q| =4π
λsin θ (2.12)

8 CHAPTER 2. OPTICS FOR HARD X-RAYS
101
102
103
104
105
106
inte
nsit
y
0.1 1 10 100 1000Q
Q→0Guinier
PorodBragg
Figure 2.4: Intensity as a function of the momentum transfer Q for small angle scattering.Characteristic regions include structure information of the scattering material.
The scattering cross section
dσ
dΩ=
(dσ
dΩ
)Th
·∣∣∣∣∣∣∑
j
fje−iQ·rj
∣∣∣∣∣∣2
(2.13)
can be written for N inhomogeneities with a volume V and concentration c as
dσ
dΩ=
(dσ
dΩ
)Th
· N V2 |∆ρ|2 F(Q) (2.14)
Both, the defects and the matrix in which they are embedded, are considered as homogeneous.The scattering of a single photon by a single electron is represented by the Thomson crosssection
(dσdΩ
)Th
= r20 (e1 · e2). The difference in the scattering amplitude of the matrix and
the inhomogeneities is ∆ρ = n f − nmfm. The structure factor of the inhomogeneity is
F (Q) =∣∣∣∣ 1V
∫V
d3r e−iQr
∣∣∣∣2
. (2.15)
For a spherical particle of radius R it reads
F (Q) =[3
sin QR − QR cos QR(QR)3
]2
. (2.16)
With the equations (2.14 to 2.16) the different characteristic regions in figure 2.4 can beexplained. In forward direction, when Q → 0, the structure factor becomes 1 and thereforethe small angle scattering intensity is proportional to the constant product N V.

2.2. FOCUSING OPTICS FOR HARD X-RAYS 9
If the product QR is smaller than unity (Guinier range) the structure factor can be expressedas F(Q) = exp(−1
3Q2R2G). For non-oriented defects RG is the Guinier radius defined as
RG =
√n1 + c2
n2· R , with
n1 n2 csphere 2 5 1cube 2 3 1disc 1 4 1
needle 1 12 0
. (2.17)
The Guinier radius can be found from the slope of the logarithm of the scattering cross sectionplotted versus Q2. If QR is much larger than unity (Porod range) the scattering cross sectionof inhomogeneities with a sharply defined boundary is proportional to the total surface areaof all inhomogeneities. At even larger scattering angles Bragg peaks can occur as indicatedin figure 2.4.
2.2 Focusing Optics for Hard X-Rays
A brief presentation of the most common optical devices used at 3rd generation synchrotronradiation facilities follows.
Optical elements based on total reflection
Coated and uncoated mirrors are commonly used at synchrotron radiation facilities. In orderto focus a mirror must be bent. Due to external total reflection an ellipsoid mirror focusesa point source in one focal point into the second focal point. Common mirrors have toroidshapes in the meter range to catch the beam under small angles. Significant progress in formfidelity and in surface finishing made them very common optical element for X-rays. Thecrossed geometry (KB-geometry) of two mirrors constitutes an X-ray microscope [5]. Furthermore, flat mirrors are used for eliminating higher harmonics in a beam monochromatized byBragg reflection. This is possible because the critical angle for the total reflection is lower forhigher order Bragg peaks.
Capillaries are hollow glass fibres which guide the X-rays by total reflection. A typical fiberhas an opening of ∼ 50 µm and an exit of ∼ 1 µm - 0.1 µm in diameter, which increases the fluxconsiderably. Even more intense micro beams were realized with poly-capillaries containinghundreds of individual fibres [6]. They are often used with X-ray tubes. For high energyX-rays (60 keV) lead glass capillaries have been used since they have a larger angle of totalreflection [7].
Optical elements based on diffraction
Bragg reflection from crystals and multilayers is based on total reflection at lattice planes.However, the angle of total reflection is much larger than for mirrors. Crystals are used forsynchrotron radiation monochromators, mainly as flat or bent double crystals. Multi-layersare artificial periodic structures. Both can focus a beam, in particular when implemented inKB-geometry.
Fresnel zone plates (FZP) were developed in 1974 [8]. They consist of concentric rings designedin a way that the transmitted radiation is interfering constructively in the focal point. With

10 CHAPTER 2. OPTICS FOR HARD X-RAYS
higher energies the absorbing zones, which block the part of the beam that would destructivelyinterfere, must become extremely thick. At the same time, their spacing gets narrower,considering their radius dependence on the wavelength λ as rn =
√nλz with the distance
between object and detector. The spatial resolution is limited by the width of the first zone√λz. Therefore, the performance of FZP is limited by manufacturing zones with a high aspect
ratio.Efforts were made to operate FZP at higher energies. For that purpose, two zone plates werealigned to enhance the focusing effect [9]. By the same token multi-layer Fresnel zone plateswere fabricated to operate in the energy regime from 25 keV - 100 keV [10]. Furthermore,phase FZP with multi levels zones were used to improve the efficiency [11].
2.3 Parabolic Refractive Lenses as Hard X-Ray Optic
Refractive lenses are a novel optical component for hard X-rays. They can be used above 5 keVwhere Fresnel zone plates become more and more inefficient. Unlike KB mirrors lenses havea straight optical path. In contrast to capillaries refractive lenses are designed for imaging,even up to high energies, like 120 keV.
2.3.1 Historical Note
X-rays were discovered in 1895 by W. C. Rontgen [12]. During the first experiments with X-rays, Rontgen has tried to focus them and found no visible effect. He was able to determine arefraction index below 1.05 for all analyzed materials and stated ’That with lenses one cannotconcentrate X-rays.’ The first observation of X-ray refraction was made by C. G. Barkla 1916[13]. However, the value of the index of the refraction decrement δ were known not until1948. Then P. Kirkpatrick and A. V. Baez discussed the possibilities of refractive lenses as ’acumbersome and very weak system with poor transparency’ [5]. They decided to use anothermethod and implemented in a very successful way mirrors as optical elements for X-rays.In the early 1990’s the controversial discussion was continued [14, 15]. For the first time, in1993, B. X. Yang theoretically introduced a parabolic design for refractive hard X-ray lenses[16]. Still, he proposed Fresnel lenses as ’superior focusing elements for hard X-rays’, becauseof the fabrication difficulties for useful refractive lenses. The first refractive lenses for hardX-rays were reported 1996 [17]. The lenses were drilled holes, with a radius of 300µm, in bulkaluminium with cylindrical or cross-cylindrical geometry. At 14 keV a spot size of 8µm wasmeasured. A patent on spherical refractive X-ray lenses was claimed by Tomie [18, 19, 20],in which the possibility to align many single refractive lenses was still precluded.Experiments with stacked single parabolic refractive lenses were presented in 1999 [21], whichdiscussed the optical properties of the lenses. The imaging abilities, even for hidden struc-tures, were demonstrated with crossed gold meshes. Later, tomographic and microprobingapplications were implemented [22, 23]. Beryllium parabolic refractive lenses were first man-ufactured in 2001 [24]. The concept of special refractive lenses for extreme nanofocusing hasbeen the newest approach since 2003. The prototype of planar silicon parabolic refractivelenses is described in [25].

2.3. PARABOLIC REFRACTIVE LENSES AS HARD X-RAY OPTIC 11
R
d
2R0
(1a) Single rotational parabolic lens
(1b) Stack of rotational parabolic lenses
D
(2b) Planar lens with many single parabolic lenses
l
0.05 mm
1 mm
d 2R0
t
(2a) Single planar parabolic lens
R
D2 D1
Figure 2.5: Sketch of types of parabolic refractive lenses.(1) Rotational parabolic refractive lenses. Single lenses (a) with two pressed concaveparaboloids aligned in one stack (b).(2) Planar parabolic refractive lenses. Etched in one wafer, smaller parabolic single structures(a) can be implemented. The positioning of many lenses is included in the manufacturing.
2.3.2 Design
The microanalysis experiments presented in this thesis are based on parabolic refractive lensesfor hard X-rays. Two types of lenses were designed and are under further development. Thesketch in figure 2.5 illustrates their appearance. In both designs the lenses have a parabolicshape. In the following, such a profile is defined by the radius R at the apex of the parabola.Each single lens has two concave parabolic surfaces with a minimal distance d between eachother. The slight focusing effect due to the weak refraction of hard X-rays of one lens iscompensated by stacking many lenses in a row.The first type of lenses 2.5(1) is realized in aluminium and beryllium. These lenses arerotationally parabolic. A high precision CNC lathe allows for the manufacturing of pressingtools for these lenses with parabolic radii R between 80 µm and 300µm. Apertures between2R0 = 850 µm and 1.2 mm can be achieved. For stacking the lenses a specially designed holderis used to perform an alignment with an accuracy of few micrometer.The second type of parabolic refractive lenses is planar, figure 2.5(2). Using silicon microma-chining, shapes of lenses with parabolic radii R of 1µm - 3 µm were manufactured. Typically,a single lens is placed on a field D1×D2 of 41µm× 82 µm. The depth t should be equal totheir maximal aperture of 2R0 36 µm. The manufacturing allows the use of one siliconwafer for a high number of single lenses figure 2.5(2b). Reasons for the different designs will

12 CHAPTER 2. OPTICS FOR HARD X-RAYS
be given in the next chapters. Obviously, the rotationally parabolic refractive lenses providea point focus and a high quality imaging optic, whereas the planar lenses generate a thin linefocus.
2.3.3 Principal Geometries
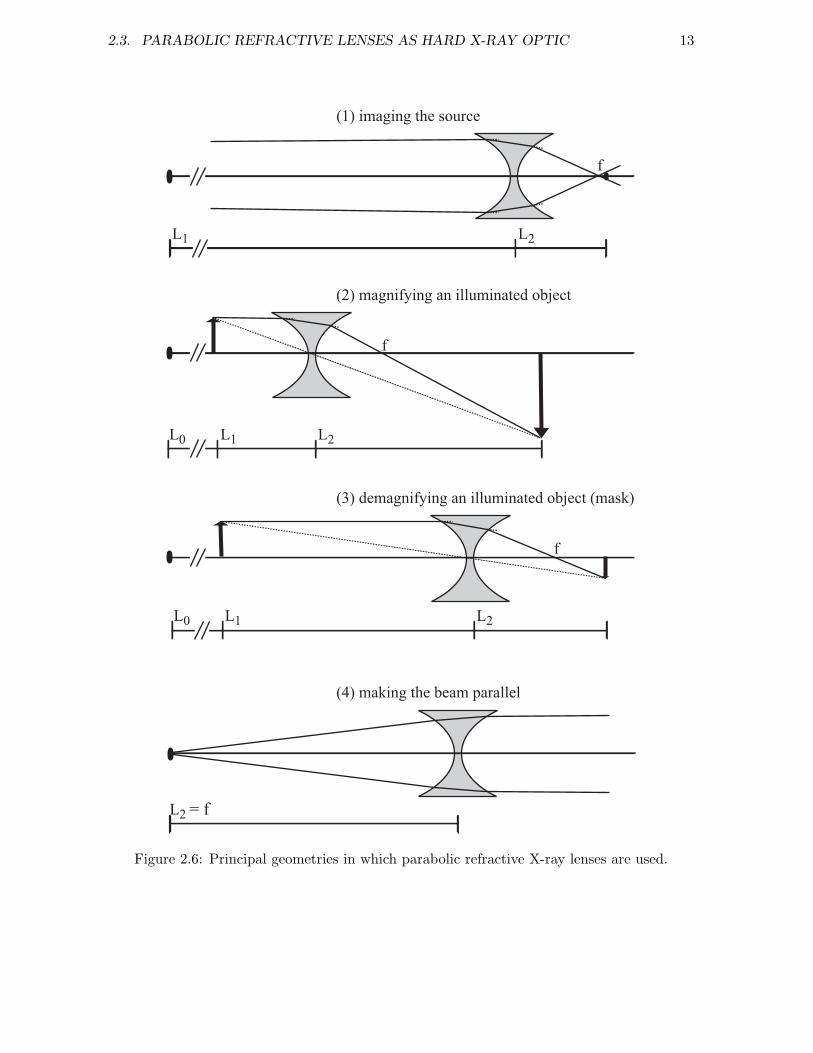
Parabolic refractive lenses for hard X-ray generate a straight optical path. The optical ge-ometries are similar to the optics of visible light using glass lenses. In figure 2.6(1)-(4) areillustrated the main application schemes. The stack of lenses is symbolically represented bytwo parabolic shapes.(1) First, an analytical microprobe is realized if the synchrotron radiation source itself isimaged by the refractive lenses. The distance source-lens L1 is chosen long, normally between30 m and 70 m. Many single refractive lenses are used in order to shorten the focal length fin a strongly demagnifying mode. Photons of the beam are focused to a small intense spotat the image distance L2 which defines the spatial resolution in scanning analytical methods.In an imaging setup an object is illuminated by the source. Usually the length L0 is given bythe beamline design. (2) The second geometry illustrates that a short focal length f and along image-distance L2 lead to a strong magnification of the sample. This is the concept fora hard X-ray microscope. (3) On the other hand, a short focal length f and a long distancebetween the object and the lens L1 allow a demagnification of the sample, e. g. a mask forX-ray lithography, which is shown in the third geometry.(4) Finally, in the forth geometry a few single lenses can generate an X-ray beam with muchless divergence than without the refractive lenses. Therefore, the objective must be locatedapproximately in a distance of its focal length from the source. Such a geometry is helpfulfor example in small angle scattering experiments.
2.3. PARABOLIC REFRACTIVE LENSES AS HARD X-RAY OPTIC 13
L0 L2L1
f
f
L0 L2L1
L2 = f
f
L2L1
(1) imaging the source
(2) magnifying an illuminated object
(3) demagnifying an illuminated object (mask)
(4) making the beam parallel
Figure 2.6: Principal geometries in which parabolic refractive X-ray lenses are used.

14 CHAPTER 2. OPTICS FOR HARD X-RAYS

Chapter 3
Parabolic Refractive Lenses:Properties
3.1 Parabolic Shape
The shape of refractive lenses is of utmost importance. Classical optics in the Gaussianapproximation are based upon the assumption that the incident angle Θ to the surface normalis small enough for the approximation Θ ≈ sinΘ ≈ tanΘ to be valid. Linearizing requiresthat all refracting surfaces are almost normal to the optical axis. This requires radii R of thelenses large compared to the geometrical aperture 2R0. This assumption is not valid for hardX-ray lenses.
R
R0
R
R0
(1) spherical shape
(2) parabolic shape
Figure 3.1: The compensation of spherical aberration by a parabolic lens shape. (1) A bundleof rays entering a spherical lens parallel to the optical axis does not meet in one point. (2)For a parabolic shape the refraction of outer rays is weaker. All rays meet in the focal spot.
15
16 CHAPTER 3. PARABOLIC REFRACTIVE LENSES: PROPERTIES
The radii of refractive lenses are in the range of 1µm - 500 µm and are comparable to theapertures of 10µm - 1.4 mm. Figure 3.1(1) demonstrates the origin of spherical aberration, ifthe Gaussian approximation is not fulfilled. Rays which enter the lens far from the center arestronger refracted than rays which are close to the optical axis. A parabolic shape like figure3.1(2) compensates for this. A bundle of rays entering a parabolic lens parallel to the opticalaxis is focused on the focal spot in excellent approximation.
(a) (b)
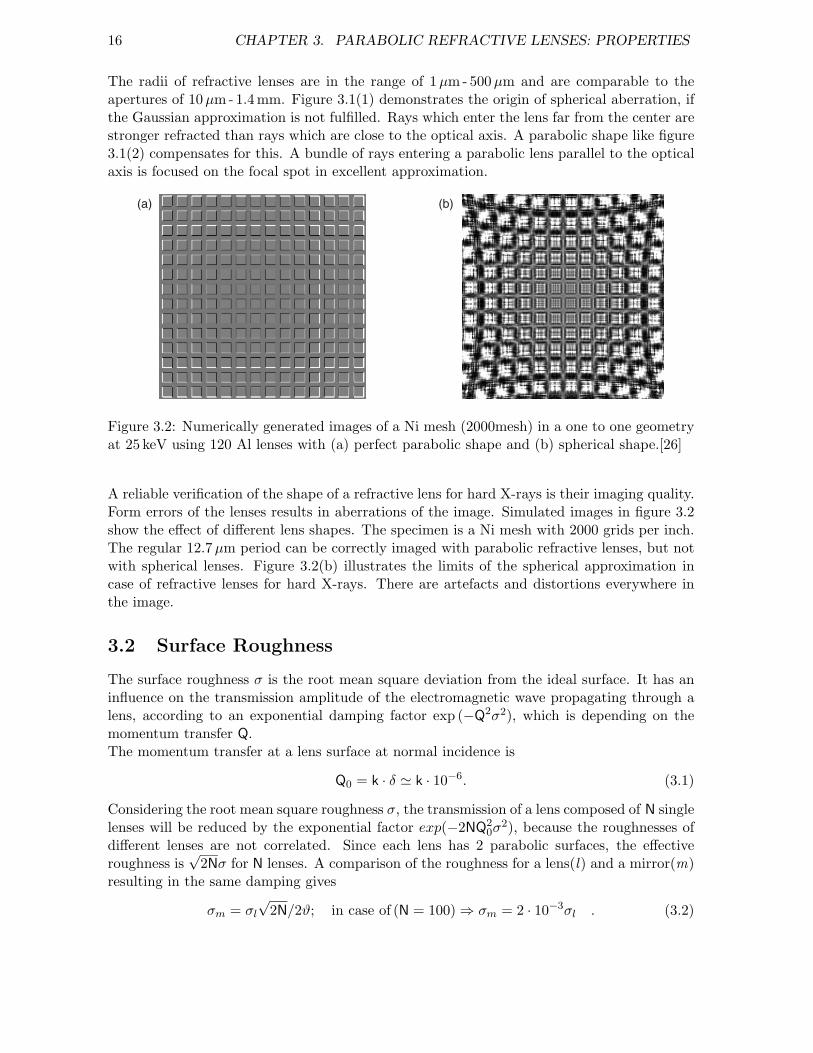
Figure 3.2: Numerically generated images of a Ni mesh (2000mesh) in a one to one geometryat 25 keV using 120 Al lenses with (a) perfect parabolic shape and (b) spherical shape.[26]
A reliable verification of the shape of a refractive lens for hard X-rays is their imaging quality.Form errors of the lenses results in aberrations of the image. Simulated images in figure 3.2show the effect of different lens shapes. The specimen is a Ni mesh with 2000 grids per inch.The regular 12.7µm period can be correctly imaged with parabolic refractive lenses, but notwith spherical lenses. Figure 3.2(b) illustrates the limits of the spherical approximation incase of refractive lenses for hard X-rays. There are artefacts and distortions everywhere inthe image.
3.2 Surface Roughness
The surface roughness σ is the root mean square deviation from the ideal surface. It has aninfluence on the transmission amplitude of the electromagnetic wave propagating through alens, according to an exponential damping factor exp (−Q2σ2), which is depending on themomentum transfer Q.The momentum transfer at a lens surface at normal incidence is
Q0 = k · δ k · 10−6. (3.1)
Considering the root mean square roughness σ, the transmission of a lens composed of N singlelenses will be reduced by the exponential factor exp(−2NQ2
0σ2), because the roughnesses of
different lenses are not correlated. Since each lens has 2 parabolic surfaces, the effectiveroughness is
√2Nσ for N lenses. A comparison of the roughness for a lens(l) and a mirror(m)
resulting in the same damping gives
σm = σl
√2N/2ϑ; in case of (N = 100) ⇒ σm = 2 · 10−3σl . (3.2)

3.3. FOCAL LENGTH 17
Q
k k'
Qk k'
lens
mirror
Figure 3.3: Momentum transfer in case of a mirror and of a lens.
The incident angle ϑ for totally reflecting mirrors is about ϑ = 0.2. Refractive lenses areless sensitive to surface roughness by 3 orders of magnitude compared to mirrors. This is aconsequence of the higher momentum transfer for a mirror compared to a refractive lens, asdemonstrated in figure 3.3.The weak sensitivity to roughness is important for manufacturing refractive lenses. For arotational lens with a radius R 200 µm a roughness smaller than 1µm rms barely deterioratesthe lens performance if the shape is still parabolic. Considering the smaller dimensions of aplanar lens, the roughness has to be below 100 nm.
3.3 Focal Length
For a concave thin lens with parabolic radius R on both sides the focal length f0 is
f0 =R
2Nδ· [1 + O(δ)]. (3.3)
The focal length is proportional to the parabolic radius R and can be reduced by increasingthe number of lenses N [21]. The energy dependence of the focal length (chromatic aberration)is hidden in the index of refraction decrement δ introduced in equation (2.3).The focal length f0 for parabolic refractive lenses uses the thin lens approximation [27]. Thisassumption is no longer justified for the short focal distances achieved recently [23]. Thepropagation of a ray through an axially symmetric system of lenses is described by a transfermatrix formalism [2]. A ray is characterized as its distance y from the optical axis and its slopewith respect to the optical axis, the inclination Θ. A matrix T01 describes the propagationfrom the initial position (y0,Θ0) to a final position (y1,Θ1):
T01
(y0
Θ0
)=
(y1
Θ1
).
Each single lens has the focal distance fs = R/2δ. This is expressed by the transfer matrix forthe refraction Tfs . Two single lenses are separated by ∆l which leads to the transfer matrix
18 CHAPTER 3. PARABOLIC REFRACTIVE LENSES: PROPERTIES
for the translation T∆l :
Tfs =[
1 − 1fs
0 1
]and T∆l =
[1 0∆l 1
].
Considering the lens setup, the ordered product
T01 = T∆l/2 (TfsT∆l)N−1 TfsT∆l/2
defines the propagation and refraction through a system of N lenses. The minimal situationwith only one lens correctly gives fs as result. Additional lenses displace the focus to a longerdistance than in the uncorrected case. With the overall length of the lens l one obtain for thefocal distance approximately [23]
f f0 +l
6. (3.4)
3.4 Transmission and Gain
Little absorption is a criterion of high priority and the mayor reason for beryllium as lensmaterial. But refraction and transmission are largely contradictory requirements. The gainis the appropriate quality parameter.
The transmission T through the geometrical aperture of a rotational parabolic refractive lensis
T =R
µNR20
(1 − e−µNR20/R) · e−µNd (3.5)
=1
(µ/δ)·(2f − l
3
)R2
0
·(1 − e−(µ/δ)·R2
0/(2f− l3))· e−(µ/δ)·R d/(2f− l
3) (3.6)
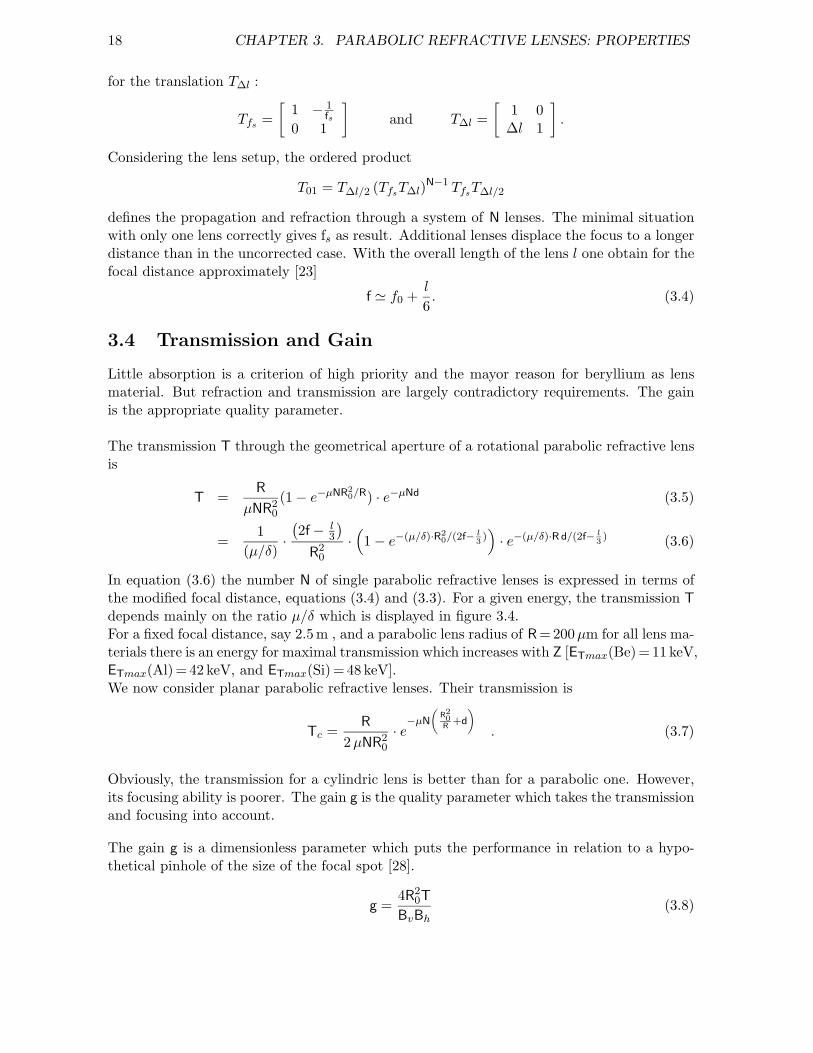
In equation (3.6) the number N of single parabolic refractive lenses is expressed in terms ofthe modified focal distance, equations (3.4) and (3.3). For a given energy, the transmission Tdepends mainly on the ratio µ/δ which is displayed in figure 3.4.For a fixed focal distance, say 2.5 m , and a parabolic lens radius of R = 200 µm for all lens ma-terials there is an energy for maximal transmission which increases with Z [ETmax(Be) = 11 keV,ETmax(Al) = 42 keV, and ETmax(Si) = 48 keV].We now consider planar parabolic refractive lenses. Their transmission is
Tc =R
2 µNR20
· e−µN
(R20R
+d
). (3.7)
Obviously, the transmission for a cylindric lens is better than for a parabolic one. However,its focusing ability is poorer. The gain g is the quality parameter which takes the transmissionand focusing into account.
The gain g is a dimensionless parameter which puts the performance in relation to a hypo-thetical pinhole of the size of the focal spot [28].
g =4R2
0T
BvBh(3.8)
3.4. TRANSMISSION AND GAIN 19
30
25
20
15
10
5
0
(µ /
δ)
/ m
-1 x
106
20018016014012010080604020energy / keV
Be Al Si
Figure 3.4: The variation of (µ/δ) with the photon energy for the lens materials Be, Al, andSi. This parameter is mainly responsible for the transmission of X-rays through a refractivelens.
The focusing performance of the optical element is described by the size of the image. Thisfocal spot (Bv × Bh) is the image of the elliptical shape of a synchrotron radiation source.Gains up to more than 10 000 can be achieved.
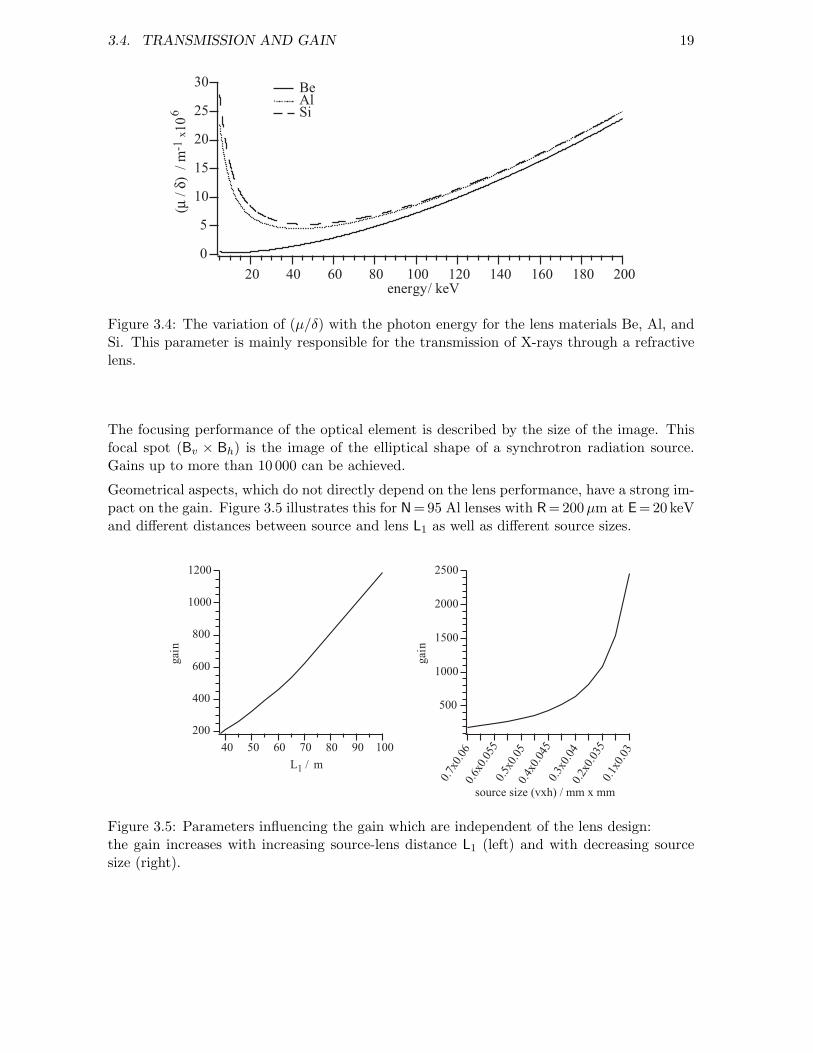
Geometrical aspects, which do not directly depend on the lens performance, have a strong im-pact on the gain. Figure 3.5 illustrates this for N = 95 Al lenses with R = 200 µm at E = 20 keVand different distances between source and lens L1 as well as different source sizes.
1200
1000
800
600
400
200
gain
100908070605040
L1 / m
2500
2000
1500
1000
500
gain
0.7x
0.06
0.6x
0.05
50.
5x0.
050.
4x0.
045
0.3x
0.04
0.2x
0.03
50.
1x0.
03
source size (vxh) / mm x mm
Figure 3.5: Parameters influencing the gain which are independent of the lens design:the gain increases with increasing source-lens distance L1 (left) and with decreasing sourcesize (right).

20 CHAPTER 3. PARABOLIC REFRACTIVE LENSES: PROPERTIES
3.5 Effective and Numerical Aperture
The absorption of X-rays is not negligible for refractive lenses. Therefore, the geometricalaperture 2R0 is larger than the effective aperture Deff
Deff =
√2R
µN. (3.9)
The numerical aperture N.A. is
N.A. =Deff
2L1. (3.10)
The object-lens distance L1 in imaging setups is of the order of 1 m and Deff is about 0.5 mm.This results in a small numerical aperture of order 10−4 to 10−3.
3.6 Depth of Field and Depth of Focus
The depth of field dl is defined as the distance of two object points along the optical axiswhich can be correctly immaged.
dl =8π
λL1
D2eff
=2π
λ
(N.A.)2(3.11)
The low values of N.A. make dl large. For tomography this is very advantageous. A microbeamgenerated by refractive lenses has a large depth of focus DoF [23] which is defined as the beamlength where the lateral beam size is smaller than
√2 Bv,h.
DoF =4 Bv,h
2√
2 ln(2)· L2
Deff(3.12)
Samples of millimeter size can be analyzed because the probing beam has the same sizethroughout the whole sample.
3.7 Resolution
The transversal resolution dt is very important in imaging. It is the distance of two lateralpoints of the object whose image points are separated by the FWHM of each image.
dt =2√
2ln(2)π
· λL1
Deff(3.13)
= 0.75 · λ
2 N.A.(3.14)
The value is dominated by the small numerical aperture of refractive lenses which is due tothe high attenuation of X-rays in the lens materials. But dt depends only linearly on N.A. incontrast to the longitudinal resolution dl which contains the square of N.A.Equation (3.13) is valid for incoherent illumination. A coherent illumination deteriorates theresolution due to the amplitude interferences of neighboring parts of the image: dcoh
t =√
2dincoht
for parabolic refractive lenses [21, 29].

3.8. CHROMATIC ABERRATION 21
3.8 Chromatic Aberration
In many cases parabolic refractive lenses are used with monochromatic radiation. The desiredfocal length for one specific energy is adjusted by the lens material, the number of single lenses,and/or their radius of curvature. But there are some applications for which monochromaticradiation is not adequate. For example, a wider energy bandwidth results in more flux.Al refractive lenses were already used for such a ’pink beam’ [23]. An other example isthe element specific analysis of the absorption fine structure for which the energy has to betunable (chapter 5). The energy dependence of the focal distance of parabolic refractive lenseswas shown above, equations (2.3) and (3.3). It is apparent that refractive lenses suffer fromchromatic aberration. With equation (2.3) the change of the index of refraction decrement∆δ can be calculated.
∆δ = − 12π
NAr02h2c2
E3 · Z + f ′
A· ∆E = −2 δ(E0)
E0∆E (3.15)
This can be translated into a change of the focal distance. Assuming the thin lens approxi-mation,
∆f = − R
2Nδ2·(−2δ
E0
)· ∆E = 2f0 · ∆E
E0. (3.16)
In case of a pink beam the band width ∆E/E is typically 1% resulting in a flux gain of100 in comparison to a typical monochromatic beam at an undulator source with an energyresolution of ∆E/E = 10−4. The chromatic aberration will be noticed when the change infocal distance, translated into a change in image distance, is larger than the depth of focusin a microprobing experiment. For instance in a microfocus setup using a pink beam thechromatic aberration is negligible [23], however for the analysis of absorption fine structuresit is not (details in chapter 6).The chromatic aberration of refractive lenses limits the experimental possibilities of someapplications. In the optics of visible light the problem of chromatical aberration can be solvedby an achromate. Therefore, two lenses with different optical parameters are combined tocompensate the chromatical aberrations of each other. This is achieved by using differentindices of refraction and different variation of the index with energy. However, this conditioncannot be realized for X-rays as shown in figure 3.6. Illustrated is this for the lens materialsLi, Be, B , Al, Si, Ni and as high Z example for Pt. Whereas the absolute values of δ differfor the materials the slopes of the curves are the same. If the values are corrected due tothe density of the elements, there are only slight differences (figure 3.6right). To sum up, anachromate lens system, which is common for visible light, is not realizable for hard X-rays.It would be possible to move the lens along the optical axis to hold the focal spot on placeduring tuning the energy. Such an implementation demands extreme requirements for thelateral stage movements in terms of accuracy and velocity. The necessary efforts wouldimplicit a permanent installation at one beamline. A defined changing of single lenses wouldbe a second possible approach. Rotational Al or Be lenses with different but defined parabolicradii R are beyond our manufacturing abilities, today. In case of planar lenses this can beaccomplished. But again, only a permanent installation can legitimate such efforts.

22 CHAPTER 3. PARABOLIC REFRACTIVE LENSES: PROPERTIES
δ
10-9
10-8
10-7
10-6
10-5
10-4
4 6 810
20 40 60100
200
energy / keV
Al
Be B
Li
Ni Pt
Si
δ/ρ
[c
m3 /
g]
10-9
10-8
10-7
10-6
10-5
4 6 810
20 40 60100
200
energy / keV
Al
Be B
Li
Ni Pt
Si
Figure 3.6: The index of refraction decrement δ at different energies for common materials.(Left) The values of δ for the lens materials (Li, Be, B, Al, Si, Ni) and Pt, as examplefor a high Z element, in the hard X-ray region (4 keV - 250 keV). (Right) The mass index ofrefraction decrement δ/ρ for the same materials.
3.9 Example: Imaging a Synchrotron Radiation Source in aTypical Geometry.
As an example we consider now a microbeam setup to image a synchrotron radiation sourceon a sample which can be used as micro probe (figure 2.6). A common lens material isaluminium.
material aluminium Z = 13density = 2.7 g/cm3
atomic mass A = 26.98 g/mol
The microbeam setup presented here can be used for fluorescence analysis, which requiresan incident beam of typically E = 20 keV. The first experiments with parabolic refractive Allenses were done with the undulator source of the beamline ID22 at the European SynchrotronRadiation Facility, ESRF.
synchrotron source ESRF/ID22 undulatorsource size horizontal 700µm
vertical 60 µmdivergence horizontal 30µrad
vertical 30 µrad
3.9. EXAMPLE EXPERIMENT 23
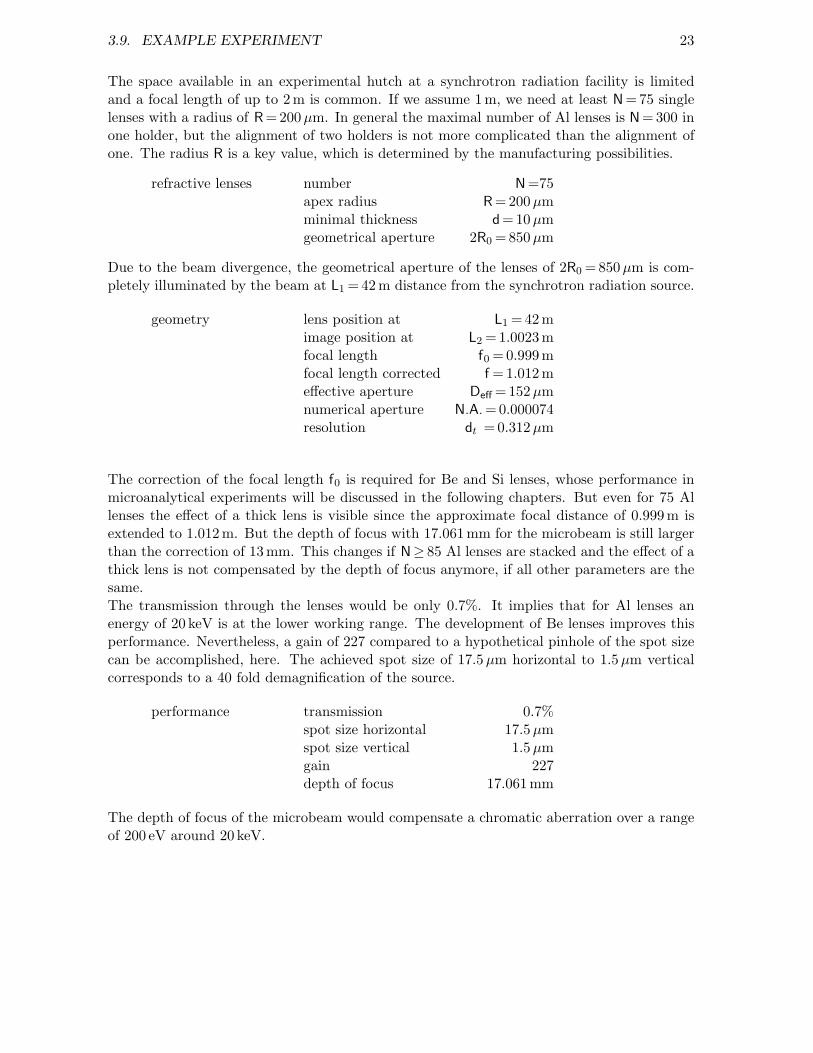
The space available in an experimental hutch at a synchrotron radiation facility is limitedand a focal length of up to 2 m is common. If we assume 1 m, we need at least N = 75 singlelenses with a radius of R = 200 µm. In general the maximal number of Al lenses is N = 300 inone holder, but the alignment of two holders is not more complicated than the alignment ofone. The radius R is a key value, which is determined by the manufacturing possibilities.
refractive lenses number N =75apex radius R = 200 µmminimal thickness d = 10 µmgeometrical aperture 2R0 = 850 µm
Due to the beam divergence, the geometrical aperture of the lenses of 2R0 = 850 µm is com-pletely illuminated by the beam at L1 = 42 m distance from the synchrotron radiation source.
geometry lens position at L1 = 42 mimage position at L2 = 1.0023 mfocal length f0 = 0.999 mfocal length corrected f = 1.012 meffective aperture Deff = 152 µmnumerical aperture N.A.= 0.000074resolution dt = 0.312µm
The correction of the focal length f0 is required for Be and Si lenses, whose performance inmicroanalytical experiments will be discussed in the following chapters. But even for 75 Allenses the effect of a thick lens is visible since the approximate focal distance of 0.999 m isextended to 1.012 m. But the depth of focus with 17.061 mm for the microbeam is still largerthan the correction of 13 mm. This changes if N≥ 85 Al lenses are stacked and the effect of athick lens is not compensated by the depth of focus anymore, if all other parameters are thesame.The transmission through the lenses would be only 0.7%. It implies that for Al lenses anenergy of 20 keV is at the lower working range. The development of Be lenses improves thisperformance. Nevertheless, a gain of 227 compared to a hypothetical pinhole of the spot sizecan be accomplished, here. The achieved spot size of 17.5 µm horizontal to 1.5µm verticalcorresponds to a 40 fold demagnification of the source.
performance transmission 0.7%spot size horizontal 17.5µmspot size vertical 1.5 µmgain 227depth of focus 17.061 mm
The depth of focus of the microbeam would compensate a chromatic aberration over a rangeof 200 eV around 20 keV.

24 CHAPTER 3. PARABOLIC REFRACTIVE LENSES: PROPERTIES

Chapter 4
Beryllium Parabolic X-Ray Lenses:Properties and Performance
For hard X-ray microscopy and microanalysis, aluminium lenses have given good results whichare in remarkable agreement with their expected theoretical performance. But these opticscannot be used below 18 keV due to a low transmission of 1 % and smaller. In chapter 2.1 themass absorption coefficient µ/ρ was considered to illustrate the influence of photoabsorptionand scattering inside the lens material. The plot of the mass absorption coefficient for differentmaterials versus the energy in figure 2.2 favors materials with low atomic number Z. The solidwith the lowest attenuation is lithium, but its high reactivity makes lenses of Li hard to handleand its low density results in a weak refraction. Therefore, efforts were made to manufactureparabolic refractive lenses from beryllium in order to improve the microanalysis with parabolicrefractive lenses with hard X-rays, figure 4.1. This chapter discusses in detail the reasons forthis choice of lens material and demonstrates the improvements which can be expected. Theapplications, which benefits of refractive Be lenses, will be discussed in the next chapters.
Be lens
inert gas
Pd-pinholes
Cu sheet
spacer
Figure 4.1: Lens holder with Be lenses and additional assembling features.
25
26 CHAPTER 4. BERYLLIUM LENSES: PROPERTIES AND PERFORMANCE
4.1 Improvements due to Beryllium
In the following, the properties of refractive beryllium lenses are discussed. Calculations andexperimental results are compared with aluminium lenses.
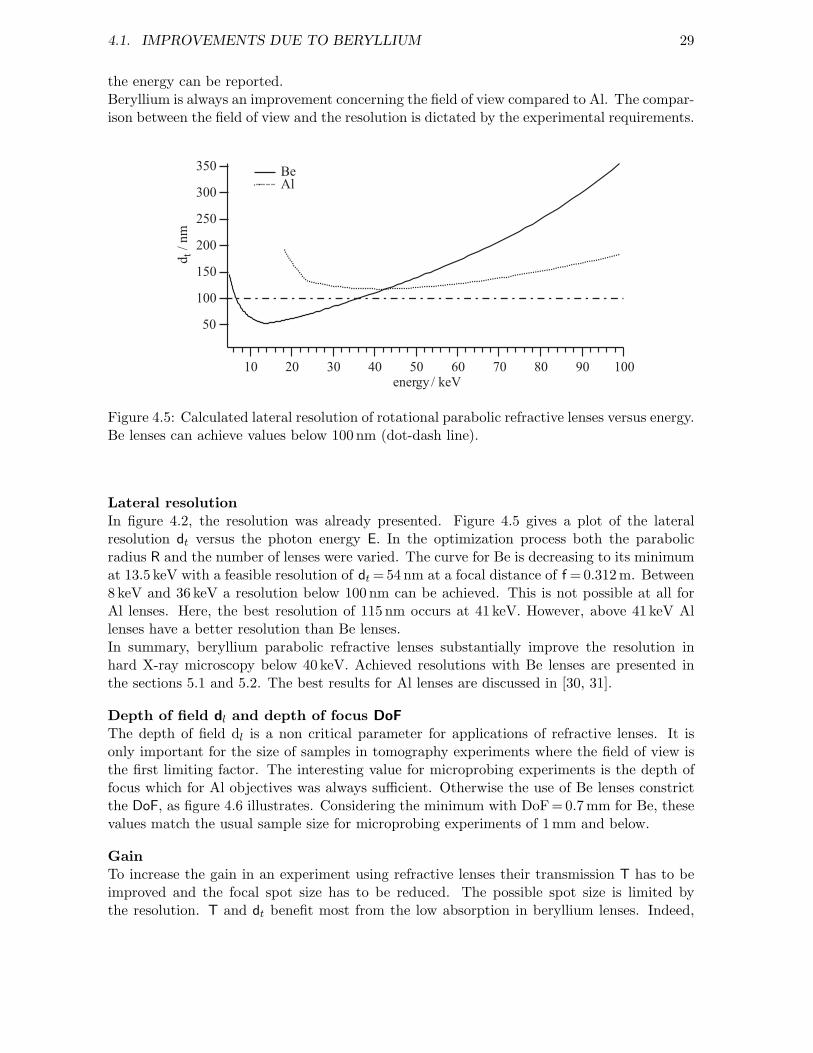
TransmissionBeryllium is the best candidate to improve the transmission of parabolic refractive lenses dueto its low atomic number Z = 4. Table 4.1 gives some values for the transmission through Aland Be lenses for different energies. Regarding the energy dependence of the mass absorp-tion coefficient µ/ρ a good working energy for Al lenses is ∼40 keV whereas for Be lenses itis ∼12 keV. Nevertheless, both materials can be used at 20 keV. It is evident that the per-formance of both lens materials is similar at their best working energies. The decrease oftransmission with a higher number N of single lenses is stronger in case of Al lenses. Inparticular, at 20 keV the different increase of attenuation is evident. In case of 100 single Allenses the transmission is below 0.5%, whereas for Be lenses this value is still above 10 %.
Table 4.1: Exemplar transmission values for objectives build of parabolic refractive lenses.The lens materials aluminium and beryllium are compared.
Al at 40 keV Al at 20 keV Be at 20 keV Be at 12 keVN = 1 92.7 % 65 % 96.7% 93.6 %
10 50.8 % 10 % 72.5% 55.2 %50 12.2 % 1.4 % 27.9% 14.1 %
100 5.7 % 0.4 % 13.8% 6.4 %150 3.51 % 0.18 % 8.8% 3.9 %185 7 % 3 %300 0.014 % 0.023 %
It has to be mentioned, that even for the worst listed transmission it is possible to performmicroanalysis experiments with parabolic refractive lenses at 3rd generation synchrotron ra-diation facilities.
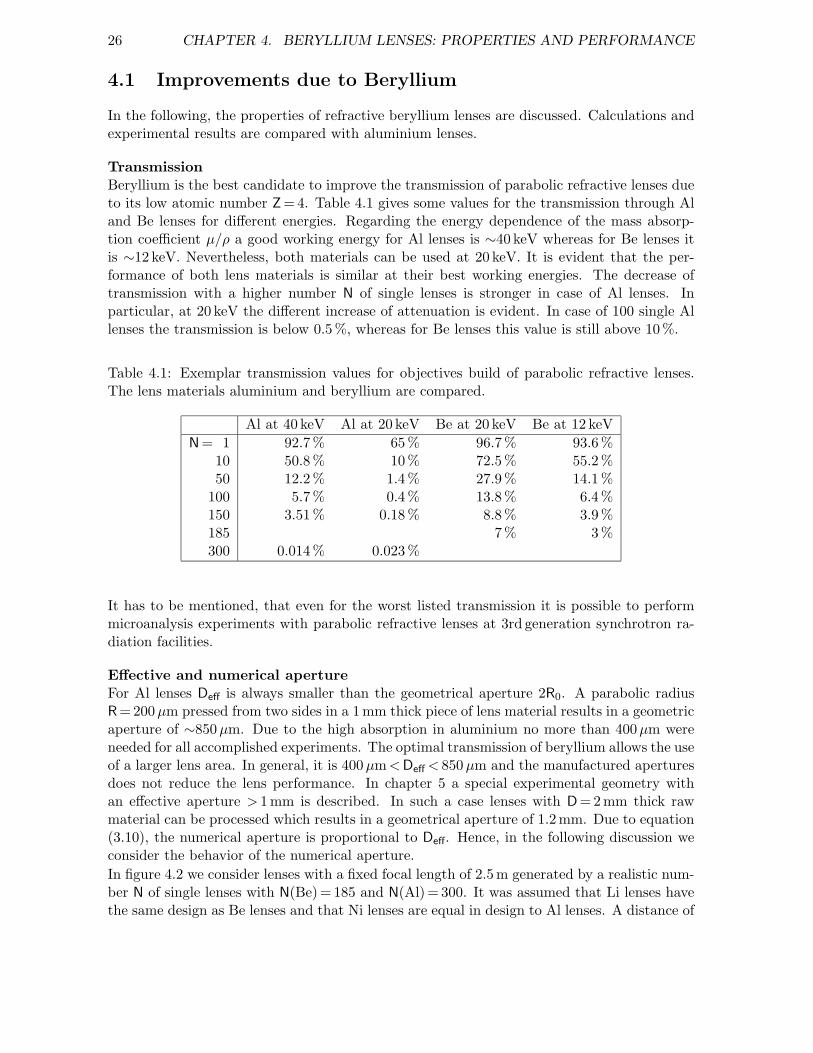
Effective and numerical apertureFor Al lenses Deff is always smaller than the geometrical aperture 2R0. A parabolic radiusR = 200 µm pressed from two sides in a 1 mm thick piece of lens material results in a geometricaperture of ∼850 µm. Due to the high absorption in aluminium no more than 400µm wereneeded for all accomplished experiments. The optimal transmission of beryllium allows the useof a larger lens area. In general, it is 400µm < Deff < 850 µm and the manufactured aperturesdoes not reduce the lens performance. In chapter 5 a special experimental geometry withan effective aperture > 1 mm is described. In such a case lenses with D =2 mm thick rawmaterial can be processed which results in a geometrical aperture of 1.2mm. Due to equation(3.10), the numerical aperture is proportional to Deff. Hence, in the following discussion weconsider the behavior of the numerical aperture.In figure 4.2 we consider lenses with a fixed focal length of 2.5 m generated by a realistic num-ber N of single lenses with N(Be) = 185 and N(Al) = 300. It was assumed that Li lenses havethe same design as Be lenses and that Ni lenses are equal in design to Al lenses. A distance of
4.1. IMPROVEMENTS DUE TO BERYLLIUM 27
40 m from the source L1 was chosen. With these parameters the numerical apertures versusthe energy was calculated, figure 4.2(left). For Be the maximal N.A. occurs at 11 keV. At thispoint, the value is 5.6 times larger than the numerical aperture of Al lenses and 16.6 timeslarger than of Ni lenses.
0.25
0.20
0.15
0.10
0.05
0.00
N.A
. / 1
0-3
12 4 6 8
102 4 6 8
100energy / keV
Be Al Ni
Li
0.1
2
4681
2
46810
d t /
µm
4 5 6 10 2 3 4 5 6 100energy / keV
Be Al Ni
Li
Figure 4.2: For the fixed focal length of 2.5 m, the calculated numerical aperture N.A. and thelateral resolution dt is plotted versus X-ray energies. The values for Be are compared withthose of Al, Li or Ni.
Equation (3.13) gives the lateral resolution dt in terms of the N.A. Likewise, in figure 4.2(right)the results for N.A. are transferred into values of the resolution. In this context the benefitsof Li are no longer important. Indeed, each value of dt for Li can be reached with Be lenses,too, just by increasing the energy by less than 1 keV. All presented types of lenses can reacha resolution dt below 200 nm. In particular, this is true for energies higher than 9.7 keV incase of Li, >11.8 keV for Be, >41.4 keV for Al, and >92.1 keV for Ni.Both, the numerical apertures and the resolution in figure 4.2, indicate a more general aspectfor refractive lenses. Be lenses are an improvement, but only for energies up to ∼40 keV.Above, the handling in number and the overall length of the lens system make Al lenses morefavorable and for the highest energies even Ni lenses should be considered.
Field of view, FoVThe field of view is an essential parameter for all imaging purposes. The pronounced lowdivergence of synchrotron radiation makes the effective aperture Deff an appropriate parameterfor the FoV. For the experiments in figure 4.3(a) and (b) Al and Be were used, respectively.Each experimental setup was optimized for the used lens material, resulting in an effectiveapertures at 162 µm for Al lenses and 463µm for Be lenses, but the measured field of viewswere lower (FoVAl
∼= 130 µm and FoVBe∼= 450 µm). Hence, the scattering and absorption
within the lenses need to be improved further on.The field of view of Be lenses is larger by a factor 3.5 compared to the value for Al lenses.The Be lenses reached 97 % of its effective aperture. So the estimated improvements in thefield of view due to Be are similar to the improvement of the effective apertures in figure 4.4.

28 CHAPTER 4. BERYLLIUM LENSES: PROPERTIES AND PERFORMANCE
(a)
(b)
50 µm
Figure 4.3: Measured field of view for (a)Al and (b)Be parabolic refractive X-ray lenses. Animprovement is visible from 130µm to at least 450 µm.
1.0
0.8
0.6
0.4
0.2
0.0
Def
f /
mm
100908070605040302010energy / keV
N = 50
N = 50
N = 150
N = 150
N = 100
N = 100Nmax = 185
Nmax = 300
Be Al
Figure 4.4: The calculated effective aperture illustrates the lower limit for the field of view.Deff is plotted versus the energy for the lens materials Be and Al as well as for differentnumbers N of single refractive lenses. The parabolic radius R = 200 µm is fixed.
Here, Deff is plotted versus X-ray energy for stacks of lenses with different optimal numbersof single lenses. The effective apertures strongly differ in the optimum energy range for eachlens material. Whereas for Be at 20 keV and Al at ∼50 keV no significant change of Deff with
4.1. IMPROVEMENTS DUE TO BERYLLIUM 29
the energy can be reported.Beryllium is always an improvement concerning the field of view compared to Al. The compar-ison between the field of view and the resolution is dictated by the experimental requirements.
350
300
250
200
150
100
50
d t /
nm
100908070605040302010energy / keV
Be Al
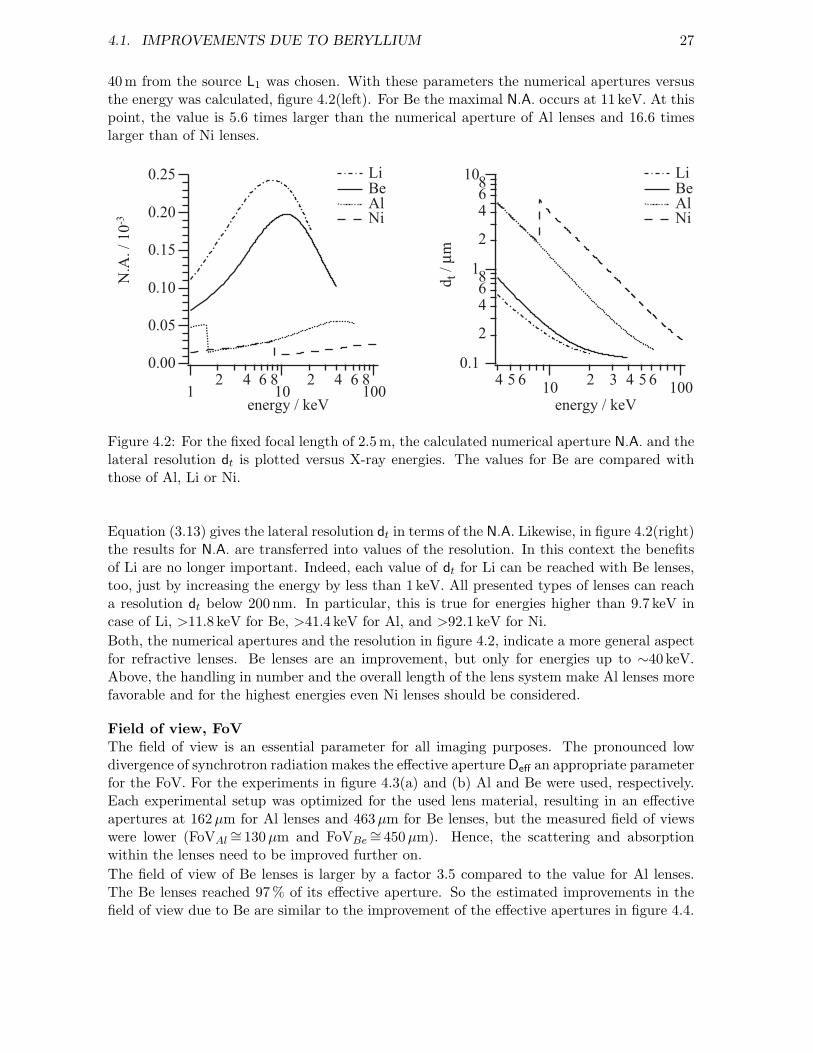
Figure 4.5: Calculated lateral resolution of rotational parabolic refractive lenses versus energy.Be lenses can achieve values below 100 nm (dot-dash line).
Lateral resolutionIn figure 4.2, the resolution was already presented. Figure 4.5 gives a plot of the lateralresolution dt versus the photon energy E. In the optimization process both the parabolicradius R and the number of lenses were varied. The curve for Be is decreasing to its minimumat 13.5 keV with a feasible resolution of dt =54 nm at a focal distance of f = 0.312 m. Between8 keV and 36 keV a resolution below 100 nm can be achieved. This is not possible at all forAl lenses. Here, the best resolution of 115 nm occurs at 41 keV. However, above 41 keV Allenses have a better resolution than Be lenses.In summary, beryllium parabolic refractive lenses substantially improve the resolution inhard X-ray microscopy below 40 keV. Achieved resolutions with Be lenses are presented inthe sections 5.1 and 5.2. The best results for Al lenses are discussed in [30, 31].
Depth of field dl and depth of focus DoFThe depth of field dl is a non critical parameter for applications of refractive lenses. It isonly important for the size of samples in tomography experiments where the field of view isthe first limiting factor. The interesting value for microprobing experiments is the depth offocus which for Al objectives was always sufficient. Otherwise the use of Be lenses constrictthe DoF, as figure 4.6 illustrates. Considering the minimum with DoF = 0.7mm for Be, thesevalues match the usual sample size for microprobing experiments of 1 mm and below.
GainTo increase the gain in an experiment using refractive lenses their transmission T has to beimproved and the focal spot size has to be reduced. The possible spot size is limited bythe resolution. T and dt benefit most from the low absorption in beryllium lenses. Indeed,

30 CHAPTER 4. BERYLLIUM LENSES: PROPERTIES AND PERFORMANCE
61
2
46
10
2
46
100
DoF
/ m
m
403530252015105energy / keV
Be Al
Figure 4.6: Calculated influence of the use of Be and Al for refractive lenses considering thedepth of focus.
gain factors higher than 10 000 can be reached. The gain is influenced by many experimentalparameters. To compare Al and Be lenses a source size of 0.7 mm× 0.06 mm and a source-lens distance L1 of 38 m were assumed. Likewise, for the energies 5 keV, 12 keV, 20 keV, and40 keV the number of lenses N was optimized.
Table 4.2: The gain of optimized Al and Be objectives for different energies.
gain Al BeE = 5 keV N = 40
10 44512 keV N = 24 N = 154
73 15 48920 keV N = 95 Nmax =185
188 6 08740 keV Nmax = 300
305
The values of the gain for Be lenses are, at least, one order of magnitude higher than thosefor Al lenses. Even an increase of two orders of magnitude can be arranged by tuning theenergy.
4.2 Material Quality and Shape Control
Beryllium raw material for lens production is manufactured by powder metallurgy and there-fore, it contains voids. Figure 4.7 shows a phase contrast tomogram of one of the first Be lensesin which the voids in the material become visible. This hard X-ray microscopy experiment

4.2. MATERIAL QUALITY AND SHAPE CONTROL 31
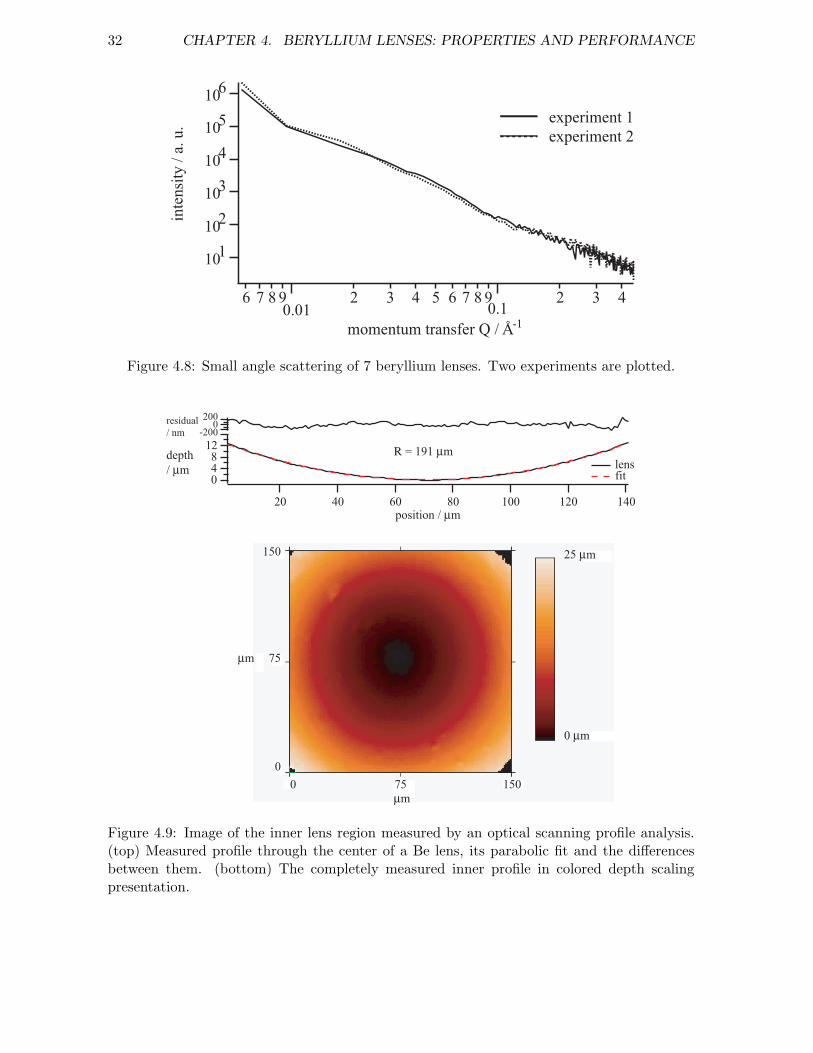
was done with Al lenses at beamline ID22/ESRF.Small angle X-ray scattering can be used to find out if the materials contains inhomogeneitiesbelow 1 µm in size. Up to now, only two measurements were recorded for two differentbatches of 7 single Be lenses, each. In figure 4.8 the results are plotted as intensity versus themomentum transfer Q. The results of both measurements are very similar. The exponent inthe power law behavior of I(Q) is ∼2.2 which is typical for a volume fractal (porous solid).Thus, the beryllium homogeneity can still be improved.
200 µm
Figure 4.7: Tomogram of a single Be lens by a hard X-ray microscopy experiment. The phasecontrast visualizes voids in the lens material.
As mentioned, the shape of a parabolic refractive X-ray lens is the key parameter. Duringthe manufacturing process the shapes of the pressing tools and of the lenses themselves aretested by an optical scanning system, ’MicroProf’ by Fries Research & Technology GmbH. Anexample is shown in figure 4.9(bottom). The topography of the inner lens region, 140µm by140 µm around its center, is displayed in a color spectrum between high (light) and low (dark)values on the z-axis. The x-points and y-points are measured in 1µm steps, the accuracyof the z-axis is given with 100 nm. The horizontal line profile, through the center of thelens, is plotted in figure 4.9(top). It is fitted by a parabola of R =191 µm. To illustrate thedeviations, the difference between the measured data and the fit function, is plotted. Thevalues vary by ±200 nm. Such a roughness increases a typical spot size by about 0.2 nm andis negligible.
32 CHAPTER 4. BERYLLIUM LENSES: PROPERTIES AND PERFORMANCE
101
102
103
104
105
106
inte
nsit
y / a
. u.
6 7 8 90.01
2 3 4 5 6 7 8 90.1
2 3 4
momentum transfer Q / Å-1
experiment 1experiment 2
Figure 4.8: Small angle scattering of 7 beryllium lenses. Two experiments are plotted.
12840
depth / µm
14012010080604020position / µm
2000
R = 191 µm lens fit
-200residual / nm
150
0 µm
25 µm
15075
75
0
0
µm
µm
Figure 4.9: Image of the inner lens region measured by an optical scanning profile analysis.(top) Measured profile through the center of a Be lens, its parabolic fit and the differencesbetween them. (bottom) The completely measured inner profile in colored depth scalingpresentation.

4.3. COMPARISON OF BERYLLIUM LENSES AND ALUMINIUM LENSES 33
4.3 Comparison of Beryllium Lenses and Aluminium Lenses
To compare the lens materials beryllium and aluminium a fixed number N = 100 of singlelenses were chosen. The design of the single lenses is the same in radius at the apex of theparabolas and geometrical aperture. For both objectives those energy regions are chosenwhich promise a good resolution. This is 12 keV for the Be parabolic refractive lenses and40 keV in case of Al. Therefore, the values for δ/, µ/ and the transmission are similar. Theeffective aperture is slightly larger for Be. The resolution is about one order better for the Belenses. Only the depth of field and depth of focus are much better for Al lenses: millimetersfor Be and tens of centimeters for Al. Due to the shorter focal length of the Be objective thesynchrotron radiation source is more strongly demagnified as for Al lenses. This is the reasonfor the enormous difference in the gain of the two experiments. The performance of refractivelenses is often questioned considering their low transmission of a few percent. But the highgain in a small spot makes them so valuable.
Al Bematerial: atomic number Z = 13 4
density = 2.7 g/cm3 1.84 g/cm3
atomic mass A = 26.98 g/mol 9.012 g/molexperiment: energy E = 40 keV 12 keV
mass index of refraction decrement δ/ = 1.25·10−7 m3/kg 1.28·10−7 m3/kgmass absorption coefficient µ/ = 0.567 m2/kg 0.443 m2/kgsource horizontal Sh = 700 µm 700 µmsource vertical Sv = 60 µm 60 µm
lenses: number of lenses N = 100 100apex radius R = 200 µm 200 µmthickness d = 0.01 mm 0.02 mmgeometrical aperture 2R0 = 850 µm 850 µm
geometry: distance from source L1 = 40 m 40 mfocal length f = 2.981 m 0.452 mdistance to image L2 = 3.221 m 0.457 meffective aperture Deff = 323 µm 437 µmnumerical aperture N.A.= 5·10−5 4.7·10−5
resolution dt = 234 nm 81 nmdepth of focus DoF = 81.93 mm 1.227 mmdepth of field dl = 3.92 mm 0.144 mm
performance: transmission T = 5.68 % 6.47 %spot size horizontal Bh = 56.37µm 8 µmspot size vertical Bv = 4.84µm 0.69 µmgain g = 164 14 811

34 CHAPTER 4. BERYLLIUM LENSES: PROPERTIES AND PERFORMANCE

Chapter 5
Beryllium Parabolic X-Ray Lenses:Methods and Applications
Parabolic refractive lenses for hard X-rays can be used in different optical geometries. Imagingsetups, which magnify or demagnify an object, taking advantage of the true imaging qualityof rotational parabolic refractive lenses, comparable to glass lenses of visible light. If thesource is imaged on a sample a probing microbeam is generated which is useful for analyticalapplications. In a scanning mode, the spatial resolution is improved due to a small focal spot,useful for example, in fluorescence and absorption spectroscopy, in diffraction experiments orin small angle scattering setups.This chapter presents these principal applications while the improvements due to berylliumlenses are discussed. Some typical results are reported. XANES microtomography and thespecial demands on parabolic refractive lenses for extreme nano focusing are the topics oflater chapters. First, the use of the lenses in microscopy and micro probing experiments arediscussed, and the benefits for applications like tomography, lithography, micro diffractionand small angle scattering will be demonstrated. Rotational parabolic refractive berylliumlenses as an optical element for a X-ray free electron laser will be discussed as an interestingopportunity for the future.
5.1 Imaging and Microscopy
A typical setup for an X-ray microscope is sketched in figure 5.1. A synchrotron radiationsource with a gaussian intensity distribution and an elliptic electron beam cross section isshown on the left. An object, here a mesh, is illuminated by synchrotron radiation. A rotatingdiffuser (B4C powder of 0.5 mm to 2.5 mm thickness) ensures an incoherent illumination ofthe object. The position of the stacked lenses and their number determine the magnificationm of the image. Comparable to common optics the magnification is the ratio of the imagedistance L2 to the object distance L1.
m =L2
L1=
L1 − f
f. (5.1)
L2 and hence m depend only on L1 and on the focal length f. A large magnification is achievedif the location of the sample L1 is only slightly larger than the focal length.
35

36 CHAPTER 5. BERYLLIUM LENSES: METHODS AND APPLICATIONS
F
diffuser
lens
synchrotronsource
object
magnified image
L1
L2
f
gF
Figure 5.1: Setup for a full field X-ray microscope.
20 µm
Figure 5.2: Image of an Ni 2000mesh ten times magnified on an high resolution X-ray film(inverted contrast). The absence of spherical aberration demonstrates the parabolic shape ofthe Be lenses, [Parameters: energy = 12 keV, 91 Be lenses, L1 = 41 m, f = 495 mm, m = 10].

5.1. IMAGING AND MICROSCOPY 37
Hard X-ray microscopy is comparable to microscopy with visible light. However, the largepenetration depth of hard X-rays in matter allows to investigate opaque samples. This wasdemonstrated with parabolic refractive lenses of aluminium on a double gold mesh with dif-ferent periods [21]. Due to their high absorption Al lenses reach only moderate resolution.On the other hand, the minimal resolution for Al lenses of 180 nm is improved to an expectedresolution for Be lenses of 50 nm. The values based upon the current design of the rota-tional parabolic refractive lenses are shown in figure 4.5. The better field of view, strongertransmission, and the use of different wavelength are additional arguments to build an X-raymicroscope with beryllium parabolic refractive lenses.An image generated by a hard X-ray microscope with an objective composed of berylliumlenses is shown in figure 5.2. The sample is a nickel mesh designed for transmission electronmicroscopy. Its pitch is 12.7µm (≡ 1/2000 inch) and its regular structure can easily revealdistortions generated by the imaging. Here, the image does not show spherical aberration andtherefore, it proves the correct parabolic shape of the lenses. Flaws in the mesh are imaged,demonstrating the high quality of the lenses.The diffuser in front of the sample ensures an incoherent illumination of the object. Otherwisesome fringes caused by the sharp edges of the mesh would show up. To visualize the difference,figure 5.3(left) is a part of the Ni-mesh without the diffuser. To allow a direct comparison apart of the image in figure 5.2, which was generated with the use of a diffuser, is shown againin figure 5.3(right).
10 10 µm10 µm10 10 µm10 µm
Figure 5.3: Images of the Ni mesh with partial coherent (left) and with incoherent (right) illu-mination of the object. A rotating B4C diffuser was used, all other experimental parametersare the same.
The vertical coherence length of the beam was changed by the diffuser from about 70 µm to0.5µm. A more detailed consideration of the effect of the diffuser will be given in [30].The main parameter for the quality of an image is its resolution. The improvement achieved isdemonstrated next. Figure 5.4 compares the images of a grid of gold lines ( 2µm thick, ∼1 µmwidth, and with a 2µm pitch) deposited electrolytically on an Si wafer, which is transparentfor hard X-rays. On purpose, an area of the Au grid with many flaws was chosen, in orderto visualize fine details. Figure 5.4(a) is a projection image, without lens, detected with thehigh resolution detector FReLon2000 [32] from 2 mm distance. Its pixel size of 680 nm isnot sufficiently small to directly image the structure in all its details. The object has to bemagnified to achieve a better resolution with this detector.
38 CHAPTER 5. BERYLLIUM LENSES: METHODS AND APPLICATIONS
(a) (b)
(c)
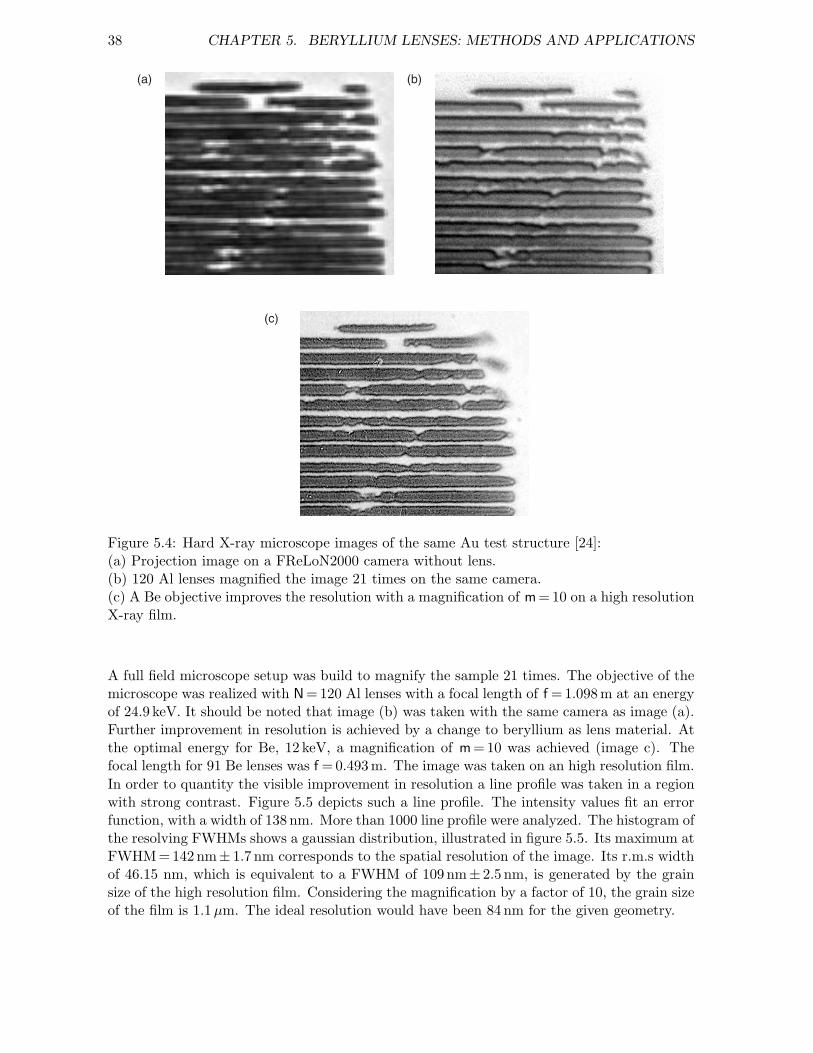
Figure 5.4: Hard X-ray microscope images of the same Au test structure [24]:(a) Projection image on a FReLoN2000 camera without lens.(b) 120 Al lenses magnified the image 21 times on the same camera.(c) A Be objective improves the resolution with a magnification of m = 10 on a high resolutionX-ray film.
A full field microscope setup was build to magnify the sample 21 times. The objective of themicroscope was realized with N =120 Al lenses with a focal length of f = 1.098 m at an energyof 24.9 keV. It should be noted that image (b) was taken with the same camera as image (a).Further improvement in resolution is achieved by a change to beryllium as lens material. Atthe optimal energy for Be, 12 keV, a magnification of m = 10 was achieved (image c). Thefocal length for 91 Be lenses was f =0.493 m. The image was taken on an high resolution film.In order to quantity the visible improvement in resolution a line profile was taken in a regionwith strong contrast. Figure 5.5 depicts such a line profile. The intensity values fit an errorfunction, with a width of 138 nm. More than 1000 line profile were analyzed. The histogram ofthe resolving FWHMs shows a gaussian distribution, illustrated in figure 5.5. Its maximum atFWHM = 142 nm± 1.7 nm corresponds to the spatial resolution of the image. Its r.m.s widthof 46.15 nm, which is equivalent to a FWHM of 109 nm± 2.5 nm, is generated by the grainsize of the high resolution film. Considering the magnification by a factor of 10, the grain sizeof the film is 1.1µm. The ideal resolution would have been 84 nm for the given geometry.

5.1. IMAGING AND MICROSCOPY 39
30
2520
15
10
5
0
coun
ts
40035030025020015010050FWHM / nm
inte
nsity
/ a.
u.
4.84.44.03.63.22.82.42.0image position / µm
line profile
histogram of 1000 line profiles
FWHM138 nm
gaussian maximum at 142 nm
Figure 5.5: Magnified part of the Au test structure with a line profile and a histogram ofmany line profiles, resulting in a spatial resolution of 142 nm.
A compact microscope was set up with rotationally parabolic refractive beryllium lenses. Dis-tortion free images were reported. Under the given experimental circumstances the objectivereproduces the desired magnification of 10 times with an overall resolution of less than 200 nmover a field of view of at least 450 µm.

40 CHAPTER 5. BERYLLIUM LENSES: METHODS AND APPLICATIONS
5.2 Focusing and Microprobing
Many analytical techniques need a high spatial resolution. This requires a microbeam in theµm range and below. The simplest solution would be a pinhole with the desired size, but thissuffers from high intensity loss. A much better solution is an optic which images the sourceon the sample in a strongly demagnifying mode. So, the incident intensity is focused ratherthan thrown away. The quality of such an optic is characterized by its spot size and by thegain.
lens
synchrotronsource
image
L1
L2
f
F
Auknife-edge
detector
camera
Figure 5.6: Microprobing setup with fluorescence detection.
In figure 5.6 is sketched a microprobing setup. The source size and the beam divergence differfor each synchrotron radiation beamline. For best resolution the image of the source has tobe demagnified as much as possible. This needs a large value for L1 (typically 30 m to 75 m)and a small value of L2 (dictated by the focal length of the lens).Here, the microbeam is characterized by knife-edge scans. A sharp edge was moved throughthe beam and the transmission or, as in our case, the fluorescence is recorded. The examplesin figure 5.7 were measured at beamline ID22 / ESRF. The source size was 0.06mm in thevertical and 0.7 mm in horizontal direction. For a demagnification N = 91 Be lenses were usedat E = 12 keV. The intensities were measured with a PIN diode.The flux recorded were:
I0 = 3.05 · 1012 ph/(s mm2) [incident radiation]FL = 1.05 · 1011 ph/s [through the lenses]Ff = 7.98 · 1010 ph/s [in the spot]
≡ 4.35 · 1015 ph/(s mm2)
The scans of figure 5.7 can be fitted as error-function. It appears that the measured dataare fitted best by the sum of two error functions. The broad one describes a background.

5.3. TOMOGRAPHY 41
10x103
8
6
4
2
0
inte
nsity
/ a.
u.
2.54 2.52 2.50 2.48horizontal position / mm
0.0096 mm
10x103
8
6
4
2
0
inte
nsity
/ a.
u.
6420-2-4-6vertical position / µm
12 keV
0.0013 mm
Figure 5.7: Au Lα fluorescence knife-edge scans with a Be lens objective. The sharp edge ofthe knife was moved in horizontal and vertical direction through the synchrotron radiationbeam.
Partly, it is formed by an image of a virtual source caused by other beamline optics (e. g. themonochromator or mirrors) and/or beam instabilities. Furthermore, small angle scattering inthe lens material can increase the background. The scans of figure 5.7 show an backgroundof 28.7% vertical and 13.7% for the horizontal knife edge scan. Adding the squared Gaussianwidths results in a spot size of 1.7µm× 10.9 µm. The flux measurement gives 7.98 · 1010
photons per second in the focal spot (Ff 76% FL), which corresponds to a gain of g = 1425,in comparison to a hypothetical pinhole in the size of the spot.Even the optimal resolution and the ideal gain were not yet reached, the improvements dueto the use of Be lenses for analytical applications are already now outstanding.
Microscopy and microprobing are the most important fields of application of the parabolicrefractive lenses. The following sections describe applications relaying on this two techniques.
5.3 Tomography
Tomography is a 3-dimensional imaging of opaque media without the need for cutting theobject. For that purpose, projection images at different sample orientations are recorded.Different analytic techniques can be used to generate these projection images. Inventedfor medical X-ray analysis, the method has developed beyond that. Magnetic resonance,ultrasound or radioisotopes produce common tomographic images.Both lens geometries, focusing and imaging, can be used in a tomographic setup. A magnifyingsetup results in increased resolution. In a scanning approach, the microbeam setup improvesthe spatial resolution of analytical tomographic applications.

42 CHAPTER 5. BERYLLIUM LENSES: METHODS AND APPLICATIONS
5.3.1 Scanning Tomography
As outlined in figure 5.8(a), an opaque sample is scanned step by step with the focused beamat equidistant positions (dashed lines). After such a translational scan, the sample is rotatedby an fraction of the full rotation and the translation scan is repeated. When the samplehas completed a full rotation all points of the scans lie on a virtual slice through the sample,figure 5.8(b). The probe, in our case the X-ray microbeam, samples in each beam positionan integral of the real or of the imaginary part of the index of refraction in the plane (x,y).We call µ(x,y) or δ(x,y) by f(x,y). Let us first consider tomography in absorption contrast:f(x,y) =µ(x,y).
x
yz
x
yφ
φ
a b
g
rss
g
r
Figure 5.8: The space coordinates of a virtual slice through a symbolic sample in scanningtomography.
In figure 5.9(a) the absorption coefficient µ is displayed for a single translation scan. Thevalues are calculated from the measured intensity by correcting for dark current and bydividing the incident intensity. The results are presented in two different ways, as the standardgraph of µ versus the scanning position r or as µ being color scaled as a function of r. Thisparallel projection of f(x, y) is the Radon transform pφ(r) =
∫g f(x, y)ds. It is the integration
over each scanned paths g at position r and at angle φ [33]. In figure 5.9(a) the result of thefirst scanning at the angle φ = 0 is shown. Figure 5.9(b) illustrates the situation after 10 stepsof rotation, when the sample was rotated to 116. The results for µ at each scanning positionbuild up a sinogram. The inverse radon transform reconstructs the desired information fromsuch a sinogram. It can be implemented as the filtered back projection algorithm [34]. Thisis based on the Fourier slice theorem that links the Fourier transform pφ(r) of a projectionpφ(r) to the two-dimensional Fourier transform f(kr · cos φ, kr · sinφ) of the object on thevirtual slice: ∫
pφ (r) eirkrdr =∫
f (x, y) ei(xkrcosφ+ykrsinφ)dxdy (5.2)
pφ(kr) = f(kr · cos φ, kr · sinφ) (5.3)
The Fourier transformation of the object function is given in polar coordinates (kr, φ)). Toavoid difficulties with resampling the Fourier components onto a regular lattice, the Fourier
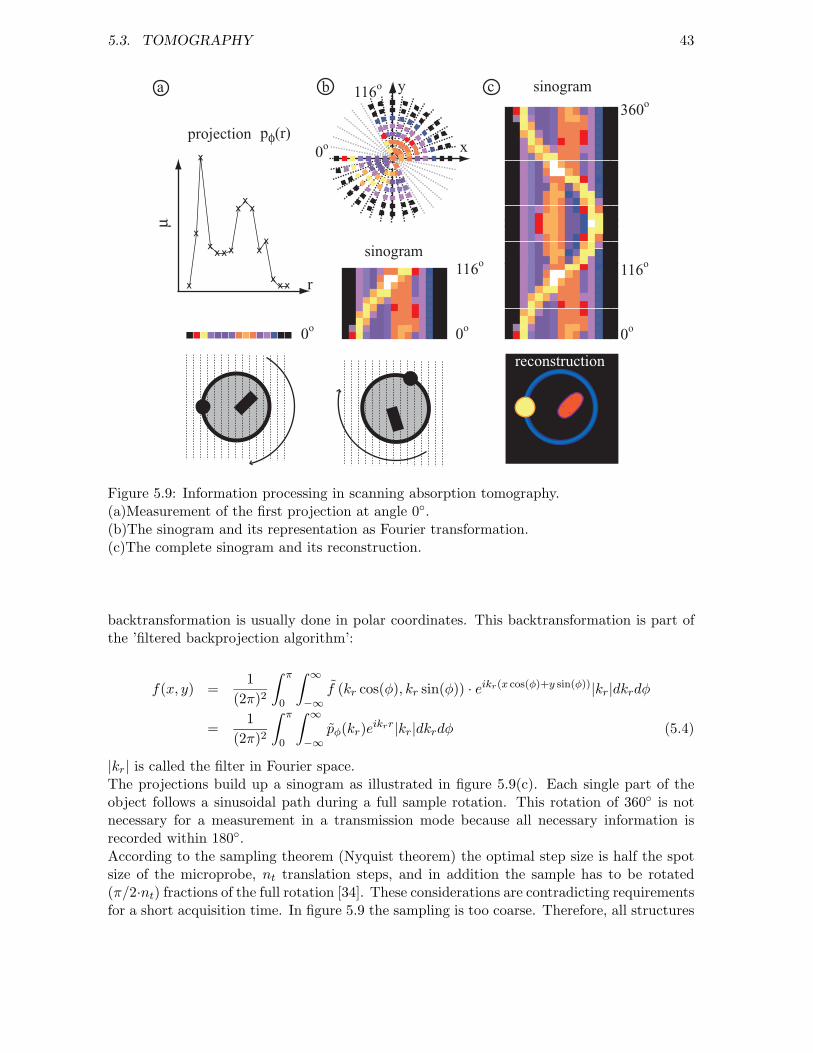
5.3. TOMOGRAPHY 43
µx
x
xx x x
xxx
x
x
xx x
x
0o
116o
0o
116o
0o
360o
reconstruction
projection
sinogram
r
pφ(r)
sinogram
x
y
0o
116oa b c
Figure 5.9: Information processing in scanning absorption tomography.(a)Measurement of the first projection at angle 0.(b)The sinogram and its representation as Fourier transformation.(c)The complete sinogram and its reconstruction.
backtransformation is usually done in polar coordinates. This backtransformation is part ofthe ’filtered backprojection algorithm’:
f(x, y) =1
(2π)2
∫ π
0
∫ ∞
−∞f (kr cos(φ), kr sin(φ)) · eikr(x cos(φ)+y sin(φ))|kr|dkrdφ
=1
(2π)2
∫ π
0
∫ ∞
−∞pφ(kr)eikrr|kr|dkrdφ (5.4)
|kr| is called the filter in Fourier space.The projections build up a sinogram as illustrated in figure 5.9(c). Each single part of theobject follows a sinusoidal path during a full sample rotation. This rotation of 360 is notnecessary for a measurement in a transmission mode because all necessary information isrecorded within 180.According to the sampling theorem (Nyquist theorem) the optimal step size is half the spotsize of the microprobe, nt translation steps, and in addition the sample has to be rotated(π/2·nt) fractions of the full rotation [34]. These considerations are contradicting requirementsfor a short acquisition time. In figure 5.9 the sampling is too coarse. Therefore, all structures

44 CHAPTER 5. BERYLLIUM LENSES: METHODS AND APPLICATIONS
fluo
resc
ence
x
x
x x x
xx
x
x x
x x x
x
x
r
a b c
Figure 5.10: Illustration of the selfabsorption effect in fluorescence microtomography.
appear bigger than they are and they are washed out. The sharp edges of the quadrangle arenot resolved. All these aspects have to be considered in the planing of an experiment and inthe interpretation of the reconstructed tomograms.Tomography can also be done in a fluorescence mode. For that purpose, the fluorescenceradiation emitted by the sample is detected by means of an energy dispersive detector. Thedetector is located, in general, perpendicular to the X-ray beam, in order to minimize theelastic X-ray scattering. Fluorescence tomography is important for the localization of traceelements and for element distribution. The energy of the fluorescence radiation is lowerthan the exciting energy. Also the absorption inside a sample must be taken into count.Figure 5.10 illustrates this selfabsorption. When the beam hits the sample on the detectorside the fluorescence radiation is barely reduced in intensity by absorption in the sample (b).Unfortunately, if the beam hits the sample on the far side from the detector, strong absorptionmay occur (c). A correction algorithm for self-absorption was developed [35]. However, a fullrotation of the sample in unpair equidistant steps is required.A microbeam generated by a beryllium refractive lens has more intensity than that by an alu-minium lens. As a consequence, the long data acquisition times in tomography can be reducedand/or the density of the sampling points can be increased in order to optimize the resolu-tion. Examples of XANES microtomography and high resolution fluorescence tomographyare given in the chapters 5 and 6.
5.3.2 Magnifying Tomography
Magnifying tomography requires the same experimental setup as the microscopy setup shownin figure 5.1. The principal differences in figure 5.11 are a fully rotatable sample and acomputerized reconstruction algorithms of the measured data.For each equidistant angle position of the sample one X-ray micrograph is recorded. Dueto the small beam divergence the micrographs can be considered as parallel projections. Asample rotation of 180 provides complete information, which will be reduced by insufficientsampling, mechanical instabilities and lens aberrations. The sampling requirements definedby the Fourier slice theorem are the same as for scanning tomography. Also flat field anddark field corrections are required. A flat field is a micrograph without sample to documentintensity variations of the incident beam. On the other hand, dark fields taken withoutincident radiation document the detector performance, e.g. its dark current. Due to the long

5.3. TOMOGRAPHY 45
acquisition times the flat fields are recorded at regular intervals in order to correct for timedependent beam stabilities.
lens (optical center)
synchrotronsource
object
magnified image(with inner structures)
L1
L2
f
F
Figure 5.11: Setup for magnifying tomography.
Some samples, especially biological ones, are not sufficiently absorbing to get a contrast basedon absorption. Therefore, the highly coherent radiation from a synchrotron source providesan other possibility: tomography in phase contrast. A change of the refraction index disturbsthe free propagation of the wavefront. This leads to interference fringes. For a quantitativeanalysis with phase contrast at least two tomograms have to be recorded, one of them ina defocused plane, in order to reconstruct the phase and the amplitude of the transmissionfunction.The need of many projection for the reconstruction of a tomogram leads to hours of acquisitiontime. In reference [31] the reconstruction is shown of a AMD K6 microprocessor. The datawere taken with Al lens (N = 120). The resolution achieved was 420 nm±100 nm. Eachprojection was recorded in 40 s and 500 projections were required. The total acquisition timewas 5.5 h (without motor movements and readout times!). The better transmission of a Beobjective and its larger aperture improve the experimental conditions. A resolution below100 nm is expected. The larger field of view which can be achieved with Be lenses allows forlarger samples to be analyzed by tomography.
In summary, parabolic refractive lenses, their flexibility and easy alignment, have made magni-fying and microprobing hard X-ray tomography feasible. The use of beryllium lenses extendsthe accessible energy range. Their better transmission is extremely helpful in reducing thetime of data acquisition. The full field microscope describe in section 5.1 reaches a resolutionof at least 145 nm. It is planned to transfer this into tomography during a high resolutionmagnified tomography experiment at an undulator source.The scanning tomography with Be lenses from chapters 5 and with Si lenses from chapter 6

46 CHAPTER 5. BERYLLIUM LENSES: METHODS AND APPLICATIONS
illustrate the new techniques and samples which can now be analyzed. XANES microtomogra-phy can be performed with sufficient intensity. Fluorescence tomography is recorded in recordresolution. In principle other analytical methods like diffraction, small angle scattering, etc.could be likewise implemented in a tomography experiment.
5.4 Hard X-Ray Lithography
Lithography is a method for micro structuring. A resist is partially illuminated and changesits structure at the exposed spots. Well established processes based on UV-light, soft X-raysor electron beam lithography allow the manufacturing of fine structures with a high aspectratio. In that regard, refractive X-ray beryllium lenses find some promising applications.
• Demagnifying the image of an X-ray mask may alleviate some of the problems with theproduction of contact masks.
• The large penetration depth of hard X-rays into the resist allows thick layers and highaspect ratios (deep X-ray lithography) which are required, for example, for Fresnel zoneplates, section 2.2.
• The higher photon energies reduces disturbing proximity effects due to scattering, pho-toelectrons, and fluorescence which have direct impact on the quality of the imaging.
diffuser
lens
synchrotronsource
mask
resist
L2
f
F
L1
Figure 5.12: Setup of a hard X-ray lithography experiment using rotational parabolic refrac-tive lenses.
As mentioned above, the typical experimental setup for hard X-ray lithography in figure5.12 is comparable to the imaging method of full field microscope in figure 5.1. To get ademagnification, the image distance L2 has to be smaller than the distance L1 to the object.

5.4. HARD X-RAY LITHOGRAPHY 47
Demagnified imaging for lithography requires high quality optical components. Be lensesfor hard X-ray lithography are highly recommended because of the large aperture and hightransmission which are needed to get a reasonable X-ray dose in the resist.The first experiment with Be lenses was a feasibility test of hard X-ray lithography. Thesynchrotron radiation was collimated by a Be condenser lens (16 single lenses). Then thecoherence of the beam was reduced by a B4C-powder diffuser (1 mm thickness), to avoidinterference fringes due to the sharp edges of the mask. The mask composed of ∼20 µmthick gold on a transparent substrate (e. g. Si or Be). The distance L1 = 3.66 m betweenthe mask and the objective lens was chosen as large as possible within the boundaries ofthe experimental hutch. An undulator harmonic (’pink’ beam) at 20 keV was used withoutloss of focusing (section 3.8). During this experiment at the ID22/ESRF an objective withN =108 single Al lenses was used. A demagnification of 4 times was generated (focal lengthf =0.714 m and L2 = 0.89 m). The image projection was verified with the FReLon2000 CCDcamera at the position the sample.The first mask was a ’wagon wheel’ of 22µm thick gold on a beryllium wafer. The ’wagonwheel’ consists of well defined spokes which get thinner at the center. This structure allows,even at partial illumination, to estimate the resolution and field of view. Figure 5.13 illustratesthe need for all optical components. Whereas image (a) is the result with N =108 Al lenses,image (b) was taken with 16 Be lenses as condenser lens in front of the mask increasing the
100 µm100 µm
100 µm100 µm
(a) (b)
(d)(c)
Figure 5.13: Comparison of the image size with different optical tools. A wagon wheel imagedby (a) an Al lens objective, (b) with a Be field lens, (c) with a B4C diffuser, and (d) with Befield lens and with diffuser.

48 CHAPTER 5. BERYLLIUM LENSES: METHODS AND APPLICATIONS
size of the image from 54 µm to 128 µm. The influence of the diffuser is displayed in image(c). The best image (with 204 µm in size) is achieved when all 3 components are installed(image d).
only Al lenses 54µmAl and Be lenses 128 µmAl lenses + diffuser 175 µmAl and Be lenses + diffuser 204 µm
The listed values were measured on the camera with a four fold demagnification. Therefore,with the help of the diffuser and the Be field lens the Al objective generates a field of view of616 µm.To optimize the optic for hard X-ray lithography is the first step. To transfer the imagedstructures into a resist is a second more complicated step. The resist itself, its thickness,exposure time, and the characteristics of the developer in time and concentration must beevaluated and optimized, too. ’Demagnifying X-Ray Lithography’ is the theme of the PhDthesis by C. Zimprich (RWTH), which should be refered for further information [36]. Here,we confine in figure 5.14 to illustrate the transfer of a structure into the negative resist AR-N7700 by ’Allresist’. The mask was gold with a thickness of 15µm on a silicon wafer. Thegenerated demagnification correspond to a 2.8x reduction [parameters: E = 25 keV, N = 130,L1 = 3.62 m, L2 =1.28 m].It is unlikely that hard X-ray lithography will replace the well established electron beam, softX-ray, and/or UV lithography. But creating mask for these methods could be accomplishedby hard X-ray lithography. Special resists, for example doted with Pd, could reduce theproximity effects which now blur the image. The possible high aspect ratios are certainlyworth mentioning.Beryllium parabolic refractive lenses made it possible to implement hard X-ray lithography.Their good transmission allows reasonable exposure times. The large field of view may bebeneficial for further development in hard X-ray lithography and for other imaging applica-tions.
50 µm 20 µm
Figure 5.14: (Left) SEM image of the mask, gold deposited by electroplating on silicon.(Right) Demagnified lithography of the RWTH logo, reduction 2.8x.
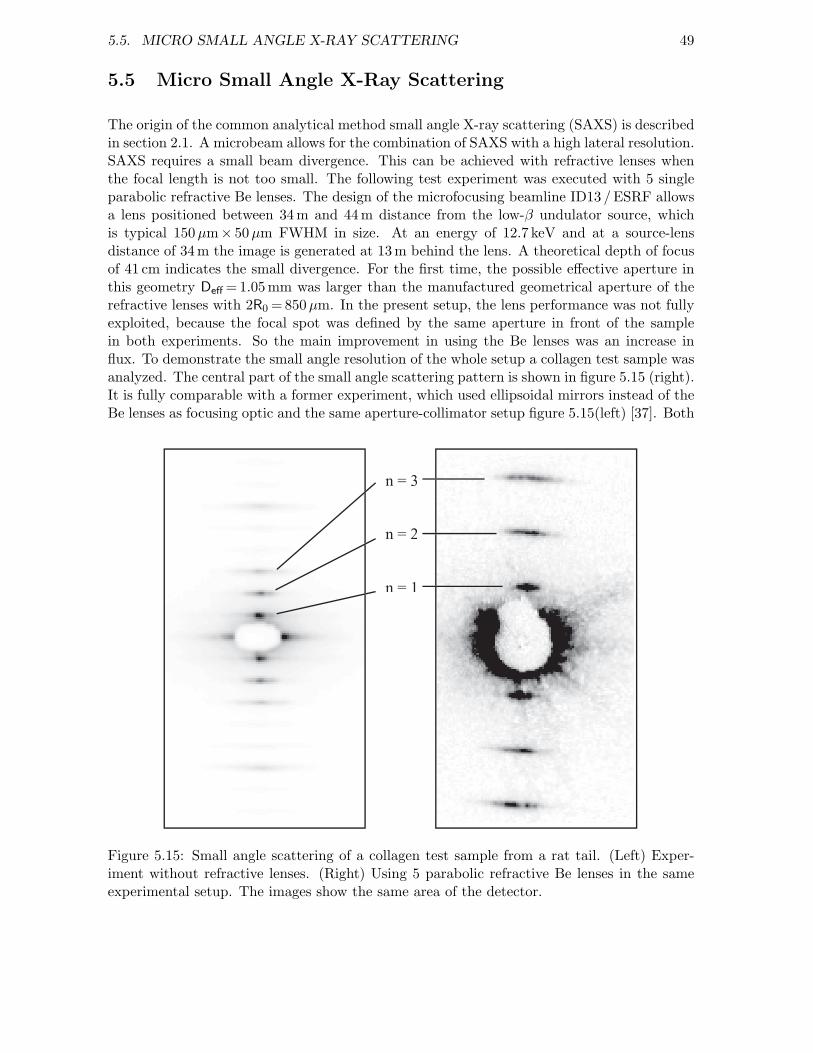
5.5. MICRO SMALL ANGLE X-RAY SCATTERING 49
5.5 Micro Small Angle X-Ray Scattering
The origin of the common analytical method small angle X-ray scattering (SAXS) is describedin section 2.1. A microbeam allows for the combination of SAXS with a high lateral resolution.SAXS requires a small beam divergence. This can be achieved with refractive lenses whenthe focal length is not too small. The following test experiment was executed with 5 singleparabolic refractive Be lenses. The design of the microfocusing beamline ID13 / ESRF allowsa lens positioned between 34 m and 44 m distance from the low-β undulator source, whichis typical 150µm× 50 µm FWHM in size. At an energy of 12.7 keV and at a source-lensdistance of 34 m the image is generated at 13 m behind the lens. A theoretical depth of focusof 41 cm indicates the small divergence. For the first time, the possible effective aperture inthis geometry Deff = 1.05 mm was larger than the manufactured geometrical aperture of therefractive lenses with 2R0 = 850 µm. In the present setup, the lens performance was not fullyexploited, because the focal spot was defined by the same aperture in front of the samplein both experiments. So the main improvement in using the Be lenses was an increase influx. To demonstrate the small angle resolution of the whole setup a collagen test sample wasanalyzed. The central part of the small angle scattering pattern is shown in figure 5.15 (right).It is fully comparable with a former experiment, which used ellipsoidal mirrors instead of theBe lenses as focusing optic and the same aperture-collimator setup figure 5.15(left) [37]. Both
n = 1
n = 2
n = 3
Figure 5.15: Small angle scattering of a collagen test sample from a rat tail. (Left) Exper-iment without refractive lenses. (Right) Using 5 parabolic refractive Be lenses in the sameexperimental setup. The images show the same area of the detector.

50 CHAPTER 5. BERYLLIUM LENSES: METHODS AND APPLICATIONS
images show the same detector area. During the micro small angle scattering experiment withrefractive lenses the detector and the beamstop were positioned in a larger distance from thesample. This results in the better resolution in the right image of figure 5.15. Detailedcalculations during the following experiment by S. V. Roth (ESRF) were able to evaluate thechanged experiment parameters. The maximal resolvable particle size increases from 110 nmto now 140 nm. As described in section 2.1, the better the resolution of the forward scatteringangle is the larger the structures are which can be resolved.Also, more flux by a factor of 1.4 was measured. However, the most important improvementis in the marginal divergence of the probing beam. Focused by ellipsoidal mirrors a divergenceof 0.2 mrad was recorded. The same experimental setup with Be parabolic refractive lensesreported a divergence of 0.05 mrad.The lenses were not optimized for the SAXS experiment, nor was the experimental setupoptimized for the use of refractive lenses. Again, there is ample room for improvements inthe future. Lenses with a geometrical aperture larger than 1 mm can be used to improvethe flux, further. The additional aperture in front of the sample should match with thespot size produced by the refractive lens which was not realized here. The radius R of therefractive optics and of the relative positions of the final aperture and the parabolic refractivelenses should be optimized. In addition, a nanofocusing setup, as described in chapter 7,and tomographic approaches can be carried out in combination with small angle scattering.Even an additional specially designed refractive optics for parallelization of the synchrotronradiation is a possibility.
5.6 Beam Conditioning
Microanalysis applications with beryllium lenses were presented with best performances inresolution, magnification, or gain. But often there is no need to use extreme geometries.Slight changes in the beam path can be the key for improvement of standard experiments.One single lens in a distance from the source equal to the focal length reduces the beamdivergence. Under ideal circumstances parallelism can be achieved, without reduction of thecoherence of the beam. A one-to-one imaging geometry can be established at most beamlinesof 3rd generation synchrotron radiation facilities due to the highly flexible concept of refractiveX-ray lenses. The benefit would be an increase in intensity per area and a control element forthe beam divergence, already under development at the sub-picoscecond pulse source SPPSat the Stanford Synchrotron Radiation Laboratory SSRL. Since refractive lenses keep thedirection and the position of the beam their installation in a beam line has little influenceon the positioning of other optical components. This clearly demonstrates the flexibility inusing refractive lenses. Furthermore, the ability to reproduce the lens position with standardlateral stages is helpful. Also, the lenses can withstand the white beam of an undulator sourceof a third generation synchrotron radiation facility without degradation [21, 38].
5.7 Refractive Lenses for X-Ray Free Electron Lasers
The next generation of synchrotron radiation sources will be the X-ray free electron laser,XFEL. Linac-based XFELs use self-amplified spontaneous emission (SASE). The expectedtime-average brilliance will be up to 6 orders of magnitude higher than for 3rd generationsynchrotron storage rings. The peak brilliance can increases even by 10 orders of magnitude.
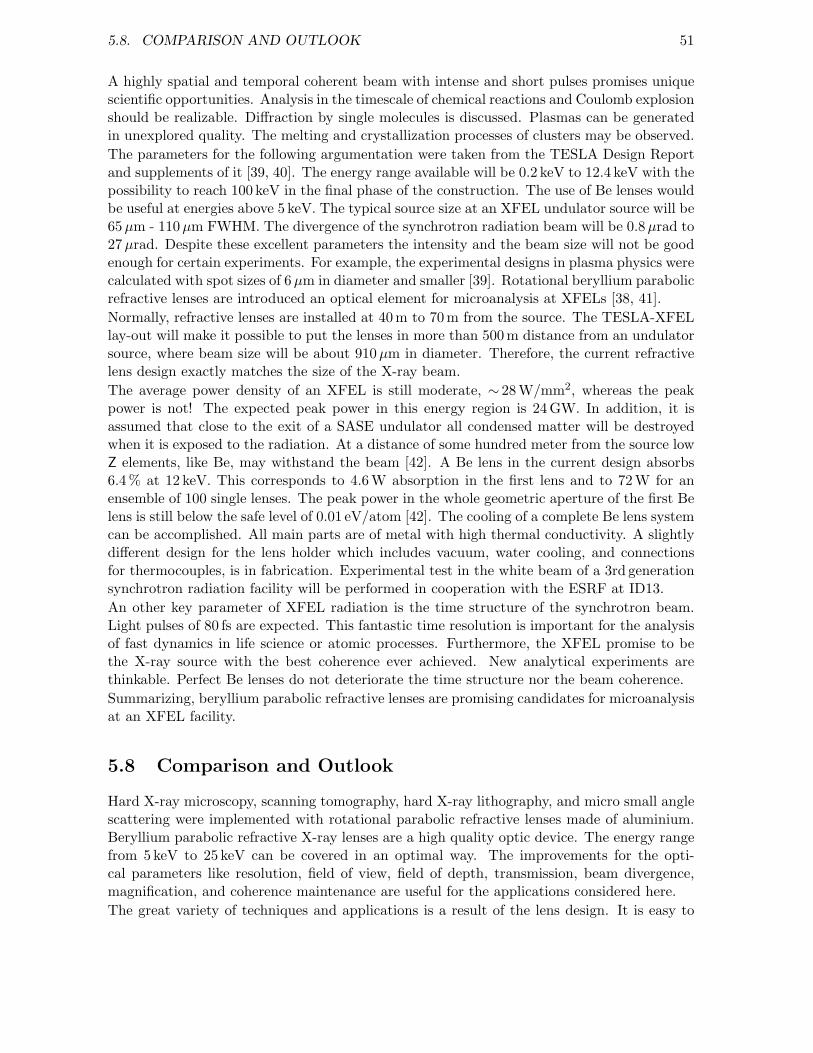
5.8. COMPARISON AND OUTLOOK 51
A highly spatial and temporal coherent beam with intense and short pulses promises uniquescientific opportunities. Analysis in the timescale of chemical reactions and Coulomb explosionshould be realizable. Diffraction by single molecules is discussed. Plasmas can be generatedin unexplored quality. The melting and crystallization processes of clusters may be observed.The parameters for the following argumentation were taken from the TESLA Design Reportand supplements of it [39, 40]. The energy range available will be 0.2 keV to 12.4 keV with thepossibility to reach 100 keV in the final phase of the construction. The use of Be lenses wouldbe useful at energies above 5 keV. The typical source size at an XFEL undulator source will be65 µm - 110 µm FWHM. The divergence of the synchrotron radiation beam will be 0.8µrad to27 µrad. Despite these excellent parameters the intensity and the beam size will not be goodenough for certain experiments. For example, the experimental designs in plasma physics werecalculated with spot sizes of 6 µm in diameter and smaller [39]. Rotational beryllium parabolicrefractive lenses are introduced an optical element for microanalysis at XFELs [38, 41].Normally, refractive lenses are installed at 40 m to 70 m from the source. The TESLA-XFELlay-out will make it possible to put the lenses in more than 500 m distance from an undulatorsource, where beam size will be about 910 µm in diameter. Therefore, the current refractivelens design exactly matches the size of the X-ray beam.The average power density of an XFEL is still moderate, ∼ 28 W/mm2, whereas the peakpower is not! The expected peak power in this energy region is 24 GW. In addition, it isassumed that close to the exit of a SASE undulator all condensed matter will be destroyedwhen it is exposed to the radiation. At a distance of some hundred meter from the source lowZ elements, like Be, may withstand the beam [42]. A Be lens in the current design absorbs6.4 % at 12 keV. This corresponds to 4.6 W absorption in the first lens and to 72 W for anensemble of 100 single lenses. The peak power in the whole geometric aperture of the first Belens is still below the safe level of 0.01 eV/atom [42]. The cooling of a complete Be lens systemcan be accomplished. All main parts are of metal with high thermal conductivity. A slightlydifferent design for the lens holder which includes vacuum, water cooling, and connectionsfor thermocouples, is in fabrication. Experimental test in the white beam of a 3rd generationsynchrotron radiation facility will be performed in cooperation with the ESRF at ID13.An other key parameter of XFEL radiation is the time structure of the synchrotron beam.Light pulses of 80 fs are expected. This fantastic time resolution is important for the analysisof fast dynamics in life science or atomic processes. Furthermore, the XFEL promise to bethe X-ray source with the best coherence ever achieved. New analytical experiments arethinkable. Perfect Be lenses do not deteriorate the time structure nor the beam coherence.Summarizing, beryllium parabolic refractive lenses are promising candidates for microanalysisat an XFEL facility.
5.8 Comparison and Outlook
Hard X-ray microscopy, scanning tomography, hard X-ray lithography, and micro small anglescattering were implemented with rotational parabolic refractive lenses made of aluminium.Beryllium parabolic refractive X-ray lenses are a high quality optic device. The energy rangefrom 5 keV to 25 keV can be covered in an optimal way. The improvements for the opti-cal parameters like resolution, field of view, field of depth, transmission, beam divergence,magnification, and coherence maintenance are useful for the applications considered here.The great variety of techniques and applications is a result of the lens design. It is easy to
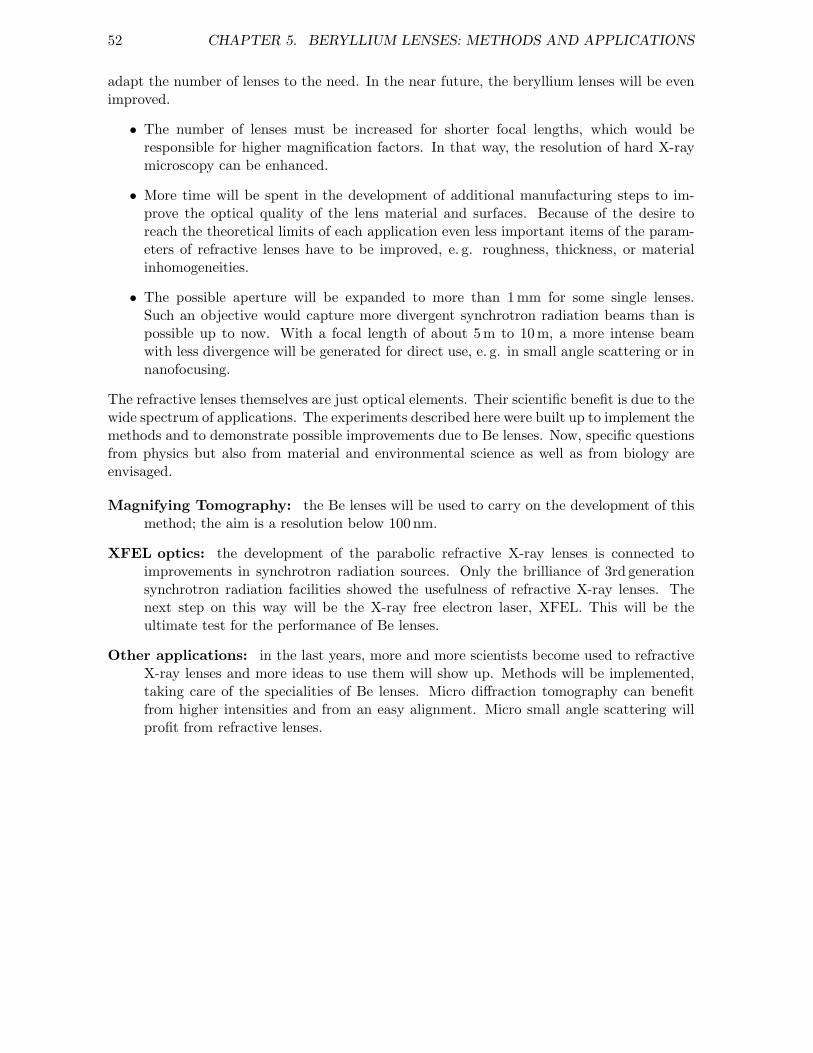
52 CHAPTER 5. BERYLLIUM LENSES: METHODS AND APPLICATIONS
adapt the number of lenses to the need. In the near future, the beryllium lenses will be evenimproved.
• The number of lenses must be increased for shorter focal lengths, which would beresponsible for higher magnification factors. In that way, the resolution of hard X-raymicroscopy can be enhanced.
• More time will be spent in the development of additional manufacturing steps to im-prove the optical quality of the lens material and surfaces. Because of the desire toreach the theoretical limits of each application even less important items of the param-eters of refractive lenses have to be improved, e. g. roughness, thickness, or materialinhomogeneities.
• The possible aperture will be expanded to more than 1 mm for some single lenses.Such an objective would capture more divergent synchrotron radiation beams than ispossible up to now. With a focal length of about 5 m to 10 m, a more intense beamwith less divergence will be generated for direct use, e. g. in small angle scattering or innanofocusing.
The refractive lenses themselves are just optical elements. Their scientific benefit is due to thewide spectrum of applications. The experiments described here were built up to implement themethods and to demonstrate possible improvements due to Be lenses. Now, specific questionsfrom physics but also from material and environmental science as well as from biology areenvisaged.
Magnifying Tomography: the Be lenses will be used to carry on the development of thismethod; the aim is a resolution below 100 nm.
XFEL optics: the development of the parabolic refractive X-ray lenses is connected toimprovements in synchrotron radiation sources. Only the brilliance of 3rd generationsynchrotron radiation facilities showed the usefulness of refractive X-ray lenses. Thenext step on this way will be the X-ray free electron laser, XFEL. This will be theultimate test for the performance of Be lenses.
Other applications: in the last years, more and more scientists become used to refractiveX-ray lenses and more ideas to use them will show up. Methods will be implemented,taking care of the specialities of Be lenses. Micro diffraction tomography can benefitfrom higher intensities and from an easy alignment. Micro small angle scattering willprofit from refractive lenses.

Chapter 6
XANES Microtomography
X-ray absorption near edge structure, XANES, is a well established analytical method for thelocal and atomspecific electronic structure in condensed matter with the emphasis in bondangles and coordination geometry. As part of X-ray absorption fine structures, XAFS, itstheory is sketched in the following section. Scanning tomography was introduced in chapter5.3 as non destructive analytic method which benefits of the current developments of parabolicrefractive lenses. The local sensitivity of XANES and the spatial mapping of tomography arecombined with a micro probe technique to improve the spatial resolution. In particular,heterogeneous and/or small sample textures can be analyzed. The experimental realizationin section 6.3 describes the complexity of this new combination. Finally, the achieved results,partially published in [43], will demonstrate the significant improvements in XANES andscanning tomography.
6.1 X-Ray Absorption Fine Structure (XAFS)
A sample is illuminated with monochromatic X-rays, whose energy is tuned around theabsorbtion edge of a specific chemical element. The transmitted intensity is given by theLambert-Beer law
IAbs(E) = I0(E) · e−µ(E)·d . (6.1)
The measured intensity IAbs is exponentially attenuated with the thickness d of the material,and with its attenuation coefficient µ, which is a function of the energy.Absorption dramatically increases at an absorption edge. The energy of the edges is increasingwith higher Z and decreasing with higher shells. Figure 6.1 illustrates these effects. Theattenuation coefficient µ is plotted versus the energy in the vicinity of the K-absorption edgesof atomic Cu (Z=29) and Zn (Z=30) as well as the K- and L-edges of Pd (Z=46). Thelocation of the edges is element specific. The K-edges of the neighboring elements Cu and Znare clearly distinguished.After absorption of a photon, the atom is excited. Depending on its kinetic energy, the elec-tron will be excited into the continuum or it may occupy an empty valence orbital. Afterabsorption, the excited atom will return to the ground state by Auger emission or by fluores-cence emission. Auger emission dominates for small excitation energies, whereas fluorescencedominates for deep core excitation. Absorption edges in atoms are marked by an abruptincrease in absorption when the photon energy exceeds the edge energy. At the same time,Auger yield and fluorescence increases dramatically. In condensed matter and molecules a
53
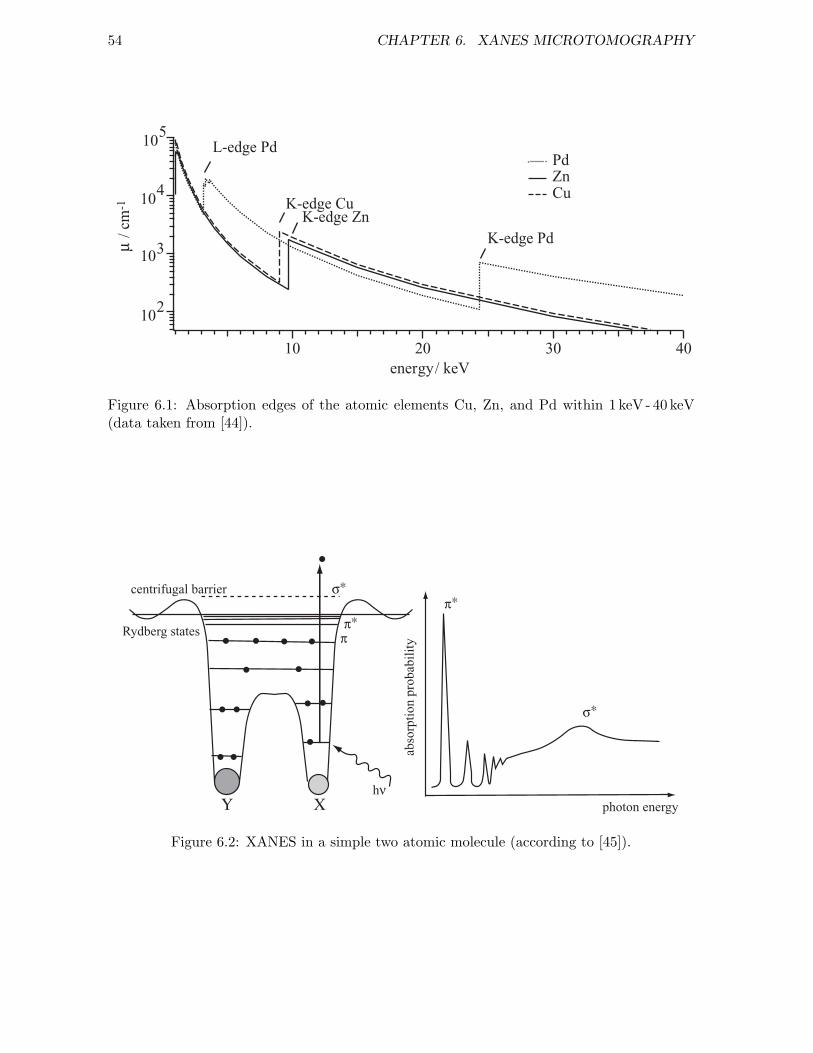
54 CHAPTER 6. XANES MICROTOMOGRAPHY
102
103
104
µ / c
m-1
40302010energy / keV
Pd Zn Cu
L-edge Pd
K-edge Cu K-edge Zn
K-edge Pd
105
Figure 6.1: Absorption edges of the atomic elements Cu, Zn, and Pd within 1 keV - 40 keV(data taken from [44]).
Rydberg states
centrifugal barrier
photon energy
σ∗
ππ∗
hν
abso
rptio
n pr
obab
ility
σ∗
π∗
XY
Figure 6.2: XANES in a simple two atomic molecule (according to [45]).
6.1. X-RAY ABSORPTION FINE STRUCTURE (XAFS) 55
fine structure is observed in the absorption at the edge and above it. Figure 6.2 demonstratesthe origin of a XANES spectrum for a simple two atomic molecule. The K-edge of atom Xis exceeded by the exciting photon hν. With increasing photon energy the first empty elec-tronic states will be occupied by the photoelectron. They give rise to sharp features in theabsorption. In the case of figure 6.2, the molecular σ∗ anti bonding state is the highest boundend state before the excitation occurs into free states. XANES can study the local order incomplex systems. As a matter of fact, molecules, clusters, surfaces and heterogeneous solidscan be analyzed, because no periodic structures are needed. Later in this chapter this will beshown by the analysis of biological samples and porous catalyst grains.In condensed matter an extended X-ray fine structure (EXAFS) is observed which may beextend to 1 keV above the edge. It is due to interference of the outgoing and backscatteredphotoelectron wave which is scattered by atoms in the neighborhood of the absorbing atom.Figure 6.3 illustrates constructive and destructive interference. For constructive interferencethe probability for finding the photoelectron outside of the absorber is larger than withoutneighboring atoms. The absorption shows a maximum. On the contrary, for destructiveinterference the probability to detect the photoelectron outside the absorber is lower thanwithout neighbors; µ(E) has a minimum. In general, µ(E) varies between these two extremesas a function of the photoelectron wave vector k which is linked to the photoelectron energyEp = E - E0 =(h2k2)/(2m). Here E is the photon energy and E0 is the binding energy of thephotoelectron prior to absorption.In the following sections XANES spectra are analyzed in detail, whereas the EXAFS oscilla-tions are considered in regard to their disturbing influences on them. Therefore, the EXAFStheory is left to the textbooks [46, 47].Here, only K-edges of different atoms will be analyzed. These edges are preferred due to theclearer evidence they provide. In the first place this is because the edges with higher energiesare well separated from other edges resulting in little disturbances from other absorbers. Theoverall absorption cross section for hard X-rays is weak and follows a decreasing Victoreenfunction with increasing energy [45]. A higher sample transparency due to a high X-rayenergy is an advantage. The use of beryllium as lens material makes more K-edges accessiblecompared to a refractive lens optics made of aluminium. In particular, within the energyrange from 5 keV to 20 keV the K-edges of the element Cr to Mo can be analyzed.A measured Cu K-edge spectra is shown in figure 6.4. The attenuation coefficient µ is dis-played versus increasing photon energy. The different analytical energy regions are specifiedwithin the figure. As definition of the edge, we use the position of the first inflection pointof the edge jump, which is marked by a dashed line at 8.979 keV. The edge region and thefirst peak are formed by the orbital transitions 1s to 4p. It is noteworthy that the edgestructure and the edge position vary with the valence and the type of coordination of theabsorber atom. For instance, they differ substantially between copper metal and the differentcopper oxides. The strong XANES peaks are followed by the EXAFS structures which aremeasurable beyond the Zn K-edge at 9.565 keV.
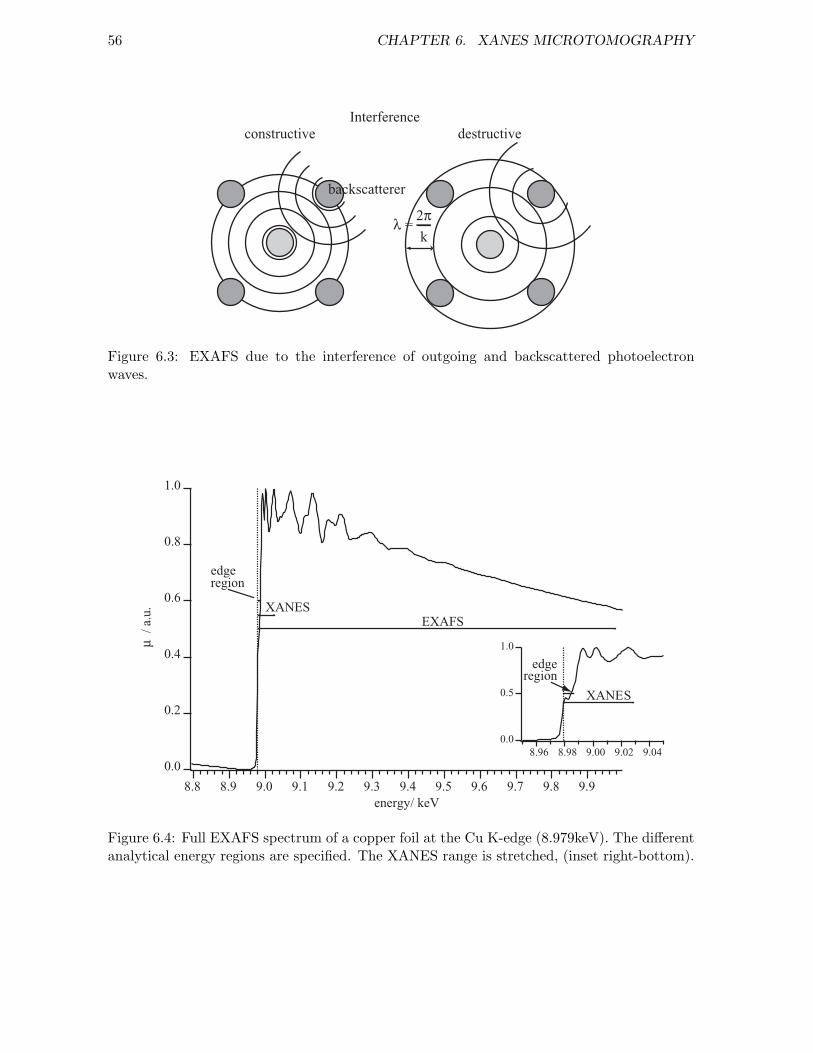
56 CHAPTER 6. XANES MICROTOMOGRAPHY
Interferenceconstructive destructive
λ =k
2π
backscatterer
Figure 6.3: EXAFS due to the interference of outgoing and backscattered photoelectronwaves.
1.0
0.8
0.6
0.4
0.2
0.0
µ /
a.u.
9.99.89.79.69.59.49.39.29.19.08.98.8energy / keV
EXAFS
edge
XANES
region
1.0
0.5
0.09.049.029.008.988.96
XANES
edgeregion
Figure 6.4: Full EXAFS spectrum of a copper foil at the Cu K-edge (8.979keV). The differentanalytical energy regions are specified. The XANES range is stretched, (inset right-bottom).
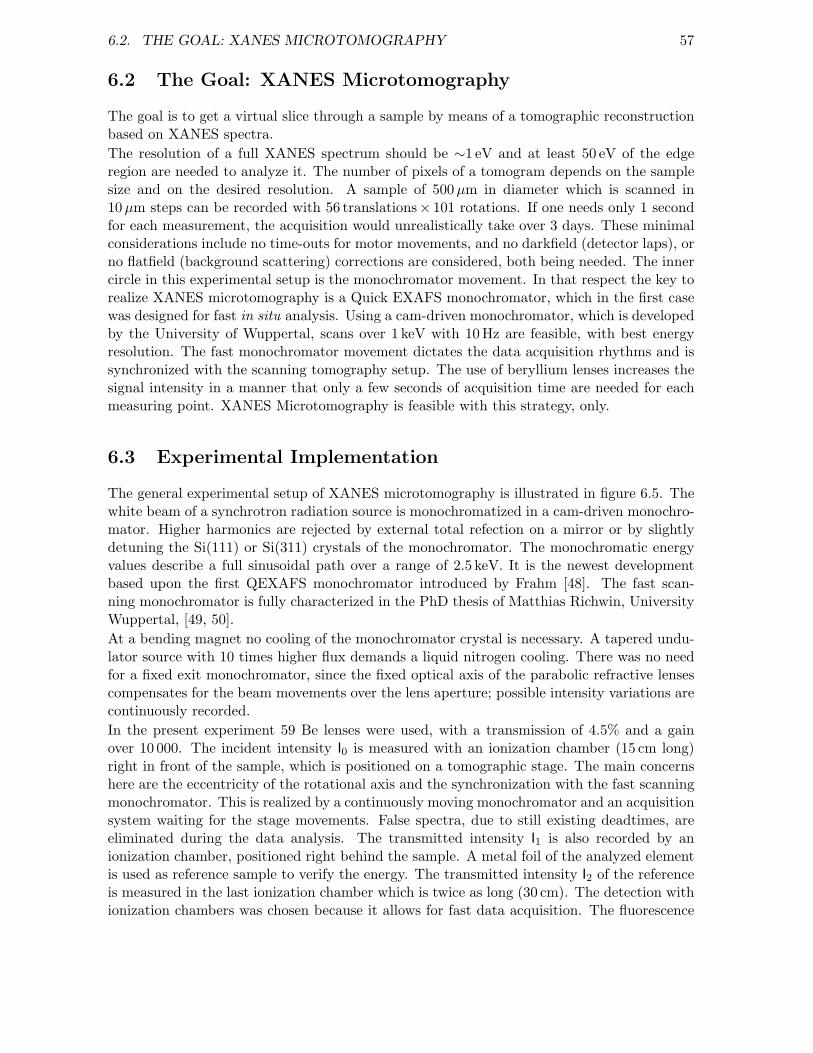
6.2. THE GOAL: XANES MICROTOMOGRAPHY 57
6.2 The Goal: XANES Microtomography
The goal is to get a virtual slice through a sample by means of a tomographic reconstructionbased on XANES spectra.The resolution of a full XANES spectrum should be ∼1 eV and at least 50 eV of the edgeregion are needed to analyze it. The number of pixels of a tomogram depends on the samplesize and on the desired resolution. A sample of 500µm in diameter which is scanned in10 µm steps can be recorded with 56 translations× 101 rotations. If one needs only 1 secondfor each measurement, the acquisition would unrealistically take over 3 days. These minimalconsiderations include no time-outs for motor movements, and no darkfield (detector laps), orno flatfield (background scattering) corrections are considered, both being needed. The innercircle in this experimental setup is the monochromator movement. In that respect the key torealize XANES microtomography is a Quick EXAFS monochromator, which in the first casewas designed for fast in situ analysis. Using a cam-driven monochromator, which is developedby the University of Wuppertal, scans over 1 keV with 10 Hz are feasible, with best energyresolution. The fast monochromator movement dictates the data acquisition rhythms and issynchronized with the scanning tomography setup. The use of beryllium lenses increases thesignal intensity in a manner that only a few seconds of acquisition time are needed for eachmeasuring point. XANES Microtomography is feasible with this strategy, only.
6.3 Experimental Implementation
The general experimental setup of XANES microtomography is illustrated in figure 6.5. Thewhite beam of a synchrotron radiation source is monochromatized in a cam-driven monochro-mator. Higher harmonics are rejected by external total refection on a mirror or by slightlydetuning the Si(111) or Si(311) crystals of the monochromator. The monochromatic energyvalues describe a full sinusoidal path over a range of 2.5 keV. It is the newest developmentbased upon the first QEXAFS monochromator introduced by Frahm [48]. The fast scan-ning monochromator is fully characterized in the PhD thesis of Matthias Richwin, UniversityWuppertal, [49, 50].At a bending magnet no cooling of the monochromator crystal is necessary. A tapered undu-lator source with 10 times higher flux demands a liquid nitrogen cooling. There was no needfor a fixed exit monochromator, since the fixed optical axis of the parabolic refractive lensescompensates for the beam movements over the lens aperture; possible intensity variations arecontinuously recorded.In the present experiment 59 Be lenses were used, with a transmission of 4.5% and a gainover 10 000. The incident intensity I0 is measured with an ionization chamber (15 cm long)right in front of the sample, which is positioned on a tomographic stage. The main concernshere are the eccentricity of the rotational axis and the synchronization with the fast scanningmonochromator. This is realized by a continuously moving monochromator and an acquisitionsystem waiting for the stage movements. False spectra, due to still existing deadtimes, areeliminated during the data analysis. The transmitted intensity I1 is also recorded by anionization chamber, positioned right behind the sample. A metal foil of the analyzed elementis used as reference sample to verify the energy. The transmitted intensity I2 of the referenceis measured in the last ionization chamber which is twice as long (30 cm). The detection withionization chambers was chosen because it allows for fast data acquisition. The fluorescence
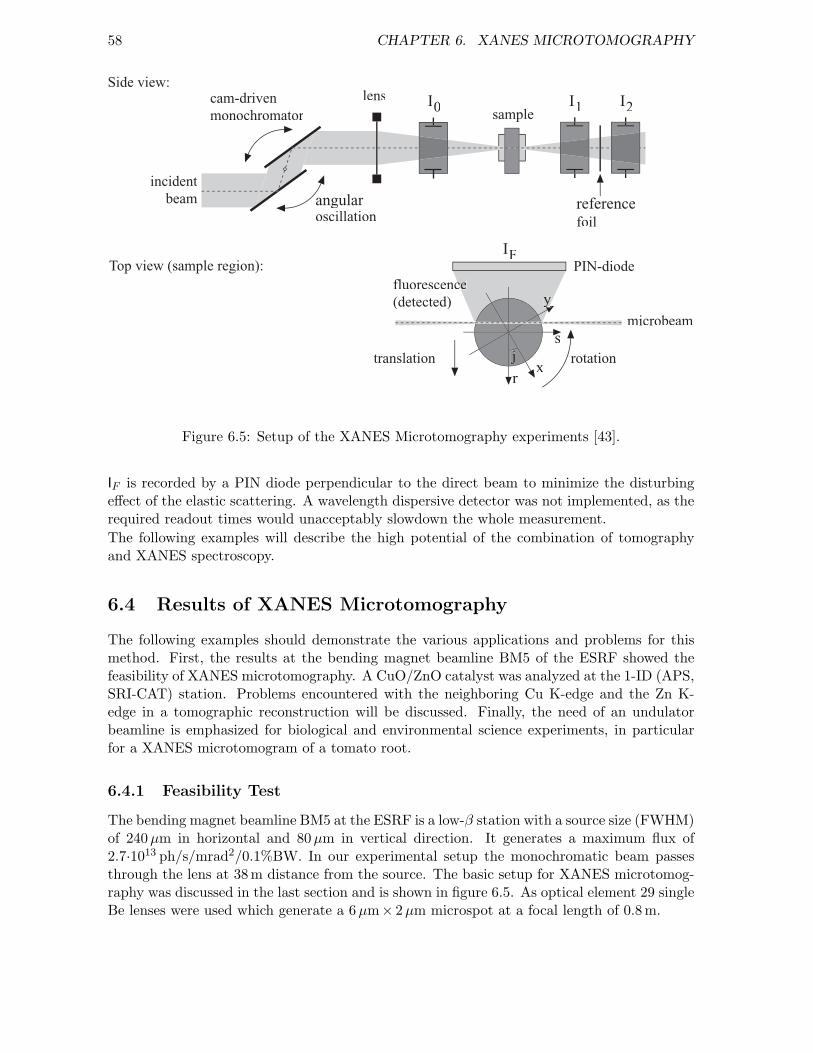
58 CHAPTER 6. XANES MICROTOMOGRAPHY
Side view:
Top view (sample region):
lens I0 I1 I2sample
referencefoil
angularoscillation
cam-drivenmonochromator
microbeam
PIN-diode
translation rotationr
s
x
yyy
j
IF
fluorescencce(detected)
incidentbeam
Figure 6.5: Setup of the XANES Microtomography experiments [43].
IF is recorded by a PIN diode perpendicular to the direct beam to minimize the disturbingeffect of the elastic scattering. A wavelength dispersive detector was not implemented, as therequired readout times would unacceptably slowdown the whole measurement.The following examples will describe the high potential of the combination of tomographyand XANES spectroscopy.
6.4 Results of XANES Microtomography
The following examples should demonstrate the various applications and problems for thismethod. First, the results at the bending magnet beamline BM5 of the ESRF showed thefeasibility of XANES microtomography. A CuO/ZnO catalyst was analyzed at the 1-ID (APS,SRI-CAT) station. Problems encountered with the neighboring Cu K-edge and the Zn K-edge in a tomographic reconstruction will be discussed. Finally, the need of an undulatorbeamline is emphasized for biological and environmental science experiments, in particularfor a XANES microtomogram of a tomato root.
6.4.1 Feasibility Test
The bending magnet beamline BM5 at the ESRF is a low-β station with a source size (FWHM)of 240µm in horizontal and 80µm in vertical direction. It generates a maximum flux of2.7·1013 ph/s/mrad2/0.1%BW. In our experimental setup the monochromatic beam passesthrough the lens at 38 m distance from the source. The basic setup for XANES microtomog-raphy was discussed in the last section and is shown in figure 6.5. As optical element 29 singleBe lenses were used which generate a 6 µm× 2 µm microspot at a focal length of 0.8 m.
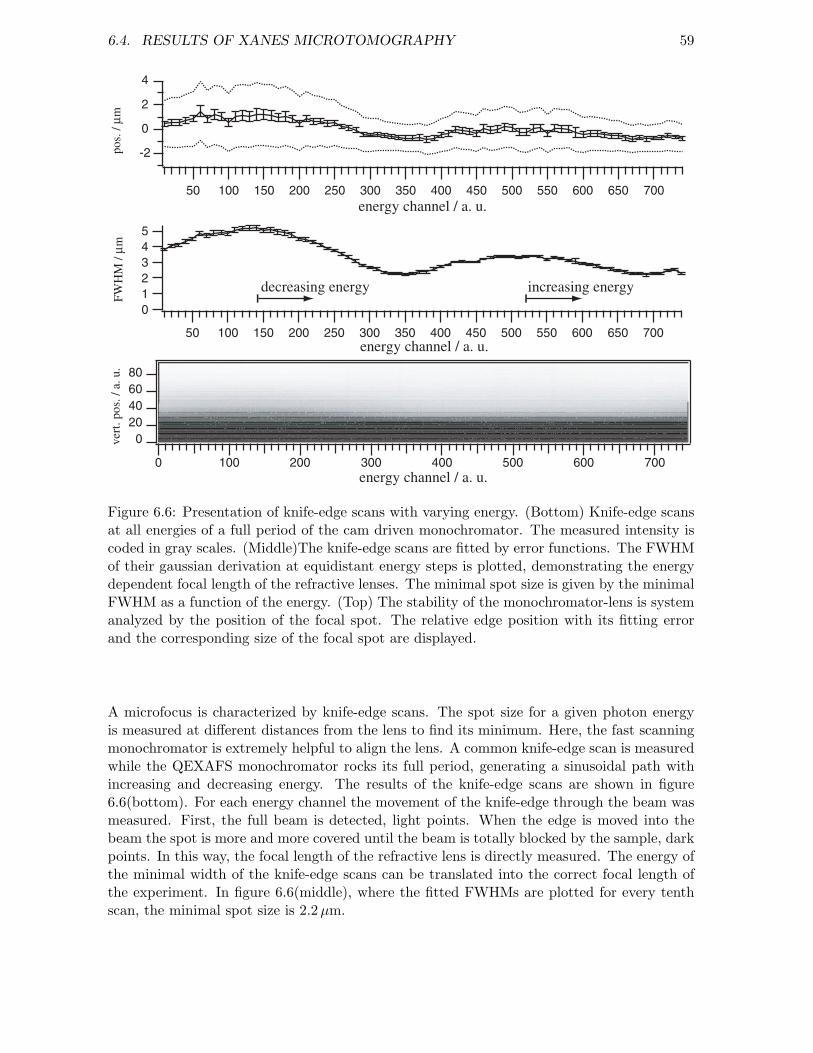
6.4. RESULTS OF XANES MICROTOMOGRAPHY 59
80604020
0 ver
t. po
s. /
a. u
.
7006005004003002001000 energy channel / a. u.
FWH
M /
µm
energy channel / a. u.
pos.
/ µm
energy channel / a. u.
4
2
0
-2
70065060055050045040035030025020015010050
543210
70065060055050045040035030025020015010050
decreasing energy increasing energy
Figure 6.6: Presentation of knife-edge scans with varying energy. (Bottom) Knife-edge scansat all energies of a full period of the cam driven monochromator. The measured intensity iscoded in gray scales. (Middle)The knife-edge scans are fitted by error functions. The FWHMof their gaussian derivation at equidistant energy steps is plotted, demonstrating the energydependent focal length of the refractive lenses. The minimal spot size is given by the minimalFWHM as a function of the energy. (Top) The stability of the monochromator-lens is systemanalyzed by the position of the focal spot. The relative edge position with its fitting errorand the corresponding size of the focal spot are displayed.
A microfocus is characterized by knife-edge scans. The spot size for a given photon energyis measured at different distances from the lens to find its minimum. Here, the fast scanningmonochromator is extremely helpful to align the lens. A common knife-edge scan is measuredwhile the QEXAFS monochromator rocks its full period, generating a sinusoidal path withincreasing and decreasing energy. The results of the knife-edge scans are shown in figure6.6(bottom). For each energy channel the movement of the knife-edge through the beam wasmeasured. First, the full beam is detected, light points. When the edge is moved into thebeam the spot is more and more covered until the beam is totally blocked by the sample, darkpoints. In this way, the focal length of the refractive lens is directly measured. The energy ofthe minimal width of the knife-edge scans can be translated into the correct focal length ofthe experiment. In figure 6.6(middle), where the fitted FWHMs are plotted for every tenthscan, the minimal spot size is 2.2 µm.

60 CHAPTER 6. XANES MICROTOMOGRAPHY
Another characteristic of the microspot can be demonstrated by means of such knife-edgescans at various energies. It has been mentioned that any displacement of the beam by theQEXAFS monochromator parallel to the optical axis will be compensate by the refractive lens.Any angular change of the beam at different energies would lead to a not tolerable change inthe analyzed volume of the sample. Information of the stability of the microspot is needed.Therefore, the fitted positions of the knife-edge scans are analyzed, figure 6.6(top). The centerpositions of the fits are plotted and the fitting errors are displayed, the corresponding spot sizeis shown as envelope of dotted lines. To understand the results it has to be mentioned thatthe used knife-edge had wedge shape. So the gaussian profile of the beam was convolutedwith the increasing absorption of the knife-edge. This results in the relative shifts of thebeginning of the edge and of its center. Whereas the position of total absorption of the beamis stable over the complete energy range by at least ±0.1µm. The artefact due to the designof the knife-edge is negligible for this value. The excellent beam stability documents theperformance of the monochromator and the optic.The technique is now applied to a partially oxidized copper wire 50µm in diameter. In figure6.7(1) the object is shown in magnification. Obviously, the image suffers from the poor depthof sharpness of light microscope images. Nevertheless, one can clearly distinguish betweenthe red copper(I)oxide [Cu2O] and the black copper(II)oxide [CuO]. A scratch in the oxidesreveals the metallic copper core. These copper species have only slight differences in theirXANES spectra and were chosen as test material for that reason. The differences in the fullXANES spectra allow to distinguish between the Cu species, but there are no energies atwhich single measurements would be likewise sufficient.A scanning tomogram is recorded at a virtual slice through the sample. A XANES analysis iscarried out for each combination of a rotation angle and a translation position. The incidentintensity I0, the transmitted intensity I1, the intensity I2 behind a 12µm thick reference Cu foiland the fluorescence radiation I3 are measured 300 times when the QEXAFS monochromatorrocks back and forth through an energy range around the Cu K-edge. Figure 6.7(2) shows atypical scan. The edge region is covered twice, once with increasing and once with decreasingenergy. Each spectrum is energy calibrated relative to the Cu signal. 32 projections with25 translation steps were recorded for 60 s, in order to get the required data statistics. Thereconstruction of the tomograms is as described in section 5.3, however the data for the wholeXANES region have to be processed. As a consequence, a sinogram is generated for eachenergy step. In the actual example there are 380 energy steps within an edge region and atotal of 950 energy points were measured. Figure 6.7(3) presents two sinograms. The firstbelow the Cu K-edge and the other above the edge. The diagrams illustrate in their colorsthe attenuation coefficient. The striking differences in the images of figure 6.7(3) reflect thecomposition of this test sample. Finally, part (4) of figure 6.7 shows reconstructed tomograms.The first tomogram belongs to an energy above the Cu K-edge. Obviously, the sample wastoo absorbing so that artifacts were introduced into the reconstruction resulting in a darkercenter in the absorption image. The tomograms of figure 6.7(4) illustrate that the metalliccopper core inside the sample was detected, but only the Cu2O surface layer was found.Due to the resolution of 5µm per projection, due to the high total absorption, and due toinsufficient data statistics existent CuO at the surface was not detected. A better resolutionin the tomogram can be achieved but only if the photon flux in the focal spot can be increased.This required an undulator beam line. The intensity from a bending magnet is not sufficient.
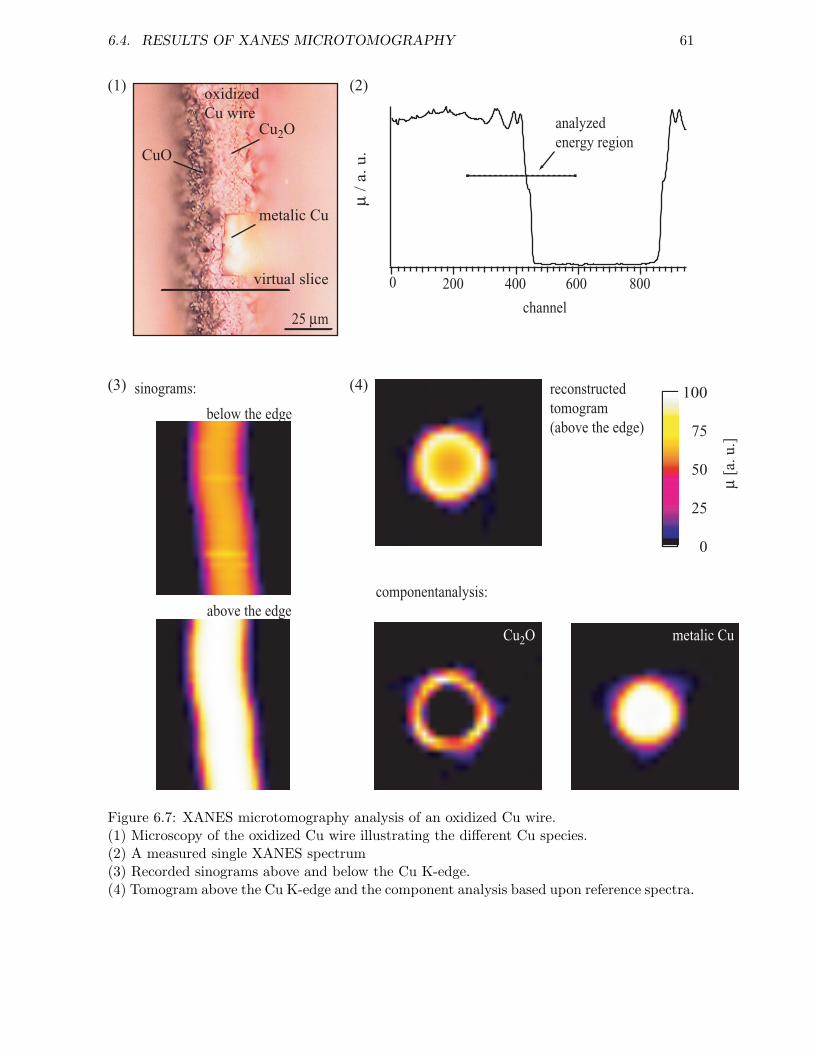
6.4. RESULTS OF XANES MICROTOMOGRAPHY 61
metalic Cu
Cu2O
CuO
virtual slice
(1) (2)
(3) (4)
µ /
a. u
.
8006004002000
channel
analyzedenergy region
sinograms:
above the edge
below the edge
reconstructed tomogram (above the edge)
componentanalysis:
metalic CuCu2O
µ [a
. u.]
100
0
50
75
25
oxidizedCu wire
25 µm
Figure 6.7: XANES microtomography analysis of an oxidized Cu wire.(1) Microscopy of the oxidized Cu wire illustrating the different Cu species.(2) A measured single XANES spectrum(3) Recorded sinograms above and below the Cu K-edge.(4) Tomogram above the Cu K-edge and the component analysis based upon reference spectra.

62 CHAPTER 6. XANES MICROTOMOGRAPHY
6.4.2 Catalyst Science
The search for effective catalysts is an important task in chemistry and chemical technology.X-ray absorption spectroscopy, and in particular XANES, is an excellent analytical tool forstudying heterogeneous catalysts. As an example, we consider a CuO/ZnO catalyst usedin methanol synthesis. XANES studies have been reported for this system [51, 52]. TheInstitute of Chemistry and Bioengineering of the Swiss Federal Institute of Technology hasbuilt a reactor to control the environment of the catalytical reaction. In situ experimentswere carried out, in particular with EXAFS studies [50, 53]. The central part of this reactoris a glass capillary filled with a granular catalyst embedded in a boronnitride matrix. Forour XANES microtomography we have chosen such a reactor capillary. The capillary wasfilled with a 30% CuO/ZnO catalyst that was twice reduced and reoxidized by 4% H2/Heand 2%O2/He at 200C - 300C. The reduction/reoxidation was checked by QEXAFS. Afterthe final reduction the grown Cu-particles on ZnO were reoxidized at room temperature.
... at the Cu K-edge
First the beam was tuned to the Cu K-edge at 8.979 keV. A slice through the capillary wasscanned at 90 equidistant lateral positions. We have used a beryllium refractive lens withN =51 and a focal length of 0.479 m. Two reconstructed tomograms, one above and one belowthe edge, are shown in figure 6.8(1a,b) [25]. The perfect circle of the glass capillary is visible.Since the glass contains no copper the signal from the capillary is the same below and abovethe Cu K-edge. On the other hand, the Cu and Zn catalyst, inside the glass tube, showstrong variations in absorption below and above the edges. In a XANES microtomographya full X-ray energy scan is taken at each tomographic position. A total of 90 000 XANESspectra have been taken. Reconstruction allows to calculate the XANES spectrum for eachpixel in the sample. Examples are given in the figure 6.8(1c): pixel 5 in the glass capillaryshows no edge structure near the Cu K-edge, since it contains no copper. The pixel 1, 2, 3,4, and 6, on the other hand, all show a Cu K-edge. In order to identify the type of Cu inthe catalysts, three Cu reference samples have been measured under identical conditions asthe catalyst: metallic Cu, monovalent copper oxide Cu2O and divalent copper oxide CuO.It turned out that all of the spectra for the catalyst were mixtures of the three referencespectra with different fractions for different pixels. For instance, pixel 2 contains 48% Cuand 52% Cu2O, while pixel 6 contains 37% Cu and 63% Cu2O. The overall result is shown infigure 6.8(part 2). Figure 2a gives the metallic Cu content whereas figure 2b gives the Cu2Ocontribution. The fraction of CuO was always below the detection limit due to the fittingerrors (about 2%).

6.4. RESULTS OF XANES MICROTOMOGRAPHY 63
80
60
40
20
0
µ [a
. u.]
(3)
(4)(5)
(2)
(6)
(1)
Cu Cu(I)2O Cu(II)O
(c) spectra at different locations 1-6 and reference spectraff
(a) below Cu K-edge (b) above Cu K-edge
µ[a
. u.]
(6)(5)
(3)
200µm0
35
70
8980 9000 9020 9040Energy [eV]
(1)
(2)
200 µm
(a) Cu metallic (b) Cu(I)2Oµ
[a. u
.]
100
0
50
75
25
Figure 6.8: XANES Microtomography of a CuO/ZnO-Catalyst at the Cu K-edge: (1) recordedtomograms (1a) below and (1b) above the edge. The spectra measured in the different pixels1 - 6, (1c), turned out to be combinations of the spectra for Cu (2a) and Cu2O (2b) withdifferent fractions of both in different pixels. [43]

64 CHAPTER 6. XANES MICROTOMOGRAPHY
below Zn K-edge above Zn K-edge
µ [a
. u.]
100
0
50
75
25
0.13
0.12
0.11
0.10
µ [a
. u.]
9659eV energy
artefact due to a superposedCu EXAFS spectrum
Figure 6.9: (Top) Recorded tomograms of the CuO/ZnO-Catalyst above and below the ZnK-edge. (Bottom) Reconstructed XANES spectrum at the Zn K-edge demonstrating theinfluence of Cu species therein.
... at the Zn K-edge
The Zn K-edge is located 680 eV above the Cu K-edge. In order to keep the experimen-tal setup as similar as possible for the Cu and Zn XANES measurements 8 additional Belenses have been added to the stack so that the focal length is kept identical at both edges.All other parameters were also kept similar: 101 rotation over 360, 10 µm horizontal stepsize, monochromator scanned with 10 Hz, data points recorded at 0.037 eV step size, totalmeasuring time about 6 hours.Figure 6.9(top) shows the tomograms below and above the Zn K-edge, at 9.659 keV, for thesame virtual slice as in figure 6.8. A few points are noteworthy: (1) it is possible to probe thesame cross section of the sample at different energies; shifts in beam position are negligible.(2) The cross section under investigation contains Zn, as indicated by the increasing signalabove the Zn K-edge. However, at the Zn K-edge, copper is still contributing to the signal.
6.4.3 Biological and Environmental Science
Zinc (Zn) is a very common trace element in plants. However, the natural concentration offree Zn is typically below 1 ion per cell. It is needed as receptor and for transport processesin a plants. However, in higher concentrations Zn is a heavy metal pollutant.

6.4. RESULTS OF XANES MICROTOMOGRAPHY 65
In our case the sample was a root of a tomato plant living in symbiosis with the fungus mycor-rhyzal. The plant was grown on a soil, which was polluted with zinc and lead and which wasalso inoculated with the fungus. This biologic system is studied by W. Schroder at the Insti-tute of Chemistry and Dynamics of the Geosphere III: Phytosphere, Research Center Julich.It is investigated how such symbiotic plants are able to withstand the polluted environment.This understanding is essential to renaturalize areas with destroyed ecological system. Theoverall concentration of Zn in the root of the tomato plant was below 100 ppm. This still lowconcentration was analyzed with XANES microtomography in order to determine the spatialcomposition of the Zn in the root and to additionally examine its chemical state.The analyzed section of the root is about 700µm in diameter. For the XANES microtomogramthe root was scanned with 87 translations and 101 rotations over the full 360. Therefore, aresolution of 10µm was achieved for the tomograms shown in figure 6.10(a). The measureddistribution of Zn was already known from former scanning tomography experiments [23]. TheZn concentration is high at the border of the root. Zn is the strongly absorbing species inan otherwise low absorbing biological matrix. Inside the sample, some pixels show significantabsorption at photon energies above the Zn K-edge. This region is of interest in termsof transport processes in the tomato plant. The difficulties with the dilute concentration,which is typical for biologic samples, becomes visible in the reconstruction of the absorptionmeasurements. Whereas the tomograms of figure 6.10(a) below and above the Zn K-edge,at 9.659 keV, detected an increase in absorption, it was not possible to reconstruct XANESspectra for all pixels of interest. To illustrate this, two pixels are analyzed in detail. For pixel(1) the highest Zn concentration was measured, and the reconstructed XANES spectrumshows an edge structure, figure 6.10(c). On the other hand, for pixel (2), positioned insidethe root, no edge structure occurs, figure 6.10(d). Both pixels are typical therein for theregions at the border and inside the root, respectively.Based only on the information of the absorption measurements the aim of the experiment,the determination of the Zn species for a virtual slice of the root, would not be accomplished.Hence, the fluorescence emitted by the sample is needed. In figure 6.10(b) the fluorescencedata are illustrated for the same incident photon energies as for the absorption. In general, themeasured intensity of fluorescence is less than the transmitted intensity. But the disturbancesdue to more absorbing components (here Pb in respect to Zn) are less, too. Therefore, thefluorescence tomograms of figure 6.10(b) were recorded. They show a significant increase ofthe fluorescence intensity above the Zn K-edge.The fluorescence intensity inside the root is very weak. Nevertheless, for one region insidethe sample, 12 connected pixels around the marked pixel (2), a Zn XANES structure wasreconstructed.Because of the different origin of fluorescence in respect to the absorption the reconstructionalgorithms slightly differ in both cases [54, 35]. Further, selfabsorption effects have to beconsidered in the fluorescence signal. Since the sinogram of the tomato root in figure 6.11shows no significant intensity fading the selfabsorption correction was not implemented in thiscase. An algorithm to correct the selfabsorption for fluorescence tomography was introducedin [35], but it considers incident radiation away from the absorption edges of the samplecomponents. In the future, a correction algorithm for selfabsorption in the reconstruction ofXANES fluorescence tomography will be implemented based on the simultaneously recordedabsorption.

66 CHAPTER 6. XANES MICROTOMOGRAPHY
(1)
(2)
below Zn K-edge above Zn K-edge 100
0
50
75
25
µ / a
. u.
200 µm
(1)
(2)
below Zn K-edge above Zn K-edge 100
0
50
75
25
fluo
resc
ence
/ a.
u.
200 µm
45
40
35
30
25
20
15
flu
ores
cenc
e /
a. u
. x10
-3
9659 eV energy
5.0
4.5
4.0
3.5
3.0
2.5
2.0
µ /
a. u
.
9659 eV energy
1.2
1.0
0.8
0.6
0.4
flu
ores
cenc
e / a
. u.
9659 eV energy
20
19
18
17
16
15
µ /
a. u
.
9659 eV energy
(a) Absorption
(b) Fluorescence
(c) Absorption spectrum of pixel 1 (d) Absorption spectrum of pixel 2
(e) Fluorescence spectrum of pixel 1 (f) Fluorescence spectrum of pixel 2
Figure 6.10: Reconstructed tomograms of a tomato root in (a) absorption and in (b) fluo-rescence, each recorded before and above the Zn K-edge. (c-f) For the marked pixels thereconstructed XANES spectra are plotted.

6.5. CONCLUSIONS 67
projection a
ngle
Figure 6.11: Sinogram for the fluorescence measurement of the tomato root, illustratingselfabsorption effects inside a sample.
A chemical analysis of the XANES fluorescence tomograms is possible, even though the signalintensity of pixel (2) in figure 6.10(e) shows only ∼4% of the signal in the border region, figure6.10(f). Whereas the edge position in both fluorescence spectra is the same the curves showdifferent structures when the first peak decreases. These fine structures are not generatedby one single Zn species which was verified by reference substances. A detailed componentanalysis will be carried out in the near future.Up to now, it can be summarized that the high flux of the undulator synchrotron radiationsource at beamline 1-ID/APS has made a chemical analysis possible. The dilute concentra-tion of Zn in the root of a tomato plant can be analyzed by XANES microtomography influorescence mode.
6.5 Conclusions
XANES microtomography combines X-ray absorption spectroscopy with a high 3-dimensionalresolution; indeed, a full XANES spectrum is measured for each pixel of a tomogram. Thisopens new opportunities in many field of research, as demonstrated for 2 applications inthe field of catalysts and plant physiology. It was shown that neighboring elements in theperiodic table, like Cu and Zn, can clearly be distinguished. No assumptions are needed indata acquisition and processing. The XANES spectra can be measured in absorption andin fluorescence. For chemical elements, present in the sample in low concentrations, as forinstance in plants, fluorescence is the only adequate spectroscopy. The combination withabsorption measurements is needed to correct for the selfabsorption.Different extensions of the technique can be considered in the near future. X-ray absorptioncan be extended to a larger energy range in order to cover the EXAFS up to about 1 keVabove the edge. The QEXAFS monochromator is sufficient for that purpose. As shown in[49] this setup is able to cover a range of more than 2 keV at the Cu K-edge. However, itmust be taken into account that chromatic aberration of the refractive lenses generates someproblems in large energy scans, due to the change in focal length and a variation of the volumeprobed in each energy scan. A possible solution is a large focal length of the refractive lens.

68 CHAPTER 6. XANES MICROTOMOGRAPHY
As a consequence, the depth of field becomes large and the change in focal length becomesless important. In order to keep the good spatial resolution the X-ray source must be verysmall, as in a low-β undulator. An other approach is the use of achromatic mirrors as focusingoptic. In such a case a QEXAFS fixed exit monochromator is needed and new concepts forthe sample alignment have to be implemented.

Chapter 7
Nanofocusing
There is an increasing demand for analytical tools with submicrometer resolution. Biologicalcells are in the µm range. Nanotechnology is able to fabricate structure with 20 nm in size.Since most samples are inhomogeneous in structure X-ray probes should head for a lateralresolution of a few nanometers.This chapter presents a second implementation of parabolic refractive lenses for hard X-rays.Planar parabolic refractive lenses with an extremely small radius of curvature. A micro/nanoprobe is the demagnified image of a synchrotron radiation source, which is defined by thedesign of the synchrotron radiation storage ring and which is fixed in its dimensions (section5.2). Demagnification can be enhanced by different approaches: In a first approach, the X-raysource can be decreased by slits (Yun et al. [55]) or the source-optic distance L1 can be chosenvery large. This second option can only be realized at special beamlines, the 1 km beamlineat SPring8 [56] or the 140 m beamline ID19 at the ESRF [57]. Both solutions suffer fromintensity loss.Here, a different approach is presented which can be implemented in any synchrotron radiationsource of the 3rd generation. In the thin lens approximation the minimal focal length of aparabolic refractive lens is
fmin =√
f0l =
√RD
2δ. (7.1)
D is the length of an individual lens in the stack of total length l. For a given lens materialand a given photon energy, the decrement δ is fixed. Also, D is fixed by the aperture of thelens. As a consequence, the radius of curvature R must be made small in order to get a strongdemagnification of the source. A focal length of a few millimeter requires a radius of curvatureR of below 10µm. This can no longer be realized with a pressing technique. Therefore, a newdesign is implemented.
7.1 Design and Manufacturing of Nanofocusing Lenses
The fabrication of X-ray refractive nanofocusing lenses has benefitted from the microfabrica-tion techniques developed in semiconductor technology. Aristov et al. [58] have manufacturedplanar silicon lenses in 2000. Their aim was to optimize the transmission by means of kino-form shapes [21, 16]. Here, the aim was to minimize the focal spot by choosing a value of Rin the µm range [25]. These lenses are called NFL’s nanofocusing lenses.
69

70 CHAPTER 7. NANOFOCUSING
Figure 7.1: Scanning electron micrograph (SEM) of a arrays of silicon parabolic refractive X-ray lenses. The shaded area (a) is a single refractive lens, two complement concave parabolicshapes. Area (b) belongs to an NFL, the optical axis being parallel to the dashed line in themiddle of the lenses.[25]
The scanning electron microscope image in figure 7.1 shows a small part of an NFL array.The shaded area (a) shows a single lens, comparable to a single pressed lens. The shaded area(b) belongs to the end of an array of lenses. Eight different NFLs are visible in the image.Manufacturing starts with a silicon wafer thermally oxidized (layer thickness of 300 nm). Thenext step is the physical vapor deposition of 30 nm chromium. Then the positive electronbeam resist PMMA (poly methyl methacrylate) ’AR-P 659.04’ is spin coated on top. Figure7.2 illustrates the following structuring.
(1) E-beam lithography defines the starting structure. Thereby, proximity effects and theproblems with underetching of masks during the whole manufacturing are anticipatedupon an empirical base.
(2) The first transfer of the structure is done by chemical etching of the layer of chromiumby ammoniumceriumIV-nitrate in perchloric acid. After perchloric etching, the Cr canserve as hard mask for subsequent SiO2 etching.
(3) Reactive ion etching (RIE) of SiO2 was done in a ’SENTECH’ system. The processparameters were 20 sccm H2 and 5 sccm CHF3 under a pressure of 5 Pa and at a powerof 200 W.
(4) When the silicon bulk was reached the Cr hard mask was completely removed by wetetching.
(5) The lenses themselves are etched by commonly available deep trench RIE (co-operation
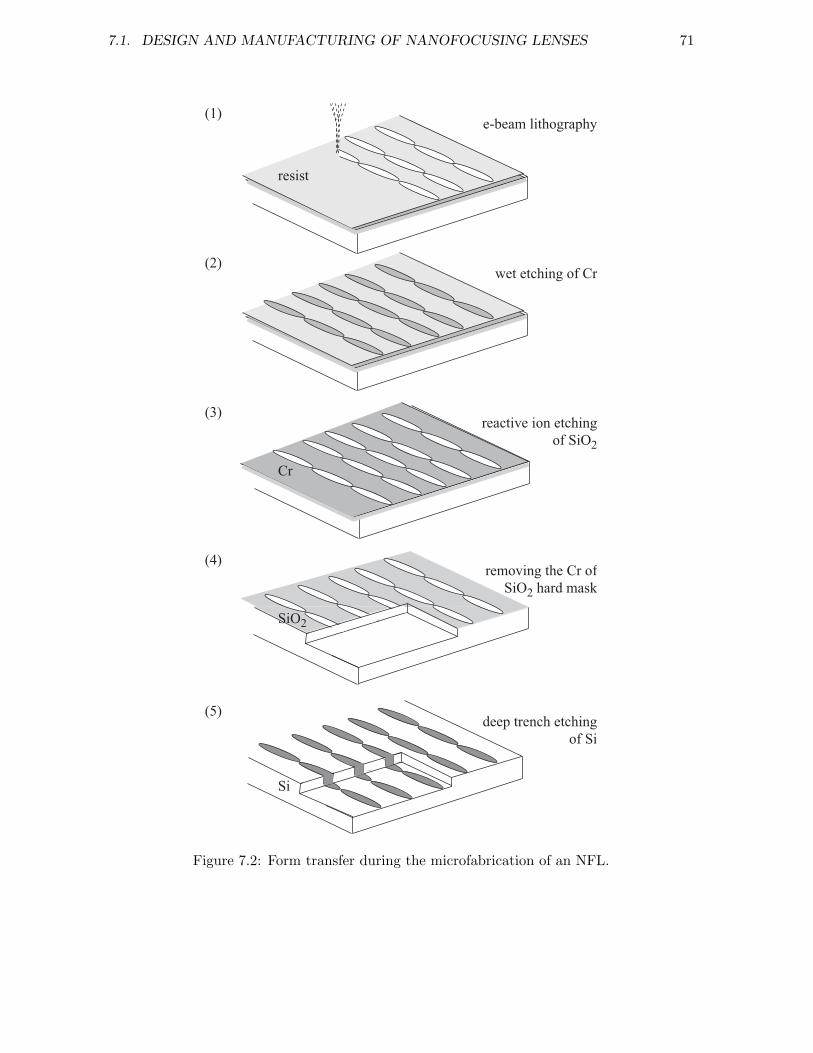
7.1. DESIGN AND MANUFACTURING OF NANOFOCUSING LENSES 71
(1)
(5)
(4)
(3)
(2)
resist
Cr
SiO2
Si
e-beam lithography
wet etching of Cr
reactive ion etching of SiO2
removing the Cr ofSiO2 hard mask
deep trench etchingof Si
Figure 7.2: Form transfer during the microfabrication of an NFL.
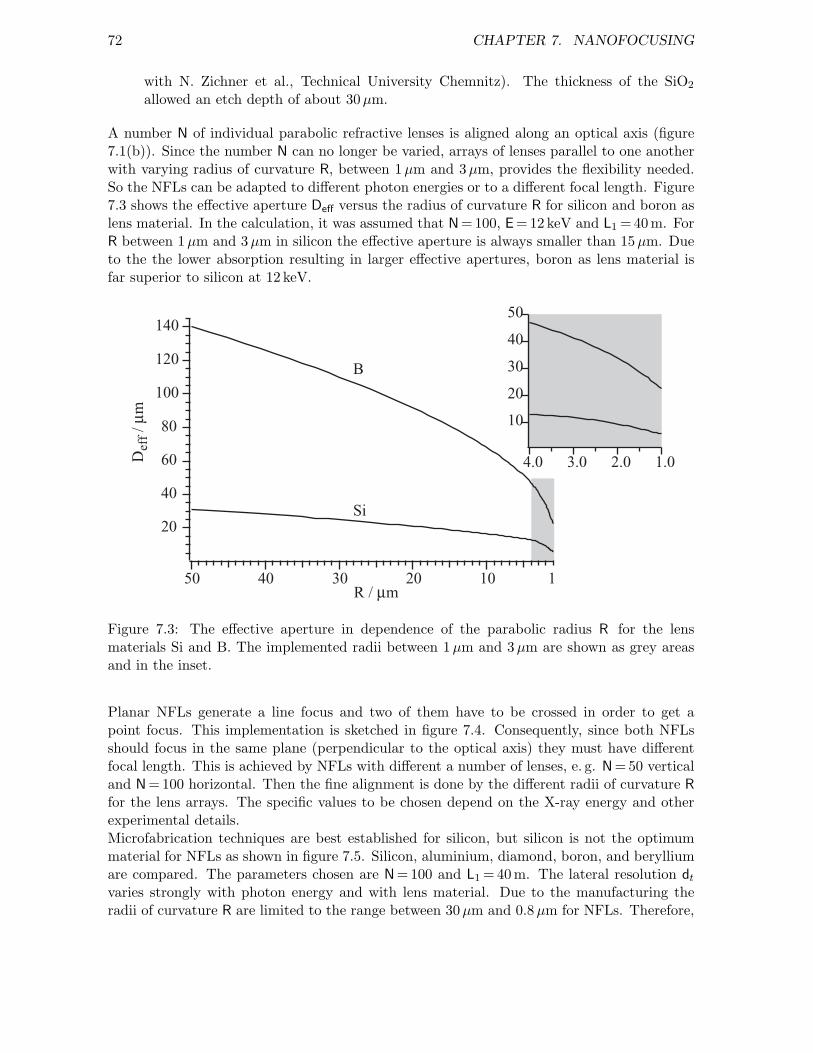
72 CHAPTER 7. NANOFOCUSING
with N. Zichner et al., Technical University Chemnitz). The thickness of the SiO2
allowed an etch depth of about 30µm.
A number N of individual parabolic refractive lenses is aligned along an optical axis (figure7.1(b)). Since the number N can no longer be varied, arrays of lenses parallel to one anotherwith varying radius of curvature R, between 1 µm and 3µm, provides the flexibility needed.So the NFLs can be adapted to different photon energies or to a different focal length. Figure7.3 shows the effective aperture Deff versus the radius of curvature R for silicon and boron aslens material. In the calculation, it was assumed that N = 100, E = 12 keV and L1 = 40 m. ForR between 1 µm and 3µm in silicon the effective aperture is always smaller than 15µm. Dueto the the lower absorption resulting in larger effective apertures, boron as lens material isfar superior to silicon at 12 keV.
140
120
100
80
60
40
20
Def
f / µ
m
50 40 30 20 10R / µm
B
Si
50
40
30
20
10
4.0 3.0 2.0 1.0
1
Figure 7.3: The effective aperture in dependence of the parabolic radius R for the lensmaterials Si and B. The implemented radii between 1 µm and 3µm are shown as grey areasand in the inset.
Planar NFLs generate a line focus and two of them have to be crossed in order to get apoint focus. This implementation is sketched in figure 7.4. Consequently, since both NFLsshould focus in the same plane (perpendicular to the optical axis) they must have differentfocal length. This is achieved by NFLs with different a number of lenses, e. g. N = 50 verticaland N = 100 horizontal. Then the fine alignment is done by the different radii of curvature Rfor the lens arrays. The specific values to be chosen depend on the X-ray energy and otherexperimental details.Microfabrication techniques are best established for silicon, but silicon is not the optimummaterial for NFLs as shown in figure 7.5. Silicon, aluminium, diamond, boron, and berylliumare compared. The parameters chosen are N =100 and L1 = 40 m. The lateral resolution dt
varies strongly with photon energy and with lens material. Due to the manufacturing theradii of curvature R are limited to the range between 30 µm and 0.8µm for NFLs. Therefore,
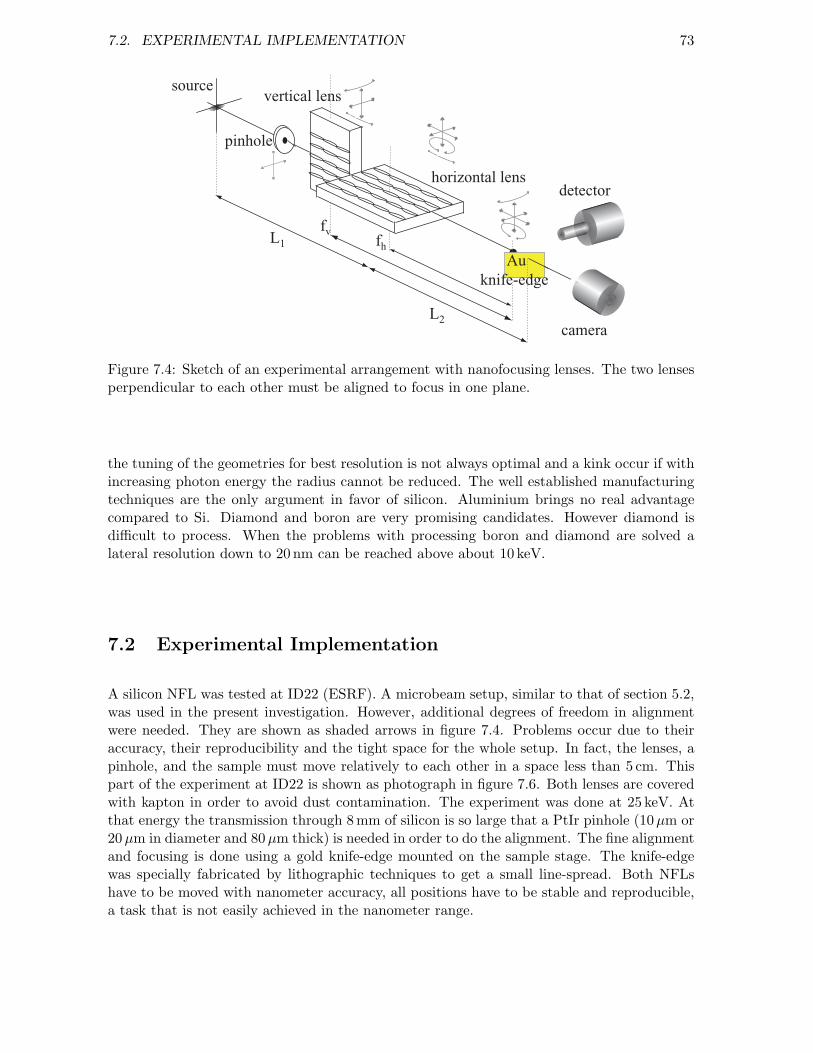
7.2. EXPERIMENTAL IMPLEMENTATION 73
source
detectorhorizontal lens
vertical lens
camera
pinhole
Auknife-edge
fh
fvL1
L2
Figure 7.4: Sketch of an experimental arrangement with nanofocusing lenses. The two lensesperpendicular to each other must be aligned to focus in one plane.
the tuning of the geometries for best resolution is not always optimal and a kink occur if withincreasing photon energy the radius cannot be reduced. The well established manufacturingtechniques are the only argument in favor of silicon. Aluminium brings no real advantagecompared to Si. Diamond and boron are very promising candidates. However diamond isdifficult to process. When the problems with processing boron and diamond are solved alateral resolution down to 20 nm can be reached above about 10 keV.
7.2 Experimental Implementation
A silicon NFL was tested at ID22 (ESRF). A microbeam setup, similar to that of section 5.2,was used in the present investigation. However, additional degrees of freedom in alignmentwere needed. They are shown as shaded arrows in figure 7.4. Problems occur due to theiraccuracy, their reproducibility and the tight space for the whole setup. In fact, the lenses, apinhole, and the sample must move relatively to each other in a space less than 5 cm. Thispart of the experiment at ID22 is shown as photograph in figure 7.6. Both lenses are coveredwith kapton in order to avoid dust contamination. The experiment was done at 25 keV. Atthat energy the transmission through 8 mm of silicon is so large that a PtIr pinhole (10µm or20 µm in diameter and 80µm thick) is needed in order to do the alignment. The fine alignmentand focusing is done using a gold knife-edge mounted on the sample stage. The knife-edgewas specially fabricated by lithographic techniques to get a small line-spread. Both NFLshave to be moved with nanometer accuracy, all positions have to be stable and reproducible,a task that is not easily achieved in the nanometer range.

74 CHAPTER 7. NANOFOCUSING
10
20
50
100
200
d t /
nm
3530252015105energy / keV
Si
B
BeAl
Diamond
Figure 7.5: Lateral resolution for identical NFLs of the different lens materials silicon, alu-minium, beryllium, boron, and diamond in the same typical geometry [parameters: N = 100,L1 = 40 m, 30 µm> R > 0.8µm, ⇒ 8 mm < f < 20 mm].
5mmoptical axis
pinhole
vertical lens
horizontal lens
detectorsample
Figure 7.6: Experimental setup with nano focusing lenses as implemented at ESRF/ID22.
7.3 NFL Characterization
The NFL system was characterized at 25 keV by the vertical and horizontal Au knife-edgescans of figure 7.7. The synchrotron radiation source (size: Sh = 700 µm × Sv= 60 µm FWHM)was focused to an image of Bh= 380 nm ± 90 nm × Bv =210 nm ± 50 nm.

7.3. NFL CHARACTERIZATION 75
1200
1000
800
600
400
200
0
fluo
resc
ence
inte
nsity
/ a.
u.
-1.0 -0.5 0.0 0.5 1.0vertical position / µm
3000
2500
2000
1500
1000
500
0
fluo
resc
ence
inte
nsity
/ a.
u.
-1.5 -1.0 -0.5 0.0 0.5 1.0 1.5horizontal position / µm
FWHM210 nm FWHM
380 nm
Figure 7.7: Measured gold fluorescence knife-edge scans which characterize the microbeamvertical and horizontal and therefore indicate the NFL performance. The recorded data arefitted by an error function which gaussian derivation represent the size of the microbeam.
The expected spot size was 340 nm and 110 nm. Obviously, there is room for improving themanufacturing process. This is also evidenced by the strong and asymmetric backgroundunder the focal spot. A better alignment and a more efficient pinhole might help to reducethe background.
Crossed NFLs offer the opportunity to obtain an almost circular focal spot by adapting thefocal lengths of the horizontal and vertical lenses. This is a very interesting feature for mostanalytical tools. In the present setup this specification has not yet be achieved.
The flux in the focal spot is estimated on the basis of the data in figure 7.7.
I0 = 4.3 · 1012 ph/(s mm2) [incident radiation]FL = 4.4 · 108 ph/s [through the lenses]Ff = 1.2 · 108 ph/s [in the spot]
2.1 · 108 ph/s [expected]
The incident intensity I0 and the total flux behind the lenses were directly recorded by a PINdiode. Only the intensity in the focus area is useful. The flux in the spot can be evaluatedwith the knife-edge scans of figure 7.7 and is found to be 1.2·108 ph/s. It is only smaller by afactor 2 compared to the expected flux. The observed gain was 350.

76 CHAPTER 7. NANOFOCUSING
7.4 First Nanofocusing Results
A number of experiments using the NFL prototype have been carried out, showing the fol-lowing general features:
• The designed focal length of some millimeters generates the demagnification ratiosneeded to achieve a probing spot of nanometer size at common beamlines of 3rd generationsynchrotron radiation facilities.
• The existing equipment is sufficient to align two NFLs to each other and to the syn-chrotron radiation beam.
• The analysis of small volumes can be performed with hard X-rays.
• Some of the problems not solvable with Be or Al refractive lenses can be tackled withNFLs.
(1) Characterization of the sample in the NASA Cosmic Dust Catalog #15: L2036H18.
(2) Multi channel fluorescence spectrum at ID22 / ESRF.
fluorescence energy / keV
phot
ons
/ 100
s
Figure 7.8: Fluorescence nanotomography of a micrometeorite [59]. (1) Sample descrip-tion taken from the NASA Dust Catalogue. (2) Typical multichannel fluorescence spec-trum of the meteorite. (3) Reconstructed fluorescence tomograms for all detected elements.(4) Visualization of the increased spacial resolution due to NFLs (description in the text).

7.4. FIRST NANOFOCUSING RESULTS 77
0
50
100
25
75
FeCr Mn
Ni
S Ti
ZnCu
Ca
(3) Reconstructed fluorescence tomograms of the components.
(4) Presentation of the sample dimensions: Al lenses versus NFLs.
inte
nsity
/ a.
u.
3.5 % 5.1 % < 1 %
3.0 % 1.7 % 100 %
6.8 % 1.3 % 1.0 %

78 CHAPTER 7. NANOFOCUSING
Fluorescence tomography of a meteorite with a horizontal resolution of 600 nm
A micrometeorite, about 20µm in size, was analyzed by fluorescence tomography. The mete-orite was captured by a high flying plane in the upper atmosphere. It is listed in the NASADust Catalogue #15:L2036H18 and was provided by G. Flynn (U. Plattsburgh). The unique-ness of the sample forbids any destructive analytical method. Since the sample is only 20µmin size a lateral resolution below 1µm is required. The NASA catalogue contains a scanningelectron microscope (SEM) picture of the meteorite and an electron induced X-ray (EDX)fluorescence spectrum, shown in figure 7.8(1).In the present fluorescence tomography elements with X-ray emission lines between 2 keV and22.5 keV have been detected. This energy region was defined by the incident energy of 25 keVand by scattering and absorption. Absorption was minimized by a helium chamber around thesample and the detector. The high sensitivity of the fluorescence analysis using synchrotronradiation is demonstrated in the measured multichannel spectrum of figure 7.8(2). Obviously,the detection limit is better for excitation by X-rays than by electrons (figure 7.8(1)). Moreelements can be detected, e. g. Zn. Figure 7.8(3) shows the elementspecific tomograms for 9elements from sulfur to zinc. A pixel size of 600 nm was achieved by means of 52 translationsat 70 rotation positions with 2 s dwell time. To enhance the flux an additional Be parabolicrefractive lens was positioned 1100 mm upstream from the NFLs, demagnifying the image ofthe synchrotron radiation source ∼400 mm behind the NFLs. Thus the beam matched theNFL’s aperture at their position. This additional beam collimation enhanced the flux from1.8·108 ph/s, with Si refractive lenses alone, to 4.6·109 ph/s. The intensity in the tomograms(figure 7.8(3)) is given relative to their maximal concentration. The percentage values showthe relation of these maxima to the maximal intensity of Fe. Note the strong variation inthe distribution of calcium which is concentrated at two tips of the meteorite. A detailedevaluation of the sample and data analysis including selfabsorption correction is carried outin the PhD thesis of T. F. Gunzler (RWTH) [59]. In the present context the gain and thesensitivity obtained by using NFLs is emphasised. This improvement is documented, oncemore, in figure 7.8(4). Here, the virtual slice through the micrometeorite is compared to amicrofluorescence tomogram of the potassium distribution inside a mahogany plant root. Thatsample which had a diameter of about 750µm was analyzed by means of an Al refractive lens(N = 150, E = 19.5 keV, f = 0.45 m, g = 200, Ff = 1010 ph/s). The spot size was much largerthan in the case of the micrometeorite, spotsize = 1.4 µm× 6 µm. The improvement achievedby the NFL is obvious and fluorescence microtomography with a resolution way below 1µmis now feasible.
Diffraction by samples with submicrometer dimensions
Micro- and nanotechnology require more and more tools to investigate the structure of sam-ples with submicrometer dimensions. Two systems of this type were studied: the sensor partof a giant magnetoresistance (GMR) read head and a phase change storage device. Both ex-periments were carried out at ID22 / ESRF in close co-operation with M. Drakopoulos (nowDiamond Light Source, UK).
The GMR read head from IBM is described in functionality and implementation in [60,61]. This state of the art functional sensor is typical for the problems encountered in diffractionof very small samples. The interesting functional part is only 350 nm× 300 nm× 15 nm in
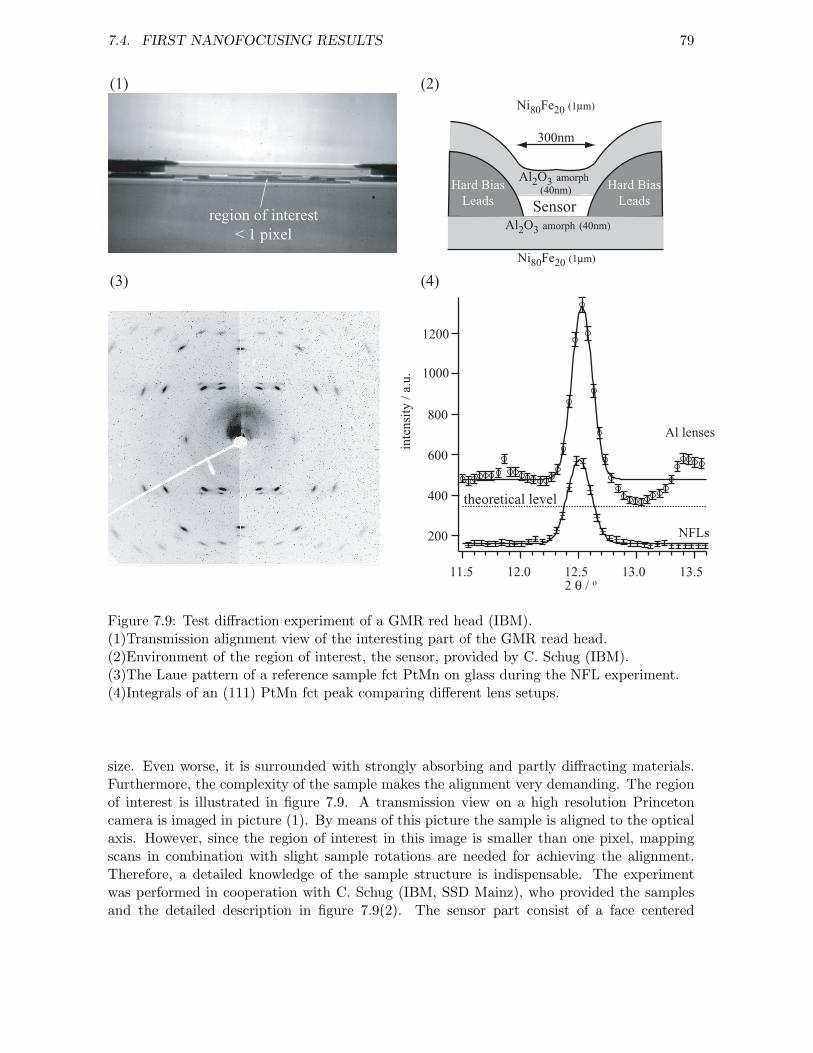
7.4. FIRST NANOFOCUSING RESULTS 79
theoretical level
region of interest< 1 pixel
Ni80Fe20 (1µm)
300nm
Al2O3 amorph (40nm)
SensorHard Bias
LeadsHard Bias
Leads
Al2O3 amorph (40nm)
Ni80Fe20 (1µm)
1200
1000
800
600
400
200
inte
nsity
/ a.
u.
13.513.012.512.011.52 θ / o
NFLs
Al lenses
(1)
(4)(3)
(2)
Figure 7.9: Test diffraction experiment of a GMR red head (IBM).(1)Transmission alignment view of the interesting part of the GMR read head.(2)Environment of the region of interest, the sensor, provided by C. Schug (IBM).(3)The Laue pattern of a reference sample fct PtMn on glass during the NFL experiment.(4)Integrals of an (111) PtMn fct peak comparing different lens setups.
size. Even worse, it is surrounded with strongly absorbing and partly diffracting materials.Furthermore, the complexity of the sample makes the alignment very demanding. The regionof interest is illustrated in figure 7.9. A transmission view on a high resolution Princetoncamera is imaged in picture (1). By means of this picture the sample is aligned to the opticalaxis. However, since the region of interest in this image is smaller than one pixel, mappingscans in combination with slight sample rotations are needed for achieving the alignment.Therefore, a detailed knowledge of the sample structure is indispensable. The experimentwas performed in cooperation with C. Schug (IBM, SSD Mainz), who provided the samplesand the detailed description in figure 7.9(2). The sensor part consist of a face centered
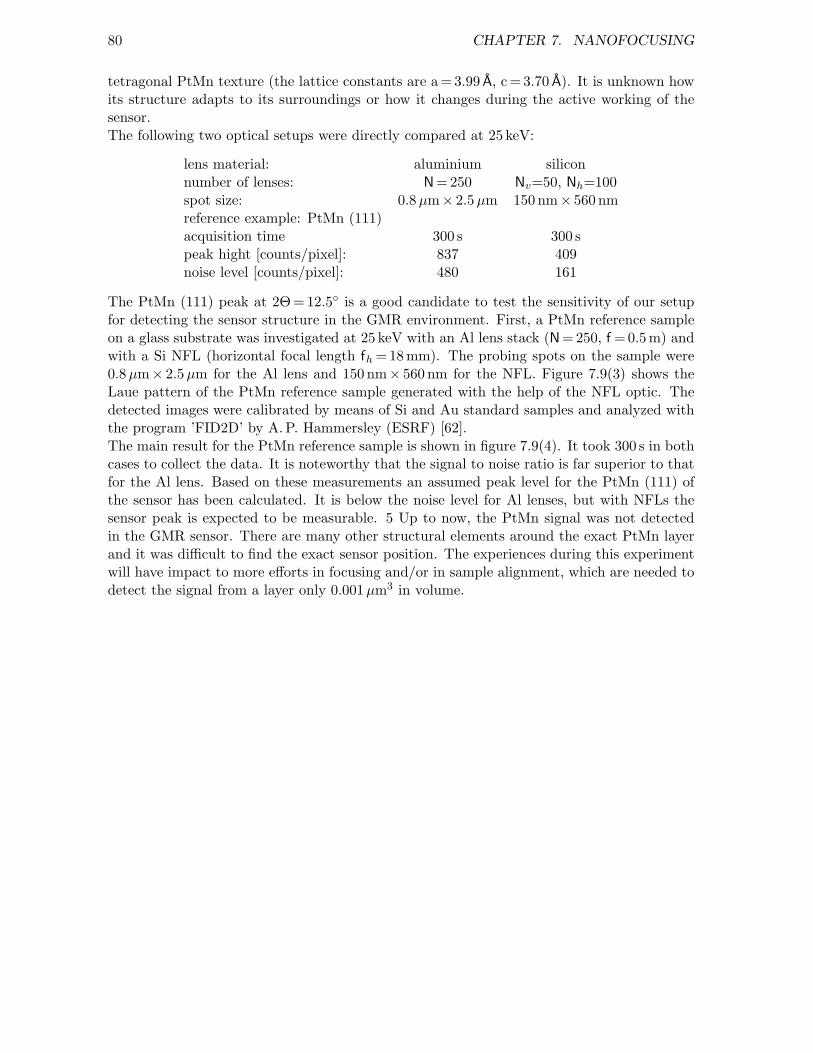
80 CHAPTER 7. NANOFOCUSING
tetragonal PtMn texture (the lattice constants are a = 3.99 A, c = 3.70 A). It is unknown howits structure adapts to its surroundings or how it changes during the active working of thesensor.The following two optical setups were directly compared at 25 keV:
lens material: aluminium siliconnumber of lenses: N = 250 Nv=50, Nh=100spot size: 0.8 µm× 2.5µm 150 nm× 560 nmreference example: PtMn (111)acquisition time 300 s 300 speak hight [counts/pixel]: 837 409noise level [counts/pixel]: 480 161
The PtMn (111) peak at 2Θ = 12.5 is a good candidate to test the sensitivity of our setupfor detecting the sensor structure in the GMR environment. First, a PtMn reference sampleon a glass substrate was investigated at 25 keV with an Al lens stack (N =250, f = 0.5 m) andwith a Si NFL (horizontal focal length fh = 18 mm). The probing spots on the sample were0.8µm× 2.5µm for the Al lens and 150 nm× 560 nm for the NFL. Figure 7.9(3) shows theLaue pattern of the PtMn reference sample generated with the help of the NFL optic. Thedetected images were calibrated by means of Si and Au standard samples and analyzed withthe program ’FID2D’ by A. P. Hammersley (ESRF) [62].The main result for the PtMn reference sample is shown in figure 7.9(4). It took 300 s in bothcases to collect the data. It is noteworthy that the signal to noise ratio is far superior to thatfor the Al lens. Based on these measurements an assumed peak level for the PtMn (111) ofthe sensor has been calculated. It is below the noise level for Al lenses, but with NFLs thesensor peak is expected to be measurable. 5 Up to now, the PtMn signal was not detectedin the GMR sensor. There are many other structural elements around the exact PtMn layerand it was difficult to find the exact sensor position. The experiences during this experimentwill have impact to more efforts in focusing and/or in sample alignment, which are needed todetect the signal from a layer only 0.001µm3 in volume.
7.4. FIRST NANOFOCUSING RESULTS 81
Phase change media are interesting candidates for non-volatile data storage devices witha high data storage capacity. AgInSbTe films are a candidate for these media. Data arestored in the form of crystallized submicrometer regions in the amorphous film. Crystallizedand amorphous regions have different reflectivity for light. Such a sample was provided by S.Ziegler and M. Wuttig (I. Physikalisches Institut, RWTH). The crystallization kinetics of thiscomplex are described by K. Njoroge et al. [63]. Differences in the crystalline state can beanalyzed by hard X-ray microdiffraction. An NFL setup for a photon energy of 25 keV waschosen. A crystallized spot (bit) had a size of 130 nm× 470 nm× 50 nm. This corresponds toa volume of 0.003µm3. The flux behind the NFL was Ff = 2·108 ph/s. It took 600 s to collectthe diffraction picture in figure 7.10(1). The Debye-Scherrer rings become clearly visible whenthe photon scattering in air is subtracted from the picture (figure 7.10(2)). Three peaks (103),(106), and (110) are identified [63]. They show the correct intensity ratios and no expectedpeaks are missing. Note that this signal originates from a sample volume of only 0.003µm3,which corresponds to about 107 unit cells.
(110)(106)
(103)
(1) (2)
Figure 7.10: Nanodiffraction of an AgInSbTe thin film: a volume of 0.003µm3 forms the baseof the measured diffraction image (1), the Laue pattern becomes clearer when the photonscattering in air is subtracted (2).
82 CHAPTER 7. NANOFOCUSING
7.5 Nanofocusing Lenses: Summary and Outlook
Parabolic refractive planar lenses with small radii of curvature R of 1µm to 3 µm were fabri-cated by micro structuring processes in silicon. This design allows very short focal lengths,some few millimeter, which results in an extreme demagnification of the imaged synchrotronradiation source. This design makes nanoanalysis with hard X-rays possible.A tomography experiment with the NFL prototype demonstrated the improvements for scan-ning analytical methods like fluorescence tomography. The tomographic reconstructions of ameteorite, only 20µm in size was presented, with a resolution of 600 nm.The diffraction of a GMR sensor head with an active sensor size of only 350 nm× 300 nm× 15 nm(or 0.0015µm3) underlines the necessity to use a nanoprobe. The comparison between rota-tional Al lenses and planar Si lenses underlined the abilities of the new NFL concept. Theanalysis of the sensor head is not possible without nanofocusing lenses. Finally, the Lauepattern out of 1.1·107 cells in a AgInSbTe thin film demonstrated that the achieved intensitygain is already sufficient for certain experiments.
A number of improvements in nanofocusing lenses is envisaged for the near future.First, the alignment system for diffraction experiments has to be improved. This includesthe degree of freedom for the lens alignment, a pinhole at close distance to the lens and thesample holder. Vibrations and other uncontrolled motions in the setup have to be avoided.Second, the parabolic shape of the nanofocusing lenses has to be improved.Finally, silicon is not the optimum material for NFLs. However, the microfabrication of siliconis well developed. Better materials with lower absorption are diamond, graphite, and boron.Appropriate processing procedures have to be developed for these materials.

Chapter 8
Summary
Parabolic refractive X-ray lenses show an outstanding potential for micro- and nano-analysisand for imaging with hard X-rays. Imaging can be done in absorption, fluorescence, diffrac-tion, and small angle scattering. Beryllium as lens material has turned out as ideal material forphoton energies below about 40 keV. The lenses are manufactured with a rotational parabolicprofile as is demonstrated by the quality of the images which are free of spherical aberra-tion. A lateral resolution of 140 nm has been achieved. Beryllium as lens material improvesthe transmission of the refractive lenses and increases the field of view. This is favorablefor microfocusing, and helps to improve microtomography and micro small angle scattering.The development of XANES microtomography is also made possible by these improvements.90 000 single XANES spectra for one tomogram were handled in acquisition and data pro-cessing. It allows for chemical analysis in each pixel of the sample without need for sampledestruction. Furthermore, the requirements on beryllium parabolic refractive lenses at anX-ray free electron laser XFEL have been investigated. Today, the implementation of micro-analysis methods at an XFEL by using parabolic refractive lenses seems possible. In thatrespect, novel experiments will become feasible in many fields of science, in particular in thestructure analysis of individual large biological molecules.In order to push the resolution in microanalysis in the range below 100 nm, new refractivelenses (nanofocusing lenses) with extremely short focal lengths have been developed. A proto-type of such NFL’s has been manufactured in silicon. The radius of curvature varies between1 µm and 3µm. The potential of this concept is outstanding. A microprobe smaller than100 nm is already feasible, and a microprobe smaller than 50 nm can be expected in the viewof the ongoing improvements in the lens material. We were able to achieve diffraction patternfrom a small volume (50 nm× 470 nm× 130 nm) consisting of ∼ 108 atoms. A micrometeoritewas analyzed in voxels of 600 nm, even in horizontal direction. The larger size of synchrotronradiation source in horizontal direction can be compensated by a stronger demagnificationof the source image in this direction. The alignment of NFLs under realistic experimentalconditions is a demanding task. A compact and portable setup has been developed, includingtwo independent NFLs for horizontal and vertical focusing, a pinhole, and the sample holder.This allows a lens exchange and alignment under realistic circumstances in about 2 hours.Hence, the limited available beamtime at synchrotron radiation facilities can be efficientlyused in data acquisition.Parabolic refractive X-ray lenses have greatly improved our capability to combine imagingtechniques with spectroscopy, which will be required in many fields of science and technology.
83

Appendix A
The Choice of Lens Material
The trade of between high refraction of a refractive lens and little absorption is the basicproblem for refractive optics with hard X-rays. As outlined in section 2.1, the mass atten-uation coefficient µ/ρ is a quality factor for that purpose and in this context elements witha low atomic number Z are preferred. Nevertheless, this argument depends on the energy ofthe X-rays and with that on the analytical application the lenses are used for.The lens material has to meet some additional criteria. First, the material has to withstandthe radiation on long timescales without loss of optical performance. Another requirement isa small degree of small angle X-ray scattering. Tests for both properties can be found in thePhD thesis of J. Tummler (RWTH Aachen) [64]. A third criterium is the ability to give thematerial the required parabolic shape.In the following only materials are presented which result in lenses or which are consideredas promising.
Aluminium Al: is the material of which the first parabolic refractive X-ray lenses weremanufactured. Its atomic number is Z =13 and this is far from optimal considering themass attenuation coefficient µ/ρ. Obviously, the main argument for aluminium is itsplasticity. It is ductile at room temperature and the thin oxidized layer at its surfaceprevent further corrosion. The development of parabolic refractive lenses of aluminiumis described in [64] and the first results of a full field microscope in the hard X-rayregion was presented by [21] in 1999. Since then, aluminium refractive lenses havebeen used for analytical applications in an energy range between 20 keV and 120 keV at3rd generation synchrotron facilities.
Lithium Li: is the solid with the lowest atomic number, Z = 3. Unfortunately for themanufacturing of lenses it oxidizes immediately in air, loosing its shape and opticalperformance. Lenses have to be manufactured under inert gas atmosphere and must besealed when used as optical element. These conditions were considered as too compli-cated, especially as lithium lenses promise only a small experimental profit comparedto beryllium. This is indicated for example in figure 7.5 where the good resolution of Lilenses can also be realized with Be lenses. Nevertheless, in a teeth lens design coatedLi have been tested as optical element at 10 keV, [65].
Beryllium Be: has a higher density than Li and therefore the coefficient µ/ρ is compa-rable. Safety precautions have to be taken when handling beryllium. Beryllium ismuch harder than aluminium and the pressing of Be is done at elevated temperature.
A1

A2 APPENDIX A. THE CHOICE OF LENS MATERIAL
Parabolic refractive lenses of Be were used in many different experiments since 2002.The improvements for analytical applications are topics of the chapters 4 and 5.
Nickel Ni: is an option as lens material for photon energies above 100 keV, as shown infigure 4.2. Parabolic refractive Ni lenses were manufactured in Aachen and were testedat ID22 / ESRF.
Boron B: with Z = 5 and a relatively high density, boron was often considered as lensmaterial. But boron has a high melting point, extreme hardness, and strong reactivityat higher temperatures with many other elements. Recently, parabolic refractive lensesin the design for nanofocusing lenses (figure 2.5 and chapter 7) were realized with boronand are under further development.
Silicon Si: is one of the best known materials and can be shaped accurately on a sub-µmscale. Therefore, the second design of parabolic refractive lenses was first realized inSi by standard micromachining techniques. Parabolic radii R of ∼1 µm minimize thepossible focal length of refractive lenses. This is the approach for the strong demagni-fication required for a nanoprobe. The planar parabolic X-ray lenses are presented inchapter 7.
Carbon/Diamond C: Diamond is the material of low Z with the highest density. Thematerial was used for optical elements already [66]. It is considered as material foretched nanofocusing lenses but until now, lenses as presented here were not structuredin diamond. Whereas, carbon in its graphite representation have been processed andfirst results are awaited.
Bibliography
[1] R. W. James: The Optical Principles of the Diffraction of X-Rays (G. Bell and SonsLTD, London, 1962)
[2] E. Hecht: Optics (second edition) (Addison-Wesley, 1987)
[3] C. T. Chantler: Theoretical form factor, attenuation and scattering tabulation for Z =1 - 92 from E = 1 - 10eV to E = 0.4, 10.0MeV , in Journal of Physical and ChemicalReferences Data, volume 24, 71 (1995)
[4] J. H. Hubbell and S. M. Seltzer: Tables of X-Ray Mass Attenu-ation Coefficients and Mass Energy-Absorption Coefficients, in URL:http://physics.nist.gov/PhysRefData/XrayMassCoef/ (1996)
[5] P. Kirkpatrick and A. V. Baez: Formation of Optical Images by X-Rays, in Journal ofthe Optical Society of America, volume 38, 9 (1948)
[6] N. Gao, I. Y. Ponomarev, Q. F. Xiao, W. M. Gibson, and D. A. Carpender: Monolithicpolycapillary focusing optics and their applications in microbeam x-ray fluorescence, inApplied Physics Letters, volume 69, 1529 (1996)
[7] K. Janssens, L. Vincze, B. Vekemans, F. Adams, M. Haller, and A. Knochel: Use of lead-glass capillaries for micro-focusing of highly-energetic (0-60 keV) synchrotron radiation,in Journal of Analytic Atomic Spectroscopy, volume 13, 339 (1998)
[8] J. Kirz: Phase zone plates for x rays and the exteme uv , in Journal of the Optical Societyof America, volume 64 (1974)
[9] S. D. Shastri, J. M. Maser, B. Lai, and J. Tys: Microfocusing of 50 keV undulatorradiation with two stacked zone plates , in Optical Communication, volume 197, 9 (2001)
[10] S. Tamura, M. Yasumoto, N. Kamijo, Y. Suzuki, M. Awaji, A.Takeuchi, H. Takano, andK. Handa: Development of a multilayer Fresnel zone plate for high-energy synchrotronradiation X-rays by DC sputtering deposition, in Journal of Synchrotron Radiation, vol-ume 9, 154 (2002)
[11] E. DiFabrizio, F. Romanato, M. Gentill, S. Cabrini, B. Kaulich, J. Susini, and R. Barrett:High-efficiency multilevel zone plates for keV X-rays, in Nature, volume 401 (1999)
[12] W. C. Rontgen: Ueber eine neue Art von Strahlen., in Sitzungsberichte der physikal.-medicin. Gesellschaft, p. 132 (1895)
BIBLIOGRAPHY
[13] C. Barkla: Note on Experiments to detect Refraction of X-rays, in Philosophical Maga-zine, volume 31, 257 (1916)
[14] S. Suehiro, H. Miyaji, and H. Hayashi: Refractive lens for X-ray focus, in Nature, volume352, 385 (1991)
[15] A. G. Michette: No X-ray lens, in Nature, volume 353, 510 (1991)
[16] B. X. Yang: Fresnel and refractive lenses for X-rays, in Nuclear Instruments and Methodsin Physics Research A, volume 328, 578 (1993)
[17] A. Snigirev, V. Kohn, I. Snigirev, and B. Lengeler: A compound refractive lens forfocusing high-energy X-rays, in Nature, volume 384, 49 (1996)
[18] T. Tomie: Japanese Patent No. 06045288 , in (1994)
[19] T. Tomie: US Patent No. 5,684,852 , in (1997)
[20] T. Tomie: German Patent No. DE19505433 , in (1998)
[21] B. Lengeler, C. Schroer, M. Richwin, J. Tummler, M. Drakopoulos, I. Snigireva, andA. Snigirev: Imaging by parabolic refractive lenses in the hard x-ray range, in J. Syn-chrotron Rad., volume 6, 1153 (1999)
[22] C. G. Schroer, J. Tummler, F. Gunzler, B. Lengeler, W. H. Schroder, A. J. Kuhn,A. S. Siminiovici, A. Snigirev, and I. Snigireva: Fluorescence Microtomography: ExternalMapping of Elements Inside Biological Samples, in Proeedings of SPIE, volume 4142, 287(2000)
[23] C. G. Schroer, B. Lengeler, B. Benner, T. F. Gunzler, M. Kuhlmann, A. S. Siminiovici,S. Bohic, M. Drakopoulos, I. S. A. Snigirv, and W. Schroder: Microbeam ProductionUsing Compound Refractive Lenses: Beam Characterization and Applications, in Pro-ceedings of SPIE, volume 4499, 52 (2001)
[24] C. G. Schroer, M. Kuhlmann, B. Lengeler, T. F. Gunzler, O. Kurapova, B. Benner,C. Rau, A. S. Siminiovici, A. Snigirev, and I. Snigireva: Beryllium parabolic refractivex-ray lenses, in Proeedings of SPIE, volume 4783, 10 (2002)
[25] C. G. Schroer, M. Kuhlmann, T. Hunger, F. Gunzler, O. Kurapova, S. Feste, F. Frehse,B. Lengeler, , M. Drakopoulos, A. Somogyi, A. S. Simionovici, A. Sngirev, I. Snigireva,C. Schug, and W. H. Schroder: Nanofocusing parabolic refractive lenses, in AppliedPhysics Letters, volume 82, 1485 (2003)
[26] B. Lengeler, C. G. Schroer, B. Benner, A. Gehardus, F. Gunzler, M. Kuhlmann, J. Meyer,and C. Zimprich: Parabolic refractive X-ray lenses, in Journal of Synchrotron Radiation,volume 9, 119 (2002)
[27] B. Lengeler, C. Schroer, M. Richwin, J. Tummler, M. Drakopoulos, A. Snigirev, andI. Snigireva: A novel microscope for hard x-rays based on parabolic compound refractivelenses, in Applied Physical Letters, volume 74, 3924 (1999)
BIBLIOGRAPHY
[28] B. Lengeler, J. Tummler, A. Snigirev, I. Snigireva, and C. Raven: Transmission andgain of singly and doubly focusing refractive x-ray lenses, in Journal of Applied Physics,volume 84, 5855 (1998)
[29] S. G. Lipson, H. Lipson, and D. S. Tannhauser: Optical Physics (Cambridge UniversityPress, 1998)
[30] B. Benner: Imaging with Parabolic Refractive X-Ray Lenses, Ph.D. thesis, RWTHAachen, Aachen
[31] C. G. Schroer, J. Meyer, M. Kuhlmann, B. Benner, T. F. Gunzler, B. Lengeler, C. Rau,T. Weitkamp, A. Snigirev, and I. Snigireva: Nanotomography based on hard x-ray mi-croscopy with refrective lenses, in Applied Physics Letters, volume 81, 8 (2002)
[32] J.-C. Labiche, J. S. Puchades, D. von Brussel, and J. Moy: FRELON Camera: FastREadout LOw Noise, in ESRF Newsletter, volume 25, 41 (1996)
[33] J. Radon: Uber die Bestimmung von Funktionen durch ihre Integralwerte langs gewisserMannigfaltigkeiten, in Ber. Ver. Sachs. Akad. Wiss., volume 69, 262 (1917)
[34] A. Kak and M. Slaney: Principles of Computerized Tomographic Imaging (IEEE Press,1988)
[35] C. G. Schroer: Reconstructing X-Ray Fluorescence Microtomograms, in Applied PhysicsLetters, volume 79, 1912 (2001)
[36] C. Zimprich: Demagnifying X-Ray Lithography , Ph.D. thesis, RWTH Aachen, Aachen(2003)
[37] S. V. Roth, M. Burghammer, R. Gilles, D. Mukherji, J. Rosler, and P. Strunz: Precipitatescanning in Ni-base γγ′-superalloys, in Nuclear Instruments and Methods in PhysicsResearch B, volume 200, 255 (2003)
[38] C. G. Schroer, J. Tummler, B. Lengeler, M. Drakopoulos, A. Snigirev, and I. Snigireva:Compound Refractive Lenses: High Quality Imaging Optics for the XFEL, in Proceedingsof SPIE, volume 4143, 60 (2001)
[39] TESLA Technical Design Report; Part V The X-Ray Free Electron Laser , in (2001)
[40] TESLA Technical Design Report, Supplement , in
[41] H. Schulte-Schrepping: Photon beamlines at X-FEL undulators, in Proceedings of SPIE,volume 4143, 9 (2001)
[42] R. M. Bionta: Controlling dose to low Z solids at LCLS , in technical report LawrenceLivermore National Laboratory, LCLS-TN-00-4 (2000)
[43] C. G. Schroer, M. Kuhlmann, F. Gunzler, B. Lengeler, M. Richwin, B. Griesebock,D. Lutzenkirchen-Hecht, R. Frahm, E. Ziegler, A. Mashayekhi, D. R. Haeffner, J.-D.Grunwaldt, and A. Baiker: Mapping the chemical states of an element inside a sampleusing tomographic x-ray absorption spectroscopy , in Applied Physics Letters, volume 82,3360 (2003)

BIBLIOGRAPHY
[44] B. Henke, E. Gullikson, and J. Davis: in Atomic Data and Nuclear Data Tables, vol-ume 54, 181 (1993)
[45] J. Stohr: NEXAFS Spectroscopy (Springer, 1996)
[46] D. C. Koningsberger and R. Prins, eds.: X-Ray Absorption: Principles, Applications,Techniques of EXAFS, SEXAFS and XANES (John Wiley & Sons, 1988)
[47] E. A. Stern and S. M. Heald: Basic Principles and Applications of EXAFS (1983)
[48] R. Frahm: New method for time dependent x-ray absorption studies, in Review of Scien-tific Instruments, volume 60, 2515 (1989)
[49] M. Richwin: Entwicklung und Anwendung neuer Verfahren zur zeitaugelostenRontgenabsorbtionsspektroskopie mit Synchrotronstrahlung , Ph.D. thesis, Bergische Uni-versitat Wuppertal (2002)
[50] J.-D. Grunwaldt and B. S. Clausen: Combining XRD and EXAFSwith on-line catalyticstudies for in situ characterization of catalyst., in Topics in Catalysis, volume 18 (2002)
[51] J.-D. Grunwaldt, D. Lutzenkirchen-Hecht, M. Richwin, S. Grundmann, B. S. Clausen,and R. Frahm: Piezo X-ray Absorption Spectroacopy for the Investigation of Solid-StateTransformations in the Millisecond Range, in Journal of Physical Chemistry B, volume105, 5161 (2001)
[52] T. L. Reitz, P. L. Lee, K. F. Czaplewski, J. C. Lang, K. E. Popp, and H. H. Kung:Time-resolved XANES Investigation of CuO/ZnO in the Oxidative Methanol ReformingReaction, in Journal of Catalysis, volume 199, 193 (2001)
[53] J.-D. Grunwaldt, M. Maciejewski, and A. Baiker: I situ X-ray absorption study duringmethane combustion over Pd/ZrO2 catalysts, in Physical Chemistry Chemical Physics,volume 5, 1481 (2003)
[54] C. G. Schroer, B. Benner, T. F. Gunzler, M. Kuhlmann, B. Lengeler, W. H. Schroder,A. J. Kuhn, A. S. Siminiovici, A. Snigirev, and I. Snigireva: High Resolution ElementMapping Inside Biological Samples Using Fluorescence Microtomography , in Proceedingsof SPIE, volume 4503, 230 (2002)
[55] W. Yun, B. Lai, Z. Cai, J. Maser, D. Legnini, E. Gluskin, Z. Chen, A. A. Krasnoperova,Y. Vladimirsky, R. Cerrina, E. D. Fabrizio, and M. Gentili: in Review of ScientificInstruments, volume 70, 2238 (1999)
[56] K. Yamauchi, K. Yamamura, H. Mimura, Y. Sano, A. Saito, A. Souvorov, M. Yabashi,K. Tamasaku, T. Ishikawa, and Y. Mori: in Journal of Sunchrotron Radiation, volume 9,313 (2002)
[57] O. Hignette, G. Rostaing, P. Cloetens, A. Rommeveaux, W. Ludwig, and A. Freund:Submicron focusing of hard X-rays with reflecting surfaces at the ESRF , in Proceedingsof SPIE, volume 4499, 105 (2001)
[58] V. Aristov, M. Grigoriev, S. Kuznetsov, L. Shabelnikov, V. Yunkin, T. Weitkamp,C. Rau, I. Snigireva, A. Snigirev, M. Hoffmann, and E. Voges: X-ray refractive pla-nar lens with minimized absorption, in Applied Physics Letters, volume 77, 4058 (2000)

[59] T. F. Gunzler: Element-specific X-ray Fluorescence Microtomography , Ph.D. thesis,RWTH Aachen, Aachen (2004)
[60] D. E. Heim, R. E. Fontana, C. Tsang, V. S. Speriosu, B. A. Gurney, and M. L. Williams:Design and Operation of Spin Valves Sensors, in IEEE Transactions on Magnetics, vol-ume 30 (1994)
[61] C. Tsang, R. E. Fontana, T. Lin, D. E. Heim, V. S. Speriosu, B. A. Gurney, and M. L.Williams: Design, Fabrication and Testing of Sin-Valve Read Heads for High DensityRecording , in IEEE Transactions on Magnetics, volume 30 (1994)
[62] A. P. Hammersley, S. O. Svensson, M. Hanfland, A. N. Fitch, and D. Hausermann: Two-Dimensional Detector Software: From Real Detector to Idealised Image or Two-ThetaScan, in High Pressure Research, volume 14, 235 (1996)
[63] W. K. Njoroge and M. Wuttig: Crystallization kinetics of sputter-deposited amorphousAgInSbTe films, in Journal of Applied Physics, volume 90, 3816 (2001)
[64] J. Tummler: Development of Compound Refractive Lenses for Hard X-Rays, Ph.D. the-sis, RWTH Aachen, Aachen (2000)
[65] E. M. Dufresne, D. A. Arms, R. Clarke, N. P. Pereira, S. B. Dierker, and D. Foster:Lithium metal for x-ray refractive optics, in Applied Physics Letters, volume 79, 4085(2001)
[66] B. Nohammer, J. Hosowska, A. K. Freund, and C. David: Diamond planar refractivelenses for third- and forth-generation X-ray sources, in Journal of Synchrotron Radiation,volume 10, 168 (2003)


List of Figures
2.1 Refraction at boundary between vacuum and matter for visible light and forX-rays . . . . . . . . . . . . . . . . . . . . . . . . . . . . . . . . . . . . . . . . 3
2.2 The mass attenuation coefficient µ/ρ in the range of 1 keV - 100 keV for differentmaterials. . . . . . . . . . . . . . . . . . . . . . . . . . . . . . . . . . . . . . . 6
2.3 Bragg and Laue constructions for diffraction peaks. . . . . . . . . . . . . . . 72.4 Intensity as a function of Q for small angle scattering. . . . . . . . . . . . . . 82.5 Types of parabolic refractive lenses. . . . . . . . . . . . . . . . . . . . . . . . 112.6 Principal geometries in which parabolic refractive X-ray lenses are used. . . . 13
3.1 The compensation of spherical aberration by a parabolic shape. . . . . . . . . 153.2 Numerically generated images of a Ni mesh comparing lens shapes. . . . . . . 163.3 Momentum transfer in case of a mirror and of a lens. . . . . . . . . . . . . . 173.4 The variation of (µ/δ) with the photon energy. . . . . . . . . . . . . . . . . . 193.5 Non lens parameters influencing the gain of an experiment. . . . . . . . . . . 193.6 The index of refraction decrement δ at different energies. . . . . . . . . . . . . 22
4.1 Lens holder with Be lenses and additional assembling features. . . . . . . . . 254.2 N.A. and dt at a fixed focal length for lens materials. . . . . . . . . . . . . . . 274.3 Field of view for Al and Be parabolic refractive X-ray lenses. . . . . . . . . . 284.4 The effective aperture illustrates the lower limit for the field of view. . . . . . 284.5 Calculated lateral resolution. . . . . . . . . . . . . . . . . . . . . . . . . . . . 294.6 Influence of the use of Be considering the depth of focus. . . . . . . . . . . . . 304.7 Tomogram of a single Be lens . . . . . . . . . . . . . . . . . . . . . . . . . . . 314.8 Small angle scattering of Be lenses. . . . . . . . . . . . . . . . . . . . . . . . . 324.9 The lens profile by optical scanning analysis. . . . . . . . . . . . . . . . . . . 32
5.1 Setup for a full field X-ray microscope. . . . . . . . . . . . . . . . . . . . . . . 365.2 Magnified image of a Ni mesh on high resolution film. . . . . . . . . . . . . . 365.3 Images of the Ni mesh with partial coherent and with incoherent illumination. 375.4 Hard X-ray microscope images of the same Au test structure. . . . . . . . . . 385.5 Resolution verified by line profiles. . . . . . . . . . . . . . . . . . . . . . . . . 395.6 Microprobing setup with fluorescence detection. . . . . . . . . . . . . . . . . . 405.7 Au Lα fluorescence knife-edge scans with a Be lens objective. The sharp edge
of the knife was moved in horizontal and vertical direction through the syn-chrotron radiation beam. . . . . . . . . . . . . . . . . . . . . . . . . . . . . . 41
5.8 Space coordinates in scanning tomography. . . . . . . . . . . . . . . . . . . . 425.9 Information processing in scanning absorption tomography. . . . . . . . . . . 43

5.10 Illustration of the selfabsorption effect in fluorescence microtomography. . . . 445.11 Setup for magnifying tomography. . . . . . . . . . . . . . . . . . . . . . . . . 455.12 Setup of a hard X-ray lithography experiment using rotational parabolic re-
fractive lenses. . . . . . . . . . . . . . . . . . . . . . . . . . . . . . . . . . . . 465.13 Comparison of the image size with different optical tools. . . . . . . . . . . . 475.14 Mask and demagnified lithography of a RWTH logo. . . . . . . . . . . . . . . 485.15 Small angle scattering of a collagen test sample . . . . . . . . . . . . . . . . . 49
6.1 Absorption edges of the atomic elements Cu, Zn, and Pd. . . . . . . . . . . . 546.2 XANES in a two atomic molecule. . . . . . . . . . . . . . . . . . . . . . . . . 546.3 EXAFS due to interference. . . . . . . . . . . . . . . . . . . . . . . . . . . . 566.4 Cu K-edge EXAFS spectrum with exemplar XAFS regions of interest. . . . 566.5 Setup of the XANES Microtomography experiments [43]. . . . . . . . . . . . 586.6 Knife-edge scans varying the energy. . . . . . . . . . . . . . . . . . . . . . . . 596.7 XANES microtomography analysis of an oxidized Cu wire . . . . . . . . . . . 616.8 XANES Microtomography of the CuO/ZnO-catalyst at the Cu K-edge. . . . 636.9 XANES Microtomography of the CuO/ZnO-Catalyst at the Zn K-edge. . . . 646.10 Reconstructed tomograms of a tomato root. . . . . . . . . . . . . . . . . . . . 666.11 Sinogram for the fluorescence measurement of the tomato root. . . . . . . . . 67
7.1 Scanning electron micrograph of a NFL. . . . . . . . . . . . . . . . . . . . . . 707.2 Form transfer during the microfabrication of an NFL. . . . . . . . . . . . . . 717.3 The effective aperture in dependence of the parabolic radius R. . . . . . . . . 727.4 Sketch of an experimental setup with NFLs. . . . . . . . . . . . . . . . . . . . 737.5 Lateral resolution for NFL lenses. . . . . . . . . . . . . . . . . . . . . . . . . . 747.6 Experimental setup with NFLs. . . . . . . . . . . . . . . . . . . . . . . . . . . 747.7 Vertical and horizontal fluorescence scans of a gold knife-edge. . . . . . . . . . 757.8 Fluorescence nanotomography of a micrometeorite. . . . . . . . . . . . . . . . 767.9 Test diffraction experiment of a GMR read head (IBM). . . . . . . . . . . . . 797.10 Nanodiffraction of an AgInSbTe thin film. . . . . . . . . . . . . . . . . . . . . 81

Acknowledgements to
Prof. B. Lengeler, of his confidence, the support, his endurance, and the assistance I havebenefit the last years.
Prof.H. Luth, for co-refereeing this thesis.
C.G. Schroer, his enthusiasm to any physical aspect of live tears me along and I stop onlywondering about the clear theoretical point of view he provides us with.
J.Knoch, whose constructive critics were most helpful and necessary.
the RWTH Experimental Physics IIB, nothing I have done would accomplished any-thing without the work of the others.
U.T.Hunger, his introduction in semiconductor processing was a lucky circumstance.
H. Schlosser, his expertise on workshop machinery and material manufacturing was essen-tial for the development of parabolic refractive lenses.
Prof. R. Frahm (University of Wuppertal), for the benefit of his support. I thank his groupfor the commitment in the concerted project XANES microtomography, which turnedout to be astonishing especially due to the experimental expertise of M.Richwin .
the ESRF, the scientific and machine staff of the beamlines ID22, ID18F, BM5, ID13, andID10 made many experiments possible. I hope that the now reached performance of therefractive parabolic X-ray lenses will help in the future, in exchange.
the APS, especially the members of 1-ID, I have to thank for a great experience and theopportunity to introduce XANES microtomography and microanalytic with parabolicrefractive lenses to a larger community.
A.A. Snigirev and I. Snigireva, for continuously supporting parabolic refractive lensesand for helping the Aachen group on many occasions.
W.Schroder (FZ-Julich) and J.-D.Grunwaldt (ETH Zurich), as representatives of allthe scientists which allow us to take their samples and I truly remember all the inter-esting insights in their scientific tasks.
Foundation:
• The use of the Advanced Photon Source was supported by the U. S. Depart-ment of Energy, Office of Science, Office of Basic Energy Science, under ContractNo. W-31-109-ENG-38
• The further development of parabolic refractive lenses are founded by the BMBF,project 05KS1PAB/5.

, and thanks for
... the change in mimic of the person I try to propose an experiment immediately the momentI mention being a member of the group of Bruno Lengeler. Changing from ’not possible’into ’maybe I miss something, we should try!’.
... the single event I was faster in realizing a task than Christian has simulated it.
... my colleague Boris living a non-egoism I benefit way to often.
... the pride Thomas developed during the NFL project - it always takes a smile on my face,and for his friendship.
... physics, being the only thing Florian and I have in common. I have never thought ofrespecting someone I disagree so often, I still don’t understand it.
... Olga coming along, adding a fine humor and an intelligent knowing of people beside herhard work for the group.
... the breath taking months with Malte. He, Thomas and I won the match versus boron,finally.
... the time during the beamtime. So I get to know Jens musical interests (imitation of live),which are sometimes interpreted by the motor movements.
... the knowing of Regina that physicians and bureaucracy often do not fit.
... all lenses Martin has manufactured (instead of me).
... our lights Mario has left; ’the’ adapting plate constructed by Sebastian; the differentperspective presented by Fatima; the 3D look of our results directed by Jannik; thebelletristic of Hartmut.
... the end of all the problems, frustrations, and overtime during the machining of the press-ing tools, each single time. I think Herbert Schlosser and Frank Neubauer will agree.
... the simple courage Michael Drakopoulos had shown by using the NFLs the first time.
... the foreign worker job with the boss Matthias Richwin and the warrior Bernd Grisebock.
... the weekly email from/to Gerda which has become a part of my life (ACKW 230).
... the trust and the perspective of my family.
...

Curriculum Vitae
Name: Marion Kuhlmann
Date of birth: 3.August 1969
Place of birth: Bramsche, Germany
08.1976 - 06.1980 Elementary school ’Meyerhof ’, Bramsche
07.1980 - 06.1982 Attendance at the ’Orientierungsstufe Innenstadt ’, Bramsche
07.1982 - 07.1985 Attendance at the ’Gymnasium Bramsche’, Bramsche
08.1985 - 05.1986 Attendance at the ’Realschule Bramsche’, Bramsche
07.1986 - 05.1988 Business school ’Fachgymnasium Wirtschaft Osnabruck ’, Osnabruck
10.1988 - 12.1992 Education computer science at the’Friedrich-Alexander Universitat Erlangen-Nurnberg ’, Erlangen
10.1994 - 09.1999 Education physics at the University Osnabruck, Osnabruck
01.2000 - 10.2004 PhD studies at Aachen University, Aachen
Related Documents