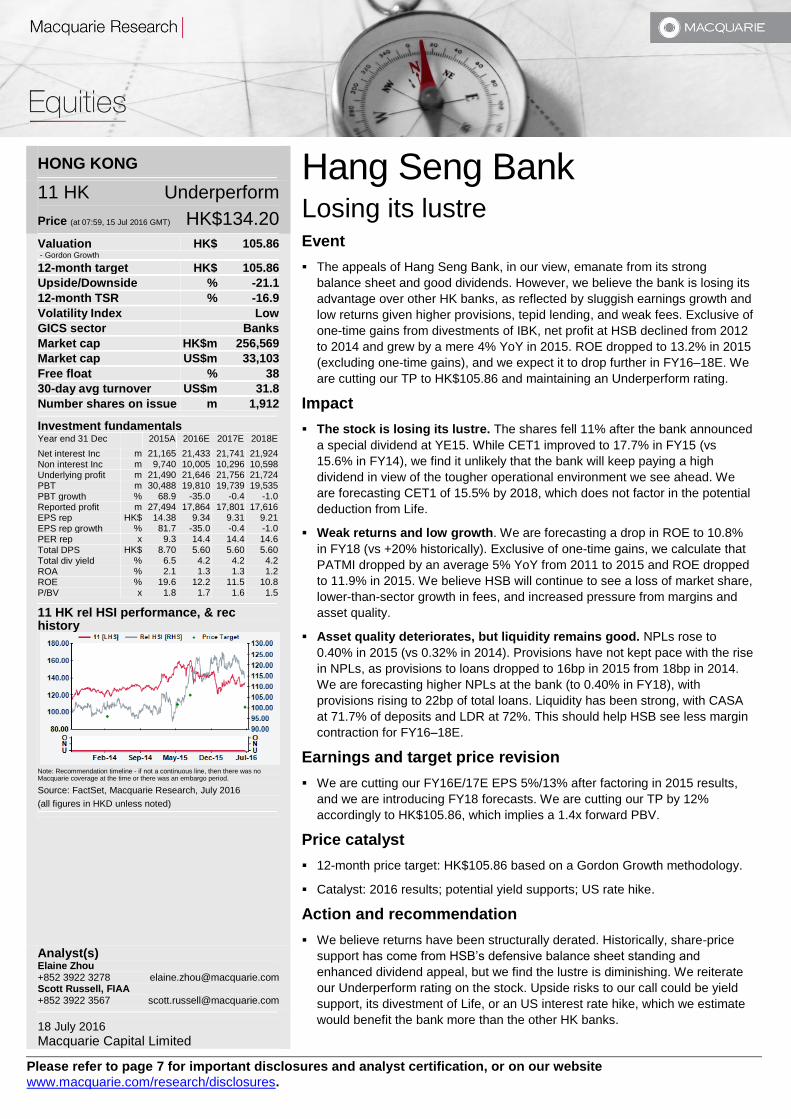
Please refer to page 7 for important disclosures and analyst certification, or on our website www.macquarie.com/research/disclosures . HONG KONG 11 HK Underperform Price (at 07:59, 15 Jul 2016 GMT) HK$134.20 Valuation HK$ 105.86 - Gordon Growth 12-month target HK$ 105.86 Upside/Downside % -21.1 12-month TSR % -16.9 Volatility Index Low GICS sector Banks Market cap HK$m 256,569 Market cap US$m 33,103 Free float % 38 30-day avg turnover US$m 31.8 Number shares on issue m 1,912 Investment fundamentals Year end 31 Dec 2015A 2016E 2017E 2018E Net interest Inc m 21,165 21,433 21,741 21,924 Non interest Inc m 9,740 10,005 10,296 10,598 Underlying profit m 21,490 21,646 21,756 21,724 PBT m 30,488 19,810 19,739 19,535 PBT growth % 68.9 -35.0 -0.4 -1.0 Reported profit m 27,494 17,864 17,801 17,616 EPS rep HK$ 14.38 9.34 9.31 9.21 EPS rep growth % 81.7 -35.0 -0.4 -1.0 PER rep x 9.3 14.4 14.4 14.6 Total DPS HK$ 8.70 5.60 5.60 5.60 Total div yield % 6.5 4.2 4.2 4.2 ROA % 2.1 1.3 1.3 1.2 ROE % 19.6 12.2 11.5 10.8 P/BV x 1.8 1.7 1.6 1.5 11 HK rel HSI performance, & rec history Note: Recommendation timeline - if not a continuous line, then there was no Macquarie coverage at the time or there was an embargo period. Source: FactSet, Macquarie Research, July 2016 (all figures in HKD unless noted) Analyst(s) Elaine Zhou +852 3922 3278 [email protected] Scott Russell, FIAA +852 3922 3567 [email protected] 18 July 2016 Macquarie Capital Limited Hang Seng Bank Losing its lustre Event The appeals of Hang Seng Bank, in our view, emanate from its strong balance sheet and good dividends. However, we believe the bank is losing its advantage over other HK banks, as reflected by sluggish earnings growth and low returns given higher provisions, tepid lending, and weak fees. Exclusive of one-time gains from divestments of IBK, net profit at HSB declined from 2012 to 2014 and grew by a mere 4% YoY in 2015. ROE dropped to 13.2% in 2015 (excluding one-time gains), and we expect it to drop further in FY16–18E. We are cutting our TP to HK$105.86 and maintaining an Underperform rating. Impact The stock is losing its lustre. The shares fell 11% after the bank announced a special dividend at YE15. While CET1 improved to 17.7% in FY15 (vs 15.6% in FY14), we find it unlikely that the bank will keep paying a high dividend in view of the tougher operational environment we see ahead. We are forecasting CET1 of 15.5% by 2018, which does not factor in the potential deduction from Life. Weak returns and low growth. We are forecasting a drop in ROE to 10.8% in FY18 (vs +20% historically). Exclusive of one-time gains, we calculate that PATMI dropped by an average 5% YoY from 2011 to 2015 and ROE dropped to 11.9% in 2015. We believe HSB will continue to see a loss of market share, lower-than-sector growth in fees, and increased pressure from margins and asset quality. Asset quality deteriorates, but liquidity remains good. NPLs rose to 0.40% in 2015 (vs 0.32% in 2014). Provisions have not kept pace with the rise in NPLs, as provisions to loans dropped to 16bp in 2015 from 18bp in 2014. We are forecasting higher NPLs at the bank (to 0.40% in FY18), with provisions rising to 22bp of total loans. Liquidity has been strong, with CASA at 71.7% of deposits and LDR at 72%. This should help HSB see less margin contraction for FY16–18E. Earnings and target price revision We are cutting our FY16E/17E EPS 5%/13% after factoring in 2015 results, and we are introducing FY18 forecasts. We are cutting our TP by 12% accordingly to HK$105.86, which implies a 1.4x forward PBV. Price catalyst 12-month price target: HK$105.86 based on a Gordon Growth methodology. Catalyst: 2016 results; potential yield supports; US rate hike. Action and recommendation We believe returns have been structurally derated. Historically, share-price support has come from HSB’s defensive balance sheet standing and enhanced dividend appeal, but we find the lustre is diminishing. We reiterate our Underperform rating on the stock. Upside risks to our call could be yield support, its divestment of Life, or an US interest rate hike, which we estimate would benefit the bank more than the other HK banks.

Welcome message from author
This document is posted to help you gain knowledge. Please leave a comment to let me know what you think about it! Share it to your friends and learn new things together.
Transcript
Please refer to page 7 for important disclosures and analyst certification, or on our website
www.macquarie.com/research/disclosures.
HONG KONG
11 HK Underperform
Price (at 07:59, 15 Jul 2016 GMT) HK$134.20
Valuation HK$ 105.86 - Gordon Growth
12-month target HK$ 105.86
Upside/Downside % -21.1
12-month TSR % -16.9
Volatility Index Low
GICS sector Banks
Market cap HK$m 256,569
Market cap US$m 33,103
Free float % 38
30-day avg turnover US$m 31.8
Number shares on issue m 1,912
Investment fundamentals Year end 31 Dec 2015A 2016E 2017E 2018E
Net interest Inc m 21,165 21,433 21,741 21,924 Non interest Inc m 9,740 10,005 10,296 10,598 Underlying profit m 21,490 21,646 21,756 21,724 PBT m 30,488 19,810 19,739 19,535 PBT growth % 68.9 -35.0 -0.4 -1.0 Reported profit m 27,494 17,864 17,801 17,616 EPS rep HK$ 14.38 9.34 9.31 9.21 EPS rep growth % 81.7 -35.0 -0.4 -1.0 PER rep x 9.3 14.4 14.4 14.6
Total DPS HK$ 8.70 5.60 5.60 5.60 Total div yield % 6.5 4.2 4.2 4.2 ROA % 2.1 1.3 1.3 1.2 ROE % 19.6 12.2 11.5 10.8 P/BV x 1.8 1.7 1.6 1.5
11 HK rel HSI performance, & rec history
Note: Recommendation timeline - if not a continuous line, then there was no Macquarie coverage at the time or there was an embargo period.
Source: FactSet, Macquarie Research, July 2016
(all figures in HKD unless noted)
Analyst(s) Elaine Zhou +852 3922 3278 [email protected] Scott Russell, FIAA +852 3922 3567 [email protected]
18 July 2016 Macquarie Capital Limited
Hang Seng Bank Losing its lustre Event
The appeals of Hang Seng Bank, in our view, emanate from its strong
balance sheet and good dividends. However, we believe the bank is losing its
advantage over other HK banks, as reflected by sluggish earnings growth and
low returns given higher provisions, tepid lending, and weak fees. Exclusive of
one-time gains from divestments of IBK, net profit at HSB declined from 2012
to 2014 and grew by a mere 4% YoY in 2015. ROE dropped to 13.2% in 2015
(excluding one-time gains), and we expect it to drop further in FY16–18E. We
are cutting our TP to HK$105.86 and maintaining an Underperform rating.
Impact
The stock is losing its lustre. The shares fell 11% after the bank announced
a special dividend at YE15. While CET1 improved to 17.7% in FY15 (vs
15.6% in FY14), we find it unlikely that the bank will keep paying a high
dividend in view of the tougher operational environment we see ahead. We
are forecasting CET1 of 15.5% by 2018, which does not factor in the potential
deduction from Life.
Weak returns and low growth. We are forecasting a drop in ROE to 10.8%
in FY18 (vs +20% historically). Exclusive of one-time gains, we calculate that
PATMI dropped by an average 5% YoY from 2011 to 2015 and ROE dropped
to 11.9% in 2015. We believe HSB will continue to see a loss of market share,
lower-than-sector growth in fees, and increased pressure from margins and
asset quality.
Asset quality deteriorates, but liquidity remains good. NPLs rose to
0.40% in 2015 (vs 0.32% in 2014). Provisions have not kept pace with the rise
in NPLs, as provisions to loans dropped to 16bp in 2015 from 18bp in 2014.
We are forecasting higher NPLs at the bank (to 0.40% in FY18), with
provisions rising to 22bp of total loans. Liquidity has been strong, with CASA
at 71.7% of deposits and LDR at 72%. This should help HSB see less margin
contraction for FY16–18E.
Earnings and target price revision
We are cutting our FY16E/17E EPS 5%/13% after factoring in 2015 results,
and we are introducing FY18 forecasts. We are cutting our TP by 12%
accordingly to HK$105.86, which implies a 1.4x forward PBV.
Price catalyst
12-month price target: HK$105.86 based on a Gordon Growth methodology.
Catalyst: 2016 results; potential yield supports; US rate hike.
Action and recommendation
We believe returns have been structurally derated. Historically, share-price
support has come from HSB’s defensive balance sheet standing and
enhanced dividend appeal, but we find the lustre is diminishing. We reiterate
our Underperform rating on the stock. Upside risks to our call could be yield
support, its divestment of Life, or an US interest rate hike, which we estimate
would benefit the bank more than the other HK banks.
Macquarie Research Hang Seng Bank
18 July 2016 2
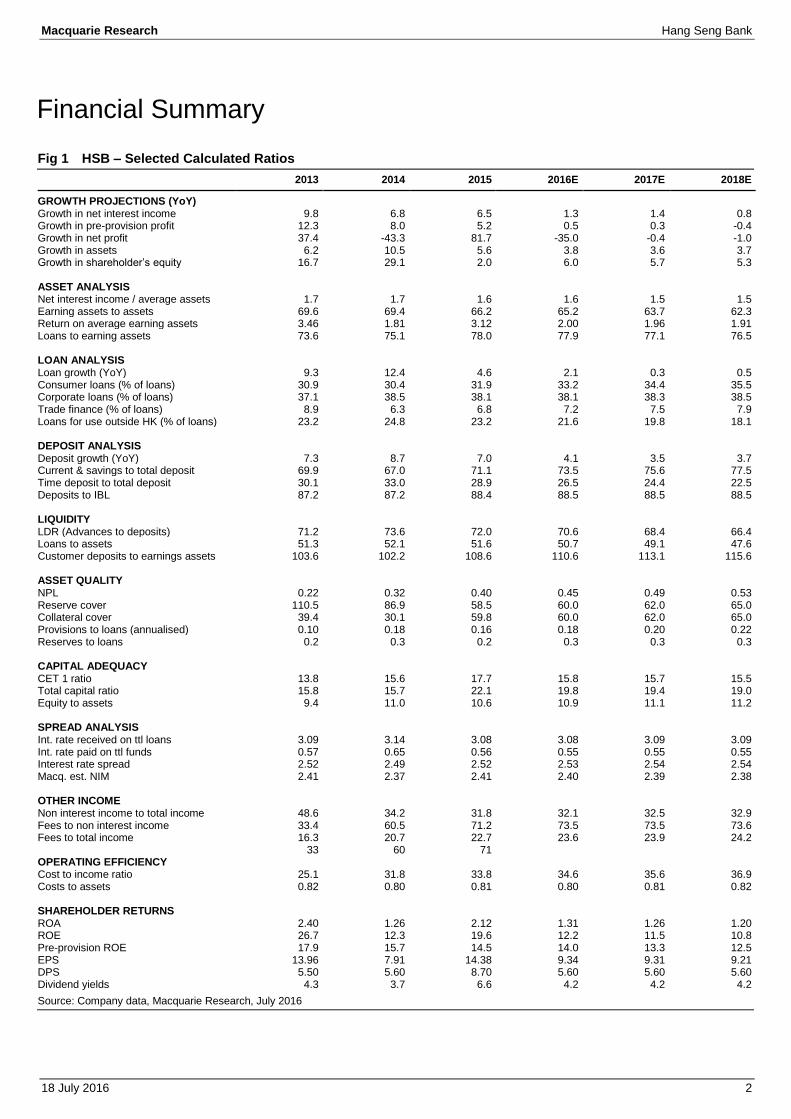
Financial Summary
Fig 1 HSB – Selected Calculated Ratios
2013 2014 2015 2016E 2017E 2018E
GROWTH PROJECTIONS (YoY) Growth in net interest income 9.8 6.8 6.5 1.3 1.4 0.8 Growth in pre-provision profit 12.3 8.0 5.2 0.5 0.3 -0.4 Growth in net profit 37.4 -43.3 81.7 -35.0 -0.4 -1.0 Growth in assets 6.2 10.5 5.6 3.8 3.6 3.7 Growth in shareholder’s equity 16.7 29.1 2.0 6.0 5.7 5.3 ASSET ANALYSIS Net interest income / average assets 1.7 1.7 1.6 1.6 1.5 1.5 Earning assets to assets 69.6 69.4 66.2 65.2 63.7 62.3 Return on average earning assets 3.46 1.81 3.12 2.00 1.96 1.91 Loans to earning assets 73.6 75.1 78.0 77.9 77.1 76.5 LOAN ANALYSIS Loan growth (YoY) 9.3 12.4 4.6 2.1 0.3 0.5 Consumer loans (% of loans) 30.9 30.4 31.9 33.2 34.4 35.5 Corporate loans (% of loans) 37.1 38.5 38.1 38.1 38.3 38.5 Trade finance (% of loans) 8.9 6.3 6.8 7.2 7.5 7.9 Loans for use outside HK (% of loans) 23.2 24.8 23.2 21.6 19.8 18.1 DEPOSIT ANALYSIS Deposit growth (YoY) 7.3 8.7 7.0 4.1 3.5 3.7 Current & savings to total deposit 69.9 67.0 71.1 73.5 75.6 77.5 Time deposit to total deposit 30.1 33.0 28.9 26.5 24.4 22.5 Deposits to IBL 87.2 87.2 88.4 88.5 88.5 88.5 LIQUIDITY LDR (Advances to deposits) 71.2 73.6 72.0 70.6 68.4 66.4 Loans to assets 51.3 52.1 51.6 50.7 49.1 47.6 Customer deposits to earnings assets 103.6 102.2 108.6 110.6 113.1 115.6 ASSET QUALITY NPL 0.22 0.32 0.40 0.45 0.49 0.53 Reserve cover 110.5 86.9 58.5 60.0 62.0 65.0 Collateral cover 39.4 30.1 59.8 60.0 62.0 65.0 Provisions to loans (annualised) 0.10 0.18 0.16 0.18 0.20 0.22 Reserves to loans 0.2 0.3 0.2 0.3 0.3 0.3 CAPITAL ADEQUACY CET 1 ratio 13.8 15.6 17.7 15.8 15.7 15.5 Total capital ratio 15.8 15.7 22.1 19.8 19.4 19.0 Equity to assets 9.4 11.0 10.6 10.9 11.1 11.2 SPREAD ANALYSIS Int. rate received on ttl loans 3.09 3.14 3.08 3.08 3.09 3.09 Int. rate paid on ttl funds 0.57 0.65 0.56 0.55 0.55 0.55 Interest rate spread 2.52 2.49 2.52 2.53 2.54 2.54 Macq. est. NIM 2.41 2.37 2.41 2.40 2.39 2.38 OTHER INCOME Non interest income to total income 48.6 34.2 31.8 32.1 32.5 32.9 Fees to non interest income 33.4 60.5 71.2 73.5 73.5 73.6 Fees to total income 16.3 20.7 22.7 23.6 23.9 24.2 33 60 71 OPERATING EFFICIENCY Cost to income ratio 25.1 31.8 33.8 34.6 35.6 36.9 Costs to assets 0.82 0.80 0.81 0.80 0.81 0.82 SHAREHOLDER RETURNS ROA 2.40 1.26 2.12 1.31 1.26 1.20 ROE 26.7 12.3 19.6 12.2 11.5 10.8 Pre-provision ROE 17.9 15.7 14.5 14.0 13.3 12.5 EPS 13.96 7.91 14.38 9.34 9.31 9.21 DPS 5.50 5.60 8.70 5.60 5.60 5.60 Dividend yields 4.3 3.7 6.6 4.2 4.2 4.2
Source: Company data, Macquarie Research, July 2016
Macquarie Research Hang Seng Bank
18 July 2016 3
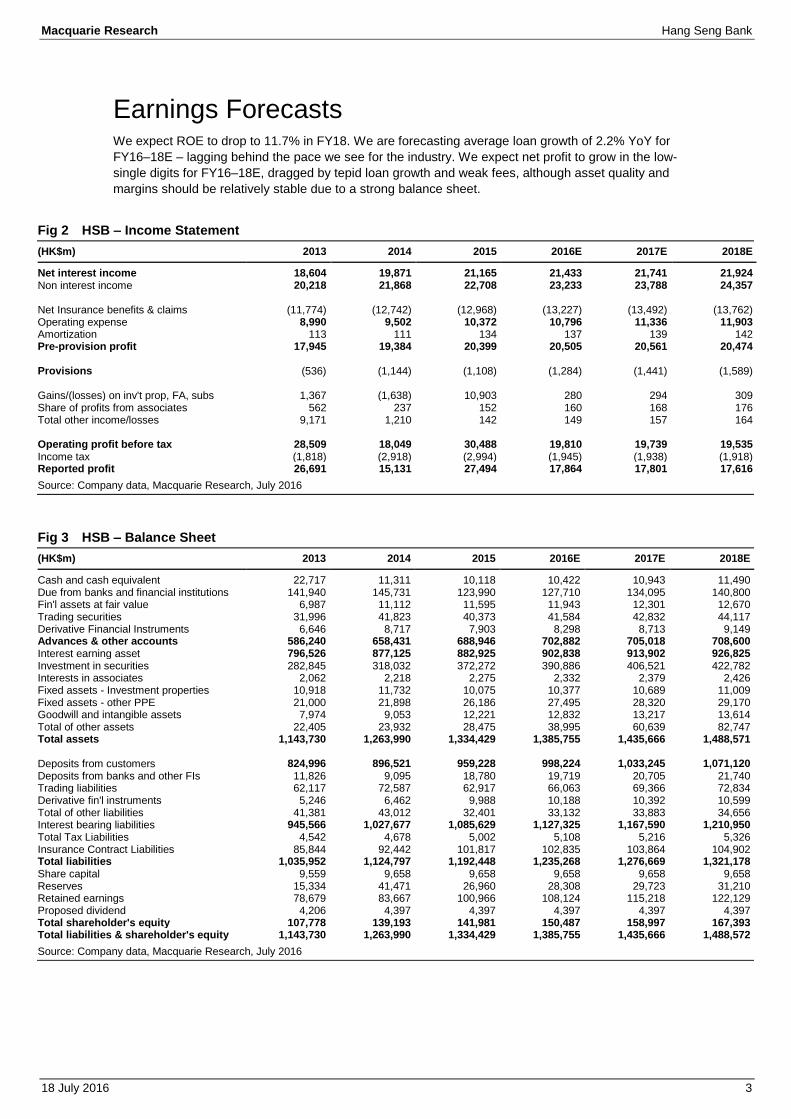
Earnings Forecasts We expect ROE to drop to 11.7% in FY18. We are forecasting average loan growth of 2.2% YoY for
FY16–18E – lagging behind the pace we see for the industry. We expect net profit to grow in the low-
single digits for FY16–18E, dragged by tepid loan growth and weak fees, although asset quality and
margins should be relatively stable due to a strong balance sheet.
Fig 2 HSB – Income Statement
(HK$m) 2013 2014 2015 2016E 2017E 2018E
Net interest income 18,604 19,871 21,165 21,433 21,741 21,924 Non interest income 20,218 21,868 22,708 23,233 23,788 24,357 Net Insurance benefits & claims (11,774) (12,742) (12,968) (13,227) (13,492) (13,762) Operating expense 8,990 9,502 10,372 10,796 11,336 11,903 Amortization 113 111 134 137 139 142 Pre-provision profit 17,945 19,384 20,399 20,505 20,561 20,474 Provisions (536) (1,144) (1,108) (1,284) (1,441) (1,589) Gains/(losses) on inv't prop, FA, subs 1,367 (1,638) 10,903 280 294 309 Share of profits from associates 562 237 152 160 168 176 Total other income/losses 9,171 1,210 142 149 157 164 Operating profit before tax 28,509 18,049 30,488 19,810 19,739 19,535 Income tax (1,818) (2,918) (2,994) (1,945) (1,938) (1,918) Reported profit 26,691 15,131 27,494 17,864 17,801 17,616
Source: Company data, Macquarie Research, July 2016
Fig 3 HSB – Balance Sheet
(HK$m) 2013 2014 2015 2016E 2017E 2018E
Cash and cash equivalent 22,717 11,311 10,118 10,422 10,943 11,490 Due from banks and financial institutions 141,940 145,731 123,990 127,710 134,095 140,800 Fin'l assets at fair value 6,987 11,112 11,595 11,943 12,301 12,670 Trading securities 31,996 41,823 40,373 41,584 42,832 44,117 Derivative Financial Instruments 6,646 8,717 7,903 8,298 8,713 9,149 Advances & other accounts 586,240 658,431 688,946 702,882 705,018 708,600 Interest earning asset 796,526 877,125 882,925 902,838 913,902 926,825 Investment in securities 282,845 318,032 372,272 390,886 406,521 422,782 Interests in associates 2,062 2,218 2,275 2,332 2,379 2,426 Fixed assets - Investment properties 10,918 11,732 10,075 10,377 10,689 11,009 Fixed assets - other PPE 21,000 21,898 26,186 27,495 28,320 29,170 Goodwill and intangible assets 7,974 9,053 12,221 12,832 13,217 13,614 Total of other assets 22,405 23,932 28,475 38,995 60,639 82,747 Total assets 1,143,730 1,263,990 1,334,429 1,385,755 1,435,666 1,488,571 Deposits from customers 824,996 896,521 959,228 998,224 1,033,245 1,071,120 Deposits from banks and other FIs 11,826 9,095 18,780 19,719 20,705 21,740 Trading liabilities 62,117 72,587 62,917 66,063 69,366 72,834 Derivative fin'l instruments 5,246 6,462 9,988 10,188 10,392 10,599 Total of other liabilities 41,381 43,012 32,401 33,132 33,883 34,656 Interest bearing liabilities 945,566 1,027,677 1,085,629 1,127,325 1,167,590 1,210,950 Total Tax Liabilities 4,542 4,678 5,002 5,108 5,216 5,326 Insurance Contract Liabilities 85,844 92,442 101,817 102,835 103,864 104,902 Total liabilities 1,035,952 1,124,797 1,192,448 1,235,268 1,276,669 1,321,178 Share capital 9,559 9,658 9,658 9,658 9,658 9,658 Reserves 15,334 41,471 26,960 28,308 29,723 31,210 Retained earnings 78,679 83,667 100,966 108,124 115,218 122,129 Proposed dividend 4,206 4,397 4,397 4,397 4,397 4,397 Total shareholder's equity 107,778 139,193 141,981 150,487 158,997 167,393 Total liabilities & shareholder's equity 1,143,730 1,263,990 1,334,429 1,385,755 1,435,666 1,488,572
Source: Company data, Macquarie Research, July 2016
Macquarie Research Hang Seng Bank
18 July 2016 4
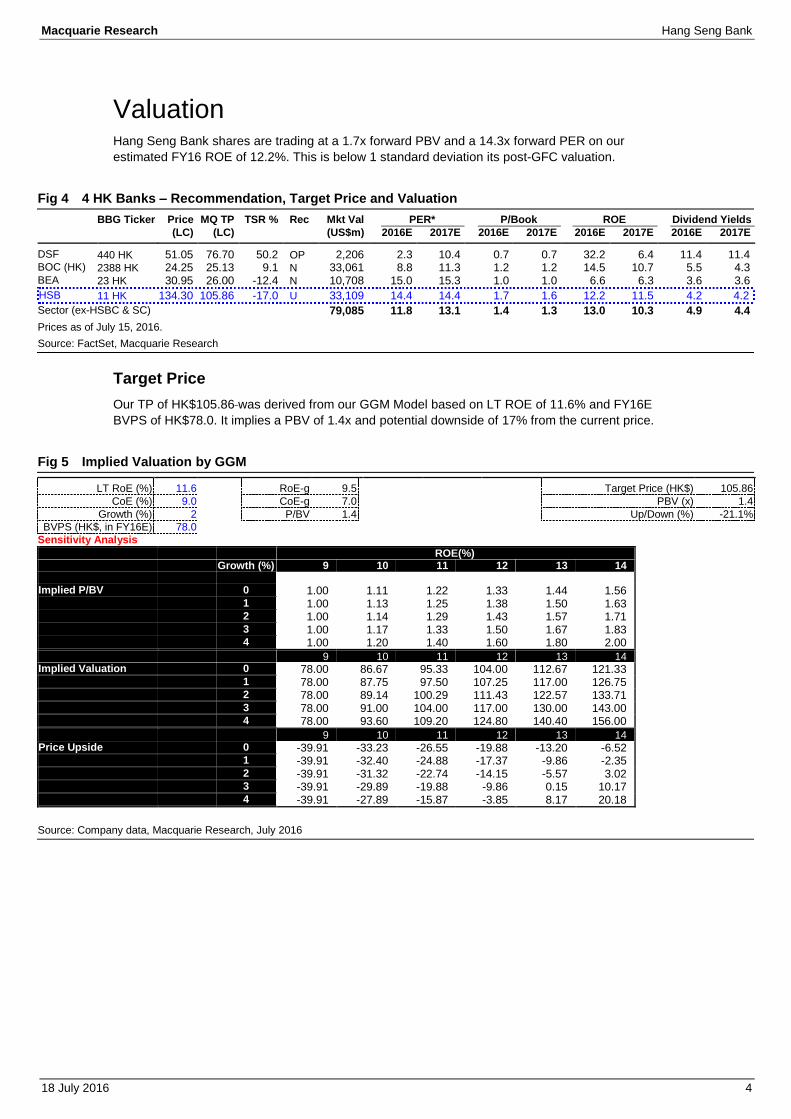
Valuation Hang Seng Bank shares are trading at a 1.7x forward PBV and a 14.3x forward PER on our
estimated FY16 ROE of 12.2%. This is below 1 standard deviation its post-GFC valuation.
Fig 4 4 HK Banks – Recommendation, Target Price and Valuation
BBG Ticker Price MQ TP TSR % Rec Mkt Val PER* P/Book ROE Dividend Yields
(LC) (LC) (US$m) 2016E 2017E 2016E 2017E 2016E 2017E 2016E 2017E
DSF 440 HK 51.05 76.70 50.2 OP 2,206 2.3 10.4 0.7 0.7 32.2 6.4 11.4 11.4 BOC (HK) 2388 HK 24.25 25.13 9.1 N 33,061 8.8 11.3 1.2 1.2 14.5 10.7 5.5 4.3 BEA 23 HK 30.95 26.00 -12.4 N 10,708 15.0 15.3 1.0 1.0 6.6 6.3 3.6 3.6
HSB 11 HK 134.30 105.86 -17.0 U 33,109 14.4 14.4 1.7 1.6 12.2 11.5 4.2 4.2
Sector (ex-HSBC & SC) 79,085 11.8 13.1 1.4 1.3 13.0 10.3 4.9 4.4
Prices as of July 15, 2016.
Source: FactSet, Macquarie Research
Target Price
Our TP of HK$105.86 was derived from our GGM Model based on LT ROE of 11.6% and FY16E
BVPS of HK$78.0. It implies a PBV of 1.4x and potential downside of 17% from the current price.
Fig 5 Implied Valuation by GGM
LT RoE (%) 11.6 RoE-g 9.5 Target Price (HK$) 105.86
CoE (%) 9.0 CoE-g 7.0 PBV (x) 1.4
Growth (%) 2 P/BV 1.4 Up/Down (%) -21.1%
BVPS (HK$, in FY16E) 78.0
Sensitivity Analysis
ROE(%) Growth (%) 9 10 11 12 13 14 Implied P/BV 0 1.00 1.11 1.22 1.33 1.44 1.56
1 1.00 1.13 1.25 1.38 1.50 1.63
2 1.00 1.14 1.29 1.43 1.57 1.71
3 1.00 1.17 1.33 1.50 1.67 1.83
4 1.00 1.20 1.40 1.60 1.80 2.00
9 10 11 12 13 14 Implied Valuation 0 78.00 86.67 95.33 104.00 112.67 121.33
1 78.00 87.75 97.50 107.25 117.00 126.75
2 78.00 89.14 100.29 111.43 122.57 133.71
3 78.00 91.00 104.00 117.00 130.00 143.00
4 78.00 93.60 109.20 124.80 140.40 156.00
9 10 11 12 13 14 Price Upside 0 -39.91 -33.23 -26.55 -19.88 -13.20 -6.52
1 -39.91 -32.40 -24.88 -17.37 -9.86 -2.35
2 -39.91 -31.32 -22.74 -14.15 -5.57 3.02
3 -39.91 -29.89 -19.88 -9.86 0.15 10.17
4 -39.91 -27.89 -15.87 -3.85 8.17 20.18
Source: Company data, Macquarie Research, July 2016
Macquarie Research Hang Seng Bank
18 July 2016 5
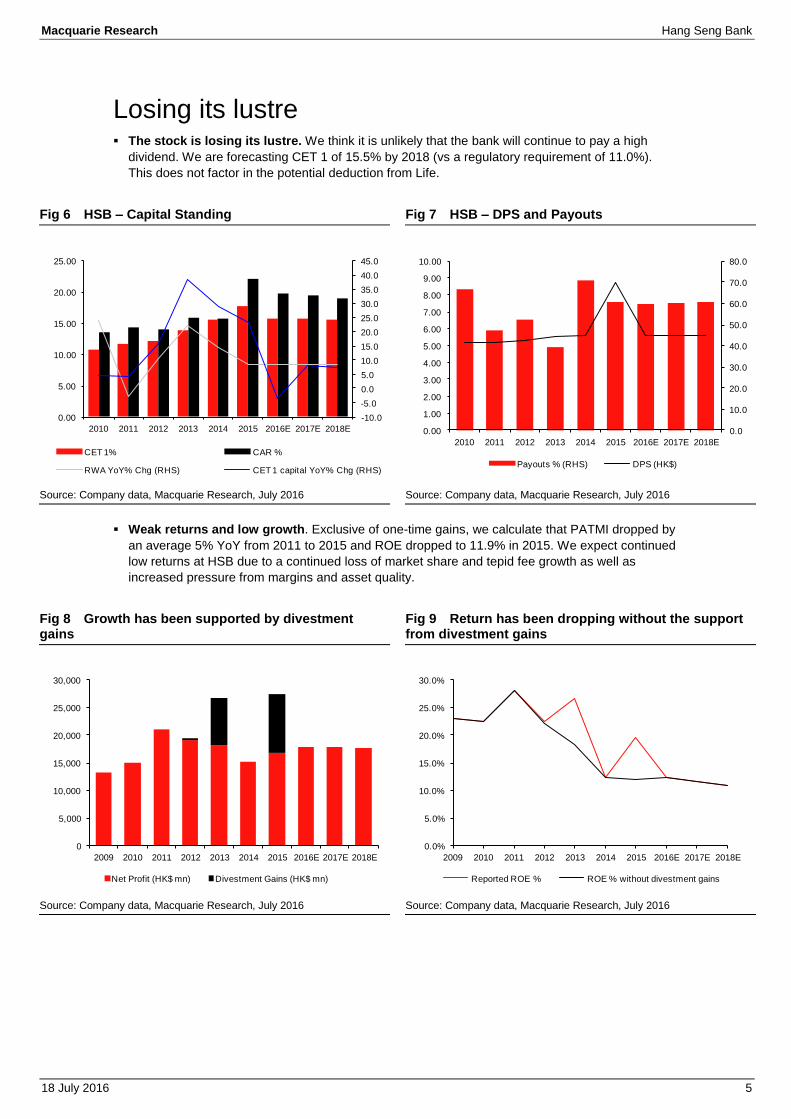
Losing its lustre The stock is losing its lustre. We think it is unlikely that the bank will continue to pay a high
dividend. We are forecasting CET 1 of 15.5% by 2018 (vs a regulatory requirement of 11.0%).
This does not factor in the potential deduction from Life.
Fig 6 HSB – Capital Standing Fig 7 HSB – DPS and Payouts
Source: Company data, Macquarie Research, July 2016 Source: Company data, Macquarie Research, July 2016
Weak returns and low growth. Exclusive of one-time gains, we calculate that PATMI dropped by
an average 5% YoY from 2011 to 2015 and ROE dropped to 11.9% in 2015. We expect continued
low returns at HSB due to a continued loss of market share and tepid fee growth as well as
increased pressure from margins and asset quality.
Fig 8 Growth has been supported by divestment gains
Fig 9 Return has been dropping without the support from divestment gains
Source: Company data, Macquarie Research, July 2016 Source: Company data, Macquarie Research, July 2016
-10.0
-5.0
0.0
5.0
10.0
15.0
20.0
25.0
30.0
35.0
40.0
45.0
0.00
5.00
10.00
15.00
20.00
25.00
2010 2011 2012 2013 2014 2015 2016E 2017E 2018E
CET 1% CAR %
RWA YoY% Chg (RHS) CET 1 capital YoY% Chg (RHS)
0.0
10.0
20.0
30.0
40.0
50.0
60.0
70.0
80.0
0.00
1.00
2.00
3.00
4.00
5.00
6.00
7.00
8.00
9.00
10.00
2010 2011 2012 2013 2014 2015 2016E 2017E 2018E
Payouts % (RHS) DPS (HK$)
0
5,000
10,000
15,000
20,000
25,000
30,000
2009 2010 2011 2012 2013 2014 2015 2016E 2017E 2018E
Net Profit (HK$ mn) Divestment Gains (HK$ mn)
0.0%
5.0%
10.0%
15.0%
20.0%
25.0%
30.0%
2009 2010 2011 2012 2013 2014 2015 2016E 2017E 2018E
Reported ROE % ROE % without divestment gains
Macquarie Research Hang Seng Bank
18 July 2016 6
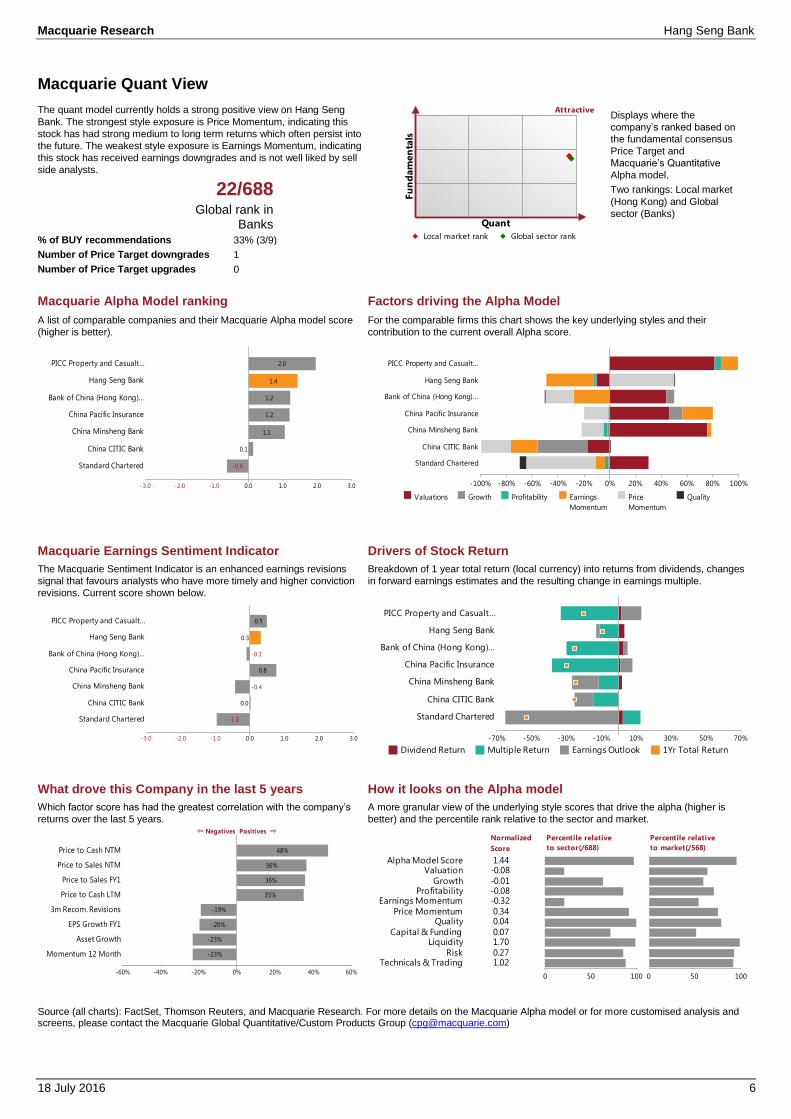
Macquarie Quant View
The quant model currently holds a strong positive view on Hang Seng
Bank. The strongest style exposure is Price Momentum, indicating this
stock has had strong medium to long term returns which often persist into
the future. The weakest style exposure is Earnings Momentum, indicating
this stock has received earnings downgrades and is not well liked by sell
side analysts.
Displays where the
company’s ranked based on
the fundamental consensus
Price Target and
Macquarie’s Quantitative
Alpha model.
Two rankings: Local market
(Hong Kong) and Global
sector (Banks)
22/688 Global rank in
Banks
% of BUY recommendations 33% (3/9)
Number of Price Target downgrades 1
Number of Price Target upgrades 0
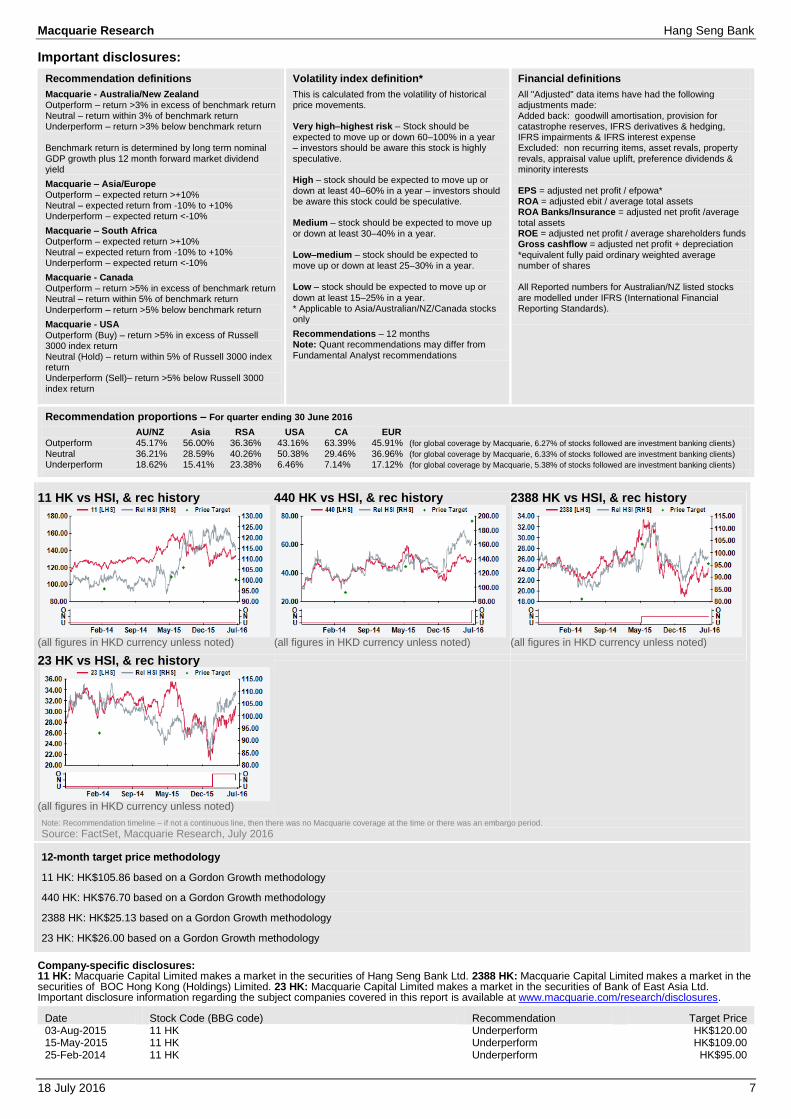
Macquarie Alpha Model ranking Factors driving the Alpha Model
A list of comparable companies and their Macquarie Alpha model score
(higher is better).
For the comparable firms this chart shows the key underlying styles and their
contribution to the current overall Alpha score.
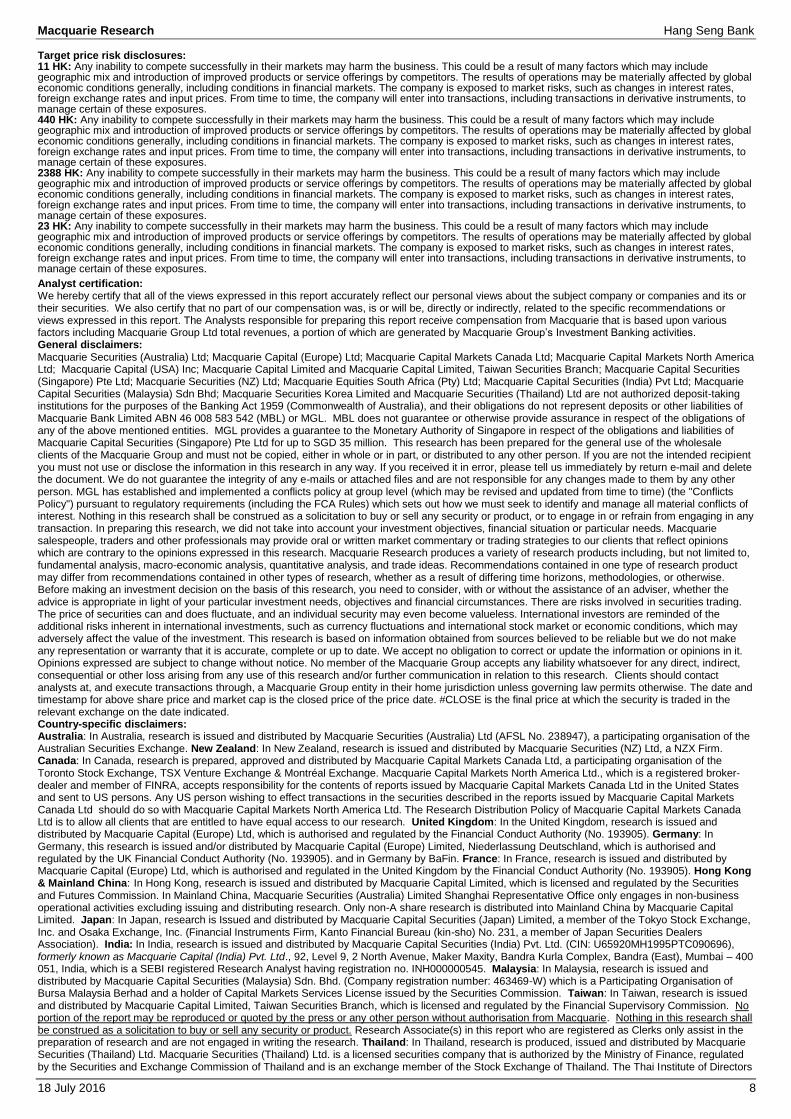
Macquarie Earnings Sentiment Indicator Drivers of Stock Return
The Macquarie Sentiment Indicator is an enhanced earnings revisions
signal that favours analysts who have more timely and higher conviction
revisions. Current score shown below.
Breakdown of 1 year total return (local currency) into returns from dividends, changes
in forward earnings estimates and the resulting change in earnings multiple.
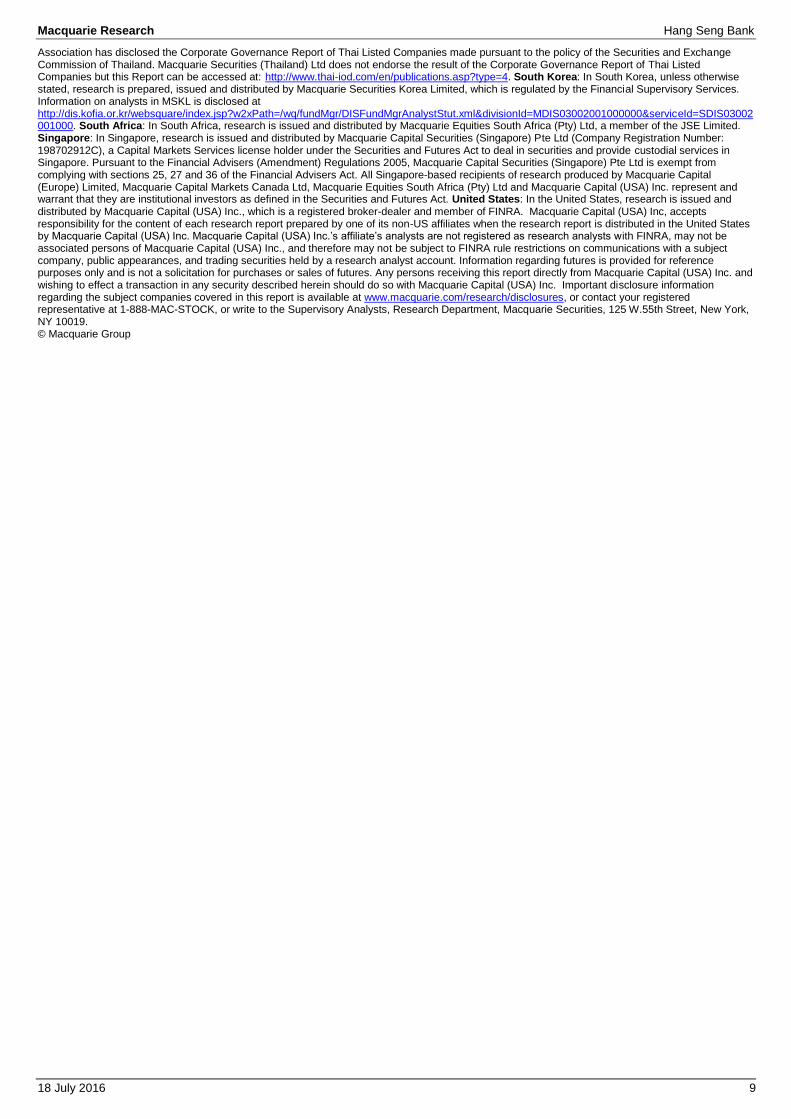
What drove this Company in the last 5 years How it looks on the Alpha model
Which factor score has had the greatest correlation with the company’s
returns over the last 5 years.
A more granular view of the underlying style scores that drive the alpha (higher is
better) and the percentile rank relative to the sector and market.
Source (all charts): FactSet, Thomson Reuters, and Macquarie Research. For more details on the Macquarie Alpha model or for more customised analysis and screens, please contact the Macquarie Global Quantitative/Custom Products Group ([email protected])
Fu
nd
am
en
tals
Quant
Local market rank Global sector rank
Attractive
-0.6
0.1
1.1
1.2
1.2
1.4
2.0
-3.0 -2.0 -1.0 0.0 1.0 2.0 3.0
Standard Chartered
China CITIC Bank
China Minsheng Bank
China Pacific Insurance
Bank of China (Hong Kong)…
Hang Seng Bank
PICC Property and Casualt…
-100% -80% -60% -40% -20% 0% 20% 40% 60% 80% 100%
Standard Chartered
China CITIC Bank
China Minsheng Bank
China Pacific Insurance
Bank of China (Hong Kong)…
Hang Seng Bank
PICC Property and Casualt…
Valuations Growth Profitability Earnings
Momentum
Price
Momentum
Quality
-1.0
0.0
-0.4
0.8
-0.1
0.3
0.5
-3.0 -2.0 -1.0 0.0 1.0 2.0 3.0
Standard Chartered
China CITIC Bank
China Minsheng Bank
China Pacific Insurance
Bank of China (Hong Kong)…
Hang Seng Bank
PICC Property and Casualt…
-70% -50% -30% -10% 10% 30% 50% 70%
Standard Chartered
China CITIC Bank
China Minsheng Bank
China Pacific Insurance
Bank of China (Hong Kong)…
Hang Seng Bank
PICC Property and Casualt…
Dividend Return Multiple Return Earnings Outlook 1Yr Total Return
-23%
-23%
-20%
-19%
35%
36%
36%
48%
-60% -40% -20% 0% 20% 40% 60%
⇐ Negatives Positives ⇒
Momentum 12 Month
Asset Growth
EPS Growth FY1
3m Recom. Revisions
Price to Cash LTM
Price to Sales FY1
Price to Sales NTM
Price to Cash NTM
0 1
Technicals & TradingRisk
LiquidityCapital & Funding
QualityPrice Momentum
Earnings MomentumProfitability
Growth
ValuationAlpha Model Score
1.02 0.27
1.70 0.07
0.04 0.34
-0.32-0.08-0.01
-0.08 1.44
0 1
Normalized
Score
0 50 100
Percentile relative
to sector(/688)
0 50 100
Percentile relative
to market(/568)
Macquarie Research Hang Seng Bank
18 July 2016 7
Important disclosures:
Recommendation definitions
Macquarie - Australia/New Zealand Outperform – return >3% in excess of benchmark return Neutral – return within 3% of benchmark return Underperform – return >3% below benchmark return Benchmark return is determined by long term nominal GDP growth plus 12 month forward market dividend yield
Macquarie – Asia/Europe Outperform – expected return >+10% Neutral – expected return from -10% to +10% Underperform – expected return <-10%
Macquarie – South Africa Outperform – expected return >+10% Neutral – expected return from -10% to +10% Underperform – expected return <-10%
Macquarie - Canada Outperform – return >5% in excess of benchmark return Neutral – return within 5% of benchmark return Underperform – return >5% below benchmark return
Macquarie - USA Outperform (Buy) – return >5% in excess of Russell 3000 index return Neutral (Hold) – return within 5% of Russell 3000 index return Underperform (Sell)– return >5% below Russell 3000 index return
Volatility index definition*
This is calculated from the volatility of historical price movements. Very high–highest risk – Stock should be expected to move up or down 60–100% in a year – investors should be aware this stock is highly speculative. High – stock should be expected to move up or down at least 40–60% in a year – investors should be aware this stock could be speculative. Medium – stock should be expected to move up or down at least 30–40% in a year. Low–medium – stock should be expected to move up or down at least 25–30% in a year. Low – stock should be expected to move up or
down at least 15–25% in a year. * Applicable to Asia/Australian/NZ/Canada stocks only
Recommendations – 12 months Note: Quant recommendations may differ from
Fundamental Analyst recommendations
Financial definitions
All "Adjusted" data items have had the following adjustments made: Added back: goodwill amortisation, provision for catastrophe reserves, IFRS derivatives & hedging, IFRS impairments & IFRS interest expense Excluded: non recurring items, asset revals, property revals, appraisal value uplift, preference dividends & minority interests EPS = adjusted net profit / efpowa* ROA = adjusted ebit / average total assets ROA Banks/Insurance = adjusted net profit /average total assets ROE = adjusted net profit / average shareholders funds Gross cashflow = adjusted net profit + depreciation *equivalent fully paid ordinary weighted average number of shares All Reported numbers for Australian/NZ listed stocks are modelled under IFRS (International Financial Reporting Standards).
Recommendation proportions – For quarter ending 30 June 2016
AU/NZ Asia RSA USA CA EUR Outperform 45.17% 56.00% 36.36% 43.16% 63.39% 45.91% (for global coverage by Macquarie, 6.27% of stocks followed are investment banking clients)
Neutral 36.21% 28.59% 40.26% 50.38% 29.46% 36.96% (for global coverage by Macquarie, 6.33% of stocks followed are investment banking clients)
Underperform 18.62% 15.41% 23.38% 6.46% 7.14% 17.12% (for global coverage by Macquarie, 5.38% of stocks followed are investment banking clients)
11 HK vs HSI, & rec history
(all figures in HKD currency unless noted)
440 HK vs HSI, & rec history
(all figures in HKD currency unless noted)
2388 HK vs HSI, & rec history
(all figures in HKD currency unless noted)
23 HK vs HSI, & rec history
(all figures in HKD currency unless noted)
Note: Recommendation timeline – if not a continuous line, then there was no Macquarie coverage at the time or there was an embargo period.
Source: FactSet, Macquarie Research, July 2016
12-month target price methodology
11 HK: HK$105.86 based on a Gordon Growth methodology
440 HK: HK$76.70 based on a Gordon Growth methodology
2388 HK: HK$25.13 based on a Gordon Growth methodology
23 HK: HK$26.00 based on a Gordon Growth methodology
Company-specific disclosures: 11 HK: Macquarie Capital Limited makes a market in the securities of Hang Seng Bank Ltd. 2388 HK: Macquarie Capital Limited makes a market in the securities of BOC Hong Kong (Holdings) Limited. 23 HK: Macquarie Capital Limited makes a market in the securities of Bank of East Asia Ltd. Important disclosure information regarding the subject companies covered in this report is available at www.macquarie.com/research/disclosures.
Date Stock Code (BBG code) Recommendation Target Price 03-Aug-2015 11 HK Underperform HK$120.00 15-May-2015 11 HK Underperform HK$109.00 25-Feb-2014 11 HK Underperform HK$95.00
Macquarie Research Hang Seng Bank
18 July 2016 8
Target price risk disclosures: 11 HK: Any inability to compete successfully in their markets may harm the business. This could be a result of many factors which may include geographic mix and introduction of improved products or service offerings by competitors. The results of operations may be materially affected by global economic conditions generally, including conditions in financial markets. The company is exposed to market risks, such as changes in interest rates, foreign exchange rates and input prices. From time to time, the company will enter into transactions, including transactions in derivative instruments, to manage certain of these exposures. 440 HK: Any inability to compete successfully in their markets may harm the business. This could be a result of many factors which may include geographic mix and introduction of improved products or service offerings by competitors. The results of operations may be materially affected by global economic conditions generally, including conditions in financial markets. The company is exposed to market risks, such as changes in interest rates, foreign exchange rates and input prices. From time to time, the company will enter into transactions, including transactions in derivative instruments, to manage certain of these exposures. 2388 HK: Any inability to compete successfully in their markets may harm the business. This could be a result of many factors which may include geographic mix and introduction of improved products or service offerings by competitors. The results of operations may be materially affected by global economic conditions generally, including conditions in financial markets. The company is exposed to market risks, such as changes in interest rates, foreign exchange rates and input prices. From time to time, the company will enter into transactions, including transactions in derivative instruments, to manage certain of these exposures. 23 HK: Any inability to compete successfully in their markets may harm the business. This could be a result of many factors which may include geographic mix and introduction of improved products or service offerings by competitors. The results of operations may be materially affected by global economic conditions generally, including conditions in financial markets. The company is exposed to market risks, such as changes in interest rates, foreign exchange rates and input prices. From time to time, the company will enter into transactions, including transactions in derivative instruments, to manage certain of these exposures.
Analyst certification: We hereby certify that all of the views expressed in this report accurately reflect our personal views about the subject company or companies and its or their securities. We also certify that no part of our compensation was, is or will be, directly or indirectly, related to the specific recommendations or views expressed in this report. The Analysts responsible for preparing this report receive compensation from Macquarie that is based upon various factors including Macquarie Group Ltd total revenues, a portion of which are generated by Macquarie Group’s Investment Banking activities. General disclaimers: Macquarie Securities (Australia) Ltd; Macquarie Capital (Europe) Ltd; Macquarie Capital Markets Canada Ltd; Macquarie Capital Markets North America Ltd; Macquarie Capital (USA) Inc; Macquarie Capital Limited and Macquarie Capital Limited, Taiwan Securities Branch; Macquarie Capital Securities (Singapore) Pte Ltd; Macquarie Securities (NZ) Ltd; Macquarie Equities South Africa (Pty) Ltd; Macquarie Capital Securities (India) Pvt Ltd; Macquarie Capital Securities (Malaysia) Sdn Bhd; Macquarie Securities Korea Limited and Macquarie Securities (Thailand) Ltd are not authorized deposit-taking institutions for the purposes of the Banking Act 1959 (Commonwealth of Australia), and their obligations do not represent deposits or other liabilities of Macquarie Bank Limited ABN 46 008 583 542 (MBL) or MGL. MBL does not guarantee or otherwise provide assurance in respect of the obligations of any of the above mentioned entities. MGL provides a guarantee to the Monetary Authority of Singapore in respect of the obligations and liabilities of Macquarie Capital Securities (Singapore) Pte Ltd for up to SGD 35 million. This research has been prepared for the general use of the wholesale clients of the Macquarie Group and must not be copied, either in whole or in part, or distributed to any other person. If you are not the intended recipient you must not use or disclose the information in this research in any way. If you received it in error, please tell us immediately by return e-mail and delete the document. We do not guarantee the integrity of any e-mails or attached files and are not responsible for any changes made to them by any other person. MGL has established and implemented a conflicts policy at group level (which may be revised and updated from time to time) (the "Conflicts Policy") pursuant to regulatory requirements (including the FCA Rules) which sets out how we must seek to identify and manage all material conflicts of interest. Nothing in this research shall be construed as a solicitation to buy or sell any security or product, or to engage in or refrain from engaging in any transaction. In preparing this research, we did not take into account your investment objectives, financial situation or particular needs. Macquarie salespeople, traders and other professionals may provide oral or written market commentary or trading strategies to our clients that reflect opinions which are contrary to the opinions expressed in this research. Macquarie Research produces a variety of research products including, but not limited to, fundamental analysis, macro-economic analysis, quantitative analysis, and trade ideas. Recommendations contained in one type of research product may differ from recommendations contained in other types of research, whether as a result of differing time horizons, methodologies, or otherwise. Before making an investment decision on the basis of this research, you need to consider, with or without the assistance of an adviser, whether the advice is appropriate in light of your particular investment needs, objectives and financial circumstances. There are risks involved in securities trading. The price of securities can and does fluctuate, and an individual security may even become valueless. International investors are reminded of the additional risks inherent in international investments, such as currency fluctuations and international stock market or economic conditions, which may adversely affect the value of the investment. This research is based on information obtained from sources believed to be reliable but we do not make any representation or warranty that it is accurate, complete or up to date. We accept no obligation to correct or update the information or opinions in it. Opinions expressed are subject to change without notice. No member of the Macquarie Group accepts any liability whatsoever for any direct, indirect, consequential or other loss arising from any use of this research and/or further communication in relation to this research. Clients should contact analysts at, and execute transactions through, a Macquarie Group entity in their home jurisdiction unless governing law permits otherwise. The date and timestamp for above share price and market cap is the closed price of the price date. #CLOSE is the final price at which the security is traded in the relevant exchange on the date indicated. Country-specific disclaimers: Australia: In Australia, research is issued and distributed by Macquarie Securities (Australia) Ltd (AFSL No. 238947), a participating organisation of the Australian Securities Exchange. New Zealand: In New Zealand, research is issued and distributed by Macquarie Securities (NZ) Ltd, a NZX Firm. Canada: In Canada, research is prepared, approved and distributed by Macquarie Capital Markets Canada Ltd, a participating organisation of the Toronto Stock Exchange, TSX Venture Exchange & Montréal Exchange. Macquarie Capital Markets North America Ltd., which is a registered broker-dealer and member of FINRA, accepts responsibility for the contents of reports issued by Macquarie Capital Markets Canada Ltd in the United States and sent to US persons. Any US person wishing to effect transactions in the securities described in the reports issued by Macquarie Capital Markets Canada Ltd should do so with Macquarie Capital Markets North America Ltd. The Research Distribution Policy of Macquarie Capital Markets Canada Ltd is to allow all clients that are entitled to have equal access to our research. United Kingdom: In the United Kingdom, research is issued and distributed by Macquarie Capital (Europe) Ltd, which is authorised and regulated by the Financial Conduct Authority (No. 193905). Germany: In Germany, this research is issued and/or distributed by Macquarie Capital (Europe) Limited, Niederlassung Deutschland, which is authorised and regulated by the UK Financial Conduct Authority (No. 193905). and in Germany by BaFin. France: In France, research is issued and distributed by Macquarie Capital (Europe) Ltd, which is authorised and regulated in the United Kingdom by the Financial Conduct Authority (No. 193905). Hong Kong & Mainland China: In Hong Kong, research is issued and distributed by Macquarie Capital Limited, which is licensed and regulated by the Securities and Futures Commission. In Mainland China, Macquarie Securities (Australia) Limited Shanghai Representative Office only engages in non-business operational activities excluding issuing and distributing research. Only non-A share research is distributed into Mainland China by Macquarie Capital Limited. Japan: In Japan, research is Issued and distributed by Macquarie Capital Securities (Japan) Limited, a member of the Tokyo Stock Exchange, Inc. and Osaka Exchange, Inc. (Financial Instruments Firm, Kanto Financial Bureau (kin-sho) No. 231, a member of Japan Securities Dealers Association). India: In India, research is issued and distributed by Macquarie Capital Securities (India) Pvt. Ltd. (CIN: U65920MH1995PTC090696), formerly known as Macquarie Capital (India) Pvt. Ltd., 92, Level 9, 2 North Avenue, Maker Maxity, Bandra Kurla Complex, Bandra (East), Mumbai – 400 051, India, which is a SEBI registered Research Analyst having registration no. INH000000545. Malaysia: In Malaysia, research is issued and distributed by Macquarie Capital Securities (Malaysia) Sdn. Bhd. (Company registration number: 463469-W) which is a Participating Organisation of Bursa Malaysia Berhad and a holder of Capital Markets Services License issued by the Securities Commission. Taiwan: In Taiwan, research is issued and distributed by Macquarie Capital Limited, Taiwan Securities Branch, which is licensed and regulated by the Financial Supervisory Commission. No portion of the report may be reproduced or quoted by the press or any other person without authorisation from Macquarie. Nothing in this research shall be construed as a solicitation to buy or sell any security or product. Research Associate(s) in this report who are registered as Clerks only assist in the preparation of research and are not engaged in writing the research. Thailand: In Thailand, research is produced, issued and distributed by Macquarie Securities (Thailand) Ltd. Macquarie Securities (Thailand) Ltd. is a licensed securities company that is authorized by the Ministry of Finance, regulated by the Securities and Exchange Commission of Thailand and is an exchange member of the Stock Exchange of Thailand. The Thai Institute of Directors
Macquarie Research Hang Seng Bank
18 July 2016 9
Association has disclosed the Corporate Governance Report of Thai Listed Companies made pursuant to the policy of the Securities and Exchange Commission of Thailand. Macquarie Securities (Thailand) Ltd does not endorse the result of the Corporate Governance Report of Thai Listed Companies but this Report can be accessed at: http://www.thai-iod.com/en/publications.asp?type=4. South Korea: In South Korea, unless otherwise stated, research is prepared, issued and distributed by Macquarie Securities Korea Limited, which is regulated by the Financial Supervisory Services. Information on analysts in MSKL is disclosed at http://dis.kofia.or.kr/websquare/index.jsp?w2xPath=/wq/fundMgr/DISFundMgrAnalystStut.xml&divisionId=MDIS03002001000000&serviceId=SDIS03002001000. South Africa: In South Africa, research is issued and distributed by Macquarie Equities South Africa (Pty) Ltd, a member of the JSE Limited. Singapore: In Singapore, research is issued and distributed by Macquarie Capital Securities (Singapore) Pte Ltd (Company Registration Number: 198702912C), a Capital Markets Services license holder under the Securities and Futures Act to deal in securities and provide custodial services in Singapore. Pursuant to the Financial Advisers (Amendment) Regulations 2005, Macquarie Capital Securities (Singapore) Pte Ltd is exempt from complying with sections 25, 27 and 36 of the Financial Advisers Act. All Singapore-based recipients of research produced by Macquarie Capital (Europe) Limited, Macquarie Capital Markets Canada Ltd, Macquarie Equities South Africa (Pty) Ltd and Macquarie Capital (USA) Inc. represent and warrant that they are institutional investors as defined in the Securities and Futures Act. United States: In the United States, research is issued and distributed by Macquarie Capital (USA) Inc., which is a registered broker-dealer and member of FINRA. Macquarie Capital (USA) Inc, accepts responsibility for the content of each research report prepared by one of its non-US affiliates when the research report is distributed in the United States by Macquarie Capital (USA) Inc. Macquarie Capital (USA) Inc.’s affiliate’s analysts are not registered as research analysts with FINRA, may not be associated persons of Macquarie Capital (USA) Inc., and therefore may not be subject to FINRA rule restrictions on communications with a subject company, public appearances, and trading securities held by a research analyst account. Information regarding futures is provided for reference purposes only and is not a solicitation for purchases or sales of futures. Any persons receiving this report directly from Macquarie Capital (USA) Inc. and wishing to effect a transaction in any security described herein should do so with Macquarie Capital (USA) Inc. Important disclosure information regarding the subject companies covered in this report is available at www.macquarie.com/research/disclosures, or contact your registered representative at 1-888-MAC-STOCK, or write to the Supervisory Analysts, Research Department, Macquarie Securities, 125 W.55th Street, New York, NY 10019. © Macquarie Group
Asia Research Head of Equity Research
Peter Redhead (Global – Head) (852) 3922 4836
Jake Lynch (Asia – Head) (852) 3922 3583
David Gibson (Japan – Head) (813) 3512 7880
Conrad Werner (ASEAN – Head) (65) 6601 0182
Automobiles/Auto Parts
Janet Lewis (China) (852) 3922 5417
Zhixuan Lin (China) (8621) 2412 9006
Leo Lin (China) (852) 3922 1098
Takuo Katayama (Japan) (813) 3512 7856
James Hong (Korea) (822) 3705 8661
Amit Mishra (India) (9122) 6720 4084
Lyall Taylor (Indonesia) (6221) 2598 8489
Financials
Scott Russell (Asia) (852) 3922 3567
Dexter Hsu (China, Taiwan) (8862) 2734 7530
Elaine Zhou (Hong Kong) (852) 3922 3278
Keisuke Moriyama (Japan) (813) 3512 7476
Leo Nakada (Japan) (813) 3512 6050
Chan Hwang (Korea) (822) 3705 8643
Suresh Ganapathy (India) (9122) 6720 4078
Thomas Stoegner (65) 6601 0854 (Malaysia, Singapore)
Lyall Taylor (Indonesia) (6221) 2598 8489
Gilbert Lopez (Philippines) (632) 857 0892
Passakorn Linmaneechote (Thailand) (662) 694 7728
Conglomerates
David Ng (China, Hong Kong) (852) 3922 1291
Conrad Werner (Singapore) (65) 6601 0182
Gilbert Lopez (Philippines) (632) 857 0892
Consumer and Gaming
Linda Huang (Asia, China, Hong Kong) (852) 3922 4068
Zibo Chen (China, Hong Kong) (852) 3922 1130
Terence Chang (China, Hong Kong) (852) 3922 3581
Satsuki Kawasaki (Japan) (813) 3512 7870
Kwang Cho (Korea) (822) 3705 4953
KJ Lee (Korea) (822) 3705 9935
Stella Li (Taiwan) (8862) 2734 7514
Amit Sinha (India) (9122) 6720 4085
Fransisca Widjaja (65) 6601 0847 (Indonesia, Singapore)
Hendy Soegiarto (Indonesia) (6221) 2598 8369
Karisa Magpayo (Philippines) (632) 857 0899
Chalinee Congmuang (Thailand) (662) 694 7993
Emerging Leaders
Jake Lynch (Asia) (852) 3922 3583
Aditya Suresh (Asia) (852) 3922 1265
Timothy Lam (China, Hong Kong) (852) 3922 1086
Mike Allen (Japan) (813) 3512 7859
Kwang Cho (Korea) (822) 3705 4953
Corinne Jian (Taiwan) (8862) 2734 7522
Marcus Yang (Taiwan) (8862) 2734 7532
Conrad Werner (ASEAN) (65) 6601 0182
Industrials
Janet Lewis (Asia) (852) 3922 5417
Patrick Dai (China) (8621) 2412 9082
Leo Lin (China) (852) 3922 1098
Kenjin Hotta (Japan) (813) 3512 7871
James Hong (Korea) (822) 3705 8661
Inderjeetsingh Bhatia (India) (9122) 6720 4087
Lyall Taylor (Indonesia) (6221) 2598 8489
Internet, Media and Software
Wendy Huang (Asia, China) (852) 3922 3378
David Gibson (Asia, Japan) (813) 3512 7880
Hillman Chan (China, Hong Kong) (852) 3922 3716
Nathan Ramler (Japan) (813) 3512 7875
Soyun Shin (Korea) (822) 3705 8659
Abhishek Bhandari (India) (9122) 6720 4088
Oil, Gas and Petrochemicals
Polina Diyachkina (Asia, Japan) (813) 3512 7886
Aditya Suresh (Asia, China) (852) 3922 1265
Anna Park (Korea) (822) 3705 8669
Duke Suttikulpanich (ASEAN) (65) 6601 0148
Isaac Chow (Malaysia) (603) 2059 8982
Pharmaceuticals and Healthcare
Abhishek Singhal (India) (9122) 6720 4086
Wei Li (China, Hong Kong) (852) 3922 5494
Property
Tuck Yin Soong (Asia, Singapore) (65) 6601 0838
David Ng (China, Hong Kong) (852) 3922 1291
Raymond Liu (China, Hong Kong) (852) 3922 3629
Wilson Ho (China) (852) 3922 3248
William Montgomery (Japan) (813) 3512 7864
Corinne Jian (Taiwan) (8862) 2734 7522
Abhishek Bhandari (India) (9122) 6720 4088
Aiman Mohamad (Malaysia) (603) 2059 8986
Kervin Sisayan (Philippines) (632) 857 0893
Patti Tomaitrichitr (Thailand) (662) 694 7727
Resources / Metals and Mining
Polina Diyachkina (Asia, Japan) (813) 3512 7886
Coria Chow (China) (852) 3922 1181
Anna Park (Korea) (822) 3705 8669
Stanley Liong (Indonesia) (6221) 2598 8381
Technology
Damian Thong (Asia, Japan) (813) 3512 7877
George Chang (Japan) (813) 3512 7854
Daniel Kim (Korea) (822) 3705 8641
Allen Chang (Greater China) (852) 3922 1136
Jeffrey Ohlweiler (Greater China) (8862) 2734 7512
Patrick Liao (Greater China) (8862) 2734 7515
Louis Cheng (Greater China) (8862) 2734 7526
Kaylin Tsai (Greater China) (8862) 2734 7523
Telecoms
Nathan Ramler (Asia, Japan) (813) 3512 7875
Danny Chu (Greater China) (852) 3922 4762
Soyun Shin (Korea) (822) 3705 8659
Chirag Jain (India) (9122) 6720 4352
Prem Jearajasingam (ASEAN) (603) 2059 8989
Kervin Sisayan (Philippines) (632) 857 0893
Transport & Infrastructure
Janet Lewis (Asia) (852) 3922 5417
Corinne Jian (Taiwan) (8862) 2734 7522
Azita Nazrene (ASEAN) (603) 2059 8980
Utilities & Renewables
Alan Hon (Hong Kong) (852) 3922 3589
Inderjeetsingh Bhatia (India) (9122) 6720 4087
Prem Jearajasingam (Malaysia) (603) 2059 8989
Karisa Magpayo (Philippines) (632) 857 0899
Commodities
Colin Hamilton (Global) (44 20) 3037 4061
Ian Roper (65) 6601 0698
Jim Lennon (44 20) 3037 4271
Lynn Zhao (8621) 2412 9035
Matthew Turner (44 20) 3037 4340
Economics
Peter Eadon-Clarke (Global) (813) 3512 7850
Larry Hu (China, Hong Kong) (852) 3922 3778
Tanvee Gupta Jain (India) (9122) 6720 4355
Quantitative / CPG
Gurvinder Brar (Global) (44 20) 3037 4036
Woei Chan (Asia) (852) 3922 1421
Danny Deng (Asia) (852) 3922 4646
Per Gullberg (Asia) (852) 3922 1478
Strategy/Country
Viktor Shvets (Asia, Global) (852) 3922 3883
Chetan Seth (Asia) (852) 3922 4769
David Ng (China, Hong Kong) (852) 3922 1291
Erwin Sanft (China, Hong Kong) (852) 3922 1516
Peter Eadon-Clarke (Japan) (813) 3512 7850
Chan Hwang (Korea) (822) 3705 8643
Jeffrey Ohlweiler (Taiwan) (8862) 2734 7512
Inderjeetsingh Bhatia (India) (9122) 6720 4087
Lyall Taylor (Indonesia) (6221) 2598 8489
Gilbert Lopez (Philippines) (632) 857 0892
Conrad Werner (Singapore) (65) 6601 0182
Alastair Macdonald (Thailand) (662) 694 7753
Find our research at Macquarie: www.macquarie.com.au/research Thomson: www.thomson.com/financial Reuters: www.knowledge.reuters.com Bloomberg: MAC GO Factset: http://www.factset.com/home.aspx CapitalIQ www.capitaliq.com Email [email protected] for access
Asia Sales Regional Heads of Sales
Miki Edelman (Global) (1 212) 231 6121
Jeff Evans (Boston) (1 617) 598 2508
Jeffrey Shiu (China, Hong Kong) (852) 3922 2061
Sandeep Bhatia (India) (9122) 6720 4101
Thomas Renz (Geneva) (41 22) 818 7712
Riaz Hyder (Indonesia) (6221) 2598 8486
Nick Cant (Japan) (65) 6601 0210
John Jay Lee (Korea) (822) 3705 9988
Nik Hadi (Malaysia) (603) 2059 8888
Eric Roles (New York) (1 212) 231 2559
Gino C Rojas (Philippines) (632) 857 0861
Regional Heads of Sales cont’d
Paul Colaco (San Francisco) (1 415) 762 5003
Amelia Mehta (Singapore) (65) 6601 0211
Angus Kent (Thailand) (662) 694 7601
Ben Musgrave (UK/Europe) (44 20) 3037 4882
Christina Lee (UK/Europe) (44 20) 3037 4873
Sales Trading
Adam Zaki (Asia) (852) 3922 2002
Stanley Dunda (Indonesia) (6221) 515 1555
Sales Trading cont’d
Suhaida Samsudin (Malaysia) (603) 2059 8888
Michael Santos (Philippines) (632) 857 0813
Chris Reale (New York) (1 212) 231 2555
Marc Rosa (New York) (1 212) 231 2555
Justin Morrison (Singapore) (65) 6601 0288
Daniel Clarke (Taiwan) (8862) 2734 7580
Brendan Rake (Thailand) (662) 694 7707
Mike Keen (UK/Europe) (44 20) 3037 4905
This publication was disseminated on 18 July 2016 at 08:58 UTC.
Related Documents