PNNL-6415 Rev. 15 Hanford Site National Environmental Policy Act (NEPA) Characterization D. A. Neitzel, Editor A. L. Bunn D. G. Horton K.W. Burk G. V. Last S.D. Cannon T. M. Poston J.P. Duncan E. L. Prendergast-Kennedy R.A. Fowler S.P. Reidel B. G. Fritz A. C. Rohay D. W. Harvey M. J. Scott P. L. Hendrickson P. D. Thorne D. J. Hoitink D.M. Woody September 2003 Prepared for the U.S. Department of Energy under Contract DE-AC06-76RL01830

Welcome message from author
This document is posted to help you gain knowledge. Please leave a comment to let me know what you think about it! Share it to your friends and learn new things together.
Transcript
PNNL-6415 Rev. 15
Hanford Site National Environmental Policy Act (NEPA) Characterization D. A. Neitzel, Editor A. L. Bunn D. G. Horton K.W. Burk G. V. Last S.D. Cannon T. M. Poston J.P. Duncan E. L. Prendergast-Kennedy R.A. Fowler S.P. Reidel B. G. Fritz A. C. Rohay D. W. Harvey M. J. Scott P. L. Hendrickson P. D. Thorne D. J. Hoitink D.M. Woody September 2003 Prepared for the U.S. Department of Energy under Contract DE-AC06-76RL01830
DISCLAIMER
This report was prepared as an account of work sponsored by an agency of the United States Government. Neither the United States Government nor any agency thereof, nor Battelle Memorial Institute, nor any of their employees, makes any warranty, express or implied, or assumes any legal liability or responsibility for the accuracy, completeness, or usefulness of any information, apparatus, product, or process disclosed, or represents that its use would not infringe privately owned rights. Reference herein to any specific commercial product, process, or service by trade name, trademark, manufacturer, or otherwise does not necessarily constitute or imply its endorsement, recommendation, or favoring by the United States Government or any agency thereof, or Battelle Memorial Institute. The views and opinions of authors expressed herein do not necessarily state or reflect those of the United States Government or any agency thereof.
PACIFIC NORTHWEST NATIONAL LABORATORY operated by BATTELLE
for the UNITED STATES DEPARTMENT OF ENERGY
under Contract DE-AC06-76RL01830
Printed in the United States of America
Available to DOE and DOE contractors from the Office of Scientific and Technical Information, P.O. Box 62, Oak Ridge, TN 37831;
prices available from (615) 576-8401.
Available to the public from the National Technical Information Service, U.S. Department of Commerce, 5285 Port Royal Rd., Springfield, VA 22161
Hanford Site National Environmental Policy Act (NEPA) Characterization
D. A. Neitzel, Editor
A. L. Bunn K. W. Burk S. D. Cannon J. P. Duncan R. A. Fowler B. G. Fritz D. W. Harvey P. L. Hendrickson D. J. Hoitink D. G. Horton G. V. Last T. M. Poston E. L. Prendergast-Kennedy S. P. Reidel A. C. Rohay M. J. Scott P. D. Thorne D. M. Woody
September 2003
Prepared for the U.S. Department of Energy under Contract DE-AC06-76RL01830
PNNL-64 15 Rev. 15
Pacific Northwest National Laboratory Richland, Washington 99352

This page intentionally left blank
This document describes the U.S. Department of Energy's (DOE) Hanford Site environment. It is updated each year and is intended to provide a consistent description of the Hanford Site environment for the many National Environmental Policy Act (NEPA) documents being prepared by DOE contractors. No statements of significance or environmental consequences are provided. This year's report is the fifteenth revision of the original document published in 1988 and is (until replaced by the sixteenth revision) the only version that is relevant for use in the preparation of Hanford NEPA, State Environmental Policy Act (SEPA), and Comprehensive Environmental Response, Compensation, and Liability Act (CERCLA) documents.
The two chapters included in this document (Chapters 4 and 6) are numbered to correspond to the chapters where such information is typically presented in environmental impact statements (EISs) and other Hanford Site NEPA or CERCLA documentation. Chapter 4.0 (Affected Environment) describes Hanford Site climate and meteorology; geology; hydrology; ecology; cultural, archaeological, and historical resources; socioeconomics; noise; and occupational safety. Sources for extensive tabular data related to these topics are provided in the chapter. Most subjects are divided into a general description of the characteristics of the Hanford Site, followed by site-specific information, where available, of the 100, 200, 300, and other areas. This division allows the reader to go directly to those sections of particular interest. When specific information on each of these separate areas is not complete or available, the general Hanford Site description should be used.
Chapter 6.0 (Statutory and Regulatory Requirements) describes federal and state laws and regulations, DOE directives and permits, and presidential executive orders that are applicable to the NEPA documents prepared for Hanford Site activities. Information in Chapter 6 of this document can be adapted and supplemented with specific information for a chapter covering statutory and regulatory requirements in an environmental assessment or environmental impact statement (EIS).
When preparing environmental assessments and EISs, authors should also be cognizant of the document titled Recommendations,for the Preparation of Environmental Assessments and Environmental Impact Statements published by the DOE Office of NEPA Oversight (DOE 1993a). Additional guidance on preparing DOE NEPA documents can be found at http://tis.eh.doe.gov/nepdguidance.html.
Any interested individual seeking baseline data on the Hanford Site and its past activities may also use the information contained in this document to evaluate projected activities and their impacts.
For this 2003 revision, the following sections of the document were reviewed by the authors and updated with the best available information through April 2003:
Climate and Meteorology Geology Hydrology - Average daily flow charts for the Columbia and Yakima rivers. Ecology - Threatened and Endangered Species subsection only Cultural, Archaeological, and Historical Resources Socioeconomics Occupational Safety All of Chapter 6, Statutory and Regulatory Requirements.
Remaining sections were last revised in 2002.
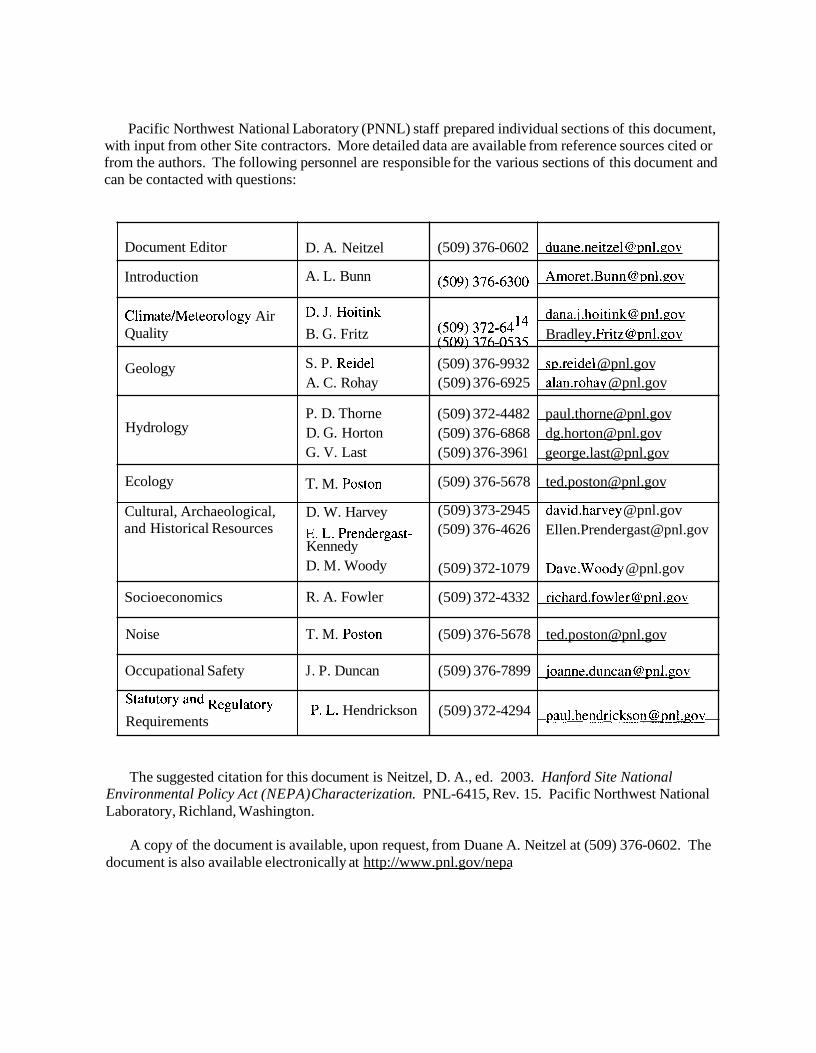
Pacific Northwest National Laboratory (PNNL) staff prepared individual sections of this document, with input from other Site contractors. More detailed data are available from reference sources cited or from the authors. The following personnel are responsible for the various sections of this document and can be contacted with questions:
The suggested citation for this document is Neitzel, D. A., ed. 2003. Hanford Site National Environmental Policy Act (NEPA) Characterization. PNL-6415, Rev. 15. Pacific Northwest National Laboratory, Richland, Washington.
Document Editor
Introduction
Climate/Meteorology Air Quality
Geology
Hydrology
Ecology
Cultural, Archaeological, and Historical Resources
Socioeconomics
Noise
Occupational Safety
Stamtory and Requirements
A copy of the document is available, upon request, from Duane A. Neitzel at (509) 376-0602. The document is also available electronically at http://www.pnl.gov/nepa
D. A. Neitzel
A. L. Bunn
D. J. Hoitink B. G. Fritz
S. P. Reidel A. C. Rohay
P. D. Thorne D. G. Horton G. V. Last
T. M. Poston
D. W. Harvey E. L. Prendergast- Kennedy D. M. Woody
R. A. Fowler
T. M. Poston
J. P. Duncan
p. L. Hendrickson
(509) 376-0602
(509) 376-6300
(509) 372-64 (509) 376-0535
(509) 376-9932 (509) 376-6925
(509) 372-4482 (509) 376-6868 (509) 376-396 1
(509) 376-5678
(509) 373-2945 (509) 376-4626
(509) 372-1 079
(509) 372-4332
(509) 376-5678
(509) 376-7899
(509) 372-4294
duane.neitze1 @ pnl .gov
dana.i [email protected] Bradley [email protected]
sp.reide1 @pnl.gov alan.rohay @pnl.gov
[email protected] [email protected] [email protected]
david.harvey @pnl.gov [email protected]
Dave.Woody @pnl.gov
joanne.duncan@pnl.,oov
Acknowledgments
As the editor of Revision 15, I hope you find this document useful in preparing Hanford Site NEPA documents or as a useful source of information about the Hanford environment. Many people are responsible for the years of work that went into preparing this description of the Hanford Site. The authors of the individual sections took great care to accurately describe their work. PNNL, DOE, and other Hanford contractor personnel reviewed the document. Their comments and suggestions are important to preparing Revision 15. This year's reviewers include Kathy Rhoads, Darby Stapp, Michael Scott, Charles Brandt, Paul Dunigan, Douglas Hildebrand, Ken Gano, Kathy Tollefson, Van Ramsdell, Annabelle Rodriguez, Michael Sackschewsky, Thomas Marceau, Bruce Bjornstad, Doug Chapin, and Jamie Zeisloft. A special thanks goes to Paul Dunigan and Annabelle Rodriguez with DOE for their help and support. Most importantly, I thank Joanne Duncan and Amoret Bunn for all their work in making sure Revision 15 was completed on time and presented in a way that is useful to everyone needing an up- to-date description of the Hanford environment. Joanne Duncan also maintains the electronic copy of the document throughout the year.
D. A. Neitzel

This page intentionally left blank
Acronyms, Abbreviations, and Symbols
AADT AAS ACL AEA ALE ARAR ARPA BCAA BCRFD BLS BNI BNSF B.P. BPA CAA CBC CCP/EIS CEQ CERCLA CFR Corps CWA dB dB A DCG DOC DOE DOE-ORP DOERL DOH DO1 DOL DWS E/Q EA EC Ecology EDNA EIS EJ EMT EO E.O. EPA EPCRA ESU
Annual average daily traffic Associate in applied science Administrative Control Level Atomic Energy Act Fitzner Eberhardt Arid Lands Ecology Reserve Applicable or Relevant and Appropriate Requirements Archaeological Resources Protection Act Benton Clean Air Authority Benton County Rural Fire Department Bureau of Labor Statistics Bechtel National Inc. Burlington Northern & Santa Fe Railway Before present Bonneville Power Administration Clean Air Act Columbia Basin College Comprehensive Conservation Plan/ Environmental Impact Statement Council on Environmental Quality Comprehensive Environmental Response, Compensation, and Liability Act Code of Federal Regulations U.S. Army Corps of Engineers Clean Water Act Decibels A-weighted sound level Derived concentration guides U.S. Department of Commerce U.S. Department of Energy U.S. Department of Energy Office of River Protection U.S. Department of Energy, Richland Operations Office Washington State Department of Health U.S. Department of the Interior U.S. Department of Labor Drinking water standards Atmospheric dispersion estimates Environmental assessment Environmental concern Washington State Department of Ecology Environmental designation for noise abatement Environmental Impact Statement Environmental justice Emergency medical technician Environmental Objections Executive Order U.S. Environmental Protection Agency Emergency Planning and Community Right-To-Know Act Evolutionary significant units
vii
Acronyms, Abbreviations, and Symbols (cont'd.)
EU FEMA FFTF FR FY GENII HABS HAER HAMMER HCP-EIS HCRL HEHF Historic District HMS Hz I kwh
Le, LIGO LLWPA LO LOS LWC LWD MCL ME1 MMI MOU MW NAAQS National Register NEPA NESHAP NHPA NMFS NPDES NPL NPPC NRC NWPA om OSHA OSPI OTED PCB PFF PL
Environmentally unsatisfactory Federal Emergency Management Agency Fast Flux Test Facility Federal Register Fiscal Year Generation I1 Model For Environmental Dose Calculations Historic American Buildings Survey Historic American Engineering Record Hazardous Materials Management and Emergency Response Hanford Comprehensive Land-Use Plan Environmental Impact Statement Hanford Cultural Resources Laboratory Hanford Environmental Health Foundation Hanford Site Manhattan Project and Cold War Era Historic District Hanford Meteorology Station Hertz Interstate Kilowatt-hour Equivalent sound level Laser Interferometer Gravitational Wave Observatory Low-Level Radioactive Waste Policy Act Lack of objections Level of service Lost workday cases Lost workdays Maxim~~m contaminant levels Maximally exposed individual Modified Mercalli intensity Memorandum of understanding Megawatt National Ambient Air Quality Standards National Register of Historic Places National Environmental Policy Act National Emission Standards for Hazardous Air Pollutants National Historic Preservation Act National Marine Fisheries Service National Pollutant Discharge Elimination System National Priorities List Northwest Power Planning Council U.S. Nuclear Regulatory Commission Nuclear Waste Policy Act Office of Financial Management (Washington State) Occupational Safety and Health Administration Office of Superintendent of Public Instruction Washington State Office of Trade and Economic Development Polychlorinated biphenyls Plutonium Finishing Plant Public law
Acronyms, Abbreviations, and Symbols (cont'd.)
PM2.5 PMl0 PNNL PSD PUREX RCRA RCW REIS RM ROD SARA SDWA SEPA SESP SHPO SIP SR TCP TEDE TEDF TRIDEC TRC Tri-Cities Tri-Party Agreement TSCA TSD uo3 USC USFWS USGS WAC WDFW WNP WSU-TC XlQ'
Particulate matter (2.5 pm or less) Particulate matter ( 1 0 pm or less) Pacific Northwest National Laboratory Prevention of significant deterioration Plutonium-uranium extraction Resource Conservation and Recovery Act Revised Code of Washington Regional Economic Information System River mile Record of Decision Superfund Amendments and Reauthorization Act Safe Drinking Water Act State Environmental Policy Act (Washington) Surface Environmental Surveillance Project State Historic Preservation Officer State Implementation Plan State route Traditional Cultural Place Total effective dose equivalent Treated Effluent Disposal Facility Tri-Cities Industrial Development Council Total recordable cases Kennewick, Pasco, and Richland, Washington Hanford Federal Facility Agreement and Consent Order Toxic Substances Control Act Treatment, storage, andlor disposal Uranium trioxide United States Code U.S. Fish and Wildlife Service U.S. Geological Survey Washington Administrative Code Washington State Department of Fish and Wildlife Washington nuclear plant Washington State University, Tri-Cities Atmospheric dispersion coefficient
Acronyms, Abbreviations, and Symbols (cont'd.)
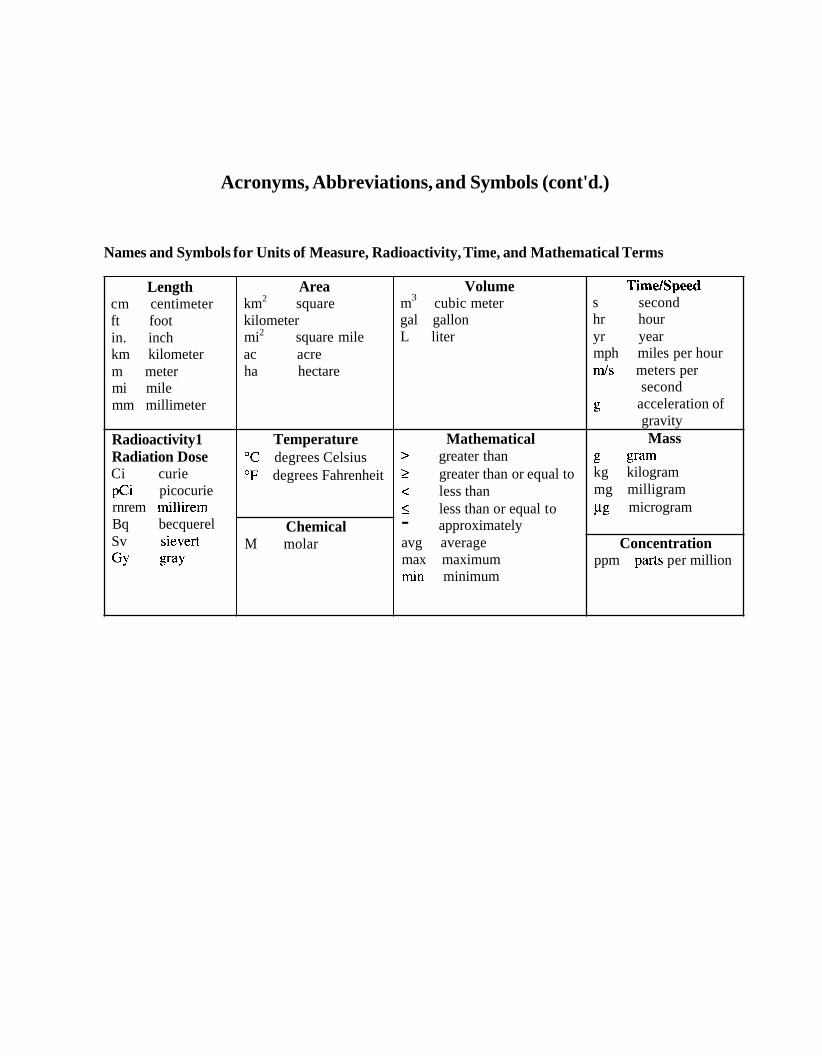
Names and Symbols for Units of Measure, Radioactivity, Time, and Mathematical Terms
Timetspeed s second hr hour yr year mph miles per hour m/s meters per
second g acceleration of
gravity Mass
g gram kg kilogram mg milligram pg microgram
Concentration ppm pai-ts per million
Volume m3 cubic meter gal gallon L liter
Mathematical > greater than 2 greater than or equal to < less than < less than or equal to - approximately avg average max maximum min minimum
Length cm centimeter ft foot in. inch km kilometer m meter mi mile mm millimeter
Radioactivity1 Radiation Dose Ci curie pCi picocurie rnrem millirem Bq becquerel Sv sievert GY gray
Area km2 square kilometer mi2 square mile ac acre ha hectare
Temperature OC degrees Celsius OF degrees Fahrenheit
Chemical M molar
Contents ... ....................................................................................................................................................... Preface 111
....................................................................................................................................... Acknowledgments v
. . ................................................................................................... Acronyms. Abbreviations. and Symbols VII
4.0 Affected Environment ...................................................................................................................... 4.1 Introduction ...................................................................................................................................... 4.1
.............................................................................................. 4.1 Climate and MeteorologyIAir Quality 4.5 4.1.1 Wind .................................................................................................................................. 4.7
.............................................................................................. 4.1.2 Temperature and Humidity 4.10 4.1.3 Precipitation ..................................................................................................................... 4.13
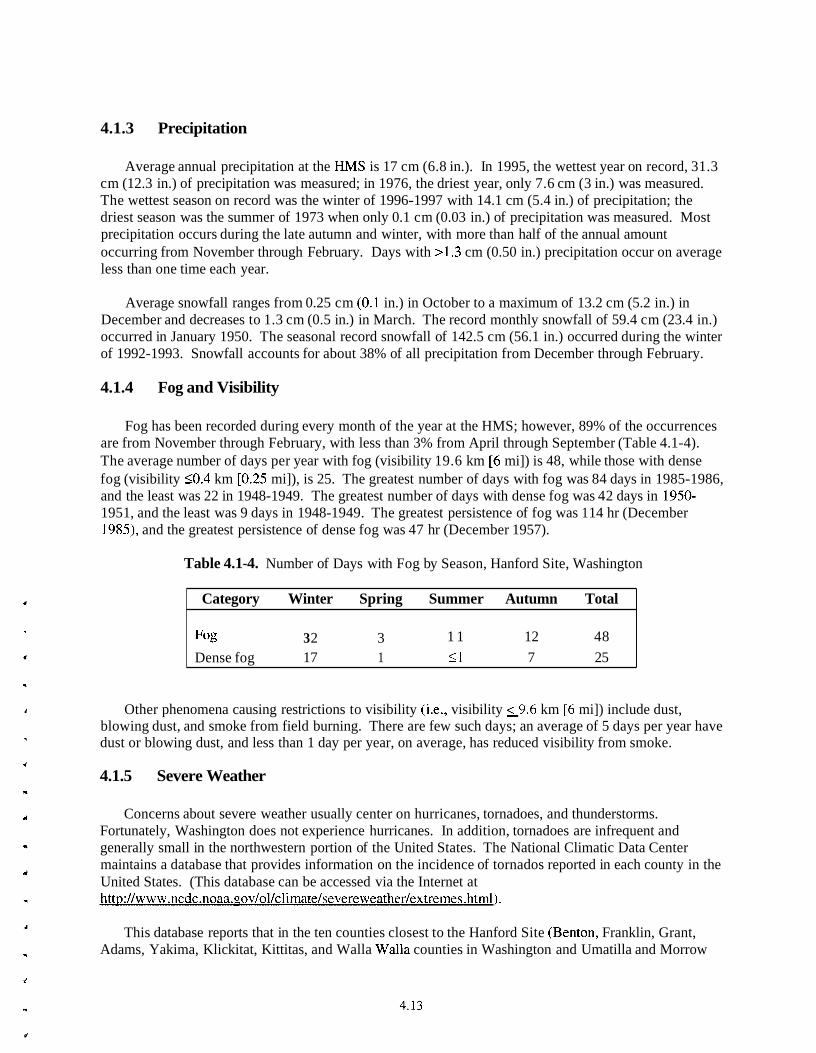
............................................................................................................ 4.1.4 Fog and Visibility 4.13 ................................................................................................................ 4.1.5 Severe Weather 4.13
.................................................................................................. 4.1.6 Atmospheric Dispersion 4.15 ............................................................................................ 4.1.7 Nonradiological Air Quality 4.16
.................................................................... 4.1.7.1 Prevention of Significant Deterioration 4.34 4.1.7.2 Emissions of Nonradiological Pollutants .................................................................. 4.34 4.1.7.3 Offsite Monitoring .................................................................................................... 4.34
........................................................................................... 4.1.7.4 Background Monitoring 4.34 ..................................................................................................... 4.1.7.5 Onsite Monitoring 4.35
................................................................................................. 4.1.8 Radiological Air Quality 4.36 ............................................................................................ 4.1.8.1 Radiological Emissions 4.37
..................................................................................................... 4.1.8.2 Dose Assessments 4.37 ....................................................................................... 4.1.8.3 Environmental Monitoring 4.37
Geology .......................................................................................................................................... 4.38 4.2.1 Physical and Structural Characteristics ........................................................................... 4.41 4.2.2 Strata and Structure of Sediment and Rock ..................................................................... 4.43
.................................................................................. 4.2.2.1 Columbia River Basalt Group 4.43 ............................................................................................... 4.2.2.2 Ellensburg Formation 4.44
4.2.2.3 Hanford Formation, Cold Creek Unit, and Ringold Formation ................................ 4.45 4.2.2.4 Clastic Dikes ............................................................................................................. 4.46
................................................................................. 4.2.2.5 100 Areas Strata and Structure 4.47
................................................................................. 4.2.2.6 200 Areas Strata and Structure 4.47 4.2.2.7 300 Area Strata and Structure ................................................................................... 4.47
4.2.3 Surface Soils .................................................................................................................... 4.47 4.2.4 Seismicity ........................................................................................................................ 4.50
....................................................................................................................................... 4.3 Hydrology 4.55 4.3.1 Surface Water .................................................................................................................. 4.55
......................................................................................................... 4.3.1.1 Columbia River 4.55 4.3.1.2 Water Quality of the Columbia River ....................................................................... 4.58 4.3.1.3 YakimaRiver ............................................................................................................ 4.60
................................................................................................. 4.3.1.4 Springs and Streams 4.61 .................................................................................. 4.3.1.5 Columbia Riverbank Seepage 4.61
....................................................................................... 4.3.1.6 Runoff and Net Infiltration 4.61 .................................................................................................................... 4.3.1.7 Flooding 4.62
................................................................................... 4.3.1.8 Non-Riverine Surface Water .4.66 .............................................................................................. 4.3.2 Hanford Site Vadose Zone 4.69
.................................................................................... 4.3.2.1 Vadose Zone Contamination 4.70 ............................................................................................................. 4.3.3 Groundwater . . . . . . . . 1
................................................................................... 4.3.3.1 Hanford Site Aquifer System 4.71 ....................................................................................................... 4.3.4 Groundwater Quality 4.76
................................................................................... 4.3.4.1 Natural Groundwater Quality 4.76 ......................................................... 4.3.4.2 Groundwater Contamination and Monitoring .4.76
....................................................................................................... 4.3.5 100 Areas Hydrology 4.77 4.3.6 200 Areas Hydrology ....................................................................................................... 4.77 4.3.7 300 Area Hydrology ........................................................................................................ 4.83 4.3.8 Richland North Areas Hydrology .................................................................................... 4.83
4.4 Ecology ........................................................................................................................................... 4.84 .......................................................................................................... 4.4.1 Terrestrial Ecology 4.84
................................................................................................................. 4.4.1.1 Vegetation 4.85 4.4.1.2 Wildlife ..................................................................................................................... 4.93
.............................................................................................................. 4.4.2 Aquatic Ecology 4.97 4.4.2.1 Columbia River ......................................................................................................... 4.97
........................................................................................................ 4.4.2.2 Spring Streams 4.100 .................................................................................................... 4.4.2.3 Wetland Habitats 4.101
........................................................................................ 4.4.2.4 Temporary Water Bodies 4.102 ............................................................................. 4.4.3 Threatened and Endangered Species 4.102
...................................................................................................................... 4.4.3.1 Plants 4.103 4.4.3.2 Animals ................................................................................................................... 4.104
..................................................................... 4.5 Cultural. Archaeological. and Historical Resources 4.108 ............................................................................ 4.5.1 Native American Cultural Landscape 4.1 I 1
...................................................................................... 4.5.1.1 Archaeological Resources 4 . 112 ..................................................................................... 4.5.1.2 Traditional Cultural Places 4.112
................................................................................. 4.5.2 Early SettlersrFarming Landscape 4.1 13 ...................................................................................... 4.5.2.1 Archaeological Resources 4 . 1 3 ..................................................................................... 4.5.2.2 Traditional Cultural Places 4.1 14
......................................................................................... 4.5.2.3 Buildings and Structures 4.1 14 .................................................. 4.5.3 Manhattan Project and Cold War Cultural Landscape 4.1 14
...................................................................................... 4.5.3.1 Archaeological Resources 4.1 15 ......................................................................................... 4.5.3.2 Buildings and Structures 4.115
4.5.4 Site Areas ...................................................................................................................... 4.1 16 4.5.4.1 100Areas ............................................................................................................... 4.116 4.5.4.2 200Areas ............................................................................................................... 4.121 4.5.4.3 300Area ................................................................................................................. 4.122 4.5.4.4 400Area ............................................................................................................... 4.123 4.5.4.5 600Area ................................................................................................................. 4.123 4.5.4.6 700Area ................................................................................................................. 4.125
............................................................................................................................ 4.6 Socioeconomics 4.125 ......................................................................................................... 4.6.1 Local Economy 4 125
................................................................................... 4.6.1.1 DOE Contractors (Hanford) 4.126 ................................................................................................... 4.6.1.2 Energy Northwest 4.126
.............................................................................................................. 4.6.1.3 Agriculture 4.126 .......................................................................................... 4.6.1.4 Other Major Employers 4.127
xii
................................................................................................................. 4.6.1.5 Tourism 4 127
................................................................................................................... 4.6.1.6 Retirees 4.127 ............................................................................................... 4.6.2 Employment and Income 4.128
.................................................................................................................. 4.6.3 Demography 4.129 .................................................................................................... 4.6.4 Environmental Justice 4.130
4.6.5 Housing .......................................................................................................................... 4.133 4.6.6 Transportation ................................................................................................................ 4.1 36
...................................................................................................... 4.6.7 Educational Services 4.138 ................................................................................. 4.6.8 Health Care and Human Services 4 1 3 8
.............................................................................................. 4.6.9 Police and Fire Protection 4.139 ................................................................................................... 4.6.10 Parks and Recreation 4 1 4 0
.......................................................................................................................... 4.6.1 1 Utilities 4.141 4.6.12 Land Use ........................................................................................................................ 4.143
........................................................................................................ 4.6.1 3 Visual Resources 4 1 4 8
4.7 Noise ............................................................................................................................................ 4.150 ................................................................................................ 4.7.1 Background Information 4.150
................................................................................. 4.7.2 Environmental Noise Regulations 4.150 4.7.3 Hanford Site Sound Levels ........................................................................................ 4.15 1
............................................................................................... 4.7.3.1 SkagitRIanford Data 4.15 1 4.7.3.2 Basalt Waste Isolation Project (BWIP) Data .......................................................... 4.151 4.7.3.3 New Production Reactor (NPR) EIS ...................................................................... 4.153 4.7.3.4 Noise Levels of Hanford Field Activities ............................................................... 4.154
...................................................................................................................... 4.8 Occupational Safety 4.155 4.8.1 Occupational Radiation Exposure at the Hanford Site .................................................. 4.157
............................................................................................................................................ References 4.16 1
APPENDIX A . Hanford Site Species Lists ........................................................................................... A . 1
6.0 Statutory and Regulatory Requirements ........................................................................................... 6.1 Introduction ...................................................................................................................................... 6.2 Federal and State Environmental Laws ............................................................................................ 6.3 Citation of Laws and Regulations .................................................................................................... 6.3 Specific Federal Laws Cited in the CEQ Regulations ...................................................................... 6.3
6.1 Federal Environmental Laws ........................................................................................................... 6.4
6.2 Federal and State Environmental Regulations ................................................................................. 6.5 .......................................................................................................................... 6.2.1 Air Quality 6.6
..................................................................................................................... 6.2.2 Water Quality 6.7 .......................................................................................... 6.2.3 Hazardous Waste Management 6.8
............................................................................................................... 6.2.4 Species Protection 6.9 6.2.5 Historic and Cultural Resource Preservation .................................................................... 6.10 6.2.6 Land Use ........................................................................................................................... 6.11
................................................................................................................................. 6.2.7 Other 6.11
........................................................................................................................... 6.3 Executive Orders 6.12
6.4 DOE Directives ............................................................................................................................. 6.13

6.5 Treaties, Statutes, and Policies Relating to Indian Tribes of the Hanford Region ........................ 6.14
6.6 Permits ................................. ........................................................................................................ 6.15
Figures
Figure 4.0- 1 .
Figure 4.0-2.
Figure 4.1-1.
Figure 4.1-2.
Figure 4.1-3.
Figure 4.1-4.
Figure 4.2-1.
Figure 4.2-2.
Figure 4-2.3.
Figure 4.2-4.
Figure 4.2-5.
Figure 4.2-6.
Figure 4.2-7.
Figure 4.2-8.
Figure 4.3-1.
Figure 4.3-2.
Figure 4.3-3.
Figure 4.3-4.
U.S. Department of Energy's Hanford Site. Washington .................................................. 4.2
Hanford Reach National Monument. Washington .......................................................... 4.4
Hanford Meteorological Monitoring Network. Hanford Site. Washington ...................... 4.6
Wind Roses at the 9.1 m (30 ft) Level of the Hanford Meteorological Monitoring Network. Washington. 1982 to 2002 ................................................................................ 4.9
Wind Roses at the 60 m (197 ft) Level of the Hanford Meteorological Monitoring Network. Washington. 1986 to 2002 .............................................................................. 4.12
24-hr Average PMlo Concentrations at the Hanford Meteorological Station. Washington. 2002 ........................................................................................................... 4.36
Geologic Elements of the Hanford Site. Washington in the Pasco Basin Portion of the Columbia Basin ........................................................................................................ 4.39
Flood in the vicinity of the Hanford Site. Washington. between 18.00 0.1 3. 000 years ago ......................................................................................................................... 4.41
................................ Physical and Structural Geology of the Hanford Site. Washington 4.42
Strata of Rocks and Sediment at the Hanford Site. Washington ..................................... 4.44
White Bluffs at the Hanford Site. Washington. Display River and Lake Deposits Left from the Ancestral Colun~bia River .................................................................... 4.46
...................................................... Map of Soil Types at the Hanford Site. Washington 4.48
Historical Earthquake Activity of the Columbia Basin. Washington. and Surrounding Areas Showing All Earthquakes between 1850 and March 20. 1969. with a Modified Mercalli Intensity of V or Larger and/or a Richter Magnitude of 4 or Larger ..................................................................................................................... -4 -5 2
Earthquake Activity of the Columbia Basin. Washington. and Surrounding Areas as Measured by Seismographs from March 20. 1969. to December 3 1.2000. with Richter Magnitude 3 or Larger ...................................................................................... 4.53
Surface Water Features including Rivers. Ponds. Major Springs. and Ephemeral Streams on the Hanford Site. Washington ...................................................................... 4.56
Average Daily Flow for the Columbia River below Priest Rapids Dam. Washington. from January 1992 through April 2003 ..................................................... 4.57
Average Daily Flow for the Columbia River during Calendar Year 2002 ..................... 4.58
............................... Columbia River Monitoring Locations. Hanford Site. Washington 4.59
Figure 4.3.6. Flood Area on the Hanford Site. Washington. during the 1894 Flood ........................... 4.63
Figure 4.3-7.
Figure 4.3-8.
Figure 4.3-9.
Figure 4.3-10.
Figure 4.3-1 1 .
Figure 4.3-12.
Figure 4.3-13.
Figure 4.3-14.
Figure 4.4- 1 .
Figure 4.4-2.
Figure 4.4-3.
Figure 4.5-1.
Figure 4.6- 1 .
Figure 4.6-2.
Figure 4.6-3.
Figure 4.6-4.
Figure 4.7- 1 .
Locations of Principal Dams within the Columbia Plateau. Washington and Oregon ........................................................................................................................... 4.64
......... Flood Area on the Hanford Site. Washington. for the Probable Maximum Flood 4.65
Flood Area from a 100-Year Flood of the Yakima River near the Hanford Site. Washington ..................................................................................................................... 4.67
Extent of Probable Maximum Flood in Cold Creek Area. Hanford Site. Washington ..................................................................................................................... 4.68
Water Table Elevations for the Unconfined Aquifer at Hanford. Washington. MarchIApril 2000 ........................................................................................................... 4.73
Distribution of Major Radionuclides in Groundwater on the Hanford Site. Washington. at Concentrations above the Maximum Contaminant Level or Interim Drinking Water Standard during Fiscal Year 2000 ........................................... 4.80
Distribution of Major Hazardous Chemicals in Groundwater on the Hanford Site. Washington. at Concentrations above the Maximum Contaminant Level or Interim Drinking Water Standard during Fiscal Year 2000 ........................................... 4.81
Geologic Units Intersected by the Water Table in the 100 Areas. Hanford Site. Washington ..................................................................................................................... 4.82
Distribution of Vegetation Types and Land Use Areas on the Hanford Site. Washington. before the 24 Command Fire .................................................................... 4.86
Area of Hanford Site. Washington. Burned as a Result of the June 27 . July 2. ................................................................................................................. 2000. Wildfire 4.88
Columbia River Islands in the vicinity of the Hanford Site. Washington ....................... 4.92
.................. Areas Surveyed for Cultural Resources on the Hanford Site. Washington 4.109
Location of Minority Populations Near the Hanford Site. Washington. based on 2000 Census .................................................................................................................. 4.134
Location of Low-Income Populations Near the Hanford Site. Washington. based ............................................................................................................. on 2000 Census 4.135
................................... DOE'S Preferred Alternative for Land Use on the Hanford Site 4.144
............................. Viewshed from Gable Mountain on the Hanford Site. Washington 4.149
................. Location of Background Noise Measurements. Hanford Site. Washington 4.152
Figure 4.8-1. Occupational Injury and Illness Total Recordable Case Rates at the Hanford Site, ............................ Washington. Compared to the DOE Complex and Private Industry 4.156
Figure 4.8-2. Average Occupational Dose (mremlyr) to Hanford Site. Washington. Individuals with Measurable Dose. 1997-2001 ............................................................................... 4.159
Figure 4.8-3. Collective Operational Dose (person-rernlyr) at the Hanford Site. Washington. 1997-2001 ..................................................................................................................... 4.159
xvii

This page intentionally left blank
Table 4.1-1. Station Numbers, Names, and Meteorological Parameters Measured at each Station in the Hanford Meteorological Monitoring Network, Washington .................................. 4.8
Table 4.1-2. Number of Days with Peak Gusts above Specific Thresholds at 15-m (50-ft) Level, 1945 through 2002, Hanford Meteorology Station, Washington ................................... 4.11
Table 4.1-3. Monthly and Annual Prevailing Wind Directions, Average Speeds, and Peak Gusts at 15-m (50-ft) Level, 1945 through 2002, Hanford Meteorology Station, Washington .................................................................................................................... 4.1 1
Table 4.1-4. Number of Days with Fog by Season, Hanford Site, Washington ..................................... 4.13
Table 4.1-5. Estimate of the Probability of Extreme Winds Associated with Tornadoes Striking a ....................................................................................... Point at Hanford, Washington 4.14
Table 4.1-6. Estimates of Extreme Winds at the Hanford Site, Washington .......................................... 4.14
Table 4.1-7. Percent Probabilities for Extended Periods of Surface-Based Inversions, Hanford Site, Washington ............................................................................................................. 4.15
Table 4.1-8. Joint Frequency Distributions of Atmospheric Stability, Wind Speed, and Transport Direction for the 100 Area at 9.1 m (30 ft) above Ground Level, Hanford Site, Washington ................................................................................................................ 4 17
Table 4.1-9. Joint Frequency Distributions of Atmospheric Stability, Wind Speed, and Transport Direction for the 100 Area at 60 m (1 97 ft) above Ground Level, Hanford Site,
.................................................................................................................. Washington. ..4.18
Table 4.1-10. Joint Frequency Distributions of Atmospheric Stability, Wind Speed, and Transport Direction for the 200 Areas at 9.1 m (30 ft) above Ground Level, Hanford Site, Washington .............................................................................................. 4.19
Table 4.1-1 1. Joint Frequency Distributions of Atmospheric Stability, Wind Speed, and Transport Direction for the 200 Areas at 60 m (1 97 ft) above Ground Level, Hanford Site, Washington .............................................................................................. 4.20
Table 4.1 - 12. Joint Frequency Distributions of Atmospheric Stability, Wind Speed, and Transport Direction for the 300 Area at 9.1 m (30 ft) above Ground Level, Hanford Site, Washington ............................................................................................ 4.21
Table 4.1-13. Joint Frequency Distributions of Atmospheric Stability, Wind Speed, and Transport Direction for the 300 Area at 60 m (197 ft) above Ground Level, Hanford Site, Washington .............................................................................................. 4.22
Table 4.1-14. Joint Frequency Distributions of Atmospheric Stability, Wind Speed, and Transport Direction for the 400 Area at 9.1 m (30 ft) above Ground Level, Hanford Site, Washington .......................................................................................... 4.23
xix
Table 4.1- 15. Joint Frequency Distributions of Atmospheric Stability, Wind Speed, and Transport Direction for the 400 Area at 60 m (197 ft) above Ground Level, Hanford Site, Washington .............................................................................................. 4.24
Table 4.1 - 16. XIQ' Values (sec m-3) for Chronic Ground-Level Releases from 100-N Area Based on 1983 through 2002 Meteorological Information, Hanford Site, Washington .......... . .4.25
Table 4.1 - 17. XIQ' Values (sec m-') for Chronic 60-m Stack Releases from 100-N Area Based on 1986 through 2002 Meteorological Information, Hanford Site, Washington ................. 4.25
Table 4.1 - 1 8. XIQ' Values (sec mS3) for Chronic Ground-Level Releases from 200 Areas Based on 1983 through 2002 Meteorological Information, Hanford Site, Washington ............ 4.26
Table 4.1 -1 9. XIQ' Values (sec m") for Chronic 60-m Stack Releases from 200 Areas Based on 1983 through 2002 Meteorological Information, Hanford Site, Washington ................. 4.26
Table 4.1-20. XIQ' Values (sec m-3) for Chronic Ground-Level Releases from 300 Area Based on 1983 through 2002 Meteorological Information, Hanford Site, Washington ................. 4.27
Table 4.1-2 1. XIQ' Values (sec m-') for Chronic 60-m Stack Releases from 300 Area Based on 1986 through 2002 Meteorological Information, Hanford Site, Washington. ........ . ....... 4.27
Table 4.1-22. XIQ' Values (sec m-3) for Chronic Ground-Level Releases from 400 Area Based on 1983 through 2002 Meteorological Information, Hanford Site, Washington ................. 4.28
Table 4.1-23. XIQ' Values (sec m") for Chronic 60-m Stack Releases from 400 Area Based on 1986 through 2002 Meteorological Information, Hanford Site, Washington ................. 4.28
Table 4.1-24. 95th Percentile EIQ Values (sec m-3) for Acute Ground Level Releases from 100-N Area Based on 1983 through 2002 Meteorological Information, Hanford Site, Washington ..... ............. ... ...................... ........... ..... ...... .. .......... . ......... .............. .. ...... . ....... 4.29
Table 4.1-25. 95 th Percentile E/Q Values (sec m-3) for Acute 60-m Stack Releases from 100-N Area Based on 1986 through 2002 Meteorological Information, Hanford Site, Washington .. ...... .. .... ..... .......... ... ...... ..................... ........................ . ....... ..... ..................... 4.29
Table 4.1 -26. 95th Percentile EIQ Values (sec m-') for Acute Ground-Level Releases from 200 Areas Based on 1983 through 2002 Meteorological Information, Hanford Site, Washington ......... ............ .. .... ...... .. ............. ................. ............. ...... ....... . ....... ... . ...... ........ 4-30
Table 4.1-27. 95th Percentile WQ Values (sec m-') for Acute 60-m Stack Releases from 200 Areas Based on 1983 through 2002 Meteorological Information, Hanford Site, Washington ..................................................................................................................... 4.30
Table 4.1-28. 95th Percentile E/Q Values (sec m-3) for Acute Ground-Level Releases from 300 Area Based on 1983 through 2002 Meteorological Information, Hanford Site, Washington .................... . .. .... . . . .......... . ......... . . ........... . . ....... . . ............... 4.3 1
Table 4.1-29. 95th Percentile EIQ Values (sec m-') for Acute 60-m Stack Releases from 300 Area Based on 1986 through 2002 Meteorological Information, Hanford Site, Washington. ......... ........ .. . .. .... ........ ... . . ........... . . . . . ............. . . ......... . ................... 4.3 1
Table 4.1-30. 95th Percentile EIQ Values (sec m-3) for Acute Ground-Level Releases from 400 Area Based on 1983 through 2002 Meteorological Information, Hanford Site, Washington ..................................................................................................................... 4.32
Table 4.1-3 1. 95th Percentile EIQ Values (sec m") for Acute 60-m Stack Releases from 400 Area Based on 1986 through 2002 Meteorological Information, Hanford Site, Washington ..................................................................................................................... 4.32
Table 4.1-32. National and Washington State Ambient Air Quality Standards ...................................... 4.33
Table 4.1 -33. Nonradioactive Constituents Discharged to the Atmosphere, 2002, Hanford Site, Washington ..................................................................................................................... 4.35
Table 4.1-34. Radionuclides Discharged to the Atmosphere at the Hanford Site, Washington, 2002 ............................................................................................................................... -4 -3 8
Table 4.2-1. Soil Types at the Hanford Site, Washington ...................................................................... 4.49
Table 4.3-1. Maximum Concentrations of Groundwater Contaminants on the Hanford Site, Washington, during Fiscal Year 2000 ............................................................................ 4.78
Table 4.4-1. Federal- or Washington State-Listed Threatened (T), Endangered (E), and Candidate (C) Species Occurring on the Hanford Site ................................................. 4.103
Table 4.4-2. Birds of Conservation Concern Observed on the Hanford Site ....................................... 4.104
Table 4.4-3. Washington State Plant Species of Concern Occurring on the Hanford Site ................... 4.105
Table 4.4-4. Washington State Candidate Animal Species Occurring or Potentially Occurring on the Hanford Site ............................................................................................................ 4.107
Table 4.5-1. Hanford Site, Washington Historic Buildings, Archaeological Sites, and Districts Listed in the National Register of I-Iistoric Places ........................................................ 4.110
Table 4.5-2. Hanford Site, Washington Historic Buildings, Archaeological Sites, and Districts Determined Eligible for Listing in the National Register of Historic Places ............... 4.1 10
Table 4.5-3. Hanford Site, Washington Archaeological Sites and Districts Listed in the Washington Heritage Register .................................................................................. 4.1 I 1
Table 4.6-1. Federal Government Transfer Payments in Benton County and Franklin County, Washington, 2001 ......................................................................................................... 4.128
Table 4.6-2. Nonagricultural Wage and Salary Workers in Benton County and Franklin County, Washington, 2001 and 2002 ......................................................................................... 4.129
Table 4.6-3. Population Estimates and Percentages by Race and Hispanic Origin within each County in Washington State and the 80-km (50 mi) Radius of Hanford as Determined by the 2000 Census ................................................................................... 4.13 1
xxi
Table 4.6.4. Police Personnel in the Tri.Cities, Washington. 2003 ..................................................... 4.139
Table 4.6.5. Fire Protection Personnel in the Tri.Cities, Washington, 2003 .................................... 4.140
Table 4.6-6. Examples of Physical Recreational Facilities Available in the TriCities, Washington .................................................................................................................. 4.141
Table 4.6.7. Areas of the Hanford Site. Washington. Outgranted/Released to Date ........................... 4.147
Table 4.7-1. Applicable State Noise Limitations for the Hanford Site, Washington. Based on Source and Receptor EDNA Designation .................................................................... 4.15 1
Table 4.7-2. Background Noise Levels Measured at Isolated Areas on the Hanford Site. Washington ................................................................................................................... 4.153
Table 4.7-3. Modeled Noise Resulting from Automobile Traffic at Hanford. Washington. with the New Production Reactor Environmental Impact Statement ................................... 4.154
Table 4.7-4. Monitored Levels of Noise Propagated from Outdoor Activities at the Hanford Site, Washington ................................................................................................................... 4.155
Table 4.8-1. Occupational Injury and Illness Incidence Rates, and Fatality Counts for Department of Energy Facilities and Private Industry .......................................... 4.157
Table 4.8.2. Radiation Exposure Data for the Hanford Site. Washington. 1997-2001 ........................ 4.160
Table A.1 . Common Vascular Plants on the Hanford Site. Washington ............................................... A.3
.............................. Table A.2 . Mammals that Have Been Observed on the Hanford Site. Washington A.6
Table A.3 . Common Bird Species Known to Occur on the Hanford Site. Washington ........................ A.7
.................................. Table A.4 . Reptiles and Amphibians Found on the Hanford Site. Washington 1 2
............ . Table A.5 . Fish Species in the Hanford Reach. Washington. Region of the Columbia River A 13
xxii
4.0 Affected Environment
Introduction A. L. Bunn
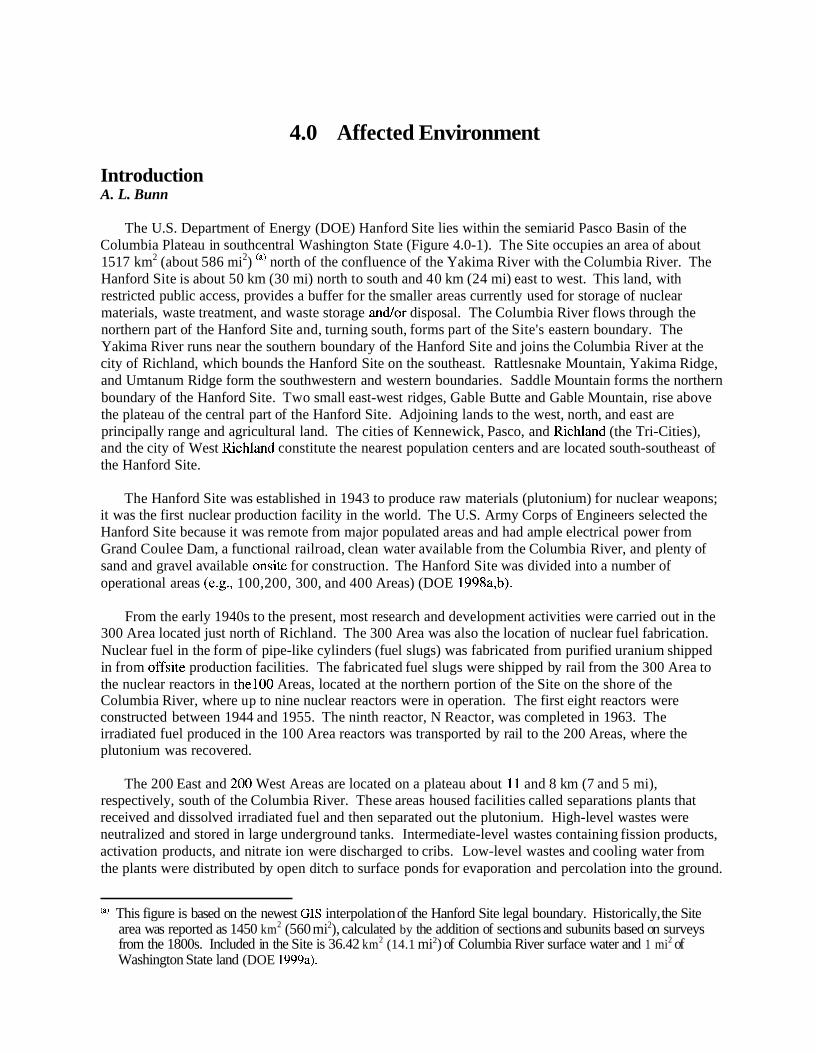
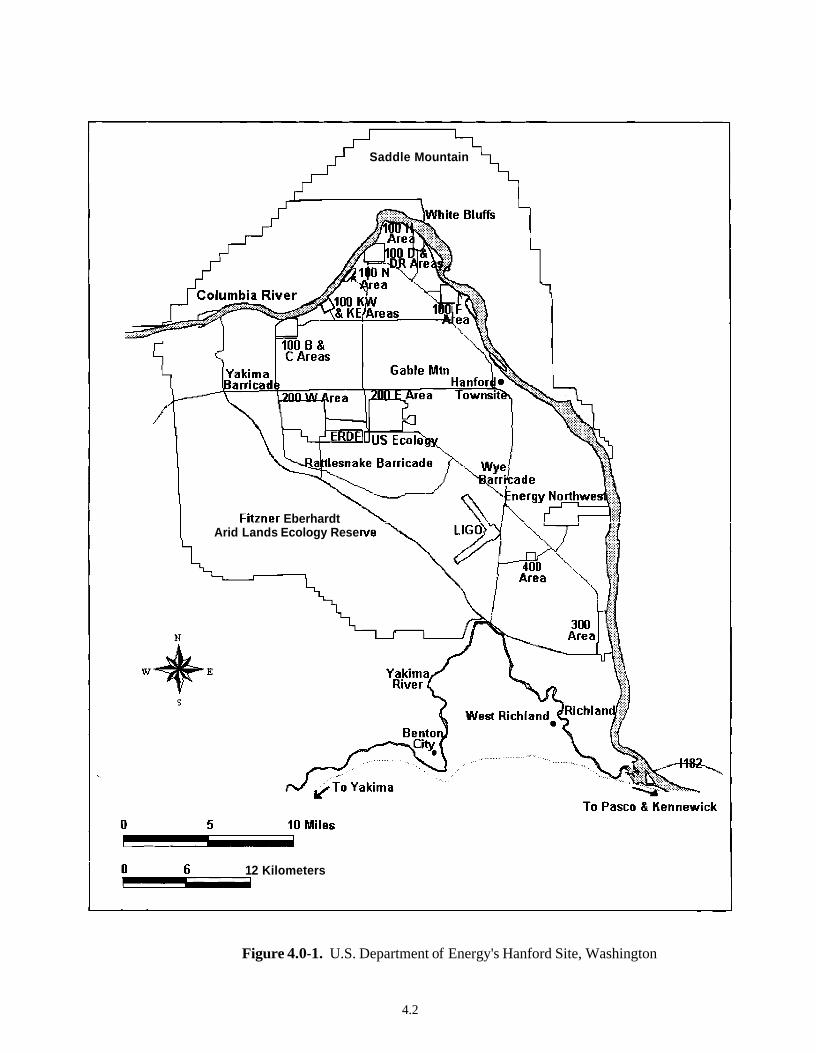
The U.S. Department of Energy (DOE) Hanford Site lies within the semiarid Pasco Basin of the Columbia Plateau in southcentral Washington State (Figure 4.0-1). The Site occupies an area of about 15 17 km2 (about 586 mi2) (a' north of the confluence of the Yakima River with the Columbia River. The Hanford Site is about 50 km (30 mi) north to south and 40 km (24 mi) east to west. This land, with restricted public access, provides a buffer for the smaller areas currently used for storage of nuclear materials, waste treatment, and waste storage andor disposal. The Columbia River flows through the northern part of the Hanford Site and, turning south, forms part of the Site's eastern boundary. The Yakima River runs near the southern boundary of the Hanford Site and joins the Columbia River at the city of Richland, which bounds the Hanford Site on the southeast. Rattlesnake Mountain, Yakima Ridge, and Umtanum Ridge form the southwestern and western boundaries. Saddle Mountain forms the northern boundary of the Hanford Site. Two small east-west ridges, Gable Butte and Gable Mountain, rise above the plateau of the central part of the Hanford Site. Adjoining lands to the west, north, and east are principally range and agricultural land. The cities of Kennewick, Pasco, and Richland (the Tri-Cities), and the city of West Richland constitute the nearest population centers and are located south-southeast of the Hanford Site.
The Hanford Site was established in 1943 to produce raw materials (plutonium) for nuclear weapons; it was the first nuclear production facility in the world. The U.S. Army Corps of Engineers selected the Hanford Site because it was remote from major populated areas and had ample electrical power from Grand Coulee Dam, a functional railroad, clean water available from the Columbia River, and plenty of sand and gravel available onsite for construction. The Hanford Site was divided into a number of operational areas (e.g., 100,200, 300, and 400 Areas) (DOE 1998a,b).
From the early 1940s to the present, most research and development activities were carried out in the 300 Area located just north of Richland. The 300 Area was also the location of nuclear fuel fabrication. Nuclear fuel in the form of pipe-like cylinders (fuel slugs) was fabricated from purified uranium shipped in from offsite production facilities. The fabricated fuel slugs were shipped by rail from the 300 Area to the nuclear reactors in the100 Areas, located at the northern portion of the Site on the shore of the Columbia River, where up to nine nuclear reactors were in operation. The first eight reactors were constructed between 1944 and 1955. The ninth reactor, N Reactor, was completed in 1963. The irradiated fuel produced in the 100 Area reactors was transported by rail to the 200 Areas, where the plutonium was recovered.
The 200 East and 200 West Areas are located on a plateau about 11 and 8 km (7 and 5 mi), respectively, south of the Columbia River. These areas housed facilities called separations plants that received and dissolved irradiated fuel and then separated out the plutonium. High-level wastes were neutralized and stored in large underground tanks. Intermediate-level wastes containing fission products, activation products, and nitrate ion were discharged to cribs. Low-level wastes and cooling water from the plants were distributed by open ditch to surface ponds for evaporation and percolation into the ground.
This figure is based on the newest CIS interpolation of the Hanford Site legal boundary. Historically, the Site area was reported as 1450 km2 (560 mi2), calculated by the addition of sections and subunits based on surveys from the 1800s. Included in the Site is 36.42 km2 (14.1 mi2) of Columbia River surface water and 1 mi2 of Washington State land (DOE 1999a).
Saddle Mountain
Fitzner Eberhardt Arid Lands Ecology Rese
P
12 Kilometers s
Figure 4.0-1. U.S. Department of Energy's Hanford Site, Washington
4.2
Other areas on the Hanford Site include the 400 and 600 Areas. The Fast Flux Test Facility located in the 400 Area is a special nuclear reactor designed to test various types of nuclear fuel, produce medical and industrial isotopes, and conduct cooperative international research. The facility operated for about ten years and has been shut down since 1993. The 600 Area includes all the land between the designated areas of the Site.
Areas near north Richland provided Hanford Site support services. The former 1100 Area, about 1.8 km (1.1 mi) west of the Columbia River was the location of general stores and the transportation maintenance facility for the Hanford Site. Operations at the transportation maintenance facility resulted in ground contamination from several chemicals, oils, and greases. No radioactive waste was discharged to the ground in the 1100 Area. The 1100 Area was declared clean and the Environmental Protection Agency issued a delisting from the National Priorities List September 1996 (DOE 1998a). The 700 Area was the original location for administrative activities at Hanford. Most of this area has been incorporated into the city of Richland (DOEJRL 2002).
At the Hanford Site several areas, totaling 665 km (257 mi), have been set aside for special uses. The Fitznermberhardt Arid Lands Ecology Reserve (ALE), used for ecological research, was established in 1967 on land between the southern boundary of the Hanford Site and State Route 240. On the north end of the site are the Saddle Mountain National Wildlife Refuge and the Wahluke Slope Wildlife Recreation Area. Nuclear operations and activities not under the auspices of DOE include commercial power production by Energy Northwest (near the 400 Area) and commercial low-level radioactive waste burial at a site leased and licensed by the State of Washington and operated by U.S. Ecology (near the 200 Areas). Near the southern boundary of the Hanford Site north of Richland, Framatome ANP, Richland Inc., operates a commercial nuclear fuel fabrication facility and Allied Technology Group Corporation operates a low-level radioactive waste decontamination, super-compaction, and packaging disposal facility.
The Hanford Site encompasses more than 2700 waste management units and groundwater contamination plumes. These waste sites have been grouped into 74 operable units. Each unit has complementary characteristics of such parameters as geography, waste content, type of facility, and relationship of contaminant plumes. This grouping into operable units allows for economies of scale to reduce the cost and number of characterization investigations and remedial actions that will be required for the Hanford Site to complete environmental cleanup efforts (WHC 1989). The 74 operable units are located in four areas: 17 in the 100 Area, 51 in the 200 Areas, 2 in the 300 Area, and 4 in the former 1100 Area (DOE 2002a). Those persons contemplating NEPA-related activities on the Hanford Site should be aware of the existence and location of the various operable units. Detailed information concerning the operable units and current maps showing the locations of the operable units can be obtained from the management contractor Fluor Hanford, Inc.
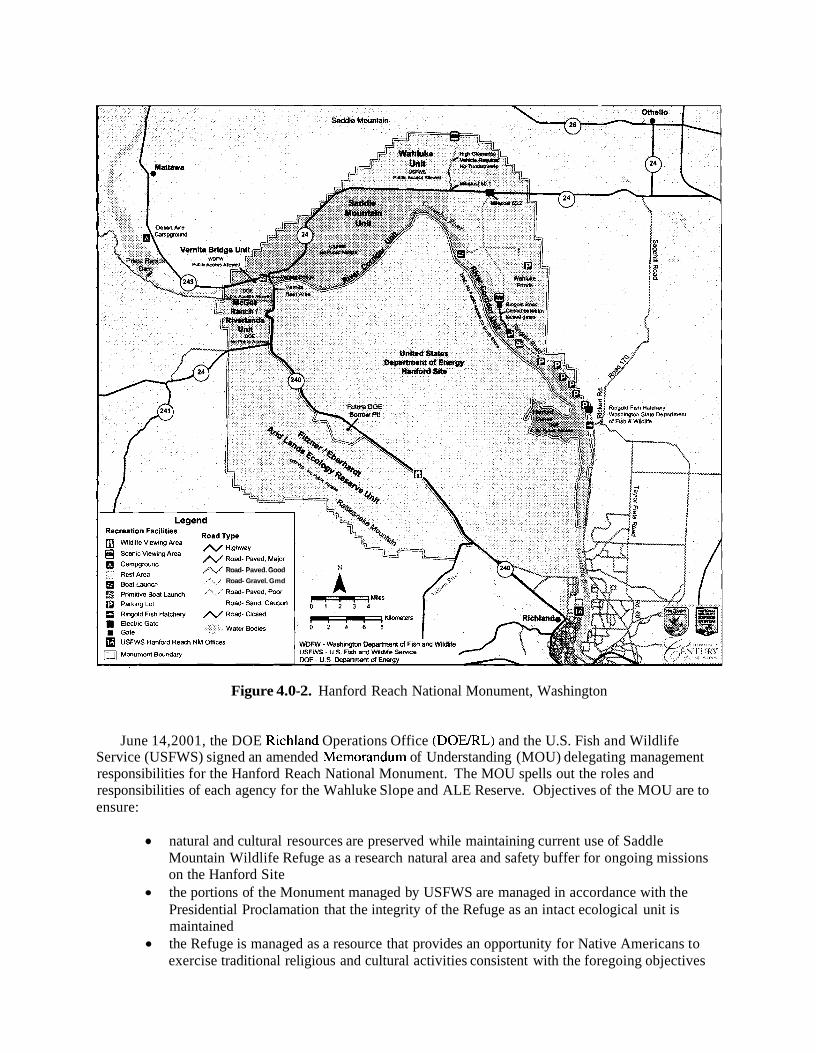
June 9, 2000, William J. Clinton, by Presidential Proclamation, created the Hanford Reach National Monument (65 FR 37253) under the authority of the 1906 Antiquities Act. As established, the Monument totals 792.6 km2 (306 mi2) and includes the Fitzner Eberhardt Arid Lands Ecology Reserve (ALE), Saddle Mountain Wildlife Refuge, McGee Ranch/Riverlands Area, and land 0.40 km (0.25 mi) inland from the mean high-water mark on the south and west shores of the 82 km (5 1 mi) long Hanford Reach, the last free-flowing, non-tidal stretch of the Columbia River. It also includes Wahluke Slope, federally owned islands in the Hanford Reach, White Bluffs, and the sand dune area northwest of the Energy Northwest Site (Figure 4.0-2). This designation establishes the protection and management of the lands within the region of the monument. By memorandum, the President also directed the Secretary of Energy to consult with the Secretary of the Interior regarding the incorporation of additional Hanford Site lands into the Monument as the land is remediated.
,A/ Road- Paved. Good
.."..,.- Road- Gravel. Gmd
Figure 4.0-2. Hanford Reach National Monument, Washington
June 14,2001, the DOE Richland Operations Office (DOEIRL) and the U.S. Fish and Wildlife Service (USFWS) signed an amended Memorandum of Understanding (MOU) delegating management responsibilities for the Hanford Reach National Monument. The MOU spells out the roles and responsibilities of each agency for the Wahluke Slope and ALE Reserve. Objectives of the MOU are to ensure:
natural and cultural resources are preserved while maintaining current use of Saddle Mountain Wildlife Refuge as a research natural area and safety buffer for ongoing missions on the Hanford Site the portions of the Monument managed by USFWS are managed in accordance with the Presidential Proclamation that the integrity of the Refuge as an intact ecological unit is maintained the Refuge is managed as a resource that provides an opportunity for Native Americans to exercise traditional religious and cultural activities consistent with the foregoing objectives
access to the Refuge is available for the educational, scientific, and recreational benefit of the public to the extent this access and use is consistent with the foregoing objectives and compatible with Refuge purposes worker safety and public protection are maintained nationally significant cultural resources including archeological and historic resources and traditional cultural places continue to be protected, preserved, and monitored.
As a result of the MOU, the USFWS is the lead agency in producing a Comprehensive Conservation Plan (CCPiEIS) for management of the Hanford Reach National Monument, including Wahluke Slope (Saddle Mountain Unit and Wahluke Unit) and ALE. Development of the CCPEIS will be a public process, including input from local governments, affected Native American Tribes, stakeholders, and the recently initiated Federal Advisory Committee for the Hanford Reach National Monument. DOE'S approval will be necessary prior to implementation of the CCPIEIS. Under the MOU, DOE and USFWS will produce other agreements for such actions as site access, security, emergency preparedness, mutual assistance, wildland fire response, and cultural and biological resource management.
4.1 Climate and MeteorologyIAir Quality D. J. Hoitink and B. G. Fritz
The Hanford Site lies within the semiarid shrub-steppe Pasco Basin of the Columbia Plateau in southcentral Washington State. The region's climate is greatly influenced by the Pacific Ocean, the Cascade Mountain Range to the west, and other mountain ranges located to the north and east. The Pacific Ocean moderates temperatures throughout the Pacific Northwest and the Cascade Range generates a rain shadow that limits rain and snowfall in the eastern half of Washington State. The Cascade Range also serves as a source of cold air drainage, which has a considerable effect on the wind regime on the Hanford Site. Mountain ranges to the north and east of the region shield the area from the severe winter storms and frigid air masses that move southward across Canada.
Climatological data for the Hanford Site are compiled at the Hanford Meteorology Station (HMS). The HMS is located on Hanford's Central Plateau, just outside the northeast corner of the 200 West Area and about 4 km (3 mi) west of the 200 East Area. Meteorological measurements have been made at the HMS since late 1944. Prior to the establishment of the HMS, local meteorological observations were made at the Old Hanford Townsite (1912 through late 1943) and in Richland (1943-1944). A climatological summary for Hanford is provided in Hoitink et al. (2003). (")
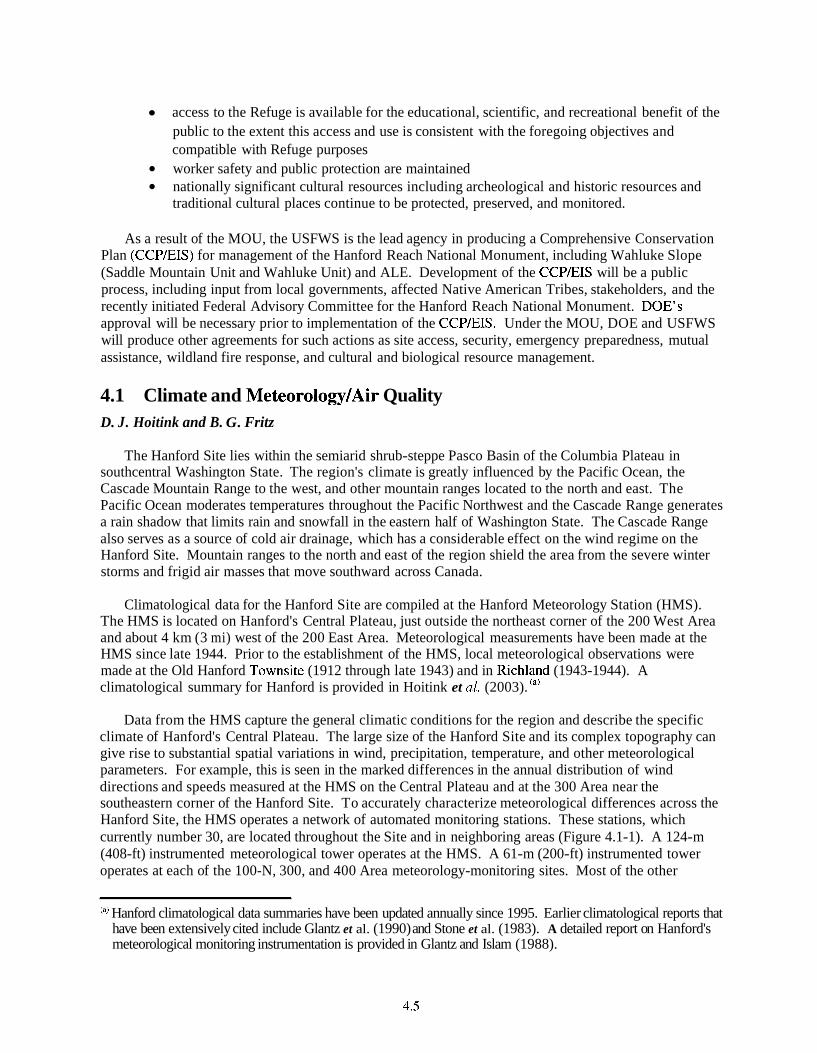
Data from the HMS capture the general climatic conditions for the region and describe the specific climate of Hanford's Central Plateau. The large size of the Hanford Site and its complex topography can give rise to substantial spatial variations in wind, precipitation, temperature, and other meteorological parameters. For example, this is seen in the marked differences in the annual distribution of wind directions and speeds measured at the HMS on the Central Plateau and at the 300 Area near the southeastern corner of the Hanford Site. To accurately characterize meteorological differences across the Hanford Site, the HMS operates a network of automated monitoring stations. These stations, which currently number 30, are located throughout the Site and in neighboring areas (Figure 4.1-1). A 124-m (408-ft) instrumented meteorological tower operates at the HMS. A 61-m (200-ft) instrumented tower operates at each of the 100-N, 300, and 400 Area meteorology-monitoring sites. Most of the other
Hanford climatological data summaries have been updated annually since 1995. Earlier climatological reports that have been extensively cited include Glantz et al. (1990) and Stone et al. (1983). A detailed report on Hanford's meteorological monitoring instrumentation is provided in Glantz and Islam (1988).
Hanford Meteorology Station
Hanford Meteorological Monitoring Network Station G0102W25 1
NOTE: Station 28 is located at Roosevelt, Washington
0 4 8 Kilometers L-L-u-J - 0 2 4 6 8 Miles
Figure 4.1-1. Hanford Meteorological Monitoring Network, Hanford Site, Washington
network stations use short-instrumented towers with heights of about 9.1 m (30 ft). Instrumentation on each tower is described in Table 4.1-1. Data are collected and processed at each monitoring site, and key information is transmitted to the HMS every 15 minutes. This monitoring network has been in full operation since the early 1980s.
For reporting purposes throughout this section the seasons are defined as follows:
Winter - December through February Spring - March through May Summer - June through August Autumn - September through November.
4.1.1 Wind
Wind data at the HMS are collected at 2.1 m (7 ft) above the ground and at the 15.2-, 61 .O-, and 121.9-m (50-, 200-, and 400-ft) levels on the 124-m (408-ft) tower. Each of the three 61 -m (200-ft) towers has wind-measuring instrumentation at the lo-, 25-, and 60-m (33-, 82-, and 197-ft) levels. The short towers measure winds at 9.1 m (30 ft) above ground level.
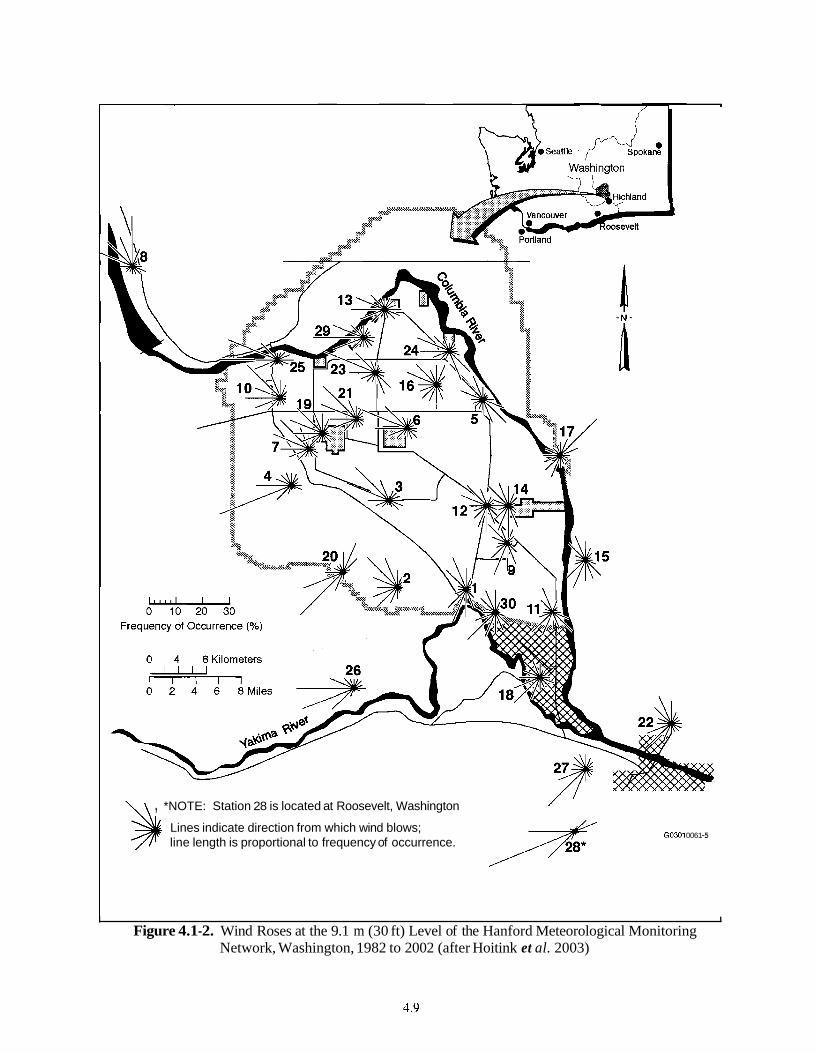
The prevailing winds on Hanford's Central Plateau are the same year round, with prevailing wind directions near the surface from the northwest (Figure 4.1-2). Winds from the northwest occur most frequently during the winter and summer. Winds from the southwest also have a high frequency of occurrence on the Central Plateau. During the spring and fall, there is an increase in the frequency of winds from the southwest and a corresponding decrease in winds from the northwest.
In the southeastern portion of the Hanford Site (including the 300 [Station I l ] and 400 [Station 91 Areas), the prevailing wind direction near the surface is from the southwest during most months; winds from the northwest are much less common (Figure 4.1-2). In the 100 Area and along the Columbia River, local winds are strongly influenced by the topography near the river. At the 100-K (Station 29) and 100- N (Station 13) facilities, the prevailing wind direction is from the west. At the 100-F (Station 24) facility and near the Old Hanford Townsite (environmental designation for noise abatement [EDNA] station) (Station 5), winds often have a northwesterly or southeasterly component.
Stations that are relatively close together can exhibit significant differences in wind patterns. For example, the stations at Rattlesnake Springs (Station 4) and the 200 West Area (Station 7) are separated by about 5 km (3 mi), yet the wind patterns at the two stations are very different (Figure 4.1-2). Care should be taken when assessing the appropriateness of the wind data used in estimating environmental impacts. When possible, wind data from the closest representative station should be used for assessing local dispersion conditions.
Monthly and annual joint-frequency distributions of wind direction versus wind speed for the HMS are reported in Hoitink et al. (2003). Monthly average wind speeds at 15.2 m (50 ft) above the ground are lower during the winter months, averaging 2.7 to 3.1 rn/s (6 to 7 mph), and faster during the summer, averaging 3.6 to 4.0 m/s (8 to 9 mph). The fastest wind speeds at the HMS are usually associated with flow from the southwest. However, the summertime drainage winds from the northwest frequently exceed speeds of 13 rnls (30 mph). The maximum speed of the drainage winds (and their frequency of occurrence) tends to decrease as one moves toward the southeast across the Hanford Site.
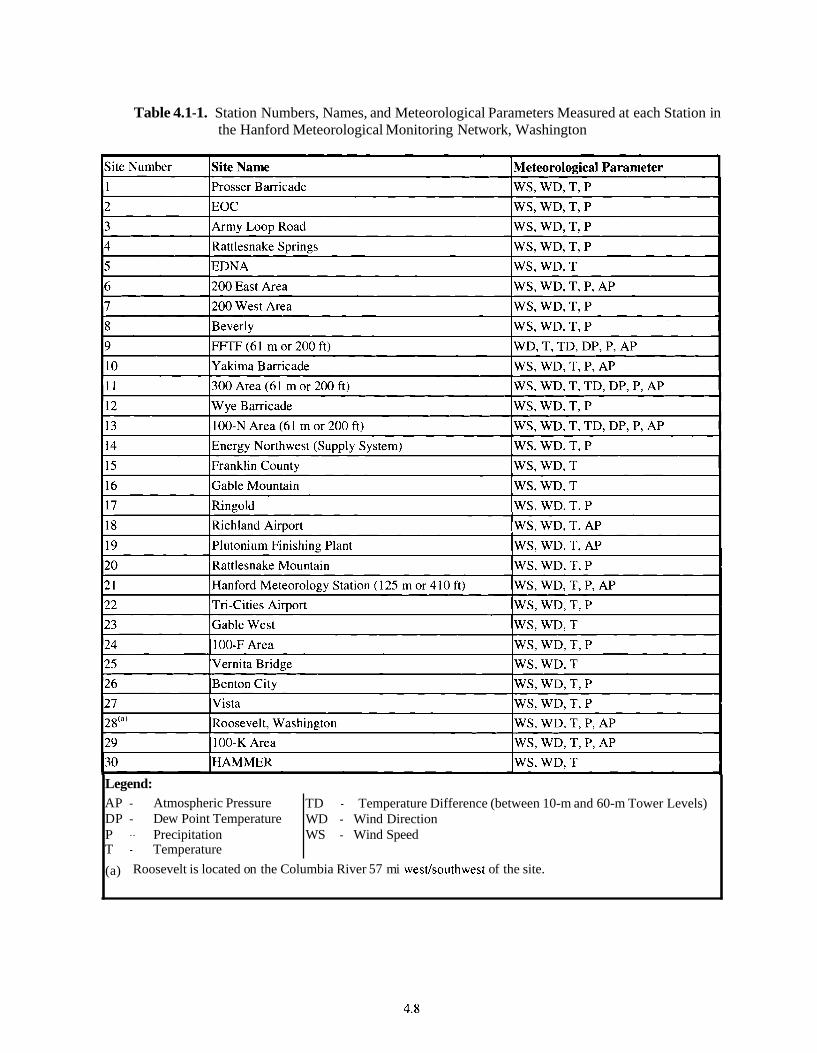
Table 4.1-1. Station Numbers, Names, and Meteorological Parameters Measured at each Station in the Hanford Meteorological Monitoring Network, Washington
Legend: AP - Atmospheric Pressure DP - Dew Point Temperature P - Precipitation T - Temperature
TD - Temperature Difference (between 10-m and 60-m Tower Levels) WD - Wind Direction WS - Wind Speed
(a) Roosevelt is located on the Columbia River 57 mi west/southwest of the site.
\\ , *NOTE: Station 28 is located at Roosevelt, Washington / ' Lines indicate direction from which wind blows;
GO301 0061 -5 line length is proportional to frequency of occurrence.
I I
Figure 4.1-2. Wind Roses at the 9.1 m (30 ft) Level of the Hanford Meteorological Monitoring Network, Washington, 1982 to 2002 (after Hoitink et al. 2003)
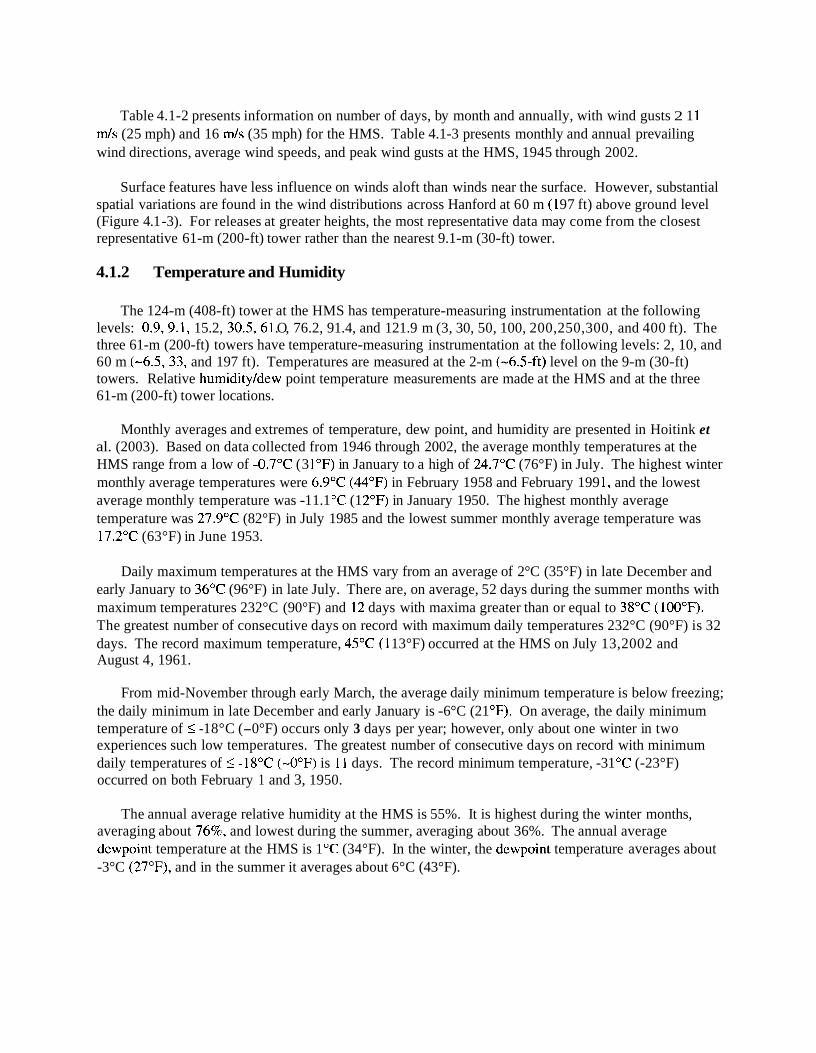
Table 4.1-2 presents information on number of days, by month and annually, with wind gusts 2 1 1 m/s (25 mph) and 16 d s (35 mph) for the HMS. Table 4.1-3 presents monthly and annual prevailing wind directions, average wind speeds, and peak wind gusts at the HMS, 1945 through 2002.
Surface features have less influence on winds aloft than winds near the surface. However, substantial spatial variations are found in the wind distributions across Hanford at 60 m (1 97 ft) above ground level (Figure 4.1 -3). For releases at greater heights, the most representative data may come from the closest representative 61-m (200-ft) tower rather than the nearest 9.1-m (30-ft) tower.
4.1.2 Temperature and Humidity
The 124-m (408-ft) tower at the HMS has temperature-measuring instrumentation at the following levels: 0.9,9.1, 15.2, 30.5,6 1 .O, 76.2, 91.4, and 121.9 m (3, 30, 50, 100, 200,250,300, and 400 ft). The three 61-m (200-ft) towers have temperature-measuring instrumentation at the following levels: 2, 10, and 60 m (-6.5,33, and 197 ft). Temperatures are measured at the 2-m (-6.5-ft) level on the 9-m (30-ft) towers. Relative humidityldew point temperature measurements are made at the HMS and at the three 61-m (200-ft) tower locations.
Monthly averages and extremes of temperature, dew point, and humidity are presented in Hoitink et al. (2003). Based on data collected from 1946 through 2002, the average monthly temperatures at the HMS range from a low of -0.7"C (3 1 OF) in January to a high of 24.7"C (76°F) in July. The highest winter monthly average temperatures were 6.9"C (44°F) in February 1958 and February 199 1, and the lowest average monthly temperature was -1 1.1 "C (1 2°F) in January 1950. The highest monthly average temperature was 27.9"C (82°F) in July 1985 and the lowest summer monthly average temperature was 17.2"C (63°F) in June 1953.
Daily maximum temperatures at the HMS vary from an average of 2°C (35°F) in late December and early January to 36°C (96°F) in late July. There are, on average, 52 days during the summer months with maximum temperatures 232°C (90°F) and 12 days with maxima greater than or equal to 38°C (100°F). The greatest number of consecutive days on record with maximum daily temperatures 232°C (90°F) is 32 days. The record maximum temperature, 45°C (1 13°F) occurred at the HMS on July 13,2002 and August 4, 1961.
From mid-November through early March, the average daily minimum temperature is below freezing; the daily minimum in late December and early January is -6°C (21 OF). On average, the daily minimum temperature of 5 -1 8°C (-0°F) occurs only 3 days per year; however, only about one winter in two experiences such low temperatures. The greatest number of consecutive days on record with minimum daily temperatures of I -18°C (-0°F) is 11 days. The record minimum temperature, -31 "C (-23°F) occurred on both February 1 and 3, 1950.
The annual average relative humidity at the HMS is 55%. It is highest during the winter months, averaging about 7696, and lowest during the summer, averaging about 36%. The annual average dewpoint temperature at the HMS is 1 "C (34°F). In the winter, the dewpoint temperature averages about -3°C (27"F), and in the summer it averages about 6°C (43°F).
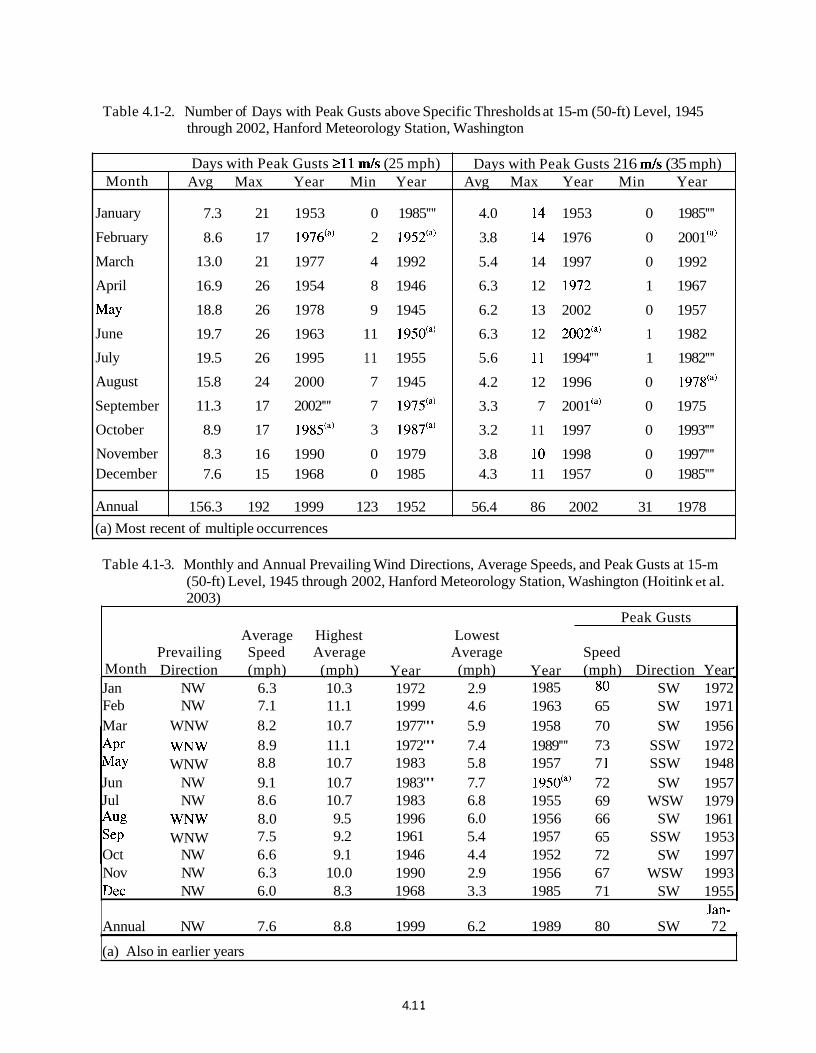
Table 4.1-2. Number of Days with Peak Gusts above Specific Thresholds at 15-m (50-ft) Level, 1945 through 2002, Hanford Meteorology Station, Washington
Table 4.1-3. Monthly and Annual Prevailing Wind Directions, Average Speeds, and Peak Gusts at 15-m (50-ft) Level, 1945 through 2002, Hanford Meteorology Station, Washington (Hoitink et al. 2003)
Peak Gusts Average Highest Lowest
Days with Peak Gusts 216 m/s (35 mph) Avg Max Year Min Year
4.0 14 1953 0 1985'"'
3.8 14 1976 0 2001 'a)
5.4 14 1997 0 1992
6.3 12 1972 1 1967
6.2 13 2002 0 1957
6.3 12 2002@' 1 1982
5.6 1 1 1994'"' 1 1982'"'
4.2 12 1996 0 1978'~)
3.3 7 2001 '"' 0 1975
3.2 11 1997 0 1993'"'
3.8 10 1998 0 1997'"' 4.3 11 1957 0 1985'"'
56.4 86 2002 31 1978
Month
January
February
March
April
May
June
July
August
September
October
November December
Annual
Prevailing Speed Average Average Speed Month Direction (mph) (mph) Year (mph) Year (mph) Direction Year Jan NW 6.3 10.3 1972 2.9 1985 80 SW 1972 Feb NW 7.1 11.1 1999 4.6 1963 65 SW 1971 Mar WNW 8.2 10.7 1977'" 5.9 1958 70 SW 1956
A P ~ WNW 8.9 11.1 1972'" 7.4 1989'"' 73 SSW 1972 May WNW 8.8 10.7 1983 5.8 1957 7 1 SSW 1948 Jun NW 9.1 10.7 1983'" 7.7 1950'"' 72 SW 1957 Jul NW 8.6 10.7 1983 6.8 1955 69 WSW 1979 Aug WNW 8.0 9.5 1996 6.0 1956 66 SW 1961 S ~ P WNW 7.5 9.2 1961 5.4 1957 65 SSW 1953 Oct NW 6.6 9.1 1946 4.4 1952 72 SW 1997 Nov NW 6.3 10.0 1990 2.9 1956 67 WSW 1993 Dec NW 6.0 8.3 1968 3.3 1985 7 1 SW 1955
(a) Most recent of multiple occurrences
Days with Peak Gusts 111 m/s (25 mph) Avg Max Year Min Year
7.3 21 1953 0 1985'"'
8.6 17 1976'"' 2 1952'"'
13.0 21 1977 4 1992
16.9 26 1954 8 1946
18.8 26 1978 9 1945
19.7 26 1963 11 1950'~)
19.5 26 1995 11 1955
15.8 24 2000 7 1945
11.3 17 2002'"' 7 1975'~'
8.9 17 198.5'"' 3 1987'"'
8.3 16 1990 0 1979 7.6 15 1968 0 1985
156.3 192 1999 123 1952
Jan- 1 Annual NW 7.6 8.8 1999 6.2 1989 80 SW 72
(a) Also in earlier years
4.1 1
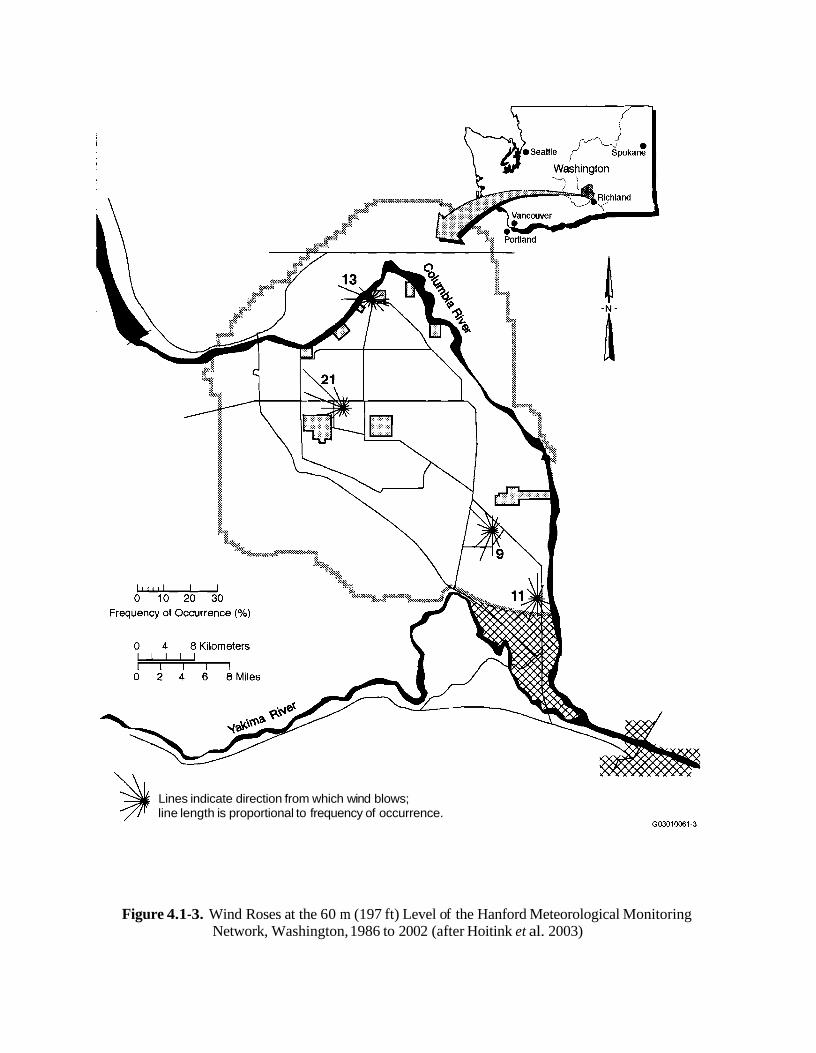
Lines indicate direction from which wind blows; line length is proportional to frequency of occurrence.
Figure 4.1-3. Wind Roses at the 60 m (197 ft) Level of the Hanford Meteorological Monitoring Network, Washington, 1986 to 2002 (after Hoitink et al. 2003)
4.1.3 Precipitation
Average annual precipitation at the HMS is 17 cm (6.8 in.). In 1995, the wettest year on record, 31.3 cm (12.3 in.) of precipitation was measured; in 1976, the driest year, only 7.6 cm (3 in.) was measured. The wettest season on record was the winter of 1996-1997 with 14.1 cm (5.4 in.) of precipitation; the driest season was the summer of 1973 when only 0.1 cm (0.03 in.) of precipitation was measured. Most precipitation occurs during the late autumn and winter, with more than half of the annual amount occurring from November through February. Days with >I .3 cm (0.50 in.) precipitation occur on average less than one time each year.
Average snowfall ranges from 0.25 cm (0.1 in.) in October to a maximum of 13.2 cm (5.2 in.) in December and decreases to 1.3 cm (0.5 in.) in March. The record monthly snowfall of 59.4 cm (23.4 in.) occurred in January 1950. The seasonal record snowfall of 142.5 cm (56.1 in.) occurred during the winter of 1992-1993. Snowfall accounts for about 38% of all precipitation from December through February.
4.1.4 Fog and Visibility
Fog has been recorded during every month of the year at the HMS; however, 89% of the occurrences are from November through February, with less than 3% from April through September (Table 4.1-4). The average number of days per year with fog (visibility 19.6 km [6 mi]) is 48, while those with dense fog (visibility 10.4 km [0.25 mi]), is 25. The greatest number of days with fog was 84 days in 1985-1986, and the least was 22 in 1948-1949. The greatest number of days with dense fog was 42 days in 1950- 195 1, and the least was 9 days in 1948- 1949. The greatest persistence of fog was 1 14 hr (December 1985), and the greatest persistence of dense fog was 47 hr (December 1957).
Table 4.1-4. Number of Days with Fog by Season, Hanford Site, Washington
Category Winter Spring Summer Autumn Total
Fog 3 2 3 1 1 12 48
Dense fog 17 1 I 1 7 25
Other phenomena causing restrictions to visibility (i.e., visibility 19 .6 km [6 mi]) include dust, blowing dust, and smoke from field burning. There are few such days; an average of 5 days per year have dust or blowing dust, and less than 1 day per year, on average, has reduced visibility from smoke.
4.1.5 Severe Weather
Concerns about severe weather usually center on hurricanes, tornadoes, and thunderstorms. Fortunately, Washington does not experience hurricanes. In addition, tornadoes are infrequent and generally small in the northwestern portion of the United States. The National Climatic Data Center maintains a database that provides information on the incidence of tornados reported in each county in the United States. (This database can be accessed via the Internet at http://www.ncdc.noaa.~ov/ol/climate/severe~~eather/extre~nes.ht~nl).
This database reports that in the ten counties closest to the Hanford Site (Benton, Franklin, Grant, Adams, Yakima, Klickitat, Kittitas, and Walla Walla counties in Washington and Umatilla and Morrow
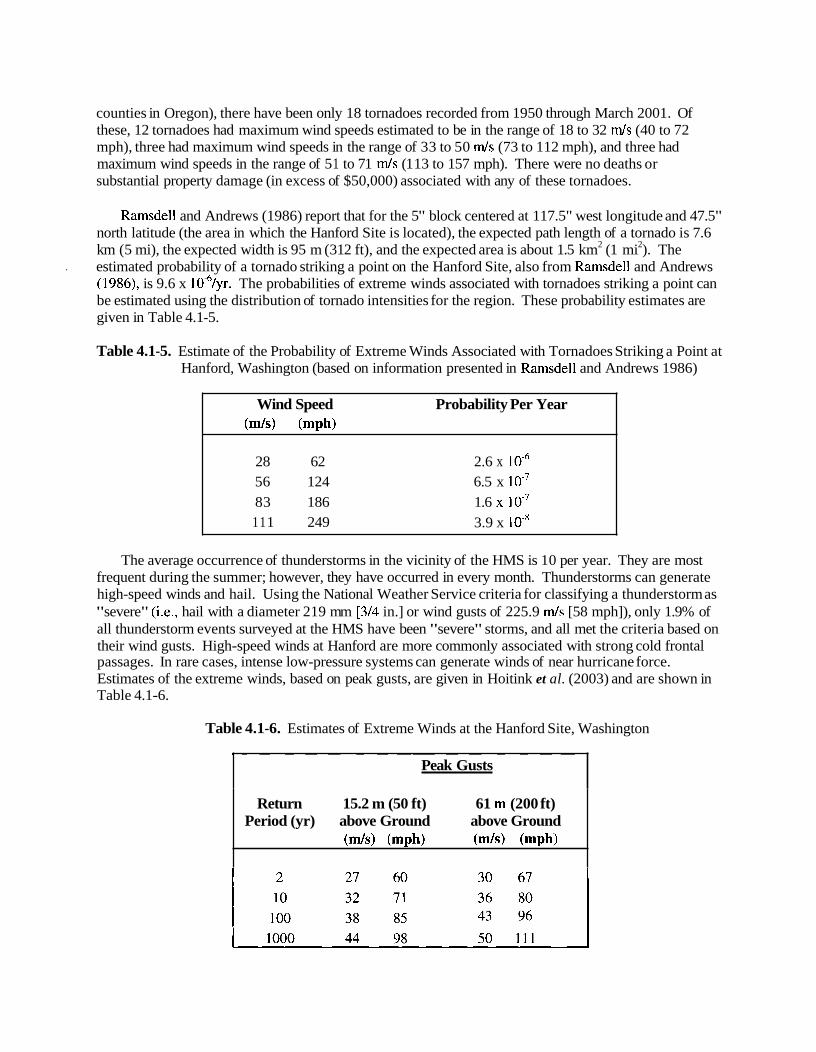
counties in Oregon), there have been only 18 tornadoes recorded from 1950 through March 2001. Of these, 12 tornadoes had maximum wind speeds estimated to be in the range of 18 to 32 mls (40 to 72 mph), three had maximum wind speeds in the range of 33 to 50 m/s (73 to 112 mph), and three had maximum wind speeds in the range of 5 1 to 71 m/s (1 13 to 157 mph). There were no deaths or substantial property damage (in excess of $50,000) associated with any of these tornadoes.
Ramsdell and Andrews (1986) report that for the 5" block centered at 117.5" west longitude and 47.5" north latitude (the area in which the Hanford Site is located), the expected path length of a tornado is 7.6 km (5 mi), the expected width is 95 m (3 12 ft), and the expected area is about 1.5 km2 (1 mi2). The
. estimated probability of a tornado striking a point on the Hanford Site, also from Ramsdell and Andrews (1 986), is 9.6 x 1 0 - ~ / ~ r . The probabilities of extreme winds associated with tornadoes striking a point can be estimated using the distribution of tornado intensities for the region. These probability estimates are given in Table 4.1-5.
Table 4.1-5. Estimate of the Probability of Extreme Winds Associated with Tornadoes Striking a Point at Hanford, Washington (based on information presented in Ramsdell and Andrews 1986)
Wind Speed Probability Per Year (mfs) (mph)
28 62 2.6 x 10'~ 56 124 6.5 x 83 186 1.6 x lo-7 11 1 249 3.9 x lo-g
The average occurrence of thunderstorms in the vicinity of the HMS is 10 per year. They are most frequent during the summer; however, they have occurred in every month. Thunderstorms can generate high-speed winds and hail. Using the National Weather Service criteria for classifying a thunderstorm as "severe" (i.e., hail with a diameter 219 mm [3/4 in.] or wind gusts of 225.9 m/s [58 mph]), only 1.9% of all thunderstorm events surveyed at the HMS have been "severe" storms, and all met the criteria based on their wind gusts. High-speed winds at Hanford are more commonly associated with strong cold frontal passages. In rare cases, intense low-pressure systems can generate winds of near hurricane force. Estimates of the extreme winds, based on peak gusts, are given in Hoitink et al. (2003) and are shown in Table 4.1-6.
Table 4.1-6. Estimates of Extreme Winds at the Hanford Site, Washington
Peak Gusts
Return 15.2 m (50 ft) 61 m (200 ft) Period (yr) above Ground above Ground
( d s ) (mph) (mls) (mph)
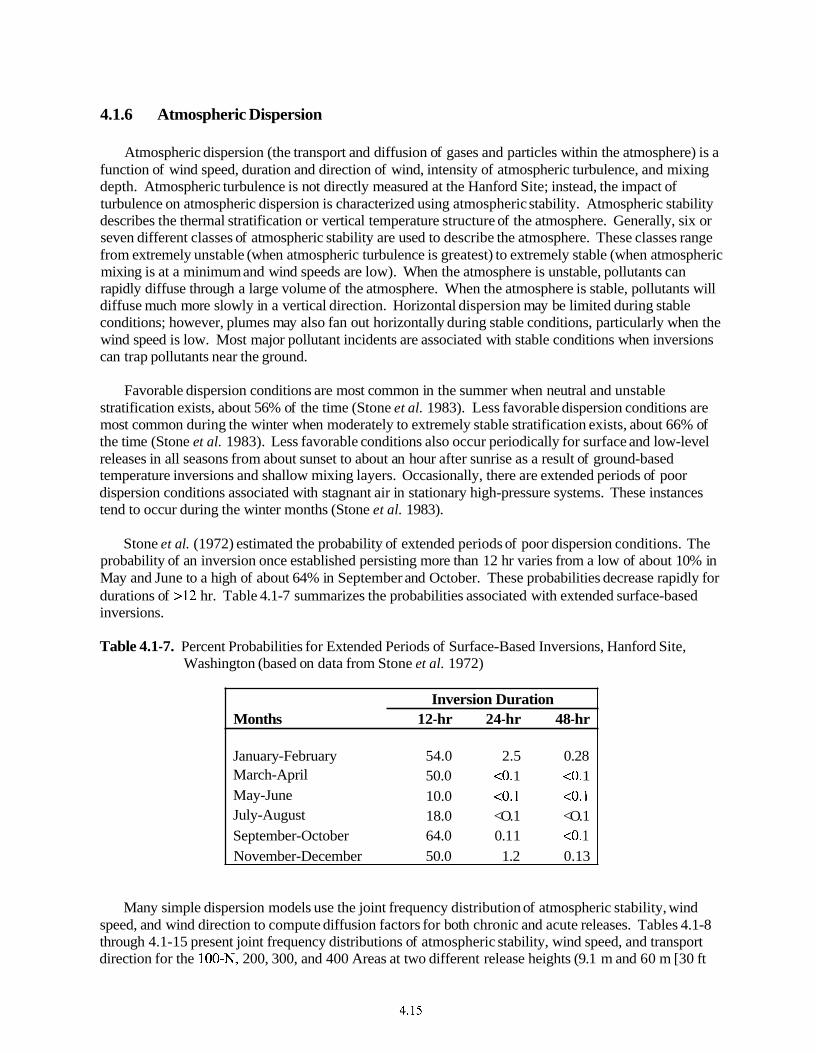
4.1.6 Atmospheric Dispersion
Atmospheric dispersion (the transport and diffusion of gases and particles within the atmosphere) is a function of wind speed, duration and direction of wind, intensity of atmospheric turbulence, and mixing depth. Atmospheric turbulence is not directly measured at the Hanford Site; instead, the impact of turbulence on atmospheric dispersion is characterized using atmospheric stability. Atmospheric stability describes the thermal stratification or vertical temperature structure of the atmosphere. Generally, six or seven different classes of atmospheric stability are used to describe the atmosphere. These classes range from extremely unstable (when atmospheric turbulence is greatest) to extremely stable (when atmospheric mixing is at a minimum and wind speeds are low). When the atmosphere is unstable, pollutants can rapidly diffuse through a large volume of the atmosphere. When the atmosphere is stable, pollutants will diffuse much more slowly in a vertical direction. Horizontal dispersion may be limited during stable conditions; however, plumes may also fan out horizontally during stable conditions, particularly when the wind speed is low. Most major pollutant incidents are associated with stable conditions when inversions can trap pollutants near the ground.
Favorable dispersion conditions are most common in the summer when neutral and unstable stratification exists, about 56% of the time (Stone et al. 1983). Less favorable dispersion conditions are most common during the winter when moderately to extremely stable stratification exists, about 66% of the time (Stone et al. 1983). Less favorable conditions also occur periodically for surface and low-level releases in all seasons from about sunset to about an hour after sunrise as a result of ground-based temperature inversions and shallow mixing layers. Occasionally, there are extended periods of poor dispersion conditions associated with stagnant air in stationary high-pressure systems. These instances tend to occur during the winter months (Stone et al. 1983).
Stone et al. (1972) estimated the probability of extended periods of poor dispersion conditions. The probability of an inversion once established persisting more than 12 hr varies from a low of about 10% in May and June to a high of about 64% in September and October. These probabilities decrease rapidly for durations of >12 hr. Table 4.1-7 summarizes the probabilities associated with extended surface-based inversions.
Table 4.1-7. Percent Probabilities for Extended Periods of Surface-Based Inversions, Hanford Site, Washington (based on data from Stone et al. 1972)
Inversion Duration Months 12-hr 24-hr 48-hr
January -February 54.0 2.5 0.28 March-April 50.0 <O. 1 <O. 1 May-June 10.0 <O. 1 <O. 1 July-August 18.0 <O. 1 <O. 1 September-October 64.0 0.1 1 <O. 1 November-December 50.0 1.2 0.13
Many simple dispersion models use the joint frequency distribution of atmospheric stability, wind speed, and wind direction to compute diffusion factors for both chronic and acute releases. Tables 4.1-8 through 4.1-15 present joint frequency distributions of atmospheric stability, wind speed, and transport direction for the 100-N, 200, 300, and 400 Areas at two different release heights (9.1 m and 60 m [30 ft
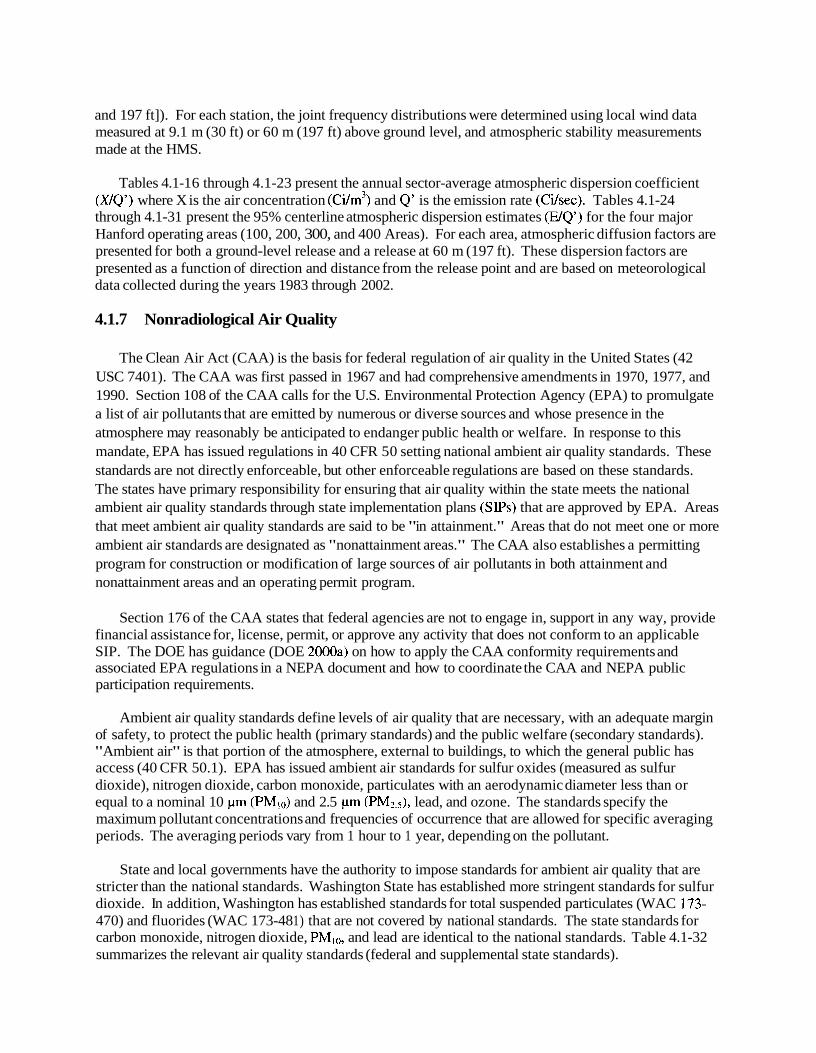
and 197 ft]). For each station, the joint frequency distributions were determined using local wind data measured at 9.1 m (30 ft) or 60 m (1 97 ft) above ground level, and atmospheric stability measurements made at the HMS.
Tables 4.1-1 6 through 4.1-23 present the annual sector-average atmospheric dispersion coefficient (X/Q7) where X is the air concentration (ci/m3) and Q' is the emission rate (Ci/sec). Tables 4.1-24 through 4.1-31 present the 95% centerline atmospheric dispersion estimates (EIQ') for the four major Hanford operating areas (100, 200, 300, and 400 Areas). For each area, atmospheric diffusion factors are presented for both a ground-level release and a release at 60 m (197 ft). These dispersion factors are presented as a function of direction and distance from the release point and are based on meteorological data collected during the years 1983 through 2002.
4.1.7 Nonradiological Air Quality
The Clean Air Act (CAA) is the basis for federal regulation of air quality in the United States (42 USC 7401). The CAA was first passed in 1967 and had comprehensive amendments in 1970, 1977, and 1990. Section 108 of the CAA calls for the U.S. Environmental Protection Agency (EPA) to promulgate a list of air pollutants that are emitted by numerous or diverse sources and whose presence in the atmosphere may reasonably be anticipated to endanger public health or welfare. In response to this mandate, EPA has issued regulations in 40 CFR 50 setting national ambient air quality standards. These standards are not directly enforceable, but other enforceable regulations are based on these standards. The states have primary responsibility for ensuring that air quality within the state meets the national ambient air quality standards through state implementation plans (SIPS) that are approved by EPA. Areas that meet ambient air quality standards are said to be "in attainment." Areas that do not meet one or more ambient air standards are designated as "nonattainment areas." The CAA also establishes a permitting program for construction or modification of large sources of air pollutants in both attainment and nonattainment areas and an operating permit program.
Section 176 of the CAA states that federal agencies are not to engage in, support in any way, provide financial assistance for, license, permit, or approve any activity that does not conform to an applicable SIP. The DOE has guidance (DOE 2000a) on how to apply the CAA conformity requirements and associated EPA regulations in a NEPA document and how to coordinate the CAA and NEPA public participation requirements.
Ambient air quality standards define levels of air quality that are necessary, with an adequate margin of safety, to protect the public health (primary standards) and the public welfare (secondary standards). "Ambient air" is that portion of the atmosphere, external to buildings, to which the general public has access (40 CFR 50.1). EPA has issued ambient air standards for sulfur oxides (measured as sulfur dioxide), nitrogen dioxide, carbon monoxide, particulates with an aerodynamic diameter less than or equal to a nominal 10 pm (PMlo) and 2.5 pm (PM2.5), lead, and ozone. The standards specify the maximum pollutant concentrations and frequencies of occurrence that are allowed for specific averaging periods. The averaging periods vary from 1 hour to 1 year, depending on the pollutant.
State and local governments have the authority to impose standards for ambient air quality that are stricter than the national standards. Washington State has established more stringent standards for sulfur dioxide. In addition, Washington has established standards for total suspended particulates (WAC 173- 470) and fluorides (WAC 173-48 1) that are not covered by national standards. The state standards for carbon monoxide, nitrogen dioxide, PMlo, and lead are identical to the national standards. Table 4.1-32 summarizes the relevant air quality standards (federal and supplemental state standards).
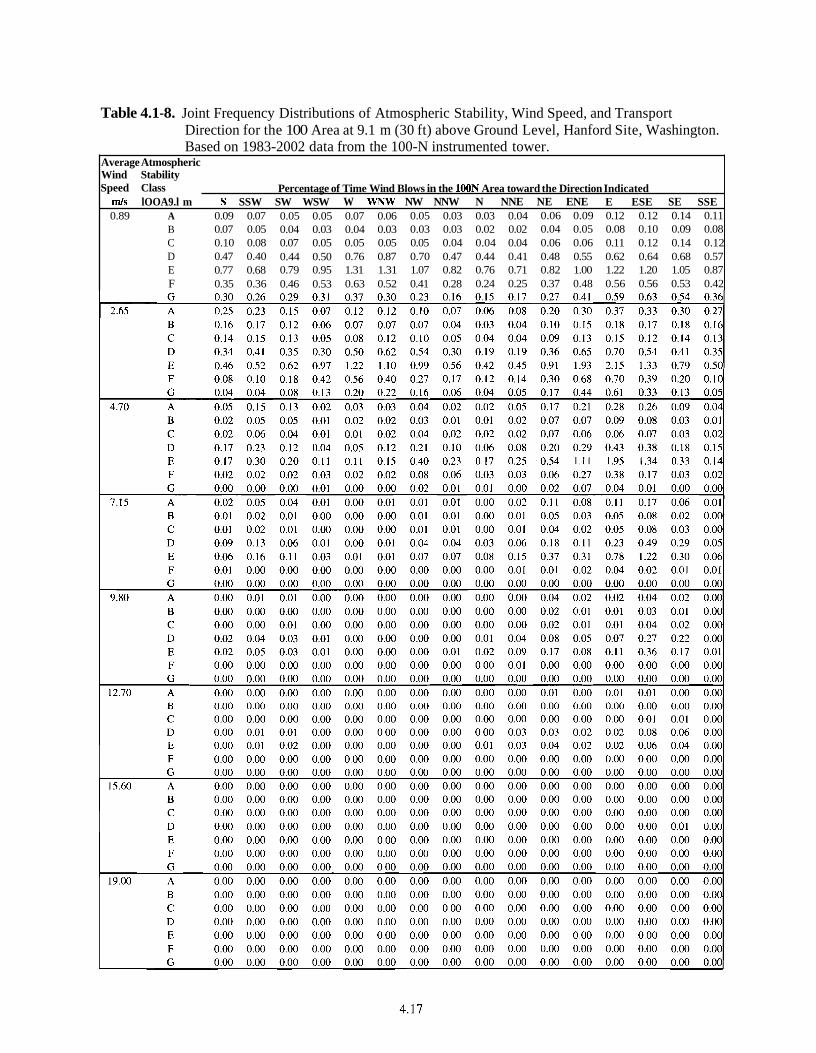
Table 4.1-8. Joint Frequency Distributions of Atmospheric Stability, Wind Speed, and Transport Direction for the 100 Area at 9.1 m (30 ft) above Ground Level, Hanford Site, Washington. Based on 1983-2002 data from the 100-N instrumented tower.
Average Atmospheric Wind Stability Speed Class Percentage of Time Wind Blows in the lOON Area toward the Direction Indicated
mls lOOA9.l m S SSW SW WSW W WNW NW NNW N NNE NE ENE E ESE SE SSE 0.89 A 0.09 0.07 0.05 0.05 0.07 0.06 0.05 0.03 0.03 0.04 0.06 0.09 0.12 0.12 0.14 0.11
B 0.07 0.05 0.04 0.03 0.04 0.03 0.03 0.03 0.02 0.02 0.04 0.05 0.08 0.10 0.09 0.08 C 0.10 0.08 0.07 0.05 0.05 0.05 0.05 0.04 0.04 0.04 0.06 0.06 0.11 0.12 0.14 0.12 D 0.47 0.40 0.44 0.50 0.76 0.87 0.70 0.47 0.44 0.41 0.48 0.55 0.62 0.64 0.68 0.57 E 0.77 0.68 0.79 0.95 1.31 1.31 1.07 0.82 0.76 0.71 0.82 1.00 1.22 1.20 1.05 0.87 F 0.35 0.36 0.46 0.53 0.63 0.52 0.41 0.28 0.24 0.25 0.37 0.48 0.56 0.56 0.53 0.42
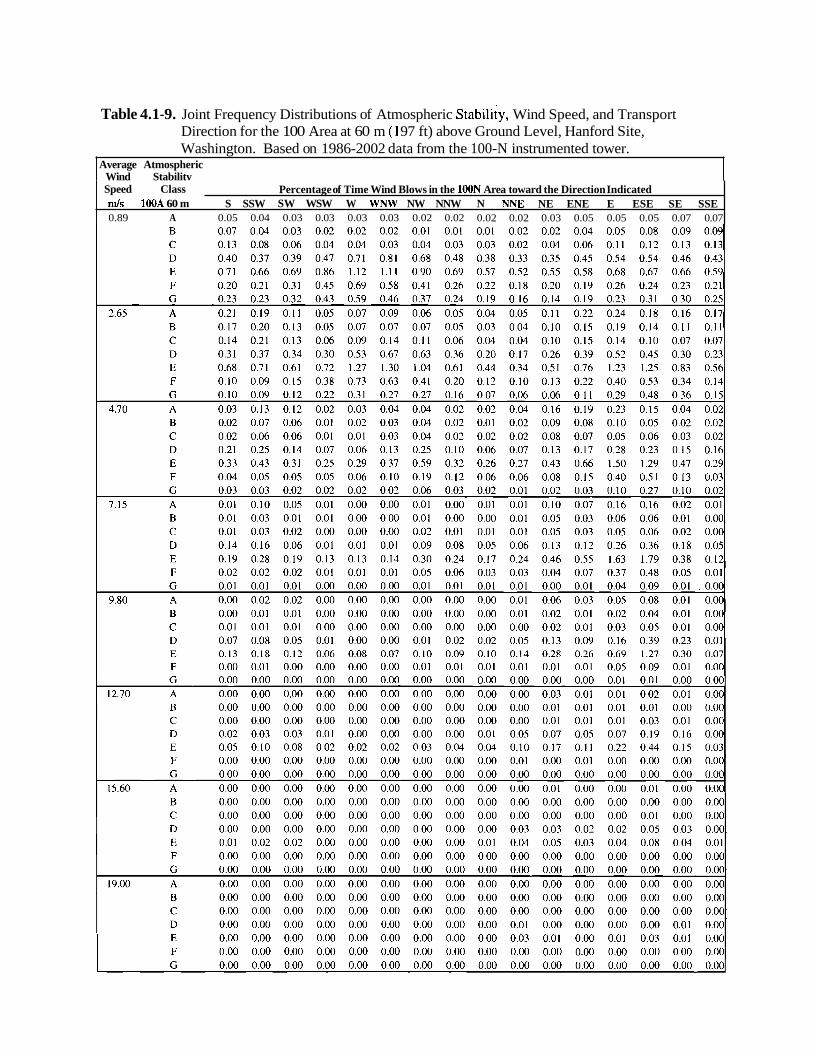
Table 4.1-9. Joint Frequency Distributions of Atmospheric stability, Wind Speed, and Transport Direction for the 100 Area at 60 m (1 97 ft) above Ground Level, Hanford Site, Washington. Based on 1986-2002 data from the 100-N instrumented tower.
Average Atmospheric Wind Stabilitv Speed Class Percentage of Time Wind Blows in the lOON Area toward the Direction Indicated m/s lOOA 60 m S SSW SW WSW W WNW NW NNW N NNE NE ENE E ESE SE SSE 0.89 A 0.05 0.04 0.03 0.03 0.03 0.03 0.02 0.02 0.02 0.02 0.03 0.05 0.05 0.05 0.07 0.07
Table 4.1-10. Joint Frequency Distributions of Atmospheric Stability, Wind Speed, and Transport Direction for the 200 Areas at 9.1 m (30 ft) above Ground Level, Hanford Site, Washington. Based on 1983-2002 data from the HMS instrumented tower.
Average Wind Atmospheric Speed Stability Class Percentage of Tinie Wind Blows in the 200 Areas toward the Direction Indicated m/s HMS 9.1 m S SSW SW WSW W WNW NW NNW N NNE NE ENE E ESE SE SSE 0.89 A 0.32 0.36 0.39 0.29 0.29 0.27 0.21 0.16 0.14 0.12 0.11 0.10 0.11 0.13 0.19 0.25
B 0.15 0.14 0.16 0.11 0.10 0.10 0.09 0.05 0.06 0.05 0.05 0.04 0.06 0.07 0.10 0.12 C 0.13 0.13 0.13 0.09 0.08 0.08 0.08 0.06 0.04 0.04 0.05 0.04 0.05 0.06 0.08 0.12 D 0.76 0.65 0.62 0.49 0.52 0.55 0.57 0.40 0.34 0.29 0.32 0.35 0.44 0.52 0.69 0.73 E 0.37 0.28 0.26 0.24 0.28 0.33 0.44 0.38 0.34 0.33 0.45 0.48 0.54 0.59 0.58 0.50 F 0.24 0.16 0.15 0.14 0.16 0.19 0.25 0.24 0.26 0.29 0.34 0.34 0.40 0.42 0.39 0.30
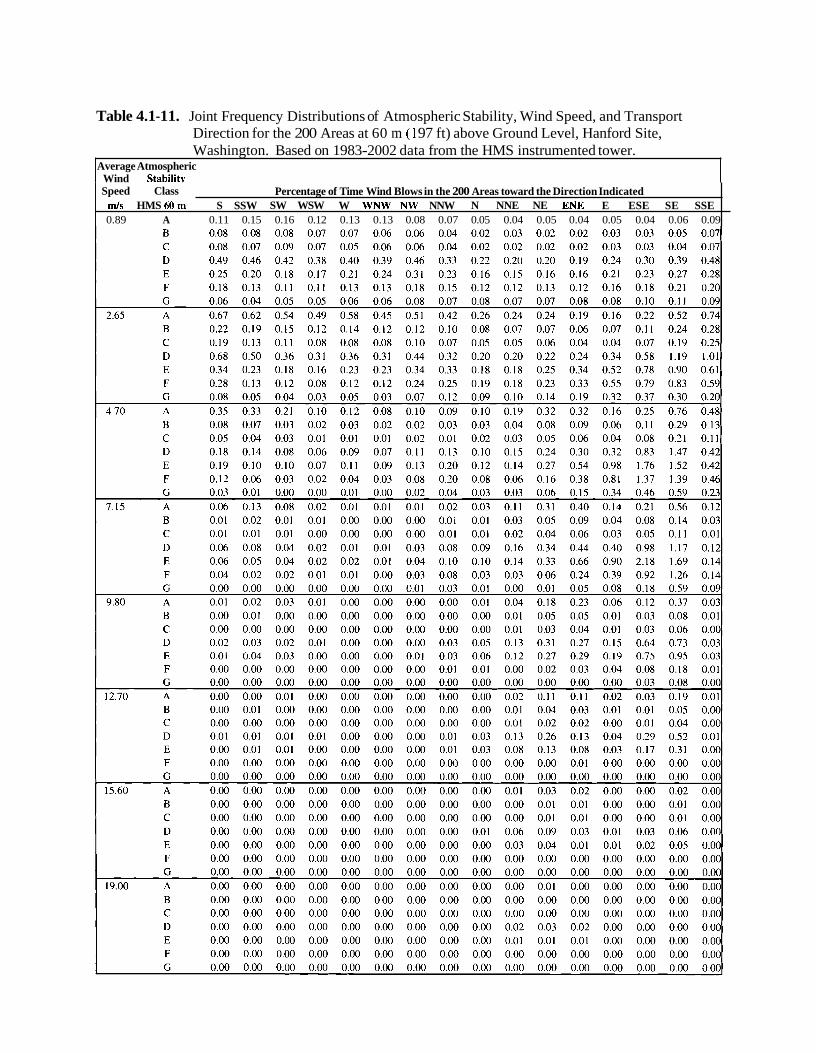
Table 4.1-11. Joint Frequency Distributions of Atmospheric Stability, Wind Speed, and Transport Direction for the 200 Areas at 60 m (1 97 ft) above Ground Level, Hanford Site, Washington. Based on 1983-2002 data from the HMS instrumented tower.
Average Atmospheric Wind Stabilitv Speed Class Percentage of Time Wind Blows in the 200 Areas toward the Direction Indicated
m/s HMS 60m S SSW SW WSW W WNW NW NNW N NNE NE ENE E ESE SE SSE 0.89 A 0.11 0.15 0.16 0.12 0.13 0.13 0.08 0.07 0.05 0.04 0.05 0.04 0.05 0.04 0.06 0.09
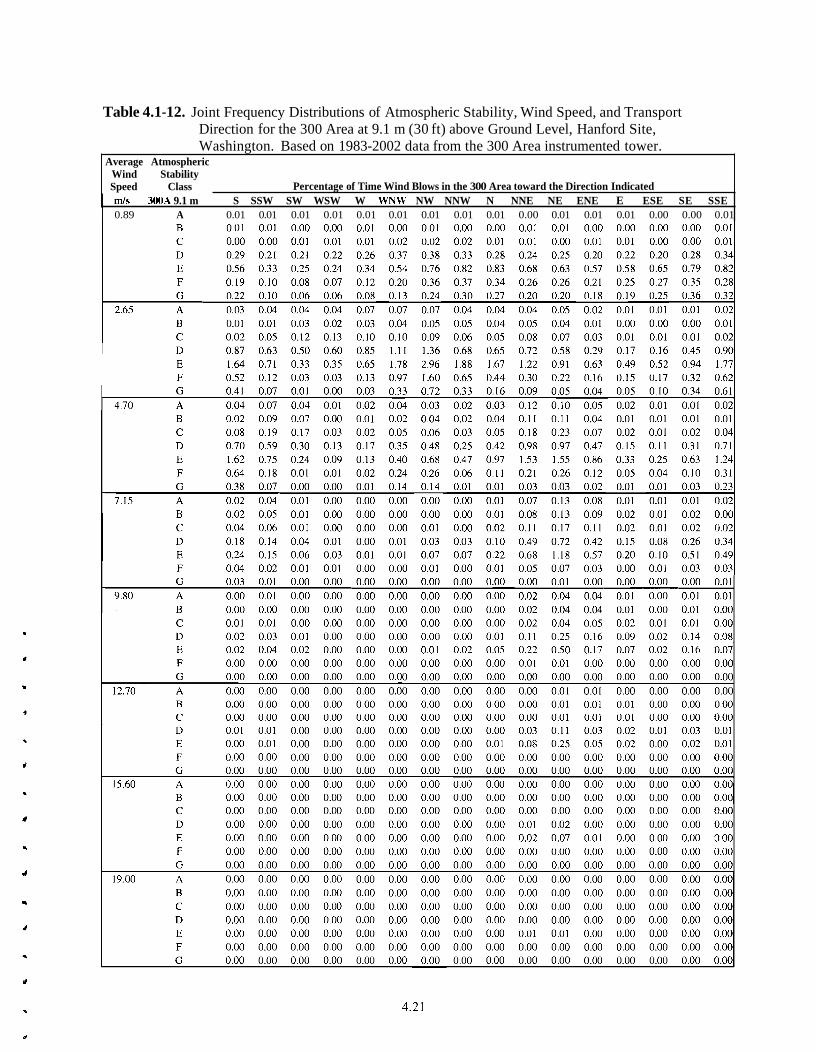
Table 4.1-12. Joint Frequency Distributions of Atmospheric Stability, Wind Speed, and Transport Direction for the 300 Area at 9.1 m (30 ft) above Ground Level, Hanford Site, Washington. Based on 1983-2002 data from the 300 Area instrumented tower.
Average Atmospheric Wind Stability Speed Class Percentage of Time Wind Blows in the 300 Area toward the Direction Indicated mls 300A 9.1 m S SSW SW WSW W WNW NW NNW N NNE NE ENE E ESE SE SSE 0.89 A 0.01 0.01 0.01 0.01 0.01 0.01 0.01 0.01 0.01 0.00 0.01 0.01 0.01 0.00 0.00 0.01
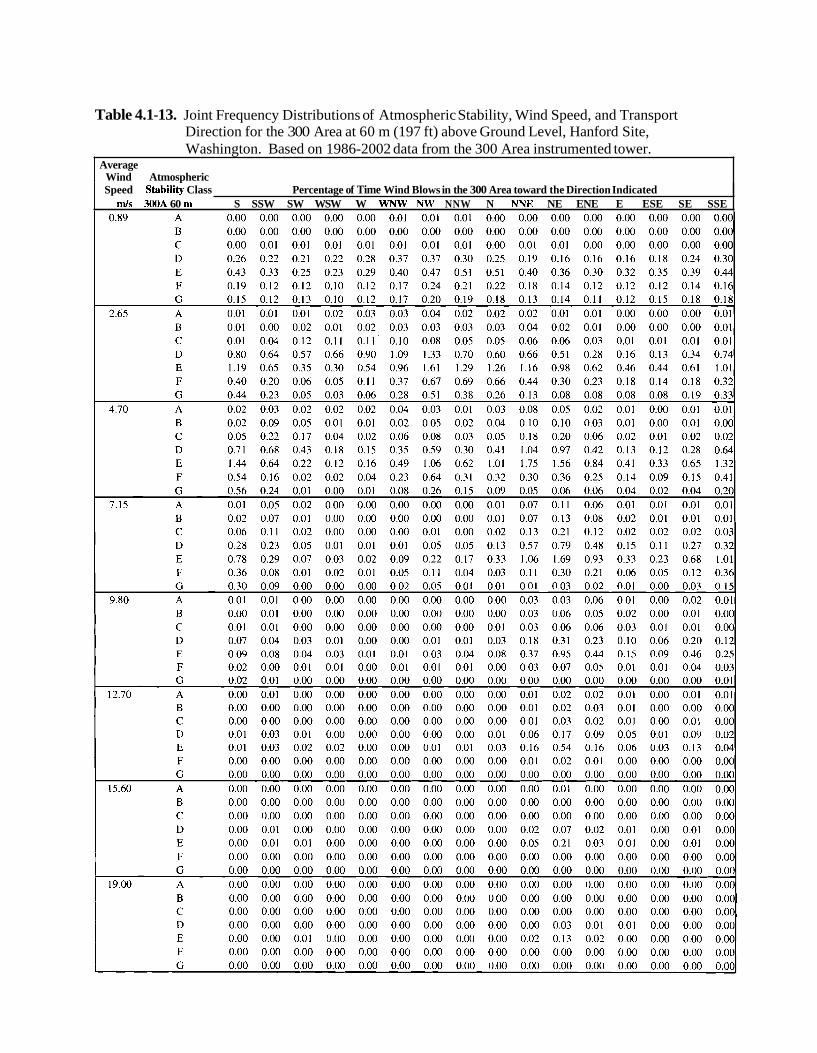
Table 4.1-13. Joint Frequency Distributions of Atmospheric Stability, Wind Speed, and Transport Direction for the 300 Area at 60 m (197 ft) above Ground Level, Hanford Site, Washington. Based on 1986-2002 data from the 300 Area instrumented tower.
Average Wind Atmospheric Speed stability Class Percentage of Time Wind Blows in the 300 Area toward the Direction Indicated
mls 300A 60 m S SSW SW WSW W WNW NW NNW N NNE NE ENE E ESE SE SSE
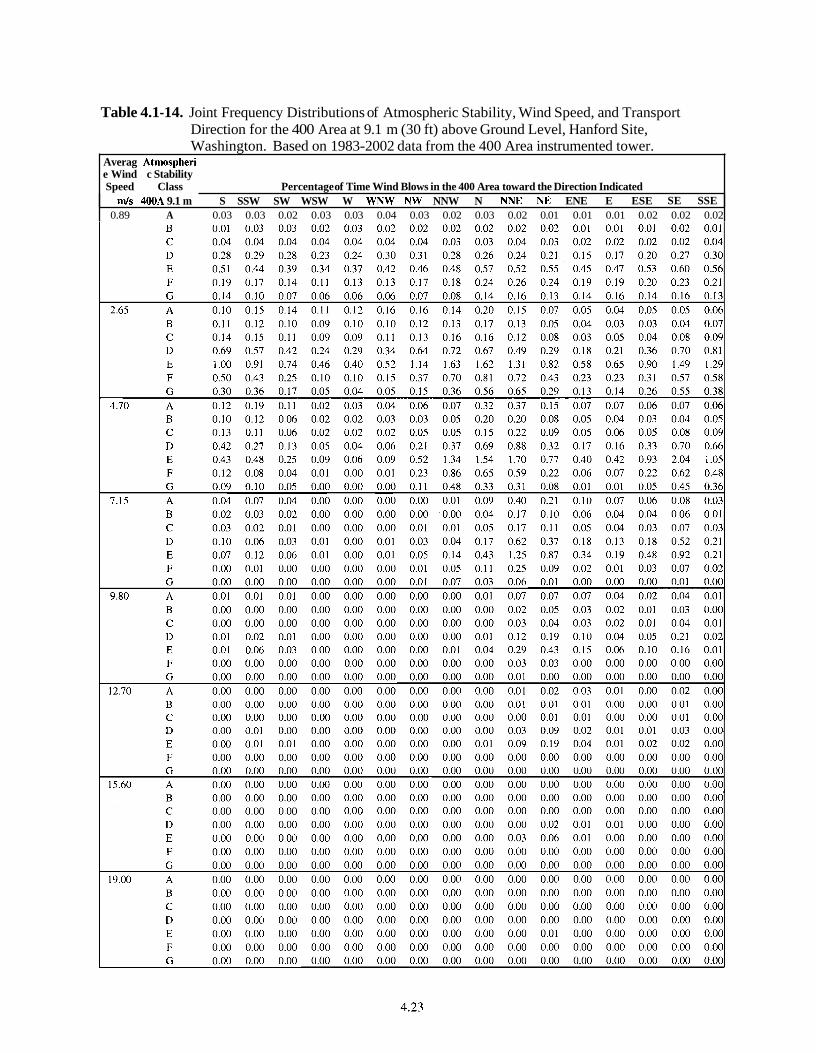
Table 4.1-14. Joint Frequency Distributions of Atmospheric Stability, Wind Speed, and Transport Direction for the 400 Area at 9.1 m (30 ft) above Ground Level, Hanford Site, Washington. Based on 1983-2002 data from the 400 Area instrumented tower.
Averag Atn~ospheri e Wind c Stability Speed Class Percentage of Time Wind Blows in the 400 Area toward the Direction Indicated
mls 400A 9.1 m S SSW SW WSW W WNW NW NNW N NNE NE ENE E ESE SE SSE 0.89 A 0.03 0.03 0.02 0.03 0.03 0.04 0.03 0.02 0.03 0.02 0.01 0.01 0.01 0.02 0.02 0.02
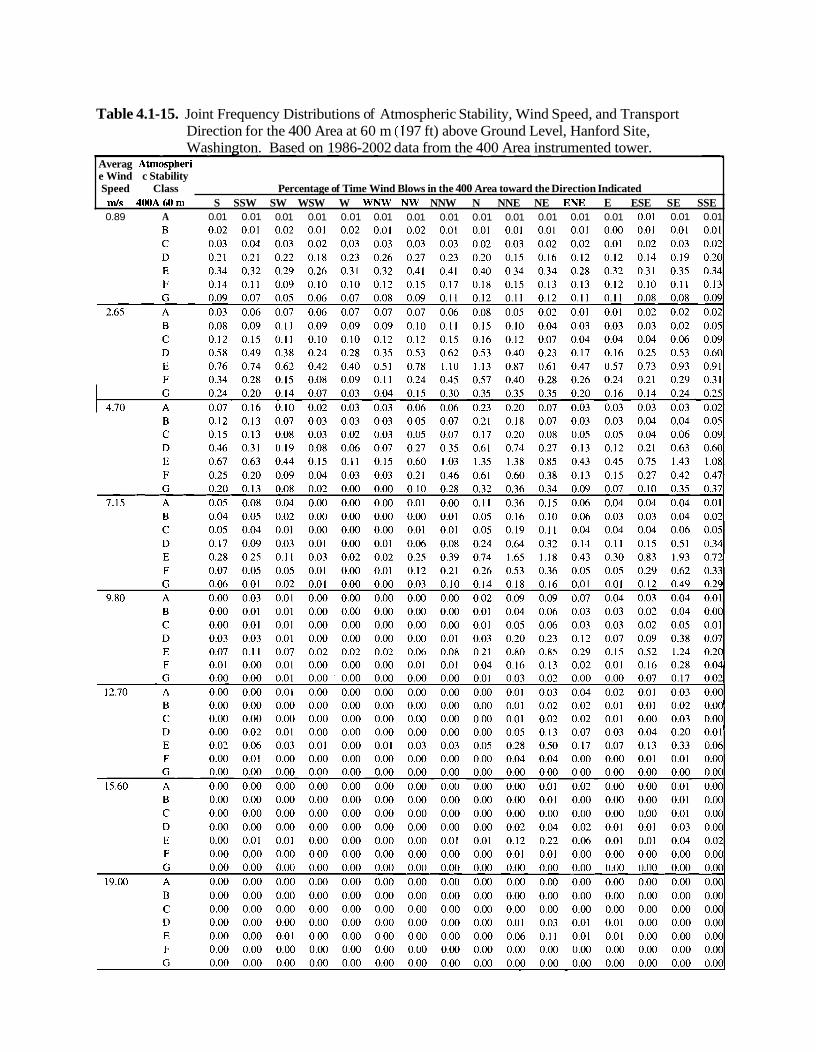
Table 4.1-15. Joint Frequency Distributions of Atmospheric Stability, Wind Speed, and Transport Direction for the 400 Area at 60 m ( 1 97 ft) above Ground Level, Hanford Site, Washington. Based on 1986-2002 data from the 400 Area instrumented tower.
Averag Atmospheri e Wind c Stability Speed Class Percentage of Time Wind Blows in the 400 Area toward the Direction Indicated
d s 400A60m S SSW SW WSW W WNW NW NNW N NNE NE ENE E ESE SE SSE 0.89 A 0.01 0.01 0.01 0.01 0.01 0.01 0.01 0.01 0.01 0.01 0.01 0.01 0.01 0.01 0.01 0.01
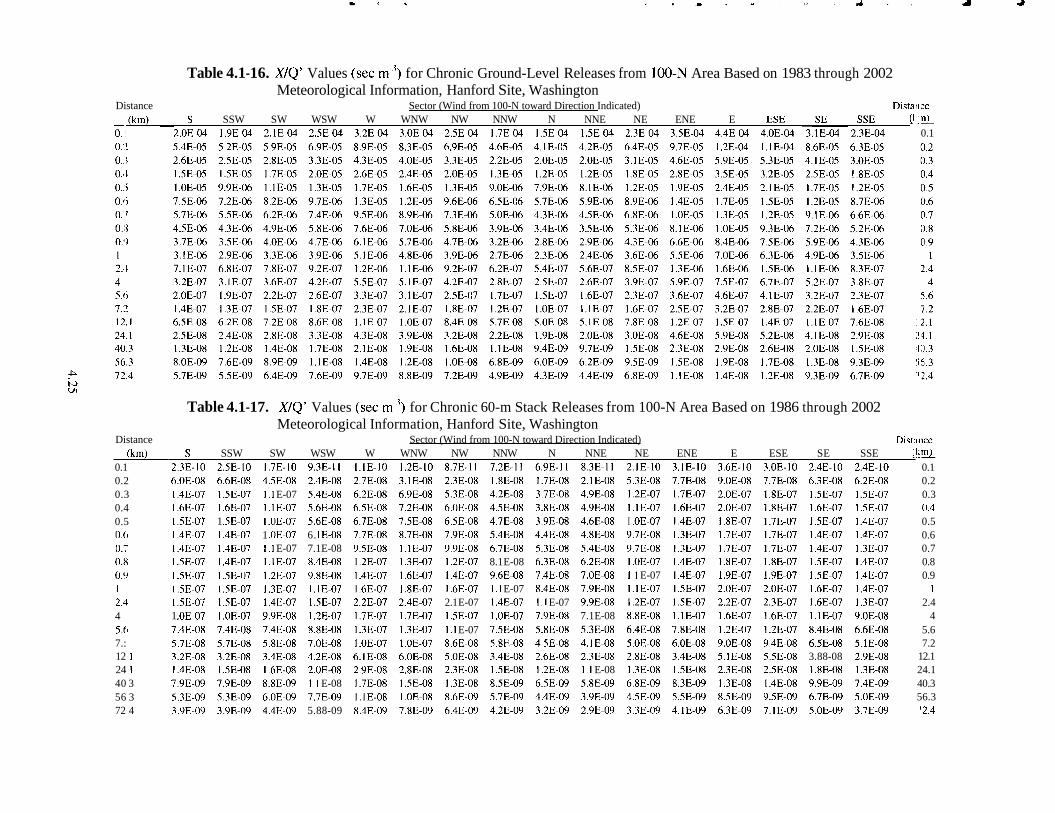
Distance
Distance
(km) 0.1 0.2 0.3 0.4 0.5 0.6 0.: 0.8 0.q 1 2.4. 4 5.f~ 7.: 12 1 24 1 40 3 56 3 72 4
Table 4.1-16. XIQ' Values (sec m-3) for Chronic Ground-Level Releases from 100-N Area Based on 1983 through 2002 Meteorological Information, Hanford Site, Washington
Sector (Wind from 100-N toward Direction Indicated) Distar~ce S SSW SW WSW W WNW NW NNW N NNE NE ENE E ESE SE SSE (I:!*
2.OE-04 1.9E-04 2.lE-04 2.58-04 3.28-04 3.OE-04 2.5E-04 1.7E-04 1.5E-04 1.5E-04 2.38-04 3.5E-04 4.4E-04 4.0E-04 3.1E-04 2.3E-04 0.1
Table 4.1-17. XIQ' Values (sec m-3) for Chronic 60-m Stack Releases from 100-N Area Based on 1986 through 2002 Meteorological Information, Hanford Site, Washington
Sector (Wind from 100-N toward Direction Indicated) Dist.lnce S SSW SW WSW W WNW NW NNW N NNE NE ENE E ESE SE SSE (!:a
2.3E-10 2.5E-I0 1.7E-I0 9.3E-ll l.lE-10 1.2E-10 8.7E-ll 7.2E-11 6.9E-ll 8.3E-ll 2.IE-10 3.1E-10 3.6E-10 3.OE-I0 2.4E-10 2.4E-10 0.1 6.OE-08 6.68-08 4.5E-08 2.4E-08 2.7E-08 3.1E-08 2.38-08 1.8E-08 1.7E-08 2.IE-08 5.3E-08 7.78-08 9.OE-08 7.7E-08 6.38-08 6.2E-08 0.2 1.4E-07 1 .5E-07 I. l E-07 5.48-08 6.2E-08 6.98-08 5.38-08 4.2E-08 3.78-08 4.9E-08 1.2E-07 1.7E-07 2.OE-07 1.8E-07 1.5E-07 1.5E-07 0.3 1.6E-07 1.6E-07 l .lE-07 5.68-08 6.58-08 7.28-08 6.OE-08 4.5E-08 3.88-08 4.9E-08 l .lE-07 1.6E-07 2.OE-07 1.8E-07 1.6E-07 1.5E-07 0.4 1.5E-07 1 .5E-07 1.OE-07 5.68-08 6.78-08 7.58-08 6.58-08 4.7E-08 3.98-08 4.6E-08 I .OE-07 1.4E-07 1.8E-07 1.7E-07 1.5E-07 1.4E-07 0.5 1.4E-07 1.4E-07 1 .OE-07 6. IE-08 7.78-08 8.7E-08 7.98-08 5.4E-08 4.48-08 4.8E-08 9.7E-08 1.3E-07 1.7E-07 1.7E-07 1.4E-07 1.4E-07 0.6 1.4E-07 1.4E-07 I. l E-07 7.1 E-08 9.5E-08 I. IE-07 9.98-08 6.78-08 5.38-08 5.4E-08 9.7E-08 1.3E-07 1.7E-07 1.7E-07 1.4E-07 1.3E-07 0.7 1 .5E-07 1.4E-07 l .lE-07 8.48-08 1.2E-07 1.3E-07 1.2E-07 8.1 E-08 6.38-08 6.28-08 1 .OE-07 1.4E-07 1.8E-07 1.8E-07 1.5E-07 1.4E-07 0.8 1 .5E-07 1.5E-07 1.2E-07 9.8E-08 1.4E-07 1.6E-07 1.4E-07 9.68-08 7.48-08 7.OE-08 l .I E-07 1.4E-07 1.9E-07 1.9E-07 1.5E-07 1.4E-07 0.9 1.5E-07 1.5E-07 1.3E-07 l .lE-07 1.6E-07 1.8E-07 1.6E-07 I. l E-07 8.48-08 7.9E-08 l .lE-07 1 .5E-07 2.OE-07 2.OE-07 1.6E-07 1.4E-07 1 1.5E-07 1 .5E-07 1.4E-07 1.5E-07 2.2E-07 2.4E-07 2.1 E-07 1.4E-07 I. l E-07 9.9E-08 1.2E-07 1.5E-07 2.2E-07 2.3E-07 1.6E-07 1.3E-07 2.4 1 .OE-07 1 .OE-07 9.98-08 1.2E-07 1.7E-07 1.7E-07 1.5E-07 1 .OE-07 7.9E-08 7.1 E-08 8.8E-08 1 .lE-07 1.6E-07 1.6E-07 l .lE-07 9.OE-08 4 7.4E-08 7.48-08 7.48-08 8.88-08 1.3E-07 1.3E-07 I. l E-07 7.5E-08 5.88-08 5.38-08 6.48-08 7.88-08 1.2E-07 1.2E-07 8.48-08 6.6E-08 5.6 5.7E-08 5.78-08 5.8E-08 7.OE-08 1.OE-07 1.OE-07 8.68-08 5.88-08 4.58-08 4.1E-08 5.08-08 6.0E-08 9.OE-08 9.48-08 6.5E-08 5.1E-08 7.2 3.28-08 3.28-08 3.48-08 4.28-08 6.IE-08 6.OE-08 5.0E-08 3.48-08 2.68-08 2.38-08 2.8E-08 3.48-08 5.1E-08 5.5E-08 3.88-08 2.9E-08 12.1 1.4E-08 1.5E-08 1.6E-08 2.OE-08 2.98-08 2.88-08 2.38-08 1.5E-08 1.2E-08 l .I E-08 1.3E-08 1.5E-08 2.38-08 2.5E-08 1.8E-08 1.3E-08 24.1 7.98-09 7.9E-09 8.88-09 1 .I E-08 1.7E-08 1.5E-08 1.3E-08 8.58-09 6.58-09 5.8E-09 6.8E-09 8.38-09 1.3E-08 1.4E-08 9.98-09 7.4E-09 40.3 5.38-09 5.38-09 6.OE-09 7.78-09 l.lE-08 1.OE-08 8.68-09 5.7E-09 4.48-09 3.98-09 4.58-09 5.5E-09 8.5E-09 9.58-09 6.78-09 5.OE-09 56.3 3.9E-09 3.98-09 4.4E-09 5.88-09 8.4E-09 7.8E-09 6.4E-09 4.28-09 3.2E-09 2.9E-09 3.3E-09 4.1E-09 6.38-09 7.1E-09 5.OE-09 3.7E-09 12.4
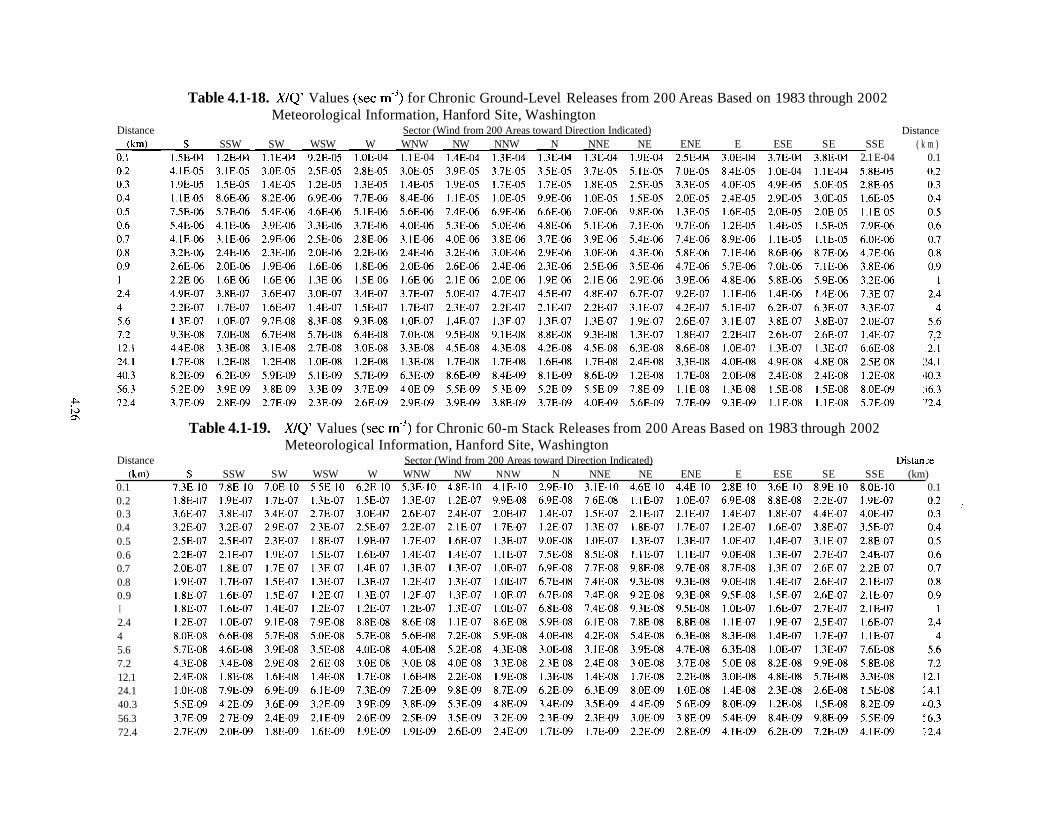
Distance
Distance (km)
0.1 0.2 0.3 0.4 0.5 0.6 0.7 0.8 0.9 I 2.4 4 5.6 7.2 12.1 24.1 40.3 56.3 72.4
Table 4.1-18. XIQ' Values (sec m-7 for Chronic Ground-Level Releases from 200 Areas Based on 1983 through 2002 Meteorological Information, Hanford Site, Washington
Sector (Wind from 200 Areas toward Direction Indicated) Distance S SSW SW WSW W WNW NW NNW N NNE NE ENE E ESE SE SSE ( k m )
1.58-04 1.2E-04 l .lE-04 9.2E-05 1 .OE-04 1.1 E-04 1.4E-04 1.3E-04 1.3E-04 1.3E-04 1.9E-04 2.58-04 3.OE-04 3.78-04 3.88-04 2.1 E-04 0.1
Table 4.1-19. XIQ' Values (sec m-7 for Chronic 60-m Stack Releases from 200 Areas Based on 1983 through 2002 Meteorological Information, Hanford Site, Washington
Sector (Wind from 200 Areas toward Direction Indicated) Distan,:e S SSW SW WSW W WNW NW NNW N NNE NE ENE E ESE SE SSE (km)
7.3E-I0 7.8E-10 7.OE-10 5.5E-10 6.2E-I0 5.3E-10 4.8E-10 4.IE-10 2.9E-I0 3.1E-I0 4.6E-I0 4.4E-10 2.8E-I0 3.6E-10 8.9E-10 8.OE-10 0.1
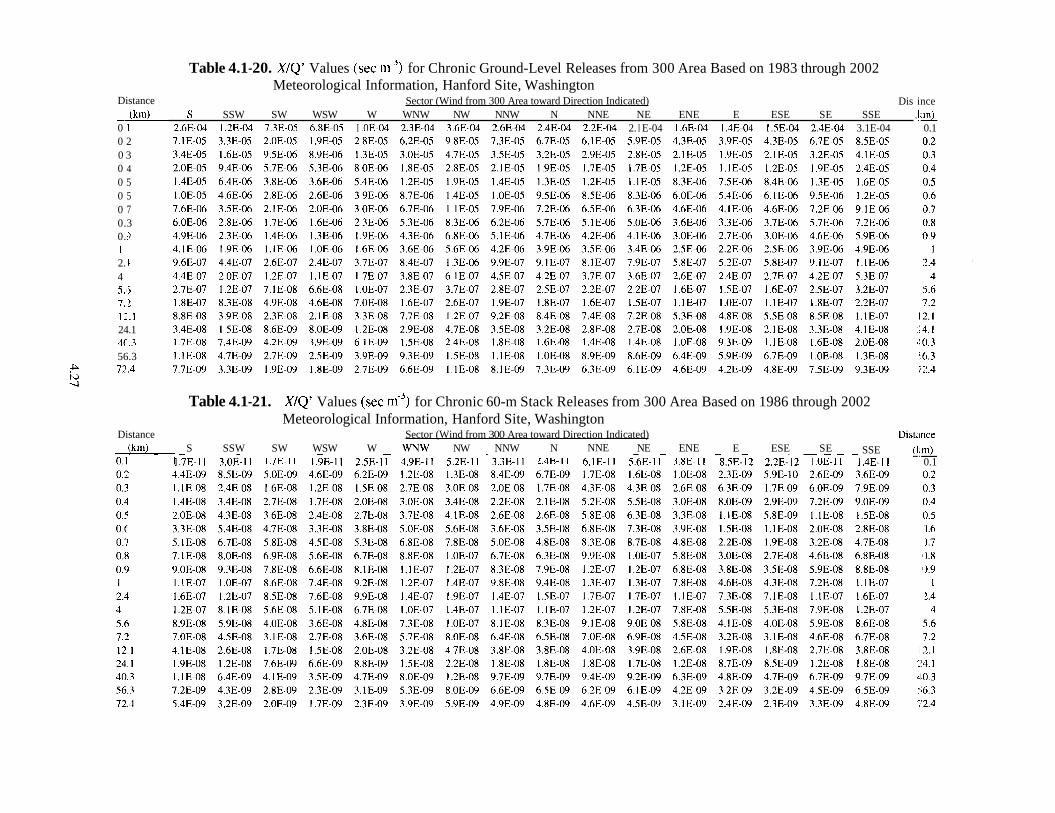
Distance
(km) -- 0 1 0 2 0 3 0 4 0 5 0 5 0 7 0.3 0. S 1 2. $
4 5.5 7. t 15.1 24.1 4( .3 56.3
Distance
Table 4.1-20. XIQ' Values (sec m-7 for Chronic Ground-Level Releases from 300 Area Based on 1983 through 2002 Meteorological Information, Hanford Site, Washington
Sector (Wind from 300 Area toward Direction Indicated) Dis ince S SSW SW WSW W WNW NW NNW N NNE NE ENE E ESE SE SSE , I c m )
2.6E-04 1.2E-04 7.38-05 6.88-05 I .OE-04 2.3E-04 3.6E-04 2.68-04 2.48-04 2.2E-04 2. I E-04 1.6E-04 1.4E-04 1.5E-04 2.48-04 3.1 E-04 0.1
Table 4.1-21. XIQ' Values (sec m-3) for Chronic 60-m Stack Releases from 300 Area Based on 1986 through 2002 Meteorological Information, Hanford Site, Washington
Sector (Wind from 300 Area toward Direction Indicated) Distance S SSW SW WSW W WNW NW NNW N NNE NE ENE E ESE SE SSE (ljm)
1.7E-ll 3.OE-ll 1.7E-I1 1.9E-ll 2.5E-ll 4.9E-11 5.2E-ll 3.3E-ll 2.4E-I1 6.1E-11 5.6E-ll 3.8E-I1 8.5E-12 2.2E-12 1.OE-11 1.4E-ll 0.1
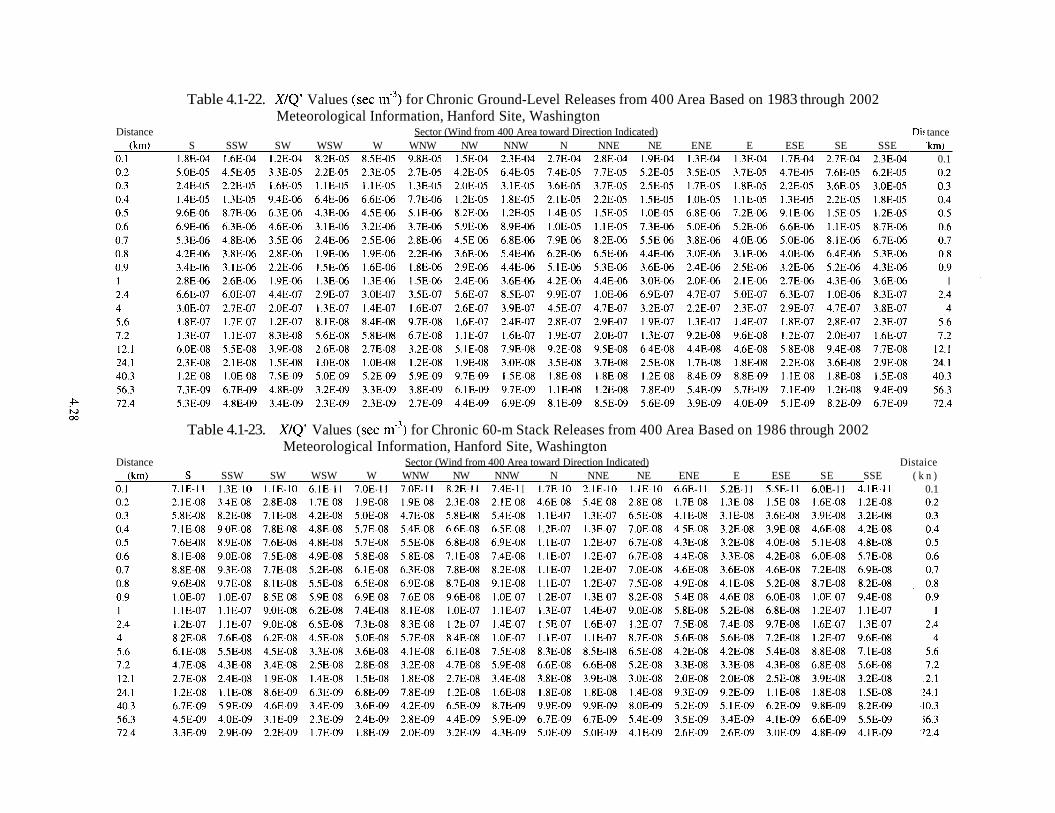
Distance
Distance
Table 4.1-22. XIQ' Values (sec m-3) for Chronic Ground-Level Releases from 400 Area Based on 1983 through 2002 Meteorological Information, Hanford Site, Washington
Sector (Wind from 400 Area toward Direction Indicated) Di: tance S SSW SW WSW W WNW NW NNW N NNE NE ENE E ESE SE SSE rkm)
1.8E-04 1.6E-04 1.2E-04 8.28-05 8.58-05 9.8E-05 1.5E-04 2.3E-04 2.78-04 2.8E-04 1.9E-04 1.3E-04 1.3E-04 1.7E-04 2.7E-04 2.3E-04 0.1
Table 4.1-23. XIQ' Values (sec m-7 for Chronic 60-m Stack Releases from 400 Area Based on 1986 through 2002 Meteorological Information, Hanford Site, Washington
Sector (Wind from 400 Area toward Direction Indicated) Distaice S SSW SW WSW W WNW NW NNW N NNE NE ENE E ESE SE SSE ( k n )
7.1E-I1 1.3E-I0 1.IE-I0 6.1E-ll 7.OE-ll 7.OE-ll 8.2E-ll 7.4E-I I 1.7E-I0 2.1E-10 l.lE-10 6.6E-ll 5.2E-ll 5.5E-ll 6.OE-11 4.1E-11 0.1
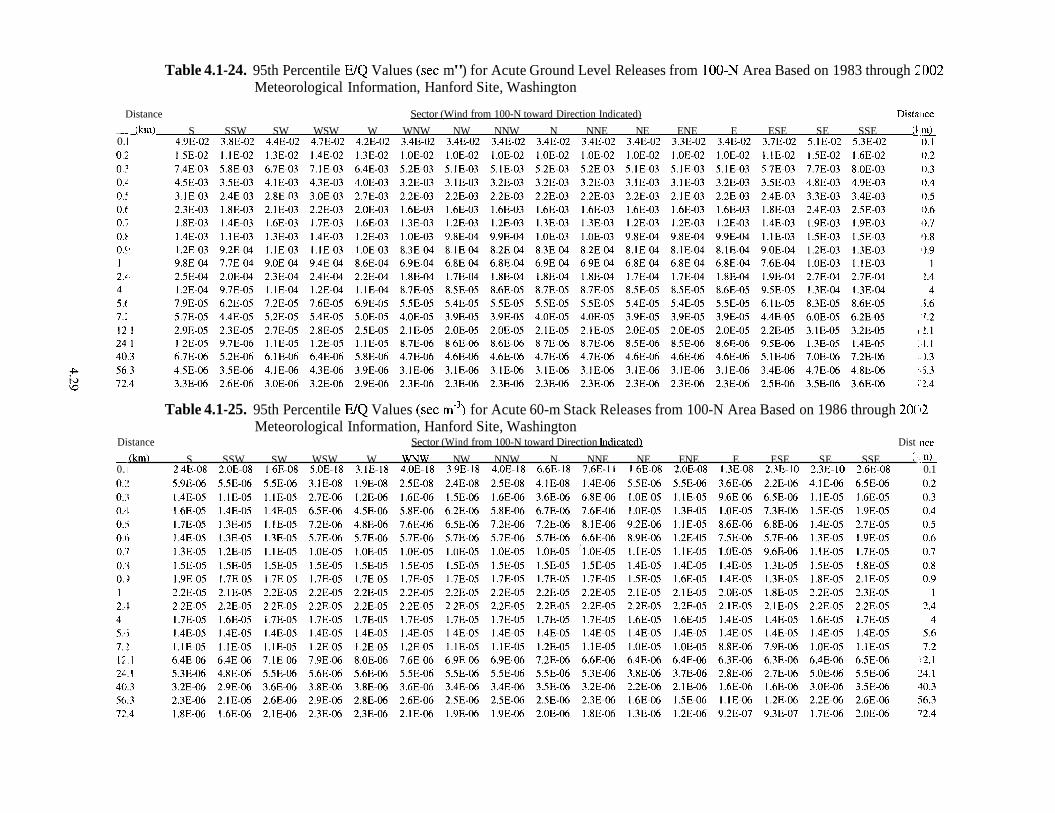
Table 4.1-24. 95th Percentile E/Q Values (sec m") for Acute Ground Level Releases from 100-N Area Based on 1983 through Z.002 Meteorological Information, Hanford Site, Washington
Distance Sector (Wind from 100-N toward Direction Indicated) Distar~ce
- ikm) S SSW SW WSW W WNW NW NNW N NNE NE ENE E ESE SE SSE ik.!p 0. I 4.98-02 3.88-02 4.48-02 4.7E-02 4.28-02 3.48-02 3.4E-02 3.48-02 3.4E-02 3.48-02 3.4E-02 3.38-02 3.48-02 3.78-02 5.1E-02 5.38-02 {).I
Table 4.1-25. 95th Percentile E/Q Values (sec m'3) for Acute 60-m Stack Releases from 100-N Area Based on 1986 through 20(:12 Meteorological Information, Hanford Site, Washington
Distance Sector (Wind from 100-N toward Direction Indicated) Dist 111ce
- (km) S SSW SW WSW W WNW NW NNW N NNE NE ENE E ESE SE SSE 0. I 2.48-08 2.OE-08 1.6E-08 5.OE-I8 3.1E-I8 4.OE-I8 3.98-18 4.OE-I8 6.6E-18 7.6E-l l 1.6E-08 2.OE-08 1.3E-08 2.3E-I0 2.3E-10 2.68-08 0.1
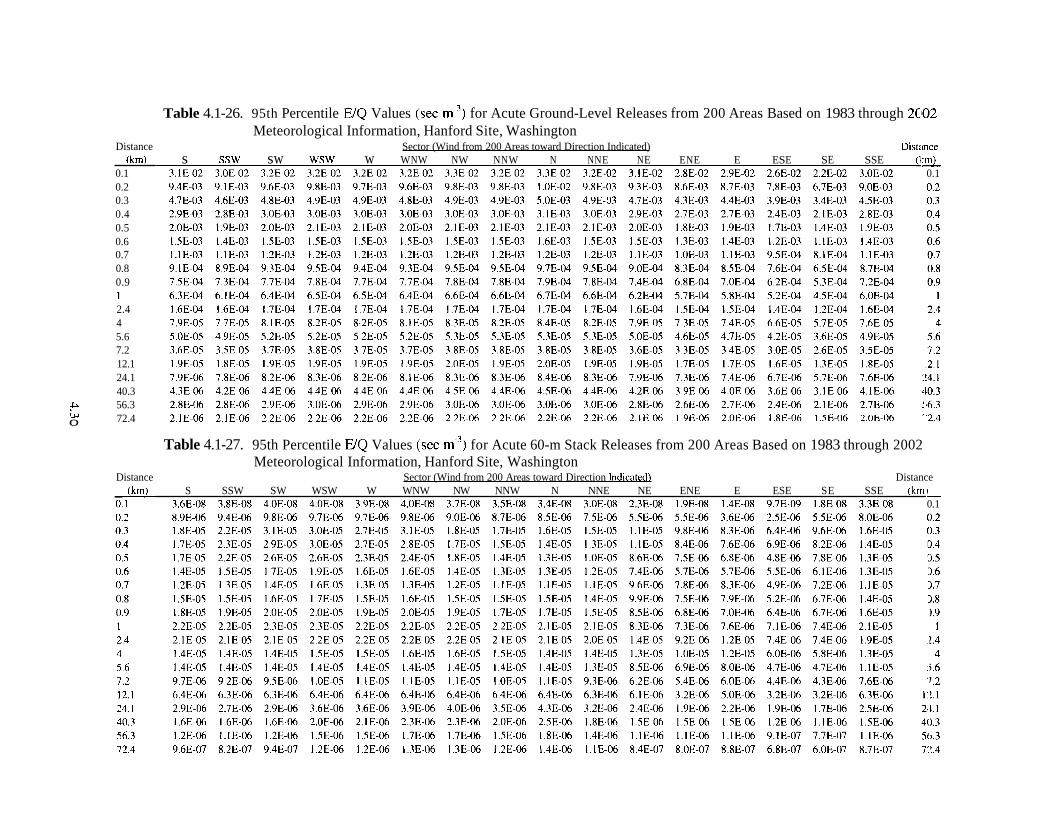
Distance (km)
0.1 0.2 0.3 0.4 0.5 0.6 0.7 0.8 0.9 1 2.4 4 5.6 7.2 12.1 24.1 40.3
c 56.3
0 72.4
Distance
Table 4.1-26. 95th Percentile EIQ Values (sec m-3) for Acute Ground-Level Releases from 200 Areas Based on 1983 through 2Cl02 Meteorological Information, Hanford Site, Washington
Sector (Wind from 200 Areas toward Direction Indicated) Distimce s ssw sw wsw w WNW NW NNW N NNE NE ENE E ESE SE SSE Q:I
3.1E-02 3.0E-02 3.2E-02 3.2E-02 3.2E-02 3.2E-02 3.38-02 3.28-02 3.3E-02 3.28-02 3.IE-02 2.88-02 2.YE-02 2.68-02 2.2E-02 3.0E-02 0.1
Table 4.1-27. 95th Percentile EfQ Values (sec m-7 for Acute 60-m Stack Releases from 200 Areas Based on 1983 through 2002 Meteorological Information, Hanford Site, Washington
Sector (Wind from 200 Areas toward Direction Indicated) Distance S SSW SW WSW W WNW NW NNW N NNE NE ENE E ESE SE SSE ( k m ~
3.6E-08 3.88-08 4.OE-08 4.OE-08 3.98-08 4.OE-08 3.78-08 3.58-08 3.48-08 3.0E-08 2.38-08 1.9E-08 1.4E-08 9.7E-09 1.8E-08 3.38-08 0.1
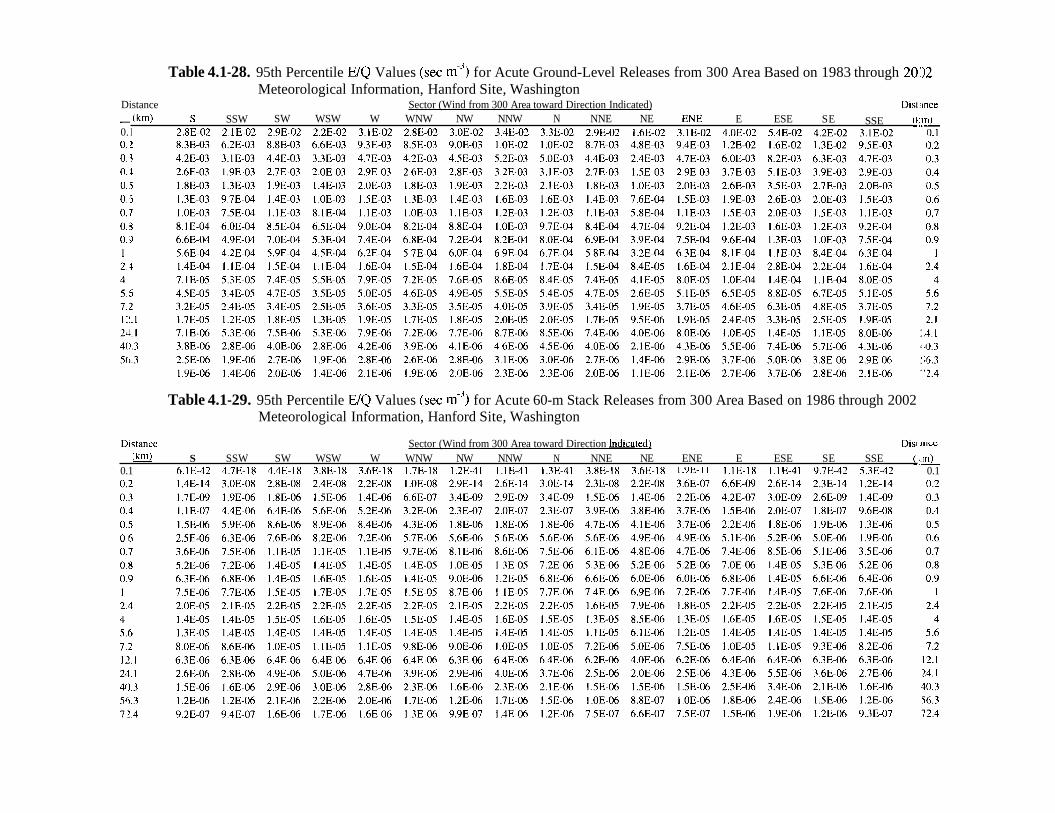
Table 4.1-28. 95th Percentile E/Q Values (sec m-3) for Acute Ground-Level Releases from 300 Area Based on 1983 through 2032 Meteorological Information, Hanford Site, Washington
Distance Sector (Wind from 300 Area toward Direction Indicated) Dist:~nce -. (km) S SSW SW WSW W WNW NW NNW N NNE NE ENE E ESE SE SSE ():!I 0. I 2.88-02 2.1E-02 2.98-02 2.28-02 3.1E-02 2.88-02 3.OE-02 3.48-02 3.38-02 2.98-02 1.6E-02 3.1E-02 4.OE-02 5.48-02 4.2E-02 3.1E-02 0.1
Table 4.1-29. 95th Percentile E/Q Values (sec m-9 for Acute 60-m Stack Releases from 300 Area Based on 1986 through 2002 Meteorological Information, Hanford Site, Washington
Dlstance Sector (Wind from 300 Area toward Direction Indicated) Dis~ ,~nce (km) S SSW SW WSW W WNW NW NNW N NNE NE ENE E ESE SE SSE (:m)
0.1 6.18-42 4.78-18 4.48-18 3.88-18 3.68-18 1.7E-I8 1.2E-41 l.lE-41 1.3E-41 3.88-18 3.68-18 1.9E-I1 1.lE-18 l.lE-41 9.7E-42 5.3E-42 0.1
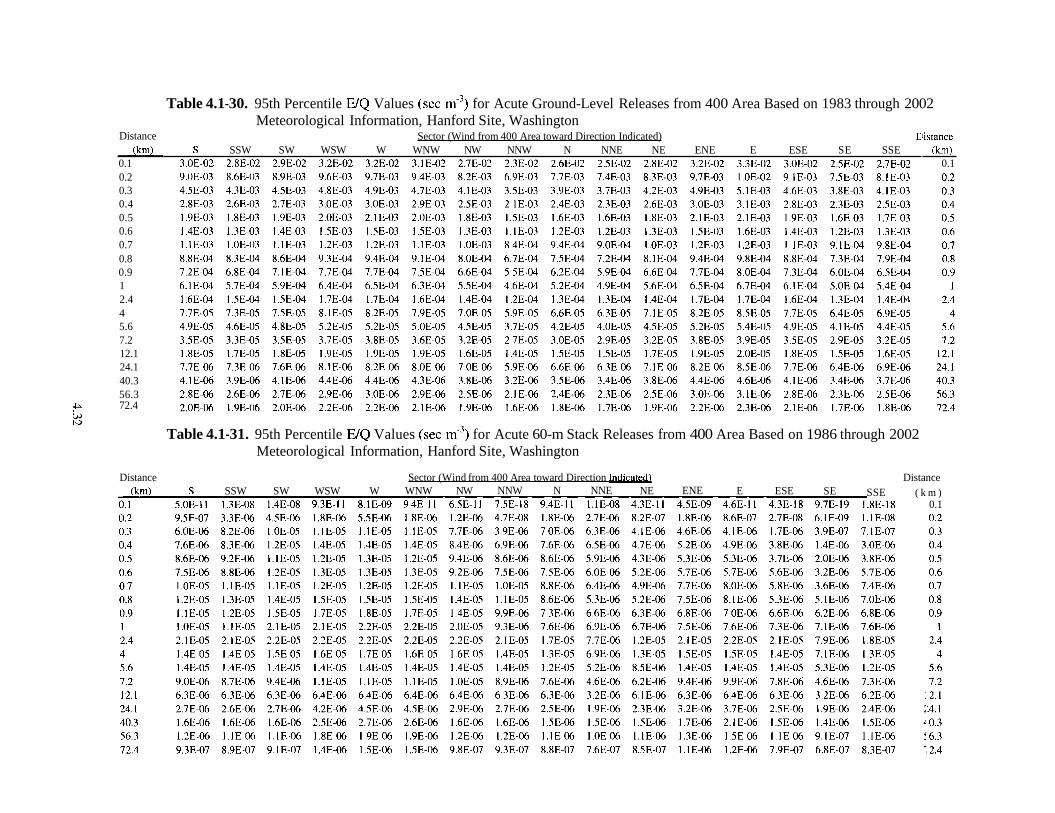
Distance (km) 0.1 0.2 0.3 0.4 0.5 0.6 0.7 0.8 0.9 1 2.4 4 5.6 7.2 12.1 24.1 40.3 56.3
P 72.4 L, h)
Distance
Table 4.1-30. 95th Percentile E/Q Values (sec m-') for Acute Ground-Level Releases from 400 Area Based on 1983 through 2002 Meteorological Information, Hanford Site, Washington
Sector (Wind from 400 Area toward Direction Indicated) tlistance S SSW SW WSW W WNW NW NNW N NNE NE ENE E ESE SE SSE (km)
3.OE-02 2.8E-02 2.98-02 3.28-02 3.28-02 3.1E-02 2.78-02 2.3E-02 2.68-02 2.58-02 2.88-02 3.2E-02 3.38-02 3.OE-02 2.58-02 2.78-02 0.1
Table 4.1-31. 95th Percentile E/Q Values (sec m-') for Acute 60-m Stack Releases from 400 Area Based on 1986 through 2002 Meteorological Information, Hanford Site, Washington
Sector (Wind from 400 Area toward Direction Indicated) Distance S SSW SW WSW W WNW NW NNW N NNE NE ENE E ESE SE SSE ( k m )
S.0E-l l 1.3E-08 1.4E-08 9.3E-I1 8.1E-09 9.4E-I1 6.5E-l l 7.58-18 9.4E-l l l .lE-08 4.3E-1 l 4.5E-09 4.6E-11 4.3E-18 9.78-19 1.8E-18 0.1
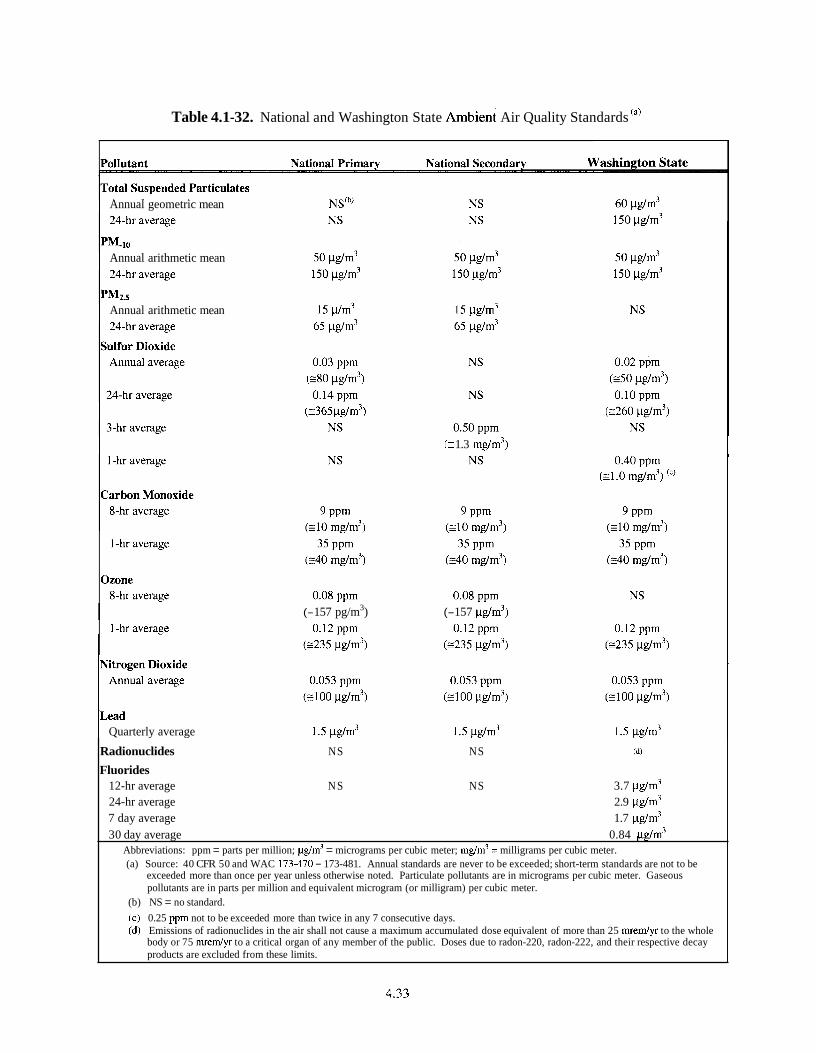
Table 4.1-32. National and Washington State ~ rnb ien t Air Quality Standards (")
Annual geometric mean
Annual arithmetic mean
Annual arithmetic mean
(=365pg/m")
(2 1.3 mg/m")
(- 157 pg/m3) (- 1 57 pg/m3)
Quarterly average
Radionuclides NS NS (d)
Fluorides 12-hr average NS NS 3.7 pg/m3 24-hr average 2.9 pg/m3 7 day average 1.7 pg/mS 30 day average 0.84 pg/m3
Abbreviations: ppm = parts per million; pg/m3 = micrograms per cubic meter; mg/m7 = milligrams per cubic meter. (a) Source: 40 CFR 50 and WAC 173-470 - 173-481. Annual standards are never to be exceeded; short-term standards are not to be
exceeded more than once per year unless otherwise noted. Particulate pollutants are in micrograms per cubic meter. Gaseous pollutants are in parts per million and equivalent microgram (or milligram) per cubic meter.
(b) NS = no standard.
(c) 0.25 ppm not to be exceeded more than twice in any 7 consecutive days. (d) Emissions of radionuclides in the air shall not cause a maximum accumulated dose equivalent of more than 25 mremlyr to the whole
body or 75 mredyr to a critical organ of any member of the public. Doses due to radon-220, radon-222, and their respective decay products are excluded from these limits.
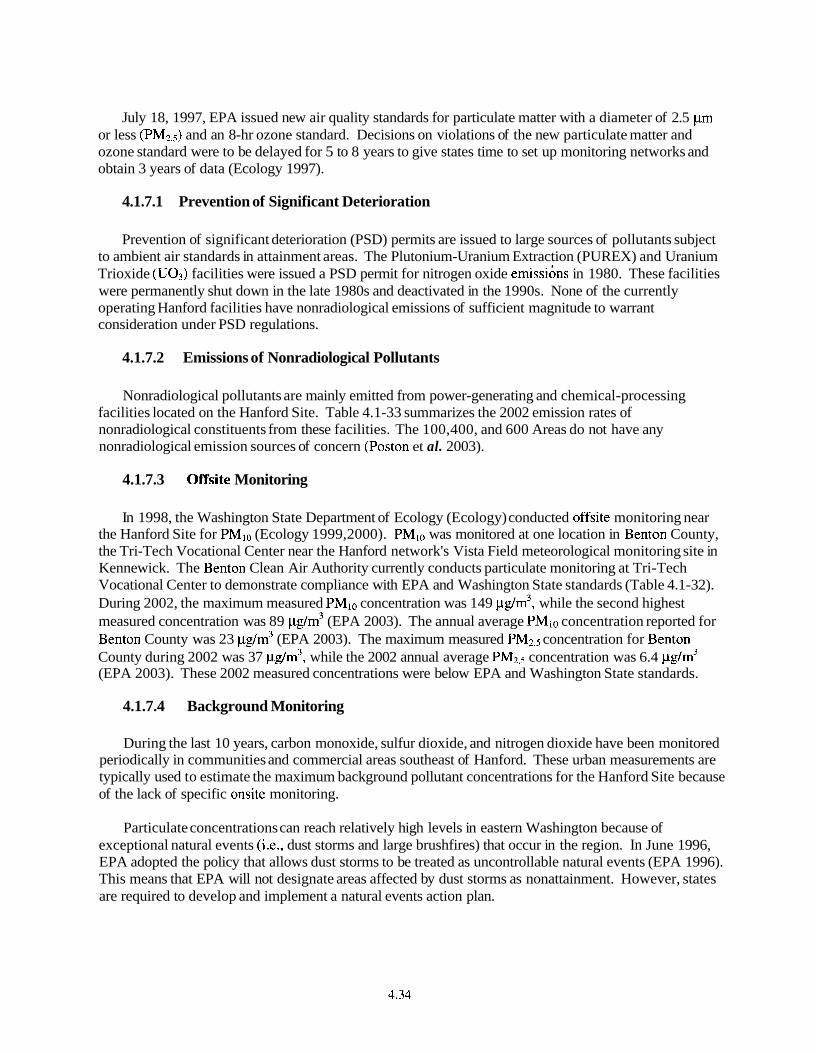
July 18, 1997, EPA issued new air quality standards for particulate matter with a diameter of 2.5 pm or less (PM2.5) and an 8-hr ozone standard. Decisions on violations of the new particulate matter and ozone standard were to be delayed for 5 to 8 years to give states time to set up monitoring networks and obtain 3 years of data (Ecology 1997).
4.1.7.1 Prevention of Significant Deterioration
Prevention of significant deterioration (PSD) permits are issued to large sources of pollutants subject to ambient air standards in attainment areas. The Plutonium-Uranium Extraction (PUREX) and Uranium Trioxide (U03) facilities were issued a PSD permit for nitrogen oxide emissibs in 1980. These facilities were permanently shut down in the late 1980s and deactivated in the 1990s. None of the currently operating Hanford facilities have nonradiological emissions of sufficient magnitude to warrant consideration under PSD regulations.
4.1.7.2 Emissions of Nonradiological Pollutants
Nonradiological pollutants are mainly emitted from power-generating and chemical-processing facilities located on the Hanford Site. Table 4.1-33 summarizes the 2002 emission rates of nonradiological constituents from these facilities. The 100,400, and 600 Areas do not have any nonradiological emission sources of concern (Poston et al. 2003).
4.1.7.3 Offsite Monitoring
In 1998, the Washington State Department of Ecology (Ecology) conducted offsite monitoring near the Hanford Site for PMlo (Ecology 1999,2000). PMlo was monitored at one location in Benton County, the Tri-Tech Vocational Center near the Hanford network's Vista Field meteorological monitoring site in Kennewick. The Benton Clean Air Authority currently conducts particulate monitoring at Tri-Tech Vocational Center to demonstrate compliance with EPA and Washington State standards (Table 4.1-32). During 2002, the maximum measured PMlo concentration was 149 yglm3, while the second highest measured concentration was 89 pg/m3 (EPA 2003). The annual average PMlo concentration reported for Benton County was 23 pg/m3 (EPA 2003). The maximum measured PM2.5 concentration for Benton County during 2002 was 37 pg/m" while the 2002 annual average PM2.5 concentration was 6.4 pg/m3 (EPA 2003). These 2002 measured concentrations were below EPA and Washington State standards.
4.1.7.4 Background Monitoring
During the last 10 years, carbon monoxide, sulfur dioxide, and nitrogen dioxide have been monitored periodically in communities and commercial areas southeast of Hanford. These urban measurements are typically used to estimate the maximum background pollutant concentrations for the Hanford Site because of the lack of specific onsite monitoring.
Particulate concentrations can reach relatively high levels in eastern Washington because of exceptional natural events (i.e., dust storms and large brushfires) that occur in the region. In June 1996, EPA adopted the policy that allows dust storms to be treated as uncontrollable natural events (EPA 1996). This means that EPA will not designate areas affected by dust storms as nonattainment. However, states are required to develop and implement a natural events action plan.
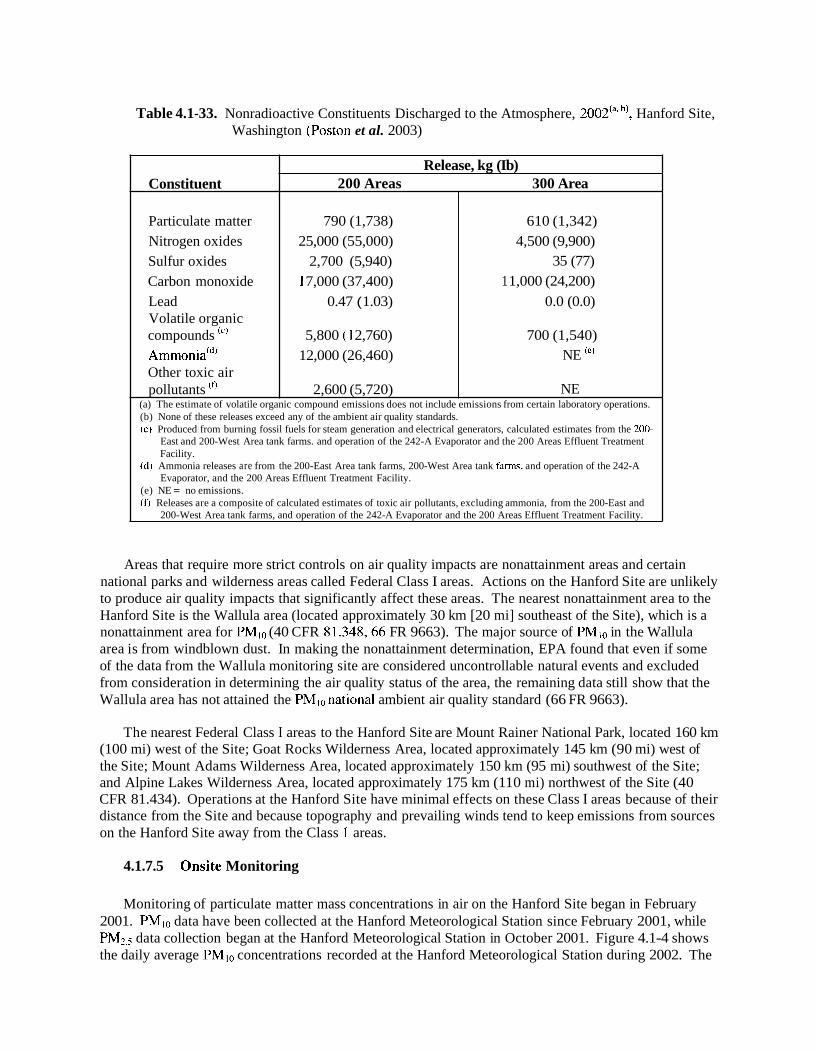
Table 4.1-33. Nonradioactive Constituents Discharged to the Atmosphere, 2002'" '), Hanford Site, Washington (Poston et al. 2003)
Areas that require more strict controls on air quality impacts are nonattainment areas and certain national parks and wilderness areas called Federal Class I areas. Actions on the Hanford Site are unlikely to produce air quality impacts that significantly affect these areas. The nearest nonattainment area to the Hanford Site is the Wallula area (located approximately 30 km [20 mi] southeast of the Site), which is a nonattainment area for PMlo (40 CFR 81.348,66 FR 9663). The major source of PMlo in the Wallula area is from windblown dust. In making the nonattainment determination, EPA found that even if some of the data from the Wallula monitoring site are considered uncontrollable natural events and excluded from consideration in determining the air quality status of the area, the remaining data still show that the Wallula area has not attained the PMlonational ambient air quality standard (66 FR 9663).
Constituent
Particulate matter Nitrogen oxides Sulfur oxides Carbon monoxide Lead Volatile organic compounds (') ~rnrnonia '~ ' Other toxic air pollutants '"
The nearest Federal Class I areas to the Hanford Site are Mount Rainer National Park, located 160 km (100 mi) west of the Site; Goat Rocks Wilderness Area, located approximately 145 km (90 mi) west of the Site; Mount Adams Wilderness Area, located approximately 150 km (95 mi) southwest of the Site; and Alpine Lakes Wilderness Area, located approximately 175 km (1 10 mi) northwest of the Site (40 CFR 81.434). Operations at the Hanford Site have minimal effects on these Class I areas because of their distance from the Site and because topography and prevailing winds tend to keep emissions from sources on the Hanford Site away from the Class 1 areas.
4.1.7.5 Onsite Monitoring
(a) The estimate of volatile organic compound emissions does not include emissions from certain laboratory operations. (b) None of these releases exceed any of the ambient air quality standards. (c) Produced from burning fossil fuels for steam generation and electrical generators, calculated estimates from the 200-
East and 200-West Area tank farms. and operation of the 242-A Evaporator and the 200 Areas Effluent Treatment Facility.
(d) Ammonia releases are from the 200-East Area tank farms, 200-West Area tank f m s , and operation of the 242-A Evaporator, and the 200 Areas Effluent Treatment Facility.
(e) NE = no emissions. (f) Releases are a composite of calculated estimates of toxic air pollutants, excluding ammonia, from the 200-East and
200-West Area tank farms, and operation of the 242-A Evaporator and the 200 Areas Effluent Treatment Facility.
Release, kg (Ib) 200 Areas 300 Area
Monitoring of particulate matter mass concentrations in air on the Hanford Site began in February 2001. PMlo data have been collected at the Hanford Meteorological Station since February 2001, while PM2,5 data collection began at the Hanford Meteorological Station in October 2001. Figure 4.1-4 shows the daily average PMlo concentrations recorded at the Hanford Meteorological Station during 2002. The
790 (1,738) 25,000 (55,000)
2,700 (5,940) 1 7,000 (37,400)
0.47 ( 1.03)
5,800 (1 2,760) 12,000 (26,460)
2,600 (5,720)
610 (1,342) 4,500 (9,900)
35 (77) 1 1,000 (24,200)
0.0 (0.0)
700 (1,540) NE 'e'
NE
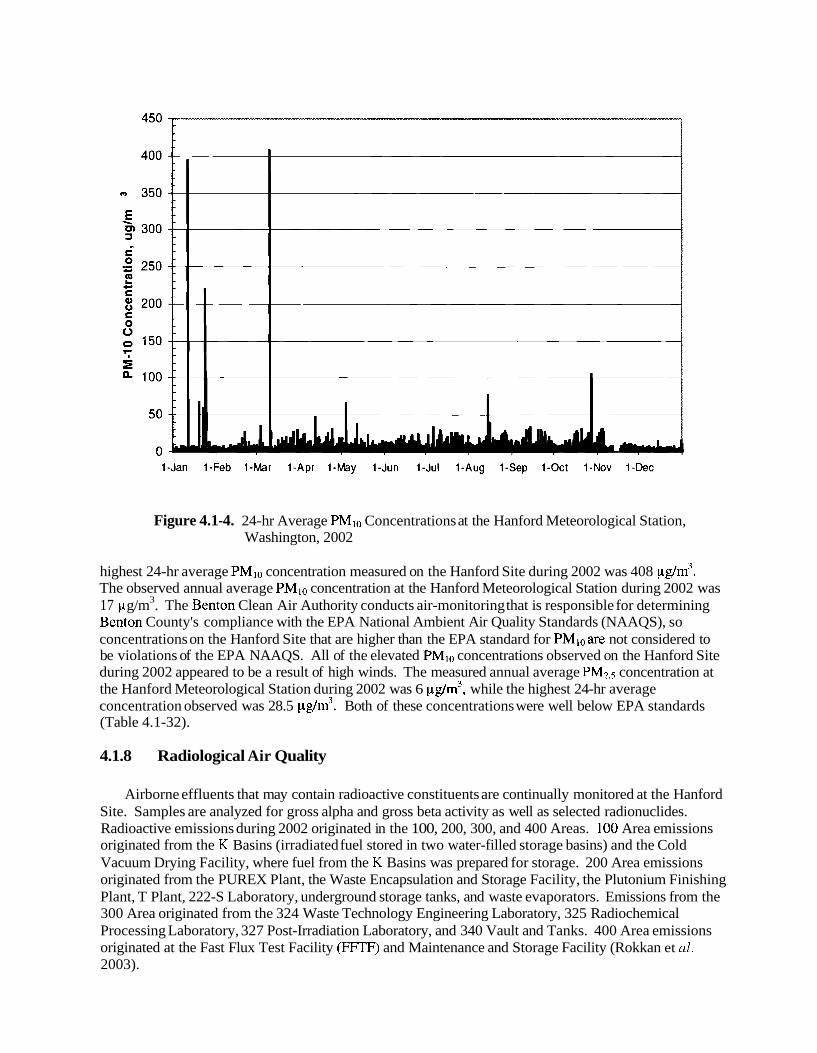
Figure 4.1-4. 24-hr Average PMlo Concentrations at the Hanford Meteorological Station, Washington, 2002
highest 24-hr average PMlo concentration measured on the Hanford Site during 2002 was 408 ~lg/rn~. The observed annual average PMlo concentration at the Hanford Meteorological Station during 2002 was 17 g/m3. The Benton Clean Air Authority conducts air-monitoring that is responsible for determining Benton County's compliance with the EPA National Ambient Air Quality Standards (NAAQS), so concentrations on the Hanford Site that are higher than the EPA standard for PMloare not considered to be violations of the EPA NAAQS. All of the elevated PMlo concentrations observed on the Hanford Site during 2002 appeared to be a result of high winds. The measured annual average PM2,5 concentration at the Hanford Meteorological Station during 2002 was 6 ~lg/rn~, while the highest 24-hr average concentration observed was 28.5 pg/m3. Both of these concentrations were well below EPA standards (Table 4.1-32).
4.1.8 Radiological Air Quality
Airborne effluents that may contain radioactive constituents are continually monitored at the Hanford Site. Samples are analyzed for gross alpha and gross beta activity as well as selected radionuclides. Radioactive emissions during 2002 originated in the 100, 200, 300, and 400 Areas. 100 Area emissions originated from the K Basins (irradiated fuel stored in two water-filled storage basins) and the Cold Vacuum Drying Facility, where fuel from the K Basins was prepared for storage. 200 Area emissions originated from the PUREX Plant, the Waste Encapsulation and Storage Facility, the Plutonium Finishing Plant, T Plant, 222-S Laboratory, underground storage tanks, and waste evaporators. Emissions from the 300 Area originated from the 324 Waste Technology Engineering Laboratory, 325 Radiochemical Processing Laboratory, 327 Post-Irradiation Laboratory, and 340 Vault and Tanks. 400 Area emissions originated at the Fast Flux Test Facility (FFTF) and Maintenance and Storage Facility (Rokkan et al. 2003).
4.1.8.1 Radiological Emissions
Standards for emissions of radionuclides from DOE facilities have been established by EPA (40 CFR Part 61) and Washington State (WAC 173-480 and WAC 246-247). Emissions may not exceed quantities that would result in a dose of 10 mrem in a year to a maximally exposed member of the public. A summary of radiological air emissions for 2002 is provided in Table 4.1-34.
4.1.8.2 Dose Assessments
In order to comply with the Clean Air Act (40 CFR 61, Subpart H), dose assessments are required to assure that no member of the public receives a dose greater than 10 mrem in a year. EPA requires the use of an approved computer model to calculate doses. During 2002, the estimated annual dose from radionuclide air point source emissions to a hypothetical maximally exposed individual (MEI) was 0.023 mrem. This calculated ME1 scenario occurred to a member of the public living near Sagemoor Road in Franklin County and was calculated using the EPA approved CAP88-PC computer model (EPA 2000). Model results were calculated using established standard parameters for the Hanford Site (Rokkan et al. 2003). A maximum dose to an offsite individual from point sources and fugitive emissions was also calculated using CAP88-PC. This dose calculation used environmental measurements to estimate diffuse and fugitive emissions and then modeled a total ME1 dose. For 2002, this maximum annual dose to an offsite individual occurred near Sagemoor Road in Franklin County and was 0.065 mrem.
Another maximally exposed individual dose is estimated annually to comply with DOE Order 5400.5 (DOE 1993b). This dose assessment uses a multi-media pathway assessment computer model known as GENII (Napier et al. 1998). During 2002, the annual dose to a hypothetical maximally exposed individual was estimated to be 0.022 mrem (Poston et. a1 2003). This ME1 dose was calculated for a person living in the Riverview area of Pasco in Franklin County. The annual ME1 dose for an individual living near Sagemoor Road was calculated to be 0.01 9 mrem using the GENII computer program.
4.1.8.3 Environmental Monitoring
Both the Surface Environmental Surveillance Project (SESP) and the near-facility environmental monitoring project conduct Hanford Site environmental monitoring. The SESP conducts monitoring at locations across the Hanford Site, as well as up and downwind locations. The near-facility monitoring project primarily collects samples near known effluent sources. Summaries of the 2002 monitoring data from both of these projects are available in the annual Hanford Site Environmental Report (Poston et. al. 2003). In general, the results from ambient monitoring supported the radiological effluent data shown in Table 4.1-34. For example, the 300 Area had the highest average tritium concentration measurements. Also, the 100 and 200 Areas had plutonium-239140 concentrations higher than other areas on and around the Hanford Site.
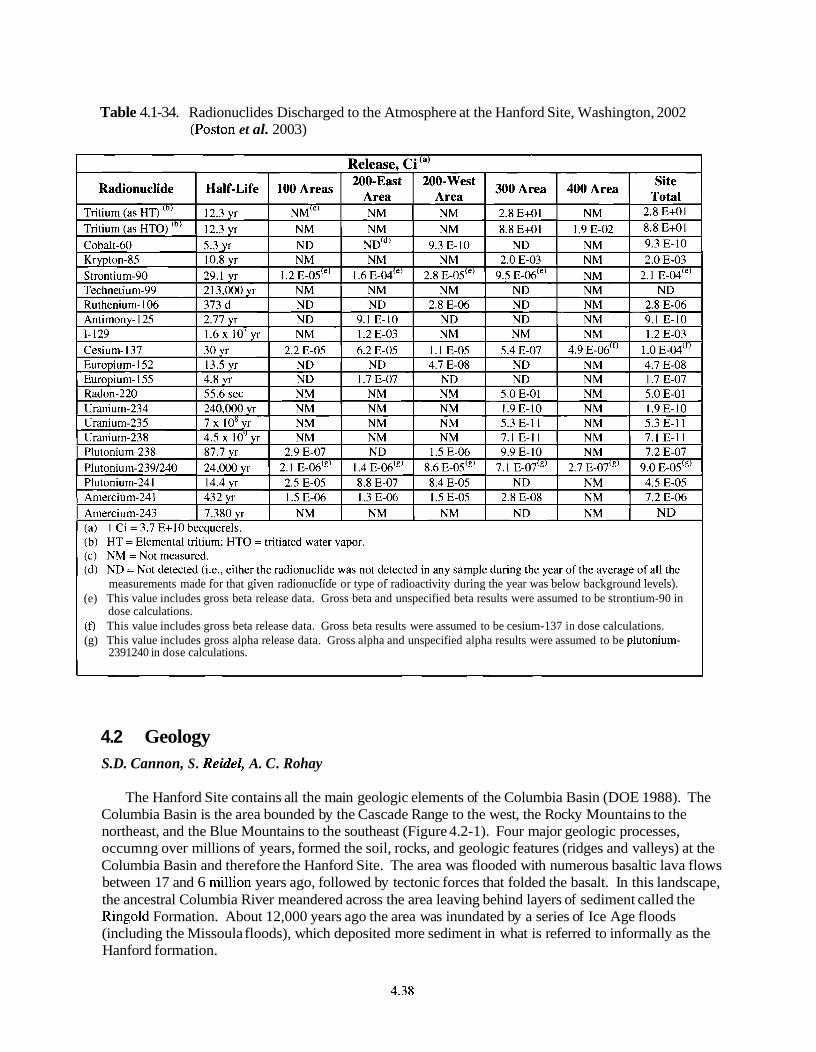
Table 4.1-34. Radionuclides Discharged to the Atmosphere at the Hanford Site, Washington, 2002 (Poston et al. 2003)
measurements made for that given radionuclide or type of radioactivity during the year was below background levels). (e) This value includes gross beta release data. Gross beta and unspecified beta results were assumed to be strontium-90 in
dose calculations. (f) This value includes gross beta release data. Gross beta results were assumed to be cesium-137 in dose calculations. (g) This value includes gross alpha release data. Gross alpha and unspecified alpha results were assumed to be plutonium-
2391240 in dose calculations.
4.2 Geology S.D. Cannon, S. Reidel, A. C. Rohay
The Hanford Site contains all the main geologic elements of the Columbia Basin (DOE 1988). The Columbia Basin is the area bounded by the Cascade Range to the west, the Rocky Mountains to the northeast, and the Blue Mountains to the southeast (Figure 4.2-1). Four major geologic processes, occumng over millions of years, formed the soil, rocks, and geologic features (ridges and valleys) at the Columbia Basin and therefore the Hanford Site. The area was flooded with numerous basaltic lava flows between 17 and 6 n~illion years ago, followed by tectonic forces that folded the basalt. In this landscape, the ancestral Columbia River meandered across the area leaving behind layers of sediment called the Ringold Formation. About 12,000 years ago the area was inundated by a series of Ice Age floods (including the Missoula floods), which deposited more sediment in what is referred to informally as the Hanford formation.
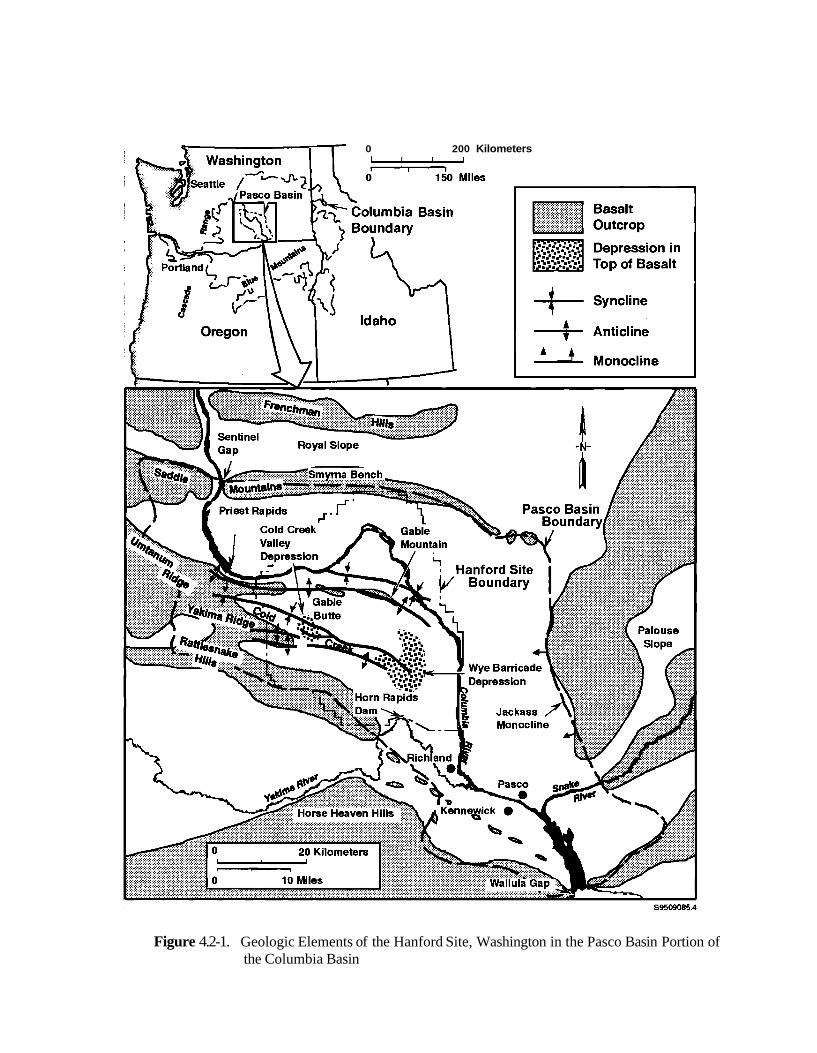
I I 0 200 Kilometers
Figure 4.2-1. Geologic Elements of the Hanford Site, Washington in the Pasco Basin Portion of the Columbia Basin
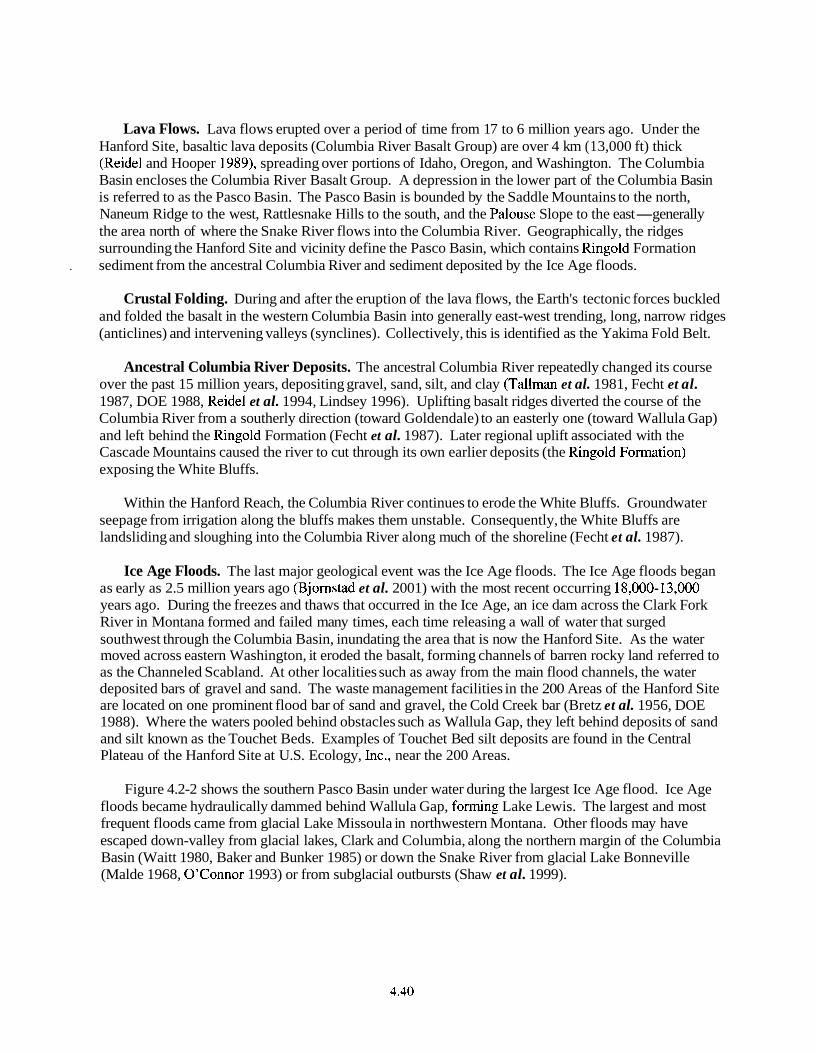
Lava Flows. Lava flows erupted over a period of time from 17 to 6 million years ago. Under the Hanford Site, basaltic lava deposits (Columbia River Basalt Group) are over 4 km (1 3,000 ft) thick (Reidel and Hooper 1989), spreading over portions of Idaho, Oregon, and Washington. The Columbia Basin encloses the Columbia River Basalt Group. A depression in the lower part of the Columbia Basin is referred to as the Pasco Basin. The Pasco Basin is bounded by the Saddle Mountains to the north, Naneum Ridge to the west, Rattlesnake Hills to the south, and the Palouse Slope to the east-generally the area north of where the Snake River flows into the Columbia River. Geographically, the ridges surrounding the Hanford Site and vicinity define the Pasco Basin, which contains Ringold Formation
. sediment from the ancestral Columbia River and sediment deposited by the Ice Age floods.
Crustal Folding. During and after the eruption of the lava flows, the Earth's tectonic forces buckled and folded the basalt in the western Columbia Basin into generally east-west trending, long, narrow ridges (anticlines) and intervening valleys (synclines). Collectively, this is identified as the Yakima Fold Belt.
Ancestral Columbia River Deposits. The ancestral Columbia River repeatedly changed its course over the past 15 million years, depositing gravel, sand, silt, and clay (Tallman et al. 1981, Fecht et al. 1987, DOE 1988, Reidel et al. 1994, Lindsey 1996). Uplifting basalt ridges diverted the course of the Columbia River from a southerly direction (toward Goldendale) to an easterly one (toward Wallula Gap) and left behind the Ringold Formation (Fecht et al. 1987). Later regional uplift associated with the Cascade Mountains caused the river to cut through its own earlier deposits (the Ringold Fornlation) exposing the White Bluffs.
Within the Hanford Reach, the Columbia River continues to erode the White Bluffs. Groundwater seepage from irrigation along the bluffs makes them unstable. Consequently, the White Bluffs are landsliding and sloughing into the Columbia River along much of the shoreline (Fecht et al. 1987).
Ice Age Floods. The last major geological event was the Ice Age floods. The Ice Age floods began as early as 2.5 million years ago (Bjornstad et al. 2001) with the most recent occurring 18,000-13,000 years ago. During the freezes and thaws that occurred in the Ice Age, an ice dam across the Clark Fork River in Montana formed and failed many times, each time releasing a wall of water that surged southwest through the Columbia Basin, inundating the area that is now the Hanford Site. As the water moved across eastern Washington, it eroded the basalt, forming channels of barren rocky land referred to as the Channeled Scabland. At other localities such as away from the main flood channels, the water deposited bars of gravel and sand. The waste management facilities in the 200 Areas of the Hanford Site are located on one prominent flood bar of sand and gravel, the Cold Creek bar (Bretz et al. 1956, DOE 1988). Where the waters pooled behind obstacles such as Wallula Gap, they left behind deposits of sand and silt known as the Touchet Beds. Examples of Touchet Bed silt deposits are found in the Central Plateau of the Hanford Site at U.S. Ecology, Inc., near the 200 Areas.
Figure 4.2-2 shows the southern Pasco Basin under water during the largest Ice Age flood. Ice Age floods became hydraulically dammed behind Wallula Gap, forming Lake Lewis. The largest and most frequent floods came from glacial Lake Missoula in northwestern Montana. Other floods may have escaped down-valley from glacial lakes, Clark and Columbia, along the northern margin of the Columbia Basin (Waitt 1980, Baker and Bunker 1985) or down the Snake River from glacial Lake Bonneville (Malde 1968, O'Connor 1993) or from subglacial outbursts (Shaw et al. 1999).
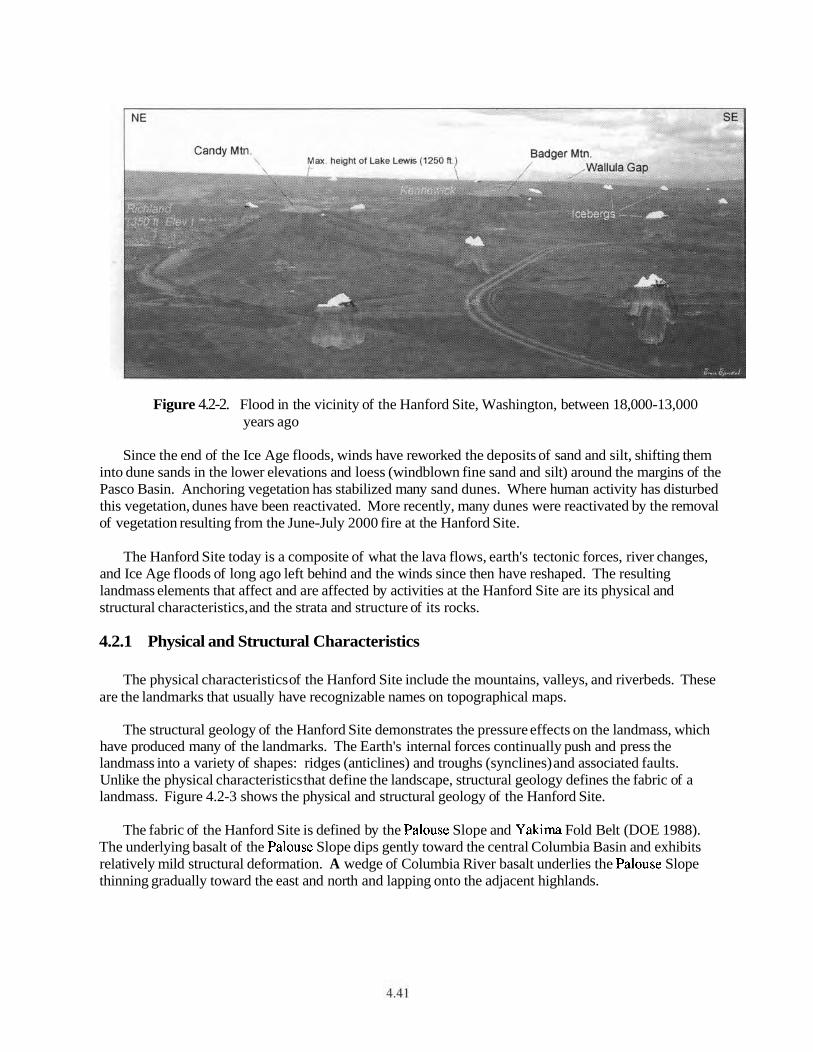
Figure 4.2-2. Flood in the vicinity of the Hanford Site, Washington, between 18,000-1 3,000 years ago
Since the end of the Ice Age floods, winds have reworked the deposits of sand and silt, shifting them into dune sands in the lower elevations and loess (windblown fine sand and silt) around the margins of the Pasco Basin. Anchoring vegetation has stabilized many sand dunes. Where human activity has disturbed this vegetation, dunes have been reactivated. More recently, many dunes were reactivated by the removal of vegetation resulting from the June-July 2000 fire at the Hanford Site.
The Hanford Site today is a composite of what the lava flows, earth's tectonic forces, river changes, and Ice Age floods of long ago left behind and the winds since then have reshaped. The resulting landmass elements that affect and are affected by activities at the Hanford Site are its physical and structural characteristics, and the strata and structure of its rocks.
4.2.1 Physical and Structural Characteristics
The physical characteristics of the Hanford Site include the mountains, valleys, and riverbeds. These are the landmarks that usually have recognizable names on topographical maps.
The structural geology of the Hanford Site demonstrates the pressure effects on the landmass, which have produced many of the landmarks. The Earth's internal forces continually push and press the landmass into a variety of shapes: ridges (anticlines) and troughs (synclines) and associated faults. Unlike the physical characteristics that define the landscape, structural geology defines the fabric of a landmass. Figure 4.2-3 shows the physical and structural geology of the Hanford Site.
The fabric of the Hanford Site is defined by the Palouse Slope and Yakima Fold Belt (DOE 1988). The underlying basalt of the Palouse Slope dips gently toward the central Columbia Basin and exhibits relatively mild structural deformation. A wedge of Columbia River basalt underlies the Palouse Slope thinning gradually toward the east and north and lapping onto the adjacent highlands.
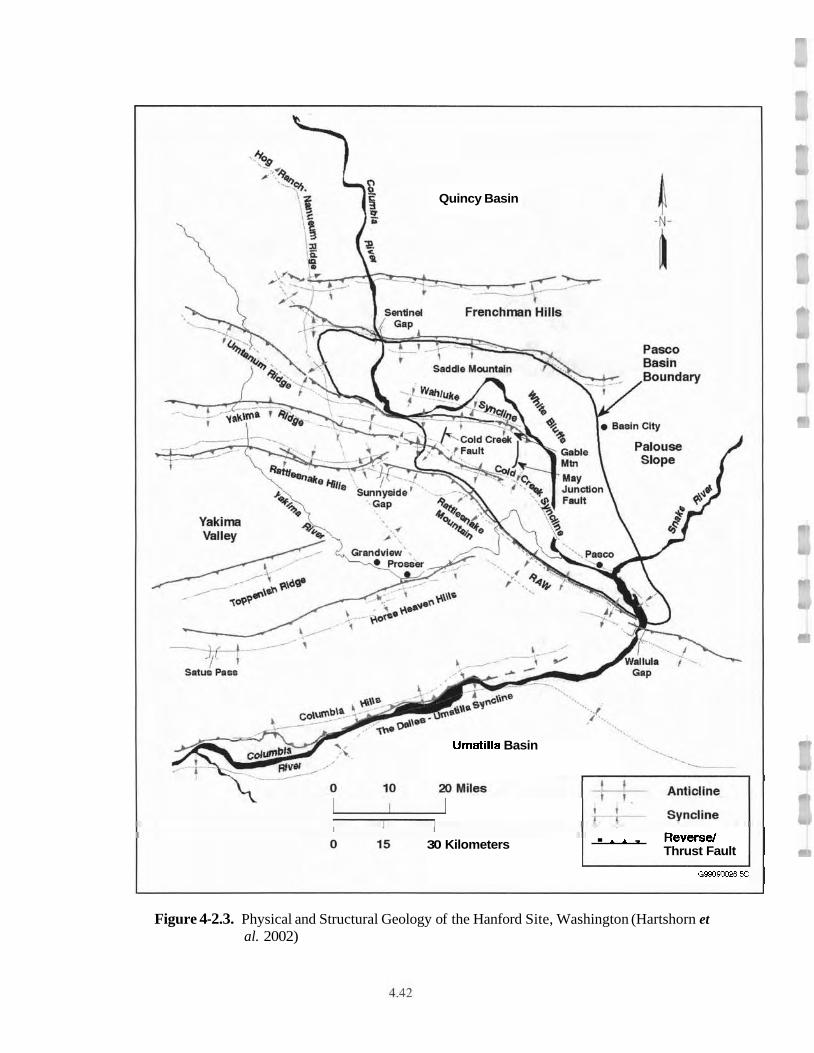
Quincy Basin
Umatilla Basin
30 Kilometers . ,, , Reversel Thrust Fault
GM90026 5C
Figure 4-2.3. Physical and Structural Geology of the Hanford Site, Washington (Hartshorn et al. 2002)
The Yakima Fold Belt is the name collectively given to all the ridges formed from the basaltic lava flows that are found within the central and western parts of the Columbia Basin (DOE 1988). They are a result of tectonic forces compressing the basaltic lava flows and overlying sediment into a series of ridges (anticlines) and valleys (synclines). Typically, a large fault is on the north side of ridges where the rock broke as it was folded. The main ridges and troughs on the Hanford Site area are as follows:
Saddle Mountain is the ridge that forms the northern boundary of the Pasco Basin and Hanford Site. Saddle Mountain is an east-west ridge about 110 km (68 mi) long and 5 km (3 mi) wide.
Wahluke Slope is on the north side of the Columbia River. The Wahluke Slope is a portion of the trough (syncline) of basalt between Saddle Mountain and Umtanum Ridge. The 100 Areas at the Hanford Site are located in this trough.
Umtanum Ridge makes up the southern boundary of the Wahluke Slope. Gable Butte and Gable Mountain are the parts of this ridge that lie between the 100 and 200 Areas. Gable Butte and Gable Mountain are folded layers of rock that form both anticlines and synclines and associated faults.
Rattlesnake Hills and Rattlesnake Mountain, southwest of the Hanford Site, are also the result of folded rock layers (anticline). Rattlesnake Mountain, the highest of the Rattlesnake Hills, reaches an elevation of 11 10 m (3660 ft) above mean sea level, the highest elevation in the area.
Cold Creek syncline is the folded trough of rock that lies between Umtanum Ridge and Yakima Ridge. Yakima Ridge is one of the anticlines of the Yakima Fold Belt. The Cold Creek bar, a deposit of Ice Age flood sediment, lies in this area.
4.2.2 Strata and Structure of Sediment and Rock
The strata and structure of the sediment and rocks that affect the Hanford Site are described in detail in DOE (1988). Figure 4.2-4 shows the various strata, their age, and epoch names for those geological periods of time.
4.2.2.1 Columbia River Basalt Group
The bedrock of the Hanford Site is volcanic rock (basalt). Beneath the Hanford Site lay a minimum of 100 basalt flows with a maximum combined thickness of more than 4 km (almost 13,000 ft) (DOE 1988), all part of the Columbia River Basalt Group.
To organize the many basalt deposits into a consistent nomenclature, geologists have named and grouped them based on their physical and chemical properties. The basalt deposit closest to the surface at the Hanford Site, and therefore most often referred to, is Saddle Mountains Basalt (Figure 4.2-4). Saddle Mountains Basalt consists of ten distinct basaltic lava deposits (members). The most recent basalt flow underlying most of the Hanford Site is the Elephant Mountain Member of the Saddle Mountains Basalt. A younger basalt flow, the Ice Harbor Member, is found in the southern portion of the site near the 300 Area (DOE 1988).
In addition to basalt, the Hanford Site has sedimentary formations. These are sediment (material that settles to the bottom of a liquid) that often has hardened into rock. Some of the sediment at the Hanford Site is found between the basaltic lavas and is called the Ellensburg Formation. The majority of the sediment is above the basalt with the Ringold Formation on the bottom, overlain by the Cold Creek unit, and topped with the Hanford formation (Figure 4.2-4). Understanding the formations, along with clastic
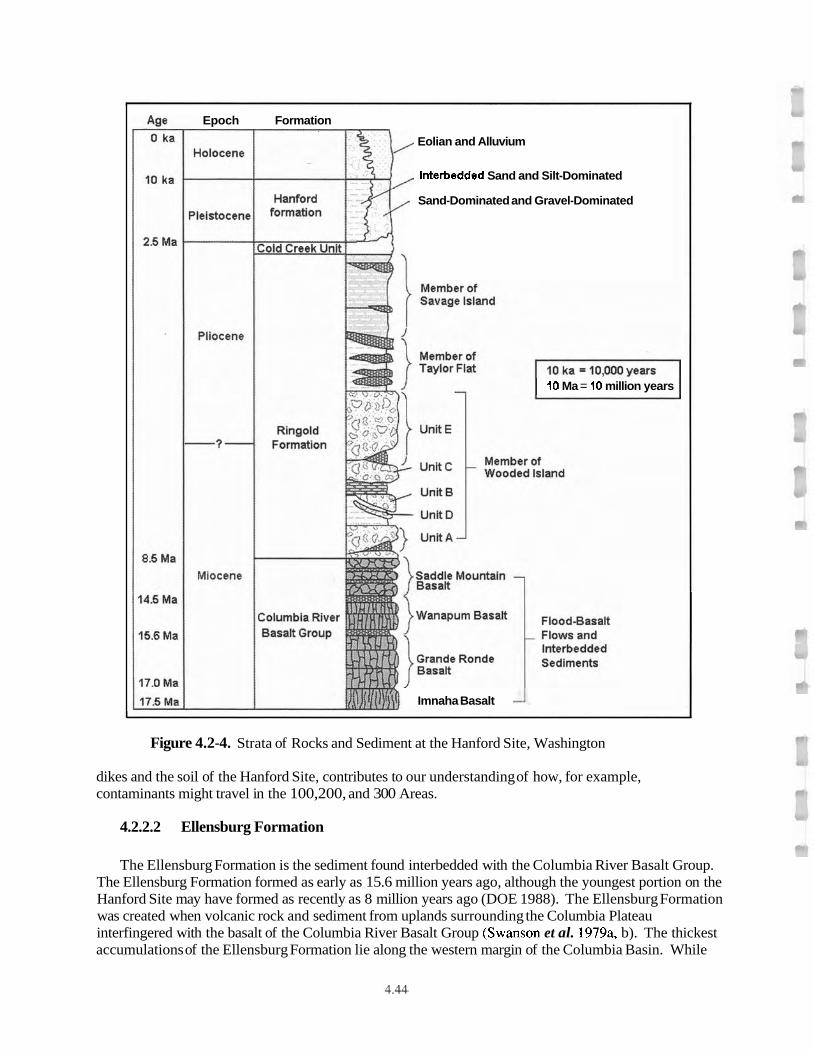
Epoch Formation
Eolian and Alluvium
Interbedded Sand and Silt-Dominated
Sand-Dominated and Gravel-Dominated
10 Ma = 10 million years
Imnaha Basalt
Figure 4.2-4. Strata of Rocks and Sediment at the Hanford Site, Washington
dikes and the soil of the Hanford Site, contributes to our understanding of how, for example, contaminants might travel in the 100,200, and 300 Areas.
4.2.2.2 Ellensburg Formation
The Ellensburg Formation is the sediment found interbedded with the Columbia River Basalt Group. The Ellensburg Formation formed as early as 15.6 million years ago, although the youngest portion on the Hanford Site may have formed as recently as 8 million years ago (DOE 1988). The Ellensburg Formation was created when volcanic rock and sediment from uplands surrounding the Columbia Plateau interfingered with the basalt of the Columbia River Basalt Group (Swanson et al. 1979a, b). The thickest accumulations of the Ellensburg Formation lie along the western margin of the Columbia Basin. While
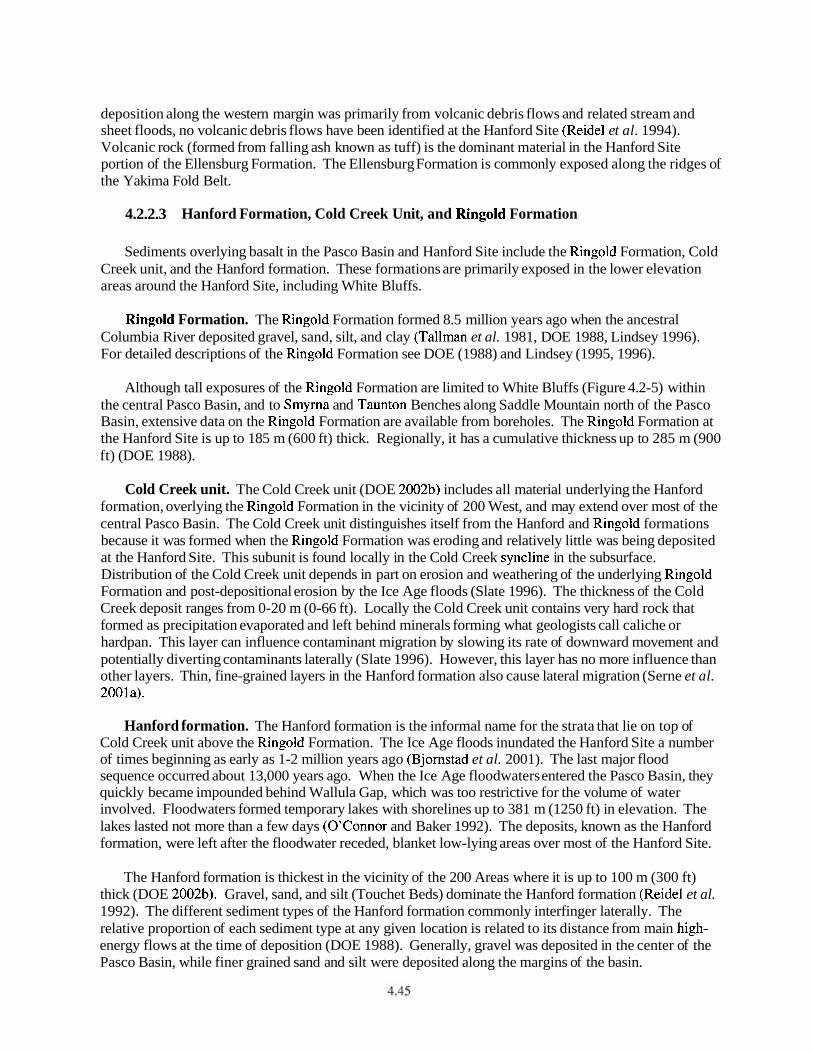
deposition along the western margin was primarily from volcanic debris flows and related stream and sheet floods, no volcanic debris flows have been identified at the Hanford Site (Reidel et al. 1994). Volcanic rock (formed from falling ash known as tuff) is the dominant material in the Hanford Site portion of the Ellensburg Formation. The Ellensburg Formation is commonly exposed along the ridges of the Yakima Fold Belt.
4.2.2.3 Hanford Formation, Cold Creek Unit, and Ringold Formation
Sediments overlying basalt in the Pasco Basin and Hanford Site include the Ringold Formation, Cold Creek unit, and the Hanford formation. These formations are primarily exposed in the lower elevation areas around the Hanford Site, including White Bluffs.
Ringold Formation. The Ringold Formation formed 8.5 million years ago when the ancestral Columbia River deposited gravel, sand, silt, and clay (Tallman et al. 1981, DOE 1988, Lindsey 1996). For detailed descriptions of the Ringold Formation see DOE (1988) and Lindsey (1995, 1996).
Although tall exposures of the Ringold Formation are limited to White Bluffs (Figure 4.2-5) within the central Pasco Basin, and to Smyrna and Taunton Benches along Saddle Mountain north of the Pasco Basin, extensive data on the Ringold Formation are available from boreholes. The Ringold Formation at the Hanford Site is up to 185 m (600 ft) thick. Regionally, it has a cumulative thickness up to 285 m (900 ft) (DOE 1988).
Cold Creek unit. The Cold Creek unit (DOE 2002b) includes all material underlying the Hanford formation, overlying the Ringold Formation in the vicinity of 200 West, and may extend over most of the central Pasco Basin. The Cold Creek unit distinguishes itself from the Hanford and Ringold formations because it was formed when the Ringold Formation was eroding and relatively little was being deposited at the Hanford Site. This subunit is found locally in the Cold Creek syncline in the subsurface. Distribution of the Cold Creek unit depends in part on erosion and weathering of the underlying Ringold Formation and post-depositional erosion by the Ice Age floods (Slate 1996). The thickness of the Cold Creek deposit ranges from 0-20 m (0-66 ft). Locally the Cold Creek unit contains very hard rock that formed as precipitation evaporated and left behind minerals forming what geologists call caliche or hardpan. This layer can influence contaminant migration by slowing its rate of downward movement and potentially diverting contaminants laterally (Slate 1996). However, this layer has no more influence than other layers. Thin, fine-grained layers in the Hanford formation also cause lateral migration (Serne et al. 2001a).
Hanford formation. The Hanford formation is the informal name for the strata that lie on top of Cold Creek unit above the Ringold Formation. The Ice Age floods inundated the Hanford Site a number of times beginning as early as 1-2 million years ago (Bjornstad et al. 2001). The last major flood sequence occurred about 13,000 years ago. When the Ice Age floodwaters entered the Pasco Basin, they quickly became impounded behind Wallula Gap, which was too restrictive for the volume of water involved. Floodwaters formed temporary lakes with shorelines up to 381 m (1250 ft) in elevation. The lakes lasted not more than a few days (O'Connor and Baker 1992). The deposits, known as the Hanford formation, were left after the floodwater receded, blanket low-lying areas over most of the Hanford Site.
The Hanford formation is thickest in the vicinity of the 200 Areas where it is up to 100 m (300 ft) thick (DOE 2002b). Gravel, sand, and silt (Touchet Beds) dominate the Hanford formation (Reidel et al. 1992). The different sediment types of the Hanford formation commonly interfinger laterally. The relative proportion of each sediment type at any given location is related to its distance from main high- energy flows at the time of deposition (DOE 1988). Generally, gravel was deposited in the center of the Pasco Basin, while finer grained sand and silt were deposited along the margins of the basin.
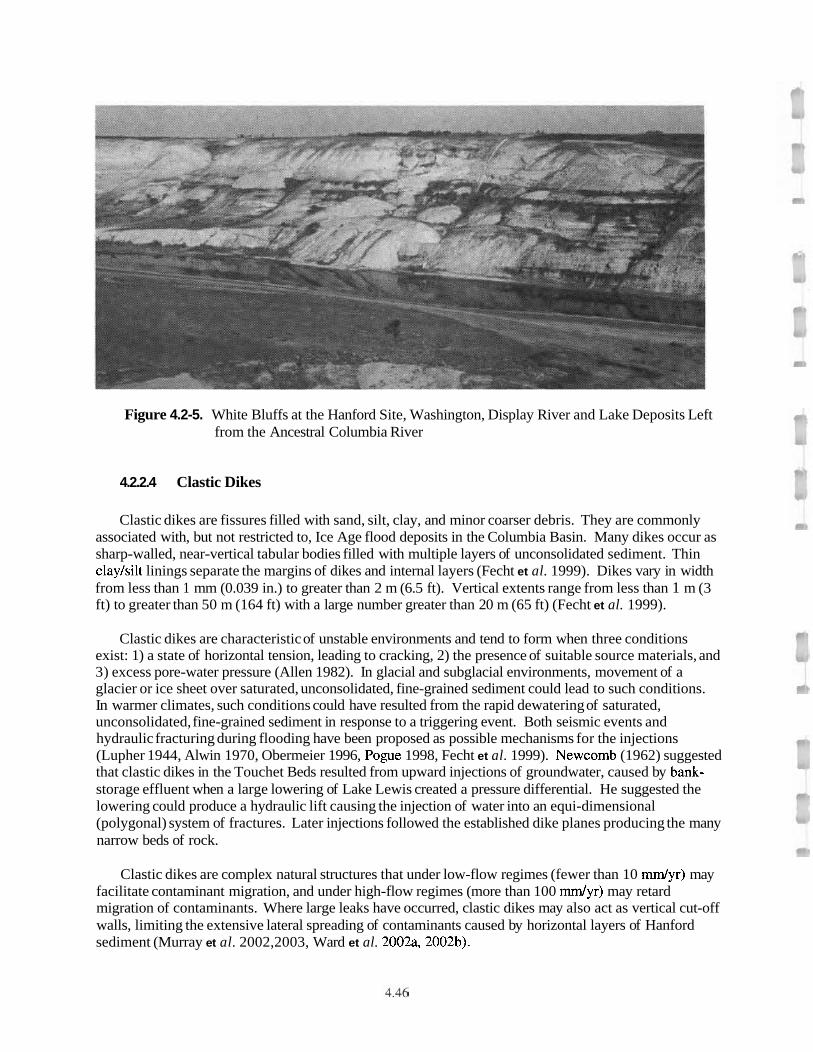
Figure 4.2-5. White Bluffs at the Hanford Site, Washington, Display River and Lake Deposits Left from the Ancestral Columbia River
4.2.2.4 Clastic Dikes
Clastic dikes are fissures filled with sand, silt, clay, and minor coarser debris. They are commonly associated with, but not restricted to, Ice Age flood deposits in the Columbia Basin. Many dikes occur as sharp-walled, near-vertical tabular bodies filled with multiple layers of unconsolidated sediment. Thin claylsilt linings separate the margins of dikes and internal layers (Fecht et al. 1999). Dikes vary in width from less than 1 mm (0.039 in.) to greater than 2 m (6.5 ft). Vertical extents range from less than 1 m (3 ft) to greater than 50 m (164 ft) with a large number greater than 20 m (65 ft) (Fecht et al. 1999).
Clastic dikes are characteristic of unstable environments and tend to form when three conditions exist: 1) a state of horizontal tension, leading to cracking, 2) the presence of suitable source materials, and 3) excess pore-water pressure (Allen 1982). In glacial and subglacial environments, movement of a glacier or ice sheet over saturated, unconsolidated, fine-grained sediment could lead to such conditions. In warmer climates, such conditions could have resulted from the rapid dewatering of saturated, unconsolidated, fine-grained sediment in response to a triggering event. Both seismic events and hydraulic fracturing during flooding have been proposed as possible mechanisms for the injections (Lupher 1944, Alwin 1970, Obermeier 1996, Pogue 1998, Fecht et al. 1999). Newcomb (1962) suggested that clastic dikes in the Touchet Beds resulted from upward injections of groundwater, caused by bank- storage effluent when a large lowering of Lake Lewis created a pressure differential. He suggested the lowering could produce a hydraulic lift causing the injection of water into an equi-dimensional (polygonal) system of fractures. Later injections followed the established dike planes producing the many narrow beds of rock.
Clastic dikes are complex natural structures that under low-flow regimes (fewer than 10 mdyr ) may facilitate contaminant migration, and under high-flow regimes (more than 100 mmlyr) may retard migration of contaminants. Where large leaks have occurred, clastic dikes may also act as vertical cut-off walls, limiting the extensive lateral spreading of contaminants caused by horizontal layers of Hanford sediment (Murray et al. 2002,2003, Ward et al. 2002a, 2002b).
4.2.2.5 100 Areas Strata and Structure
The 100 Areas are located along the Columbia River in the northern portion of the Hanford Site (Figure 4.0-1). With the exception of the 100-B/C Area, the 100 Areas lie on the north limb of the Wahluke syncline. The 100-B/C Area lies over the axis of the syncline. The top of the basalt in the 100 Areas ranges in elevation from 46 m (150 ft) near the 100-H Area to -64 m (-210 ft) below sea level near the 100-B/C Area. The Ringold Formation and Hanford formation occur throughout this area. The Cold Creek unit deposits have not been recognized in the 100 Areas.
The Ringold Formation shows a marked west-to-east variation in the 100 Areas (Lindsey 1992). The main channel of the ancestral Columbia River flowed along the front of Umtanum Ridge and through the 100-BIC and 100-K Areas before turning south to flow along the front of Gable Mountain andlor through the Gable Mountain-Gable Butte gap. This main channel deposited coarse-grained sand and gravel of the Ringold Formation. Farther to the north and east, however, the Ringold sediment is gradually dominated by the fine-grained silt deposits and associated ancient soil with the 100-H Area showing almost none of the gravel areas.
4.2.2.6 200 Areas Strata and Structure
The geology in the 200 West Area is notably different from that in the 200 East Area even though they are separated by a distance of only 6 km (4 mi) (DOE 1988) (Figure 4.0-1). The 200 West Area has sections containing all three formations including most of the Ringold Formation as well as the Cold Creek unit and the Hanford formation (DOE 1988).
In the 200 East Area, some of the Ringold Formation is present in the southern part but has been completely eroded in the northern part. On the north side of the 200 East Area, the Hanford formation rests directly on the basalt, and no Ringold sediment is present. Erosion by the ancestral Columbia River and Ice Age flooding are believed to have removed the Ringold Formation from this area. Material of questionable origin overlies basalt within the B-BX-BY Waste Management Area (Wood et al. 2000). This material may be equivalent or partially equivalent to the Cold Creek unit or it may represent the earliest ice-age flood deposits overlain by a locally thick sequence of fine-grained non-flood deposits. This unit is referred to informally as Hanford-Cold Creek deposits.
4.2.2.7 300 Area Strata and Structure
The 300 Area is located in the southeastern portion of the Hanford Site (Figure 4.0-1). The 300 Area lies above a gentle syncline formed by the intersection of the Yakima Fold Belt and the undeformed eastern Columbia Basin (DOE 1988). Over most of the Hanford Site, the uppermost basalt flows belong to the Elephant Mountain Member, but near the 300 Area younger flows belonging to the Ice Harbor Member of the Saddle Mountains Basalt are present, causing the overlying sediment layers to be relatively thin (Schalla et al. 1988). Both Ringold Formation and Hanford formation sediment is found in the 300 Area.
4.2.3 Surface Soils
Hajek (1966) describes 15 different surface soil types on the Hanford Site, varying from sand to silty and sandy loam (Figure 4.2-6, Table 4.2-1). Various classifications, including land use, are also given in Hajek (1966). The soil classifications given in Hajek (1966) have not been updated to reflect current reinterpretations of soil classifications. Until the surface soils on the Hanford Site are resurveyed, the descriptions presented in Hajek (1966) will continue to be used.
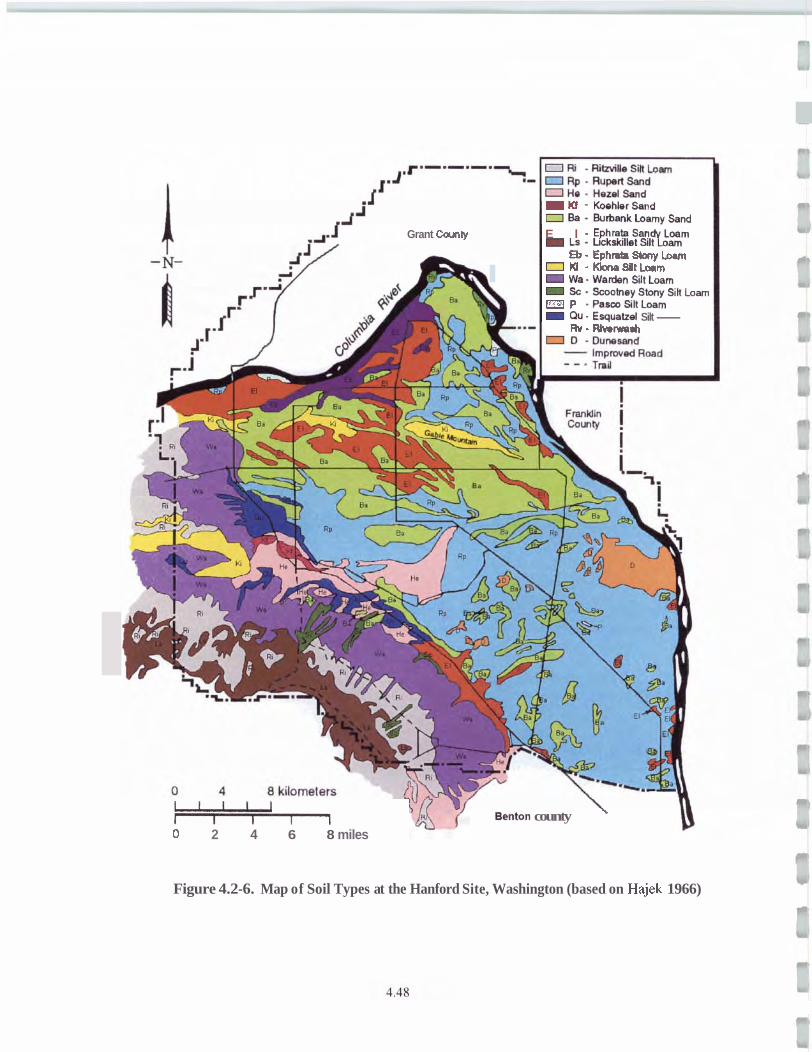
K i - IbhkrSIlnd B . - B u ~ L o u n y S n d
Grant Counly E l - EphM.SabdyLoam Is-Uduidll.tSPILoMI
Eb- EphnhSbnyLoMl = KI - Kbnr3JtLmrn = V l l P . W . i b n S i t t h =Sc-Sax,twySbDnySilLwm m P -PllooSi#Loun = Qu. Ellqiuh.l Silt-
Rv-mwarh
- - 0 2 4 6 8 miles
B.nton county '
Figure 4.2-6. Map of Soil Types at the Hanford Site, Washington (based on Hajek 1966)
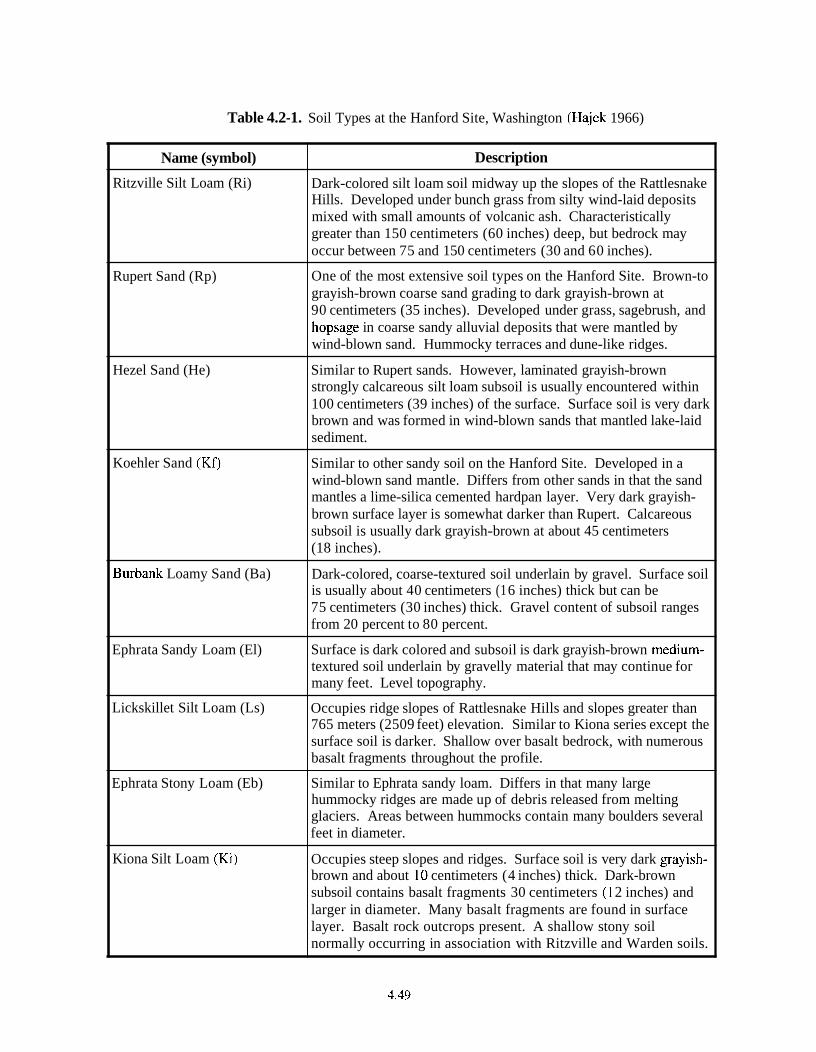
Table 4.2-1. Soil Types at the Hanford Site, Washington (Hajek 1966)
Name (symbol)
Ritzville Silt Loam (Ri)
Rupert Sand (Rp)
Hezel Sand (He)
Koehler Sand (Kf)
Burbank Loamy Sand (Ba)
Ephrata Sandy Loam (El)
Lickskillet Silt Loam (Ls)
Ephrata Stony Loam (Eb)
Kiona Silt Loam (Ki)
Description
Dark-colored silt loam soil midway up the slopes of the Rattlesnake Hills. Developed under bunch grass from silty wind-laid deposits mixed with small amounts of volcanic ash. Characteristically greater than 150 centimeters (60 inches) deep, but bedrock may occur between 75 and 150 centimeters (30 and 60 inches).
One of the most extensive soil types on the Hanford Site. Brown-to grayish-brown coarse sand grading to dark grayish-brown at 90 centimeters (35 inches). Developed under grass, sagebrush, and hopsage in coarse sandy alluvial deposits that were mantled by wind-blown sand. Hummocky terraces and dune-like ridges.
Similar to Rupert sands. However, laminated grayish-brown strongly calcareous silt loam subsoil is usually encountered within 100 centimeters (39 inches) of the surface. Surface soil is very dark brown and was formed in wind-blown sands that mantled lake-laid sediment.
Similar to other sandy soil on the Hanford Site. Developed in a wind-blown sand mantle. Differs from other sands in that the sand mantles a lime-silica cemented hardpan layer. Very dark grayish- brown surface layer is somewhat darker than Rupert. Calcareous subsoil is usually dark grayish-brown at about 45 centimeters (18 inches).
Dark-colored, coarse-textured soil underlain by gravel. Surface soil is usually about 40 centimeters (1 6 inches) thick but can be 75 centimeters (30 inches) thick. Gravel content of subsoil ranges from 20 percent to 80 percent.
Surface is dark colored and subsoil is dark grayish-brown medium- textured soil underlain by gravelly material that may continue for many feet. Level topography.
Occupies ridge slopes of Rattlesnake Hills and slopes greater than 765 meters (2509 feet) elevation. Similar to Kiona series except the surface soil is darker. Shallow over basalt bedrock, with numerous basalt fragments throughout the profile.
Similar to Ephrata sandy loam. Differs in that many large hummocky ridges are made up of debris released from melting glaciers. Areas between hummocks contain many boulders several feet in diameter.
Occupies steep slopes and ridges. Surface soil is very dark grayish- brown and about 10 centimeters (4 inches) thick. Dark-brown subsoil contains basalt fragments 30 centimeters (1 2 inches) and larger in diameter. Many basalt fragments are found in surface layer. Basalt rock outcrops present. A shallow stony soil normally occurring in association with Ritzville and Warden soils.
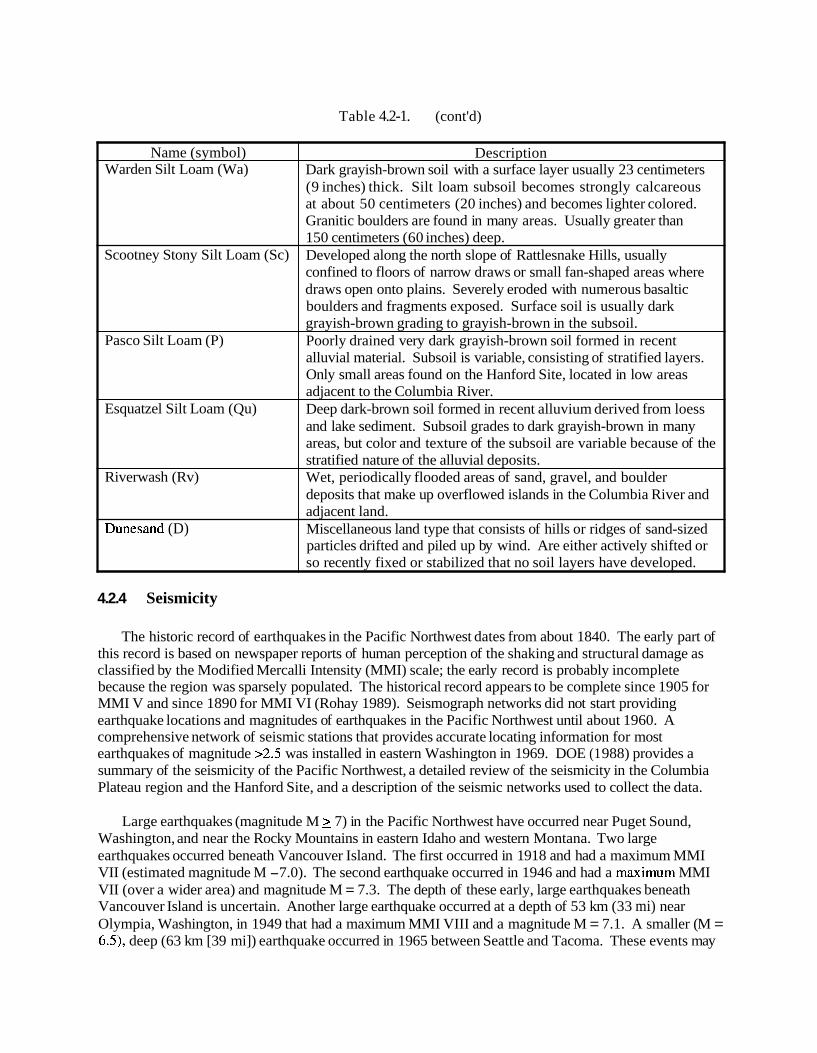
Table 4.2-1. (cont'd)
4.2.4 Seismicity
Name (symbol) Warden Silt Loam (Wa)
Scootney Stony Silt Loam (Sc)
Pasco Silt Loam (P)
Esquatzel Silt Loam (Qu)
Riverwash (Rv)
Dunesand (D)
The historic record of earthquakes in the Pacific Northwest dates from about 1840. The early part of this record is based on newspaper reports of human perception of the shaking and structural damage as classified by the Modified Mercalli Intensity (MMI) scale; the early record is probably incomplete because the region was sparsely populated. The historical record appears to be complete since 1905 for MMI V and since 1890 for MMI VI (Rohay 1989). Seismograph networks did not start providing earthquake locations and magnitudes of earthquakes in the Pacific Northwest until about 1960. A comprehensive network of seismic stations that provides accurate locating information for most earthquakes of magnitude >2.5 was installed in eastern Washington in 1969. DOE (1 988) provides a summary of the seismicity of the Pacific Northwest, a detailed review of the seismicity in the Columbia Plateau region and the Hanford Site, and a description of the seismic networks used to collect the data.
Description Dark grayish-brown soil with a surface layer usually 23 centimeters (9 inches) thick. Silt loam subsoil becomes strongly calcareous at about 50 centimeters (20 inches) and becomes lighter colored. Granitic boulders are found in many areas. Usually greater than 150 centimeters (60 inches) deep. Developed along the north slope of Rattlesnake Hills, usually confined to floors of narrow draws or small fan-shaped areas where draws open onto plains. Severely eroded with numerous basaltic boulders and fragments exposed. Surface soil is usually dark grayish-brown grading to grayish-brown in the subsoil. Poorly drained very dark grayish-brown soil formed in recent alluvial material. Subsoil is variable, consisting of stratified layers. Only small areas found on the Hanford Site, located in low areas adjacent to the Columbia River. Deep dark-brown soil formed in recent alluvium derived from loess and lake sediment. Subsoil grades to dark grayish-brown in many areas, but color and texture of the subsoil are variable because of the stratified nature of the alluvial deposits. Wet, periodically flooded areas of sand, gravel, and boulder deposits that make up overflowed islands in the Columbia River and adjacent land. Miscellaneous land type that consists of hills or ridges of sand-sized particles drifted and piled up by wind. Are either actively shifted or so recently fixed or stabilized that no soil layers have developed.
Large earthquakes (magnitude M 7) in the Pacific Northwest have occurred near Puget Sound, Washington, and near the Rocky Mountains in eastern Idaho and western Montana. Two large earthquakes occurred beneath Vancouver Island. The first occurred in 191 8 and had a maximum MMI VII (estimated magnitude M -7.0). The second earthquake occurred in 1946 and had a maximum MMI VII (over a wider area) and magnitude M = 7.3. The depth of these early, large earthquakes beneath Vancouver Island is uncertain. Another large earthquake occurred at a depth of 53 km (33 mi) near Olympia, Washington, in 1949 that had a maximum MMI VIII and a magnitude M = 7.1. A smaller (M = 6.5), deep (63 km [39 mi]) earthquake occurred in 1965 between Seattle and Tacoma. These events may
all be related to deformation within the subducting Juan de Fuca plate at depth beneath the Vancouver IslandPuget Sound region.
Two large events occurred on the eastern boundary of the Pacific Northwest, in the Rocky Mountains. These were the 1959 Hebgen Lake earthquake in western Montana, which had a Richter magnitude of 7.5 and an MMI X, and the 1983 Borah Peak earthquake in eastern Idaho, which had a Richter magnitude of 7.3 and an MMI M.
Closer to the Hanford Site, a significant large earthquake of uncertain location occurred in north- central Washington in 1872. This event had an estimated maximum MMI ranging from VIII to IX and an estimated Richter magnitude of approximately 7.4. The distribution of intensities suggests a location within a broad region between Lake Chelan, Washington, and the British Columbia border. Evidence of landslides near Lake Chelan suggests a location near there.
February 28,2001, there was a moderate (M < 7), deep earthquake near Olympia (termed the Nisqually earthquake). This earthquake was located at a depth of 52 km (32 mi) and had a magnitude of 6.8; reported ground shaking effects reached MMI VIII. This event is similar to those in 1949 and 1965 described above. Actual ground motions from this earthquake measured at the Hanford Site are reported at the end of this section.
Seismicity of the Columbia Plateau, as determined by the rate of earthquakes per area and the historical magnitude of these events, is relatively low when compared with other regions of the Pacific Northwest, the Puget Sound area, and western MontanaJeastern Idaho. Figure 4.2-8 shows the locations of all earthquakes that occurred in the Columbia Plateau before 1969 with an MMI of 2 V and at Richter magnitude 2 4, and Figure 4.2-9 shows the locations of all earthquakes that occurred from 1969 to 2000 at Richter magnitudes 2 3. The largest known earthquake in the Columbia Plateau occurred in 1936 near Milton-Freewater, Oregon. This earthquake had a Richter magnitude of 5.75 and a maximum MMI of VII, and was followed by a number of aftershocks indicating a northeast-trending fault plane.
Other earthquakes with Richter magnitudes 2 5 andor MMIs of VI occurred along the boundaries of the Columbia Plateau in a cluster near Lake Chelan in 1872 extending into the northern Cascade Range, in northern Idaho and Washington, and along the boundary between the western Columbia Plateau and the Cascade Range. Three MMI VI earthquakes have occurred within the Columbia Plateau, including one event in the Milton-Freewater, Oregon region in 192 1; one near Yakima, Washington in 1892; and one near Umatilla, Oregon in 1893. In the central portion of the Columbia Plateau, the largest earthquakes near the Hanford Site are two earthquakes that occurred in 1918 and 1973. These two events were magnitude 4.4 and intensity V and were located north of the Hanford Site near Othello.
Earthquakes often occur in spatial and temporal clusters in the central Columbia Plateau and are termed "earthquake swarms." The region north and east of the Hanford Site is a region of concentrated earthquake swarm activity, but earthquake swarms have also occurred in several locations within the Hanford Site. The frequency of earthquakes in a swarm tends to gradually increase and decay with no one outstanding large event within the sequence. Roughly 90% of the earthquakes in swarms have Richter magnitudes of 2 or less. These earthquake swarms generally occur at shallow depths, with 75% of the events located at depths < 4 km (2.5 mi). Each earthquake swarm typically lasts several weeks to months, consists of several to 100 or more earthquakes, and the locations are clustered in an area 5 to 10 km (3 to 6 mi) in lateral dimension. Often, the longest dimension of the swarm area is elongated in an east-west direction. However, detailed locations of swarm earthquakes indicate that the events occur on fault planes of variable orientation and not on a single, through-going fault plane.
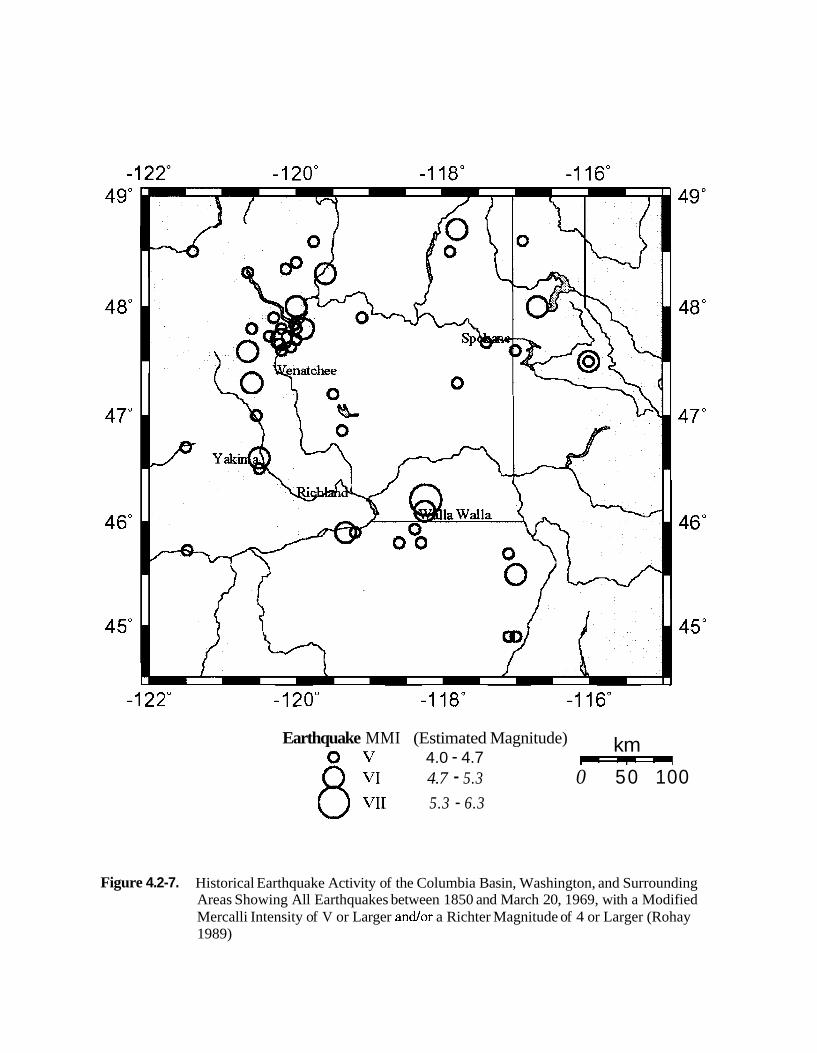
Earthquake MMI (Estimated Magnitude) 4.0 - 4.7
km - 4.7 - 5.3 0 50 100 5.3 - 6.3
Figure 4.2-7. Historical Earthquake Activity of the Columbia Basin, Washington, and Surrounding Areas Showing All Earthquakes between 1850 and March 20, 1969, with a Modified Mercalli Intensity of V or Larger andlor a Richter Magnitude of 4 or Larger (Rohay 1989)
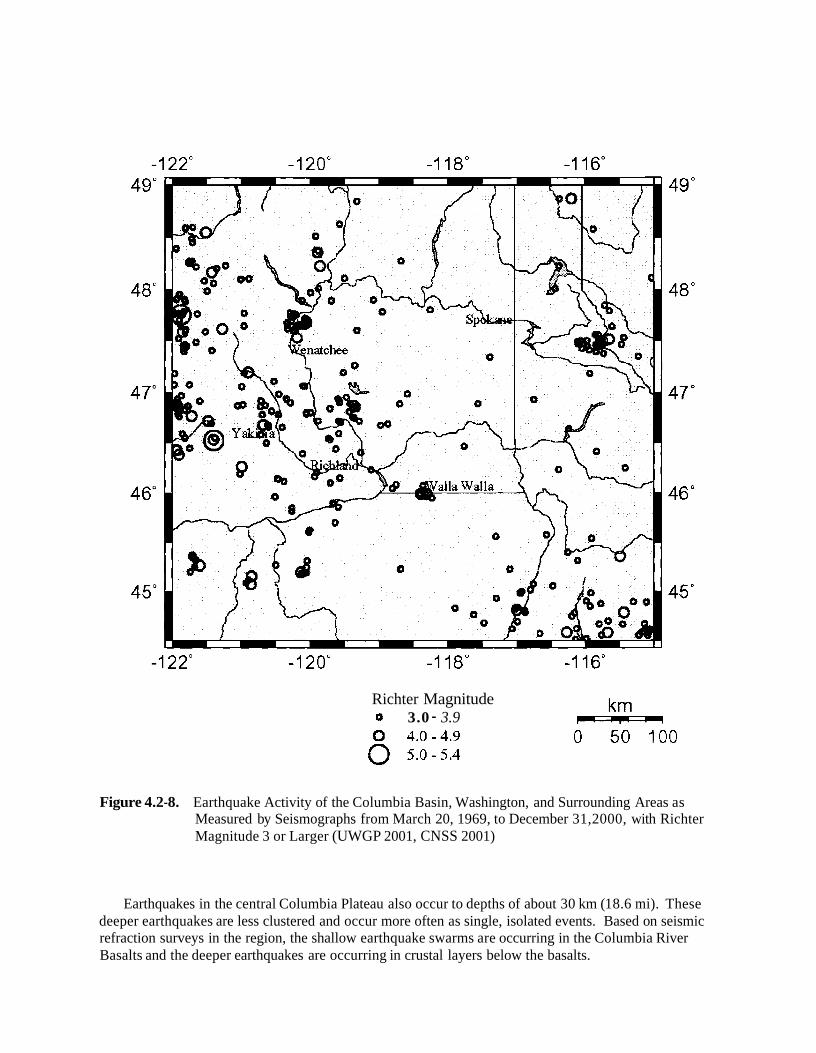
Richter Magnitude 0 3.0 - 3.9
Figure 4.2-8. Earthquake Activity of the Columbia Basin, Washington, and Surrounding Areas as Measured by Seismographs from March 20, 1969, to December 31,2000, with Richter Magnitude 3 or Larger (UWGP 2001, CNSS 2001)
Earthquakes in the central Columbia Plateau also occur to depths of about 30 km (1 8.6 mi). These deeper earthquakes are less clustered and occur more often as single, isolated events. Based on seismic refraction surveys in the region, the shallow earthquake swarms are occurring in the Columbia River Basalts and the deeper earthquakes are occurring in crustal layers below the basalts.
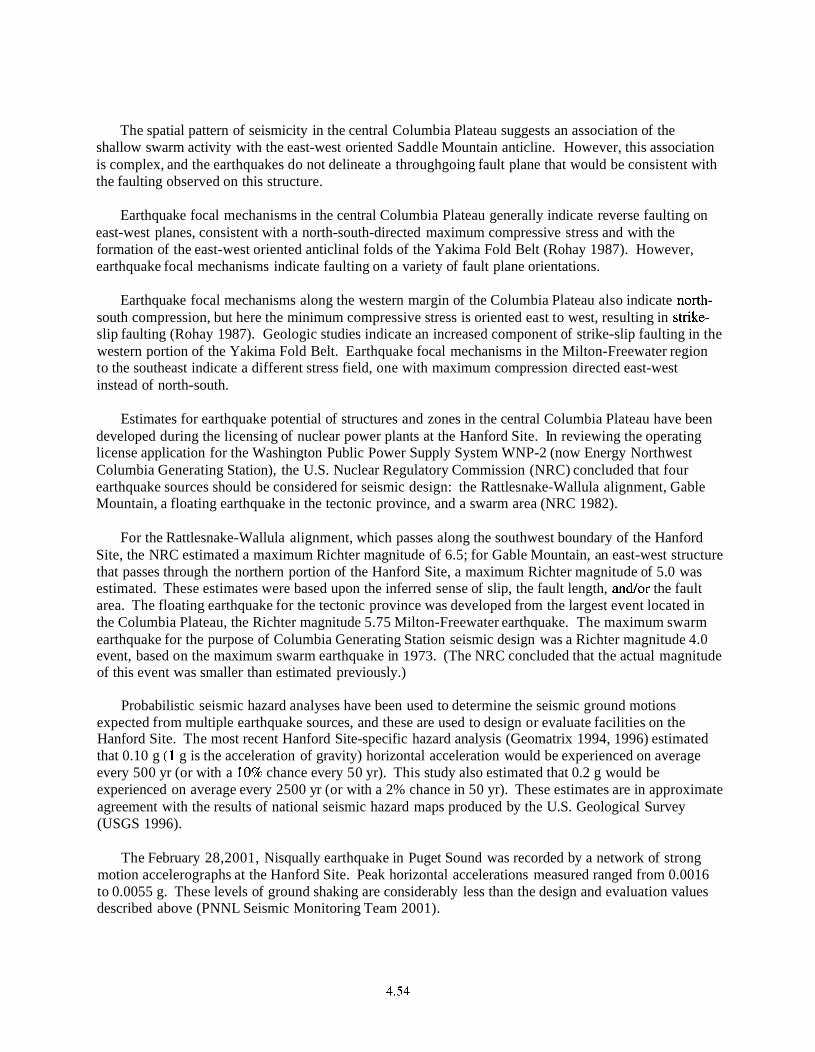
The spatial pattern of seismicity in the central Columbia Plateau suggests an association of the shallow swarm activity with the east-west oriented Saddle Mountain anticline. However, this association is complex, and the earthquakes do not delineate a throughgoing fault plane that would be consistent with the faulting observed on this structure.
Earthquake focal mechanisms in the central Columbia Plateau generally indicate reverse faulting on east-west planes, consistent with a north-south-directed maximum compressive stress and with the formation of the east-west oriented anticlinal folds of the Yakima Fold Belt (Rohay 1987). However, earthquake focal mechanisms indicate faulting on a variety of fault plane orientations.
Earthquake focal mechanisms along the western margin of the Columbia Plateau also indicate north- south compression, but here the minimum compressive stress is oriented east to west, resulting in strike- slip faulting (Rohay 1987). Geologic studies indicate an increased component of strike-slip faulting in the western portion of the Yakima Fold Belt. Earthquake focal mechanisms in the Milton-Freewater region to the southeast indicate a different stress field, one with maximum compression directed east-west instead of north-south.
Estimates for earthquake potential of structures and zones in the central Columbia Plateau have been developed during the licensing of nuclear power plants at the Hanford Site. In reviewing the operating license application for the Washington Public Power Supply System WNP-2 (now Energy Northwest Columbia Generating Station), the U.S. Nuclear Regulatory Commission (NRC) concluded that four earthquake sources should be considered for seismic design: the Rattlesnake-Wallula alignment, Gable Mountain, a floating earthquake in the tectonic province, and a swarm area (NRC 1982).
For the Rattlesnake-Wallula alignment, which passes along the southwest boundary of the Hanford Site, the NRC estimated a maximum Richter magnitude of 6.5; for Gable Mountain, an east-west structure that passes through the northern portion of the Hanford Site, a maximum Richter magnitude of 5.0 was estimated. These estimates were based upon the inferred sense of slip, the fault length, andlor the fault area. The floating earthquake for the tectonic province was developed from the largest event located in the Columbia Plateau, the Richter magnitude 5.75 Milton-Freewater earthquake. The maximum swarm earthquake for the purpose of Columbia Generating Station seismic design was a Richter magnitude 4.0 event, based on the maximum swarm earthquake in 1973. (The NRC concluded that the actual magnitude of this event was smaller than estimated previously.)
Probabilistic seismic hazard analyses have been used to determine the seismic ground motions expected from multiple earthquake sources, and these are used to design or evaluate facilities on the Hanford Site. The most recent Hanford Site-specific hazard analysis (Geomatrix 1994, 1996) estimated that 0.10 g (1 g is the acceleration of gravity) horizontal acceleration would be experienced on average every 500 yr (or with a 10% chance every 50 yr). This study also estimated that 0.2 g would be experienced on average every 2500 yr (or with a 2% chance in 50 yr). These estimates are in approximate agreement with the results of national seismic hazard maps produced by the U.S. Geological Survey (USGS 1996).
The February 28,2001, Nisqually earthquake in Puget Sound was recorded by a network of strong motion accelerographs at the Hanford Site. Peak horizontal accelerations measured ranged from 0.0016 to 0.0055 g. These levels of ground shaking are considerably less than the design and evaluation values described above (PNNL Seismic Monitoring Team 2001).
4.3 Hydrology P. D. Thorne, D. G. Horton, and G. V. Last
Hydrology considerations at the Hanford Site include surface water, the vadose zone, and groundwater. The vadose zone is the unsaturated or partially saturated region between ground surface and the saturated zone. Water in the vadose zone is called soil moisture. Groundwater refers to water within the saturated zone. Permeable saturated units in the subsurface are called aquifers.
4.3.1 Surface Water
Surface water at Hanford includes the Columbia River, Columbia riverbank seepage, springs, and ponds. Intermittent surface streams, such as Cold Creek, may also contain water after large precipitation or snowmelt events. In addition, the Yakima River flows along a short section of the southern boundary of the Hanford Site (Figure 4.3-I), and there is surface water associated with irrigation east and north of the Site.
4.3.1.1 Columbia River
The Columbia River is the second largest river in the contiguous United States in terms of total flow and is the dominant surface-water body on the Hanford Site. The original selection of the Hanford Site for plutonium production and processing was based, in part, on the abundant water provided by the Columbia River. The existence of the Hanford Site has precluded development of this section of the river.
Originating in the Canadian Rockies of southeastern British Columbia, Canada, the Columbia River drains a total area of approximately 680,000 km2 (262,480 mi2) en route to the Pacific Ocean. Most of the Columbia River is impounded by 11 dams within the United States: 7 upstream and 4 downstream of the Hanford Site. Priest Rapids is the nearest upstream dam, and McNary is the nearest downstream dam. Lake Wallula, the impoundment created by McNary Dam, extends upstream past Richland, Washington, to the southern part of the Hanford Site. Except for the Columbia River estuary, the only unimpounded stretch of the river in the United States is the Hanford Reach, which extends from Priest Rapids Dam downstream approximately 82 km (5 1 mi) to the McNary Pool, north of Richland, Washington. The Hanford Reach of the Columbia River was recently incorporated into the land area established as the Hanford Reach National Monument.
Flows through the Hanford Reach fluctuate significantly and are controlled primarily by releases from three upstream storage dams: Grand Coulee, Mica, and Keenleyside. Storage dams on tributaries of the Columbia River also affect flows. Flows in the Hanford Reach are directly affected by releases from Priest Rapids Dam; however, Priest Rapids operates as a run-of-the-river dam rather than a storage dam. Flows are controlled from purposes of power generation and to promote salmon migration. The Vernita Bar Agreement (signed June 16, 1988, by the U.S. Department of Energy, federal and state agencies, Tribal governments, and public utility districts in Grant, Chelan, and Douglas counties) was created to prevent salmon eggs in the Hanford Reach from being left high and dry. Columbia River flow rates near Priest Rapids during the 83-year period from 19 17 to 2000 averaged nearly 3360 m3/s (1 20,000 ft3/s). Daily average flows during this period ranged from 570 to 19,500 m3/s (20,000 to 690,000 ft3/s). The lowest and highest flows occurred before the construction of upstream dams. During the 10-year period from 1991 through 2000, the average flow rate was also about 3360 m3/s (120,000 ft3/s). Daily average flows for the period 1992 through April 2003 are plotted in Figure 4.3-2.
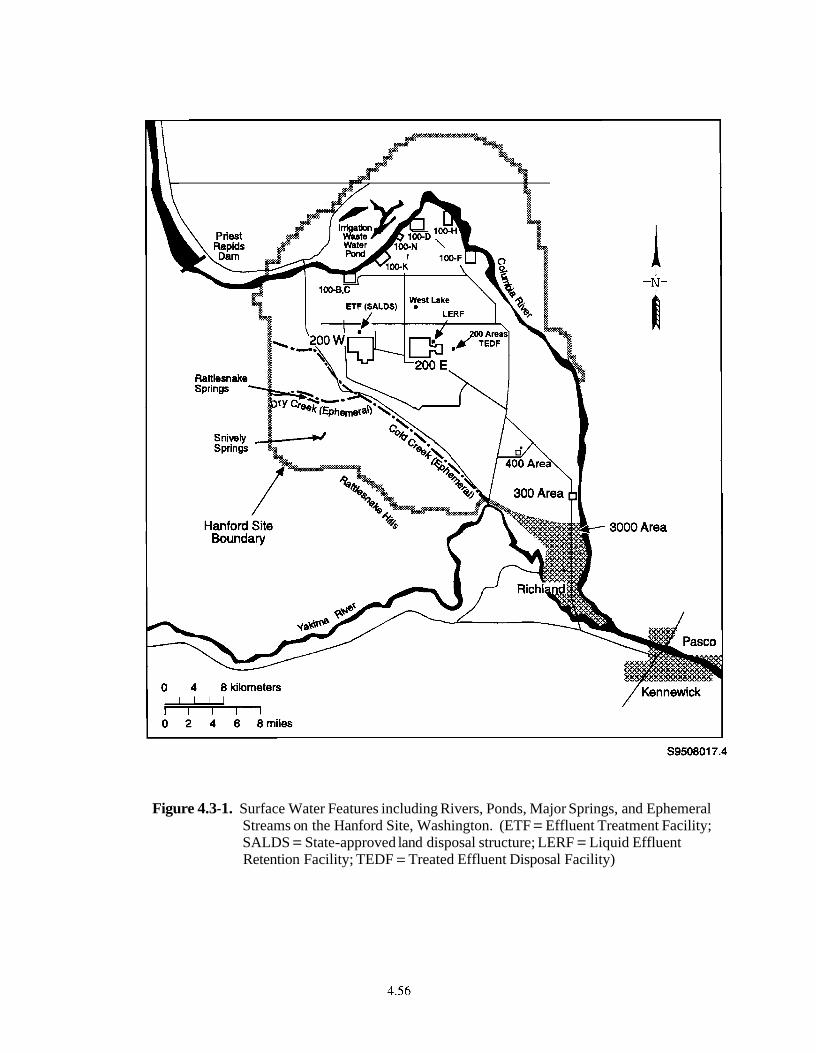
Figure 4.3-1. Surface Water Features including Rivers, Ponds, Major Springs, and Ephemeral Streams on the Hanford Site, Washington. (ETF = Effluent Treatment Facility; SALDS = State-approved land disposal structure; LERF = Liquid Effluent Retention Facility; TEDF = Treated Effluent Disposal Facility)
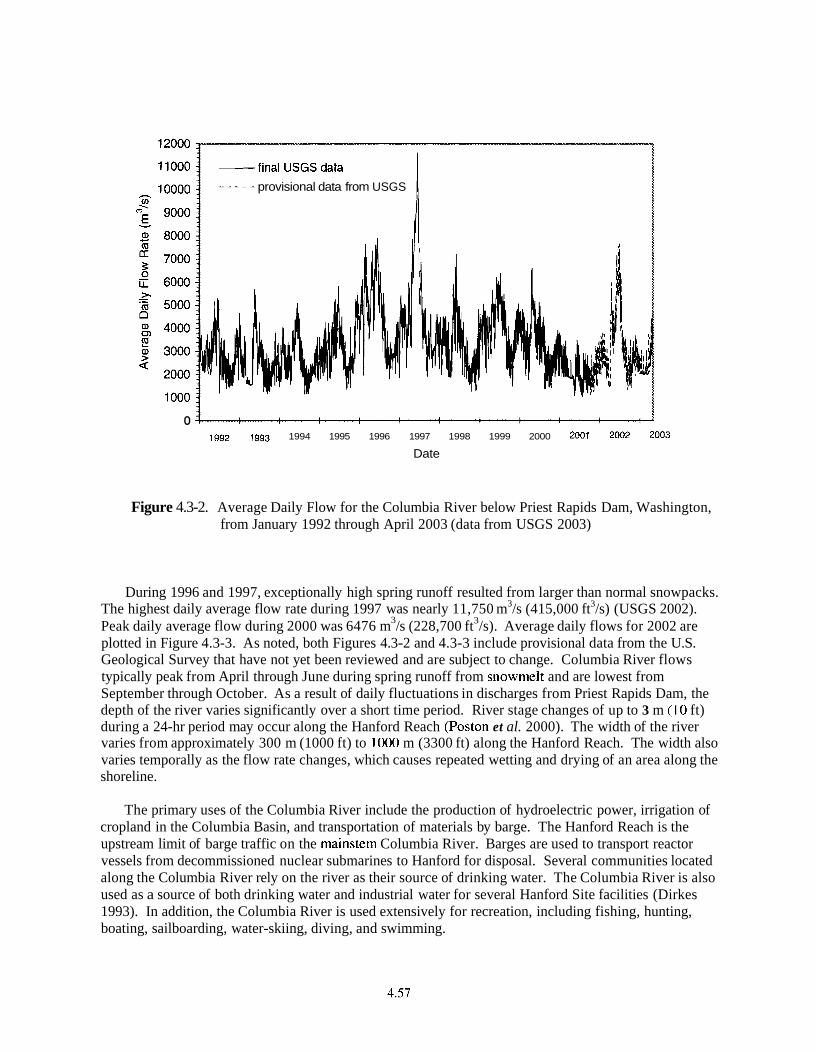
0 1992 1993 1994 1995 1996 1997 1998 1999 2000 2001 2002 2003
Date
provisional data from USGS
Figure 4.3-2. Average Daily Flow for the Columbia River below Priest Rapids Dam, Washington, from January 1992 through April 2003 (data from USGS 2003)
During 1996 and 1997, exceptionally high spring runoff resulted from larger than normal snowpacks. The highest daily average flow rate during 1997 was nearly 11,750 m3/s (415,000 ft3/s) (USGS 2002). Peak daily average flow during 2000 was 6476 m3/s (228,700 ft3/s). Average daily flows for 2002 are plotted in Figure 4.3-3. As noted, both Figures 4.3-2 and 4.3-3 include provisional data from the U.S. Geological Survey that have not yet been reviewed and are subject to change. Columbia River flows typically peak from April through June during spring runoff from snowmelt and are lowest from September through October. As a result of daily fluctuations in discharges from Priest Rapids Dam, the depth of the river varies significantly over a short time period. River stage changes of up to 3 m ( I 0 ft) during a 24-hr period may occur along the Hanford Reach (Poston et al. 2000). The width of the river varies from approximately 300 m (1000 ft) to 1000 m (3300 ft) along the Hanford Reach. The width also varies temporally as the flow rate changes, which causes repeated wetting and drying of an area along the shoreline.
The primary uses of the Columbia River include the production of hydroelectric power, irrigation of cropland in the Columbia Basin, and transportation of materials by barge. The Hanford Reach is the upstream limit of barge traffic on the mainstem Columbia River. Barges are used to transport reactor vessels from decommissioned nuclear submarines to Hanford for disposal. Several communities located along the Columbia River rely on the river as their source of drinking water. The Columbia River is also used as a source of both drinking water and industrial water for several Hanford Site facilities (Dirkes 1993). In addition, the Columbia River is used extensively for recreation, including fishing, hunting, boating, sailboarding, water-skiing, diving, and swimming.
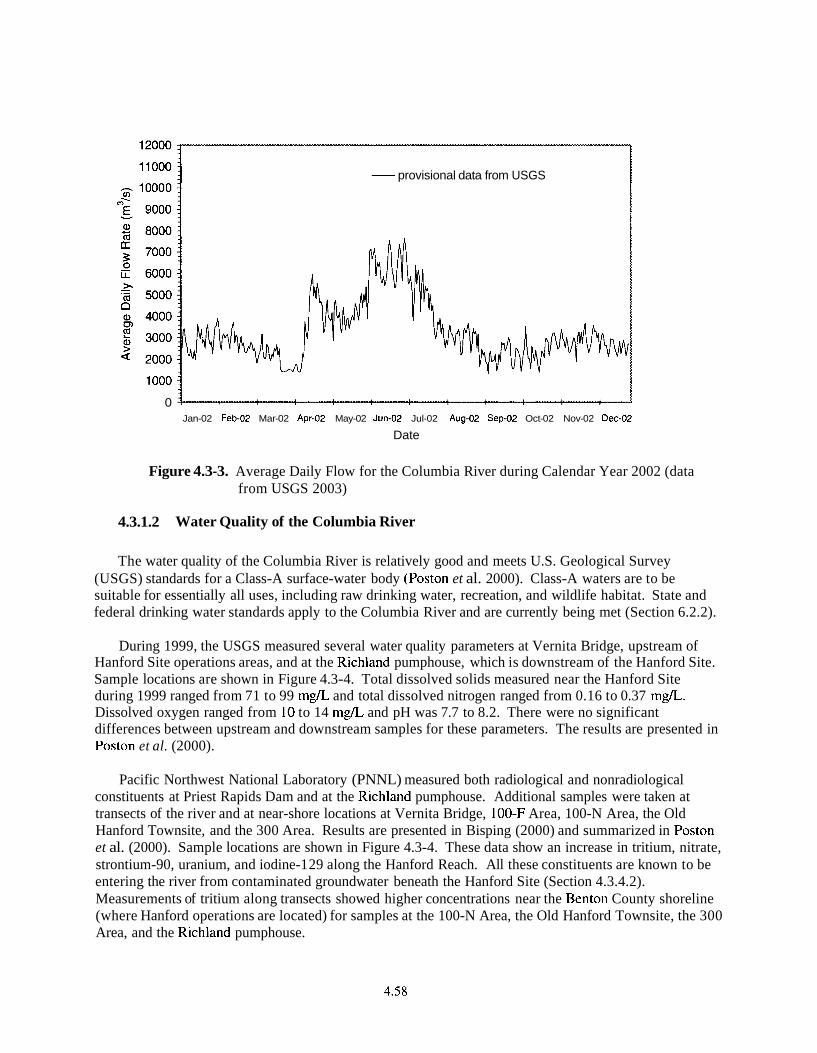
0 Jan-02 Feb-02 Mar-02 Apr-02 May-02 Jun-02 Jul-02 Aug-02 Sep-02 Oct-02 Nov-02 Dec-02
Date
- provisional data from USGS
Figure 4.3-3. Average Daily Flow for the Columbia River during Calendar Year 2002 (data from USGS 2003)
4.3.1.2 Water Quality of the Columbia River
The water quality of the Columbia River is relatively good and meets U.S. Geological Survey (USGS) standards for a Class-A surface-water body (Poston et al. 2000). Class-A waters are to be suitable for essentially all uses, including raw drinking water, recreation, and wildlife habitat. State and federal drinking water standards apply to the Columbia River and are currently being met (Section 6.2.2).
During 1999, the USGS measured several water quality parameters at Vernita Bridge, upstream of Hanford Site operations areas, and at the Richland pumphouse, which is downstream of the Hanford Site. Sample locations are shown in Figure 4.3-4. Total dissolved solids measured near the Hanford Site during 1999 ranged from 71 to 99 mg/L and total dissolved nitrogen ranged from 0.16 to 0.37 mg/L. Dissolved oxygen ranged from 10 to 14 mg/L and pH was 7.7 to 8.2. There were no significant differences between upstream and downstream samples for these parameters. The results are presented in Poston et al. (2000).
Pacific Northwest National Laboratory (PNNL) measured both radiological and nonradiological constituents at Priest Rapids Dam and at the Richland pumphouse. Additional samples were taken at transects of the river and at near-shore locations at Vernita Bridge, 100-F Area, 100-N Area, the Old Hanford Townsite, and the 300 Area. Results are presented in Bisping (2000) and summarized in Poston et al. (2000). Sample locations are shown in Figure 4.3-4. These data show an increase in tritium, nitrate, strontium-90, uranium, and iodine-1 29 along the Hanford Reach. All these constituents are known to be entering the river from contaminated groundwater beneath the Hanford Site (Section 4.3.4.2). Measurements of tritium along transects showed higher concentrations near the Benton County shoreline (where Hanford operations are located) for samples at the 100-N Area, the Old Hanford Townsite, the 300 Area, and the Richland pumphouse.
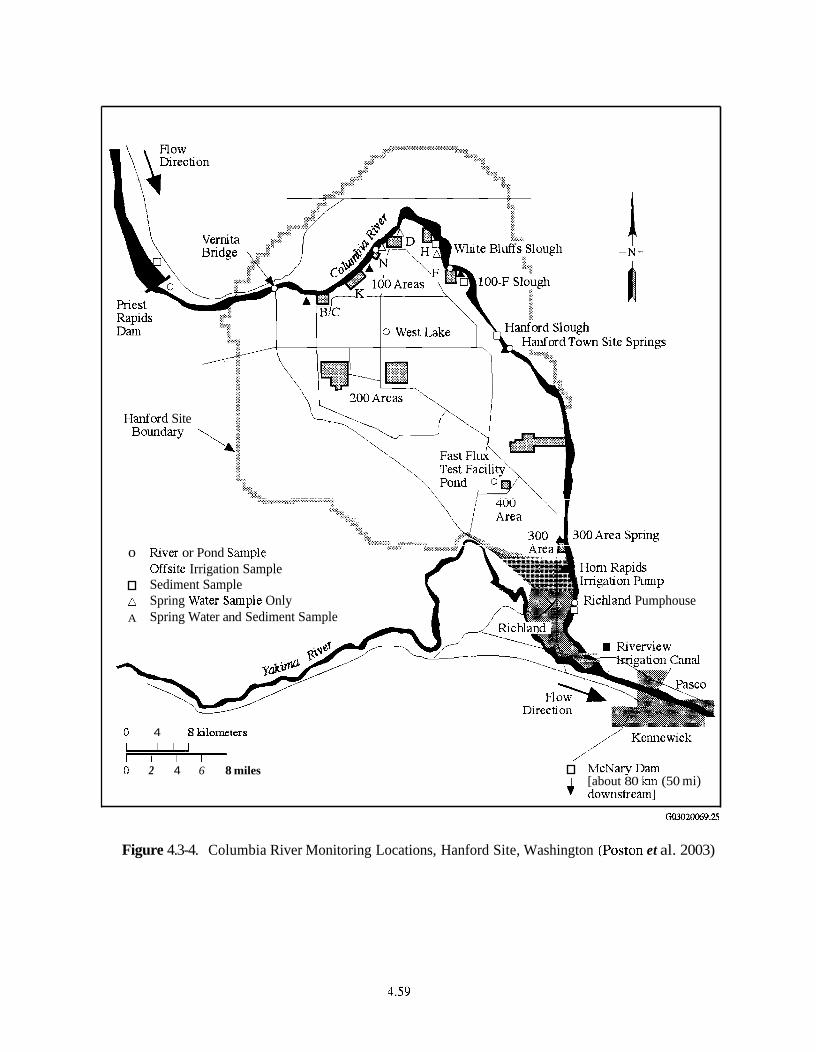
Hadord Site
o Ever or Pond Sample Offsite Irrigation Sample Sediment Sample
n Spring Water Sample Only Richland Pumphouse A Spring Water and Sediment Sample
O 4 8 kilometers LLLU -
O 2 4 6 8 miles McNary Dam [about 80 h (50 mi) + donisbeam]
CiO3020069.25
Figure 4.3-4. Columbia River Monitoring Locations, Hanford Site, Washington (Poston et al. 2003)
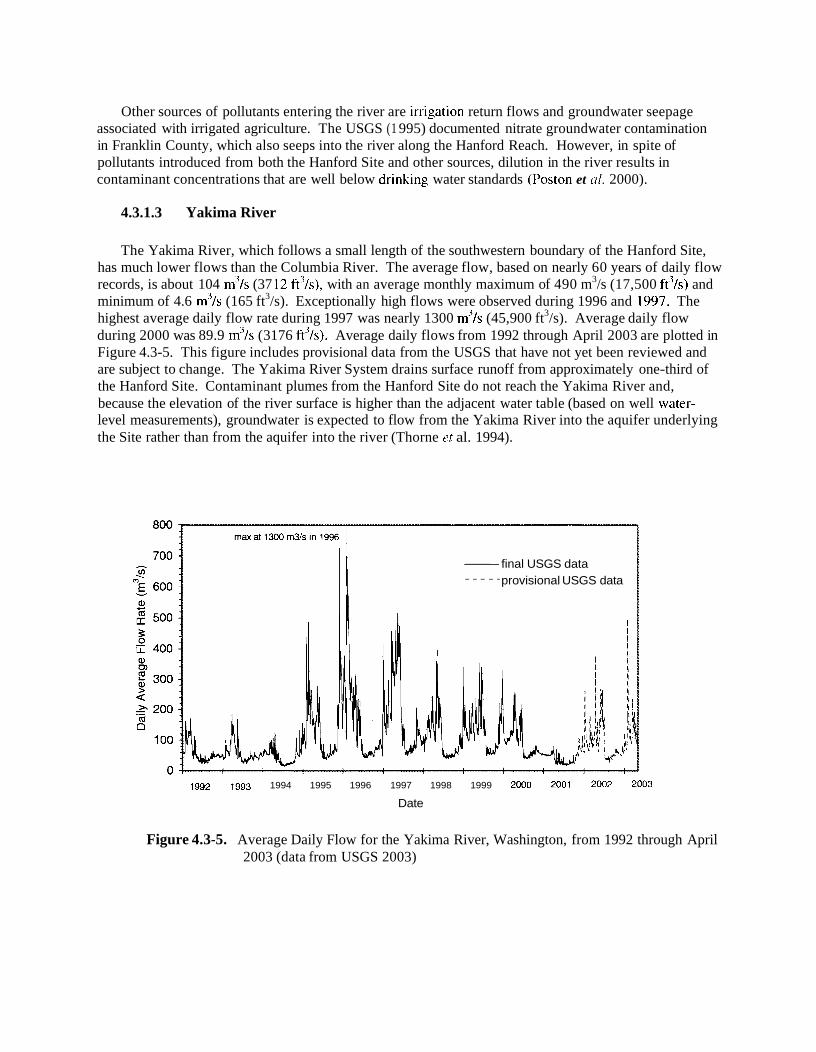
Other sources of pollutants entering the river are irrigation return flows and groundwater seepage associated with irrigated agriculture. The USGS (1 995) documented nitrate groundwater contamination in Franklin County, which also seeps into the river along the Hanford Reach. However, in spite of pollutants introduced from both the Hanford Site and other sources, dilution in the river results in contaminant concentrations that are well below drinking water standards (Poston et al. 2000).
4.3.1.3 Yakima River
The Yakima River, which follows a small length of the southwestern boundary of the Hanford Site, has much lower flows than the Columbia River. The average flow, based on nearly 60 years of daily flow records, is about 104 mys (37 12 ftvs), with an average monthly maximum of 490 m3/s (17,500 ft"/s and minimum of 4.6 m3/s (165 ft3/s). Exceptionally high flows were observed during 1996 and 1997. The highest average daily flow rate during 1997 was nearly 1300 mys (45,900 ft3/s). Average daily flow during 2000 was 89.9 mys (3 176 ft3/s). Average daily flows from 1992 through April 2003 are plotted in Figure 4.3-5. This figure includes provisional data from the USGS that have not yet been reviewed and are subject to change. The Yakima River System drains surface runoff from approximately one-third of the Hanford Site. Contaminant plumes from the Hanford Site do not reach the Yakima River and, because the elevation of the river surface is higher than the adjacent water table (based on well water- level measurements), groundwater is expected to flow from the Yakima River into the aquifer underlying the Site rather than from the aquifer into the river (Thorne er al. 1994).
final USGS data - - - - - provisional USGS data
1992 1993 1994 1995 1996 1997 1998 1999 2000 2007 2002 2003
Date
Figure 4.3-5. Average Daily Flow for the Yakima River, Washington, from 1992 through April 2003 (data from USGS 2003)
4.3.1.4 Springs and Streams
Several springs are found on the slopes of the Rattlesnake Hills along the western edge of the Hanford Site (DOE 1988). The Nature Conservancy of Washington, in its Biodiversity Inventory and Analysis of the Hanford Site - 1997 Annual Report (Hall 1998), documented an alkaline spring at the east end of Umtanum Ridge. Rattlesnake and Snively springs form small surface streams. Water discharged from Rattlesnake Springs flows down Dry Creek for about 3 km (1.6 mi) before disappearing into the ground (Figure 4.3-1). Cold Creek and its tributary, Dry Creek, are ephemeral streams within the Yakima River drainage system in the southwestern portion of the Hanford Site. These streams drain areas to the west of the Hanford Site and cross the southwestern part of the Site toward the Yakima River. When surface flow occurs, it infiltrates rapidly and disappears into the surface sediments in the western part of the Site. The ecological characteristics of these systems are described in Section 4.4.2.2.
4.3.1.5 Columbia Riverbank Seepage
The seepage of groundwater into the Columbia River has been known to occur for many years. Riverbank seeps were documented along the Hanford Reach long before Hanford operations began (Jenkins 1922). In the early 1980s, researchers identified 115 springs along the Benton County shoreline of the Hanford Reach (McCormack and Carlile 1984). Seepage occurs both below the river surface and on the exposed riverbank, particularly at low-river stage. The seeps flow intermittently, apparently influenced primarily by changes in river level. In many areas, water flows from the river into the aquifer at high river stage and then returns to the river at low river stage. This "bank-storage" phenomenon has been numerically modeled for the 100 H Area (Hartman et al. 2001).
In areas of contaminated groundwater, seeps and springs are also generally contaminated. However, the concentrations in seeping water along the riverbank may be lower than groundwater because of the bank-storage phenomenon. Elevated levels of contaminants have also been detected in near shore samples downstream from riverbank seeps (Poston et al. 2000). Riverbank seeps are monitored for radionuclides at the 100-N Area, the Old Hanford Townsite, and the 300 Area. Hanford-origin contaminants have been documented in some of these seeps (Peterson and Johnson 1992, Poston et al. 2000). Detected radionuclides include strontium-90, technetium-99, iodine-129, uranium-234, -235, and -238, and tritium. Detected chemicals include arsenic, chromium, chloride, fluoride, nitrate, and sulfate. Volatile organic compounds were near or below the detection limits. Results of these samples are listed in Bisping (2000) and summarized in Poston et al. (2000). Water samples are also collected along the 100-N shoreline at monitoring well 199-N-46 and at shoreline seepage wells. A strontium-90 concentration higher than the 1000 pCi/L (37.34 BqL) derived concentration guide was reported in 1999 for one of these seepage-monitoring wells (Poston et al. 2000). There were no visible riverbank seeps in the vicinity of this well. Concentrations of radionuclides including tritium, technetium-99, and iodine- 129 in riverbank seeps near the Old Hanford Townsite have generally been increasing since 1994. This is an area where a major groundwater plume from the 200 East Area intercepts the river. However, tritium concentration has declined since 1997. This decline may be due to the effects of radioactive decay andlor less wastewater disposal, resulting in the groundwater tritium plume moving at a slower velocity.
4.3.1.6 Runoff and Net Infiltration
Total estimated precipitation over the Pasco Basin is about 9 xlo8 m3 (3.2 x 10I0ft3) annually (DOE 1988). This was calculated by multiplying the average annual precipitation averaged over the Pasco Basin by the 4900 km2 (1900 mi2) basin area. Precipitation varies both spatially and temporally with higher amounts generally falling at higher elevations. As noted in Section 4.1.3, annual precipitation measured at the Hanford Meteorology Station (HMS) has varied from 7.6 cm (3 in.) to 3 1.3 cm (12.3 in.)
since 1945. Most precipitation occurs during the late autumn and winter, with more than half of the annual amount occumng from November through February. Mean annual runoff from the Pasco Basin is estimated at c3.1 x 1 o7 mqYr (1.1 x 1 o9 ft31yr), or approximately 3% of the total precipitation (DOE 1988). Most of the remaining precipitation is lost through evapotranspiration. However, some precipitation that infiltrates the soil is not lost to evaporation or transpiration and eventually recharges the groundwater flow system.
4.3.1.7 Flooding
Large Columbia River floods have occurred in the past (DOE 1987), but the likelihood of recurrence of large-scale flooding has been reduced by the construction of several flood controllwater-storage dams upstream of the Hanford Site. Major floods on the Columbia River are typically the result of rapid melting of the winter snowpack over a wide area augmented by above-normal precipitation. The maximum historical flood on record occurred June 7, 1894, with a peak discharge at the Hanford Site of 21,000 m3/s (742,000 ft3/s). The floodplain associated with the 1894 flood is shown in Figure 4.3-6. This floodplain area was calculated by modeling based on topographic cross-sections across the river channel (ERDA 1976). The largest recent flood took place in 1948 with an observed peak discharge of 20,000 m3/s (700,000 ft3/s) at the Hanford Site. The probability of flooding at the magnitude of the 1894 and 1948 floods has been greatly reduced because of upstream regulation by dams (Figure 4.3-7). The exceptionally high runoff during the spring of 1996 resulted in a maximum discharge of nearly 11,750 m3/s (415,000 ft3/s) (USGS 2002).
There are no Federal Emergency Management Agency (FEMA) floodplain maps for the Hanford Reach of the Columbia River. FEMA only maps developing areas, and the Hanford Reach has been specifically excluded because the adjacent land is primarily under federal control.
Evaluation of flood potential is conducted in part through the concept of the probable maximum flood, which is determined from the upper limit of precipitation falling on a drainage area and other hydrologic factors, such as antecedent moisture conditions, snowmelt, and tributary conditions, that could result in maximum runoff. The probable maximum flood for the Columbia River downstream of Priest Rapids Dam has been calculated to be 40,000 m3/s (1.4 million ft3/s) and is greater than the 500-year flood. The floodplain associated with the probable maximum flood is shown in Figure 4.3-8. This flood would inundate parts of the 100 Areas located adjacent to the Columbia River, but the central portion of the Hanford Site would remain unaffected (DOE 1986).
The U.S. Army Corps of Engineers (Corps) (1989) has derived the Standard Project Flood with both regulated and unregulated peak discharges given for the Columbia River downstream of Priest Rapids Dam. Frequency curves for both natural (unregulated) and regulated peak discharges are also given for the same portion of the Columbia River. The regulated Standard Project Flood for this part of the river is given as 15,200 m3/s (54,000 ft3/s) and the 100-year regulated flood as 12,400 m3/s (440,000 ft3/s). A map for the 100-yr flood area is available (DOEIRL 1998) but impacts to the Site are negligible and would be less than the probable maximum flood (Figure 4.3-8).
Potential dam failures on the Columbia River have been evaluated. Upstream failures could arise from a number of causes, with the magnitude of the resulting flood depending on the degree of breaching at the dam. The Corps evaluated a number of scenarios on the effects of failures of Grand Coulee Dam, assuming flow conditions of 1 1,000 m3/s (400,000 ft3/s). For emergency planning, they hypothesized that 25% and 50% breaches, the "instantaneous" disappearance of 25% or 50% of the center section of the dam, would result from the detonation of nuclear explosives in sabotage or war. The discharge or floodwave resulting from such an instantaneous 50% breach at the outfall of the Grand Coulee Dam was determined to be 600,000 m3/s (21 million ft3/s). In addition to the areas inundated by the probable
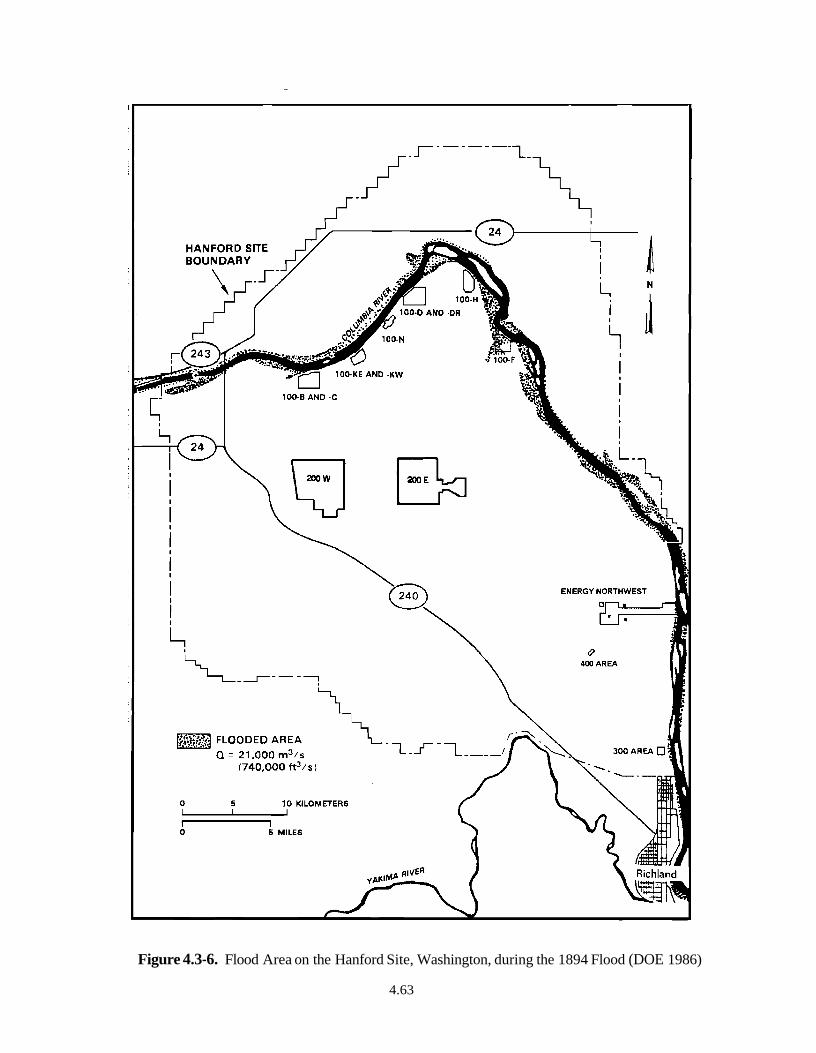
Figure 4.3-6. Flood Area on the Hanford Site, Washington, during the 1894 Flood (DOE 1986)
4.63
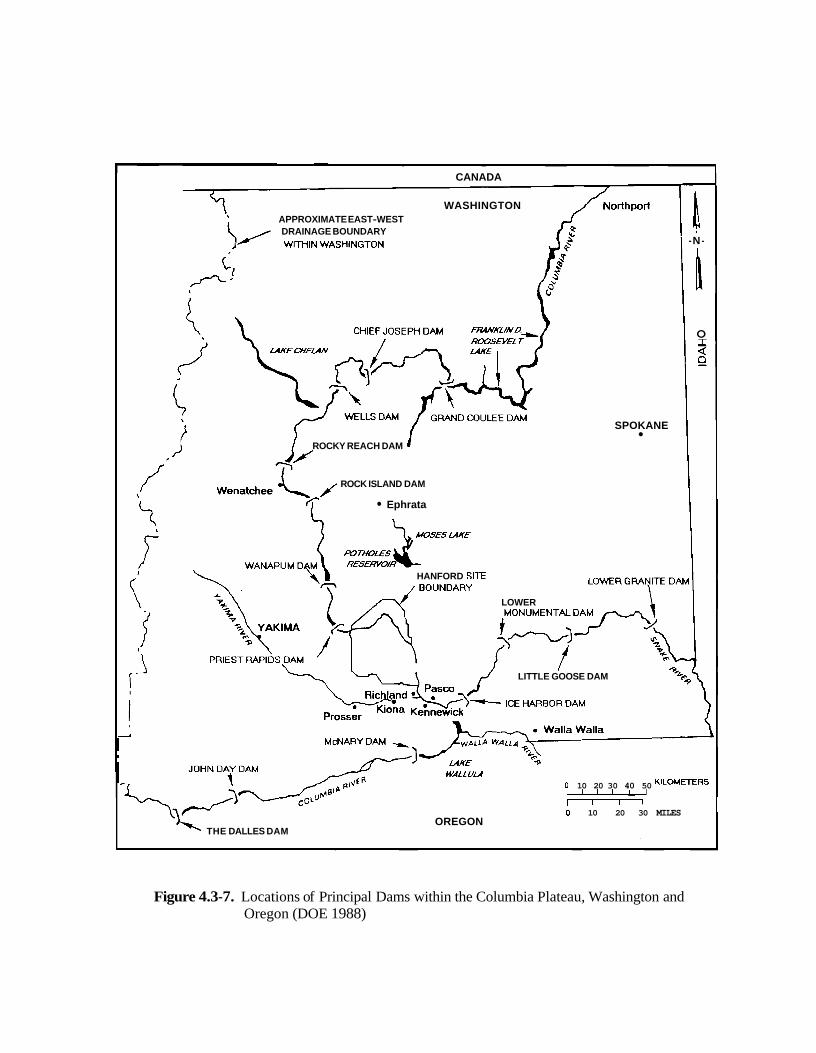
CANADA
WASHINGTON APPROXIMATE EAST-WEST DRAINAGE BOUNDARY
-N -
O LAKECWELAN
I
SPOKANE
ROCKY REACH DAM
ROCK ISLAND DAM
Ephrata
HANFORD SITE
LOWER
LITTLE GOOSE DAM
A
I
WALLULA 0 10 20 30 40 50 KILOMETERS - - 0 10 20 30 MILES
OREGON THE DALLES DAM
Figure 4.3-7. Locations of Principal Dams within the Columbia Plateau, Washington and Oregon (DOE 1988)
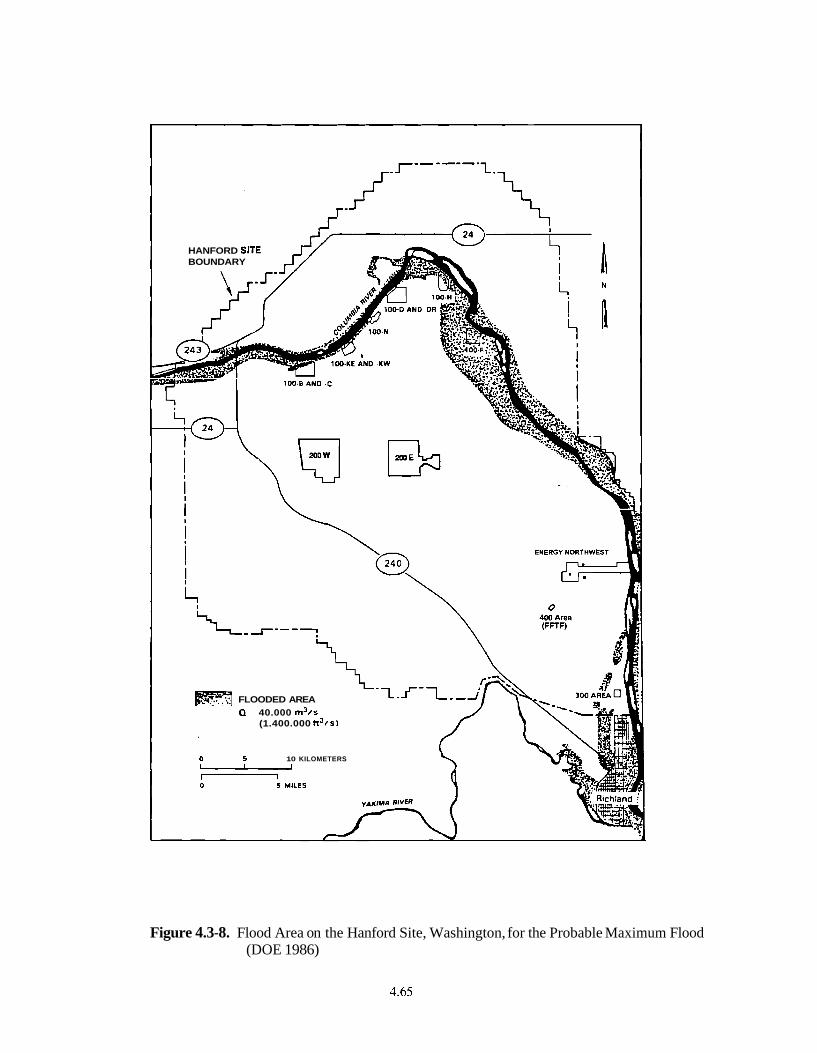
HANFORD SITE BOUNDARY
100-6 AND .C
FLOODED AREA Q 40.000 m3/s
(1.400.000 tt3/sl
10 KILOMETERS -
Figure 4.3-8. Flood Area on the Hanford Site, Washington, for the Probable Maximum Flood (DOE 1986)
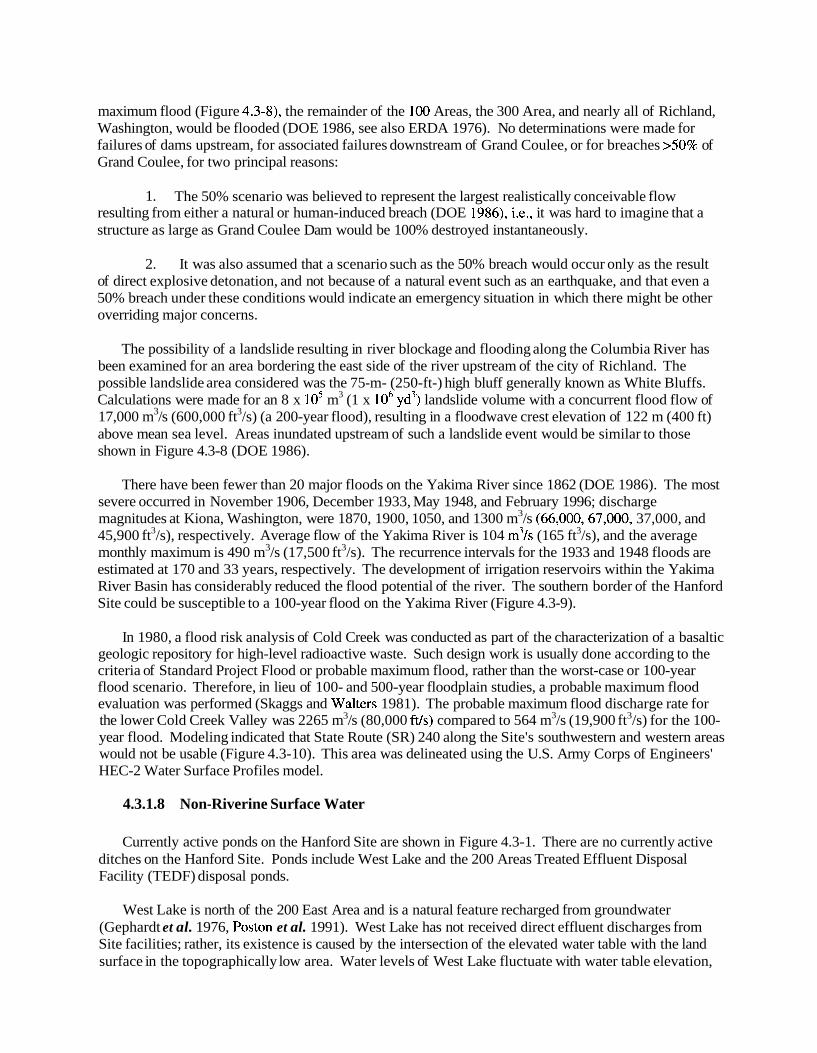
maximum flood (Figure 4.3-8), the remainder of the 100 Areas, the 300 Area, and nearly all of Richland, Washington, would be flooded (DOE 1986, see also ERDA 1976). No determinations were made for failures of dams upstream, for associated failures downstream of Grand Coulee, or for breaches ~ 5 0 % of Grand Coulee, for two principal reasons:
1. The 50% scenario was believed to represent the largest realistically conceivable flow resulting from either a natural or human-induced breach (DOE 1986), i.e., it was hard to imagine that a structure as large as Grand Coulee Dam would be 100% destroyed instantaneously.
2. It was also assumed that a scenario such as the 50% breach would occur only as the result of direct explosive detonation, and not because of a natural event such as an earthquake, and that even a 50% breach under these conditions would indicate an emergency situation in which there might be other overriding major concerns.
The possibility of a landslide resulting in river blockage and flooding along the Columbia River has been examined for an area bordering the east side of the river upstream of the city of Richland. The possible landslide area considered was the 75-m- (250-ft-) high bluff generally known as White Bluffs. Calculations were made for an 8 x lo5 m3 (1 x lo6 yd" landslide volume with a concurrent flood flow of 17,000 m3/s (600,000 ft3/s) (a 200-year flood), resulting in a floodwave crest elevation of 122 m (400 ft) above mean sea level. Areas inundated upstream of such a landslide event would be similar to those shown in Figure 4.3-8 (DOE 1986).
There have been fewer than 20 major floods on the Yakima River since 1862 (DOE 1986). The most severe occurred in November 1906, December 1933, May 1948, and February 1996; discharge magnitudes at Kiona, Washington, were 1870, 1900, 1050, and 1300 m3/s (66,000,67,000, 37,000, and 45,900 ft3/s), respectively. Average flow of the Yakima River is 104 m3/s (165 ft3/s), and the average monthly maximum is 490 m3/s (17,500 ft3/s). The recurrence intervals for the 1933 and 1948 floods are estimated at 170 and 33 years, respectively. The development of irrigation reservoirs within the Yakima River Basin has considerably reduced the flood potential of the river. The southern border of the Hanford Site could be susceptible to a 100-year flood on the Yakima River (Figure 4.3-9).
In 1980, a flood risk analysis of Cold Creek was conducted as part of the characterization of a basaltic geologic repository for high-level radioactive waste. Such design work is usually done according to the criteria of Standard Project Flood or probable maximum flood, rather than the worst-case or 100-year flood scenario. Therefore, in lieu of 100- and 500-year floodplain studies, a probable maximum flood evaluation was performed (Skaggs and Walters 1981). The probable maximum flood discharge rate for the lower Cold Creek Valley was 2265 m3/s (80,000 ft/s) compared to 564 m3/s (19,900 ft3/s) for the 100- year flood. Modeling indicated that State Route (SR) 240 along the Site's southwestern and western areas would not be usable (Figure 4.3-10). This area was delineated using the U.S. Army Corps of Engineers' HEC-2 Water Surface Profiles model.
4.3.1.8 Non-Riverine Surface Water
Currently active ponds on the Hanford Site are shown in Figure 4.3-1. There are no currently active ditches on the Hanford Site. Ponds include West Lake and the 200 Areas Treated Effluent Disposal Facility (TEDF) disposal ponds.
West Lake is north of the 200 East Area and is a natural feature recharged from groundwater (Gephardt et al. 1976, Poston et al. 1991). West Lake has not received direct effluent discharges from Site facilities; rather, its existence is caused by the intersection of the elevated water table with the land surface in the topographically low area. Water levels of West Lake fluctuate with water table elevation,
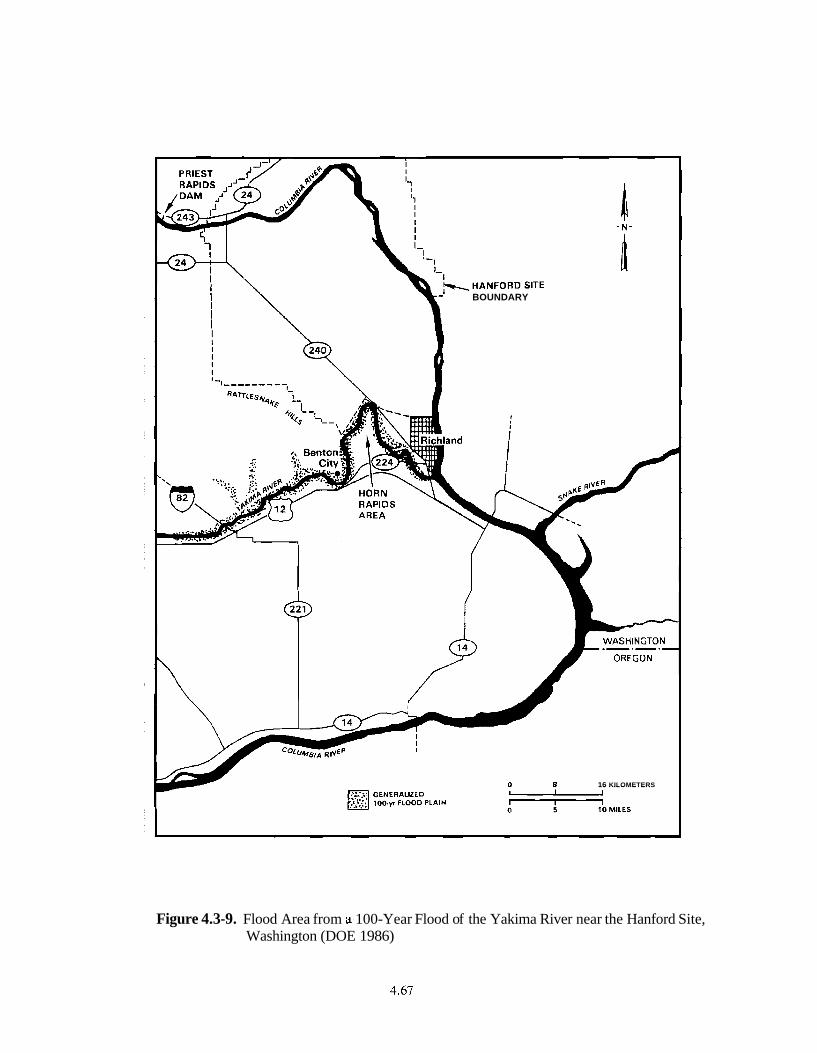
BOUNDARY
16 KILOMETERS
Figure 4.3-9. Flood Area from a. 100-Year Flood of the Yakima River near the Hanford Site, Washington (DOE 1986)
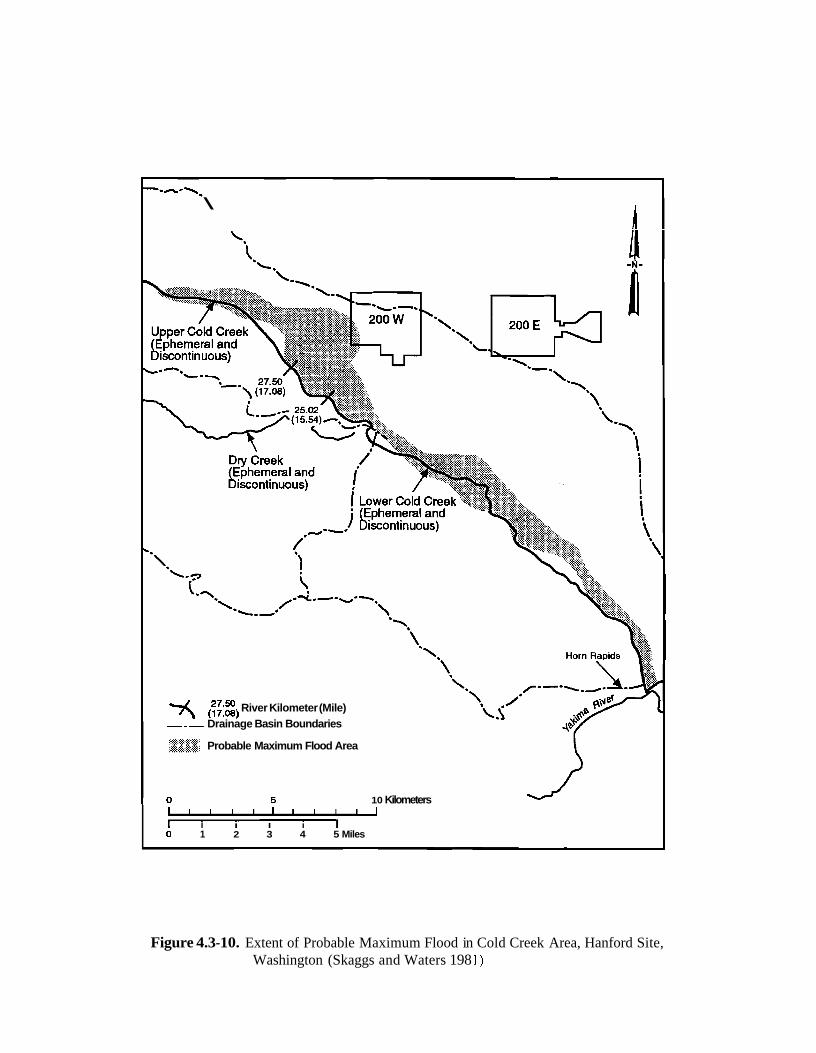
--n-\.
\
% River Kilometer (Mile) --- Drainage Basin Boundaries I<q$g:p )IS=;$ Probable Maximum Flood Area
0 5 10 Kilometers 1 1 1 1 1 1 1 1 1 1 1
I I I I I I 0 1 2 3 4 5 Miles
Figure 4.3-10. Extent of Probable Maximum Flood in Cold Creek Area, Hanford Site, Washington (Skaggs and Waters 198 1)
which is influenced by wastewater discharge in the 200 Areas. The water level and size of the lake has been decreasing over the past several years because of reduced wastewater discharge (Section 4.3.3.1). There is unsubstantiated information that sewage sludge may have been dumped in the vicinity of West Lake in the 1940s, and this has beencited as the reason for elevated dissolved solids and nitrate in the lake water (Emery and McShane 1978, Meinhardt and Frostenson 1979). However, it is possible that the concentration of salts resulted from evaporation of groundwater at the lake, which has no outlet. Total dissolved solids are approximately 15,000 mgL, and pH is over 9. Nitrate and ammonia concentrations of about 1.8 and 2.6 mg/L, respectively, have been reported, which are higher than freshwater lakes, but lower than other alkaline lakes in Washington such as Soap Lake and Lake Lenore. West Lake contains relatively high levels of uranium that are thought to be from natural sources concentrated by evaporation in the lake (Poston et al. 1991). Recent sampling results for West Lake are presented in Poston et al. (2000).
TEDF in the 200 Areas consists of two disposal ponds. These ponds are each 0.02 km2 (0.008 mi2) in size and receive industrial wastewater permitted in accordance with Ecology's State Waste Discharge Permit Program (WAC 173-216). The wastewater percolates into the ground from the disposal ponds.
The Nature Conservancy (Hall 1998) documented the existence of several naturally occurring vernal ponds near Gable Mountain and Gable Butte. These ponds appear to occur where a depression is present in a relatively shallow buried basalt surface. Water collects within the depression over the winter resulting in a shallow pond that dries during the summer months. The formation of these ponds in any particular year depends on the amount and temporal distribution of precipitation and snowmelt events. The vernal ponds range in size from about 20 ft x 20 ft to 150 ft x 100 ft (6.1 m x 6.1 m to 45.73 m x 30.5 m), and were found in three clusters. Approximately 10 were documented at the eastern end of Umtanum Ridge, 6 or 7 were observed in the central part of Gable Butte, and 3 were found at the eastern end of Gable Mountain. (See Figure 4.0-1 for Gable Mountain, Gable Butte, and Umtanum Ridge locations.)
Other than rivers and springs, there are no naturally occurring bodies of surface water adjacent to the Hanford Site. However, there are artificial wetlands, caused by irrigation, on the east and west sides of the Wahluke Slope, which lies north of the Columbia River. Hatcheries and irrigation canals constitute the only other artificial surface water in the Hanford Site vicinity. The Ringold Hatchery is located just south of the Hanford Site boundary on the east side of the Columbia River.
4.3.2 Hanford Site Vadose Zone
At the Hanford Site, the thickness of the vadose zone ranges from 0 m (0 ft) near the Columbia River to greater than 100 m (328 ft) beneath parts of the central plateau (Hartman 2000). Unconsolidated glacio-fluvial sands and gravels of the Hanford formation make up most of the vadose zone. In some areas, however, such as west and south of 200 East Area and in some of the 100 Areas, the fluvial- lacustrine sediments of the Ringold Formation make up the lower part of the vadose zone.
Moisture movement through the vadose zone is important at the Hanford Site because it is the driving force for migration of most contaminants to the groundwater. Radioactive and hazardous wastes in the soil column from past intentional liquid-waste disposals, unplanned leaks, solid waste burial grounds, and underground tanks are potential sources of continuing and future vadose zone and groundwater contamination. Contaminants may continue to move downward for long periods (tens to hundreds of years depending on recharge rates) after termination of liquid waste disposal.
Except for the State Approved Land Disposal Site (the 200 Area Treated Effluent Disposal Facility ponds), and septic drain fields, artificial recharge to the vadose zone ended in the mid-1990s. Currently,
the major source of recharge is natural precipitation. Natural infiltration in the vadose zone causes older preexisting water to be displaced downward by newly infiltrated water. The amount of recharge at any particular site is highly dependent on the soil type and the presence of vegetation. Usually, vegetation reduces the amount of infiltration through the biological process of transpiration.
Although most natural recharge is probably uniform flow (Jones et al. 1998), the vadose zone stratigraphy influences the movement of liquid through the soil column. Where conditions are favorable, lateral spreading of liquid effluent andlor local perched water zones may develop. Perched water zones form where downward moving moisture accumulates on top of low-permeability soil lenses or highly cemented horizons.
Preferential flow may also occur along discontinuities, such as clastic dikes and fractures. Clastic dikes are a common geologic feature in the suprabasalt sediments at the Hanford Site. Their most important fea.ture is their potential to either enhance or inhibit vertical and lateral movement of contaminants in the subsurface, depending on textural relationships. Fecht et al. (1998) give the most recent compilation of information known about clastic dikes in the Pasco Basin.
Subsurface source characterization, sediment sampling and characterization, and vadose zone monitoring are employed to describe the current and future configuration of contamination in the vadose zone.
4.3.2.1 Vadose Zone Contamination
The Hanford Site has more than 800 past-practice liquid-disposal facilities. Radioactive liquid waste was discharged to the vadose zone through reverse (injection) wells, French drains, cribs, ponds, trenches, and ditches. Over the last 56 years, 1.5 to 1.7 billion m' (396 to 449 billion gal) of effluent were disposed to the soils (Gephart 1999). Most effluent was released in the 200 Areas. The major groundwater contaminant plumes emanating from the 200 Areas are tritium and nitrate. The major source for both was discharges resulting from chemical processing.
Also of concern are technetium-99 and iodine-] 29 which, like tritium and nitrate, are mobile in groundwater. The major sources of technetium-99 and iodine-] 29 were discharges to liquid disposal facilities. Vadose zone sources for these contaminants almost certainly remain beneath many past- practice disposal facilities. However, other than physical sampling and laboratory analysis, there are no currently available monitoring techniques for tritium, nitrate, technetium-99 and iodine-129 in the vadose zone.
Approximately 280 unplanned releases in the 200 Areas also contributed contaminants to the vadose zone (DOE 1997a). Many of these were from underground tanks and have contributed significant contamination to the vadose zone. In addition, approximately 50 active and inactive septic tanks and drain fields and numerous radioactive and non-radioactive landfills and dumps have impacted the vadose zone (DOE 1997a). The landfills are and were used to dispose of solid wastes, which, in most instances, are easier to locate, retrieve, and remediate than are liquid wastes.
One hundred forty-nine single-shell tanks and 28 double-shell tanks have been used to store high- level radioactive and mixed wastes in the 200 Areas. The wastes resulted from uranium and plutonium recovery processes and, to a lesser extent, from strontium and cesium recovery processes. Sixty-seven of the single-shell tanks are assumed to have leaked an estimated total of 2839 to 3975 m' (750,000 to 1,050,000 gal) of contaminated liquid to the vadose zone (Hanlon 2001). The three largest tank leaks were 435,320 L ( I 15,000 gal), 37,850 to 1,048,560 L (10,000 to 277,000 gal), and 265,980 L (70,365 gal). The average tank leak was between 41,640 and 60,565 L (1 1,000 and 16,000 gal) (Hanlon 2001).
Cooling water from the single-pass reactors along the Columbia River was routinely routed to retention basins prior to return to the river. Thermal shock from the hot cooling water cracked the basins so that much of the cooling water leaked into the vadose zone. In addition, trenches were used for disposal of cooling water from 100-KE, 100-KW, and 100-N Reactors. The disposed cooling waters contained fission and neutron activation products and some chemicals and actinides. Of biggest concern are the impacts of tritium, strontium-90, nitrate, and chromium migrating through the vadose zone to groundwater, and ultimately, to the Columbia River. Chromium is actively being remediated at the 100-K and 100-H Areas by pump-and-treat methods and in the 100-DIDR Area by pump-and-treat and in situ redox methods (Hartman et al. 2001).
Highly contaminated cooling water, such as water that had contacted broken fuel rods, was routed to trenches rather than being directly returned to the river. These fluids contained large quantities of fission and neutron activation products.
Leakage from fuel-storage basins in the 100-K Area also contributes potential significant inventories of fission products, transuranics, and carbon-14 to the soil column (Johnson et al. 1995). Thus, both past- practice sites and fuel-storage basin leakage are potential vadose zone sources of contaminants in the 100 Areas.
The amount of contamination remaining in the vadose zone is uncertain. Several compilations of vadose zone contamination have been formulated through the past years. DOE (1997a) and Kincaid et al. (1998) contain the most recent inventories of contaminants disposed to past-practice liquid disposal facilities in the 200 Areas. Dorian and Richards (1978) list contaminant inventories disposed to most 100 Area past-practice facilities. Agnew (1997) and Anderson (1990) list inventories of effluents sent to single-shell tanks. Most recently, MacTec-ERS has issued a series of reports that estimate the curies of gamma emitting radionuclides and the volumes of contaminated soil associated with each single-shell tank farm. (A series of online reports on the Hanford Tank Farm Vadose Zone Project are available at: http://www.doeg.ipo.com/l>rograms/hanf/HTFVZ.html ) Their estimates for all locations for the three most widespread contaminants are 8901 Ci of Cesium-137 in 395,550 m3 of soil, 0.861 1 Ci of Europium- 154 in 30,133 m3 of soil, and 0.7424 Ci of Cobalt-60 in 74,369 m3 of soil.
Further information on vadose zone characterization and monitoring activities on the Hanford Site is available online at http://vadose.pnl.gov and http:Nwww.hanford.gov/cp/mp/ as well as in Ward and Gee (2000), Horton and Randall (2000), Hartman et al. (2001) and Serne et al. (2001a, b, c).
4.3.3 Groundwater
Groundwater is one component of the hydrologic cycle. Groundwater beneath the Hanford Site originated as either natural recharge from rain and snowmelt, or as artificial recharge from excess inigation, canal seepage, and wastewater disposal. The groundwater will eventually return to the surface environment as discharge to springs and seepage into rivers and streams, through evaporation from shallow water table areas, or brought to the surface through wells or excavations; however, it may take many thousands of years for groundwater in deeper aquifers to reach the surface.
4.3.3.1 Hanford Site Aquifer System
Groundwater beneath the Hanford Site is found in both an upper unconfined aquifer system and deeper basalt-confined aquifers. The unconfined aquifer system is also referred to as the suprabasalt aquifer system because it is within the sediments that overlie the basalt bedrock. Figure 4.2-4 exhibits a stratigraphic column showing the relative positions of the basalts and overlying sediments. Portions of
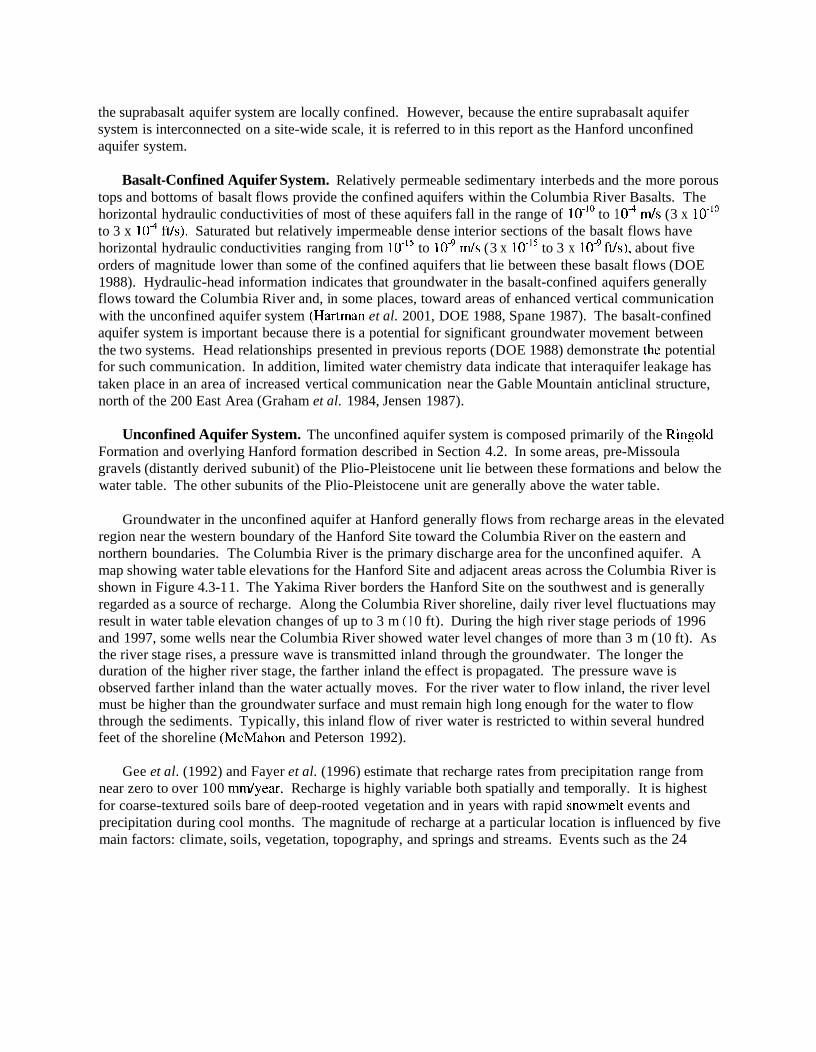
the suprabasalt aquifer system are locally confined. However, because the entire suprabasalt aquifer system is interconnected on a site-wide scale, it is referred to in this report as the Hanford unconfined aquifer system.
Basalt-Confined Aquifer System. Relatively permeable sedimentary interbeds and the more porous tops and bottoms of basalt flows provide the confined aquifers within the Columbia River Basalts. The horizontal hydraulic conductivities of most of these aquifers fall in the range of 10-lo to 1 o - ~ m/s (3 x to 3 x ftls). Saturated but relatively impermeable dense interior sections of the basalt flows have horizontal hydraulic conductivities ranging from to m/s (3 x lo-" to 3 x ft/s), about five orders of magnitude lower than some of the confined aquifers that lie between these basalt flows (DOE 1988). Hydraulic-head information indicates that groundwater in the basalt-confined aquifers generally flows toward the Columbia River and, in some places, toward areas of enhanced vertical communication with the unconfined aquifer system (Hartman et al. 2001, DOE 1988, Spane 1987). The basalt-confined aquifer system is important because there is a potential for significant groundwater movement between the two systems. Head relationships presented in previous reports (DOE 1988) demonstrate the potential for such communication. In addition, limited water chemistry data indicate that interaquifer leakage has taken place in an area of increased vertical communication near the Gable Mountain anticlinal structure, north of the 200 East Area (Graham et al. 1984, Jensen 1987).
Unconfined Aquifer System. The unconfined aquifer system is composed primarily of the Ringold Formation and overlying Hanford formation described in Section 4.2. In some areas, pre-Missoula gravels (distantly derived subunit) of the Plio-Pleistocene unit lie between these formations and below the water table. The other subunits of the Plio-Pleistocene unit are generally above the water table.
Groundwater in the unconfined aquifer at Hanford generally flows from recharge areas in the elevated region near the western boundary of the Hanford Site toward the Columbia River on the eastern and northern boundaries. The Columbia River is the primary discharge area for the unconfined aquifer. A map showing water table elevations for the Hanford Site and adjacent areas across the Columbia River is shown in Figure 4.3-1 1. The Yakima River borders the Hanford Site on the southwest and is generally regarded as a source of recharge. Along the Columbia River shoreline, daily river level fluctuations may result in water table elevation changes of up to 3 m (1 0 ft). During the high river stage periods of 1996 and 1997, some wells near the Columbia River showed water level changes of more than 3 m (10 ft). As the river stage rises, a pressure wave is transmitted inland through the groundwater. The longer the duration of the higher river stage, the farther inland the effect is propagated. The pressure wave is observed farther inland than the water actually moves. For the river water to flow inland, the river level must be higher than the groundwater surface and must remain high long enough for the water to flow through the sediments. Typically, this inland flow of river water is restricted to within several hundred feet of the shoreline (McMahon and Peterson 1992).
Gee et al. (1992) and Fayer et al. (1996) estimate that recharge rates from precipitation range from near zero to over 100 mrnlyear. Recharge is highly variable both spatially and temporally. It is highest for coarse-textured soils bare of deep-rooted vegetation and in years with rapid snowmelt events and precipitation during cool months. The magnitude of recharge at a particular location is influenced by five main factors: climate, soils, vegetation, topography, and springs and streams. Events such as the 24
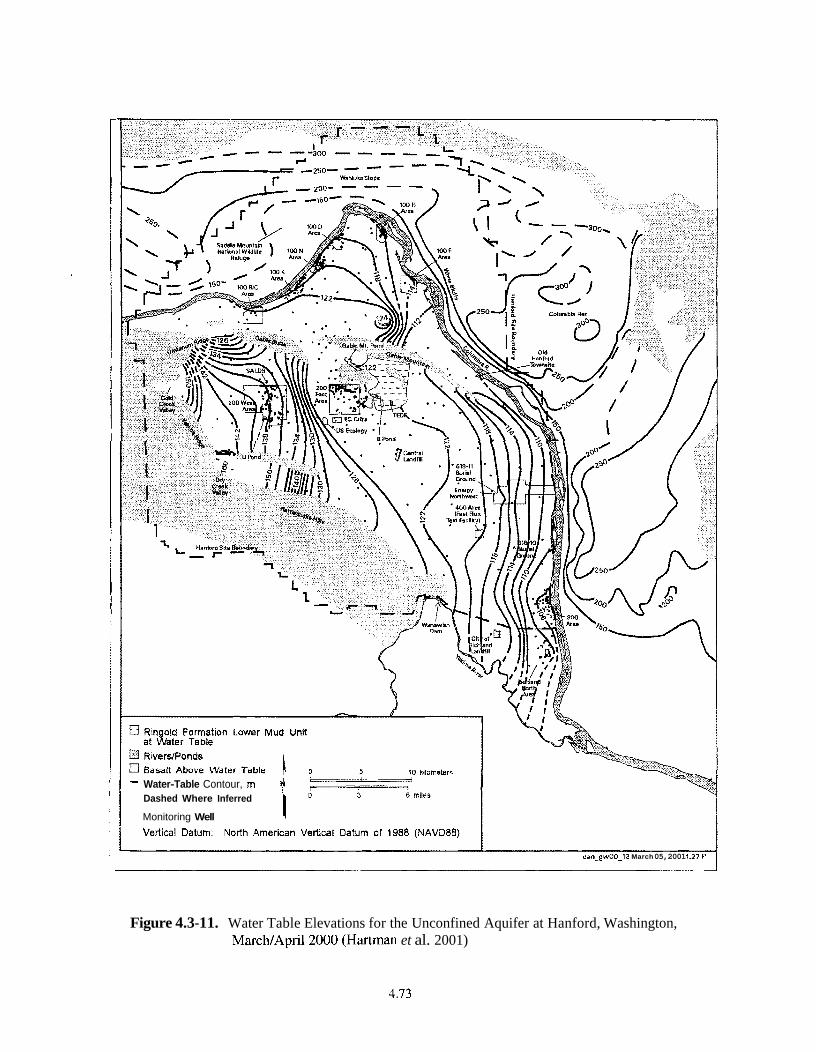
ID kilomders
- Water-Table Contour, rn Dashed Where Inferred
Monitoring Well
can-gw00-13 March 05,2001 1:27 P
Figure 4.3-11. Water Table Elevations for the Unconfined Aquifer at Hanford, Washington, MarchlApril2000 (Hartman et al. 2001)
Command Fire that burned vegetation from a large portion of the Hanford Site during the summer of 2000 also affect recharge rates. Fayer et al. (1996) used several types of field data and computer modeling to estimate the areal distribution of mean recharge rates for the soil and vegetation conditions at the Hanford Site, including any disturbance by Hanford operations.
Between 1944 and the mid-1990s, the volume of artificial recharge from Hanford wastewater disposal was significantly greater than the natural recharge. An estimated 1.68 x 10¹² L (4.44 x 10" gal) of liquid was discharged to disposal ponds, trenches, and cribs during this period. Wastewater discharge has decreased since 1984 and currently contributes a volume of recharge in the same range as the estimated natural recharge from precipitation. Because of the reduction in discharges, groundwater levels are falling, particularly around the operational areas (Hartman 2000).
After the beginning of Hanford operations in 1943, the water table rose about 27 m (89 ft) under the U Pond disposal area in the 200 West Area and about 9.1 m (30 ft) under disposal ponds near the 200 East Area. The volume of water that was discharged to the ground at the 200 West Area was actually less than that discharged at the 200 East Area. However, the lower conductivity of the a.quifer near the 200 West Area inhibited groundwater movement in this area resulting in a higher groundwater mound. The presence of the groundwater mounds locally affected the direction of groundwater movement, causing radial flow from the discharge areas. Zimmerman et al. (1986) documented changes in water table elevations between 1950 and 1980. Until about 1980, the edge of the mounds migrated outward from the sources over time. Groundwater levels have declined over most of the Hanford Site since 1984 because of decreased wastewater discharges (Hartman 2000). Although the reduction of wastewater discharges has caused water levels to drop significantly, a residual groundwater mound beneath the 200 West Area is still shown by the curved water table contours near this area (Figure 4.3-1 1) and small groundwater mounds exist near the 200 Areas Treated Effluent Disposal Facility and the State-approved land disposal structure wastewater disposal sites. The contour interval in Figure 4.3-1 1 is too large to show these groundwater mounds.
Horizontal hydraulic conductivities of sand and gravel facies within the Ringold Formation generally range from about lo-' to 1 0-4 mls (0.9 to 9 ftld), compared to 10.' to m/s (1 000 to 10,000 ft/d) for the Hanford formation (DOE 1988). Because the Ringold sediments are more consolidated and partially cemented, they are about 10 to 100 times less permeable than the sediments of the overlying Hanford formation. Before wastewater disposal operations at the Hanford Site, the uppermost aquifer was mainly within the Ringold Formation, and the water table extended into the Hanford formation at only a few locations (Newcomb et al. 1972). However, wastewater discharges raised the water table elevation across the Site. The general increase in groundwater elevation caused the unconfined aquifer to extend upward into the Hanford formation over a larger area, particularly near the 200 East Area. This resulted in an increase in groundwater velocity because of both the greater volume of groundwater and the higher permeability of the newly saturated Hanford sediments.
Limitations of Hydrogeologic Information. The sedimentary architecture of the unconfined aquifer is very complex because of repeated deposition and erosion. Although hundreds of wells have been drilled on the Hanford Site, many penetrate only a small percentage of the total unconfined aquifer thickness, and there are a limited number of useful wells for defining the deeper sediment facies. A number of relatively deep wells were drilled in the early 1980s as part of a study for a proposed nuclear power plant (PSPL 1982), and these data are helpful in defining facies architecture. For most of the thinner and less extensive sedimentary units, correlation between wells is either not possible or uncertain. Major sand and gravel units of the Ringold Formation (e.g., Units A, B, C, D, and E) are separated by mud-dominated units. In some places the mud units act as aquitards that locally confine groundwater in deeper permeable sediments.
A limited amount of hydraulic property data is available from testing of wells. Hydraulic test results from wells on the Hanford Site have been compiled for the Hanford Groundwater Monitoring Project and for environmental restoration efforts (Connelly et al. 1992(a,b), Kipp and Mudd 1973, Thorne and Newcomer 1992, Thorne et al. 1993, Thorne et al. 1994). Depths of the tested intervals have been correlated with the top of the unconfined aquifer as defined by the water table elevations presented in Newcomer et al. (1991). Most hydraulic tests were done within the upper 15 m (49 ft) of the aquifer, and many were open to more than one geologic unit. In some cases, changes in water table elevation may have significantly changed the unconfined aquifer transrnissivity at a well since the time of the hydraulic test. Few hydraulic tests within the Hanford Site unconfined aquifer system have yielded reliable estimates of aquifer-specific yield.
Groundwater Residence Times. Tritium and carbon-14 measurements indicate that residence or recharge time (length of time required to replace the groundwater) takes tens to hundreds of years for spring waters. Recharge takes from hundreds to thousands of years for the unconfined aquifer and more than 10,000 years for groundwater in the shallow confined aquifer (Johnson et al. 1992). However, groundwater travel time from the 200 East Area to the Columbia River has been shown to be much faster, in the range of 10 to 30 years (USGS 1987, Freshley and Graham 1988). This is because of large volumes of recharge from wastewater that was disposed in the 200 Areas between 1944 and the mid- 1990s and the relatively high permeability of Hanford formation sediments, which are below the water table between the 200 Areas and the Columbia River. Residence times in this portion of the aquifer are expected to increase because of the reduction in wastewater recharge in the 200 Areas. Chlorine-36 and noble gas isotope data suggest groundwater ages greater than 100,000 years in the deeper confined systems (Johnson et al. 1992). These relatively long residence times are consistent with semiarid-site recharge conditions.
Hydrology East and North of the Columbia River. The Hanford Site boundary extends east and north of the Columbia River to provide a buffer zone for non-Hanford activities such as recreation and agriculture. Hanford Site activities in these areas have not impacted the groundwater. However, the groundwater in this area is impacted by high artificial recharge from irrigation and canal leakage. The South Columbia Basin Irrigation District manages surface water used to irrigate land east and north of the Columbia River. Artificial recharge has increased water table elevations in large areas of the Pasco Basin, in some places by as much as 92 m (300 ft) (Drost et al. 1989).
There are two general hydrologic areas that impinge upon the Hanford Site boundaries to the east and north of the river. The eastern area extends from north to south between the lower slope of Saddle Mountain and the Esquatzel Diversion canal and includes the Ringold Coulee, White Bluffs area, and Esquatzel Coulee. The water table occurs in the Pasco gravels of the Hanford formation in both Ringold and Esquatzel Coulees. Brown (1979) reported that runoff from spring discharge at the mouth of Ringold Coulee is >37,850 L/min (10,000 gallmin). Elsewhere in this area, the unconfined aquifer is in the less- transmissive Ringold Formation. Irrigation has also created perched aquifers and resulted in a series of springs issuing from perched water along the White Bluffs. The increased hydraulic pressure in these sediments has caused subsequent slumping and landslides (Brown 1979, Newcomer et ul. 1991).
The other principal irrigated area is the northern part of the Pasco Basin on the Wahluke Slope, which lies between the Columbia River and the Saddle Mountain anticline. Irrigation on Wahluke Slope has created ponds and seeps in the Saddle Mountain Wildlife Refuge. The direction of unconfined groundwater flow is southward from the basalt ridges toward the Columbia River. Bauer et al. (1985) reported that lateral water table gradients are essentially equal to or slightly less than the structural gradients on the flanks of the anticlinal fold mountains where the basalt dips steeply.
4.3.4 Groundwater Quality
4.3.4.1 Natural Groundwater Quality
The natural quality of groundwater at the Hanford Site varies depending on the aquifer system and depth, which generally is related to residence time in the aquifer. Background water quality (i.e., unaffected by Hanford discharges) for the unconfined aquifer is discussed in DOE (1992a), DOE (1997b), and Hartman (2000). The DOE (1997b) study involved examination of historical data and new data from wells in areas not affected by Hanford Site contaminants.
Groundwater chemistry in the basalt-confined aquifers displays a range depending on depth and residence time (DOE 1988). The chemical type varies from a calcium and magnesium-carbonate water to a sodium- and chloride-carbonate water. Some of the shallower basalt-confined aquifers in the region (e.g., the Wanapum basalt aquifer) have exceptionally good water quality characteristics: <300 mg/L dissolved solids; ~ 0 . 1 mg/L iron and magnesium; <20 mg/L sodium, sulfate, and chloride; and <10 ppb heavy metals (Johnson et al. 1992). However, deeper basalt-confined aquifers typically have high dissolved solids content and some have fluoride concentrations over the drinking water standard of 5 mg/L (DOE 1988).
4.3.4.2 Groundwater Contamination and Monitoring
Groundwater beneath large areas of the Hanford Site has been impacted by radiological and chemical contaminants resulting from past Hanford Site operations. These contaminant; were primarily introduced through wastewater discharged to cribs, ditches, injection wells, trenches, and ponds (Kincaid et al. 1998). Additional contaminants from spills, leaking waste tanks, and burial grounds (landfills) have also impacted groundwater in some areas. Contaminant concentrations in the existing groundwater plumes are expected to decline through radioactive decay, chemical degradation, and dispersion. However, contaminants also exist within the vadose zone beneath waste sites (Section 4.3.2) as well as in waste storage and disposal facilities. These contaminants have a potential to continue to move downward into the aquifer. Some contaminants, such as tritium, move with the groundwater while the movement of other contaminants is slower because they react with or are sorbed on the surface of minerals within the aquifer or the vadose zone. Groundwater contamination is monitored and is being actively remediated in several areas through pump-and-treat operations. These are summarized in Hartman et al. (2001).
Monitoring of radiological and chemical constituents in groundwater at the Hanford Site is performed to characterize physical and chemical trends in the flow system, establish groundwater quality baselines, assess groundwater remediation, and identify new or existing groundwater problems. Groundwater monitoring is also performed to verify compliance with applicable environmental laws and regulations. Samples were collected from approximately 700 wells during fiscal year (FY) 2000 to determine the distributions of radiological and chemical constituents in Hanford Site groundwater. Detailed results and interpretations are presented in Hartman et al. (2001).
To assess the quality of groundwater, concentrations measured in samples were compared with maximum contaminant levels (MCL) or interim Drinking Water Standards (DWS) and DOE'S Derived Concentration Guides (DCG). The MCL or DWS standards are legal limits for contaminant concentrations in public drinking water supplies enforceable by the Washington State Department of Health or EPA. Although these standards are only applicable at the point of consumption of the groundwater, they provide a useful indicator of negative impacts to the groundwater resource. The DCG applies only to radionuclides and is based on the concentration that would result in a dose exposure of 100-mremlyear through ingestion under specified intake scenarios.
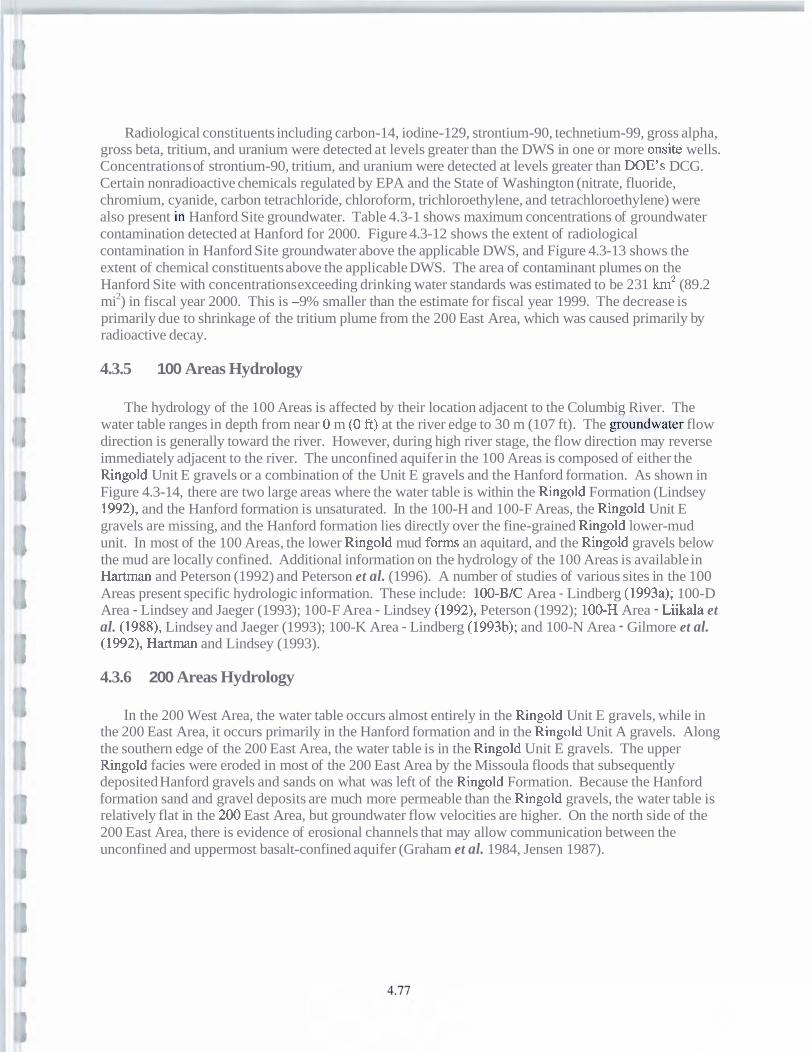
Radiological constituents including carbon-14, iodine-129, strontium-90, technetium-99, gross alpha, gross beta, tritium, and uranium were detected at levels greater than the DWS in one or more onsite wells. Concentrations of strontium-90, tritium, and uranium were detected at levels greater than DOE'S DCG. Certain nonradioactive chemicals regulated by EPA and the State of Washington (nitrate, fluoride, chromium, cyanide, carbon tetrachloride, chloroform, trichloroethylene, and tetrachloroethylene) were also present in Hanford Site groundwater. Table 4.3-1 shows maximum concentrations of groundwater contamination detected at Hanford for 2000. Figure 4.3-12 shows the extent of radiological contamination in Hanford Site groundwater above the applicable DWS, and Figure 4.3-13 shows the extent of chemical constituents above the applicable DWS. The area of contaminant plumes on the Hanford Site with concentrations exceeding drinking water standards was estimated to be 23 1 km2 (89.2 mi2) in fiscal year 2000. This is -9% smaller than the estimate for fiscal year 1999. The decrease is primarily due to shrinkage of the tritium plume from the 200 East Area, which was caused primarily by radioactive decay.
4.3.5 100 Areas Hydrology
The hydrology of the 100 Areas is affected by their location adjacent to the Columbig River. The water table ranges in depth from near 0 m (0 ft) at the river edge to 30 m (107 ft). The ghndwater flow direction is generally toward the river. However, during high river stage, the flow direction may reverse immediately adjacent to the river. The unconfined aquifer in the 100 Areas is composed of either the Ringold Unit E gravels or a combination of the Unit E gravels and the Hanford formation. As shown in Figure 4.3-14, there are two large areas where the water table is within the Ringold Formation (Lindsey 1992), and the Hanford formation is unsaturated. In the 100-H and 100-F Areas, the Ringold Unit E gravels are missing, and the Hanford formation lies directly over the fine-grained Ringold lower-mud unit. In most of the 100 Areas, the lower Ringold mud forms an aquitard, and the Ringold gravels below the mud are locally confined. Additional information on the hydrology of the 100 Areas is available in Hartman and Peterson (1992) and Peterson et al. (1996). A number of studies of various sites in the 100 Areas present specific hydrologic information. These include: 100-BlC Area - Lindberg (1993a); 100-D Area - Lindsey and Jaeger (1993); 100-F Area - Lindsey (1992), Peterson (1992); 100-H Area - Liikala et al. (1988), Lindsey and Jaeger (1993); 100-K Area - Lindberg (1993b); and 100-N Area - Gilmore et al. (1992), Hartman and Lindsey (1993).
4.3.6 200 Areas Hydrology
In the 200 West Area, the water table occurs almost entirely in the Ringold Unit E gravels, while in the 200 East Area, it occurs primarily in the Hanford formation and in the Ringold Unit A gravels. Along the southern edge of the 200 East Area, the water table is in the Ringold Unit E gravels. The upper Ringold facies were eroded in most of the 200 East Area by the Missoula floods that subsequently deposited Hanford gravels and sands on what was left of the Ringold Formation. Because the Hanford formation sand and gravel deposits are much more permeable than the Ringold gravels, the water table is relatively flat in the 200 East Area, but groundwater flow velocities are higher. On the north side of the 200 East Area, there is evidence of erosional channels that may allow communication between the unconfined and uppermost basalt-confined aquifer (Graham et al. 1984, Jensen 1987).
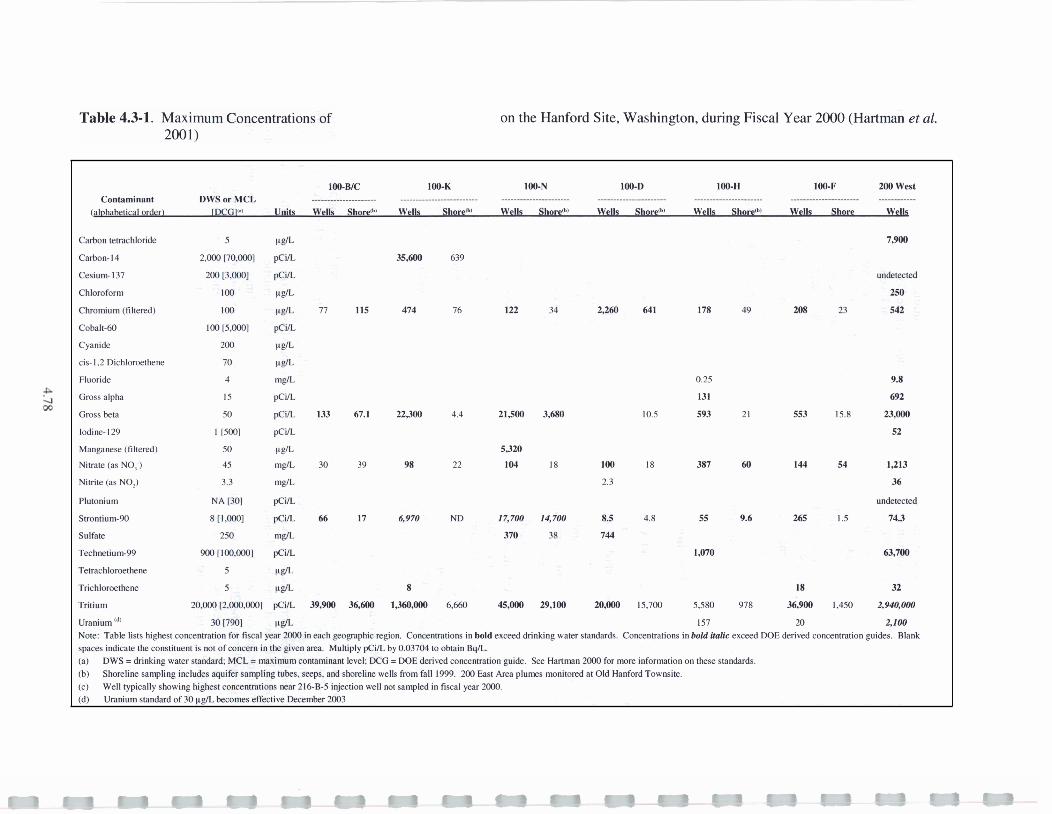
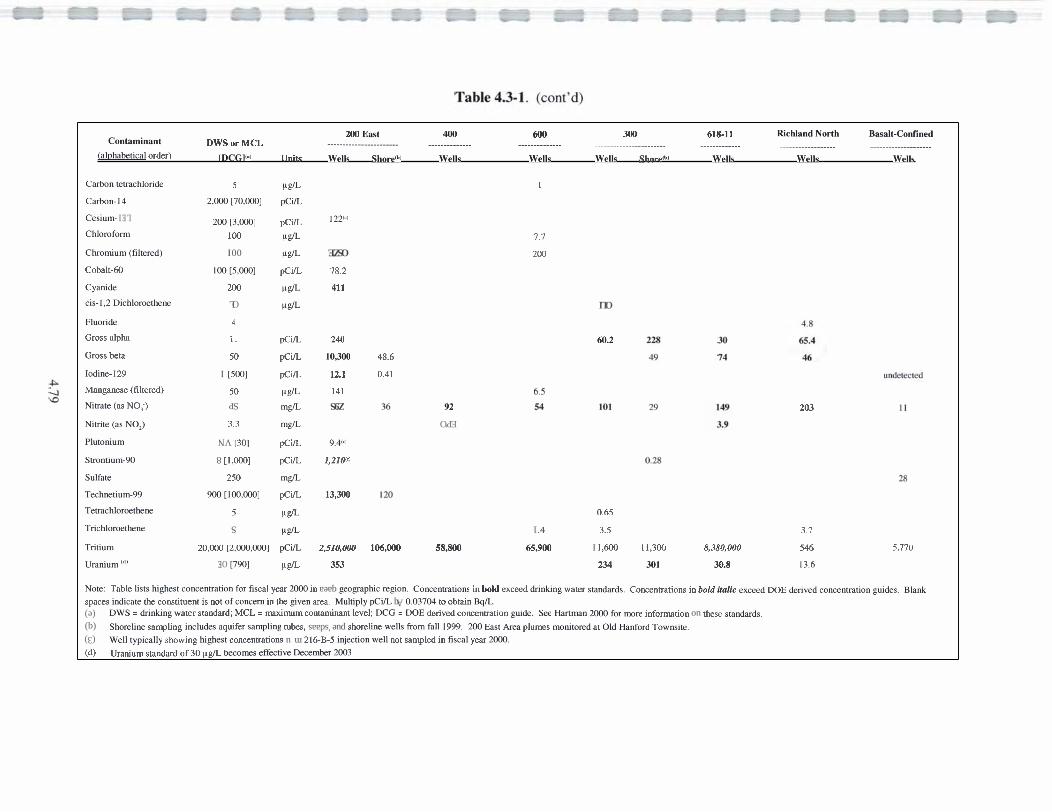
EOZ
EP'O
26
COY
OLI
00z
L'L
£00~ iaqruama aAn3aSJa saruo3aq l/%d OE JO prepuels mnNein (p) ,0002 maA 1~3s'~ u! paldwes IOU [lam uopmLu! S-8-91~ mu suogenua3uo~ ~saq%m Su~~oqs Al[e3!dA1 IIaM (3)
-a!sumo.~ piojue~ plo le pa.~ol~om sacunld KUV ]sea 00~ '6661 llej moy sllam aurlaoqs pue 'sdaas 'saqw Pu!ldu~es iajmbe sapnl:,u! %ugdwes augaoqs (q) .spmpuas asaq uo uogeuuo~u! =ow 103 000~ umv~?~ q .ap!d uopwua3uo~ paAuap 30a = 9~ :[anal meuye~uo:, mnmpnew = 73~ Ipiepms iaem 8uqu!~p = SM(I (e)
'vba u!nqo 01 M)LE~JIJ Aq ~9 h[dn[n&q 'ean ua~@ aq u! ma3uor, 30 lou s! luan1psuo3 aq aw!pu! sa:,eds Tel8 'sapm% uo!lenua3um PaA!Jap aoa Paeaxa 3!m moq u! suopenua3uo3 .sprepuns iaem Suyu!~p paa3xa ploq u! suogmua3uo3 'uot%ar ~!qddoa% qaea u! 000~ maA le3srJ ioj uope~lua3uo3 ,saq%!q sls!l alqe& :aIoN
9.61 8.0~ 10s PEZ csc u%d [O~LI OE (p, mnrue~n
~LL'S WS OOO'osc'8 006'11 009'1 I W'S9 008'8s 000'901 000‘01~'~ ~3d ~~'~'zI 000'02 UnnJI
L' E S'E P' 1 u%d S aua~aoiolq3u.~
59'0 v%d S auqaoioIq3ena~
00E'EI W3d [000'0011006 66-mnPurl3aL
u%m OSZ aeJInS
tllZ'I W3d ~000'11 8 06-mnnuons
(47'6 W3d [OEl VN wnmo~nld
vzw £'£ ('ON se) a!a!~
Z9S ?/am SP (-(ON se) aen!~
IP1 v%d 0s (paialg) asaueSuely
IP'O 1.~1 ~3d [WSl I 6z I -aulpoI
9'8P oOE'01 W3d 0s naq ssoig
OPZ W3d -1 eqdle sswg
b T!lonld
u%d OL auaq1aoiolq3!a z'1-s!3
IIP u%d Gilz ap!ueA3
Z'8L W3d [000'S1001 09-Ile903
OSZ'E u%d 00 I (PaJPIrJ) mnlruonl3
Mrl 001 WlOJOlO[t43
,.GZ 1 w3d [000'€100Z LEI -mn!sa3
I/!$ [~'OLIOOO'Z P 1 -uoqre3
1 Tad S WuOlq3B43l UOqJe3
SIPM SIPM SII~M tuaJoqs SIPM SIPM ~IPM tua~oqs ~II~M vrun ,.,~33a1 (iapio le3!1aqeqale) .................... ------------------ ------------- --------------..------- -----------... -----------.-- ....................... 13b4 JO SMa lueu!ruquo3 ~aul~u03-i@=~ WON PU~JM 11-819 OOE 009 OOt lm3 00Z
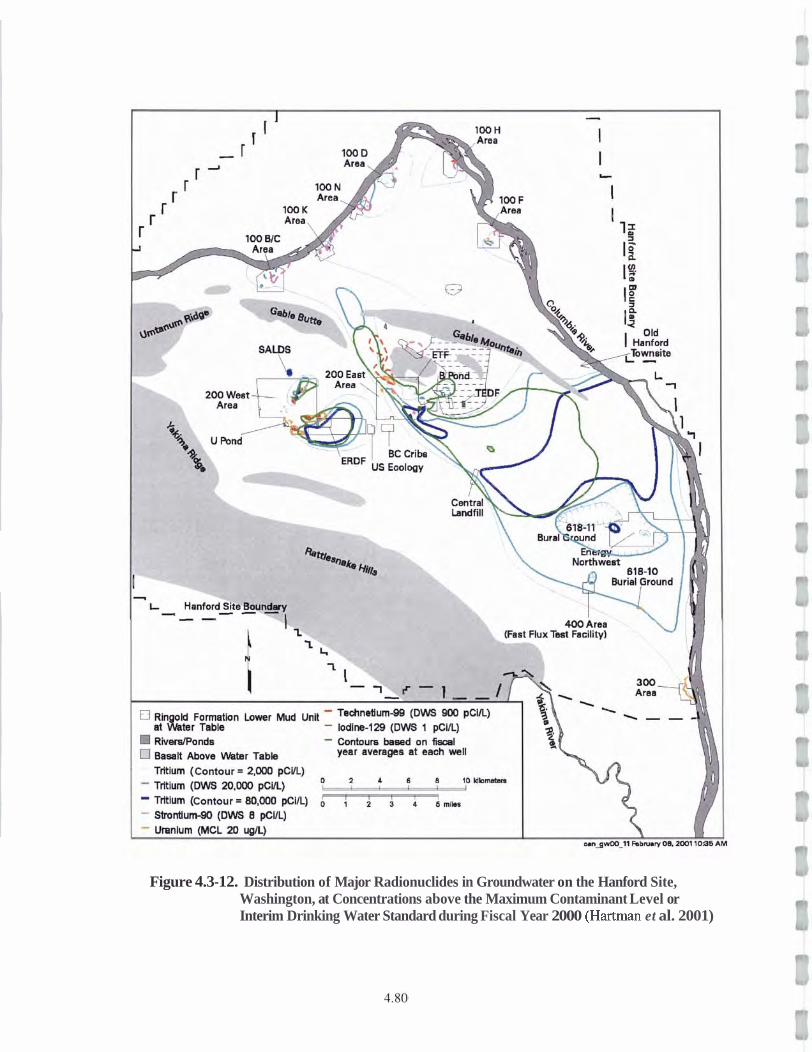
Figure 4.3-12. Distribution of Major Radionuclides in Groundwater on the Hanford Site, Washington, at Concentrations above the Maximum Contaminant Level or Interim Drinking Water Standard during Fiscal Year 2000 (Hartman et al. 2001)
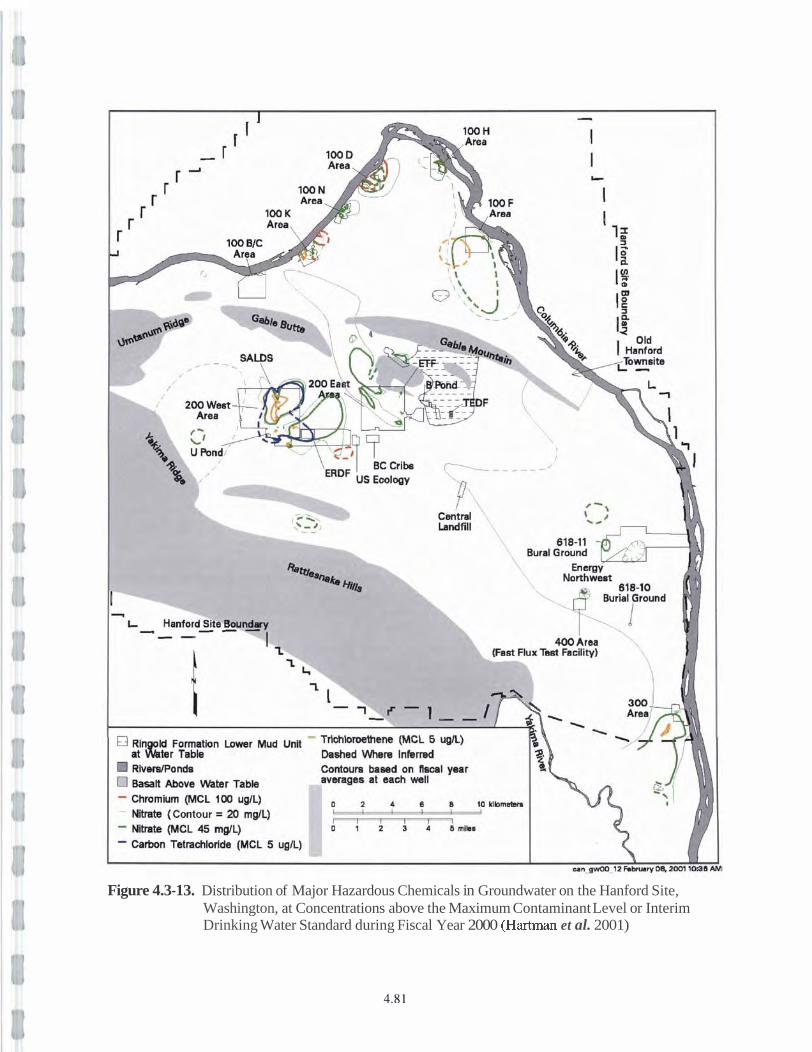
Figure 4.3-13. Distribution of Major Hazardous Chemicals in Groundwater on the Hanford Site, Washington, at Concentrations above the Maximum Contaminant Level or Interim Drinking Water Standard during Fiscal Year 2000 (Hartrnan et al. 2001)
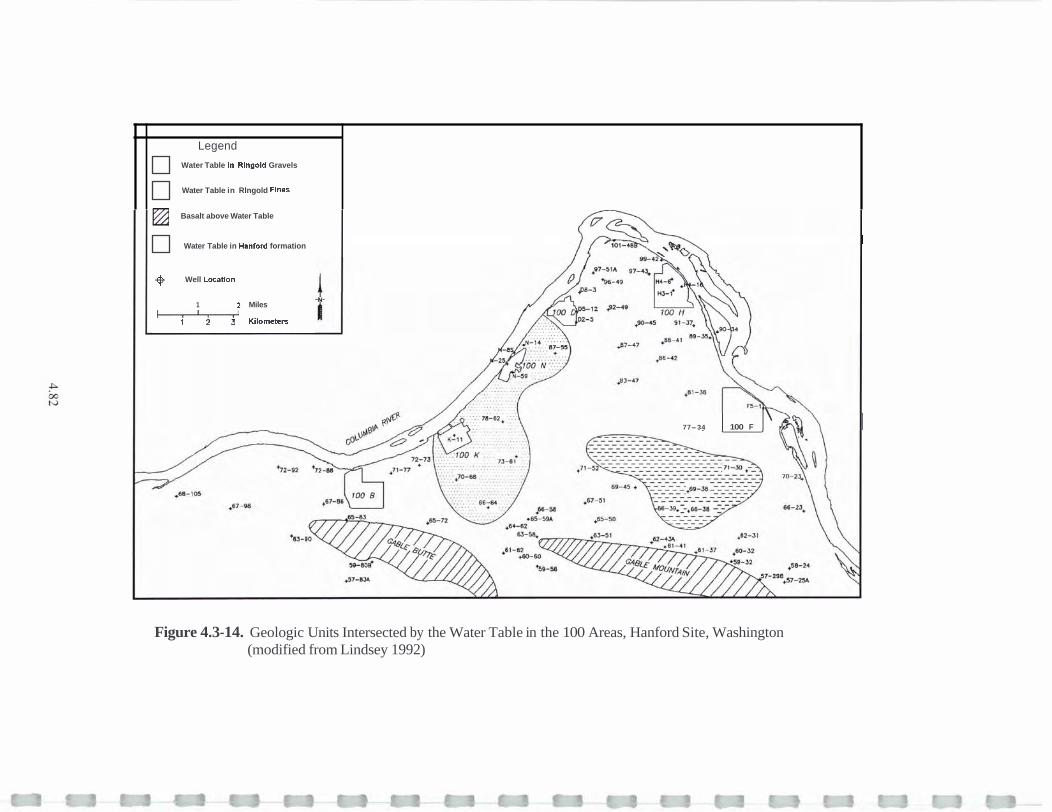
Legend
Water Table In Ringold Gravels
Water Table in Rlngold Fines
Basalt above Water Table
Water Table in Hanford formation
fe Well Locatlon
1 2 Miles
iilorneterr
77-34 100 F
Figure 4.3-14. Geologic Units Intersected by the Water Table in the 100 Areas, Hanford Site, Washington (modified from Lindsey 1992)
The hydrology of the 200 Areas has been strongly influenced by the discharge of large quantities of wastewater to the ground over a 50-year period. Those discharges have caused elevated water levels across much of the Hanford Site resulting in a large groundwater mound beneatkthe former U Pond in the 200 West Area and a smaller mound beneath the former B Pond, east of the 200 East Area. Water table changes beneath 200 West Area have been greatest because of the lower transmissivity of the aquifer in this ana. Discharges of water to the ground have been greatly reduced, and corresponding decreases in the elevation of the water table have been measured. The dedine in part of the 200 West Ama has been more than 8 m (26 ft) (Hartman et al. 2001). Water levels are expected to continue to decrease as the unconfined groundwater system reaches equilibrium with the new level of artificial recharge (Wursmer and Freshley 1994).
A number of reports dealing with the hydrogeology of the 200 Areas have been released including Graham et al. (1981); Last et al. (1989); and Connelly et al. (1992a,b). More detailed information is also provided in Hartman (2000).
4.3.7 300 Area Hydrology
The unconfined aquifer water table in the 3 0 Area is generally found in the Ringold Formation at a depth of 9 to 19 m (30 to 62 ft) below ground surface. Fluctuations in the river level strwgly affect the groundwater levels and flow in the 300 Area, just as they do in the 100 Areas. Water table contours in the vicinity of the 300 Area are somewhat concentric, showing that this is a discharge area for the unconfined aquifer system. Groundwater flows from the northwest, west, and even the southwest to discharge into the Columbia River near the 300 Area. Schalla et al. (1988); Swanson (1992); and Hartman (2000) have provided more detailed information on the hydrogeology of the 300 Area.
4.3.8 Richland North Areas Hydrology y-9. '+
, '%.C,. <.m 7 . . - " "' - : - c
, - 7 . 7
- + j r : it~~4E.a he Richland North Area is located in the southern part of the Hanford Site and includes the former
"100 Area, which was transferred from the DOE to the Port of Benton on October 1, 1998. The groundwater in this area is influenced by artificial recharge associated with the North Richland recharge basins and nearby inigated farming. Water is pumped from the Columbia River to the recharge basins and subsequently pumped from nearby wells. This system is used by the City of Richland as a backup filtration system for city water. Because an excess of water is pumped into the recharge basins, a mound has been created in the water table, which helps to reduce the potential for groundwater flow from the Hanford Site into this area. The river stage elevation of Yakima River, which flows just west of the area, is high enough such that the river also acts as a recharge source for the groundwater system.
The southern portion of the tritium plume from the 200 Areas extends to the 300 Area, and there is concern that this plume could reach the Richland North Area and impact water supply wells. However, triti;m concentrations decrease from greater than 10,000 pCi/L (373.4 BqL) to less than 100 pCin (3.734 BqL) across the 300 Area and the distribution across this area has changed little since fiscal year 1999 (Hartman et al. 2001). A few wells south of the 300 Area, in the vicinity of Richland's recharge ponds, have shown slightly elevated tritium levels, although well below the 20,000-pCi/L (746.8 BqL) drinking water standard. These levels are consistent with tritium concentrations in the Columbia River water that is pumped into the ponds (Hartman et al. 2001). Nitrate contamination is also found in the Richland North Area. This is likely the result of industrial and agricultural sources off the Hanford Site. In fiscal year 2000, nitrate concentrations increased in a number of wells. The nitrate plume appears to be migrating east toward the Columbia River. Concentrations above the 45-mgL maximum contaminant level are found over much of the Richland North Area (Hartman et al. 2001).
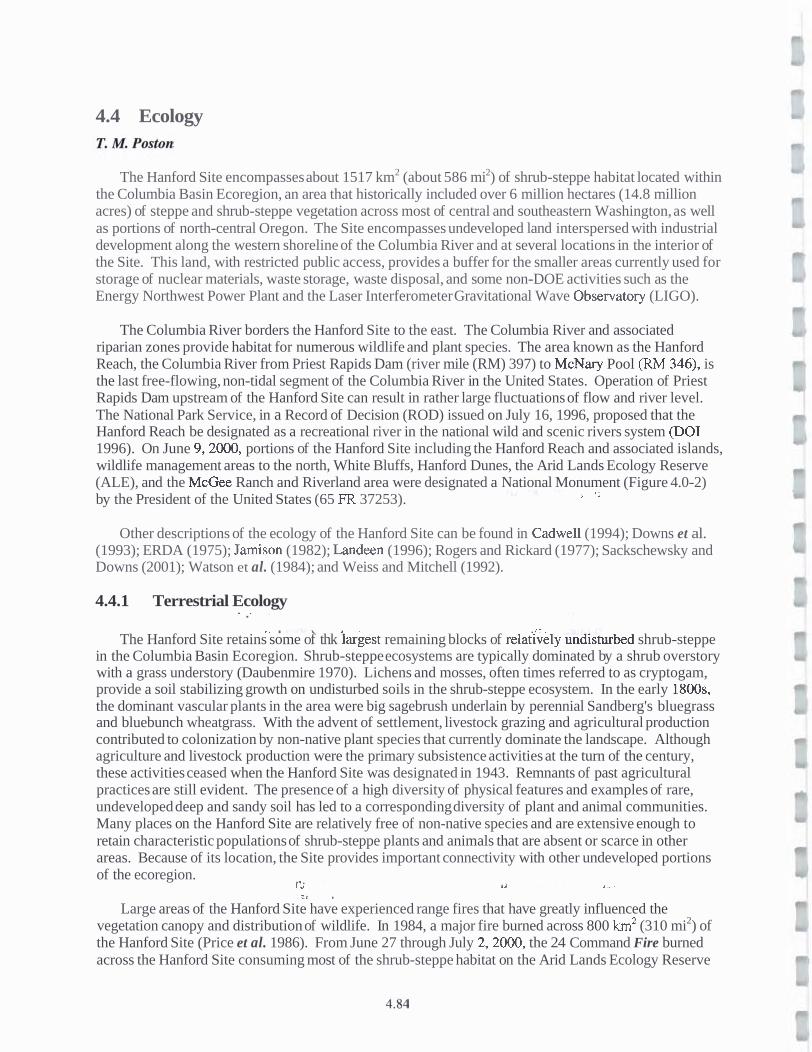
4.4 Ecology
The Hanford Site encompasses about 1517 km2 (about 586 mi2) of shrub-steppe habitat located within the Columbia Basin Ecoregion, an area that historically included over 6 million hectares (14.8 million acres) of steppe and shrub-steppe vegetation across most of central and southeastern Washington, as well as portions of north-central Oregon. The Site encompasses undeveloped land interspersed with industrial development along the western shoreline of the Columbia River and at several locations in the interior of the Site. This land, with restricted public access, provides a buffer for the smaller areas currently used for storage of nuclear materials, waste storage, waste disposal, and some non-DOE activities such as the Energy Northwest Power Plant and the Laser Interferometer Gravitational Wave Observatory (LIGO).
The Columbia River borders the Hanford Site to the east. The Columbia River and associated riparian zones provide habitat for numerous wildlife and plant species. The area known as the Hanford Reach, the Columbia River from Priest Rapids Dam (river mile (RM) 397) to McNary Pool (RM 346), is the last free-flowing, non-tidal segment of the Columbia River in the United States. Operation of Priest Rapids Dam upstream of the Hanford Site can result in rather large fluctuations of flow and river level. The National Park Service, in a Record of Decision (ROD) issued on July 16, 1996, proposed that the Hanford Reach be designated as a recreational river in the national wild and scenic rivers system (DO1 1996). On June 9,2000, portions of the Hanford Site including the Hanford Reach and associated islands, wildlife management areas to the north, White Bluffs, Hanford Dunes, the Arid Lands Ecology Reserve (ALE), and the McGee Ranch and Riverland area were designated a National Monument (Figure 4.0-2) by the President of the United States (65 FR 37253). *U ' R -" 1 * r
Other descriptions of the ecology of the Hanford Site can be found in Cadwell (1994); Downs et al. (1993); ERDA (1975); Jamison (1982); Landeen (1996); Rogers and Rickard (1977); Sackschewsky and Downs (2001); Watson et al. (1984); and Weiss and Mitchell (1992).
4.4.1 Terrestrial Ecology . . 4 . - 7
,. . '.>& L , . 'AlL$I-l
The Hanford Site retains some of thk largest remaining blocks of relatively und~sturbed shrub-steppe in the Columbia Basin Ecoregion. Shrub-steppe ecosystems are typically dominated by a shrub overstory with a grass understory (Daubenmire 1970). Lichens and mosses, often times referred to as cryptogam, provide a soil stabilizing growth on undisturbed soils in the shrub-steppe ecosystem. In the early 1800s, the dominant vascular plants in the area were big sagebrush underlain by perennial Sandberg's bluegrass and bluebunch wheatgrass. With the advent of settlement, livestock grazing and agricultural production contributed to colonization by non-native plant species that currently dominate the landscape. Although agriculture and livestock production were the primary subsistence activities at the turn of the century, these activities ceased when the Hanford Site was designated in 1943. Remnants of past agricultural practices are still evident. The presence of a high diversity of physical features and examples of rare, undeveloped deep and sandy soil has led to a corresponding diversity of plant and animal communities. Many places on the Hanford Site are relatively free of non-native species and are extensive enough to retain characteristic populations of shrub-steppe plants and animals that are absent or scarce in other areas. Because of its location, the Site provides important connectivity with other undeveloped portions of the ecoregion.
rb; ' .1 t , , , . ' 1 .
Large areas of the Hanford Site have experienced range fires that have greatly influenced the vegetation canopy and distribution of wildlife. In 1984, a major fire burned across 800 km2 (310 mi2) of the Hanford Site (Price et al. 1986). From June 27 through July 2,2000, the 24 Command Fire burned across the Hanford Site consuming most of the shrub-steppe habitat on the Arid Lands Ecology Reserve
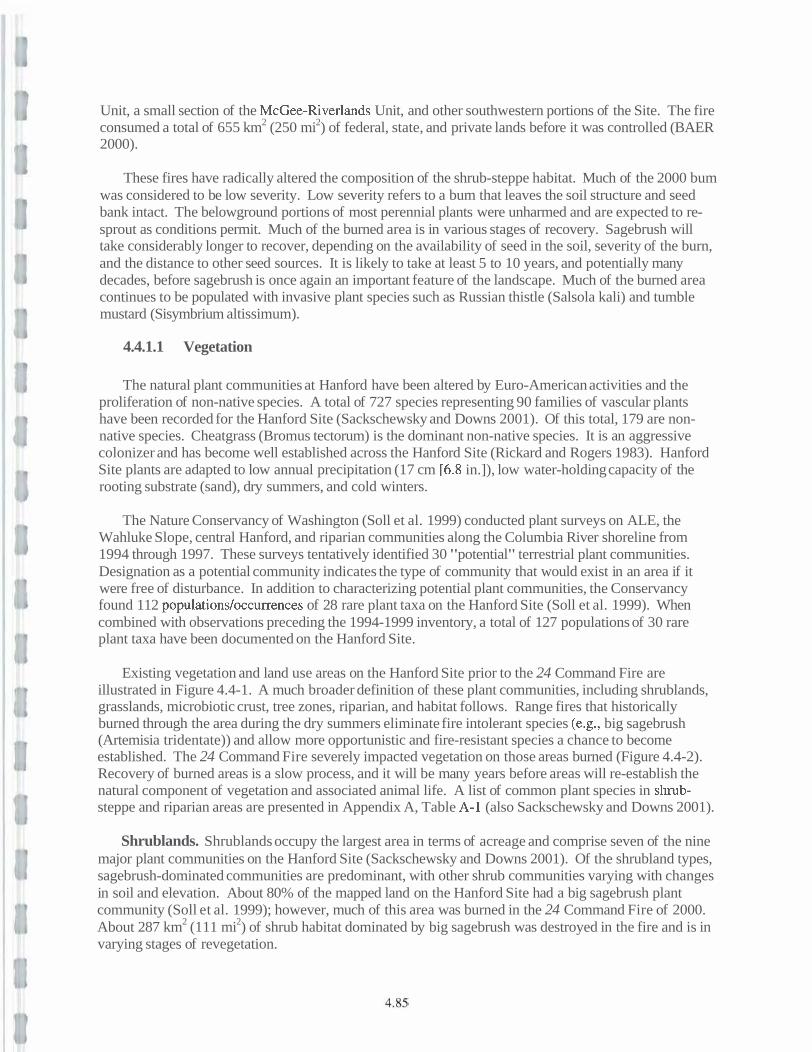
Unit, a small section of the McGee-Riverlands Unit, and other southwestern portions of the Site. The fire consumed a total of 655 km2 (250 mi2) of federal, state, and private lands before it was controlled (BAER 2000).
These fires have radically altered the composition of the shrub-steppe habitat. Much of the 2000 bum was considered to be low severity. Low severity refers to a bum that leaves the soil structure and seed bank intact. The belowground portions of most perennial plants were unharmed and are expected to re- sprout as conditions permit. Much of the burned area is in various stages of recovery. Sagebrush will take considerably longer to recover, depending on the availability of seed in the soil, severity of the burn, and the distance to other seed sources. It is likely to take at least 5 to 10 years, and potentially many decades, before sagebrush is once again an important feature of the landscape. Much of the burned area continues to be populated with invasive plant species such as Russian thistle (Salsola kali) and tumble mustard (Sisymbrium altissimum).
4.4.1.1 Vegetation
The natural plant communities at Hanford have been altered by Euro-American activities and the proliferation of non-native species. A total of 727 species representing 90 families of vascular plants have been recorded for the Hanford Site (Sackschewsky and Downs 2001). Of this total, 179 are non- native species. Cheatgrass (Bromus tectorum) is the dominant non-native species. It is an aggressive colonizer and has become well established across the Hanford Site (Rickard and Rogers 1983). Hanford Site plants are adapted to low annual precipitation (17 cm [6.8 in.]), low water-holding capacity of the rooting substrate (sand), dry summers, and cold winters.
The Nature Conservancy of Washington (Soll et al. 1999) conducted plant surveys on ALE, the Wahluke Slope, central Hanford, and riparian communities along the Columbia River shoreline from 1994 through 1997. These surveys tentatively identified 30 "potential" terrestrial plant communities. Designation as a potential community indicates the type of community that would exist in an area if it were free of disturbance. In addition to characterizing potential plant communities, the Conservancy found 112 populations/occurrences of 28 rare plant taxa on the Hanford Site (Soll et al. 1999). When combined with observations preceding the 1994-1999 inventory, a total of 127 populations of 30 rare plant taxa have been documented on the Hanford Site.
Existing vegetation and land use areas on the Hanford Site prior to the 24 Command Fire are illustrated in Figure 4.4-1. A much broader definition of these plant communities, including shrublands, grasslands, microbiotic crust, tree zones, riparian, and habitat follows. Range fires that historically burned through the area during the dry summers eliminate fire intolerant species (e.g., big sagebrush (Artemisia tridentate)) and allow more opportunistic and fire-resistant species a chance to become established. The 24 Command Fire severely impacted vegetation on those areas burned (Figure 4.4-2). Recovery of burned areas is a slow process, and it will be many years before areas will re-establish the natural component of vegetation and associated animal life. A list of common plant species in shrub- steppe and riparian areas are presented in Appendix A, Table A-1 (also Sackschewsky and Downs 2001).
Shrublands. Shrublands occupy the largest area in terms of acreage and comprise seven of the nine major plant communities on the Hanford Site (Sackschewsky and Downs 2001). Of the shrubland types, sagebrush-dominated communities are predominant, with other shrub communities varying with changes in soil and elevation. About 80% of the mapped land on the Hanford Site had a big sagebrush plant community (Soll et al. 1999); however, much of this area was burned in the 24 Command Fire of 2000. About 287 km2 (1 11 mi2) of shrub habitat dominated by big sagebrush was destroyed in the fire and is in varying stages of revegetation.
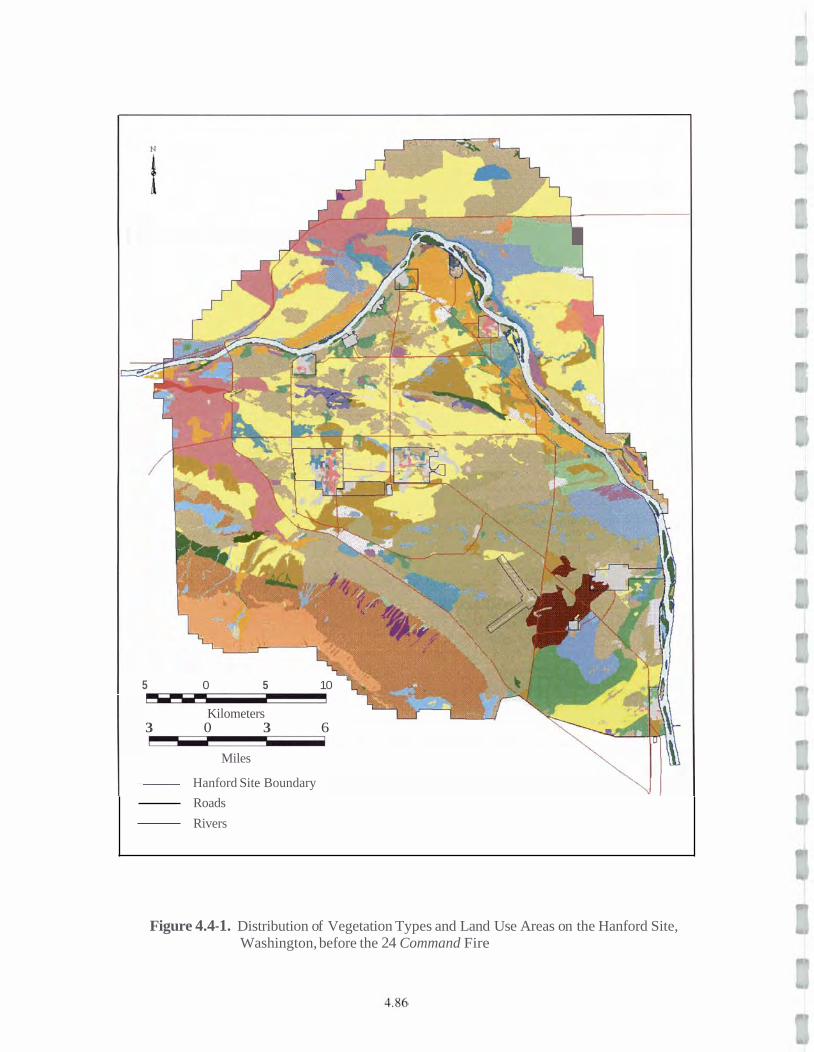
I
5 0 5 10 l
Kilometers 3 0 3 6
Miles
Hanford Site Boundary
Roads
Rivers
Figure 4.4-1. Distribution of Vegetation Types and Land Use Areas on the Hanford Site, Washington, before the 24 Command Fire
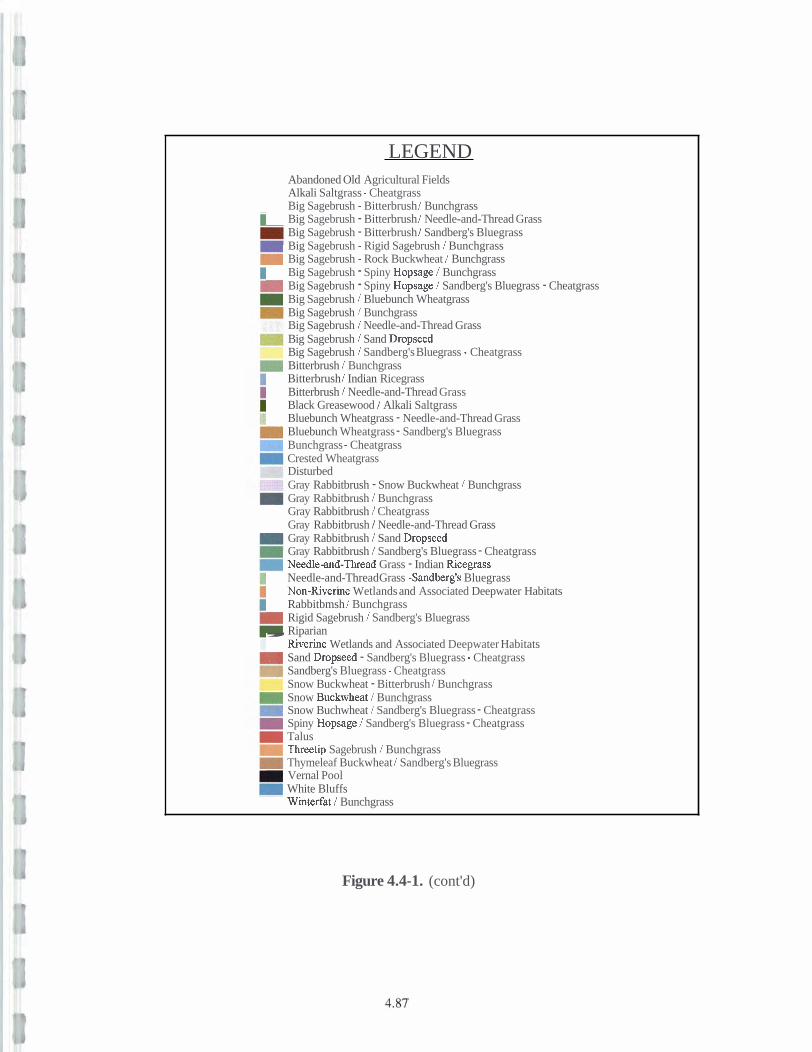
LEGEND Abandoned Old Agricultural Fields Alkali Saltgrass - Cheatgrass Big Sagebrush - Bitterbrush / Bunchgrass Big Sagebrush - Bitterbrush / Needle-and-Thread Grass Big Sagebrush - Bitterbrush 1 Sandberg's Bluegrass Big Sagebrush - Rigid Sagebrush 1 Bunchgrass Big Sagebrush - Rock Buckwheat / Bunchgrass Big Sagebrush - Spiny Hopsage / Bunchgrass - Big Sagebrush - Spiny Hopsage / Sandberg's Bluegrass - Cheatgrass Big Sagebrush 1 Bluebunch Wheatgrass Big Sagebrush 1 Bunchgrass Big Sagebrush 1 Needle-and-Thread Grass Big Sagebrush 1 Sand Dropseed Big Sagebrush 1 Sandberg's Bluegrass - Cheatgrass - Bitterbrush I Bunchgrass Bitterbrush 1 Indian Ricegrass Bitterbrush / Needle-and-Thread Grass Black Greasewood 1 Alkali Saltgrass Bluebunch Wheatgrass - Needle-and-Thread Grass - Bluebunch Wheatgrass - Sandberg's Bluegrass Bunchgrass - Cheatgrass Crested Wheatgrass Disturbed Gray Rabbitbrush - Snow Buckwheat / Bunchgrass Gray Rabbitbrush / Bunchgrass Gray Rabbitbrush / Cheatgrass Gray Rabbitbrush 1 Needle-and-Thread Grass
- Gray Rabbitbrush / Sand Dropseed Gray Rabbitbrush 1 Sandberg's Bluegrass - Cheatgrass Needle-and-Thread Grass - Indian kcegrass Needle-and-Thread Grass -Sandberg's Bluegrass Non-Riverine Wetlands and Associated Deepwater Habitats Rabbitbmsh I Bunchgrass
- Rigid Sagebrush / Sandberg's Bluegrass , Riparian
Riverine Wetlands and Associated Deepwater Habitats Sand Dropseed - Sandberg's Bluegrass - Cheatgrass Sandberg's Bluegrass - Cheatgrass Snow Buckwheat - Bitterbrush / Bunchgrass Snow Buckwheat / Bunchgrass Snow Buchwheat / Sandberg's Bluegrass - Cheatgrass Spiny Hopsage / Sandberg's Bluegrass - Cheatgrass Talus Threetip Sagebrush I Bunchgrass Thymeleaf Buckwheat I Sandberg's Bluegrass - Vernal Pool White Bluffs Winterfat / Bunchgrass
Figure 4.4-1. (cont'd)
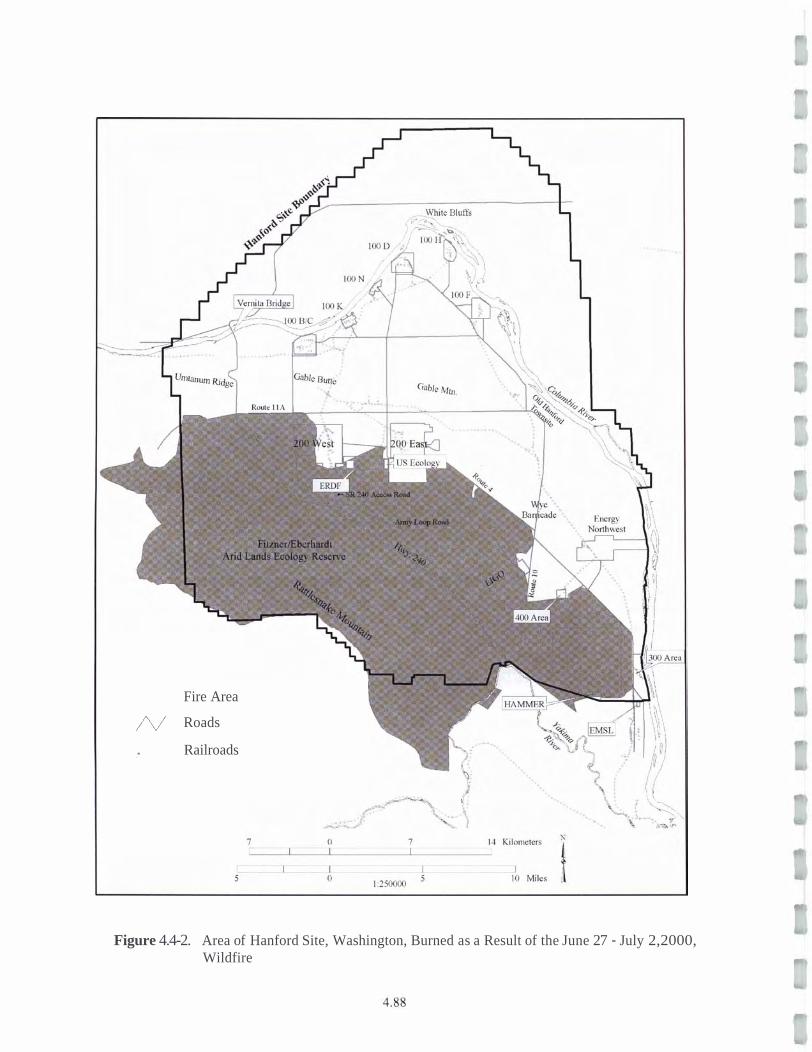
Fire Area
/V Roads
. Railroads
Figure 4.4-2. Area of Hanford Site, Washington, Burned as a Result of the June 27 - July 2,2000, Wildfire
The areas botanically characterized as shrub-steppe include remnant native big sagebrush, threetip sagebrush (Artemisia tripartite), bitterbrush (Purshia tridentate), gray rabbitbrush (Chrysothamnus nauseosus), green rabbitbrush (Chrysothamnus viscidijlorus), black greasewood (Sarcobatus vermiculatus), winterfat (Krascheninnikovia (Ceratoides) lanata), buckwheat (Eriogonum niveum), and spiny hopsage (Grayia (Atriplex) spinosa). Remnant bluebunch wheatgrass (Agropyron spicatum), Sandberg's bluegrass (Poa sandbergii (secunda)), needle-and-thread grass (Stipa comata), Indian ricegrass (Oryzopsis hymenoides), and prairie junegrass (Koeleria cristata) also occur in these areas. Heterogeneity of species composition varies with soil, slope, and elevation. Of the vegetation types depicted in Figure 4.4-1, those with a shrub component (i.e., big sagebrush, three-tip sagebrush, bitterbrush, spiny hopsage, rabbitbrush, winterfat, and snow-buckwheat) are considered shrub-steppe. Vegetation types with a significant cheatgrass component are generally of lower habitat quality than those with bunchgrass understories. Post-fire shrub-steppe on the Hanford Site refers to areas impacted by wildfires that are in the process of recovery.
Grasslands. Most grasses occur as understory in shrub-dominated plant communities. Cheatgrass has replaced many native perennial grass species and is well established in many low-elevation ( ~ 2 4 4 m [800 ft]) andlor disturbed areas (Rickard and Rogers 1983, Sol1 et al. 1999). Of the native grasses that occur on the Hanford Site, bluebunch wheatgrass occurs at higher elevations. Sandberg's bluegrass is more widely distributed and occurs within several plant communities. Needle-and-thread grass, Indian ricegrass, and thickspike wheatgrass (Agropyron dasytachyum) occur in sandy soils and dune habitats. About 133 km2 (5 1 mi2) of shrubless habitat dominated by native grasses were destroyed in the 24 Command Fire. Species preferring more moist locations include bentgrass (Agrostis spp.), meadow foxtail (Alopecurus aequalis), lovegrasses (Eragrostis spp.), and reed canarygrass (Phalaris arundinacea) (DOE 200 1).
Microbiotic crusts. Microbiotic crusts generally occur in the top 1 to 4 mm (0.04 to 0.16 in.) of soil and are formed by living organisms and their by-products, creating a crust of soil particles bound together by organic materials. Microbiotic crusts are common in the semi-arid Columbia Basin, where the dominant form tends to be green algae (Johansen et al. 1993). The functions of microbiotic crusts include soil stability and protection from erosion, fixation of atmospheric nitrogen, nutrient contribution to plants, influencing soil-plant water relations, increasing water infiltration, seedling germination, and plant growth. The ecological roles of microbiotic crusts depend on the relative cover of various crustal components. Carbon inputs are higher when mosses and lichens are present than when the crust is dominated by cyanobacteria. Nitrogen inputs are higher with greater water infiltration. Soil surface stability is related to cyanobacterial biomass as well as total moss and lichen cover (Belnap et al. 2001). The lichen and mosses of the Hanford Site were surveyed and evaluated by Link et al. (2000). They found 29 soil lichens in 19 genera and 6 moss species in 4 genera. Twelve (41 percent) lichen species are of the crustose growth form (flat and firmly attached to the substrate), eight (28 percent) are squamulose (having small, flat scales that do not adhere tightly to substrate), seven (24 percent) are foliose (having leaf-like lobes, attached in the center to substrate by clusters of rhizomes), and two (7 percent) are fruticose (plant-like growth attached at one point).
Trees. Before Euro-American settlement, the Hanford Site landscape lacked trees, and the Columbia River shoreline supported a few scattered cottonwood or willows. Homesteaders planted trees in association with agricultural areas. Shade and ornamental trees were planted around former military installations and industrial areas on the Hanford Site. Currently, approximately 23 species of trees occur on the Site. The most commonly occurring species are black locust (Robinia pseudo-acacia), Russian olive (Eleagnus angustijolia), cottonwood (Populus trichocarpa), mulberry (Morus alba), sycamore (Platanus occidentalis), and poplar (Populus ssp.). Many of these non-native species are aggressive colonizers and have become established along the Columbia River (e.g., mulberry, cottonwood, poplar, Russian olive), serving as a functional component of the riparian zone (DOE 2001). Trees provide
nesting habitat and cover for many species of mammals and birds. The 24 Command Fire destroyed most of the shrubs and trees associated with streams on ALE; however, some plants have persisted and established new growth from their charred stumps.
Riparian (Wetland) Areas. Riparian habitat includes sloughs, backwaters, shorelines, islands, and palustrine areas associated with the Columbia River floodplain. Vegetation that occurs along the river shoreline includes water smartweed (Polygonum amphibium), pondweed (Potamogeton spp.), sedges (Carex spp.), reed canary grass (Phalaris arundinacea), and bulbous bluegrass (Poa bulbosa). Trees include willow (Salix spp), mulberry (Morus alba), and Siberian elm (Ulmus pumila). Other riparian vegetation occurs in association with perennial springs and seeps. Rattlesnake and Snively Springs supports highly diverse biological communities (Cushing and Wolf 1984) that include bulrush (Scirpus spp.), spike rush (Eleocharis spp.), and cattail (Typha latifolia). Watercress (Rorippa nasturtium- aquaticum), which persists at these sites, is also abundant for a large portion of the year. In recent years, exotic trees and shrubs have become established in the riparian zone along these springs. The riparian transects associated with Snively and Rattlesnake Springs were greatly impacted by the 24 Command Fire (B AER 2000).
Most wastewater ponds and ditches on the Hanford Site have been decommissioned and no longer support riparian vegetation. On the Wahluke Slope, several imgation return ponds support riparian vegetation.
Riparian habitat that occurs in association with the Columbia River includes riffles, gravel bars, backwater sloughs, and cobble shorelines. These specialized habitats occur infrequently along the Hanford Reach and have acquired greater significance because of the net loss of wetland habitat elsewhere within the region. The Nature Conservancy identified 13 rare plant species (out of 19 total on the Hanford Site) residing along the Hanford Reach during surveys conducted in 1994 and 1995 (Soll and Soper 1996). The Conservancy found four new species previously not listed at Hanford in the 31 wetland areas surveyed (Soll et al. 1999). Common emergent species include reed canary grass, common witchgrass (Panicum capillare), and large barnyard grass (Echinochloa crusgalli). Rushes and sedges occur along the shorelines of the Columbia River and at several sloughs along the Hanford Reach at White Bluffs, below the 100-H Area, downstream of the 100-F Area, and at the Hanford Slough.
Noxious weeds are also becoming established along the riparian zones of the Hanford Reach. Purple loosestrife (Lythrum salicaria), yellow nutsedge (Cyperus esculentus), reed canary grass, knapweed (Centaurea ssp.), and yellow star thistle (Centaurea solstitialis) are some of the more common species found near or on wetlands. The Department of Energy has an ongoing program to control populations of noxious weeds with aerial applications of herbicides.
Flow management practices at Priest Rapids Dam have facilitated the establishment of non-native trees along the riparian zones of the Hanford Reach.
Unique Habitats. Habitats on the Hanford Site include bluffs, dunes, and islands (DOE 2001). The White Bluffs, Umtanum Ridge, and Gable Mountain on the Hanford Site include rock outcrops that occur infrequently on the Site. Plant communities dominated by buckwheat and Sandberg's bluegrass most often occupy basalt outcrops.
Snow buckwheat (Eriogonum niveum) and Sandberg's bluegrasslcheatgrass communities dominate a large dune area north of the Energy Northwest complex along the Columbia River shoreline (Figure 4.4- 1). The terrain of the dune habitat rises and falls between 3 and 5 m (10 and 16 ft) above ground level, creating areas that range from 2.5 to several hundred acres in size (U.S. Department of the Army 1990). The dunes are vegetated by bitterbrush, scurfpea (Psoralea lanceolata), and thickspike wheatgrass.
Smaller dunes containing basalt grains that impart a dark color to the sand are found near the 100-F Area and westward across the site north of Gable Mountain. As a result of the 24 Command Fire, temporary dunes have formed along State Route 240 east to the 200 West Area and Army Loop Road. These denuded areas are in various stages of revegetation with primarily invasive non-native plants.
Island habitat accounts for approximately 4.74 km2 (1.8 mi2) (Hanson and Browning 1959) and 64.3 km (39.9 mi) of river shoreline within the main channel of the Hanford Reach (Figure 4.4-3). Island ownership descriptions pertain to status prior to national monument designation and are subject to change. DOE owns and administered the upland portions of Locke Island (RM 371-373.5) and Wooded Island (RM 348-351) that now fall under U.S. Fish and Wildlife Service management as part of the Hanford Reach National Monument designation. The Washington State Department of Natural Resources oversees the shorelines of Locke and Wooded islands. Recent landslides caused by rotational slumping in the White Bluffs area have resulted in accelerated erosion of Locke Island by the Columbia River. Shoreline riparian vegetation that characterizes the islands includes willow, poplar, Russian olive, and mulberry. Before regulation of river flows by dams, trees were generally not found along river shoreline habitat, with the exception of small willows and a few juniper trees around the 100-B/C Area. The most common tree to establish itself along the shoreline is mulbeny. Species occurring on the island interior include buckwheat, lupine, mugwort, thickspike wheatgrass, giant wildrye, yarrow, and cheatgrass (Warren 1980). Management of these islands is the responsibility of the island owners, which include DOE, USFWS, and the U.S. Bureau of Land Management.
West Lake and its immediate basin represent a habitat that is characterized by highly saline conditions (Poston et al. 1991). These conditions occurred most likely from the evaporation of water from the pond and the accumulation of dissolved solids during the early years on the Site. West Lake is classified as a waste site under the Comprehensive Environmental Restoration, Compensation, and Liability Act of 1980 (CERCLA) (42 USC 9601, et seq.). Water levels of the pond fluctuate with wastewater discharge levels in the 200 Areas. Predominant plants include salt grass, plantain, and rattle box. Three-spine bulrush grows along the shoreline; however, the water in the pond is too saline to support aquatic macrophytes. Due to a sharp decrease in water discharged to the ground in the 200 Areas, the water level of West Lake has dropped, exposing large sections of saline mud flats and salt deposits along the shoreline.
Operable Units. The Hanford Site encompasses numerous waste management units and groundwater contamination plumes that have been grouped into operable units under CERCLA. Each unit has complementary characteristics of such parameters as geography, waste content, type of facility, and relationship of contaminant plumes. In general, non-native or invasive plants typify the operable units. Cheatgrass, Russian thistle, and tumble mustard are invasive species that have colonized many of the disturbed portions of these sites. The 100 Area operable units are characterized by a narrow band of riparian vegetation along the shoreline of the Columbia River, with much of the area shoreward consisting of old agricultural fields dominated by cheatgrass and tumble mustard. Scattered big sagebrush and gray rabbitbrush also occur throughout the 100 Areas (Landeen et al. 1993). An area of natural big sagebrush habitat near the 100-D area has experienced significant and apparently natural decline in recent years (Cardenas et al. 1997). A total area encompassing 17.8 km2 (6.9 mi2) is in decline, and a central core area of 2.8 km2 (1.1 mi2) has experienced more than 80% mortality. State threatened, endangered, or species of concern that occur within the 100 Area operable units include persistent sepal yellowcress (Rorippa columbiae), false pimpernel (Lindernia dubia anagallidea), shining flatsedge (Cyperus bipartitus (rivularis)), gray cryptantha (Cryptantha leucophaea), and possibly, dense sedge (Carex densa) (Table 4.4-1 and Table 4.4-3 in Section 4.4.3) (Landeen et al. 1993, Sol1 et al. 1999).
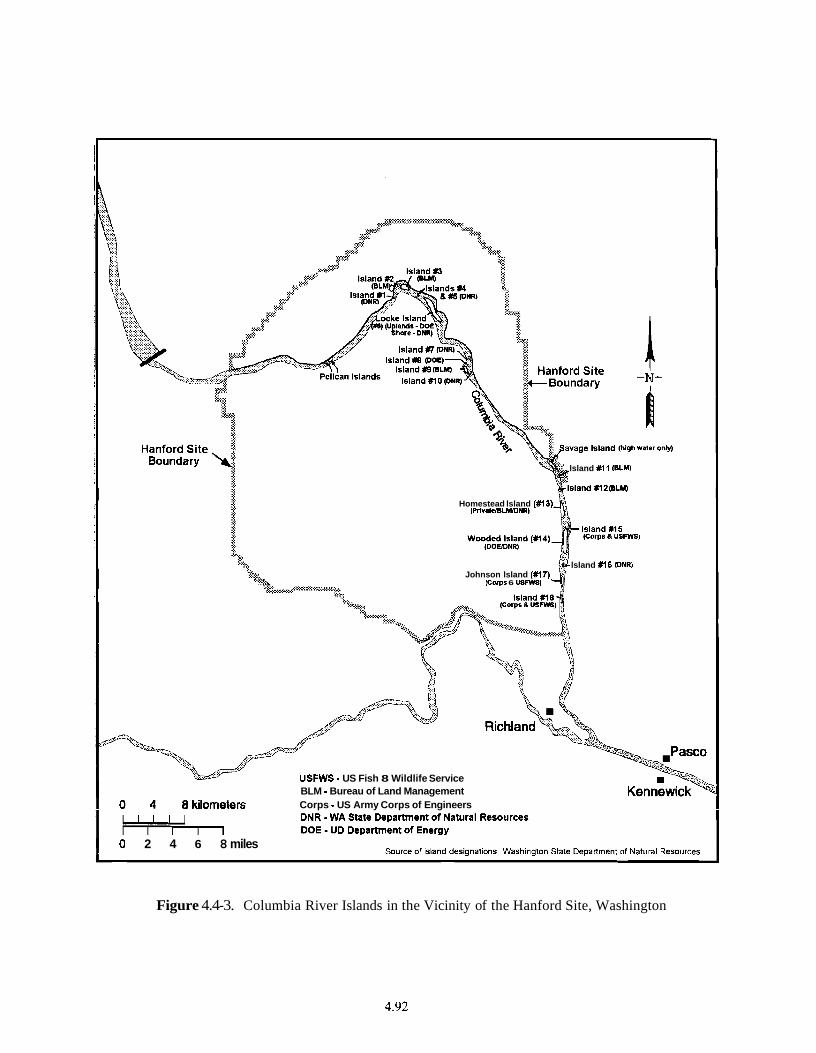
I
lsland #I 1 (ELM)
Homestead lsland (#l3) (PrivatdBLWDNR)
lsland #l6 PNR) Johnson lsland (M7)
(CwpS 6 U S M )
USFWS - US Fish 8 Wildlife Service BLM - Bureau of Land Management Corps - US Army Corps of Engineers
0 2 4 6 8 miles
Figure 4.4-3. Columbia River Islands in the Vicinity of the Hanford Site, Washington
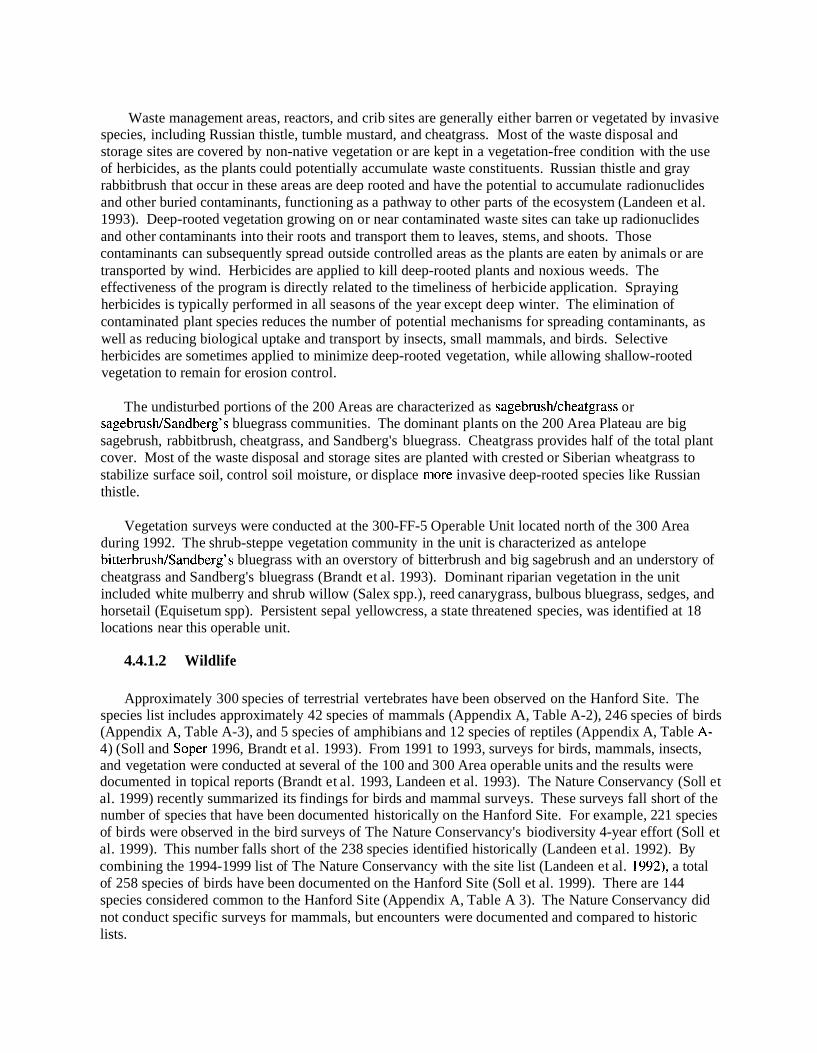
Waste management areas, reactors, and crib sites are generally either barren or vegetated by invasive species, including Russian thistle, tumble mustard, and cheatgrass. Most of the waste disposal and storage sites are covered by non-native vegetation or are kept in a vegetation-free condition with the use of herbicides, as the plants could potentially accumulate waste constituents. Russian thistle and gray rabbitbrush that occur in these areas are deep rooted and have the potential to accumulate radionuclides and other buried contaminants, functioning as a pathway to other parts of the ecosystem (Landeen et al. 1993). Deep-rooted vegetation growing on or near contaminated waste sites can take up radionuclides and other contaminants into their roots and transport them to leaves, stems, and shoots. Those contaminants can subsequently spread outside controlled areas as the plants are eaten by animals or are transported by wind. Herbicides are applied to kill deep-rooted plants and noxious weeds. The effectiveness of the program is directly related to the timeliness of herbicide application. Spraying herbicides is typically performed in all seasons of the year except deep winter. The elimination of contaminated plant species reduces the number of potential mechanisms for spreading contaminants, as well as reducing biological uptake and transport by insects, small mammals, and birds. Selective herbicides are sometimes applied to minimize deep-rooted vegetation, while allowing shallow-rooted vegetation to remain for erosion control.
The undisturbed portions of the 200 Areas are characterized as sagebrushlcheatgrass or sagebrushlsandberg's bluegrass communities. The dominant plants on the 200 Area Plateau are big sagebrush, rabbitbrush, cheatgrass, and Sandberg's bluegrass. Cheatgrass provides half of the total plant cover. Most of the waste disposal and storage sites are planted with crested or Siberian wheatgrass to stabilize surface soil, control soil moisture, or displace more invasive deep-rooted species like Russian thistle.
Vegetation surveys were conducted at the 300-FF-5 Operable Unit located north of the 300 Area during 1992. The shrub-steppe vegetation community in the unit is characterized as antelope bitterbrushlsandberg's bluegrass with an overstory of bitterbrush and big sagebrush and an understory of cheatgrass and Sandberg's bluegrass (Brandt et al. 1993). Dominant riparian vegetation in the unit included white mulberry and shrub willow (Salex spp.), reed canarygrass, bulbous bluegrass, sedges, and horsetail (Equisetum spp). Persistent sepal yellowcress, a state threatened species, was identified at 18 locations near this operable unit.
4.4.1.2 Wildlife
Approximately 300 species of terrestrial vertebrates have been observed on the Hanford Site. The species list includes approximately 42 species of mammals (Appendix A, Table A-2), 246 species of birds (Appendix A, Table A-3), and 5 species of amphibians and 12 species of reptiles (Appendix A, Table A- 4) (Soll and Soper 1996, Brandt et al. 1993). From 1991 to 1993, surveys for birds, mammals, insects, and vegetation were conducted at several of the 100 and 300 Area operable units and the results were documented in topical reports (Brandt et al. 1993, Landeen et al. 1993). The Nature Conservancy (Soll et al. 1999) recently summarized its findings for birds and mammal surveys. These surveys fall short of the number of species that have been documented historically on the Hanford Site. For example, 221 species of birds were observed in the bird surveys of The Nature Conservancy's biodiversity 4-year effort (Soll et al. 1999). This number falls short of the 238 species identified historically (Landeen et al. 1992). By combining the 1994-1999 list of The Nature Conservancy with the site list (Landeen et al. 1992), a total of 258 species of birds have been documented on the Hanford Site (Soll et al. 1999). There are 144 species considered common to the Hanford Site (Appendix A, Table A 3). The Nature Conservancy did not conduct specific surveys for mammals, but encounters were documented and compared to historic lists.
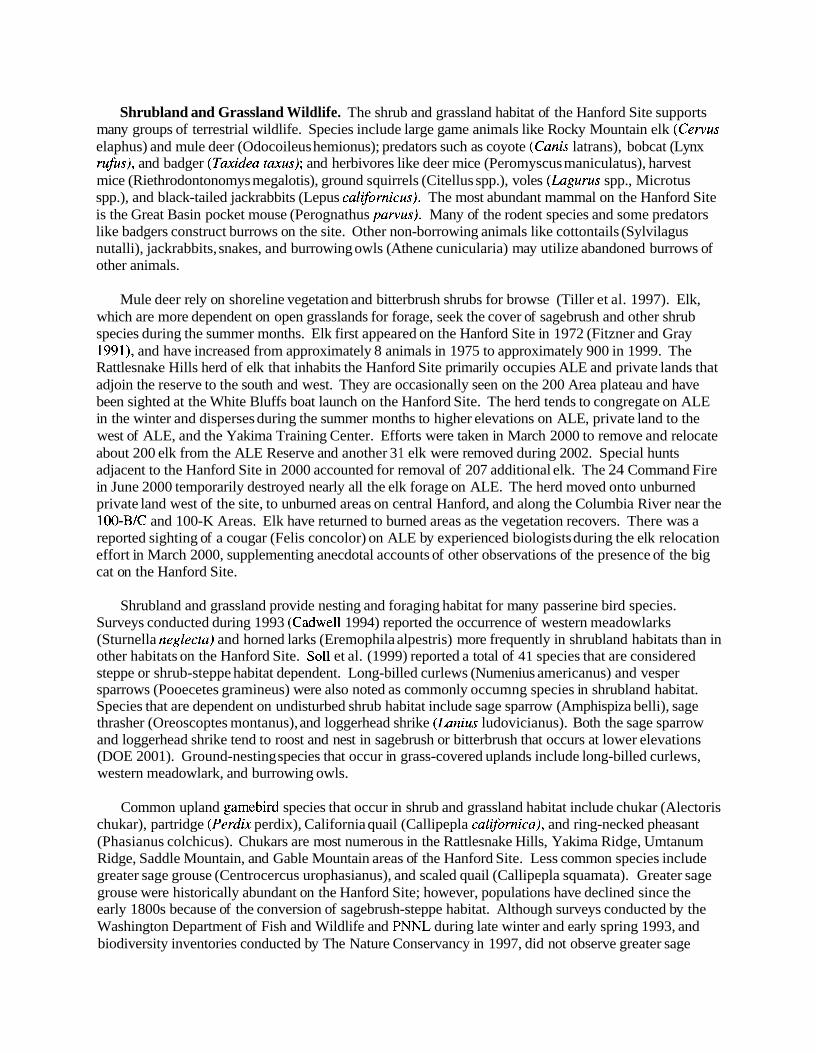
Shrubland and Grassland Wildlife. The shrub and grassland habitat of the Hanford Site supports many groups of terrestrial wildlife. Species include large game animals like Rocky Mountain elk (Cewus elaphus) and mule deer (Odocoileus hemionus); predators such as coyote (Canis latrans), bobcat (Lynx rufus), and badger (Taxidea taxus); and herbivores like deer mice (Peromyscus maniculatus), harvest mice (Riethrodontonomys megalotis), ground squirrels (Citellus spp.), voles (Lagurus spp., Microtus spp.), and black-tailed jackrabbits (Lepus californicus). The most abundant mammal on the Hanford Site is the Great Basin pocket mouse (Perognathus pawus). Many of the rodent species and some predators like badgers construct burrows on the site. Other non-borrowing animals like cottontails (Sylvilagus nutalli), jackrabbits, snakes, and burrowing owls (Athene cunicularia) may utilize abandoned burrows of other animals.
Mule deer rely on shoreline vegetation and bitterbrush shrubs for browse (Tiller et al. 1997). Elk, which are more dependent on open grasslands for forage, seek the cover of sagebrush and other shrub species during the summer months. Elk first appeared on the Hanford Site in 1972 (Fitzner and Gray 1991), and have increased from approximately 8 animals in 1975 to approximately 900 in 1999. The Rattlesnake Hills herd of elk that inhabits the Hanford Site primarily occupies ALE and private lands that adjoin the reserve to the south and west. They are occasionally seen on the 200 Area plateau and have been sighted at the White Bluffs boat launch on the Hanford Site. The herd tends to congregate on ALE in the winter and disperses during the summer months to higher elevations on ALE, private land to the west of ALE, and the Yakima Training Center. Efforts were taken in March 2000 to remove and relocate about 200 elk from the ALE Reserve and another 3 1 elk were removed during 2002. Special hunts adjacent to the Hanford Site in 2000 accounted for removal of 207 additional elk. The 24 Command Fire in June 2000 temporarily destroyed nearly all the elk forage on ALE. The herd moved onto unburned private land west of the site, to unburned areas on central Hanford, and along the Columbia River near the 100-BIC and 100-K Areas. Elk have returned to burned areas as the vegetation recovers. There was a reported sighting of a cougar (Felis concolor) on ALE by experienced biologists during the elk relocation effort in March 2000, supplementing anecdotal accounts of other observations of the presence of the big cat on the Hanford Site.
Shrubland and grassland provide nesting and foraging habitat for many passerine bird species. Surveys conducted during 1993 (Cadwell 1994) reported the occurrence of western meadowlarks (Sturnella neglecta) and horned larks (Eremophila alpestris) more frequently in shrubland habitats than in other habitats on the Hanford Site. Sol1 et al. (1999) reported a total of 41 species that are considered steppe or shrub-steppe habitat dependent. Long-billed curlews (Numenius americanus) and vesper sparrows (Pooecetes gramineus) were also noted as commonly occumng species in shrubland habitat. Species that are dependent on undisturbed shrub habitat include sage sparrow (Amphispiza belli), sage thrasher (Oreoscoptes montanus), and loggerhead shrike (Lanius ludovicianus). Both the sage sparrow and loggerhead shrike tend to roost and nest in sagebrush or bitterbrush that occurs at lower elevations (DOE 2001). Ground-nesting species that occur in grass-covered uplands include long-billed curlews, western meadowlark, and burrowing owls.
Common upland gamebird species that occur in shrub and grassland habitat include chukar (Alectoris chukar), partridge (Perdix perdix), California quail (Callipepla californica), and ring-necked pheasant (Phasianus colchicus). Chukars are most numerous in the Rattlesnake Hills, Yakima Ridge, Umtanum Ridge, Saddle Mountain, and Gable Mountain areas of the Hanford Site. Less common species include greater sage grouse (Centrocercus urophasianus), and scaled quail (Callipepla squamata). Greater sage grouse were historically abundant on the Hanford Site; however, populations have declined since the early 1800s because of the conversion of sagebrush-steppe habitat. Although surveys conducted by the Washington Department of Fish and Wildlife and PNNL during late winter and early spring 1993, and biodiversity inventories conducted by The Nature Conservancy in 1997, did not observe greater sage
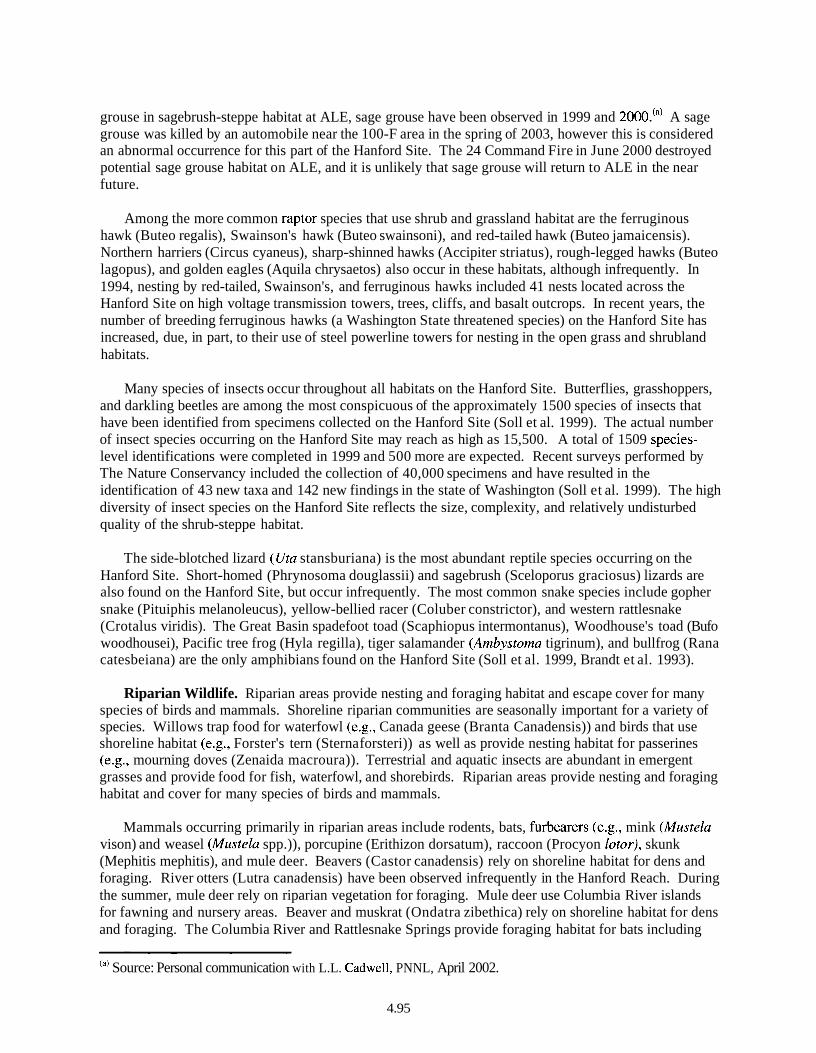
grouse in sagebrush-steppe habitat at ALE, sage grouse have been observed in 1999 and 2000.'~' A sage grouse was killed by an automobile near the 100-F area in the spring of 2003, however this is considered an abnormal occurrence for this part of the Hanford Site. The 24 Command Fire in June 2000 destroyed potential sage grouse habitat on ALE, and it is unlikely that sage grouse will return to ALE in the near future.
Among the more common raptor species that use shrub and grassland habitat are the ferruginous hawk (Buteo regalis), Swainson's hawk (Buteo swainsoni), and red-tailed hawk (Buteo jamaicensis). Northern harriers (Circus cyaneus), sharp-shinned hawks (Accipiter striatus), rough-legged hawks (Buteo lagopus), and golden eagles (Aquila chrysaetos) also occur in these habitats, although infrequently. In 1994, nesting by red-tailed, Swainson's, and ferruginous hawks included 41 nests located across the Hanford Site on high voltage transmission towers, trees, cliffs, and basalt outcrops. In recent years, the number of breeding ferruginous hawks (a Washington State threatened species) on the Hanford Site has increased, due, in part, to their use of steel powerline towers for nesting in the open grass and shrubland habitats.
Many species of insects occur throughout all habitats on the Hanford Site. Butterflies, grasshoppers, and darkling beetles are among the most conspicuous of the approximately 1500 species of insects that have been identified from specimens collected on the Hanford Site (Soll et al. 1999). The actual number of insect species occurring on the Hanford Site may reach as high as 15,500. A total of 1509 species- level identifications were completed in 1999 and 500 more are expected. Recent surveys performed by The Nature Conservancy included the collection of 40,000 specimens and have resulted in the identification of 43 new taxa and 142 new findings in the state of Washington (Soll et al. 1999). The high diversity of insect species on the Hanford Site reflects the size, complexity, and relatively undisturbed quality of the shrub-steppe habitat.
The side-blotched lizard (Uta stansburiana) is the most abundant reptile species occurring on the Hanford Site. Short-homed (Phrynosoma douglassii) and sagebrush (Sceloporus graciosus) lizards are also found on the Hanford Site, but occur infrequently. The most common snake species include gopher snake (Pituiphis melanoleucus), yellow-bellied racer (Coluber constrictor), and western rattlesnake (Crotalus viridis). The Great Basin spadefoot toad (Scaphiopus intermontanus), Woodhouse's toad (Bufo woodhousei), Pacific tree frog (Hyla regilla), tiger salamander (Ambystoma tigrinum), and bullfrog (Rana catesbeiana) are the only amphibians found on the Hanford Site (Soll et al. 1999, Brandt et al. 1993).
Riparian Wildlife. Riparian areas provide nesting and foraging habitat and escape cover for many species of birds and mammals. Shoreline riparian communities are seasonally important for a variety of species. Willows trap food for waterfowl (e.g., Canada geese (Branta Canadensis)) and birds that use shoreline habitat (e.g., Forster's tern (Sterna forsteri)) as well as provide nesting habitat for passerines (e.g., mourning doves (Zenaida macroura)). Terrestrial and aquatic insects are abundant in emergent grasses and provide food for fish, waterfowl, and shorebirds. Riparian areas provide nesting and foraging habitat and cover for many species of birds and mammals.
Mammals occurring primarily in riparian areas include rodents, bats, furbearers (e.g., mink (Mustela vison) and weasel (Mustela spp.)), porcupine (Erithizon dorsatum), raccoon (Procyon lotor), skunk (Mephitis mephitis), and mule deer. Beavers (Castor canadensis) rely on shoreline habitat for dens and foraging. River otters (Lutra canadensis) have been observed infrequently in the Hanford Reach. During the summer, mule deer rely on riparian vegetation for foraging. Mule deer use Columbia River islands for fawning and nursery areas. Beaver and muskrat (Ondatra zibethica) rely on shoreline habitat for dens and foraging. The Columbia River and Rattlesnake Springs provide foraging habitat for bats including
'"' Source: Personal communication with L.L. Cadwell, PNNL, April 2002.
4.95
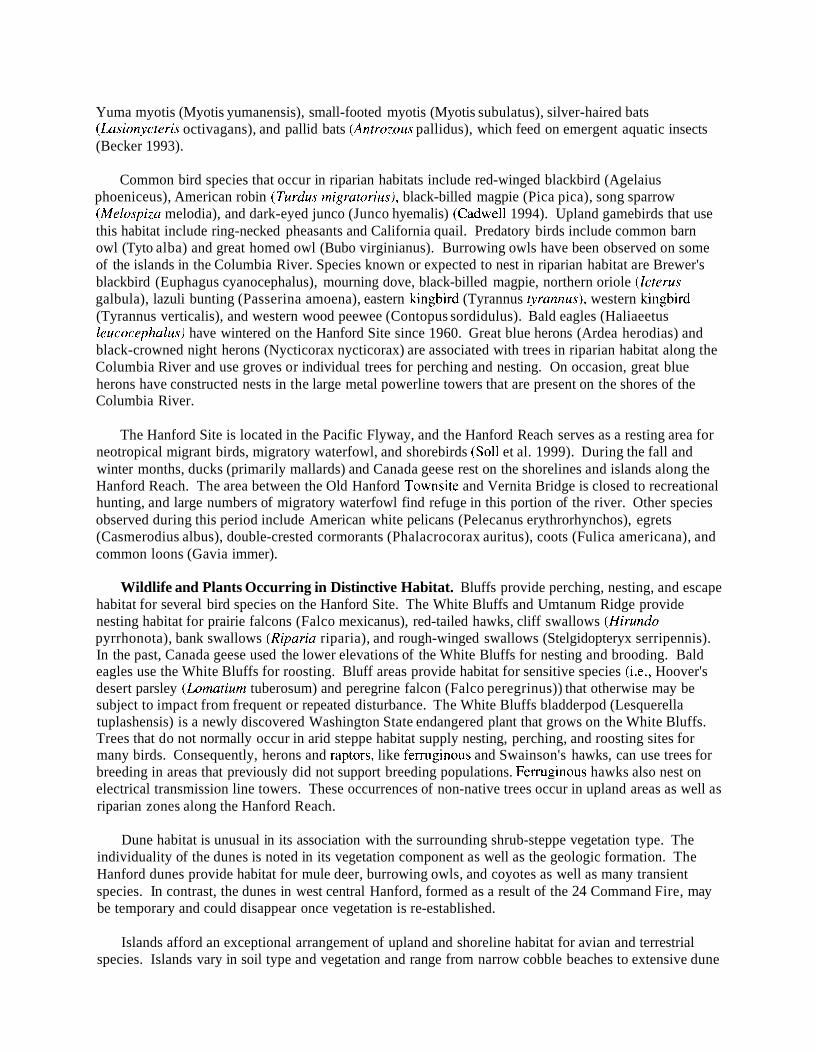
Yuma myotis (Myotis yumanensis), small-footed myotis (Myotis subulatus), silver-haired bats (Lasionycteris octivagans), and pallid bats (Antrozous pallidus), which feed on emergent aquatic insects (Becker 1993).
Common bird species that occur in riparian habitats include red-winged blackbird (Agelaius phoeniceus), American robin (Turdus migratorius), black-billed magpie (Pica pica), song sparrow (Melospiza melodia), and dark-eyed junco (Junco hyemalis) (Cadwell 1994). Upland gamebirds that use this habitat include ring-necked pheasants and California quail. Predatory birds include common barn owl (Tyto alba) and great homed owl (Bubo virginianus). Burrowing owls have been observed on some of the islands in the Columbia River. Species known or expected to nest in riparian habitat are Brewer's blackbird (Euphagus cyanocephalus), mourning dove, black-billed magpie, northern oriole (Icterus galbula), lazuli bunting (Passerina amoena), eastern kingbird (Tyrannus tyrannus), western kingbird (Tyrannus verticalis), and western wood peewee (Contopus sordidulus). Bald eagles (Haliaeetus leucocephalus) have wintered on the Hanford Site since 1960. Great blue herons (Ardea herodias) and black-crowned night herons (Nycticorax nycticorax) are associated with trees in riparian habitat along the Columbia River and use groves or individual trees for perching and nesting. On occasion, great blue herons have constructed nests in the large metal powerline towers that are present on the shores of the Columbia River.
The Hanford Site is located in the Pacific Flyway, and the Hanford Reach serves as a resting area for neotropical migrant birds, migratory waterfowl, and shorebirds (Sol1 et al. 1999). During the fall and winter months, ducks (primarily mallards) and Canada geese rest on the shorelines and islands along the Hanford Reach. The area between the Old Hanford Townsite and Vernita Bridge is closed to recreational hunting, and large numbers of migratory waterfowl find refuge in this portion of the river. Other species observed during this period include American white pelicans (Pelecanus erythrorhynchos), egrets (Casmerodius albus), double-crested cormorants (Phalacrocorax auritus), coots (Fulica americana), and common loons (Gavia immer).
Wildlife and Plants Occurring in Distinctive Habitat. Bluffs provide perching, nesting, and escape habitat for several bird species on the Hanford Site. The White Bluffs and Umtanum Ridge provide nesting habitat for prairie falcons (Falco mexicanus), red-tailed hawks, cliff swallows (Hirundo pyrrhonota), bank swallows (Riparia riparia), and rough-winged swallows (Stelgidopteryx serripennis). In the past, Canada geese used the lower elevations of the White Bluffs for nesting and brooding. Bald eagles use the White Bluffs for roosting. Bluff areas provide habitat for sensitive species (i.e., Hoover's desert parsley (Lomatium tuberosum) and peregrine falcon (Falco peregrinus)) that otherwise may be subject to impact from frequent or repeated disturbance. The White Bluffs bladderpod (Lesquerella tuplashensis) is a newly discovered Washington State endangered plant that grows on the White Bluffs. Trees that do not normally occur in arid steppe habitat supply nesting, perching, and roosting sites for many birds. Consequently, herons and raptors, like fermginous and Swainson's hawks, can use trees for breeding in areas that previously did not support breeding populations. Fermginous hawks also nest on electrical transmission line towers. These occurrences of non-native trees occur in upland areas as well as riparian zones along the Hanford Reach.
Dune habitat is unusual in its association with the surrounding shrub-steppe vegetation type. The individuality of the dunes is noted in its vegetation component as well as the geologic formation. The Hanford dunes provide habitat for mule deer, burrowing owls, and coyotes as well as many transient species. In contrast, the dunes in west central Hanford, formed as a result of the 24 Command Fire, may be temporary and could disappear once vegetation is re-established.
Islands afford an exceptional arrangement of upland and shoreline habitat for avian and terrestrial species. Islands vary in soil type and vegetation and range from narrow cobble beaches to extensive dune
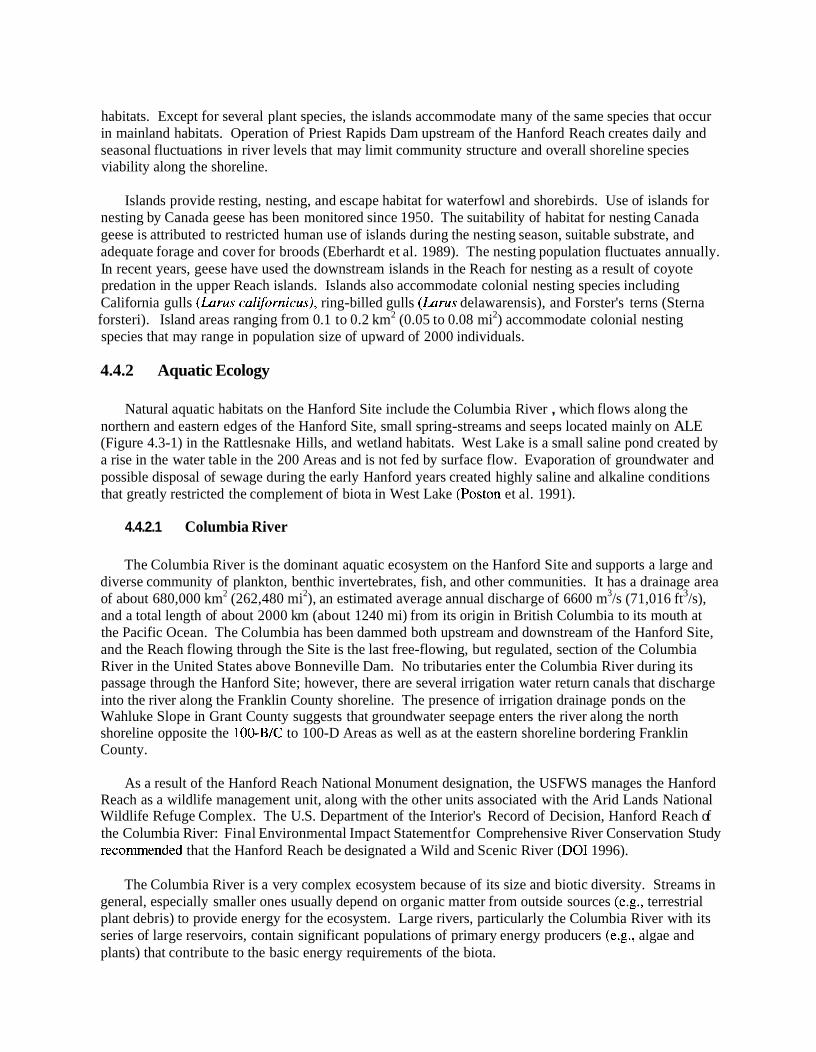
habitats. Except for several plant species, the islands accommodate many of the same species that occur in mainland habitats. Operation of Priest Rapids Dam upstream of the Hanford Reach creates daily and seasonal fluctuations in river levels that may limit community structure and overall shoreline species viability along the shoreline.
Islands provide resting, nesting, and escape habitat for waterfowl and shorebirds. Use of islands for nesting by Canada geese has been monitored since 1950. The suitability of habitat for nesting Canada geese is attributed to restricted human use of islands during the nesting season, suitable substrate, and adequate forage and cover for broods (Eberhardt et al. 1989). The nesting population fluctuates annually. In recent years, geese have used the downstream islands in the Reach for nesting as a result of coyote predation in the upper Reach islands. Islands also accommodate colonial nesting species including California gulls ( k r u s californicus), ring-billed gulls (Larus delawarensis), and Forster's terns (Sterna forsteri). Island areas ranging from 0.1 to 0.2 km2 (0.05 to 0.08 mi2) accommodate colonial nesting species that may range in population size of upward of 2000 individuals.
4.4.2 Aquatic Ecology
Natural aquatic habitats on the Hanford Site include the Columbia River , which flows along the northern and eastern edges of the Hanford Site, small spring-streams and seeps located mainly on ALE (Figure 4.3-1) in the Rattlesnake Hills, and wetland habitats. West Lake is a small saline pond created by a rise in the water table in the 200 Areas and is not fed by surface flow. Evaporation of groundwater and possible disposal of sewage during the early Hanford years created highly saline and alkaline conditions that greatly restricted the complement of biota in West Lake (Poston et al. 1991).
4.4.2.1 Columbia River
The Columbia River is the dominant aquatic ecosystem on the Hanford Site and supports a large and diverse community of plankton, benthic invertebrates, fish, and other communities. It has a drainage area of about 680,000 km2 (262,480 mi2), an estimated average annual discharge of 6600 m3/s (71,016 ft3/s), and a total length of about 2000 km (about 1240 mi) from its origin in British Columbia to its mouth at the Pacific Ocean. The Columbia has been dammed both upstream and downstream of the Hanford Site, and the Reach flowing through the Site is the last free-flowing, but regulated, section of the Columbia River in the United States above Bonneville Dam. No tributaries enter the Columbia River during its passage through the Hanford Site; however, there are several irrigation water return canals that discharge into the river along the Franklin County shoreline. The presence of irrigation drainage ponds on the Wahluke Slope in Grant County suggests that groundwater seepage enters the river along the north shoreline opposite the 100-B/C to 100-D Areas as well as at the eastern shoreline bordering Franklin County.
As a result of the Hanford Reach National Monument designation, the USFWS manages the Hanford Reach as a wildlife management unit, along with the other units associated with the Arid Lands National Wildlife Refuge Complex. The U.S. Department of the Interior's Record of Decision, Hanford Reach of the Columbia River: Final Environmental Impact Statement for Comprehensive River Conservation Study recornrneilded that the Hanford Reach be designated a Wild and Scenic River (DO1 1996).
The Columbia River is a very complex ecosystem because of its size and biotic diversity. Streams in general, especially smaller ones usually depend on organic matter from outside sources (e.g., terrestrial plant debris) to provide energy for the ecosystem. Large rivers, particularly the Columbia River with its series of large reservoirs, contain significant populations of primary energy producers (e.g., algae and plants) that contribute to the basic energy requirements of the biota.
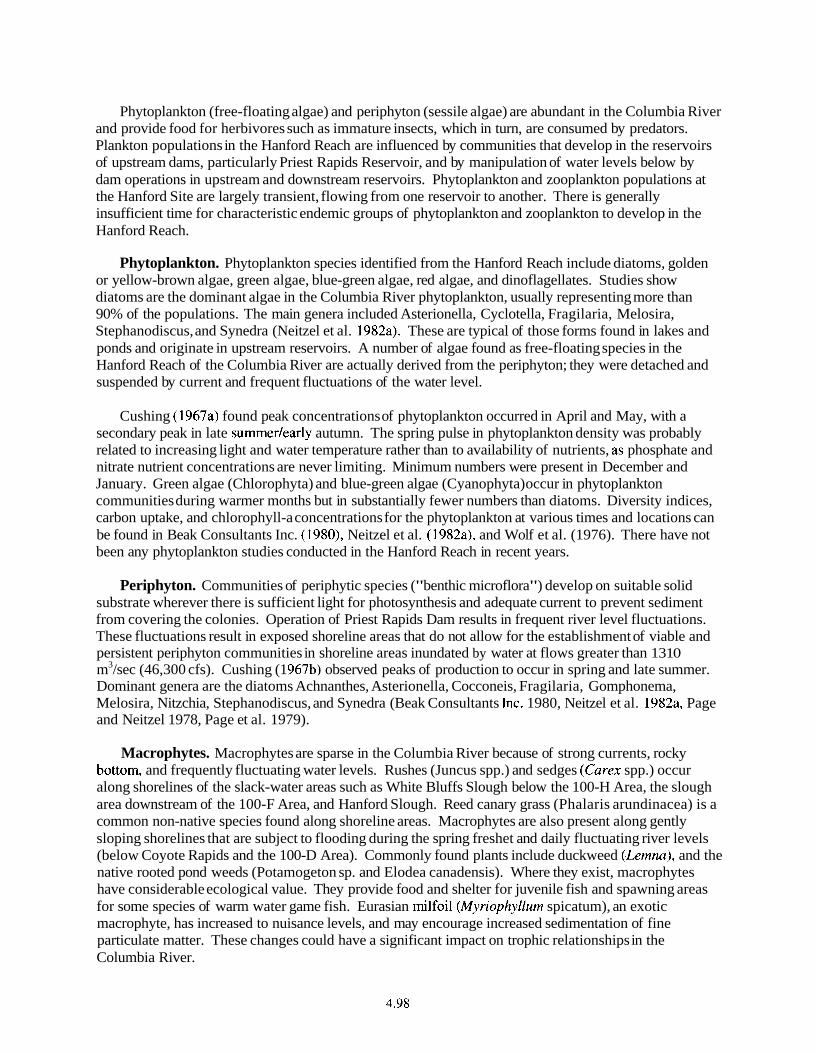
Phytoplankton (free-floating algae) and periphyton (sessile algae) are abundant in the Columbia River and provide food for herbivores such as immature insects, which in turn, are consumed by predators. Plankton populations in the Hanford Reach are influenced by communities that develop in the reservoirs of upstream dams, particularly Priest Rapids Reservoir, and by manipulation of water levels below by dam operations in upstream and downstream reservoirs. Phytoplankton and zooplankton populations at the Hanford Site are largely transient, flowing from one reservoir to another. There is generally insufficient time for characteristic endemic groups of phytoplankton and zooplankton to develop in the Hanford Reach.
Phytoplankton. Phytoplankton species identified from the Hanford Reach include diatoms, golden or yellow-brown algae, green algae, blue-green algae, red algae, and dinoflagellates. Studies show diatoms are the dominant algae in the Columbia River phytoplankton, usually representing more than 90% of the populations. The main genera included Asterionella, Cyclotella, Fragilaria, Melosira, Stephanodiscus, and Synedra (Neitzel et al. 1982a). These are typical of those forms found in lakes and ponds and originate in upstream reservoirs. A number of algae found as free-floating species in the Hanford Reach of the Columbia River are actually derived from the periphyton; they were detached and suspended by current and frequent fluctuations of the water level.
Cushing (1967a) found peak concentrations of phytoplankton occurred in April and May, with a secondary peak in late summer/early autumn. The spring pulse in phytoplankton density was probably related to increasing light and water temperature rather than to availability of nutrients, a.s phosphate and nitrate nutrient concentrations are never limiting. Minimum numbers were present in December and January. Green algae (Chlorophyta) and blue-green algae (Cyanophyta) occur in phytoplankton communities during warmer months but in substantially fewer numbers than diatoms. Diversity indices, carbon uptake, and chlorophyll-a concentrations for the phytoplankton at various times and locations can be found in Beak Consultants Inc. (1980), Neitzel et al. (1982a), and Wolf et al. (1976). There have not been any phytoplankton studies conducted in the Hanford Reach in recent years.
Periphyton. Communities of periphytic species ("benthic microflora") develop on suitable solid substrate wherever there is sufficient light for photosynthesis and adequate current to prevent sediment from covering the colonies. Operation of Priest Rapids Dam results in frequent river level fluctuations. These fluctuations result in exposed shoreline areas that do not allow for the establishment of viable and persistent periphyton communities in shoreline areas inundated by water at flows greater than 13 10 m3/sec (46,300 cfs). Cushing (1 967b) observed peaks of production to occur in spring and late summer. Dominant genera are the diatoms Achnanthes, Asterionella, Cocconeis, Fragilaria, Gomphonema, Melosira, Nitzchia, Stephanodiscus, and Synedra (Beak Consultants Inc. 1980, Neitzel et al. 1982a, Page and Neitzel 1978, Page et al. 1979).
Macrophytes. Macrophytes are sparse in the Columbia River because of strong currents, rocky bottom, and frequently fluctuating water levels. Rushes (Juncus spp.) and sedges (Carex spp.) occur along shorelines of the slack-water areas such as White Bluffs Slough below the 100-H Area, the slough area downstream of the 100-F Area, and Hanford Slough. Reed canary grass (Phalaris arundinacea) is a common non-native species found along shoreline areas. Macrophytes are also present along gently sloping shorelines that are subject to flooding during the spring freshet and daily fluctuating river levels (below Coyote Rapids and the 100-D Area). Commonly found plants include duckweed (Lemna), and the native rooted pond weeds (Potamogeton sp. and Elodea canadensis). Where they exist, macrophytes have considerable ecological value. They provide food and shelter for juvenile fish and spawning areas for some species of warm water game fish. Eurasian milfoil (Myriophyllum spicatum), an exotic macrophyte, has increased to nuisance levels, and may encourage increased sedimentation of fine particulate matter. These changes could have a significant impact on trophic relationships in the Columbia River.
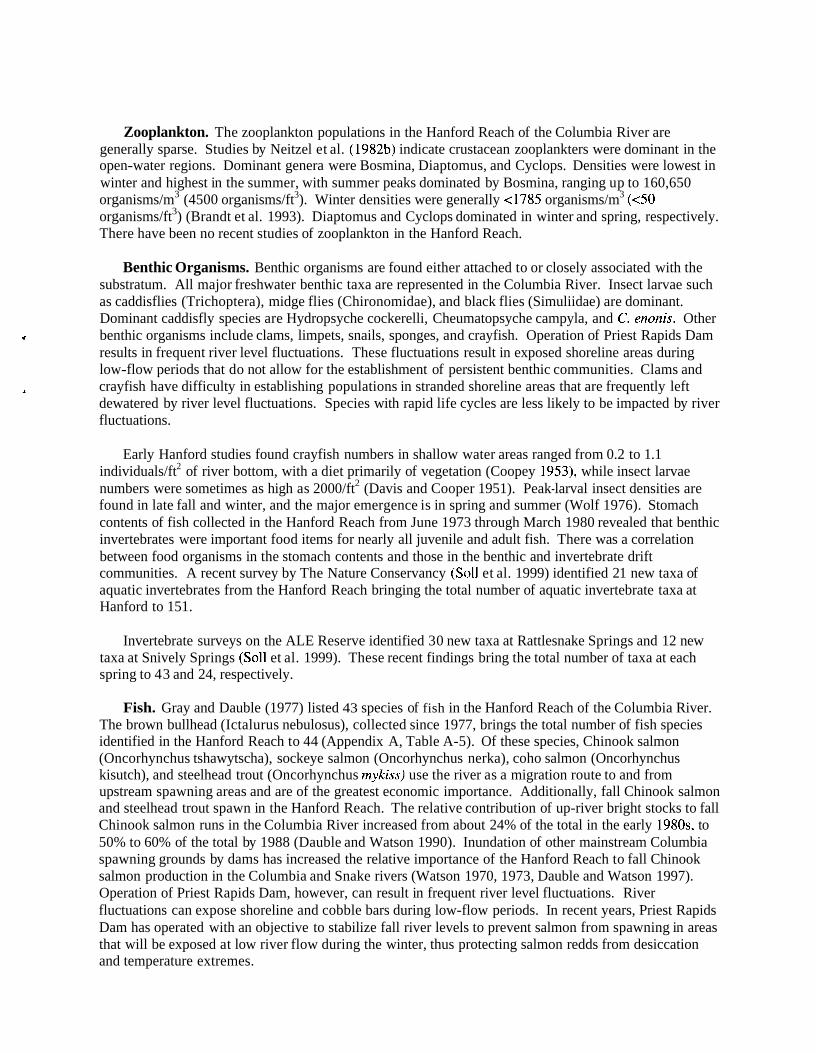
Zooplankton. The zooplankton populations in the Hanford Reach of the Columbia River are generally sparse. Studies by Neitzel et al. (1982b) indicate crustacean zooplankters were dominant in the open-water regions. Dominant genera were Bosmina, Diaptomus, and Cyclops. Densities were lowest in winter and highest in the summer, with summer peaks dominated by Bosmina, ranging up to 160,650 organisms/m3 (4500 organisms/ft3). Winter densities were generally <I785 organisms/m3 ( 4 0 organisms/ft3) (Brandt et al. 1993). Diaptomus and Cyclops dominated in winter and spring, respectively. There have been no recent studies of zooplankton in the Hanford Reach.
Benthic Organisms. Benthic organisms are found either attached to or closely associated with the substratum. All major freshwater benthic taxa are represented in the Columbia River. Insect larvae such as caddisflies (Trichoptera), midge flies (Chironomidae), and black flies (Simuliidae) are dominant. Dominant caddisfly species are Hydropsyche cockerelli, Cheumatopsyche campyla, and C. enonis. Other
o benthic organisms include clams, limpets, snails, sponges, and crayfish. Operation of Priest Rapids Dam results in frequent river level fluctuations. These fluctuations result in exposed shoreline areas during low-flow periods that do not allow for the establishment of persistent benthic communities. Clams and
7 crayfish have difficulty in establishing populations in stranded shoreline areas that are frequently left dewatered by river level fluctuations. Species with rapid life cycles are less likely to be impacted by river fluctuations.
Early Hanford studies found crayfish numbers in shallow water areas ranged from 0.2 to 1.1 individuals/ft2 of river bottom, with a diet primarily of vegetation (Coopey 1953), while insect larvae numbers were sometimes as high as 2000/ft2 (Davis and Cooper 1951). Peak-larval insect densities are found in late fall and winter, and the major emergence is in spring and summer (Wolf 1976). Stomach contents of fish collected in the Hanford Reach from June 1973 through March 1980 revealed that benthic invertebrates were important food items for nearly all juvenile and adult fish. There was a correlation between food organisms in the stomach contents and those in the benthic and invertebrate drift communities. A recent survey by The Nature Conservancy (Soll et al. 1999) identified 21 new taxa of aquatic invertebrates from the Hanford Reach bringing the total number of aquatic invertebrate taxa at Hanford to 15 1.
Invertebrate surveys on the ALE Reserve identified 30 new taxa at Rattlesnake Springs and 12 new taxa at Snively Springs (Soll et al. 1999). These recent findings bring the total number of taxa at each spring to 43 and 24, respectively.
Fish. Gray and Dauble (1977) listed 43 species of fish in the Hanford Reach of the Columbia River. The brown bullhead (Ictalurus nebulosus), collected since 1977, brings the total number of fish species identified in the Hanford Reach to 44 (Appendix A, Table A-5). Of these species, Chinook salmon (Oncorhynchus tshawytscha), sockeye salmon (Oncorhynchus nerka), coho salmon (Oncorhynchus kisutch), and steelhead trout (Oncorhynchus mykiss) use the river as a migration route to and from upstream spawning areas and are of the greatest economic importance. Additionally, fall Chinook salmon and steelhead trout spawn in the Hanford Reach. The relative contribution of up-river bright stocks to fall Chinook salmon runs in the Columbia River increased from about 24% of the total in the early 1980s, to 50% to 60% of the total by 1988 (Dauble and Watson 1990). Inundation of other mainstream Columbia spawning grounds by dams has increased the relative importance of the Hanford Reach to fall Chinook salmon production in the Columbia and Snake rivers (Watson 1970, 1973, Dauble and Watson 1997). Operation of Priest Rapids Dam, however, can result in frequent river level fluctuations. River fluctuations can expose shoreline and cobble bars during low-flow periods. In recent years, Priest Rapids Dam has operated with an objective to stabilize fall river levels to prevent salmon from spawning in areas that will be exposed at low river flow during the winter, thus protecting salmon redds from desiccation and temperature extremes.
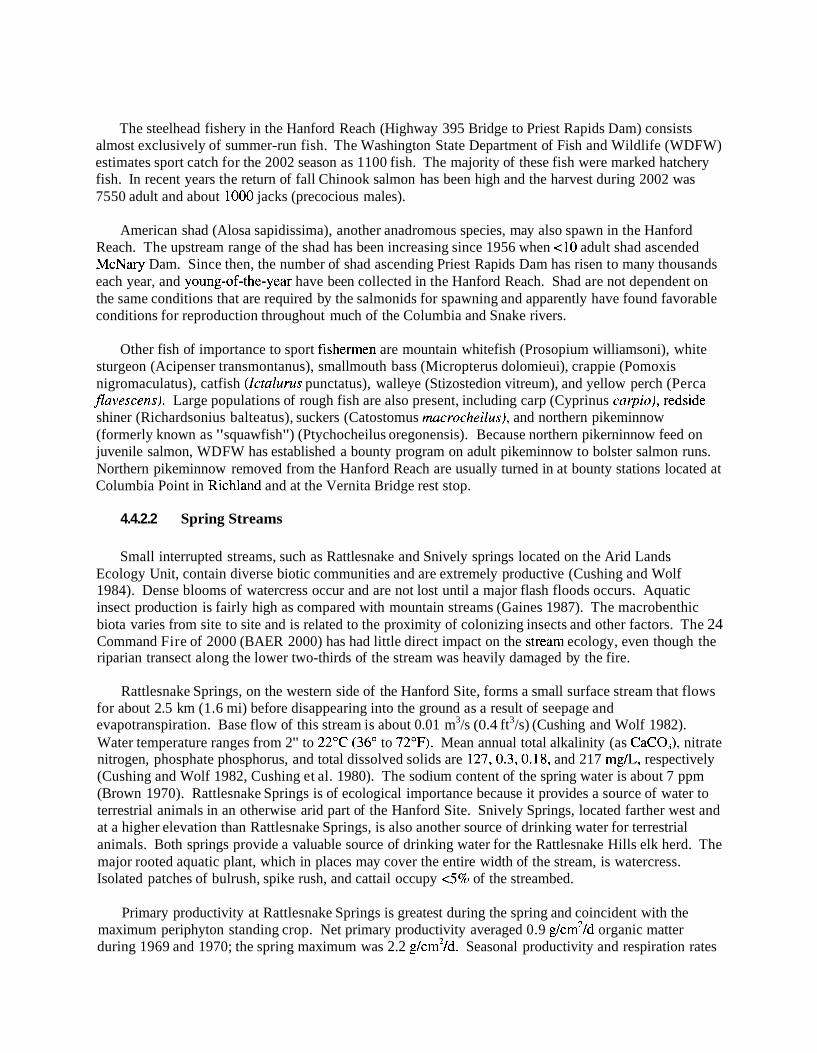
The steelhead fishery in the Hanford Reach (Highway 395 Bridge to Priest Rapids Dam) consists almost exclusively of summer-run fish. The Washington State Department of Fish and Wildlife (WDFW) estimates sport catch for the 2002 season as 1100 fish. The majority of these fish were marked hatchery fish. In recent years the return of fall Chinook salmon has been high and the harvest during 2002 was 7550 adult and about 1000 jacks (precocious males).
American shad (Alosa sapidissima), another anadromous species, may also spawn in the Hanford Reach. The upstream range of the shad has been increasing since 1956 when <10 adult shad ascended McNary Dam. Since then, the number of shad ascending Priest Rapids Dam has risen to many thousands each year, and young-of-the-year have been collected in the Hanford Reach. Shad are not dependent on the same conditions that are required by the salmonids for spawning and apparently have found favorable conditions for reproduction throughout much of the Columbia and Snake rivers.
Other fish of importance to sport fishermen are mountain whitefish (Prosopium williamsoni), white sturgeon (Acipenser transmontanus), smallmouth bass (Micropterus dolomieui), crappie (Pomoxis nigromaculatus), catfish (Ictalurus punctatus), walleye (Stizostedion vitreum), and yellow perch (Perca flavescens). Large populations of rough fish are also present, including carp (Cyprinus carpio), redside shiner (Richardsonius balteatus), suckers (Catostomus macrocheilus), and northern pikeminnow (formerly known as "squawfish") (Ptychocheilus oregonensis). Because northern pikerninnow feed on juvenile salmon, WDFW has established a bounty program on adult pikeminnow to bolster salmon runs. Northern pikeminnow removed from the Hanford Reach are usually turned in at bounty stations located at Columbia Point in Richland and at the Vernita Bridge rest stop.
4.4.2.2 Spring Streams
Small interrupted streams, such as Rattlesnake and Snively springs located on the Arid Lands Ecology Unit, contain diverse biotic communities and are extremely productive (Cushing and Wolf 1984). Dense blooms of watercress occur and are not lost until a major flash floods occurs. Aquatic insect production is fairly high as compared with mountain streams (Gaines 1987). The macrobenthic biota varies from site to site and is related to the proximity of colonizing insects and other factors. The 24 Command Fire of 2000 (BAER 2000) has had little direct impact on the stream ecology, even though the riparian transect along the lower two-thirds of the stream was heavily damaged by the fire.
Rattlesnake Springs, on the western side of the Hanford Site, forms a small surface stream that flows for about 2.5 km (1.6 mi) before disappearing into the ground as a result of seepage and evapotranspiration. Base flow of this stream is about 0.01 m3/s (0.4 ft3/s) (Cushing and Wolf 1982). Water temperature ranges from 2" to 22OC (36" to 72OF). Mean annual total alkalinity (as CaCO,), nitrate nitrogen, phosphate phosphorus, and total dissolved solids are 127,0.3,0.18, and 217 mg/L, respectively (Cushing and Wolf 1982, Cushing et al. 1980). The sodium content of the spring water is about 7 ppm (Brown 1970). Rattlesnake Springs is of ecological importance because it provides a source of water to terrestrial animals in an otherwise arid part of the Hanford Site. Snively Springs, located farther west and at a higher elevation than Rattlesnake Springs, is also another source of drinking water for terrestrial animals. Both springs provide a valuable source of drinking water for the Rattlesnake Hills elk herd. The major rooted aquatic plant, which in places may cover the entire width of the stream, is watercress. Isolated patches of bulrush, spike rush, and cattail occupy 4 % of the streambed.
Primary productivity at Rattlesnake Springs is greatest during the spring and coincident with the maximum periphyton standing crop. Net primary productivity averaged 0.9 g/cm2/d organic matter during 1969 and 1970; the spring maximum was 2.2 g/cm2/d. Seasonal productivity and respiration rates
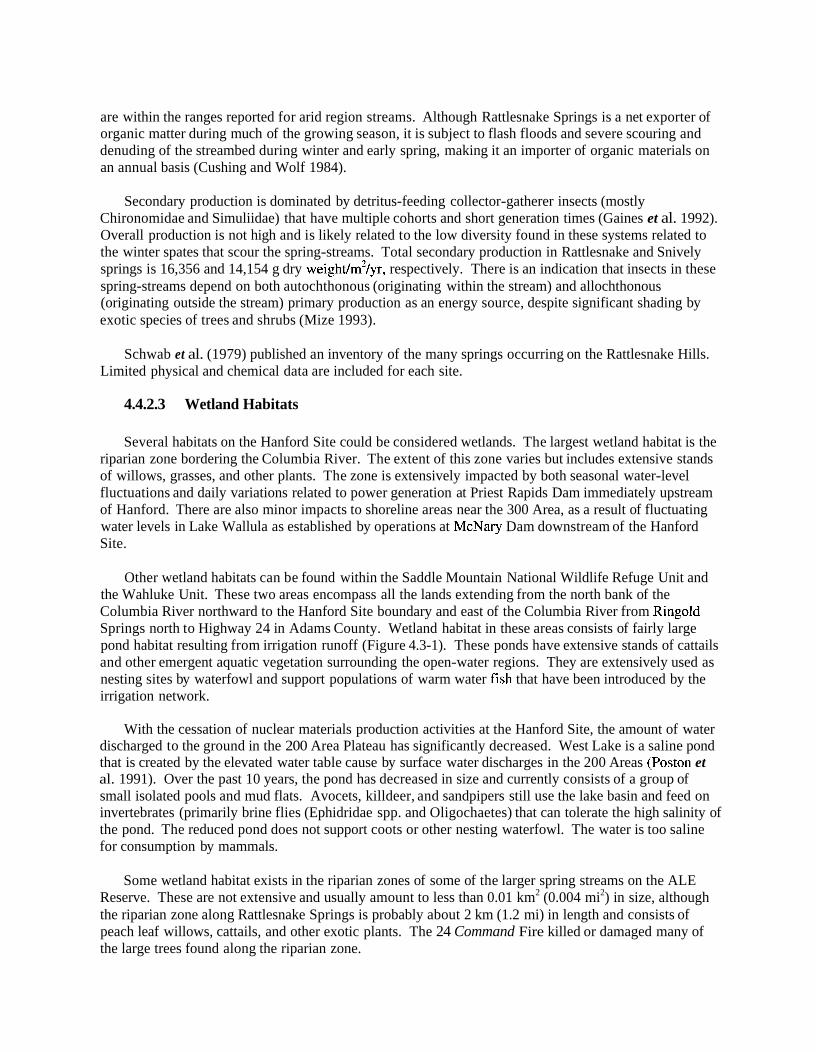
are within the ranges reported for arid region streams. Although Rattlesnake Springs is a net exporter of organic matter during much of the growing season, it is subject to flash floods and severe scouring and denuding of the streambed during winter and early spring, making it an importer of organic materials on an annual basis (Cushing and Wolf 1984).
Secondary production is dominated by detritus-feeding collector-gatherer insects (mostly Chironomidae and Simuliidae) that have multiple cohorts and short generation times (Gaines et al. 1992). Overall production is not high and is likely related to the low diversity found in these systems related to the winter spates that scour the spring-streams. Total secondary production in Rattlesnake and Snively springs is 16,356 and 14,154 g dry weight/m21yr, respectively. There is an indication that insects in these spring-streams depend on both autochthonous (originating within the stream) and allochthonous (originating outside the stream) primary production as an energy source, despite significant shading by exotic species of trees and shrubs (Mize 1993).
Schwab et al. (1979) published an inventory of the many springs occurring on the Rattlesnake Hills. Limited physical and chemical data are included for each site.
4.4.2.3 Wetland Habitats
Several habitats on the Hanford Site could be considered wetlands. The largest wetland habitat is the riparian zone bordering the Columbia River. The extent of this zone varies but includes extensive stands of willows, grasses, and other plants. The zone is extensively impacted by both seasonal water-level fluctuations and daily variations related to power generation at Priest Rapids Dam immediately upstream of Hanford. There are also minor impacts to shoreline areas near the 300 Area, as a result of fluctuating water levels in Lake Wallula as established by operations at McNary Dam downstream of the Hanford Site.
Other wetland habitats can be found within the Saddle Mountain National Wildlife Refuge Unit and the Wahluke Unit. These two areas encompass all the lands extending from the north bank of the Columbia River northward to the Hanford Site boundary and east of the Columbia River from Ringold Springs north to Highway 24 in Adams County. Wetland habitat in these areas consists of fairly large pond habitat resulting from irrigation runoff (Figure 4.3-1). These ponds have extensive stands of cattails and other emergent aquatic vegetation surrounding the open-water regions. They are extensively used as nesting sites by waterfowl and support populations of warm water fish that have been introduced by the irrigation network.
With the cessation of nuclear materials production activities at the Hanford Site, the amount of water discharged to the ground in the 200 Area Plateau has significantly decreased. West Lake is a saline pond that is created by the elevated water table cause by surface water discharges in the 200 Areas (Poston et al. 1991). Over the past 10 years, the pond has decreased in size and currently consists of a group of small isolated pools and mud flats. Avocets, killdeer, and sandpipers still use the lake basin and feed on invertebrates (primarily brine flies (Ephidridae spp. and Oligochaetes) that can tolerate the high salinity of the pond. The reduced pond does not support coots or other nesting waterfowl. The water is too saline for consumption by mammals.
Some wetland habitat exists in the riparian zones of some of the larger spring streams on the ALE Reserve. These are not extensive and usually amount to less than 0.01 km2 (0.004 mi2) in size, although the riparian zone along Rattlesnake Springs is probably about 2 km (1.2 mi) in length and consists of peach leaf willows, cattails, and other exotic plants. The 24 Command Fire killed or damaged many of the large trees found along the riparian zone.
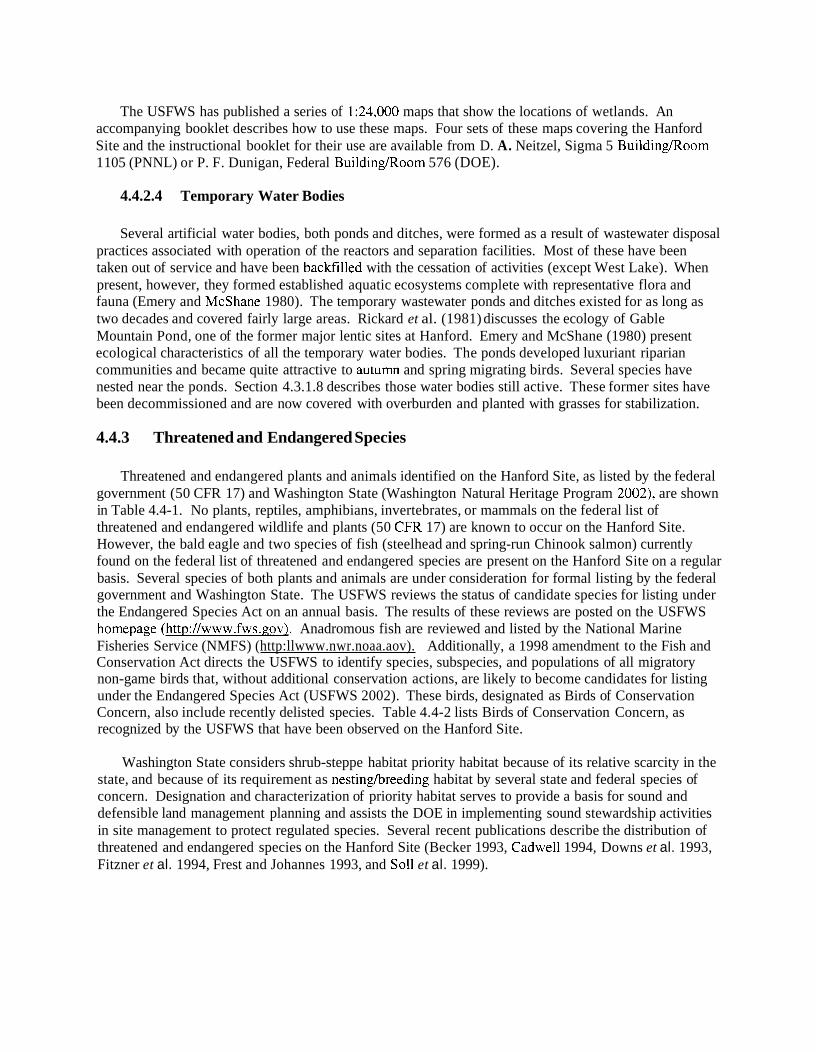
The USFWS has published a series of 1:24,000 maps that show the locations of wetlands. An accompanying booklet describes how to use these maps. Four sets of these maps covering the Hanford Site and the instructional booklet for their use are available from D. A. Neitzel, Sigma 5 BuildingIRoom 1 105 (PNNL) or P. F. Dunigan, Federal Building/Room 576 (DOE).
4.4.2.4 Temporary Water Bodies
Several artificial water bodies, both ponds and ditches, were formed as a result of wastewater disposal practices associated with operation of the reactors and separation facilities. Most of these have been taken out of service and have been backfilled with the cessation of activities (except West Lake). When present, however, they formed established aquatic ecosystems complete with representative flora and fauna (Emery and McShane 1980). The temporary wastewater ponds and ditches existed for as long as two decades and covered fairly large areas. Rickard et al. (1981) discusses the ecology of Gable Mountain Pond, one of the former major lentic sites at Hanford. Emery and McShane (1980) present ecological characteristics of all the temporary water bodies. The ponds developed luxuriant riparian communities and became quite attractive to autumn and spring migrating birds. Several species have nested near the ponds. Section 4.3.1.8 describes those water bodies still active. These former sites have been decommissioned and are now covered with overburden and planted with grasses for stabilization.
4.4.3 Threatened and Endangered Species
Threatened and endangered plants and animals identified on the Hanford Site, as listed by the federal government (50 CFR 17) and Washington State (Washington Natural Heritage Program 2002), are shown in Table 4.4-1. No plants, reptiles, amphibians, invertebrates, or mammals on the federal list of threatened and endangered wildlife and plants (50 CFR 17) are known to occur on the Hanford Site. However, the bald eagle and two species of fish (steelhead and spring-run Chinook salmon) currently found on the federal list of threatened and endangered species are present on the Hanford Site on a regular basis. Several species of both plants and animals are under consideration for formal listing by the federal government and Washington State. The USFWS reviews the status of candidate species for listing under the Endangered Species Act on an annual basis. The results of these reviews are posted on the USFWS homepage (http://www.fws.~ov). Anadromous fish are reviewed and listed by the National Marine Fisheries Service (NMFS) (http:llwww.nwr.noaa.aov). Additionally, a 1998 amendment to the Fish and Conservation Act directs the USFWS to identify species, subspecies, and populations of all migratory non-game birds that, without additional conservation actions, are likely to become candidates for listing under the Endangered Species Act (USFWS 2002). These birds, designated as Birds of Conservation Concern, also include recently delisted species. Table 4.4-2 lists Birds of Conservation Concern, as recognized by the USFWS that have been observed on the Hanford Site.
Washington State considers shrub-steppe habitat priority habitat because of its relative scarcity in the state, and because of its requirement as nestinghreeding habitat by several state and federal species of concern. Designation and characterization of priority habitat serves to provide a basis for sound and defensible land management planning and assists the DOE in implementing sound stewardship activities in site management to protect regulated species. Several recent publications describe the distribution of threatened and endangered species on the Hanford Site (Becker 1993, Cadwell 1994, Downs et al. 1993, Fitzner et al. 1994, Frest and Johannes 1993, and Sol1 et al. 1999).
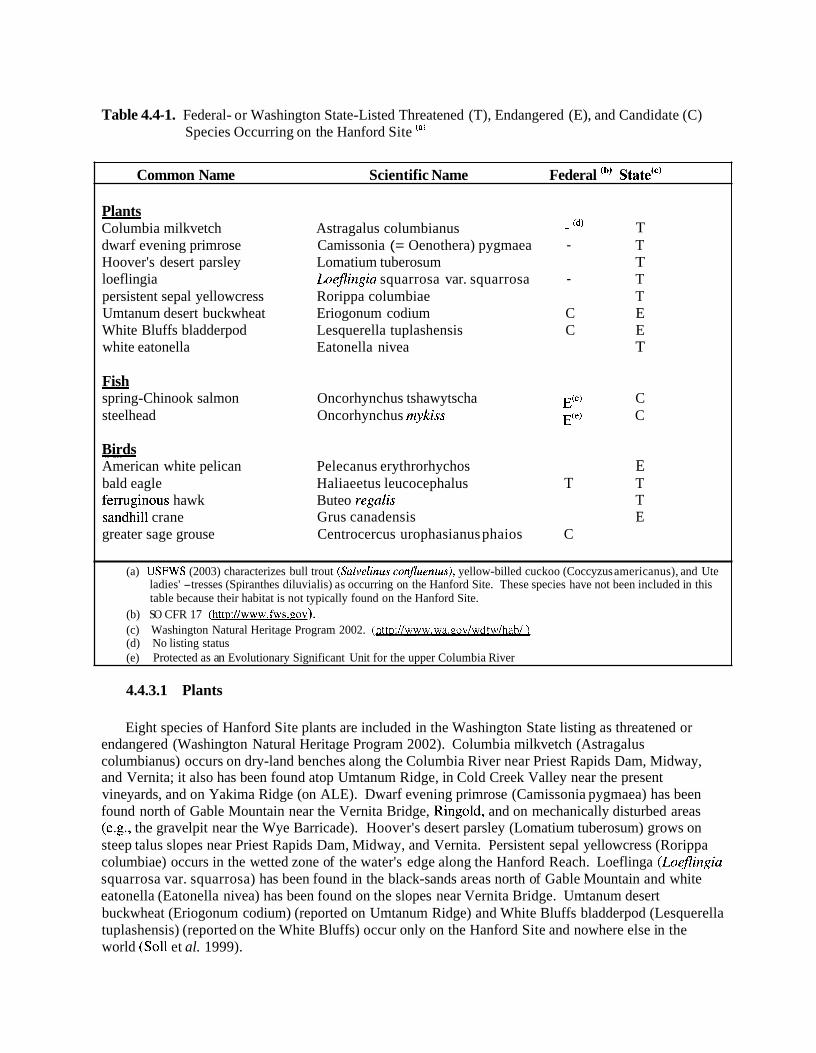
Table 4.4-1. Federal- or Washington State-Listed Threatened (T), Endangered (E), and Candidate (C) Species Occurring on the Hanford Site 'a'
Common Name Scientific Name Federal 'b' state"'
Plants - Columbia milkvetch Astragalus columbianus - (4 T dwarf evening primrose Camissonia (= Oenothera) pygmaea - T Hoover's desert parsley Lomatium tuberosum T loeflingia LoefZingia squarrosa var. squarrosa - T persistent sepal yellowcress Rorippa columbiae T Umtanum desert buckwheat Eriogonum codium C E White Bluffs bladderpod Lesquerella tuplashensis C E white eatonella Eatonella nivea T
Fish - spring-Chinook salmon Oncorhynchus tshawytscha ~ ( e ) C steelhead Oncorhynchus mykiss ~ ( e ) C
Birds - American white pelican Pelecanus erythrorhychos E bald eagle Haliaeetus leucocephalus T T fermginous hawk Buteo regalis T sandhill crane Grus canadensis E greater sage grouse Centrocercus urophasianus phaios C
(a) USFWS (2003) characterizes bull trout (Snlvelinus co~lfluentus), yellow-billed cuckoo (Coccyzus americanus), and Ute ladies' -tresses (Spiranthes diluvialis) as occurring on the Hanford Site. These species have not been included in this table because their habitat is not typically found on the Hanford Site.
(b) SO CFR 17 (httu:llwww.fws.,oov). (c) Washington Natural Heritage Program 2002. (httu://www.wa.~ov/wdfwlhabl) (d) No listing status (e) Protected as an Evolutionary Significant Unit for the upper Columbia River
4.4.3.1 Plants
Eight species of Hanford Site plants are included in the Washington State listing as threatened or endangered (Washington Natural Heritage Program 2002). Columbia milkvetch (Astragalus columbianus) occurs on dry-land benches along the Columbia River near Priest Rapids Dam, Midway, and Vernita; it also has been found atop Umtanum Ridge, in Cold Creek Valley near the present vineyards, and on Yakima Ridge (on ALE). Dwarf evening primrose (Camissonia pygmaea) has been found north of Gable Mountain near the Vernita Bridge, Ringold, and on mechanically disturbed areas (e.g., the gravelpit near the Wye Barricade). Hoover's desert parsley (Lomatium tuberosum) grows on steep talus slopes near Priest Rapids Dam, Midway, and Vernita. Persistent sepal yellowcress (Rorippa columbiae) occurs in the wetted zone of the water's edge along the Hanford Reach. Loeflinga (LoefZingia squarrosa var. squarrosa) has been found in the black-sands areas north of Gable Mountain and white eatonella (Eatonella nivea) has been found on the slopes near Vernita Bridge. Umtanum desert buckwheat (Eriogonum codium) (reported on Umtanum Ridge) and White Bluffs bladderpod (Lesquerella tuplashensis) (reported on the White Bluffs) occur only on the Hanford Site and nowhere else in the world (Sol1 et al. 1999).
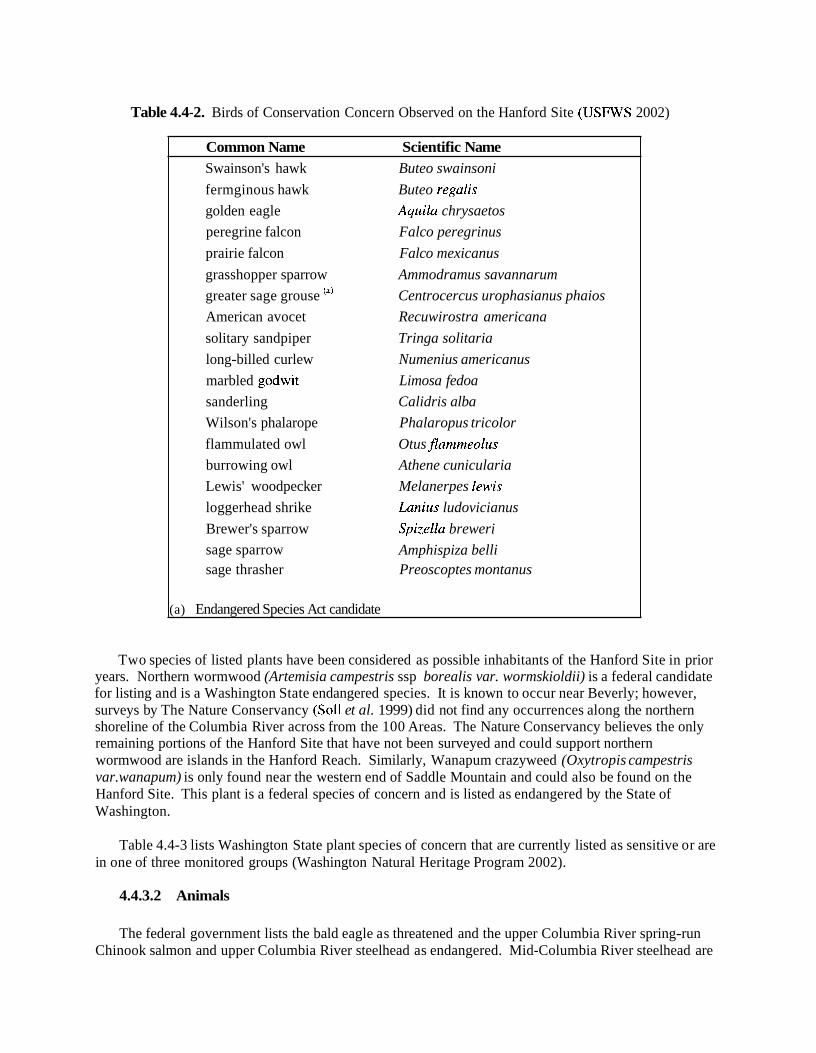
Table 4.4-2. Birds of Conservation Concern Observed on the Hanford Site (USFWS 2002)
Common Name Scientific Name Swainson's hawk Buteo swainsoni
fermginous hawk Buteo regalis
golden eagle Aquila chrysaetos
peregrine falcon Falco peregrinus
prairie falcon Falco mexicanus
grasshopper sparrow Ammodramus savannarum
greater sage grouse (a) Centrocercus urophasianus phaios
American avocet Recuwirostra americana
solitary sandpiper Tringa solitaria
long-billed curlew Numenius americanus
marbled godwit Limosa fedoa
sanderling Calidris alba
Wilson's phalarope Phalaropus tricolor
flammulated owl Otus flammeolus
burrowing owl Athene cunicularia
Lewis' woodpecker Melanerpes Lewis
loggerhead shrike Lanius ludovicianus
Brewer's sparrow Spizella breweri
sage sparrow Amphispiza belli sage thrasher Preoscoptes montanus
(a) Endangered Species Act candidate
Two species of listed plants have been considered as possible inhabitants of the Hanford Site in prior years. Northern wormwood (Artemisia campestris ssp borealis var. wormskioldii) is a federal candidate for listing and is a Washington State endangered species. It is known to occur near Beverly; however, surveys by The Nature Conservancy (Sol1 et al. 1999) did not find any occurrences along the northern shoreline of the Columbia River across from the 100 Areas. The Nature Conservancy believes the only remaining portions of the Hanford Site that have not been surveyed and could support northern wormwood are islands in the Hanford Reach. Similarly, Wanapum crazyweed (Oxytropis campestris var. wanapum) is only found near the western end of Saddle Mountain and could also be found on the Hanford Site. This plant is a federal species of concern and is listed as endangered by the State of Washington.
Table 4.4-3 lists Washington State plant species of concern that are currently listed as sensitive or are in one of three monitored groups (Washington Natural Heritage Program 2002).
4.4.3.2 Animals
The federal government lists the bald eagle as threatened and the upper Columbia River spring-run Chinook salmon and upper Columbia River steelhead as endangered. Mid-Columbia River steelhead are
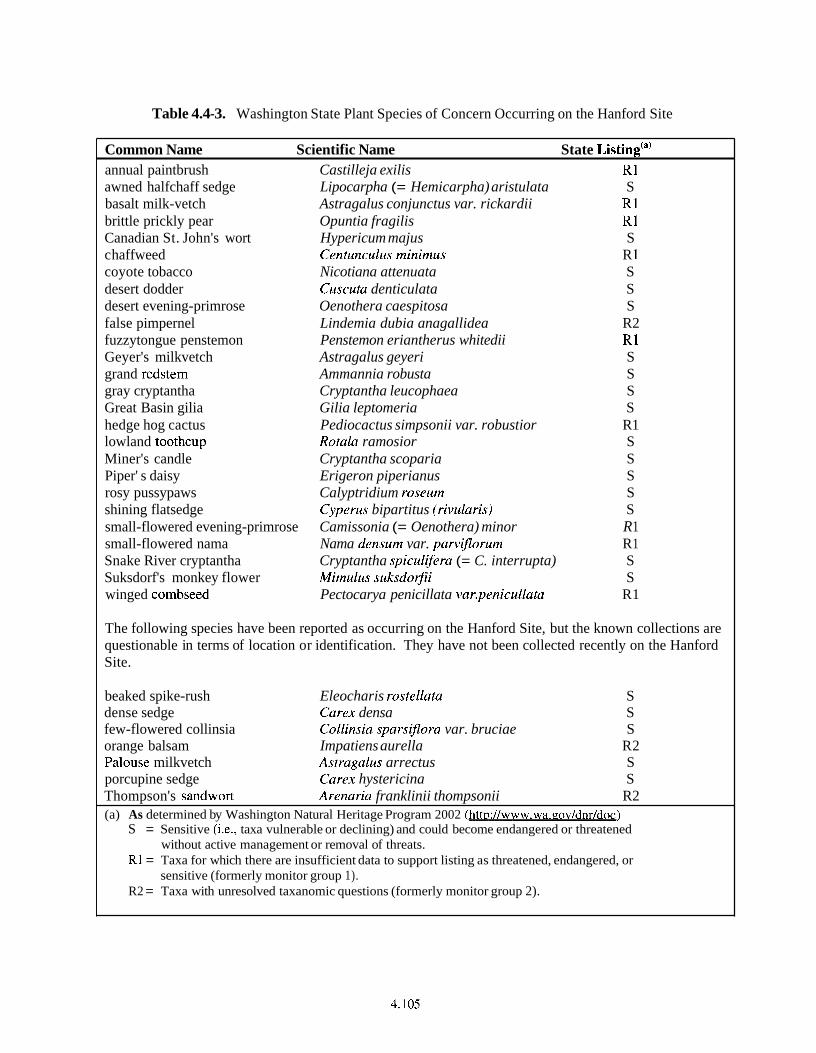
Table 4.4-3. Washington State Plant Species of Concern Occurring on the Hanford Site
Common Name Scientific Name State ist tin^'^' annual paintbrush Castilleja exilis R1 awned halfchaff sedge Lipocarpha (= Hemicarpha) aristulata S basalt milk-vetch Astragalus conjunctus var. rickardii R1 brittle prickly pear Opuntia fragilis R1 Canadian St. John's wort Hypericum majus S c haffweed Centunculus minimus R 1 coyote tobacco Nicotiana attenuata S desert dodder Cuscuta denticulata S desert evening-primrose Oenothera caespitosa S false pimpernel Lindemia dubia anagallidea R2 fuzzytongue penstemon Penstemon eriantherus whitedii R l Geyer's milkvetch Astragalus geyeri S grand redstem Ammannia robusta S gray cryptantha Cryptantha leucophaea S Great Basin gilia Gilia leptomeria S hedge hog cactus Pediocactus simpsonii var. robustior R 1 lowland toothcup Rotala ramosior S Miner's candle Cryptantha scoparia S Piper' s daisy Erigeron piperianus S rosy pussypaws Calyptridium roseum S shining flatsedge Cyperus bipartitus (rivularis) S small-flowered evening-primrose Camissonia (= Oenothera) minor R 1 small-flowered nama Nama densum var. pawiflorum R 1 Snake River cryptantha Cryptantha spiculifera (= C. interrupta) S Suksdorf's monkey flower Mimulus suksdorjli S winged combseed Pectocarya penicillata var.penicullata R 1
The following species have been reported as occurring on the Hanford Site, but the known collections are questionable in terms of location or identification. They have not been collected recently on the Hanford Site.
beaked spike-rush Eleocharis rostellata S dense sedge Carex densa S few-flowered collinsia Collinsia sparsijlora var. bruciae S orange balsam Impatiens aurella R2 Palouse milkvetch Astragalus arrectus S porcupine sedge Carex hystericina S Thompson's sandwort Arenaria franklinii thompsonii R2 (a) As determined by Washington Natural Heritage Program 2002 (http://www.wa.~o\,/dnr/doc)
S = Sensitive (i.e., taxa vulnerable or declining) and could become endangered or threatened without active management or removal of threats.
R1 = Taxa for which there are insufficient data to support listing as threatened, endangered, or sensitive (formerly monitor group 1).
R2 = Taxa with unresolved taxanomic questions (formerly monitor group 2).
listed as threatened. Washington State lists the American white pelican and sandhill crane (Grus Canadensis) as endangered and lists the ferruginous hawk, greater sage grouse, and bald eagle as threatened. Sage grouse were sighted on ALE in 1999 and 2000, but have not been observed since the 24 Command Fire that occurred during 2000. White pelicans have become residents of the Hanford Site but are not known to nest onsite and sandhill cranes have been occasionally observed on the Reach during their spring migrations. Ferriginous hawks are known to nest on metal transmission towers throughout the central portion of the Hanford Site.
The bald eagle is a regular winter resident and forages on dead salmon and waterfowl along the Columbia River; it has not nested on the Hanford Site, although it has attempted to nest for the last several years. Access controls are in place along the river while eagles are present to prevent their disturbance. Washington State Bald Eagle Protection Rules were issued in 1986 (Washington Administrative Code [WAC]-232-12-292). DOE developed a site management plan (Fitzner and Weiss 1994) to mitigate eagle disturbance. This document constitutes a biological assessment for those activities implemented in accordance with the plan and, unless there are extenuating circumstances associated with a given project, the document fulfills the requirements of Section 7 (a)(2) of the Endangered Species Act (16 USC 1531-1544) for bald eagles and peregrine falcons. Section 7 (a) of the Endangered Species Act also requires consultation with the U.S. Department of the Interior when any action is taken that may destroy, adversely modify, or jeopardize the existence of bald eagle or other endangered species' critical habitat. At this time, bald eagles are under consideration for de-listing; however, the species will require 5 years of post de-listing monitoring (50 CFR 17).
Steelhead and salmon are regulated as Evolutionary Significant Units (ESU) by the NMFS based on their historical geographic spawning areas. The upper Columbia River ESU steelhead (Oncorhynchus mykissj was listed as endangered in August 1997 and the mid-Columbia ESU steelhead were listed as threatened on March 25, 1999 (64 FR 145 17). The upper Columbia River ESU spring-run Chinook salmon (Oncorhynchus tshawytscha) was listed as endangered in March 1999. These adult steelhead and Chinook salmon migrate upstream through the Hanford Reach to spawn in upriver tributaries and juveniles pass through the Hanford Reach on their outward migration to the sea. A salmon and steelhead management plan (DOE 2000b) for Hanford Reach steelhead and upriver Columbia River ESU spring- run Chinook was developed as required by section 7 (a)(2) of the Endangered Species Act.
Several federal- or state-listed species have been reported on very rare instances on or near the Hanford Site. The bull trout (Salvelinus confluentus), a state candidate species and federal threatened species, has been reported in the Hanford Reach, but its natural habitat is mountain streams; anecdotal accounts of bull trout in the Hanford Reach are likely individuals moved downstream during the spring freshet. Peregrine falcons (Falco pereginus) are occasionally seen on the Hanford Site during migration, but are no longer listed as a state or federal endangered species. The pygmy rabbit (Brachylagus idahoensis) was recently listed as "Emergency listing, endangered" for the Columbia Basin distinct population. The pygmy rabbit has been reported as residing on the ALE Reserve (Fitzner and Gray 1991). However, this observation is based on only one reported sighting in 1979. Their presence on the Hanford Site is unlikely and has not been documented with additional sightings or physical evidence since that time despite intensive surveys.
There are several Washington State candidate species that have been reported on the Hanford Site (Table 4.4-4). Decline of steppe habitat statewide has resulted in the designation of black-tailed and white-tailed jackrabbits as state candidate species. Any number of species capable of flight could inadvertently be found onsite. Two candidate butterflies, the juniper hairstreak (Callophrys gryneus) and the silver bordered bog fritillary (Boloria selene atrocostalis), have been sighted in areas close to Hanford, but have never been observed on the Site. Similarly, Townsend's big eared bat (Plecotus
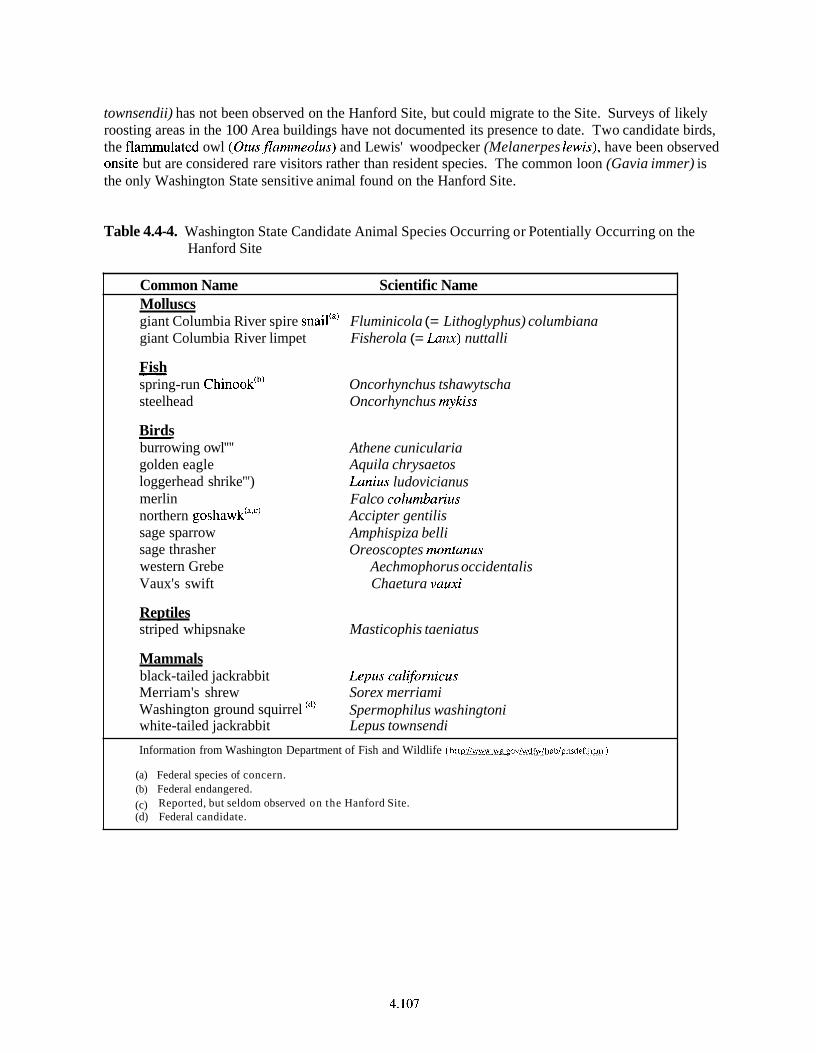
townsendii) has not been observed on the Hanford Site, but could migrate to the Site. Surveys of likely roosting areas in the 100 Area buildings have not documented its presence to date. Two candidate birds, the flarnrnulated owl (Otusflammeolus) and Lewis' woodpecker (Melanerpes Lewis), have been observed onsite but are considered rare visitors rather than resident species. The common loon (Gavia immer) is the only Washington State sensitive animal found on the Hanford Site.
Table 4.4-4. Washington State Candidate Animal Species Occurring or Potentially Occurring on the Hanford Site
Common Name Scientific Name Molluscs giant Columbia River spire snail'a' Fluminicola (= Lithoglyphus) columbiana giant Columbia River limpet Fisherola (= Lanx) nuttalli
Fish - spring-run hin nook'^) Oncorhynchus tshawytscha steelhead Oncorhynchus mykiss
Birds - burrowing owl'"' Athene cunicularia golden eagle Aquila chrysaetos loggerhead shrike'") Lanius ludovicianus merlin Falco columbarius northern Accipter gentilis sage sparrow Amphispiza belli sage thrasher Oreoscoptes montanus western Grebe Aechmophorus occidentalis Vaux's swift Chaetura vauxi
Reptiles striped whipsnake Masticophis taeniatus
Mammals black-tailed jackrabbit Lep~ls californicus Merriam's shrew Sorex merriami Washington ground squirrel (d' Spermophilus washingtoni white-tailed jackrabbit Lepus townsendi
Information from Washington Department of Fish and Wildlife (htt~:i:uuw~.wa.~ov!wdf~~iI~abi~hsdef.I~tn)
(a) Federal species of concern. (b) Federal endangered.
(c) Reported, but seldom observed on the Hanford Site. (d) Federal candidate.
4.5 Cultural, Archaeological, and Historical Resources E. L. Prendergast-Kennedy, D. W. Harvey, and D. M. Woody
The following section represents a summary of cultural, archaeological, and historical resources that are known to be located on the Hanford Site. The inventory is based on a summary of archaeological, historical, and ethnographic data collected from archival records, archaeological surveys, and ethnographic interviews. It does not reflect a complete inventory as presently 24% of the Hanford Site has been surveyed for archaeological resources (Figure 4.5-1).
The Hanford Site is one of the richest cultural resource areas remaining in the western Columbia Plateau. The Site comprises a series of cultural landscapes containing the cumulative record of multiple occupations by both Native and non-Native Americans. For management and interpretive purposes, these cultural landscapes have been divided into the Native American Landscape, the Early SettlerdFarming Landscape, and the Manhattan Project and Cold War Landscape. These landscapes contain numerous well-preserved archaeological resources representing pre-contact, ethnographic, and historic periods. Period resources include sites with cultural materials that are thousands of years old, traditional cultural places, and buildings and structures from the pre-Hanford, Manhattan Project, and Cold War eras. (For overall site-wide history, an online report is available at http://www.hanford.,oov/doe/culres/mpd (DOE 1997~). Site-wide management of Hanford's cultural resources will follow the Hanford Cultural Resources Management Plan (DOE 2003a).
Approximately 1405 cultural resources sites and isolated finds, and 531 buildings and structures have been documented since 1926 on the Hanford Site. Early archaeological reconnaissance projects dating from 1926 to 1968 (Drucker 1948, Krieger 1928, Rice 1968a,b) and more recent National Historic Preservation Act, Section 1 10 and 106, archaeological surveys conducted between 1987 and 2002 have resulted in formal recording of these resources on archaeological site and isolate forms and Washington State Historic Property Inventory Forms. The DOE Hanford Cultural Resources Laboratory (HCRL) holds these records.
Of the 127 sites that have been evaluated for listing in the National Register of Historic Places (National Register), 49 have been listed. Except for B-Reactor, which is associated with the Manhattan Project and Cold War Period, the other listed sites are associated with the Native American Landscape. Most of these are part of six Archaeological Districts and with the exception of the Rattlesnake Springs Sites and the Snively Canyon Archaeological District, are situated on the shores and islands of the Columbia River (Table 4.5-1).
Eleven individual archaeological sites and three historic districts comprising 58 archaeological sites and 530 buildings or structures have also been determined to be eligible for listing in the National Register (Table 4.5-2). These sites are dispersed throughout the Hanford Site and represent the three cultural landscapes found on the Hanford Site. In addition to the National Register sites and districts, 47 of Hanford's cultural resource sites (46 in three districts and one site) are listed in the Washington Heritage Register (Table 4.5-3). These are associated with the Native American cultural landscape and are located predominantly along the Columbia River. More information on sites listed and eligible for listing in the National Register and the Washington Heritage Register may be found by contacting the DOE Richland Operations Office, Hanford Cultural and Historic Resources Program.
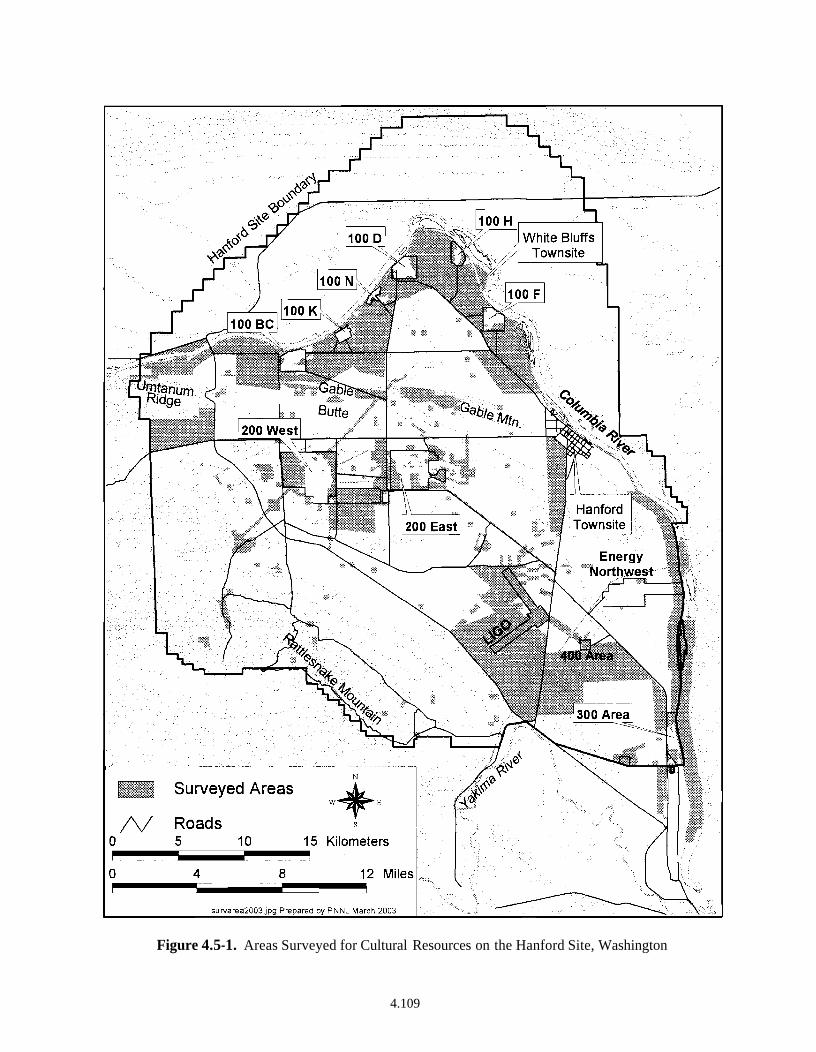
Figure 4.5-1. Areas Surveyed for Cultural Resources on the Hanford Site, Washington
4.109
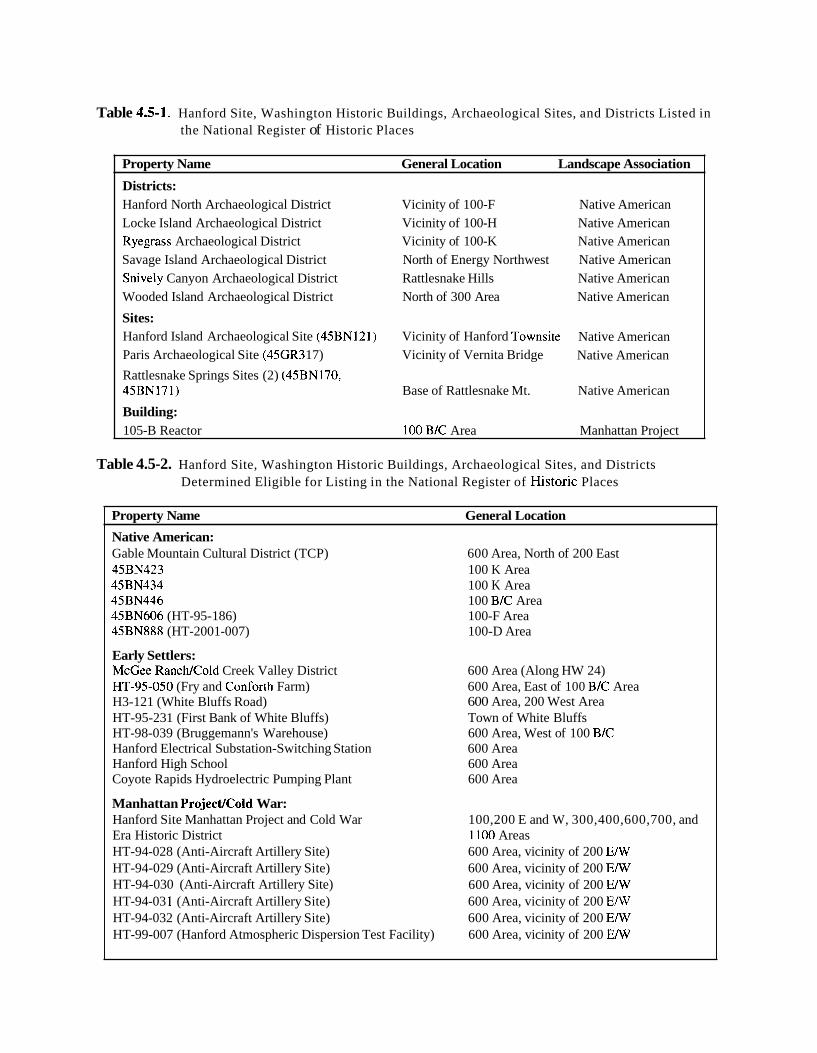
Table 4.5-1. Hanford Site, Washington Historic Buildings, Archaeological Sites, and Districts Listed in the National Register of Historic Places
Property Name General Location Landscape Association
Districts: Hanford North Archaeological District Vicinity of 100-F Native American Locke Island Archaeological District Vicinity of 100-H Native American Ryegrass Archaeological District Vicinity of 100-K Native American Savage Island Archaeological District North of Energy Northwest Native American Snively Canyon Archaeological District Rattlesnake Hills Native American Wooded Island Archaeological District North of 300 Area Native American
Sites: Hanford Island Archaeological Site (45BN121) Vicinity of Hanford Townsite Native American Paris Archaeological Site (45GR3 17) Vicinity of Vernita Bridge Native American
Rattlesnake Springs Sites (2) (45BN170, 45BN171) Base of Rattlesnake Mt. Native American
Building: 105-B Reactor 100 B/C Area Manhattan Project
Table 4.5-2. Hanford Site, Washington Historic Buildings, Archaeological Sites, and Districts Determined Eligible for Listing in the National Register of Histaric Places
Property Name General Location
Native American: Gable Mountain Cultural District (TCP) 600 Area, North of 200 East 45BN423 100 K Area 45BN434 100 K Area 45BN446 100 BIC Area 45BN606 (HT-95- 186) 100-F Area 45BN888 (HT-2001-007) 100-D Area
Early Settlers: McGee RanchICold Creek Valley District 600 Area (Along HW 24) HT-95-050 (Fry and Conforth Farm) 600 Area, East of 100 BIC Area H3-121 (White Bluffs Road) 600 Area, 200 West Area HT-95-23 1 (First Bank of White Bluffs) Town of White Bluffs HT-98-039 (Bruggemann's Warehouse) 600 Area, West of 100 B/C Hanford Electrical Substation-Switching Station 600 Area Hanford High School 600 Area Coyote Rapids Hydroelectric Pumping Plant 600 Area
Manhattan ProjectJCold War: Hanford Site Manhattan Project and Cold War 100,200 E and W, 300,400,600,700, and Era Historic District 1 I00 Areas HT-94-028 (Anti-Aircraft Artillery Site) 600 Area, vicinity of 200 E N HT-94-029 (Anti-Aircraft Artillery Site) 600 Area, vicinity of 200 E/W HT-94-030 (Anti-Aircraft Artillery Site) 600 Area, vicinity of 200 E/W HT-94-03 1 (Anti-Aircraft Artillery Site) 600 Area, vicinity of 200 E/W HT-94-032 (Anti-Aircraft Artillery Site) 600 Area, vicinity of 200 EIW HT-99-007 (Hanford Atmospheric Dispersion Test Facility) 600 Area, vicinity of 200 E/W
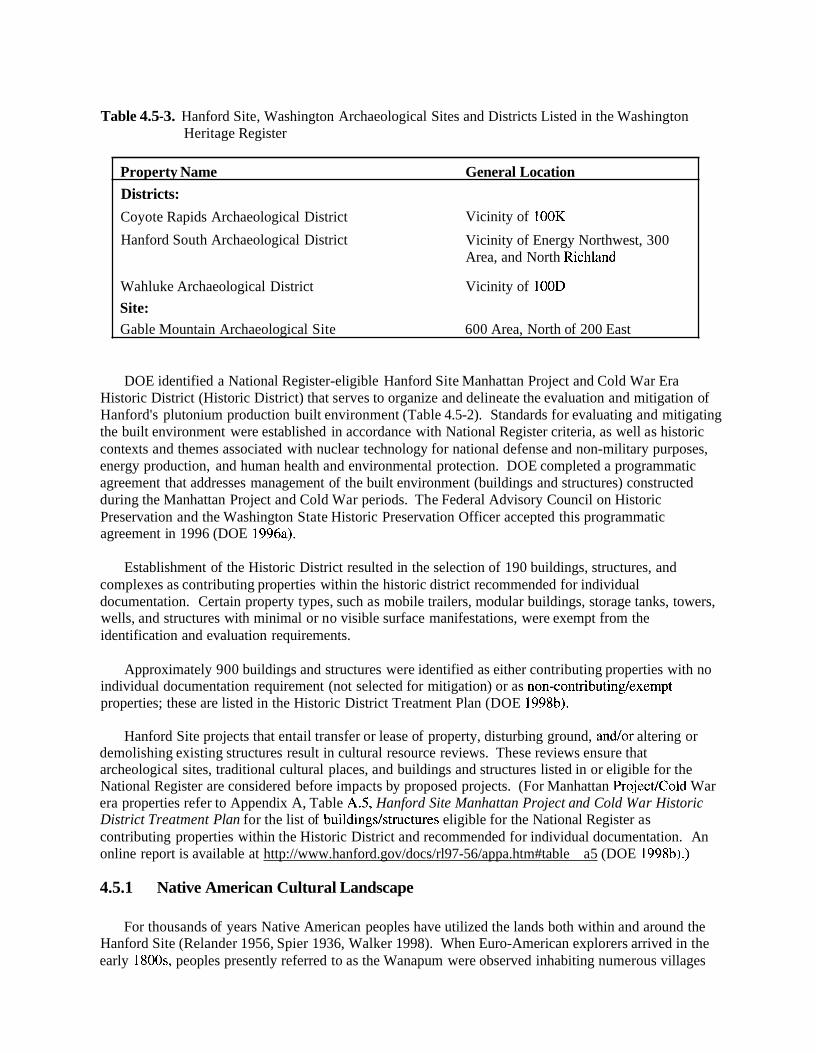
Table 4.5-3. Hanford Site, Washington Archaeological Sites and Districts Listed in the Washington Heritage Register
Property Name General Location
Districts:
Coyote Rapids Archaeological District Vicinity of 100K
Hanford South Archaeological District Vicinity of Energy Northwest, 300 Area, and North Richland
Wahluke Archaeological District Vicinity of lOOD
Site: Gable Mountain Archaeological Site 600 Area, North of 200 East
DOE identified a National Register-eligible Hanford Site Manhattan Project and Cold War Era Historic District (Historic District) that serves to organize and delineate the evaluation and mitigation of Hanford's plutonium production built environment (Table 4.5-2). Standards for evaluating and mitigating the built environment were established in accordance with National Register criteria, as well as historic contexts and themes associated with nuclear technology for national defense and non-military purposes, energy production, and human health and environmental protection. DOE completed a programmatic agreement that addresses management of the built environment (buildings and structures) constructed during the Manhattan Project and Cold War periods. The Federal Advisory Council on Historic Preservation and the Washington State Historic Preservation Officer accepted this programmatic agreement in 1996 (DOE 1996a).
Establishment of the Historic District resulted in the selection of 190 buildings, structures, and complexes as contributing properties within the historic district recommended for individual documentation. Certain property types, such as mobile trailers, modular buildings, storage tanks, towers, wells, and structures with minimal or no visible surface manifestations, were exempt from the identification and evaluation requirements.
Approximately 900 buildings and structures were identified as either contributing properties with no individual documentation requirement (not selected for mitigation) or as non-contributinglexempt properties; these are listed in the Historic District Treatment Plan (DOE 1998b).
Hanford Site projects that entail transfer or lease of property, disturbing ground, and/or altering or demolishing existing structures result in cultural resource reviews. These reviews ensure that archeological sites, traditional cultural places, and buildings and structures listed in or eligible for the National Register are considered before impacts by proposed projects. (For Manhattan ProjectICold War era properties refer to Appendix A, Table A.5, Hanford Site Manhattan Project and Cold War Historic District Treatment Plan for the list of buildings/structures eligible for the National Register as contributing properties within the Historic District and recommended for individual documentation. An online report is available at http://www.hanford.gov/docs/rl97-56/appa.htm#table a5 (DOE 1998b).)
4.5.1 Native American Cultural Landscape
For thousands of years Native American peoples have utilized the lands both within and around the Hanford Site (Relander 1956, Spier 1936, Walker 1998). When Euro-American explorers arrived in the early 1800s, peoples presently referred to as the Wanapum were observed inhabiting numerous villages
and fishing camps scattered throughout this segment of the mid-Columbia River. Neighboring groups known today as the Yakama, Umatilla, Cayuse, Walla Walla, Palus, Nez Perce, and Middle Columbia Salish frequented the area to trade, gather resources, and conduct other activities. Many descendants of these tribes and bands are affiliated with the Wanapum, Confederated Tribes and Bands of the Yakama Nation, Confederated Tribes of the Umatilla Reservation, Nez Perce Tribe of Idaho, or the Confederated Tribes of the Colville Reservation, and they retain traditional, cultural, and religious ties to Hanford's places and resources. (Section 6.5 offers further information on the treaties associated with the Hanford Site). This record of Native American use and history is reflected in the archaeological sites and traditional cultural places that are located across the Hanford Site.
4.5.1.1 Archaeological Resources
More than 8000 years of pre-contact human activity in this largely arid environment of the mid- Columbia River region have left extensive archaeological deposits along the river shores (DOE 2003a, Greengo 1982, Leonhardy and Rice 1970). Well-watered areas inland from the river also show evidence of concentrated human activity (Chatters 1982, DOE 2003a, Daugherty 1952, Greene 1975, Leonhardy and Rice 1970, Rice 1980a) and recent research has indicated ephemeral use of arid lowlands for hunting and other resource procurement activities. Throughout most of the region, hydroelectric development, agricultural activities, and domestic and industrial construction have destroyed or covered the majority of these deposits. Amateur artifact collectors have had an immeasurable impact on what remains at numerous sites. However, by virtue of their inclusion in the Hanford Site from which the public is restricted, archaeological deposits found in the Hanford Reach of the Columbia River and on adjacent plateaus and mountains have witnessed less destruction than many other areas.
Approximately 720 archaeological sites and isolated finds associated with the pre-contact period have been recorded on the Hanford Site; of these, 80 contain historic components as well. Pre-contact period sites common to the Hanford Site include pit house villages, various types of open campsites, spirit quest monuments (rock cairns), hunting camps, game drive complexes, and quarries in nearby mountains and rocky bluffs (Rice 1968a, b; Rice 1980a); huntingrkill sites in lowland stabilized dunes; and small temporary camps near perennial sources of water located away from the river (Rice 1968b).
A historic context for the pre-contact period of the Hanford Site has been prepared as part of a National Register Multiple Property Documentation form to assist with the evaluation of the National Register eligibility of pre-contact archaeological resources. An online report is available at http:Nwww.hanford.gov/doelc~~lreslmpdlsec2.htm#2.0 (DOE 1997~).
4.5.1.2 Traditional Cultural Places
In 1990, the National Park Service formalized the concept of traditional cultural property or traditional cultural place (TCP) as a means to identify and protect cultural landscapes, places, and objects that have special cultural significance to Native Americans and other ethnic groups (Parker and King 1990). A TCP eligible for the National Register is associated with "cultural practices or beliefs of a living community that are rooted in that community's history, and are important in maintaining the continuing cultural identity of the community" (Parker and King 1990).
The Hanford Reach and the greater Hanford Site, a geographic center for regional Native American religious activities, is central to the practice of Indian religion of the region, and many believe the Creator made the first people here (DO1 1994). Indian religious leaders such as Smoholla, a prophet of Priest Rapids who brought the Washani religion to the Wanapum and others during the late 19" century, began their teachings here. Native plant and animal foods, some of which can be found on the Hanford Site, are
used in the ceremonies performed by tribal members. Prominent landforms such as Rattlesnake Mountain, Gable Mountain, and Gable Butte, as well as various sites along and including the Columbia River. remain sacred to them.
Native American traditional cultural places within the Hanford Site include, but are not limited to, a wide variety of places and landscapes: archaeological sites, cemeteries, trails and pathways, campsites and villages, fisheries, hunting grounds, plant gathering areas, holy lands, landmarks, important places in Indian history and culture, places of persistence and resistance, and landscapes of the heart (Bard 1997). Due to their sacred nature, many traditional cultural places remain unidentified. The DOE and HCRL continue to consult with Hanford Tribes for input on these important locations, as their importance is determined through methods that are mutually agreed upon by DOE and the Native American community.
A historic context for the EthnographicIContact Periods of the Hanford Site has been prepared as part of a National Register Multiple Property Documentation form to assist with the evaluation of the National Register eligibility of Native American ethnographic resources. An online report is available at http:llwww.hanford.nov/doelculreslmpdlsec3.htm#3.O (DOE 1997~).
4.5.2 Early SettlersIFarming Landscape
The Early SettlersIFarming Landscape is comprised of those areas on the Hanford Site where people, mainly of European descent, and some of various ethnicity, settled in the Columbia River Plateau prior to the start of the Manhattan Project in 1943. Non-Native American presence in the mid-Columbia began in 1805 with the arrival of the Lewis and Clark Expedition. It was not until the late 19" and early 20" centuries, however, that non-Native American peoples began intensive settlement on the Hanford Site. A record of their activities and use is present in the archaeological sites, traditional cultural places, and buildings and structures that are located throughout the Hanford Site.
A historic context for the Euro-American resettlement period (pre-Hanford era) has been prepared as part of a National Register Multiple Property Documentation form to assist with the evaluation of the National Register eligibility of historic archaeological resources, traditional cultural places, and historic structures. An online report is available at http:Nwww.hanford.~ovldoelculre~lmpdl~e~4.htm#4.O) (DOE 1997~).
4.5.2.1 Archaeological Resources
The first Euro-Americans to pass near the Hanford Site were part of the Lewis and Clark expedition, which traveled along the Columbia and Snake rivers during the 1803 to 1806 exploration of the Louisiana Territory. The first European explorer to cross the Hanford Site was David Thompson, who traveled along the Columbia River from Canada during his 181 1 exploration of the Columbia River. Other visitors included fur trappers, military units, and miners who traveled through the Hanford Site on their way to lands up and down the Columbia River and across the Columbia Basin. It was not until the 1860s that merchants set up stores, a freight depot, and the White Bluffs Ferry on the Hanford Reach. Chinese miners soon began to work the gravel bars for gold. Cattle ranches were established in the 1880s, and farmers soon followed. Agricultural development, irrigation districts, and roads soon dotted the
%
landscape, particularly in the eastern portion of the central Hanford Site. Several small thriving towns, including Hanford, White Bluffs, Richland, and Ringold, grew up along the riverbanks in the early 20' century. The communities' accessibility to outside markets expanded with the arrival in 191 3 of the Chicago, Milwaukee, St. Paul and Pacific Railroad branch line (Priest Rapids-Hanford Line) from Beverly, Washington. Ferries were established at Richland, Hanford, Wahluke, and Richmond. The
towns and nearly all other structures were razed in the years after the U.S. Government acquired the land for the Hanford Engineer Works in 1943 (DOE 2003a, ERTEC 198 1, Rice 1980a).
Approximately 620 historic archaeological sites associated with the Early SettlerFarming Landscape including an assortment of towns, farmsteads, corrals and dumps are recorded by the HCRL since 1987. Approximately 80 of these sites contain pre-contact components as well. Archaeological resources from the Early SettlersFarrning period are scattered over the entire Hanford Site and include numerous areas of gold mining features along the riverbanks of the Columbia and remains of homesteads, building foundations, agricultural equipment and fields, ranches, and irrigation features. Archaeological properties from this period include the Hanford Irrigation Ditch; former Hanford Townsite; Wahluke Ferry; White Bluffs Townsite; Richmond Ferry; Arrowsmith Townsite; White Bluffs Road; and Chicago, Milwaukee, St. Paul and Pacific Railroad (Priest Rapids-Hanford Line) and associated stops.
4.5.2.2 Traditional Cultural Places
Traditional cultural places associated with the Early SettlersFarming Landscape that are located on the Hanford Site include structures and places that are important to descendants of pre-1943 settlers in the former communities of White Bluffs, Hanford, Allard, Fruitvale, Vernita, and Cold Springs. These places are deeply rooted in the memories of local residents and include but are not limited to a former cemetery, numerous former home sites and town sites, orchards, fields, former swimming holes, and places of former community activities, e.g., Hanford Grange Hall, town parks, churches, and schools. Former residents visit these areas annually with friends and family.
4.5.2.3 Buildings and Structures
Although most of the structures were destroyed by the U.S. Government to build infrastructure for the Hanford Engineer Works in 1943 (DOE 2003a, ERTEC 198 1, Rice 1980a), a small number of buildings associated with the Early SettlersFarming Landscape remain standing today. They include the Hanford Irrigation and Power Company's pumping plant at Coyote Rapids, the high school and the electrical substation at the Hanford Townsite, First Bank of White Bluffs, Bruggemann's fruit warehouse, and the blacksmith cabin at the East White Bluffs ferry landing. These structures are located near the Columbia River and in the 600 Area of the Hanford Site.
4.5.3 Manhattan Project and Cold War Cultural Landscape
The Manhattan Project and Cold War era landscape is comprised of cultural resources associated with plutonium production, military operations, research and development, waste management, and environmental monitoring activities that took place beginning with the establishment of the Hanford Site (Hanford Engineer Works) in 1943 to the end of the Cold War in 1990.
The Hanford Site built environment is an industrial landscape that consists of buildings and structures constructed during the Manhattan Project and Cold War period. This industrial landscape makes up the Hanford Site Manhattan Project and Cold War Era Historic District. The DOE Richland Operations Office, the State Historic Preservation Officer, and the Federal Advisory Council on Historic Preservation, through a programmatic agreement to manage the Manhattan Project and Cold War built environment, determined that a historic district afforded the best means to inventory, assess, and mitigate the most significant buildings and structures constructed during the Manhattan Project and Cold War. Industrial, scientific, administrative, environmental monitoring, waste management, infrastructure, and military facilities constructed during the Manhattan Project and Cold War era can be found in all of the Site areas.
While buildings and structures representing this era are located throughout the site, evidence of resources associated with military operations is mainly archaeological in nature. Military operations in various forms took place on the Site from World War I1 to the early 1960s. Most of the military operations, however, took place beginning with the establishment of Camp Hanford by the U.S. Army in 1950-5 1 until its closure in 1961. Camp Hanford was a military outpost, with the main cantonment located in North Richland and forward positions situated throughout the Site consisting of anti-aircraft artillery sites and Nike missile installations.
Historic contexts were completed for the Manhattan Project and Cold War eras as part of a National Register Multiple Property Documentation Form prepared for the Hanford Site to assist with the evaluation of National Register eligibility of buildings and structures site wide. An online report is available at http:Nwww.hanford.aov/doelculreslmp~sec4.htm#5.0) (DOE 1997~).
Additionally, historical narratives and individual building documentations have been completed for the History of the Plutonium Production Facilities at the Hanford Site Historic District, 1943-1990 (DOEIRL 2002) and have been placed on the internet at www.hanford.govldocs/rl-97-1047lindex.htm. Five hundred twenty-eight Manhattan Project and Cold War era buildingslstructures and complexes have been determined eligible for the National Register as contributing properties within the Historic District. Of that number, 190 were recommended for individual documentation. DOEIRL is in the process of undertaking an assessment of the contents of the contributing buildings and structures to locate and identify any Manhattan Project and Cold War era artifacts that may have interpretive or educational value for museum exhibit purposes (Appendix A, Table A.5, Hanford Site Manhattan Project and Cold War Era Historic Treatment Plan) (DOE 1998b).
4.5.3.1 Archaeological Resources
Historic archaeological military sites associated with the Manhattan Project and Cold War Landscape are scattered throughout the Hanford Site's 600 Area. These archaeological resources are mainly located within the former Camp Hanford forward positions, the 16 anti-aircraft artillery sites that encircled the 100 and 200 Areas, and the three Nike missile installations on Wahluke Slope. (A fourth Nike position, in relatively intact condition, is located at the base of Rattlesnake Mountain on ALE.) The Nike position on ALE has been determined eligible for inclusion in the National Register as a contributing property within the Hanford Site Manhattan Project and Cold War Era Historic District. Five of the 16 anti-aircraft artillery sites have also been determined eligible for the National Register.
The anti-aircraft artillery and Nike sites were strategic components in Camp Hanford's military defense of the Site's plutonium production facilities during the 1950s. Potential archeological resources at these sites include former gun emplacements, launch and radar sites, concrete foundations and pads, pathways/sidewalks, associated dumpsites, small arms firing ranges, and ammunition caches.
The recently recorded Atmospheric Dispersion Test Facility Grid (HT-99-007), located in the 600 Area of the Hanford Site in the vicinity of the 200 West Area, was used for monitoring airborne waste dispersions during the operation of the Hanford Project.
4.5.3.2 Buildings and Structures
Historic built resources documented from the Manhattan Project and Cold War eras include buildings and structures found in the 100,200, 300,400,600,700, and 1100 Areas. The most important of these are the plutonium production and test reactors, chemical separation and plutonium finishing buildings, and fuel fabrication/manufacturing facilities. The first reactors, 105-B, 105-D, and 105-F, were
constructed during the Manhattan Project. Plutonium for the first atomic explosion and the bomb that destroyed Nagasaki to end World War I1 were produced at the Hanford Site. Additional reactors and processing facilities were constructed after World War I1 during the Cold War period. All reactor containment buildings still stand, although many ancillary structures have been removed, and C, DR, and F Reactors have been considerably modified.
DOEIRL will consider the retention of National Register-eligible buildings and structures that may qualify for adaptive reuse as interpretive centers, museums, industrial, or manufacturing facilities (DOE 1996a).
4.5.4 Site Areas
Archaeological sites, traditional cultural places, buildings, and structures are found in each of several areas on the Hanford Site, including the 100,200,300,400,600, and 700 Areas. Since it was the Manhattan Project that established these areas as geographical locations on the Hanford Site, many cultural resources located within those areas are associated with that landscape. Many of these areas were developed over the top of existing cultural resources from the Native American and Early SettlersIFarming landscape. Hence, these earlier landscapes have sustained some damage; however, many resources remain intact. A brief synopsis of known resources found in these areas is presented in the following subsections.
4.5.4.1 100 Areas
Intensive field surveys were completed in the 100 Areas from 1991 to 1995 (Andrefsky et al. 1996, Chatters et al. 1992, Wright 1993). Much of the surface area within the 100 Area operable units has been disturbed by the industrial activities that have taken place during the past 50 years. However, these areas are still very rich in significant cultural resources.
Each of the three landscapes is represented in the 100 Areas by the presence of archaeological sites, traditional cultural properties, and reactor facilities. Most of these resources reflect past use of river resources such as open camps, fishing sites, farmsteads, pump houses, gold mining pits, and water intake and outtake structures.
Nine plutonium production reactors and their ancillary and support facilities were located in the 100 Areas. The production reactors functioned to irradiate uranium fuel elements, the essential second step in the plutonium production process. A complete inventory of 100 Area buildings and structures was completed during FY 1995, and a National Register evaluation for each was finalized during 1996. To date, 146 buildings/structures have been inventoried in the 100 Areas. Of that number, 55 have been determined eligible for the National Register as contributing properties within the Historic District recommended for individual documentation (DOE 1998b).
As remediation continues in the 100 Areas, the potential exists for unanticipated discoveries of archaeological resources. To understand impacts to cultural resources and to reduce the need to perform extensive reviews on highly disturbed areas, disturbance maps and reports have been completed for 100- BIC, 100-DIDR, and 100-F Areas.
100-B/C Area
Archaeological Resources. There is a high density of archaeological resources associated with the Native American Cultural Landscape in the 100-BIC Area. Three are located partially within the 100-BIC
Area (Rice 1968a, Rice 1980a, b), and 35 have been recorded within the immediate vicinity of the BIC Area during archaeological surveys completed in 1995.
Historic archaeological resources include the remains of Haven Station, a small stop on the former Chicago, Milwaukee, St. Paul and Pacific Railroad, located to the west of the reactor compound. One archaeological site and the remains of the small community of Haven lie on the opposite bank of the Columbia River.
Two archaeological sites located near 100-BIC have been investigated. Test excavations conducted in 1991 at one hunting site revealed large quantities of deer and mountain sheep bone, and projectile points dating from 500 to 1500 before present (B.P.). The second archaeological site is considered to be eligible for listing in the National Register, in part, because it may contain new information about the Frenchman Springs and Cayuse Phases of mid-Columbia prehistory.
Traditional Cultural Places. Many sites related to hunting and religious activities are located at the west end of Gable Butte, due south of the 100-BIC Area and prominent in the view shed. These sites are part of the proposed Gable MountainIGable Butte Cultural District nomination.
Buildings and Structures. The only structure associated with the Early SettlersIFarming Landscape is the Hanford Irrigation and Power Company pumping plant built at Coyote Rapids in 1908. It is located east of the 100-BIC Area and the 105-B Reactor.
The 105-B Reactor was the world's first full-scale plutonium production reactor and is designated as a National Historic Mechanical Engineering Landmark. It is also listed in the National Register, was recently named as a National Civil Engineering Landmark, and was given the Nuclear Historic Landmark Award. Historic American Engineering Record (HAER) documentation of B Reactor was completed in 1999 (DOEIRL 2001). A total of 14 buildings and structures within the reactor compound have been recorded on historic property inventory forms. Of that number, 10 properties have been determined eligible for the National Register as contributing properties within the Historic District recommended for individual documentation. These include 105-B Reactor, 18 1 -B River Pump house, 104-B- 1 Tritium Vault, 104-B-2 Tritium Laboratory, 105-B-Rod Tip Cave, 116-B Reactor Exhaust Stack, 117-B Exhaust Air Filter Building, 1 18-B- 1 Solid Waste Burial Trench, and 182-B Reservoir and Pump house (DOE 1998b).
An assessment of the contents of the 105-B Reactor was conducted to locate and identify Manhattan Project and Cold War era artifacts that may have interpretive or educational value in potential exhibits. Thirty-nine industrial artifacts were identified and tagged, located mainly in the fuel basin, exhaust fan room, and supply room. For the time being, these artifacts will be retained in place.
100-D/DR Area
Archaeological Resources. One hundred and seven known archaeological sites lie within 2 km (1.2 mi) of the 100-DIDR Reactor compound: three on the northern bank and the remainder on the southern bank of the Columbia River. The Wahluke Archaeological District is located north of the reactor compound area. Most remaining sites represent early Euro-American settlement activities. The former community of Wahluke, which was at the landing of a ferry of the same name, is situated on the river's north bank. Remains of historic farmsteads are scattered throughout the nearby area. An unanticipated discovery was made during 2001 of a significant archaeological site associated with the Native American Cultural Landscape during monitoring of 100-D environmental restoration activities.
Traditional Cultural Places. Twenty-seven sites located south of the reactor compound may be eligible for the National Register because of their association with a traditional cultural property.
Buildings and Structures. All the buildings and structures in the 100-DIDR Area were built during the Manhattan Project and Cold War eras. Twenty buildingslstructures have been inventoried, including the 105-D and 105-DR Reactor buildings. Both reactors were determined eligible for the National Register as contributing properties within the Historic District, but were not recommended for individual documentation. An assessment of the contents of 105-D and 105-DR was conducted to locate and identify Manhattan Project and Cold War era artifacts that may have interpretive or educational value in potential exhibits. Twenty-four industrial artifacts were identified and tagged in 105-D, including control panels, a reactor curtain, lunch tables, benches, tools, and signs. Ten industrial artifacts were identified and tagged on 105-DR, including a radiological worker procedures poster, an instrument ladder, three metal signs, a lead sampling chamber "pig," a control panel, vintage ceiling lights, and graphite blocks. The 18511 89-D buildings and adjoining facilities, all part of the 190-D complex, have been determined eligible for the National Register and were documented to HAER standards (DOE 1998b). However, the 190-D Complex has been demolished.
100-F Area
Archaeological Resources. The 100-F Area is situated on a segment of the Colurr~bia River that contains many cultural sites associated with the Native American cultural landscape. According to Relander (1956), a nearly continuous string of camps and villages of the Wanapum extended from the Hanford Townsite upstream to the White Bluffs Townsite. Eighty-one archaeological sites have been recorded near the 100-F Area. Sites of particular importance include a site recently determined eligible to the National Register, a cemetery, a second National Register site, and a site that appears to contain artifact deposits dating to at least 6000 years ago.
The principal site associated with the Early Settlers/Farming Landscape near 100-F is the White Bluffs Townsite and ferry landing. This location was the upriver terminus of shipping during the mid-1 9th century. It was at this point that supplies for trappers, traders, and miners were off-loaded, and commodities from the interior were transferred from pack trains and wagons to riverboats. The first store and feny of the mid-Columbia region were located at the ferry landing (ERTEC 1981). A log cabin, thought to have been a blacksmith shop built in the late 19" century, still stands there. Test excavations conducted at the cabin by the University of Idaho revealed historic and pre-contact cultural materials. The structure has been recorded according to standards of the Historic American Buildings Survey (HABS) (Rice 1976). A formal Determination of National Register eligibility for the East White Bluffs cabin was recently completed by DOEIRL and USFWS and submitted to the State Historic Preservation Officer (SHPO) for concurrence. While the two agencies are exploring options for restoration of the structure, stabilization of the structure was carried out by the USFWS during 2001. The only remaining structure associated with the White Bluffs Townsite (near the railroad) is the First Bank of White Bluffs.
Traditional Cultural Places. Cemeteries associated with the Native American Landscape are known to be in the vicinity of the 100-F Area.
Buildings and Structures. Three Manhattan ProjectICold War era buildingslstructures have been inventoried in this area, including the 105-F Reactor building. An assessment of the contents of 105-F was conducted to identify any artifacts that may have value as potential museum exhibits. Eleven industrial artifacts were identified and tagged, including a fuel scale, elevator control panel, two shop signs, four safety signs, a hardhat, graphite blocks, and vintage ceiling lights.
100-H Area
Archaeological Resources. As of 2003, there have been 40 archaeological sites recorded within 2 km (1.2 mi) of the 100-H Area. Included in this group are two historic Wanapum cemeteries, six camps (one with an associated cemetery), and three house pit villages. The largest village contains approximately 100 house pits and numerous storage caches. It appears to have been occupied from 2500 years B.P. to historic times (Rice 1968a). The cemeteries, camps, and villages are included in the Locke Island Archaeological District.
Archaeological sites associated with the Early SettlersIFarming Landscape in 100-H include several 20' century farmsteads and numerous household dumps. None of these sites has yet been evaluated for eligibility to the National Register. Remains of military encampments associated with the Manhattan Project and Cold War Landscape are also located near the 100-H Area.
Traditional Cultural Places. As noted above, Wanapum cemeteries are known to be in the vicinity of the 100-H Area.
Buildings and Structures. Four Cold War era buildings/structures were inventoried in the 100-H Area. Of that number, only the 105-H Reactor was determined eligible for the National Register as a contributing property within the Historic District. The reactor, however, was not recommended for individual documentation (DOE 1998b). An assessment of the contents of 105-H was conducted to locate and identify Cold War era artifacts that may have interpretive or educational value in potential exhibits. No items were tagged.
100-K Area
Archaeological Resources. An archaeological survey of the 100-K Area in 199 1 revealed five previously unrecorded archaeological sites. Archaeological surveys conducted during 1995 of areas not surveyed in 1991 resulted in documentation of 31 additional pre-contact and historic sites. Two of these sites are believed to date to the Cascade Phase (9000 to 4000 B.P.). Two National Register Districts are located near the 100-K Area: the Coyote Rapids Archaeological District and the Ryegrass Archaeological District. Two individual archaeological sites near the 100-K Area have been determined to be eligible for listing in the National Register.
The Hanford Imgation Ditch and the former Chicago, Milwaukee, St. Paul and Pacific Railroad, two important linear features associated with the Early SettlersFarming Landscape, are also present in the 100-K Area. Remnants of the Allard community at Coyote Rapids and a number of historic farmstead sites are located west of the K Reactor compound.
Traditional Cultural Places. Particular events took place at this locale during the mid-19'~ century that are of great significance to Native American people of the interior Northwest (Relander 1956). Specifically, the Washani religion (also known as Seven Drums or Dreamer religion) was first practiced here, eventually spreading to many neighboring tribes. A group of pit houses with an associated long house and sweat lodge have been identified that may have been the site of the Wanapum religious leader Smohalla's first Washat dance. Coyote Rapids, which is a short distance upstream, was called Moon, or Water Swirl Place, and is recognized as a traditional cultural place because of its association with Wanapum history and traditional cultural beliefs.
Buildings and Structures. Thirty-eight buildings and structures have been inventoried in the 100-K Reactor Area, including the 105-KE and KW Reactor buildings. Of that number, 13 have been determined eligible for the National Register as contributing properties within the Historic District
recommended for individual documentation. These include the 105-KW Reactor, 190-KW Main Pump house, 107-KW Retention Basin, 183-KW Filter Plant, and I 8 1 -KW River Pump house (DOE 1998b).
An assessment of the contents of 105-KE and KW was conducted to identify any artifacts that may have educational or interpretive value as potential museum exhibits. Fourteen industrial artifacts were identified and tagged in 105-KE Reactor, including tools, signage, radiation monitoring equipment, and furniture. Seven artifacts were identified and tagged from 105-KW Reactor, including furniture, a measurement scale, tools, and a floodlight. An assessment of the 109-KW Pump house was also conducted, and two artifacts were tagged: a phone booth with phone set and a wooden safety bulletin board.
100-N Area
Archaeological Resources. Thirty-one archaeological sites associated with the Native American Cultural Landscape have been recorded within 2 km (1.2 mi) of the 100-N Area perimeter. Four of these sites are either listed, or considered eligible for listing, in the National Register. Three sites (two house pit villages and one cemetery) comprise the Ryegrass Archaeological District. Site 45BN179, once considered for a National Register nomination as the Hanford Generating Plant Site, has been found to be part of 45BN149, which is already listed in the National Register. Extant knowledge about the archaeology of the 100-N Area is based largely on reconnaissance-level archaeological surveys conducted during the late 1960s to late 1970s (Rice 1968b, see also Rice 1980a, b), which do not purport to produce complete inventories of the areas covered.
The most common evidence of activities associated with the Early Settlersmarrning Landscape found near the 100-N Area consists of the archaeological remains of farmhouses and agricultural fields. The historic Hanford Ditch is adjacent to and south of the 100-N compound.
Traditional Cultural Places. Three areas near the 100-N Area are known to have been of importance to the Wanapum. Cataclysmic flooding at the end of the Pleistocene formed the knobs and kettles area, known as Mooli Mooli, which means Little Stacked Hills. Gable Mountain (called Nookshai or Otter) and Gable Butte, which lie to the south of the river, are sacred mountains where youths would go on overnight vigils seeking guardian spirits (Relander 1956). Sites of religious importance may also exist near the 100-N compound.
Buildings and Structures. The 100-N Reactor, completed in 1963, was the last of the plutonium production, graphite-moderated reactors. The design of N Reactor differed from the previous eight reactors in several ways to afford greater safety and to enable co-generation of electricity. Sixty-six Cold War era buildings and structures have been inventoried in the 100-N Area. Thirty 100-N Area buildingslstructures have been determined eligible for the National Register as contributing properties within the Historic District recommended for individual documentation (DOE 1998b). These include the 105-N Reactor, 109-N Heat Exchanger Building, 18 1 -N River Water Pump house, 183-N Water Filter Plant, 184-N Plant Service Powerhouse, 185-N Export Powerhouse, and the 1 1 12-N Guard Station (DOE 1997d).
An assessment of the contents of 185-N was conducted to locate and identify Cold War era artifacts that may have interpretive or educational value in potential exhibits. Six artifacts were identified and tagged, including control room panels, phone booths, a "hear-here" phone, metal cart, and a safety sign.
4.5.4.2 200 Areas
Much of the 200 Areas have been disturbed by Hanford operations. The HCRL conducted a comprehensive archaeological resources survey for the fenced portions of the 200 Areas in 1987 and 1988 (Chatters and Cadoret 1990). The results indicate that evidence of cultural resources associated with the Native American Cultural Landscape and the Early Settlers/Farming Landscape is minimal.
Archaeological Resources. The most significant archaeological resource located in the 200 Areas is an extensive linear feature known as the White Bluffs Road, a portion of which passes diagonally southwest to northeast through the 200 West Area. This road, in its entirety, was determined eligible for listing in the National Register. Segments of the White Bluffs Road that are located in the 200 West Area have been determined to be non-contributing elements. Such non-contributing segments of the White Bluffs Road are those that do not add to the historic significance of the road, but retain evidence of its contiguous bearing. Originally used as a Native American trail, it played a role in Euro-American immigration, development, agriculture, and Hanford Site operations. The 2000 White Bluffs Road survey recorded an additional 54 historic isolated finds and 2 pre-conta.ct isolated finds, as well as six can dump features.
Traditional Cultural Places. Many sites related to hunting and religious activities are located on Gable Butte and Gable Mountain north of the 200 West and East Areas. These sites are part of the proposed Gable Mountain/Gable Butte Cultural District nomination.
Buildings and Structures. The 200 Areas contain many significant buildings and structures associated with the Manhattan Project and Cold War Landscape. They were formerly used as chemical separations (processing) plants and ancillary and support facilities. The plants functioned to dissolve the irradiated fuel elements to separate out the plutonium, the essential third step in plutonium production. Historic property inventory forms have been completed for 72 buildings/structures in the 200 Areas. Of that number, 58 have been determined eligible for the National Register as contributing properties within the Historic District recommended for individual documentation. These include the 202-A Purex Plant, 2 12-N Lag Storage Facility, 221 -T Plant, 222-S Redox Plant, 225-B Encapsulation Building, 23 1-2 Plutonium Metallurgical Laboratory, 234-52 Plutonium Finishing Plant, 236-2 Plutonium Reclamation Facility, 242-2 Water Treatment Facility, 282-E Pump house and Reservoir Building, 283-E Water Filtration Plant, and the 284-W Powerhouse and Steam Plant. The 232-2 Waste Incinerator Facility and the 233-S Plutonium Concentration Building, individually determined eligible for the National Register, and the 221 -T Plant have been documented to HAER standards (DOE 1998b).
An assessment of the contents of nine facilities in the Plutonium Finishing Plant (PFP) complex was conducted during 1998 and 2002 in response to the production of the Interpretive and Curation Plan for the Deactivation and Decommissioning of Historic Buildings at the Plutonium Finishing Plant Complex. These buildings and structures included the 234-52 Plutonium Finishing Plant, 291 -2 Exhaust Stack, 232- Z Waste Recovery Facility, 236-2 Plutonium Reclamation Facility, 2704-2 Safeguards and Security Building, the 2736-2, ZA and ZB Plutonium Storage Facilities, and 2736-ZC Cargo Restraint Transport Facility. Because of security/radiological exposure concerns and/or inaccessibility, a number of identified artifacts were not tagged. These included plutonium storage vaults and a dry air glove box. In 234-52, the entire Remote Mechanical C line (glove boxes) and control room, and the Remote Mechanical A line (glove boxes) and control room were identified and tagged. Ten additional Cold War era artifacts were identified and tagged as a result of a walkthrough of the Analytical Laboratories in 234-52. The assessment of the 2704-2 Building resulted in two tagged artifacts: a typology of "cans" poster and demonstration training cans. A third artifact, the classified documents vault, was identified but not tagged.

Thirty-two industrial artifacts were identified and tagged in chemical separations buildings located in 200 East and West. The following buildings were inspected for artifacts during the walkthroughs: 202- A, 202-S, 221 -T, 221-U, 224-U, 224-B, and 27 1 -U. Types of artifacts selected included electrical equipment, control panels, tools, vintage lights, health and safety items, signage, and communications equipment.
4.5.4.3 300 Area
Much of the 300 Area has been highly disturbed by industrial activities associated with the Manhattan Project and Cold War Cultural Landscape. Prior to the Manhattan Project in 1943, the 300 Area was used by Native Americans as a camp location and by Early Settlers who developed a fanning community known as Fruitvale. Due to its proximity to the Columbia River, many archaeological resources associated with both these landscapes are located along the river shore outside of the 300 Area fence. Subsurface archaeological deposits are likely to be located underneath existing 300 Area facilities in pockets of undisturbed ground. Disturbance maps and reports have been prepared for the 300 Area.
Archaeological Resources. Five recorded archaeological sites, including campsites, house pits, and a historic trash scatter, are located at least partially within the 300 Area. Many more may be located in subsurface deposits. Twenty-seven archaeological sites and 13 isolated artifacts have been recorded within 2 km (1.2 mi) of the 300 Area fence. One archaeological site has been tested and is recognized as eligible for listing in the National Register. Several archaeological sites in this area are in the Hanford South Archaeological District, which is listed in the Washington Heritage Register. Other areas near the 300 Area have been found to be of great importance to the Native Americans and are fenced. Archaeological sites associated with the Early Settlers are comprised mainly of debris scatters and roadbeds associated with farmsteads.
Traditional Cultural Places. One documented locality with great importance to the historic Wanapum is located near the 300 Area.
Buildings and Structures. The 300 Area, the location of the uranium fuel fabrication plants that manufactured fuel rods to be irradiated in the Hanford Site reactors, provided the first essential step in the plutonium production process. The 300 Area was also the location of most of the research and development laboratories. One hundred fifty-nine buildings/structures in the 300 Area have been documented on historic property inventory forms. Of that number, 47 buildings/structures have been determined eligible for the National Register as contributing properties within the Historic District recommended for individual documentation. This total includes the 305 Test Pile, 31 3 Fuels Fabrication Facility, 3 14 Metal Press/Extrusion Building, 3 18 High Temperature Lattice Test Reactor, 321 Separation Building, 325 Radiochemistry Laboratory, 333 Fuel Cladding Facility, 3706 Radiochemistry Laboratory, and the 3760 (former) Hanford Technical Library (DOE 1998b).
Assessments of the contents of former fuel manufacturing and reactor operations facilities in the 300 Area have been conducted including the 303-A Magazine Product Storage Building, 305 Test Pile, 305-B Engineers Development Lab Annex, 306-W Materials Development Laboratory, 306-E Fabrication Test Lab, 308 Plutonium Fabrication Pilot Plant, 309 Plutonium Recycle Test Reactor, 3 13 Fuels Fabrication FacilityIMetal Fabrication Building, 3 14 Press Building, and the 333 Fuel Cladding Facility. The 27 Manhattan Project/Cold War era artifacts that were identified and tagged are mainly industrial in nature associated with the fuel manufacturing processes and reactor operations. A second walkthrough of Building 333 resulted in an additional 12 artifacts being identified including a selection of safety signs/posters, a control panel, a safety shower, protective worker clothes, and a sample uranium fuel element.
Other 300 Area buildings assessed include the 303-K Fresh Metal Storage Building, 304 Uranium Scrap Concentration Storage Facility, 324 Chemical Engineering Laboratory, 325 Radiochemistry Laboratory, 327 Post Irradiation Test Laboratory, 329 Biophysics Laboratory, 334 Chemical Handling Facility, 334-A Acid Pump house, 3701-D (former) Hanford Patrol Building, 3707-G Change House, 37 16 Fuels Manufacturing Storage/Automotive Repair Shop, 3727 Classified Storage Facility, 3746 Radiological Physics Building, 3762 Technical Safety Building, the 340 Waste Neutralization Complex, 3745-B Positive Ion Accelerator Building, 3708 Radiochemical Lab, 3706 Radiochemistry Lab, 326 Physics Lab, 3707-D Patrol Headquarters, 384 Power House, 328 Engineering Services Building, 3720 Environmental Sciences Laboratory, 3745-A Electron Accelerator Building, 3722 Area Shop, and the 37 13 Storeroom. Seventy-seven Manhattan ProjectICold War era artifacts were identified and tagged in these buildings.
4.5.4.4 400 Area
Most of the 400 Area has been so disrupted by construction activities that archaeologists surveying the site in 1978 were able to find only 0.12 km2 (0.047 mi2) that was undisturbed (Rice et al. 1978). They found no cultural resources in the undisturbed area. No archaeological sites are known to be located within 2 krn (1.2 mi) of the 400 Area.
The 400 Area consists of the Fast Flux Test Facility (FFI'F) complex. The 405 Reactor Containment Building includes a 400-megawatt, sodium-cooled test reactor designed primarily to test fuels and materials for advanced nuclear power plants. All the buildings and structures in the 400 Area were constructed during the Cold War era. Twenty-one building/structures have been recorded on historic property inventory forms. Of that number, six have been determined eligible for the National Register as contributing properties within the Historic District recommended for individual documentation. These include the 4.05 Reactor Containment Building, 436 Training Facility, 4621 -W Auxiliary Equipment Facility, 4703 FFTF Control Building, 4710 Operation Support Building, and the 4790 Patrol Headquarters (DOE 1998b). In response to the production of a Curation Plan for the Deactivation and Decommissioning of Historic Buildings at the Fast Flux Test Facility, walkthroughs were conducted of the contributing properties requiring mitigation except for the 4790 patrol headquarters. In addition, walkthroughs were also conducted of 16 contributing properties at FFI'F where no individual documentation was required. Operations carried out in these facilities were closely related to the work conducted in the five contributing buildings that required mitigation. Thirty artifacts were identified and tagged in 8 of the 21 historic buildings: 405,4703,436,403,4621 -W, 4621 -E, 47 10, and 4701 -A. (Two of the identified artifacts are located in 4732-C, a non-historic building.) The types of artifacts included industrial equipment and machinery, photographs, publications, control room panels, and models.
An assessment of the contents of Building 427 was also conducted to locate and identify Cold War era artifacts that may have interpretive or educational value in potential exhibits. Four artifacts were identified and tagged, including fuel assembly components.
4.5.4.5 600 Area
The 600 Area includes all of the Hanford Site not occupied by the 100,200, 300, and 400 Areas. Project-driven surveys have been conducted throughout the area, but much of the 600 Area remains unsurveyed. All of the 21 archaeological sites and 13 isolates recorded during 2002 were located in the 600 Area and are associated with the Native American and Early SettlersFarming Landscapes. Based on what is known, the 600 Area contains a diverse wealth of cultural resources associated with all three cultural landscapes. Representing a full range of human activity across the Hanford Site, the activities are best characterized for the Native American Cultural Landscape by their seasonal gathering of inland
resources (quarry sites, hunting sites, religious use sites, plant gathering sites) and riverine resources (fishing sites, open camp sites, root gathering). The Early SettlersEarming Landscape is present in the 600 Area, mainly consisting of the archaeological remains of former farmsteads, ranches, and pre-1943 transportation routes. Evidence of cultural resources associated with the Manhattan Project and Cold War Era Landscape consists of anti-aircraft artillery sites, meteorological towers, and present day roads located in the 600 Area.
Archaeological Resources. Numerous National Register Districts associated with the Native American Landscape are located within the 600 Area including the Hanford Archaeological Site, Hanford North Archaeological District, the Paris Archaeological Site, Rattlesnake Springs Sites, Savage Island Archaeological District, Snively Basin Archaeological District, and Wooded Island Archaeological District.
Archaeological properties associated with the Early SettlersEarming Landscape in the 600 Area include the Hanford Townsite; the White Bluffs Townsite and ferry landing; the Chicago, Milwaukee, St. Paul and Pacific Railroad line and associated whistle stops; and the Hanford Irrigation Ditch. The McGee RanchICold Creek Valley District has been determined to be eligible for listing in the National Register.
Cold War era archaeological resources that are located in the 600 Area include five anti-aircraft artillery sites associated with Camp Hanford's defense of the Hanford Site during the 1950s that have been determined eligible for the National Register. The Hanford Atmospheric Dispersion Test Facility was evaluated and determined to be a contributing property within the Historic District and was recommended for individual documentation. Mitigation required the completion of an Expanded Historic Property Inventory Form for the Test Facility. Numerous artifacts were identified as having interpretive or educational value in potential exhibits. A selected representative number of artifacts were removed and curated into the Hanford Collection.
Traditional Cultural Places. Areas of traditional cultural importance include Rattlesnake Mountain and foothills, the Columbia River, and Gable Mountain and Butte. In 2001 and 2002, additional resources related to religious and hunting activities were added to the Gable Mountain Cultural District. Cemeteries associated with the Native American Cultural Landscape are also dispersed throughout the 600 Area.
Buildings and Structures. There are several structures associated with the Early SettlersIFarming Landscape that are located in the 600 Area. The Bruggemann Agricultural Complex, located approximately 3 mi (1.6 km) east of 100-BIC, has been determined eligible for listing in the National Register. During 2002, the Hanford Electrical Substation-Switching Station, the Hanford Townsite High School, the Coyote Rapids Hydroelectric Pumping Plant, and the First Bank of White Bluffs have also been determined eligible for listing in the National Register.
Fifteen Cold War era buildings/structures, including the former underground missile storage facility, have been inventoried at the former 6652 Nike launch and control center in the Fitzner Eberhardt ALE Reserve. The 622 Meteorological Complex, located near 200 West, includes seven inventoried properties. Both complexes have been determined eligible for the National Register as contributing properties within the Historic District recommended for mitigation. An assessment of the contents of 622-F and the 6652 Nike site were conducted. No artifacts of interpretive or educational value were identified.
Five other 600 Area properties, the 604 Yakima Patrol Checking Station, 604-A Sentry House, 607 Batch Plant, 61 8-1 0 Solid Waste Burial Trench, and Hanford Site Railroad System have been determined eligible for the National Register as contributing properties within the Historic District recommended for individual documentation. Twenty-five railcars located at the 212-N rail spur were designated Register-
eligible as contributing features of the Hanford Site Railroad and recommended for mitigation. Documentation/mitigation of the 25 railcars was completed as an addendum to the Expanded Historic Property Inventory Form of the Hanford Site Railroad System. Due to their high contamination levels, most of the railcars have been shipped offsite for disposition.
The former Central Shops complex located in the 600 Area north of the 200 Areas was determined to be ineligible for the National Register (DOE 1997~).
Buildings 623 (Gable Mountain Relay Station) and 213 (Magazinemaste Storage Vault) were originally designated as contributing properties within the Historic District with no individual documentation required. They were reevaluated and designated as contributing properties recommended for individual documentation.
4.5.4.6 700 Area
The 700 Area was the location of the administrative functions of the early Hanford Site period. Most of the 700 Area has been highly disturbed by industrial activities. Of the seven Manhattan Project and Cold War era buildings/structures identified in this area, the 703 Administrative Building, 7 12 Records/Printing/Mail Office Facility, and the 748 Radiosurgery/Emergency Decontamination Facility have been determined eligible for listing in the National Register as contributing properties within the Historic District and recommended for individual documentation (DOE 1998b).
4.6 Socioeconomics R. A. Fowler and M. J. Scott
Activity on the Hanford Site plays a dominant role in the socioeconomics of the Tri-Cities and other parts of Benton and Franklin counties. The agricultural community also has a significant effect on the local economy. Any major changes in Hanford activity would potentially affect the Tri-Cities and other areas of Benton and Franklin counties. Unless otherwise specifically cited, data in this section are collected from interviews with the referenced organization.
4.6.1 Local Economy
Three major sectors have been the principal driving forces of the economy in the Tri-Cities since the early 1970s: 1) DOE and its contractors operating the Hanford Site; 2) Energy Northwest (formerly the Washington Public Power Supply System) in its construction and operation of nuclear power plants; and 3) the agricultural community, including a substantial food-processing component. With the exception of a minor amount of agricultural commodities sold to local-area consumers, the goods and services produced by these sectors are exported outside the Tri-Cities. In addition to the direct employment and payrolls, these major sectors also support a sizable number of jobs in the local economy through their procurement of equipment, supplies, and business services.
In addition to these three major employment sectors, three other components can be readily identified as contributors to the economic base of the Tri-Cities. The first of these, loosely termed "other major employers," includes the five major non-Hanford employers in the region. The second component is tourism. The Tri-Cities area has increased its convention business substantially in recent years as well as recreational travel. The final component in the economic base relates to the local purchasing power generated not from current employees, but from retired former employees. Government transfer payments, specifically retirement and disability insurance benefit payments, constitute a significant proportion of total spendable income in the local economy.
4.6.1.1 DOE Contractors (Hanford)
The Hanford Site is the largest single source of employment in the Tri-Cities. During fiscal year (FY) 2002, an average of 10,892 employees were employed by DOE Office of River Protection (OW) and its prime contractor CH2M Hill Hanford Group, Inc.; DOE-Richland Operations Office (RL) and its prime contractor Fluor Hanford, Inc.; Battelle Memorial Institute; Bechtel Hanford, Inc.; and the Hanford Environmental Health Foundation. Fiscal year 2002 year-end employment at Hanford was 10,938, up from 10,670 in FY 2001. In addition to these totals, Bechtel National, Inc. (BNI) and its prime subcontractor Washington Group International employed 3013 at the end of FY 2002, up from 1350 at the end of FY 2001. In December 2000, ORP awarded a contract to BNI to design, build and start up waste treatment facilities for the glassification of liquid radioactive waste. According to the Washington State Labor Market and Economic Analysis (LMEA) establishment the annual average number of employees at Hanford is down considerably from a peak of 19,200 in FY 1994, but still represents 15% of the 94,000 total jobs in the economy (LMEA 2002a).
Based on employee residence records as of April 2003,90% of the direct employees of Hanford live in Benton and Franklin counties. Approximately 74% of Hanford employees reside in Richland, Pasco, or Kennewick. More than 37% are Richland residents, 10% are Pasco residents, and 27% live in Kennewick. Residents of other areas of Benton and Franklin counties, including West Richland, Benton City, and Prosser, account for about 17% of total Hanford Site employment.
4.6.1.2 Energy Northwest
Although activity related to commercial nuclear power plant construction ceased with the completion of the WNP-2 reactor in 1983 (now named Columbia Generating Station), Energy Northwest continues to be a major employer in the Tri-Cities area. Headquarters personnel based in Richland oversee the operation of the Columbia Generating Station and perform a variety of functions related to the Hanford Generating Project. Decommissioning of mothballed nuclear power plants (WNP- 1 and WNP-3), which were never completed, began in 1995. In FY 1999, Energy Northwest employed approximately 29 people at the two plants. As part of an effort to reduce electricity production costs, Energy Northwest headquarters decreased the size of its workforce from over 1900 in 1994 to 1016 at the end of 1999. As of April 2003, employment was 1266 personnel.
4.6.1.3 Agriculture
During 2001, agricultural production and services in the bi-county area generated about 10,3 17 wage and salary jobs, or about 12% of the area's total employment, as represented by the employees covered by unemployment insurance (LMEA 2002b). Seasonal farm workers are not included in that total but are estimated by the U.S. Department of Labor (DOL) for the agricultural areas in the state of Washington. In 2002, there was an average of 4721 seasonal farm workers per month in Benton, Franklin, and Walla Walla counties, ranging from 11 12 workers during the winter pruning season to 9669 workers at the peak of harvest. An estimated average of 3924 seasonal workers were classified as local (ranging from 1 103 to 8340); an average of 88 were classified as intrastate (ranging from 0 to 330), and an average of 710 were classified as interstate (ranging from 0 to 2063). The weighted seasonal wage for 2002 ranged from $6.92/hr to $7.96/hr, with an average wage of $7.16/hr (DOL 2002).
According to the U.S. Department of Commerce's Regional Economic Information System (REIS), 2581 people were classified as farm proprietors in Benton and Franklin counties during 2001. Total farm proprietors' income, according to this same source, was estimated to be $4.3 million (DOC 2002).
The area's farms and ranches generate a sizable number of jobs in supporting activities, such as agricultural services (e.g., application of pesticides and fertilizers and irrigation system development) and wholesale trade (e.g., farm supply and equipment sales, and fruit packing). Although formally classified as a manufacturing activity, food processing is a natural extension of the farm sector. More than 20 food processors in Benton and Franklin counties produce such items as potato products, canned fruits and vegetables, wine, and animal feed.
4.6.1.4 Other Major Employers
During 2001, the five largest non-Hanford and non-government employers employed approximately 5035 people in Benton and Franklin counties. These companies include 1) Lamb Weston, which employed 1800; 2) Iowa Beef Processing Inc., which employed 1450; 3) Framatome ANP, Richland Inc. (formerly Siemens Power Corporation), which employed 750; 4) Boise Cascade Corporation Paper and Corrugated Container Divisions, which employed 685, and 5) Burlington Northern and Santa Fe Railway, which employed 350. Both Boise Cascade and Iowa Beef are located in western Walla Walla County, but most of their workforce resides in Benton and Franklin counties. Four of the largest agriculture growers and processors in the area: Broetje Orchards, J.R. Simplot Company, Twin City Foods, Inc., and AgriNorthwest, employed approximately 2000 people during 2001 ; however, a large portion of the workers were seasonal (TRIDEC 2002).
Other area employers include the school districts of Richland, Kennewick, and Pasco, which employed a total of 3981 during 2001; the three major health care facilities: Kadlec Medical Center, Kennewick General Hospital, and Lourdes Health Network, which employed a total of 1931; and Benton and Franklin county offices and Richland, Kennewick and Pasco city offices, which employed 1762.
4.6.1.5 Tourism
A significant rise in the number of visitors to the Tri-Cities over the last several years has resulted in tourism playing an increasing role in helping to diversify and stabilize the area economy. The Tri-Cities Visitors and Convention Bureau reported that 1 12,810 people attended conventions and sporting events, spending an estimated $37.3 million in the mid-Columbia during 2002, up from 97,770 and $32.3 million during 2001. The number of people attending convention and group events has more than doubled since 1995 and more than tripled since 199 1.
The importance of tourism is evidenced by the amount of money spent on local goods and services. Overall tourism expenditures in the Tri-Cities were roughly $238 million during 2001, up from $220 million in 2000. Travel-generated employment in Benton and Franklin counties was about 4250 with an estimated $60.6 million in payroll, up from an estimated 41 20 employed and a $56.4 million payroll during 2000. In addition, tourism generated $3.8 million in local taxes and $16.4 million in state taxes during 2001 (OTED 2002).
4.6.1.6 Retirees
Although Benton and Franklin counties have a relatively young population (approximately 53% under the age of 35), 19,523 people over the age of 65 resided in Benton and Franklin counties during 2002. Washington State Office of Financial Management (OFM) reports the portion of the total population 65 years and older in Benton and Franklin counties accounts for 10% of the total population, which is below the 11.2% for the state of Washington (OFM 2003). This segment of the population supports the local economy through income received from government transfer payments and pensions, private pension benefits, and prior individual savings.
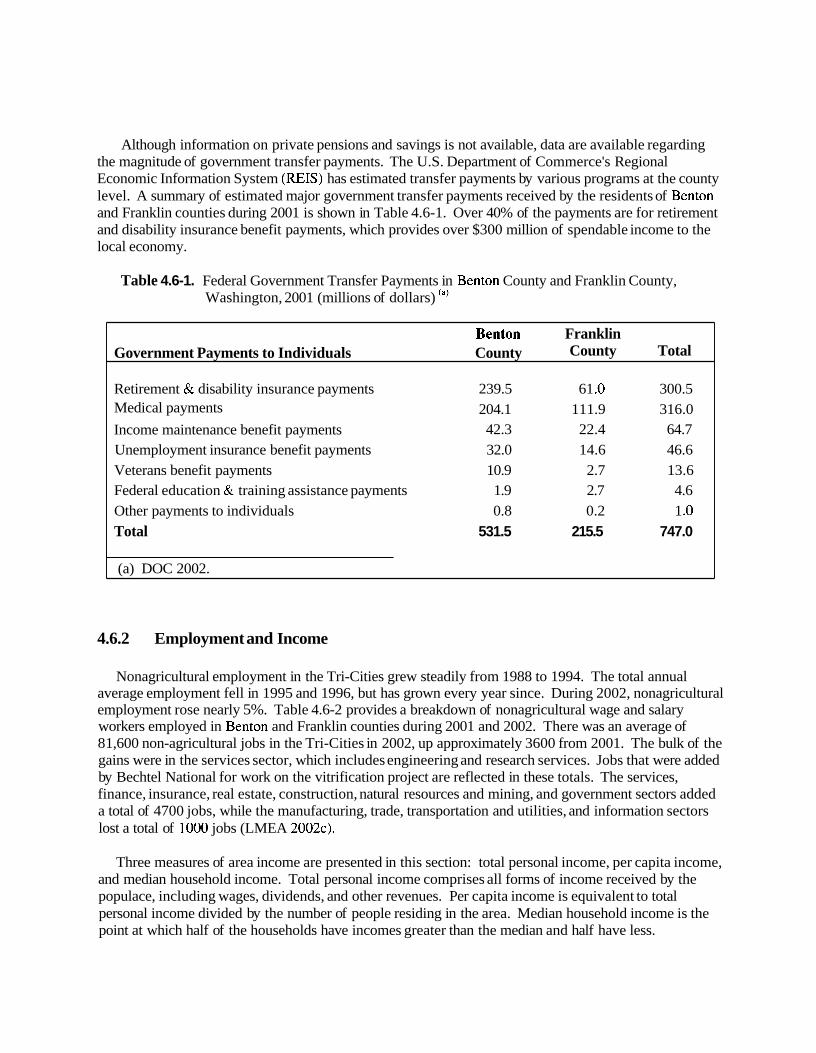
Although information on private pensions and savings is not available, data are available regarding the magnitude of government transfer payments. The U.S. Department of Commerce's Regional Economic Information System (REIS) has estimated transfer payments by various programs at the county level. A summary of estimated major government transfer payments received by the residents of Benton and Franklin counties during 2001 is shown in Table 4.6-1. Over 40% of the payments are for retirement and disability insurance benefit payments, which provides over $300 million of spendable income to the local economy.
Table 4.6-1. Federal Government Transfer Payments in Benton County and Franklin County, Washington, 2001 (millions of dollars) 'a)
Benton Franklin Government Payments to Individuals County County Total
Retirement & disability insurance payments 239.5 61 .O 300.5 Medical payments 204.1 111.9 3 16.0 Income maintenance benefit payments 42.3 22.4 64.7 Unemployment insurance benefit payments 32.0 14.6 46.6 Veterans benefit payments 10.9 2.7 13.6
- Federal education & training assistance payments 1.9 2.7 4.6 Other payments to individuals 0.8 0.2 1 .O
Total 531.5 215.5 747.0
(a) DOC 2002.
4.6.2 Employment and Income
Nonagricultural employment in the Tri-Cities grew steadily from 1988 to 1994. The total annual average employment fell in 1995 and 1996, but has grown every year since. During 2002, nonagricultural employment rose nearly 5%. Table 4.6-2 provides a breakdown of nonagricultural wage and salary workers employed in Benton and Franklin counties during 2001 and 2002. There was an average of 8 1,600 non-agricultural jobs in the Tri-Cities in 2002, up approximately 3600 from 2001. The bulk of the gains were in the services sector, which includes engineering and research services. Jobs that were added by Bechtel National for work on the vitrification project are reflected in these totals. The services, finance, insurance, real estate, construction, natural resources and mining, and government sectors added a total of 4700 jobs, while the manufacturing, trade, transportation and utilities, and information sectors lost a total of 1000 jobs (LMEA 2002~).
Three measures of area income are presented in this section: total personal income, per capita income, and median household income. Total personal income comprises all forms of income received by the populace, including wages, dividends, and other revenues. Per capita income is equivalent to total personal income divided by the number of people residing in the area. Median household income is the point at which half of the households have incomes greater than the median and half have less.
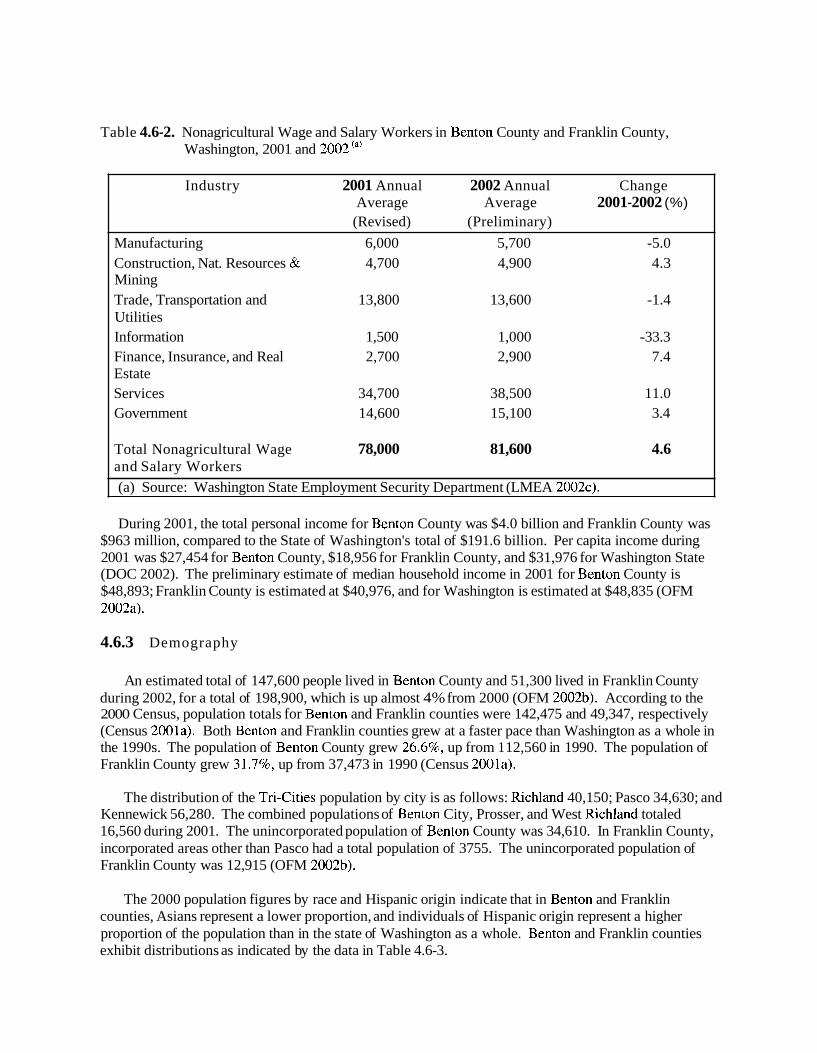
Table 4.6-2. Nonagricultural Wage and Salary Workers in Benton County and Franklin County, Washington, 2001 and 2002(a)
Industry 2001 Annual 2002 Annual Change Average Average 2001-2002 (%) (Revised) (Preliminary)
Manufacturing 6,000 5,700 -5.0 Construction, Nat. Resources & 4,700 4,900 4.3 Mining Trade, Transportation and 13,800 13,600 -1.4 Utilities Information 1,500 1,000 -33.3 Finance, Insurance, and Real 2,700 2,900 7.4 Estate Services 34,700 38,500 11.0 Government 14,600 15,100 3.4
Total Nonagricultural Wage 78,000 81,600 4.6 and Salary Workers
(a) Source: Washington State Employment Security Department (LMEA 2002~).
During 2001, the total personal income for Benton County was $4.0 billion and Franklin County was $963 million, compared to the State of Washington's total of $191.6 billion. Per capita income during 2001 was $27,454 for Benton County, $18,956 for Franklin County, and $31,976 for Washington State (DOC 2002). The preliminary estimate of median household income in 2001 for Benton County is $48,893; Franklin County is estimated at $40,976, and for Washington is estimated at $48,835 (OFM 2002a).
4.6.3 Demography
An estimated total of 147,600 people lived in Benton County and 51,300 lived in Franklin County during 2002, for a total of 198,900, which is up almost 4% from 2000 (OFM 2002b). According to the 2000 Census, population totals for Benton and Franklin counties were 142,475 and 49,347, respectively (Census 2001a). Both Benton and Franklin counties grew at a faster pace than Washington as a whole in the 1990s. The population of Benton County grew 26.6%, up from 1 12,560 in 1990. The population of Franklin County grew 31.7%, up from 37,473 in 1990 (Census 2001a).
The distribution of the Tri-Cities population by city is as follows: Richland 40,150; Pasco 34,630; and Kennewick 56,280. The combined populations of Benton City, Prosser, and West Richland totaled 16,560 during 2001. The unincorporated population of Benton County was 34,610. In Franklin County, incorporated areas other than Pasco had a total population of 3755. The unincorporated population of Franklin County was 12,915 (OFM 2002b).
The 2000 population figures by race and Hispanic origin indicate that in Benton and Franklin counties, Asians represent a lower proportion, and individuals of Hispanic origin represent a higher proportion of the population than in the state of Washington as a whole. Benton and Franklin counties exhibit distributions as indicated by the data in Table 4.6-3.
During 2002, Benton and Franklin counties accounted for 3.3% of Washington's population. The population demographics of Benton and Franklin counties are quite similar to those found within Washington. In general, the population of Benton and Franklin counties is somewhat younger than that of Washington. The 0- to 14-year old age group accounts for 25.4% of the total bi-county population as compared to 20.9% for Washington. The population in Benton and Franklin counties under the age of 35 is 53.3%, compared to 48.9% for Washington State. During 2002, the 65-year old and older age group constituted 10% of the population of Benton and Franklin counties compared to 11.2% for Washington (OFM 2003).
Table 4.6-3 represents population estimates and percentages by race and Hispanic origin for Benton, Franklin, Grant, Adams, and Yakima counties, and the 80-km (50-mi) radius of the Hanford Site.
4.6.4 Environmental Justice
Executive Order 12898, "Federal Actions to Address Environmental Justice in Minority Populations and Low-income Populations," (59 FR 7629), directs federal agencies in the Executive Branch to consider environmental justice so that their programs will not have "disproportionately high and adverse human health or environmental effects" on minority and low-income populations. Executive Order 12898 further directs federal agencies to consider effects to "populations with differential patterns of subsistence consumption of fish and wildlife." The Executive Branch agencies also were directed to develop plans for carrying out the order. The Council on Environmental Quality (CEQ) later provided additional guidance for integrating environmental justice (EJ) into the National Environmental Policy Act process in a December 1997 document, Environmental Justice Guidance under the National Environmental Policy Act (CEQ 1997).
Minority populations are defined as all nonwhite individuals, plus all white individuals of Hispanic origin, as reported in the 2000 Census (Census 2001b). Low-income persons are defined as 1iving.in households that report an annual income less than the United States official poverty level, as reported by the Census Bureau. The poverty level varies by size and relationship of the members of the household. The year 2000 poverty level was $17,761 for a family of four (Census 2000,2001a). Nationally, in 1999, 29.9% of all persons were minorities, and 11.8% of all persons lived in households that had incomes less than the poverty level (which was $17,029 for a family of four in that year) (Census 2000,2001a). The 2000 Census reports that 10.6% of Washington's population lived in poverty in 1999, while 10.3% of Benton County persons and 19.2% of Franklin County persons were below the poverty level (Census 2003a).
Based on the 2000 census (Census 2001 b,c), the 80-km (50-mi) radius area surrounding the Hanford Site had a total population of 482,300 and a minority population of 178,500.'" The ethnic composition of the minority population is primarily White Hispanic (24 percent), self-designated "other and multiple" races (63 percent), and Native American (6 percent). Asians and Pacific Islanders (4 percent) and African American (3 percent) make up the rest. The Hispanic population resides predon~inantly in Franklin,
'a' The Hanford Site National Environmental Policy Act (NEPA) Characterization Rev.14 shows the total population "within" 80 km as 5 1 1,500, which was estimated by a geographical information system from the populations of individual census block groups, the smallest geographic area for which both minority and poverty status were estimated in the 2000 Census. The higher number resulted because the total population of a census block group was previously assigned to the 80-km area if any purr of the block group lay within 80 km of the Hanford Meteorological Station in the middle of the Hanford Site. The new estimate splits boundary block groups to include only those portions within 80 km, which should result in a lower and more accurate estimate.
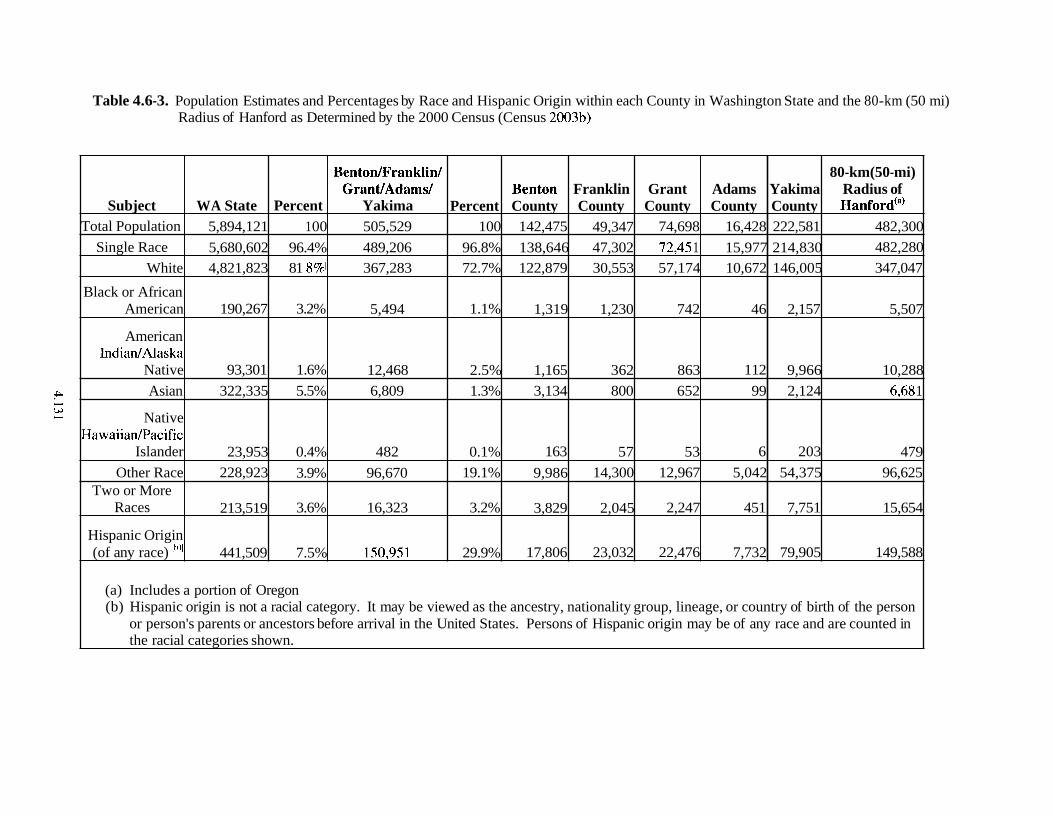
Table 4.6-3. Population Estimates and Percentages by Race and Hispanic Origin within each County in Washington State and the 80-km (50 mi) Radius of Hanford as Determined by the 2000 Census (Census 2003b)
Subject Total Population
Single Race
White
Black or African American
American IndianIAlaska
Native
Asian
Native HawaiianIPacific
Islander
Other Race Two or More
Races
Hispanic Origin (of any race) 'b)
(a) Includes a portion of Oregon (b) Hispanic origin is not a racial category. It may be viewed as the ancestry, nationality group, lineage, or country of birth of the person
or person's parents or ancestors before arrival in the United States. Persons of Hispanic origin may be of any race and are counted in the racial categories shown.
WA State 5,894,121
5,680,602 4,821,823
190,267
93,301
322,335
23,953
228,923
213,519
441,509
Percent 1 00
96.4% 81 3 %
3.2%
1.6%
5.5%
0.4%
3.9%
3.6%
7.5%
Benton/Franklin/ GrantIAdamsl
Yakima 505,529
489,206 367,283
5,494
12,468
6,809
482
96,670
16,323
150,95 1
Franklin County
49,347
47,302 30,553
1,230
362
800
5 7
14,300
2,045
23,032
Percent 100
96.8% 72.7%
1.1%
2.5%
1.3%
0.1%
19.1%
3.2%
29.9%
Benton County 142,475
138,646 122,879
1,319
1,165
3,134
163
9,986
3,829
17,806
Grant County
74,698
72,45 1 57,174
742
863
652
5 3
12,967
2,247
22,476
80-km(50-mi) Radius of anf ford'"'
482,300
482,280
347,047
5,507
10,288
6,68 1
479
96,625
15,654
149,588
Adams County
16,428
15,977 10,672
46
112
99
6
5,042
451
7,732
Yakima County 222,581
214,830 146,005
2,157
9,966
2,124
203
54,375
7,751
79,905

THIS PAGE INTENTIONALLY LEFT BLANK
Yakima, Grant, and Adams counties. Native Americans within the 80-km (50-mi) area reside primarily on the Yakama Reservation and upstream of the Hanford Site near the town of Beverly, Washington.
The low-income population in 2000 was approximately 80,800, or 17 percent of the total population residing in the 80-km (50-mi) radius of the Hanford Site (Census 2002 a, b), about the same percentage as the 1990 Census. The majority of these households were located to the southwest and northwest of the Site (Yakima and Grant counties) and in the cities of Pasco and Kennewick.
Figure 4.6-1 shows the location of Census block groups from the 2000 Census that had either a majority of residents who were members of a minority group (racial minority or Hispanic), or whose percentage of residents belonging to any minority group was at least 20 percentage points greater than the corresponding percentage of the state population (Census 2001a,b,c).
d Figure 4.6-2 shows the location of Census block groups from the 2000 Census that had either a majority of residents who were low income (members of a household below the national poverty level), or a percentage of low-income residents at least 20 percentage points greater than the corresponding
4 percentage of the state population (Census 2002 a,b).
The CEQ guidance recognizes that many minority and low-income populations derive part of their a sustenance from subsistence hunting, fishing, and gathering activities (sometimes for species unlike those
consumed by the majority population) or are dependent on water supplies or other resources that are atypical or used at different rates than other groups. These differential patterns of resource use are to be identified where practical and appropriate. Native Americans of various tribal affiliations who live in the greater Colurr~bia Basin rely in part on natural resources for subsistence. According to Harris and Harper (19971, the Nez Perce Tribe of Idaho, the Confederated Tribes of the Umatilla Reservation, and the Confederated Tribes and Bands of the Yakama Nation depend on natural resources for dietary subsistence. For example, the Treaty of 1855 with the Confederated Tribes and Bands of the Yakama Nation (Yakama 1855) secured to the Yakamas "the right of taking fish at all usual and accustomed places, in common with the citizens of the Territory [now the state of Washington] and of erecting temporary buildings for curing them; together with the privilege of hunting, gathering roots and berries, and pasturing their horses and cattle upon open and unclaimed lands" ceded to the government. Some of this ceded territory is located on the Hanford Site. The Wanapum, a non-treaty tribe, historically lived along the Columbia River and continue to live upstream of the Hanford Site. They fish on the Columbia River and gather food resources near the Hanford Site. The Confederated Tribes of the Colville Reservation established by the Executive Order of April 9, 1872, traditionally fished and gathered food resources in the Hanford area. They also are recognized as having cultural and religious ties to the Hanford Site.
4.6.5 Housing
In FY 2002,2603 houses were sold in the Tri-Cities at an average price of $1 5 1,902, compared to 2569 houses sold at an average price of $134,570 during 2001 (TCAR 2002). In FY 2002, 1227 single- family houses were built, up 41 % from the 869 that were built during 2001. The FY 2002 total surpasses the previous annual peak of 11 17 in 1994 (WCRER 2002a).
As of April 1,2002, there were estimated to be 75,191 housing units in Benton and Franklin counties, which is 28.4% more than the 58,541 in 1990 (OFM 2002~) . The number of apartments has increased from 8225 in 1990 to 10,290 during 2002. The vacancy rate of apartments in Benton and Franklin counties in September 2002 was 3.4%, and the average rent was $598 per month. These figures are up from the 2.0% vacancy rate and up from the $576 average rent in 2001 (WCRER 2002b).
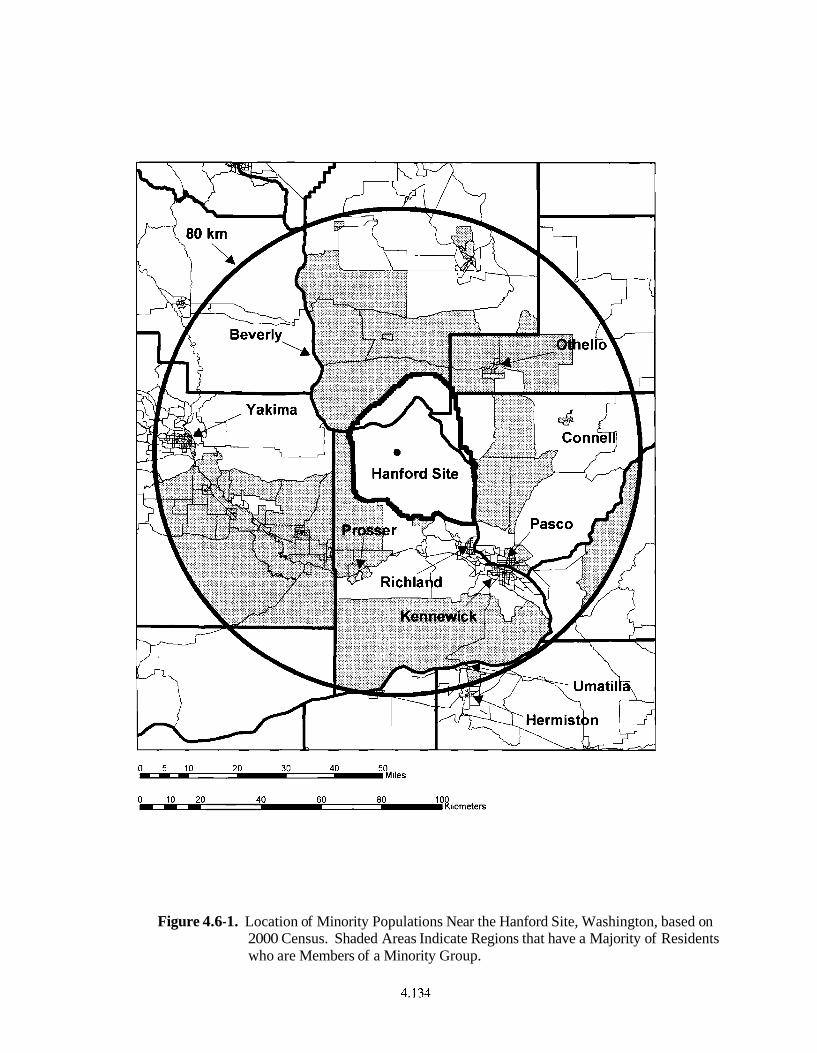
Figure 4.6-1. Location of Minority Populations Near the Hanford Site, Washington, based on 2000 Census. Shaded Areas Indicate Regions that have a Majority of Residents who are Members of a Minority Group.
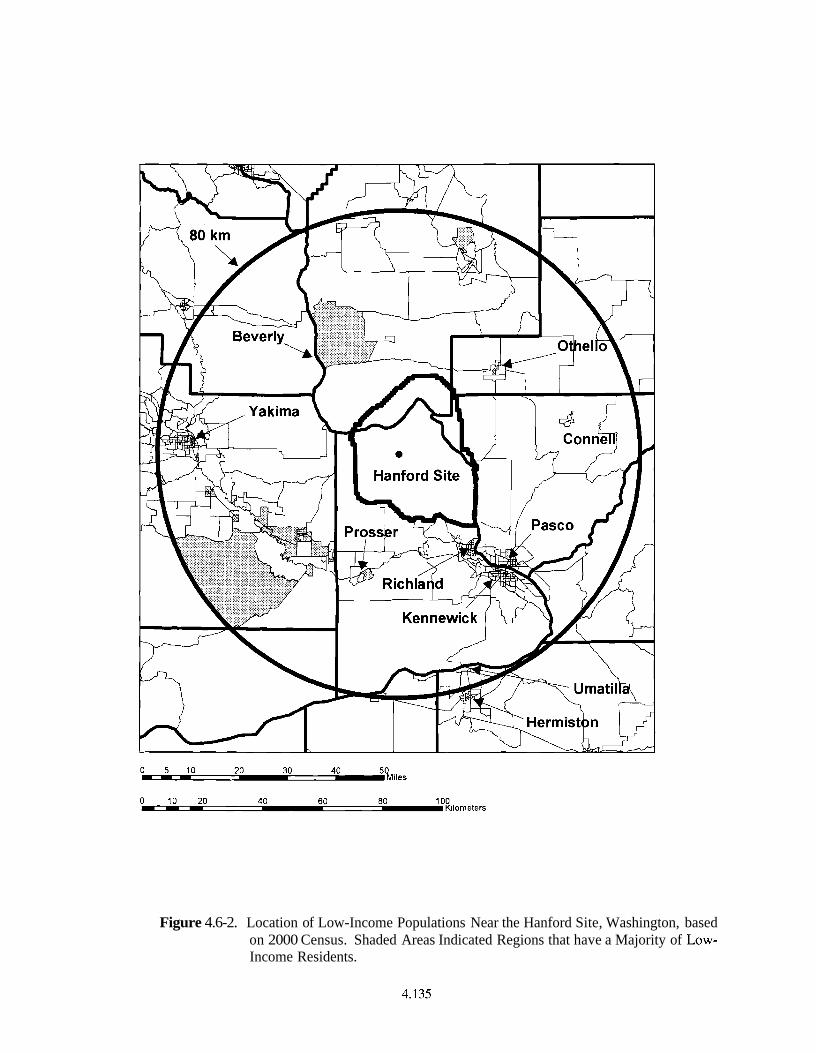
Figure 4.6-2. Location of Low-Income Populations Near the Hanford Site, Washington, based on 2000 Census. Shaded Areas Indicated Regions that have a Majority of Low- Income Residents.
4.6.6 Transportation
The Tri-Cities serves as a regional transportation and distribution center with major air, land, and river connections. The Burlington Northern and Santa Fe Railway (BNSF) and Union Pacific Railroad provide direct rail service. Union Pacific Railroad operates the largest fleet of refrigerated rail cars in the United States and is essential to food processors, which ship frozen food from this area. Passenger rail service is provided by Amtrak, which has a station in Pasco. Rail service on the Hanford Site is maintained and operated by the Tri-City and Olympia Railroad Company.
Docking facilities at the Ports of Benton, Kennewick, and Pasco are important aspects of this region's infrastructure. These facilities are located on the 525-km- (325.5-mi-) long commercial waterway, which includes the Snake and Columbia rivers, that extends from the Ports of Lewiston-Clarkston in Idaho to the deep-water ports of Portland, Oregon, and Vancouver, Washington.
Daily air passenger and freight services connect the area with most major cities through the Tri-Cities Airport, located in Pasco. This modern commercial airport links the Tri-Cities to major hubs and provides access to destinations anywhere in the world. There are two runways, a main runway and a minor runway for use during crosswinds. The main runway is equipped for precision instrumentation landings and takeoffs. Each runway is 2347 m (7700 ft) long and 46 m (150 ft) wide, and can accommodate landings and takeoffs by medium-range commercial aircraft, such as the Boeing 727-200 and Douglas DC-9.
During 2002, Delta Airlines, United Express, Horizon Air, and Air Wisconsin offered 7365 total flights (landings) into and out of the Tri-Cities. These airlines provide daily connections to domestic and international flights through Salt Lake City, Seattle, Denver, Spokane, and Portland. There were 210,351 enplanements at the Tri-Cities Airport during 2002, which was up from 206,188 enplanements in 2001, and is a record for the airport. Except for 2001, which saw a slight decrease due in part to the effects of 911 1, the number of passengers has increased eight years in a row. Projections indicate that the terminal can serve almost 300,000 passengers annually.
The Tri-Cities region has three general aviation airports that serve private aircraft. The Richland Airport, owned by the Port of Benton, is located northwest of the Richland central business district, adjacent to the Richland by-pass highway (SR-240). Vista Field Airport, owned by the Port of Kennewick, is located at the intersection of Columbia Center Boulevard and Canal Drive, with easy access to SR-240,I-82, and 1-182. The Prosser Airport, owned by the Port of Benton, is located one mile northwest of the business district of Prosser and is adjacent to US-12. Airfreight shippers that service the region include Airborne from Richland, United Parcel Service from Kennewick, and Federal Express from the Tri-Cities Airport in Pasco.
Mass transit within the Tri-Cities is provided by the Ben Franklin Transit system. The system covers more than 110 mi2 and provides frequent service to all four local communities (Richland, Kennewick, Pasco, and West Richland). The Ben Franklin fleet consists of 54 buses, 3 1 Dial-a-Ride para-transit vehicles, and 75 VanPool vans. Two local taxi companies provide radio-dispatched taxicab service 24 hours per day: A-1 Tri-Cities Cab and AMR Transportation. Intercity bus transportation is provided by Greyhound Bus Lines. Buses to Seattle, Spokane, and Portland leave twice daily from the Pasco terminal.
The regional transportation network in the Hanford vicinity includes the areas in Benton and Franklin counties from which most of the commuter traffic associated with the Site originates. Interstate highways that serve the area are 1-82 and 1-1 82. 1-82 is 8 km (5 mi) south-southwest of the
Site. 1-182, a 24-km (15-mi) long urban connector route, located 8 km (5 mi) south-southeast of the Site, provides an east-west corridor linking 1-82 to the Tri-Cities area. 1-90, located north of the Site, is the major link to Seattle and Spokane and extends to the East Coast. 1-82 serves as a primary link between Hanford and 1-90, as well as 1-84. 1-84, located south of the Site in Oregon, is a major corridor leading to Portland, Oregon. SR 224 (Van Giesen Street), also south of the Site, serves as a 16-km (1 0-mi) link between 1-82 and SR 240. SR 24 enters the Site from the west, continues eastward across the northernmost portion of the Site, and intersects SR 17 approximately 24 km (1 5 mi) east of the Site boundary. SR 17 is a north-south route that links 1-90 to the Tri-Cities and joins U.S. Route 395, continuing south through the Tri-Cities. U.S. Route 395 north also provides direct access to 1-90. SR 240 and SR 24 traverse the Site and are maintained by Washington State.
A DOE-maintained road network within the Hanford Site consists of 607 km (377 mi) of asphalt- paved road and provides access to the various work centers. Primary access roads to the industrial areas of the Hanford Site are Routes I, 2, 3, 5,6, 10, 11, and Beloit Avenue. Public access to the 200 Areas and interior locations of the Hanford Site has been restricted by guarded gates at the Wye Barricade (at the intersection of Routes 10 and 4), the Yakima Barricade (at the intersection of SR 24.0 and Route 1 IA), and Rattlesnake Barricade south of the 200 West Area. None of those roadways have experienced any substantial congestion except Route 4 (WHC 1994).
Access to the Hanford Site is via four main routes: Hanford Route 4 s from Stevens Drive in the City of Richland, Route 10 from SR 240 near its intersection with SR 225, Beloit Avenue from SR 240, or Route 11A from SR 240 near its intersection with SR 24. Another route, through the Rattlesnake Bamcade, is located 35 km (22 mi) northwest of Stevens Drive and is for passenger vehicle access only. The estimated total number of commuters to this area is 3100. Approximately 87 percent of the workers commuting to the 200 Areas are from the Tri-Cities, West Richland, Benton City, and Prosser (Perteet et al. 2001). The remaining workers commute from the surrounding counties of Yakima, Adams, Grant, and Walla Walla.
The portion of SR 240 most affected by 200 Area commuters is between U.S. 395 in Kennewick and Stevens Drive. Portions of this roadway currently operate below the minimum level of service established by the Regional Transportation Planning Organization. Peak annual average daily traffic (AADT) on the section from Columbia Center Boulevard to 1-182 is 54,000 (Perteet et al. 2001).
I- 182 has peak traffic counts of 35,000 AADT in the vicinity of SR 240 in Richland. 1-1 82 also has current deficiencies at the interchanges with Queensgate Drive and 20' Avenue. SR 224 (Van Giesen Street) transports most of the commuters from West Richland and Benton City to SR 240. The intersection of SR 224 and SR 240 is the only section of SR 224 with current level of service (LOS) deficiencies. LOS is a qualitative measure of a roadway's ability to accommodate vehicular traffic, ranging from free-flow conditions (LOS A) to extreme congestion (LOS F). LOS D is considered the lower end of acceptable LOS (Perteet et al. 2001).
Stevens Drive (in and north of Richland) has peak traffic counts of 8300 AADT at Horn Rapids Road and 22,000 AADT just north of its intersection with SR 240 (Bypass Highway). Currently this roadway experiences LOS deficiencies. George Washington Way is the principal north-south arterial through Richland. AADT at the entrance of the Hanford Site on George Washington Way is 1800. Counts north of McMurray are 18,000 AADT and counts on George Washington Way just north of 1-1 82 are 43,000 AADT. George Washington Way has LOS deficiencies between 1-182 and Swift Boulevard (Perteet et al. 2001).
Private vehicles account for 91 percent of the person trips to the Hanford Site. The remaining person trips are by forms of High Occupancy Vehicles (mostly Ben-Franklin Vanpools). Of the 91 percent of private vehicles only 3 percent are by carpool with the remaining 88 percent being single-occupancy vehicles. The Draft Regional Transportation Plan identifies 11,468 employees working at Hanford. Based on 88 percent of the trips carrying a single person to Hanford, 10,092 single occupancy trips are made daily or an AADT of 10,184 (Perteet et al. 2001). Several local highway construction projects are underway to reduce some of the traffic bottlenecks.
The Hanford Site rail system originally consisted of approximately 210 km (1 30 mi) of track. It connected to the Union Pacific Railroad commercial track at the Richland Junction (at Columbia Center in Kennewick) and to a now abandoned commercial right-of-way (Chicago, Milwaukee, St. Paul and Pacific Railroad) near Vernita Bridge in the northwest section of the Site. Prior to 1990, annual railcar movements numbered about 1400 sitewide, transporting materials including coal, fuel, hazardous process chemicals, and radioactive materials and equipment (DOE 1996b). In October 1998,26 km (16 mi) of track from Columbia Center to Horn Rapids Road were transferred to the Port of Benton and are currently operated by the Tri-City and Olympia Railroad. The Port of Benton has been granted the right to operate portions of the railroad on the Hanford Site.
4.6.7 Educational Services
Most of the primary and secondary students in the Tri-Cities area are served by the Richland, Pasco, Kennewick, and Kiona-Benton (Benton City) school districts. The total 2002 fall enrollment for all districts in Benton and Franklin counties was 41,999 students, an increase of 3.4% from the 2001 total of 40,590 students. The 2001 totals include 9800 students from the Richland School District, up from 9622 in 2001; 9785 students from the Pasco School District, up from 9227 in 2001; 14,698 students from the Kennewick School District, up from 13,993 in 2001; and 1664 from the Kiona-Benton School District, which remained even with 2001 enrollment figures (OSPI 2003).
There are several private elementary and secondary schools in the Tri-Cities, including Bethlehem Lutheran (K-8) and St. Joseph's (K-8) in Kennewick; Christ the King (K-8) and Liberty Christian (K-12) in Richland; and Faith Christian (K-12), Country Haven Academy, St. Patrick's (K-8), Tri-City Junior Academy (K-lo), and Tri-Cities Prep Catholic High School in Pasco. Fall 2002 enrollment at these schools totaled 2300 students, a decrease of 2.1 percent from the 2001 total of 2350 (OSPI 2003).
Post-secondary education in the Tri-Cities area is provided Columbia Basin College (CBC), City University, and Washington State University, Tri-Cities branch campus (WSU-TC). The 2001 faluwinter enrollment was 7661 at CBC, 342 at City University, and 1099 at WSU-TC. Many of the programs offered by these three institutions are geared toward the vocational and technical needs of the area. During 2001-02, CBC offered 23 Associate in Applied Science (AAS) degree programs. City University offers three undergraduate, and four graduate programs, plus access to several more programs through distance learning. WSU-TC offers 16 undergraduate and 14 graduate programs, as well as access to graduate programs via satellite.
4.6.8 Health Care and Human Services
The Tri-Cities has three major hospitals and five minor emergency centers. All three hospitals offer general medical services and include a 24-hr emergency room, basic surgical services, intensive care, and neonatal care.
Kadlec Medical Center, located in Richland, has 147 beds and functioned at 61% capacity with 7706
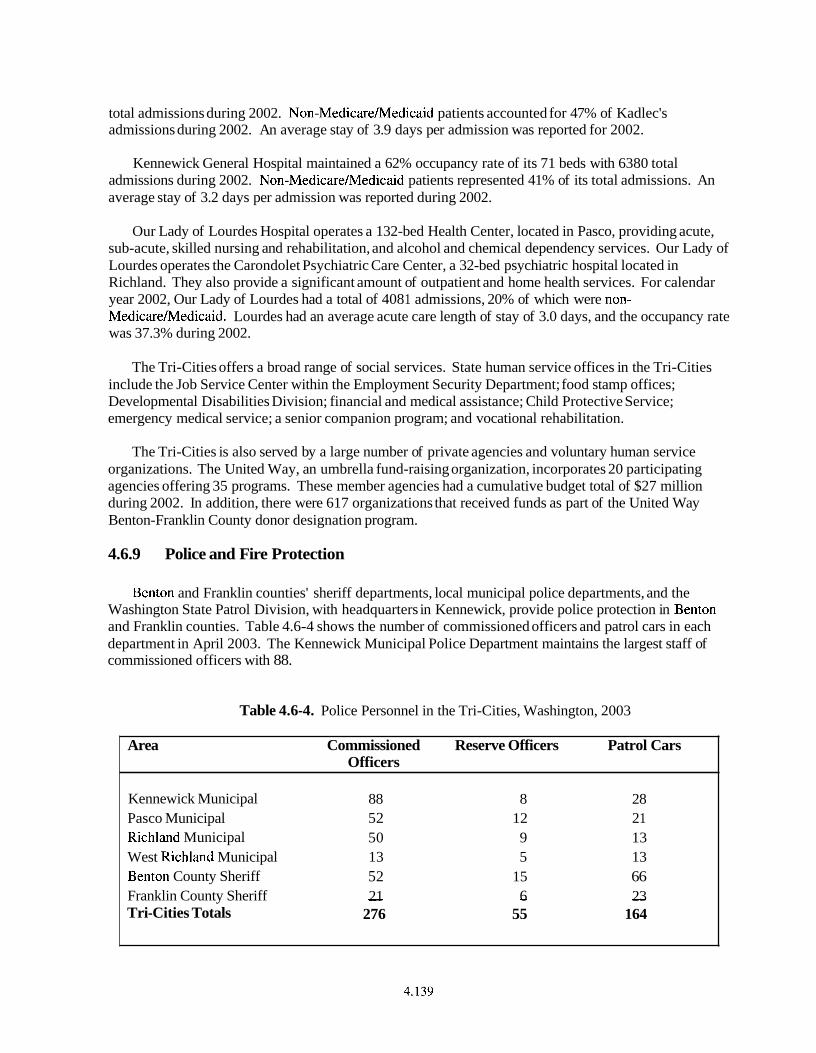
total admissions during 2002. Non-Medicare/edicaid patients accounted for 47% of Kadlec's admissions during 2002. An average stay of 3.9 days per admission was reported for 2002.
Kennewick General Hospital maintained a 62% occupancy rate of its 71 beds with 6380 total admissions during 2002. Non-Medicaremedicaid patients represented 41% of its total admissions. An average stay of 3.2 days per admission was reported during 2002.
Our Lady of Lourdes Hospital operates a 132-bed Health Center, located in Pasco, providing acute, sub-acute, skilled nursing and rehabilitation, and alcohol and chemical dependency services. Our Lady of Lourdes operates the Carondolet Psychiatric Care Center, a 32-bed psychiatric hospital located in Richland. They also provide a significant amount of outpatient and home health services. For calendar year 2002, Our Lady of Lourdes had a total of 408 1 admissions, 20% of which were non- Medicaremedicaid. Lourdes had an average acute care length of stay of 3.0 days, and the occupancy rate was 37.3% during 2002.
The Tri-Cities offers a broad range of social services. State human service offices in the Tri-Cities include the Job Service Center within the Employment Security Department; food stamp offices; Developmental Disabilities Division; financial and medical assistance; Child Protective Service; emergency medical service; a senior companion program; and vocational rehabilitation.
The Tri-Cities is also served by a large number of private agencies and voluntary human service organizations. The United Way, an umbrella fund-raising organization, incorporates 20 participating agencies offering 35 programs. These member agencies had a cumulative budget total of $27 million during 2002. In addition, there were 617 organizations that received funds as part of the United Way Benton-Franklin County donor designation program.
4.6.9 Police and Fire Protection
Benton and Franklin counties' sheriff departments, local municipal police departments, and the Washington State Patrol Division, with headquarters in Kennewick, provide police protection in Benton and Franklin counties. Table 4.6-4 shows the number of commissioned officers and patrol cars in each department in April 2003. The Kennewick Municipal Police Department maintains the largest staff of commissioned officers with 88.
Table 4.6-4. Police Personnel in the Tri-Cities, Washington, 2003
Area Commissioned Reserve Officers Patrol Cars Officers
Kennewick Municipal 8 8 8 28 Pasco Municipal 5 2 12 2 1 Richland Municipal 50 9 13 West Richland Municipal 13 5 13 Benton County Sheriff 5 2 15 66 Franklin County Sheriff - 2 1 - 6 - 23 Tri-Cities Totals 276 55 164
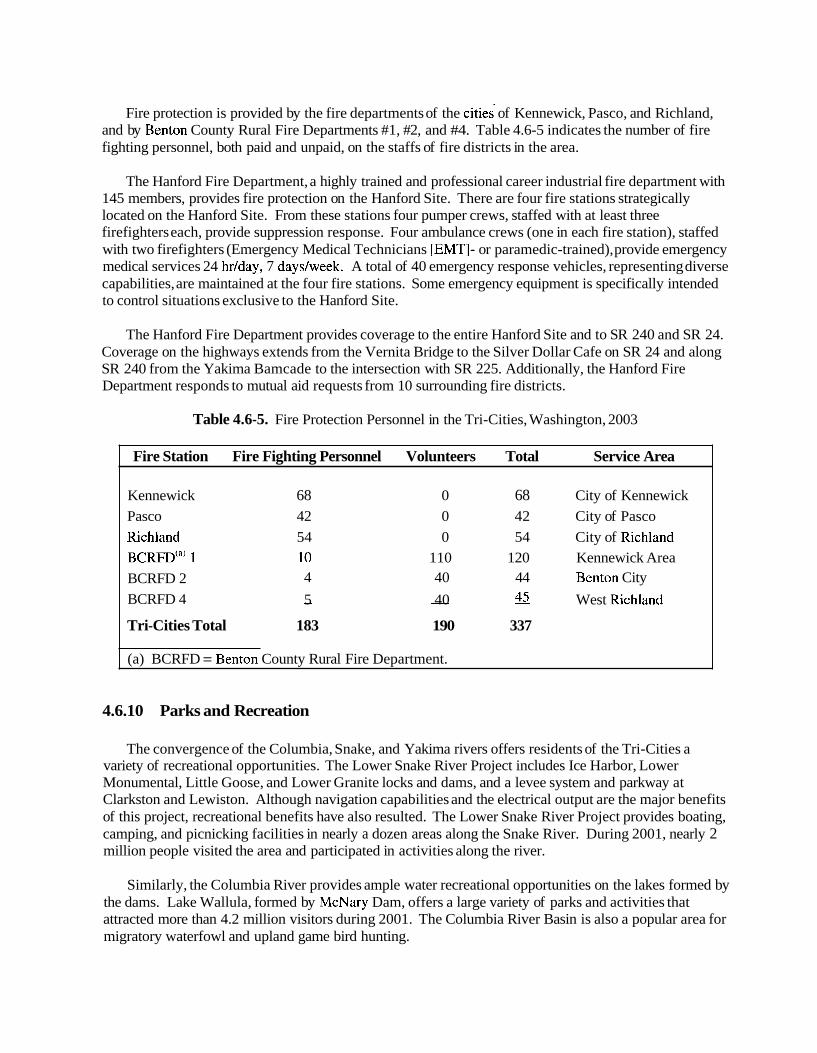
Fire protection is provided by the fire departments of the citiei of Kennewick, Pasco, and Richland, and by Benton County Rural Fire Departments #1, #2, and #4. Table 4.6-5 indicates the number of fire fighting personnel, both paid and unpaid, on the staffs of fire districts in the area.
The Hanford Fire Department, a highly trained and professional career industrial fire department with 145 members, provides fire protection on the Hanford Site. There are four fire stations strategically located on the Hanford Site. From these stations four pumper crews, staffed with at least three firefighters each, provide suppression response. Four ambulance crews (one in each fire station), staffed with two firefighters (Emergency Medical Technicians [EMTI- or paramedic-trained), provide emergency medical services 24 hrlday, 7 dayslweek. A total of 40 emergency response vehicles, representing diverse capabilities, are maintained at the four fire stations. Some emergency equipment is specifically intended to control situations exclusive to the Hanford Site.
The Hanford Fire Department provides coverage to the entire Hanford Site and to SR 240 and SR 24. Coverage on the highways extends from the Vernita Bridge to the Silver Dollar Cafe on SR 24 and along SR 240 from the Yakima Bamcade to the intersection with SR 225. Additionally, the Hanford Fire Department responds to mutual aid requests from 10 surrounding fire districts.
Table 4.6-5. Fire Protection Personnel in the Tri-Cities, Washington, 2003
Fire Station Fire Fighting Personnel Volunteers Total Service Area
Kennewick 68 0 68 City of Kennewick
Pasco 42 0 42 City of Pasco
Richland 54 0 54 City of Richland BCRFD'" I 10 110 120 Kennewick Area
BCRFD 2 4 40 44 Benton City
BCRFD 4 - 5 - 40 45 West Richland
Tri-Cities Total 183 190 337
(a) BCRFD = Benton County Rural Fire Department.
4.6.10 Parks and Recreation
The convergence of the Columbia, Snake, and Yakima rivers offers residents of the Tri-Cities a variety of recreational opportunities. The Lower Snake River Project includes Ice Harbor, Lower Monumental, Little Goose, and Lower Granite locks and dams, and a levee system and parkway at Clarkston and Lewiston. Although navigation capabilities and the electrical output are the major benefits of this project, recreational benefits have also resulted. The Lower Snake River Project provides boating, camping, and picnicking facilities in nearly a dozen areas along the Snake River. During 2001, nearly 2 million people visited the area and participated in activities along the river.
Similarly, the Columbia River provides ample water recreational opportunities on the lakes formed by the dams. Lake Wallula, formed by McNary Dam, offers a large variety of parks and activities that attracted more than 4.2 million visitors during 2001. The Columbia River Basin is also a popular area for migratory waterfowl and upland game bird hunting.
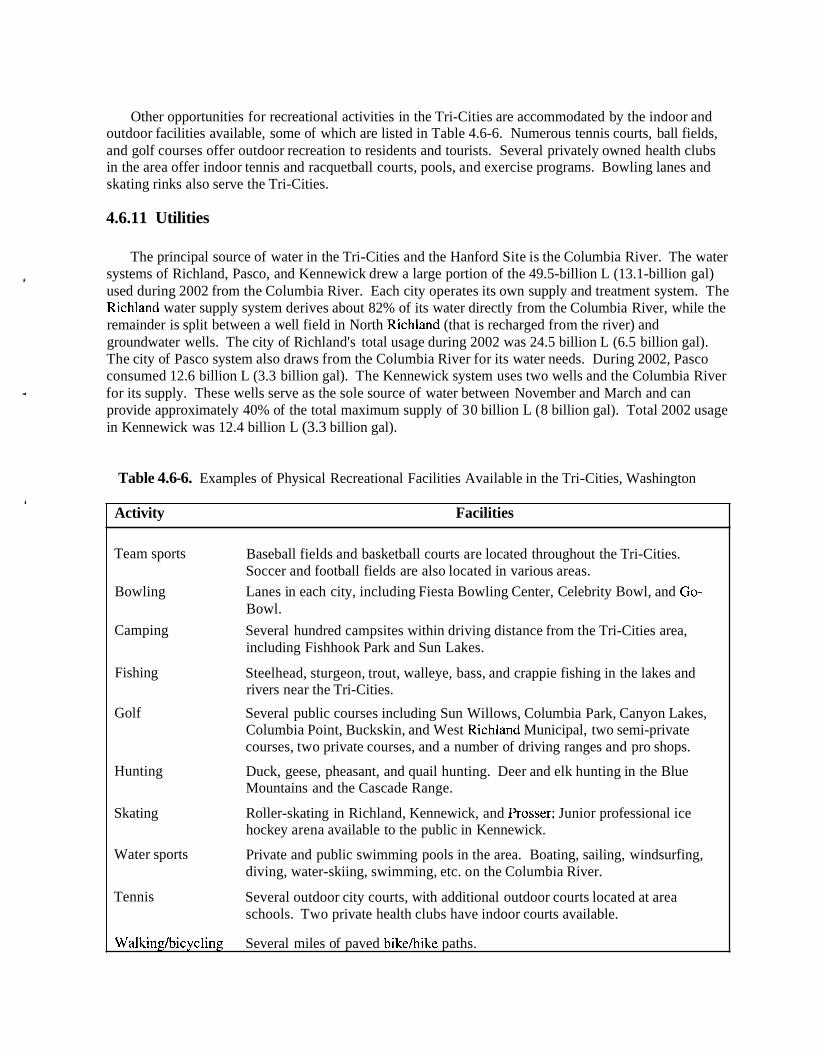
Other opportunities for recreational activities in the Tri-Cities are accommodated by the indoor and outdoor facilities available, some of which are listed in Table 4.6-6. Numerous tennis courts, ball fields, and golf courses offer outdoor recreation to residents and tourists. Several privately owned health clubs in the area offer indoor tennis and racquetball courts, pools, and exercise programs. Bowling lanes and skating rinks also serve the Tri-Cities.
4.6.11 Utilities
The principal source of water in the Tri-Cities and the Hanford Site is the Columbia River. The water systems of Richland, Pasco, and Kennewick drew a large portion of the 49.5-billion L (13.1-billion gal)
* used during 2002 from the Columbia River. Each city operates its own supply and treatment system. The Richland water supply system derives about 82% of its water directly from the Columbia River, while the remainder is split between a well field in North Richland (that is recharged from the river) and groundwater wells. The city of Richland's total usage during 2002 was 24.5 billion L (6.5 billion gal). The city of Pasco system also draws from the Columbia River for its water needs. During 2002, Pasco consumed 12.6 billion L (3.3 billion gal). The Kennewick system uses two wells and the Columbia River
.d for its supply. These wells serve as the sole source of water between November and March and can provide approximately 40% of the total maximum supply of 30 billion L (8 billion gal). Total 2002 usage in Kennewick was 12.4 billion L (3.3 billion gal).
Table 4.6-6. Examples of Physical Recreational Facilities Available in the Tri-Cities, Washington
I
Activity Facilities
Team sports Baseball fields and basketball courts are located throughout the Tri-Cities. Soccer and football fields are also located in various areas.
Bowling Lanes in each city, including Fiesta Bowling Center, Celebrity Bowl, and Go- Bowl.
Camping Several hundred campsites within driving distance from the Tri-Cities area, including Fishhook Park and Sun Lakes.
Fishing Steelhead, sturgeon, trout, walleye, bass, and crappie fishing in the lakes and rivers near the Tri-Cities.
Golf Several public courses including Sun Willows, Columbia Park, Canyon Lakes, Columbia Point, Buckskin, and West Richland Municipal, two semi-private courses, two private courses, and a number of driving ranges and pro shops.
Hunting Duck, geese, pheasant, and quail hunting. Deer and elk hunting in the Blue Mountains and the Cascade Range.
Skating Roller-skating in Richland, Kennewick, and Prosser; Junior professional ice hockey arena available to the public in Kennewick.
Water sports Private and public swimming pools in the area. Boating, sailing, windsurfing, diving, water-skiing, swimming, etc. on the Columbia River.
Tennis Several outdoor city courts, with additional outdoor courts located at area schools. Two private health clubs have indoor courts available.
Walking/bicycling Several miles of paved bikelhike paths.
The major incorporated areas of Benton and Franklin counties are served by municipal wastewater treatment systems, whereas the unincorporated areas are served by onsite septic systems. Richland's wastewater treatment system processed an average flow of 22.4 million Lid (5.9 million gaud) during 2002 and is designed to treat 43.1 million Lld (1 1.4 million gaud). Kennewick's waste treatment system processed an average 20.1 million Lld (5.3 million gaud) during 2002. Their system is capable of treating about 46.1 million Ud (12.2 million gaud). Pasco's waste treatment system processed an average 10.4 million Lld (2.7 million gaud) and is capable of treating 16.1 million Lld (4.25 million gaud).
The Benton County Public Utility District, Franklin County Public Utility District, and City of Richland Energy Services Department provide electricity to the Tri-Cities and surrounding areas. Nearly all the power these utilities provide in the local area is purchased from the Bonneville Power Administration (BPA), a federal power-marketing agency. These three utilities served more than 8 1,000 customers and had 3.03 billion kilowatt-hour (kwh) total sales during 2002. The average rate for residential customers was approximately $0.065/kWh in 2002, up from $0.061 in 2001. The Benton Rural Electrical Association serves portions of the rural areas of Benton and adjacent counties.
Electrical power for the Hanford Site is purchased wholesale from BPA, which provided nearly 95% of the electricity consumed on the Hanford Site during 2002. Energy requirements for the Hanford Site during FY 2002 were over 249 million kwh for a total cost of $8.3 million. Additionally, the Site spends about $0.024/kWh for electrical transportation and distribution within the Hanford Site.
Natural gas, provided by the Cascade Natural Gas Corporation, serves a small portion of local residents, with 9188 residential customers as of April 2003. Average annual gas bill for residential customers is approximately $1 100. The Cascade Natural Gas Corporation also serves the Hanford Site 300 Area.
In the Pacific Northwest, hydropower, and to a lesser extent coal, natural gas, and nuclear power, constitute the bulk of the region's electrical generation system. During 2002, generating resources in the Northwest averaged more than 28,547 megawatts (MW) of energy. The region's electrical power system, more than any other system in the nation, is dominated by hydropower, as 56.5% of the Pacific Northwest's regional generation came from the hydroelectric system during 2002. Coal resources were the next largest component, representing nearly 19.6% of all generating resources, followed by natural gas (17.9%), nuclear (3.0%), and "other" (3.0%) resources (NPPC 2003).
The Pacific Northwest system's reliance on hydroelectric power means that it is more constrained by the seasonal variations in peak demand than in meeting momentary peak demand. The Columbia River hydroelectric system's installed capacity was 33,463 MW during 2002 (NPPC 2003), but limitations on the storage capacity of the system result in significant variations in the system's energy output from year to year, depending on annual rainfall and snowpack accumulation. In the driest years, the hydroelectric system produces only about 1 1,700 average MW of energy. In the wettest years, the hydroelectric system produces about 20,000 average MW. In average water years, the dams generate approximately 16,500 average MW (NPPC 1 998).
Additional constraints on hydroelectric production include measures designed to protect and enhance the production of salmon, as many salmon runs have dwindled to the point of being threatened or endangered. These measures, outlined by the Northwest Power Planning Council's (NPPC) Columbia River Basin Fish and Wildlife Program, include minimum flow levels and a "water budget," referring to water in the Columbia and Snake rivers that is released to speed the migration of young fish to the sea. Generation capacity of the hydroelectric system is decreased with these measures, as less water is available to pass through the turbines.
In addition to the hydroelectric system, other sources of bulk electric power in the Northwest include large coal-fired power plants, industrial cogeneration plants, small biomass plants, numerous small hydroelectric projects, simple-cycle and combined-cycle natural gas combustion turbines, and the Energy Northwest Columbia Generating Station nuclear plant. The Columbia Generating Station (the only commercial nuclear power plant remaining in service in the Pacific Northwest), upgraded from its original peak capacity, and can now serve about 1216 MW during winter peak load. The plant produced 85 1 average MW of energy in fiscal year 2001 (NPPC 2002).
Wind energy is a new but growing component of the mix of generating resources. Phase I of FPL Energy's Stateline wind generation project (180 MW) entered service in December 2001 near Walla Walla, and Energy Northwest's Nine Mile Canyon Wind Farm (48 MW) entered service in October 2002 near Kennewick (American Wind Energy Association 2003). A number of other wind power projects (including a 40 MW Phase I1 for Stateline) have been proposed for the Northwest, though many have been put on hold because of low electricity demand, declining wholesale electricity prices and reduced economic activity due to recession. At prices of 4.0 to 6.0 cents per kwh, wind energy is close to competitive with other sources, despite relatively high costs per installed kwh and capacity factors of around 35 percent (OTED 2003).
4.6.12 Land Use
The DOE completed a Hanford Comprehensive Land-Use Plan EIS (HCP-EIS) in September 1999 (DOE 1999a), and a Record of Decision (ROD) was issued on November 2, 1999 (64 FR 61615). The purpose of this land-use plan and its implementing policies and procedures is to facilitate decision-making about the Hanford Site's uses and facilities over at least the next 50 years. The Preferred Alternative map shown in Figure 4.6-3 represents DOE'S future land-management values, goals, and objectives. The land- use plan consists of several key elements that are included in the Department's Preferred Alternative in the Final HCP-EIS (DOE 1999a). These elements include a land-use map that addresses the Hanford Site as five geographic areas - Wahluke Slope, Columbia River Corridor, Central Plateau, All Other Areas of the Site, and the Fitzner Eberhardt Arid Lands Ecology Reserve. The map depicts the planned future uses for each area; a set of 10 land-use designations that define the permissible uses for each area of the Hanford Site; and the planning and implementing policies and procedures that will govern the review and approval of future land uses. Together, these four elements create the Hanford Comprehensive Land-Use Plan.
The key features of the Hanford Site that form the basis for the five geographic areas used in the environmental impact analysis and land-use plans are as follows:
The Wahluke Slope. The area north of the Columbia River and the Hanford Site proper encompasses approximately 357 km2 (138 mi2) of relatively undisturbed or recovering shrub- steppe habitat managed by the USFWS for the DOE. These lands consist of two wildlife management units within the Hanford Reach National Monument/Saddle Mountain National Wildlife Refuge, the 130 km2 (50 mi2) Saddle Mountain Unit, and the 225 km2 (87 mi2) Wahluke Unit. Portions of the Saddle Mountain Unit, closed to public access, still serve as buffer areas for the Hanford Site. The Wahluke Unit is open to public recreational access. A small strip of land approximately 1.62 km2 (0.63 mi2) located between SR 243 and the Columbia River west of SR 24 is managed by the Washington State Department of Fish and Wildlife and retains public access.
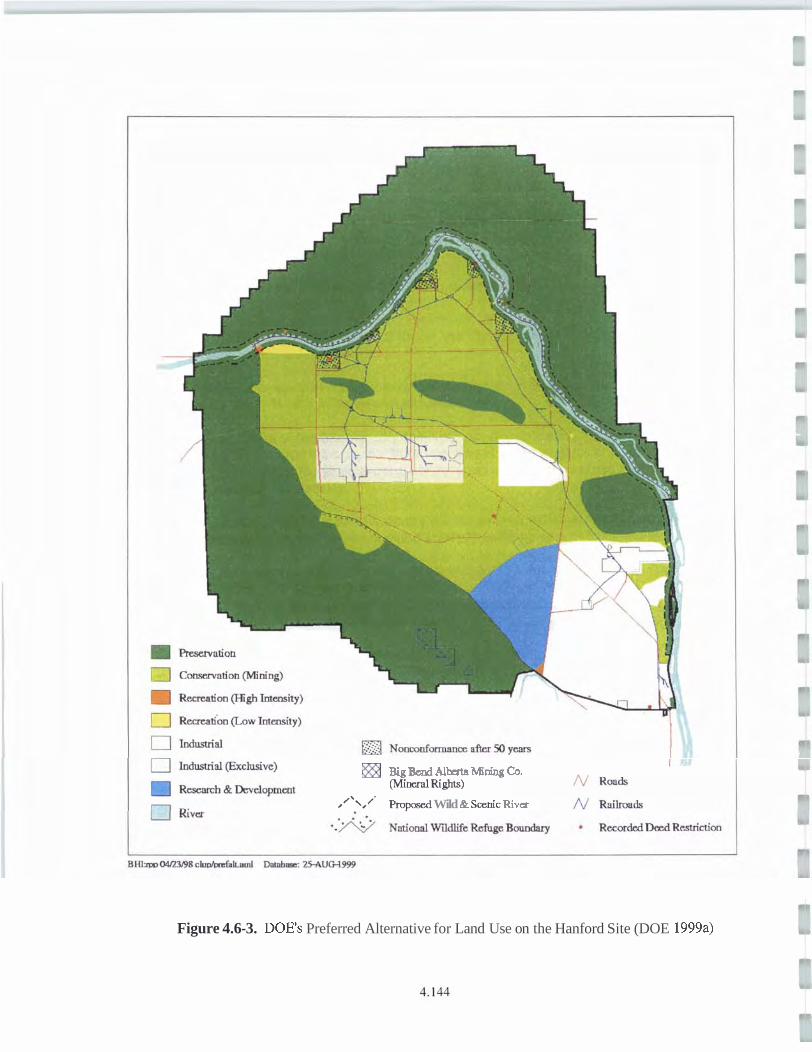
BiiBGnd Albata Mnhg Cn. -Rim)
,/'\,/' Propo&d Wild & &mic Ri~er
Figure 4.6-3. DOE'S Preferred Alternative for Land Use on the Hanford Site (DOE 1999a)
Colunlbia River Corridor. The 11 1.6 km2 (43.1 mi2) Columbia River Corridor, adjacent to and running through the Hanford Site, is used for boating, water skiing, fishing, and hunting of upland game birds and migratory waterfowl. Although public access is allowed on certain islands, access to other islands and adjacent areas is restricted because of distinctive habitats and the presence of cultural resources.
Along the southern shoreline of the Columbia River Corridor, the 100 Areas occupy approximately 68 km2 (26 mi2). The facilities in the 100 Areas include nine retired plutonium production reactors, associated facilities, and structures. Resource Conservation and Recovery Act of 1976 (RCRA) (42 USC 6901 et seq.) closure permit restrictions have been placed in the vicinity of the 100-H Area, which is associated with the 183-H Solar Evaporation Basins. Additional deed restrictions or covenants for activities that potentially extend more than 4.6 m (15 ft) below ground surface are expected for the Comprehensive Environmental Restoration, Compensation, and Liability Act of 1980 (CERCLA) (42 USC 9601, et seq.) remediation areas.
The area within the Columbia River Corridor known as the Hanford Reach includes an average of a 402 m (1 320 ft) strip of public land on either side of the Columbia River.
Central Plateau. The 200 East and 200 West Areas occupy approximately 51 km2 (19.5 mi2) in the Central Plateau of the Hanford Site. Facilities located in the Central Plateau were built to process irradiated fuel from the plutonium production reactors. The operation of these facilities resulted in the treatment, storage, disposal, and unplanned release of radioactive and nonradioactive waste. The Environmental Restoration Disposal Facility for CERCLA cleanup wastes is located in the Central Plateau.
A commercial low-level radioactive waste disposal facility, licensed by the State of Washington and run by U.S. Ecology, Inc., currently operates on 0.4 km2 (0.16 mi2) of the Central Plateau.
All Other Areas. All Other Areas comprise 689 km2 (266 mi2) and contain the 300,4.00, and 1100 Areas, Energy Northwest facilities, and a section of land currently owned by the State of Washington for the disposal of hazardous substances.
The Hanford 1 100 Area and the Hanford railroad southern connection (from Horn Rapids Road to Columbia Center) have been transferred from DOE ownership to Port of Benton ownership to support future economic development. Although the 1 100 Area is no longer under DOE control, it is included in the HCP EIS to support the local governments with their State Environmental Policy Act (SEPA) EIS analyses of the Hanford sub-area of Benton County under the State of Washington's Growth Management Act.
The 300 Area is located just north of the city of Richland and covers 1.5 km2 (0.6 mi2). The 300 Area is the site of former reactor fuel fabrication facilities and is also the principal location of nuclear research and development facilities serving the Hanford Site.
The 400 Area, located southeast of the 200 East Area, is the site primarily of the Fast Flux Test Facility (FFTF), a 400-megawatt (thermal) liquid metal (sodium) fast neutron flux nuclear test reactor. The construction of the FFTF was completed in 1978 and its initial operation began in 1980. From 1982 to 1992, the FFTF operated as a national research facility to test advanced nuclear fuels, materials, components, nuclear power plant operations and maintenance protocols, and reactor safety designs. During this time, the FFTF also produced a wide variety of medical and industrial isotopes, made tritium for the U.S. fusion research program, and conducted
cooperative international research work. In late 1993, DOE ordered the FFTF to begin shutdown (i.e., deactivation or transition) due to lack of economically-viable missions, and shutdown work was performed from 1994 through 1997. From 1997 through the end of 2001, the FFTF was maintained in a standby condition while numerous feasibility studies and a NEPA EIS review were conducted of any future roles it might have. Based on these evaluations, the DOE decided in late 2001 that restart of the FFTF was impracticable and that its deactivation would resume. Major FFTF deactivation activities underway at this time consist of, but are not limited to, dry cask storage of irradiated fuel, dry storage of unirradiated and sodium-bonded fuel, sodium drain and storage, and deactivation of the auxiliary plant systems. In late 2002, these deactivation activities were temporarily stopped due to legal challenges. However, in early 2003 the court resolved these legal challenges and DOE was allowed to resume deactivation activities.
Energy Northwest currently operates the Columbia Generating Station on leased land approximately I0 km (6 mi) north of Richland. Originally leased for the operation of three nuclear power plants, construction of two of the plants was halted; other industrial options are currently being considered.
In 1980, the federal government sold a 2.59 km2 (1 mi2) section of land (known as Section 1) south of the 200 East Area, near SR 240, to the State of Washington for the purpose of nonradioactive hazardous waste disposal. To date, this parcel has not been used for hazardous waste disposal, and it is undeveloped and uncontaminated (although the underlying groundwater is contaminated). The deed requires that if it were used for any purpose other than hazardous waste disposal, ownership would revert to the federal government. -
Additional activities in All Other Areas include:
(1) A specialized training center: The Hazardous Materials Management and Emergency Response (HAMMER) Volpentest Training and Education Center is used to train hazardous materials response personnel. It is located north of the former 1100 Area and covers about 0.3 km2 (0.1 2 mi2). (2) A regional law-enforcement training facility: The Hanford Patrol Training Academy provides a range of training environments including classrooms, library resources, practice shoot houses, an exercise gym, and an obstacle course. (3) A national research facility: The Laser Interferometer Gravitational Wave Observatory (LIGO), built by the National Science Foundation for scientific research, is designed to detect cosmic gravitational waves. The facility consists of two optical tube arms, each 4 km (2.5 mi) long, arrayed in an "L" shape, which are extremely sensitive to vibrations.
Fitzner Eberhardt Arid Lands Ecology Reserve Unit (ALE Reserve). The 308.7 km2 (1 19.2 mi2) ALE Unit is part of the Hanford Reach National Monument and is managed by the USFWS for the DOE. The Unit is located in the southwestern portion of the Hanford Site and is managed as a wildlife reserve and environmental research center. The public is currently restricted from the site.
The Hanford Site facilities and activities are consolidated within operating areas that occupy about 6 percent of the total available area of the Site (DOE 1999b). Some of the Hanford Site that is not involved with the current mission has been leased, disposed, or permitted to federal or state agencies, or private entities. Table 4.6-7 is a summary of land allocations.
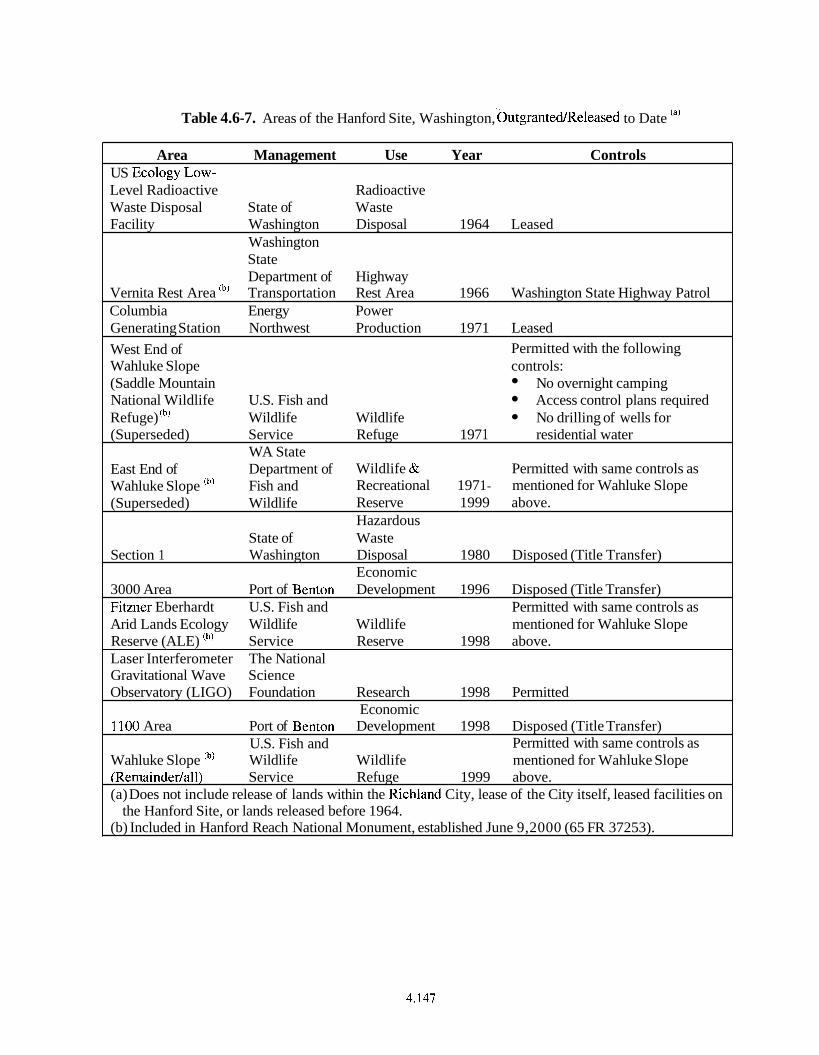
Table 4.6-7. Areas of the Hanford Site, Washington, .outgranterneleased to Date '"' Area Management Use Year Controls
US Ecology LOW- Level Radioactive Radioactive Waste Disposal State of Waste Facility Washington Disposal 1964 Leased
Washington State Department of Highway
Vernita Rest Area (b' Transportation Rest Area 1966 Washington State Highway Patrol Columbia Energy Power Generating Station Northwest Production 1971 Leased
West End of Permitted with the following Wahluke Slope controls: (Saddle Mountain No overnight camping National Wildlife U.S. Fish and Access control plans required Refuge) 'b' Wildlife Wildlife No drilling of wells for (Superseded) Service Refuge 197 1 residential water
WA State East End of Department of Wildlife & Permitted with same controls as Wahluke Slope 'b' Fish and Recreational 197 1 - mentioned for Wahluke Slope (Superseded) Wildlife Reserve 1999 above.
Hazardous State of Waste
Section 1 Washington Disposal 1980 Disposed (Title Transfer) Economic
3000 Area Port of Benton Development 1996 Disposed (Title Transfer) Fitzner Eberhardt U.S. Fish and Permitted with same controls as Arid Lands Ecology Wildlife Wildlife mentioned for Wahluke Slope Reserve (ALE) (b) Service Reserve 1998 above. Laser Interferometer The National Gravitational Wave Science Observatory (LIGO) Foundation Research 1998 Permitted
Economic 1 100 Area Port of Benton Development 1998 Disposed (Title Transfer)
U.S. Fish and Permitted with same controls as Wahluke Slope 'b) Wildlife Wildlife mentioned for Wahluke Slope (Remaindertall) Service Refuge 1999 above. (a) Does not include release of lands within the Richland City, lease of the City itself, leased facilities on
the Hanford Site, or lands released before 1964. (b) Included in Hanford Reach National Monument, established June 9,2000 (65 FR 37253).
4.6.13 Visual Resources
With the exception of Rattlesnake Mountain, the land near the Hanford Site is generally flat with little relief. Rattlesnake Mountain, rising to 1060 m (3477 ft) above mean sea level forms the western boundary of the Hanford Site, and Gable Mountain and Gable Butte are the highest landforms within the Site (Figure 4.6-4). The view toward Rattlesnake Mountain is visually pleasing, especially in the springtime when wildflowers are in bloom. Large rolling hills are located to the west and far north. The Columbia River, flowing across the northern part of the Hanford Site and forming the eastern boundary, is generally considered scenic, with its contrasting blue against a background of brown basaltic rocks and sagebrush. The White Bluffs, steep whitish-brown bluffs adjacent to the Columbia River and above the northern boundary of the river in this region, are a strong feature of the landscape.
Traditional Native American religion is manifest in the earth, water, sky, and all animate or inanimate beings that inhabit a given location. The National Historic Preservation Act (16 USC 470, et seq.), the Native American Graves Protection and Repatriation Act (25 USC 3001, et seq.), the Archaeological Resources Protection Act (16 USC 470aa, et seq.), and DOE'S American Indian Policy (DOE 1992b), among other legislation and guidelines, all require the identification and protection of areas and resources of concern to Native Americans.
The acquisition of spiritual guidance and assistance through personal vision quests is deeply rooted in the religious practices of the indigenous people of the Columbia Basin. High spots were selected because they afforded extensive views of the natural landscape and seclusion for quiet meditation.
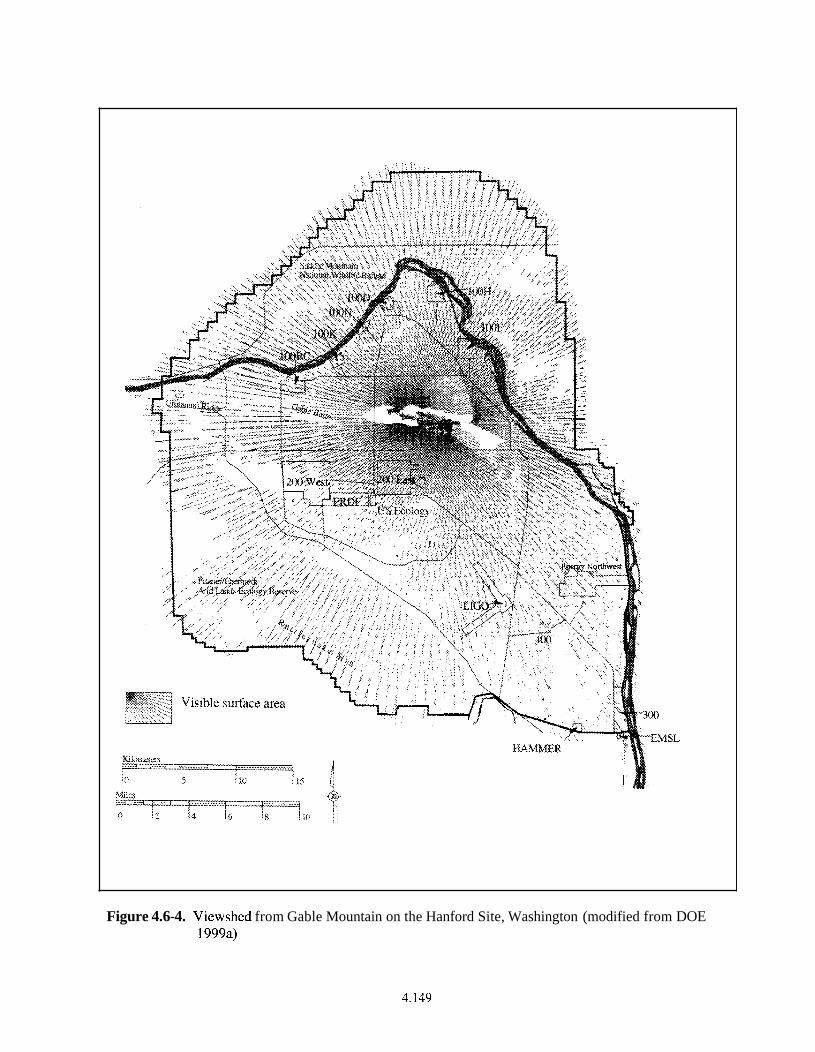
Figure 4.6-4. Viewshed from Gable Mountain on the Hanford Site, Washington (modified from DOE 1999a)
4.7 Noise T. M. Poston
Noise is technically defined as sound waves that are unwanted and perceived as a nuisance by humans. Sound waves are characterized by frequency, measured in Hertz (Hz), and sound pressure expressed as decibels (dB). Humans have a perceptible hearing range of 3 1 to 20,000 Hz. The decibel is a value equal to 10 times the logarithm of the ratio of a sound pressure squared to a standard reference sound-pressure level (20 micropascals) squared. The threshold of audibility ranges from about 60 dB at a frequency of 31 Hz to less than about 1 dB between 900 and 8000 Hz. (For regulatory purposes, noise levels for perceptible frequencies are weighted to provide an A-weighted sound level [dBA] that correlates highly with individual community response to noise.) Sound levels outside the range of human hearing are not considered noise in a regulatory sense, even though wildlife may hear at these frequencies.
Noise levels are often reported as the equivalent sound level (L,). The L, is expressed in dBA over a specified period of time, usually I or 24 hr. The L, is the equivalent steady sound level that, if continuous during a specified time period, would contain the same total energy as the actual time-varying sound over the monitored or modeled time period.
4.7.1 Background Information
Studies of the propagation of noise at Hanford have been concerned primarily with occupational noise at work sites. Environmental noise levels have not been extensively evaluated because of the remoteness of most Hanford activities and isolation from receptors that are covered by federal or state statutes. This discussion focuses on what few environmental noise data are available. The majority of available information consists of model predictions, which in many cases have not been verified because the predictions indicate that the potential to violate federal or state standards is remote or unrealistic.
4.7.2 Environmental Noise Regulations
The Noise Control Act of 1972 and its subsequent amendments (Quiet Communities Act of 1978 and 40 CFR 201-21 1) direct the regulation of environmental noise to the state. The State of Washington has adopted Revised Code of Washington (RCW) 70.107, which authorizes Ecology to implement rules consistent with federal noise control legislation. RCW 70.107 and the implementing regulations embodied in WAC 173-60 through 173-70 define the regulation of environmental noise levels. Maximum noise levels are defined for the zoning of the area in accord with environmental designation for noise abatement (EDNA). The Hanford Site is classified as a Class C EDNA on the basis of industrial activities. Unoccupied areas are also classified as Class C areas by default because they are neither Class A (residential) nor Class B (commercial). Maximum noise levels are established based on the EDNA classification of the receiving area and the source area (Table 4.7-1).
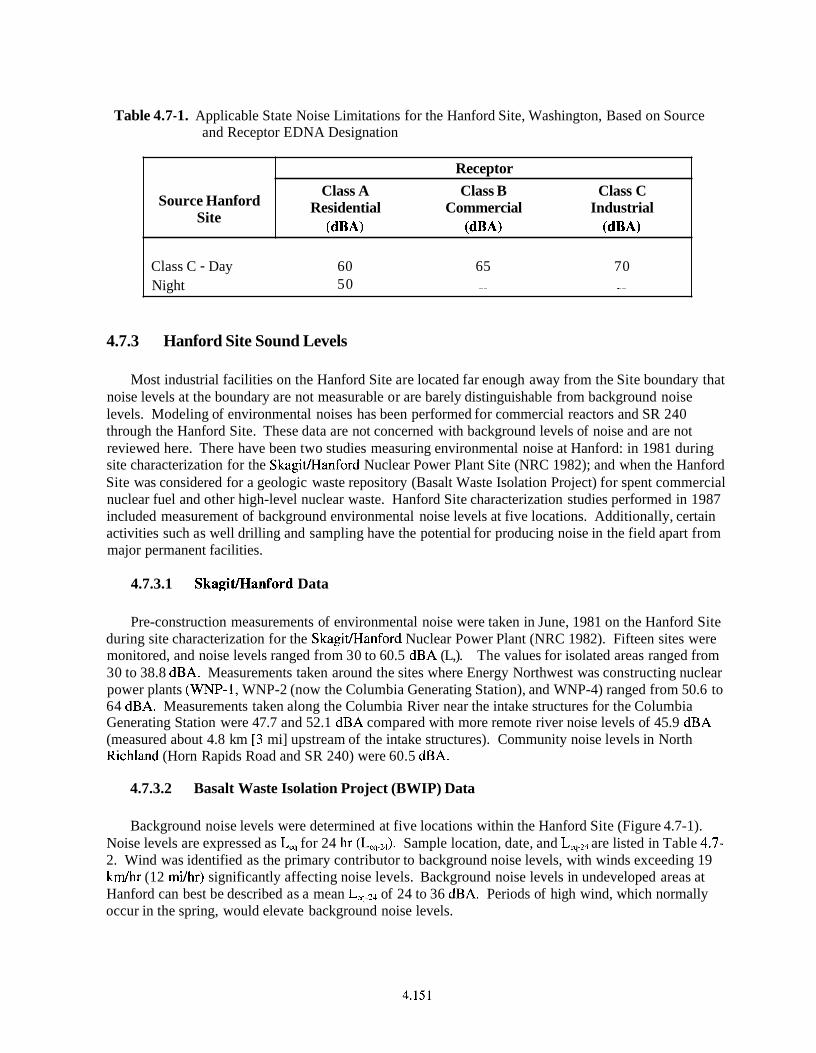
Table 4.7-1. Applicable State Noise Limitations for the Hanford Site, Washington, Based on Source and Receptor EDNA Designation
4.7.3 Hanford Site Sound Levels
Source Hanford Site
Most industrial facilities on the Hanford Site are located far enough away from the Site boundary that noise levels at the boundary are not measurable or are barely distinguishable from background noise levels. Modeling of environmental noises has been performed for commercial reactors and SR 240 through the Hanford Site. These data are not concerned with background levels of noise and are not reviewed here. There have been two studies measuring environmental noise at Hanford: in 1981 during site characterization for the Skaginanford Nuclear Power Plant Site (NRC 1982); and when the Hanford Site was considered for a geologic waste repository (Basalt Waste Isolation Project) for spent commercial nuclear fuel and other high-level nuclear waste. Hanford Site characterization studies performed in 1987 included measurement of background environmental noise levels at five locations. Additionally, certain activities such as well drilling and sampling have the potential for producing noise in the field apart from major permanent facilities.
Receptor
Class A Class B Class C Residential Commercial Industrial
( d B 4 (dBA) (dBA)
4.7.3.1 SkagitJHanford Data
Class C - Day 60 65 70 Night 50 -- --
Pre-construction measurements of environmental noise were taken in June, 1981 on the Hanford Site during site characterization for the SkagidHanford Nuclear Power Plant (NRC 1982). Fifteen sites were monitored, and noise levels ranged from 30 to 60.5 dBA (L,). The values for isolated areas ranged from 30 to 38.8 dBA. Measurements taken around the sites where Energy Northwest was constructing nuclear power plants (WNP-1, WNP-2 (now the Columbia Generating Station), and WNP-4) ranged from 50.6 to 64 dBA. Measurements taken along the Columbia River near the intake structures for the Columbia Generating Station were 47.7 and 52.1 dBA compared with more remote river noise levels of 45.9 dBA (measured about 4.8 km [3 mi] upstream of the intake structures). Community noise levels in North Richland (Horn Rapids Road and SR 240) were 60.5 dBA.
4.7.3.2 Basalt Waste Isolation Project (BWIP) Data
Background noise levels were determined at five locations within the Hanford Site (Figure 4.7-1). Noise levels are expressed as L, for 24 hr (LC,,,). Sample location, date, and L,,, are listed in Table 4.7- 2. Wind was identified as the primary contributor to background noise levels, with winds exceeding 19 kmlhr (12 milhr) significantly affecting noise levels. Background noise levels in undeveloped areas at Hanford can best be described as a mean Leq-24 of 24 to 36 dBA. Periods of high wind, which normally occur in the spring, would elevate background noise levels.
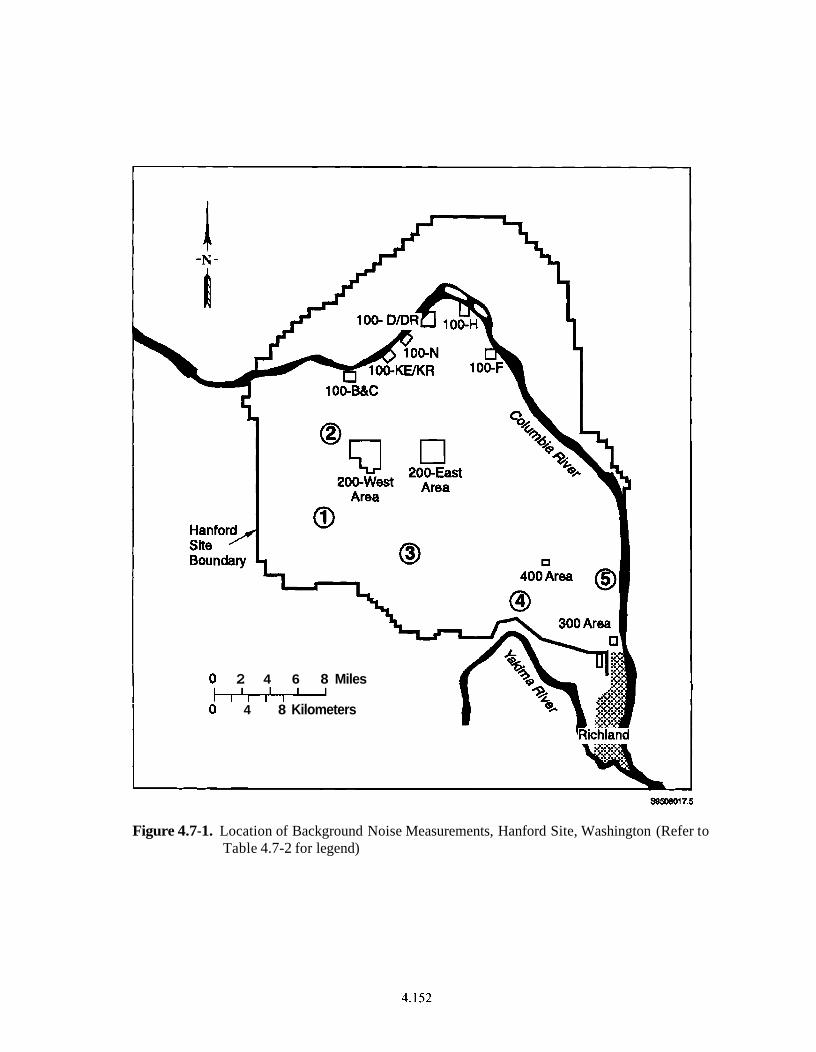
0 2 4 6 8 Miles - 0 4 8 Kilometers
Figure 4.7-1. Location of Background Noise Measurements, Hanford Site, Washington (Refer to Table 4.7-2 for legend)
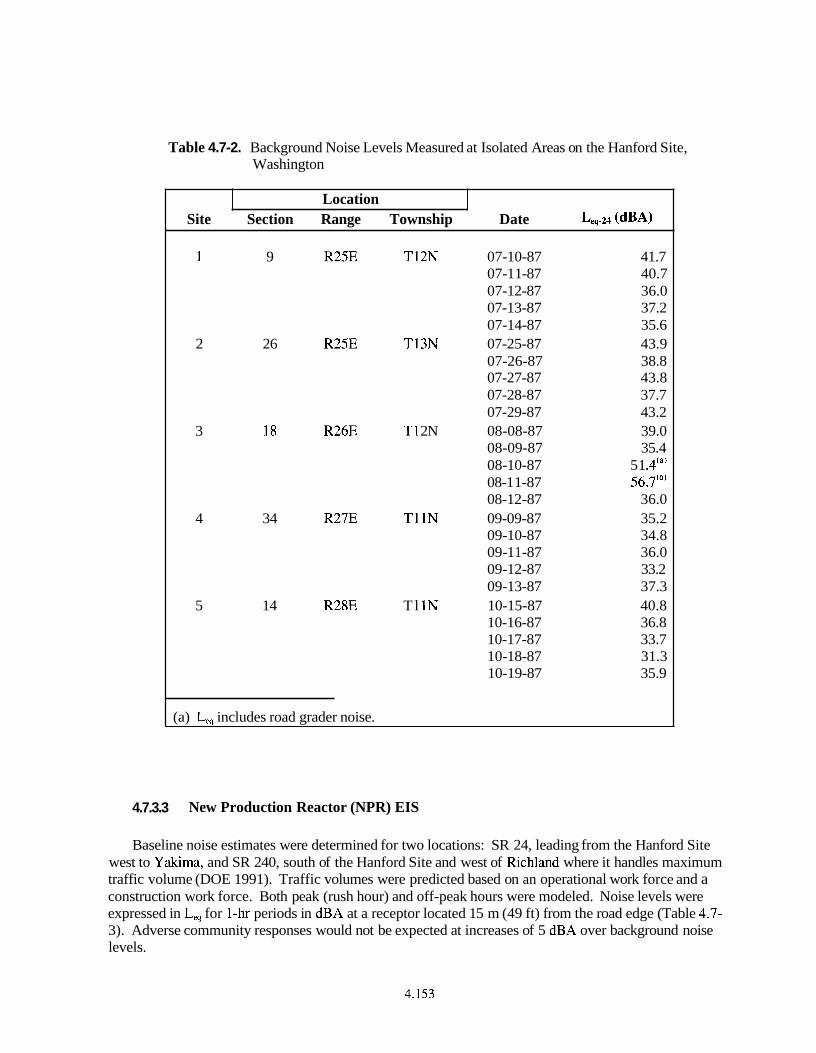
Table 4.7-2. Background Noise Levels Measured at Isolated Areas on the Hanford Site, Washington
Location Site Section Range Township Date Leq-z4 (dB-4)
1 9 R25E T12N 07- 10-87 41.7 07- 1 1-87 40.7 07- 12-87 36.0 07-13-87 37.2 07- 14-87 35.6
2 26 R25E T13N 07-25-87 43.9 07-26-87 38.8 07-27-87 43.8 07-28-87 37.7 07-29-87 43.2
3 18 R26E TI 2N 08-08-87 39.0 08-09-87 35.4 08- 10-87 5 1 .4(a) 08-1 1-87 56.7'a' 08-12-87 36.0
4 34 R27E Tl lN 09-09-87 35.2 09- 10-87 34.8 09- 1 1 -87 36.0 09- 12-87 33.2 09- 13-87 37.3
5 14 R28E T l lN 10-15-87 40.8 10-16-87 36.8 10-17-87 33.7 10- 18-87 31.3 10-19-87 35.9
(a) L, includes road grader noise.
4.7.3.3 New Production Reactor (NPR) EIS
Baseline noise estimates were determined for two locations: SR 24, leading from the Hanford Site west to Yakima, and SR 240, south of the Hanford Site and west of Richland where it handles maximum traffic volume (DOE 1991). Traffic volumes were predicted based on an operational work force and a construction work force. Both peak (rush hour) and off-peak hours were modeled. Noise levels were expressed in L, for 1-hr periods in dBA at a receptor located 15 m (49 ft) from the road edge (Table 4.7- 3). Adverse community responses would not be expected at increases of 5 dBA over background noise levels.
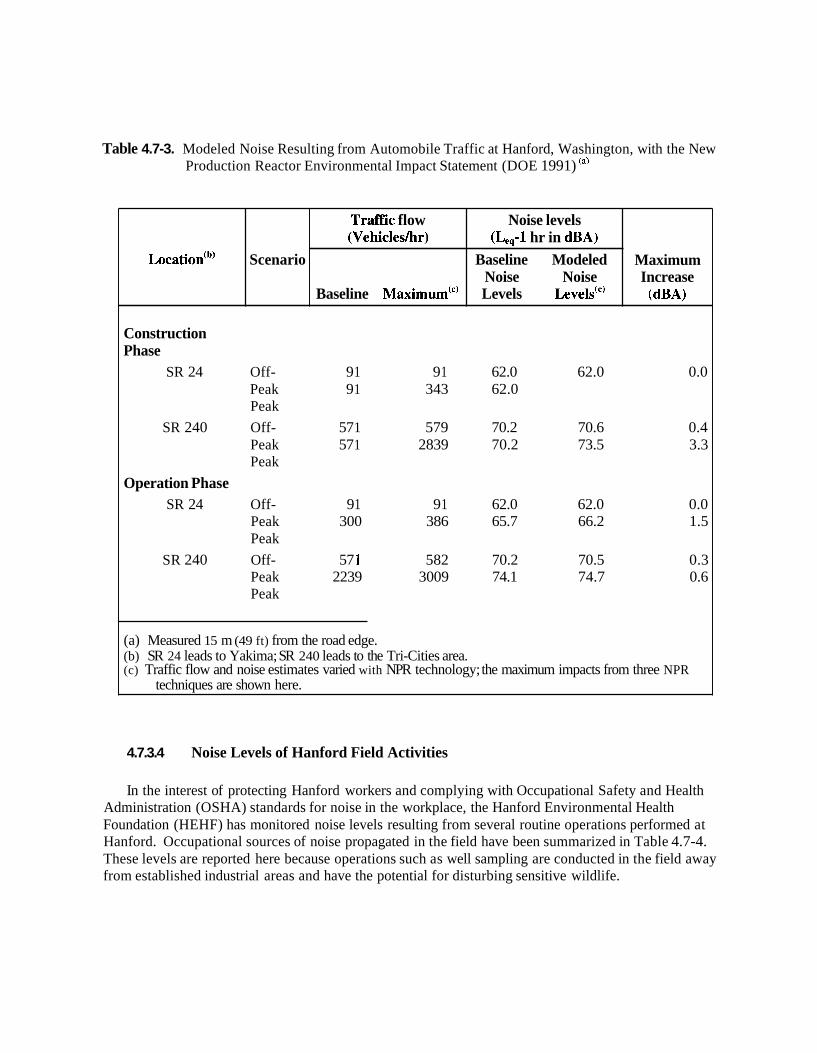
Table 4.7-3. Modeled Noise Resulting from Automobile Traffic at Hanford, Washington, with the New Production Reactor Environmental Impact Statement (DOE 1991) (")
4.7.3.4 Noise Levels of Hanford Field Activities
~ocation'~'
In the interest of protecting Hanford workers and complying with Occupational Safety and Health Administration (OSHA) standards for noise in the workplace, the Hanford Environmental Health Foundation (HEHF) has monitored noise levels resulting from several routine operations performed at Hanford. Occupational sources of noise propagated in the field have been summarized in Table 4.7-4. These levels are reported here because operations such as well sampling are conducted in the field away from established industrial areas and have the potential for disturbing sensitive wildlife.
Construction Phase
SR 24 Off- 9 1 9 1 62.0 62.0 0.0 Peak 9 1 343 62.0 Peak
SR 240 Off- 57 1 579 70.2 70.6 0.4 Peak 57 1 2839 70.2 73.5 3.3 Peak
Operation Phase SR 24 Off- 9 1 9 1 62.0 62.0 0.0
Peak 300 3 86 65.7 66.2 1.5 Peak
SR 240 Off- 57 1 582 70.2 70.5 0.3 Peak 2239 3009 74.1 74.7 0.6 Peak
(a) Measured 15 m (49 ft) from the road edge. (b) SR 24 leads to Yakima; SR 240 leads to the Tri-Cities area. (c) Traffic flow and noise estimates varied with NPR technology; the maximum impacts from three NPR
techniques are shown here.
Scenario
Traffic flow (Vehicleshr)
Baseline ~aximum"'
Noise levels (L,,-1 hr in dBA)
Baseline Modeled Noise Noise Levels ~evels"'
Maximum Increase
( d B 4
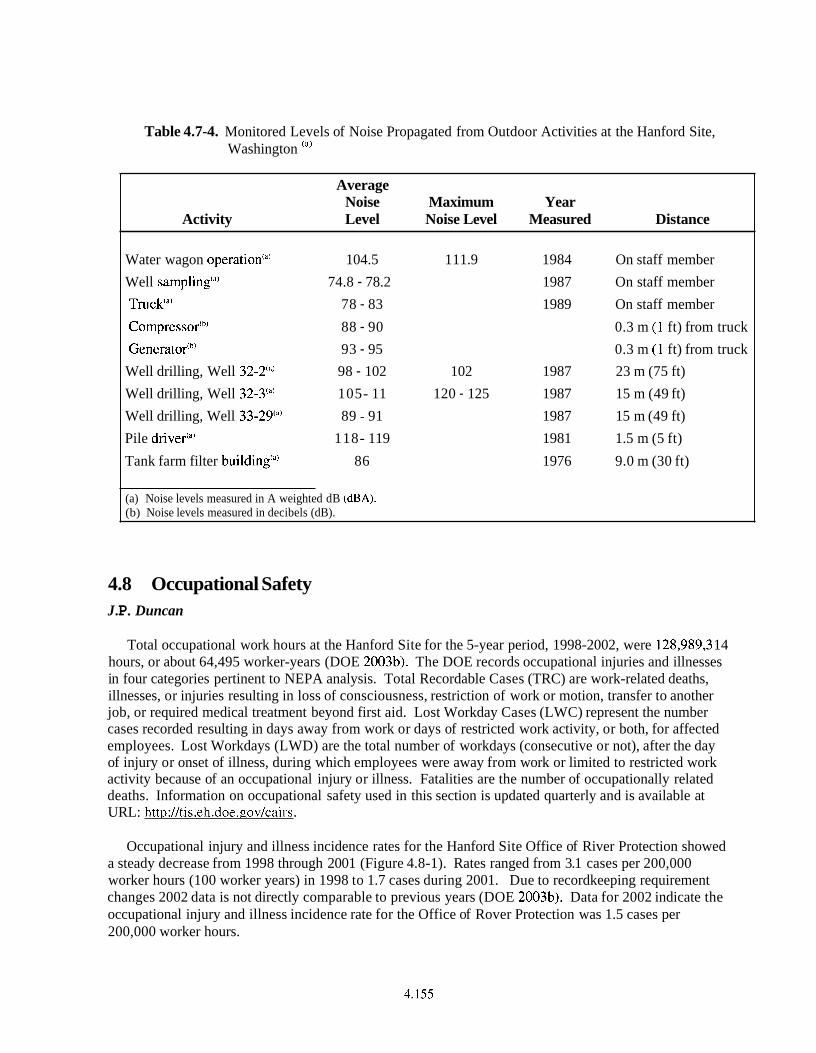
Table 4.7-4. Monitored Levels of Noise Propagated from Outdoor Activities at the Hanford Site, Washington (a'
Average Noise Maximum Year
Activity Level Noise Level Measured Distance
Water wagon operatiodaJ 104.5 1 1 1.9 1984 On staff member
Well sampling(a) 74.8 - 78.2 1987 On staff member
Truck(a) 78 - 83 1989 On staff member
Compre~sor'~' 88 - 90 0.3 m (1 ft) from truck
Generat~r'~' 93 - 95 0.3 m (1 ft) from truck
Well drilling, Well 32-2(a) 98 - 102 102 1987 23 m (75 ft)
Well drilling, Well 32-3(*' 105- 11 120 - 125 1987 15 m (49 ft)
Well drilling, Well 33-29(*) 89 - 91 1987 15 m (49 ft)
Pile driver(d) 118- 119 1981 1.5 m (5 ft)
Tank farm filter building(a) 86 1976 9.0 m (30 ft)
(a) Noise levels measured in A weighted dB (dBA). (b) Noise levels measured in decibels (dB).
4.8 Occupational Safety J. P. Duncan
Total occupational work hours at the Hanford Site for the 5-year period, 1998-2002, were 128,989,3 14 hours, or about 64,495 worker-years (DOE 2003b). The DOE records occupational injuries and illnesses in four categories pertinent to NEPA analysis. Total Recordable Cases (TRC) are work-related deaths, illnesses, or injuries resulting in loss of consciousness, restriction of work or motion, transfer to another job, or required medical treatment beyond first aid. Lost Workday Cases (LWC) represent the number cases recorded resulting in days away from work or days of restricted work activity, or both, for affected employees. Lost Workdays (LWD) are the total number of workdays (consecutive or not), after the day of injury or onset of illness, during which employees were away from work or limited to restricted work activity because of an occupational injury or illness. Fatalities are the number of occupationally related deaths. Information on occupational safety used in this section is updated quarterly and is available at URL: http://tis.eh.doe.~ov/cairs.
Occupational injury and illness incidence rates for the Hanford Site Office of River Protection showed a steady decrease from 1998 through 2001 (Figure 4.8-1). Rates ranged from 3.1 cases per 200,000 worker hours (100 worker years) in 1998 to 1.7 cases during 2001. Due to recordkeeping requirement changes 2002 data is not directly comparable to previous years (DOE 2003b). Data for 2002 indicate the occupational injury and illness incidence rate for the Office of Rover Protection was 1.5 cases per 200,000 worker hours.
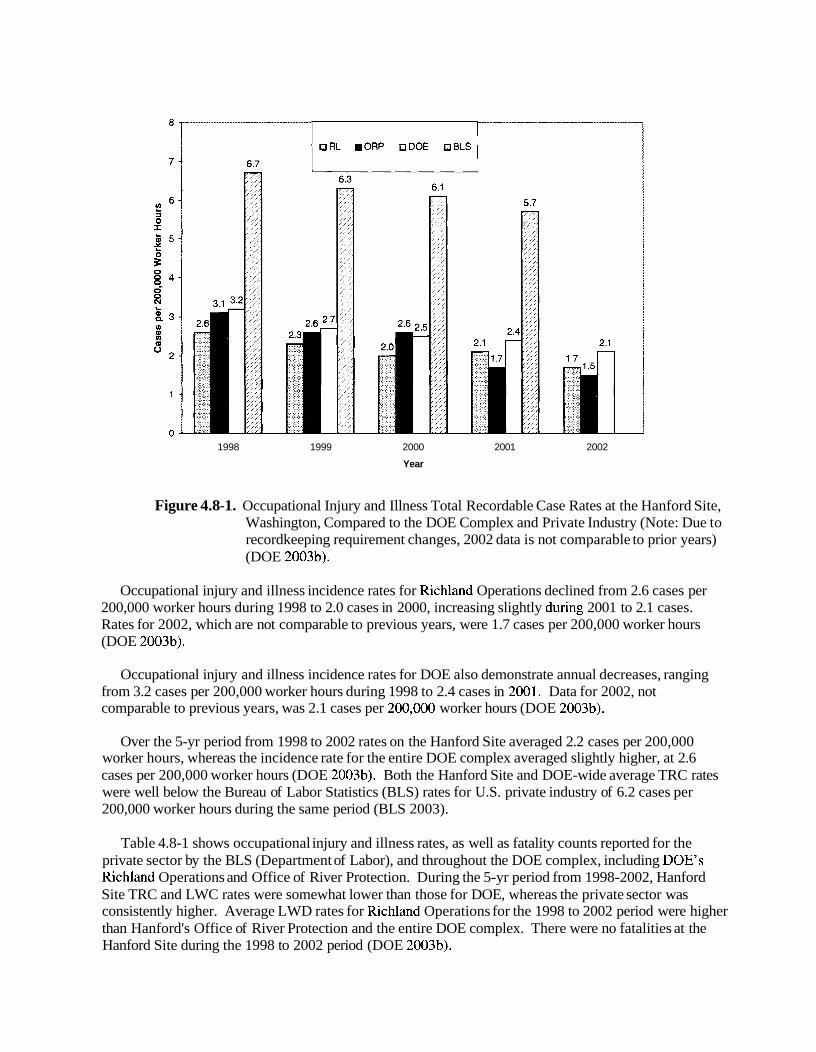
1998 1999 2000 2001 2002
Year
Figure 4.8-1. Occupational Injury and Illness Total Recordable Case Rates at the Hanford Site, Washington, Compared to the DOE Complex and Private Industry (Note: Due to recordkeeping requirement changes, 2002 data is not comparable to prior years) (DOE 2003b).
Occupational injury and illness incidence rates for Richland Operations declined from 2.6 cases per 200,000 worker hours during 1998 to 2.0 cases in 2000, increasing slightly d~lring 2001 to 2.1 cases. Rates for 2002, which are not comparable to previous years, were 1.7 cases per 200,000 worker hours (DOE 2003b).
Occupational injury and illness incidence rates for DOE also demonstrate annual decreases, ranging from 3.2 cases per 200,000 worker hours during 1998 to 2.4 cases in 2001. Data for 2002, not comparable to previous years, was 2.1 cases per 200,000 worker hours (DOE 2003b).
Over the 5-yr period from 1998 to 2002 rates on the Hanford Site averaged 2.2 cases per 200,000 worker hours, whereas the incidence rate for the entire DOE complex averaged slightly higher, at 2.6 cases per 200,000 worker hours (DOE 2003b). Both the Hanford Site and DOE-wide average TRC rates were well below the Bureau of Labor Statistics (BLS) rates for U.S. private industry of 6.2 cases per 200,000 worker hours during the same period (BLS 2003).
Table 4.8-1 shows occupational injury and illness rates, as well as fatality counts reported for the private sector by the BLS (Department of Labor), and throughout the DOE complex, including DOE'S Richland Operations and Office of River Protection. During the 5-yr period from 1998-2002, Hanford Site TRC and LWC rates were somewhat lower than those for DOE, whereas the private sector was consistently higher. Average LWD rates for Richland Operations for the 1998 to 2002 period were higher than Hanford's Office of River Protection and the entire DOE complex. There were no fatalities at the Hanford Site during the 1998 to 2002 period (DOE 2003b).
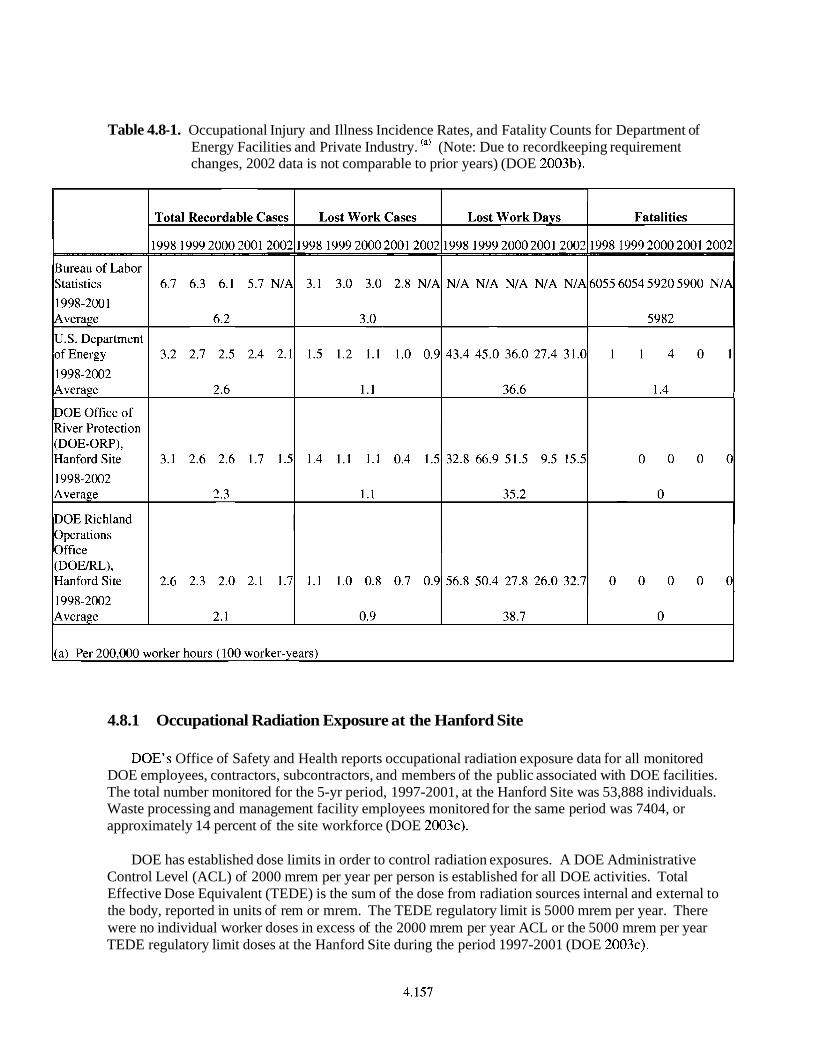
Table 4.8-1. Occupational Injury and Illness Incidence Rates, and Fatality Counts for Department of Energy Facilities and Private Industry. (") (Note: Due to recordkeeping requirement changes, 2002 data is not comparable to prior years) (DOE 2003b).
4.8.1 Occupational Radiation Exposure at the Hanford Site
DOE'S Office of Safety and Health reports occupational radiation exposure data for all monitored DOE employees, contractors, subcontractors, and members of the public associated with DOE facilities. The total number monitored for the 5-yr period, 1997-2001, at the Hanford Site was 53,888 individuals. Waste processing and management facility employees monitored for the same period was 7404, or approximately 14 percent of the site workforce (DOE 2003~).
DOE has established dose limits in order to control radiation exposures. A DOE Administrative Control Level (ACL) of 2000 mrem per year per person is established for all DOE activities. Total Effective Dose Equivalent (TEDE) is the sum of the dose from radiation sources internal and external to the body, reported in units of rem or mrem. The TEDE regulatory limit is 5000 mrem per year. There were no individual worker doses in excess of the 2000 mrem per year ACL or the 5000 mrem per year TEDE regulatory limit doses at the Hanford Site during the period 1997-2001 (DOE 2003~).
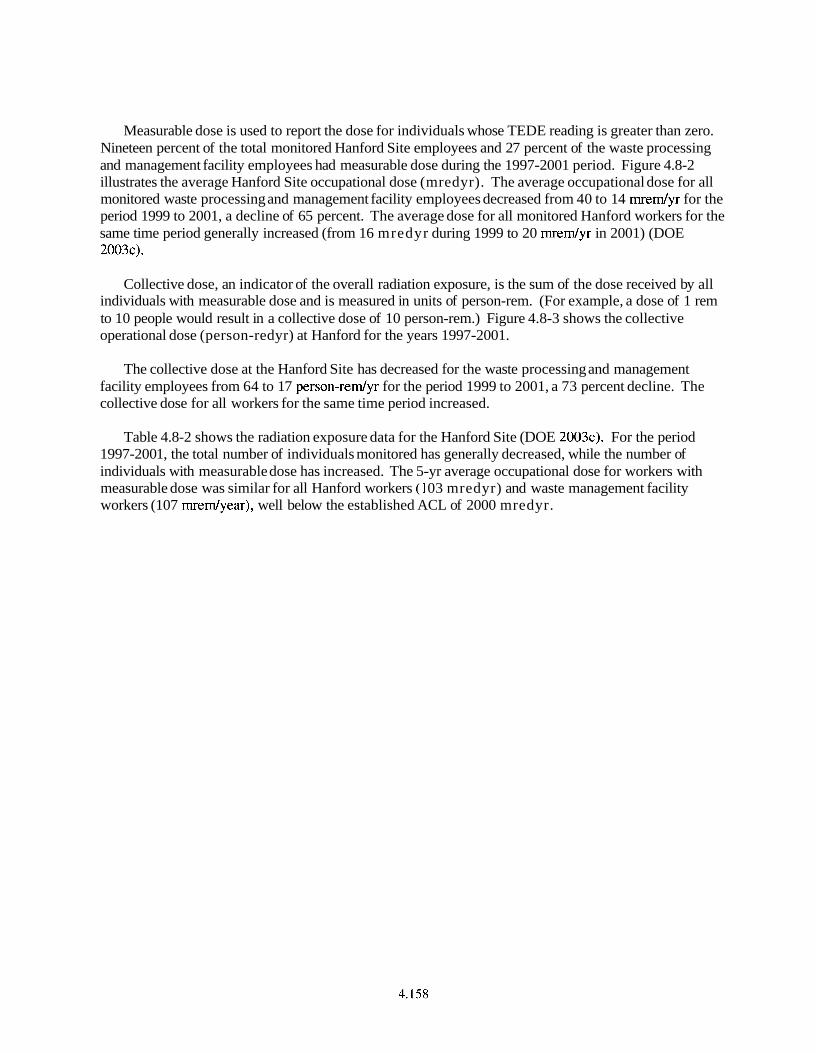
Measurable dose is used to report the dose for individuals whose TEDE reading is greater than zero. Nineteen percent of the total monitored Hanford Site employees and 27 percent of the waste processing and management facility employees had measurable dose during the 1997-2001 period. Figure 4.8-2 illustrates the average Hanford Site occupational dose (mredyr). The average occupational dose for all monitored waste processing and management facility employees decreased from 40 to 14 mredyr for the period 1999 to 2001, a decline of 65 percent. The average dose for all monitored Hanford workers for the same time period generally increased (from 16 mredyr during 1999 to 20 mredyr in 2001) (DOE 2003~).
Collective dose, an indicator of the overall radiation exposure, is the sum of the dose received by all individuals with measurable dose and is measured in units of person-rem. (For example, a dose of 1 rem to 10 people would result in a collective dose of 10 person-rem.) Figure 4.8-3 shows the collective operational dose (person-redyr) at Hanford for the years 1997-2001.
The collective dose at the Hanford Site has decreased for the waste processing and management facility employees from 64 to 17 person-redyr for the period 1999 to 2001, a 73 percent decline. The collective dose for all workers for the same time period increased.
Table 4.8-2 shows the radiation exposure data for the Hanford Site (DOE 2003~). For the period 1997-200 1, the total number of individuals monitored has generally decreased, while the number of individuals with measurable dose has increased. The 5-yr average occupational dose for workers with measurable dose was similar for all Hanford workers (1 03 mredyr) and waste management facility workers (107 mredyear), well below the established ACL of 2000 mredyr.
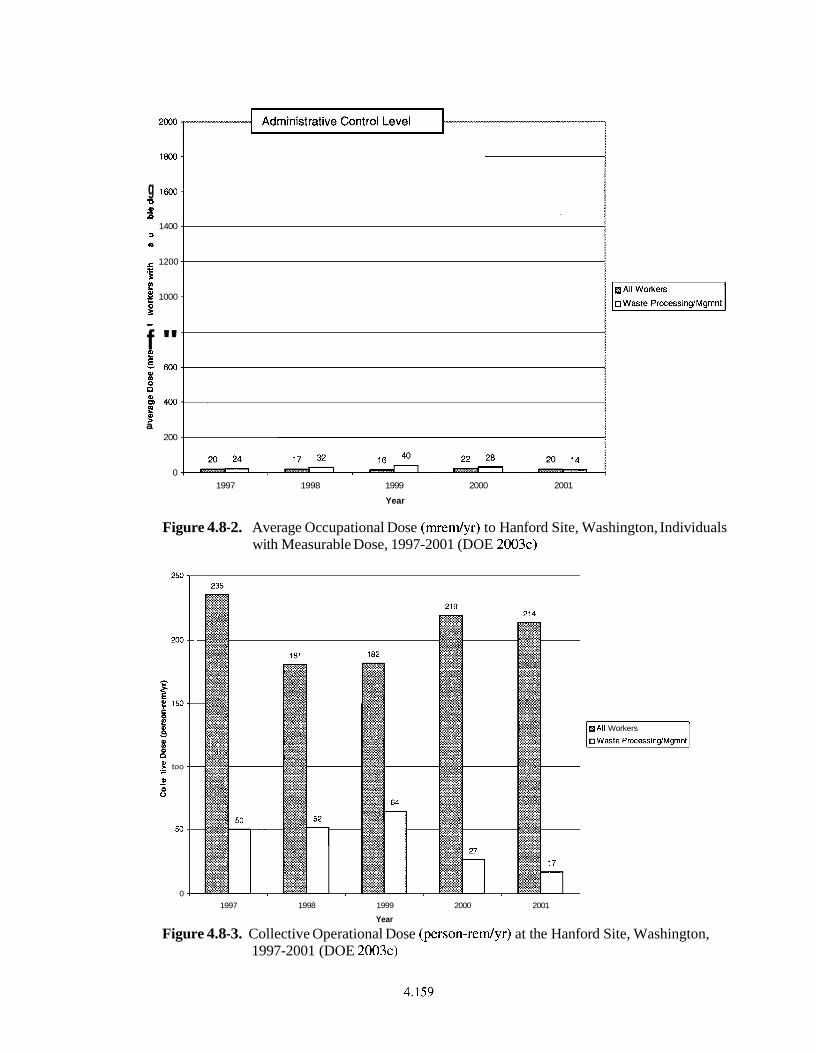
2000
1800
g 1600 u 0)
B 1400
3
a
1200 5 '5 r 4 1000
e - f " E - 600
g 0
& 400 e a
200
0
1997 1998 1999 2000 2001
Year
Figure 4.8-2. Average Occupational Dose (rnremlyr) to Hanford Site, Washington, Individuals with Measurable Dose, 1997-2001 (DOE 2003c)
all Workers
OWaste ProcessingIMgrnnt
I too .- - QJ - - S
0
1997 1998 1999 2000 2001
Year
Figure 4.8-3. Collective Operational Dose (person-remlyr) at the Hanford Site, Washington, 1997-2001 (DOE 2003~)
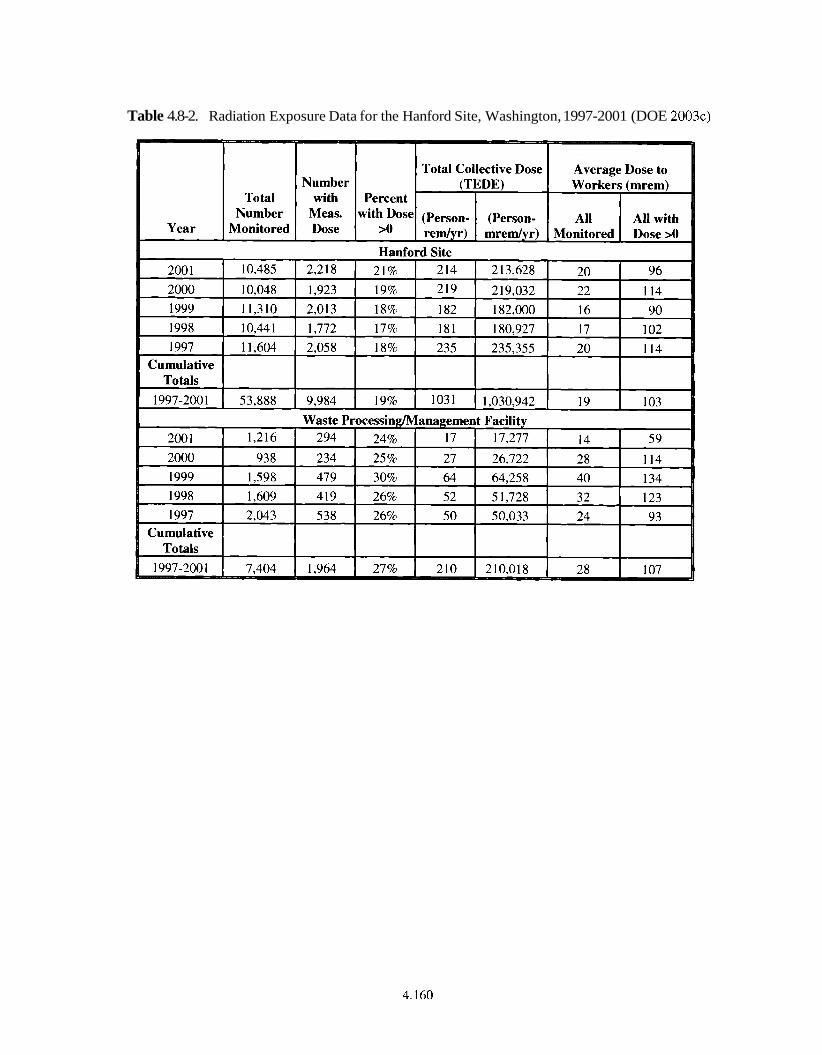
Table 4.8-2. Radiation Exposure Data for the Hanford Site, Washington, 1997-2001 (DOE 2003c)
References
40 CFR 201-21 1. Subchapter G. Protection of Environment: Noise Abatement Programs. U.S. Code of Federal Regulations.
40 CFR 50. National Primary and Secondary Ambient Air Quality Standards. U.S. Code of Federal Regulations.
40 CFR 61. National Emission Standards for Hazardous Air Pollutant. U.S. Code of Federal Regulations.
40 CFR 8 1.348. Designation of Areas for Air Quality Planning Purposes, Washington, Attainment Status Designations. U.S. Environmental Protection Agency.
40 CFR 81.434. Designation of Areas for Air Quality Planning Purposes, Washington, identification of Mandatory Class I Federal Areas Where Visibility Is an Important Value. U.S. Environmental Protection Agency.
50 CFR 17. Wildlife and Fisheries. United States Fish and Wildlife Service, Department of the Interior, Endangered and Threatened Wildlife and Plants. U.S. Code of Federal Regulations.
59 FR 7629. "Executive Order 12898: Federal Actions to Address ~nvironk&tal Justice in Minority Populations and Low-income Populations." Federal Register (February 16, 1994).
64 FR 14517. "Endangered and Threatened Species: Threatened Status for Two ESUs of Steelhead in Washington and Oregon." Federal Register (March 24, 1999).
64 FR 61615. "Record of Decision: Hanford Comprehensive Land-Use Plan Environmental Impact Statement (HCP EIS)." Federal Register (November 12, 1999).
65 FR 37253. "Establishment of the Hanford Reach National Monument." Federal Register (June 9, 2000).
66 FR 9663. "Clean Air Act Reclassification; Wallula, Washington Particulate Matter (PM-10) Nonattainment Area." U.S. Environmental Protection Agency.
16 USC 470, et seq. National Historic Preservation Act (NHPA) of 1966. Online at: http://www4.law.cornell.edu
16 USC 470aa, et seq. Archaeological Resources Protection Act of 1979. Online at: http://www4.1aw.cornell.edu
16 USC 153 1- 1544. Endangered Species Act (ESA) of 1973. Online at: http://www4.law.cornell.edu
25 USC 3001, et seq. Native American Graves Protection and Repatriation Act. Online at: http://www4.law.cornell.edu
42 USC 6901, et seq. Resource Conservation and Recovery Act (RCRA) of 1976. Online at: http://www4.law.cornell.edu
42 USC 7401, et seq. Clean Air Act. Online at: htt~://www.~~oaccess.~ov/uscode/index.html
42 USC 9601, et seq. Comprehensive Environmental Response, Compensation, and Liability Act (CERCLA) of 1980. Online at: http:Nwww4.law.corneIl.edu
Agnew, S.F. 1997. Hanford Tank Chemical and Radionuclide Inventories: HDW Model, Rev. 4. LA- UR-96-3860. Online at: http:Nlib-www.lanl.gov/1a-pubs/00326 1 8 1 .pdf
Allen, J.R.L. 1982. "Sedimentary Structures, their Character and Physical Basis." Developments in Sedimentology, 30A-30B, Elsevier, Amsterdsam.
Alwin, J.A. 1970. Clastic dikes of the Touchet beds, southeastern Washington. M.S. thesis. Washington State University, Pullman WA.
American Wind Energy Association. 2003. Washington State Wind Energy Development. Online at: http://www.awea.org/proiects/washington.html
Anderson, J.D. 1990. A History of the 200 Area Tank Farms. WHC-MR-0132, Westinghouse Hanford Company, Richland, Washington.
Andrefsky, Jr., W., L.L. Hale, and D.A. Harder. 1996. 1995 WSU Archaeological Block Survey of the Hanford 600 Area. Project Report No. 29. Center for Northwest Anthropology, Department of Anthropology, Washington State University, Pullman, Washington.
BAER 2000. 24 Command Fire Burn Area Emergency Rehabilitation (BAER) Plan. Northern States Burned Area Emergency Rehabilitation Team, U.S. Department of the Interior, Washington, D.C.
Baker, V.R., and R.C. Bunker. 1985. "Cataclysmic late Pleistocene flooding from glacial Lake Missoula: A review". Quat. Sci. Rev. 4: 1-4 1.
Bard, J.C. 1997. "Ethnographic /Contact Period (Lewis and Clark 1805 - Hanford Engineer Works 1943) of the Hanford Site, Washington." In National Register of Historic Places Multiple Property Documentation Form - Historic, Archaeological and Traditional Cultural Properties of the Hanford Site, Washington. DOERL-97-02. Richland, Washington.
Bauer, H.H., J.J. Vaccaro, and R.C. Lane. 1985. Maps Showing Ground- Water Levels in the Columbia River Basalt and Overlying Materials, Spring 1983, Southeastern Washington. Water Resources Investigation Report 84-4360, U.S. Geological Survey, Tacoma, Washington.
Beak Consultants Inc. 1980. Aquatic Ecological Studies Near WNP- 1, 2 and 4. August 1978-March 1980. WPPSS Columbia River Ecology Studies, Vol. 7, prepared for Washington Public Power Supply System by Beak Consultants Inc., Portland, Oregon.
Becker, J.M. 1993. A Preliminary Survey of Selected Structures on the Hanford Site for Townsend's Big- Eared Bat (Plecotus townsendii). PNL-8916, Pacific Northwest Laboratory, Richland, Washington.
Belnap, J., J.H. Kaltenecker, R. Rosentreter, J. Williams, S. Leonard, and D. Eldrige. 2001. Biological Soil Crusts: Ecology and Management. Technical Reference 1730-2. Bureau of Land Management, Denver, Colorado.
Bisping, L.E. 2000. Hanford Site Environmental Surveillance Data Report for Calendar Year 1999. PNNL-13230, App. 1 , Pacific Northwest National Laboratory, Richland, Washington.
Bjornstad, B.N., K.R. Fecht, and C.J. Pluhar. 2001. "Long history of Pre-Wisconsin, Ice Age cataclysmic floods: evidence from southeastern Washington State". Journal of Geology 109:695-713.
BLS (see Bureau of Labor Statistics)
Brandt, C.A., C.E. Cushing, W.H. Rickard, N.A. Cadoret, and R. Mazaika. 1993. Biological Resources of the 300-FF-5 Operable Unit. WHC-SD-EN-TI-121, Westinghouse Hanford Company, Richland, Washington.
Bretz, J H., H.T.U. Smith, and G.E. Neff. 1956. "Channeled Scabland of Washington: New Data and Interpretations". Geol. Soc. of Am. Bul. 67:957-1049.
Brown, R.E. 1970. Interrelationships of Geologic Formations and Processes Affecting Ecology as Exposed at Rattlesnake Springs, Hanford Project. BNWL-B-29, Pacific Northwest Laboratories, Richland, Washington.
Brown, R.E. 1979. A Review of Water Well Data from the Unconfined Aquifer in the Eastern and Southern Parts of the Pasco Basin. RHO-BWI-C-56, Rockwell Hanford Operations, Richland, Washington.
Bureau of Labor Statistics (BLS). 2003. Industry Injury and Illness Data. Bureau of Labor Statistics, U.S. Department of Labor, Washington DC. Online at: http://www.bls.~ov/iif/oshsutn.htm
Cadwell, L.L. 1994. Wildlife Studies on the Hanford Site: 1993 Highlights Report. PNL-9380, Pacific Northwest Laboratory, Richland, Washington.
Cardenas, A., J. Lewinsohn, C. Auger, J.L. Downs, L.L. Cadwell, and R. Burrows. 1997. Characterization of a Sagebrush (Artemisia tridentata spp. wyomingensis) Die-Off on the Hanford Site. PNNL-11673, Pacific Northwest National Laboratory, Richland, Washington.
Census (See U.S. Census Bureau).
CEQ (see Council on Environmental Quality).
Chatters, J.C. 1982. "Prehistoric settlement and Land Use in the Dry Columbia Basin." Northwest Anthropological Research Notes 16: 125- 147.
Chatters, J.C., and N.A. Cadoret. 1990. Archeological Survey of the 200-East and 200-West Areas, Hanford Site, Washington. PNL-7264, Pacific Northwest Laboratory, Richland, Washington.
Chatters, J.C., H.A. Gard, and P.E. Minthorn. 1992. Fiscal Year 1991 Report on Archaeological Surveys of the 100 Areas, Hanford Site, Washington. PNL-8143, Pacific Northwest Laboratory, Richland, Washington.
CNSS (see Council of the National Seismic System).
Connelly, M.P., B.H. Ford, and J.V. Borghese. 1992a. Hydrogeologic Model for the 200 West Groundwater Aggregate Area. WHC-SD-EN-TI-014, Rev. 0, Westinghouse Hanford Company, Richland, Washington.
Connelly, M.P., B.H. Ford, J.W. Lindberg, S.J. Trent, C.D. Delaney, and J.V. Borghese. 1992b. Hydrogeologic Model for the 200 East Groundwater Aggregate Area. WHC-SD-EN-TI-019, Westinghouse Hanford Company, Richland, Washington.
Coopey, R.W. 1953. The Abundance of the Principal Crustacea of the Columbia River and the . Radioactivity they Contain. HW-25 1, Hanford Atomic Products Operation, Richland, Washington.
Corps (see U.S. Army Corps of Engineers).
Council on Environmental Quality (CEQ). 1997. Environmental Justice. Guidance Under the National Environmental Policy Act. Executive Office of the President, Washington, D.C.
Council of the National Seismic System (CNSS). 2001. On-line Earthquake Catalog. Council of the National Seismic System. Online at: http://www.quake.~eo.berkelev.eddcnss
Cushing, C.E., Jr. 1967a. "Concentration and Transport of 3 2 ~ and 6 5 ~ by Columbia River Plankton." Limnology and Oceanography 12:330-332.
Cushing, C.E., Jr. 1967b. "Periphyton Productivity and Radionuclide Accumulation in the Columbia River, Washington, USA." Hydrobiologia 29: 125-1 39.
Cushing, C.E., and E.G. Wolf. 1982. "Organic Energy Budget of Rattlesnake Springs, Washington." Am. Midl. Nut. 107(2): 404-407.
Cushing, C.E., and E.G. Wolf. 1984. "Primary Production in Rattlesnake Springs, a Cold Desert Spring- Stream." Hydrobiologia 1 14:229-236.
Cushing, C.E., C.D. McIntire, J.R. Sedell, K.W. Cummins, G.W. Minshall, R.C. Petersen, and R.L. Vannote. 1980. "Comparative Study of Physical-Chemical Variables of Streams Using Multivariate Analyses." Arch. Hydrobiologia 89(3):343-352.
Daubenmire, R. 1970. Steppe Vegetation of Washington. Technical Bulletin 62, Experimental Station, Washington State University, Pullman, Washington.
Dauble, D.D., and D.G. Watson. 1990. Spawning and Abundance of Fall Chinook Salmon (Oncorhynchus tshawytscha) in the Hanford Reach of the Columbia River, 1948-1988. PNL-7289, Pacific Northwest Laboratory, Richland, Washington.
Dauble, D.D., and D.G. Watson. 1997. Status of Fall Chinook Salmon Populations in the Mid Columbia River, 1948-1 992. North American Journal of Fisheries Management 17: 283-300.
Daugherty, R.D. 1952. "Archaeological Investigations of O'Sullivan Reservoir, Grant County, Washington." American Antiquity 17: 274-278.
Davis, J.J., and C.L. Cooper. 195 1. Effect of Hanford Pile EfSluent upon Aquatic Invertebrates in the Columbia River. HW-20055, Hanford Works, Richland, Washington.
Dirkes, R.L. 1993. Columbia River Monitoring: Distribution of Tritium in Columbia River Water at the Richland Pumphouse. PNL-853 1, Pacific Northwest Laboratory, Richland, Washington.
Dirkes, R.L., and R.W. Hanf. 1998. Hanford Site Environmental Report for Calendar Year 1997. PNNL-11795, Pacific Northwest National Laboratory, Richland, Washington.
DOC (see U.S. Department of Commerce).
DOE (see U.S. Department of Energy).
DO1 (see U.S. Department of the Interior).
DOL (see U.S. Department of Labor Employment and Training Administration).
Dorian, J.J., and V.R. Richards. 1978. Radiological Characterization of the Retired 100 Areas. UNI- 946, United Nuclear Industries, Inc., Richland, Washington.
Downs, J.L., W.H. Rickard, C.A. Brandt, L.L. Cadwell, C.E. Cushing, D.R. Geist, R.M. Mazaika, D.A. Neitzel, L.E. Rogers, M.R. Sackschewsky, and J.J. Nugent. 1993. Habitat Types on the Hanford Site: Wildlife and Plant Species of Concern. PNL-8942, Pacific Northwest Laboratory, Richland, Washington.
Drost, B.W., K.M. Schurr, and W.E. Lum 11. 1989. Selected Ground-Water Information for the Pasco Basin and Adjacent Areas, Washington, 1986-1989. Open-File Report 89-228, U.S. Geological Survey, Tacoma, Washington.
Drucker, P. 1948. Appraisal of the Archaeological Resources of the McNary Reservoir, Oregon- Washington. Report on file, Columbia Basin Project, River Basin Survey, Smithsonian Institution, Washington, D.C.
Eberhardt, L.E., R.E. Anthony, and W.H. Rickard. 1989. "Survival of Juvenile Canada Geese during the Rearing Period." Journal of Wildlife Management 53:372-377.
Ecology. (See Washington State Department of Ecology).
Emery, R.M., and M.C. McShane. 1978. Comparative Ecology of Nuclear Waste Ponds and Streams on the Hanford Site. PNL-2499, Pacific Northwest Laboratory, Richland, Washington.
Emery, R.M., and M.C. McShane. 1980. "Nuclear Waste Ponds and Streams on the Hanford Site: An Ecological Search for Radiation Effects." Health Physics 38:787-809.
EPA (see U.S. Environmental Protection Agency)
ERDA (see U.S. Energy Research and Development Administration).
ERTEC. 1981. Cultural Resources Survey and Exploratory Excavations for the Skagit-Hanford Nuclear Power Project. ERTEC Northwest, Seattle, Washington.
Executive Order of April 9, 1872, Establishing the Confederated Tribes of the Colville Indian Reservation.
Fayer M.J., G.W. Gee, M.L. Rockhold, M.D. Freshley, and T.B. Walters. 1996. "Estimating Recharge Rates for a Groundwater Model using a GIs." Journal of Environmental Quality 25: 5 10-5 18.
Fecht, K.R., S.P. Reidel, and A.M. Tallman. 1987. Paleodrainage of the Columbia River System on the Columbia Plateau of Washington State - A Summary. Washington Division of Geology and Earth Resources Bulletin 77.
Fecht, K.R., K.A. Lindsey, B.N. Bjornstad, D.G. Horton, G.V. Last, and S.P. Reidel. 1998. An Atlas of Clastic Injection Dikes of the Pasco Basin and Vicinity. BHI-0 1 103. Online at: http://www.erc.rl.gov/-pgs/readroom/BHI/Ol 103/Intro.pdf
Fecht, K.R., K.A. Lindsey, B.N. Bjornstad, D.G. Horton, G.V. Last, and S.P. Reidel. 1999. Clastic Injection Dikes of the Pasco Basin and Vicinity - Geologic Atlas Series. BHI-01103, Rev. 0. Online at: http://www.erc.rl.~ov/-p~s/ClasticDikes.pdf
Fitzner, R.E., and R.H. Gray. 1991. "The Status, Distribution, and Ecology of Wildlife on the U.S. DOE Hanford Site: A Historical Overview of Research Activities." Environ. Monit. Assess. 18:173-202.
Fitzner, R.E., and S.G. Weiss. 1994. Bald Eagle Site Management Plan for the Hanford Site, South Central Washington. DOEIRL-94-150, U.S. Department of Energy, Richland, Washington.
Fitzner, R.E., S.G. Weiss, and J.A. Stegen. 1994. Threatened and Endangered Wildlife Species of the Hanford Site Related to CERCLA Characterization Activities. WHC-EP-05 13, Westinghouse Hanford Company, Richland, Washington.
Freshley, M.D., and M.J. Graham. 1988. Estimation of Ground-Water Travel Time at the Hanford Site: Description, Past Work, and Future Needs. PNL-6328, Pacific Northwest National Laboratory, Richland, Washington.
Frest, T.J., and E.J. Johannes. 1993. Mollusc Survey of the Hanford Site, Benton and Franklin Counties, Washington. PNL-8653, Pacific Northwest Laboratory, Richland, Washington.
Gaines, W.E. 1987. Secondary Production of Benthic Insects in Three Cold Desert Streams. PNL-6286, Pacific Northwest Laboratory, Richland, Washington.
Gaines, W.L., C.E. Cushing, and S.D. Smith. 1992. "Secondary Production Estimates of Benthic Insects in Three Cold Desert Streams." Great Basin Naturalist 52(1): 1 1-24.
Gee, G.W., M.J. Fayer, M.L. Rockhold, and M.D. Campbell. 1992. "Variations in Recharge at the Hanford Site." Northwest Science 66(4): 237.
Geomatrix. 1994. Probabilistic Seismic Hazard Assessment DOE Hanford Site, Washington. Prepared for Westinghouse Hanford Company. WHC-SD-W236A-TI-002, Westinghouse Hanford Company, Richland, Washington.
Geomatrix. 1996. Probabilistic Seismic Hazard Analysis DOE Hanford Site, Washington. Prepared for Westinghouse Hanford Company. WHC-SD-W236A-TI-002, Rev. 1, Westinghouse Hanford Company, Richland, Washington.
Gephardt, R.E., P.A. Eddy, R.C. Amett, and G.A. Robinson. 1976. Geohydrologic Study of the West Luke Basin. ARH-CD-775, Atlantic Richfield Hanford Company, Richland, Washington.
Gephart, R.E. 1999. A Short History of Plutonium Production and Nuclear Waste Generation, Storage, and Release at the Hanford Site. PNNL-SA-32152, Pacific Northwest National Laboratory, Richland, Washington.
Gilmore, T.J., D.R. Newcomer, S.K. Wurstner, and F.A. Spane Jr. 1992. Calculation of Groundwater Discharge to the Columbia River in the 100-N Area. PNL-8057, Pacific Northwest Laboratory, Richland, Washington.
Glantz, C.S., and M.M. Islam. 1988. The Data Collection Component of the Hanford Meteorology Monitoring Program. PNL-6684, Pacific Northwest Laboratory, Richland, Washington.
Glantz, C.S., M.N. Schwartz, K.W. Burk, R.B. Kasper, M.W. Ligotke, and P.J. Perrault. 1990. Climatological Summary of Wind and Temperature Data for the Hanford Meteorologj~ Monitoring Network. PNL-747 1, Pacific Northwest Laboratory, Richland, Washington.
Graham, M.J., M.D. Hall, S.R. Straight, and W.R. Brown. 1981. Hydrology of the Separations Area. RHO-ST-42, Rockwell Hanford Operations, Richland, Washington.
Graham, M.J., G.V. Last, and K.R. Fecht. 1984. An Assessment of Aquifer Intercommunication with B Pond-Gable Mountain Pond Area of the Hanford Site. RHO-RE-ST- 12P, Rockwell Hanford Operations, Richland, Washington.
Gray, R.H., and D.D. Dauble. 1977. "Checklist and Relative Abundance of Fish Species from the Hanford Reach of the Columbia River." Northwest Science 5 1 :208-2 15.
Greene, G.S. 1975. Prehistoric Utilization of the Channeled Scablands of Eastern Washington. Ph.D. Dissertation, Department of Anthropology, Washington State University, Pullman, Washington.
Greengo, R.E. 1982. Studies in Prehistory: Priest Rapids and Wanapum Reservoir Areas, Columbia River, Washington. Department of Anthropology, University of Washington, Seattle, Washington.
Hajek, B.F. 1966. Soil Survey: Hanford Project in Benton County, Washington. BNWL-243, Pacific Northwest Laboratories, Richland, Washington.
Hall, J.A. (ed.). 1998. Biodiversity Inventory and Analysis of the Hanford Site, 1997 Annual Report. The Nature Conservancy of Washington, Seattle, Washington.
Hanlon, B.M. 2001. Waste Tank summary Report for Month Ending January 31, 2001. HNF-EP-0182- 154. Online at: http://www.doe.gov/bridge
Hanson, W.C., and R.L. Browning. 1959. "Nesting Studies of Canada Geese on the Hanford Reservation, 1953-1 956." Journal of Wildlife Management 23: 129-1 37.
Harris, S., and B.L. Harper. 1997. A Native American Exposure Scenario. Society for Risk Analysis, 17 (6): 789-795.
Hartman, M.J., ed. 2000. Hanford Site Groundwatec Setting, Sources, and Methods. PNNL- 1 3080. Online at: http://hanford-site.~nl.gov/g.roundwater/reports/gwset99/html/startl .htm
Hartman, M.J., and R.E. Peterson. 1992. Hydrologic Information Summary for the Northern Hanford Site. WHC-SD-EN-TI-023, Westinghouse Hanford Company, Richland, Washington.
Hartman, M.J., and K.A. Lindsey. 1993. Hydrogeology of the 100-N Area, Hanford Site, Washington. WHC-SD-EN-EV-027, Rev. 0, Westinghouse Hanford Company, Richland, Washington.
Hartman, M.J., L.F. Morasch, and W.D. Webber, eds. 2001. Hanford Site Groundwater Monitoring for Fiscal Year 2000. PNNL-13404. Online at: http://hanford- site.pnl.nov/groundwater/report~/nwrep00/start.htm
Hartshorn D.C., S.P. Reidel, and A.C. Rohay. 2002. Annual Hanford Seismic Report for Fiscal Year 2002. PNNL-11557-20, Pacific Northwest National Laboratory, Richland, WA.
Hoitink, D.J., K.W. Burk, J.V. Ramsdell, and W.J. Shaw. 2003. Hanford Site Climatological Data Summary 2002 with Historical Data. PNNL-14242, Pacific Northwest National Laboratory, Richland, Washington.
Horton, D.G., and R.R. Randall. 2000. Results of 1999 Spectral Gamma-Ray and Neutron Moisture Monitoring of Boreholes at Specific Retention Facilities In the 200 East Area, Hanford Site. PNNL- 13077. Online at: http:llwww.osti.novibridge/product.biblio.isp?osti id=750263
Jamison, J.D. 1982. Standardized Input for Hanford Environmental Impact Statements Part 11: Site Descriptions. PNL-3509, Pt. 2, Pacific Northwest Laboratory, Richland, Washington.
Jenkins, O.P. 1922. Underground Water Supply of the Region About White Bluffs and Hanford. Bulletin No. 26, Division of Geology, State of Washington Department of Conservation and Development, Olympia, Washington.
Jensen, E.J. 1987. An Evaluation of Aquifer Intercommunication Between the Unconfined and Rattlesnake Ridge Aquifers on the Hanford Site. PNL-63 13, Pacific Northwest Laboratory, Richland, Washington.
Johansen, J.R., J. Ashley, and W.R. Rayburn. 1993. Effects of Rangefire on Soil Algal Crusts in Semiarid Shrub-Steppe of the Lower Columbia Basin and their Subsequent Recovery. Great Basin Naturalist 53(1): 73-88.
Johnson, V.G., F.N. Hodges, and S.P. Reidel. 1992. "Arid Environment Aquifers: An Example from South Central Washington." Geological Society of America (ABS) 24(5):36.
Johnson, V.G., C.J. Chou, and J.W. Lindberg. 1995. Groundwater Monitoring and Assessment Plan for the 100-K Area Fuel Storage Basins. WHC-SD-EN-AP-174, Westinghouse Hanford Company, Richland, WA.
Jones, T.E., R. Khaleel, D.A. Myers, J.W. Shade, and M.I. Wood. 1998. Summary and Evaluation of Hanford Site Tank Farm Subsu$ace Contamination. HNF-2603, Rev. 0, Lockheed Martin Hanford, Richland, Washington.
Kincaid, C.T., M.P. Bergeron, C.R. Cole, M.D. Freshley, N.L. Hassig, V.G. Johnson, D.I. Kaplan, R.J. Serne, G.P. Streile, D.L. Strenge, P.D. Thorne, L.W. Vail, G.A. Whyatt, and S.K. Wurstner. 1998. Composite Analysis for Low-Level Waste Disposal in the 200 Areas Plateau of the Hanford Site. PNNL- 11 800, Pacific Northwest National Laboratory, Richland, Washington.
Kipp, K.L., and R.D. Mudd. 1973. Collection and Analysis of Pump Test Data for Transmissivity Values. BNWL-1709, Pacific Northwest Laboratories, Richland, Washington.
Krieger, H.W. 1928. "A Prehistoric Pithouse Village Site at Wahluke, Grant County, Washington." Proc. U.S. Natl. Mus. 73: 1-29.
Landeen, D. (ed.). 1996. Wetes pe m'e wes - I am of this land. [Wildlife of the Hanford Site]. Confluence Press, Lewiston, Idaho.
Landeen, D.S., A.R. Johnson, and R.M. Mitchell. 1992. Status of Birds at the Hanford Site in Southeastern Washington. WHC-EP-0402, Westinghouse Hanford Company, Richland, Washington.
Landeen, D.S., M.R. Sackschewsky, and S. Weiss. 1993. 1OOAreas CERCLA Ecological Investigations. WHC-EP-0620, Westinghouse Hanford Company, Richland, Washington.
Last, G.V., B.N. Bjornstad, M.P. Bergeron, D.W. Wallace, D.R. Newcomer, J.A. Schremke, M.A. Charnness, C.S. Cline, S.P. Airhart, and J.S. Wilbur. 1989. Hydrogeology of the 200 Areas Low Level Burial Grounds - An Interim Report. PNL-6820, Pacific Northwest Laboratory, Richland, Washington.
Leonhardy, F.C., and D.G. Rice. 1970. "A Proposed Culture Typology for the Lower Snake River Region, Southeastern Washington." Northwest Anthropological Research Notes 4: 1-29.
Liikala, T.L., R.L. Aaberg, N.J. Aimo, D.J. Bates, T.J. Gilmore, E.J. Jensen, G.V. Last, P.L. Oberlander, K.B. Olsen, K.R. Oster, L.R. Roome, J.C. Simpson, S.S. Teel, and J. Westergard. 1988. Geohydrologic Characterization of the Area Surrounding the 183-H Solar Evaporation Basins. PNL-6728, Pacific Northwest Laboratory, Richland, Washington.
Lindberg, J.W. 1993a. Geology of the 100-B/C Area, Hanford Site, South-Central Washington. WHC- SD-EN-TI-133, Westinghouse Hanford Company, Richland, Washington.
Lindberg, J.W. 1993b. Geology of the 100-KArea, Hanford Site, South-Central Washington. WHC-SD- EN-TI-155, Westinghouse Hanford Company, Richland, Washington.
Lindsey, K.A. 1992. Geology of the Northern Part of the Hanford Site: An Outline of Data Sources and the Geologic Setting of the 100 Areas. WHC-SD-EN-TI-011, Rev. 0, Westinghouse Hanford Company, Richland, Washington.
Lindsey, K.A. 1995. Miocene- to Pliocene-Aged suprabasalt sediments of the Hanford Site, south- central Washington. BHI-00184, Bechtel Hanford, Inc., Richland, Washington.
Lindsey, K.A. 1996. The Miocene to Pliocene Ringold Formation and Associated Deposits of the Ancestral Columbia River System, South-central Washington and North-central Oregon. Washington Division of Geology and Earth Resources Open File Report 96-8, Washington State Department of Natural Resources, Olympia, Washington.
Lindsey, K.A., and G.K. Jaeger. 1993. Geologic Setting of the 100-HR-3 Operable Unit, Hanford Site, South-Central Washington. WHC-SD-EN-TI- 132, Westinghouse Hanford Company, Richland, Washington.
Link, S.O., B.D. Ryan, J.L. Downs, L.L. Cadwell, J.A. Soll, M.A. Hawke, and J. Ponzetti. 2000. "Lichens and Mosses on Shrub-steppe Soils in Southeastern Washington." Northwest Science, Vol. 74, No. 1.
LMEA (see Washington State Labor Market and Economic Analysis).
Lupher, R.L. 1944. "Clastic Dikes of the Columbia Basin Region, Washington and Idaho." Geological Society of America Bulletin, 55: 143 1-1462.
Malde, H.E. 1968. The Catastrophic Late Pleistocene Bonneville Flood in the Snake River Plain, Idaho. Professional Paper 596, U.S. Geological Survey, Washington, D.C.
McCormack, W.D., and J.M.V. Carlile. 1984. Investigation of Ground- Water Seepage from the Hanford Shoreline of the Columbia River. PNL-5289, Pacific Northwest Laboratory, Richland, Washington.
McMahon, W.J., and R.E. Peterson. 1992. Estimating Aquifer Hydraulic Properties Using the Ferris Method, Hanford Site, Washington. DOERL-92-64, U.S. Department of Energy, Richland, Washington.
Meinhardt, C.C., and J.C. Frostenson. 1979. Current Status of the 200Area Ponds. RHO-CD-798, Rockwell Hanford Operations, Richland, Washington.
Mize, A.L. 1993. Differential Utilization of Allochthonous and Autochthonous Carbon By Aquatic Insects of Two Shrub-Steppe Desert Spring-Streams: A Stable Carbon Isotope Analysis and Critique of the Method. PNL-8684, Pacific Northwest Laboratory, Richland, Washington.
Murray, C.J., D.G. Horton, A.L. Ward, and G.W. Gee. 2002. Hydrogeologic Influence of Clastic Dikes on Vadose Zone Transport. Sec. 3.3.4, p. 3.64-3.67,3.82-3.86. In Hanford Site Groundwater Monitoring for Fiscal Year 2001. PNNL-13788, Pacific Northwest National Laboratory, Richland, Washington. C I
Murray, C.J., A.L. Ward, and J.L. Wilson. 2003. Influence of Clastic Dikes on Vertical Migration of Contaminants in the Vadose Zone at Hanford. USDOE Environmental Management Science Final Report, Project 70 193.
Napier, B.A., R.A. Peloquin, D.L. Strenge, and J.V. Ramsdell. 1998. GENII- The Hanford Environmental Radiation Dosimetry Software System. PNL-6584 (3 vols), Pacific Northwest National Laboratory, Richland, Washington.
Neitzel, D.A., T.L. Page, and R.W. Hanf, Jr. 1982a. "Mid-Columbia River Microflora." J. Freshwater Ecology l(5): 495-505.
Neitzel, D.A., T.L. Page, and R.W. Hanf, Jr. 1982b. "Mid-Columbia River Zooplankton." Northwest Science 57:112-118.
Newcomb, R.C. 1962. "Hydraulic Injection of Clastic Dikes in the Touchet Beds, Washington, Oregon, and Idaho." Geological Society of the Oregon Country Geological Newsletter 28(10):70.
Newcomb, R.C., J.R. Strand, and F.J. Frank. 1972. Geology and Ground-Water Characteristics of the Hanford Reservation of the U.S. Atomic Energy Commission, Washington. Professional Paper 7 17, U.S. Geological Survey, Washington, D.C.
Newcomer, D.R., K.D. Pohlod, and J.P. McDonald. 1991. Water-Table Elevations on the Hanford Site, 1990. PNL-7693, Pacific Northwest Laboratory, Richland, Washington.
Northwest Power Planning Council (NPPC). 1998. Revised Fourth Northwest Conservation and Electric Power Plan, document 98-22. July 1998. Northwest Power Planning Council, Portland Oregon. Online at: http:Nwww.nwcounci1.orgllibrarv/l998/98-221
Northwest Power Planning Council (NPPC). 2003. Existing Generating Projects. April 2003. Northwest Power Planning Council, Portland Oregon. Online at: http://www.nwcouncil.org/energy/powersupply/Default.htm
NPPC (see Northwest Power Planning Council).
NRC (see U.S. Nuclear Regulatory Commission).
Obermeier, S.F. 1996. "Use of Liquefaction-Induced Features for Seismic Analysis - An Overview of How Seismic Liquefaction Features Can be Distinguished from Other Features and How Their Regional Distribution and Properties of Source Sediment Can be Used to Infer the Location and Strength of Holocene Paleo-Earthquakes." Engineering Geology, 44: 1-76.
O'Connor, J.E. 1993. "Hydrology, Hydraulics, and Geomorphology of the Bonneville Flood. Geol. Soc. Am. Spec. Paper 274.83 p.
O'Connor, J.E., and V.R. Baker. 1992. "Magnitudes and Implications of Peak Discharges from Glacial Lake Missoula ". Geol. Soc. of Am. Bul. 104:267-279.
OFM (see Office of Financial Management).
Office of Financial Management (OFM). 2002a. Median Household Income by County: 1989 to 2000 and Forecast for 2002. Office of Financial Management, Forecasting Division, Olympia, Washington. Online at: http://www.ofn-~.wa.aov/pop/poptrends/index.ht~n
Office of Financial Management (OFM). 2002b. Population of Cities, Towns and Counties: April 1, 2000 to April 1, 2002. Office of Financial Management, Forecasting Division, Olympia, Washington. Online at: http:llwww.ofm.wa.go~~/pop/poptrends/index.htm
Office of Financial Management (OFM). 2002c. Washington State April I Housing Estimates for Cities, Towns, and Counties. Office of Financial Management, Forecasting Division, Olympia, Washington. Online at: http://www.ofm.wa.gov/pop/housing1i11dex.htm
Office of Financial Management (OFM). 2003. Intercensal and Postcensal Estimates of County Population by Age and Sex, 1980-2002. Office of Financial Management, Forecasting Division, Olympia, Washington. Online at: htt~://www.ofm.wa.~ov/~o~/coagemf/index.htm
Office of Superintendent of Public Instruction (OSPI). 2003. 2002-2003 Public and Private School Enrollment Summary (Report 1345A-by county, district, building, and ethnicity). Office of Superintendent of Public Instruction, Olympia, Washington. Online at: htt~://www.kl2.wa.us/dataadmin/
OSPI (see Office of Superintendent of Public Instruction).
OTED (see Washington State Office of Trade and Economic Development).
Page, T.L., and D.A. Neitzel. 1978. "Columbia River Benthic Macrofauna and Microfauna Near WNP 1, 2, and 4: January through December 1977." In Aquatic Ecological Studies Near WNP 1, 2, and 4, January through December 1977, WPPSS Columbia River Ecology Studies, Vol. 5, Section 4. Battelle, Pacific Northwest Laboratories, Richland, Washington.
Page, T.L., D.A. Neitzel, and R.W. Hanf. 1979. "Columbia River Benthic Macrofauna and Microflora Near WNP l , 2 , and 4: January through August 1978." In Aquatic Ecological Studies Near WNP 1, 2, and 4, January through August 1978, WPPSS Columbia River Ecology Studies, Vol. 6, Section 4. Battelle, Pacific Northwest Laboratories, Richland, Washington.
Parker, P.L., and T.F. King. 1990. Guidelines for Evaluating and Documenting Traditional Cultural Properties. National Register Bulletin 38, National Park Service, Washington, D.C.
Perteet Engineering, Inc., ThomasLane and Associates, Inc., and SCM Consultants, Inc. 2001. The Impact of the Waste Treatment Plant Project on the Hanford Communities. Prepared by Perteet Engineering, Inc., Everett, Washington for the Hanford Communities, Richland, Washington.
Peterson, R.E. 1992. Hydrologic and Geologic Data Available for the Region North of Gable Mountain, Hanford Site, Washington. WHC-SD-EN-TI-006, Westinghouse Hanford Company, Richland, Washington.
Peterson, R.E., and V.G. Johnson. 1992. Riverbank Seepage of Groundwater Along the lOOAreas Shoreline, Hanford Site. WHC-EP-0609, Westinghouse Hanford Company, Richland, Washington.
Peterson, R.E., R.F. Raidl, and C.W. Denslow. 1996. Conceptual Site Models for Groundwater Contamination at 100-BC-5, 100-KR-4, 100-HR-3, and 100-FR-3 Operable Units. BHI-00917, Bechtel Hanford Incorporated, Richland, Washington.
PNNL Seismic Monitoring Team. 2001. Second and Third Quarter Hanford Seismic Report for Fiscal Year 2001. PNNL- 1 1557- 18, Pacific Northwest National Laboratory, Richland, Washington.
Pogue, K.R. 1998. "Earthquake-generated structures in Missoula flood slackwater sediments (Touchet Beds) of southeastern Washington." Geological Society of America Abstracts with Programs 30:398-399.
Poston, T.M., K.R. Price, and D.R. Newcomer. 199 1. An Evaluation o f the Chemical, Radiological, and Ecological Conditions of West Luke on the Hanford Site. PNL-7662, Pacific Northwest Laboratory, Richland, Washington.
Poston, T.M., R.W. Hanf, and R.L. Dirkes. 2000. Hanford Site Environmental Report for Calendar Year 1999. PNNL-13230, Pacific Northwest National Laboratory, Richland, Washington.
Poston, T.M., R.W. Hanf, R.L. Dirkes, and L.F. Morasch. 2003. Hanford Site Environmental Report for Calendar Year 2002. PNNL-13487, Pacific Northwest National Laboratory, Richland, Washington.
Price, K.R., J.M. Carlile, R.L. Dirkes, R.E. Jaquish, M.S. Trevathan, and R.K. Woodruff. 1986. Environmental Monitoring at Hanford for 1984. Supplement. PNL-5407 Suppl. Pacific Northwest Laboratory, Richland, Washington.
PSPL (see Puget Sound Power and Light Company).
Puget Sound Power and Light Company (PSPL). 1982. Preliminary Safety Analysis for Skagit/Hanford Nuclear Project. Amendment 29, Puget Sound Power and Light Company, Bellevue, Washington.
Ramsdell, J.V., and G.L. Andrews. 1986. Tornado Climatology of the Contiguous United States NUREGICR-4461, U.S. Nuclear Regulatory Commission, Washington, D.C.
RCW 70.107. Noise Control. Revised Code of Washington, Olympia, Washington.
Reidel, S.P., K.R. Fecht, M.C. Hagood, and T.L. Tolan. 1989. "The Geologic Evolution of the Central Columbia Plateau." In Volcanism and Tectonism in the Columbia River Flood-Basalt Province, Special Paper 239, pp. 247-264, eds. S.P. Reidel and P.R. Hooper, Geological Society of America, Boulder, Colorado.
Reidel, S.P., and P.R. Hooper. 1989. Volcanism and Tectonism in the Columbia River Flood-Basalt Province. Geological Society of America Special Paper 239,30 technical papers.
Reidel, S.P., K.A. Lindsey, and K.R. Fecht. 1992. Field Trip Guide to the Hanford Site. WHC-MR- 039 1. Westinghouse Hanford Company, Richland, Washington.
Reidel, S.P., N.P. Campbell, K.R. Fecht, and K.A. Lindsey. 1994. "Late Cenozoic Structure and Stratigraphy of South-central Washington." In: Lasmanis, R. and E.S. Cheney, convenors, Regional Geology of Washington State. Washington Division of Geology and Earth Resources Bulletin 80: 159- 180.
Relander, C. 1956. Drummers and Dreamers. Caxton Printers, Caldwell, Idaho.
Rice, D.G. 1968a. Archaeological Reconnaissance: Ben Franklin Reservoir Area, 1968. Washington State University, Laboratory of Anthropology, Pullman, Washington.
Rice, D.G. 1968b. Archaeological Reconnaissance: Hanford Atomic Works. U.S. Atomic Energy Commission, National Park Service and Washington State University, Pullman, Washington.
Rice, D.G. 1976. The Log Structure at White BlufSs hnding, Franklin County, Washington. Anthropological Research Manuscript Series No. 25, University of Idaho, Moscow, Idaho.
Rice, D.G. 1980a. Overview of Cultural Resources on the Hanford Reservation in South Central Washington State. Report submitted to U.S. Department of Energy, Richland Operations, Richland, Washington.
Rice, D.G. 1980b. Cultural Resources Assessment of the Hanford Reach of the Columbia River, State of Washington. U.S. Army Corps of Engineers, Seattle District, Seattle, Washington.
Rice, H.S., D.H. Stratton, and G.W. Lundeman. 1978. An Archaeological and Historic Survey of the 400 Area, Hanford Reservation. National Heritage, Inc., Pullman, Washington.
Rickard, W.H., and L.E. Rogers. 1983. "Industrial Land Use and the Conservation of Native Biota in the Shrub-Steppe Region of Western North America." Environmental Conservation 10:205-211.
Rickard, W.H., R.E. Fitzner, and C.E. Cushing. 1981. "Biological Colonization of an Industrial Pond." Environmental Conservation 8:24 1-247.
Rogers, L.E., and W.H. Rickard. 1977. Ecology of the 200Area Plateau Waste Management Environs: A Status Report. PNL-2253, Pacific Northwest Laboratory, Richland, Washington.
Rohay, A.C. 1987. Earthquake Focal Mechanisms, Recurrence Rates and Deformation in the Columbia River Basalts. RHO-BW-SA-666 P, Rockwell Hanford Operations, Richland, Washington.
Rohay, A.C. 1989. "Earthquake Recurrence Rate Estimates for Eastern Washington and the Hanford Site." In Proceedings, Second DOE Natural Phenomena Hazards Mitigation Conference, CONF- 8910192, October 3-5, 1989, Knoxville, Tennessee, sponsored by U.S. Department of Energy Headquarters, Office of Nuclear Safety, NTIS, Springfield, Virginia.
Rokkan, D.J., Diediker, D.L. Dyekman, N.A. Homan, K. Rhoads, and L.H. Staven. 2003. Radionuclide Air Emission Report for the Hanford Site, Calendar Year 2002. DOERL-2003-19, Revision 0. U.S. Department of Energy, Richland, Washington.
Sackschewsky, M.R., and J.L. Downs. 2001. Vascular Plants of the Hanford Site. PNNL-13688, Pacific Northwest National Laboratory, Richland, Washington.
Schalla, R., R.W. Wallace, A.L. Aaberg, S.P. Arihart, D.J. Bates, J.V.M. Carlile, C.S. Cline, I. Dennison, M.D. Freshley, P.R. Heller, E.J. Jensen, K.B. Olsen, R.G. Parkhurst, J.T. Rieger, and E.J. Westergard. 1988. Interim, Characterization Report for the 300 Area Process Trenches. PNL-67 16, Pacific Northwest Laboratory, Richland, Washington.
Schwab, G.E., R.M. Colpitts Jr., and D.A. Schwab. 1979. Spring Inventory of the Rattlesnake Hills. W.K. Summers and Associates, Inc., Socorro, New Mexico.
Serne, R.J., H.T. Schaef, B.N. Bjornstad, B.A. Williams, D.C. Lanigan, D.G. Horton, R.E. Clayton, V.L. LeGore, M.J. O'Hara, C.F. Brown, D.E. Parker, I.V. Kutnyakov, J.N. Serne, A.V. Mitroshkov, G.V. Last, S.C. Smith, C.W. Lindenmeier, J.M. Zachara, and D.B. Burke. 2001a. Characterization of Uncontaminated Sediments from the Hanford Reservation - RCRA Borehole Core Samples and Composite Samples. PNNL-2001 -I, Pacific Northwest National Laboratory, Richland, Washington.
Serne, R.J., G.V. Last, G.W. Gee, H.T. Schaef, D.C. Lanigan, C.W. Lindenmeier, R.E. Clayton, V.L. LeGore, R.D. Om, M.J. O'Hara, C.F. Brown, D.B. Burke, A.T. Owen, I.V. Kutnyakov, T.C. Wilson, and D.A. Myers. 2001b. Geologic and Geochemical Data Collected from Vadose Zone Sediments from Borehole SX 41-09-39 in the S/SX Waste Management Area and Preliminary Interpretations. PNNL- 2001 -2, Pacific Northwest National Laboratory, Richland, Washington.
Serne, R.J., H.T. Schaef, B.N. Bjornstad, D.C. Lanigan, G.W. Gee, C.W. Lindenmeier, R.E. Clayton, V.L. Legore, R.D. Orr, M.J. O'Hara, C.F. Brown, G.V. Last, I.V. Kutnyakov, D.B. Burke, T.C. Wilson, and B .A. Williams. 200 1c. Geologic and Geochemical Data Collected from Vadose Zone Sediments from Borehole 299-W23-19 [SX-I 151 in the S/SX Waste Management Area and Preliminary Interpretations. PNNL-2001-3, Pacific Northwest National Laboratory, Richland, Washington.
Shaw, J., M. Munro-Stasuik, B. Sawyer, C. Beaney, J.-E. Lesemann, A. Musacchio, B. Rains, and R.R. Young. 1999. "The Channeled Scabland: Back to Bretz". Geol. 27:605-608.
Skaggs, R.L., and W.H. Walters. 1981. Flood Risk Analysis of Cold Creek Near the Hanford Site. RHO-BWI-C- 120fPNL-42 19, Rockwell Hanford Operations, Richland, Washington.
Slate, J.L. 1996. Buried Carbonate Paleosols Developed in Pliocene-Pleistocene Deposits of the Pasco Basin, South-central Washington, U.S.A. Quarternary International 34-36: 19 1 - 196. Published by Elsevier Science Ltd., Great Britain.
Soll, J.A., and C. Soper, eds. 1996. Biodiversity Inventory and Analysis of the Hanford Site, 1995 Annual Report. The Nature Conservancy of Washington, Seattle, Washington.
Soll, J.A., Hall, R. Pabst, and C. Soper. 1999. Biodiversity Inventory and Analysis of the Hanford Site Final Report 1994 - 1999. The Nature Conservancy of Washington. Seattle, Washington.
Spane, F.A., Jr. 1987. Fresh-Water Potentiometric Map and Inferred Flow Direction of Ground Water Within the Mabton Interbed, Hanford Site, Washington State - January 1987. SD-BWI-TI-335, Rockwell Hanford Operations, Richland, Washington.
Spier, L. 1936. Tribal Distribution in Washington. General Services in Anthropology No. 3, George Banta Publishing Co., Menasha, Wisconsin.
Stone, W.A., D.E. Jenne, and J.M. Thorp. 1972. Climatography of the Hanford Area. BNWL-1605, Pacific Northwest Laboratories, Richland, Washington.
Stone, W.A., J.M. Thorp, O.P. Gifford, and D.J. Hoitink. 1983. Climatological Summary for the Hanford Area. PNL-4622, Pacific Northwest Laboratory, Richland, Washington.
Supply System (see Washington Public Power Supply System).
Swanson, D.A., J.L. Anderson, R.D. Bentley, V.E. Camp, J.N. Gardner, and T.L. Wright. 1979a. Reconnaissance Geologic Map of the Columbia River Basalt Group in Eastern Washington and Northern Idaho. Open-File Report 79-1363, U.S. Geological Survey, Washington, D.C.
Swanson, D.A., T.L. Wright, P.R. Hooper, and R.D. Bentley. 1979b. Revisions in Stratigraphic Nomenclature of the Columbia River Basalt Group. USGS Bulletin 1457, U.S. Geological Survey, Boulder, Colorado.
Swanson, L.C. 1992. Phase I Hydrogeologic Summary of the 300-FF-5 Operable Unit, 300Area. WHC-SD-EN-TI-052, Rev. 0, Westinghouse Hanford Company, Richland, Washington.
Tallman, A.M., J.T. Lillie, and K.R. Fecht. 1981. "Suprabasalt sediments of the Cold Creek Syncline Area." In Subsuij-ace Geology of the Cold Creek Syncline, eds. C.W. Myers and S.M. Price. RHO-BWI- ST-14, Rockwell Hanford Operations, Richland, Washington.
TCAR (see Tri-City Association of Realtors).
Thorne, P.D., and D.R. Newcomer. 1992. Summary and Evaluation of Available Hydraulic Property Data for the Hanford Site Unconfined Aquifer System. PNL-8337, Pacific Northwest Laboratory, Richland, Washington.
Thorne, P.D., M.A. Chamness, F.A. Spane Jr., V.R. Vermeul, and W.D. Webber. 1993. Three- Dimensional Conceptual Model for the Hanford Site Unconfined Aquifer System, FY 1993 Status Report. PNL-897 1, Pacific Northwest Laboratory, Richland, Washington.
Thorne, P.D., M.A. Charnness, V.R. Vermeul, Q.C. MacDonald, and S.E. Schubert. 1994. Three- Dimensional Conceptual Model for the Hanford Site Unconfined Aquifer System: FY 1994 Status Report. PNL-10195, Pacific Northwest National Laboratory, Richland, Washington.
Tiller, B.L., G.E. Dagle, L.L. Cadwell, T.M. Poston, and A. Oganesian. 1997. Investigation of Anatomical Anomalies in Hanford Site Mule Deer. PNL- 1 15 1 8, Pacific Northwest National Laboratory, Richland, Washington.
Treaty with the Yakama. 1 855. June 9, 1 855, 12 Stat. 95 1
Tri-City Association of REALTORS (TCAR). 2002. Tri-City Area Housing Statistics. Tri-City Association of REALTORS, Kennewick, Washington. Online at: httr,://www.tricit~realtors.com/
Tri-Cities Industrial Development Council (TRIDEC). 2002. Industry and Major Employers Directory. Tri-Cities Industrial Development Council, Kennewick, Washington. Online at: http:Nwww.tridec.org
TRIDEC (see Tri-Cities Industrial Development Council)
U.S. Army Corps of Engineers (Corps). 1989. Water Control Manual for McNary Lock and Dam, Columbia River, Oregon and Washington. U.S. Army Corps of Engineers, Walla Walla District, Walla Walla, Washington.
U.S. Census Bureau (Census). 2000. Poverty 1999. Poverty Thresholds in 1999, by Size of Family and Number of Related Children Under 18 Years. Last revised September 26,2000. U.S. Bureau of the Census, U.S. Department of Commerce, Washington, D.C. Online at: http://www.census.nov
U.S. Census Bureau (Census). 2001 a. Poverty Thresholds in 2000, by Size of Family and Number of Related Children Under 18 Years. Last revised January 29, 2001. U.S. Bureau of the Census, U.S. Department of Commerce, Washington, D.C. Online at: http://www.census.~ov
U.S. Census Bureau (Census). 2001b. Census 2000 Redistricting Data (P.L. 94-1 71) Summary File - Oregon. U.S. Bureau of the Census, U.S. Department of Commerce, Washington, D.C.
U.S. Census Bureau (Census). 2001~. Census 2000 Redistricting Data (P.L. 94-17!) Summary File - Washington. U.S. Bureau of the Census, U.S. Department of Commerce, Washington, D.C.
U.S. Census Bureau (Census). 2002a. Census 2000 Summary File 3 (SF 3)- Oregon. U.S. Bureau of the Census, U.S. Department of Commerce, Washington, D.C.
U.S. Census Bureau (Census). 2002b. Census 2000 Summary File 3 (SF 3) - Washington. U.S. Bureau of the Census, U.S. Department of Commerce, Washington, D.C.
U.S. Census Bureau (Census). 2003a. Table QT P-34 Poverty Status of Individuals. Census Summary File 3 (SF3) Sample Data. U.S. Bureau of the Census, U.S. Department of Commerce, Washington, D.C. Online at: http://factfinder.census.~ov
U.S. Census Bureau (Census). 2003b. Geographic Comparison Table, Washington State Counties. , Census 2000 Redistricting Data (Public Law 94-171) Summary File, Matrices PLl and PL2. U.S. Bureau of the Census, U.S. Department of Commerce, Washington, D.C. Online at: http://factfinder.census.~ov/servlet/BasicFactsTable? lang=en& vt name=DEC 2000 PL U GCTPL S T2& gee id=04000US53>
U.S. Department of the Army. 1990. Final Environmental Impact Statement Yakima Firing Center Proposed Land Acquisition, Yakima Firing Center, Washington. Department of Army, I Corps, Fort Lewis, Washington.
U.S. Department of Commerce (DOC). 2002. Regional Economic Information System (REIS). Bureau of Economic Analysis, U.S. Department of Commerce, Washington, D.C. Online at: http://www .bea.doc.~ov/bea/renionaVreis/
U.S. Department of Energy (DOE). 1986. Environmental Assessment, Reference Repository Location, Hanford Site, Washington. DOEIRW-0070, U.S. Department of Energy, Washington, D.C.
U.S. Department of Energy (DOE). 1987. Final Environmental Impact Statement, Disposal of Hanford Defense High-Level, Transuranic and Tank Wastes, Haizford Site, Richland, Washington. DOEEIS- 01 13, Vol. 1-111, U.S. Department of Energy, Washington, D.C.
U.S. Department of Energy (DOE). 1988. Consultation Draft: Site Characterization Plan, Reference Repository Location, Hanford Site, Washington. DOERW-0164, U.S. Department of Energy, Washington, D.C.
U.S. Department of Energy (DOE). 1991. Draft Environmental Impact Statement for the Siting, Construction, and Operation of New Production Reactor Capacity. DOEEIS-0144D, Vol. 4, Appendix E, U.S. Department of Energy, Washington, D.C.
U.S. Department of Energy (DOE). 1992a. Hanford Site Groundwater Background. DOEIRL-92-23, U.S. Department of Energy, Richland Field Office, Richland, Washington.
U.S. Department of Energy (DOE). 1992b. American Indian Tribal Government Policy. DOE 1230.2. U.S. Department of Energy, Office of Congressional and Intergovernmental Affairs.
U.S. Department of Energy (DOE). 1993a. Recommendations for the Preparation of Environmental Assessments and Environmental Impact Statements. U.S. Department of Energy, Office of NEPA Oversight, Washington, D.C.
U.S. Department of Energy (DOE). 1993b. Radiation Protection of the Public and the Environment. DOE Order 5400.5. U.S. Department of Energy, Washington, D.C.
U.S. Department of Energy (DOE). 1996a. Programmatic Agreement Among the U.S. Department of Energy Richland Operations Ofice, the Advisory Council on Historic Preservation, and the Washington State Historic Preservation Ofice for the Maintenance, Deactivation, Alteration, and Demolition of the Built Environment on the Hanford Site, Washington. DOEIRL-96-77. Online at: http:Nwww.hanford.aov/docs/96eapl54/96eap154.htm
U.S. Department of Energy (DOE). 1996b. Tank Waste Remediation System, Hanford Site, Richland, Washington. Final Environmental Impact Statement. DOEJEIS-0189. U.S. Department of Energy, Washington, D.C.
U.S. Department of Energy (DOE). 1997a. Waste Site Grouping for 200 Areas Soil Investigations. DOERL-96-8 1, Rev 0. Online at: http://www.erc.rl.aov/-pas/READROOM/DOE RL.HTM
U.S. Department of Energy (DOE). 1997b. Hanford Site Background: Part 3, Groundwater Background. DOEIRL-96-61. U.S. Department of Energy, Richland, Washington.
U.S. Department of Energy (DOE). 1997c. National Register of Historic Places Multiple Property Documentation Form - Historic, Archaeological and Traditional Cultural Properties of the Hanford Site, Washington. DOEIRL-97-02. Online at: htt~:Nwww.hanford.~ov/doe/culres/m~dltoc.htm
U.S. Department of Energy (DOE). 1997d. N Reactor Comprehensive Treatment Report, Hanford Site, Washington. DOERL-96-91, Draft A, Volumes I, 11,111. U.S. Department of Energy, Richland, Washington.
U.S. Department of Energy (DOE). 1998a. Screening Assessment and Requirements for a Comprehensive Assessment: Columbia River Comprehensive Impact Assessment. DOEEL-96-1 6, Rev. 1 , Final. Online at: http://sesp.pnl.~ov/Reports/CRC1A/re~orts.htm
U.S. Department of Energy (DOE). 1998b. Hanford Site Manhattan Project and Cold War Era Historic District Treatment Plan. DOEIRL-97-56, Rev. 1. U.S. Department of Energy, Richland, Washington.
U.S. Department of Energy (DOE). 1999a. Final Hanford Comprehensive Land-Use Plan Environmental Impact Statement. DOEIEIS-0222, U.S. Department of Energy, Washington, D.C.
U.S. Department of Energy (DOE). 1999b. Site Service Division, Site Engineering Property. Online at: http:Nwww .hanford .~ov/infrastructure/sidlproperty.html
U.S. Department of Energy (DOE). 2000a. Clean Air Act General Conformity Requirements and the National Environmental Policy Act Process. Online at: http://tis.eh.doe.pov/nepa/tools/,~idance/caap;uidance.pdf
U.S. Department of Energy (DOE). 2000b. Threatened and Endangered Species Management Plan: Salmon & Steelhead. DOERL-2000-27, Rev. 0. U.S. Department of Energy, Richland, Washington.
U.S. Department of Energy (DOE). 2001. Hanford Site Biological Resources Management Plan. DOEEL-96-32, Rev. 0. U.S. Department of Energy, Richland, Washington.
U.S. Department of Energy (DOE). 2002a. Hanford Site Waste Management Units Report. DOERL-88- 30, Rev 1 1, U.S. Department of Energy, Richland, Washington.
U.S. Department of Energy (DOE). 2002b. Standardized Stratigraphic Nomenclature for the Post- Ringold-Formation Sediments Within the Central Pasco Basin. DOEIRL-2002-39, Rev. 0, U.S. Department of Energy, Richland, Washington.
U.S. Department of Energy (DOE). 2003a. Hanford Cultural Resources Management Plan. DOEIRL- 98-10, Rev. 0. U.S. Department of Energy, Richland Operations Office, Richland, Washington.
U.S. Department of Energy (DOE). 2003b. DOE Computerized Accident/Incident reporting System (CAIRS). Online at: http:Ntis.eh.doe.nov/cairs (Data Downloaded April 2003)
U.S. Department of Energy (DOE). 2003c. The US Department of Energy's Web Page for Information on Occupational Radiation Exposure. Online at: http://rems.eh.doe.g.ov
U.S. Department of Energy, Richland Operations Office (DOEIRL). 1998. Hanford Facility Dangerous Waste Permit Application, General Information Portion. DOERL-9 1-28, Rev. 4. Online at: http://www.hanford.~ov/docs/rl-9 1-28/r191-28chp 02f.htm#f2-9
U.S. Department of Energy, Richland Operations Office (DOE-RL). 2001. Historic American Engineering Record B Reactor (105-B Building) HAER No. WA-164. DOEIRL-2001-16. U.S. Department of Energy, Richland Operations Office, Richland, Washington.
U.S. Department of Energy, Richland Operations Office (DOEIRL). 2002. History of the Plutonium Production Facilities at the Hanford Site Historic District, 1943-1990. DOEIRL-97-1047, U.S. Department of Energy, Richland Operations Office, Richland, Washington. Online at: at www.hanford.nov/docs/rl-97- 1047/index.htm
U.S. Department of the Interior (DOI). 1994. Hanford Reach of the Columbia River: Comprehensive River Conservation Study and Environmental Impact Statement - Final. Volumes I1 and I. U.S. Department of Interior, Washington, D.C.
U.S. Department of the Interior (DOI). 1996. United States Department of the Interior Record of Decision - Hanford Reach of the Columbia River: Final Environmental Impact Statement for Comprehensive River Conservation Study. U.S. Department of the Interior, Washington D.C.
U.S. Department of Labor, Employment and Training Administration (DOL). 2002. Domestic Agricultural In-Season Farm Labor Report. Monthly Farm Labor Abstracts, January-December 2002. Washington State Employment Security Department for the U.S. Department of Labor, Olympia, Washington.
U.S. Energy Research and Development Administration (ERDA). 1975. Final Environmental Impact Statement of Waste Management Operations, Hanford Reservation, Richland, Washington, 2 vol. ERDA-1538, U.S. Energy Research and Development Administration, Washington, D.C.
U.S. Energy Research and Development Administration (ERDA). 1976. Evaluation of Impact of Potential Flooding Criteria on the Hanford Project. RLO-76-4, U.S. Energy Research and Development Administration, Richland, Washington.
U.S. Environmental Protection Agency (EPA). 1996. EPA's Natural Events Policy for Particulate Matter, June 6, 1996. U.S. Environmental Protection Agency, Washington, D.C. Online at: http:llwww.epa.govlttn~caaa/t I/memoranda/nepol.pdf
U.S. Environmental Protection Agency (EPA). 2000. Updated Users Guide for CAP88-PC, Version 2.0. EPA 402-R-00-004, Office of Radiation and Indoor Air, U.S. Environmental Protection Agency, Washington, D.C.
U.S. Environmental Protection Agency (EPA). 2003. AIRS database. Online at: http:ll~~~.epa.nov/airldata/reports.html
USFWS (see U.S. Fish and Wildlife Service)
U.S. Fish and Wildlife Service (USFWS). 2002. Birds of Conservation Concern 2002. Division of Migratory Bird Management, Arlington, Virginia. Online at: htt~:l/mi~atorybirds.fws.govlreports/bcc2002.pdf
U.S. Fish and Wildlife Service (USFWS). 2003. "Species List Request, FWS Reference: 03-SP- WO160." Letter from M.G. Miller (USFWS) to S.H. Wisness, DOE (Richland, Washington), February 26, 2003.
USGS (see U.S Geological Survey)
U.S. Geological Survey (USGS). 1987. Subsuqace Transport of Radionuclides in Shallow Deposits of the Hanford Nuclear Reservation, Washington - Review of Selected Previous Work and Suggestions for Further Study. USGS Open File Report 87-222, Tacoma, Washington.
U.S. Geological Survey (USGS). 1995. Nitrate Concentrations in Ground Water of the Central Columbia Plateau. Open File Report 95-445, U.S. Geological Survey, Tacoma, Washington.
U.S. Geological Survey (USGS). 1996. National Seismic-Hazard Maps: Documentation June 1996. U.S. Geological Survey Open-File Report 96-532, Denver, Colorado.
U.S. Geological Survey (USGS). 2002. Daily Streamflow for the Nation. May 2001. U.S. Geological Survey, Reston, Virginia. Online at: htt~:Nwaterdata.us~s.nov/nwisldischar~e
U.S. Geological Survey (USGS). 2003. Daily Streamflow for the Nation. U.S. Geological Survey, Reston, Virginia. Online at: htt~:llwaterdata.us~s.nov/nwisldisch~e
U.S. Nuclear Regulatory Commission (NRC). 1982. Draft Environmental Statement Related to the Construction of Skagit/Hanford Nuclear Project, Units 1 and 2. Prepared by Puget Sound Power & Light Company, Pacific Power and Light Company, the Washington Water Power Company, and Portland General Electric Company. NUREG-0894, U.S. Nuclear Regulatory Commission, Washington, D.C.
University of Washington Geophysics Program (UWGP). 2001. On-line Earthquake Catalog. University of Washington Geophysics Program, Seattle, Washington. Online at: h t t p : I / ~ ~ ~ . ~ e o p h y s. washington.edu1SEIS
UWGP (see University of Washington Geophysics Program).
WAC 173-60. Maximum Environmental Noise Levels. Washington Administrative Code, Olympia, Washington.
WAC 173-70. Watercraft Noise Pe$ormance Standards. Washington Administrative Code, Olympia, Washington.
WAC 173-2 16. State Waste Discharge Permit Program. Washington Administrative Code, Olympia, Washington.
WAC 173-470. Ambient Air Quality Standards for Particulate Matter. Washington Administrative Code, Olympia, Washington.
WAC 173-480. Ambient Air Quality Staizdards and Emission Limits for Radionuclides. Washington Administrative Code, Olympia, Washington.
WAC 173-481. Ambient Air Quality and Environmental Standards for Fluorides. Washington Administrative Code, Olympia, Washington.
WAC 232-12-292. Bald Eagle Protection Rules. Washington Administrative Code, Olympia, Washington.
WAC 246-247. Radiation protection -- Air emissions. Washington Administrative Code, Olympia, Washington.
Waitt, R.B. 1980. "About Forty Last-Glacial Lake Missoula Jokulhlaups Through Southern Washington." Journal of Geology 88: 653-679.
Walker, D.E., Jr. 1998. Handbook of North American Indians. Volume 12:Plateau. Smithsonian Institute, Washington D.C.
Ward, A.L., and G.W. Gee. 2000. Vadose Zone Transport Field Study: Detailed Test Plan for Simulated Leak Tests. PNNL- 13263. Online at: http://etd.pnl ..gov:2080/vadose
Ward, A. L., G. W. Gee, Z. F. Zhang, and J.M. Keller. 2002a. Vadose Zone Transport Field Study: FY 2002 Status Report. PNNL 14150 Pacific Northwest National Laboratory, Richland, Washington.
Ward, A.L., G.W. Gee and Z.F. Zhang. 2002b. Hydrologic Tests of Lateral Flow and Transport in the Hanford Vadose Zone. Appendix D.4.1 (D-223- D233), In. A. J. Knepp. Field Investigation Report for Waste Management Area B-BX-BY. RPP-I 0098. Rev 0, CH2MHILL Hanford Group, Inc. Richland, Washington.
Warren, J.L. 1980. Vegetation Maps of the Hanford Reach, Columbia River. Prepared for the U.S. Army Corps of Engineers, Seattle District, Seattle, Washington, by Pacific Northwest Laboratory, Richland, Washington.
Washington Center for Real Estate Research (WCRER). 2002a. Washington State Housing Market. Washington State University, Pulman, Washington. Online at: http:Nwww.cbe.wsu.edu/-wcrer/market/Housin~Market.asp
Washington Center for Real Estate Research (WCRER). 2002b. WCRER Apartment Market Survey, Fall 2002. Washington State University, Pulman, Washington. Online at: http:Nwww.cbe. wsu.edu/-wcrerlmarketlapt intro. htm
Washington Natural Heritage Program. 2002. Rare Plant Species With Ranks. Washington Department of Natural Resources, Olympia, Washington. Online at: htt~:Nwww.wa.aovldnr/doc
Washington State Department of Ecology (Ecology). 1997. 1997Air Quality Annual Report for Washington State. #97-208, Washington State Department of Ecology, Olympia , Washington.
Washington State Department of Ecology Air Quality Program (Ecology). 1999. 1998 Washington State Air Quality Report. #98-213. Online at: htt~://www.wa.~ov/ecolonv/air/98r~tbea.~df
Washington State Department of Ecology Air Quality Program (Ecology). 2000. 1998 Air Quality Data Summaq. #00-02-005. Online at: http://ww~~.wa.~ov/ecologv/air/98-final I .pdf
Washington State Labor Market and Economic Analysis (LMEA). 2002a. Washington State Labor Summaries. Olympia, Washington. Online at: htt~://www.workforceex~lorer.com/
Washington State Labor Market and Economic Analysis (LMEA). 2002b. Covered Employment and Wages by Industry, 2002. Olympia, Washington. Online at: htt~://www.workforceex~lorer.com/
Washington State Labor Market and Economic Analysis (LMEA). 2002c. Nonagricultural Wage and Salary Employment (2001-2002). Olympia, Washington. Online at: http://www.workforceexp1orer.com/
Washington State Office of Trade and Economic Development (OTED). 2002. Washington State Travel Impacts & Visitor Volume 1991-2002p. Washington State Tourism Division, Olympia, Washington. Online at: http://www.experiencewashington.com
Washington State Office of Trade and Economic Development (OTED). 2003. A Brief Analysis of the Economic Benefits of Wind Power in Washington State. Energy Policy Division, Olympia, Washington. Online at: http:Nwww.energy.cted.wa.~0vffapersNind%20Power%2OOppo~unities%2Oin%2OWA.~df
Watson, D.G. 1970. Fall Chinook Salmon Spawning in the Columbia River Near Hanford 1947-1969. BNWL-15 15, Pacific Northwest Laboratories, Richland, Washington.
Watson, D.G. 1973. Fall Chinook Salmon Population Census. BNWL-1750, Pacific Northwest Laboratories, Richland, Washington.
Watson, E.C., C.D. Becker, R.E. Fitzner, K.A. Gano, C.L. Imhoff, R.F. McCallum, A. Myers, T.L. Page, K.R. Price, J.V. Ramsdell, D.G. Rice, D.L. Schreiber, L.A. Skumatz, D.J. Sommer, J.J. Tawil, R.W. Wallace, and D.G. Watson. 1984. Environmental Characterization of Two Potential Locations at Hanford for a New Production Reactor. PNL-5275, Pacific Northwest Laboratory, Richland, Washington.
WCRER (see Washington Center for Real Estate Research).
WDFW (see Washington State Department of Fish and Wildlife).
Weiss, S.G., and R.M. Mitchell. 1992. A Synthesis of Ecological Data from the 100Areas of the Hanford Site. WHC-EP-060 1 , Westinghouse Hanford Company, Richland, Washington.
Westinghouse Hanford Company (WHC). 1989. Primary Operable Units Designation Project. WHC- EP-0216, Environmental Engineering Group, Westinghouse Hanford Company, Richland, Washington.
Westinghouse Hanford Company (WHC). 1994. Traflc Data for the Comprehensive Tank Waste Remediation System, Environmental Impact Statement. Response to Memorandum 94-JE-DOE-0 10. Westinghouse Hanford Company, Richland, Washington.
WHC (see Westinghouse Hanford Company).
Wolf, E.G. 1976. "Characterization of the Benthos Community." In Final Report on Aquatic Ecological Studies Conducted at the Hanford Generating Project, prepared by Battelle, Pacific Northwest Laboratories for United Engineers and Constructors, Inc. for Washington Public Power Supply System under Contract No. 231 1201335, Richland, Washington.
Wolf, E.G., T.L. Page, and D.A. Neitzel. 1976. "Phytoplankton Community: Primary Productivity, Pigment Concentration, Species Composition and Relative Abundance of Phytoplankton and Physicochemical Analysis," Section 2. In Final Report on Aquatic Ecological Studies Conducted at the Hanford Generating Project, 1973-1 974, WPPSS Columbia River Ecological Studies, Vol. 1. Prepared by Battelle, Pacific Northwest Laboratories for Washington Public Power Supply System, Richland, Washington.
Wood, M.I., R. Schalla, B.N. Bjornstad, and S.M. Narbutovskih. 2000. Subsurface Conditions Description of the B-BX-BY Waste Management Area. HNF-5507, Rev. 0. CH2MHill Hanford Group, Incorporated, Richland, Washington.
Wright, M.K. 1993. Fiscal Year 1992 Report on Archaeological Surveys of the 100 Areas, Hanford Site, Washington. PNL-8819, Pacific Northwest Laboratory, Richland, Washington.
Wurstner, S.K., and M.D. Freshley. 1994. Predicted Impacts of Future Water Level Decline on Monitoring Wells Using a Ground- Water Model of the Hanford Site. PNL-10196, Pacific Northwest Laboratory, Richland, Washington.
Yakama (see Treaty with the Yakama).
Zimmerman, D.A., A.E. Reisenauer, G.D. Black, and M.A. Young. 1986. Hanford Site Water Table Changes, 1950 Through 1980 - Data Observations and Evaluation. PNL-5506, Pacific Northwest Laboratory, Richland, Washington.

This page intentionally left blank
APPENDIX A
Hanford Site Species Lists
This appendix contains five tables that list species of vascular plants, mammals, birds, reptiles and amphibians, and fish that have been sighted on the Hanford Site. The lists are for those species likely to be encountered on the site and are not intended to represent a complete listing of all species. When appropriate, more comprehensive listings have been identified.

This page intentionally left blank
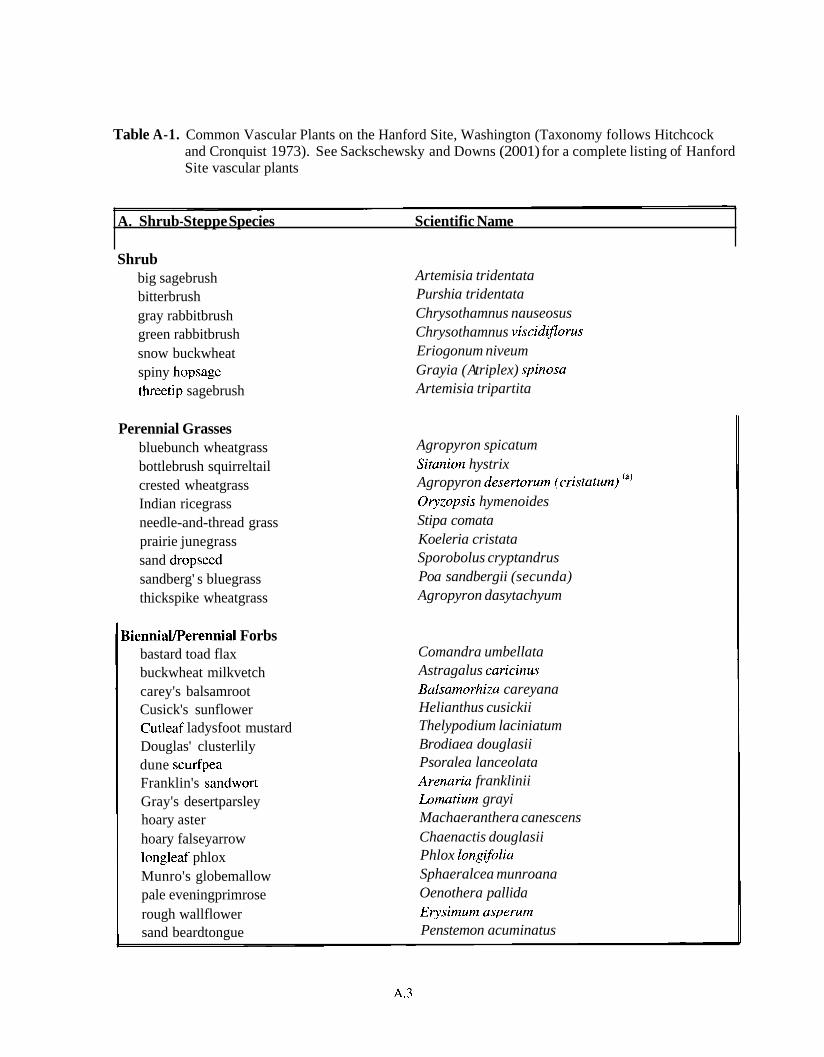
Table A-1. Common Vascular Plants on the Hanford Site, Washington (Taxonomy follows Hitchcock and Cronquist 1973). See Sackschewsky and Downs (2001) for a complete listing of Hanford Site vascular plants
A. Shrub-Steppe Species Scientific Name
Shrub big sagebrush bitterbrush gray rabbitbrush green rabbitbrush snow buckwheat spiny hopsage threetip sagebrush
Perennial Grasses bluebunch wheatgrass bottlebrush squirreltail crested wheatgrass Indian ricegrass needle-and-thread grass prairie junegrass sand dropseed sandberg' s bluegrass thickspike wheatgrass
BiennialIPerennial Forbs bastard toad flax buckwheat milkvetch carey's balsamroot Cusick's sunflower Cutleaf ladysfoot mustard Douglas' clusterlily dune scurfpea Franklin's sandwort Gray's desertparsley hoary aster hoary falseyarrow longleaf phlox Munro's globemallow pale eveningprimrose rough wallflower sand beardtongue
Artemisia tridentata Purshia tridentata Chrysothamnus nauseosus Chrysothamnus viscidiflorus Eriogonum niveum Grayia (A triplex) spinosa Artemisia tripartita
Agropyron spicatum Sitanion hystrix Agropyron desertorum (cristatum) (" Oryzopsis hymenoides Stipa comata Koeleria cristata Sporobolus cryptandrus Poa sandbergii (secunda) Agropyron dasytachyum
Comandra umbellata Astragalus caricinus Balsamorhiza careyana Helianthus cusickii Thelypodium laciniatum Brodiaea douglasii Psoralea lanceolata Arenaria franklinii Lornatium grayi Machaeranthera canescens Chaenactis douglasii Phlox longifolia Sphaeralcea munroana Oenothera pallida Erysimum asperum Penstemon acuminatus
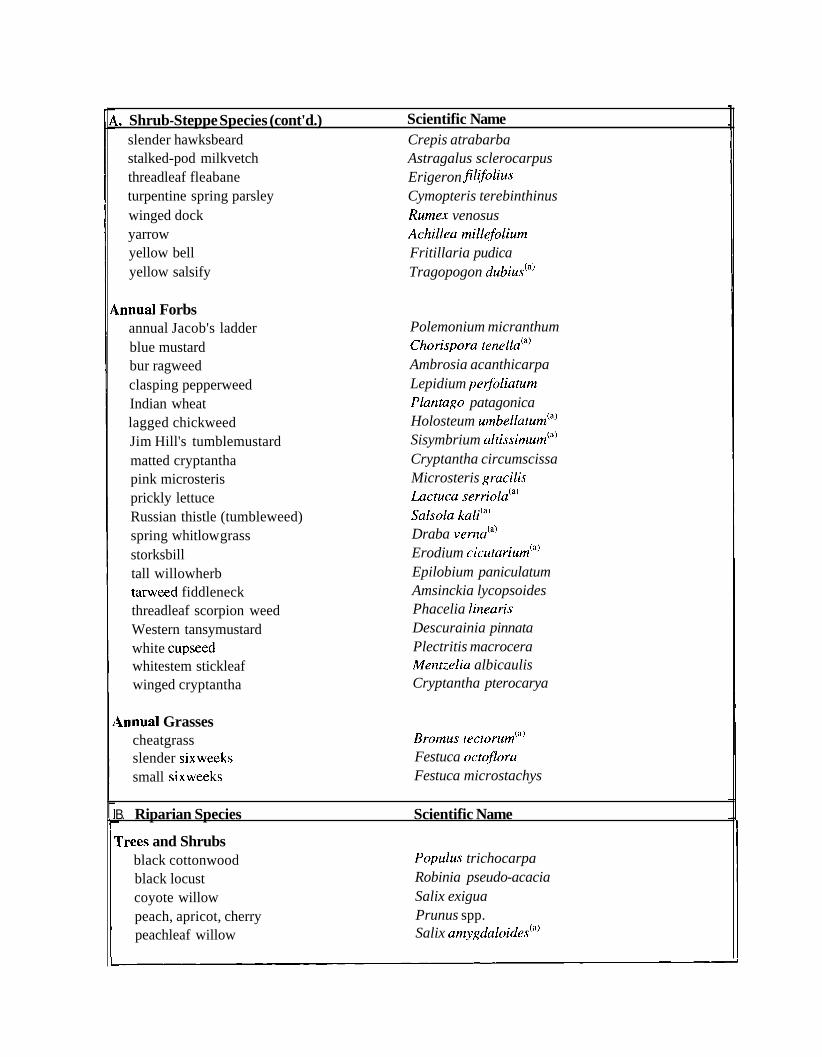
L. Shrub-Steppe Species (cont'd.) Scientific Name slender hawksbeard Crepis atrabarba stalked-pod milkvetch Astragalus sclerocarpus threadleaf fleabane Erigeron filijiolius turpentine spring parsley Cymopteris terebinthinus winged dock Rumex venosus yarrow Achillea millefolium yellow bell Fritillaria pudica yellow salsify Tragopogon dubius'")
knnual Forbs annual Jacob's ladder blue mustard bur ragweed clasping pepperweed Indian wheat lagged chickweed Jim Hill's tumblemustard matted cryptantha pink microsteris prickly lettuce Russian thistle (tumbleweed) spring whitlow grass storksbill tall willowherb tarweed fiddleneck threadleaf scorpion weed Western tansymustard white cupseed whitestem stickleaf winged cryptantha
4nnual Grasses cheatgrass slender sixweeks small sixweeks
Polemonium micranthum Chorispora tenella'") Ambrosia acanthicarpa Lepidium perfoliatum Plantago patagonica Holosteum umbellaturn'") Sisymbrium altissim~m'~' Cryptantha circumscissa Microsteris gracilis hctuca serriola'") Salsola kali'"' Draba verna'") Erodium ci~utarium'~) Epilobium paniculatum Amsinckia lycopsoides Phacelia linearis Descurainia pinnata Plectritis macrocera Mentzelia albicaulis Cryptantha pterocarya
Brornus tector~m'~) Festuca octoflora Festuca microstachys
B. Riparian Species Scientific Name
rrees and Shrubs black cottonwood Populus trichocarpa black locust Robinia pseudo-acacia coyote willow Salix exigua peach, apricot, cherry Prunus spp. peachleaf willow Salix amygdaloides'"'
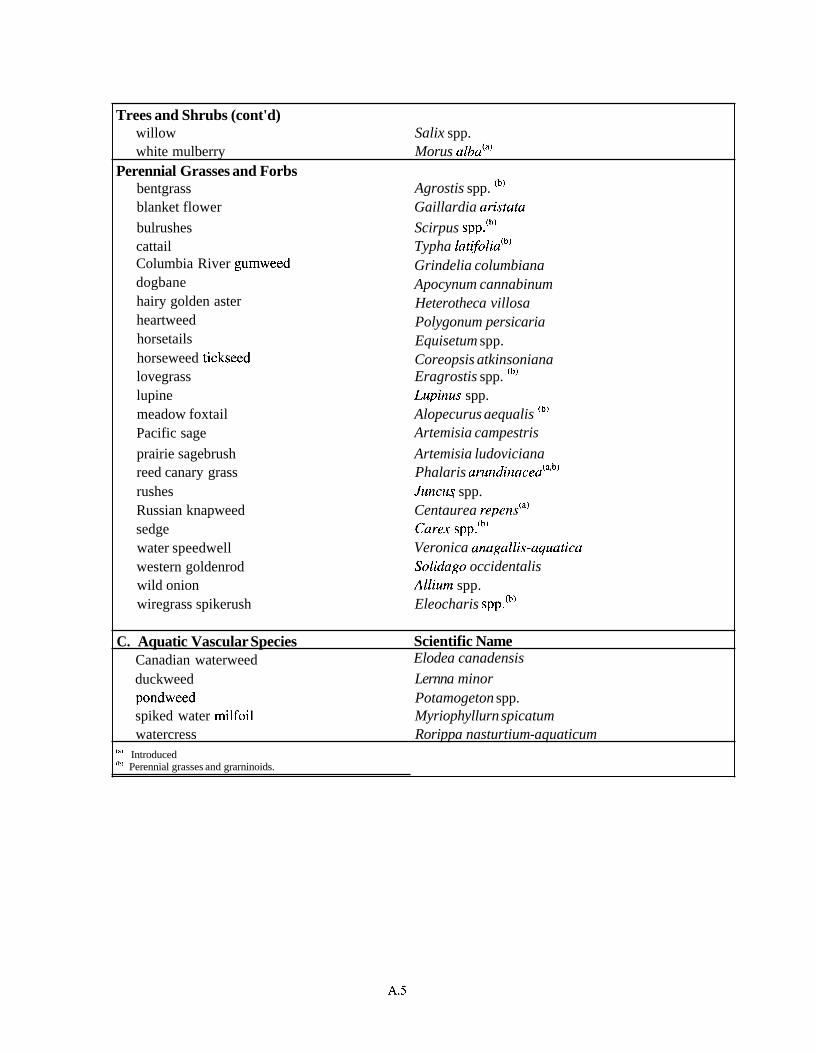
Trees and Shrubs (cont'd) willow Salix spp. white mulberry Morus a ~ b a ' ~ )
Perennial Grasses and Forbs bentgrass Agrostis spp. (b)
blanket flower Gaillardia aristata
bulrushes Scirpus spp.@) cattail Typha lat i f~l ia '~) Columbia River gumweed Grindelia columbiana dogbane Apocynum cannabinum hairy golden aster Heterotheca villosa heartweed Polygonum persicaria horsetails Equisetum spp. horseweed tickseed Coreopsis atkinsoniana lovegrass Eragrostis spp. (b)
lupine Lupinus spp. meadow foxtail Alopecurus aequalis (b)
Pacific sage Artemisia campestris
prairie sagebrush Artemisia ludoviciana reed canary grass Phalaris a r~nd inacea (~~~) rushes Juncu~ spp. Russian knapweed Centaurea rependa) sedge Carex spp.(b) water speedwell Veronica anagallis-aquatica western goldenrod Solidago occidentalis wild onion Allium spp. wiregrass spikerush Eleocharis spp.(b)
C. Aquatic Vascular Species Scientific Name Canadian waterweed Elodea canadensis
duckweed Lernna minor pondweed Potamogeton spp. spiked water milfoil Myriophyllurn spicatum watercress Rorippa nasturtium-aquaticum
la' Introduced ''' Perennial grasses and grarninoids.
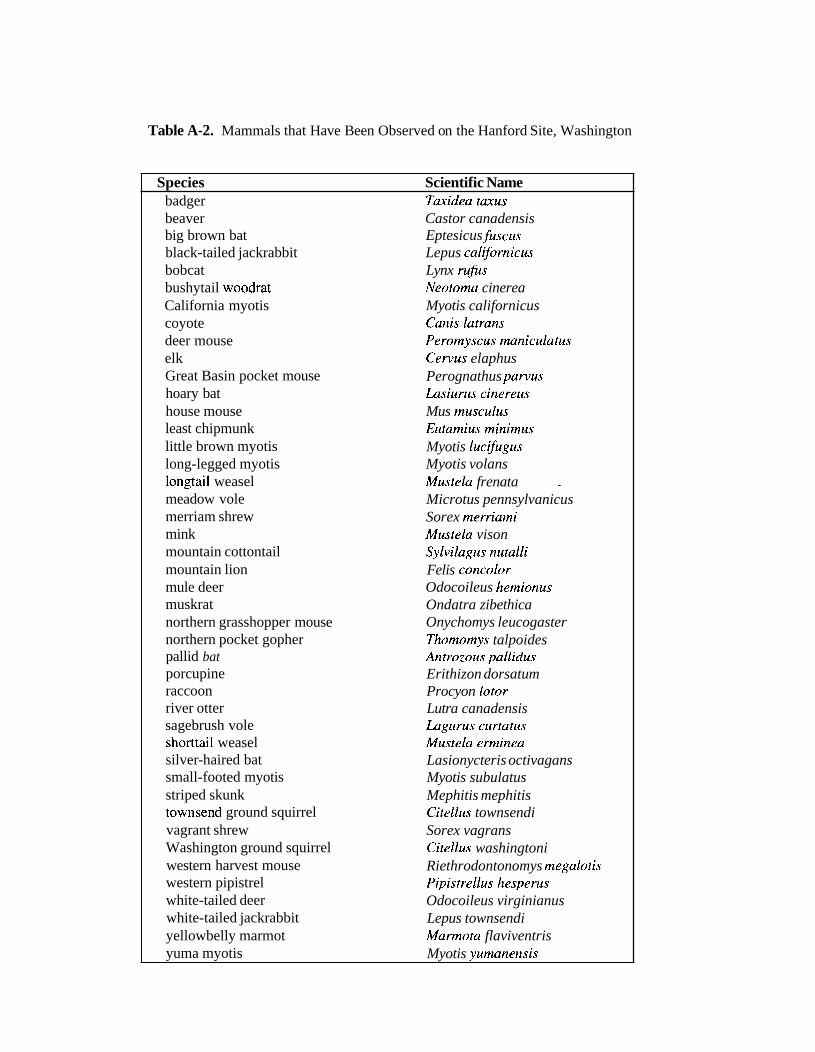
Table A-2. Mammals that Have Been Observed on the Hanford Site, Washington
Species Scientific Name badger Taxidea taxus beaver Castor canadensis big brown bat Eptesicus fuscus black-tailed jackrabbit Lepus californicus bobcat Lynx rubs bushytail woodrat Neotoma cinerea California myotis Myotis californicus coyote Canis latrans deer mouse Peromyscus maniculatus elk Cervus elaphus Great Basin pocket mouse Perognathus parvus hoary bat Lasiurus cinereus house mouse Mus musculus least chipmunk Eutamius minimus little brown myotis Myotis lucifugus long-legged myotis Myotis volans longtail weasel Mustela frenata -
meadow vole Microtus pennsylvanicus merriam shrew Sorex merriami mink Mustela vison mountain cottontail Sylvilagus nutalli mountain lion Felis concolor mule deer Odocoileus hemionus muskrat Ondatra zibethica northern grasshopper mouse Onychomys leucogaster northern pocket gopher Thomomys talpoides pallid bat Antrozous pallidus porcupine Erithizon dorsatum raccoon Procyon lotor river otter Lutra canadensis sagebrush vole Lagurus curtatus shorttail weasel Mustela erminea silver-haired bat Lasionycteris octivagans small-footed myotis Myotis subulatus striped skunk Mephitis mephitis townsend ground squirrel Citellus townsendi vagrant shrew Sorex vagrans Washington ground squirrel Citellus washingtoni western harvest mouse Riethrodontonomys megalotis western pipistrel Pipistre flus hesperus white-tailed deer Odocoileus virginianus white-tailed jackrabbit Lepus townsendi yellowbelly marmot Marmota flaviventris yuma myotis Myotis yumanensis
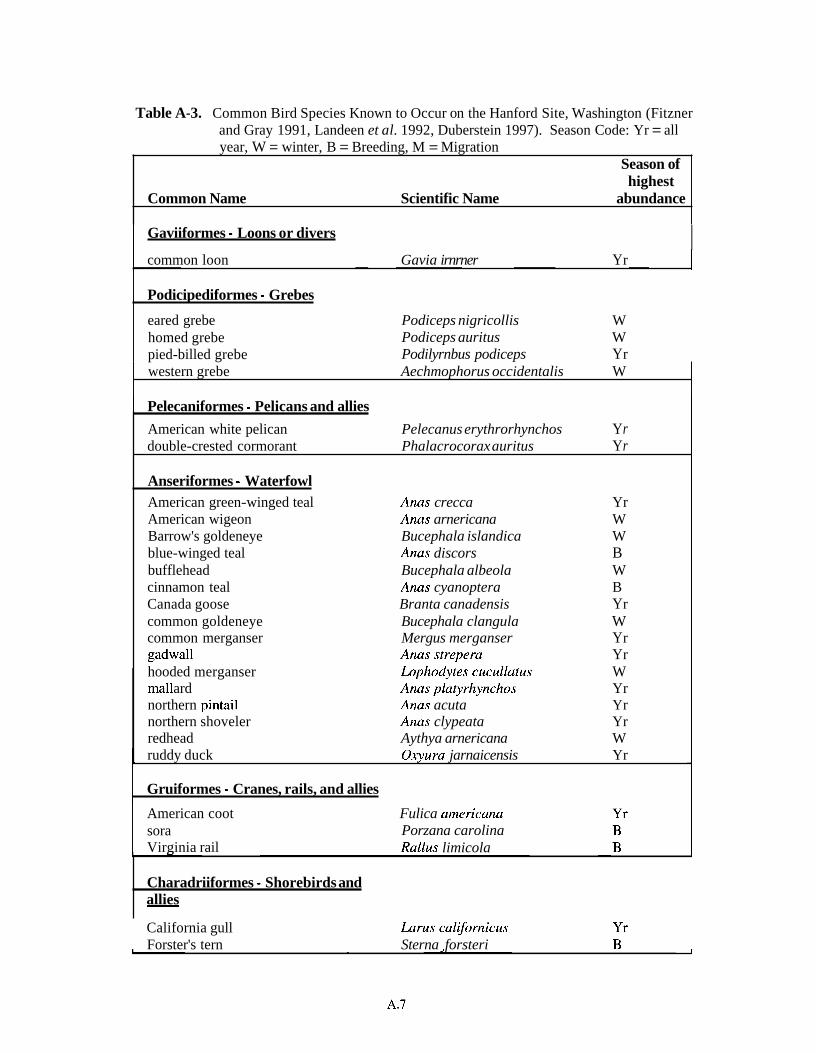
Table A-3. Common Bird Species Known to Occur on the Hanford Site, Washington (Fitzner and Gray 1991, Landeen et al. 1992, Duberstein 1997). Season Code: Yr = all year, W = winter, B = Breeding, M = Migration
Season of highest
Common Name Scientific Name abundance
I Gaviiformes - Loons or divers I I common loon Gavia irnrner Y r 1
Podicipediformes - Grebes
eared grebe Podiceps nigricollis W homed grebe Podiceps auritus W pied-billed grebe Podilyrnbus podiceps Y r western grebe Aechmophorus occidentalis W
I Pelecaniformes - Pelicans and allies
American white pelican Pelecanus erythrorhynchos Y r double-crested cormorant Phalacrocorax auritus Y r
Anseriformes - Waterfowl American green-winged teal Anas crecca Yr American wigeon Anas arnericana W Barrow's goldeneye Bucephala islandica W blue-winged teal Anas discors B bufflehead Bucephala albeola W cinnamon teal Anas cyanoptera B Canada goose Branta canadensis Y r common goldeneye Bucephala clangula W common merganser Mergus merganser Y r gadwall Anas strepera Y r hooded merganser Lophodytes cucullatus W ma1 1 ard Anas platyrhynchos Yr northern pintail Anas acuta Y r northern shoveler Anas clypeata Y r redhead Aythya arnericana W ruddy duck Oxyura jarnaicensis Y r
Gruiformes - Cranes, rails, and allies
American coot sora Virginia rail
Fulica arnericana Porzana carolina Rallus limicola
Charadriiformes - Shorebirds and allies - California gull Forster's tern
Larus californicus Sterna forsteri
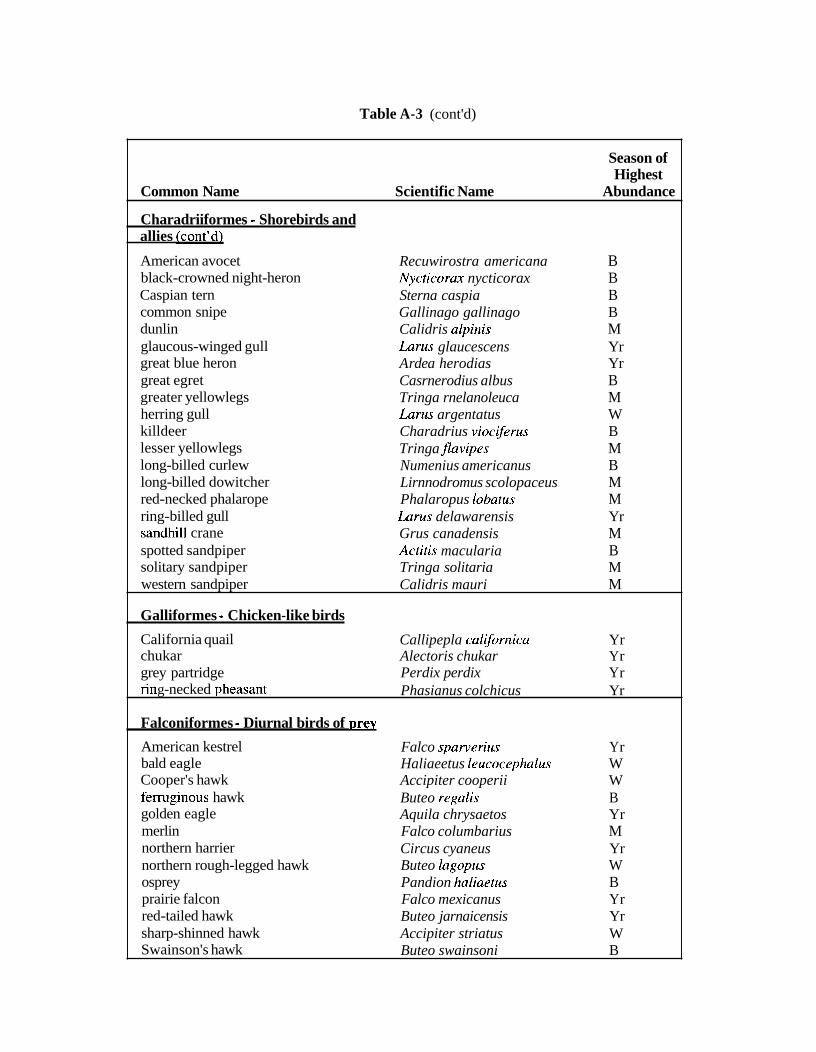
Table A-3 (cont'd)
Season of Highest
Common Name Scientific Name Abundance
Charadriiformes - Shorebirds and allies (cont'd)
American avocet Recuwirostra americana B black-crowned night-heron Nycticorax nycticorax B Caspian tern Sterna caspia B common snipe Gallinago gallinago B dunlin Calidris alpinis M glaucous-winged gull Larus glaucescens Yr great blue heron A rdea herodias Yr great egret Casrnerodius albus B greater yellowlegs Tringa rnelanoleuca M herring gull Larus argentatus W killdeer Charadrius viociferus B lesser yellowlegs Tringa flavipes M long-billed curlew Numenius americanus B long-billed dowitcher Lirnnodromus scolopaceus M red-necked phalarope Phalaropus lobatus M ring-billed gull Larus delawarensis Yr sandhill crane Grus canadensis M spotted sandpiper Actitis macularia B solitary sandpiper Tringa solitaria M western sandpiper Calidris mauri M
Galliformes - Chicken-like birds
California quail Callipepla californica Yr chukar Alectoris chukar Y r grey partridge Perdix perdix Y r
Phasianus colchicus Yr rin g -necked p heasant
Falconiformes - Diurnal birds of prey
American kestrel Falco sparverius Y r bald eagle Haliaeetus leucocephalus W Cooper's hawk Accipiter cooperii W fermginous hawk Buteo regalis B golden eagle Aquila chrysaetos Y r merlin Falco columbarius M northern harrier Circus cyaneus Y r northern rough-legged hawk Buteo lagopus W osprey Pandion haliaetus B prairie falcon Falco mexicanus Y r red-tailed hawk Buteo jarnaicensis Y r sharp-shinned hawk Accipiter striatus W Swainson's hawk Buteo swainsoni B
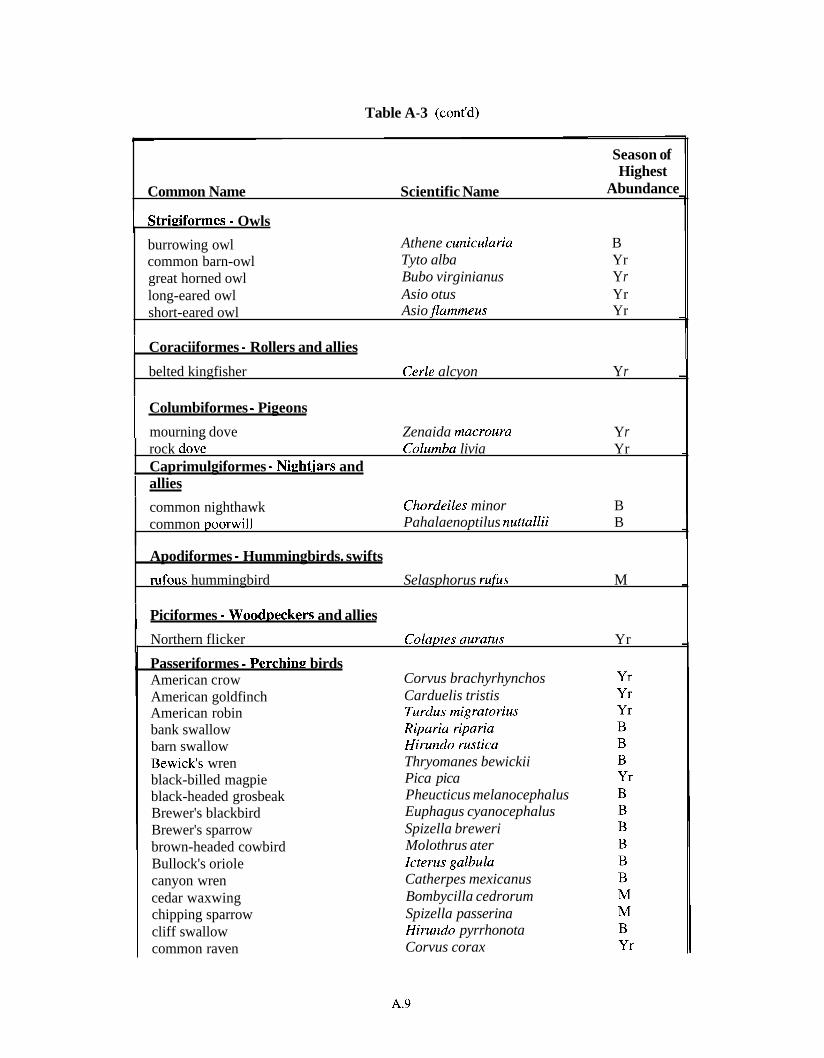
Table A-3 (cont'd)
Season of Highest
Common Name Scientific Name Abundance
1 StriPiformes - Owls
burrowing owl Athene cunicularia B common barn-owl Tyto alba Y r great horned owl Bubo virginianus Y r long-eared owl Asio otus Y r short-eared owl Asio JZammeus Y r
I Coraciiformes - Rollers and allies
belted kingfisher Cerle alcyon Y r
I Columbiformes - Pigeons
1 mourning dove Zenaida macroura Y r rock dove Columba livia Y r Caprimulgiformes - Ni~htjars and
I allies
common nighthawk Chordeiles minor B common poorwill Pahalaenoptilus nuttallii B
Apodiformes - Hummingbirds. swifts
rufous hummingbird Selasphorus rufus M
I Piciformes - Woodseckers and allies
Northern flicker Colaptes auratus Yr
Passeriformes - Perchinp birds American crow American goldfinch American robin bank swallow barn swallow Bewick's wren black-billed magpie black-headed grosbeak Brewer's blackbird Brewer's sparrow brown-headed cowbird Bullock's oriole canyon wren cedar waxwing chipping sparrow cliff swallow common raven
Corvus brachyrhynchos Carduelis tristis Turdus rnigratorius Riparia riparia Hirundo rustica Thryomanes bewickii Pica pica Pheucticus melanocephalus Euphagus cyanocephalus Spizella breweri Molothrus ater Icterus galbula Catherpes mexicanus Bombycilla cedrorum Spizella passerina Hirundo pyrrhonota Corvus corax
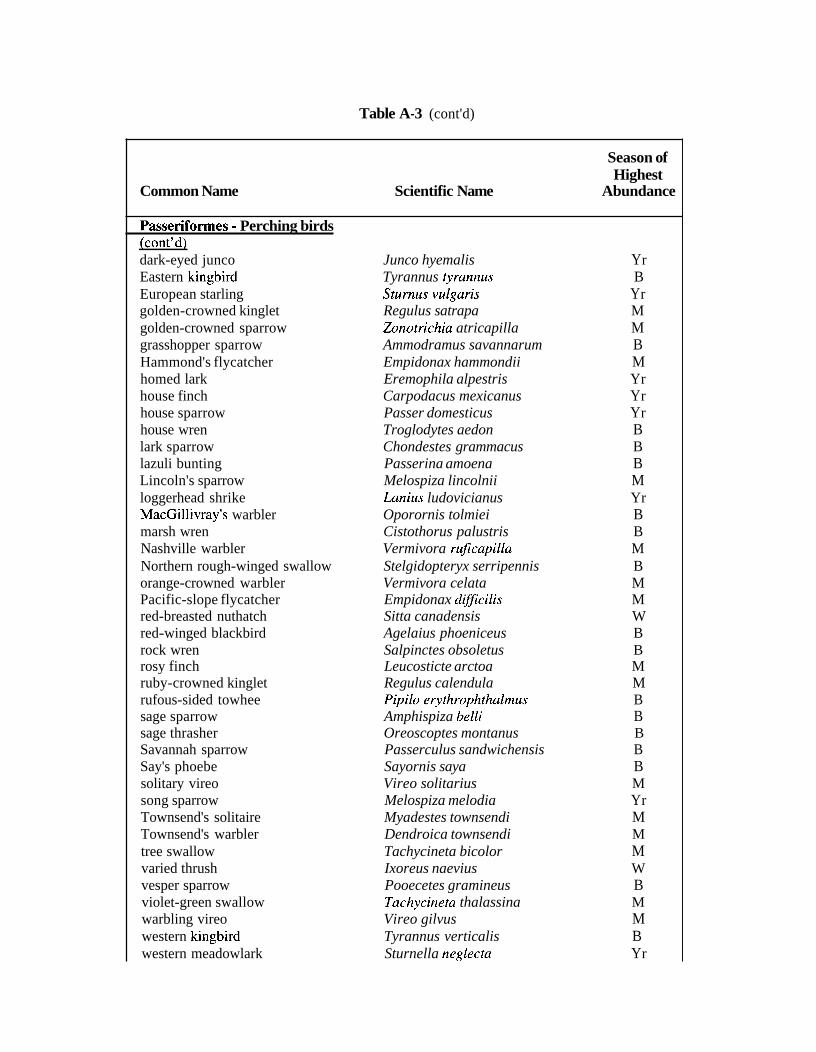
Table A-3 (cont'd)
Season of Highest
Common Name Scientific Name Abundance
Passerifonnes - Perching birds (cont'd) dark-eyed junco Junco hyemalis Y r Eastern kingbird Tyrannus tyrannus B European starling Sturnus vulgaris Y r golden-crowned kinglet Regulus satrapa M golden-crowned sparrow Zonotrichia atricapilla M grasshopper sparrow Ammodramus savannarum B Hammond's flycatcher Empidonax hammondii M homed lark Eremophila alpestris Y r house finch Carpodacus mexicanus Y r house sparrow Passer domesticus Y r house wren Troglodytes aedon B lark sparrow Chondestes grammacus B lazuli bunting Passerina amoena B Lincoln's sparrow Melospiza lincolnii M loggerhead shrike Lanius ludovicianus Yr MacGillivray's warbler Oporornis tolmiei B marsh wren Cistothorus palustris B Nashville warbler Vermivora ru$capilla M Northern rough-winged swallow Stelgidopteryx serripennis B orange-crowned warbler Vermivora celata M Pacific-slope flycatcher Empidonax dificilis M red-breasted nuthatch Sitta canadensis W red-winged blackbird Agelaius phoeniceus B rock wren Salpinctes obsoletus B rosy finch Leucosticte arctoa M ruby-crowned kinglet Regulus calendula M rufous-sided towhee Pipilo erythrophthulmus B sage sparrow Amphispiza belli B sage thrasher Oreoscoptes montanus B Savannah sparrow Passerculus sandwichensis B Say's phoebe Sayornis saya B solitary vireo Vireo solitarius M song sparrow Melospiza melodia Y r Townsend's solitaire Myadestes townsendi M Townsend's warbler Dendroica townsendi M tree swallow Tachycineta bicolor M varied thrush Ixoreus naevius W vesper sparrow Pooecetes gramineus B violet-green swallow Tachyciizeta thalassina M warbling vireo Vireo gilvus M western kingbird Tyrannus verticalis B western meadowlark Sturnella neglecta Y r
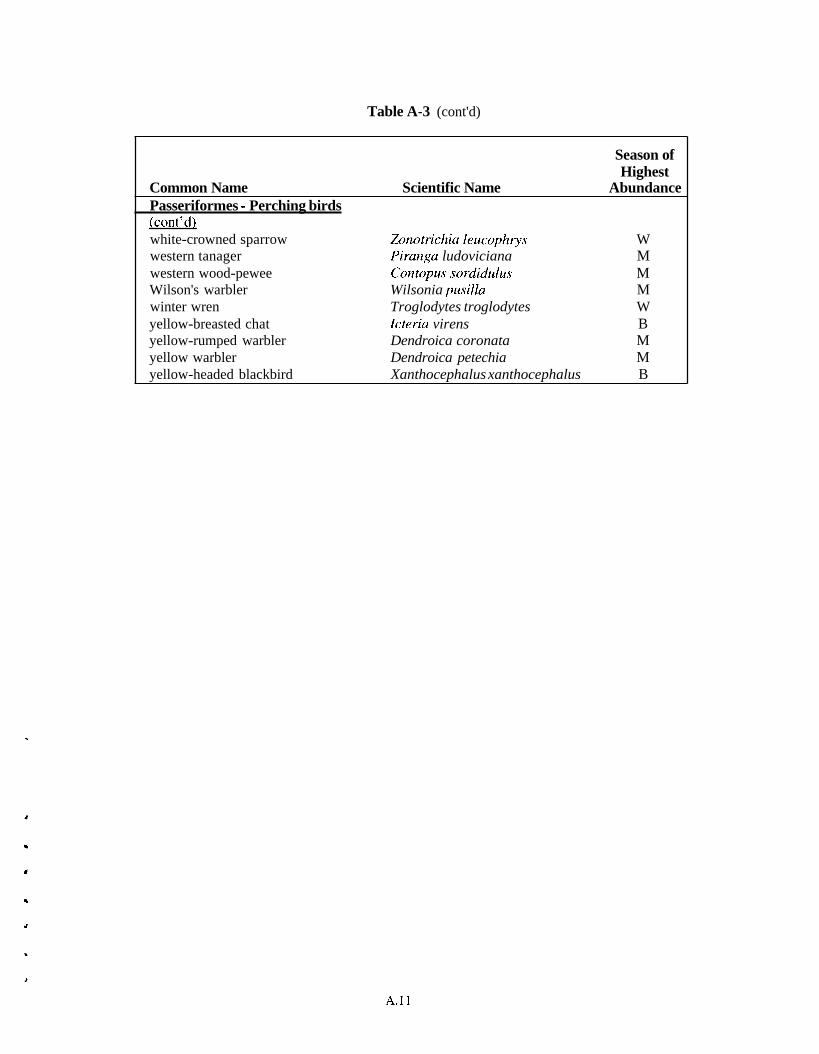
Table A-3 (cont'd)
Season of Highest
Common Name Scientific Name Abundance Passeriformes - Perching birds (cont'd) white-crowned sparrow Zonotrichia leucophrys W western tanager Piranga ludoviciana M western wood-pewee Contopus sordidulus M Wilson's warbler Wilsonia pusilla M winter wren Troglodytes troglodytes W yellow-breasted chat Icteria virens B yellow-rumped warbler Dendroica coronata M yellow warbler Dendroica petechia M yellow-headed blackbird Xanthocephalus xanthocephalus B
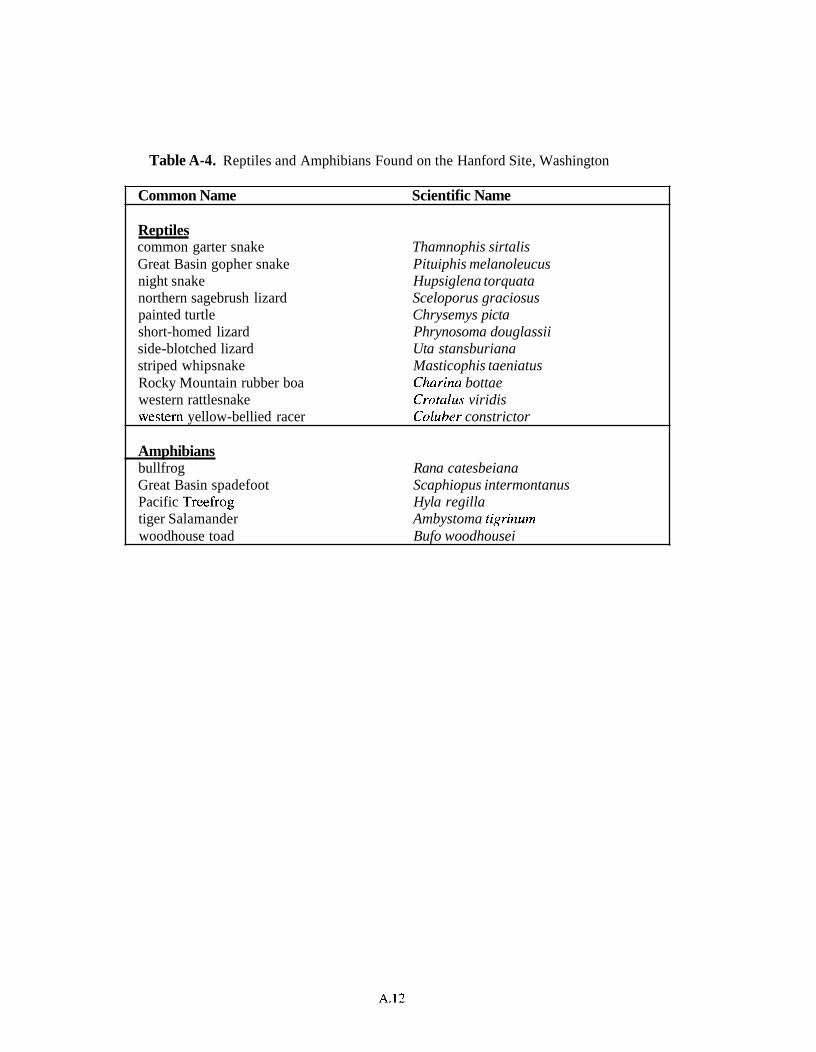
Table A-4. Reptiles and Amphibians Found on the Hanford Site, Washington
Common Name Scientific Name
Reptiles common garter snake Thamnophis sirtalis Great Basin gopher snake Pituiphis melanoleucus night snake Hupsiglena torquata northern sagebrush lizard Sceloporus graciosus painted turtle Chrysemys picta short-homed lizard Phrynosoma douglassii side-blotched lizard Uta stansburiana striped whipsnake Masticophis taeniatus Rocky Mountain rubber boa Charina bottae western rattlesnake Crotalus viridis western yellow-bellied racer Coluber constrictor
Amphibians bullfrog Rana catesbeiana Great Basin spadefoot Scaphiopus intermontanus Pacific Treefrog Hyla regilla tiger Salamander Ambystoma tigrinum woodhouse toad Bufo woodhousei
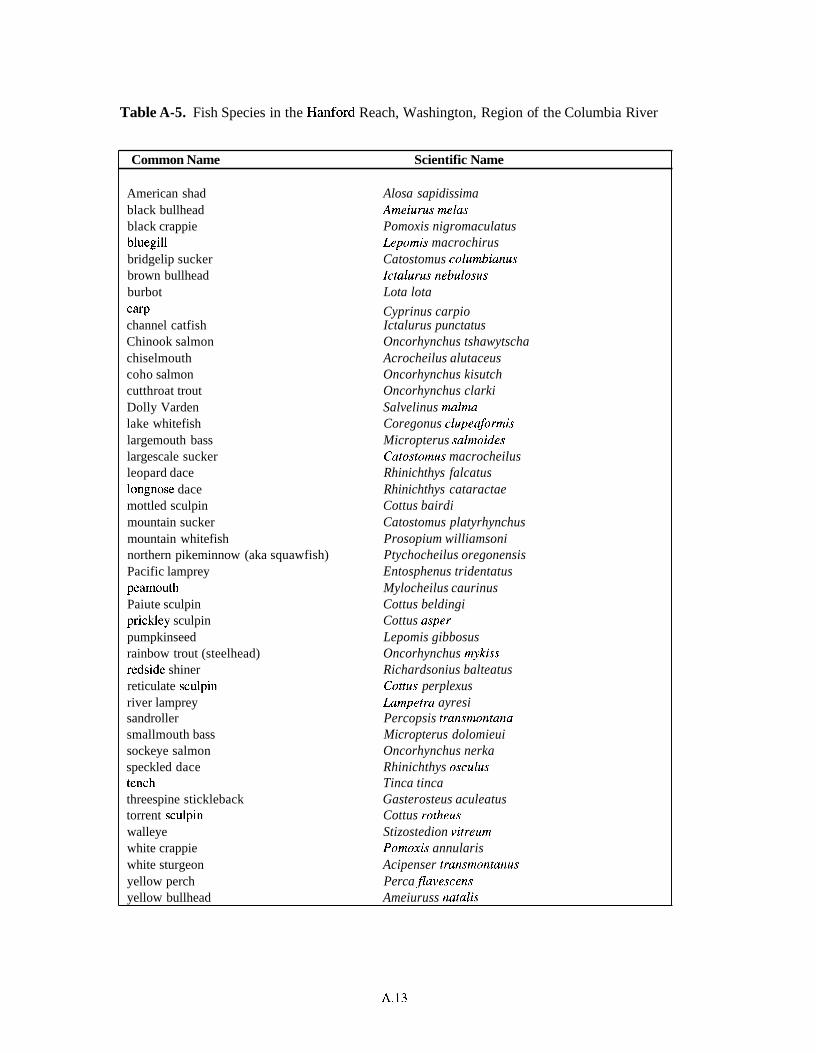
Table A-5. Fish Species in the Hanford Reach, Washington, Region of the Columbia River
Common Name Scientific Name
American shad Alosa sapidissima black bullhead Ameiurus melas black crappie Pomoxis nigromaculatus bluegill Lepomis macrochirus bridgelip sucker Catostomus columbianus brown bullhead Ictalurus nebulosus burbot Lota lota
CarP Cyprinus carpio channel catfish Ictalurus punctatus Chinook salmon Oncorhynchus tshawytscha chiselmouth Acrocheilus alutaceus coho salmon Oncorhynchus kisutch cutthroat trout Oncorhynchus clarki Dolly Varden Salvelinus malma lake whitefish Coregonus clupeaformis largemouth bass Micropterus salmoides largescale sucker Catostomus macrocheilus leopard dace Rhinichthys falcatus longnose dace Rhinichthys cataractae mottled sculpin Cottus bairdi mountain sucker Catostomus platyrhynchus mountain whitefish Prosopium williamsoni northern pikeminnow (aka squawfish) Ptychocheilus oregonensis Pacific lamprey Entosphenus tridentatus pearnouth Mylocheilus caurinus Paiute sculpin Cottus beldingi prickley sculpin Cottus asper pumpkinseed Lepomis gibbosus rainbow trout (steelhead) Oncorhynchus mykiss redside shiner Richardsonius balteatus reticulate sculpin Cottus perplexus river lamprey Lampetra ayresi sandroller Percopsis transmontana smallmouth bass Micropterus dolomieui sockeye salmon Oncorhynchus nerka speckled dace Rhinichthys osculus tench Tinca tinca threespine stickleback Gasterosteus aculeatus torrent sculpin Cottus rotheus walleye Stizostedion vitreum white crappie Pomoxis annularis white sturgeon Acipenser transmontanus yellow perch Perca flavescens yellow bullhead Ameiuruss natalis
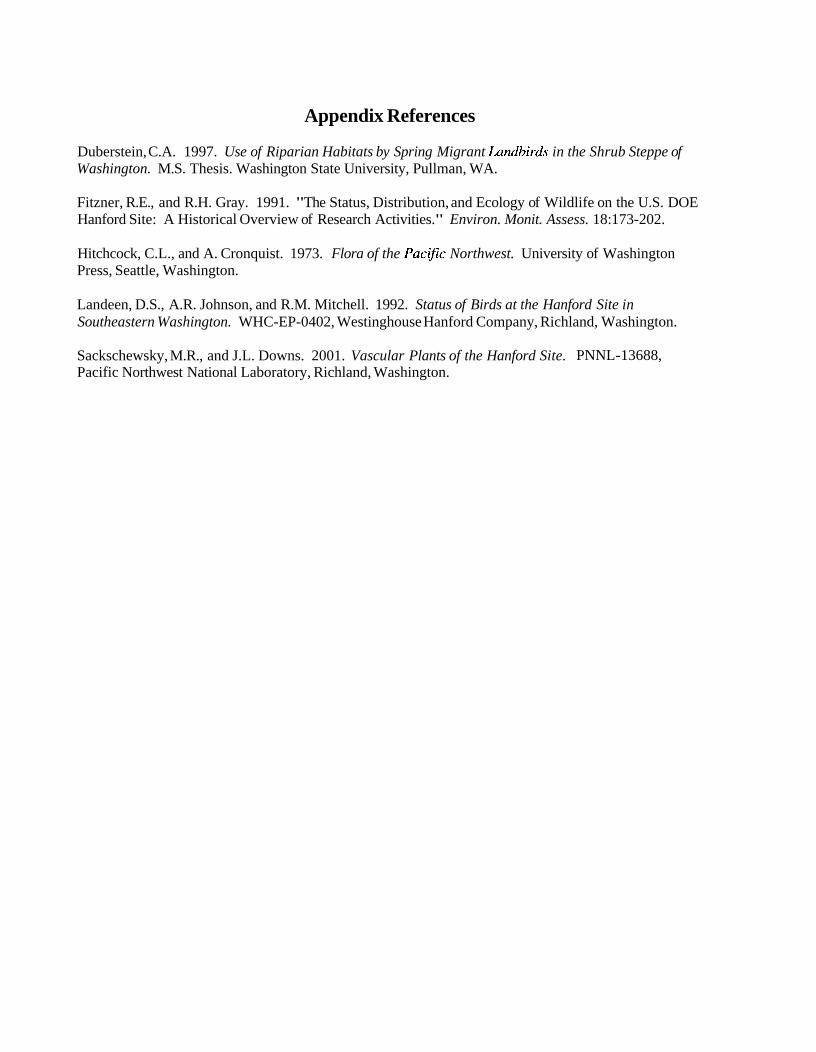
Appendix References
Duberstein, C.A. 1997. Use of Riparian Habitats by Spring Migrant Landbirds in the Shrub Steppe of Washington. M.S. Thesis. Washington State University, Pullman, WA.
Fitzner, R.E., and R.H. Gray. 1991. "The Status, Distribution, and Ecology of Wildlife on the U.S. DOE Hanford Site: A Historical Overview of Research Activities." Environ. Monit. Assess. 18: 173-202.
Hitchcock, C.L., and A. Cronquist. 1973. Flora of the Pacific Northwest. University of Washington Press, Seattle, Washington.
Landeen, D.S., A.R. Johnson, and R.M. Mitchell. 1992. Status of Birds at the Hanford Site in Southeastern Washington. WHC-EP-0402, Westinghouse Hanford Company, Richland, Washington.
Sackschewsky, M.R., and J.L. Downs. 2001. Vascular Plants of the Hanford Site. PNNL-13688, Pacific Northwest National Laboratory, Richland, Washington.
6.0 Statutory and Regulatory Requirements P.L. Hendrickson
The Hanford Site is owned by the U.S. Government and is managed by the U.S. Department of Energy (DOE). It is the policy of the DOE to carry out its operations in compliance with all applicable federal, state, and local laws and regulations, presidential executive orders, DOE directives, and treaty rights. Environmental regulatory authority over the Hanford Site is vested both in federal agencies, primarily the U.S. Environmental Protection Agency (EPA), and in Washington State agencies, primarily the Washington State Department of Ecology (Ecology) and the Washington State Department of Health (DOH). In addition, the Benton Clean Air Authority (BCAA) has certain regulatory authority over Hanford activities, including open burning, asbestos removal, and fugitive dust control. Significant environmental laws, regulations, and other requirements are discussed in this chapter in the following order:
Major federal environmental laws Significant applicable federal and state regulations Presidential executive orders DOE directives Treaties, statutes, and policies relating to Indian Tribes of the Hanford region Existing environmental permits covering activities at the Hanford Site.
There are a number of sources of information available concerning statutory and regulatory requirements as they relate to the National Environmental Policy Act (NEPA) process. Sources available over the Internet include the following:
Links to Hanford NEPA documents at: http:Nwww.hanford.gov/rllresource.asp DOE'S NEPA web site at: http://www.eh.doe.gov/nepa/ Council on Environmental Quality's (CEQ's) web site at: http://www.whitehouse.gov/ces/ EPA NEPA web site at: http:Nepa.,oov/comp1iance/nepa/index.html
The National Environmental Policy Act Compliance Guide (DOE 1998) issued by the DOE Office of Environment, Safety, and Health, contains useful information including regulations, DOE and CEQ guidance, and copies of relevant executive orders, as well as other preparation assistance documents such as checklists.
(The following introduction [boxed text] is intended to be explanatory for persons writing the chapter of a Hanford Site environmental impact statement [EIS] or environmental assessment [EA] covering regulatory requirements, but is not intended to be included in the EIS or EA.) The material following the boxed text can be adapted, as appropriate, for use in an EIS or EA at the discretion of the authors. Additional specificity should be added to the material to reflect the particular circumstances and facts that are the subject of the EIS or EA. An EIS will normally contain more detail than an EA.
Introduction
The CEQ regulations in the Code of Federal Regulations (CFR) at 40 CFR 1500-1508 implement NEPA and set forth requirements for the preparation of environmental documentation by federal agencies that satisfies NEPA. DOE has adopted the CEQ regulations as part of its NEPA implementing procedures (10 CFR 1021.103). The CEQ regulations identify the types of actions proposed by a federal agency that require preparation of an EIS, prescribe the content of an EIS, and identify actions and other environmental reviews that must or should be undertaken by the federal agency in preparing and circulating an EIS. In general, an EIS must be prepared by a federal agency for any major federal action significantly affecting the quality of the human environment (40 CFR 1502.3). The regulations also state reasons why an agency may want to prepare an EA instead of an EIS (40 CFR 1508.9).
A specific requirement in the CEQ regulations (40 CFR 1502.25) is that the draft EIS must list "all federal permits, licenses, and other entitlements which must be obtained in implementing the proposal." If it is uncertain whether a federal permit or license is needed, the draft EIS is to so indicate. There is, however, no requirement in the CEQ regulations or in the DOE NEPA implementing procedures at 10 CFR Part 102 1 that the EIS must list or discuss applicable environmental laws and regulations. Nevertheless, applicable environmental laws and regulations (federal, state, and local) have been discussed in recent Hanford Site EISs and EAs in a chapter usually captioned "Statutory and Regulatory Requirements." The discussion below assumes this chapter is chapter 6 of the EIS or EA, but another chapter number is possible.
Chapter 6 of Hanford Site EISs and EAs should include the list called for by 40 CFR 1502.25(b). The list should also include significant permits that will be needed from federal, state, and local government agencies. Chapter 6 should not normally include information on environmental impacts associated with any of the requirements. For example, Executive Order (E.O.) 12962 requires federal agencies to evaluate the effects of their actions on aquatic systems and recreational fisheries. Although E.O. 12962 should be mentioned in Chapter 6 in appropriate cases, the actual impacts of the alternatives on aquatic systems and recreational fisheries should be discussed in the Environmental Consequences chapter (normally Chapter 5) of the EIS or EA and any recreational fisheries aspects of the affected environment should be discussed in the Affected Environment chapter (normally Chapter 4) of the EIS or EA. Chapter 6 can refer the reader to the portion of the EIS or EA where the environmental impacts associated with a particular environmental requirement are discussed.
The purpose, then, of Chapter 6 in this document is to present a "reference" that can be used as the basis for the preparation of f~lture Hanford Site EISs and EAs. The intent is to present a reasonably complete discussion of federal, state, and local environmental laws, regulations, and permit requirements that are applicable to activities at the Hanford Site. The information in this chapter can then be adapted to any future Hanford Site EISIEA by deleting irrelevant parts and by adding some specificity with respect to the proposed action and the alternatives being considered.
It should be noted that environmental standards and permit requirements usually appear in regulations and not in the laws themselves. Thus, more emphasis is placed on regulations and less on laws in this chapter.
Federal and State Environmental Laws
Federal law governs environmental regulation of federal facilities. Most major federal environmental laws now include provisions for regulation of federal activities that impact the environment. The activity to be regulated is usually an activity being carried out by an agency of the executive branch. The federal environmental law will also typically designate a specific agency, such as EPA or the U.S. Nuclear Regulatory Commission (NRC), as the regulator. In addition, federal laws may provide for the delegation of the environmental regulation of federal facilities to the states or may directly authorize the environmental regulation of federal facilities by the states through waivers of sovereign immunity. At Hanford, all these situations apply in varying degrees. EPA has regulatory authority over Hanford facilities and has delegated regulatory authority to, shares regulatory authority with, or is in the process of delegating regulatory authority to the State of Washington. The State of Washington also asserts its own independent regulatory authority over Hanford facilities under federal waivers of sovereign immunity and state legislation. Washington State Department of Ecology has also delegated various air compliance responsibilities to the BCAA.
As a legal matter at Hanford, applicable federal and state environmental standards must be met. As a practical matter, differences in language between federal and state laws and regulations may result in some differences in applicability and interpretation. Guidance on specific applicability should be obtained from the Office of Chief Counsel of the DOE Richland Operations Office (DOEJRL) or the Office of River Protection (DOE-ORP).
Citation of Laws and Regulations
Laws and regulations may be cited both by their common name and by their location in the appropriate document. Federal laws are most often cited by their common name (e.g., Clean Water Act [CWA]), by their public law (Pub. L. or PL) number, or by their location in the United States Code (USC). Section numbers differ between laws as enacted and as codified in the USC, so it must be understood which is being cited. Federal regulations appear in the CFR. Washington State laws are most often cited by their location in the Revised Code of Washington (RCW). Washington State regulations are cited by their location in the Washington Administrative Code (WAC). Links to the RCW and WAC are available at http://slc.leg..wa.g.ov/ . Announcements of proposed and final federal regulations appear in the Federal Register (FR). Announcements of proposed and final Washington State regulations appear in the Washington State Register.
Specific Federal Laws Cited in the CEQ Regulations
Four federal laws are specifically cited in the CEQ regulations [40 CFR 1502.25(a) and 1504.l(b)]:
Section 309 of the Clean Air Act (CAA) (42 USC 7609) Fish and Wildlife Coordination Act (16 USC 661 et seq.) National Historic Preservation Act (NHPA) (1 6 USC 470 et seq.) Endangered Species Act (ESA) (16 USC 1531 et seq.).
Section 309 of the CAA directs EPA to review and comment in writing on the environmental impacts of any matter relating to EPA's authority contained in proposed legislation, federal construction projects, other federal actions requiring EISs, and new regulations. In addition to commenting on EISs, EPA rates every draft EIS prepared by a federal agency under its Section 309 authority. Ratings are made for the environmental impact of the proposed action and the adequacy of the impact statement. Rating categories for environmental impact are: LO - lack of objections, EC - environmental concerns, EO - environmental objections, and EU - environmentally unsatisfactory. Rating categories for adequacy are: Category 1 - adequate, Category 2 - insufficient information, and Category 3 - inadequate. A summary of EPA rating definitions is available at: http://www.epa.~ov/compliance/nepdcomments/ratins.ht . Responses to EPA's comments on a draft EIS are included in the final EIS.
The CEQ regulations (40 CFR 1502.25[a]) direct federal agencies to prepare draft EISs concurrently with and integrated with environmental impact analyses and related surveys required by the Fish and Wildlife Coordination Act, the NHPA, the ESA, and other environmental review laws and executive orders. The three preceding statutes should be cited in Chapter 6 of a draft EIS. Environmental impacts associated with the laws should be discussed in Chapter 5.
6.1 Federal Environmental Laws
Significant federal environmental laws applicable to the Hanford Site include the following:
Antiquities Act ( I 6 USC 43 1 et seq.)
American Indian Religious Freedom Act (42 USC 1996)
Archaeological and Historic Preservation Act (16 USC 469 et seq.)
Archaeological Resources Protection Act (ARPA) (16 USC 470aa et seq.)
Bald and Golden Eagle Protection Act (16 USC 668 et seq.)
Clean Air Act (CAA) (42 USC 7401 et seq.)
Clean Water Act (CWA) (33 USC 125 1 et seq.) (The CWA is also known as the Federal Water Pollution Control Act)
Comprehensive Environmental Response, Compensation, and Liability Act (CERCLA) as amended by the Superfund Amendments and Reauthorization Act (SARA) (42 USC 9601 et seq.)
Emergency Planning and Community Right-To-Know Act (EPCRA) (42 USC 1 1001 et seq.)
Endangered Species Act (1 6 USC 153 1 et seq.)
Fish and Wildlife Coordination Act (16 USC 661 et seq.)
Hanford Reach Act (PL 100-605), as amended by PL 104-333
Hazardous Materials Transportation Act (49 USC 5101 et seq.)
Migratory Bird Treaty Act (I 6 USC 703 et seq.)
National Historic Preservation Act (NHPA) (16 USC 470 et seq.)
Native American Graves Protection and Repatriation Act (25 USC 3001 et seq.)
National Environmental Policy Act (NEPA) (42 USC 4321 et seq.)
Noise Control Act (42 USC 4901 et seq.)
Pollution Prevention Act (42 USC 13101 et seq.)
Resource Conservation and Recovery Act (RCRA) of 1976 as amended by the Hazardous and Solid Waste Amendments (42 USC 6901 et seq.) of 1984
Safe Drinking Water Act (SDWA) (42 USC 300f et seq.)
Toxic Substances Control Act (TSCA) (15 USC 2601 et seq.).
In addition, the Atomic Energy Act (AEA) (42 USC 201 1 et seq.), the Low-Level Radioactive Waste Policy Act (LLWPA) (42 USC 2021 b et seq.), and the Nuclear Waste Policy Act (NWPA) (42 USC 10101 et seq.), while not environmental laws per se, contain provisions under which environmental regulations applicable to the Hanford Site may be or have been promulgated. Brief descriptions of most of the preceding statutes are in Section 6.1 of the Revised Drafr Hanford Solid (Radioactive and Hazardous) Waste Program Environmental Impact Statement (DOE 2003).
6.2 Federal and State Environmental Regulations
Under the Supremacy Clause of the U.S. Constitution (Article VI, Clause 2), activities of the federal government are ordinarily not subject to regulation by the states unless Congress creates specific exceptions. Congress has created exceptions with respect to environmental regulation and provisions in several federal laws giving specific authority to the states to regulate federal activities affecting the environment. These waivers (or partial waivers) of sovereign immunity appear in Section 1 18 of the CAA, Section 3 13 of the CWA, Section 1447 of the SDWA, Section 6001 of RCRA, and Section 120 of CERCLAISARA. The Federal Facilities Compliance Act is an amendment to RCRA that makes the RCRA waiver of sovereign immunity more explicit. Many Washington State programs, with respect to the environmental regulation of Hanford Site facilities under the preceding statutes, are coordinated with the U.S. Environmental Protection Agency (EPA) Region 10 office.
Federal and state environmental regulations that may apply to operations at the Hanford Site have been promulgated under the CAA, CWA, SDWA, RCRA, CERCLA, SARA, AEA, LLWPA, NWPA, under other federal statutes, and under relevant state statutes.
Several of the more important existing federal and state environmental regulations are discussed briefly below. These regulations are grouped according to environmental media.
6.2.1 Air Quality
The federal Clean Air Act and the Washington Clean Air Act (Revised Code of Washington [RCW] 70.94) provide the statutory basis for air quality regulation of Hanford Site activities. The federal CAA establishes a floor or minimum level of requirements. State requirements can exceed, i.e., be more stringent than, federal requirements.
40 Code of Federal Regulations (CFR) 50, "National Primary and Secondary Ambient Air Quality Standards." EPA regulations in 40 CFR 50 set national ambient air quality standards for sulfur oxides, particulate matter, carbon monoxide, ozone, nitrogen dioxide, and lead. The standards are not directly enforceable, but other enforceable regulations are based on the standards. Washington's ambient air standards are at Washington Administrative Code (WAC) 173-470 through 173-481 and include standards for radionuclides and fluorides. The Hanford Site is within an area that is in attainment with or is unclassifiable for all national ambient air quality standards (40 CFR 81.348).
40 CFR 5 1-52, State Implementation Plans (SIPs). EPA regulations in 40 CFR 5 1-52 establish the requirements for SIPs and record the approved plans. The SIPs are directed at the control of emissions for which federal ambient air standards exist. Information on the Washington SIP is available at: http:Nyosemite.epa.gov/rl O/airpa,oe.nsf/eeSa9f 1901 03579b8825646 10001 b99cIbe3d 13447b9c42c088 2565 16006b2c64?0penDocument.
40 CFR 60, "Standards of Performance for New Stationary Sources." EPA regulations in 40 CFR 60 provide standards for the control of the emission of pollutants to the atmosphere. Construction or modification of an emissions source in an attainment area such as Hanford can require a prevention of significant deterioration (PSD) of air quality permit under 40 CFR 52.21 and WAC 173-400-141.
40 CFR 61, "National Emission Standards for Hazardous Air Pollutants," (NESHAP); 40 CFR 63, National Emission Standards for Hazardous Air Pollutants for Source Categories." EPA hazardous emission standards in 40 CFR 6 1 provide for the control of the emission of hazardous pollutants to the atmosphere. Standards in 40 CFR 61 Subpart H apply specifically to the emission of radionuclides from DOE facilities. Emissions of radionuclides (other than radon-220 and radon-222) to the ambient air from DOE facilities are not to exceed those amounts that would cause any member of the public to receive in any year an effective dose equivalent of 10 rnremlyr (0.1 mSv/yr) (40 CFR 61.92). Standards in 40 CFR 61 Subpart Q apply to the emission of radon from DOE facilities. No source at a DOE facility is to emit more than 20 picocuries per square meter per second (p~i/(m2- sec)) (1.9 p~i/(ft2-sec)) of radon-222 as an average for the entire source into the air (40 CFR 61.192). Approval to construct a new facility or to modify an existing one may be required under 40 CFR 61.07. Emission standards for sources of hazardous air pollutants designated in the 1990 CAA amendments appear at 40 CFR 63.
40 CFR 70, "State Operating Permit Programs." These regulations provide for the establishment of comprehensive state air quality permitting programs. All major sources of air pollutants including hazardous air pollutants are covered. Washington's operating perrnit regulations appear at WAC 173- 401.
40 CFR 93 Subpart B, "Determining Conformity of General Federal Actions to State or Federal
6.6
Implementation Plans." The general conformity requirements require that actions of federal agencies are to comply with state implementation plans designed to achieve national ambient air quality standards.
WAC 173-400 through 173-495, Washington State Air Pollution Control Regulations. Ecology air pollution control regulations, promulgated under the Washington CAA appear in WAC 173-400 through 173-495 and are available at htt~:Nwww.ecv.wa.~ov/laws-ruleslecvwac.html#air. These regulations include emission standards, ambient air quality standards, and the standards in WAC 173- 460, "Controls for New Sources of Toxic Air Pollutants." The State of Washington has delegated much of its authority under the Washington CAA to the BCAA. However, except for certain air pollution sources (e.g., asbestos removal, fugitive dust, and open burning) administered by the BCAA, Ecology continues to administer air pollution control requirements for the Hanford Site.
WAC 246-247, "Radiation Protection--Air Emissions." Washington DOH regulations in WAC 246- 247 contain standards and permit requirements for the emission of radionuclides to the atmosphere.
Regulation I of the Benton Clean Air Authority can be accessed at : http://www.bcaa.net/Re,oPol.htm.
6.2.2 Water Quality
The CWA and the Washington Water Pollution Control Act provide the statutory basis for the regulation of water quality in Washington State. The CWA established the National Pollutant Discharge Elimination System (NPDES) to limit the amount of pollutants that could be discharged.
40 CFR 121, "State Certification of Activities Requiring a Federal License or Permit." These regulations provide for state certification that any activity requiring a federal water permit, i.e., a NPDES permit or a discharge of dredged or fill material permit, will not violate state water quality standards.
40 CFR 122, "EPA Administered Permit Programs: The National Pollutant Discharge Elimination System." EPA regulations in 40 CFR 122 (and also in 40 CFR 125 and 129) apply to the discharge of pollutants from any point source into waters of the United States. These regulations also apply to the discharge of storm waters (40 CFR 122.26) and the discharge of runoff waters from construction areas over 0.02 km2 (0.008 mi2) in size into waters of the United States. NPDES permits may be required by 40 CF% 122. EPA has not delegated to the State of Washington the authority to issue NPDES permits at the Hanford Site.
40 CFR 141, "National Primary Drinking Water Regulations." EPA drinking water standards in 40 CFR 141 apply to Columbia River water at community water supply intakes downstream of the Hanford Site. Standards in 40 CFR 14 1.16 apply indirectly to releases of radionuclides from DOE facilities (and also non-DOE facilities) to the extent that the releases impact community water systems. The average annual concentration of beta particle and photon radioactivity from man-made radionuclides in drinking water are not to produce an annual dose equivalent to the body or any internal organ greater than 4 rnrem (0.04 mSv) in a year. Maximum contaminant levels in community water systems of 5 pCiL (0.18 Bq/L) of combined radium-226 and radium-228; 15 pCi/L (0.56 BqIL) of gross alpha particle activity, including radium-226 but excluding radon and uranium; and 30 pgL for uranium are specified in 40 CFR 141.66. The average annual concentration of beta particle and photon radioactivity from man-made radionuclides in drinking water must not produce an annual dose equivalent to the total body or any internal organ greater than 4 mremlyr (0.04 mSv/yr) [40 CFR 141.66(d)]. In December 2000, EPA issued revised maximum contaminant levels for radionuclides to
6.7
be effective in December 2003 (65 FR 76708). The new rule includes requirements for uranium.
40 CFR 144-147, Underground Injection Control Program. EPA regulations in 40 CFR 144-147 apply to the underground injection of liquids and wastes and may require a permit for any underground injection. In Washington State, EPA has approved Ecology regulations in WAC 173- 21 8, "Underground Injection Control Program," to operate in lieu of the EPA program. The Ecology regulations provide standards and permit requirements for the disposal of fluids by well injection.
10 CFR 1022, "Compliance with Floodplain/Wetlands Environmental Review Requirements." DOE regulations in 10 CFR 1022 implement Executive Orders 11988 and 11990 and apply to DOE activities that are proposed to take place either in wetlands or in floodplains.
33 CFR 322-323,40 CFR 230-233. Construction or placement of structures in the Columbia River and work in the Columbia River, as well as the discharge of dredged or fill material into the Columbia River, require permits under these U.S. Army Corps of Engineers and EPA regulations.
WAC 173- 160. Under WAC 173- 160, DOE provides notification to Ecology for water-well drilling on the Hanford Site.
WAC 173-216, "State Waste Discharge Permit Program." Ecology regulations in WAC 173-216 establish a state permit program for the discharge of waste materials from industrial, commercial, and municipal operations into ground and surface waters of the state. Discharges covered by NPDES or WAC 173-2 18 permits are excluded from the WAC 173-2 16 program. DOE has agreed to meet the requirements of this program at the Hanford Site for discharges of liquids to the ground.
WAC 332-30, "Aquatic Land Management." Where applicable, DOE will obtain an aquatic land use lease or permit from the Washington Department of Natural Resources for the placement of structures in the Columbia River on lands owned by the State of Washington. The U.S. Government owns most of the riverbed along the Hanford Site to the line of navigation.
WAC 246-272-08001 and 246-272-09001. These regulations, administered by the Washington DOH, contain permit requirements for onsite sewage systems.
WAC 246-290. These regulations, administered by the Washington DOH, contain requirements applicable to water systems providing piped water for human consumption.
6.2.3 Hazardous Waste Management
Regulation of hazardous wastes at Hanford is conducted under RCRA, CERCLA, the Tri-Party Agreement, and the Washington State Hazardous Waste Management Act.
40 CFR 300, "National Oil and Hazardous Substances Pollution Contingency Plan." EPA CERCLA regulations in 40 CFR 300 apply to the cleanup of inactive hazardous waste disposal sites, the cleanup of hazardous substances released into the environment, the reporting of hazardous substances released into the environment, and natural resource damage assessments. Four areas of the Hanford Site (100, 200,300, and 1100) were listed on the EPA's National Priorities List (NPL) in November 1989. The 1100 Area was subsequently delisted. Placement on the list requires DOE, in consultation with EPA and Washington State, to conduct remedial investigations and feasibility studies leading to a Record of Decision (ROD) on the cleanup of inactive waste disposal sites at Hanford. Standards for cleanup under CERCLA are "applicable or relevant and appropriate requirements" (ARARs), which may
6.8
include both federal and state laws and regulations. In anticipation of Hanford's being placed on the NPL, DOE, EPA, and Ecology signed the Hanford Federal Facility Agreement and Consent Order (Tri-Party Agreement) on May 15, 1989. This agreement describes the cleanup responsibilities and authorities of the three parties under CERCLA (and RCRA), and also provides for permitting of the treatment, storage, and disposal of hazardous wastes under RCRA. The Tri-Party Agreement has been amended a number of times. The agreement is available at http://www.hanford.gov/tpa/tpahome.htm.
40 CFR 260-268 and 270-272, Hazardous Waste Management. EPA RCRA regulations in 40 CFR 260-268 and 270-272 apply to the generation, transport, treatment, storage, and disposal of hazardous wastes (but not to source, by-product, or special nuclear material [i.e., not in general to radioactive wastes]), and apply to the hazardous component of hazardous radioactive mixed wastes (but not to the radioactive component) owned by DOE. RCRA regulations (40 CFR 268) require treatment of many hazardous wastes before they can be disposed of in landfills (land disposal restrictions). RCRA permits are required for the treatment, storage, or disposal of hazardous wastes. The regulations also require cleanup (corrective action) of any RCRA facility from which there is an unauthorized release before a RCRA permit is granted. Ecology has been authorized by EPA to administer the RCRA program within Washington. Ecology has oversight authority for RCRA corrective actions at Hanford under the Tri-Party Agreement.
40 CFR 280-28 1, Underground Storage Tanks. EPA has regulations in 40 CFR 280-28 I issued under RCRA Subtitle IX that apply to new and existing underground storage tanks containing petroleum or substances regulated under CERCLA (except for hazardous wastes regulated under RCRA). New tanks must meet strict design and operating standards. Owners of new tanks must notify the applicable regulatory agency and certify compliance with the regulations. The regulations require the reporting, investigation, and cleanup of releases from underground tanks. EPA has authorized Washington State to administer the underground storage tank program. Washington's requirements are in RCW 90.76 and WAC 173-360.
WAC 173-303, "Dangerous Waste Regulations." EPA has authorized the State of Washington through Ecology to conduct its own dangerous waste regulation program in lieu of major portions of the RCRA interim and final permit program for the treatment, storage, and disposal of hazardous wastes. Ecology is also authorized to conduct its own program for the hazardous portion of radioactive-mixed wastes. The state regulations include both standards and permit requirements, as well as a larger universe of covered materials than the federal hazardous waste program.
6.2.4 Species Protection
50 CFR 10-24,222,402, and 450-453, Species Protection Regulations. Regulations under the Endangered Species Act, the Bald and Golden Eagle Protection Act, and the Migratory Bird Treaty Act in 50 CFR 10-24 apply to the protection of plant and animal species on the Hanford Site. Regulations in 50 CFR 17, 81,222,223,402, and 450-453 apply to endangered or threatened species. Section 7 of the Endangered Species Act (16 USC 1536) requires that federal agencies I) utilize their authority in furtherance of the purposes of the Act by carrying out programs for the conservation of listed endangered and threatened species, and 2) consult with appropriate federal agencies to ensure that any action carried out is not likely to jeopardize the continued existence of any endangered or threatened species or result in the destruction or adverse modification of critical habitat for such species. The Fish and Wildlife Coordination Act [16 USC 662(a, h)] requires that a federal agency consult with the U.S. Fish and Wildlife Service and the state agency exercising administration over wildlife if any body of water over 0.04 km2 (0.01 6 mi2) in size is to be modified
by a federal agency, or a licensee or permitee of the agency, for any purpose. The purpose of this consultation is to prevent loss and damage to wildlife resources.
6.2.5 Historic and Cultural Resource Preservation
The DOE policy on management of cultural resources (DOE 2001a) provides that:
DOE will uphold [the NHPA, the Archaeological Resources Protection Act, and the Native American Graves Protection and Repatriation Act] by preserving, protecting, and perpetuating cultural resources for future generations in a spirit of stewardship to the extent feasible given the agency's mission and mandates. To do this, DOE will implement management accountability for compliance with federal statutes, executive orders, treaties, DOE orders, and implementation guidance. The Department also ensures that DOE contractors are obligated to implen~ent DOE programs and projects in a manner that is consistent with this Policy and that reflects this commitment in site management contracts.
The background statement in "Management of Cultural Resources at Department of Energy Facilities" (DOE 2001b) further states that:
DOE recognizes the cultural and scientific value of the resources that may exist on the properties under its management or over which it has direct or indirect control. Therefore, DOE has implemented a program to protect these resources and ensure that all DOE facilities and programs comply with all existing cultural resource executive orders, laws, and regulations.
The DOE management document (DOE 2001 b) defines cultural resources to include "historic properties" as defined in the NHPA, "archaeological resources" as defined in the Archaeological Resources Protection Act of 1979, and "cultural items" as defined in the Native American Graves Protection and Repatriation Act.
The NHPA authorizes the Secretary of the Interior to maintain a National Register of Historic Places (16 USC 470a[a][l]). Federal agencies are to consider the effect of their actions on properties included in or eligible for inclusion in the Register and afford the Advisory Council on Historic Preservation a reasonable opportunity to comment on such actions (16 USC 470f).
The Archaeological Resources Protection Act of 1979 prohibits the excavation of material remains of past human life that have archaeological interest and are at least 100 years old without a permit from the appropriate federal land manager or an exemption (16 USC 470bb, 470ee).
The Native American Graves Protection and Repatriation Act prohibits the intentional excavation or removal of human remains or cultural items without a written pennit, and prescribes protective measures and repatriative actions to be taken in the event that human remains or cultural items are discovered inadvertently (25 USC 3001 et seq.).
Additional information is available by contacting the Department of Energy, Richland Operations Office, Hanford Cultural and Historic Resources Program or by accessing the Hanford website at http://~~~.hanf~rd.~ov/doe/culres/index.htm.
6.2.6 Land Use
The Hanford Reach National Monument was created on June 9,2000, by a proclamation (65 FR 37253) signed by President Clinton under the authority of the Antiquities Act. The Monument includes 792.6 km2 (306 mi2) of federally owned land making up a portion of the Hanford Site. The principal components of the Monument are:
the Fitzner~Eberhardt Arid Lands Ecology Reserve (ALE), the McGee Ranch and Riverlands area, the Saddle Mountain National Wildlife Refuge, the quarter-mile study strip along the south and west sides of the Columbia River corridor as designated by the Hanford Reach Act (Hanford Reach Act [I9881 as amended by Public Law 104-333), the federally owned islands within the portion of the Columbia River included in the Monument, and the Hanford Sand Dune Field.
The U.S. Fish and Wildlife Service (USFWS) manages approximately 67,000 ha (1 66,000 ac) of Monument lands that are within ALE and the Wahluke Slope (Wahluke Unit and Saddle Mountain Unit) under permit from DOE. DOE manages the remainder of the Monument. The June 9,2000, proclamation does not affect the responsibilities and authority of DOE on Hanford Site lands nor does it affect DOE activities on lands not included within the Monument boundaries. In a separate memorandum'") to the Secretary of Energy, DOE was directed by the President to protect the natural values of the Hanford Site land not included within the Monument. DOE and USFWS signed a Memorandum of Understanding on June 14, 2001, covering management responsibilities for the Monument. USFWS issued a Notice of Intent to prepare a comprehensive conservation plan and associated EIS for the Monument in June 2002 (67 FR 40333).
In September 1999, DOE issued the Final Hanford Comprehensive Land-Use Plan Environmental Impact Statement (DOE 1999). The ROD issued in November 1999 (64 FR 61615) states that the purpose of the land-use plan and its implementing policies is to facilitate decision making about the Hanford Site's uses and facilities over at least the next 50 years. The ROD adopts the Preferred Alternative land-use maps, designations, policies, and implementing procedures as described in the 1999 EIS and designates the Central Plateau (200 Areas) for Industrial-Exclusive use. In November of 1999, USFWS signed a Record of Decision documenting USFWS's adoption of the DOE'S Final Comprehensive Land Use Plan.
6.2.7 Other
40 CFR 19 1, "Environmental Radiation Protection Standards for Management and Disposal of Spent Nuclear Fuel, High-Level and Transuranic Radioactive Wastes." EPA regulations in 40 CFR 191 provide environmental standards for the management, storage, and disposal of spent nuclear fuel, high-level radioactive wastes, and transuranic radioactive wastes at high-level or transuranic waste disposal sites.
40 CFR 355, 370, and 372. These regulations implement the federal Emergency Planning and Community Right-to-Know Act (EPCRA). EPCRA was signed into law in October 1986 as part of
'a ) The memorandum is available at http://c1inton6.nara.go~/2000/06/2000-06-09-memorandum-on-hanford-reach- national-monument.htm1.
6.1 1
the Superfund Amendments and Reauthorization Act.
40 CFR 700-799, TSCA Regulations. EPA's regulations in 40 CFR 700-799 implement TSCA and, in particular, regulate polychlorinated biphenyls (PCBs) and dioxins and partially regulate asbestos.
40 CFR 1500-1508, Council on Environmental Quality. The CEQ regulations in 40 CFR 1500-1508 implement NEPA.
10 CFR 830, "Nuclear Safety Management." Part 830 contains nuclear safety management requirements applicable to DOE contractors.
10 CFR 835, "Occupational Radiation Protection." These DOE rules establish radiation protection standards, limits, and program requirements for protecting individuals from ionizing radiation resulting from DOE activities.
10 CFR 102 1, "National Environmental Policy Act Implementing Procedures." DOE regulations in 10 CFR 1021 set out procedures that DOE uses to comply with section 102(2) of NEPA and the CEQ regulations for implementing the procedural provisions of NEPA (40 CFR parts 1500-1508). The DOE regulations supplement, and are to be used in conjunction with, the CEQ regulations.
49 CFR 17 1-179, Hazardous Materials Regulations. These Department of Transportation regulations apply to the handling, packaging, labeling, and shipment of hazardous materials offsite, including radioactive materials and wastes.
WAC 173-60, "Maximum Environmental Noise Levels." These regulations contain maximum permissible environmental noise levels in Washington. Additionally, the Occupational Safety and Health Administration has regulations covering noise exposure of occupational workers at 29 CFR 1910.95.
6.3 Executive Orders
DOE is subject to a number of presidential executive orders (E.0.s) concerning environmental matters. Some of these orders may be appropriately considered in a Hanford EIS or EA. Potentially relevant E.0.s include:
E.O. 1 15 14 Protection and Enhancement of Environmental Quality
E.O. 11593 Protection and Enhancement of the Cultural Environment
E.O. 11738 Providing for Administration of the Clean Air Act and the Federal Water Pollution Control Act with Respect to Federal Contracts, Grants, or Loans
E.O. 1 1988 Floodplain Management
E.O. 1 1990 Protection of Wetlands
E.O. 12088 Federal Compliance with Pollution Control Standards
E.O. 121 14 Environmental Effects Abroad of Major Federal Actions
6.12
E.O. 121 96 Occupational Safety and Health Programs for Federal Employees
E.O. 125 80 Superfund Implementation
E.O. 12898 Federal Actions to Address Environmental Justice in Minority Populations and Low- Income Populations
E.O. 12962 Recreational Fisheries
E.O. 13007 Indian Sacred Sites
E.O. 13045 Protection of Children from Environmental Health Risks and Safety Risks (as amended by E.O. 13296)
E.O. 13101 Greening the Government through Waste Prevention, Recycling, and Federal Acquisition
E.O. 13 1 12 Invasive Species
E.O. 13 123 Greening the Government through Energy Efficient Management
E.O. 13 134 Developing and Promoting Biobased Products and Bioenergy
E.O. 13 148 Greening the Government through Leadership in Environmental Management
E.O. 13 149 Greening the Government through Federal Fleet and Transportation Efficiency
E.O. 1 3 150 Federal Workforce Transportation
E.O. 13 175 Consultation and Coordination with Indian Tribal Governments
E.O. 13 186 Responsibilities of Federal Agencies to Protect Migratory Birds
E.O. 131 95 Trails for America in the 21 " Century
E.O. 13287 Preserve America
6.4 DOE Directives
Categories of DOE directives include orders, policy statements, standards, notices, manuals, and contractor requirements documents.
DOE directives can be accessed at :
Directives with particular application to DOE'S environmental activities are found in the 400 series of the new series directives and the 5000 series (particularly the 5400 and 5800 series) under the old series directives.
6.13
Topics covered in DOE directives include environmental protection, safety, and health protection standards; hazardous and radioactive-mixed waste management; cleanup of retired facilities; safety requirements for the packaging and transportation of hazardous materials; safety of nuclear facilities; radiation protection; and other standards for the safety and protection of workers and the public. Regulations and standards of other federal agencies and standard setting entities are incorporated by reference into some DOE directives.
6.5 Treaties, Statutes, and Policies Relating to Indian Tribes of the Hanford Region
DOE'S relationship with American Indians is based on treaties, statutes, Executive Orders, and DOE policy statements. Representatives of the United States negotiated treaties with leaders of various Columbia Plateau American Tribes and Bands in June 1855 at Camp Stevens in the Walla Walla Valley. The negotiations resulted in three treaties, one with the 14 tribes and bands of the group that would become the Confederated Tribes and Bands of the Yakama Nation, one with the three tribes that would become the Confederated Tribes of the Umatilla Reservation, and one with the Nez Perce Tribe of Idaho. The U.S. Senate ratified the treaties in 1859. The three treaties are included in Appendix A of the Final Hanford Comprehensive Land-Use Plan EIS (DOE 1999). The negotiated treaties are as follows:
1. Treaty with the Walla Walla, Cayuse, etc. (June 9, 1855; 12 Stats. 945)
2. Treaty with the Yakama (June 9, 1855; 12 Stats. 951)
3. Treaty with the Nez Perce (June 1 1, 1855; 12 Stats. 957).
The Confederated Tribes and Bands of the Yakama Nation of the Yakama Reservation, the Confederated Tribes of the Umatilla Reservation, and the Nez Perce Tribe of Idaho are federally recognized tribes that are eligible for funding and services from the Bureau of Indian Affairs by virtue of their status as Indian tribes (67 FR 46328, July 12, 2002).
The terms of the three preceding treaties are similar. Each of the three tribal organizations agreed to cede large blocks of land to the United States. The Hanford Site is within the ceded lands of the Confederated Tribes and Bands of the Yakama Nation and the Confederated Tribes of the Umatilla Reservation. The treaties reserved to the Tribes certain lands for their exclusive use (the three reservations). The treaties also secured to the Tribes certain rights and privileges to continue traditional activities outside the reservations. These included 1 ) the right to fish at usual and accustomed places in common with citizens of the United States, and 2) the privileges of hunting, gathering roots and berries, and pasturing horses and cattle on open and unclaimed lands.
The U.S. Department of Energy American Indian and Alaska Native Tribal Government Policy (DOE 2000) states, in part, that DOE
Recognizes the federal trust relationship with American Indians and Alaska Native Nations and will fulfill its trust responsibilities to them
Recognizes and commits to a government-to-government relationship and will institute appropriate protocols and procedures for program and policy implementation
Complies with applicable federal cultural resource protection and other laws and executive orders will assist in preservation and protection of historic and cultural sites and traditional religious practices.
The American Indian Religious Freedom Act (42 USC 1996) establishes that U.S. policy is to protect and preserve for American Indians their inherent rights of freedom to believe, express, and exercise their traditional religions, including access to sites, use and possession of sacred objects, and the freedom to worship through ceremonies and traditional rites.
The Native American Graves Protection and Repatriation Act establishes the right of lineal descendants, Indian Tribes, and Native Hawaiian organizations to certain Native American human remains, funerary objects, sacred objects, or objects of cultural patrimony discovered on federal lands
1
after November 16, 1990 (25 USC 3002). When discovered during an activity on federal lands, the activity is to cease and appropriate tribal governments are to be notified. Work on the activity may resume, if the activity is otherwise lawful, 30 days after the receipt of certification that tribal governments have received the notice.
Executive Order 13007 "Indian Sacred Sites," (6 1 FR 2677 1, May 29, 1996) directs federal agencies, to the extent practicable, permitted by law, and not clearly inconsistent with essential agency functions, to 1) accommodate access to and ceremonial use of American Indian sacred sites by their religious practitioners, and 2) avoid adversely affecting the physical integrity of such sacred sites. Where appropriate, agencies are to maintain the confidentiality of sacred sites.
DOE/RL interacts and consults regularly and directly with the three federally recognized tribes q
affected by Hanford operations; that is, the Nez Perce Tribe of Idaho, the Confederated Tribes of the Umatilla Reservation, and the Confederated Tribes and Bands of the Yakama Nation. In addition, the Wanapum, who still live adjacent to the Hanford Site, are a non-federally recognized tribe that has strong cultural ties to the Site. The Hanford area was also used by groups whose descendants are now enrolled members of the Confederated Tribes of the Colville Reservation. The Wanapum and the Confederated Tribes of the Colville Reservation are also consulted on cultural resource issues in accordance with DOE policy and relevant legislation.
6.6 Permits
Information on the status of environmental permits at'Hanford is included in the Annual Hanford Site Environmental Permitting Status Report (DOE 2002). The report includes information on environmental permitting under RCRA; TSCA; CAA; CWA; the State Waste Discharge, Hydraulic Permit, and Underground Injection Control Programs; the Onsite Sewage System Program; and the Petroleum Underground Storage Tank Program.
The Hanford Site's RCRA permit is in two portions, one portion issued by EPA Region 10 and the other portion issued by Ecology. The EPA portion of the RCRA permit covers the Hazardous and Solid Waste Amendments portion of the RCRA permit (EPA 1994). The Ecology portion of the Hanford Site RCRA permit covers compliance with Ecology's dangerous waste regulations (Ecology 2001 a). The Ecology portion of the permit includes standard conditions, general facility conditions, and specific conditions for individual operating Treatment, Storage, andlor Disposal (TSD) units, TSD units undergoing corrective action, and TSD units undergoing closure.
Clean Air Act compliance requires both facility and sitewide compliance. The Annual Hanford Site Environmental Permitting Status Report (DOE 2002) identifies existing facility-specific and sitewide

CAA compliance activities. The air operating permit for the Hanford Site issued by Ecology became effective in July 2001 (Ecology 2001b).
The Hanford Site National Pollutant Discharge Elimination System Permit (WA-002591-7) governs liquid process effluent discharges to the Columbia River (DOE 2002).
DOE has asserted a federally reserved water withdrawal right with respect to its Hanford operations. Current Hanford activities use water withdrawn under the DOE'S federally reserved water rights.
References
10 CFR 830. "Nuclear Safety Management." U.S. Code of Federal Regulations. Online at: http://www.gpoaccess.govlcfrlindex.htn:l
10 CFR 835. "Occupational Radiation Protection." U.S. Code of Federal Regulations. Online at: http://www.gpoaccess.gov/cfr/index.htrnl
10 CFR 1021. "DOE National Environmental Policy Act Implementing Procedures." U.S. Code of Federal Regulations. Online at: http://www.~poaccess.~ov/cfr/index.html
10 CFR 1022. "Compliance with FloodplainIWetlands Environmental Review Requirements." U.S. Code of Federal Regulations. Online at: http:Nwww.access.gpo.go~~/nardcfr/index.htrnl
29 CFR 1910. "Occupational Safety and Health Standards." U.S. Code of Federal Regulations. Online at: http://www.gpoaccess.p;ov/cfr/index.html
33 CFR 322. "Permits for Structures or Work in or Affecting Navigable Waters of the United States." U.S. Code of Federal Regulations. Online at: http:llwww.access.~po.gov/nardcfr/index.html
33 CFR 323. "Pennits for Discharges of Dredged or Fill Material Into Waters of the United States." U.S. Code of Federal Regulations. Online at: http://www.access.~po.go~~/nardcfr/index.html
40 CFR 50. "National Primary and Secondary Ambient Air Quality Standards." U.S. Code of Federal Regulations. Online at: http://www.p;poaccess.gov/cfr/index.html
40 CFR 51. "Requirements for Preparation, Adoption, and Submittal of Implementation Plans." U.S. Code of Federal Regulations. Online at: htt~://www.~~oaccess.~ov/cfr/index.html
40 CFR 52. "Approval and Promulgation of Implementation Plans." U.S. Code of Federal Regulations. Online at: http://www.gpoaccess.gov/cfr/index.html
40 CFR 60. "Standards of Performance for New Stationary Sources." Online at: http://www.gpoaccess.gov/cfr/index.html
40 CFR 61. "National Emission Standards for Hazardous Air Pollutants." U.S. Code of Federal Regulations. Online at: http:Nww~~.gpoaccess.gov/cfr/index.html
40 CFR 63. "National Emissions Standards for Hazardous Air Pollutants for Source Categories." U.S. Code of Federal Regulations. Online at: htt~://www.~~oaccess.~ov/cfr/index.htrnl
40 CFR 70. "State Operating Permit Programs." U.S. Code of Federal Regulations. Online at: http://~~~.gpoaccess.gov/cfr/index.html
40 CFR 81. "Designation of Areas for Air Quality Planning Purposes." U.S. Code of Federal Regulations. Online at: http://ww~~.ppoaccess.gov/cfr/index.html
40 CFR 93 Subpart B. "Determining Conformity of Federal Actions to State and Federal Implementation Plans." U.S. Code of Federal Regulations. Online at: http://www.~poaccess.gov/cfr/index.html
40 CFR 121. "State Certification of Activities Requiring a Federal License or Permit." U.S. Code of Federal Regulations. Online at: http:Nwww.g;voaccess.aov/cfr/index.html
40 CFR 122. "EPA Administered Permit Programs: The National Pollutant Discharge Elimination System." U.S. Code of Federal Regulations. Online at: http://www.gpoaccess.g;ov/cfr/index.html
40 CFR 141. "National Primary Drinking Water Regulations." U.S. Code of Federal Regulations. Online at: ~ o a c c e s s . g o v / c f r / i n d e x . h t m l
40 CFR 144. "Underground Injection Control Program." U.S. Code of Federal Regulations. Online at: http://www.gpoac~ess.gov/cfr/index.html
40 CFR 19 1. "Environmental Radiation Protection Standards for Management and Disposal of Spent Nuclear Fuel, High-Level and Transuranic Radioactive Wastes." U.S. Code of Federal Regulations. Online at: http://www.g~oaccess.aov/cfr/index.html
40 CFR 230. "Section 404(b)(l) Guidelines for Specification of Disposal Sites for Dredged or Fill Material." U.S. Code of Federal Regulations. Online at: http://www.gpoaccess.gov/cfr/index.html
40 CFR 260-282. "Resource Conservation and Recovery Act." U.S. Code of Federal Regulations. Online at: http://www.apoaccess.g;ov/cfr/index.html
40 CFR 300. "National Oil and Hazardous Substances Pollution Contingency Plan." U.S. Code of Federal Regulations. Online at: http:Nwww.access.g;po.~ov/nara/cfr/waisidx 02/40cfr300 02.html
40 CFR 350 - 374. "Emergency Planning and Community Right-to-Know Act regulations." U.S. Code of Federal Regulations. Online at: http://www.g;poaccess.gov/cfr/index.html
4.0 CFR 700-799. "Toxic Substances Control Act." U.S. Code of Federal Regulations. Online at: http://www.moaccess.g;ov/cfr/index.html
40 CFR 761. "Polychlorinated Biphenyls (PCBs) Manufacturing, Processing, Distribution in Commerce, and Use Prohibitions." U.S. Code of Federal Regulations. Online at: http://www.g;poaccess.g;ovlcfrlindex.html
40 CFR 1500-1508. "Council on Environmental Quality Regulations for Implementing the Procedural Provision of the National Environmental Policy Act." U.S. Code of Federal Regulations. Online at: http://~~~.gp~a~~e~s.g;~~/~fr/index.htrnl
49 CFR 105-1 80. "Subtitle B--Other Regulations Relating to Transportation. Chapter I. Research and Special Programs Administration." U.S. Code of Federal Regulations. Online at: http:Nwww.moaccess.aov/cfr/index.html
49 CFR 397. "Transportation of Hazardous Materials: Driving and Parking Rules." U.S. Code of Federal Regulations. Online at: http://www.access.gpo.gov/nara/cfr/index.html.
50 CFR. "Wildlife and Fisheries." U.S. Code of Federal Regulations. Online at: http://www.access.apo.g;ov/nara/cfr/index.html
64 FR 61615. "Record of Decision: Hanford Comprehensive Land-Use Plan Environmental Impact Statement." Federal Register (November 12, 1999).
65 FR 37253. "Establishment of the Hanford Reach National Monument." Proclamation 7319 of June 9,2000 by the President of the United States of America. Federal Register (June 9 , 2000).
65 FR 76708. "National Primary Drinking Water Regulations; Radionuclides; Final Rule." Federal Register (December 7,2000).
67 FR 40333. "Notice of Intent to Prepare a Comprehensive Conservation Plan and Associated Environmental Impact Statement for Hanford Reach National MonumentlSaddle Mountain National Wildlife Refuge." Federal Register (June 12, 2002).
67 FR 46328. "Indian Entities Recognized and Eligible to Receive Services from the United States Bureau of Indian Affairs." Federal Register (July 12,2002).
15 USC 2601, et seq., Toxic Substances Control Act. Online at: http://www.gpoaccess.gov/uscode/index.html
16 USC 431, et seq. Antiquities Act of 1906 (American Antiquities Preservation Act). Online at: http:Nwww.g~oaccess.nov/uscode/index.ht~nl
16 USC 469 et seq. Archaeological and Historic Preservation Act. Online at: http://www .gpoaccess.gov/uscode/index.html
16 USC 470aa et seq. Archaeological Resources Protection Act of 1979. Online at: http://www .gpoaccess.gov/uscode/index.htrnl
16 USC 470, et seq. National Historic Preservation Act. Online at: http://~~~.~oaccess.gov/uscode/index.html
16 USC 661, et seq. Fish and Wildlife Coordination Act. Online at: http://www.gpoaccess.gov/uscode/index.html
16 USC 668, et seq. Bald and Golden Eagle Protection Act. Online at: http://www.gpoaccess.gov/uscode/index.html
16 USC 703, et seq. Migratory Bird Treaty Act. Online at: http://~~w.gp~a~~e~~.g~~/~~~ode/index.htrnl
16 USC 153 1, et seq. Endangered Species Act. Online at: htt~://www.~~oaccess.ov/uscode/index.html
25 USC 3001, et seq. Native American Graves Protection and Repatriation Act. Online at: http://www.gpoaccess.gov/uscode/index.htn~l
33 USC 125 1, et seq. Clean Water Act. Online at: http://www.~~oaccess.~ov/uscode/index.htinl
42 USC 300f, et seq. Safe Drinking Water Act. Online at: htt~://www.gpoaccess.gov/~~scode/index.html
42 USC 1996. American Indian Religious Freedom Act. Online at: http://www .gpoaccess.gov/uscode/index.html
42 USC 201 1, et seq. Atomic Energy Act. Online at: htt~:llwww.~~oaccess.~ov/uscode/index.html
42 USC 2021b, et seq. Low-Level Radioactive Waste Policy Act. Online at: http:llwww.gpoaccess.gov/uscode/index.html
42 USC 4321, et seq. National Environmental Policy Act. Online at: http://~~~.gp~a~~e~~.g~v/uscode/index.html
42 USC 4901, et seq. Noise Control Act. Online at: http:/Iwww.gpoaccess.gov/uscode1index.htrr1l.
42 USC 6901, et seq. Resource Conservation and Recovery Act of 1976. Online at: http:Nwww.gpoaccess.gov/uscode/index.html
42 USC 7401, et seq. Clean Air Act. Online at: http://www.gpoaccess.p;ov/uscode/index.html
42 USC 9601, et seq. Comprehensive Environmental Response, Compensation, and Liability Act as amended by the Supeend Amendments and Reauthorization Act. Online at: http://www.gpoacces~.gov/uscode/index.html
42 USC 10101, et seq. Nuclear Waste Policy Act. Online at: http://www.npoaccess.gov/uscode/index.html
42 USC 11001, et seq. Emergency Planning and Community Right-to-Know Act. Online at: http://~~~.gp~access.gov/uscode/index.html
42 USC 13 101, et seq. Pollution Prevention Act. Online at: http://www.gpoaccess.gov/uscode/index.html
49 USC 5 101, et seq. Hazardous Materials Transportation Act. Online at: http:Nwww.gpoaccess.gov/uscode/index.html
Ecology (see Washington State Department of Ecology)
Ecology, EPA, and DOE. 1989. Hanford Federal Facility Agreement and Consent Order. 89-10 (as amended). Washington State Department of Ecology, U.S. Environmental Protection Agency, U.S. Department of Energy. Online at: htt~://www.hanford.~ov/t~dt~ahome.htm
Executive Order 1 15 14. "Protection and Enhancement of Environmental Quality." Online at: http://www.archives.gov/federal register/executive orders/disposition tables.htm1
Executive Order 1 1593. "Protection and Enhancement of the Cultural Environment." Online at: http://www.archives.p;ov/federal register/executive orders/disposition tables.html
Executive Order 1 1738. "Providing for Administration of the Clean Air Act and the Federal Water Pollution Control Act with Respect to Federal Contracts, Grants, or Loans." Online at: http://www.archives.gov/federal registedexecutive orders/disuosition tables.htm1
Executive Order 1 1988. "Floodplain Management." Online at: http:llww~v.archives.~ov/federal register/executive orders/disposition tables.htm1
Executive Order 1 1990. "Protection of Wetlands." Online at: http:Nwww.archives.gov/federal register/executive orders/disposition tables.html
Executive Order 12088. "Federal Compliance with Pollution Control Standards." Online at: http:l/www.archives.aov/federal re~isterlexecutive orders/disposition tables.html
Executive Order 121 14. "Environmental Effects Abroad of Major Federal Actions." Online at: http://www.archives.~ovlfederal rerristerlexecutive orders/disposition tables.htm1
Executive Order 12196. "Occupational Safety and Health Programs for Federal Employees."
Executive Order 12580. "Superfund Implementation." Online at: http:llwww.archives.aov/federal re~ister/executive ordersldisposition tables.htm1
Executive Order 12898. "Federal Actions to Address Environmental Justice in Minority Populations and Low-Income Populations." Online at: http:Nwww.archives.aov/federal reaister/executive ordersldisposition tables.htm1
Executive Order 12962. "Recreational Fisheries." Online at: http:Nwww.archives.rrov/federal renisterlexecutive orders/disposition tables.htm1
Executive Order 13007. "Indian Sacred Sites." Online at: http://www.archives.~ov/federal renisterlexecutive orders/disposition tables.htn-11
Executive Order 13045. "Protection of Children from Environmental Health Risks and Safety Risks." Online at: http://www.archives.~ovlfederal register/executive orders/dispositio~~ tables.htm1
Executive Order 13 10 1. "Greening the Government through Waste Prevention, Recycling, and Federal Acquisition." Online at: http:llwww.archives.~ov/federal re~isterlexecutive ordersldisposition tables.htm1
Executive Order 13 1 12. "Invasive Species." Online at: http:N\n/ww.archives.aov/federal renisterlexecutive ordersldisposition tables.htm1
Executive Order 13 123. "Greening the Government through Energy Efficient Management. Online at: http://www.archives.aov/federal renister/executive orders/disposition tables.htm1
Executive Order 13 134. "Developing and Promoting Biobased Products and Bioenergy." Online at: http:llwww.archives.~o~~Ifederal reaister/executive ordersldisposition tables.html
Executive Order 13 148. "Greening the Government through Leadership in Environmental Management." Online at: http:I/www.archives.gov/federal register/executive orders/disposition tables.html
Executive Order 13 149. "Greening the Government through Federal Fleet and Transportation Efficiency." Online at: http://www.arcl~ives.~ov/federal re~isterlexecutive orders/disposition tables.htm1
Executive Order 13 150. "Federal Workforce Transportation." Online at: http://www.archives.~ov/federal reaister/executive orders/disposition tables.htm1
Executive Order 13175. "Consultation and Coordination with Indian Tribal Governments." Online at: http://www.archives.gov/federal reaister/executive orders/disposition tables.htrn1
Executive Order 13 186. "Responsibilities of Federal Agencies to Protect Migratory Birds." Online at: http:l/www.archives.gov/federal reaister/executive orders/disposition tables.html
Executive Order 13 195. "Trails for America in the 2 1 " Century." Online at: http://www.archives.gov/federal re,oister/executive ordersldisposition tables.html
Executive Order 13287. "Preserve America." Online at: http://www.archives.gov/federal renisterlexecutive orders/disposition tables.htn11
Hanford Reach Act. 1988. Public Law No. 100-605 as amended by Public Law 104-333. Online at: http://206.61.2 10.104/pViap/html/body apx-a.1itm
RCW 70.94. Washington State Clean Air Act. Online at: htt~://www.lea.wa.aov
Treaty with the Walla Walla, Cayuse and Umatilla. 1855. June 9, 1855, 12 Stat. 945.
Treaty with the Yakama. 1855. June 9, 1855, 12 Stat. 95 1.
Treaty with the Nez Perces. 1855. June 11, 1855, 12 Stat. 957
U.S. Department of Energy (DOE). 1998. National Environmental Policy Act Compliance Guide. Washington, D.C. Online at: http://www.eh.doe.aov/nepa/~idance.html
U.S. Department of Energy (DOE). 1999. Final Hanford Comprehensive Land-Use Plan Environmental Impact Statement. DOE/EIS-0222-F. U.S. Department of Energy, Richland, Washington. Online at: http://www.hanford.,oov/netlib/eis.html
U.S. Department of Energy (DOE). 2000. U.S. Department of Energy American Indian and Alaska Native Tribal Government Policy. Online at: http://www.ci.doe.~ov/indianbk.pdf
U.S. Department of Energy (DOE). 2001 a. Department of Energy Management of Cultural Resources. DOE P 141.1, Washington, D.C. Online at: htt~:l/www.directives.doe.e;ov
U.S. Department of Energy (DOE). 2001 b. "Management of Cultural Resources at Department of Energy Facilities." DOEEH-4 12/0005r (revised July 200 1). U.S. Department of Energy, Washington, D.C. Online at: http:/homer.ornl.gov/oepa/~uidance/cu1tural/culturalresourcemgt.pdf
U.S. Department of Energy (DOE). 2002. Annual Hanford Site Environmental Permitting Status Report. DOEIRL-96-63, Revision 6, U.S. Department of Energy, Richland, Washington.
U.S. Department of Energy (DOE). 2003. Revised Draft Hanford Site Solid (Radioactive and Hazardous) Waste Program Environmental Impact Statement. DOEEIS-0286D2. U.S. Department of Energy, Richland, Washington. Online at: http://w ww .hanford.gov/eis/eis-0286DY
U.S. Environmental Protection Agency (EPA). 1994. "Hazardous and Solid Waste Amendments Portion of the Resource Conservation and Recovery Act Permit for the Treatment, Storage, and Disposal of Hazardous Waste". September 1994. U.S. Environmental Protection Agency, Region 10, Seattle, Washington. Online at: http://yosemite.epa.aov/R lOIOWCM.NSF/72b5220edcd9cf5b88256500005decf3hdbld43aa85483~5882 2 f
WAC 173-60. "Maximum Environmental Noise Levels." Washington Administrative Code. Online at: http://~~~.le~.wa.gov/wac/index.cfm?fuseaction=chapterdigest&chapter=173-60
WAC 173-160. "Minimum Standards for Construction and Maintenance of Wells." Washington Administrative Code. Online at: http://www.leg.wa.~0~~/wac/index.cfm?fuseaction=chapterdigest&chapter=l73- 160
WAC 173-216. "State Waste Discharge Permit Program." Washington Administrative Code. Online at: http://www.leg.wa.rrov/wac/index.cfm?fseaction=chapterdiest&chpter=173-216
WAC 173-2 18. "Underground Injection Control Program." Washington Administrative Code. Online at: http://www.leg.wa.gov/wac/index.cfm?fuseaction=chapterdigest&chapter=l73-218
WAC 173-303. "Dangerous Waste Regulations." Washington Administrative Code. Online at: http:Nwww.leg.wa.gov/wac/index.cfm?fuseaction=chapterdigest&chapter= 173-303
WAC 173-400. "General Regulations for Air Pollution Sources." Washington Administrative Code. Online at: http://www.le~.wa.gov/wac/index.cfm?fi~seaction=chapterdirrest&chapter=l73-400
WAC 173-460. "Controls for New Sources of Toxic Air Pollutants." Washington Administrative Code. Online at: http://www.leg.wa.gov/wac/index.cfm?fuseaction=chaterdiest&chapter=173-460
WAC 173-480. "Ambient Air Quality Standards and Emission Limits for Rabionuclides." Washington Administrative Code. Online at: http:llwu~w.leg.wa.gov/wac/index.cfm?fuseaction=chapterdigest&chapter=173-480
WAC 220-1 10. "Hydraulic Code Rules." Washington Administrative Code. Online at: http://www.lerr.wa.go~~/wac/index.cfm?fuseaction=chaterdiest&chater=220-110
WAC 246-247. "Radiation Protection - Air Emissions." Washington Administrative Code. Online at: http://~~~.leg.wa.gov/wac/index.cfm?fuseaction=chapterdi~est&chapter=246-247
WAC 246-272. "On-Site Sewage Systems." Washington Administrative Code. Online at: http://www.leg.wa.go~~/wac/index.cfm'~fuseaction=chapterdigest&chapter=246-272
WAC 246-290. "Public Water Supplies." Washington Administrative Code. Online at: http:Nwww.le.~.wa.govlwaclindex.cfm?fuseaction=chapterdigest&chapter=246-290
WAC 332-30. "Aquatic Land Management." Washington Administrative Code. Online at: http:Nwww.leg.wa.gov/wac/index.cfm'?fuseaction=chapterdirrest&chapter=332-3O
Washington State Department of Ecology (Ecology). 2001a. Dangerous Waste Portion of the Resource Conservation and Recovery Act Permit for the Treatment, Storage, and Disposal of Dangerous Waste, Revision 7. Washington State Department of Ecology Publication Number 94-05-001. Permit Number: WA7890008967. Olympia, Washington. Online at: http://~~u~.ecv.wa.gov/programs/nwp/pdf/permitrev7.pdf
Washington State Department of Ecology (Ecology). 2001b. Hanford Air Operating Permit. Washington State Department of Ecology Publication Number 00-05-006. Olympia, Washington. Online at: http://~~~.ecy.wa.govlpubs/0005006.pdf

This page intentionally left blank
Distribution
No. of Copies
No. of Copies
OFFSITE
2 Gary Ballew Sustainable Development Manager Benton County Planning Dept. P.O. Box 910 Prosser. WA 99350
1 C. Borgstrom U.S. Department of Energy (EH-42) 1000 Independence Avenue SW Washington, D.C. 20585-01 19
1 A. J. Dvorak Environmental Assessment Division Argonne National Laboratory 9700 S. Cass Avenue Bldg 900 Argonne, IL 60439-4832
1 S.Frank U.S. Department of Energy (EM-I) 1000 Independence Avenue SW Washington, D.C. 20585
1 C. Hickey NEPA Compliance Officer U.S. Department of Energy Office of Science (SC-83) 19901 Germantown Road Germantown. MD 20874- 1 290
7 G. Hughes U.S. Fish and Wildlife Service 3250 Port of Benton Blvd Richland, WA 99352
6 C. L. Johnson SAIC 3250 Port of Benton Blvd Richland, WA 99352
1 J. E. Loving U.S. Department of Energy (EH-42) Office Of NEPA Policy &Compliance 1000 Independence Avenue SW Washington, D.C. 20585
1 Lloyd Lorenzi NEPA Compliance Officer National Energy Technology Lab P.O. Box 10940 Pittsburgh, PA 15236
1 David Rice US Corps of Engineers P.O. Box 3755 Seattle. WA 98 124-3755
1 R.Sharma NEPA Compliance Officer U.S. Department of Energy (NE-47) 19901 Germantown Road Germantown, MD 20874- 1290
1 Laurie Vigue Washington Dept of Fish & Wildlife 600 Capitol Way N Olympia, WA 98501-1091
Native American Tribes
3 Mr. Stuart Harris (2) Mr. Jeff Van Pelt Confederated Tribes of the Umatilla Indian Reservation P.O. Box 638 Pendleton, OR 97801
2 Mr. Russell Jim, Manager Environmental Restoration1 Waste Management Program Yakama Nation 2808 Main Street Union Gap, WA 98903
Distr. 1
No. of Copies
No. of Copies
2 Mr. Patrick Sobotta Environmental Restoration and Waste Management Nez Perce Tribe P.O. Box 365 Lapwai, ID 83540
2 Ms. Leanora Seelatsee Wanapum Grant County P.U.D. 30 "C" Street, S.W. P.O. Box 878 Ephrata, WA 98823
1 Ms. Camille Pleasants 3 Colville Tribal Historic Preservation Officer P.O. Box 150 Nespelem WA 99155
46 DOE Richland Operations OfficeIOffice of River Protection
T. L. Aldridge, LOD D. W. Bowser, ORP M. E. Burandt, ORP B. F. Burton, OOD R. M. Carosino, OCC D. H. Chapin, FFTF C. E. Clark, RCA S. S. Clark, PMO K. V. Clarke, COM M. S. Collins, WMD J. L. Daily, CLO P. F. Dunigan, RCA (20) T. W. Ferns, CLO H. B. Hathaway, CLO R. D. Hildebrand, WMD E. V. Hiskes, OCC L. A. Huffman, ORP R. R. McNulty, ORP G. M. Neath, ORP J. E. Rasmussen, ORP H. M. Rodriguez, RCA A. L. Rodriguez, RCA
DOE Richland Operations Office/ Office of River Protection (cont.)
W. Russell, ORP H6-60 C. V. Smith, OCC A4-52 D. C. Ward, CLO A2- 17 B. D. Williamson, OCC A4-52 J. H. Zeisloft, ERD A3-04
CH2M HILL Hanford Group, Inc.
F. M. Mann K. S. Tollefson
CH2M Hill Hanford, Inc.
L. M. Johnson R. W. Ovink J. J. Sharpe
Bechtel Hanford, Inc.
R. A. Carlson K. R. Fecht G. E. Fitzgibbon K. A. Gano R. J. Landon T. J. Lazarski T. E. Marceau D. D. Tee1 B. L. Vedder S. G. Weiss J. G. Woolard
Fluor Hanford. Inc.
G. D. Cummins D. P. Demitruk B. J. Dixon R. H. Engelmann K. A. Hadley A. M. Hopkins M. T. Jansky B. B. Nelson-Maki F. A. Ruck, I11 D. J. Watson K. R. Welsch
HO- 1 7 HO-02 HO-09 HO-23 HO-02 HO- 16 HO-23 HO-23 HO-02 HO-20 HO-02
No. of No. of Copies Copies
I Fluor Federal Services, Inc. Pacific NW Natl. Laboratory (cont'd)
P. D. Rittrnann E6- 17
1 Washington State Universitv
R. G. Schreckhise H2-52
2 Duratek Federal Services Northwest Ouerations
J. J. Dorian HI-1 1 R. M. Mitchell H1-11
1 Jacobs Engineering, Inc.
S. Holderness B2-05
78 Pacific Northwest National Laboratory
E. J. Antonio M. P. Bergeron G. R. Bilyard B. N. Bjornstad C. A. Brandt R. W. Bryce A. L. Bunn K. W. Burk S. D. Cannon C. R. Cole P. J. Cowley P. M. Daling D. D. Dauble R. L. Dirkes (5) J. L. Downs J. P. Duncan (15) T. 0 . Eschbach M. J. Fayer R. A. Fowler B. G. Fritz S. W. Gajewski D. R. Geist T. L. Gilbride G. R. Guensch D. L. Hadley R. W. Hanf
K3-54 K9-36 K3-54 K6-8 1 K6-85 K6-35 K6-85 S3-9 1 Kl-72 K9-36 K7-22 H6-61 K6-84 K6-75 K6-85 K6-85 K3-54 K9-33 K6-05 K6-75 K9-18 K6-85
BPO K9-33 K5-16 K6-75
D. W. Harvey P. L. Hendrickson D. J. Hoitink D. G. Horton D. J. Hostick U. P. Jenquin R. A. Kennedy C. T. Kincaid W. W. Laity G. V. Last B. A. Napier D. A. Neitzel (5) W. E. Nichols G. P. O'Connor T. L. Page T. M. Poston E. Prendergast-Kennedy J. V. Ramsdell, Jr. K. Rhoads S. P. Reidel A. C. Rohay M. R. Sackschewsky M. J. Scott D.C. Stapp D. L. Strenge P. D. Thorne K. M. Tominey M. D. White R. S. Weeks D. M. Woody
2 DOE Public Reading Room
2 Hanford Technical Library
2 DOE Administrative Record
Distr. 3
Related Documents