39 3 Summary The poor are those whose expenditure (or income) falls below a poverty line. This chapter explains how poverty lines are constructed and discusses the strengths and weaknesses of defining poverty lines based on three methods: the cost of basic needs, food energy intake, and subjective evaluations. The construction of a poverty line is the most difficult step in the practical measurement of poverty. The cost of basic needs approach is most commonly used. It first estimates the cost of acquiring enough food for adequate nutrition—usually 2,100 Calories per person per day—and then adds the cost of other essentials such as clothing and shelter. When price information is unavailable, the food energy intake method can be used. This method plots expenditure (or income) per capita against food consumption (in calo- ries per person per day) to determine the expenditure (or income) level at which a household acquires enough food. Subjective poverty lines are based on asking people what minimum income level is needed just to make ends meet. An absolute poverty line remains fixed over time, adjusted only for inflation, as in the United States. It allows the evolution of poverty over time to be tracked, and is also useful when evaluating the effects of policies and programs on the incidence of poverty. However, in most countries, poverty lines are revised from time to time, reflecting the evolution of social consensus about what constitutes poverty. Poverty lines that are revised in this way allow relative poverty to be measured, but not absolute poverty. The choice of poverty line depends on the use to which it will be put: thus, for international comparisons, the $1/day standard is helpful, while for targeting Chapter Poverty Lines

Welcome message from author
This document is posted to help you gain knowledge. Please leave a comment to let me know what you think about it! Share it to your friends and learn new things together.
Transcript
39
3
Summary
The poor are those whose expenditure (or income) falls below a poverty line. This
chapter explains how poverty lines are constructed and discusses the strengths and
weaknesses of defining poverty lines based on three methods: the cost of basic needs,
food energy intake, and subjective evaluations. The construction of a poverty line is
the most difficult step in the practical measurement of poverty.
The cost of basic needs approach is most commonly used. It first estimates the cost
of acquiring enough food for adequate nutrition—usually 2,100 Calories per person
per day—and then adds the cost of other essentials such as clothing and shelter. When
price information is unavailable, the food energy intake method can be used. This
method plots expenditure (or income) per capita against food consumption (in calo-
ries per person per day) to determine the expenditure (or income) level at which a
household acquires enough food. Subjective poverty lines are based on asking people
what minimum income level is needed just to make ends meet.
An absolute poverty line remains fixed over time, adjusted only for inflation, as
in the United States. It allows the evolution of poverty over time to be tracked, and
is also useful when evaluating the effects of policies and programs on the incidence
of poverty. However, in most countries, poverty lines are revised from time to time,
reflecting the evolution of social consensus about what constitutes poverty. Poverty
lines that are revised in this way allow relative poverty to be measured, but not
absolute poverty.
The choice of poverty line depends on the use to which it will be put: thus, for
international comparisons, the $1/day standard is helpful, while for targeting
Chapter
Poverty Lines
Haughton and Khandker3
40
programs or policies to the poor a relative poverty line suffices. The appropriate
choice of poverty line is a matter of judgment, and will therefore vary from
country to country.
Learning Objectives
After completing the chapter on Poverty Lines, you should be able to
1. Explain what a poverty line is, why it is needed, and how countries adjust their
poverty lines over time.
2. Distinguish between absolute and relative poverty lines, and identify the condi-
tions under which one might be preferred to the other.
3. Identify the steps required to construct a poverty line using the cost of basic needs
method, and justify the choices made at each step.
4. Show how to construct a poverty line using the food energy intake method, and
explain the serious weaknesses of this method.
5. Explain how subjective poverty lines are constructed and critically appraise their
usefulness.
6. Construct a poverty line using real survey data, using
• the cost of basic needs method
• the food energy intake method.
Introduction: Defining a Poverty Line
Assume we have chosen a measure of household well-being, say, consumption
expenditure. The next step is to choose a poverty line. Households whose consump-
tion expenditure falls below this line are considered poor.
The choice of poverty line depends in large measure on the intended use of the
poverty rates. If the goal is to identify “the poor” for a targeted system of food sub-
sidies, a line that generates a poverty rate of 60 percent, or of 2 percent, is unlikely to
be helpful. In this sense, the poverty rate is indeed a social and policy construct, and
appropriately so.
However, it is common practice to define the poor as those who lack command
over basic consumption needs, including food and nonfood components. In this case
the poverty line is obtained by specifying a consumption bundle considered ade-
quate for basic consumption needs, then estimating the cost of these basic needs. The
CHAPTER 3: Poverty Lines3
More formally, following Ravallion (1998), the poverty line for a household, zi,
may be defined as the minimum spending or consumption (or income, or other
measure) needed to achieve at least the minimum utility level uz, given the level of
prices (p) and the demographic characteristics of the household (x), so
zi = e(p, x, uz). (3.1)
In practice, we cannot measure uz, or even e(·), so a more pragmatic solution
is needed.
There are two approaches. One is to compute a poverty line for each household,
adjusting it from household to household to take into account differences in the prices
they face and their demographic composition. For example, a small household in a rural
area may face low housing costs and relatively modest food prices. Thus, their zi may be
low compared with a large household in a city where housing is more expensive and
food prices are perhaps higher. This gives a different poverty line for each household. 41
poverty line may be thought of as the minimum expenditure required by an
individual to fulfill his or her basic food and nonfood needs.
Once we have computed a household’s consumption, we need to determine
whether that amount places the household in poverty, or defines the household as
poor. The threshold used for this is the poverty line. The poverty line defines the level
of consumption (or income) needed for a household to escape poverty.
It is sometimes argued that the notion of a poverty line implies a distinct turning
point in the welfare function. That is, by rising from just below to just above the
poverty line, households (and individuals therein) move from considerable misery
to an adequate minimum amount of well-being. However, given that well-being fol-
lows a continuum, and given how arbitrary the choice of poverty line is, the notion
of such a turning point is not compelling.
A corollary is that it usually makes sense to define more than one poverty line. For
example, one common approach is to define one poverty line that marks households
that are poor, and another lower level that marks those that are extremely poor.
Another approach is to construct a food poverty line, which is based on some notion
of the minimum amount of money a household needs to purchase some basic-needs
food bundle and nothing more. If the cost of basic nonfood needs is estimated, the
food poverty line added to the nonfood needs will equal the overall poverty line.
1. A poverty line is
° A. The minimum expenditure required to fulfill basic needs.
° B. The threshold consumption needed for a household to escape poverty.
° C. Somewhat arbitrary because the line between poor and nonpoor can behard to define.
° D. All of the above.
Review Questions
Haughton and Khandker3
42
A second and more widely used approach is to construct one per capita poverty
line for all individuals, but to adjust per capita expenditure (or income) yi for differ-
ences in prices and household composition. The adjusted per capita yi is then com-
pared with the poverty line to determine if the individual is living below the poverty
line. With this approach, it is easier to talk of “the poverty line” and present it as a
single number.
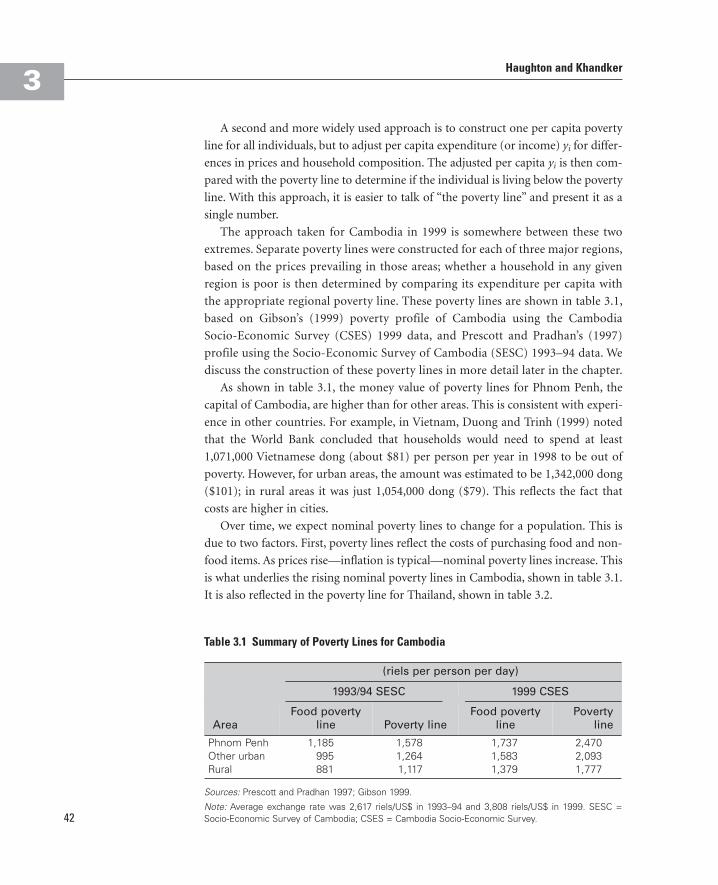
The approach taken for Cambodia in 1999 is somewhere between these two
extremes. Separate poverty lines were constructed for each of three major regions,
based on the prices prevailing in those areas; whether a household in any given
region is poor is then determined by comparing its expenditure per capita with
the appropriate regional poverty line. These poverty lines are shown in table 3.1,
based on Gibson’s (1999) poverty profile of Cambodia using the Cambodia
Socio-Economic Survey (CSES) 1999 data, and Prescott and Pradhan’s (1997)
profile using the Socio-Economic Survey of Cambodia (SESC) 1993–94 data. We
discuss the construction of these poverty lines in more detail later in the chapter.
As shown in table 3.1, the money value of poverty lines for Phnom Penh, the
capital of Cambodia, are higher than for other areas. This is consistent with experi-
ence in other countries. For example, in Vietnam, Duong and Trinh (1999) noted
that the World Bank concluded that households would need to spend at least
1,071,000 Vietnamese dong (about $81) per person per year in 1998 to be out of
poverty. However, for urban areas, the amount was estimated to be 1,342,000 dong
($101); in rural areas it was just 1,054,000 dong ($79). This reflects the fact that
costs are higher in cities.
Over time, we expect nominal poverty lines to change for a population. This is
due to two factors. First, poverty lines reflect the costs of purchasing food and non-
food items. As prices rise—inflation is typical—nominal poverty lines increase. This
is what underlies the rising nominal poverty lines in Cambodia, shown in table 3.1.
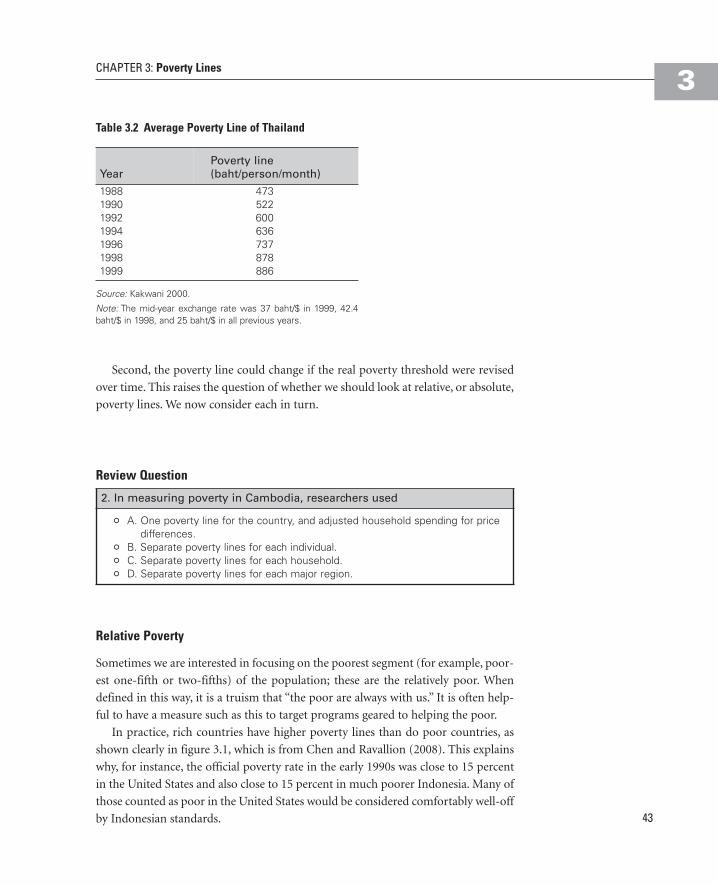
It is also reflected in the poverty line for Thailand, shown in table 3.2.
Table 3.1 Summary of Poverty Lines for Cambodia
(riels per person per day)
1993/94 SESC 1999 CSES
AreaFood poverty
line Poverty lineFood poverty
linePoverty
line
Phnom Penh 1,185 1,578 1,737 2,470Other urban 995 1,264 1,583 2,093Rural 881 1,117 1,379 1,777
Sources: Prescott and Pradhan 1997; Gibson 1999.
Note: Average exchange rate was 2,617 riels/US$ in 1993–94 and 3,808 riels/US$ in 1999. SESC =Socio-Economic Survey of Cambodia; CSES = Cambodia Socio-Economic Survey.
CHAPTER 3: Poverty Lines3
Relative Poverty
Sometimes we are interested in focusing on the poorest segment (for example, poor-
est one-fifth or two-fifths) of the population; these are the relatively poor. When
defined in this way, it is a truism that “the poor are always with us.” It is often help-
ful to have a measure such as this to target programs geared to helping the poor.
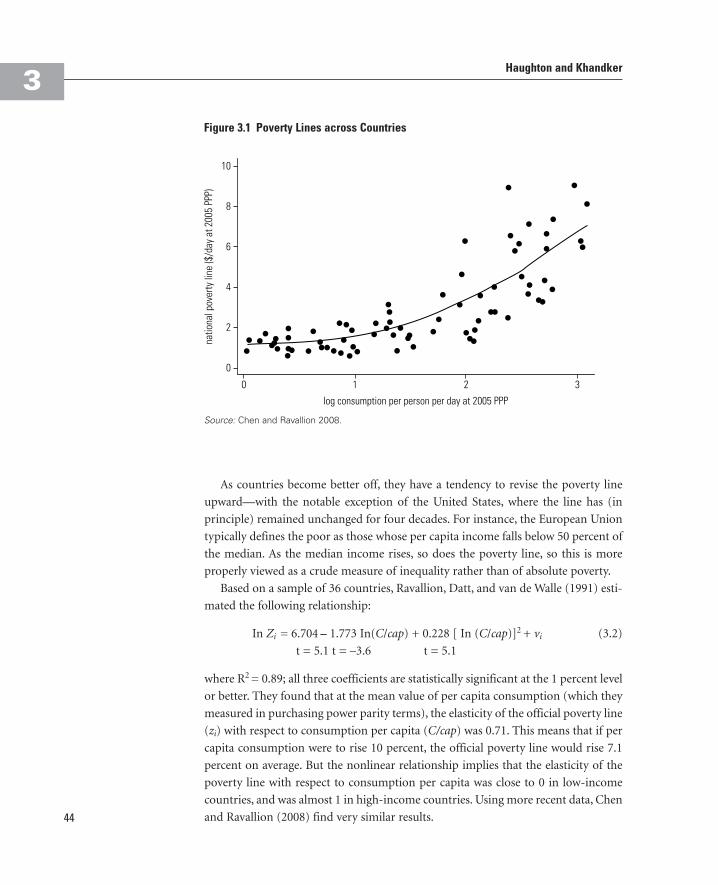
In practice, rich countries have higher poverty lines than do poor countries, as
shown clearly in figure 3.1, which is from Chen and Ravallion (2008). This explains
why, for instance, the official poverty rate in the early 1990s was close to 15 percent
in the United States and also close to 15 percent in much poorer Indonesia. Many of
those counted as poor in the United States would be considered comfortably well-off
by Indonesian standards. 43
Second, the poverty line could change if the real poverty threshold were revised
over time. This raises the question of whether we should look at relative, or absolute,
poverty lines. We now consider each in turn.
Table 3.2 Average Poverty Line of Thailand
YearPoverty line (baht/person/month)
1988 4731990 5221992 6001994 6361996 7371998 8781999 886
Source: Kakwani 2000.
Note: The mid-year exchange rate was 37 baht/$ in 1999, 42.4baht/$ in 1998, and 25 baht/$ in all previous years.
2. In measuring poverty in Cambodia, researchers used
° A. One poverty line for the country, and adjusted household spending for pricedifferences.
° B. Separate poverty lines for each individual.
° C. Separate poverty lines for each household.
° D. Separate poverty lines for each major region.
Review Question
Haughton and Khandker3
44
As countries become better off, they have a tendency to revise the poverty line
upward—with the notable exception of the United States, where the line has (in
principle) remained unchanged for four decades. For instance, the European Union
typically defines the poor as those whose per capita income falls below 50 percent of
the median. As the median income rises, so does the poverty line, so this is more
properly viewed as a crude measure of inequality rather than of absolute poverty.
Based on a sample of 36 countries, Ravallion, Datt, and van de Walle (1991) esti-
mated the following relationship:
In Zi = 6.704 – 1.773 In(C/cap) + 0.228 [ In (C/cap)]2 + vi (3.2)
t = 5.1 t = –3.6 t = 5.1
where R2 = 0.89; all three coefficients are statistically significant at the 1 percent level
or better. They found that at the mean value of per capita consumption (which they
measured in purchasing power parity terms), the elasticity of the official poverty line
(zi) with respect to consumption per capita (C/cap) was 0.71. This means that if per
capita consumption were to rise 10 percent, the official poverty line would rise 7.1
percent on average. But the nonlinear relationship implies that the elasticity of the
poverty line with respect to consumption per capita was close to 0 in low-income
countries, and was almost 1 in high-income countries. Using more recent data, Chen
and Ravallion (2008) find very similar results.
Figure 3.1 Poverty Lines across Countries
Source: Chen and Ravallion 2008.
CHAPTER 3: Poverty Lines3
45
To the extent that one’s goal is to identify and target today’s poor, then a relative
poverty line is appropriate, and needs to be tailored to the overall level of develop-
ment of the country. For instance, a $1/day poverty line might be useful in Vietnam,
where 27 percent of the population would be considered poor by this standard in
1998 (Haughton 2000), but would be of little relevance in the United States, where
almost nobody would fall below that poverty line.
3. According to Ravallion, Datt, and van de Walle (1991), as countriesbecome richer, they adjust their real poverty lines upward
° A. A little, if they are poor, and a lot if they are rich.
° B. A little, if they are rich, and a lot if they are poor.
° C. To maintain poverty at 27 percent.
° D. To adjust for inflation.
Review Question
Absolute Poverty. An absolute poverty line is “fixed in terms of the standards
indicator being used, and fixed over the entire domain of the poverty compari-
son” (Ravallion 1992, 25). In other words, the poverty line is set so that it repre-
sents the same purchasing power year after year, but this fixed line may differ
from country to country or region to region (the “domain” of the relevant com-
parison). For example, the U.S. poverty line does not change over time (except to
adjust for inflation), so that the poverty rate today may be compared with the
poverty rate of a decade ago, knowing that the definition of what constitutes
poverty has not changed.
An absolute poverty line is essential if one is trying to judge the effect of
antipoverty policies over time, or to estimate the impact of a project (for example,
microcredit) on poverty. Legitimate comparisons of poverty rates between one
country and another can only be made if the same absolute poverty line is used in
both countries. Thus, the World Bank needs absolute poverty lines to be able to com-
pare poverty rates across countries. Such comparisons are useful in determining
where to channel resources, and in assessing progress in the war on poverty.
The World Bank has recently revised its measurement of world poverty; Chen
and Ravallion (2008) use a poverty rate of US$1.25 a day (in 2005 U.S. dollars), and
by this standard there were 1.38 billion poor in 2005 (see box 3.1). If the poverty line
is set at US$2.00 a day, this number rises to 2.09 billion. These are absolute poverty
lines. There is a vigorous controversy about whether world poverty is indeed falling;
this issue is addressed more completely in chapter 10. In this context, the focus is on
absolute poverty.
Haughton and Khandker3
46
Issues in Choosing an Absolute Poverty Line
In choosing an absolute poverty line, one first has to determine how to measure the
standard of living, and then pick an appropriate level to serve as a poverty line.
Decide the Standard of Living
An important conceptual problem arises when working with absolute poverty
lines—the issue of what is meant by “the standard of living” (Ravallion [1998], on
which much of this discussion is based).
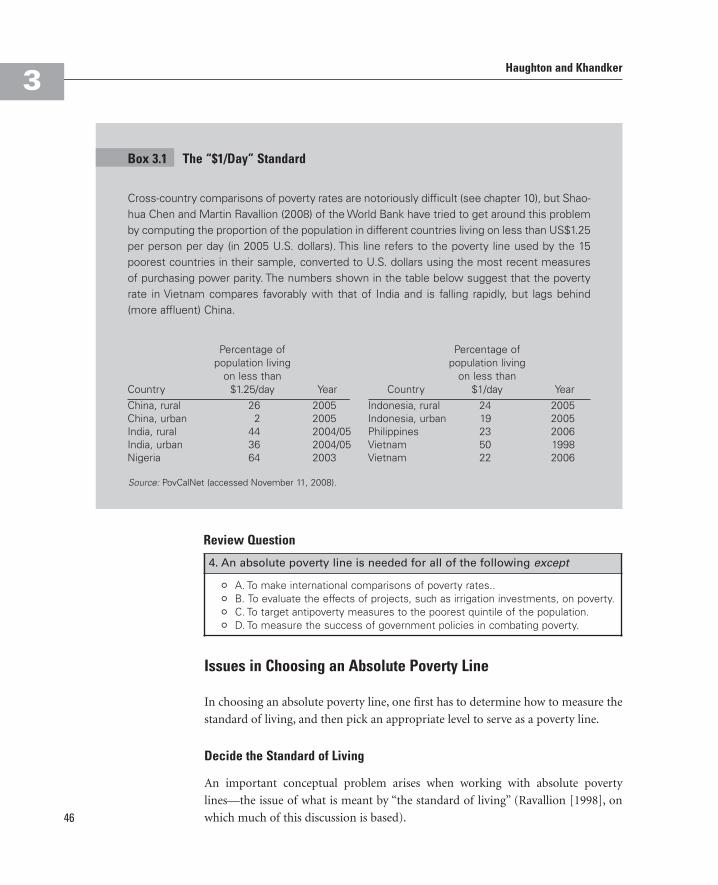
Cross-country comparisons of poverty rates are notoriously difficult (see chapter 10), but Shao-hua Chen and Martin Ravallion (2008) of the World Bank have tried to get around this problemby computing the proportion of the population in different countries living on less than US$1.25per person per day (in 2005 U.S. dollars). This line refers to the poverty line used by the 15poorest countries in their sample, converted to U.S. dollars using the most recent measuresof purchasing power parity. The numbers shown in the table below suggest that the povertyrate in Vietnam compares favorably with that of India and is falling rapidly, but lags behind(more affluent) China.
Country
Percentage of population living
on less than$1.25/day Year Country
Percentage ofpopulation living
on less than$1/day Year
China, rural 26 2005 Indonesia, rural 24 2005China, urban 2 2005 Indonesia, urban 19 2005India, rural 44 2004/05 Philippines 23 2006India, urban 36 2004/05 Vietnam 50 1998Nigeria 64 2003 Vietnam 22 2006
Source: PovCalNet (accessed November 11, 2008).
4. An absolute poverty line is needed for all of the following except
° A. To make international comparisons of poverty rates..
° B. To evaluate the effects of projects, such as irrigation investments, on poverty.
° C. To target antipoverty measures to the poorest quintile of the population.
° D. To measure the success of government policies in combating poverty.
Review Question
Box 3.1 The “$1/Day” Standard
CHAPTER 3: Poverty Lines3
47
In practice, almost all absolute poverty lines are set by measuring the cost of
buying a basket of goods (the “commodity-based poverty line,” which we denote
by z). If we assume that
u = f(y), (3.3)
which says that utility or “standard of living” (u) depends on income or expenditure
(y), then
y = f-1(u). (3.4)
Equation (3.4) says that for any given level of utility, there is some income (or
expenditure) level that is needed to achieve it. If uz is the utility that just suffices to
avoid being poor, then
z = f-1(uz). (3.5)
In other words, given a poverty line that is absolute in the space of welfare (that
is, gives uz) there is a corresponding absolute commodity-based poverty line.
But suppose we make a different but equally plausible assumption, which is that
utilities are interdependent. My well-being may depend not just on what I con-
sume, but also on how my consumption stacks up against that of the rest of soci-
ety. Thus, a household of four with an income of $12,000 per year would not be
considered poor in Indonesia, but when this household compares its position with
average incomes in the United States, it may feel very poor. We may capture this
idea by assuming
(3.6)
where is the mean income in the society. In this case
(3.7)
and making the standard assumption of invertibility,
(3.8)
Equation (3.8) means that for a poverty line to be absolute in the space of wel-
fare (that is, to yield uz), the commodity-based poverty line (z) may have to rise
as rises. The commodity-based poverty line would then look more like a rela-
tive poverty line. The key idea here is that the poverty line should be set at a level
that enables individuals to achieve certain capabilities, including healthy and
active lives and full participation in society. In practice, this almost certainly

Haughton and Khandker
Decide uz and g(·)
Even if we assume that the commodity-based poverty line remains constant, we are
still left with two problems.
• The referencing problem. What is the appropriate value of uz—that is, what is the
value of the utility of the poverty line? The choice is arbitrary, of course, but “a
degree of consensus about the choice of the reference utility level in a specific
society may well be crucial to mobilizing resources for fighting poverty” (Ravallion
1998, 6).
• The identification problem. Given uz, what is the correct value of z—that is, what
is the correct commodity value of the poverty line? This problem arises for two
reasons: the size and demographic composition of households vary—an issue
raised in the discussion of equivalence scales in chapter 2—and “the view that
we can measure welfare by looking solely at demand behavior is untenable”
(Ravallion 1998, 7).
The implication is that external information and judgments will be required to
answer the referencing and identification problems, and hence, to determine the
absolute poverty line. But how is this to be done in practice?
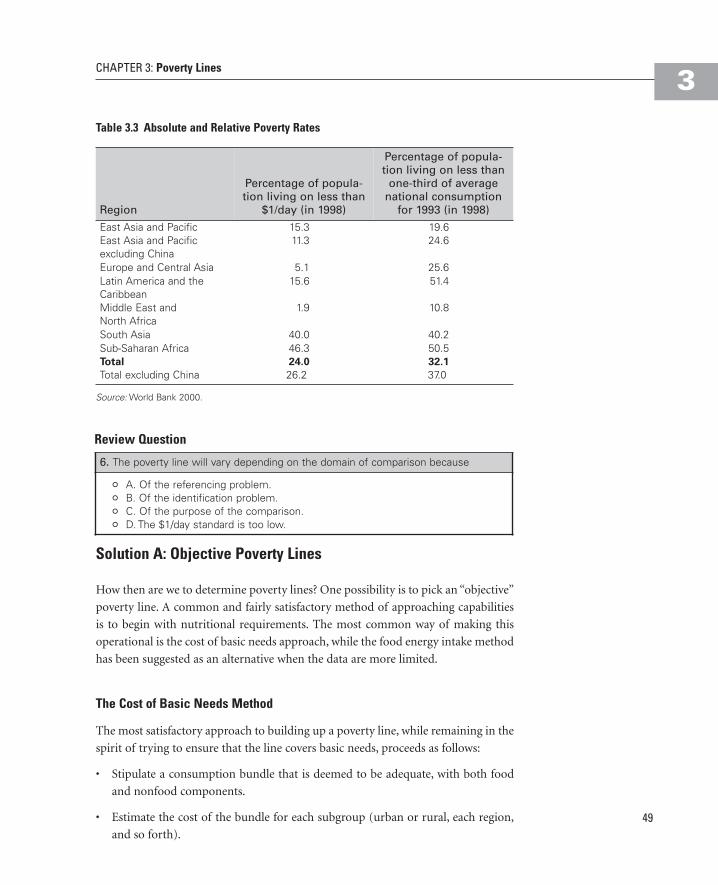
Table 3.3 presents absolute and relative poverty headcount rates for different
regions in the world. How regions compare with each other depends on which
poverty measure is used. For example, by the absolute measure of less than $1/day,
Sub-Saharan Africa has the highest portion of the population living in poverty.
However, countries in Latin America and the Caribbean have the highest portion of
their population living below one-third of the average national consumption; in
effect, these Latin American and the Caribbean countries are the most unequal soci-
eties, an issue that is addressed directly in chapter 6.
3
48
would imply that the commodity-based poverty line would rise as a country
becomes more affluent, because the minimum resources needed to participate
fully in society probably rise over time. In Sen’s prose, “an absolute approach in
the space of capabilities translates into a relative approach in the space of com-
modities” (Sen 1983, 168). However, in what follows, we simplify the analysis by
assuming that utilities are not interdependent, so the commodity-based poverty
line is given in absolute terms.
5. Is the following statement true or false? If my well-being depends onwhere I stand relative to others, then the dollar absolute poverty lineneeds to change as a country becomes richer.
° True
° False
Review Question
CHAPTER 3: Poverty Lines3
49
Solution A: Objective Poverty Lines
How then are we to determine poverty lines? One possibility is to pick an “objective”
poverty line. A common and fairly satisfactory method of approaching capabilities
is to begin with nutritional requirements. The most common way of making this
operational is the cost of basic needs approach, while the food energy intake method
has been suggested as an alternative when the data are more limited.
The Cost of Basic Needs Method
The most satisfactory approach to building up a poverty line, while remaining in the
spirit of trying to ensure that the line covers basic needs, proceeds as follows:
• Stipulate a consumption bundle that is deemed to be adequate, with both food
and nonfood components.
• Estimate the cost of the bundle for each subgroup (urban or rural, each region,
and so forth).
Table 3.3 Absolute and Relative Poverty Rates
Region
Percentage of popula-tion living on less than
$1/day (in 1998)
Percentage of popula-tion living on less than
one-third of averagenational consumption
for 1993 (in 1998)
East Asia and Pacific 15.3 19.6East Asia and Pacific excluding China
11.3 24.6
Europe and Central Asia 5.1 25.6Latin America and theCaribbean
15.6 51.4
Middle East and North Africa
1.9 10.8
South Asia 40.0 40.2Sub-Saharan Africa 46.3 50.5Total 24.0 32.1
Total excluding China 26.2 37.0
Source: World Bank 2000.
6. The poverty line will vary depending on the domain of comparison because
° A. Of the referencing problem.
° B. Of the identification problem.
° C. Of the purpose of the comparison.
° D. The $1/day standard is too low.
Review Question

Haughton and Khandker3
50
This is essentially the approach taken by Seebohm Rowntree in his seminal studies
of poverty in York, undertaken in 1901 and 1936 (Rowntree 1941). Note that although
we begin with a consumption bundle—so much food, so much housing space, so much
electricity, and so forth—the poverty line is measured in money. We are therefore not
insisting that each basic need be met by each person (a nonwelfarist position), only that
it could be met (a welfarist position). Operationally, the steps to follow are these:
• Pick a nutritional requirement for good health, such as 2,100 Calories per person
per day. This standard is widely used, and has been proposed by the Food and
Agricultural Organization of the United Nations. It is also an approximation,
given that food needs vary across individuals, by climate, by the level of an indi-
vidual’s activity, and seasonally.
• Estimate the cost of meeting this food energy requirement, using a diet that
reflects the habits of households near the poverty line (for example, those in the
lowest, or second-lowest, quintile of the income distribution; or those consuming
between 2,000 and 2,200 calories). This may not be easy if diets vary widely across
the country. Call this food component zF.
• Add a nonfood component (zNF). There is a lot of disagreement about how to do
this; we offer some more thoughts on this issue below; for U.S. practice, see box
3.2, below.
• Then the basic needs poverty line is given by
zBN = zF + zNF. (3.9)
7. Is the following statement true, false, or uncertain? The cost of basicneeds approach requires that households meet their basic needs of foodand essential nonfood spending.
° True
° False
° Uncertain
Review Question
In 1963 and 1964, Mollie Orshansky of the U.S. Social Security Administration computed thecost of an “adequate” amount of food intake, to get zF. She then multiplied this number by 3to get zBN. Why? Because at the time, consumers in the United States devoted a third of theirspending to food. This line is still used, updated regularly for price changes.
Source: Dalaker and Naifeh 1998.
Box 3.2 The U.S. Poverty Line

To illustrate how this might work, suppose, following common practice, that we use
a food energy threshold of 2,100 Calories per day. Suppose that there are only three
foodstuffs: rice, corn, and eggs. For this hypothetical example, imagine that table 3.4
shows the expenditure on each item, and the amount consumed per person by a house-
hold in the second (from bottom) quintile; because such a household consumes, we
suppose, just 2,000 Calories per day, the figures here have to be grossed up to give the
cost of purchasing 2,100 Calories. In this example the cost comes to 105 pesos per day.
The choice of which diet to use when estimating the cost of obtaining 2,100 Calo-
ries is not a trivial one, a point emphasized in the context of Indonesia by Pradhan
et al. (2000).1 To illustrate, consider the information in table 3.5, drawn from the
Vietnam Living Standards Survey of 1992–93 (World Bank 1994). Households in the
Table 3.4 Illustration of Construction of Cost-of-Food Component of Poverty Line
Expenditure per day (pesos) Calories
Calories,adjusted to give2,100 Calories
Expenditure,adjusted tocover 2,100
CaloriesRice 60 1,400 1,470 63Corn 20 400 420 21Eggs 20 200 210 21Total 100 2,000 2,100 105
Source: Authors.
Table 3.5 Food Consumption by Expenditure Quintile, Vietnam, 1992–93
Quintile
Expenditure percapita, thou-
sand dong/year
Percentage ofexpenditure
devoted to food
Calories percapita
per dayDong per Calorie
Lowest 562 70 1,591 0.68Low-mid 821 65 1,855 0.79Middle 1,075 60 2,020 0.87Mid-upper 1,467 54 2,160 1.00Upper 2,939 47 2,751 1.38
Source: World Bank 1994.
8. In constructing a cost of basic needs poverty line in Vietnam, the povertyline will be
° A. Lower if the food price of the lowest quintile is used.
° B. Higher if one uses the calorie per capita level of the lowest quintile.
° C. Lower if one uses the percentage of spending on nonfood from the topexpenditure quintile.
° D. Higher if one uses a threshold of 2,020 Calories per capita per day.
Review Question
CHAPTER 3: Poverty Lines3
51
Haughton and Khandker3
52
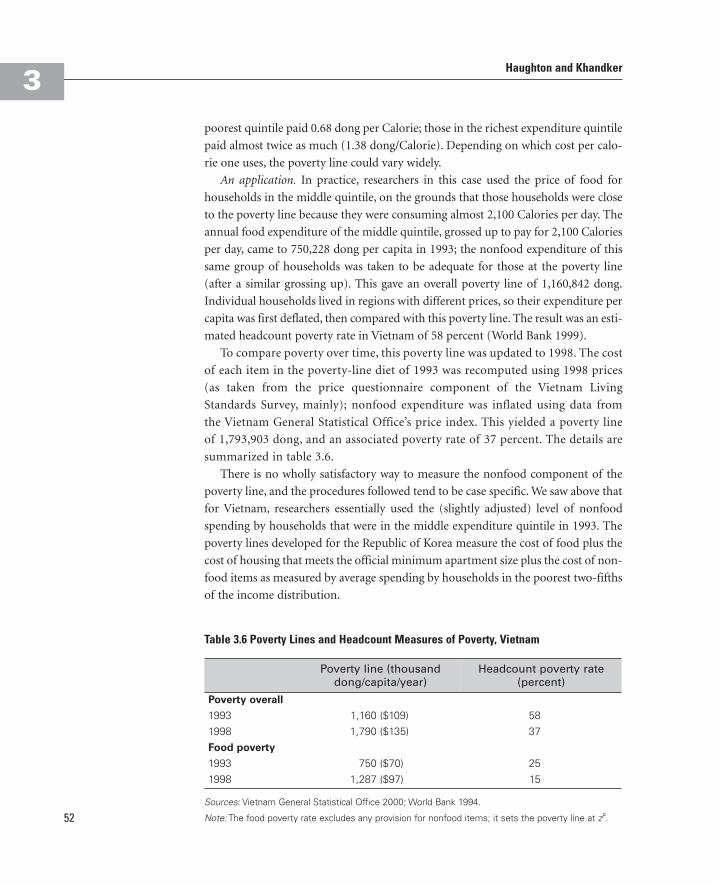
poorest quintile paid 0.68 dong per Calorie; those in the richest expenditure quintile
paid almost twice as much (1.38 dong/Calorie). Depending on which cost per calo-
rie one uses, the poverty line could vary widely.
An application. In practice, researchers in this case used the price of food for
households in the middle quintile, on the grounds that those households were close
to the poverty line because they were consuming almost 2,100 Calories per day. The
annual food expenditure of the middle quintile, grossed up to pay for 2,100 Calories
per day, came to 750,228 dong per capita in 1993; the nonfood expenditure of this
same group of households was taken to be adequate for those at the poverty line
(after a similar grossing up). This gave an overall poverty line of 1,160,842 dong.
Individual households lived in regions with different prices, so their expenditure per
capita was first deflated, then compared with this poverty line. The result was an esti-
mated headcount poverty rate in Vietnam of 58 percent (World Bank 1999).
To compare poverty over time, this poverty line was updated to 1998. The cost
of each item in the poverty-line diet of 1993 was recomputed using 1998 prices
(as taken from the price questionnaire component of the Vietnam Living
Standards Survey, mainly); nonfood expenditure was inflated using data from
the Vietnam General Statistical Office’s price index. This yielded a poverty line
of 1,793,903 dong, and an associated poverty rate of 37 percent. The details are
summarized in table 3.6.
There is no wholly satisfactory way to measure the nonfood component of the
poverty line, and the procedures followed tend to be case specific. We saw above that
for Vietnam, researchers essentially used the (slightly adjusted) level of nonfood
spending by households that were in the middle expenditure quintile in 1993. The
poverty lines developed for the Republic of Korea measure the cost of food plus the
cost of housing that meets the official minimum apartment size plus the cost of non-
food items as measured by average spending by households in the poorest two-fifths
of the income distribution.
Table 3.6 Poverty Lines and Headcount Measures of Poverty, Vietnam
Poverty line (thousanddong/capita/year)
Headcount poverty rate(percent)
Poverty overall
1993 1,160 ($109) 581998 1,790 ($135) 37Food poverty
1993 750 ($70) 251998 1,287 ($97) 15
Sources: Vietnam General Statistical Office 2000; World Bank 1994.
Note: The food poverty rate excludes any provision for nonfood items; it sets the poverty line at zF.
CHAPTER 3: Poverty Lines3
53
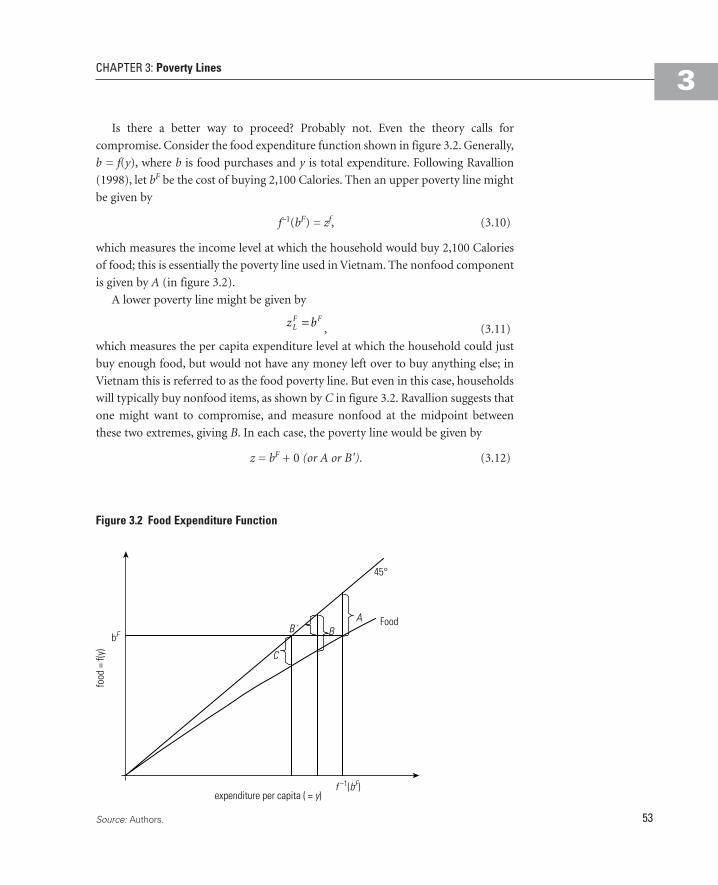
Is there a better way to proceed? Probably not. Even the theory calls for
compromise. Consider the food expenditure function shown in figure 3.2. Generally,
b = f(y), where b is food purchases and y is total expenditure. Following Ravallion
(1998), let bF be the cost of buying 2,100 Calories. Then an upper poverty line might
be given by
f–1(bF) = zf, (3.10)
which measures the income level at which the household would buy 2,100 Calories
of food; this is essentially the poverty line used in Vietnam. The nonfood component
is given by A (in figure 3.2).
A lower poverty line might be given by
, (3.11)
which measures the per capita expenditure level at which the household could just
buy enough food, but would not have any money left over to buy anything else; in
Vietnam this is referred to as the food poverty line. But even in this case, households
will typically buy nonfood items, as shown by C in figure 3.2. Ravallion suggests that
one might want to compromise, and measure nonfood at the midpoint between
these two extremes, giving B. In each case, the poverty line would be given by
z = bF + 0 (or A or B'). (3.12)
Figure 3.2 Food Expenditure Function
Source: Authors.
Haughton and Khandker3
54
As one might expect, when there is potential disagreement about the best
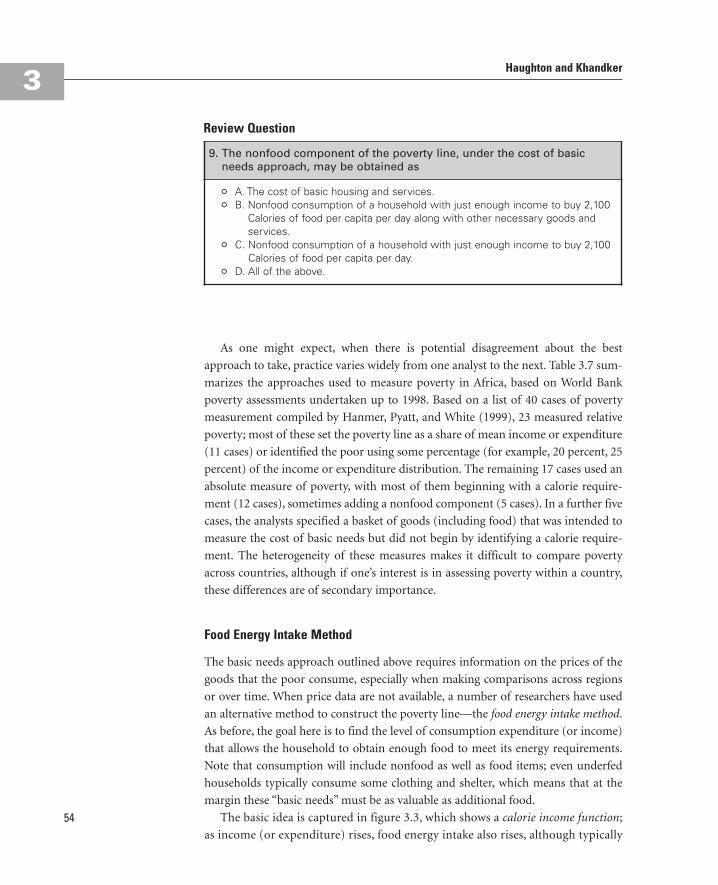
approach to take, practice varies widely from one analyst to the next. Table 3.7 sum-
marizes the approaches used to measure poverty in Africa, based on World Bank
poverty assessments undertaken up to 1998. Based on a list of 40 cases of poverty
measurement compiled by Hanmer, Pyatt, and White (1999), 23 measured relative
poverty; most of these set the poverty line as a share of mean income or expenditure
(11 cases) or identified the poor using some percentage (for example, 20 percent, 25
percent) of the income or expenditure distribution. The remaining 17 cases used an
absolute measure of poverty, with most of them beginning with a calorie require-
ment (12 cases), sometimes adding a nonfood component (5 cases). In a further five
cases, the analysts specified a basket of goods (including food) that was intended to
measure the cost of basic needs but did not begin by identifying a calorie require-
ment. The heterogeneity of these measures makes it difficult to compare poverty
across countries, although if one’s interest is in assessing poverty within a country,
these differences are of secondary importance.
Food Energy Intake Method
The basic needs approach outlined above requires information on the prices of the
goods that the poor consume, especially when making comparisons across regions
or over time. When price data are not available, a number of researchers have used
an alternative method to construct the poverty line—the food energy intake method.
As before, the goal here is to find the level of consumption expenditure (or income)
that allows the household to obtain enough food to meet its energy requirements.
Note that consumption will include nonfood as well as food items; even underfed
households typically consume some clothing and shelter, which means that at the
margin these “basic needs” must be as valuable as additional food.
The basic idea is captured in figure 3.3, which shows a calorie income function;
as income (or expenditure) rises, food energy intake also rises, although typically
9. The nonfood component of the poverty line, under the cost of basicneeds approach, may be obtained as
° A. The cost of basic housing and services.
° B. Nonfood consumption of a household with just enough income to buy 2,100Calories of food per capita per day along with other necessary goods and services.
° C. Nonfood consumption of a household with just enough income to buy 2,100Calories of food per capita per day.
° D. All of the above.
Review Question
CHAPTER 3: Poverty Lines3
55
more slowly. Given some level of just-adequate food energy intake k, one may use
this curve to determine the poverty-line level of expenditure, z. Formally, the
function shows
k = f (y) (3.13)
So, given monotonicity,
y = f–1(k), (3.14)
or, given a minimum adequate level of calorie kmin, we have
z = f–1(kmin), (3.15)
where z is the poverty line. This approach is parsimonious in that it does not require
any information about the prices of goods consumed.
First one needs to determine the amount of food that is adequate. Vietnam pegs
this level at 2,100 calories per person per day, in line with UN Food and Agriculture
Table 3.7 Typology of Poverty Lines in World Bank Poverty Assessments for Africa
Absolute (17 cases)Calorie requirement (12) Calories only
Calorie cost/food share (1)Calories + basket of goods (5)
Basket of goods (including food) (5)
Relative (23 cases)Relative to income base Multiple of wage
Share of mean income or expenditure (11)Specified percentage of income distribution (11)
Source: Hanman, Pyatt, and White 1999.
Figure 3.3 Calorie Income Function
Source: Authors.

Haughton and Khandker3
56
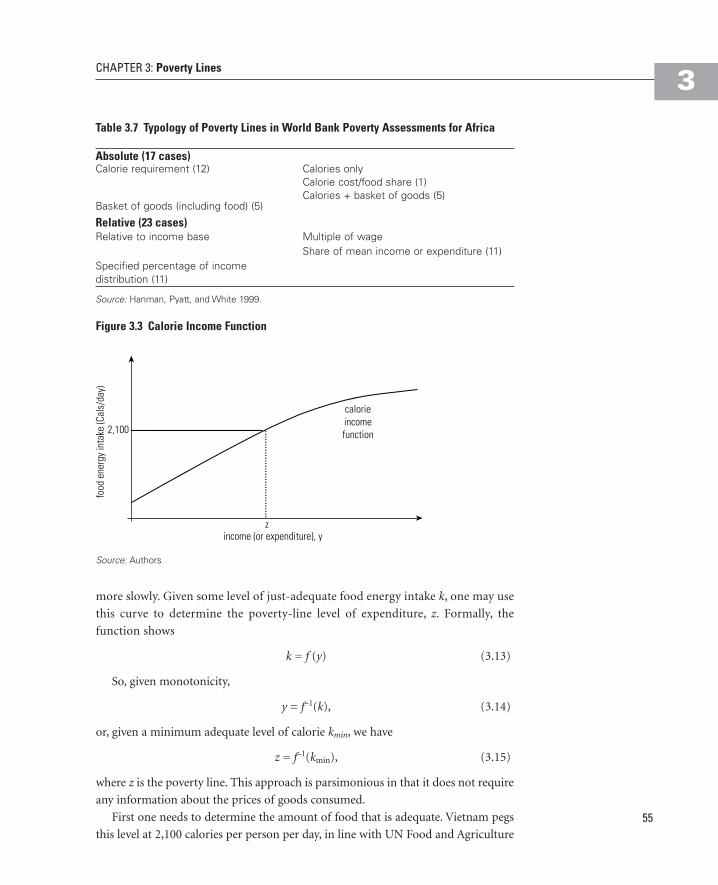
Unfortunately, the food energy intake method is seriously flawed, and should not
be used for comparisons across time, or across regions, or between urban and rural
areas, unless the alternatives are infeasible. Ravallion and Bidani (1994) computed
headcount poverty measures for Indonesia using the SUSENAS (Indonesia’s
National Socioeconomic Survey) data for 1990, using both the cost of basic needs
and the food energy intake methods. Their results are shown in table 3.9. The most
striking finding is that while the overall poverty rates are designed to be relatively
Organization recommendations, but it is recognized that individuals may need more
or less food than this. Clearly, the needs of young children, growing teenagers, man-
ual workers, pregnant women, or sedentary office workers may differ quite
markedly; physical stature also plays a role. Not all countries have set the same cut-
off point, as table 3.8 shows.
A variant of this approach was used to measure poverty in Vietnam, using data
from the Vietnam Living Standards Survey of 1993 (World Bank 2004). Separate
food expenditure lines were estimated for urban and rural areas in each of seven
provinces; the cost of obtaining 2,100 Calories of food per person per day was
then computed, as were the associated poverty lines—one for each rural and
urban area in each province. This gave a headcount index of 55 percent (Dollar
and Litvack 1998).
Table 3.8 Per Capita Daily Calorie Intake Used in Poverty Line Construction
Years Urban Rural
Bangladesh 1996–99 2,112 2,122India 1993–95 2,100 2,400Indonesia 1990, 1999 2,100 2,100Laos 1995 2,100 2,100Pakistan 1992–93, 1996–97 2,295 2,550Thailand 1990, 1998 2,100 2,100Vietnam 1993, 1998 2,100 2,100
Source: www.idrc.ca/uploads/user-S/10282146370mimap60.doc [accessed July 16, 2008].
Note:Thailand now uses Calorie levels that are differentiated by age and gender; for instance, for adultsages 31–50, 2,100 Calories for men and 1,750 Calories for women.
10. Is the following statement true, false, or uncertain? The food energyintake approach sets the poverty line at the level of expenditure at whichthe household buys just enough calories (for example, 2,100 Calories percapita per day).
° True
° False
° Uncertain
Review Question
CHAPTER 3: Poverty Lines3
57
similar, the disaggregated results are very different: the cost of basic needs method
shows rural poverty to be more than twice as great as urban poverty, while the food
energy intake method indicates (implausibly) that poverty is higher in urban than in
rural areas. Ravallion and Bidani also computed poverty rates using these two meas-
ures for each of the main regions of Indonesia, and found almost no correlation
between the two measures.
Why is the food energy intake method potentially unreliable? The weaknesses of
the method were pointed out in an important article by Ravallion and Bidani (1994);
in the next few paragraphs we summarize their approach and findings. The method
also failed in a recent analysis of data from Vietnam, for slightly different reasons,
also summarized below.
The Urban-Rural Problem. The problem begins when one recognizes that food
energy, typically shown on the calorie income function, depends on other factors as
well as income. The other influences include the tastes of the household (for example,
urban tastes in food may differ from rural tastes); the level of activity of household
members; the relative prices of different foods, and of food to nonfood items; and the
presence of publicly provided goods.
Figure 3.4 shows hypothetical (but plausible) calorie income functions for urban
and rural households. Rural households can obtain food more cheaply, both because
food is typically less expensive in rural areas and also because they are more willing
to consume foodstuffs that are cheaper per calorie (such as cassava rather than rice);
urban consumers are more likely to buy higher quality foodstuffs, which raises the
cost per calorie. It follows that the calorie income function for rural households will
typically be higher than that for urban households. The implication is that for a
given level of food energy intake, the poverty line in the rural area will be lower than
in the urban area, as figure 3.4 makes clear. To the extent that this reflects differences
in the cost of living, it is not a problem to have two poverty lines of this kind.
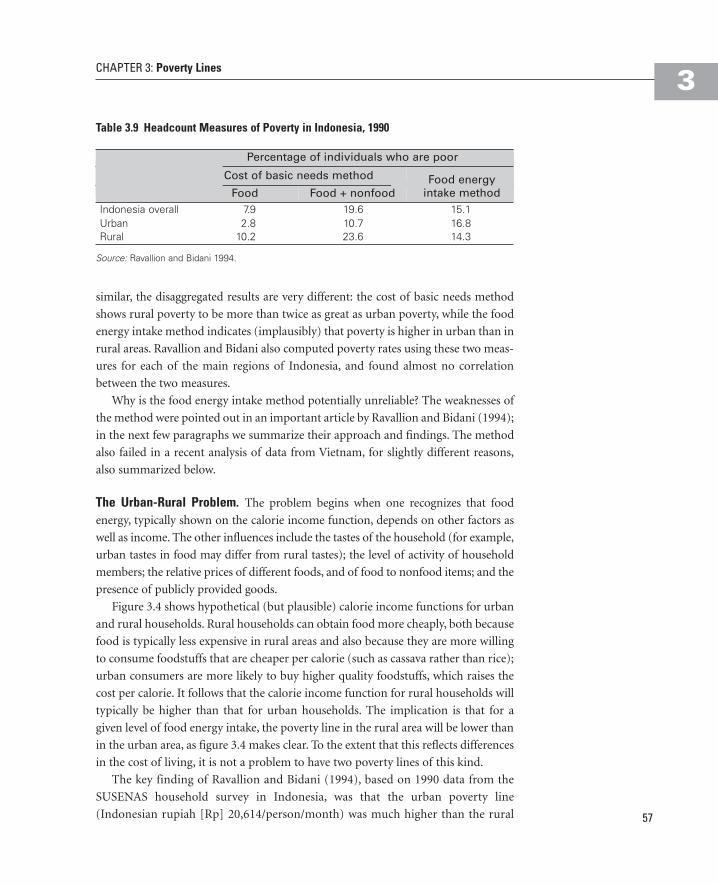
The key finding of Ravallion and Bidani (1994), based on 1990 data from the
SUSENAS household survey in Indonesia, was that the urban poverty line
(Indonesian rupiah [Rp] 20,614/person/month) was much higher than the rural
Table 3.9 Headcount Measures of Poverty in Indonesia, 1990
Percentage of individuals who are poor
Cost of basic needs method
Food Food + nonfoodIndonesia overall 7.9 19.6 15.1Urban 2.8 10.7 16.8Rural 10.2 23.6 14.3
Source: Ravallion and Bidani 1994.
Food energyintake method

Haughton and Khandker3
58
one (Rp 13,295/person/month) and, most important, this gap far exceeded the
difference in the cost of living between urban and rural areas. Using these poverty
lines, Ravallion and Bidani (1994) found that poverty in Indonesia appeared to be
higher in the urban than in the rural areas (table 3.10), a completely implausible
result. The point is also illustrated in figure 3.5, which shows the cumulative dis-
tribution of consumption per capita for rural and urban areas and marks the
poverty lines and headcount poverty rates.
Figure 3.4 Calorie Income Functions for Urban and Rural Indonesia
Source: Authors.
11. Ravallion and Bidani found, using the food energy intake method, thatthe urban poverty line in Indonesia exceeded the rural poverty line bymore than a simple comparison of living costs would lead one toexpect, because
° A. Urban households eat more.
° B. Urban households eat better-quality food.
° C. Urban food prices are much higher than rural food prices.
° D. Urban housing costs more than rural housing.
Review Question
The Relative Price Problem. When researchers tried to apply the food energy
intake approach to data from the Vietnam Living Standards Survey of 1998, the
method failed. As with the 1993 data, the idea was to compute food expenditure
functions, find the cost of 2,100 Calories of food, and calculate the related level of
expenditure per capita, which would then serve as a poverty line. After undertaking
this exercise, researchers found a higher level of poverty in 1998 than in 1993, an
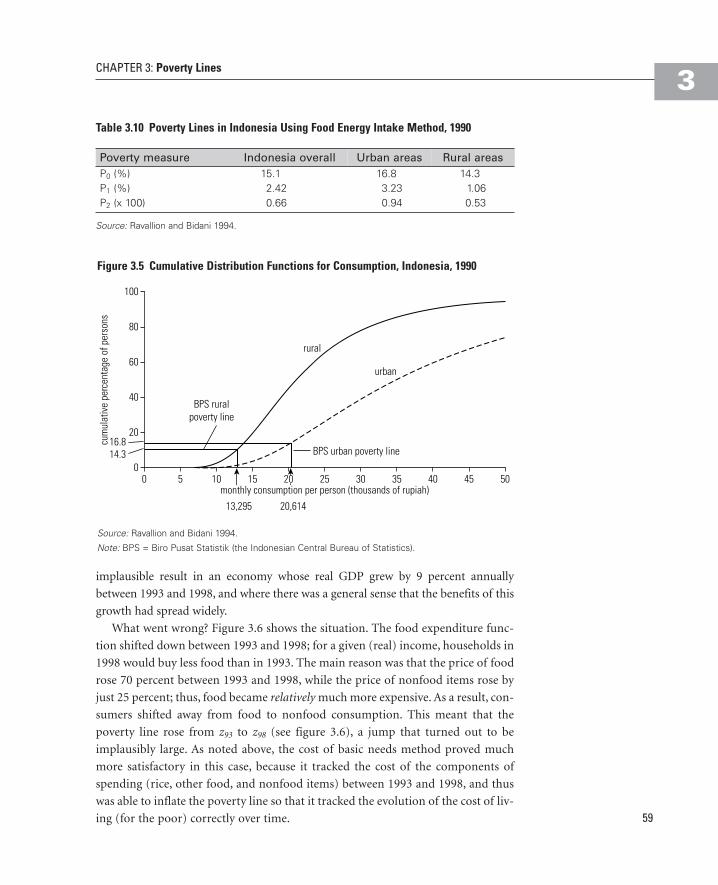
CHAPTER 3: Poverty Lines3
59
implausible result in an economy whose real GDP grew by 9 percent annually
between 1993 and 1998, and where there was a general sense that the benefits of this
growth had spread widely.
What went wrong? Figure 3.6 shows the situation. The food expenditure func-
tion shifted down between 1993 and 1998; for a given (real) income, households in
1998 would buy less food than in 1993. The main reason was that the price of food
rose 70 percent between 1993 and 1998, while the price of nonfood items rose by
just 25 percent; thus, food became relatively much more expensive. As a result, con-
sumers shifted away from food to nonfood consumption. This meant that the
poverty line rose from z93 to z98 (see figure 3.6), a jump that turned out to be
implausibly large. As noted above, the cost of basic needs method proved much
more satisfactory in this case, because it tracked the cost of the components of
spending (rice, other food, and nonfood items) between 1993 and 1998, and thus
was able to inflate the poverty line so that it tracked the evolution of the cost of liv-
ing (for the poor) correctly over time.
Figure 3.5 Cumulative Distribution Functions for Consumption, Indonesia, 1990
Source: Ravallion and Bidani 1994.
Note: BPS = Biro Pusat Statistik (the Indonesian Central Bureau of Statistics).
Table 3.10 Poverty Lines in Indonesia Using Food Energy Intake Method, 1990
Poverty measure Indonesia overall Urban areas Rural areasP0 (%) 15.1 16.8 14.3P1 (%) 2.42 3.23 1.06P2 (x 100) 0.66 0.94 0.53
Source: Ravallion and Bidani 1994.

Haughton and Khandker3
60
Solution B: Subjective Poverty Lines
We could measure poverty by asking people to define a poverty line, and using this
to measure the extent of poverty. For instance, in a survey one might ask
What income level do you personally consider to be absolutely minimal? That is
to say, with less you could not make ends meet.
The answers will vary from person to person (and by size of household), but they
could be plotted, and a line fitted through them, to get a subjective poverty line such
as z* in figure 3.7. It may also be possible to get adequate results by asking “do you
consider your current consumption to be adequate to make ends meet?”
Mahar Mangahas has amassed extensive information on subjective poverty in
the Philippines as part of the social weather stations project. Collected biannually
This is a serious indictment of the food energy intake method. But it should also
be clear that every measure of poverty can be faulted because each rests in part on
arbitrary assumptions. In measuring poverty, there is no single truth.
Figure 3.6 The Determination of Poverty Lines for Vietnam, 1993 and 1998
Source: Authors.
12. Is the following statement true or false? The food energy intake methodshowed that the real poverty line in Vietnam rose rapidly between 1993and 1998, because of inflation.
° True
° False
Review Question

CHAPTER 3: Poverty Lines3
61
since 1985, and quarterly since 1992, the surveys poll about 1,200 households.
Each household is shown a card with a line running across it; below the line is
marked “poor” (mahirap) and above the line “nonpoor,” and each household is
asked to mark on the card where it fits. Separately, households are also asked to
define a poverty line. Figure 3.8 reproduces a graph that tracks the evolution of
this poverty rate from 1983 to 2008. Here are the comments of Mahar Mangahas
that accompany the graph:
Figure 3.7 Estimating a Subjective Poverty Line
Source: Authors.
Figure 3.8 Self-Rated Poverty: Households That Are “Mahirap,” April 1983 to Second
Quarter 2008
Source: Mangahas 2008 (http://www.sws.org.ph/), reprinted with permission.
Note: NSCB = National Statistical Coordination Board of the Philippines.

Haughton and Khandker3
62
Fifty-nine percent of Filipino families, or about 10.6 million, rate themselves
as Mahirap or Poor, 24% put themselves on the Borderline, and 17% rate
themselves as Hindi Mahirap or Not Poor, according to the Second Quarter
2008 Social Weather Survey, fielded over June 27-30, 2008.
The new Self-Rated Poverty rate is 9 points higher than the 50% (estimated
9.0 million) in the First Quarter, and 13 points above the previous low of 46%
(est. 8.1 million) in December 2007, thus wiping out the decline in Self-Rated
Poverty “to its 20-year low in 2007” mentioned in President Gloria Macapa-
gal-Arroyo’s State of the Nation Address last July 28th. (Mangahas 2008)2
Gaurav Datt of the World Bank has analyzed the Filipino data in some detail.
Here are some of his more interesting findings (Datt 2002):
• Self-rated poverty lines are high. In 1997, the median poverty line was about 10,000
pesos per month for a “typical” household; this compares with the government’s
“basic needs” poverty line, which at that time stood at 4,495 pesos/month. The
implication is that self-rated poverty rates are high—60 percent of all households
in 1997, compared with 25 percent using the basic needs line.
• The self-rated poverty line has risen rapidly over time, by about 60–70 percent
between 1985 and 1997. One consequence is that there is no trend in self-rated
poverty over time. Another implication is that even when there is an economic
slowdown, as occurred in 1997–98, the self-rated poverty rate hardly changes: it
rose from 59 percent in 1996–97 to 61 percent in 1998.
• Perhaps a surprise, the self-rated poverty line given by poor households is only
slightly lower than that for nonpoor households, and in fact, the difference is not
statistically significant. One might have expected poor households to have a less
generous measure of the poverty line.
• There is a clear urban/rural difference in perceptions of the poverty line, with
urban households setting a (money) poverty line at about twice the level of rural
households, giving
(3.16)
The cost of living is certainly higher in urban areas, but by a factor of 1.2 to 1.5
rather than by a factor of 2. Thus, the urban self-rated poverty line is, in real terms,
higher than its rural counterpart. Why?
• One possibility is that there is more inequality in the urban areas, and that this
raises expectations.
• Another plausible explanation is that households in urban areas may have
more exposure to the media, and may have been affected more thoroughly by
consumerism.
CHAPTER 3: Poverty Lines3
63
• A third explanation is that urban households may be more attuned to political
processes, and their estimates of the poverty line may include an element of
strategic behavior—trying to influence policy makers.
Self-rated measures of poverty are rarely collected. If the Filipino experience is at
all representative, it is clear that self-rated measures may complement, but cannot
fully supplant, the more traditional “objective” measures of poverty.
The question of the reliability of self-rated measures of satisfaction continues to
be debated. Angus Deaton (2008) finds a measure of “life satisfaction,” as collected
in 123 countries in 2006 by the Gallup organization, is highly correlated with real
per capita income. More specifically, life satisfaction is measured on a scale of 0
(dissatisfied) through 10 (satisfied), in response to a question that asks, “All things
considered, how satisfied are you with your life as a whole these days?” This, notes
Deaton, is not synonymous with “happiness,” which is a more short-term phenom-
enon. Using a measure of GDP per capita in 2000 international dollars, Deaton
(2008) estimated the following regression:
Average life satisfaction = 0.845 ln(GDP/capita) – 3.25 GDP growth rate, 2003–05 + αSE = 0.050 SE = 1.46
Here, α refers to the intercept. This equation has an R2 of 0.71. The strong link
between real income and life satisfaction is clear; more surprising, perhaps, is that
after controlling for the level of per capita GDP, faster GDP growth is associated with
lower life satisfaction, perhaps because of the psychological and other adjustment
costs associated with rapid economic growth.
Deaton concludes that, “reports of life satisfaction, at least on average, may
provide a useful summary of the different components of people’s capabilities”
(2008, 12), but he considers that more objective measures of poverty are still
needed, because people may simply have adapted to misery and hardship. The
dilemma is this: if a poor slave says he is happy, should we take that assertion at
face value? But if not, then a subjective measure of life satisfaction is an incom-
plete measure of well-being.
13. Based on experience in the Philippines, which of the following state-ments is not true?
° A. Subjective poverty lines are not absolute over time.
° B. Self-rated poverty lines show high poverty rates.
° C. The rich report markedly higher poverty lines than the poor.
° D. Urban households set poverty lines higher than rural households, by morethan the price differential between urban and rural areas would imply.
Review Question

Haughton and Khandker3
64
Notes
1. Pradhan et al. (2000) favor an interactive procedure: pick a reference population that is rel-
atively poor and compute their cost of calories; now recompute the poverty line; take as the
new reference population those households close to this poverty line and recalculate the
cost of calories; compute the poverty line again; and so on, until the poverty line stabilizes.
2. The exchange rate in mid-September 2003 was P54.75 per U.S. dollar.
References
Chen, Shaohua, and Martin Ravallion. 2008. “The Developing World Is Poorer Than We
Thought, But No Less Successful in the Fight against Poverty.” Policy Research Working
Paper No. 4703, World Bank, Washington, DC.
Dalaker, Joseph, and Mary Naifeh. 1998. Poverty in the United States: 1997. U.S. Bureau of the
Census, Current Population Reports, Series P60-201, U.S. Government Printing Office,
Washington, DC.
Datt, Gaurav. 2002. “Implementation Completion Report. Philippines: Enhanced Poverty
Monitoring – Studies Component.” World Bank, Washington, DC.
Deaton, Angus. 2008. “Income, Health, and Well-Being around the World: Evidence from the
Gallup World Poll.” Journal of Economic Perspectives 22 (2): 53–72.
Dollar, David, Paul Glewwe, and Jennie Litvack, eds. 1998. Household Welfare and Vietnam’s
Transition. World Bank Regional and Sectoral Studies. Washington, DC: World Bank.
Dollar, David, and Jennie Litvack. 1998. “Macroeconomic Reform and Poverty Reduction in
Vietnam.” In Household Welfare and Vietnam’s Transition, ed. D. Dollar, P. Glewwe, and J.
Litvack, 1–28. Washington, DC: World Bank.
Duong, Nguyen Binh, and Dinh Tien Trinh. 1999. “Identification of Poverty in Vietnam.” In
Health and Wealth in Vietnam: An Analysis of Household Living Standards, ed. Dominique
Haughton, Jonathan Haughton, Sarah Bales, Truong Thi Kim Chuyen, and Nguyen Nguyet
Nga. Singapore: Institute of Southeast Asian Studies Press.
Gibson, John. 1999. “A Poverty Profile of Cambodia, 1999.” Report to the World Bank and the
Ministry of Planning, Phnom Penh.
Hanmer, Lucia C., Graham Pyatt, and Howard White. 1999. “What Do the World Bank’s
Poverty Assessments Teach Us about Poverty in Sub-Saharan Africa?” Development and
Change 30 (4): 795–823.
Haughton, Jonathan. 2000. “Ten Puzzles and Surprises: Economic and Social Change in
Vietnam, 1993–1998.” Comparative Economic Studies 42 (4): 67–92.
Kakwani, Nanak. 2000. “Growth and Poverty Reduction: An Empirical Analysis.” Asian Devel-
opment Review 18 (2): 74–84.
Mangahas, Mahar. 2008. “Second Quarter 2008 Social Weather Survey: Self-Rated Poverty
jumps to 59%.” Social Weather Stations project, the Philippines. http://www.sws.org.ph/.
Pradhan, Menno, Asep Suryahadi, Sudarno Sumarto, and Lant Pritchett. 2000. “Measurements
of Poverty in Indonesia, 1996, 1999, and Beyond.” Policy Research Working Paper Series
No. 2438, World Bank, Washington, DC.

CHAPTER 3: Poverty Lines3
65
Prescott, Nicholas, and Menno Pradhan. 1997. “A Poverty Profile of Cambodia.” Discussion
Paper No. 373, World Bank, Washington, DC.
Ravallion, Martin. 1992. “Poverty Comparisons: A Guide to Concepts and Methods.” LSMS
Working Paper No. 88, World Bank, Washington, DC.
———. 1996. “How Well Can Method Substitute for Data? Five Experiments in Poverty
Analysis.” The World Bank Research Observer 11 (2): 199–221.
———. 1998. Poverty Lines in Theory and Practice. Washington, DC: World Bank.
Ravallion, Martin, and Benu Bidani. 1994. “How Robust Is a Poverty Profile?” World Bank
Economic Review 8 (1): 75–102.
Ravallion, Martin, Gaurav Datt, and Dominique van de Walle. 1991. “Quantifying Absolute
Poverty in the Developing World.” Review of Income and Wealth 37 (4): 345–61.
Rowntree, Benjamin Seebohm. 1941. Poverty and Progress: A Second Social Survey of York.
London: Longmans, Green.
Sen, Amartya. 1983. “Development: Which Way Now?” The Economic Journal 93 (372): 742–62.
Vietnam General Statistical Office. 2000. Viet Nam Living Standards Survey 1997-1998,
Statistical Publishing House, Hanoi.
World Bank. 1994. “Viet Nam Living Standards Survey (VNLSS) 1992–93.” Poverty and
Human Resources Division, World Bank, Washington, DC.
———. 1999. Entering the 21st Century: World Development Report 1999/2000. Washington,
DC: World Bank.
———. 2000. World Development Report 2000/2001: Attacking Poverty. Washington, DC:
World Bank.

Related Documents