HAND-GESTURE SENSING LEVERAGING RADIO AND VIBRATION SIGNALS BY SONG YANG A thesis submitted to the School of Graduate Studies Rutgers, The State University of New Jersey In partial fulfillment of the requirements For the degree of Master of Engineering Graduate Program in Electrical and Computer Engineering Written under the direction of Yingying Chen And approved by New Brunswick, New Jersey May, 2019

Welcome message from author
This document is posted to help you gain knowledge. Please leave a comment to let me know what you think about it! Share it to your friends and learn new things together.
Transcript
HAND-GESTURE SENSING LEVERAGING RADIOAND VIBRATION SIGNALS
BY SONG YANG
A thesis submitted to the
School of Graduate Studies
Rutgers, The State University of New Jersey
In partial fulfillment of the requirements
For the degree of
Master of Engineering
Graduate Program in Electrical and Computer Engineering
Written under the direction of
Yingying Chen
And approved by
New Brunswick, New Jersey
May, 2019
c© 2019
Song Yang
ALL RIGHTS RESERVED
ABSTRACT OF THE THESIS
Hand-gesture Sensing Leveraging Radio and Vibration
Signals
by Song Yang
Thesis Director:
Yingying Chen
Gesture recognition that enriches human-computer interaction (HCI) has gained consid-
erable attention recently. Existing solutions such as computer-vision-based approaches
recognize and track human hand/body gestures using cameras or visible light. How-
ever, they all require line-of-sight and are susceptible to interference from light sources.
In this thesis, an innovative approach using ambient radio and vibration signals is
implemented to achieve fine-grained hand/finger gesture recognition. By sensing the
influence of hand/finger gestures on the transmitted radio signals (e.g., millimeter wave
signals) and physical vibrations on a solid surface (e.g., tables, glass boards, acrylic
boards), the position of the hand/finger can be precisely estimated through similarity
and threshold-based techniques. Particularly, we implemented two types of solutions
that work separately: (1) a mmWave-based strategy, where we leverage frequency-
modulated continuous-wave (FMCW) radar to track hand movements and recognize
various hand gestures, and (2) a vibration-based strategy, where we capture the tiny
disturbance in the surface vibrations caused by a users finger touches to distinguish
between different finger inputs on the surface. Extensive experiments demonstrate that
our proposed approaches can accurately track and recognize users hand gestures with
high accuracy.
ii
List of Figures
1.1. Illustrations of hand-gesture sensing systems. . . . . . . . . . . . . . . . 2
3.1. Feasibility experiment swiping right tracing. . . . . . . . . . . . . . . . . 6
3.2. Chirp and intermediate frequency signal in FMCW. . . . . . . . . . . . 7
3.3. Received 17kHz to 19kHz chirp signal. . . . . . . . . . . . . . . . . . . . 9
4.1. System architecture for radio-signal-based gesture recognition. . . . . . . 11
4.2. Views of antennas. . . . . . . . . . . . . . . . . . . . . . . . . . . . . . . 12
4.3. Illustration of radio-signal-based gestures. . . . . . . . . . . . . . . . . 13
4.4. System architecture for vibration-based gesture recognition system. . . . 13
4.5. Illustration of target gestures. . . . . . . . . . . . . . . . . . . . . . . . . 16
4.6. The similarity definitions. . . . . . . . . . . . . . . . . . . . . . . . . . . 16
5.1. The experimental setups . . . . . . . . . . . . . . . . . . . . . . . . . . . 19
5.2. Selected piezoelectric sensor. . . . . . . . . . . . . . . . . . . . . . . . . 20
5.3. Preliminary traces of gestures. . . . . . . . . . . . . . . . . . . . . . . . 21
5.4. Similarity between ’push and pull’ gesture and ’swipe right’ gesture. . . 22
5.5. Gestures confusion matrix. . . . . . . . . . . . . . . . . . . . . . . . . . . 23
5.6. Similarity among drawing two line2 gesture samples. . . . . . . . . . . . 24
5.7. Similarity among three gestures including drawing two lines, drawing a
circle and drawing a triangle. . . . . . . . . . . . . . . . . . . . . . . . . 24
iii

Acknowledgements
First of all, I am very grateful to my advisor Prof. Yingying Chen for her insightful
feedback and kind guidance, which shaped the direction of my research. I also appreciate
Prof. Richard Howard’s helpful critique of my research. I would like to express thanks to
my mentors, Jian Liu and Chen Wang. Their experience and keen observations helped
me develop my skills as an academic. I also like to thank Xin Yang, my research partner
who helped accelerate the progress of my research work through our collaborations. Last
but not least, I’ d like to thank my family for their encouragement and support.
iv
Table of Contents
Abstract . . . . . . . . . . . . . . . . . . . . . . . . . . . . . . . . . . . . . . . . ii
List of Figures . . . . . . . . . . . . . . . . . . . . . . . . . . . . . . . . . . . . iii
Acknowledgements . . . . . . . . . . . . . . . . . . . . . . . . . . . . . . . . . iv
1. Introduction . . . . . . . . . . . . . . . . . . . . . . . . . . . . . . . . . . . 1
2. Related Work . . . . . . . . . . . . . . . . . . . . . . . . . . . . . . . . . . . 4
3. Background and Feasibility . . . . . . . . . . . . . . . . . . . . . . . . . . 5
3.1. Millimeter Wave Object Detection . . . . . . . . . . . . . . . . . . . . . 5
3.2. Physical Vibration Propagation and Attenuation on Common Boards . 8
4. System Design . . . . . . . . . . . . . . . . . . . . . . . . . . . . . . . . . . 10
4.1. Radio-signal-based System . . . . . . . . . . . . . . . . . . . . . . . . . . 10
4.1.1. Radio-signal-based System Design . . . . . . . . . . . . . . . . . 10
4.1.2. mmWave Radar Sensor . . . . . . . . . . . . . . . . . . . . . . . 10
4.1.3. Gesture Design . . . . . . . . . . . . . . . . . . . . . . . . . . . . 12
4.2. Vibration-based System . . . . . . . . . . . . . . . . . . . . . . . . . . . 12
4.2.1. Vibration-based System Overview . . . . . . . . . . . . . . . . . 13
4.2.2. Sensors Selection . . . . . . . . . . . . . . . . . . . . . . . . . . . 14
4.2.3. Design of Transmitting Signal . . . . . . . . . . . . . . . . . . . . 14
4.2.4. Gesture Design . . . . . . . . . . . . . . . . . . . . . . . . . . . . 15
4.3. Profiling . . . . . . . . . . . . . . . . . . . . . . . . . . . . . . . . . . . . 15
4.3.1. Similarity Definitions . . . . . . . . . . . . . . . . . . . . . . . . . 15
4.3.2. Profiling . . . . . . . . . . . . . . . . . . . . . . . . . . . . . . . . 17
v

5. Performance Evaluation . . . . . . . . . . . . . . . . . . . . . . . . . . . . 18
5.1. Prototyping and Experimental Setup . . . . . . . . . . . . . . . . . . . . 18
5.2. Data Collection . . . . . . . . . . . . . . . . . . . . . . . . . . . . . . . . 19
5.3. Evaluation of Radio-signal-based System . . . . . . . . . . . . . . . . . . 20
5.4. Evaluation of Vibration-based System . . . . . . . . . . . . . . . . . . . 22
6. Discussion . . . . . . . . . . . . . . . . . . . . . . . . . . . . . . . . . . . . . 25
6.1. The Influence Factors in Vibration-based Gesture System . . . . . . . . 25
6.2. Authentication and The Sweeping Speed of Chirp Signal . . . . . . . . . 25
6.3. Limitations . . . . . . . . . . . . . . . . . . . . . . . . . . . . . . . . . . 26
7. Conclusion . . . . . . . . . . . . . . . . . . . . . . . . . . . . . . . . . . . . 27
References . . . . . . . . . . . . . . . . . . . . . . . . . . . . . . . . . . . . . . . 28
vi
1
Chapter 1
Introduction
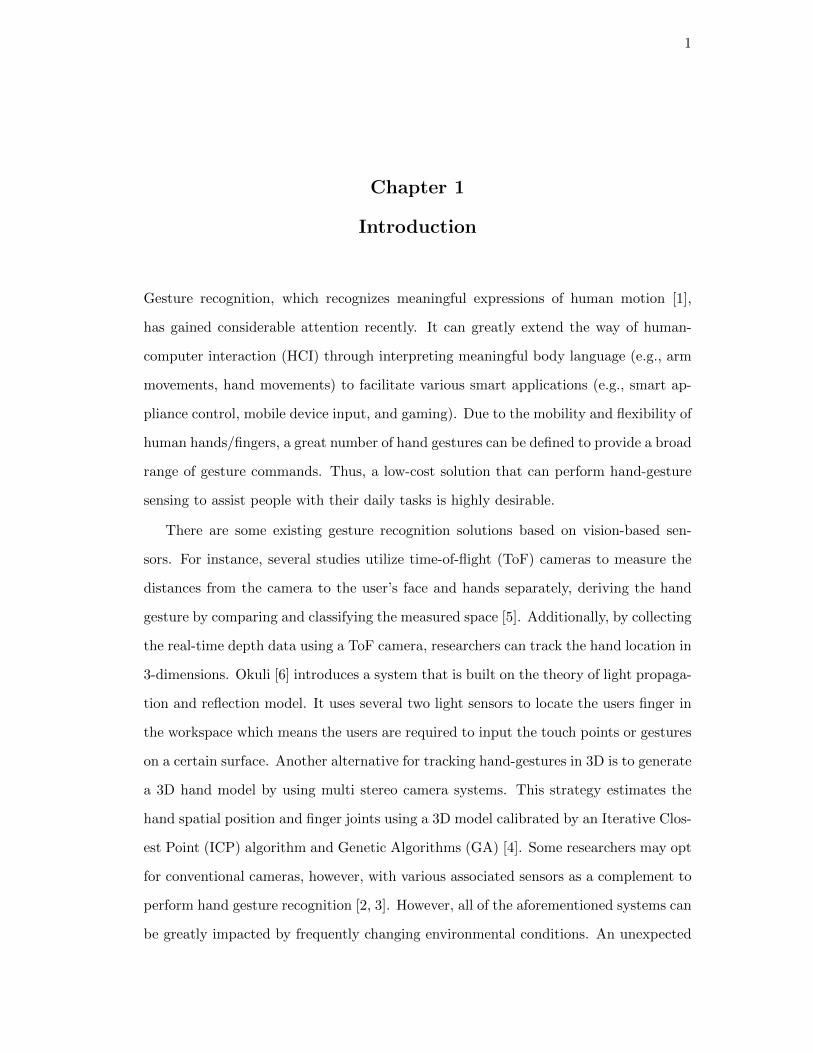
Gesture recognition, which recognizes meaningful expressions of human motion [1],
has gained considerable attention recently. It can greatly extend the way of human-
computer interaction (HCI) through interpreting meaningful body language (e.g., arm
movements, hand movements) to facilitate various smart applications (e.g., smart ap-
pliance control, mobile device input, and gaming). Due to the mobility and flexibility of
human hands/fingers, a great number of hand gestures can be defined to provide a broad
range of gesture commands. Thus, a low-cost solution that can perform hand-gesture
sensing to assist people with their daily tasks is highly desirable.
There are some existing gesture recognition solutions based on vision-based sen-
sors. For instance, several studies utilize time-of-flight (ToF) cameras to measure the
distances from the camera to the user’s face and hands separately, deriving the hand
gesture by comparing and classifying the measured space [5]. Additionally, by collecting
the real-time depth data using a ToF camera, researchers can track the hand location in
3-dimensions. Okuli [6] introduces a system that is built on the theory of light propaga-
tion and reflection model. It uses several two light sensors to locate the users finger in
the workspace which means the users are required to input the touch points or gestures
on a certain surface. Another alternative for tracking hand-gestures in 3D is to generate
a 3D hand model by using multi stereo camera systems. This strategy estimates the
hand spatial position and finger joints using a 3D model calibrated by an Iterative Clos-
est Point (ICP) algorithm and Genetic Algorithms (GA) [4]. Some researchers may opt
for conventional cameras, however, with various associated sensors as a complement to
perform hand gesture recognition [2, 3]. However, all of the aforementioned systems can
be greatly impacted by frequently changing environmental conditions. An unexpected

2
(a) Radio-signal-based system. (b) Vibration-based system.
Figure 1.1: Illustrations of hand-gesture sensing systems.
strong light or a dark environment can make it hard to build a robust system. This
thesis presents two systems utilizing vibration and radio signals to achieve the gesture
detection goal stepping forward to the a better gesture recognition. Vibration and radio
signals are desirable for their resistance to light changes. Furthermore, when consid-
ering hardware costs, the transmitters and receivers that signal-based systems require
are considerably less expensive compared to optical equipment needed for camera-based
solutions.
The proposed gesture recognition systems are built to provide interaction between
people and the environment. In the first radio-signal-based system, the user performs
hand gestures in the air, detected by nearby radar antennas as shown in Figure 1.1(a).
The system uses the radar sensors to measure the distance to each part of the human’s
hand and identifies the gesture with a threshold classifier.
The second system is a vibration-based gesture recognition system. The overall idea
is that, when the user performs a gesture on a solid surface, the transmitted signal on
the solid surface could sense the finger by detecting vibration anomalies created by
the presence of the finger. The theory is similar to previous work conducted by Prof.
Yingying Chen ’s team [8]. The illustration in Figure 1.1(b) shows the gesture perform-
ing process. By comparing the received and original signals, the software can learn the
fluctuation pattern of each gesture. Finally, we use a threshold based classification to
distinguish gestures. The similarity among the time series is quantifiable. We define
the sdsimilarity as the combination of two existing distance indicators, dynamic time
wrapping (DTW) and earth mover’s distance (EMD).
3
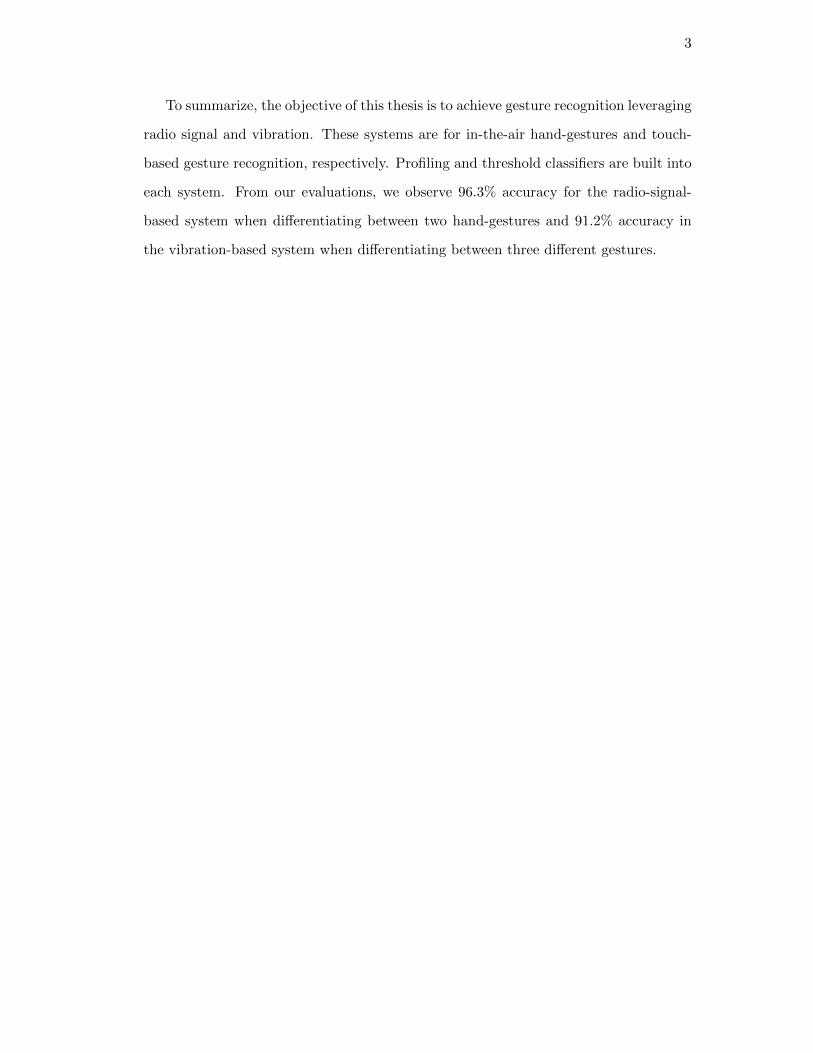
To summarize, the objective of this thesis is to achieve gesture recognition leveraging
radio signal and vibration. These systems are for in-the-air hand-gestures and touch-
based gesture recognition, respectively. Profiling and threshold classifiers are built into
each system. From our evaluations, we observe 96.3% accuracy for the radio-signal-
based system when differentiating between two hand-gestures and 91.2% accuracy in
the vibration-based system when differentiating between three different gestures.
4
Chapter 2
Related Work
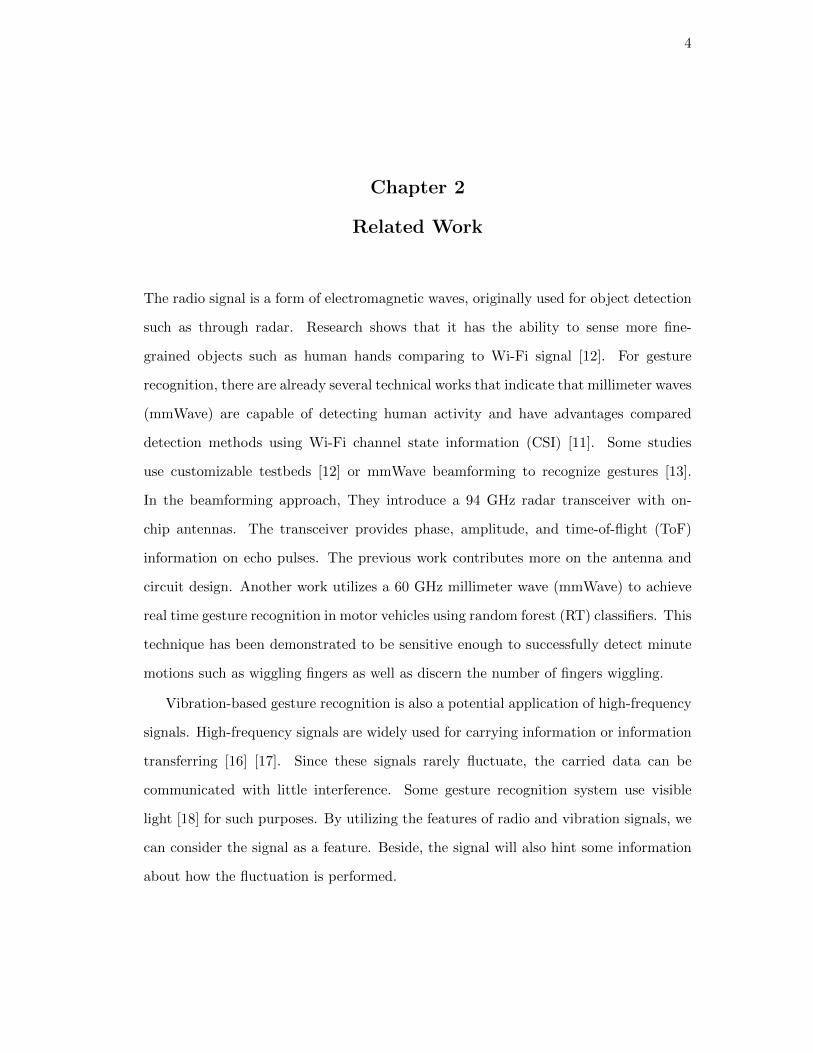
The radio signal is a form of electromagnetic waves, originally used for object detection
such as through radar. Research shows that it has the ability to sense more fine-
grained objects such as human hands comparing to Wi-Fi signal [12]. For gesture
recognition, there are already several technical works that indicate that millimeter waves
(mmWave) are capable of detecting human activity and have advantages compared
detection methods using Wi-Fi channel state information (CSI) [11]. Some studies
use customizable testbeds [12] or mmWave beamforming to recognize gestures [13].
In the beamforming approach, They introduce a 94 GHz radar transceiver with on-
chip antennas. The transceiver provides phase, amplitude, and time-of-flight (ToF)
information on echo pulses. The previous work contributes more on the antenna and
circuit design. Another work utilizes a 60 GHz millimeter wave (mmWave) to achieve
real time gesture recognition in motor vehicles using random forest (RT) classifiers. This
technique has been demonstrated to be sensitive enough to successfully detect minute
motions such as wiggling fingers as well as discern the number of fingers wiggling.
Vibration-based gesture recognition is also a potential application of high-frequency
signals. High-frequency signals are widely used for carrying information or information
transferring [16] [17]. Since these signals rarely fluctuate, the carried data can be
communicated with little interference. Some gesture recognition system use visible
light [18] for such purposes. By utilizing the features of radio and vibration signals, we
can consider the signal as a feature. Beside, the signal will also hint some information
about how the fluctuation is performed.
5
Chapter 3
Background and Feasibility
In this section, we investigate the feasibility of gesture recognition using radio signals
and vibration. Specifically, we evaluate the validity of the following ideas. For the
radio-signal-based system, we try to differentiate the reflected signal spectrograms. For
vibration-based gesture recognition, we examine use of physical vibration propagation
features. The following subsections will present the fundamental theory of millimeter
wave object detection, vibration attenuation, and how a human’s finger can affect this
process.
3.1 Millimeter Wave Object Detection
A millimeter wave (mmWave) is a signal encompassing the spectrum band between 30
gigahertz (GHz) and 300 GHz. The mmWave signal is easily blocked or absorbed by
solid surfaces because of its high-frequency nature. A study [23] on a mmWave ranging
from 75-110 GHz investigated the signal absorbing performance on frequency selective
surfaces. Their findings suggested that the mmWave has an advantage compared with
the visible, ultrasound and Wi-Fi signals.
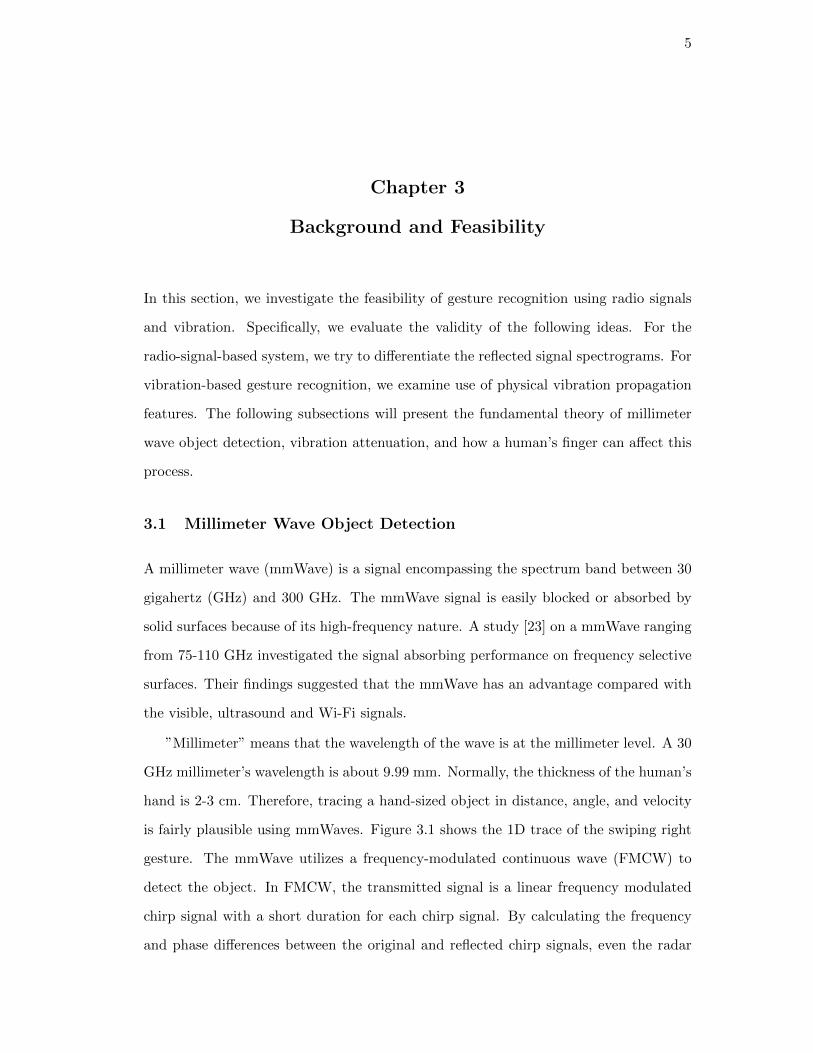
”Millimeter” means that the wavelength of the wave is at the millimeter level. A 30
GHz millimeter’s wavelength is about 9.99 mm. Normally, the thickness of the human’s
hand is 2-3 cm. Therefore, tracing a hand-sized object in distance, angle, and velocity
is fairly plausible using mmWaves. Figure 3.1 shows the 1D trace of the swiping right
gesture. The mmWave utilizes a frequency-modulated continuous wave (FMCW) to
detect the object. In FMCW, the transmitted signal is a linear frequency modulated
chirp signal with a short duration for each chirp signal. By calculating the frequency
and phase differences between the original and reflected chirp signals, even the radar

6
Figure 3.1: Feasibility experiment swiping right tracing.
can detect objects.
The basic algorithm of detecting the distance, angle, and velocity of the object
relies on the chirp slope and phase difference. The chirp slope is the increasing speed
of the frequency. The fundamental concept is that the antenna array sends the chirp
signal and receives the reflected signal wave from the object. The difference between
the overlapping part of the transmitted and received single chirp signal is defined as
the intermediate frequency (IF) signal as we can see the solid part in Figure 3.1. The
IF signal is computed by the hardware circuit. The initial phase (φ0 in Figure 3.1) of
the IF signal is the difference between the phase of the transmitted and received chirp,
which is known. The time delay for the received signal is normally hard to measure
for hardware in the real world situations since the travel time is normally 2 ns for
measuring an object across 30 cm. However, the slope follows the formula slope = φ0τ
where τ is the time delay. Furthermore, the time delay τ can be derived from Formula
3.1 where fc is the start frequency of the chirp signal.
φ0 = 2πfcτ (3.1)
With this formula, the distance and velocity can be calculated, after which the
time delay (τ) can be derived. Distance can be estimated by simply measuring the

7
Figure 3.2: Chirp and intermediate frequency signal in FMCW.
frequency difference between the transmitted and received signals. With the distance
to the object, we calculate the time delay (τ) between transmitted and received signal
using Formula 3.2 where c is the speed of the light [19].
τ =2d
c(3.2)
The angle measurements are based on the phase difference of multiple antenna
arrays. According to the Doppler Shift, an object moving to the wave source would
cause a change in the frequency or the wavelength of a wave. The frequency and phase
difference is caused by the movement of the object. When there are two chirps in
transmission to a moving object, the tiny phase difference (∆Φ) in each chirp can be
calculated. Since the absolute distance can be estimated through range measurement,
8
using two distances and intermediate transmitting time difference, the velocity (v) of
the object can also be calculated with Formula 3.3 where Tc is the length in time of a
single chirp and λ is the wavelength of the radar signal [19].
v =λ∆Φ
4πTc(3.3)
In Formula 3.3, the velocity resolution is closely related to the difference among
transmitted times. This formula actually computes the average speed of two points
based on range detection, assuming that the target object is moving along the cen-
tral line of the mmWave radar. The actual resolution is blurred but still capable of
determining the direction given the range and velocity measurement.
To summarize, the mmWave has the ability to detect fine-grained hand and finger
gestures. However, the limitation is that the vertical field-of-view (FOV) is just about
5 degrees. Thus it limits our gesture pattern design.
3.2 Physical Vibration Propagation and Attenuation on Common Boards
As we discussed in Section 3.1, object detection is based on the frequency change of
each chirp signal transmission process. The vibration propagation approach is different,
instead transmitting as a radio signal wave in the air. By transmitting the signal into
a solid board, the solid board works as a low pass filter in this situation. By choosing a
proper method to combine the surface and the signal transmitter sensor, it is possible
to revert the frequency peaks.
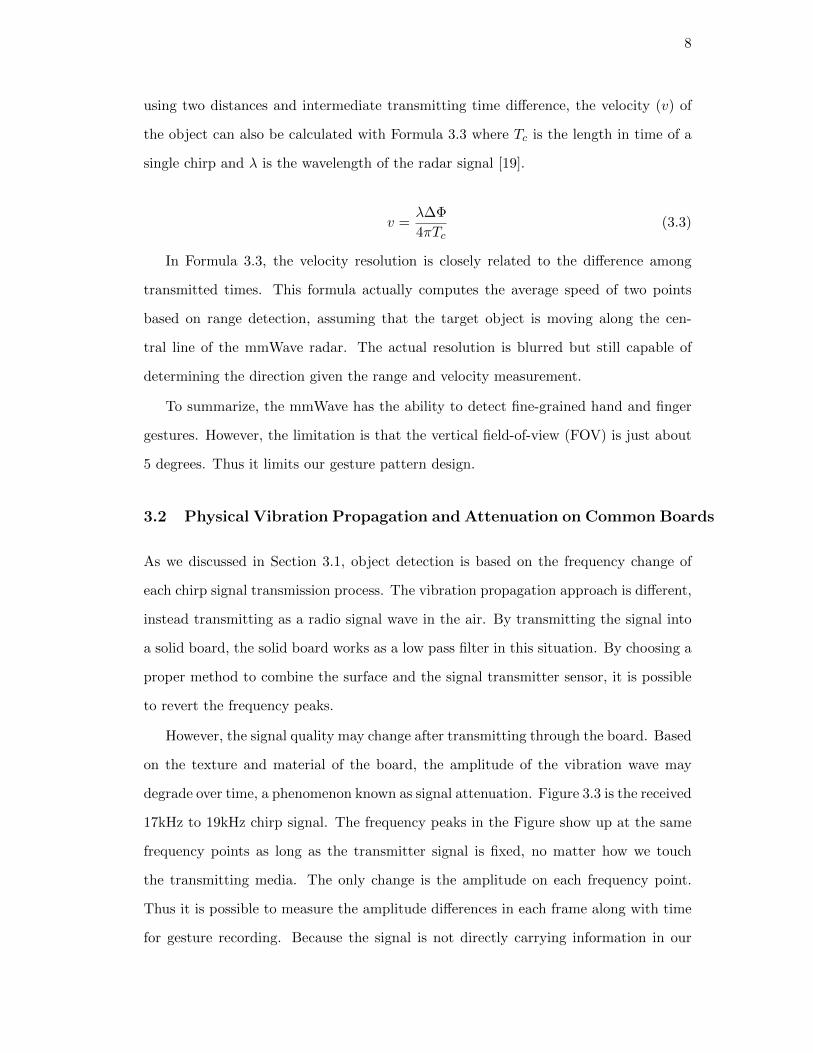
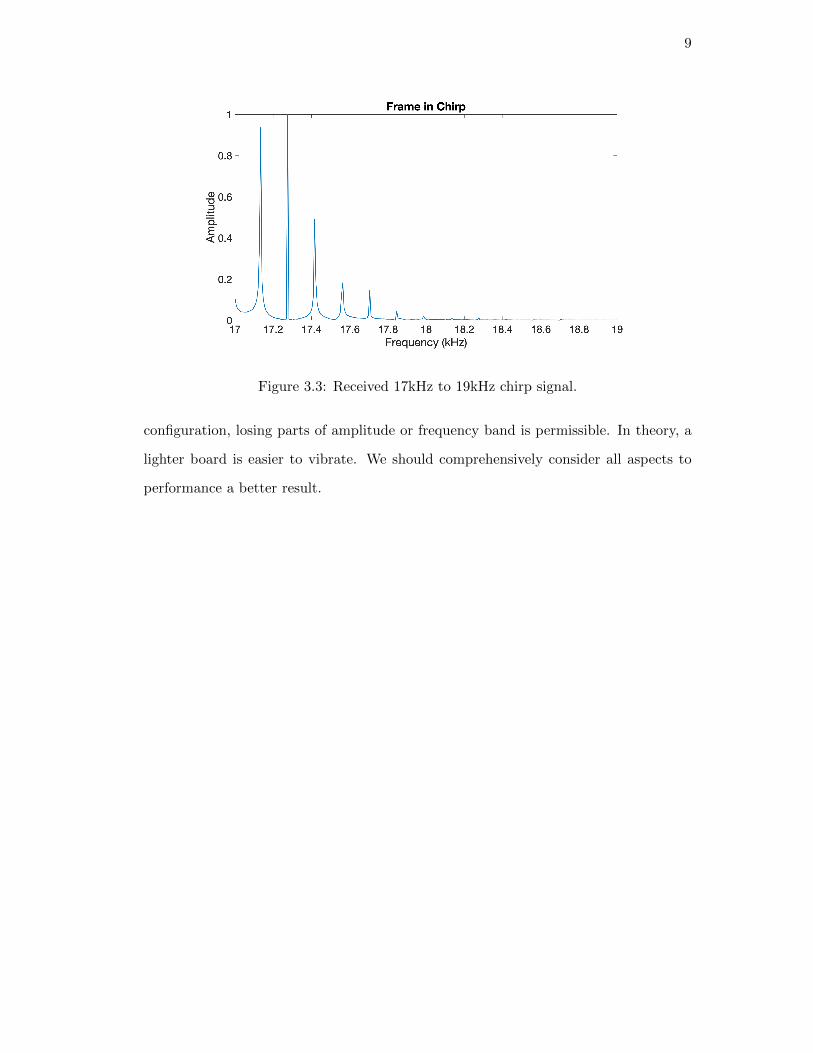
However, the signal quality may change after transmitting through the board. Based
on the texture and material of the board, the amplitude of the vibration wave may
degrade over time, a phenomenon known as signal attenuation. Figure 3.3 is the received
17kHz to 19kHz chirp signal. The frequency peaks in the Figure show up at the same
frequency points as long as the transmitter signal is fixed, no matter how we touch
the transmitting media. The only change is the amplitude on each frequency point.
Thus it is possible to measure the amplitude differences in each frame along with time
for gesture recording. Because the signal is not directly carrying information in our
9
Figure 3.3: Received 17kHz to 19kHz chirp signal.
configuration, losing parts of amplitude or frequency band is permissible. In theory, a
lighter board is easier to vibrate. We should comprehensively consider all aspects to
performance a better result.
10
Chapter 4
System Design
4.1 Radio-signal-based System
4.1.1 Radio-signal-based System Design
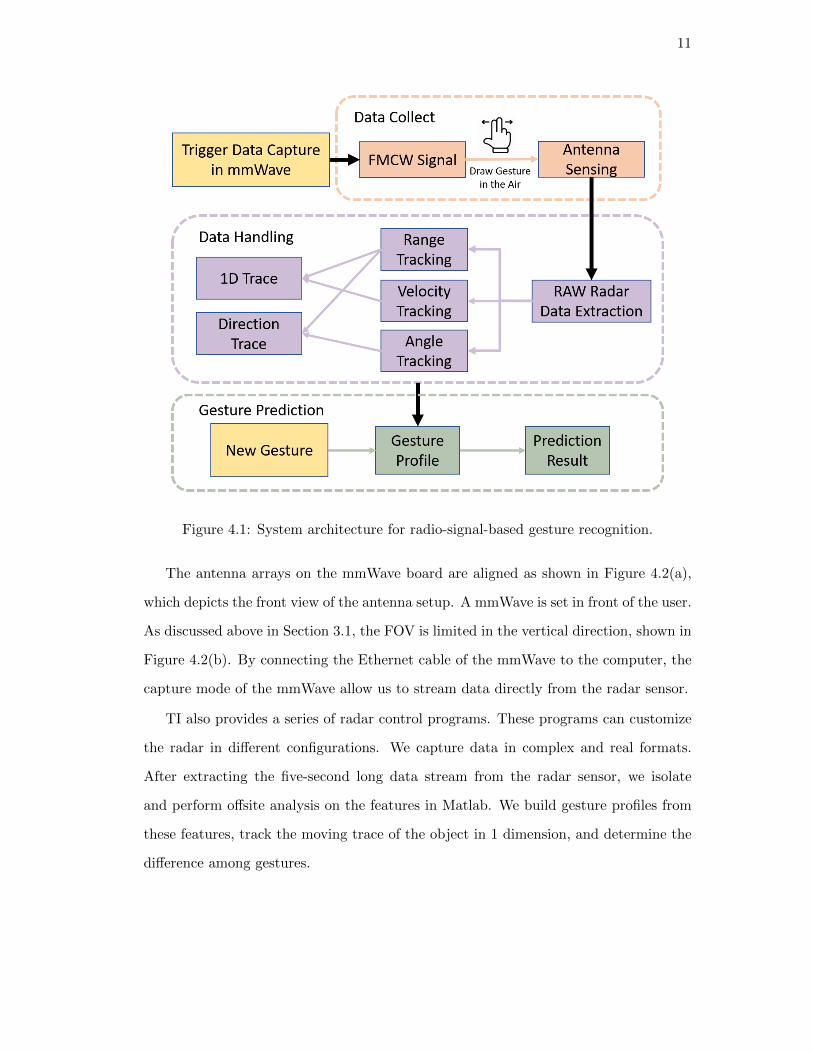
In this section, we describe the development of the mmWave system built for testing the
radio-signal-based hand gesture recognition. We utilize an off-the-shelf millimeter wave
product from Texas Instrument (TI) [24] to detect the hand gestures. As we discussed
in Section 3.1, the mmWave is theoretically capable of detecting hand gestures. Figure
4.1 illustrates our system design. In the data collection phase, the mmWave radar is
triggered to begin recording. The user performs a hand gesture in front of the radar
antennas. The data capture card will record the signal and transfer the recorded signal
to the data handling block. By the fundamental knowledge of FMCW, we can extract
range, velocity, and angle estimation from the recorded raw signal data. Furthermore,
we can plot the 1D trace with this data. Most importantly, this data can be utilized to
build profiles for gestures. In profile building, existing indicators are used to calculate
the similarity between hand gestures in time sequences. The final decision is made by a
majority vote algorithm. With the similarity definitions, we distinguish hand gestures
by with a threshold-based classifier.
4.1.2 mmWave Radar Sensor
We choose the mmWave Radar board AWR1642 to achieve our requirements for trans-
mitting the signal. The board can produce the signal starting from 76GHz to 81 GHz
and covers 4 GHz available bandwidth. The transmitter transmits with the power of
12.5 dBm.
11
Figure 4.1: System architecture for radio-signal-based gesture recognition.
The antenna arrays on the mmWave board are aligned as shown in Figure 4.2(a),
which depicts the front view of the antenna setup. A mmWave is set in front of the user.
As discussed above in Section 3.1, the FOV is limited in the vertical direction, shown in
Figure 4.2(b). By connecting the Ethernet cable of the mmWave to the computer, the
capture mode of the mmWave allow us to stream data directly from the radar sensor.
TI also provides a series of radar control programs. These programs can customize
the radar in different configurations. We capture data in complex and real formats.
After extracting the five-second long data stream from the radar sensor, we isolate
and perform offsite analysis on the features in Matlab. We build gesture profiles from
these features, track the moving trace of the object in 1 dimension, and determine the
difference among gestures.

12
(a) Front view of antennas.
(b) Side view of antennas.
Figure 4.2: Views of antennas.
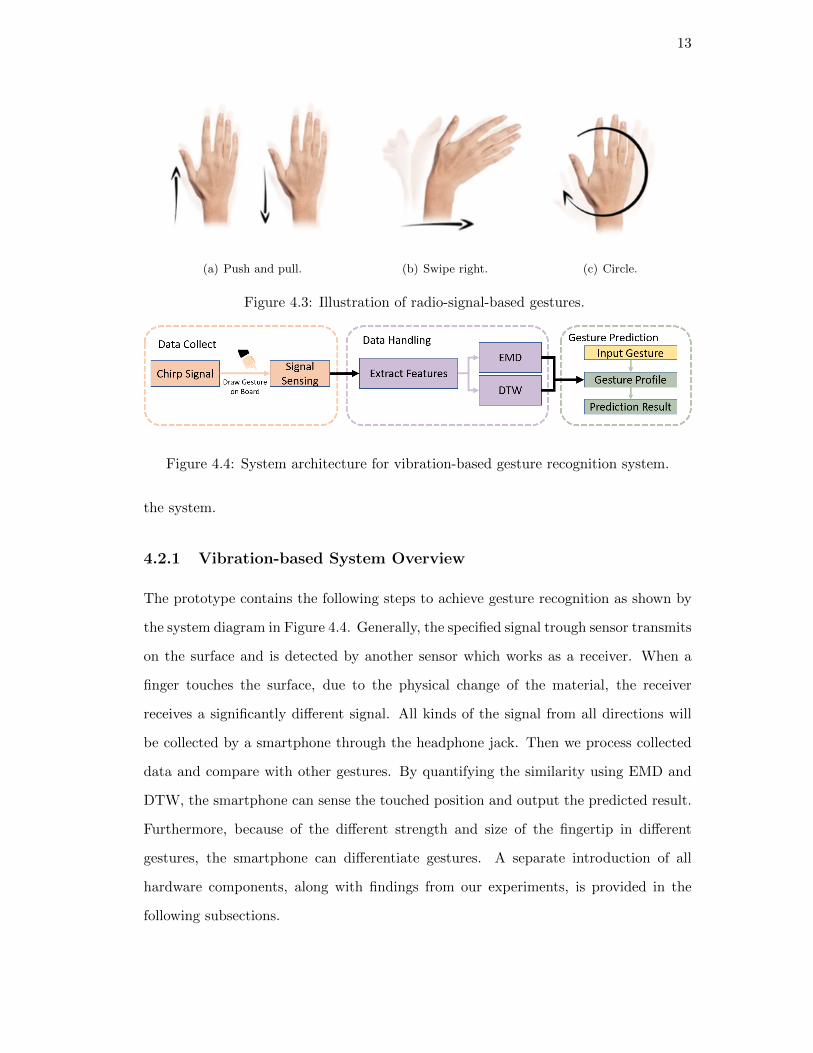
4.1.3 Gesture Design
As shown in Figure 4.3, we define 3 gestures. The ability of our system to distinguish
between these gestures will be the focus of our evaluations. These gestures are per-
formed in front of the mmWave radar sensor. The swiping right are not performed
since we could easily differentiate them with the moving direction in the same profile.
Hand gestures, like clenching a fist, are preferred rather than finger gestures as the
radar sensor is more likely to detect reflected signals produced by the palm due to its
larger size. The circle gesture is chosen because this gesture has a moving range in
all directions. We’d like to find the FOV in the vertical plane. We also perform the
gesture not exceeding the FOV along the horizontal surface. The other two gestures
are derived from common actions performed in daily life.
4.2 Vibration-based System
This section describes the theoretical system overview and practical system design in
detail. The structure and functions of the prototype will be explained, including mate-
rial and method selection, approach trade-offs, and other considerations that may affect
13
(a) Push and pull. (b) Swipe right. (c) Circle.
Figure 4.3: Illustration of radio-signal-based gestures.
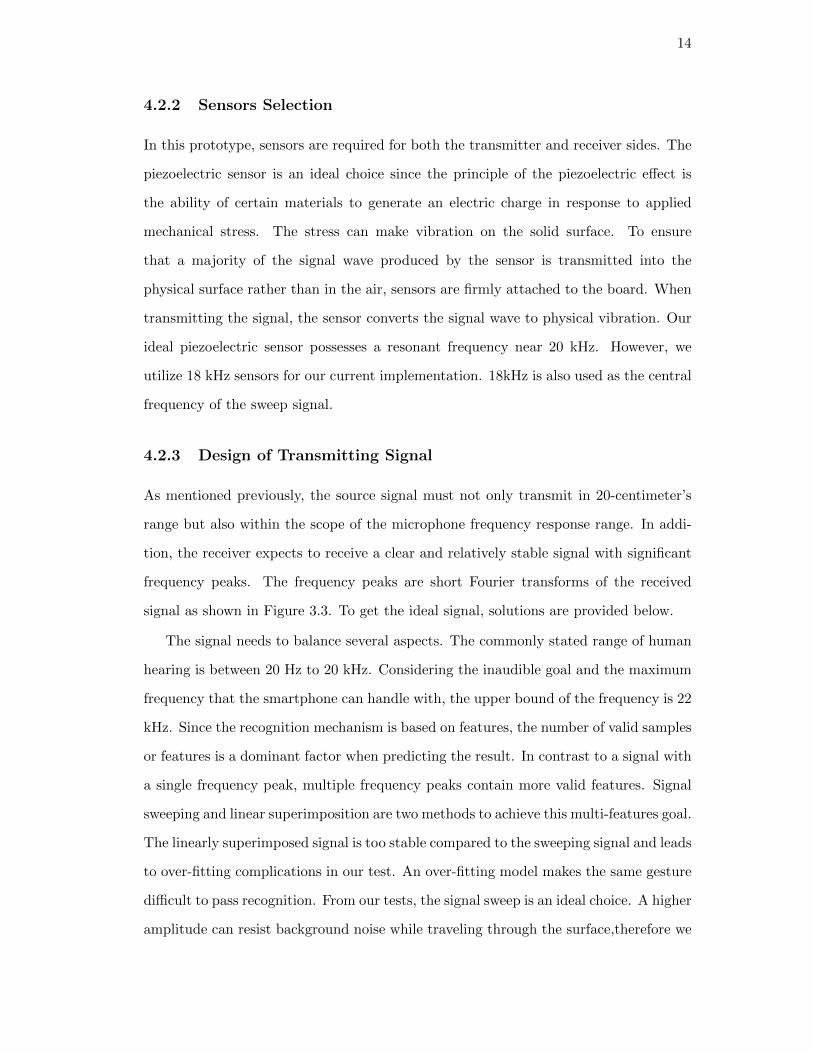
Figure 4.4: System architecture for vibration-based gesture recognition system.
the system.
4.2.1 Vibration-based System Overview
The prototype contains the following steps to achieve gesture recognition as shown by
the system diagram in Figure 4.4. Generally, the specified signal trough sensor transmits
on the surface and is detected by another sensor which works as a receiver. When a
finger touches the surface, due to the physical change of the material, the receiver
receives a significantly different signal. All kinds of the signal from all directions will
be collected by a smartphone through the headphone jack. Then we process collected
data and compare with other gestures. By quantifying the similarity using EMD and
DTW, the smartphone can sense the touched position and output the predicted result.
Furthermore, because of the different strength and size of the fingertip in different
gestures, the smartphone can differentiate gestures. A separate introduction of all
hardware components, along with findings from our experiments, is provided in the
following subsections.
14
4.2.2 Sensors Selection
In this prototype, sensors are required for both the transmitter and receiver sides. The
piezoelectric sensor is an ideal choice since the principle of the piezoelectric effect is
the ability of certain materials to generate an electric charge in response to applied
mechanical stress. The stress can make vibration on the solid surface. To ensure
that a majority of the signal wave produced by the sensor is transmitted into the
physical surface rather than in the air, sensors are firmly attached to the board. When
transmitting the signal, the sensor converts the signal wave to physical vibration. Our
ideal piezoelectric sensor possesses a resonant frequency near 20 kHz. However, we
utilize 18 kHz sensors for our current implementation. 18kHz is also used as the central
frequency of the sweep signal.
4.2.3 Design of Transmitting Signal
As mentioned previously, the source signal must not only transmit in 20-centimeter’s
range but also within the scope of the microphone frequency response range. In addi-
tion, the receiver expects to receive a clear and relatively stable signal with significant
frequency peaks. The frequency peaks are short Fourier transforms of the received
signal as shown in Figure 3.3. To get the ideal signal, solutions are provided below.
The signal needs to balance several aspects. The commonly stated range of human
hearing is between 20 Hz to 20 kHz. Considering the inaudible goal and the maximum
frequency that the smartphone can handle with, the upper bound of the frequency is 22
kHz. Since the recognition mechanism is based on features, the number of valid samples
or features is a dominant factor when predicting the result. In contrast to a signal with
a single frequency peak, multiple frequency peaks contain more valid features. Signal
sweeping and linear superimposition are two methods to achieve this multi-features goal.
The linearly superimposed signal is too stable compared to the sweeping signal and leads
to over-fitting complications in our test. An over-fitting model makes the same gesture
difficult to pass recognition. From our tests, the signal sweep is an ideal choice. A higher
amplitude can resist background noise while traveling through the surface,therefore we

15
position a 5W amplifier at the very front of the system configuration. To produce a
robust signal, the amplifier is set at a high but stable point. Another way to amplify the
signal is to use the signal around the resonant frequency since the sensor will produce
the strongest vibration feedback at the resonant frequency. The resonant frequency of
the selected sensors is 18 kHz which fairly meets the requirements. Wide bandwidth
is not necessary for this application. Thus a signal sweeping from 17kHz-19kHz is
sufficient for feature extraction and similarity calculation. The sample rate is set at
the upper bound of smartphone limitations, which is 192kHz. As a result, 17k-19kHz
frequency range is selected to be used in other tests as well.
For the sweeping time, we observed from works such as Vibwrite [8] that the chirp
signal with a 0.004 sweep period performs well on the PIN Pad authentication scenario.
However, reducing differences between users is necessary in the recognition system. We
reduce the sweep time to 0.003 and get a better result in the vibration-base gesture
recognition.
4.2.4 Gesture Design
The gesture is expected to work as a switch with more flexible and reliable features.
We designed three patterns in Figure 4.5. Previous works have demonstrated that
vibration-based sensing techniques can authenticate users by tapping a PIN number on
a given surface [8]. The two-line and triangle gestures evaluate the system in multi-
points features. The circle gesture is a closed graphic. Detection of such a gesture
suggests potential for continuous input recognition, which is a possible future work.
Because the triangle gesture can be clearly split into three steps which are easier to
distinguish, the triangle is also selected as the tested gesture.
4.3 Profiling
4.3.1 Similarity Definitions
Once a series of data is collected we need to build a profile for each gesture. Profile
samples are classified based on similarity between each other. We define three categories

16
Figure 4.5: Illustration of target gestures.
(a) Similarity between gestures. (b) Similarity between a gesture
and a profile.
(c) Similarity between profiles.
Figure 4.6: The similarity definitions.
of similarity, including similarity between gestures, similarity between a gesture and a
profile, and the similarity between profiles, illustrated in Figure 4.6.
Similarity between gestures. We selected the Earth Movers Distance (EMD).
EMD is a measure of the distance between two probability distributions. Assuming
that we have two gestures P = {(P1, wP1), (P2, wP2), (P3, wP3), ..., (PM , wPM)} and Q =
{(Q1, wQ1), (Q2, wQ2), (Q3, wQ3), ..., (QN , wQN)}. Pi/Qj is the certain feature of P/Q
which is each frame of the time sequence. We define D as a matrix describing the
distance between each pair of features. Thus the dimension of D will be M ×N . We
are looking for a matrix flow F that can minimize the cost function∑m
i=1
∑nj=1 fi,jdi,j
which is a dynamic programming problem. The EMD is calculated with following
formula.
EMD(P,Q) =
∑mi=1
∑nj=1 fi,jdi,j∑m
i=1
∑nj=1 fi,j
(4.1)
Additionally, we also need an indicator to calculate D in EMD calculation. This
indicator should match the spectrogram pattern in each frame. Dynamic time warping
(DTW) is selected to achieve this. As we can see in the received signal in Figure 3.3,
17
frequency peaks are fixed. As a result, DTW will only calculate the Euclidean distances
of peaks. For other parts in the spectrogram, in case of some certain frequency have
a usual fluctuation, DTW is necessary. We use the DTW similarity sequence as the
weight of EMD and calculate the similarity between two gestures . Thus, the EMD
weighted using DTW in each frame is regarded as the similarity between gestures.
Similarity between a gesture and a profile. This similarity is used when
validating a gesture to a profile. There are two steps to compute the similarity between
a gesture and a profile. First, calculate the similarity between the test gesture and each
profile gesture. We will get a distance matrix after that. Second, we the validate the
decision if we can at least achieve a 60% majority vote. The definition of threshold is
threshold = MEAN(Profile SimMatrix) + STDEV (Profile SimMatrix).
Similarity between profiles. This similarity is used to evaluate the profile build-
ing result. We simply define it as the average similarity of the training data in each
profile.
4.3.2 Profiling
In either system, the gesture profiles must be distinct from other gestures. The profile
of a gesture is primarily dependent on the ’distance’ among samples. The distance is
defined by the summation of DTW weighted EMD. The processing is described below.
Starting with the profiling samples, any new input gesture whose distance to the profile
is less than than a threshold is regarded to be a member of such profile. The final
prediction decision is made by the majority vote algorithm. The database of a gesture
can be dynamically updated to fit a variety of gesture inputs.

18
Chapter 5
Performance Evaluation
The performance of the prototype is given in the following sections. The prototype is
tested in different scenarios to evaluate its performance in real situations. In addition,
the motivation for all experiments will also be presented.
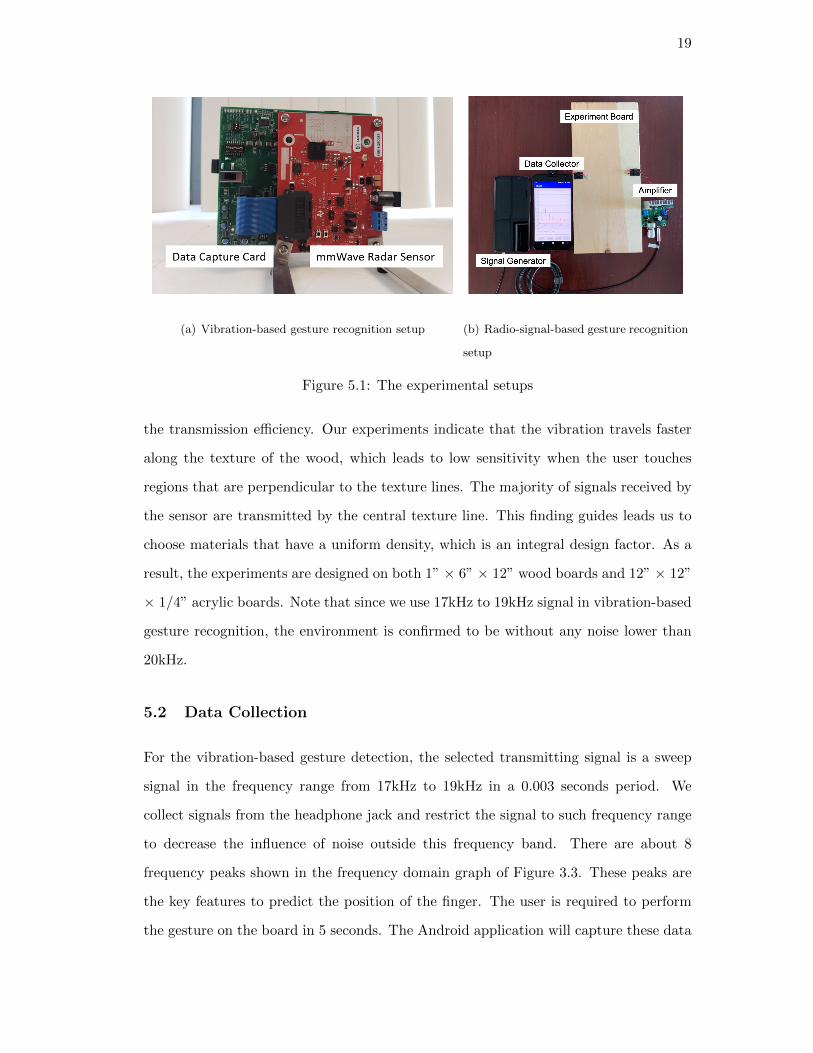
5.1 Prototyping and Experimental Setup
The experiment setup is shown in Figure 5.1. Note that in Figure 5.1(a), an acrylic
board is tested in addition to a wooden board. There are two sensors on each side of
the board. They can be either transmitter or receiver depending on the transmitted
signal and wire connection to the smartphones. The transmitter transmits the signal
produced by a headphone jack of a smartphone. The receiver sensor’s wires go to the
headphone jack of another smartphone for data collection and similarity computations.
The smartphone on the receiver and transmitter side can either be split or combined in
the same phone since the transceivers utilize different channels of the headphone jack.
The user is expected to perform the same gesture in the same position. The dimension
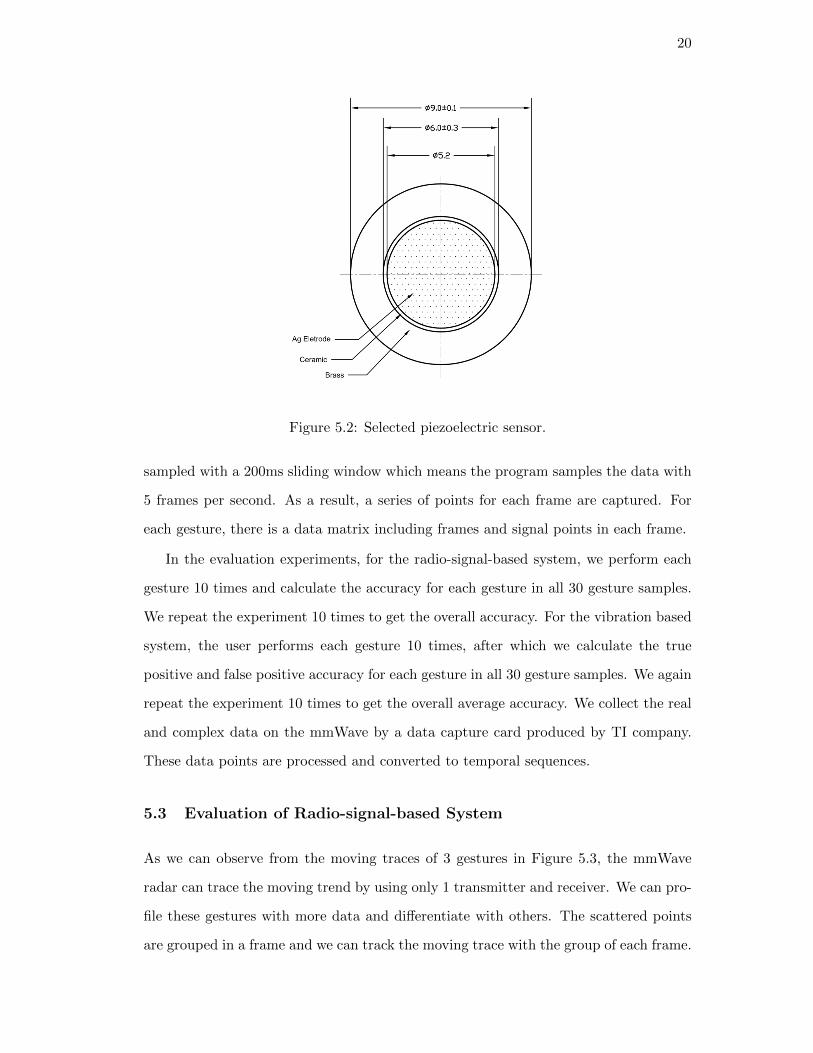
of the sensor is shown in Figure 5.2. With 18kHz resonant frequency, the receiver can
receive a clean and stable signal.
In the evaluation of the radio-signal-based gesture recognition, the mmWave is set
50 centimeters away from the user. As we already know, the gesture is performed in
the range of 1 meter, we manually cut and drop the data out of the range of 1 meter.
Thus we do not need to worry about the size of the room during the experiments. The
background of the test environment is clear and stable in order to block the multi-path
noise of the radar.
For touch-based input gestures, the texture and material of the surface influence
19
(a) Vibration-based gesture recognition setup (b) Radio-signal-based gesture recognition
setup
Figure 5.1: The experimental setups
the transmission efficiency. Our experiments indicate that the vibration travels faster
along the texture of the wood, which leads to low sensitivity when the user touches
regions that are perpendicular to the texture lines. The majority of signals received by
the sensor are transmitted by the central texture line. This finding guides leads us to
choose materials that have a uniform density, which is an integral design factor. As a
result, the experiments are designed on both 1” × 6” × 12” wood boards and 12” × 12”
× 1/4” acrylic boards. Note that since we use 17kHz to 19kHz signal in vibration-based
gesture recognition, the environment is confirmed to be without any noise lower than
20kHz.
5.2 Data Collection
For the vibration-based gesture detection, the selected transmitting signal is a sweep
signal in the frequency range from 17kHz to 19kHz in a 0.003 seconds period. We
collect signals from the headphone jack and restrict the signal to such frequency range
to decrease the influence of noise outside this frequency band. There are about 8
frequency peaks shown in the frequency domain graph of Figure 3.3. These peaks are
the key features to predict the position of the finger. The user is required to perform
the gesture on the board in 5 seconds. The Android application will capture these data
20
Figure 5.2: Selected piezoelectric sensor.
sampled with a 200ms sliding window which means the program samples the data with
5 frames per second. As a result, a series of points for each frame are captured. For
each gesture, there is a data matrix including frames and signal points in each frame.
In the evaluation experiments, for the radio-signal-based system, we perform each
gesture 10 times and calculate the accuracy for each gesture in all 30 gesture samples.
We repeat the experiment 10 times to get the overall accuracy. For the vibration based
system, the user performs each gesture 10 times, after which we calculate the true
positive and false positive accuracy for each gesture in all 30 gesture samples. We again
repeat the experiment 10 times to get the overall average accuracy. We collect the real
and complex data on the mmWave by a data capture card produced by TI company.
These data points are processed and converted to temporal sequences.
5.3 Evaluation of Radio-signal-based System
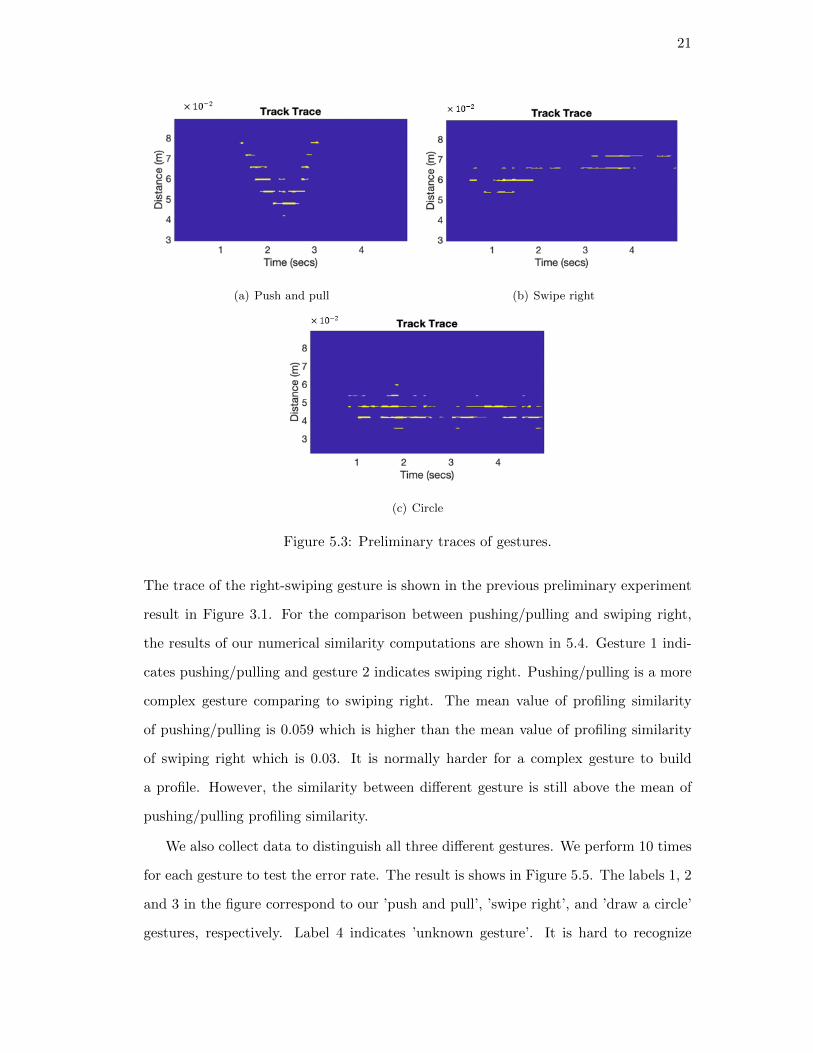
As we can observe from the moving traces of 3 gestures in Figure 5.3, the mmWave
radar can trace the moving trend by using only 1 transmitter and receiver. We can pro-
file these gestures with more data and differentiate with others. The scattered points
are grouped in a frame and we can track the moving trace with the group of each frame.
21
(a) Push and pull (b) Swipe right
(c) Circle
Figure 5.3: Preliminary traces of gestures.
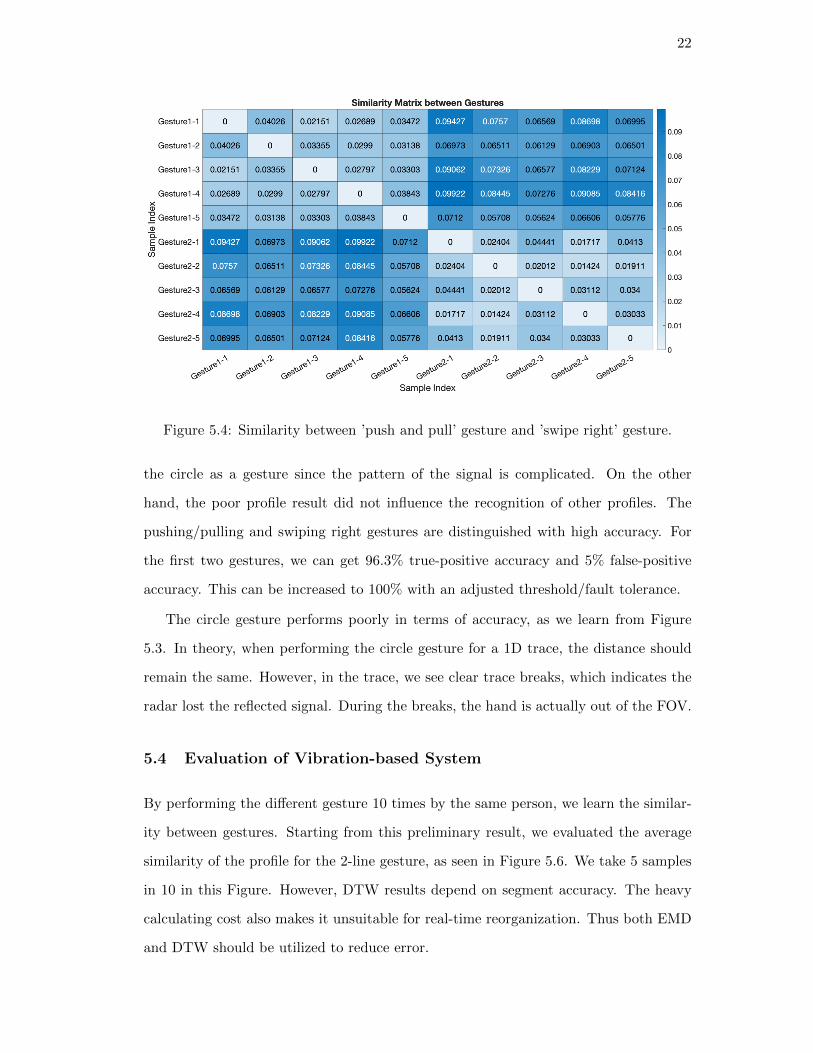
The trace of the right-swiping gesture is shown in the previous preliminary experiment
result in Figure 3.1. For the comparison between pushing/pulling and swiping right,
the results of our numerical similarity computations are shown in 5.4. Gesture 1 indi-
cates pushing/pulling and gesture 2 indicates swiping right. Pushing/pulling is a more
complex gesture comparing to swiping right. The mean value of profiling similarity
of pushing/pulling is 0.059 which is higher than the mean value of profiling similarity
of swiping right which is 0.03. It is normally harder for a complex gesture to build
a profile. However, the similarity between different gesture is still above the mean of
pushing/pulling profiling similarity.
We also collect data to distinguish all three different gestures. We perform 10 times
for each gesture to test the error rate. The result is shows in Figure 5.5. The labels 1, 2
and 3 in the figure correspond to our ’push and pull’, ’swipe right’, and ’draw a circle’
gestures, respectively. Label 4 indicates ’unknown gesture’. It is hard to recognize
22
Figure 5.4: Similarity between ’push and pull’ gesture and ’swipe right’ gesture.
the circle as a gesture since the pattern of the signal is complicated. On the other
hand, the poor profile result did not influence the recognition of other profiles. The
pushing/pulling and swiping right gestures are distinguished with high accuracy. For
the first two gestures, we can get 96.3% true-positive accuracy and 5% false-positive
accuracy. This can be increased to 100% with an adjusted threshold/fault tolerance.
The circle gesture performs poorly in terms of accuracy, as we learn from Figure
5.3. In theory, when performing the circle gesture for a 1D trace, the distance should
remain the same. However, in the trace, we see clear trace breaks, which indicates the
radar lost the reflected signal. During the breaks, the hand is actually out of the FOV.
5.4 Evaluation of Vibration-based System
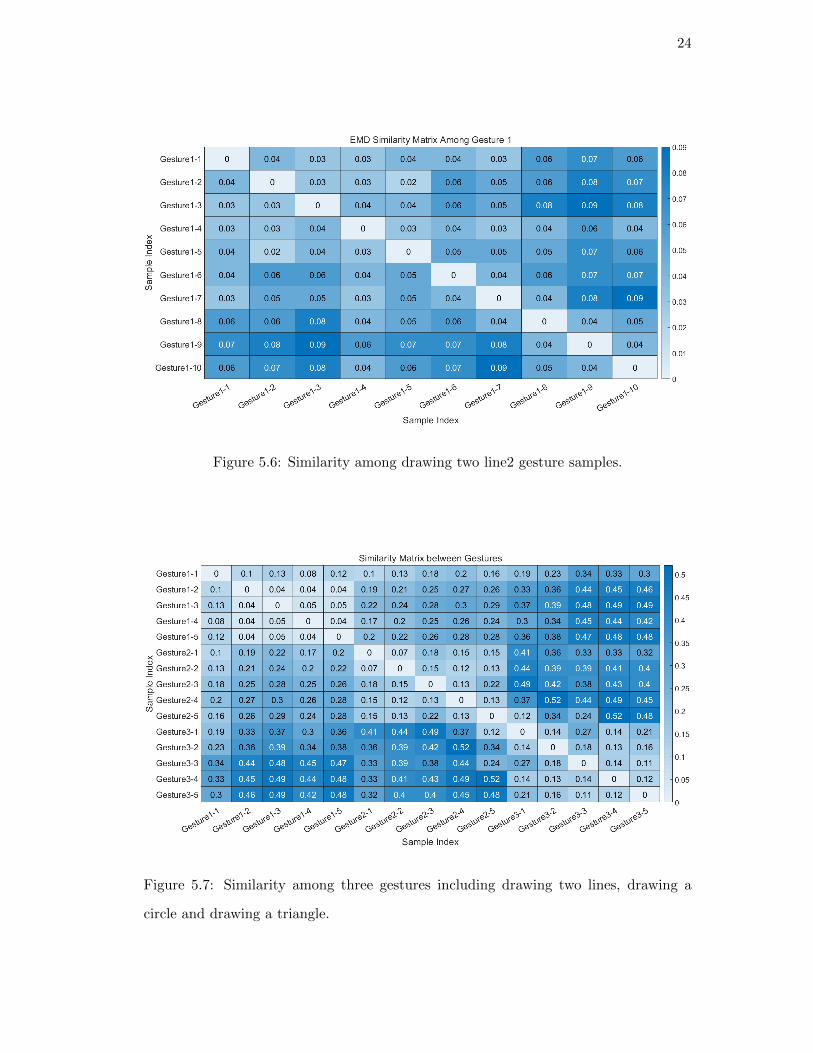
By performing the different gesture 10 times by the same person, we learn the similar-
ity between gestures. Starting from this preliminary result, we evaluated the average
similarity of the profile for the 2-line gesture, as seen in Figure 5.6. We take 5 samples
in 10 in this Figure. However, DTW results depend on segment accuracy. The heavy
calculating cost also makes it unsuitable for real-time reorganization. Thus both EMD
and DTW should be utilized to reduce error.

23
Figure 5.5: Gestures confusion matrix.
Figure 5.7 shows a similar trend when using DTW weighted EMD. The DTW
weighted EMD evaluation method is presented in Section 4.3.1. There is a signifi-
cant difference gap between user 1 and user 2. For our 2-line gesture pattern, the mean
value of the EMD among same gesture samples for user 1 and user 2 are 0.0688 and
0.0570 separately. For the 2-line gesture, the true-positive accuracy is 93% and the
false-positive accuracy is 2%. For the circle and triangle gestures, since they are simi-
lar, the overall accuracy is 89% and 90% for true-positive accuracy for each gesture and
8% and 4% false-positive accuracy separately. By setting an adjusted threshold, higher
accuracy is possible.
24
Figure 5.6: Similarity among drawing two line2 gesture samples.
Figure 5.7: Similarity among three gestures including drawing two lines, drawing a
circle and drawing a triangle.

25
Chapter 6
Discussion
Along with the goal-oriented experiments, we also find out some interesting facts and
features that may guide us to some inspiration in research. Some of these discoveries
accelerated and changed our original plans.
6.1 The Influence Factors in Vibration-based Gesture System
The original selected signal is 17k-19kHz chirp in 0.003 seconds as explained in Section
4.2.3. The rationale for this selection is to optimize detection of PIN number inputs
rather than gesture detection. Thus, lower performance was observed when utilizing the
chirp signal with 0.003s duration in gesture segmentation. Relativity slower sweeping
speeds for the chirp signal could yield fewer peak features in the spectrogram. The more
peak features transmitted to the receiver side, the better the system can recover the
signal. Furthermore, the signal is more sensitive to the physical change of the medium.
Since the user’s finger is unstable when drawing a gesture, the system should keep the
peak features and resist the instability at the same time.
6.2 Authentication and The Sweeping Speed of Chirp Signal
For the vibration-based system, according to our previous experiments, a sweeping
chirp signal in 0.004 seconds per chirp yields considerably higher performance in PIN
Pad authentication. The 16 point authentication result is also acceptable. Intuitively,
shorter sweep time brings fewer peak features in the receiver plot. The number of
features is directly related to the sensitivity to the features of input. With noticeable
sweeping time, such as 1 second, any tiny fluctuation by mistake will be recognized as
an important feature. As a result, we choose 0.003 as the sweeping speed, which results
26
in approximately four frequency peaks on the plot and allows for the differentiation of
different gestures.
6.3 Limitations
There are some limitations to this project. First, more fine-grained hand gesture should
also be tested to see the potential of mmWave. Second, there is an alternative method
to combat the limited FOV in the vertical plane. We can simply put the mmWave 10
degrees angled down to get a 3-D like detection field. However, this scenario was not
evaluated in our experiments. These considerations can be incorporated into future
works. The full potential of mmWave is still under investigation.
27
Chapter 7
Conclusion
We proposed and developed two gesture recognition systems in this thesis. For the
physical touch-based input gesture recognition, the ability to accurately classify dif-
ferent gestures is dependent on signal peak fluctuation, therefore the gestures are not
sensitive to the complexity of the signal. However, in the radio-signal-based gesture
recognition detection, because the mmWave radar sensor tracks the moving object by
sensing through a limited FOV, it is hard to develop profiles for complex gestures like
the circle input.
Although numerous experiments have already done for investigating the possibility
of gesture recognition, there is still more potential abilities that the mmWave may
have. Future work could include counting people or performing fine-grained gesture
recognition. We would like to do more experiments using our setups. Thus, our ultimate
goal is to find a quantified standard that demonstrates how mmWave can perform in
the gesture recognition field.
28
References
[1] S. Mitra and T. Acharya, ”Gesture Recognition: A Survey,” in IEEE Transactionson Systems, Man, and Cybernetics, Part C (Applications and Reviews), vol. 37,no. 3, pp. 311-324, May 2007.
[2] Garg, P., Aggarwal, N., & Sofat, S. (2009). Vision based hand gesture recognition.World Academy of Science, Engineering and Technology, 49(1), 972-977.
[3] Liu, X., & Fujimura, K. (2004, May). Hand gesture recognition using depth data. InSixth IEEE International Conference on Automatic Face and Gesture Recognition,2004. Proceedings. (pp. 529-534). IEEE.
[4] J. Appenrodt, S. Handrich, A. Al-Hamadi and B. Michaelis, ”Multi stereo cameradata fusion for fingertip detection in gesture recognition systems,” 2010 Interna-tional Conference of Soft Computing and Pattern Recognition, Paris, 2010, pp.35-40.
[5] M. Van den Bergh and L. Van Gool, ”Combining RGB and ToF cameras forreal-time 3D hand gesture interaction,” 2011 IEEE Workshop on Applications ofComputer Vision (WACV), Kona, HI, 2011, pp. 66-72.
[6] Chi Zhang, Josh Tabor, Jialiang Zhang, and Xinyu Zhang. 2015. Extending MobileInteraction Through Near-Field Visible Light Sensing. In Proceedings of the 21stAnnual International Conference on Mobile Computing and Networking (MobiCom’15). ACM, New York, NY, USA, 345-357.
[7] Sohrabi, F., & Yu, W. (2017). Hybrid analog and digital beamforming for mmWaveOFDM large-scale antenna arrays. IEEE Journal on Selected Areas in Communi-cations, 35(7), 1432-1443.
[8] Liu, J., Wang, C., Chen, Y., and Saxena, N. (2017, October). VibWrite: TowardsFinger-input Authentication on Ubiquitous Surfaces via Physical Vibration. In Pro-ceedings of the 2017 ACM SIGSAC Conference on Computer and CommunicationsSecurity (pp. 73-87). ACM.
[9] Liu, J., Chen, Y., Gruteser, M., and Wang, Y. (2017, June). VibSense: SensingTouches on Ubiquitous Surfaces through Vibration. In Sensing, Communication,and Networking (SECON), 2017 14th Annual IEEE International Conference on(pp. 1-9). IEEE.
[10] Chen, W., Guan, M., Huang, Y., Wang, L., Ruby, R., Hu, W., and Wu, K. (2018,June). ViType: A Cost Efficient On-Body Typing System through Vibration. In2018 15th Annual IEEE International Conference on Sensing, Communication, andNetworking (SECON) (pp. 1-9). IEEE.
29
[11] Jiang, W., Miao, C., Ma, F., Yao, S., Wang, Y., Yuan, Y., ... & Xu, W. (2018,October). Towards Environment Independent Device Free Human Activity Recog-nition. In Proceedings of the 24th Annual International Conference on MobileComputing and Networking (pp. 289-304). ACM.
[12] Saha, S. K., Ghasempour, Y., Haider, M. K., Siddiqui, T., De Melo, P., Somanchi,N., ... & Uvaydov, D. (2019). X60: A programmable testbed for wideband 60 ghzwlans with phased arrays. Computer Communications, 133, 77-88.
[13] A. Arbabian, S. Callender, S. Kang, M. Rangwala and A. M. Niknejad, ”A 94 GHzmm-Wave-to-Baseband Pulsed-Radar Transceiver with Applications in Imagingand Gesture Recognition,” in IEEE Journal of Solid-State Circuits, vol. 48, no. 4,pp. 1055-1071, April 2013.
[14] K. A. Smith, C. Csech, D. Murdoch and G. Shaker, ”Gesture Recognition Usingmm-Wave Sensor for Human-Car Interface,” in IEEE Sensors Letters, vol. 2, no.2, pp. 1-4, June 2018, Art no. 3500904.
[15] Y. Zeng, P. H. Pathak, Z. Yang and P. Mohapatra, ”Poster Abstract: HumanTracking and Activity Monitoring Using 60 GHz mmWave,” 2016 15th ACM/IEEEInternational Conference on Information Processing in Sensor Networks (IPSN),Vienna, 2016, pp. 1-2.
[16] Peter A. Iannucci, Ravi Netravali, Ameesh K. Goyal, and Hari Balakrishnan. 2015.Room-Area Networks. In Proceedings of the 14th ACM Workshop on Hot Topicsin Networks (HotNets-XIV). ACM, New York, NY, USA, Article 9, 7 pages.
[17] Qian Wang, Kui Ren, Man Zhou, Tao Lei, Dimitrios Koutsonikolas, and Lu Su.2016. Messages behind the sound: real-time hidden acoustic signal capture withsmartphones. In Proceedings of the 22nd Annual International Conference on Mo-bile Computing and Networking (MobiCom ’16). ACM, New York, NY, USA,29-41.
[18] S. Berman and H. Stern, ”Sensors for Gesture Recognition Systems,” in IEEETransactions on Systems, Man, and Cybernetics, Part C (Applications and Re-views), vol. 42, no. 3, pp. 277-290, May 2012.
[19] C. Iovescu S. Rao ”The fundamentals of millimeter wave sensors” pp. 1-8 2017[online] Available: http://www.ti.com/lit/wp/spyy005/spyy005.pdf.
[20] Niu, Y., Li, Y., Jin, D. et al. Wireless Netw (2015) 21: 2657.
[21] Hong, W., Baek, K. H., Lee, Y., Kim, Y., & Ko, S. T. (2014). Study and proto-typing of practically large-scale mmWave antenna systems for 5G cellular devices.IEEE Communications Magazine, 52(9), 63-69.
[22] Musa, A., Murakami, R., Sato, T., Chaivipas, W., Okada, K., & Matsuzawa, A.(2011). A low phase noise quadrature injection locked frequency synthesizer formm-wave applications. IEEE Journal of Solid-State Circuits, 46(11), 2635-2649.
[23] Sakran, F., Neve-Oz, Y., Ron, A., Golosovsky, M., Davidov, D., & Frenkel, A.(2008). Absorbing frequency-selective-surface for the mm-wave range. IEEE Trans-actions on Antennas and Propagation, 56(8), 2649-2655.
30
[24] AWR1642 single-chip 76-GHz to 81-GHz automotive radar sensor evaluation mod-ule, from http://www.ti.com/tool/awr1642boost
Related Documents