HAMSTER: Using Search Clicklogs for Schema and Taxonomy Matching Arnab Nandi * University of Michigan, Ann Arbor [email protected] Philip A. Bernstein Microsoft Research [email protected] ABSTRACT We address the problem of unsupervised matching of schema information from a large number of data sources into the schema of a data warehouse. The matching process is the first step of a framework to integrate data feeds from third- party data providers into a structured-search engine’s data warehouse. Our experiments show that traditional schema- based and instance-based schema matching methods fall short. We propose a new technique based on the search engine’s clicklogs. Two schema elements are matched if the distri- bution of keyword queries that cause click-throughs on their instances are similar. We present experiments on large com- mercial datasets that show the new technique has much bet- ter accuracy than traditional techniques. 1. INTRODUCTION In this paper, we address the problem of unsupervised matching of schema information from a large number of data sources into the schema of a data warehouse. The applica- tion is the use of structured data sources to enhance the results of keyword-based web search. For example, Google, Yahoo and Live Search all provide shopping listings for the query “digital camera” above their traditional web search re- sults, presumably by augmenting their keyword index with structured shopping data. This requires gathering a wide va- riety of structured data sources into a data warehouse that is indexed by the search engine for keyword queries. These sources are typically provided by third-parties, though they might also be obtained from web sites using information ex- traction. The sources need to be integrated so that similar data in the warehouse is indexed in the same way by the search engine, thereby improving the relevance of the result of keyword queries. The first step of the integration process is to match incoming data source schemas to the warehouse schema. For example, suppose we are integrating data sources that describe movies. Our data warehouse of integrated data has * Work done while at Microsoft Research. Permission to copy without fee all or part of this material is granted provided that the copies are not made or distributed for direct commercial advantage, the VLDB copyright notice and the title of the publication and its date appear, and notice is given that copying is by permission of the Very Large Data Base Endowment. To copy otherwise, or to republish, to post on servers or to redistribute to lists, requires a fee and/or special permission from the publisher, ACM. VLDB ‘09, August 24-28, 2009, Lyon, France Copyright 2009 VLDB Endowment, ACM 000-0-00000-000-0/00/00. Data Integrator Target Database [warehouse] Schema Taxonomy Source Database Schema Taxonomy Query Logs Search Engine Schema Correspondences Taxonomy Correspondences Updated Target [warehouse] HAMSTER Figure 1: HAMSTER System Architecture a column called Rating, which describes the suitability of the movie for certain audiences (e.g., G, PG-13, R). We need to integrate a new data source which has an XML tag <MPAA> that contains the rating. It is beneficial to map <MPAA> to the column name Rating, so that instances of <MPAA> in the new source are recognized in our index as ratings. This enables the search engine to answer queries about the rating of movies that appear only in this new data source, such as a keyword query “rating Dark Knight”. Some values in a data source are categorical. By “categori- cal,” we mean the values come from a controlled vocabulary and are organized into a taxonomy. For better indexing, we need to map the data source’s taxonomy to the data warehouse’s taxonomy. For example, product catalogs usu- ally categorize each product within a taxonomy. An item “netbook” might have an attribute “class” in a new data source, whose value is the path computer portable econ- omy small in the data source’s taxonomy. But the data warehouse may classify the item differently, such as laptop lightweight inexpensive. To do a good job of answering the query “netbook” over data feeds whose descriptions of netbooks do not contain the word “netbook,” we need to map the data feed’s class to the data warehouse’s class and recognize “netbook” as a term for the latter class. Our focus is how to generate the required schema and tax-

Welcome message from author
This document is posted to help you gain knowledge. Please leave a comment to let me know what you think about it! Share it to your friends and learn new things together.
Transcript

HAMSTER: Using Search Clicklogs for Schema andTaxonomy Matching
Arnab Nandi∗University of Michigan, Ann Arbor
Philip A. BernsteinMicrosoft Research
ABSTRACTWe address the problem of unsupervised matching of schemainformation from a large number of data sources into theschema of a data warehouse. The matching process is thefirst step of a framework to integrate data feeds from third-party data providers into a structured-search engine’s datawarehouse. Our experiments show that traditional schema-based and instance-based schema matching methods fall short.We propose a new technique based on the search engine’sclicklogs. Two schema elements are matched if the distri-bution of keyword queries that cause click-throughs on theirinstances are similar. We present experiments on large com-mercial datasets that show the new technique has much bet-ter accuracy than traditional techniques.
1. INTRODUCTIONIn this paper, we address the problem of unsupervised
matching of schema information from a large number of datasources into the schema of a data warehouse. The applica-tion is the use of structured data sources to enhance theresults of keyword-based web search. For example, Google,Yahoo and Live Search all provide shopping listings for thequery “digital camera” above their traditional web search re-sults, presumably by augmenting their keyword index withstructured shopping data. This requires gathering a wide va-riety of structured data sources into a data warehouse thatis indexed by the search engine for keyword queries. Thesesources are typically provided by third-parties, though theymight also be obtained from web sites using information ex-traction. The sources need to be integrated so that similardata in the warehouse is indexed in the same way by thesearch engine, thereby improving the relevance of the resultof keyword queries. The first step of the integration processis to match incoming data source schemas to the warehouseschema.
For example, suppose we are integrating data sources thatdescribe movies. Our data warehouse of integrated data has
∗Work done while at Microsoft Research.
Permission to copy without fee all or part of this material is granted providedthat the copies are not made or distributed for direct commercial advantage,the VLDB copyright notice and the title of the publication and its date appear,and notice is given that copying is by permission of the Very Large DataBase Endowment. To copy otherwise, or to republish, to post on serversor to redistribute to lists, requires a fee and/or special permission from thepublisher, ACM.VLDB ‘09, August 24-28, 2009, Lyon, FranceCopyright 2009 VLDB Endowment, ACM 000-0-00000-000-0/00/00.
Data Integrator
Target Database [warehouse]
Schema
Taxonomy
Source Database
Schema
Taxonomy
Query Logs
Search Engine
Schema Correspondences
Taxonomy Correspondences
Updated Target [warehouse]
HAMSTER
Figure 1: HAMSTER System Architecture
a column called Rating, which describes the suitability ofthe movie for certain audiences (e.g., G, PG-13, R). Weneed to integrate a new data source which has an XML tag<MPAA> that contains the rating. It is beneficial to map<MPAA> to the column name Rating, so that instancesof <MPAA> in the new source are recognized in our indexas ratings. This enables the search engine to answer queriesabout the rating of movies that appear only in this new datasource, such as a keyword query “rating Dark Knight”.
Some values in a data source are categorical. By “categori-cal,” we mean the values come from a controlled vocabularyand are organized into a taxonomy. For better indexing,we need to map the data source’s taxonomy to the datawarehouse’s taxonomy. For example, product catalogs usu-ally categorize each product within a taxonomy. An item“netbook” might have an attribute “class” in a new datasource, whose value is the path computer . portable . econ-omy . small in the data source’s taxonomy. But the datawarehouse may classify the item differently, such as laptop. lightweight . inexpensive. To do a good job of answeringthe query “netbook” over data feeds whose descriptions ofnetbooks do not contain the word “netbook,” we need tomap the data feed’s class to the data warehouse’s class andrecognize “netbook” as a term for the latter class.
Our focus is how to generate the required schema and tax-
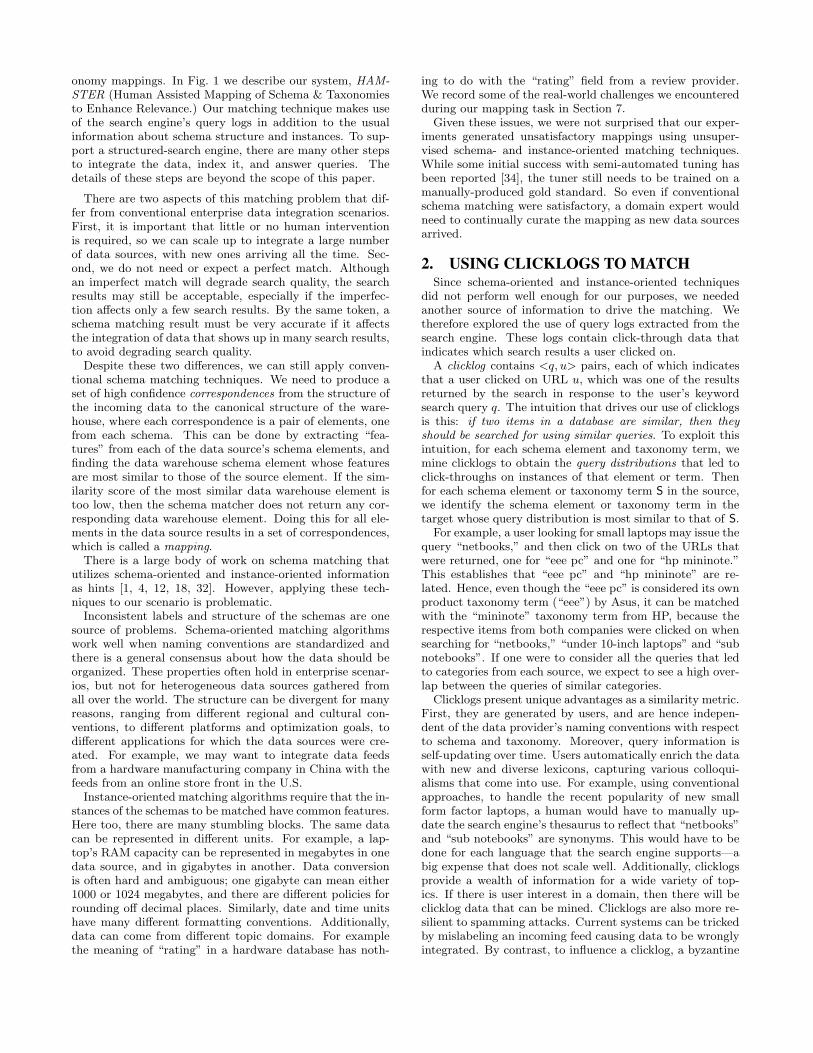
onomy mappings. In Fig. 1 we describe our system, HAM-STER (Human Assisted Mapping of Schema & Taxonomiesto Enhance Relevance.) Our matching technique makes useof the search engine’s query logs in addition to the usualinformation about schema structure and instances. To sup-port a structured-search engine, there are many other stepsto integrate the data, index it, and answer queries. Thedetails of these steps are beyond the scope of this paper.
There are two aspects of this matching problem that dif-fer from conventional enterprise data integration scenarios.First, it is important that little or no human interventionis required, so we can scale up to integrate a large numberof data sources, with new ones arriving all the time. Sec-ond, we do not need or expect a perfect match. Althoughan imperfect match will degrade search quality, the searchresults may still be acceptable, especially if the imperfec-tion affects only a few search results. By the same token, aschema matching result must be very accurate if it affectsthe integration of data that shows up in many search results,to avoid degrading search quality.
Despite these two differences, we can still apply conven-tional schema matching techniques. We need to produce aset of high confidence correspondences from the structure ofthe incoming data to the canonical structure of the ware-house, where each correspondence is a pair of elements, onefrom each schema. This can be done by extracting “fea-tures” from each of the data source’s schema elements, andfinding the data warehouse schema element whose featuresare most similar to those of the source element. If the sim-ilarity score of the most similar data warehouse element istoo low, then the schema matcher does not return any cor-responding data warehouse element. Doing this for all ele-ments in the data source results in a set of correspondences,which is called a mapping.
There is a large body of work on schema matching thatutilizes schema-oriented and instance-oriented informationas hints [1, 4, 12, 18, 32]. However, applying these tech-niques to our scenario is problematic.
Inconsistent labels and structure of the schemas are onesource of problems. Schema-oriented matching algorithmswork well when naming conventions are standardized andthere is a general consensus about how the data should beorganized. These properties often hold in enterprise scenar-ios, but not for heterogeneous data sources gathered fromall over the world. The structure can be divergent for manyreasons, ranging from different regional and cultural con-ventions, to different platforms and optimization goals, todifferent applications for which the data sources were cre-ated. For example, we may want to integrate data feedsfrom a hardware manufacturing company in China with thefeeds from an online store front in the U.S.
Instance-oriented matching algorithms require that the in-stances of the schemas to be matched have common features.Here too, there are many stumbling blocks. The same datacan be represented in different units. For example, a lap-top’s RAM capacity can be represented in megabytes in onedata source, and in gigabytes in another. Data conversionis often hard and ambiguous; one gigabyte can mean either1000 or 1024 megabytes, and there are different policies forrounding off decimal places. Similarly, date and time unitshave many different formatting conventions. Additionally,data can come from different topic domains. For examplethe meaning of “rating” in a hardware database has noth-
ing to do with the “rating” field from a review provider.We record some of the real-world challenges we encounteredduring our mapping task in Section 7.
Given these issues, we were not surprised that our exper-iments generated unsatisfactory mappings using unsuper-vised schema- and instance-oriented matching techniques.While some initial success with semi-automated tuning hasbeen reported [34], the tuner still needs to be trained on amanually-produced gold standard. So even if conventionalschema matching were satisfactory, a domain expert wouldneed to continually curate the mapping as new data sourcesarrived.
2. USING CLICKLOGS TO MATCHSince schema-oriented and instance-oriented techniques
did not perform well enough for our purposes, we neededanother source of information to drive the matching. Wetherefore explored the use of query logs extracted from thesearch engine. These logs contain click-through data thatindicates which search results a user clicked on.
A clicklog contains <q, u> pairs, each of which indicatesthat a user clicked on URL u, which was one of the resultsreturned by the search in response to the user’s keywordsearch query q. The intuition that drives our use of clicklogsis this: if two items in a database are similar, then theyshould be searched for using similar queries. To exploit thisintuition, for each schema element and taxonomy term, wemine clicklogs to obtain the query distributions that led toclick-throughs on instances of that element or term. Thenfor each schema element or taxonomy term S in the source,we identify the schema element or taxonomy term in thetarget whose query distribution is most similar to that of S.
For example, a user looking for small laptops may issue thequery “netbooks,” and then click on two of the URLs thatwere returned, one for “eee pc” and one for “hp mininote.”This establishes that “eee pc” and “hp mininote” are re-lated. Hence, even though the “eee pc” is considered its ownproduct taxonomy term (“eee”) by Asus, it can be matchedwith the “mininote” taxonomy term from HP, because therespective items from both companies were clicked on whensearching for “netbooks,” “under 10-inch laptops” and “subnotebooks”. If one were to consider all the queries that ledto categories from each source, we expect to see a high over-lap between the queries of similar categories.
Clicklogs present unique advantages as a similarity metric.First, they are generated by users, and are hence indepen-dent of the data provider’s naming conventions with respectto schema and taxonomy. Moreover, query information isself-updating over time. Users automatically enrich the datawith new and diverse lexicons, capturing various colloqui-alisms that come into use. For example, using conventionalapproaches, to handle the recent popularity of new smallform factor laptops, a human would have to manually up-date the search engine’s thesaurus to reflect that “netbooks”and “sub notebooks” are synonyms. This would have to bedone for each language that the search engine supports—abig expense that does not scale well. Additionally, clicklogsprovide a wealth of information for a wide variety of top-ics. If there is user interest in a domain, then there will beclicklog data that can be mined. Clicklogs are also more re-silient to spamming attacks. Current systems can be trickedby mislabeling an incoming feed causing data to be wronglyintegrated. By contrast, to influence a clicklog, a byzantine

data provider would have to issue a large number of searchqueries and click on URLs, posing as different users or IPsto achieve similar effect.
We outline the contributions made by this paper.
1. We introduce the problem of data integration for structured-search engines and show how it differs from traditionalenterprise data integration scenarios (Section 1).
2. We introduce “query distributions” derived from searchengine clicklogs as a feature that can be used to deter-mine the similarity of schema elements (Section 2).
3. We show how to reduce the problem of matching tax-onomy paths that appear as data values into the prob-lem of schema matching (Section 3).
4. We introduce new techniques for deriving query distri-butions that are associated with schema elements andtaxonomy terms (Section 4).
5. We introduce the use of surrogate items to leveragequery distributions for items that do not appear inclicklogs (Section 5).
6. We report on experiments that show the use of querydistributions improves schema matching results com-pared to conventional schema-based and instance-basedtechniques (Section 6).
7. We show how to integrate the query distribution tech-nique into an existing schema matching framework (Sec-tions 6.2 and 8).
3. COMBINING SCHEMA & TAXONOMIESIn this section, we describe how to reduce the taxonomy
mapping problem into the schema matching problem, andhence re-use our schema-matching framework and conceptsto perform both operations.
First, we require our incoming data feed to be in XMLformat, and the warehouse to be a collection of XML enti-ties. Since XML data can be represented as a tree, we canconsider schema mapping to be a problem of mapping be-tween nodes in two trees, one representing the data feed’sXML structure and one representing the warehouse schema.
The mapping process first extracts a set of features fromthe structure and content of the XML data. It then uses aset of similarity metrics to select correspondences from thetree representing the incoming data schema to the tree rep-resenting the data warehouse schema. For example, considerthe following XML feed:
<feed>
<laptop>
<name>ASUS eeePC</name>
<class>Portables . Economy . Smallsize</class>
<market>Americas . USA</market>
</laptop>
</feed>
For the schema mapping task, the words “ASUS” and“eeePC” are considered as features for the schema element“name”. With instance-oriented matching, the warehouseschema element whose instances contained many mentionsof “ASUS” would be selected to match “name”.
Taxonomy terms usually appear in data sources as datavalues within entities, not as schema elements. We need tomap each of these data source values into the correspondingwarehouse taxonomy path. To do this, we use a “pivot”operation that converts the categorical part of the XMLelement into a virtual XML schema, including other fields asneeded. In the example, we can perform the pivot operationfirst on the categorical field “class,” keeping “name” as afeature. This converts the feed into:
<feed>
<laptop>
<Portables>
<Economy>
<Smallsize>ASUS eeePC</Smallsize>
</Economy>
</Portables>
</laptop>
</feed>
This virtual XML allows us to overload the schema mappingoperations to also perform taxonomy matching. This is donefor every categorical field we need to map (e.g. “market”),resulting in a taxonomy tree with many leaf nodes. We focuson mapping only the leaf nodes of each tree.
4. USING CLICKLOGS AS FEATURESTo drive the schema matching task, we aggregate the click-
log into a clicklog summary. Each entry is of the form <q,n, u>, where n is the number of times that a user clicked onURL u when it was presented as a result of search query q.For example, an entry <laptop, 5, http://asus.com/eeepc>means that for the query “laptop,” the search result withURL http://asus.com/eeepc was clicked 5 times. All otherinformation, such as unique identifiers for the user and thesearch session, is discarded for privacy reasons.
4.1 Generating Query DistributionsTo match two schema elements or taxonomy terms, we
extract the query distribution across all clicklog entries thatcorrespond to each element. We then generate a correspon-dence between the two elements if their query distributionsare sufficiently similar.
To do this we need to associate each schema or taxonomyelement with the set of clicklog entries whose URLs refer tothat element. We do this in two steps. In the first step,we associate each element to be matched with the set ofentities that are instances of the element. These entities arethe values of the element that are found in the data feed. Forexample, if an entry in a data feed associates the taxonomyterm “Computers . Laptop . Small Laptops” with the value“HP MiniNote,” then we regard “HP MiniNote” as an entitythat is an instance of that taxonomy term.
In the second step, we associate each entity with the URLin the clicklog summary that describes that entity. Thisturns out to be an easy task, because most modern websitesare database driven. Since each website has to query thedatabase to generate a webpage for the requested URL, web-sites typically embed a unique key value of the entity in theURL itself and have a catalog that publishes the definition ofkeys. For example, Amazon.com uses a unique “ASIN num-ber” to identify each product in their inventory. This ASINnumber also appears as a part of each Amazon.com productpage URL. Thus, the URL “http://amazon.com/dp/B0006HU4OO”

is about the product with ASIN number B0006HU4OO, or“Apple Macbook Pro” (similarly, in our clicklog example be-low, “macbookpro” and “mininote” could be primary keysto identify the corresponding items in the database). Hence,to find the URL for an Amazon.com product item, we cansimply look up the product item’s ASIN number, and thenselect all clicklogs entries whose URL contains this ASINnumber. This convention was found to be true for all majordatabase-driven website frameworks and almost all the topshopping websites we inspected1.
The query distribution of an entity is the normal-ized frequency distribution of keyword queries where thequery returned that entity and the user selected it (i.e.,clicked on it). For example, according to the clicklog inTable 1a, of the 25 queries that led to the click of the en-tity “eeePC” (denoted by http://asus.com/eeepc), 5 were for“laptop,” 15 for “netbook” and the remaining 5 for “cheapnotebook.” Hence, after normalization, the query distribu-tion is {“laptop”:0.2, “netbook”:0.6, “cheap notebook”:0.2}.
An aggregate class is the set of entities that are instancesof a given schema element or taxonomy term. The querydistribution for an aggregate class is the normalized fre-quency distribution of keyword queries that resulted in theselection of any of the member instances. Table 1b presentsquery distributions for 3 aggregate classes.
query freq urllaptop 70 http://searchengine.com/product/macbookprolaptop 25 http://searchengine.com/product/mininotelaptop 5 http://asus.com/eeepcnetbook 5 http://searchengine.com/product/macbookpronetbook 20 http://searchengine.com/product/mininotenetbook 15 http://asus.com/eeepccheapnetbook
5 http://asus.com/eeepc
Database: Aggregate class query distributionWarehouse: “. . . . Small Laptops” {“laptop”: 25/45,
“netbook”:20/45}Warehouse: “. . . . Professional Use” {“laptop”:70/75,
“netbook”:5/75}Asus.com:“eee” {“laptop”:5/25,
“netbook”:15/25,“cheap netbook”:5/25}
Table 1: (a) A sample clicklog. (b) Inferred querydistributions for 3 aggregate classes
4.2 Using Query DistributionsGiven an incoming data source, we need to generate a
mapping between the aggregate classes (taxonomy and schemaelements) of the incoming data and those of the data ware-house. To do this, we do a pairwise comparison between thequery distributions of each aggregate class of the incomingand warehouse data sources. Similarity scores above a cer-tain tunable threshold are considered to be valid candidatecorrespondences.
To compare query distributions, we need a comparisonmetric. For now, we use Jaccard similarity. We considerother alternatives at the end of this section.
To revisit our previous example, suppose the warehousecontains only one HP Mininote small laptop product item,
1Alexa.com Top Shopping Sites
with the taxonomy term “Computers . Laptop . Small Lap-tops”. Suppose the warehouse also contains the Apple Mac-book Pro item, the only laptop that falls under “Computers. Laptop . Professional Use”. Now, suppose Asus, anotherlaptop manufacturer, wishes to include its data in our index.It uploads an XML feed to our system, as described previ-ously. The “eee PC” item is assigned the taxonomy term“eee” in the Asus feed, and our task is to map “eee” to theappropriate warehouse taxonomy term.
To do this, we generate query distributions for the aggre-gate classes representing each of the two warehouse cate-gories, and then compare them with the query distributionfor the aggregate class representing the ASUS feed taxon-omy term “eee”. We analyze our clicklogs in Table 1a andobserve that 100 people have searched (and clicked a result)for the word “laptop”. Seventy of them clicked on the Ap-ple Macbook Pro item, 25 on the HP MiniNote item, and 5on the link for the Asus eee PC item in the incoming feed.For the query “netbook,” we observe 40 queries, 5 of whichclicked on Macbook, 20 on the MiniNote product, and 15on the eee PC. For the query “cheap netbook,” 5 out of 5queries resulted in clicks to eeePC.
We count not only the number of clicks on the items inthe warehouse such as the Apple Macbook Pro, but alsoclicks on the Asus items, since the search engine indexes theAsus web site. In addition, we have a mapping of productpages on asus.com to entities of the incoming feed, sinceeach page’s URL is constructed from the primary key of theentity. So when someone clicks on an asus.com result, wecan translate it to a click to an Asus item.
Hence, the query distribution for the aggregate class rep-resenting the data provider’s “eee” taxonomy term is {“laptop”:5,“netbook”:15, “cheap netbook”:5}. For the aggregate classrepresenting the data warehouse’s “Computers . Laptop .Small Laptops” taxonomy term, the distribution is {“laptop”:25, “netbook”:20}, and for “Computers . Laptop . Profes-sional Use,” the query distribution is {“laptop”:70, “net-book”:5}. (For clarity, we have not normalized the querydistributions in this paragraph.)
After processing the clicklogs to generate query distribu-tions of the aggregate classes, we can now compare each pair(i.e., Warehouse class “Computers . Laptop . Small Lap-tops” vs Asus.com class “eee” and Warehouse class “Com-puters . Laptop . Professional Use” vs Asus.com class “eee”)and generate correspondences as follows:
Generate-Correspondences(Classes WC, Classes IC)1 for each class wc in WC2 do for each query ic in IC3 do Emit(wc, ic,Compare-Distributions(wc, ic))
Compare-Distributions(Distribution DH , Distribution DF )1 score← 02 for each query qh in DH
3 do for each query qf in DF
4 do minFreq = lesser(DH [qh], DF [qf ])5 score← score + Jaccard(qh, qf ) ∗minFreq6 return score
Jaccard similarity Jaccard(q1, q2) of two queries q1, q2is defined as:
Jaccard =|Words(q1) ∩Words(q2)||Words(q1) ∪Words(q2)|
For example, consider comparing the query distributionsfor the aggregate classes of ASUS taxonomy term “eee”{“laptop”:0.2, “netbook”:0.6, “cheap netbook”:0.2} and thewarehouse taxonomy term “Small Laptops” {“laptop”:0.56,“netbook”:0.44}. Comparing each combination of queries,the score is (1× 0.2 + 1× 0.44 + 0.5× 0.2) = 0.74. On theother hand, the score for comparing “eee” with the ware-house taxonomy term “Professional Use” would be (1×0.2+1 × 0.07 + 0.5 × 0.07) = 0.31, which is much less than theprevious similarity score. Clearly, “Computers . Laptop .Small Laptops” is the recommended correspondence for in-coming taxonomy term “eee”.
Jaccard similarity can be replaced by other functions, suchas WordDistance:
WordDistance(n) = Len(Words(q1) ∩Words(q2))n
Jaccard compensates for large phrases that are common,looking at only the ratio of common vs. uncommon words.WordDistance allows for exponential biasing of overlaps,also considering the length of the common words. Anotheralternative is simply to use the exact string comparison func-tion, hence only counting the queries that are identical inboth distributions. We call this alternative the Min vari-ant. It is significantly faster because it does not have todo word-level text analysis. We compare and contrast thesefunctions in Section 6.4.
4.3 RemarksIn this section we offer three remarks about using clicklogs
and query distributions for schema matching. First, we of-fer some intuition by comparing them to schema-based andinstance-based matching using join operations as an anal-ogy. In schema-based matching, each warehouse class in theset of classes WC is compared with each incoming providerclass in the set of classes IC, possibly generating a corre-spondence. So in a sense, we are performing the join
WC 1SB IC
where the schema-based join operator 1SB generates corre-spondences based on the text similarity of the left and rightsides. In instance-based matching, we add another join oneach side to map classes to their underlying entities, ItemsW
and ItemsI , and then do an instance-based join 1IB :
(WC 1 ItemsW ) 1IB (ItemsI 1 IC)
In clicklog-based matching, we introduce a further query-distribution-based join 1QD with the clicklog CL:
(WC 1 (ItemsW 1 CL)) 1QD ((CL 1 ItemsI) 1 IC)
This intuitive view highlights the fact that clicklog-basedschema matching is not competitive with schema-based orinstance-based methods. It simply adds another feature thatcan be used to improve the result of other schema-matchingmethods.
Second, we observe that query distributions are a gen-eral feature of schemas that can be understood independentof their use in schema matching. They have the followingproperties, which might be useful in contexts beyond schemamatching, such as classification applications.
• The query distributions of similar entities are similar.(E.g., if the Toshiba m500 and Toshiba x60 are simi-lar items, then the query distributions for the Toshibam500 and Toshiba x60 are similar.)
• Query distributions of similar aggregate classes aresimilar.
• The query distribution of a database item is closest tothe aggregate class it belongs to. (This allows us touse query distributions for classification purposes.)
We verified these properties in experiments that are de-scribed in Section 6.5.
Third, we observe that the fact that two entities havesimilar query distributions depends on their ranking in theresults of search queries. Thus, our approach leverages thesearch engine’s ability to identify related entities (i.e., URLs)in response to a query. Indeed, one could argue that ourquery-distribution method does only that. However, thisdiscounts the benefit provided by users, since they generatesearch keywords and click on relevant items more than ir-relevant ones. We are leveraging their vocabulary and judg-ment, not just the search engine’s ranking.
We can test this claim by viewing simple search engine-based clustering as a special case of instance-based match-ing, with the content of the entities as features, and thesearch engine’s ranking as a similarity function. As we willsee in Sec. 6.2, search-based clustering does not performas well as query distributions. One reason is the benefitof user clicks; search queries provide high-quality human-generated features for each URL (i.e., entity). Another isthat search engine results are not based solely on contentsimilarity. They are biased by popularity metrics such asPageRank. Hence, the most similar item may rank belowa less similar but more popular item. Since query distribu-tions span multiple queries, the association of two items dueto their overlapping query distributions is much stronger.
5. FINDING SURROGATESThe use of query distributions requires that data sources
have a web presence, so that their results show up in websearch results and are clicked on. Some data providers donot satisfy this requirement. However, they are likely tohave established competitors with similar data, which dohave significant presence in the clicklogs. Thus, we propose amethod by which we identify surrogate clicklogs for any datasource without significant web presence. For each candidateentity in the feed that does not have a significant presence inthe clicklogs (i.e. clicklog volume is less than a threshold),we look for an entity in our collection of feeds that is mostsimilar to the candidate, and use its clicklog data to generatea query distribution for the candidate object.
Get-Surrogate-ClickLog(Entity e)1 query ← DB-String(e)2 similarItems← Similar-Search(targetDB, query)3 surrogateUrl← similarItems[0].url4 return Get-ClickLog(surrogateUrl)
The functions DB-String and Similar-Search are userimplemented. For example, we use the surrogate methodfor our third task in the following section. Since one of ourdatasets, called the Whale dataset, does not have a web
presence, we use clicklog information from Amazon.com asa substitute. For our purpose, given an instance in Whale,the DB-String function returns the concatenation of theentity’s “name” and “brandname” attributes as the querystring, i.e., return item.name + “ ” + item.brandname. Forthe “Similar-Search” function, we used the Yahoo! WebSearch API with the “site:amazon.com inurl:/dp/” filter tofind the appropriate Amazon.com product item and url (ev-ery Amazon.com item has a unique product page). Thislets Yahoo! search for pages only within the amazon.comdomain, which contain “/dp/” in their URL. In line 4, wesimply pick the top result among those returned, and use itsURL as our surrogate URL. The search engine’s clicklog isthen searched for this URL to generate a surrogate clicklog.For this taxonomy mapping task, we first sample 100 itemsper taxonomy term for the incoming Whale data.
For each of the 1500 categories in Whale, we sample 100items from its inventory. Then, we search for them on Ama-zon, and end up finding 3651 items representing 853 Whalecategories.
6. EXPERIMENTS AND EVALUATIONIn this section, we compare the efficacy of our mapping
algorithm against other methods, and explore various otherfacets of the process. We begin in Section 6.1.1 by describ-ing our metrics and algorithms. We then describe the datasets and mapping tasks in Section 6.1.2, and describe thealgorithms compared in Section 6.1.3. We also study theeffect of clicklog size on mapping quality in Section 6.3, andevaluate the use of surrogate clicklogs. Then, in Section 6.4we consider different functions for comparing query distri-butions to pick the ideal one. We conclude by presentingevidence in Section 6.5 that verifies our claims that querydistributions are a valid similarity metric.
6.1 Experimental Setup
6.1.1 Evaluation MetricsIn order to evaluate our mapping algorithm, we first need
to define the methods and metrics for evaluation. For eachof the integration tasks described in Section 6.1.2, we deriveor construct gold standards listing the correct mappings. Amapping is a set of correspondences. Each correspondenceis a pair of elements, one from each schema (or taxonomy).
Each algorithm is then run, producing a set of correspon-dences. For each set of correspondences, we compute recall(i.e., the fraction of correct correspondences that we pro-duced) and precision (i.e., the fraction of correspondencesin the produced set that are correct). Ideally, mapping al-gorithms should have both high recall and high precision.When this is not possible, we prefer to have high precisionat the cost of reduced recall. Since mappings produced areused down the pipeline in automated and semi-automatedprocesses for the search engine, an erroneous mapping couldhave an amplified impact in overall result quality. Thus itis important to maintain high precision and minimize anyerrors that we introduce into the system, even if it is at thecost of reduced recall.
Recall and precision are defined using the notions of true(T)and false(F) positives(P) and negatives(N), where Recall =TP/(TP + FN) and Precision = TP/(TP + FP ).
Generated correspondences that were wrong (whose left
side existed in the gold standard, but not the right side) ordidn’t exist (even the left side was not present) in the goldstandard are considered as false positives. Correspondenceswhose left side existed in the gold standard, but matchingcorrespondences that did not exist in the test mapping werecounted as false negatives. Correspondences produced thatexist in the gold standard were marked true positives, whiletrue negatives are not considered.
Since a practical framework may contain more than onealgorithm to perform data integration, we are interestedin comparing the output of our Query-Distribution methodagainst other methods, namely Schema-based and Instance-based methods, which will be described in the followingparagraphs. Differences and similarities of outputs give usa deeper understanding of the strengths and weaknesses ofeach method, which can then be used to come up with a com-bined meta-mapping algorithm. We construct a Consensusbased algorithm in this light, and study its performance.
6.1.2 DatasetsTo derive query distributions, we used a sample of query
log data from the Live.com web search engine, restricted toonly English U.S. queries. Blank queries, pornographic oroffensive keywords and navigational queries were removedusing blacklists. As expected, our query log displays prop-erties similar to published studies on search query logs, andfollows Zipf’s law: many of the queries have a low frequencyof occurrence and a few of them are highly frequent. Click-logs are attained by filtering those entries that lead to a validURL. Query distributions were then generated by mappingURLs to entities. For example in Task B below, 1.8 millionsearch queries in our query log sample resulted in clicks topages with URLs starting with http://amazon.com and con-tained a valid ASIN number. The URLs were then mappedto an Amazon product using the ASIN id. Each producthad a query distribution averaging 13 unique (i.e., different)search queries (min 1, max 181, stdev 22).
To study many different aspects of query-distribution basedmappings, we need to pose a variety of questions. How-ever, we were unable to find a single real dataset that cap-tures this variety. Instead, our experiments evaluate threedata integration tasks. Each task is an actual data inte-gration challenge we encountered during the development ofour search engine, and each poses unique challenges typicalof real-world scenarios. Our first task is to integrate theschema of an incoming data feed. The second task involvesthe mapping of taxonomies. The third task evaluates theuse of surrogate clicklogs.
Task A. Schema Integration: Our data warehouse’sMovie database contains movie and showtime informationgathered from a number of data sources. The warehouseMovie schema contains 5 domains for movies, people, show-times, series and companies, each with 4-5 schema elements.For example, each item of the movies domain has the ele-ments “Name,” “Runtime,” “Rating,” among others. Weconsider the inclusion of an additional data provider (letus call it XYZ Movies) which provides feeds called Movieand Theatre. We focus on the mapping of schema elementswithin the feed to schema elements in the warehouse. Inour case, we consider the mapping of the data warehouse’smovies domain with the Movie from our data provider. The

warehouse movies domain contains 30 different XML ele-ments and 16 attributes. The incoming Movie was origi-nally in CSV format with 24 fields, converted to a flat XMLstream. A gold standard was hand-created for this. We usea sample of 10,000 entities from the data warehouse, and asample of around 1400 entities for the incoming data.
Task B. Taxonomy Integration: The data warehouse’sShopping domain contains millions of computers and elec-tronics items, each of which is assigned exactly one tax-onomy term from about 6000 leaf categories. The incomingAmazon.com dataset is a collection of 70,000 computers andelectronics items, each having multiple categories. We studya sample of 258 products that existed in both catalogs. Wemanually derive a gold standard by identifying the instancesin both catalogs, and then use the taxonomy term informa-tion on each side (613 in Amazon, 43 in our warehouse) toproduce 901 correspondences we consider to be correct. Thetaxonomy correspondences were observed to be consistent inthe following sense: If an item was assigned the “laptops”taxonomy term in Amazon, and the same item was assignedthe taxonomy term “portables” in the warehouse, then allother items under “laptops” were also assigned “portables”in the warehouse. 93% of the Amazon categories consis-tently mapped to the same warehouse taxonomy term.
Task C. Schema & Taxonomy Integration, Use ofsurrogates: The Whale (name anonymized) database con-tained a list of 2.6 million computers and electronics productoffers and discount information. Each offer was assigned ex-actly one taxonomy term out of a taxonomy of around 1500leaf categories. Other fields included product name, brandname and various pricing options, of which we only used thebrand name and product name fields. We attempt to inte-grate this with the warehouse Shopping database from theprevious task B. Unlike the previous task, we do not haveany instance information from the warehouse side. This isbecause the Shopping database is split in an ad hoc manneracross multiple partitions, and sampling entities for each ofthe 6000 categories is extremely expensive to compute. Acorrespondence of each of the 1500 Whale leaf categoriesto exactly one of the 6000 warehouse categories was donemanually to create the gold standard.
6.1.3 AlgorithmsFor each task, we compare our query distribution based
methods against two other methods. The first method uti-lizes the “Schema-based” techniques of the matching algo-rithm described in [32]. This method performs matchingbased on lexical properties of labels, and the structure ofthe schema tree (and in our case, also the taxonomy tree).We call this method Schema-based mapping.
The second method, which we call the Instance-based method,uses the content of the warehouse’s entities as features, andschema elements and taxonomy terms as labels to be inputto a Naive Bayes classifier. A sample of the incoming datais then classified using this model. The schema element ortaxonomy term of the incoming data sample and the outputlabel are considered as a correspondence, and all correspon-dences above a certain score threshold are considered.
We also compare a consensus algorithm that combines thecorrespondences generated from the Schema-based, Instance-based, and query-distribution methods by summing the nor-
malized scores for each candidate correspondence. The con-sensus based method is meant solely to understand the in-teractions between the various algorithms. Our focus is theimpact of various features on mapping quality. More ad-vanced “meta-mappers” listed in the related work sectioncan always be run using the mentioned mapping algorithmsas input, generating better results.
6.2 Evaluating Integration QualityWe now present recall and precision numbers for each task
and method. Each algorithm returned a set of correspon-dences with a similarity “score,” signifying the algorithm’sconfidence that the correspondence was correct. The scorewas thresholded at increasing levels to calculate the variouscombinations of recall and precision.
Schema Integration: For Task A, the Schema-basedmethod was able to achieve 88% precision and 47% recall,thanks to the use of standard names such as “Director” /“director” and “Title” / “movie title” in the schema. TheSchema-based method was not able to map elements suchas “Genre” / “Category” or “MPAA” / “Rating”. TheInstance-based method was much better at this, since thedatasets contained identical or similar values for these fields.Overall, the Instance-based method was able to get 71% pre-cision with 73% recall. The combination of the two in theconsensus method, was able to correctly map all but fiveelements. For each of these elements, the correct correspon-dence was among the top-3 choices suggested.
While such high recall and precision is sometimes feasi-ble with Schema-based and Instance-based methods, thismay not be achievable for incoming feeds whose data doesnot overlap, or are in languages or formats different fromthe warehouse. In this case, a non-instance based methodsuch as query distributions is needed. We thus attempt tomap the incoming XYZ Movies data stream, using surro-gate clicklogs of imdb.com. Various parts of the data weremapped to appropriate URLs. For example, the “awards”field for the movie Titanic was linked tohttp://www.imdb.com/title/tt0120338/awards. This methodproduced 11 correspondences, 5 of which were correct. Weobserved that query distribution worked well for the fre-quently queried parts of the database. Schema elements thatare often part of user queries, such as “awards,” “category,”“person,” and “movie title” were correctly mapped. Ele-ments whose instances are not usually part of user queries,such as “country code,” “MPAA,” and “runtime,” were mappedincorrectly.
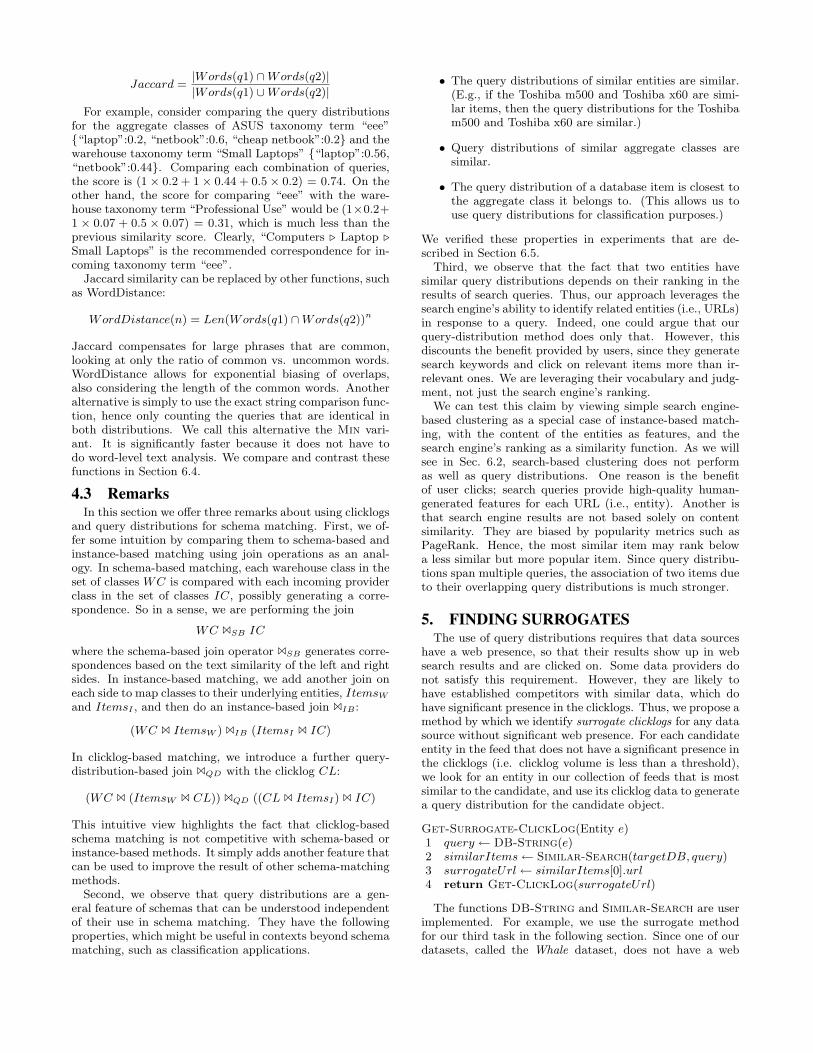
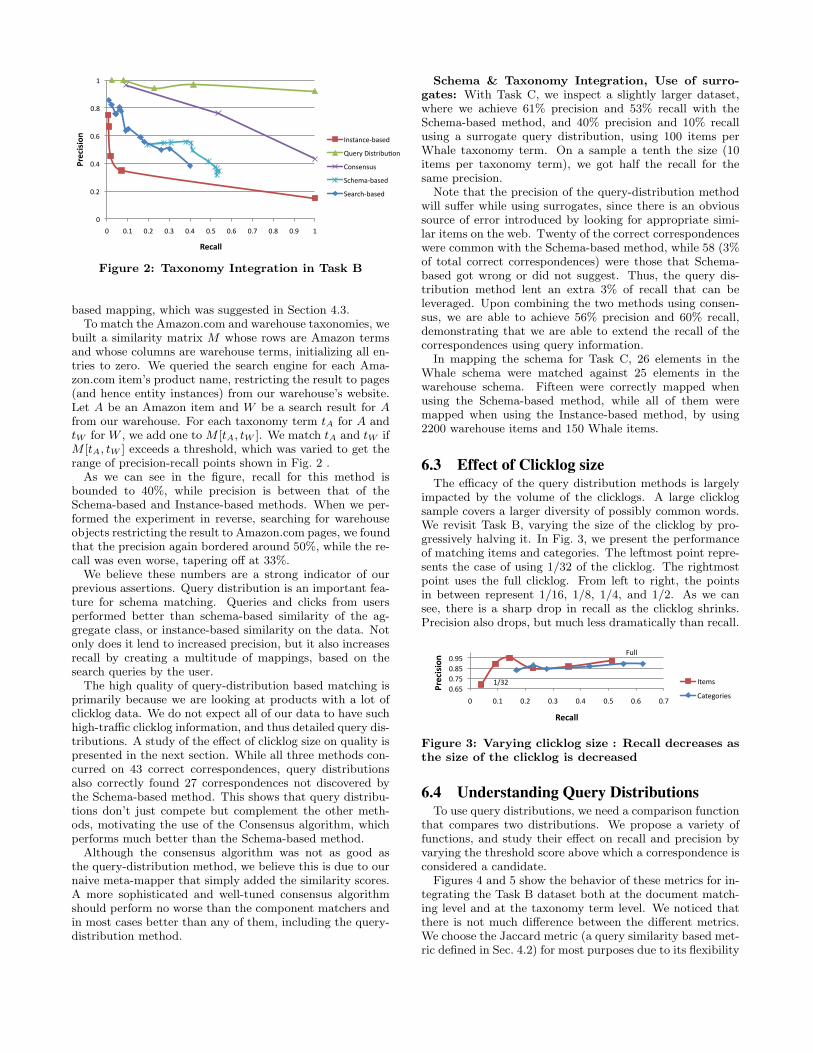
Taxonomy Integration: For Task B, we can see inFig. 2 that the query distribution method clearly outper-forms the others, with 92% precision for 100% recall. Cor-respondences are also of high confidence; for each taxonomyterm, the score for the top correspondence suggestion wasover five times the score of other suggestions on average.Instance-based matching achieved a low 11% precision and95% recall, because the classifier was using the name andbrand name as its input features, but products were nameddifferently in the warehouse and at Amazon. While thenames were different in the two sources, users still searchedfor them using similar keywords, resulting in a successfulmapping by query distribution.
We now evaluate the use of the search engine for instance-
0
0.2
0.4
0.6
0.8
1
0 0.1 0.2 0.3 0.4 0.5 0.6 0.7 0.8 0.9 1
Precision
Recall
Instance‐based
Query Distribu=on
Consensus
Schema‐based
Search‐based
Figure 2: Taxonomy Integration in Task B
based mapping, which was suggested in Section 4.3.To match the Amazon.com and warehouse taxonomies, we
built a similarity matrix M whose rows are Amazon termsand whose columns are warehouse terms, initializing all en-tries to zero. We queried the search engine for each Ama-zon.com item’s product name, restricting the result to pages(and hence entity instances) from our warehouse’s website.Let A be an Amazon item and W be a search result for Afrom our warehouse. For each taxonomy term tA for A andtW for W , we add one to M [tA, tW ]. We match tA and tW ifM [tA, tW ] exceeds a threshold, which was varied to get therange of precision-recall points shown in Fig. 2 .
As we can see in the figure, recall for this method isbounded to 40%, while precision is between that of theSchema-based and Instance-based methods. When we per-formed the experiment in reverse, searching for warehouseobjects restricting the result to Amazon.com pages, we foundthat the precision again bordered around 50%, while the re-call was even worse, tapering off at 33%.
We believe these numbers are a strong indicator of ourprevious assertions. Query distribution is an important fea-ture for schema matching. Queries and clicks from usersperformed better than schema-based similarity of the ag-gregate class, or instance-based similarity on the data. Notonly does it lend to increased precision, but it also increasesrecall by creating a multitude of mappings, based on thesearch queries by the user.
The high quality of query-distribution based matching isprimarily because we are looking at products with a lot ofclicklog data. We do not expect all of our data to have suchhigh-traffic clicklog information, and thus detailed query dis-tributions. A study of the effect of clicklog size on quality ispresented in the next section. While all three methods con-curred on 43 correct correspondences, query distributionsalso correctly found 27 correspondences not discovered bythe Schema-based method. This shows that query distribu-tions don’t just compete but complement the other meth-ods, motivating the use of the Consensus algorithm, whichperforms much better than the Schema-based method.
Although the consensus algorithm was not as good asthe query-distribution method, we believe this is due to ournaive meta-mapper that simply added the similarity scores.A more sophisticated and well-tuned consensus algorithmshould perform no worse than the component matchers andin most cases better than any of them, including the query-distribution method.
Schema & Taxonomy Integration, Use of surro-gates: With Task C, we inspect a slightly larger dataset,where we achieve 61% precision and 53% recall with theSchema-based method, and 40% precision and 10% recallusing a surrogate query distribution, using 100 items perWhale taxonomy term. On a sample a tenth the size (10items per taxonomy term), we got half the recall for thesame precision.
Note that the precision of the query-distribution methodwill suffer while using surrogates, since there is an obvioussource of error introduced by looking for appropriate simi-lar items on the web. Twenty of the correct correspondenceswere common with the Schema-based method, while 58 (3%of total correct correspondences) were those that Schema-based got wrong or did not suggest. Thus, the query dis-tribution method lent an extra 3% of recall that can beleveraged. Upon combining the two methods using consen-sus, we are able to achieve 56% precision and 60% recall,demonstrating that we are able to extend the recall of thecorrespondences using query information.
In mapping the schema for Task C, 26 elements in theWhale schema were matched against 25 elements in thewarehouse schema. Fifteen were correctly mapped whenusing the Schema-based method, while all of them weremapped when using the Instance-based method, by using2200 warehouse items and 150 Whale items.
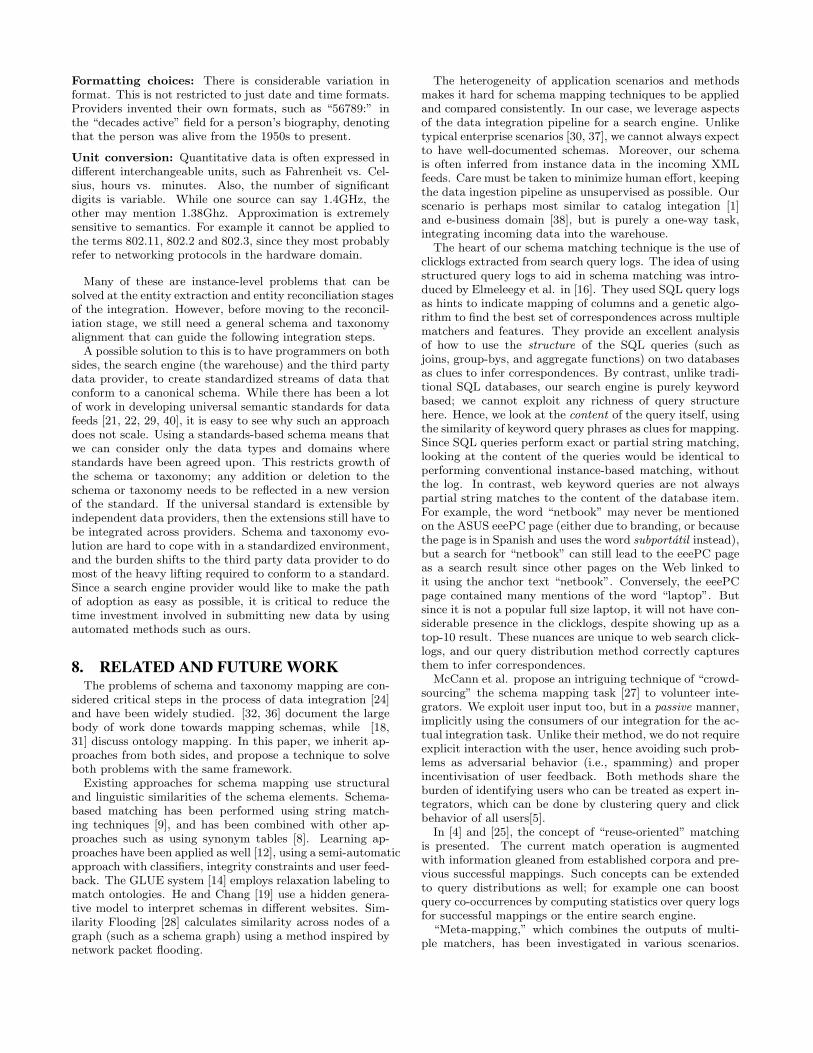
6.3 Effect of Clicklog sizeThe efficacy of the query distribution methods is largely
impacted by the volume of the clicklogs. A large clicklogsample covers a larger diversity of possibly common words.We revisit Task B, varying the size of the clicklog by pro-gressively halving it. In Fig. 3, we present the performanceof matching items and categories. The leftmost point repre-sents the case of using 1/32 of the clicklog. The rightmostpoint uses the full clicklog. From left to right, the pointsin between represent 1/16, 1/8, 1/4, and 1/2. As we cansee, there is a sharp drop in recall as the clicklog shrinks.Precision also drops, but much less dramatically than recall.
0.65 0.75 0.85 0.95
0 0.1 0.2 0.3 0.4 0.5 0.6 0.7
Precision
Recall
Items
Categories
1/32
Full
Figure 3: Varying clicklog size : Recall decreases asthe size of the clicklog is decreased
6.4 Understanding Query DistributionsTo use query distributions, we need a comparison function
that compares two distributions. We propose a variety offunctions, and study their effect on recall and precision byvarying the threshold score above which a correspondence isconsidered a candidate.
Figures 4 and 5 show the behavior of these metrics for in-tegrating the Task B dataset both at the document match-ing level and at the taxonomy term level. We noticed thatthere is not much difference between the different metrics.We choose the Jaccard metric (a query similarity based met-ric defined in Sec. 4.2) for most purposes due to its flexibility

80
85
90
95
100
0 10 20 30 40 50 60 70 80 90 100
Precision
Recall
WordDistanceLinear
Jacqard
WordDistanceSquare
Min
Figure 4: Query Distribution Metrics : Task B cat-egories
60
65
70
75
80
85
90
95
100
0 10 20 30 40 50 60 70 80 90 100
Precision
Recall
WordDistanceLinear
Jacqard
WordDistanceSquare
Min
Figure 5: Query Distribution Metrics : Task B items
across varying precision and recall levels, but it should benoted that Min (metric that considers only identical queries,also defined in Sec. 4.2) is much faster since it does not haveto do any string processing.
6.5 Claim ExperimentsAs described in Section 4.3, we first need to verify that
query distributions are good measures of similarity. To dothis, we pick the 40 categories from the data warehouse tax-onomy whose products have the most clicks in our clicklog.We pick 10 items for each taxonomy term, resulting in 400products. We found 258 of these items also listed at Ama-zon.com, representing a total of 613 categories (i.e., manyitems had more than one taxonomy term).
Table 2 presents the comparison of “query distributions”using the WordDistance metric. For each cell, query distri-butions of the corresponding row and column headers werecompared, and the best match was picked. For example,the cell for warehouse products vs. warehouse categories de-notes the ability to classify each product to a taxonomyterm, by comparing the query distributions of the productand the taxonomy term. Here, 383 of 400 (or 95.75%) itemswere categorized correctly. Additionally, we calculated the“confidence” of our choice; this is the ratio of the scores ofthe top ranking item to the second ranking item, on aver-age. The confidence numbers were observed to be high inall cases, ranging from 2.9x when matching warehouse prod-ucts against themselves, to 5.6x when mapping Amazon cat-egories to the warehouse categories, to 21x when matchingAmazon products to themselves.
Amazonproducts
Amazoncategories
WarehouseProducts
Warehousecategories
Amazonproducts
257/258(99.6%)
241/258(93.4%)
189/258(73.3%)
226/258(87.6%)
Amazoncategories
373/613(60.8%)
204/400(51%)
525/613(85.6%)
WarehouseProducts
392/400(98%)
383/400(95.75%)
Warehousecategories
40/40(100%)
Table 2: Comparing Query Distributions
As we can see in Table 2, almost 100% of query distribu-tions are unique to both products and categories with veryhigh confidence. An exception is the matching of Amazoncategories, since a product can have more than one taxon-omy term. Hence two categories end up having identicalquery distributions, and hence scores, in which case we ar-bitrarily choose one of the categories that have the identicaltop score. Also, the query distributions of products are clos-est to that of their categories. Additionally, 85% of Amazoncategories map correctly to the right warehouse taxonomyterm, again with high confidence. Based on our observationswe consider our claims to be verified.
7. DATA IN THE REAL WORLDWhile performing the tasks in the previous section, we
learned a fair bit about the challenges encountered whendealing with real world data.
One of the primary challenges encountered was the het-erogeneity of data models and conventions used. The datasources were in a wide variety of data models, from XMLstreams, to tab separated values, to SQL data dumps. Evenwithin each data model, there are numerous conventionswith regards to schema and data formats, such as:
Levels of normalization: Some data providers performheavy normalization resulting in a large number of relations/ XML entity types. Others encapsulate all their data intoa single table / entity type with many optional fields.
In-band signaling: Many data values contain encodingsand special characters that are references and lookups tovarious parts of the database. An example of this is to havea “description” field from our running example for laptops,where entity names are encoded into the text, such as “Thelaptop is a charm to use, and is a clear winner when com-pared to the $laptopid:1345$.” The field $laptopid:1345$ isthen replaced with a linked reference to another laptop bythe application layer.
Attributes vs. Elements: There is great variation inXML data regarding the use of attribute values. Manydatasets did not contain any attribute values, while onedataset was essentially a feed of a single entity type, whichcontained a large number of attributes in it. Our approachto this was to treat all attributes as subelements.
Partial Data: The data provided is often a “cutaway” ofthe original source, where certain parts of the database aremissing for practical or privacy purposes. There are oftenmany dangling references and unusable columns.
Multiple levels of detail: Providers have varying levelsof granularity in categorical data. While one provider mayclassify a laptop item as “computer,” another may file thesame laptop under “laptops . ultraportables . luxury”.
Provenance information: A large portion of the data isunusable for search access. For example, some data encoun-tered were provenance and bookkeeping, such as the cardi-nality of other tables in the database and the time and dateof last updates.
Domain specific attributes: Often the data provider usesa proprietary contraction whose translation is available onlyin the application logic, for example “en-us” to signify a USEnglish keyboard.
Formatting choices: There is considerable variation informat. This is not restricted to just date and time formats.Providers invented their own formats, such as “56789:” inthe “decades active” field for a person’s biography, denotingthat the person was alive from the 1950s to present.
Unit conversion: Quantitative data is often expressed indifferent interchangeable units, such as Fahrenheit vs. Cel-sius, hours vs. minutes. Also, the number of significantdigits is variable. While one source can say 1.4GHz, theother may mention 1.38Ghz. Approximation is extremelysensitive to semantics. For example it cannot be applied tothe terms 802.11, 802.2 and 802.3, since they most probablyrefer to networking protocols in the hardware domain.
Many of these are instance-level problems that can besolved at the entity extraction and entity reconciliation stagesof the integration. However, before moving to the reconcil-iation stage, we still need a general schema and taxonomyalignment that can guide the following integration steps.
A possible solution to this is to have programmers on bothsides, the search engine (the warehouse) and the third partydata provider, to create standardized streams of data thatconform to a canonical schema. While there has been a lotof work in developing universal semantic standards for datafeeds [21, 22, 29, 40], it is easy to see why such an approachdoes not scale. Using a standards-based schema means thatwe can consider only the data types and domains wherestandards have been agreed upon. This restricts growth ofthe schema or taxonomy; any addition or deletion to theschema or taxonomy needs to be reflected in a new versionof the standard. If the universal standard is extensible byindependent data providers, then the extensions still have tobe integrated across providers. Schema and taxonomy evo-lution are hard to cope with in a standardized environment,and the burden shifts to the third party data provider to domost of the heavy lifting required to conform to a standard.Since a search engine provider would like to make the pathof adoption as easy as possible, it is critical to reduce thetime investment involved in submitting new data by usingautomated methods such as ours.
8. RELATED AND FUTURE WORKThe problems of schema and taxonomy mapping are con-
sidered critical steps in the process of data integration [24]and have been widely studied. [32, 36] document the largebody of work done towards mapping schemas, while [18,31] discuss ontology mapping. In this paper, we inherit ap-proaches from both sides, and propose a technique to solveboth problems with the same framework.
Existing approaches for schema mapping use structuraland linguistic similarities of the schema elements. Schema-based matching has been performed using string match-ing techniques [9], and has been combined with other ap-proaches such as using synonym tables [8]. Learning ap-proaches have been applied as well [12], using a semi-automaticapproach with classifiers, integrity constraints and user feed-back. The GLUE system [14] employs relaxation labeling tomatch ontologies. He and Chang [19] use a hidden genera-tive model to interpret schemas in different websites. Sim-ilarity Flooding [28] calculates similarity across nodes of agraph (such as a schema graph) using a method inspired bynetwork packet flooding.
The heterogeneity of application scenarios and methodsmakes it hard for schema mapping techniques to be appliedand compared consistently. In our case, we leverage aspectsof the data integration pipeline for a search engine. Unliketypical enterprise scenarios [30, 37], we cannot always expectto have well-documented schemas. Moreover, our schemais often inferred from instance data in the incoming XMLfeeds. Care must be taken to minimize human effort, keepingthe data ingestion pipeline as unsupervised as possible. Ourscenario is perhaps most similar to catalog integation [1]and e-business domain [38], but is purely a one-way task,integrating incoming data into the warehouse.
The heart of our schema matching technique is the use ofclicklogs extracted from search query logs. The idea of usingstructured query logs to aid in schema matching was intro-duced by Elmeleegy et al. in [16]. They used SQL query logsas hints to indicate mapping of columns and a genetic algo-rithm to find the best set of correspondences across multiplematchers and features. They provide an excellent analysisof how to use the structure of the SQL queries (such asjoins, group-bys, and aggregate functions) on two databasesas clues to infer correspondences. By contrast, unlike tradi-tional SQL databases, our search engine is purely keywordbased; we cannot exploit any richness of query structurehere. Hence, we look at the content of the query itself, usingthe similarity of keyword query phrases as clues for mapping.Since SQL queries perform exact or partial string matching,looking at the content of the queries would be identical toperforming conventional instance-based matching, withoutthe log. In contrast, web keyword queries are not alwayspartial string matches to the content of the database item.For example, the word “netbook” may never be mentionedon the ASUS eeePC page (either due to branding, or becausethe page is in Spanish and uses the word subportatil instead),but a search for “netbook” can still lead to the eeePC pageas a search result since other pages on the Web linked toit using the anchor text “netbook”. Conversely, the eeePCpage contained many mentions of the word “laptop”. Butsince it is not a popular full size laptop, it will not have con-siderable presence in the clicklogs, despite showing up as atop-10 result. These nuances are unique to web search click-logs, and our query distribution method correctly capturesthem to infer correspondences.
McCann et al. propose an intriguing technique of “crowd-sourcing” the schema mapping task [27] to volunteer inte-grators. We exploit user input too, but in a passive manner,implicitly using the consumers of our integration for the ac-tual integration task. Unlike their method, we do not requireexplicit interaction with the user, hence avoiding such prob-lems as adversarial behavior (i.e., spamming) and properincentivisation of user feedback. Both methods share theburden of identifying users who can be treated as expert in-tegrators, which can be done by clustering query and clickbehavior of all users[5].
In [4] and [25], the concept of “reuse-oriented” matchingis presented. The current match operation is augmentedwith information gleaned from established corpora and pre-vious successful mappings. Such concepts can be extendedto query distributions as well; for example one can boostquery co-occurrences by computing statistics over query logsfor successful mappings or the entire search engine.
“Meta-mapping,” which combines the outputs of multi-ple matchers, has been investigated in various scenarios.

Both LSD [12] and GLUE [14] use a multi-strategy approachby combining the mappings from a set of learners using ameta-learner. Unsupervised rank aggregation by maximiz-ing ranker agreement [23] and using techniques from evi-dential reasoning [20] have been discussed. COMA++[4,17] proposes a variety of match strategies and provides ex-haustive infrastructure to evaluate, compose and combinematchers. Such methods can be used to combine Query-Distribution mappings with other sources. In [10] the con-tinual post-integration improvement of “mediated schemas”is discussed to make them more amenable for future in-tegration. We believe these techniques make for excellentinputs towards building our overall data integration frame-work, and would work very well in conjunction with theideas proposed in this paper.
As a solution to structured search, the construction ofan integrated warehouse is not novel. Google Base [21]already indexes a large amount of data, integrated froma variety of data providers. Data providers are encour-aged to use Google’s attributes. While universal data stan-dards exist [40, 22], we still expect a large number of dataproviders to use proprietary schemas and taxonomies. Thisforces data providers to manually write code to translatefrom the proprietary formats to the standardized format forthe warehouse, an undesirable task. Alternative paradigmsinclude federated search over heterogeneous databases byautomatically discovering relationships across the multipledatabases [35] or using an A*-based search to execute queriesover a merged schema [11]. Both approaches, while differ-ent from ours, are perfectly acceptable, and lead to mappingproblems similar to ours. Adapting our techniques for theseapproaches as a suitable topic for future work.
While query log information has been exploited for rele-vance ranking in search, HAMSTER is the first system toour knowledge that uses keyword query distributions to mapschema and taxonomies. Literature on query distributionfrom the image processing community concentrate on his-tograms with numerical bins, while we are concerned withquery strings as bin labels. [33] proposes Earth Mover’s Dis-tance as a similarity metric, which is the amount of workrequired to transform one distribution to another. [7] com-pares different methods to compare query log informationfor web search by analyzing the overlap in query terms, re-sult ranks and result contents. We leverage these ideas andpropose our own similarity metrics in Section 4.
9. CONCLUSIONWith the continual growth of structured data available on
the web, it is increasingly important to be able to sift andsearch through these mountains of structured data. Dataintegration thus becomes a necessary step to provide a uni-fied search interface. Mapping schema and taxonomy arecritical parts of the data integration pipeline, allowing thesearch engine to effectively ingest large numbers of incomingfeeds in an unsupervised or semi-supervised manner.
In this paper, we explored the scenario of schema and tax-onomy integration in the context of a keyword search engine.We proposed a single framework to tackle both problems,and presented the issues involved in building the framework.We discovered that semi-supervised mapping is an achiev-able goal for our tasks, automatically generating 40-60% ofthe correspondences with a precision of above 70%. Keep-ing our overall framework in mind, we looked into the use of
information previously unavailable in traditional mappingscenarios. We proposed the use of click information fromthe search engine’s query log as a feature in our mappingframework. We discovered that clicklogs are a promisingsource of features, generating correspondences that manycurrent methods cannot find. This is because current meth-ods analyze only the content of the data, while we use in-formation outside of the actual data, i.e., users’ queries, topropose mappings. The clicklog method is ideal when thedata comes from disparate sources and has little overlapwith the contents of the warehouse, a common situation inour experience. We observed that query distributions canproduce very high (nearly perfect) precision mappings, andthat the recall is proportional to the amount of the clickloginformation available.
Going forward, we foresee a multitude of directions whereadvancements can be made. We currently require a fewhours to extract relevant clicklogs, and less than an hourto produce the actual mappings. The former time couldbe reduced drastically by properly indexing clicklog datafor our needs, while the latter can be reduced to near in-stant time by proper optimization and parallelization (thenature of our algorithm makes it especially amenable to aMap-Reduce style adaptation). By reducing the mappinggeneration time, we can provide the data providers with aninteractive experience, showing them how their data will beintegrated right when they upload their data. Additionally,clicklogs are noisy, in that users often click through to URLsthat turn out to be irrelevant. Removing noise should im-prove our results and would be worthwhile future work.
While we consider the keyword queries as structure-lessphrases, it may be possible to discover an ad hoc structurein them. For example, the query “macbook pro prices” canbe translated to “[name] prices”. The unsupervised templa-tization of keyword queries has been shown to be possible atweb scale [39]. We plan to incorporate this technique intoour framework, allowing us to analyze the (fairly limited)structure of the queries as an additional input feature for themappers. Furthermore, the clustering of related queries [41,6] can discover connections between query terms, allowingus to generate even more input features. Another directionto explore is mapper confidence. In the presence of multiplemappers, how do we determine that the clicklog informationis the best source of mappings for a particular schema ortaxonomy element? A simple option is to threshold the ab-solute score values. Another option is to look at the amountand quality of the clicklog used to make the mapping pro-posals, since we expect sections with a large number of userswhose clicks agree with each other to produce better map-pings than sections with a few disagreeing users.
As documented by similar web-scale integration projects [26],the integration pipeline is required to provide the best-effortanswers at all times, while continually improving itself byincorporating feedback. An interesting source of feedbackinformation we possess is query log information, which canbe exploited to measure the search satisfaction of the user.One possible idea is to use search satisfaction as an objectivefunction for mapping quality. To do this, one could lever-age the method of sample testing, where a small fraction ofthe search engine users are presented with a modified searchmechanism. Various aspects of their behavior, such as or-der of clicks, session time, answers to polls or surveys, etc.are used to measure the effectiveness of the modification.

While each mapping usually consists of the top correspon-dence match for each entity, one could instead consider thetop-k correspondences for each item, resulting in multiplepossible mapping configurations. Each mapping configura-tion is run as a sample test, and the mapping that resultsin the most satisfactory user experience is then picked asthe final mapping answer. A method like this would be anexcellent complement to the work in this paper.
10. ACKNOWLEDGEMENTSWe thank Thomas Bergstraesser and Bert Casper for sug-
gesting the problem, Smitha Kalappurakkal for help withthe data and Sergey Melnik for many helpful discussions.
11. REFERENCES[1] R. Agrawal and R. Srikant. On Integrating Catalogs.
WWW, 2001.
[2] S. Amer-Yahia. A Database Solution to Search 2.0(keynote talk). WebDB, 2007.
[3] E. Amitay and A. Broder. Introduction to Specialissue on Query Log Analysis: Technology and Ethics.TWEB, 2008.
[4] D. Aumueller, H. Do, S. Massmann, and E. Rahm.Schema and ontology matching with COMA++.SIGMOD, 2005.
[5] R. Baeza-Yates, C. Hurtado, and M. Mendoza. QueryRecommendation using Query Logs in Search Engines.International Workshop on Clustering Informationover the Web, 2004.
[6] R. Baeza-Yates, C. Hurtado, and M. Mendoza. Queryrecommendation using query logs in search engines.EDBT Workshops, 2004.
[7] E. Balfe and B. Smyth. A Comparative Analysis ofQuery Similarity Metrics for Community-Based WebSearch. LNCS, 2005.
[8] P. Bernstein, J. Madhavan, and E. Rahm. GenericSchema Matching with Cupid. VLDB Journal, 2001.
[9] P. Bernstein, S. Melnik, and J. Churchill. IncrementalSchema Matching. VLDB, 2006.
[10] X. Chai, M. Sayyadian, A. Doan, A. Rosenthal, andL. Seligman. Analyzing and Revising Data IntegrationSchemas to improve their Matchability. VLDB, 2008.
[11] W. Cohen. Integration of Heterogeneous Databaseswithout Common Domains using Queries based onTextual Similarity. SIGMOD Record, 1998.
[12] A. Doan, P. Domingos, and A. Halevy. ReconcilingSchemas of Disparate Data Sources: AMachine-Learning Approach. SIGMOD Record, 2001.
[13] A. Doan and A. Halevy. Semantic IntegrationResearch in the Database Community: A BriefSurvey. AI Magazine, 2005.
[14] A. Doan, J. Madhavan, P. Domingos, and A. Halevy.Ontology Matching: A Machine Learning Approach.Handbook on Ontologies in Information Systems, 2004.
[15] X. Dong, A. Halevy, and J. Madhavan. ReferenceReconciliation in Complex Information Spaces.SIGMOD, 2005.
[16] H. Elmeleegy, M. Ouzzani, and A. Elmagarmid.Usage-Based Schema Matching. ICDE, 2008.
[17] D. Engmann and S. Massmann. Instance matchingwith COMA++. In BTW Workshop, 2007.
[18] J. Euzenat and P. Shvaiko. Ontology Matching.Springer-Verlag, 2007.
[19] B. He and K. Chang. Statistical Schema Integrationacross the Deep Web. SIGMOD, 2003.
[20] J. Hong, H. Zhongtian, and D. Bell. An EvidentialApproach to Query Interface Matching on the DeepWeb. VLDB, 2008.
[21] W. Hsieh, J. Madhavan, and R. Pike. Datamanagement projects at Google. SIGMOD, 2006.
[22] R. Khare and T. Celik. Microformats: a PragmaticPath to the Semantic Web. WWW, 2006.
[23] A. Klementiev, D. Roth, and K. Small. AnUnsupervised Learning Algorithm for RankAggregation. ECML, 2007.
[24] M. Lenzerini. Data Integration: a TheoreticalPerspective. PODS, 2002.
[25] J. Madhavan, P. Bernstein, A. Doan, and A. Halevy.Corpus-based schema matching. In ICDE, 2005.
[26] J. Madhavan, S. Jeffery, S. Cohen, X. Dong, D. Ko,C. Yu, and A. Halevy. Web-scale Data Integration:You can only afford to Pay As You Go. CIDR, 2007.
[27] R. McCann, W. Shen, and A. Doan. MatchingSchemas in Online Communities: A Web 2.0Approach. Proceedings of ICDE, 2008.
[28] S. Melnik, H. Garcia-Molina, and E. Rahm. SimilarityFlooding: A Versatile Graph Matching Algorithm andits Application to Schema Matching. ICDE, 2002.
[29] P. Mika. Microsearch: An Interface for SemanticSearch. Semantic Search, 2008.
[30] P. Mork, A. Rosenthal, L. Seligman, J. Korb, andK. Samuel. Integration Workbench: IntegratingSchema Integration Tools. Workshop on DatabaseInteroperability at ICDE, 2006.
[31] N. Noy. Semantic Integration: A Survey ofOntology-based Approaches. SIGMOD Record, 2004.
[32] E. Rahm and P. Bernstein. A Survey of Approaches toAutomatic Schema Matching. VLDB Journal, 2001.
[33] Y. Rubner, C. Tomasi, and L. Guibas. The EarthMover’s Distance as a Metric for Image Retrieval.International Journal of Computer Vision, 2000.
[34] M. Sayyadian, Y. Lee, A. Doan, and A. Rosenthal.Tuning Schema matching Software using SyntheticScenarios. VLDB, 2005.
[35] M. Sayyadian, H. LeKhac, A. Doan, and L. Gravano.Efficient Keyword Search across HeterogeneousRelational Databases. ICDE, 2007.
[36] P. Shvaiko and J. Euzenat. A Survey of Schema-BasedMatching Approaches. LNCS, 2005.
[37] K. Smith, P. Mork, L. Seligman, A. Rosenthal,M. Morse, D. Allen, and M. Li. The Role of SchemaMetching in Large Enterprises. CIDR, 2009.
[38] M. Stonebraker and J. Hellerstein. ContentIntegration for e-business. SIGMOD, 2001.
[39] B. Tan and F. Peng. Unsupervised querysegmentation using generative language models andwikipedia. WWW, 2008.
[40] S. Weibel, J. Kunze, C. Lagoze, and M. Wolf. DublinCore Metadata for Resource Discovery. InternetEngineering Task Force RFC, 1998.
[41] J. Wen, J. Nie, and H. Zhang. Query clustering usinguser logs. ACM TOIS, 2002.
Related Documents