Halton Retail Study June 2017

Welcome message from author
This document is posted to help you gain knowledge. Please leave a comment to let me know what you think about it! Share it to your friends and learn new things together.
Transcript

Halton Retail Study
June 2017

1
CONTENTS
1. INTRODUCTION & BACKGROUND Page 3
2. RETAIL TRENDS & IMPLICATIONS FOR HALTON Page 5
3. RETAIL POLICY CONTEXT Page 17
4. OVERVIEW OF CENTRES IN HALTON Page 21
5. SUMMARY OF HEALTH CHECKS & TOWN CENTRE SURVEYS Page 26
6. RETAIL CAPACITY ANALYSIS Page 42
7. RETAIL STRATEGY Page 64
8. CONCLUSIONS Page 77
APPENDICES (IN SEPARATE VOLUME) Appendix 1 Study Area Appendix 2 Town Centre Benchmarking Reports Appendix 3 Household Survey Appendix 4 Expenditure Flows (Convenience Goods) Appendix 5 Expenditure Flows (Non-Bulky Comparison Goods) Appendix 6 Expenditure Flows (Bulky Comparison Goods) Appendix 7 Population & Expenditure Forecasts Appendix 8 Capacity Analysis (Convenience Goods) Appendix 9 Capacity Analysis (Bulky Comparison Goods) Appendix 10 Capacity Analysis (Non-Bulky Comparison Goods)
LIST OF FIGURES Figure 4.1 Widnes in a Sub-Regional Context Figure 6.1 Study Area & Postcode Sectors Figure 7.1 Widnes Town Centre Boundary (Halton Core Strategy 2013) Figure 7.2 Suggested Widnes Town Centre Boundaries Figure 7.3 Halton Lea Town Centre Boundary (Halton Core Strategy 2013) Figure 7.4 Suggested Halton Lea Town Centre Boundaries Figure 7.5 Runcorn Old Town Centre Boundary (Halton Core Strategy 2013) Figure 7.6 Suggested Runcorn Old Town Centre Boundaries

2
LIST OF TABLES Table 3.1 Halton Core Strategy Policy CS5 (extract) – Retail Centre Hierarchy Table 3.2 Halton Core Strategy Policy CS5 (extract) – Future Retail Capacity (informed by
Halton Retail Study 2009) Table 5.1 Widnes Town Centre Diversity of Uses Table 5.2 Halton Lea Town Centre Diversity of Uses Table 5.3 Runcorn Old Town Diversity of Uses Table 6.1 All Convenience Goods Market Share Summary (excluding non-store sales) Table 6.2 Non-Bulky Comparison Goods Market Share Summary Table 6.3 Bulky Goods Market Shares Table 6.4 Population Forecasts Table 6.5 Expenditure Per Person Table 6.6 Total Convenience & Comparison Goods Expenditure 2014 (excluding SFT) Table 6.7 Growth in Sales Volumes (Retail Spend) Per Head Table 6.8 Expenditure Forecasts Table 6.9 Residual Retail Capacity (Convenience Goods): Widnes Town Centre Table 6.10 Residual Retail Capacity (Bulky Goods): Widnes Town Centre Table 6.11 Residual Retail Capacity (Non-Bulky Comparison Goods): Widnes Town Centre Table 6.12 Residual Retail Capacity (Convenience Goods): Halton Lea & Runcorn Old Town Table 6.13 Market Shares (Comparison Goods): Halton Lea & Runcorn Old Town Table 6.14 Residual Retail Capacity (Bulky Goods): Halton Lea & Runcorn Old Town Table 6.15 Residual Retail Capacity (Comparison Goods): Halton Lea & Runcorn Old Town
SUMMARY REFERENCE INFORMATION Prices 2014 Prices Household Survey Date February 2016 Experian Retail Planner Briefing Experian Retail Planner Briefing Note 13 (October 2015)
REVISION RECORD
Rev Description Date Author Checked Approved
0 Draft 19/05/16 GJS JRE
1 Revised Draft 21/03/17 GJS JRE JRE
2 Further Rev 08/05/17 GJS JRE JRE
3 Final 09/06/17 GJS JRE JRE

3
1. INTRODUCTION & BACKGROUND
1.1 ELG Planning has been commissioned by Halton Borough Council to undertake the Halton Retail
Study 2016. The purpose of the study is to form part of the evidence base for the emerging Halton
Local Plan, specifically helping to inform a broad strategy to support the vitality and viability of the
Borough’s three main town centres. The Retail Study will deliver the following key outputs:
i. A review of current national and regional trends in retailing and retail development and
the implications this has for Halton, including the impact of special forms of trading.
ii. A section on the current planning policy context.
iii. Health check audits of Halton’s three principal centres (Halton Lea, Runcorn Old Town
and Widnes).
iv. Analysis of on-street visitor surveys and business surveys undertaken within each of the
three principal centres.
v. Assessment of the respective roles of Halton Lea, Runcorn Old Town and Widnes.
vi. A retail capacity forecast section which clearly sets out the methodology used and the
results of the retail capacity forecasts, with focus on the three principal centres. These
forecasts will inform an overall assessment of the quantitative need for new retail
development in Halton.
vii. The quantitative forecasting of future floorspace need will be broken down to five yearly
intervals to 2037.
viii. Qualitative deficiencies in existing provision will be identified and advice provided on how
these deficiencies could be addressed.
ix. An assessment of the future position of the three principal centres within the hierarchy
established in Policy CS5 of the Core Strategy and recommendations on an appropriate
mix of uses for each of the centres that would enhance their overall vitality and viability.
x. An assessment of the potential of each of the principal centres to accommodate the
identified need for new development, including an assessment of the most sequentially

4
appropriate locations and recommendations on amendments to town centre boundaries
and shopping frontages.
xi. Evidence and advice on setting a local threshold for impact assessment.
xii. A section bringing together the main findings of the study and the retail strategy for the
main centres.

5
2. RETAIL TRENDS & IMPLICATIONS FOR HALTON
2.1 It is important that any future strategy for retail provision across Halton is formulated in the
context of the wider economic climate. This section of the study therefore seeks to consider recent
economic conditions and the near to long-term outlook, as well as recent trends in the retail sector
before giving consideration to the implications of these trends and forecasts for Halton Borough
over the plan period.
Economic Outlook
2.2 The Experian Retail Planner Briefing Note 13 (October 2015) identifies that strong UK recovery
from a lengthy period of negative or weak growth began in early 2013. The upturn has gathered
momentum with GDP growth of 2.9% in 2014 but expected to fall slightly to 2.5% in 2015. It is
anticipated that the UK economic upturn will continue in the short term, albeit at a slower rate than
in 2014 and 2015 as a result of continued pressure on government finances, tightening monetary
policy and weak exports as the key eurozone market languishes. Experian forecast that GDP
growth will ease to 2.3% in both 2016 and 2017 with less buoyant consumer spending and
decelerating retail sales volumes. However, steadily rising real disposable incomes will underpin
sales volumes growth at 2.9% in 2016 and 2.6% in 2017.
2.3 Experian forecast that economic growth will average 2.4% per annum in the medium term (2017-
2021), with the legacy of the economic crisis in 2008 continuing to weigh on performance,
although the strength of the recovery in recent years and associated improvement in household
finances has helped to offset this. Consumer spending growth is forecast to average 2.3% a year in
the period 2017-2021, with retail sales growth averaging 2.6% per annum.
2.4 In the longer term, Experian forecast that the economy is unlikely to improve on the medium-term
forecast of 2.4% per annum. In the period 2023-2035, it is anticipated that GDP growth will

6
average 2.3%, with annual average growth in 2016 to 2035 of 2.3%, which is broadly in line with the
UK’s long term trend growth rate in the three decades to 2013.
Retail Expenditure & Sales Efficiency Forecasts
2.5 UK retail expenditure per head (including non-store) increased at an annual average rate of 5.1%
between 1997 and 2007. Expenditure per head on comparison goods grew by 8.0% per annum in
this period, however, convenience goods expenditure contracted by 0.3% per annum over the same
period. UK spending per head declined by 0.4% per annum between 2008-2011 primarily due to
the onset of the global economic crisis, however, there was a return to positive expenditure growth
in the period 2012-2014 (2.1% per annum).
2.6 The Experian Retail Planner Briefing Note 13 suggests that sales density growth rate in
comparison goods is likely to be close to 2.0% per annum over the next two decades, although the
scope for sales density increases in convenience goods is very limited.
Internet & Multi-Channel Retailing
2.7 There has been a significant increase in the popularity of internet shopping since 2008 with the
majority of retailers now having an on-line presence. The growth in on-line retailing has lifted the
share of special forms of trading (SFT) to a level where it now accounts for over a tenth of total
retail sales. Experian data shows that the value of internet sales in 2015 is estimated at £42.1bn
at current prices, with the internet share of total retail sales standing at 11.7% in mid-2015
compared with just 4.7% in June 2008.
2.8 Experian forecast that non-store retailing will continue to grow rapidly and will continue to outpace
traditional forms of spending. There were however estimated to be 57.3 million internet users in
the UK in mid-2014 and, accordingly, growth in the internet user base will be less of a driver than

7
over the course of the last decade. However, growth momentum will be sustained by changes in
technology such as tablet / mobile devices and interactive TV shopping, as well as improved
delivery options.
2.9 It is anticipated that click and collect will be one of the key drivers of growth with drive thru’ pick-
up sites, lockers and existing stores rising in importance as locations for the receipt or return of
products ordered on-line. ‘The Multichannel High Street: Winning the Retail Battle in 2015’ report
prepared in partnership with the Retail Trust and British Retail Consortium identifies that
approximately 60% of retailers surveyed as part of the study already offered click and collect with
many others intending to launch the service in 2015. For example, ASDA had in excess of 600 click
and collect locations at the end of 2014, including existing supermarkets, petrol station forecourts,
tube stations and business park sites.
2.10 However, a network of stores will remain a key component of retailer’s strategies as part of a
wider multi-channel offer, providing a showroom setting and showroom experience.
2.11 Experian forecast that SFT market share will continue to grow, although the pace of e-commerce
growth will moderate markedly after 2020. The majority of internet shopping on convenience
goods will be in the form of goods bought from stores and the proportion of non-retail sales in
convenience goods outside stores is forecast to increase from 2.8% in 2015 to 5.0% in 2025.
Excluding non-store sales from within stores, the proportion of non-store retail sales in
comparison goods is forecast to increase from 11.7% in 2015 to 15.0% in 2025.
Food Retailing
2.12 The ‘Big Four’ supermarkets continue to dominate the food retail sector and Tesco remain the UK’s
largest food and grocery retailer with 28.4% of the market, followed by Sainsburys (16.8%), ASDA
(16.2%) and Morrisons (10.6%). However, the ‘Big Four’ retailers have all experienced difficult

8
trading conditions in the last few years with their collective market share having fallen from 75.7%
in June 2013 to 71.1% in January 2017.
2.13 The difficulties faced by the leading food retailers reflect the fact that there is over capacity in the
market with Tesco, Sainsburys and Morrisons having expanded their floorspace by more than the
growth of UK grocery sales. In view of weak growth in convenience goods expenditure, changing
UK demographics, increasing online sales and a growing emphasis amongst consumers on price
and value for money in convenience goods, the leading grocery retailers have, on the whole, cut
back their plans for new investment.
2.14 Tesco announced in 2015 that they would no longer be going forward with 49 planned UK stores,
as well as the closure of 43 unprofitable stores, including Tesco Metro in Runcorn. They have also
recently announced that 76 stores across the country will no longer operate for 24 hours and the
adoption of a simple pricing strategy in the face on continued competition from discount retailers.
2.15 Sainsburys are continuing to focus heavily upon their convenience store format (Sainsburys Local)
and also announced plans in April 2015 to convert existing food retail floorspace equating to
approximately 6% of their property portfolio to sell non-food items, including own brand items and
subletting floorspace within existing stores to other retailers to operate concessions, including
Argos and Jessops. Sainsburys entered into a joint venture with Danish retailer Dansk
Supermarked Group in 2014 to reintroduce the Netto discount brand into the UK market. However,
this venture was abandoned in Summer 2016 to enable Sainsburys to focus on their core business
and acquisition of the Home Retail Group.
2.16 ASDA conversely announced ambitious plans in February 2015 to invest £600m in opening a
number of new stores, primarily across London and the south east, as well as refurbishing existing
stock and to provide 1,000 click and collect locations across the UK by 2018. However, they
subsequently announced in late-2015 that they would slow down previous plans for new stores in

9
London and the creation of additional click and collect sites and would instead prioritise the
refurbishment of 95 of its larger stores.
2.17 Morrisons’ main focus in recent years has been on the convenience market through the
development of its M Local format stores. However, Morrisons pulled out of the convenience store
sector in 2015 following the sale of 140 M Local stores and it is understood that the company will
now focus investment upon its existing portfolio of stores. The store in Upton Rocks, Widnes was
initially reoccupied by an independent trader who subsequently closed with the unit being taken by
the Co-Op.
2.18 Whilst the ‘Big Four’ have experienced difficult trading conditions in recent years, the German
owned discount food retailers, Aldi and Lidl, have increased their collective market share from 6.6%
in June 2013 to 10.7% in January 2017. Aldi have recently overtaken Co-Op to become the UK’s
fifth biggest supermarket. Aldi and Lidl’s specific business models enable them to offer high
quality food items at low prices and both firms have recently outlined ambitious store opening
plans across the Country that will potentially further increase pressure on the ‘Big Four’ retailers.
Aldi have recently announced plans to open a further 80 stores across the UK in 2016 taking their
total portfolio to over 700 outlets. Lidl are also looking to open 40-50 stores per annum across the
UK over the course of the next three years, as well as refurbishing up to 150 existing sites with its
‘Lidl of the Future’ (LOF) concept.
2.19 The changing habits of consumers with a move away from large weekly shops to more frequent
‘basket’ shopping trips has also led to many of the main retailers investing in smaller format C-
stores such as Tesco Express, Sainsburys Local and Little Waitrose.

10
Polarisation of Comparison Goods Shopping
2.20 There have been fundamental changes in the retail sector in recent years, influenced heavily by the
global economic crisis and the growth in on-line retailing. These changes have led to changing
shopping habits amongst consumers with knock-on implications on the space requirements of
individual retailers. There is no longer a need for retailers to be represented in every town in order
to achieve national coverage and retailers are increasingly focusing investment on flagship stores
in prime locations, supplemented by smaller satellite stores and an on-line offer. The prime sub-
regional towns and cities are continuing to attract key retailers, however, the middle ground towns
are being squeezed and are potentially struggling to attract investment — often leaking trade to
the more dominant centres and having lost a number of multiples and anchor units during the
recession. The strong, more dominant centres are getting stronger and the polarisation of retail
between large destination malls / centres and secondary High Streets is increasing. Local and
neighbourhood centres are less affected; offering convenience, day-to-day needs and top-up
shopping.
Discount Non-Food Shopping
2.21 Discount retailers, in general merchandise as well as food, are taking sales from the leading
supermarkets and from comparison goods retailers such as Marks & Spencer. The comparison
goods market has become more competitive, in the same way as convenience goods, as
consumers look for the best offers. Although there remains a strong market for high value
comparison goods, the market for lower-priced comparison goods shopping has grown during the
recession and is expected to continue performing strongly.
2.22 In clothes shopping, Primark has expanded rapidly in the last decade. Other retailers have
benefitted from the trend towards best value in non-food shopping, as consumers seek value for
money in a competitive market. B&M Stores has been one of the fastest growing businesses in

11
this market. Poundland has also gained in popularity in the discount field as more shoppers look
for value products. Wilkinsons (now Wilko) has made recent growth by concentrating on
household products, including home-brand items. These trends suggest that there will be further
polarisation of comparison goods shopping in the future between different types of centres, with
the secondary centres concentrating more on lower value comparison goods. Discount non-food
shopping is likely to be a strong feature in the survival of smaller town centres.
Retail Parks
2.23 Retail parks were developed to provide an opportunity for retailers selling ‘bulky goods’ to locate
outside town centres where development costs are lower. Traditionally retail parks were
dominated by retailers of white goods, furniture and DIY items. However, in recent years, there
has been a trend towards ‘town centre’ retailers such as Boots, Next and Marks & Spencer locating
on retail parks where planning controls have been less restrictive. Out-of-town retailing remains
popular with national retailers where they can comply with planning restrictions on the range of
goods sold. An increasing amount of floorspace in retail parks is being used by leisure operators.
The changing character of many retail parks towards non-bulky goods has been accompanied by
an improvement of leisure provision such as restaurants, cinemas and health & fitness.
2.24 The fastest-growing retail park tenants since 2012 in terms of floorspace are Wren Living,
Poundland, B&M, Home Bargains, Smyths Toys, Poundstretcher, The Range, Dunelm, Pets at
Home and TK Maxx. Few of these are bulky goods retailers. The recession has led to the closure of
several well-known bulky goods retailers. The DIY market is dominated by B&Q, the largest home
improvement and garden centre retailer in Europe, but it is actively seeking to reduce the
floorspace in its stores by 20%, including the closure of its Widnes outlet. Focus, previously one of
the largest DIY store operators, went into administration in 2011. Home Retail Group plans to cut
the number of its Homebase stores by 25% by 2019, including its Runcorn store, following a review

12
of the chain. Many of its stores are reported to be unprofitable or in decline. In electrical goods,
Comet ceased trading in 2012.
Independent Shops
2.25 Specialist independent shops are the traditional anchors of many High Streets, particularly in the
more affluent towns and tourist destinations. The presence of independent shops can be a key
factor in the attractiveness of a centre, contrasting higher quality centres with the ‘Clone Towns’
that have been widely criticised. Some towns have a well-established base of independent shops.
In other towns, the departure of national multiples is creating an opportunity for independent
retailers to occupy the available space.
2.26 Markets represent a special form of independent retailing. Street markets can be a distinctive
selling point for a town, helping provide footfall that benefits other businesses. Consumers are
becoming more concerned about where food is sourced from and how it is produced. This has led
to an increase in popularity of specialist food outlets such as farm shops, bakers and delis.
The Future of Town Centres
2.27 In 2000, 49% of retail spending took place on the High Street. This fell to 42% in 2009 and
was expected to fall further to 40% in 2014. The traditional model of the High Street was a place
where people visited to shop. Retailing is an important element of a thriving town centre, but it is
no longer sufficient. Town centres of the future will have to adapt to perform different roles.
2.28 While planning policies have slowed down the growth of out-of-centre retailing, there continues to
be a trend in retail parks away from bulky goods retailing to the provision of ‘town centre’ goods
such as fashion and homewares. Continuation of this trend will further challenge the future vitality
of many High Streets.

13
2.29 Town centres need to move beyond retail and be vibrant places that people want to visit, including
for leisure and recreation, local independent shops, culture, entertainment, business, community
uses and public space, as well as their traditional shopping role. Centres will need to constantly
evolve to remain economically vibrant. They need to offer something different from out-of-centre
stores. Even successful centres where new investment will be concentrated will tend to have a
greater element of leisure uses. The smaller, less successful centres will have to develop a role
which fits their position in the retail and service hierarchy. Some will inevitably decline in attraction
and their retail role will contract, with a change from retail to other uses. This could be an
opportunity for different uses to locate around a smaller retail and commercial core.
Implications for Halton
2.30 The trends in the retail sector highlighted within this section of the study will have clear
implications for the future of the main town centres across Halton.
2.31 Halton is located in close proximity to a number of key regional and sub-regional shopping centres,
including Liverpool, Warrington and Chester and the main centres within the Borough will be
affected by increased focus of major retailers towards prime locations. It is therefore considered
that Halton Lea and, to a lesser extent, Widnes will generally struggle to attract the key national
multiple retailers who could help drive a marked change in the performance of the individual
centres. Moreover, in view of the socio-economic characteristics of the Borough with expenditure
per person within Zone 1 (Widnes) and Zone 3 (Runcorn) of the Study Area in both convenience and
comparison goods below the UK average, it is considered that the main focus of investment within
the Borough in the short to medium term will be from value and discount non-food retailers.
2.32 Runcorn Old Town is a compact centre with the majority of retail units concentrated on Church
Street and Regent Street. The existing offer is predominantly comprised of independent retailers
and businesses, although there are a limited number of national multiple retailers present,

14
including Co-Operative Food, Iceland, Savers and Card Factory. The size and composition of the
centre means that Runcorn Old Town serves a relatively localised catchment and the centre is
unlikely to attract further representation from national multiple retailers. In this context, it is
considered that any future strategy for the centre should be focused on developing and supporting
a vibrant independent offer within the centre reflective of Runcorn Old Town’s localised role and
function.
2.33 The Big Four grocery retailers have, on the whole, cut back their plans for new investment in recent
times and, accordingly, we would not expect proposals to come forward for large-format
supermarket developments across the Borough in the short to medium term, particularly as the
Big Four are already represented within Widnes and / or Halton Lea with the exception of
Sainsburys. We would therefore expect any investment from the Big Four grocery retailers to be
focused on convenience store formats (e.g. Tesco Express, Sainsburys Local), although it is noted
that the Tesco Metro store in Halton Lea has recently closed having been identified by Tesco as
one of 43 unprofitable stores across the country. Aldi and Lidl have announced ambitious
expansion plans to build on their success over recent years in increasing their collective market
shares and it is understood that they are actively looking for further opportunities for new store
openings within Halton Borough.
2.34 Retail parks were traditionally dominated by retailers of white goods, furniture and DIY items.
However, in recent years, there has been a trend towards ‘town centre’ retailers such as Boots,
Next and Marks & Spencer locating on retail parks where planning controls have been less
restrictive. It is noted that there have been recent high profile closures on retail parks across the
Borough, most notably the large B&Q store on Widnes Waterfront. In view of the recent identified
trend towards ‘town centre’ retailers occupying space within retail parks, there may be pressure
from owners of existing retail parks within the Borough, particularly those that have experienced
recent closures, for remodeling of units and a relaxation of planning controls to broaden the range
of goods that can be sold in order to attract new tenants.

15
2.35 It is considered that any physical expansion of the retail offer within the centres should be
balanced with the development of a strategy that encourages residents to visit centres within the
Borough over higher order centres in the wider area. It is evident that such an approach will need
to promote the distinctiveness of the main centres to distinguish them from higher order centres,
which could include the promotion of a strong local independent offer and regular cultural /
entertainment events to provide an ‘experience’ and encourage people to visit and dwell within the
centres. It is clear that such an approach will need to be actively marketed across a range of
platforms to ensure that residents and visitors are aware of local events and the offer of retailers
within each centre, as outlined in further detail below.
2.36 Planning policies relating to town centres should also provide sufficient flexibility to enable the
individual centres to evolve and adapt to market trends, including an increased focus towards retail
service and leisure uses. The recent changes to permitted development rights are also likely to
impact on the character of centres, with the temporary permitted change of use provisions
providing an opportunity to secure short term re-occupation and ‘pop-up shop’ type uses that can
reduce vacancy rates, as well as help to increase footfall and activity within individual centres.
2.37 The internet and multi-channel retailing will continue to play a fundamental role in the retail sector
and will continue to provide challenges to retailers within town centres. However, it is important
that centres within Halton seek to embrace digital technologies and opportunities presented by
multi-channel retailing, including the development of a strategy to support the role of digital
technologies in enhancing the town centre consumer experience, incorporating the provision of the
necessary infrastructure to support digital engagement, including, for example, offering support to
the integration of ‘click and collect’ hubs within town centres.
2.38 Moreover, it is considered that the LPA could work alongside other town centre stakeholders to
look into the potential of providing free public WiFi in the main centres across the Borough. The
availability of free WiFi will help residents and visitors to the centres connect with each other and
stay in touch with local events and also provides advantages for businesses by providing a

16
platform to enable businesses to market their business, engage with customers using social
media, share discounts and offers and find out more about the type of consumers using the town
centres. In addition, websites could be developed for each town centre providing business listings,
profiles of existing businesses including links for loyalty schemes for independent businesses,
events programmes, maps and transport / parking information. The town centre websites can also
be used as a tool to develop contact databases enabling customers to sign up to regular
newsletters, social media feeds and to enter competitions and examples of towns elsewhere in the
country with dedicated town centre websites include Rotherham
(www.rotherhamtowncentre.co.uk), Kirkby (www.kirkbytowncentre.com) and Worthing
(www.worthingtowncentre.co.uk).
2.39 The LPA could also look into providing support to local independent businesses both collectively
and individually to develop their digital presence thereby helping them to reach out to a wider
customer base. This could include providing support to help individual businesses to develop and
maintain websites and social media accounts, as well as supporting collective schemes including
the development of a digital loyalty system for independent businesses within each centre. This
would enable loyalty points to be delivered to customers by SMS / text, email or an app and will
also allow retailers to send messages and promotions to customers to increase sales.
2.40 Other measures could include the development of a local currency similar to those that have been
developed in Bristol, Brixton, Cardiff, Cornwall, Exeter, Kingston, Lewes, Liverpool, Plymouth,
Stroud and Worcester. The system tends to operate in both note and electronic format and allows
people to exchange sterling for the local currency, which can then be spent in participating
businesses or between businesses. The system is intended to encourage people to spend money
in local businesses and keep money circulating between independent businesses. It is clear that
such a scheme has potential to support the town centres across Halton given the identified trend
of secondary towns struggling to attract investment from key national multiples, which means that
centes across Halton will need to develop and maintain a strong local independent offer to
distinguish themselves from nearby higher order centres.

17
3. RETAIL POLICY CONTEXT
National Policy
3.1 The NPPF was published in March 2012 and sets out the Government’s planning policies for
England and how these should be applied. The presumption in favour of sustainable development
is at the heart of the NPPF and should be seen as a golden thread running through both plan-
making and decision-taking.
3.2 A key objective of the NPPF is to ensure the vitality of town centres and it indicates that planning
policies should be positive, promote competitive town centre environments and set out policies for
the management and growth of centres over the plan period. In drawing up Local Plans, the NPPF
advises that LPAs should:
Recognise town centres as the heart of their communities and pursue policies to support
their viability and vitality;
Define a network and hierarchy of centres that is resilient to anticipated future economic
changes;
Define the extent of town centres and primary shopping areas, based on a clear definition
of primary and secondary frontages in designated centres, and set policies that make clear
which uses will be permitted in such locations;
Promote competitive town centres that provide customer choice and a diverse retail offer
and reflect the individuality of town centres;
Retain and enhance existing markets and, where appropriate, reintroduce or create new
ones, ensuring that markets remain attractive and competitive;
Allocate a range of suitable sites to meet the scale and type of retail, leisure, commercial,
office, tourism, cultural, community and residential development needed in town centres.
It is important that needs for retail leisure, office and other main town centre uses are met

18
in full and are not compromised by limited site availability. LPAs should therefore
undertake an assessment of the need to expand town centres to ensure a sufficient
supply of suitable sites;
Allocate appropriate edge of centre sites for main town centre uses that are well
connected to the town centre where suitable and viable town centre sites are not available.
If sufficient edge of centre sites cannot be identified, set policies for meeting the identified
needs in other accessible locations that are well-connected to the town centre;
Set policies for the consideration of proposals for main town centre uses which cannot be
accommodated in or adjacent to town centres;
Recognise that residential development can play an important role in ensuring the vitality
of centres and set out policies to encourage residential development on appropriate sites;
and
Where town centres are in decline, LPAs should plan positively for their future to
encourage economic activity.
Local Policy Context
Halton Core Strategy Local Plan (April 2013)
3.3 The Halton Core Strategy was adopted in April 2013 and provides the overarching strategy for
future development in the Borough.
3.4 The Core Strategy defines the three main retail centres within the Borough with Widnes being the
largest, followed by Halton Lea and then Runcorn Old Town. Widnes has a strong convenience and
comparison offer, which has been substantially improved following the opening of the Widnes
Shopping Park in 2010. The Core Strategy notes that the development of a new town centre at
Halton Lea in the New Town era has been a contributory factor to the decline of Runcorn Old Town,
which has struggled to maintain its position as a key retail centre in the Borough. The Old Town

19
has however been subject to a number of regeneration projects in recent years consolidating its
role as an independent and specialist destination. The Core Strategy recognises that Halton Lea
has suffered from a number of issues, including weak pedestrian access, high vacancy rates and
the lack of an evening economy, although the complimentary leisure facilities at Trident Retail Park
have improved its offer substantially.
3.5 The Core Strategy sets out a number of challenges that must be addressed in order to ensure
Halton fulfils its future vision to 2028, including a need to maintain and enhance the retail and
leisure offer of Widnes Town Centre, Halton Lea and Runcorn Old Town.
3.6 Policy CS5 of the adopted Core Strategy sets out the following hierarchy of centres that will be
maintained and enhanced for retail and other main town centre uses:
Table 3.1: Halton Core Strategy Policy CS5 (extract) – Retail Centre Hierarchy
Designation Role & Function Centre(s) Town Centre A focus for new and enhanced retail and
other town centre activity within Halton Widnes Town Centre Halton Lea
District Centre A focus for convenience, local and niche comparison and service retail and leisure uses
Runcorn Old Town
Local Centres Focus for local convenience and service retail and complementary community facilities
Runcorn Ascot Avenue Beechwood Brook Vale Castlefields Greenway Road Halton Brook Halton Lodge Halton Road Halton Village Langdale Road Murdishaw Centre Palacefields Picton Avenue Preston Brook Russell Road Grangeway Windmill Hill
Widnes Alexander Drive Bechers Cronton Lane Ditchfield Road Farnworth Hale Bank Hale Road Halton View Road Liverpool Road Moorfield Road Queens Avenue Warrington Road West Bank Hale Ivy Court Farm

20
3.7 Policy CS5 also sets out floorspace thresholds governing the requirement for sequential and
impact assessments for retail and leisure proposals outside existing centres. The policy also
suggests that the Delivery & Allocations Local Plan will identify areas for future retail development
in line with the capacity identified in the Halton Retail & Leisure Study (2009), as follows:
Table 3.2: Halton Core Strategy Policy CS5 (extract) – Future Retail Capacity (informed by Halton Retail
Study 2009)
Convenience Goods Comparison Goods Retail Warehousing (Bulky
Goods)
Widnes Town Centre Up to about
1,300 sq.m (gross)
Up to about
24,000 sq.m (gross)
Up to about
19,000 sq.m (gross)
Halton Lea Town
Centre
Up to about 1,000 sq.m
(gross) (post 2016)
Up to about
4,400 sq.m (gross)
Up to about 3,000 sq.m
(gross) (post 2016)
Runcorn Old Town
District Centre
Up to about 3,000 sq.m
(gross)
Up to about
2,200 sq.m (gross)
-
3.8 These policies may be updated as part of the preparation of the Local Plan and in light of the
information provided in this document and the Local Centres Review completed in 2015.

21
4. OVERVIEW OF CENTRES IN HALTON BOROUGH
Overview of Halton Borough
4.1 Halton is a unitary authority in the North West of England, which comprises of the towns of
Widnes and Runcorn and a wide rural hinterland interspersed with a number of smaller
settlements, including Moore, Daresbury and Hale Village. A key characteristic of the Borough is its
position on the Mersey Estuary, which separates the principal towns of Widnes and Runcorn. Work
is currently underway on the Mersey Gateway Project, which will provide a new six-lane toll1 bridge
across the River Mersey providing a new link between Runcorn and Widnes, as well as a 9.2km
upgraded road network linking the bridge to the main motorway network. The Mersey Gateway
project is one of the largest infrastructure projects in the UK and is due to open in Autumn 2017, at
which point the existing Silver Jubilee Bridge will be closed for refurbishment.
4.2 Halton is located within the Liverpool City Region and lies to the east of Liverpool City, with the
Borough of St Helens to the north, Warrington to the east and rural north Cheshire lying to the
south. Widnes and Runcorn have only been administered as a single authority since local
government re-organisation in 1974 and by a unitary authority since 1998, with the former
historically forming part of Lancashire and the latter Cheshire.
Widnes Town Centre
4.3 Widnes lies to the north of the Mersey Estuary and developed rapidly in the latter half of the 19th
century with the growth of the chemical industry, influenced by a ready supply of water from the
River Mersey and a central location between areas of salt production in Cheshire and coal products
in Lancashire.
1 Free to registered Halton residents

22
4.4 The town centre originally developed to the north of the waterfront around Victoria Road / Victoria
Square before moving northwards towards its current focus around Albert Road. Widnes is a third
tier centre in the regional hierarchy behind the regional centres of Liverpool and Manchester and
the nearby sub-regional centres of St Helens, Warrington and Chester. The town centre broadly
comprises of the Green Oaks Centre, Albert Square and Widnes Shopping Park arranged around the
pedestrianised core of Albert Road / Widnes Road.
4.5 The pedestrianised shopping area around Albert Road / Widnes Road predominantly
accommodates small terraced units and, whilst some national multiples are represented within
this area (e.g. Greenwoods, Clarks), the majority of the units are occupied by independent traders.
The Albert Square Shopping Centre lies to the west of Albert Road and accommodates retailers
including Poundworld, Argos, Brighthouse, Bon Marche, Iceland and Savers.
Figure 4.1 – Widnes in the Sub-Regional Context (Crown copyright and database rights 2017 Ordnance Survey 100018552)

23
4.6 The Green Oaks Centre is an enclosed shopping centre, which accommodates a number of national
multiple retailers, including Peacocks, Argos and TJ Hughes, as well as a Morrisons supermarket,
which faces onto the main town centre car park. Widnes Market Hall lies to the north of the Green
Oaks Centre and is open five days per week between 09.00 and 17.00 (closed Tuesdays and
Sundays). An outdoor market also takes place between 09.00 and 15.00 on Monday, Thursday,
Friday and Saturday with a flea market taking place on Wednesdays.
4.7 The completion of the Widnes Shopping Park in 2010 has helped to address a quantitative and
qualitative deficiency in comparison goods floorspace providing larger retail floorplates in the town
centre, with occupiers including M&S, Boots, River Island, New Look and Next.
4.8 Widnes Town Centre has a particularly strong convenience goods offer comprising of large format
ASDA, Morrisons and Tesco Extra foodstores supplemented by Aldi, Iceland, M&S and a number of
independent convenience goods outlets.
4.9 The south western part of the town centre accommodates a range of office and civic uses flanking
Kingsway, including Riverside College, Kingsway Leisure Centre, Widnes Library and the Halton
Borough Council offices.
Halton Lea Town Centre
4.10 Runcorn was designated as a New Town in 1964 to cater for population overspill from Liverpool
and to re-house residents from Liverpool and North Merseyside’s unfit dwellings. This led to a
significant urban expansion of the original settlement of Runcorn and the New Town comprises a
number of distinct neighbourhoods linked by a busway system and the Expressway, which was
intended to form a unique ‘figure of eight’ around the town. At the intersection of the ‘figure of eight’
lies Halton Lea town centre. The shopping mall part of the centre was originally named ‘Shopping
City,’ before being rebranded as ’Halton Lea’ and more recently as ‘Runcorn Shopping Centre,’

24
although it is understood that it will revert back to ‘Shopping City’ shortly as part of the wider
qualitative improvements to the centre. The centre first opened in the 1970s and was one of the
first American-style shopping malls in the UK.
4.11 The main shopping mall accommodates a range of floorplate configurations and is home to a
number of national multiple retailers, including Iceland, Wilko, Poundland, JD, Argos, New Look and
Burton. A Tesco Metro store within the shopping mall closed in April 2015, although this unit has
recently been re-occupied by The Range.
4.12 The Trident Retail Park lies to the south of the main mall building and comprises of a range of retail
warehouse units occupied by national multiple retailers, including TK Maxx, Aldi, Carpet Right and
Wynsors. There are also standalone ASDA and Lidl foodstores towards the western edge of the
town centre. The leisure offer within the centre includes a nine-screen Cineworld cinema, Club
2000 Bingo, Simply Gym and a number of fast food outlets, including KFC, McDonalds, Burger King,
Pizza Hut and Dominos.
4.13 The northern edge of the centre accommodates a range of community and civic facilities, including
Runcorn Police Station, Halton Direct Link and the Library. The defined town centre boundary also
includes an area to the eastern edge of the centre, which accommodates a range of former offices
buildings (East Lane House and Castle View House). The site in question previously benefitted
from planning approval for a foodstore, however, the scheme was never delivered and the site now
has prior approval for residential development.
Runcorn Old Town District Centre
4.14 The opening of the Bridgewater Canal in 1761 provided the stimulus of commercial and industrial
development in the area and was the catalyst for the modern growth of Runcorn and this was
furthered by the development of the mainline railway and the opening of the Manchester Ship

25
Canal in the 1800s. The 19th century saw Runcorn becoming increasingly industrialised with the
development of chemical industries along the banks of the River Mersey.
4.15 The District Centre is relatively compact and well-defined with retail and commercial uses
predominantly focused on High Street and Church Road, as well as Regent Street, which forms the
western boundary of the centre. High Street includes a diverse range of uses, including
predominantly independent retail units and service uses, including banks and estate agents. There
are also a number of restaurants, pubs and hot food takeaways located on High Street. Church
Street also includes a range of uses reflective of the secondary role of the centre, including retail,
service uses, public houses and hot food takeaways. The Brindley Theatre lies to the south eastern
edge of the centre and opened in September 2004. The theatre is owned by Halton Borough
Council and is the main centre for arts and entertainment within the Borough. A new Marston’s
public house (Ten Lock Flight) has recently opened on the former Crosville Depot site to the
southern edge of the town centre following the grant of planning permission in March 2016 (LPA
Ref. 15/00584/OUT).
4.16 The convenience goods offer within Runcorn is relatively limited, although includes Co-Operative
Food and Iceland stores located on Granville Street.

26
5. SUMMARY OF HEALTH CHECKS & TOWN CENTRE SURVEYS
5.1 The NPPF emphasises that LPAs should recognise town centres as the heart of their communities
and should pursue policies to support their vitality and viability. The vitality and viability of
individual centres is assessed through performing health checks. Planning Practice Guidance
confirms that the following indicators, and their changes over time, are relevant in assessing the
health of town centres:
Diversity of Uses;
Proportion of Vacant Street Level Property;
Commercial Yields on Non-Domestic Property;
Customers’ Views & Behaviour;
Retailer Representations and Intentions to Change Representation;
Commercial Rents;
Pedestrian Flows;
Accessibility;
Perception of Safety & Occurrence of Crime;
State of Town Centre Environmental Quality
5.2 The main centres within Halton have been assessed by People & Places Limited using their
established Benchmarking System, which captures data on 12 Key Performance Indicators (KPI),
including the indicators outlined in Planning Practice Guidance. The Benchmarking System is
divided into ‘Large Towns’ (more than 250 units) and ‘Small Towns’ (less than 250 units) and the
analysis provides data on each KPI for the benchmarked town individually and also in a regional,
national and, where possible, typology context. The 2016 Town Benchmarking Reports for
Widnes, Runcorn Old Town and Halton Lea undertaken by People & Places Limited are contained at
Appendix 2 with a summary outlined within this section of the study.

27
Town Centre User Surveys
5.3 The benchmarking approach adopted by People & Places Limited includes Town Centre User
Surveys to establish how each town is seen by those people who use it and those who do not.
People & Places Limited currently design, collect and analyse 20,000 – 25,000 Town Centre User
Surveys per annum utilising core Benchmarking questions covering:
Purpose of Visit;
Length of Stay;
Mode of Transport;
Customer Spend;
Positive Aspects of Town Centre;
Negative Aspects of Town Centre;
Visit Recommendation; and
Qualitative Suggestions for Improvement
5.4 A number additional questions were added to the core list following consultation with Officers at
Halton Borough Council. The People & Places Research Team have completed face to face
interviews in each centre in accordance with the Market Research Society Code of Conduct. In
addition, paper based surveys have been disseminated in strategic locations, including libraries and
cafés, throughout each town centre. An electronic version of the survey has also been produced
and, following liaison with Officers at Halton Borough Council, the link was disseminated on
relevant local websites and emailed to relevant distribution lists. The benefit of the online survey
is that responses can be gathered from those who no longer use the town centre, establishing
reasons for this and potential improvements needed to attract return visits. A total of 234 Town
Centre User Surveys were completed for Widnes, 311 for Halton Lea and 879 for Runcorn Old
Town.

28
Business Confidence Surveys
5.5 People & Places Limited have also conducted business confidence surveys within each centre to
establish the trading conditions of town centre businesses, enabling stakeholders to focus
regeneration efforts on building on existing strengths and identifying any specific issues. People &
Places currently conduct approximately 10,000 Business Surveys per annum using the following
core questions in the Benchmarking System:
Business Type;
Business Turnover over the last 12 months;
Profitability over the last 12 months;
Business Turnover over the next 12 months;
Positive aspects of operating a business in the town centre;
Negative aspects of operating a business in the town centre;
Qualitative suggestions for improving the town centre
5.6 People & Places, through a combination of face to face distribution and a postal system, have
delivered surveys to all businesses identified in each centre, with each of the surveys accompanied
by a covering letter, freepost envelope and a ‘Shopper Origins Survey,’ where businesses ask
customers to provide their postcodes at the point of sale.

29
Summary of Benchmarking Exercise
Widnes Town Centre
Diversity of Uses
5.7 The table contained below assesses the diversity of uses within Widnes Town Centre based upon
the survey undertaken by People & Places Limited as part of the benchmarking exercise:
Table 5.1 - Widnes Town Centre Diversity of Uses
Use No. of Units Percentage
Retail (Use Class A1) 146 46.2%
Financial & Professional Services (Use Class A2) 34 10.8%
Restaurants & Cafés (Use Class A3) 21 6.6%
Public Houses (Use Class A4) 7 2.2%
Hot Food Takeaways (Use Class A5) 16 5.1%
Other 54 17.1%
Vacant Units 38 12.0%
Total 316 100%
5.8 The proportion of retail units (Class A1) within Widnes Town Centre is above the national average
(40.8%) and the centre has a particularly strong convenience offer comprising of large format ASDA,
Morrisons and Tesco Extra foodstores supplemented by Aldi, Iceland, M&S and independents. The
proportion of comparison goods units within the centre is also above the national average and the
quantitative and qualitative offer was enhanced following the completion of the Widnes Shopping
Park in 2010, which accommodates a number of key national multiple retailers including M&S,
Boots, River Island, New Look and Next.

30
5.9 There is also a reasonable proportion of financial & professional services uses within Widnes Town
Centre, as well as restaurants, cafes and public houses.
Vacancies
5.10 Widnes Town Centre contains 38 vacant units, which represents 12.1% of the total number of
units. The vacancy rate is therefore slightly above the national average (11.3%), although it is
below the ‘North West Large Towns’ average outlined within the People & Places Benchmarking
Report.
Retailer Representation
5.11 KPI 3 of the Benchmarking Report gives consideration to retailer representation within the town
centre and identifies that the proportion of the ‘key attractors’ identified by Goad2 that are
represented within Widnes Town Centre (9%) is below the ‘National Large Towns’ average. The key
attractors represented within Widnes include M&S, River Island, Next, Boots and New Look. The
survey data confirms that 47% of the retail units within the town centre are national multiples with
43% of units occupied by independent retailers.
Pedestrian Flows
5.12 Footfall was measured at the following three locations within Widnes Town Centre:
Widnes Road (Bike Shop to Grenfell House);
Widnes Road (Derby Pub to Dorothy Perkins / Burtons); and
2 Experian Goad is a retail property intelligence system that provides retail location plans and reports covering over 3,000 shopping areas in the UK and Ireland. Goad reports provide a snapshot of the demographic composition of surveyed town centres. They provide a comprehensive breakdown of floorspace and outlet count for all individual trade types in the convenience, comparison, retail service, leisure, financial / business services and vacancy sectors.

31
Albert Road (Hallmark to Green Oaks Entrance).
5.13 Counts were undertaken on a Market Day (Wednesday), Non Market Day (Tuesday) and Saturday.
The data highlights that Albert Road (Hallmark to Green Oaks Entrance) is the busiest location in
Widnes Town Centre, recording the highest footfall figures across each of the three days with an
overall aggregate of 2,576, nearly double the Widnes Road (Derby Pub to Dorothy Perkins /
Burtons) location and approximately five times more than the Albert Road (Hallmark to Green Oaks
Entrance) location.
5.14 Footfall was lower in the town centre on the Saturday count than during the week in each of the
three locations. Overall, Market Day provided the highest aggregate footfall count with 1,573
persons, compared to 1,564 on Non-Market Day and dropping to 1,332 on Saturday.
Car Parking & Accessibility
5.15 The Town Centre Benchmarking Report provides details of the existing car parking provision within
Widnes Town Centre. The Study identifies that 99.6% of parking provision is found within
designated car parks with just over half the parking available for over 4 hours. In regards to
occupancy levels, the study identifies that 40% of all parking in the town was vacant during the
Market Day audit, 15% higher than the National Large Towns average and this figure increased to
46% on a Non Market Day. However, despite lower levels of footfall being recorded within the
town centre on Saturday, car park vacancy rates fell to 27%.
5.16 The main bus terminus is located in close proximity to the Green Oaks Centre and adjoining market
hall with a number of additional bus stops located on main routes throughout the town centre. The
town is well served by bus services to local destinations within Halton, as well as to Liverpool and
Warrington.

32
5.17 The main shopping area around Albert Road / Widnes Road is pedestrianised with legible
pedestrian routes linking into the Albert Square Shopping Centre to the west and Green Oaks and
the Widnes Shopping Park to the east.
Town Centre User Surveys
5.18 The Town Centre User Surveys found that 56% of respondents visited Widnes Town Centre for
convenience shopping, which is noticeably higher than the ‘National Large Towns’ average (22%) and
is reflective of the strong convenience offer of the town centre, which includes ASDA, Morrisons,
Tesco Extra, Iceland, M&S and Aldi, as well as a number of independent retailers. The respondents
to the survey visited Widnes Town Centre regularly, with 83% of respondents visiting the town at
least once a week with 69% of those visiting spending over £20 on a normal visit. The vast majority
of respondents (72%) travel to the town centre by car.
5.19 In terms of the positive aspects of Widnes Town Centre, ease of movement around the centre
(64%), car parking (63%), convenience (57%), access to services (39%), markets (36%) and the retail
offer (34%) were highlighted as the main positive elements of the town. The physical appearance
(61%) and cleanliness (52%) of the centre were highlighted as the principal negative aspects with
issues also identified with respect of public toilets, cultural activities / events and pubs / bars /
nightclubs.
5.20 Respondents were also asked why they don’t visit Widnes Town Centre, with the quality of the
retail offer being a prominent theme and an enhancement of the retail offer was viewed by
respondents as the main area of improvement for the town, including a reduction in the proportion
of charity and discount shops.

33
Business Confidence Surveys
5.21 A total of 21 Business Confidence Surveys were returned from businesses within Widnes Town
Centre, with over half of the respondents having been present in the town centre for over ten
years. 40% of the businesses surveyed indicated that their turnover has increased compared to
last year with 35% having seen a decrease. However, 45% of respondents had seen a decrease in
profitability with only 30% of respondents experiencing an increase in profitability.
5.22 In respect of the positive aspects of the town centre, 88% of business respondents highlighted car
parking, with potential local customers (65%) and transport links (53%) also being identified as
positive aspects. However, three quarters of respondents identified the vacancy rate and
proportion of charity shops as negative aspects of Widnes Town Centre, with the proportion of
takeaways (65%), competition from the Internet (55%), rental values / property costs (35%) and the
prosperity of the town (30%) also being highlighted as areas of concern.
5.23 The majority of respondents identified that their existing unit met their business needs, although
42% of respondents suggested that their footfall had decreased in comparison with the previous
year. In terms of improvements that could be made to improve the economic performance of the
town centre, a reduction in business rates emerged as a consistent theme amongst respondents.
Halton Lea Town Centre
5.24 The table contained below assesses the diversity of uses within Halton Lea Town Centre based
upon the survey undertaken by People & Places Limited as part of the benchmarking exercise:

34
Table 5.2 - Halton Lea Town Centre Diversity of Uses
Use No. of Units Percentage
Retail (Use Class A1) 52 43.7%
Financial & Professional Services (Use Class A2) 8 6.7%
Restaurants & Cafés (Use Class A3) 9 7.6%
Public Houses (Use Class A4) 0 0.0%
Hot Food Takeaways (Use Class A5) 1 0.8%
Other 30 25.2%
Vacant Units 19 16.0%
Total 119 100%
5.25 The proportion of retail units (Class A1) within Halton Town Centre is above the national average
(40.8%) and the centre has a relatively strong convenience offer comprising of a large format ASDA
superstore supplemented by Farmfoods, Iceland, Lidl, Aldi and independents. The proportion of
comparison goods outlets within the town centre is broadly comparable to the national small
centres average.
5.26 Halton Lea has a relatively limited representation of financial & professional services, as well as
leisure service uses, including cafés, restaurants and public houses. Halton Lea does however
accommodate a nine-screen cinema, gym and bingo hall.
Vacancies
5.27 There are a total of 19 vacant units within Halton Lea Town Centre, which equates to a vacancy
rate of 16.0% and is therefore higher than the current national average (11.3%).

35
Retailer Representation
5.28 The survey undertaken by People & Places Limited identifies that the proportion of the ‘key
attractors’ identified by Goad that are represented within Halton Lea Town Centre (16%) is higher
than both the ‘National Small Towns’ and ‘North West Small Towns’ averages. The key attractors
represented within Halton Lea include TK Maxx, Burton, Dorothy Perkins, New Look and Wilko. The
survey data confirms that 79% of the retail units within the town centre are national multiples with
the remaining units occupied by regional / independent retailers.
Pedestrian Flows
5.29 Halton Lea does not have a Market Day, and so footfall was instead counted on a Busy Day (Friday)
and a Quiet Day (Monday) with this approach having been agreed with Officers prior to the surveys
being undertaken. The counts were undertaken at the following locations:
Main Mall (Wilko’s, Santander and Greggs);
Walkway Southern Bridge (Asda to Shopping Centre); and
Link Building - Under Busway (Shopping Centre to Trident Retail Park)
5.30 The surveys identify that the highest level of footfall was recorded outside Wilkos, Santander and
Greggs within the main mall, with the lowest footfall recorded on the walkway between ASDA and
the main mall. Overall footfall was relatively consistent over the three survey days with aggregate
counts of 1,194 on the Saturday and Monday and 1,135 on Friday across the three survey
locations.

36
Car Parking & Accessibility
5.31 The town centre is served by a number of multi-storey and surface level car parks providing in
excess of 2,000 car parking spaces, with 81% of the spaces available for over 4 hours. The car
parking surveys undertaken by People & Places Limited as part of the benchmarking exercise
found that occupancy levels remained fairly constant across each of the survey days – 49% on a
Busy Day, 50% on a Quiet Day and 52% on the Saturday.
5.32 There are bus terminuses to the north and south of the shopping centre providing regular services
to local destinations within Halton, as well as to larger centres including Warrington, Liverpool and
Chester.
5.33 The vertical segregation between the distinct shopping areas of the town centre (i.e. main mall,
Trident Retail Park and ASDA) clearly constrains pedestrian circulation around the centre, as
evidenced by the low levels of footfall on the pedestrian footbridge between ASDA and the main
shopping mall in particular. It is therefore evident that the town centre would benefit from
improvements to the pedestrian infrastructure connecting each of the main shopping areas.
Town Centre Users Survey
5.34 The Town Centre User Survey was completed by 311 respondents. Almost half those surveyed
visited Halton Lea for convenience shopping (42%) and 25% to access services with only 1% visiting
for leisure. 51% of those surveyed visited the town centre at least once a week, and almost a
quarter (21%) visited once a month or more. 73% travelled by car and 54% spent over £20 on a
normal visit, which is double the National Small Towns average of 27%. However 85% stayed in the
centre for less than two hours and nearly three quarters would not recommend the shopping
centre (73%).

37
5.35 Convenience and access to services were cited as positive aspects of the centre, which correlates
with the main reasons for visiting the centre. Negative aspects included the retail offer (67%) and
physical appearance (58%), as well as cafes / restaurants, pubs / bars / nightclubs, markets and
leisure facilities. The key theme for suggestions to improve the retail offer centred on the need to
improve the retail offer in terms of more range and better quality.
5.36 80% of those surveyed would normally visit Runcorn Shopping Centre and 79% Asda. Other
locations included Trident (60%) and Lidl (34%).
Business Confidence Surveys
5.37 Over half of the respondents to the 8 returned Business Confidence Surveys have been based in
Halton Lea for more than ten years (63%). 50% of Businesses reported an increase in turnover and
the same number said profitability had stayed the same compared to last year. There was a degree
of business confidence within Halton Lea with 63% of respondents expecting turnover to increase.
5.38 100% of respondents considered the most positive aspect to be the potential local customers, with
88% considering the number of vacant units being the most negative impact. 88% of businesses
had not suffered from crime, which is above the National Small Towns average of 74%. Three
quarters of respondents felt their current units met their needs, and 86% expected to continue their
business as it is. Suggestions to improve the economic performance included reduced rent, more
variety of shops and better quality shops.

38
Runcorn Old Town District Centre
Diversity of Uses
5.39 The table contained below assesses the diversity of uses within Runcorn Old Town District Centre
based upon the survey undertaken by People & Places Limited as part of the benchmarking
exercise:
Table 5.3 – Runcorn Old Town Diversity of Uses
Use No. of Units Percentage
Retail (Use Class A1) 71 39.7%
Financial & Professional Services (Use Class A2) 20 11.2%
Restaurants & Cafés (Use Class A3) 5 2.8%
Public Houses (Use Class A4) 7 3.9%
Hot Food Takeaways (Use Class A5) 18 10.1%
Other 27 15.1%
Vacant Units 31 17.3%
Total 179 100%
5.40 The proportion of retail uses (Class A1) within the Old Town is marginally below the national
average and the convenience goods offer is relatively limited with no main supermarket
representation. There are however Co-Operative Food and Iceland stores located on Granville
Street with the remainder of the convenience offer comprising predominantly of independent
retailers. The proportion of comparison goods retailers within Runcorn Old Town is also marginally
below the national average with the majority of units occupied by independents.
5.41 There is a reasonable proportion of financial and professional services and leisure service uses
within Runcorn Old Town, including cafes, restaurants and public houses. It is however noted that

39
there is a high concentration of hot food takeaways within the Old Town, which has a negative
impact on the overall daytime vitality of the centre as the majority of these outlets only open in the
evenings.
Vacancies
5.42 There are a total of 31 vacant units within Runcorn Old Town, equating to a vacancy rate of 17.2%
which is significantly higher than the national average (11.3%).
Retailer Representation
5.43 The majority of retail units within Runcorn Old Town are occupied by independent traders with the
Boots store on High Street comprising the only national ‘key attractor’ within the centre.
Pedestrian Flows
5.44 Footfall was measured at the following three locations within Runcorn Old Town:
Granville Street;
Church Street / Fryer Street; and
Regent Street.
5.45 Counts were undertaken on a Market Day (Tuesday), Non Market Day and Saturday. Granville
Street recorded the highest level of footfall on each of the three days, with very low levels of
pedestrian footfall recorded on Regent Street. The level of footfall within the centre is highest on
market day with an aggregate count of 985 across the three survey locations, dropping to 728 on
Saturday and 481 on the non-market day.

40
Car Parking & Accessibility
5.46 The Town Centre Benchmarking Report provides details of the existing car parking provision within
Runcorn District Centre, with 89% of the total car parking provision found within designated car
parks. The survey identified that 15% of car parking was vacant during the Market Day audit with
the vacancy rate increasing to 24% on the Non-Market Day. It was however identified that the car
parking vacancy rates increased markedly to 47% on Saturday.
5.47 The town centre is served by a centrally located bus station, which provides regular services to a
range of local destinations within Halton, as well as services to larger centres including Warrington,
Liverpool and Chester.
5.48 The pedestrian environment is generally well-maintained with footpaths of sufficient width to
facilitate ease of pedestrian movement. There are limited pedestrianised areas within the centre,
however, the level of vehicular traffic accommodated on High Street, Church Street and Regent
Street does not act as a particular constraint to pedestrian movement and there are pedestrian
crossing facilities available within the centre.
Town Centre Users Survey
5.49 The Town Centre Users Surveys identified that 29% of respondents visit Runcorn Old Town to
access services, with 25% visiting for convenience shopping and 14% for leisure. Only 6% of the
respondents visit the Old Town for comparison shopping. 46% of the respondents visit the Old
Town at least weekly, although 25% of respondents suggested they visit less than once a month,
which is some 15% higher than the ‘National Small Towns’ average. Half of the respondents stay in
Runcorn Old Town for less than an hour with the majority of respondents spending less than £20
on a normal visit.

41
5.50 The main positive aspects of Runcorn Old Town highlighted by respondents were access to
services (48%), convenience (38%), ease of movement (36%) and car parking (36%). The physical
appearance of the centre (78%) and the quality of the retail offer (72%) were highlighted by the
majority of respondents as negative aspects of Runcorn Old Town, with the latter being 37% higher
than the ‘National Small Towns’ average. The cleanliness of the centre (48%), public toilets (47%),
markets (47%), pubs / bars / nightclubs (46%) and cafés / restaurants (41%) were also identified as
negative aspects of the centre. An improvement in the retail offer was a key theme to emerge in
terms of improvements that respondents would like to make to the centre, as well as improving
the physical appearance of the centre, improving the café / restaurant and pub offer and improving
the market.
Business Confidence Surveys
5.51 Of the 15 respondents to the Business Confidence Surveys, 40% said they had been based in
Runcorn Old Town for more than 10 years. 54% of businesses reported a decrease in turnover and
profitability over the last year, although 46% expected turnover to increase over the next year.
5.52 Positive aspects of the centre from the perspective of the businesses included potential local
customers (67%) and car parking (60%). The physical appearance (67%) and number of vacant units
(67%) were classed as the most negative aspects. 93% of businesses have not suffered crime,
which is far higher than the National Small Town average of 74%. Improving the retail offer was
considered the key action to improve the economic performance of the centre.
5.53 All of the respondents felt their existing unit met their needs in terms of location, and 87% in terms
of floorspace, size and format. Over half of respondents indicated the footfall had decreased (54%)
however 53% stated they expected their business to continue as it is.

42
6. RETAIL CAPACITY ANALYSIS
6.1 This section of the study analyses the capacity for new retail floorspace across Halton Borough in
the period to 2037. The methodology for undertaking this analysis is outlined and an assessment
is provided of the need for future retail development in convenience and comparison goods,
including bulky goods.
Study Area
6.2 The extent of the Study Area and postcode sectors is set out below:
Figure 6.1 – Study Area & Postcode Sectors
Zone 1 (Widnes) L24 1; L24 4; L24 5; WA8 0; WA8 3; WA8 4; WA8 5; WA8 6; WA8 7; WA8 8; WA8 9; WA88 1
Zone 2 (West Warrington) WA5 2; WA5 3; WA5 4; WA5 7 Zone 3 (Runcorn) WA7 1; WA7 2; WA7 3; WA7 4; WA7 5; WA7 6; WA7 7 Zone 4 (Frodsham) WA6 0; WA6 6; WA6 7; WA6 9 Zone 5 (Daresbury) WA4 4

43
Existing Shopping Patterns
6.3 The base year expenditure data has been combined with market shares of expenditure by zone
derived from the NEMS household survey (Appendix 3) to estimate expenditure flows to the main
town centres.
Convenience Goods
6.4 Table 6.1 sets out market shares in the convenience retail sector at February 2016 with the full
results set out in the tables contained at Appendix 4.
Table 6.1 - All Convenience Goods Market Share Summary (excluding non-store sales)
Centre / Store Market Share (%) Within Study Area Widnes Town Centre 36.6 Halton Lea Town Centre 24.5 Runcorn Town Centre 2.2 Other Destinations 13.2 Total Study Area Market Share (i.e. Retention Level) 76.5 Leakage Aldi, Stockton Heath, Warrington 1.7 ASDA, Westbrook Shopping Centre, Warrington 4.6 Morrisons, Greenhalls Avenue, Warrington 2.9 Sainsburys, Santa Rosa Boulevarde, Warrington 1.7 Tesco Extra, Winwick Road, Warrington 1.3 Other Destinations 11.2 Total Leakage 23.5
6.5 There is a relatively high retention rate in the convenience goods sector (76.5%) and this is
reflective of the fact that people tend to look towards destinations close to home to undertake
grocery shopping. However, commuting patterns and geographical proximity to stores in
neighbouring authority areas will account for a degree of leakage. In particular, only 18.7% of
available convenience goods expenditure generated by residents in Zone 2 (Warrington West) is

44
retained within the Study Area, with residents in Zone 2 predominantly visiting stores in
Warrington for grocery shopping, which is likely to be down to the fact that these stores are close
to home. A similar pattern is evident in Zone 5 (Daresbury) with only 11.9% of available
convenience goods expenditure generated by residents in this zone retained within the Study Area.
Residents in Zone 5 tend to visit stores in Warrington and Northwich for food shopping.
6.6 In contrast, 84.6% of available convenience goods expenditure generated by residents in Zone 1
(Widnes) is retained within the Study Area, with the majority of residents visiting stores within
Widnes Town Centre. A total of 90.5% of convenience goods expenditure generated by residents in
Zone 3 (Runcorn) is retained within the Study Area, with stores within Halton Lea Town Centre
capturing a market share of 64.5%. The household survey results therefore demonstrate that
Widnes and Halton Lea are meeting food shopping needs.
6.7 Within Zone 4 (Frodsham), 92.0% of the convenience goods expenditure generated by residents is
retained within the Study Area, with Morrisons in Frodsham (27.9%) and Tesco in Helsby (40.5%)
attracting a significant proportion of market share.
Comparison Goods
Explanatory Note
6.8 As outlined in further detail below, the household survey identifies that Runcorn Old Town
captures a greater level of market share in both bulky and non-bulky comparison goods than
Halton Lea. However, based on the limited comparison goods offer and secondary role of Runcorn
Old Town, it would appear implausible that the centre would claim such a high proportion of
expenditure from within the catchment. It therefore becomes apparent that Runcorn Old Town
may have erroneously been classified as the last destination stated for comparison goods
shopping by respondents to the survey. This potential issue was raised by Officers prior to the

45
survey being commissioned due to the different names given to each centre by local residents.
Accordingly, NEMS were provided with a list of names that the respective centres may be referred
to in order to ensure that responses were logged to the correct centre / store. However, despite
these safeguards being put in place, the survey data should be treated with caution in terms of the
comparison goods market shares claimed by Runcorn Old Town.
6.9 Halton Lea and Runcorn Old Town do however lie in close geographical proximity to one another
and share the same catchment area and, in order to address the issues identified above, ELG
Planning have therefore combined the market share and expenditure data for both centres to
identify any comparison goods capacity for the Runcorn catchment as a whole, as opposed to the
individual centres. This approach will then enable the LPA to determine the most appropriate
centre to direct any identified floorspace capacity towards.
Non-Bulky Comparison Goods
6.10 Table 6.2 outlines the market shares in the non-bulky comparison goods sector at February 2016,
with the full results set out in the tables contained at Appendix 5.
Table 6.2 - Non-Bulky Comparison Goods Market Share Summary
Centre / Store Market Share (%) Within Study Area Widnes Town Centre 25.8 Halton Lea Town Centre 4.3 Runcorn Old Town 8.6 Other Destinations 3.7 Leakage Warrington Town Centre 19.3 Liverpool City Centre 8.6 Cheshire Oaks Designer Outlet 5.9 Chester City Centre 4.8 Gemini Retail Park, Warrington 4.2 Riverside Retail Park, Warrington 4.1

46
6.11 Less than half (42.5%) of the non-bulky comparison goods expenditure generated by residents is
retained within the Study Area, with Widnes Town Centre capturing the majority (60.7%) of this
retained expenditure. The identified leakage is reflective of the Borough’s geographical proximity
to a number of higher order centres, with Warrington Town Centre and the town’s retail parks
attracting residents from within the Study Area in particular for non-bulky comparison goods
shopping. Liverpool City Centre, Chester City Centre, Cheshire Oaks Designer Outlet and Speke
(New Mersey) Retail Park also capture a relatively high proportion of non-bulky comparison goods
market share from within the Study Area.
6.12 In Zone 1 (Widnes), 52.3% of non-bulky comparison goods expenditure generated by residents is
retained within the zone, with the overwhelming majority (51.8%) directed to Widnes Town Centre.
Warrington Town Centre attracts 12.3% market share, with Liverpool City Centre (8.6%), and Speke
(New Mersey) Retail Park (8.1%) attracting a high proportion of market share from Zone 1
residents. In addition, over half (54.9%) of non-bulky comparison goods expenditure generated by
residents in Runcorn is retained within Zone 3 (Runcorn), with the household survey identifying
that Runcorn Town Centre (26.4%), Halton Lea Town Centre (13.1%) and Widnes Town Centre
(14.3%) capture the highest proportions of market share. Warrington Town Centre (13.7%) and
Liverpool City Centre (12.9%) attract a high proportion of non-bulky comparison goods expenditure
from residents in Zone 3.
6.13 In Zone 2 (West Warrington), only 13.3% of non-bulky comparison goods expenditure is retained
within the Study Area, with the overwhelming majority of this retained expenditure directed
towards Widnes Town Centre. Residents in Zone 2 predominantly visit Warrington Town Centre
and the town’s retail parks for non-bulky comparison goods shopping. In Zone 4 (Frodsham),
approximately 31% of non-bulky comparison goods expenditure is retained within the Study Area,
with the majority directed to Frodsham Town Centre. Chester City Centre (23.1%) and Cheshire
Oaks Designer Outlet (22.5%) attract a high proportion of non-bulky comparison goods expenditure
generated by residents in Zone 4. A minimal proportion of non-bulky comparison goods
expenditure generated by residents in Zone 5 (Daresbury) (4.1%) is retained within the Study Area,

47
with Warrington Town Centre (35.7%), Northwich Town Centre (14.8%) and Stockton Heath (11.7%)
capturing the highest proportion of market share in non-bulky comparison goods expenditure from
residents in Zone 5.
Bulky Comparison Goods
6.14 Table 6.3 outlines the market shares in the bulky comparison goods sector at February 2016, with
the full results set out in the tables contained at Appendix 6.
Table 6.3 - Bulky Goods Market Shares
Centre / Store Market Share (%) Within Study Area Widnes Town Centre 23.5 Halton Lea Town Centre 4.9 Runcorn Old Town 5.9 Other Destinations 4.0 Leakage Warrington Town Centre 12.8 Speke Retail Park, Speke 11.5 Liverpool City Centre 5.8 Gemini Retail Park, Warrington 5.3 Alban Retail Park, Warrington 4.4 Chester City Centre 4.3
6.15 Only 38.3% of bulky goods expenditure generated by residents is retained within the Study Area,
with Widnes Town Centre capturing the majority of this retained expenditure. There is a high
degree of bulky goods expenditure leakage from within the Study Area to Warrington Town Centre
and the town’s retail parks, as well as Speke (New Mersey) Retail Park.
6.16 In Zone 1 (Widnes), 47.8% of bulky good expenditure generated by residents is retained within this
zone, with the majority (44.3%) directed to Widnes Town Centre. Speke (New Mersey) Retail Park
attracts a high level of bulky goods market share from residents in Zone 1 (Widnes) (18.7%), as do
Liverpool City Centre (9.4%), St Helens Town Centre (6.2%) and Warrington Town Centre (5.6%).
Approximately half (49.1%) of bulky goods expenditure generated by residents in Zone 3 (Runcorn)

48
is retained within this zone, with Widnes Town Centre (16.9%), Runcorn District Centre (17.0%) and
Halton Lea Town Centre (13.6%) capturing similar levels of market share on the basis of the results
of the household survey. There is a high level of leakage of bulky goods expenditure generated by
residents in Zone 3 (Runcorn) to Warrington Town Centre (14.7%), Speke (New Mersey) Retail Park
(13.6%) and Gemini Retail Park, Warrington (5.4%).
6.17 In Zone 2, only 10.4% of bulky comparison goods expenditure generated by residents is retained
within this zone, with residents in Zone 2 predominantly visiting Warrington Town Centre and the
town’s retail parks for bulky comparison goods shopping. In Zone 4, only 27.1% of bulky goods
expenditure is retained within the Study Area with Frodsham Town Centre claiming a 13.6% market
share. There is a high level of expenditure leakage in bulky goods to Chester City Centre and the
City’s retail parks (e.g. Greyhound Retail Park). A minimal proportion of bulky goods expenditure
generated by residents in Zone 5 (5.3%) is retained within the Study Area, with residents
predominantly visiting bulky goods retail facilities in Warrington and Northwich.
Population Data & Forecasts
6.18 A ‘Retail Planner Demographic & Expenditure Report’ has been obtained from Experian for the Halton
Study Area divided into five constituent zones. The report outlines population estimates for 2014
based upon the 2011 Census figures of usual residents. The total population in the Study Area in
2014 is 175,924, which is higher than the ONS 2012-based projections for Halton Borough, which
estimate a Borough-wide population of 126,000 in 2014. This is due to the inclusion of areas
beyond the Halton administrative boundary within the Study Area.
6.19 The Retail Planner report also provides population projections for each zone within the Study Area.
However, for the purposes of this study, the population forecasts for zones within Halton are
based on the identified future distribution of housing growth by settlement in the Borough. The
adopted Halton Core Strategy outlines the planned distribution of housing within Widnes / Hale
and Runcorn and these figures have been aggregated into the respective zones. Within the

49
peripheral parts of the Study Area (Zones 2, 4 & 5), the Experian ‘Retail Planner Demographic &
Expenditure Report’ population projections have been adopted for the respective zones. Table 6.4
shows the population projections per zone to 2037.
Table 6.4 - Population Forecasts
Population by Zone 2014 2019 2024 2029 2037 Zone 1 (Widnes) 66,486 67,346 67,776 67,776 68,206 Zone 2 (Warrington West) 23,611 24,516 25,479 26,294 26,931 Zone 3 (Runcorn) 63,305 64,445 65,015 65,015 65,585 Zone 4 (Frodsham) 17,138 17,282 17,494 17,683 17,687 Zone 5 (Daresbury) 3,370 3,458 3,537 3,602 3,636 Total 173,910 177,047 179,301 182,370 182,045
Retail Expenditure Estimates & Forecasts
6.20 Appendix 7 shows existing population and retail expenditure per person for the five zones that
comprise the Halton Study Area. Table 6.5 shows the expenditure per person in each zone in
comparison and convenience goods. The expenditure figures are compared with the UK averages
shown in the Experian Retail Planner report in the form of percentages of the UK base. All
monetary figures are in 2014 prices.
Table 6.5 - Expenditure Per Person
Zone Expenditure Per Person
(2014 Prices)
% of UK Base
Convenience
(£)
Comparison (£) Convenience
(£)
Comparison (£)
Zone 1 (Widnes) 2,019 2,662 95.1 84.1
Zone 2 (Warrington West) 2,080 3,326 98.0 105.0
Zone 3 (Runcorn) 1,934 2,388 91.1 75.4
Zone 4 (Frodsham) 2,243 3,637 105.7 114.8
Zone 5 (Daresbury) 2,578 4,492 121.4 141.8

50
6.21 Table 6.5 illustrates that Zone 1 (Widnes) has a level of spending per person which is below the UK
average in both convenience and comparison goods. The expenditure per person on convenience
goods in Zone 2 (Warrington West) is comparable with the UK average, whilst expenditure per
person on comparison goods exceeds the UK average. Zone 3 (Runcorn) has a low level of
expenditure per person in both convenience and comparison goods, whilst Zone 4 (Frodsham) and
Zone 5 (Daresbury) significantly exceed UK average expenditure per person in both convenience
and comparison goods.
6.22 It is necessary to adjust the convenience goods expenditure per person to exclude spending on
non-store retail sales (or special forms of trading), such as Internet shopping. The proportion of
non-store retailing in convenience goods nationally in 2014 is 2.5% (Source: Experian Retail Planner
Briefing Note 13), adjusted to exclude Internet / home delivery purchases that are sourced from
foodstores. Multiplying population by spending per person in each zone (excluding non-retail
sales) gives total convenience goods spending by zone. The total spending by residents on
convenience goods in 2014 is £352.95m (excluding SFT). The calculations are shown in detail at
Appendix 7.
6.23 It is also necessary to carry out similar adjustments to the comparison goods expenditure per
person to exclude spending on non-store retail sales. The proportion of non-store retailing in
comparison goods nationally in 2014 is 11.2% (Source: Experian Retail Planner Briefing Note 13).
The total spending by residents on comparison goods in 2014 is £484.16m (excluding SFT). The
calculations are shown in detail at Appendix 7.
Table 6.6 - Total Convenience & Comparison Goods Expenditure 2014 (excluding SFT)
Zone 1 (Widnes)
Zone 2 (Warrington
West)
Zone 3 (Runcorn)
Zone 4 (Frodsham)
Zone 5 (Daresbury)
Total
2014 Convenience Goods Expenditure (2014 Prices) Convenience Goods
134.25 49.10 122.46 38.45 8.69 352.95

51
2014 Comparison Goods Expenditure (2014 Prices) Non-Bulky 122.86 55.79 105.63 42.98 10.43 337.69 Bulky 54.14 22.73 45.53 19.36 4.71 146.47 Total 177.0 78.52 151.16 62.34 15.14 484.16
6.24 Expenditure has been projected forward to 2037 using forecasts in Experian Retail Planner Briefing
Note 13 (October 2015). The annual growth rates set out in Appendix 3 of Briefing Note 13 have
been adjusted by Experian to allow for future changes in non-store retail sales taking account of
the extent of trading via traditional floorspace (Table 6.7).
Table 6.7 - Growth in Sales Volumes (Retail Spend) Per Head
Comparison Growth Rates* Convenience Growth Rates* 2014 +4.8 -2.2 2015 +4.7 -0.4 2016 +2.4 -0.2 2017 +2.1 +0.1 2016-2022 (Annual Average) +2.4 -0.2 2023-2037 (Annual Average) +3.3 -0.1
* Excluding SFT adjusted for sales via stores
6.25 The population forecasts have been combined with retail expenditure per person by zone (adjusted
to exclude non-store retailing) in future years to forecast total expenditure in the Study Area.
Appendix 7 provides details of the total forecast expenditure in the Study Area in convenience and
comparison goods (bulky and non-bulky), which is summarised in Table 6.8:
Table 6.8 – Expenditure Forecasts
Expenditure Forecasts (2014 Prices)
2014 (£m)
2019 (£m)
2024 (£m)
2029 (£m)
2037 (£m)
Convenience Goods Convenience Goods 352.95 349.31 352.07 352.51 352.94 Comparison Goods Non-Bulky Comparison Goods 337.69 404.44 463.97 549.82 719.72 Bulky Comparison Goods 146.47 175.37 201.13 238.28 311.85 Total Comparison Goods 484.16 579.82 665.10 788.10 1,031.57
6.26 Based on the forecasts of population and expenditure per person, the forecast expenditure growth
in convenience goods across the Study Area from the 2014 base is -1.0% to 2019, -0.3% to 2024, -

52
0.1% to 2029 and 0.0% to 2037. The forecast growth in expenditure in comparison goods is
significantly greater, equating to 19.8% growth to 2019, 37.8% to 2024, 62.7% to 2029 and 113.1%
to 2037.
Market Share Approach
6.27 The quantitative capacity for retail development is assessed based on the expenditure forecasts
and the extent of trade retention within the catchment areas of each of the main centres – Widnes,
Halton Lea and Runcorn Old Town.
6.28 A constant market share approach is the starting point in respect of the capacity analysis, based on
the market share of each centre in convenience and comparison goods which is the conventional
approach to assessing capacity. It is not necessary to undertake a further ‘sub-sectoral’ approach
breaking the analysis down into further types of goods (e.g. footwear and clothing, books and
stationary etc.) and recent appeal decision letters have advised against such an approach. For each
centre expenditure in the base year of 2014 is compared with the survey-based turnover of the
centre estimated from the household survey data on shopping patterns and expenditure per zone.
The amount of spending in the centre from the catchment area represents its market share or
retention level as a percentage of total spending. The scope for new retail floorspace in the centre
is dependent upon expenditure growth and on the extent to which the retention level may increase
in the future. Any potential for clawback of leakage will increase the retention level.
6.29 Capacity is assessed for the forecast years 2019, 2024, 2029 and 2037 and is carried out for
convenience and comparison goods (bulky and non-bulky). An assessment is also made of the
potential for an increase in market shares or retention levels and the amount of expenditure
retained, taking account of commitments and the extent to which each of the main centres could
increase its attraction for shopping relative to other centres. In comparison goods, it is necessary
to allow for an increase in turnover in existing shops to reflect the trend towards improvements in

53
sales productivity over time as shops become more efficient. The Experian Retail Planner Briefing
Note 13 suggests that sales density growth rate in comparison goods is likely to be close to 2.0%
per annum over the next two decades and this growth rate has therefore been applied to the
capacity analysis. The Retail Planner Briefing Note advises that the scope for sales density
increases in convenience goods is very limited and therefore no allowance is made for it within the
capacity analysis.
6.30 Subtracting the future turnover of existing shops from the amount of expenditure retained gives
the surplus capacity in each forecast year. An allowance must then be made for any commitments
for new retail development. After allowing for commitments, the analysis shows the amount of
residual capacity in the catchment area. The residual capacity in the form of expenditure is
converted to floorspace capacity by applying appropriate sales densities.
Capacity Analysis
Widnes
Convenience Goods
6.31 The household survey undertaken by NEMS illustrates that Widnes Town Centre retains a
significant proportion of convenience goods expenditure (80.1% / £107.6m) generated by residents
within its catchment area. There has been a minimal increase in the convenience goods market
share of Widnes Town Centre in comparison to that identified within the Halton Retail & Leisure
Study (2009).
6.32 The main destinations for convenience goods shopping within Widnes Town Centre are Morrisons
and ASDA, which capture market shares of 26.9% and 25.6% respectively. The market share of
Morrisons has decreased from 36.6% in 2009, with ASDA’s market share also declining from 32.2%.

54
These changes are likely to be attributable to an enhanced convenience goods shopping offer in the
town centre since the previous survey was undertaken, including the opening of Tesco Extra and
the food hall within M&S at Widnes Shopping Park, as well as changing consumer shopping habits.
In particular, Aldi has seen its market share increase from 3.8% in 2009 to 10.8%, which is reflective
of the national trend towards discount retailers.
6.33 The Tesco Extra store on the site of the former Ashley Retail Park opened in 2012, however, the
store only claims a market share of 5.2% from within the Widnes catchment area and therefore
appears to be trading extremely poorly. Local centres and individual stores within the Study Area
claim a 4.4% (£5.86m) market share from the Widnes catchment. The household survey identifies
that Widnes residents undertake limited food shopping within Halton Lea or Runcorn Old Town
(0.13% / £0.18m).
6.34 The main leakage of convenience goods expenditure from residents within the Widnes catchment
area is to foodstores within Warrington and Liverpool, which is likely to be reflective of commuting
patterns or the geographical proximity of stores in neighbouring authority areas.
6.35 Appendix 8 contains detailed capacity analysis for convenience goods in Widnes. On the basis of
the strong convenience goods market share performance of Widnes Town Centre, as well as
forecast expenditure and population growth, the analysis identifies the following capacity for new
foodstore provision:
Table 6.9 – Residual Retail Capacity (Convenience Goods): Widnes Town Centre
2019 2024 2029 2037 Residual Capacity £9.09m £9.23m £8.70m £8.53 Floorspace Capacity 909 sq.m 923 sq.m 870 sq.m 853 sq.m
NB. Gross sales density and floorspace figures
6.36 It is evident that Widnes Town Centre has a strong convenience goods offer comprising of large
format ASDA, Morrisons and Tesco Extra foodstores supplemented by Aldi, Iceland, M&S and
independents and this is clearly reflected by the strong market share performance of the town

55
centre. On this basis, it is considered that there is limited scope to materially improve the retention
level of the town centre given the existing strong market share performance and, accordingly, it is
considered that there is no particular quantitative or qualitative need for Halton Borough Council to
plan for new convenience goods floorspace over the proposed Plan Period, particularly in view of
the identified extremely poor trading performance of the Tesco Extra store.
Bulky Comparison Goods
6.37 The bulky comparison goods capacity analysis contained at Appendix 9, which assumes a constant
market share factoring in expenditure and population growth forecasts, shows the following
floorspace capacity in Widnes over the Plan Period, as summarised below:
Table 6.10 – Residual Retail Capacity (Bulky Goods): Widnes Town Centre
2019 2024 2029 2037 Residual Floorspace Capacity (sq.m gross)
1,210 sq.m 1,480 sq.m 2,062 sq.m 2,993 sq.m
6.38 Widnes Town Centre currently retains 44.3% of bulky goods expenditure generated by residents in
the immediate catchment and the retention level has decreased from 49.8% as identified by the
2009 Retail & Leisure Study. This is likely to be primarily attributable to the loss of the Ashley
Retail Park, which previously claimed 11.5% of bulky goods expenditure from the Widnes
catchment area, and its replacement with a Tesco Extra superstore.
6.39 Based on a constant market share approach, there is limited identified capacity for further bulky
goods floorspace in the short to medium term (i.e. to 2024) and, accordingly, there is no
overarching requirement to pro-actively plan for new bulky goods retail floorspace within Widnes
in the early stages of the Plan period. Whilst there has been an identified reduction in the bulky
goods market share of the town centre since 2009, it is considered that the potential to improve
market share, even to the level identified in the 2009 Retail & Leisure Study, is limited given the
identified polarisation of comparison goods shopping and the recent store rationalisation

56
programmes by the main national DIY operators. We have not therefore sought to include an
allowance for a higher retention level of bulky goods expenditure within the capacity analysis for
Widnes in this context.
6.40 It is considered that, should any proposals for new bulky goods retail floorspace come forward in
Widnes in the short to medium term, they should be assessed against the prevailing national
guidance relating to main town centre uses having regard to the ability of the scheme to clawback
bulky goods expenditure.
Non-Bulky Comparison Goods
6.41 The non-bulky comparison goods capacity analysis contained at Appendix 10, which assumes a
constant market share factoring in expenditure and population growth forecasts, shows the
following floorspace capacity in Widnes over the Plan Period, as summarised below:
Table 6.11 – Residual Retail Capacity (Non-Bulky Comparison Goods): Widnes Town Centre
2019 2024 2029 2037 Residual Floorspace Capacity (sq.m gross)
802 sq.m 1,278 sq.m 2,305 sq.m 4,206 sq.m
6.42 Widnes Town Centre currently retains 51.7% of non-bulky comparison goods expenditure
generated within its immediate catchment, which is considered to be a reasonable performance in
view of the close proximity of higher order centres such as Warrington and Liverpool, which claim
12.3% and 9.3% of non-bulky comparison goods expenditure from the Widnes catchment
respectively. There has been a marginal increase in the non-bulky market share of the town centre
since the 2009 Retail & Leisure Study (49.6% non-bulky market share), which may be reflective of
the enhanced retail offer of the Widnes Shopping Park, which has commenced trading in the
intervening period. However, the improvement in market share is not as pronounced as was
forecast within the 2009 Study, with GVA predicting that the non-bulky market share of the town
centre could potentially increase to 60%, although it should be acknowledged that Phase 2 of the

57
Widnes Shopping Park development has not yet been delivered. However, Phase 2 of the scheme
comprises of an additional 3,053 sq.m (gross) of retail floorspace and, given Phase 1 has only
delivered a marginal increase in market share, we would not expect the balance of the scheme to
result in a material improvement in market share. Accordingly, we have not sought to include an
allowance for a higher retention level of non-bulky goods expenditure within the capacity analysis
for Widnes.
6.43 The analysis identifies limited capacity for further non-bulky comparison goods floorspace in the
short to medium term (i.e. to 2024) factoring in the Widnes Shopping Park (Phase 2) commitment.
It is not therefore considered that there is a requirement to pro-actively plan for new non-bulky
goods retail floorspace within Widnes in the early stages of the Plan period and the focus in the
short to medium term should be on the delivery of Phase 2 of the Widnes Shopping Park, which
provides an opportunity to further enhance the retail offer in a location that lies within the defined
boundary of the town centre and offers potential to create additional linked trips with the wider
town centre.
Halton Lea & Runcorn Old Town
Convenience Goods
6.44 The household survey identifies that convenience goods stores in the Runcorn catchment (Zone 3)
retain 70.7% (£86.6m) of convenience goods expenditure, although the majority (64.5% / £79.02m)
is directed to stores within Halton Lea Town Centre.
6.45 The market share of Halton Lea Town Centre in convenience goods has decreased slightly from
65.8% in 2009. ASDA remains the dominant foodstore in the Runcorn catchment capturing a
market share of 48.1%, which is broadly in line with the market share of the store in 2009. The
market share of Aldi has increased significantly since 2009, which is reflective of wider national

58
shopping trends and may also be influenced in part by the recent closure of the Tesco Metro store
within the Shopping Mall, which had a market share of 9.8% in 2009.
6.46 Runcorn Old Town only captures a 6.2% (£7.56m) market share in convenience goods from its
immediate catchment area, although this represents a marginal increase in the market share of
5.5% identified by the 2009 study. The majority of expenditure is directed to independent stores,
which secure a 3.4% market share. Iceland claims a 2.0% (£2.49m) market share, whilst the Co-
Operative Food store on Granville Street secures a market share of 0.74% (£0.91m).
6.47 Widnes Town Centre claims an 11.3% market share of convenience goods expenditure from the
Runcorn catchment area and a reasonable proportion of convenience good expenditure (8.4% /
£10.33m) from Zone 3 is retained by local centres / individual stores within the Study Area.
6.48 The convenience goods capacity analysis contained at Appendix 8, which assumes a constant
market share factoring in expenditure and population growth forecasts, shows very little
convenience goods floorspace capacity in Halton Lea and Runcorn Old Town over the Plan Period,
as summarised below:
Table 6.12 – Residual Retail Capacity (Convenience Goods): Halton Lea & Runcorn Old Town
2019 2024 2029 2037 Halton Lea Town Centre Residual Capacity £5.47m £5.77m £5.37m £5.43m Floorspace Capacity1 547 sq.m 577 sq.m 537 sq.m 543 sq.m Runcorn Old Town Residual Capacity £0.33m £0.36m £0.32m £0.33m Floorspace Capacity1 33 sq.m 36 sq.m 32 sq.m 33 sq.m
1. Gross sales density and floorspace figures
6.49 Halton Lea Town Centre has a relatively strong convenience goods market share performance and
it is evident that the existing convenience shopping provision, comprising of a large format ASDA
foodstore supplemented by Farmfoods, Iceland, Lidl, Aldi and independents is adequately meeting
the needs of residents within the immediate catchment. On this basis, it is not considered that

59
there is a need to pro-actively plan for further convenience goods floorspace in Halton Lea over the
Plan period.
6.50 Runcorn Old Town only captures a convenience goods market share of 6.2% from the immediate
catchment area, which is a reflection of the secondary role of the Old Town and the limited
convenience goods offer. The majority of local residents therefore visit foodstores within Halton
Lea and, to a lesser extent, Widnes for undertaking convenience goods shopping. It is considered
that there may be scope to increase the convenience goods market share of Runcorn Old Town
through the provision of a medium sized / discount foodstore within the town centre. It is
considered that such an approach would give rise to a number of quantitative and qualitative
benefits, including:
Strengthening the convenience goods offer of Runcorn Old Town;
Increased footfall within the centre and improved prospects of shoppers making linked
trips to other stores within the centre;
Helping to stem leakage of convenience goods expenditure from the Runcorn catchment
(Zone 3) to foodstores within Widnes (£13.86m), thereby promoting more sustainable
shopping patterns and reducing the need to travel in line with NPPF objectives.
6.51 The LPA should therefore adopt a town centre first approach to any proposals that come forward
for new foodstore provision within the Runcorn catchment area in line with national guidance
contained within the NPPF.
Comparison Goods
6.52 The recent household survey undertaken by NEMS identifies that Halton Lea and Runcorn Old
Town claim the following market shares of comparison goods expenditure from the Runcorn
catchment area:

60
Table 6.13 – Market Shares (Comparison Goods): Halton Lea & Runcorn Old Town
Centre Market Share from Runcorn Catchment
Non-Bulky Bulky
Halton Lea 13.1% 13.6%
Runcorn 26.4% 17.0%
Combined 39.5% 30.6%
6.53 However, as outlined earlier, based on the limited comparison goods offer and secondary role of
Runcorn Old Town, it would appear implausible that the centre would claim such a high proportion
of expenditure from within the catchment. It is therefore apparent that Runcorn Old Town may
have erroneously been classified as the last destination stated for comparison goods shopping by
respondents to the survey. This potential issue was raised by Officers prior to the survey being
commissioned due to the different names given to each centre by local residents. Accordingly,
NEMS were provided with a list of names that the respective centres may be referred to in order to
ensure that responses were logged to the correct centre / store. However, despite these
safeguards being put in place, it is apparent that the survey data should be treated with caution in
terms of the comparison goods market shares claimed by Runcorn Old Town.
6.54 Halton Lea and Runcorn Old Town do however lie in close geographical proximity to one another
and share the same catchment area and, in order to address the issues identified above, we have
merely sought to combine the market share and expenditure data for both centres to identify any
comparison goods capacity for the Runcorn catchment as a whole, as opposed to the individual
centres. This approach will then enable the LPA to determine the most appropriate centre to direct
any identified floorspace capacity towards. The retention level in non-bulky comparison goods of
Runcorn and Halton Lea combined is broadly in line with that identified within the 2009 Retail &
Leisure Study and, accordingly, it is considered that the identified methodology represents a robust
solution to the issues identified above.

61
Bulky Comparison Goods
6.55 The bulky comparison goods capacity analysis contained at Appendix 9, which assumes a constant
market share factoring in expenditure and population growth forecasts, shows the following
floorspace capacity in Halton Lea and Runcorn Old Town over the Plan Period, as summarised
below:
Table 6.14 – Residual Retail Capacity (Bulky Goods): Halton Lea & Runcorn Old Town
2019 2024 2029 2037 Residual Capacity £3.19m £4.14m £5.95m £10.02m Floorspace Capacity 963 sq.m 1,132 sq.m 1,473 sq.m 2,118 sq.m
NB. Gross sales density and floorspace figures
6.56 Halton Lea and Runcorn Old Town combined currently retain 30.6% of bulky goods expenditure
generated by residents in Zone 3, which represents a reasonable level of performance given the
proximity of the centres to bulky goods retail facilities in nearby towns such as Widnes and
Warrington.
6.57 It is considered that there is limited scope for Halton Lea and Runcorn Old Town to improve market
share in bulky goods retailing given the identified polarisation of comparison goods shopping and
the recent store rationalisation programmes by the main national DIY operators. It is not therefore
considered that there is an overarching requirement to pro-actively plan for new bulky goods retail
floorspace within Halton Lea or Runcorn Old Town over the Plan period and any proposals that
come forward for such forms of development in the short to medium term should be assessed
against the prevailing national guidance relating to main town centre uses and potential for
clawback.

62
Non-Bulky Comparison Goods
6.58 The non-bulky comparison goods capacity analysis contained at Appendix 10, which assumes a
constant market share factoring in expenditure and population growth forecasts, shows the
following floorspace capacity in Halton Lea and Runcorn Old Town over the Plan Period, as
summarised below:
Table 6.15 – Residual Retail Capacity (Comparison Goods): Halton Lea & Runcorn Old Town
2019 2024 2029 2037 Residual Capacity £6.18m £8.69m £13.70m £25.20m Floorspace Capacity 1,244 sq.m 1,583 sq.m 2,263 sq.m 3,551 sq.m
NB. Gross sales density and floorspace figures
6.59 On the basis of a constant market share approach, there is limited capacity identified for additional
non-bulky comparison goods floorspace across Halton Lea and Runcorn over the Plan period as
shown in the above table.
6.60 Halton Lea and Runcorn Old Town combined currently retain 39.5% of non-bulky comparison goods
expenditure generated within Zone 3, which is considered to be a reasonably strong level of
performance given the proximity of the towns to higher order centres including Warrington,
Liverpool and Chester. The key to delivering any increase in market share of Halton Lea / Runcorn
Old Town will be to attract key national multiples who are not already represented within the town,
particularly the key fashion multiples. However, given the identified trend of national multiples
focusing investment within prime locations, it is considered that the prospects of securing national
multiples to drive a marked increase in market share are limited and, accordingly, we have not
sought to include an allowance for a higher retention level of non-bulky goods expenditure within
the capacity analysis for Halton Lea and Runcorn Old Town.
6.61 It is not therefore considered that there is any overriding requirement to plan for an increase in
non-bulky comparison goods floorspace within Halton Lea and Runcorn Old Town over the Plan

63
period and any proposals that come forward in the short to medium term should be assessed
against the prevailing national guidance relating to main town centre uses.

64
7. RETAIL STRATEGY
Retail Hierarchy
7.1 Paragraph 23 of the NPPF confirms that, in drawing up Local Plans, local planning authorities
should, inter alia, define a network and hierarchy of centres that is resilient to anticipated future
economic changes. Annex 2 of the NPPF confirms that references to town centres or centres apply
to city centres, town centres, district centres and local centres but exclude small parades of shops
of purely neighbourhood significance. The NPPF does not provide specific definitions of centres,
although the now cancelled Planning Policy Statement 4 ‘Planning for Sustainable Economic Growth’
defined the different types of centre as follows:
Table 7.1 – Retail Hierarchy Definitions
City Centre The highest level of centre identified in Development Plans. In terms of hierarchies,
they will often be a regional centre and will serve a wide catchment. The centre may
be very large, embracing a wide range of activities and may be distinguished by
areas which may perform different main functions.
Town Centre Town centres will usually be the second level of centres after city centres and, in
many cases, they will be the principal centre or centres in a local authority’s area.
District Centre District centres will usually comprise groups of shops often containing at least one
supermarket or superstore, and a range of non-retail services, such as banks,
building societies and restaurants, as well as public facilities such as a library.
Local Centre Local centres include a range of small shops of a local nature, serving a small
catchment. Typically, local centres might include, amongst other shops, a small
supermarket, a newsagent, a sub-post office and a pharmacy. Other facilities could
include a hot-food takeaway and launderette.
Source – Planning Policy Statement 4 ‘Planning for Sustainable Economic Growth’ (Cancelled)
7.2 Policy CS5 of the adopted Halton Core Strategy sets out a hierarchy of centres that will be
maintained and enhanced for retail and other main town centre uses, with Widnes and Halton Lea

65
identified as town centres and Runcorn as a district centre. The policy also identifies 31 local
centres across the Borough. We are of the opinion that the hierarchy of centres outlined within
Policy CS5 remains entirely appropriate, although we understand that Halton Borough Council has
separately reviewed their Local Centre provision in 2015 which may result in some changes to the
list of centres.
Potential Development Sites
7.3 The capacity analysis summarised in Section 6 concludes that there is limited quantitative need for
additional retail floorspace within Widnes, Halton Lea or Runcorn Old Town in the short to medium
term (i.e. up to 2024). However, it is suggested that the provision of a discount / medium sized
foodstore within Runcorn Old Town would deliver a number of benefits, including strengthening
the convenience goods offer, increasing footfall and helping to stem leakage of convenience goods
expenditure. Based on current operator requirements in the discount foodstore sector, a suitable
site would need to be capable of accommodating a store with a gross floor area of up to
approximately 2,500 sq.m with associated car parking and servicing and would therefore require a
site area of between 0.75ha and 1.5ha.
Town Centre Boundaries
7.4 Paragraph 23 of the NPPF confirms that planning policies should be positive, promote competitive
town centre environments and promote policies for the management and growth of centres over
the plan period. The NPPF advises that, in drawing up Local Plans, local planning authorities should,
inter alia, define the extent of town centres and primary shopping areas, based on a clear definition
of primary and secondary frontages in designated centres and set policies that make clear which
uses will be permitted in such locations. Annex 2 of the NPPF provides the following definitions of
town centre boundaries:

66
Table 7.2 – Town Centre Boundary Definitions
Town Centre Area defined on the local authority’s proposal map, including the
primary shopping area and areas predominantly occupied by main
town centre uses within or adjacent to the primary shopping area.
Primary Shopping Area Defined area where retail development is concentrated (generally
comprising the primary and those secondary frontages which are
adjoining and closely related to the primary shopping frontage).
Primary & Secondary Frontages Primary frontages are likely to include a high proportion of retail
uses, which may include food, drinks, clothing and household goods.
Secondary frontages provide greater opportunities for a diversity of
uses such as restaurants, cinemas and businesses.
Source – National Planning Policy Framework (Annex 2)
7.5 The recently published Planning Practice Guidance (PPG) does not provide any substantive guidance
on the definition of town centre boundaries or primary and secondary shopping frontages. It is
therefore considered that the DCLG document ‘Planning for Town Centres: Practice Guidance on Need,
Impact & the Sequential Approach,’ whilst now replaced in its entirety by PPG, continues to provide
useful guidance on the definition of these boundaries. Paragraphs 6.12 & 6.13 provide the
following guidance on the definition of the primary shopping area and town centre boundaries:
‘In defining the PSA, it may be appropriate to take into account the anticipated future role of the
centre, and in particular the scope for growth and expansion. In centres where major expansion is
planned, it may be appropriate to indicate where the PSA is likely to be extended to, having regard
to the potential for achieving effectively integrated new development. Crawley’s core strategy,
which in response to a clearly defined need, identifies the extent of the expansion of the PSA as a
‘strategic allocation.’
(Paragraph 6.12)

67
‘LPAs should also identify an appropriate ‘town centre boundary’ within which it will seek to locate
other main town centre uses. It may be appropriate to define other areas within the town centre
but outside the PSA where specific uses are encouraged e.g. specialist retail, offices, bars /
restaurants etc. To ensure that such uses are able to benefit from the centre’s accessibility by
alternative means of transport (and facilitate linked trips), it is important to ensure that the town
centre boundary is not drawn too widely.
(Paragraph 6.13)
Widnes Town Centre
7.6 The Halton Core Strategy defines the extent of the Widnes Town Centre boundary, although does
not define the Primary Shopping Area or primary and secondary shopping frontages, as shown on
the extract contained below:
Figure 7.1 - Widnes Town Centre Boundary (Halton Core Strategy 2013)

68
7.7 It is considered that the extent of the Widnes Town Centre boundary defined by the Core Strategy
remains appropriate and encompasses areas containing a full range of main town centre uses,
including the office / civic ‘quarter’ to the south west of the town centre.
7.8 ELG Planning have also undertaken visits to Widnes Town Centre to establish the extent of the
Primary Shopping Area and primary and secondary shopping frontages and the suggested extent
of these designations is shown in Figure 7.2 contained below.
Figure 7.2 – Suggested Widnes Town Centre Boundaries
KEY:
Current Town Centre Boundary Proposed TC Boundary Primary Shopping Area
Primary Shopping Frontage Secondary Shopping Frontage

69
Figure 7.3 - Halton Lea Town Centre Boundary (Halton Core Strategy 2013)
7.9 It is recommended that the overall extent of the town centre is reduced with the suggested
amended town centre boundary encompassing the areas that are considered to be primarily
occupied by main town centre uses within or adjacent to the defined Primary Shopping Area. The
defined Primary Shopping Area stretches from Gerrard Street to the south to Deacon Road to the
north, as this broad area is where the majority of retail development within the centre is
concentrated. The Primary Shopping Area excludes the area to the south western edge of the
town centre, as well as units on Albert Road to the northern edge of the town centre, which
accommodate a higher representation of non-A1 commercial, leisure and civic uses.
7.10 The defined Primary Shopping Frontages are those areas of the town that are predominantly in
retail use, with a number of national multiples represented, including Widnes Shopping Park, Albert
Road and Albert Square Shopping Centre. The defined Secondary Shopping Frontages incorporate
a more diverse range of uses, including restaurants / cafes and financial & professional service
uses.
Halton Lea Town Centre
7.11 The Halton Core Strategy defines the
extent of the Halton Lea Town Centre
boundary, although does not define
the Primary Shopping Area or primary
and secondary shopping frontages, as
shown on the adjacent extract.
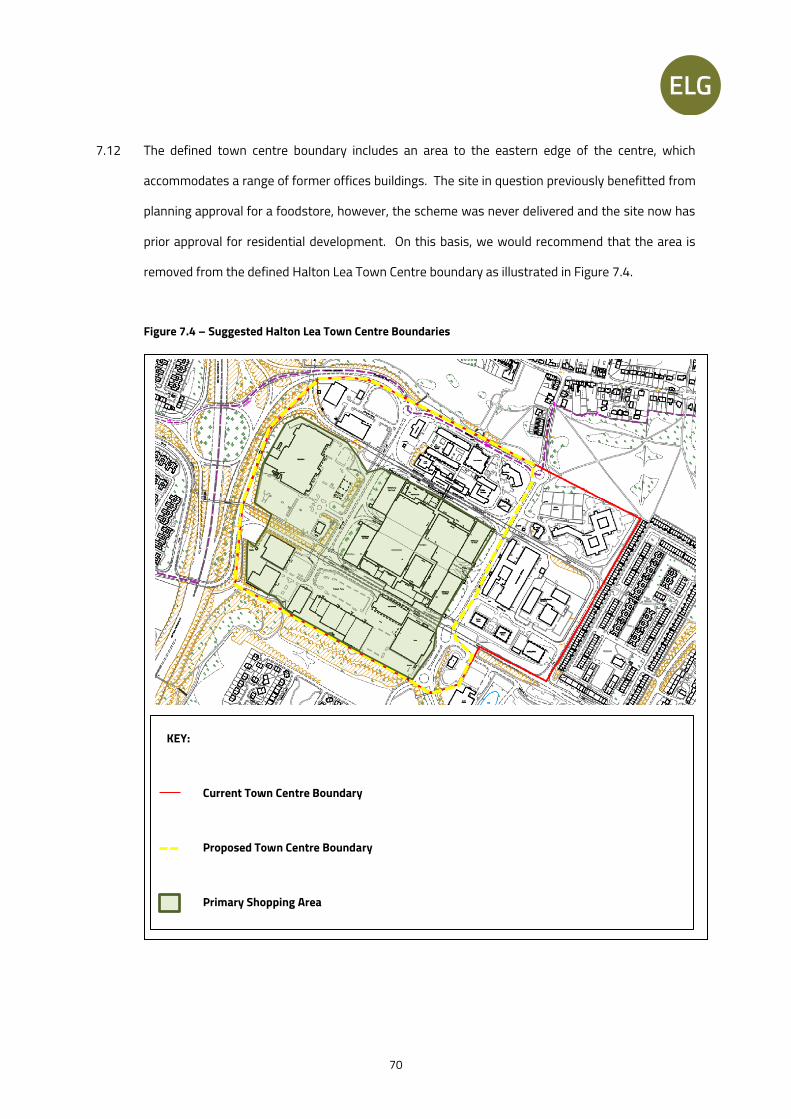
70
7.12 The defined town centre boundary includes an area to the eastern edge of the centre, which
accommodates a range of former offices buildings. The site in question previously benefitted from
planning approval for a foodstore, however, the scheme was never delivered and the site now has
prior approval for residential development. On this basis, we would recommend that the area is
removed from the defined Halton Lea Town Centre boundary as illustrated in Figure 7.4.
Figure 7.4 – Suggested Halton Lea Town Centre Boundaries
KEY: Current Town Centre Boundary Proposed Town Centre Boundary Primary Shopping Area

71
Figure 7.5 - Runcorn Centre Boundary (Halton Core Strategy 2013)
7.13 The Primary Shopping Area encompasses the main mall building, Trident Retail Park and the ASDA
foodstore, as this is the broad area where the majority of retail development within the centre is
concentrated. The Primary Shopping Area excludes the area to the north of the town centre, which
accommodates the Runcorn Police Station, Halton Direct Link library and office uses.
Runcorn Old Town District Centre
7.14 It is considered that the extent of the Runcorn District Centre boundary defined by the Halton Core
Strategy, as shown in Figure 7.5, remains broadly appropriate as it encompasses the areas
containing a range of town centre uses.
7.15 ELG Planning have also undertaken visits to Runcorn Old Town to establish the extent of the
Primary Shopping Area and primary and secondary shopping frontages and the suggested extent
of these designations is shown in Figure 7.6 contained overleaf.

72
Figure 7.6 – Suggested Runcorn Old Town Centre Boundaries
7.16 The defined Primary Shopping Area encompasses the area around Church Street, as this is the
broad area where the majority of retail units within the centre are concentrated. The Primary
Shopping Area excludes the southern extent of the town centre which accommodates a higher
proportion of non-A1 uses, including the Brindley Theatre, a health centre and a number of banks
and building societies.
7.17 The defined Primary Shopping Frontages on Church Street accommodate the highest proportion of
retail uses within the centre, including representation from national multiples including Savers and
Card Factory. The defined Secondary Shopping Frontages on Church Street incorporate a more
diverse range of uses.
KEY:
Town Centre Boundary Primary Shopping Area
Primary Shopping Frontage Secondary Shopping Frontage

73
Local Impact Thresholds
7.18 Paragraph 26 of the NPPF confirms that when assessing applications for retail, leisure and office
development outside of town centres, which are not in accordance with an up-to-date Local Plan,
LPAs should require an impact assessment if the development is over a proportionate, locally set
floorspace threshold. Policy CS5 of the adopted Halton Core Strategy confirms that retail and
leisure proposals in excess of 2,000 sq.m (gross) floorspace not located within a defined Primary
Shopping Area, or allocated within a Local Plan will be subject to sequential and impact
assessments..
7.19 PPG advises that, in setting a locally appropriate threshold, it will be important to consider:
The scale of proposals relative to town centres;
The existing vitality and viability of town centres;
Cumulative effects of recent developments;
Whether local town centres are vulnerable;
Likely effects of development on any town centre strategy;
Impact on any other planned investment
7.20 Policy CS5 of the adopted Core Strategy sets a retail impact threshold of 2,000 sq.m that will be
applied to out-of-centre proposals throughout the Borough. However, ELG are of the opinion that
a more appropriate approach would be to set a floorspace threshold for retail development on a
centre-by-centre basis, as set out below. In circumstances where a proposed out-of-centre retail
development is likely to impact upon more than one centre, it is advised that the lower floorspace
threshold is applied.

74
Widnes Town Centre
7.21 The Town Centre Benchmarking Report prepared by People & Places Limited indicates that Widnes
is a vital and viable town centre, although it is exhibiting certain signs of weakness. Widnes Town
Centre has a strong convenience goods offer comprising of large format ASDA, Morrisons and
Tesco Extra foodstores supplemented by Aldi, Iceland, M&S and independents and this is clearly
reflected by the strong market share performance of the town centre, although the household
survey results indicate that the Tesco Extra store to the south east of the town centre is trading
poorly. The completion of the Widnes Shopping Park in 2010 has helped to address a quantitative
and qualitative deficiency in comparison goods floorspace providing larger retail floorplates in the
town centre, with occupiers including M&S, BHS, Boots, River Island, New Look and Next.
7.22 The capacity analysis has identified that there is no particular quantitative or qualitative need for
Halton Borough Council to plan for new convenience goods floorspace over the Plan Period and
limited capacity for further comparison goods floorspace in the short to medium term (i.e. up to
2024). In view of the current health of the town centre and the limited capacity for further retail
floorspace, it is considered appropriate to impose a lower threshold than the national default of
2,500 sq.m outlined at Paragraph 26 of the NPPF. ELG Planning therefore advise that a locally set
threshold of 1,500 sq.m (GEA)3 for all retail development not in an existing centre and not in
accordance with an up-to-date Local Plan would be appropriate for Widnes.
Halton Lea Town Centre
7.23 Halton Lea Town Centre is considered to display a moderate level of health and has recently been
subject to a range of qualitative improvements, including cosmetic enhancements to the exterior of
the main shopping mall and the rebranding of the centre to ‘Runcorn Shopping Centre.’ The centre is 3 Paragraph-016 of National Planning Practice Guidance confirms that the impact test only applies to proposals exceeding 2,500 sq.m gross of floorspace unless a different locally appropriate threshold is set by the LPA. The asterix at Paragraph-016 confirms that ‘gross retail floorspace’ (or gross external area) is the total built floor area measured externally which is occupied exclusively by a retailer or retailers, excluding open areas used for the storage, display or sale of goods.

75
however exhibiting a number of signs of weakness, including a high vacancy rate, poor pedestrian
connectivity around the centre and a limited representation of both financial and professional and
retail and leisure services.
7.24 Halton Lea has a relatively strong convenience goods market share performance and it is evident
that the existing convenience shopping provision, comprising of a large format ASDA foodstore
supplemented by Farmfoods, Iceland, Lidl, Aldi and independents is adequately meeting the needs
of residents within the immediate catchment. The centre has a reasonable comparison goods offer
and accommodates a number of national multiple retailers, including Wilko, Poundland, JD, Argos,
New Look and Burton.
7.25 The capacity analysis identifies limited capacity for convenience goods floorspace across Halton
Lea and Runcorn over the Plan Period and there is also limited capacity for further comparison
goods floorspace. Halton Lea Town Centre is exhibiting certain signs of weakness and limited
capacity has been identified for further floorspace over the Plan Period. It is therefore considered
that proposals for major out-of-centre retail development could have a harmful impact on the
town centre and ELG Planning therefore advise that a locally set threshold of 1,000 sq.m (GEA) for
all retail development not in an existing centre and not in accordance with an up-to-date Local Plan
would be appropriate for Halton Lea.
Runcorn Old Town District Centre
7.26 Runcorn Old Town is considered to be a relatively vulnerable centre based on the benchmarking
exercise carried out by People & Places Limited, with a limited convenience goods offer, high
vacancy rate and high proportion of hot food takeaway uses.
7.27 The capacity analysis identifies limited capacity for convenience goods floorspace across Halton
Lea and Runcorn Old Town over the Plan Period and there is also limited capacity for further
comparison goods floorspace. However, it is suggested that the provision of a discount / medium

76
sized foodstore within Runcorn Old Town would deliver a number of benefits, including
strengthening the convenience goods offer, increasing footfall and helping to stem leakage of
convenience goods expenditure.
7.28 Runcorn Old Town is a compact centre and has been identified as relatively vulnerable with a
number of weaknesses. It is therefore considered that proposals for large-scale out-of-centre
retail development could have a harmful impact on the town centre and ELG Planning would
therefore advise that a locally set threshold of 500 sq.m (GEA) for all retail development not in an
existing centre and not in accordance with an up-to-date Local Plan would be appropriate for
Runcorn.

77
8. SUMMARY & CONCLUSIONS
8.1 ELG Planning have been instructed by Halton Borough Council to prepare a Borough-wide Retail
Study, which will form part of the evidence base for the emerging Local Plan and will specifically
help inform a broad strategy to support the vitality and viability of the Borough’s three main
centres. The study assesses the existing retail offer across Halton and seeks to establish the need
for new floorspace over the Plan Period having regard to guidance contained within the NPPF and
associated Planning Practice Guidance.
Existing Shopping Patterns
8.2 There is a high retention rate in the convenience goods sector (76.5%) and this is reflective of the
fact that people tend to look towards destinations close to home to undertake grocery shopping.
However, commuting patterns and geographical proximity to stores in neighbouring authority
areas will account for a degree of leakage. For example, only 18.7% of available convenience goods
expenditure generated by residents in Zone 2 (Warrington West) is retained within the Study Area,
with residents in Zone 2 predominantly visiting stores in Warrington for grocery shopping, which is
likely to be down to the fact that these stores are close to home
8.3 Widnes Town Centre retains a significant proportion of convenience goods expenditure (80.1% /
£107.6m) generated by residents within its catchment area with Morrisons and ASDA capturing
the highest levels of market share. The NEMS household survey identifies that convenience goods
stores in the Runcorn catchment (Zone 3) retain 70.7% (£86.6m) of convenience goods expenditure
with the majority (64.5% / £79.02m) being directed to stores within Halton Lea. The relatively high
retention levels of convenience goods expenditure indicate that the town centres of Widnes and
Halton Lea are adequately meeting the needs of residents within the immediate catchment

78
8.4 Less than half (42.5%) of the non-bulky comparison goods expenditure generated by residents is
retained within Halton, with Widnes Town Centre capturing the majority of this retained
expenditure. The identified leakage is reflective of the Borough’s geographical proximity to a
number of higher order centres, with Warrington Town Centre and the town’s retail parks
attracting residents from within the Study Area in particular for non-bulky comparison goods
shopping. Liverpool City Centre, Chester City Centre, Cheshire Oaks Designer Outlet and Speke
Retail Park also capture a relatively high proportion of non-bulky comparison goods market share
from within the Study Area.
8.5 The NEMS household survey identifies only 38.3% of bulky goods expenditure generated by
residents in the Study Area is retained within Halton, with Widnes Town Centre capturing the
majority of this retained expenditure. There is again a high degree of expenditure leakage from
within the Study Area to Warrington Town Centre and the town’s retail parks, as well as to Speke
(New Mersey) Retail Park.
Capacity Analysis
8.6 The quantitative capacity for retail development is assessed based on the expenditure forecasts
and the extent of trade retention within the catchment areas of each of the main centres. A
constant market share approach has been adopted with capacity assessed for the forecast years
2019, 2024, 2029 and 2037 in both convenience and comparison goods (bulky and non-bulky).
Table 8.1 summarises the forecast capacity over the Plan Period, although the longer term
forecasts should be treated with a degree of caution in view of the uncertainty in longer term
economic forecasts.

79
Table 8.1 – Retail Capacity Summary
Centre Floorspace Capacity (sq.m)
2019 2024 2029 2037
Convenience Goods
Widnes 909 sq.m 923 sq.m 870 sq.m 853 sq.m
Halton Lea 547 sq.m 577 sq.m 537 sq.m 543 sq.m
Runcorn 33 sq.m 36 sq.m 32 sq.m 33 sq.m
Non-Bulky Comparison Goods
Widnes 802 sq.m 1,278 sq.m 2,305 sq.m 4,206 sq.m
Runcorn (Halton Lea &
Runcorn Old Town)
1,244 sq.m 1,583 sq.m 2,263 sq.m 3,551 sq.m
Bulky Comparison Goods
Widnes 1,211 sq.m 1,481 sq.m 2,062 sq.m 2,994 sq.m
Runcorn (Halton Lea &
Runcorn Old Town)
963 sq.m 1,132 sq.m 1,473 sq.m 2,118 sq.m
8.7 There is limited identified capacity for further convenience goods floorspace in Widnes over the
Plan period and, accordingly, there is no particular quantitative or qualitative need for Halton
Borough Council to plan for new convenience goods floorspace, particularly in view of the identified
extremely poor trading performance of the Tesco Extra store. In addition, it is not considered that
there is a need to pro-actively plan for further convenience goods floorspace in Halton Lea over the
Plan period.
8.8 However, Runcorn Old Town only captures a convenience goods market share of 6.2% from the
immediate catchment area, which is a reflection of the secondary role of the Old Town and the
limited convenience goods offer. The majority of local residents therefore visit foodstores within
Halton Lea and, to a lesser extent, Widnes for undertaking convenience goods shopping. It is
considered that there may be scope to increase the convenience goods market share of Runcorn

80
Old Town through the provision of a medium sized / discount foodstore within the centre, which
would deliver a number of benefits, including strengthening the convenience goods offer,
increasing footfall and helping to stem leakage of convenience goods expenditure.
8.9 It is not considered that there is any overriding requirement to plan for an increase in non-bulky
comparison goods floorspace within Halton Lea and Runcorn Old Town over the Plan period and
any proposals that come forward in the short to medium term should be assessed against the
prevailing national guidance relating to main town centre uses. In Widnes, the focus in the short to
medium term should be on the delivery of Phase 2 of the Widnes Shopping Park, which provides an
opportunity to further enhance the retail offer in a location that lies within the defined boundary of
the town centre and offers potential to create additional linked trips with the wider town centre.
8.10 Based on the adopted constant market share approach, there is limited identified capacity for
further bulky goods floorspace in the short to medium term (i.e. to 2024) in any of the main centres
and, accordingly, there is no overarching requirement to pro-actively plan for new bulky goods
retail floorspace. It is considered that any proposals that come forward for bulky goods floorspace
in the short to medium term should be assessed against the prevailing national guidance relating
to main town centre uses having regard to the ability of the scheme to clawback bulky goods
expenditure.
Retail Hierarchy
8.11 Policy CS5 of the adopted Halton Core Strategy sets out a hierarchy of centres that will be
maintained and enhanced for retail and other main town centre uses, with Widnes and Halton Lea
identified as town centres and Runcorn Old Town as a district centre. The policy also identifies 31
local centres across the Borough. ELG Planning are of the opinion that the broad hierarchy of
centres outlined within Policy CS5 remains appropriate (subject to detailed changes to the list of
Local Centres being proposed by the Council following the Local Centres Review 2015).

81
Potential Development Sites
8.12 The capacity forecasts have identified that there is limited need for additional retail floorspace
within Widnes, Halton Lea or Runcorn Old Town in the short to medium term (i.e. up to 2024),
although it is advised that the provision of a discount / medium sized foodstore within Runcorn Old
Town would deliver a number of benefits. The study therefore provides advice on the site
parameters to deliver such a development within the town centre.
Town Centre Boundaries
8.13 The Retail Study advises that the existing defined town centre boundaries of Widnes and Runcorn
Old Town should be maintained and also makes recommendations on the extent of the Primary
Shopping Area and primary and secondary shopping frontages.
8.14 The existing Halton Lea town centre boundary includes an area to the eastern edge of the centre,
which accommodates a range of former offices buildings. The site in question previously
benefitted from planning approval for a foodstore, however, the scheme was never delivered and it
is understood that it is now planned to convert the buildings into residential units. On this basis, it
is recommended that this area is removed from the town centre boundary. The study also
provides advice on the extent of the Primary Shopping Area in Halton Lea.
Local Impact Thresholds
8.15 Paragraph 26 of the NPPF confirms that when assessing applications for retail, leisure and office
development outside of town centres, which are not in accordance with an up-to-date Local Plan,

82
LPAs should require an impact assessment if the development is over a proportionate, locally set
floorspace threshold. ELG Planning have therefore recommended the following thresholds:
Centre Floorspace Threshold (sq.m gross)
Convenience Goods Comparison Goods
Widnes 1,500 sq.m 1,500 sq.m
Halton Lea 1,000 sq.m 1,000 sq.m
Runcorn Old Town 500 sq.m 500 sq.m
Future Challenges & Retail Strategy
8.16 Halton is located in close proximity to a number of key regional and sub-regional shopping centres,
including Liverpool, Warrington and Chester and the main centres within the Borough will be
affected by increased focus of major retailers towards prime locations. It is therefore considered
that Halton Lea and Runcorn Old Town and, to a lesser extent, Widnes will struggle to attract the
key national multiple retailers who could help drive a marked change in the performance of the
individual centres. However, the continuing trend amongst consumers to seek value for money in
non-food shopping is likely to see a focus upon centres within the Borough for value and discount
non-food retailers.
8.17 It is considered that any physical expansion of the retail offer within the centres should be
balanced with the development of a strategy that encourages residents to visit centres within the
Borough over higher order centres in the wider area. It is evident that such an approach will need
to promote the distinctiveness of the main centres to distinguish them from higher order centres,
which could include the promotion of a strong local independent offer and regular cultural /
entertainment events to provide an ‘experience’ and encourage people to visit and dwell within the
centres.

83
8.18 Planning policies relating to town centres should provide sufficient flexibility to enable the
individual centres to evolve and adapt to market trends, including an increased focus towards retail
service and leisure uses. The recent changes to permitted development rights are also likely to
impact on the character of centres, with the temporary permitted change of use rights providing an
opportunity to secure short term re-occupation and ‘pop-up shop’ type uses that can reduce
vacancy rates, as well as help to increase footfall and activity within individual centres.
8.19 The internet and multi-channel retailing will continue to play a fundamental role in the retail sector
and will continue to provide challenges to retailers within town centres. However, it is important
that centres within Halton seek to embrace digital technologies and opportunities presented by
multi-channel retailing. This could include the development of a strategy to support the role of
digital technologies in enhancing the town centre consumer experience, including the provision of
the necessary infrastructure to support digital engagement, as outlined in Section 2.
Related Documents