ACPD 7, 4285–4403, 2007 Halogens and polar boundary-layer ozone depletion W. R. Simpson et al. Title Page Abstract Introduction Conclusions References Tables Figures Back Close Full Screen / Esc Printer-friendly Version Interactive Discussion EGU Atmos. Chem. Phys. Discuss., 7, 4285–4403, 2007 www.atmos-chem-phys-discuss.net/7/4285/2007/ © Author(s) 2007. This work is licensed under a Creative Commons License. Atmospheric Chemistry and Physics Discussions Halogens and their role in polar boundary-layer ozone depletion W. R. Simpson 1 , R. von Glasow 2 , K. Riedel 3 , P. Anderson 4 , P. Ariya 5 , J. Bottenheim 6 , J. Burrows 7 , L. Carpenter 8 , U. Frieß 9 , M. E. Goodsite 10 , D. Heard 11 , M. Hutterli 4 , H.-W. Jacobi 17 , L. Kaleschke 12 , B. Neff 13 , J. Plane 11 , U. Platt 9 , A. Richter 7 , H. Roscoe 4 , R. Sander 14 , P. Shepson 15 , J. Sodeau 16 , A. Steffen 6 , T. Wagner 9,14 , and E. Wolff 4 1 Geophysical Institute and Department of Chemistry, University of Alaska Fairbanks, Fairbanks, AK, 99775-6160, USA 2 School of Environmental Sciences, University of East Anglia, Norwich, NR4 7TJ, UK 3 National Institute of Water and Atmospheric Research, Private Bag 14–901, Wellington, New Zealand 4 British Antarctic Survey, High Cross, Madingley Road, Cambridge CB3 0ET, UK 5 McGill University, Canada 6 Environment Canada, Toronto, Canada 7 Institute of Environmental Physics, University of Bremen, Bremen, Germany 8 Dept. of Chemistry, University of York , York YO10 5DD, UK 9 Institute for Environmental Physics, University of Heidelberg, Germany 10 University of Southern Denmark, Department of Chemistry and Physics, Campusvej 55 DK5230 Odense M, Denmark 4285

Welcome message from author
This document is posted to help you gain knowledge. Please leave a comment to let me know what you think about it! Share it to your friends and learn new things together.
Transcript

ACPD7, 4285–4403, 2007
Halogens and polarboundary-layerozone depletion
W. R. Simpson et al.
Title Page
Abstract Introduction
Conclusions References
Tables Figures
J I
J I
Back Close
Full Screen / Esc
Printer-friendly Version
Interactive Discussion
EGU
Atmos. Chem. Phys. Discuss., 7, 4285–4403, 2007www.atmos-chem-phys-discuss.net/7/4285/2007/© Author(s) 2007. This work is licensedunder a Creative Commons License.
AtmosphericChemistry
and PhysicsDiscussions
Halogens and their role in polarboundary-layer ozone depletionW. R. Simpson1, R. von Glasow2, K. Riedel3, P. Anderson4, P. Ariya5,J. Bottenheim6, J. Burrows7, L. Carpenter8, U. Frieß9, M. E. Goodsite10,D. Heard11, M. Hutterli4, H.-W. Jacobi17, L. Kaleschke12, B. Neff13, J. Plane11,U. Platt9, A. Richter7, H. Roscoe4, R. Sander14, P. Shepson15, J. Sodeau16,A. Steffen6, T. Wagner9,14, and E. Wolff4
1Geophysical Institute and Department of Chemistry, University of Alaska Fairbanks,Fairbanks, AK, 99775-6160, USA2School of Environmental Sciences, University of East Anglia, Norwich, NR4 7TJ, UK3National Institute of Water and Atmospheric Research, Private Bag 14–901, Wellington, NewZealand4British Antarctic Survey, High Cross, Madingley Road, Cambridge CB3 0ET, UK5McGill University, Canada6Environment Canada, Toronto, Canada7Institute of Environmental Physics, University of Bremen, Bremen, Germany8Dept. of Chemistry, University of York , York YO10 5DD, UK9Institute for Environmental Physics, University of Heidelberg, Germany10University of Southern Denmark, Department of Chemistry and Physics, Campusvej 55DK5230 Odense M, Denmark
4285

ACPD7, 4285–4403, 2007
Halogens and polarboundary-layerozone depletion
W. R. Simpson et al.
Title Page
Abstract Introduction
Conclusions References
Tables Figures
J I
J I
Back Close
Full Screen / Esc
Printer-friendly Version
Interactive Discussion
EGU
11School of Chemistry, University of Leeds, Leeds, LS29JT, UK 12Center for Marine and At-mospheric Research , Institute of Oceanography, University of Hamburg, Bundesstrasse 53,20146 Hamburg, Germany 13NOAA/Earth System Research Laboratory, Boulder CO, USA14Air Chemistry Department, Max-Planck Institute of Chemistry, PO Box 3060, 55020 Mainz,Germany15Purdue Climate Change Research Center, 503 Northwestern Ave. West Lafayette, IN 47907,USA16Department of Chemistry, University College Cork, Ireland17Alfred Wegner Institute (AWI) for Polar and Marine Research, Bremerhaven, Germany
Received: 5 March 2007 – Accepted: 6 March 2007 – Published: 29 March 2007
Correspondence to: W. R. Simpson ([email protected])
4286

ACPD7, 4285–4403, 2007
Halogens and polarboundary-layerozone depletion
W. R. Simpson et al.
Title Page
Abstract Introduction
Conclusions References
Tables Figures
J I
J I
Back Close
Full Screen / Esc
Printer-friendly Version
Interactive Discussion
EGU
Abstract
During springtime in the polar regions, unique photochemistry converts inert halidesalts ions (e.g. Br−) into reactive halogen species (e.g. Br atoms and BrO) that de-plete ozone in the boundary layer to near zero levels. Since their discovery in thelate 1980s, research on ozone depletion events (ODEs) has made great advances;5
however many key processes remain poorly understood. In this article we review thehistory, chemistry, dependence on environmental conditions, and impacts of ODEs.This research has shown the central role of bromine photochemistry, but how salts aretransported from the ocean and are oxidized to become reactive halogen species inthe air is still not fully understood. Halogens other than bromine (chlorine and iodine)10
are also activated through incompletely understood mechanisms that are probably cou-pled to bromine chemistry. The main consequence of halogen activation is chemicaldestruction of ozone, which removes the primary precursor of atmospheric oxidation,and generation of reactive halogen atoms/oxides that become the primary oxidizingspecies. The different reactivity of halogens as compared to OH and ozone has broad15
impacts on atmospheric chemistry, including near complete removal and deposition ofmercury, alteration of oxidation fates for organic gases, and export of bromine into thefree troposphere. Recent changes in the climate of the Arctic and state of the Arctic seaice cover are likely to have strong effects on halogen activation and ODEs; however,more research is needed to make meaningful predictions of these changes.20
1 Introduction, history, and chemical mechanisms
1.1 Introduction
The Arctic and Antarctic, geographically remote as they may be, have a significant im-pact on the global atmosphere. They play an important role in the atmospheric andoceanic circulation and are regions where unusual chemical processes take place.25
4287

ACPD7, 4285–4403, 2007
Halogens and polarboundary-layerozone depletion
W. R. Simpson et al.
Title Page
Abstract Introduction
Conclusions References
Tables Figures
J I
J I
Back Close
Full Screen / Esc
Printer-friendly Version
Interactive Discussion
EGU
The glacial ice in polar regions represents an exceptional archive of atmospheric com-position histories, which can be extracted by ice coring. The Arctic, in particular, isinfluenced by pollution affecting the biosphere and indigenous people, for example bydeposition of mercury and persistent organic pollutants (POPs).
The atmospheres of the Arctic and Antarctic are unique. Dominated by cold tem-5
peratures, stable stratification of the boundary layer and unusual light conditions, theyare an exceptional natural laboratory to study atmospheric processes. The Antarc-tic atmosphere is pristine, dry and isolated from the rest of the atmosphere by thesurrounding Southern Ocean and the polar vortex. The Arctic, however, is stronglyinfluenced by seasonal atmospheric transport and anthropogenic emissions due to its10
vicinity to landmasses and highly industrialized countries.Lifetimes of chemical species are long in polar environments, especially during the
dark months of winter with a lack of photochemistry. The winter/spring Arctic pollutionphenomenon, known as Arctic haze (e.g. Mitchell, 1957; Schnell, 1983; Barrie et al.,1989; Shaw, 1995), is enhanced by inefficient dispersal of pollutants and slow removal15
rates (Barrie, 1986).Large areas in the polar regions are snow covered, providing an invaluable pale-
oarchive in the form of glacial ice cores (Legrand, 1997; Legrand and Mayewski, 1997;EPICA community members, 2004). Understanding polar atmospheric chemistry isessential for the interpretation of ice cores and to reconstruct past variations in atmo-20
spheric composition.Interest in Antarctic atmospheric chemistry intensified after it was postulated that
industrially produced halocarbons (particular chlorofluorocarbons, CFCs) could causesevere depletion in stratospheric ozone (Molina and Rowland, 1974). In the mid 1980s,the springtime stratospheric ozone hole over Antarctica was discovered (Farman et al.,25
1985). The ozone hole involves heterogeneous reactions on polar stratospheric cloudsthat lead to chlorine activation (Solomon et al., 1986).
Like the discovery of stratospheric ozone depletion, the observation of ozone de-pletion events within the polar boundary layer in the mid-1980s came as a surprise.
4288

ACPD7, 4285–4403, 2007
Halogens and polarboundary-layerozone depletion
W. R. Simpson et al.
Title Page
Abstract Introduction
Conclusions References
Tables Figures
J I
J I
Back Close
Full Screen / Esc
Printer-friendly Version
Interactive Discussion
EGU
Episodes of low surface ozone concentrations were measured at Barrow, Alaska(71◦ N, 157◦ W, Oltmans, 1981; Oltmans and Komhyr, 1986) and at Alert, northernCanada (82.5◦ N, 62.3◦ W, Bottenheim et al., 1986; Barrie et al., 1989) in late win-ter/early spring. Ozone levels drop from typical levels of >30 nmol/mol to below10 nmol/mol, or even below detection limit (Oltmans, 1981; Barrie et al., 1988). These5
episodes were called “ozone depletion events” (ODEs, Oltmans et al., 1989). After be-ing discovered in the Arctic, ODEs were also observed in the Antarctic boundary layer(Kreher et al., 1996, 1997; Wessel et al., 1998) prompting a variety of new field pro-grams and satellite investigations in the Antarctic. Interestingly, ODEs were observedin 1958 at Halley, but the data were forgotten until the late 1990s. For an historic10
overview, see Sect. 1.2.Early on, halogens were found to be involved in the ozone depletion process, since
strong ozone depletion events coincided with high levels of filterable bromine (f-Br)(Barrie et al., 1988). A bromine radical-catalyzed cycle involving Br and BrO was sug-gested (Barrie et al., 1988; Fan and Jacob, 1992; McConnell et al., 1992; Hausmann15
and Platt, 1994) with BrO+BrO→2Br+O2 as key reaction (for a detailed discussion ofthe chemical mechanism see Sect. 1.3). In contrast, stratospheric ozone depletionis dominated by chlorine chemistry (ClO self reaction forming the Cl2O2 dimer) andhalogen oxide cross reactions (Yung et al., 1980; McElroy et al., 1999).
Because ozone is the precursor for most atmospheric oxidizers, it generally controls20
the atmospheric oxidation potential. However, during ozone depletion events, ozone-dominated oxidation pathways become less important and unique halogen-dominatedoxidation pathways become most important. These new pathways alter lifetimes ofspecies and change their fates in the environment. A key example of this effect is thathalogens effectively oxidize gas-phase mercury and cause it to be transferred from the25
atmosphere to the snow, probably enhancing its bioavailability. This important topic isbriefly discussed in Sect. 4.1 and in more detail in an accompanying article (Steffenet al., 20071). Another example are volatile organic compounds (VOCs) that get very
1Steffen, A., Amyot, M., Ariya, P., Aspmo, K., Berg, T., Blum, J., Bottenheim, J., Brooks, S.,
4289
ACPD7, 4285–4403, 2007
Halogens and polarboundary-layerozone depletion
W. R. Simpson et al.
Title Page
Abstract Introduction
Conclusions References
Tables Figures
J I
J I
Back Close
Full Screen / Esc
Printer-friendly Version
Interactive Discussion
EGU
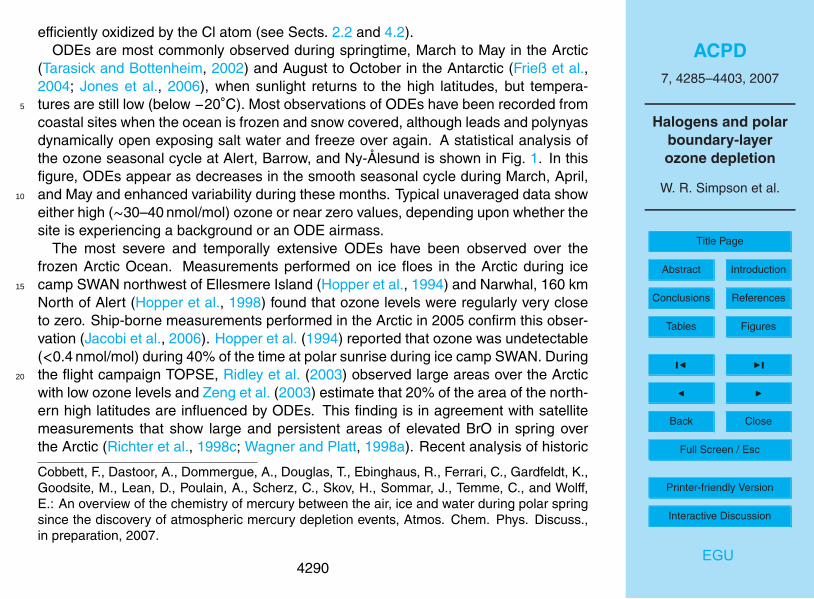
efficiently oxidized by the Cl atom (see Sects. 2.2 and 4.2).ODEs are most commonly observed during springtime, March to May in the Arctic
(Tarasick and Bottenheim, 2002) and August to October in the Antarctic (Frieß et al.,2004; Jones et al., 2006), when sunlight returns to the high latitudes, but tempera-tures are still low (below −20◦C). Most observations of ODEs have been recorded from5
coastal sites when the ocean is frozen and snow covered, although leads and polynyasdynamically open exposing salt water and freeze over again. A statistical analysis ofthe ozone seasonal cycle at Alert, Barrow, and Ny-Alesund is shown in Fig. 1. In thisfigure, ODEs appear as decreases in the smooth seasonal cycle during March, April,and May and enhanced variability during these months. Typical unaveraged data show10
either high (∼30–40 nmol/mol) ozone or near zero values, depending upon whether thesite is experiencing a background or an ODE airmass.
The most severe and temporally extensive ODEs have been observed over thefrozen Arctic Ocean. Measurements performed on ice floes in the Arctic during icecamp SWAN northwest of Ellesmere Island (Hopper et al., 1994) and Narwhal, 160 km15
North of Alert (Hopper et al., 1998) found that ozone levels were regularly very closeto zero. Ship-borne measurements performed in the Arctic in 2005 confirm this obser-vation (Jacobi et al., 2006). Hopper et al. (1994) reported that ozone was undetectable(<0.4 nmol/mol) during 40% of the time at polar sunrise during ice camp SWAN. Duringthe flight campaign TOPSE, Ridley et al. (2003) observed large areas over the Arctic20
with low ozone levels and Zeng et al. (2003) estimate that 20% of the area of the north-ern high latitudes are influenced by ODEs. This finding is in agreement with satellitemeasurements that show large and persistent areas of elevated BrO in spring overthe Arctic (Richter et al., 1998c; Wagner and Platt, 1998a). Recent analysis of historic
Cobbett, F., Dastoor, A., Dommergue, A., Douglas, T., Ebinghaus, R., Ferrari, C., Gardfeldt, K.,Goodsite, M., Lean, D., Poulain, A., Scherz, C., Skov, H., Sommar, J., Temme, C., and Wolff,E.: An overview of the chemistry of mercury between the air, ice and water during polar springsince the discovery of atmospheric mercury depletion events, Atmos. Chem. Phys. Discuss.,in preparation, 2007.
4290

ACPD7, 4285–4403, 2007
Halogens and polarboundary-layerozone depletion
W. R. Simpson et al.
Title Page
Abstract Introduction
Conclusions References
Tables Figures
J I
J I
Back Close
Full Screen / Esc
Printer-friendly Version
Interactive Discussion
EGU
ozone data from 1958 showed depleted ozone also in the Antarctic boundary layerin the middle of winter (Roscoe and Roscoe, 2006), suggesting a different chemicalmechanism since no sunlight is available for photolytical reactions.
The main source for reactive bromine species (Br and BrO) is bromide from seasalt that is released via photochemical reactions known as the bromine explosion (see5
Sect. 1.3). Also biogenic oceanic sources have been discussed recently (Yang et al.,2005; Salawitch, 2006) but are probably of smaller importance for polar regions. It isstill unclear how bromide from sea salt is released to the gas phase but interactionsbetween snow/ice surfaces and the atmosphere probably play an important role. Sea-ice surfaces, aerosol, brine, and frost flowers – delicate ice crystals that grow out of10
the vapor phase and transport concentrated brines of young sea-ice – have raised a lotof interest as bromine source in recent investigations. However, the question remainsunsolved so far and is discussed in detail in Sect. 3.1 of this article.
Ozone depletions occur mostly over the frozen ocean, as supported by aircraft (Ri-dley et al., 2003), ground based ice camp (Hopper et al., 1994, 1998), and ship-borne15
observations (Jacobi et al., 2006). Satellite observations of BrO also indicate that itis present mostly over the frozen ocean, thus indirectly indicating O3 depletion overfrozen oceans (Richter et al., 1998c; Wagner and Platt, 1998a; Wagner et al., 2001).However, depleted air masses can also be transported to lower latitudes or over land.When discussing ODEs, it is important to distinguish between advection of ozone de-20
pleted air masses to a measuring site (meteorology controlled), local chemical ozonedepletion (chemistry controlled) and a combination of the two.
Section 3.2 contains further discussion of the relationship between boundary layerstructure and ozone depletion episodes. Transport-controlled ODEs can be very rapidin their onset (timescale of minutes, Morin et al., 2005), associated with significant O325
loss and wind speed and direction changes (Jones et al., 2006), while chemically con-trolled ODEs appear normally much more gradual and are not as intense (Jones et al.,2006). However, some fast O3 depletions (∼7 h) have been linked to local chemistry(Jacobi et al., 2006). The duration of ODEs at coastal sites is typically between 1–3
4291

ACPD7, 4285–4403, 2007
Halogens and polarboundary-layerozone depletion
W. R. Simpson et al.
Title Page
Abstract Introduction
Conclusions References
Tables Figures
J I
J I
Back Close
Full Screen / Esc
Printer-friendly Version
Interactive Discussion
EGU
days, depending on meteorology. During ALERT2000, a 9-day period with basicallyno ozone occurred, one of the longest ODEs ever recorded at Alert (Bottenheim et al.,2002; Strong et al., 2002). In April 1992 during ice camp SWAN, Hopper et al. (1994)detected no ozone for a period of 18 days. From the analysis of historical ozonesonderecords, Tarasick and Bottenheim (2002) concluded that springtime surface tempera-5
tures below −20◦C seem to be required for the occurrence of ODEs. However, obser-vations of BrO at above freezing temperatures over salt lakes and lake beds indicatethat cold temperatures are not a prerequisite for halogen activation (e.g. Hebestreitet al., 1999, see also Sect. 2.1.3).
The end of an ODE is largely determined by meteorology since vertical or horizon-10
tal mixing with O3-rich air is required to replenish O3 as chemical O3 production isgenerally not sufficient for a recovery (due to low NOx).
The frequency of ODEs at other Arctic and some Antarctic stations was analyzedfrom historical ozonesonde records by Tarasick et al. (2005). ODEs occurred frequentlyat Barrow, Resolute, Eureka and Alert. Other Arctic stations like Ny-Alesund for exam-15
ple experienced fewer ODEs probably due to less nearby ice coverage and warmerconditions.
Vertically, most ODEs extend from the surface to 100–400 m (Mickle et al., 1989;Leaitch et al., 1994; Anlauf et al., 1994; Gong et al., 1997; Bottenheim et al., 2002;Strong et al., 2002; Tackett et al., 2007), but the depth can increase during the season,20
from 100–200 m in early spring to as high as 1 km altitude in late spring (Bottenheimet al., 2002; Ridley et al., 2003). Solberg et al. (1996) found that during some episodesin the Norwegian Arctic ozone was nearly completely depleted up to 2 km altitude.DOAS measurements at Alert (Honninger and Platt, 2002), Hudson Bay (Honningeret al., 2004b), and Neumayer, Antarctica (Frieß et al., 2004) showed that BrO-enriched25
air is often found at the surface but can be lifted to elevations of up to 4 km (Frieß et al.,2004).
This review article presents our current knowledge on tropospheric ozone depletionin the Arctic and Antarctic. It combines a historical review of the discovery of the phe-
4292

ACPD7, 4285–4403, 2007
Halogens and polarboundary-layerozone depletion
W. R. Simpson et al.
Title Page
Abstract Introduction
Conclusions References
Tables Figures
J I
J I
Back Close
Full Screen / Esc
Printer-friendly Version
Interactive Discussion
EGU
nomenon (in Sect. 1.2) with the most recent laboratory, modeling, remote sensing, andfield results. Chemical reaction mechanisms for bromine, chlorine and iodine are dis-cussed in Sect. 1.3. Methods involved in study of ODEs are discussed in Sect. 1.4,while observations of halogens and their roles in ODEs are discussed in Sect. 2. Theinfluence of sea ice, boundary layer meteorology and photochemistry on ODEs is dis-5
cussed in Sect. 3, while the impacts of ODEs on mercury deposition, ice cores, thefree troposphere and other aspects of polar chemistry are described in Sect. 4. Openquestions and future implications are highlighted in Sect. 5 of this article.
1.2 Historic overview of the discovery of ODEs
The first reports on surface ozone depletion in the Arctic date from the 1980s. In a10
paper on surface ozone measurements in clean air, Oltmans (1981) noted that thegreatest day-to-day changes in O3 occurred at Barrow during the spring. Similarly,Bottenheim et al. (1986) reported a significant (and quite variable) decrease in O3levels at Alert without being able to explain these observations. The key to the un-derstanding of the Arctic surface ozone depletion came shortly afterwards. During the15
second AGASP campaign (Arctic Gas and Aerosol Sampling Program; see Table 1 foran overview of major field campaigns related to ODEs) in 1986, ozone was sampledtogether with Br collection on cellulose filters. Atmospheric bromine was chosen to bestudied because of another curious observation in spring, the occurrence of “excessof filterable bromine” (f-Br), bromine that could not be explained from windblown dust,20
sea salt, or automobile fuel additives (Berg et al., 1983; Sturges, 1990). Ozone andf-Br data from spring 1986 at Alert (Fig. 2) show the now classical strong negative cor-relation (Barrie et al., 1988). Barrie et al. (1988) hypothesized that the chemical mech-anism of O3 depletion involves a bromine-catalyzed chain reaction and that photolysisof bromoform (CHBr3) could be the source of Br atoms. They speculated that hetero-25
geneous chemistry on ice surfaces could be involved. In subsequent years knowledgeadvanced through intensive field campaigns as well as laboratory and modeling stud-ies. A chronology of major field campaigns in the Arctic follows (Table 1).
4293

ACPD7, 4285–4403, 2007
Halogens and polarboundary-layerozone depletion
W. R. Simpson et al.
Title Page
Abstract Introduction
Conclusions References
Tables Figures
J I
J I
Back Close
Full Screen / Esc
Printer-friendly Version
Interactive Discussion
EGU
The first field campaign dedicated to the study of ODEs was the Polar Sunrise Ex-periment 1988, PSE88, see Bottenheim et al. (1990) at Alert, Canada. The PSE88campaign involved studies that investigated the bromoform photolysis hypothesis pro-posed by Barrie et al. (1988). Indeed, during PSE88 a strong negative correlationbetween O3 and CHBr3 was observed, results that were confirmed during the sec-5
ond Polar Sunrise Experiment at Alert in 1992 (PSE92, Yokouchi et al., 1994). Sim-ilar correlations were observed at Barrow during the AGASP-III experiment in 1989(Sturges and Shaw, 1993). However, CHBr3 photochemistry as cause for O3 deple-tion was ruled out after absorption spectra of CHBr3 were obtained and spectroscopicdata were analysed (Moortgat et al., 1993). Using this cross section, the photolytic10
lifetime of bromoform under Arctic springtime conditions is ∼100 days (Simpson et al.,2002), indicating that very little of the reactive bromine could come from the relativelylow observed concentrations of bromoform (Yokouchi et al., 1996). Nevertheless, atruly satisfactory explanation for the strong CHBr3-O3 correlation was not found. It hasbeen proposed that reactive halogen chemistry during ODEs could in fact be produc-15
ing halocarbon gases (Carpenter et al., 2005b), possibly explaining high halocarbongas abundances during ODEs (see Sect. 3.3.2). Based on trajectory calculations andsatellite images Sturges and Shaw (1993) deduced that high levels of CHBr3 were dueto recent passage (<24 h) of the air over open leads in the ice. This implied that O3 de-pletion also must have occurred within the same time period. Another important result20
from AGASP-III, which was largely an aircraft campaign, was that O3 depletion in themarine boundary layer was observed commonly over the Arctic Ocean (Sheridan et al.,1993). They also confirmed that f-Br was mostly particlulate Br, and not gas-phase HBr(Sturges and Shaw, 1993; Sturges et al., 1993).
During PSE92 (Barrie et al., 1994), long-path DOAS measurements confirmed for25
the first time the role of BrO (Hausmann and Platt, 1994) and Jobson et al. (1994)showed that Cl atom chemistry, although not driving O3 depletion, was taking place,confirming speculations by Kieser et al. (1993).
During a three-week study at ice camp SWAN, O3 was depleted over the Arctic
4294

ACPD7, 4285–4403, 2007
Halogens and polarboundary-layerozone depletion
W. R. Simpson et al.
Title Page
Abstract Introduction
Conclusions References
Tables Figures
J I
J I
Back Close
Full Screen / Esc
Printer-friendly Version
Interactive Discussion
EGU
ocean for most of the time and only increased due to turbulent mixing of ozone-richair from aloft (Hopper et al., 1994). Ingenious methods were designed and employedto measure “photolysable bromine” (Impey et al., 1997b) and in-situ BrO (Mihele andHastie, 1998). Furthermore, continuing efforts were made to determine low molecularweight carbonyl compounds (formaldehyde CH2O, acetaldehyde CH3CHO, acetone5
CH3COCH3), as they were thought to play an important role in the cycling of reac-tive bromine (Barrie et al., 1988). During PSE92, de Serves (1994) made on-sitemeasurements and found CH2O levels much higher than predicted by Barrie et al.(1988), based on a gas phase production mechanism. Studies using the DNPH (2,4-Dinitrophenylhydrazine) technique (Shepson et al., 1996) yielded similar high concen-10
trations, which were explained during PSE98, when it was discovered that gas phaseHCHO was emitted from the snow (Fuhrer et al., 1996; Hutterli et al., 1999; Sumnerand Shepson, 1999). At the same time, Honrath et al. (1999) discovered at Summitthat NOx was produced in sunlit snow. These unexpected discoveries of active snowpack chemistry became a major topic of research, giving rise to summer projects at15
Summit in 1999, 2000, 2001, 2002, 2003, 2004, and 2006, the ALERT2000 campaign,and the South Pole campaigns in 1998, 2000, and 2003 (for further information seethe accompanying snow photochemistry review, Grannas et al., 2007). It was shownthat O3, once in the snow pack, is short lived (Bottenheim et al., 2002), that molecularhalogens (Br2, BrCl) are produced in the snow (Foster et al., 2001) along with several20
other species like NOx, HONO and VOCs, and that oxidized mercury (Hg(II)) can bephoto-reduced in the snow leading to re-emission of elemental Hg into the atmosphere(see also the accompanying mercury review, Steffen et al., 20071).
While many discoveries have first been made in the Arctic, these processes havesubsequently been observed to varying degrees in the Antarctic. Boundary layer O325
depletion in the Antarctic was first observed in the mid-1990s (Kreher et al., 1996, 1997;Wessel et al., 1998) also reporting the presence of BrO (Kreher et al., 1997). Sincethen, many more Antarctic field (Rankin et al., 2002; Wolff et al., 2003; Frieß et al.,2004; Jones et al., 2006; Kalnajs and Avallone, 2006) and satellite studies (Wagner
4295

ACPD7, 4285–4403, 2007
Halogens and polarboundary-layerozone depletion
W. R. Simpson et al.
Title Page
Abstract Introduction
Conclusions References
Tables Figures
J I
J I
Back Close
Full Screen / Esc
Printer-friendly Version
Interactive Discussion
EGU
and Platt, 1998a; Richter et al., 1998c; Hegels et al., 1998a; Kaleschke et al., 2004)have been performed. Analysis of historical surface ozone data from Halley has shownthat ozone depletion events were observed as early as 1957 during the InternationalGeophysical Year (Roscoe and Roscoe, 2006).
1.3 Key reactions and cycles5
In this section, we discuss key chemical reactions and reaction cycles involved in ozonedepletion chemistry. This discussion is not meant to be a complete discussion of allhalogen chemistry; the interested reader is referred to recent reviews on this topic(Wayne et al., 1995; Platt and Janssen, 1995; Platt and Moortgat, 1999; Platt andHonninger, 2003; von Glasow and Crutzen, 2003, 2007). The overall catalytic ozone10
destruction mechanism involves halogen atoms (denoted by X, Y, where X, Y=Cl, Br,or I) that cycle between their atomic forms and their oxides, XO. Halogen atoms areformed from precursors such as Br2, BrCl, HOBr, etc., as discussed below. The typ-ical fate of an atomic halogen radical is to react with ozone, forming a halogen oxidemolecule.15
X + O3 → XO + O2 (R1)
Typical conversion times (at 40 nmol/mol O3) via Reaction (R1) for Cl are around 0.1 sand of the order of 1 s for Br and I atoms. Halogen atoms are regenerated in a series ofreactions including photolysis of XO, which is of importance for X=I, Br and to a minorextent Cl,20
XO + hν → X + O (J2)
For this reaction, typical springtime Arctic daytime values of Eq. (J2) are ∼3×10⁻⁵ s−1,∼4×10⁻² s−1, and 0.2 s−1 for X=Cl, Br, I, respectively. Often the photolysis of halogenoxides is the fastest decay of those species, thus the partitioning of X/XO is controlledby a balance of Reactions (R1) and (J2). Because of this rapid cycling, the sum of25
Br+BrO is called the BrOx family. For bromine, during the day and at high ozone, BrO4296
ACPD7, 4285–4403, 2007
Halogens and polarboundary-layerozone depletion
W. R. Simpson et al.
Title Page
Abstract Introduction
Conclusions References
Tables Figures
J I
J I
Back Close
Full Screen / Esc
Printer-friendly Version
Interactive Discussion
EGU
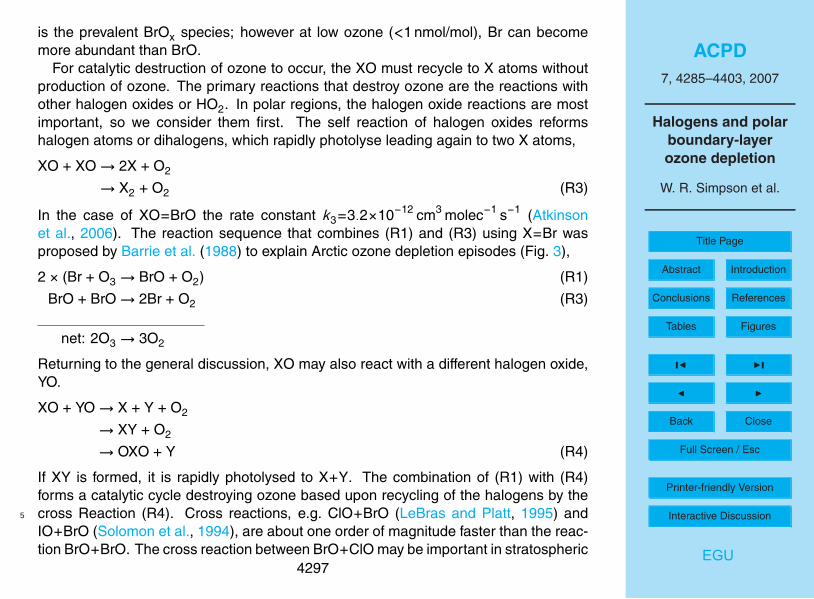
is the prevalent BrOx species; however at low ozone (<1 nmol/mol), Br can becomemore abundant than BrO.
For catalytic destruction of ozone to occur, the XO must recycle to X atoms withoutproduction of ozone. The primary reactions that destroy ozone are the reactions withother halogen oxides or HO2. In polar regions, the halogen oxide reactions are mostimportant, so we consider them first. The self reaction of halogen oxides reformshalogen atoms or dihalogens, which rapidly photolyse leading again to two X atoms,
XO + XO → 2X + O2
→ X2 + O2 (R3)
In the case of XO=BrO the rate constant k3=3.2×10⁻¹² cm3 molec−1 s−1 (Atkinsonet al., 2006). The reaction sequence that combines (R1) and (R3) using X=Br wasproposed by Barrie et al. (1988) to explain Arctic ozone depletion episodes (Fig. 3),
2 × (Br + O3 → BrO + O2) (R1)
BrO + BrO → 2Br + O2 (R3)
net: 2O3 → 3O2
Returning to the general discussion, XO may also react with a different halogen oxide,YO.
XO + YO → X + Y + O2
→ XY + O2
→ OXO + Y (R4)
If XY is formed, it is rapidly photolysed to X+Y. The combination of (R1) with (R4)forms a catalytic cycle destroying ozone based upon recycling of the halogens by thecross Reaction (R4). Cross reactions, e.g. ClO+BrO (LeBras and Platt, 1995) and5
IO+BrO (Solomon et al., 1994), are about one order of magnitude faster than the reac-tion BrO+BrO. The cross reaction between BrO+ClO may be important in stratospheric
4297

ACPD7, 4285–4403, 2007
Halogens and polarboundary-layerozone depletion
W. R. Simpson et al.
Title Page
Abstract Introduction
Conclusions References
Tables Figures
J I
J I
Back Close
Full Screen / Esc
Printer-friendly Version
Interactive Discussion
EGU
polar halogen chemistry but there is no clear evidence for the presence of significantamounts of ClO in the polar boundary layer (see Sect. 2.2). Recently, very high con-centrations of IO have been observed at Halley in the Antarctic, so that the reactionBrO+IO might play a key role under these conditions (see Sect. 2.3). The channelleading to OXO is uncommon except for the case of iodine (see discussion at end of5
this section).Another ozone destruction scheme involves reactions of halogen oxides with HO2
and follows the sequence:
X + O3 → XO + O2 (R1)
XO + HO2 → HOX + O2 (R5)
HOX + hν → X + OH (R6)
OH + CO + O2 → CO2 + HO2 (R7)
net: CO + O3 → CO2 + O2
In this scheme, a key reaction is XO+HO2, which is very fast (several times10−11 cm3 molec−1 s−1, Knight and Crowley, 2001). An analogous reaction ofXO+CH3O2 is also likely to ultimately produce HOX (Aranda et al., 1997). The abovesequence oxidizes CO to CO2, but other reactions similar to R7 involving hydrocarbons10
may be substituted for Reaction (R7).All three of these types of reaction cycles, self reaction (XO+XO), cross reaction
(XO+YO), and XO+HO2 catalytically destroy ozone at times when halogen atoms andhalogen oxides are present in the atmosphere. However, these cycles do not increasethe reactive stock of halogen atoms and halogen oxides (X and XO). A special se-quence of chemical reactions, often known as the “bromine explosion” reactions, isable to produce reactive halogen gases, and is thought be the source of the majorityof reactive halogens during ozone depletion events (Fan and Jacob, 1992; McConnellet al., 1992; Platt and Lehrer, 1996; Tang and McConnell, 1996; Wennberg, 1999). The
4298

ACPD7, 4285–4403, 2007
Halogens and polarboundary-layerozone depletion
W. R. Simpson et al.
Title Page
Abstract Introduction
Conclusions References
Tables Figures
J I
J I
Back Close
Full Screen / Esc
Printer-friendly Version
Interactive Discussion
EGU
bromine explosion reaction sequence is
HOBr + Br− + H+ mp→ H2O + Br2 (R8)
Br2 + hν → 2Br (R9)
Br + O3 → BrO + O2 (R1)
BrO + HO2 → HOBr + O2 (R5)
net: H+ + Br− + HO2 + O3mp,hν→ Br + H2O + 2O2
In this sequence, graphically depicted in Fig. 4, reactive bromine is produced by HO2oxidizing bromide (Br−), most often from sea salt and present in solution or on icesurfaces. The multiphase reaction involvement is shown in Reaction (R8) by the short-hand “mp”, highlighting its importance. The sequence is autocatalytic, meaning thatthe product is a reactive halogen species that then acts as a catalyst, further speeding5
up the reaction. It is important to remember that this reaction consumes HOx, bromide(Br−) and protons (acidity), all of which are critical to subsequent discussions in thispaper.
Another equivalent method to consider the bromine explosion chemistry is to notview the net reaction above, but instead consider an inventory of inactive (e.g. Br−)10
and reactive bromine species. Reaction (R8) consumes one reactive bromine species(HOBr) but produces Br2, the precursor of two reactive bromine species (two Br atoms).Therefore, effectively, one BrOx molecule is converted into two by oxidizing bromide atthe surface e.g. of brine or dry sea salt on sea ice or aerosol. This process leads toan exponential growth of the BrO concentration in the atmosphere, which led to the15
term bromine explosion (Platt and Janssen, 1995; Platt and Lehrer, 1996; Wennberg,1999). Recent laboratory investigations have shown that the above heterogeneousreaction is efficient and thus this sequence can produce BrOx in the troposphere (e.g.Kirchner et al., 1997; Abbatt, 1994; Abbatt and Nowak, 1997; Fickert et al., 1999; Huffand Abbatt, 2000, 2002; Adams et al., 2002).20
4299
ACPD7, 4285–4403, 2007
Halogens and polarboundary-layerozone depletion
W. R. Simpson et al.
Title Page
Abstract Introduction
Conclusions References
Tables Figures
J I
J I
Back Close
Full Screen / Esc
Printer-friendly Version
Interactive Discussion
EGU
The actual mechanism of R8 has been the subject of a number of laboratory studies(Fickert et al., 1999; Huff and Abbatt, 2000, 2002; Adams et al., 2002). These studiesconsidered the source of the halides (Cl− and Br−) to be sea salt. In sea salt the Cl−/Br−
ratio is about 650, but in experiments the Cl−/Br− ratios were varied to elucidate themechanism. When the concentration of Br is decreased below the sea salt ratio, anincreasing fraction of BrCl is produced, while at high relative Br/Cl ratios, Br2 is thepreferred product (Adams et al., 2002). The following sequence was first suggested byVogt et al. (1996) and later laboratory experiments (Fickert et al., 1999) were consistentwith this mechanism.
HOBr + Cl− + H+ mp→ H2O + BrCl (R10)
BrCl + Br−aq� Br2Cl− (R11)
Br2Cl−aq� Br2 + Cl− (R12)
net: HOBr + Br− + H+ mp→ H2O + Br2 (R8)
Field evidence supporting this scheme comes from the observation that both BrCl andBr2. are produced from the snow pack (Foster et al., 2001). Additionally, the Br−/Cl− ra-tio in snow has been found to be very variable possibly due to these reactions removingbromide from snow and gas-phase HBr adding Br− back (Simpson et al., 2005). Whenall bromide is used up and the forward Reaction (R12) cannot proceed, BrCl can es-5
cape from the surface. It is then photolysed to produce reactive chlorine atoms, whichthen typically react with hydrocarbons, reducing their impact on tropospheric ozonedestruction,
Cl + RH → HCl + R. (R13)
The relevance of reactive chlorine is discussed further in Sect. 2.2. The high abun-10
dance of hydrocarbons in the troposphere (e.g. methane) leads to the fate of nearly50% of reactive Cl atoms to be converted to HCl by Reaction (R13).
4300

ACPD7, 4285–4403, 2007
Halogens and polarboundary-layerozone depletion
W. R. Simpson et al.
Title Page
Abstract Introduction
Conclusions References
Tables Figures
J I
J I
Back Close
Full Screen / Esc
Printer-friendly Version
Interactive Discussion
EGU
The concept of lifetimes and fates of various XOx species is very useful when con-sidering the relative importance of the various halogen atoms. The lifetime of XO israther short during periods of sunlight being limited by photolysis (J2) to time periodsbetween a few seconds (IO), about two minutes (BrO), and roughly one hour (ClO). Ifhigh levels of halogen oxides are present (e.g. 30 pmol/mol of BrO found in the polar5
boundary layer would lead to a few minutes lifetime of XO), self reaction can be themost efficient in converting XO to X. Once halogen atoms are released they are, how-ever, quite likely to reform XO by reaction with O3 (Reaction R1), the probability rangesfrom >99% for I to up to 99% for Br to ∼50% for Cl. This gas-phase recycling of X toXO leads to an effective lifetime of XOx given by10
τXOx= τXO
rate of X + O3
rate of X + not(O3). (1)
For ClOx this translates to daytime lifetimes between about two hours (at low levelsof BrO) to several minutes (at 30 pmol/mol of BrO), since Cl atoms react with theubiquitous methane, as mentioned above. On the other hand Br atoms only reactwith aldehydes, olefins, or HO2 radicals, thus re-conversion to BrO (via Reaction R115
and causing O3 depletion) is most likely at normal ozone levels, consequently BrOxlifetimes are quite long despite rapid photolysis of BrO. In fact BrOx lifetimes typicallyreach several hours, with relatively little influence from XO levels. On the other hand, inpolar regions the time to destroy ozone is of the order of one day, thus BrOx needs tobe recycled from bromide on surfaces about 10 times during a typical ozone depletion20
event (Platt and Lehrer, 1996; Platt and Honninger, 2003; Lehrer et al., 2004).Based upon the autocatalytic mechanism’s ability to convert nonreactive salt bro-
mide into reactive bromine, it is currently assumed that most of the reactive brominecomes from sea salt that is activated by this mechanism. Early ideas that the major-ity of the reactive bromine might come from organobromine gases (e.g. CHBr3, Barrie25
et al., 1988) or coupling with reactive nitrogen gases (e.g. N2O5, Finlayson-Pitts et al.,1990) have now been discounted because they are not a sufficiently strong brominesource to explain the rate of ozone destruction or observed BrO levels. However, the
4301
ACPD7, 4285–4403, 2007
Halogens and polarboundary-layerozone depletion
W. R. Simpson et al.
Title Page
Abstract Introduction
Conclusions References
Tables Figures
J I
J I
Back Close
Full Screen / Esc
Printer-friendly Version
Interactive Discussion
EGU
bromine explosion chemistry requires a source of “seed” reactive halogens that initi-ate the explosion. There may be a role for these or other relatively weak sources ofreactive halogen species in providing the “seed” for the explosion. Other possible ini-tiators of bromine chemistry are interhalogen reactions, discussed in recent halogenchemistry review articles (e.g. von Glasow and Crutzen, 2003, 2007). The complexity5
of these reactions and interactions is illustrated in Fig. 5, which highlights interhalogencouplings. More recent investigations have shown that iodine must also be included inthe scheme (see Sects. 2.3 and 2.4).
Recent laboratory studies of gas-phase halogen chemistry have focused on iodineoxide chemistry, in order to quantify the efficiency of O3 destruction (Vogt et al., 1999)10
and to understand the formation of new particles (O’Dowd and Hoffmann, 2005). TheIO self-reaction produces OIO (∼40%) and IOIO (∼55%) at atmospheric pressure. TheIOIO product is unstable and most likely rapidly thermally decomposes to yield OIO,so that the overall yield of OIO from the IO self-reaction is high. The photolysis of OIOto O(3P)+IO is very unlikely to occur, it has an upper limit for the quantum yield of15
7×10⁻³ (Ingham et al., 2000). OIO has a series of strong absorption bands between480 and 620 nm, where photolysis to yield I+O2 is possible and would make OIO for-mation through the IO self reaction a major O3-depleting cycle (Ashworth et al., 2002).Although two recent studies report upper limits to the I atom quantum yield of <0.05(560–580 nm) and <0.24 (532 nm) (Joseph et al., 2005; Tucceri et al., 2006), a small20
probability of photolysis at wavelengths >470 nm, integrated over the entire OIO ab-sorption band would still lead to significant photochemical conversion of OIO to I andconsequent O3 loss.
1.4 Observational, modeling, and laboratory methods
1.4.1 Observations25
Most direct observations of halogen compounds in the polar troposphere rely on opticalabsorption measurements. Halogen oxides have narrow band absorption structures
4302

ACPD7, 4285–4403, 2007
Halogens and polarboundary-layerozone depletion
W. R. Simpson et al.
Title Page
Abstract Introduction
Conclusions References
Tables Figures
J I
J I
Back Close
Full Screen / Esc
Printer-friendly Version
Interactive Discussion
EGU
at UV and visible wavelengths, and BrO, IO, and tentatively also ClO have been ob-served by active Differential Optical Absorption Spectroscopy (long-path DOAS) mea-surements using a strong light source and an open path (e.g. Hausmann and Platt,1994; Martinez et al., 1999; Saiz-Lopez et al., 2006). The technique can also be usedfor OIO, OClO, and I2, but no results have been reported so far for polar regions.5
The same species can be detected using atmospherically scattered light with passiveDOAS instruments, and polar measurements have been reported for BrO and IO (e.g.Kreher et al., 1997; Wittrock et al., 2000; Frieß et al., 2001; Honninger and Platt, 2002;Honninger et al., 2004b). Later observations use the multiple axis DOAS (Honningeret al., 2004c) technique, which has the advantage of being able to separate clearly the10
tropospheric and stratospheric portions of the atmospheric column, and even derive acrude vertical profile. An overview of these ground-based measurements can be foundin the electronic supplement (http://www.atmos-chem-phys-discuss.net/7/4285/2007/acpd-7-4285-2007-supplement.pdf).
Global maps of BrO columns can be retrieved with the DOAS technique from satellite15
measurements by instruments such as GOME, SCIAMACHY or OMI (e.g. Wagner andPlatt, 1998a; Richter et al., 1998c) (Table 2). In principle, it should be possible to extendthese BrO observations to other halogen species, but this has not yet been achieved.Satellite data provide good coverage but have to be corrected for stratospheric BrO, thevertical distribution of BrO, and cloud effects in the troposphere, introducing substantial20
uncertainties. In-situ measurements of BrO and potentially also ClO are possible usingthe atomic fluorescence method (e.g. Avallone et al., 2003) to determine the verticalprofile of BrO in the lowest several meters. Compared to stratospheric measurements,this technique is less accurate in the boundary layer (as result of the higher pres-sure). With another in-situ method, atmospheric pressure chemical ionization mass25
spectrometry, Br2, BrCl, and Cl2 can be observed (Foster et al., 2001; Spicer et al.,2002). Indirect evidence for the presence of enhanced levels of chlorine atoms can beobtained from measurements of hydrocarbons, chosen to have rate constants that aresimilar for reaction with Cl but different for OH or vice versa (this method is known as
4303

ACPD7, 4285–4403, 2007
Halogens and polarboundary-layerozone depletion
W. R. Simpson et al.
Title Page
Abstract Introduction
Conclusions References
Tables Figures
J I
J I
Back Close
Full Screen / Esc
Printer-friendly Version
Interactive Discussion
EGU
the hydrocarbon clock method; see Jobson et al., 1994). The analysis of halogenatedVOCs, formed by the reaction of ethene and propene with Cl and Br atoms, providesa valuable method to determine [Br]/[Cl] ratios (Keil and Shepson, 2006). The sum ofphotolysable bromine compounds can also be measured by conversion to bromoace-tone and subsequent GC analysis (Impey et al., 1999). See Sect. 2.2 for more details5
on these techniques.
1.4.2 Models
Numerical models have been developed to test our understanding of the processes in-volved in bromine explosions and ODEs as well as the consequences for the chemistryof the atmosphere. Most of these are box models focusing on the chemical reaction10
mechanism. Some include parameterizations of varying complexity for heterogeneousreactions (McConnell et al., 1992; Tang and McConnell, 1996), some explicitly includeheterogeneous reactions (Fan and Jacob, 1992; Sander et al., 1997; Michalowski et al.,2000; Evans et al., 2003). Similarly, the treatment of photochemical processes in thesnow pack has explicitly only been done by Michalowski et al. (2000). These pro-15
cesses are discussed in detail in the snow photochemistry companion paper (Grannaset al., 2007). One-dimensional studies have investigated the vertical structure of ODEs(Lehrer et al., 2004; Piot and von Glasow, 20072). Three-dimensional models haveso far only used very simple approaches regarding the chemical processes, like esti-mating ozone destruction based on satellite-derived vertical BrO columns (Zeng et al.,20
2003). One common problem of all models is that many processes, especially thesource of the bromine for the bromine explosions and the triggering of these events,are still not understood and therefore have to be prescribed/parameterized in the mod-els. Progress in these fields will strongly increase our ability to simulate ODEs and lead
2Piot, M. and von Glasow, R.: The Potential Importance of Frost Flowers, Recycling onSnow, and Open Leads for Ozone Depletion Events, Atmos. Chem. Phys. Discuss., submitted,2007.
4304
ACPD7, 4285–4403, 2007
Halogens and polarboundary-layerozone depletion
W. R. Simpson et al.
Title Page
Abstract Introduction
Conclusions References
Tables Figures
J I
J I
Back Close
Full Screen / Esc
Printer-friendly Version
Interactive Discussion
EGU
to a better understanding of polar chemistry in general.
1.4.3 Laboratory methods
Laboratory measurements have contributed significantly to improve our understandingof the chemical processes behind the bromine explosion and snow and ice chemistry.One of the main advantages of laboratory experiments is that good control of conditions5
is possible, which leads to ready and systematic variation of suspected key features.The techniques that are typically used for the investigation of rate coefficients, prod-
ucts / mechanisms, photolysis cross sections and quantum yields of gas phase re-actions are, flow reactors, flash or pulse photolysis, or smog chambers with a multi-tude of techniques to measure the products, like UV/VIS/IR spectroscopy, mass spec-10
troscopy, cavity ring down spectroscopy (see e.g. Finlayson-Pitts and Pitts, 2000, foran overview).
A special challenge is posed by reactions on surfaces like snow and ice or liquidor solid aerosol particles, all of which play a major role in ODEs. One example forthe involved complications is that at typical polar temperatures, hundreds to thousands15
of monolayers of ice desorb per second. This desorption is balanced by adsorptionof water vapor onto the surface, resulting in a very dynamic equilibrium at the sur-face. The ice surfaces in the environment are very complex, and include natural snow,slush, solid ice and quasi-liquid layers (QLL) on their surfaces. Artificial snow, withits amorphous and crystalline characteristics, may not be always representative of the20
true solid/slush/QLL conditions found in the environment. However, several success-ful attempts have been made to investigate frost flowers (Martin et al., 1995, 1996;Nghiem et al., 1997; Hutterli et al., 2006), snow (Jacobi and Hilker, 2007) and sea-ice(Richardson, 1976; Adams et al., 2002; Papadimitriou et al., 2003) in the laboratory.
Other laboratory experiments focus on the kinetics and mechanisms of gas-phase25
halogen release from surfaces. They can be divided into three main types: (1) Flowtubes; these experiments provide information on gas-solid partitioning including reac-tive and non-reactive uptake. (2) Surface probes; these techniques provide character-
4305
ACPD7, 4285–4403, 2007
Halogens and polarboundary-layerozone depletion
W. R. Simpson et al.
Title Page
Abstract Introduction
Conclusions References
Tables Figures
J I
J I
Back Close
Full Screen / Esc
Printer-friendly Version
Interactive Discussion
EGU
ization of surface and bulk species can be made using a wide range of spectroscopictechniques. (3) Bulk analyses; these techniques examine the net reactivity of ice andgases in contact with them and can be monitored by a variety of approaches includingmass spectrometry. The frozen solids are often analyzed by methods including X-raydiffraction (XRD) and Raman spectroscopy. Much of the bulk analysis is performed on5
thawed material, which is problematic for interpretation because the effective surfaceconcentrations of ions and molecules at ice surfaces may be very different from themelted analysis. For example, the pH of the melt might be quite different from the ef-fective pH of molecules on the surface of ice. Two recent reviews are particularly usefulfor a more in-depth discussion of this subject (Huthwelker et al., 2006; Abbatt, 2003).10
When ice freezes, ions separate from ice, leading to freeze-concentrated solu-tions that have different reactivity from the unfrozen solution (see Sect. 3.1). Freeze-concentration effects have been used to explain the effect of cooling on a variety ofacidified and neutral, nitrite ion and bromide- or chloride-containing mixtures. In labo-ratory studies, several trihalide ions were formed, including I2Cl−, I2Br−, ICl−2 and IBr−215
(O’Driscoll et al., 2006). A mechanism to explain the observations was given in terms ofreaction steps involving INO and the nitroacidium ion, H2ONO+, within liquid “microp-ockets”. These and similar reactions in liquid inclusions of ice are likely to be critical tounderstanding air-ice chemistry that relates to halogen activation and ozone depletionevents.20
2 Halogens and their roles in ODEs
2.1 Bromine
As already discussed in Sect. 1, bromine is the key halogen species for polar ODEs. Inthis subsection, we give more details on these measurements and other bromine com-pounds, including biogenic bromine, discuss satellite observations of BrO, and men-25
tion similarities to other regions. The electronic supplement to this paper (http://www.
4306
ACPD7, 4285–4403, 2007
Halogens and polarboundary-layerozone depletion
W. R. Simpson et al.
Title Page
Abstract Introduction
Conclusions References
Tables Figures
J I
J I
Back Close
Full Screen / Esc
Printer-friendly Version
Interactive Discussion
EGU
atmos-chem-phys-discuss.net/7/4285/2007/acpd-7-4285-2007-supplement.pdf) con-tains an extensive list of measurements.
2.1.1 Ground based measurements of bromine compounds
The key first measurements of inorganic bromine compounds in the polar bound-ary layer were those of “filterable bromine” published by Barrie et al. (1988) (see5
Fig. 2 and Sect. 1.2). Since then, a multitude of further gas phase and aerosolmeasurements have been made. The Arctic sites where the majority of theseobservations have been made are Barrow, Alert, Ny-Alesund, and the HudsonBay. Halley and Neumayer stations have been the locations of key Antarctic stud-ies. See the electronic supplement (http://www.atmos-chem-phys-discuss.net/7/4285/10
2007/acpd-7-4285-2007-supplement.pdf) for a complete listing of the sites and mapsof their location.
With the direct detection of BrO by active DOAS at Alert, (see Sect. 1.4.1 and Fig. 6Hausmann and Platt, 1994) the first proof of the chemical mechanisms described inSect. 1.3 was made. Since then active and passive DOAS techniques (Tuckermann15
et al., 1997; Kreher et al., 1997; Martinez et al., 1999; Honninger and Platt, 2002; Frießet al., 2004; Honninger et al., 2004b) as well as radical amplifiers (Impey et al., 1999)and atomic fluorescence techniques (Avallone et al., 2003) have been used to identifyBrO in both polar regions at Alert, Barrow, Ny-Alesund, the Hudson Bay, Neumayer,and Arrival Heights. Typical mixing ratios of BrO are a few to several tens of pmol/mol.20
The MAX-DOAS measurements of Honninger and Platt (2002) at Alert show thatthe vertical extent of BrO layers is about 1 km (500–2000 m). Under under some cir-cumstances elevated layers might be present (Honninger et al., 2004b). Frieß et al.(2004) showed that enhanced BrO vertical columns were present at Neumayer, Antarc-tic, when part of the probed airmass was previously in contact with sea ice surfaces.25
Most measurements of BrO are made during polar spring. However, data from Alertshowed the presence of BrO at smaller mixing ratios in fall as well (G. Honninger,personal communication, 2003). Impey et al. (1997b,a) developed a method for deter-
4307
ACPD7, 4285–4403, 2007
Halogens and polarboundary-layerozone depletion
W. R. Simpson et al.
Title Page
Abstract Introduction
Conclusions References
Tables Figures
J I
J I
Back Close
Full Screen / Esc
Printer-friendly Version
Interactive Discussion
EGU
mination of the total photolysable chlorine and bromine (X2 and HOX), calibrated anddetermined “as Cl2” and “as Br2”. The mixing ratios represent Cl2 and Br2 equivalents,e.g. in terms of the rate of photolytic production of chlorine and bromine atoms. Forbromine they were able to give mixing ratios for HOBr and Br2 separately. This methodwas applied during the 1994 Polar Sunrise Experiment at Alert. Total photolysable5
bromine (TPB) typically ranged from ∼5–30 pmol/mol, and remained at these levelsunder full sunlight conditions. The highest values of HOBr (∼240 pmol/mol) detectedby Impey et al. (1999) occured at the end of an ODE when O3 was already increasing.They also measured Br2 of up to 24 pmol/mol during an ODE.
There are strong indications for a snow pack source for bromine compounds (espe-10
cially Br2 and BrCl). This evidence includes Br2 – wind sector comparisons from Alert(Impey et al., 1997b), strong vertical gradients in BrO in the lowest meters observedat Ny-Alesund and Alert (Avallone et al., 2003), and especially direct measurements ofBr2 and BrCl by mass spectrometry in the vicinity and within the snowpack (see Fig. 8and Foster et al., 2001; Spicer et al., 2002). Both Br2 and BrCl were measured before15
direct sunlight reached the site, possibly indicating a role of O3 reactions in the dark ac-tivation of bromine. Organic bromine compounds and their relevance will be discussedin Sect. 3.3.2.
2.1.2 BrO satellite observations: spatial and temporal scale
With the launch of the Global Ozone Monitoring Experiment (GOME) in April 199520
(Burrows et al., 1999), it became possible for the first time to detect the spectroscopicsignatures of many tropospheric trace gases in the spectra of backscattered sunlight,including that of the BrO absorption (Chance, 1998; Eisinger et al., 1997; Hegels et al.,1998a,b; Perner et al., 1998; Richter et al., 1998b,c; Wagner et al., 1998a; Wagner andPlatt, 1998a) on a global scale. Such UV/Visible nadir satellite observations (which25
have since also been performed by the SCanning Imaging Absorption SpectroMeterfor Atmospheric CHartographY instrument, SCIAMACHY, and the Ozone MonitoringInstrument, OMI, and in the near future from GOME-2) allow the assessment of the
4308

ACPD7, 4285–4403, 2007
Halogens and polarboundary-layerozone depletion
W. R. Simpson et al.
Title Page
Abstract Introduction
Conclusions References
Tables Figures
J I
J I
Back Close
Full Screen / Esc
Printer-friendly Version
Interactive Discussion
EGU
spatial dimension and temporal variation of “trace gas clouds” (see also Table 2 for anoverview of satellite measurements of BrO).
After the first detection of plumes of enhanced BrO in GOME data (Wagner andPlatt, 1998a; Wagner et al., 1998b; Wagner and Platt, 1998b) it rapidly became clearthat they are a frequent phenomena in both hemispheres in polar spring, covering large5
areas mainly over sea ice and along the coasts (Chance, 1998; Richter et al., 1998c,a).It could be shown that the enhanced BrO concentrations detected by satellite were wellcorrelated with depleted O3 concentrations measured from ground based instruments(Wagner and Platt, 1998a; Wagner et al., 2001) and also related with the depletionof gaseous mercury (Lu et al., 2001; Ebinghaus et al., 2002; Sommar et al., 2007).10
As the satellite record grew, it also became clear that the phenomenon of enhancedboundary layer BrO concentrations occurs very regularly for several months in bothhemispheres (Van Roozendael et al., 1999, 2002; Wagner et al., 2001; Richter et al.,2002), indicating that it probably is a natural phenomenon. From the investigation ofthe spatio-temporal variation a strong correlation with the occurrence of first-year sea15
ice was found (Wagner, 1999; Wagner et al., 2001, see also Fig. 9), indicating that thesource is related to the enrichment of sea salt on the surface of freezing sea ice. Froma detailed comparison study (Kaleschke et al., 2004) it was found in particular thatenhanced BrO concentrations were observed under conditions where the existenceof frost flowers was possible (see Sect. 3.1). Several satellite studies address issues20
like a potential trend of the areas covered by enhanced BrO concentrations (Hollwedelet al., 2004) or the existence of a global free tropospheric BrO mixing ratio of the orderof 1 pmol/mol (Van Roozendael et al., 1999; Wagner, 1999; Theys et al., 2004). Itwas in particular speculated that the free tropospheric BrO might be at least partlycaused by transport of BrO enriched air masses from polar regions (Hollwedel, 2005,25
see Sect. 4.4).In many aspects, the enhanced BrO concentrations in the boundary layer during po-
lar spring are an ideal target for the observation with space-borne sensors. First, thehigh albedo of ice and snow in polar regions causes a high sensitivity for trace gases
4309

ACPD7, 4285–4403, 2007
Halogens and polarboundary-layerozone depletion
W. R. Simpson et al.
Title Page
Abstract Introduction
Conclusions References
Tables Figures
J I
J I
Back Close
Full Screen / Esc
Printer-friendly Version
Interactive Discussion
EGU
located very close to the surface (even in the presence of some clouds). Second, thetypical spatial extension (several hundreds of kilometers) and lifetime (about one day)of boundary layer BrO fit very well to the temporal and spatial resolution and cover-age of GOME. However, some uncertainties remain with respect to the separation ofstratospheric and tropospheric columns, cloud effects, and the amount of BrO over low5
reflectivity surfaces such as the oceans. The improved spatial and temporal coverageand resolution of the latest and future satellite instruments will provide the opportunityto monitor tropospheric BrO chemistry in greater detail.
2.1.3 The link to other places
Reactive bromine chemistry has been found to be of importance in many other re-10
gions, namely the coastal and open oceans, salt lakes, volcanic plumes, polluted cities(under certain circumstances), and the free troposphere. For an overview see, e.g.,von Glasow and Crutzen (2007). Of particular interest in this regard are salt lakes(e.g. Hebestreit et al., 1999; Stutz et al., 2002; Honninger et al., 2004a) as the releasemechanisms are likely related to the ones in polar regions due to the presence of large15
salt deposits on the surface for both salt lakes and regions with new sea ice in highlatitudes. This observation shows that low temperatures are not a prerequisite for thechemical cycles to be efficient in bromine release even though many of the involvedreactions are temperature dependent so that one can expect important differences.This point, however, does not exclude the possibility that other – possibly physical –20
processes in polar regions might be dependent on cold temperatures (see also end ofSect. 3.2.2). In Sect. 4.4 we discuss the possibility of transport of boundary layer air tothe free troposphere and consequences for the chemistry in the free troposphere.
2.2 Chlorine
Chlorine was the second halogen (in inorganic form) that was found to be present in25
polar regions. As chlorine is present in small concentrations only, its direct role in
4310

ACPD7, 4285–4403, 2007
Halogens and polarboundary-layerozone depletion
W. R. Simpson et al.
Title Page
Abstract Introduction
Conclusions References
Tables Figures
J I
J I
Back Close
Full Screen / Esc
Printer-friendly Version
Interactive Discussion
EGU
ozone destruction is probably very minor. For a typical [Br] to [Cl] ratio of 800 (seeSect. 2.4), chlorine atoms would account for only 2 % of ozone depletion. Chlorinedoes play an important role, however, in the oxidation of volatile organic compounds(VOCs, see also Sect. 4.2) and possibly in the activation of bromine via BrCl (seeSects. 1.3 and 2.4). Furthermore, the concentration of HOx is increased by oxidation5
of VOCs by chlorine as detailed in Sect. 4.2. A multitude of measurements is compiledin the electronic supplement (http://www.atmos-chem-phys-discuss.net/7/4285/2007/acpd-7-4285-2007-supplement.pdf). With the exception of one measurement of HClall data for inorganic chlorine so far are from the Arctic.
Jobson et al. (1994) were the first to develop an indirect technique to measure10
chlorine atoms in the polar troposphere. Their technique involves a kinetic anal-ysis of the relative rates of hydrocarbon decay rates. They could show that thetime integrated chlorine concentration in the observed air mass at Alert was ∼3–7×10⁹ molecules s/cm3 which corresponds, based on estimated reaction times of 1–20days, to chlorine atom concentrations ranging from ∼3×10³–6×10⁴ molecules/cm3.15
Muthuramu et al. (1994) studied the decay of a series of alkyl nitrates during the pe-riods at Alert and found that the relative alkyl nitrate decays were also consistent withthe known chlorine atom rate constants. Kinetic analysis of the data led to a value of6.5×109 molecules s/cm3, i.e. the same result as obtained for light alkanes by Jobsonet al. (1994). Muthuramu et al. (1994) discuss that Cl atom oxidation of alkyl nitrates20
may be an important mechanism for recycling NOx in the Arctic lower atmosphere.Several other investigators (Solberg et al., 1996; Ariya et al., 1998; Ramacher et al.,1999; Rudolph et al., 1999) have used the VOC relative oxidation rate method, pro-ducing comparable values for [Cl]. Boudries and Bottenheim (2000) used the absolutedecay rate for alkanes during a rapid ozone depletion event at Alert, Nunavut to derive25
a value [Cl]=7.5×10⁴ molecules/cm3. The chlorine atom is responsible for all the con-sumption of a variety of VOCs, such as the alkanes studied by Jobson et al. (1994),and alkyl nitrates (Muthuramu et al., 1994) over the Arctic Ocean during these events,see more details in Sect. 4.2.
4311

ACPD7, 4285–4403, 2007
Halogens and polarboundary-layerozone depletion
W. R. Simpson et al.
Title Page
Abstract Introduction
Conclusions References
Tables Figures
J I
J I
Back Close
Full Screen / Esc
Printer-friendly Version
Interactive Discussion
EGU
As part of ARCTOC, Perner et al. (1999) conducted measurements of ClOx at Ny-Alesund, and measured a maximum [ClO] of 2 pmol/mol, leading again to the conclu-sion that ozone destruction is dominated by Br atoms. Tuckermann et al. (1997) foundaverage mixing ratios of ClO of about 21 pmol/mol during ODEs in 1995 at Ny-Alesundwhich implies Cl atom concentrations much higher than those calculated with the hy-5
drocarbon clock methods. However, Tuckermann et al. (1997) report an average ofonly 3.3 pmol/mol ClO during ODEs for 1996. The high mixing ratios observed in 1995stand out as very unusual and seem to be inconsistent also with what was observedat other locations. These observations highlight the need for independent methods formeasurement of [Cl].10
The measurements by Impey et al. (1997b) of total photolysable chlorine (TPC) atAlert during the 1995 Polar Sunrise Experiment showed mixing ratios typically rangingfrom ∼5–15 pmol/mol, with the highest concentrations found in the dark. After polarsunrise, TPC decreased to below the detection limit. This work showed that there is adark production mechanism for chlorine atom precursors.15
As already mentioned above, Foster et al. (2001) and Spicer et al. (2002) conductedthe first direct measurements of Br2 and BrCl, at Alert (see Fig. 8). Interestingly, whileBrCl is present in quantities comparable to Br2, as discussed by Spicer et al. (2002),Cl2 was not detected.
A recent study by Tackett et al. (2007) addresses the question of the vertical scale20
impact of surface-derived halogen-atom precursors. They conducted measurementsof VOCs, Hg(0), and O3 in the lowest 300 m above the surface snowpack at Barrow,Alaska. From these measurements they concluded that both Br-atom and Cl-atomchemistry was most active in the lowest ∼100–200 m above the surface. As an ex-ample, shown in Fig. 10 are plots of [methyl ethyl ketone]/[n-butane] as a function of25
altitude. As discussed in the paper, MEK/butane is a sensitive function of Cl-atomchemistry.
It is clear that chlorine atom chemistry is active and important in polar marine bound-ary layers, and over snow packs inland. This chlorine atom chemistry can play a domi-
4312

ACPD7, 4285–4403, 2007
Halogens and polarboundary-layerozone depletion
W. R. Simpson et al.
Title Page
Abstract Introduction
Conclusions References
Tables Figures
J I
J I
Back Close
Full Screen / Esc
Printer-friendly Version
Interactive Discussion
EGU
nant role in the processing of VOCs, and also in radical chemistry that in turn influencesbromine atom chemistry. However, the nature of the chlorine atom precursors is notnecessarily well understood and more measurement data for chlorine atom precursorsand chlorine atoms themselves is needed to test and develop our understanding.
2.3 Iodine5
Most modeling studies that include iodine chemistry have been performed for the ma-rine boundary layer (e.g. Vogt et al., 1999; McFiggans et al., 2000). They show thatIO mixing ratios on the order of 1 pmol/mol already have a strong impact on ozoneconcentration, with destruction rates of up to 1 nmol/mol per day and that under theseconditions, O3 destruction by iodine radicals is faster than by the O3+HO2 reaction10
(Vogt et al., 1999). They also showed that a strong chemical coupling between reac-tive Cl and Br compounds with iodine compounds exists and this coupling acceleratesthe autocatalytic release of these compounds from sea salt aerosol as discussed inthe study of Vogt et al. (1999). Model studies by Calvert and Lindberg (2004a) focusedon the role of iodine in the chemistry during polar tropospheric ozone depletion events.15
They have shown that additional halogen atom formation from reactions of IO with BrOand ClO cause significant enhancements in polar ozone depletion when only smallamounts of iodine-containing compounds, such as CH2I2, IBr or ICl, are present in anair mass. Furthermore, their model studies suggest that the coupling between iodineand bromine radical chemistry leads to an enhanced depletion of gaseous mercury20
during bromine explosion events (Calvert and Lindberg, 2004b).The main source for reactive iodine in the marine boundary layer is the photodegra-
dation of iodinated organic compounds (such as CH3I, CH2I2, CH2IBr and CH2ICl)produced by macroalgae and phytoplankton in the ocean. The atmospheric lifetime ofthese compounds is very short, ranging from 5 min for CH2I2 to 5 days for CH3I. For25
mid-latitude coastal regions I2 has been shown to be the main source for iodine atoms(Saiz-Lopez and Plane, 2004), which has a lifetime of about 10 s. See Sect. 3.3.2 formore details.
4313
ACPD7, 4285–4403, 2007
Halogens and polarboundary-layerozone depletion
W. R. Simpson et al.
Title Page
Abstract Introduction
Conclusions References
Tables Figures
J I
J I
Back Close
Full Screen / Esc
Printer-friendly Version
Interactive Discussion
EGU
First indications for the presence of reactive iodine in the polar boundary layer werefound by Wittrock et al. (2000), who detected tropospheric IO in late spring and earlysummer 1995–1998 with a zenith sky DOAS instrument in Ny-Alesund. However, noIO could be positively observed above the detection limit with a long-path DOAS at Ny-Alesund (Tuckermann et al., 1997). First long-term observations of IO in polar regions5
by zenith sky DOAS, performed at Neumayer Station, Antarctica, were reported byFrieß et al. (2001). Based on the interpretation of the diurnal variation of IO (see Fig. 11using radiative transfer calculations, they concluded that the observed IO is located inthe lower troposphere. Mixing ratios of roughly 5–10 pmol/mol during summer wereestimated under the assumption that IO is entirely located in the boundary layer. The10
IO measurements at Neumayer showed a pronounced seasonal cycle with a maximumduring summer. This finding was explained by a more efficient photodissociation oforganic precursors, a shorter distance to the open sea owing to the retreating sea iceas the likely source for organoiodine compounds, and/or a higher biological activityduring summer. Based on multi-axis DOAS measurements during May 2000 in Alert,15
Canada, Honninger (2002) estimated IO mixing ratios of 0.73+/−0.23 pmol/mol in theArctic boundary layer.
The observed high levels of IO in Antarctica might lead to the formation of newaerosol particles as had been observed in a mid-latitude coastal location, (O’Dowd andHoffmann, 2005; Saiz-Lopez et al., 2006) and thus could explain the ultrafine particle20
events that have been observed in coastal Antarctica (Davison et al., 1996).
2.4 Interhalogen interactions
Preceding sections have introduced the concept that there are a number of interactionsbetween the various halogen compounds. As explained in Sect. 1.3, laboratory studieshave shown that the halogen activating reaction, HOBr+X−+H+, where X− is a halide25
ion (Cl−, Br−) is efficient at activating both Br− and Cl− (Fickert et al., 1999; Adamset al., 2002; Huff and Abbatt, 2000, 2002). Typically, when Cl− is the initial reactionpartner, the product BrCl reacts with Br− – yielding Br2 and Cl−, however, the effi-
4314

ACPD7, 4285–4403, 2007
Halogens and polarboundary-layerozone depletion
W. R. Simpson et al.
Title Page
Abstract Introduction
Conclusions References
Tables Figures
J I
J I
Back Close
Full Screen / Esc
Printer-friendly Version
Interactive Discussion
EGU
ciency of this conversion reaction depends upon bromide being present in the reactingmixture.
A number of studies have investigated the bromine to chlorine ratios in the gasphase. The techniques used most often so far is the VOC relative oxidation rate method(Jobson et al., 1994; Solberg et al., 1996; Ariya et al., 1998; Ramacher et al., 1999;5
Rudolph et al., 1999, for more details see Sect. 2.2). Typical Br to Cl ratios derivedin these studies range from several hundred to over a thousand. Boudries and Bot-tenheim (2000) used the absolute decay rate for alkanes during a rapid ODE at Alert,Nunavut to derive a ratio [Br]/[Cl] ∼190 for that event. Recently, Keil and Shepson(2006) developed a method for measurement of the ratio [Br]/[Cl], through measure-10
ments of the products (haloaldehydes) of bromine and chlorine atom reaction withethene and propene. This method was applied in the Barrow, Alaska, region, wherethere are relatively elevated concentrations of these alkenes, yet where there are alsoactive ozone and Hg depletion events. An advantage of the Keil and Shepson methodis that it is very sensitive to halogen chemistry, and chlorine and bromine atoms can be15
detected in the absence of a significant ozone depletion event. They reported [Br]/[Cl]atom ratios ranging from 80–990 for partial ozone-depleted conditions. Analysis oftheir data indicated that the measured haloaldehydes were produced locally, and thatthe precursors were derived from chemistry occurring in the snowpack.
Direct field observations of Br2 and BrCl from snow at Alert showed a variable ratio20
of the Br2 and BrCl yields (Foster et al., 2001). The ratio of Br− to Cl− in the ice isimportant for halogen reactions, and this ratio has been shown to be highly variablein snow (Simpson et al., 2005). Impey et al. (1997b) found that total photolysablechlorine (TPC) showed the highest concentrations in the dark, by full sunlight TPC wasbelow the detection limit. In contrast, total photolysable bromine (TPB) remained at the25
same values during darkness and sunlight. This and the fact that the back trajectoriesfor airmasses with high TPC and TPB are quite different led Impey et al. (1997b) toconclude that the mechanisms for production of chlorine and bromine atoms are alsoquite different. A steady state analysis led to an estimated [Br]/[Cl] ratio of 100–300
4315
ACPD7, 4285–4403, 2007
Halogens and polarboundary-layerozone depletion
W. R. Simpson et al.
Title Page
Abstract Introduction
Conclusions References
Tables Figures
J I
J I
Back Close
Full Screen / Esc
Printer-friendly Version
Interactive Discussion
EGU
during ozone depletion events.From these direct and indirect observations it might be concluded, and has been
discussed in several of the above papers, that the high variability in the ratio of Br toCl atoms of under one hundred to over a thousand (both in the presence and absenceof ODEs) is likely caused by the surface (i.e. snow pack) being the source or “recy-5
cler” for the halogens and the high variability of these halogen’s anions in snow andaerosols. Also it might mean that different release/recycling processes are dominantunder different conditions.
We want to stress again, however, that despite a lack of a clear correlation of Brand Cl atoms there is a clear connection between chlorine and bromine chemistry,10
beyond the chemical reaction that produces BrCl (see Reaction R10). Specifically, thechemistry that produces Br2 and BrCl and the “bromine explosion” requires productionof HOBr which is produced in the reaction of BrO with HO2 (R5) and HO2 can beproduced to a substantial amount by chlorine chemistry as detailed in Sect. 4.2.
In the Antarctic, there is evidence of substantial amounts of reactive iodine (Friess15
et al., 2001), which could be coupled to bromine chemistry. However, in the Arctic,substantially lower levels of reactive iodine have been detected, indicating no linkagebetween iodine and bromine chemistry for the Arctic. It remains an important questionif this link has so far been overlooked or if indeed important differences between theArctic and Antarctic in terms of halogen interactions exist.20
3 Key environmental processes and their effects on ODEs
3.1 The role of sea ice
Many of the early studies of Arctic tropospheric ozone depletion identified marine in-fluences on ozone depleted air masses. As explained in Sect. 1, it was soon clear thatsea salt is likely the major source for bromine. The observation of depleted ozone lev-25
els during the majority of the time at ice camps on the frozen Arctic Ocean reinforced
4316

ACPD7, 4285–4403, 2007
Halogens and polarboundary-layerozone depletion
W. R. Simpson et al.
Title Page
Abstract Introduction
Conclusions References
Tables Figures
J I
J I
Back Close
Full Screen / Esc
Printer-friendly Version
Interactive Discussion
EGU
the picture of ocean-derived salts as key in the process (Hopper et al., 1994). A verystrong indication for the relevance of young sea ice are GOME satellite observationsthat showed that clouds of BrO were largely present over young sea ice but not overmulti-year sea ice (Wagner et al., 2001). The match of the tropospheric BrO featuresto areas of first-year sea ice is probably related to the higher salinity of first-year ice as5
compared to multi-year ice (Wagner et al., 2001). Frieß et al. (2004) and Simpson et al.(2007) also showed, using trajectory analysis, that areas of first-year sea ice are corre-lated to high BrO levels. The processes behind transformation of salt from the oceansto reactive halogens is crucial for understanding the dependence of halogen activationand ozone depletion on environmental properties, particularly sea ice extent. As dis-10
cussed in Sect. 5.1, in the context of a rapidly changing Arctic marine environment,sensible predictions of changes in halogen activation require detailed mechanistic un-derstanding of the role of sea ice.
In this section, we consider sea ice and how salts, initially in the ocean, are trans-ported through the ice. This transport is probably related to sea-ice structures, such15
as leads (cracks in the ice, typically linear and variable in location), polynyas (reoccur-ring, larger areas of open water), and other sea-ice forms. The process of freezingsea ice has a complex thermodynamics due to separation of ice from the concentratedsalt solutions (i.e. brine). Additionally, forms of ice and snow that occur in the sea iceenvironment may have key roles in the halogen activation process. For example, when20
an open lead begins to freeze over, it often forms dendritic vapor-deposited ice crystalsthat wick brine from the freezing ice (Perovich and Richter-Menge, 1994; Rankin et al.,2002). These ice forms, known as frost flowers, will be considered as possible sourcesof salt aerosols and possible sites of halogen activation. Figure 12 shows a photographof frost flowers growing on sea ice.25
As sea water cools, ice begins to form and rejection of salts from the freezing wa-ter creates highly saline brine. As the brine cools with the ice, some forms of saltsreach solubility limits and precipitate, altering the chemical composition of the residualunfrozen brine. The precipitation process may affect chemistry and impart signatures
4317
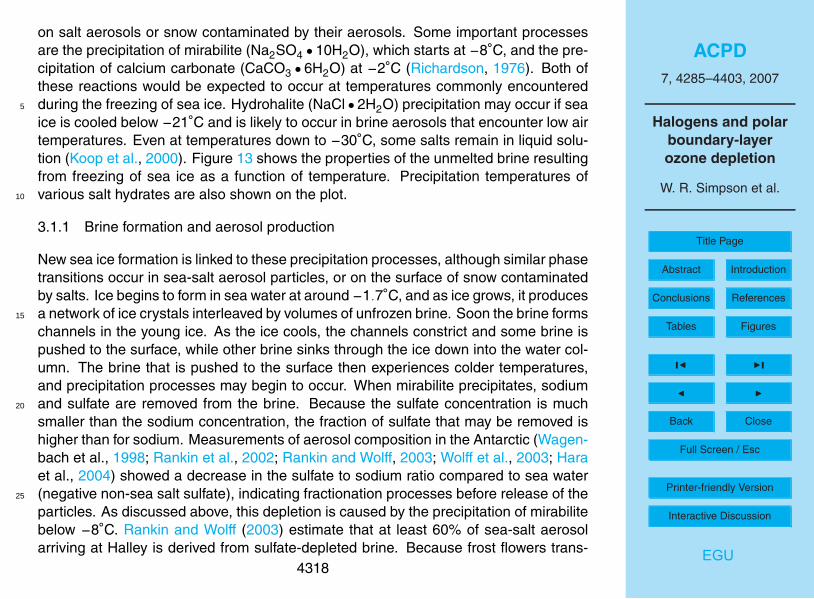
ACPD7, 4285–4403, 2007
Halogens and polarboundary-layerozone depletion
W. R. Simpson et al.
Title Page
Abstract Introduction
Conclusions References
Tables Figures
J I
J I
Back Close
Full Screen / Esc
Printer-friendly Version
Interactive Discussion
EGU
on salt aerosols or snow contaminated by their aerosols. Some important processesare the precipitation of mirabilite (Na2SO4 • 10H2O), which starts at −8◦C, and the pre-cipitation of calcium carbonate (CaCO3 • 6H2O) at −2◦C (Richardson, 1976). Both ofthese reactions would be expected to occur at temperatures commonly encounteredduring the freezing of sea ice. Hydrohalite (NaCl • 2H2O) precipitation may occur if sea5
ice is cooled below −21◦C and is likely to occur in brine aerosols that encounter low airtemperatures. Even at temperatures down to −30◦C, some salts remain in liquid solu-tion (Koop et al., 2000). Figure 13 shows the properties of the unmelted brine resultingfrom freezing of sea ice as a function of temperature. Precipitation temperatures ofvarious salt hydrates are also shown on the plot.10
3.1.1 Brine formation and aerosol production
New sea ice formation is linked to these precipitation processes, although similar phasetransitions occur in sea-salt aerosol particles, or on the surface of snow contaminatedby salts. Ice begins to form in sea water at around −1.7◦C, and as ice grows, it producesa network of ice crystals interleaved by volumes of unfrozen brine. Soon the brine forms15
channels in the young ice. As the ice cools, the channels constrict and some brine ispushed to the surface, while other brine sinks through the ice down into the water col-umn. The brine that is pushed to the surface then experiences colder temperatures,and precipitation processes may begin to occur. When mirabilite precipitates, sodiumand sulfate are removed from the brine. Because the sulfate concentration is much20
smaller than the sodium concentration, the fraction of sulfate that may be removed ishigher than for sodium. Measurements of aerosol composition in the Antarctic (Wagen-bach et al., 1998; Rankin et al., 2002; Rankin and Wolff, 2003; Wolff et al., 2003; Haraet al., 2004) showed a decrease in the sulfate to sodium ratio compared to sea water(negative non-sea salt sulfate), indicating fractionation processes before release of the25
particles. As discussed above, this depletion is caused by the precipitation of mirabilitebelow −8◦C. Rankin and Wolff (2003) estimate that at least 60% of sea-salt aerosolarriving at Halley is derived from sulfate-depleted brine. Because frost flowers trans-
4318

ACPD7, 4285–4403, 2007
Halogens and polarboundary-layerozone depletion
W. R. Simpson et al.
Title Page
Abstract Introduction
Conclusions References
Tables Figures
J I
J I
Back Close
Full Screen / Esc
Printer-friendly Version
Interactive Discussion
EGU
port brine at temperatures colder than the mirabilite precipitation temperature, aerosolderived from frost flowers would be expected to be sulfate depleted. Chemical analy-sis of frost flowers indicate that most frost flowers are depleted in sulfate (Rankin andWolff, 2003; Simpson et al., 2005). Therefore, most observations of sulfate depletedaerosol are discussed as indications of frost flowers as the source of the fractionated5
brine, although other brine processes could still be responsible. Domine et al. (2004)considered how wicking of brine up snow on sea ice may produce salty snow, whichcould later be blown and form aerosol particles (see Fig. 14). Overall, these experi-mental studies indicate that sulfate-depleted brine, probably derived from frost flowers,is the most common source of sea salt aerosol particles in the polar atmosphere.10
3.1.2 Precipitation processes and modification of pH
Another effect of salt precipitation processes is modification of the brine’s composition.A potentially important precipitation process in this regard is that of carbonate, whichaffects the pH of sea water (as proposed by Sander et al., 2006). The pH of the brineis important because of the pH dependence of the key step of the bromine explosion15
mechanism, the heterogeneous reaction of HOBr with Cl− or Br− (Reactions R8 andR10). In liquid solution, these reactions have been shown to have a strong pH depen-dence (Fickert et al., 1999), with efficient reaction at acid pH, but lower efficiency athigh pH. Sea water is basic enough to shut off the reaction. The alkalinity of sea waterderives from the presence of bicarbonate and carbonate (which are in equilibrium) in20
the water. Precipitation of calcium carbonate, which is predicted to occur soon afterinitial freezing of sea water, depletes carbonate and bicarbonate through their equilib-rium and diminishes the buffering capacity of sea-salt aerosol. This effect could assistthe bromine explosion, as has been shown in the model calculations of Sander et al.(2006). In another model study, Piot and von Glasow (2007) showed that the presence25
of a polluted airmass as in an Arctic Haze event would have the same effect on thedevelopment of an ODE as carbonate precipitation. However, a detailed analysis ofthe effects of the carbonate system in this context requires the knowledge of all ther-
4319

ACPD7, 4285–4403, 2007
Halogens and polarboundary-layerozone depletion
W. R. Simpson et al.
Title Page
Abstract Introduction
Conclusions References
Tables Figures
J I
J I
Back Close
Full Screen / Esc
Printer-friendly Version
Interactive Discussion
EGU
modynamic data (Henry’s law for CO2, solubility products, carbonic acid dissolutionconstants) at sub-zero temperatures and activity corrections to the thermodynamic pa-rameters are likely to be necessary to account for the effect of salinities in the remainingbrine (Richardson, 1976; Marion, 2001).
Analysis of the pH of melted frost flowers and snow in Antarctica showed that the pH5
of the frost-flower melt water was too alkaline to support bromine explosion chemistry,while the pH of melted snow was favorable for bromine activation (Kalnajs and Avallone,2006). These results are consistent with the idea that carbonate precipitation in thebrine can reduce the buffer capacity of the aerosol source and thus allow the aerosolto be acidified more easily. However, if precipitation of carbonate had happened in10
the frost flowers, their surface pH may have been different from the bulk pH analysisemployed in this study. In addition to the question of the effective pH of frost flowers,ice, and snow, laboratory experiments and molecular modeling studies indicate that allhalide ions except for fluoride are segregated to the surface of aqueous solutions andcrystals (Ghosal et al., 2000, 2005; Knipping et al., 2000; Jungwirth and Tobias, 2001,15
2002; Finlayson-Pitts, 2003). Jungwirth and Tobias (2002) explained this effect withthe polarizability of the halides that increases with the size of the ion.
3.1.3 Sources of reactive halogens
The realization that sulfate-depleted brine, possibly arising from frost flowers, was likelya major source of sea-salt aerosol particles led to the idea that frost flowers are involved20
in halogen activation (Rankin et al., 2002). The precise means of their involvementis still an active question of research. Frost flowers may directly release gas phasebromine to the atmosphere, or they may produce aerosol particles that carry bromideions into the atmosphere, where they then undergo halogen activation and producereactive halogen radicals. Brine-derived aerosol particles, or brine wicking may con-25
taminate snow with halide ions that are then activated and emitted to the atmosphere(e.g. as Br2 and BrCl). It is likely that several of these processes occur; therefore thereal discussion is: What are the relative roles of these mechanisms? Here we consider
4320
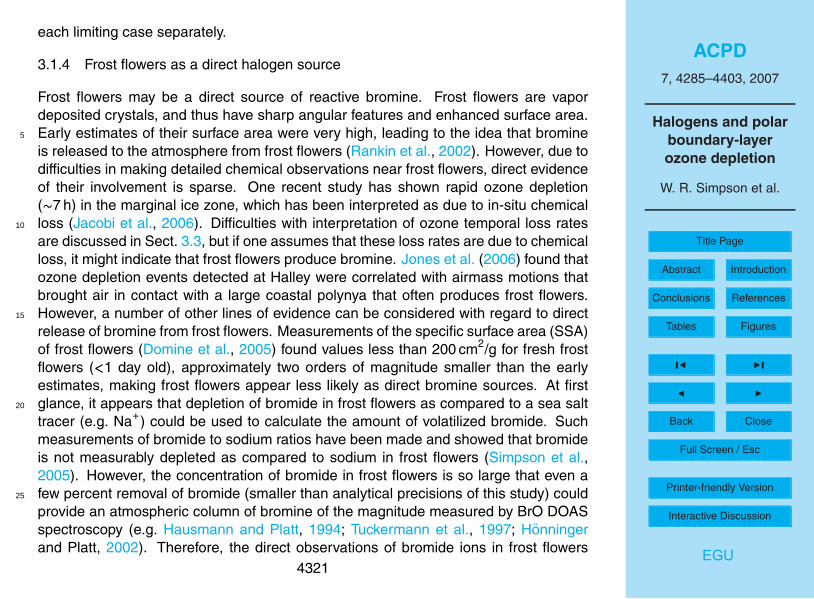
ACPD7, 4285–4403, 2007
Halogens and polarboundary-layerozone depletion
W. R. Simpson et al.
Title Page
Abstract Introduction
Conclusions References
Tables Figures
J I
J I
Back Close
Full Screen / Esc
Printer-friendly Version
Interactive Discussion
EGU
each limiting case separately.
3.1.4 Frost flowers as a direct halogen source
Frost flowers may be a direct source of reactive bromine. Frost flowers are vapordeposited crystals, and thus have sharp angular features and enhanced surface area.Early estimates of their surface area were very high, leading to the idea that bromine5
is released to the atmosphere from frost flowers (Rankin et al., 2002). However, due todifficulties in making detailed chemical observations near frost flowers, direct evidenceof their involvement is sparse. One recent study has shown rapid ozone depletion(∼7 h) in the marginal ice zone, which has been interpreted as due to in-situ chemicalloss (Jacobi et al., 2006). Difficulties with interpretation of ozone temporal loss rates10
are discussed in Sect. 3.3, but if one assumes that these loss rates are due to chemicalloss, it might indicate that frost flowers produce bromine. Jones et al. (2006) found thatozone depletion events detected at Halley were correlated with airmass motions thatbrought air in contact with a large coastal polynya that often produces frost flowers.However, a number of other lines of evidence can be considered with regard to direct15
release of bromine from frost flowers. Measurements of the specific surface area (SSA)of frost flowers (Domine et al., 2005) found values less than 200 cm2/g for fresh frostflowers (<1 day old), approximately two orders of magnitude smaller than the earlyestimates, making frost flowers appear less likely as direct bromine sources. At firstglance, it appears that depletion of bromide in frost flowers as compared to a sea salt20
tracer (e.g. Na+) could be used to calculate the amount of volatilized bromide. Suchmeasurements of bromide to sodium ratios have been made and showed that bromideis not measurably depleted as compared to sodium in frost flowers (Simpson et al.,2005). However, the concentration of bromide in frost flowers is so large that even afew percent removal of bromide (smaller than analytical precisions of this study) could25
provide an atmospheric column of bromine of the magnitude measured by BrO DOASspectroscopy (e.g. Hausmann and Platt, 1994; Tuckermann et al., 1997; Honningerand Platt, 2002). Therefore, the direct observations of bromide ions in frost flowers
4321

ACPD7, 4285–4403, 2007
Halogens and polarboundary-layerozone depletion
W. R. Simpson et al.
Title Page
Abstract Introduction
Conclusions References
Tables Figures
J I
J I
Back Close
Full Screen / Esc
Printer-friendly Version
Interactive Discussion
EGU
do not provide definitive information on their possible direct role in halogen activation.Arguments based upon pH of melted frost flowers, discussed above, indicate that thepH of frost flowers may be too alkaline for supporting bromine explosion chemistry(Kalnajs and Avallone, 2006) and that carbonate precipitation may allow aerosols andsnow to be more easily acidified, promoting halogen activation chemistry (Sander et al.,5
2006).
3.1.5 Frost flower-derived aerosol as a halogen source
Aerosol produced from frost flowers contains relatively high concentrations of sea salt,and thus could be the predominant surface on which the HOBr+X− reactions occur(Reactions R8 and R10). Many modeling studies have found that reactions on aerosol10
surfaces are important in sustaining halogen activation events (McConnell et al., 1992;Fan and Jacob, 1992; Tang and McConnell, 1996; Sander et al., 1997; Michalowskiet al., 2000; Evans et al., 2003). Evidence for aerosol involvement in halogen activa-tion comes from ground-based MAX-DOAS BrO profile observations (Honninger et al.,2004b) done in coincidence with surface-level BrO concentration measurements that15
have shown that BrO layers can be aloft. Because the lifetime of BrOx is only a fewhours in the absence of recycling (see Sect. 1.3), layers observed aloft would need tobe either lofted quite recently or BrOx would have to recycle on lofted aerosol. There-fore, this observation shows aerosol is probably capable of sustaining halogen acti-vation. Very high column densities of BrO observed from a high-altitude aircraft were20
also interpreted as due to BrO being lofted to elevations above the boundary layer andtransporting long distances (McElroy et al., 1999). Additionally, there is satellite-basedevidence for outflow of BrO events from the Arctic, which last multiple days, and mustbe sustained on aerosol surfaces (Hollwedel, 2005). Most measurements of aerosolbromide enrichment factors show that they are enhanced in bromide (Berg et al., 1983;25
Barrie et al., 1988; Toom-Sauntry and Barrie, 2002; Ianniello et al., 2002; Sander et al.,2003a). Enhancement in bromide would occur by scavenging of HBr, the chain ter-mination product of bromine activation, by the particle. This particulate bromine could
4322

ACPD7, 4285–4403, 2007
Halogens and polarboundary-layerozone depletion
W. R. Simpson et al.
Title Page
Abstract Introduction
Conclusions References
Tables Figures
J I
J I
Back Close
Full Screen / Esc
Printer-friendly Version
Interactive Discussion
EGU
be reactivated to recycle gas-phase bromine. Although there is significant evidence foraerosol involvement in halogen activation, the early observation that most ozone deple-tion episodes are based at the ground argues for some ground-based flux of halogensor their precursors and thus against a dominant role of aerosol particles in halogenactivation (Bottenheim et al., 2002; Zeng et al., 2003).5
3.1.6 Saline surfaces as a halogen source
Saline surfaces, particularly snowpack in coastal areas and snow/ice on the sea icecontaminated with sea salts, are ubiquitous in polar regions during springtime, mak-ing them possible sites for halogen activation. As discussed in Sect. 3.1.1, snow iscontaminated by salts by wind-transport of sea spray, upward migration from sea ice,10
and wind-blown frost flowers. The surface-based nature of ozone depletion episodes,discussed in Sect. 3.1.5, also provides indirect evidence that the snowpack may beproviding the halogen flux. Direct measurements of Br2 and BrCl above snow by massspectroscopy have shown the most clear evidence for the role of snowpack in halogenactivation (Foster et al., 2001; Spicer et al., 2002). In these direct studies, in-snow15
measurements also showed that snow was the source of the halogen gases. In-situmeasurements of BrO by resonance fluorescence showed high BrO concentrationsnear the snow surface, also providing evidence for snow as a source of reactive halo-gen gases (Avallone et al., 2003). Additional indirect evidence for the role of snow inthe processing of bromine are measurements of the coastal gradient in bromide en-20
richment factors that showed that many snow samples were significantly depleted inbromide, indicating that they had released bromine to the atmosphere (Simpson et al.,2005). Snowpack may also be related to halogen activation via photochemistry, as isdiscussed in the companion review paper on snow photochemistry. In a recent modelstudy, Piot and von Glasow (2007) found that they could reproduce an ODE in a one-25
dimensional model only when, in addition to the bromine source in form of frost floweraerosol, the re-release of deposited bromine from the snowpack as Br2 and BrCl wasassumed. A major ODE developed only 3–4 days after emission of the salt aerosols
4323

ACPD7, 4285–4403, 2007
Halogens and polarboundary-layerozone depletion
W. R. Simpson et al.
Title Page
Abstract Introduction
Conclusions References
Tables Figures
J I
J I
Back Close
Full Screen / Esc
Printer-friendly Version
Interactive Discussion
EGU
in the model. They also note that their results are not restricted to the source of saltaerosols being from frost flowers, any other process related to salty aerosols beingemitted from brine would have led to the same results. Direct degassing of gas-phasebromine from a frost flowers field only lead to ODEs under unrealistic conditions.
3.1.7 Satellite remote sensing of frost flowers5
Satellite-based synthetic aperture radar (SAR) images are capable of detecting frostflowers, through their high brightness (Kaleschke et al., 2001). Radar images havebeen used to examine the relationship between frost flowers and aerosol (Rankin et al.,2002). Kaleschke et al. (2004) have exploited multiple satellite-derived data sets topredict regions of possible frost flower formation. In this method, potential frost flow-10
ers (PFF) are calculated by using a physical model of their formation (Martin et al.,1995, 1996) that is based upon the combination of open water fraction, the regionsthat soon freeze over forming new ice, and the ambient air temperature, a factor thattakes into account the observation that cold air temperatures are needed to form frostflowers. With this physical model, PFF can be calculated from satellite-derived sea-ice15
fraction maps (from SSM/I or AMSR-E passive microwave images) and meteorologi-cal reanalysis of temperature fields. Kaleschke et al. (2004) showed that the areas ofhigh PFF fraction, when advected by one day using a trajectory model matched spa-tial patterns of satellite derived enhanced vertical columns of BrO. Figure 15 showsan example of this spatial match. This correlation shows evidence that frost flowers,20
or the conditions that are prone to form them, appear in coincidence with bromine ex-plosion events. Later work by Kaleschke and co-workers considered the annual cyclein PFF fraction to try to explain the annual cycle of BrO, as discussed in Sect. 3.1.7(Kaleschke et al., 2005). Recently, Bottenheim and Chan (2006) showed that youngersea ice areas, particularly areas known for polynya formation, appear to be sources25
of ozone depleted airmasses. However, a recent trajectory study showed that PFFcontact was not as good a predictor of BrO in airmasses impacting Barrow, Alaska, aswas simple first year ice contact (Simpson et al., 2007). Further work in this area is
4324

ACPD7, 4285–4403, 2007
Halogens and polarboundary-layerozone depletion
W. R. Simpson et al.
Title Page
Abstract Introduction
Conclusions References
Tables Figures
J I
J I
Back Close
Full Screen / Esc
Printer-friendly Version
Interactive Discussion
EGU
needed to determine if it is actually frost flowers that are causing this correlation, and ifthe release of bromine is from the frost flowers directly, from aerosol produced, or fromsnow contaminated by the aerosol.
3.2 The role of meteorology and boundary layer physics
3.2.1 Polar boundary layer description5
The boundary layer in polar regions is unique and may play a dominant role in ODEchemistry by limiting the dispersion of reactive chemicals produced from Earth’s sur-face. In discussions of the meteorology of atmosphere-ice interactions, it is importantto distinguish between temperature inversions and boundary layers (BL). In polar re-gions, in particular, temperature inversions dominate the lowermost portions of the10
troposphere, typically ranging from 10 m to 1000 m in depth. Inversions can arise froma variety of larger scale weather processes such as the passage of cold fronts, theadvection of warm air over a cold surface, subsiding air in high pressure regimes, tosimple near-surface radiative cooling under clear-sky, light-wind conditions. Inversionsare observed in balloon soundings and tower temperature profiles, where the temper-15
ature increases upward to some point and then begins to decrease or stays constantwith height (isothermal). However, the boundary layer, where the actual turbulent ex-change with the surface occurs, may only be a small fraction of the inversion depth.The boundary layer depth can be defined in a number of ways and is thus more difficultto quantify. In its simplest form, it can be defined as the layer of the atmosphere directly20
influenced by the Earth’s surface in the exchange of heat, momentum, and moisture.From the perspective of chemistry occurring at Earth’s surface, it would be the layerof the atmosphere through which primary emissions from the surface would be mixedvertically. This concept allows a quantitative definition of BL height. For example, thetop of the BL can be defined as the point where some quantity (e.g. heat flux, con-25
centration etc.) falls off to some fraction of its surface value (e.g. 10%). It can alsobe observed using remote sensing such as sodar (e.g. Neff et al., 2007; Jones et al.,
4325

ACPD7, 4285–4403, 2007
Halogens and polarboundary-layerozone depletion
W. R. Simpson et al.
Title Page
Abstract Introduction
Conclusions References
Tables Figures
J I
J I
Back Close
Full Screen / Esc
Printer-friendly Version
Interactive Discussion
EGU
2006) or lidar systems (e.g. Zeng et al., 2003). It can also be deduced from seriesof ozonesondes (e.g. Shepson et al., 2003) although because of the long lifetime ofozone (or conversely its slow recovery rate after depletion) its vertical profile may notcoincide with short term variations in the boundary depth (Neff et al., 2007). In thisrespect, chemical as well as temperature profiling often reflect the history of boundary5
layer processes, not necessarily the boundary layer’s current state.As described by Anderson and Neff (2007)3 in the companion article in this issue,
boundary layers fall into three general classes: stable, neutral, or unstable (convective).In the stable BL, the turbulence produced by friction of the air flow over a rough surfacehas to work against the effect of buoyancy, eroding into the overlying air. In the neutral10
BL, no work needs to be done to overcome buoyancy and the BL simply grows ordiminishes in response to changes in surface friction (typically a function of wind speedand surface roughness) and the rate of dissipation of turbulent energy (a molecularprocess). In the unstable, or convective, BL, turbulence is produced by heated parcelsrising from a warmer surface into cooler air aloft. In these cases, the “heated surface”15
can arise from the absorption of radiation (e.g. direct sunlight), development of a heatand moisture source such as the relatively warm water in an open lead (Serreze et al.,1992; Alam and Curry, 1995), or result from an airmass change where a cold air massmoves over a warmer surface. In polar regions, each of these “classical” BLs canoccur within an otherwise stable atmosphere. One can thus see shallow mixing layers20
at the bottom of deep inversions, convective plumes which may or may not penetratethe overlying inversion, and neutral boundary layers capped with an inversion. Foran example of complex vertical mixing and layering, see the trajectory calculations ofFrieß et al. (2004) shown in Fig. 7. Complicating this picture are other buoyancy effectssuch as wave motions that may transfer momentum but not heat and the effects of the25
heterogeneous surfaces characteristic of coastal areas. This last effect is sometimespresent in ground-based observations of ODEs from coastal sites, and often adds
3Anderson, P. and Neff, W.: Boundary Layer Physics over Snow and Ice, Atmos. Chem.Phys. Discuss., in preparation, 2007.
4326
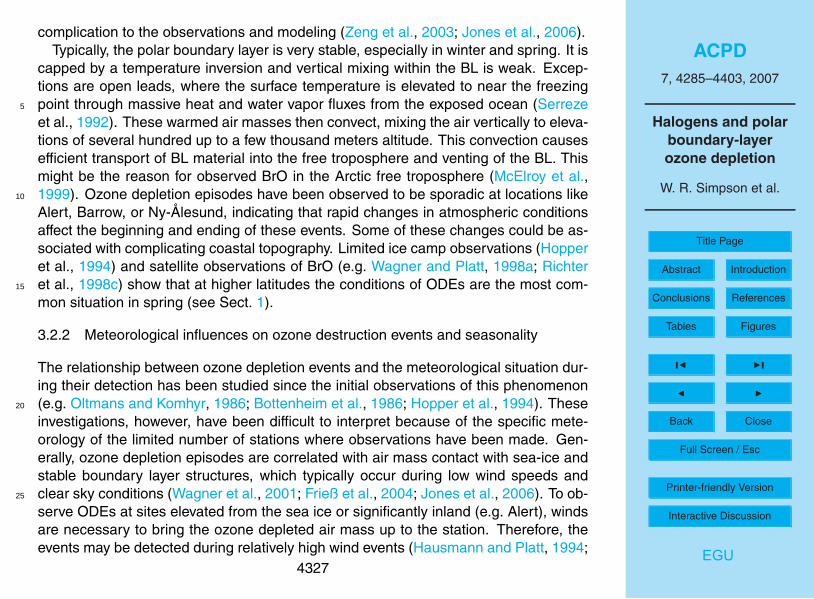
ACPD7, 4285–4403, 2007
Halogens and polarboundary-layerozone depletion
W. R. Simpson et al.
Title Page
Abstract Introduction
Conclusions References
Tables Figures
J I
J I
Back Close
Full Screen / Esc
Printer-friendly Version
Interactive Discussion
EGU
complication to the observations and modeling (Zeng et al., 2003; Jones et al., 2006).Typically, the polar boundary layer is very stable, especially in winter and spring. It is
capped by a temperature inversion and vertical mixing within the BL is weak. Excep-tions are open leads, where the surface temperature is elevated to near the freezingpoint through massive heat and water vapor fluxes from the exposed ocean (Serreze5
et al., 1992). These warmed air masses then convect, mixing the air vertically to eleva-tions of several hundred up to a few thousand meters altitude. This convection causesefficient transport of BL material into the free troposphere and venting of the BL. Thismight be the reason for observed BrO in the Arctic free troposphere (McElroy et al.,1999). Ozone depletion episodes have been observed to be sporadic at locations like10
Alert, Barrow, or Ny-Alesund, indicating that rapid changes in atmospheric conditionsaffect the beginning and ending of these events. Some of these changes could be as-sociated with complicating coastal topography. Limited ice camp observations (Hopperet al., 1994) and satellite observations of BrO (e.g. Wagner and Platt, 1998a; Richteret al., 1998c) show that at higher latitudes the conditions of ODEs are the most com-15
mon situation in spring (see Sect. 1).
3.2.2 Meteorological influences on ozone destruction events and seasonality
The relationship between ozone depletion events and the meteorological situation dur-ing their detection has been studied since the initial observations of this phenomenon(e.g. Oltmans and Komhyr, 1986; Bottenheim et al., 1986; Hopper et al., 1994). These20
investigations, however, have been difficult to interpret because of the specific mete-orology of the limited number of stations where observations have been made. Gen-erally, ozone depletion episodes are correlated with air mass contact with sea-ice andstable boundary layer structures, which typically occur during low wind speeds andclear sky conditions (Wagner et al., 2001; Frieß et al., 2004; Jones et al., 2006). To ob-25
serve ODEs at sites elevated from the sea ice or significantly inland (e.g. Alert), windsare necessary to bring the ozone depleted air mass up to the station. Therefore, theevents may be detected during relatively high wind events (Hausmann and Platt, 1994;
4327

ACPD7, 4285–4403, 2007
Halogens and polarboundary-layerozone depletion
W. R. Simpson et al.
Title Page
Abstract Introduction
Conclusions References
Tables Figures
J I
J I
Back Close
Full Screen / Esc
Printer-friendly Version
Interactive Discussion
EGU
Honninger and Platt, 2002).The complication that observation of ODEs at topographically complex coastal sites
(e.g. Alert) usually requires specific meteorological conditions to transport the properair masses to the field site has also caused difficulty in interpretation of the rate ofozone destruction. Many of the observations have shown extremely rapid temporal5
O3 decrease rates: decrease of more than 30 nmol/mol to less than 1 nmol/mol withinseveral hours (Bottenheim et al., 1986; Tuckermann et al., 1997; Morin et al., 2005;Jones et al., 2006; Jacobi et al., 2006). An example of particularly rapid O3 temporalloss and recovery is shown in Fig. 16. Most of these events can be clearly attributedto a change in air masses, where air parcels with reduced O3 concentrations were10
quickly transported to the measuring sites. For this reason, it is generally consideredthat the temporal rate of ozone decrease at a fixed site is not a good measure of thechemical ozone destruction rate. Most modeling studies also indicate that the chemicalrate of ozone destruction is on the order of a day (Fan and Jacob, 1992; McConnellet al., 1992; Sander et al., 2006). One study that was made in the marginal ice zone15
of the frozen Arctic Ocean has interpreted their observation as being due to rapid localchemical processing (Jacobi et al., 2006).
The earliest observations of ozone depletion events showed that they occurred inthe spring but not in the fall (Oltmans and Komhyr, 1986), and this apparent seasonalasymmetry has been a discussion ever since. In fact, earlier observations of bromine20
aerosol (Berg et al., 1983) showed that bromine peaks in springtime and not in the fall.Most interpretations of this asymmetry relate to the asymmetry of the annual cycle oftemperature and snow/ice as compared to the solar input. The solar input is symmetricabout the summer solstice, while the temperature and snow/ice cycles are lagged,with significantly lower temperatures and snow and sea ice during the springtime and25
warmer temperatures and increased open water during fall. This seasonal changein surface properties also causes stronger surface temperature inversions, reducedvertical mixing, and a shallower atmospheric boundary layer in the springtime. Lehreret al. (2004) argued that the combination of a shallow boundary layer, availability of
4328
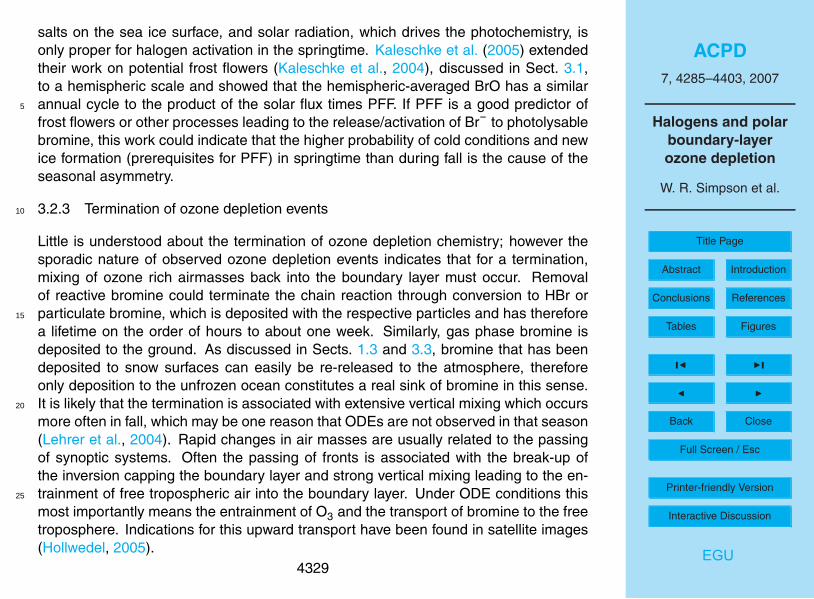
ACPD7, 4285–4403, 2007
Halogens and polarboundary-layerozone depletion
W. R. Simpson et al.
Title Page
Abstract Introduction
Conclusions References
Tables Figures
J I
J I
Back Close
Full Screen / Esc
Printer-friendly Version
Interactive Discussion
EGU
salts on the sea ice surface, and solar radiation, which drives the photochemistry, isonly proper for halogen activation in the springtime. Kaleschke et al. (2005) extendedtheir work on potential frost flowers (Kaleschke et al., 2004), discussed in Sect. 3.1,to a hemispheric scale and showed that the hemispheric-averaged BrO has a similarannual cycle to the product of the solar flux times PFF. If PFF is a good predictor of5
frost flowers or other processes leading to the release/activation of Br− to photolysablebromine, this work could indicate that the higher probability of cold conditions and newice formation (prerequisites for PFF) in springtime than during fall is the cause of theseasonal asymmetry.
3.2.3 Termination of ozone depletion events10
Little is understood about the termination of ozone depletion chemistry; however thesporadic nature of observed ozone depletion events indicates that for a termination,mixing of ozone rich airmasses back into the boundary layer must occur. Removalof reactive bromine could terminate the chain reaction through conversion to HBr orparticulate bromine, which is deposited with the respective particles and has therefore15
a lifetime on the order of hours to about one week. Similarly, gas phase bromine isdeposited to the ground. As discussed in Sects. 1.3 and 3.3, bromine that has beendeposited to snow surfaces can easily be re-released to the atmosphere, thereforeonly deposition to the unfrozen ocean constitutes a real sink of bromine in this sense.It is likely that the termination is associated with extensive vertical mixing which occurs20
more often in fall, which may be one reason that ODEs are not observed in that season(Lehrer et al., 2004). Rapid changes in air masses are usually related to the passingof synoptic systems. Often the passing of fronts is associated with the break-up ofthe inversion capping the boundary layer and strong vertical mixing leading to the en-trainment of free tropospheric air into the boundary layer. Under ODE conditions this25
most importantly means the entrainment of O3 and the transport of bromine to the freetroposphere. Indications for this upward transport have been found in satellite images(Hollwedel, 2005).
4329
ACPD7, 4285–4403, 2007
Halogens and polarboundary-layerozone depletion
W. R. Simpson et al.
Title Page
Abstract Introduction
Conclusions References
Tables Figures
J I
J I
Back Close
Full Screen / Esc
Printer-friendly Version
Interactive Discussion
EGU
3.3 The role of surface fluxes and snow photochemistry
3.3.1 HOx and NOx fluxes
As was described in Sect. 1.3, bromine can be released from salty ice surfaces in anautocatalytic chemical mechanism that oxidizes bromide in the salt to bromine that isreleased to the atmosphere. In these reactions, HOx and acidity (H+) are consumed5
to drive the oxidation, coupling the bromine explosion chemistry to HOx chemistry.Many studies have shown that the snow pack is a photochemical reactor that pro-duces HOx precursors, such as HONO, (e.g. Zhou et al., 2001; Domine and Shepson,2002) indicating ties between snow pack chemistry and ozone depletion chemistryin the overlying atmosphere. Additionally, snow pack photochemistry is likely to pro-10
duce small organic molecules (Sumner and Shepson, 1999; Michalowski et al., 2000;Boudries et al., 2004) that can be sinks for reactive halogen species, such as HCHO,also modulating the efficiency of ozone depletion. NOx is also produced by snow packphotochemistry and interacts with halogen oxide cycling (Honrath et al., 1999, 2000;Jones et al., 1999, 2000). The surface chemistry producing the HOx and NOx and15
field observations are discussed in detail in the accompanying snow photochemistryreview paper (Grannas et al., 2007). Here we focus on couplings between HOx andNOx precursors and halogen species.
In the pristine polar environment, it is expected that OH levels, and hence the rate ofchemical oxidation of VOCs, are low. However, summertime measurements at South20
Pole (Mauldin et al., 2004) and at Summit (Sjostedt et al., 2007) show several times106 molecule cm−3 OH radicals, higher than expected for production via ozone photol-ysis and the subsequent O(1D)+H2O reaction. At the South Pole, photolysis of H2O2and HCHO produced from the snow pack cause much of the OH enhancement, withthe additional factor of relatively high levels of snowpack-produced NO altering the par-25
titioning of HOx to favor OH. At Summit, ozone photolysis is a key producer of OH withsnow pack H2O2 also contributing. The photolysis of nitrate ions in the snow appearsto be the initiating step in production of NOx precursors – see the accompanying snow
4330

ACPD7, 4285–4403, 2007
Halogens and polarboundary-layerozone depletion
W. R. Simpson et al.
Title Page
Abstract Introduction
Conclusions References
Tables Figures
J I
J I
Back Close
Full Screen / Esc
Printer-friendly Version
Interactive Discussion
EGU
photochemistry review (Grannas et al., 2007). This type of modification of the atmo-spheric composition as compared to snowpack-free chemical models was discussedin a review article (Domine and Shepson, 2002) and references therein. Model calcu-lations trying to reproduce halogen oxide measurements during the recent CHABLIScampaign and other studies indicate there may be substantial photochemical produc-5
tion of reactive halogen species from the snowpack, with rapid conversion to reservoirspecies aloft. The resulting sharp vertical gradients in halogen oxides would then pro-duce significant vertical gradients in OH and HO2 concentrations above the snowpack,with implications for placing of inlets for field instruments. Other studies have shownthat ozone may be destroyed in the snow pack (Peterson and Honrath, 2001; Boudries10
et al., 2004), as is described in the accompanying snow photochemistry review article(Grannas et al., 2007).
3.3.2 Haloorganic fluxes
The concept that haloorganic molecules are the main source of the reactive halogenspecies (Barrie et al., 1988) has been replaced by the view that the majority of the15
reactive halogen species come from sea salt (see Sect. 1). However they might be themajor source for iodine and there may still be a role for haloorganic fluxes in initiationor termination of the reactive halogen chemistry. In this section, we consider observa-tions of haloorganic molecules in the polar regions and their implications for halogenactivation/ozone depletion chemistry and as source for reactive iodine.20
Sturges et al. (1992) and Sturges and Shaw (1993) demonstrated that Arctic andAntarctic sea ice algae were a source of bromoform (CHBr3) and observed ventingof bromoform from cracks in the sea ice. Schall and Heumann (1993) reported thefirst measurements of mixed bromo-iodo halocarbons in the Arctic. They measureda variety of compounds including CH3I, CH2I2, CH2ClI with mixing ratios in the range25
0.7–2 pmol/mol. Most of the organic bromine compounds are thought to be producedbiologically, by macro and micro algae and esp. by ice algae (e.g. Reifenhauser andHeumann, 1992a; Schall et al., 1994). Wever et al. (1991) even measured the direct re-
4331
ACPD7, 4285–4403, 2007
Halogens and polarboundary-layerozone depletion
W. R. Simpson et al.
Title Page
Abstract Introduction
Conclusions References
Tables Figures
J I
J I
Back Close
Full Screen / Esc
Printer-friendly Version
Interactive Discussion
EGU
lease of HOBr from seaweed in incubation studies indicating a potentially larger role forseaweed in ODEs than one might expect from the release of only organic bromine com-pounds. The production of halocarbons by different types of macroalgae in the southpolar sea was investigated by Schall et al. (1994), who have found that organoiodinesare mainly emitted as CH2I2 (4.1 ng/g of wet algae in case of Laminaria saccarina),5
followed by CH3I and CH2ClI. Volatilisation of these compounds occurs if the oceanbecomes supersaturated, which is the case for iodinated hydrocarbons with mean seawater concentrations of 2.5 ng/l for CH3I and 0.15 ng/l for CH2ClI in the south polarsea (Reifenhauser and Heumann, 1992b). There is only limited knowledge about theproduction of biomass and the related release rates of iodinated organic compounds10
into the atmosphere. The primary production of biomass in the Southern Ocean perarea and year was estimated by Lønne (1999) to 645 g(C)/m2/yr, which is more thantwice as much as the average production rate for all oceans (282 g(C)/m2/yr Longhurstet al., 1995). Very little is known about the release of iodinated compounds duringwinter, and only rough estimates exist on the biomass production of the sea ice cov-15
ered polar ocean. The total primary biological production associated with the Antarcticsea has been estimated to 2.14×10¹⁴ g(C)/yr (Legendre et al., 1992). Thus, 33% ofthe total primary production takes place below, in, or on the surface of the sea ice,with the majority (1.41×10¹⁴ g(C)/yr) being produced in the water column in ice edgeblooms. While the biological activity is more uniformly distributed over the whole wa-20
ter column during summer, it is concentrated on the surface in the ice covered oceanduring winter/spring.
Incubation studies (Moore et al., 1996) showed that a number of cold-water diatomswere capable of production of short-lived polyhalomethanes including CHBr3, CH2I2and CH2ICl. Concentrations of bromo- and bromochloromethanes in Arctic air have25
been observed to peak over a broad winter period and apparently did not directly cor-respond to blooms of marine biota (Yokouchi et al., 1996), however their seasonalvariations will also be affected by variations in prevailing winds and in chemical lossrates, and have not been definitively assigned to any one cause. Spring blooms of sea
4332

ACPD7, 4285–4403, 2007
Halogens and polarboundary-layerozone depletion
W. R. Simpson et al.
Title Page
Abstract Introduction
Conclusions References
Tables Figures
J I
J I
Back Close
Full Screen / Esc
Printer-friendly Version
Interactive Discussion
EGU
ice algae tend to occur rather earlier than those of phytoplankton, and indeed the seaice communities that detach from the ice during polar spring may seed the subsequentphytoplankton blooms (Lizotte, 2001).
There is also evidence for abiotic sources of halocarbons in the polar regions. Swan-son et al. (2002) measured the alkyl halides CH3Br, CH3I and C2H5I in the near-surface5
Arctic snowpack and found their concentrations to be 3–10 times higher in the snow-pack than in ambient air. The authors suggested a photochemical source from reactionof alkyl radicals produced from photolysis of carbonyl compounds, which comprise partof the high levels of total organic carbon found in snow (Couch et al., 2000; Yang et al.,2002). More recently, the shorter-lived di- and tri-halomethanes (e.g. CHBr3, CH2I2,10
CH2IBr, CH2ICl) have been observed in high concentrations in air that had passedover the frozen Hudson Bay during polar sunrise (Carpenter et al., 2005a, and seeFig. 17). The absence of local leads in the Bay coupled with the extremely short at-mospheric lifetime of CH2I2 indicated that production occurred in the surface of thesea-ice/overlying snowpack rather than from algal emissions through leads. Carpenter15
et al. (2005a) proposed an abiotic mechanism for the production of polyhalogenatediodo- and bromocarbons, via reaction of HOI and/or HOBr with organic material in thequasi-liquid layer to explain this phenomenon, but so far this has yet to be confirmedby studies within the snowpack. Such a link between organic and inorganic halogenrelease may, however, offer an explanation for observations that CHBr3 is inversely cor-20
related to O3 and positively correlated to inorganic Br during polar sunrise (Bottenheimet al., 1990; Li et al., 1994; Carpenter et al., 2005a). The observations and sugges-tions by Swanson et al. (2002) and Carpenter et al. (2005a) might be an explanation forthe airborne measurements of CHBr3 by Wingenter et al. (2003) that showed elevatedconcentrations over the Canadian Arctic during boundary layer ODEs. However, no25
other organic gas measured during these flights showed a similar anticorrelation whichmight be due to the different lifetimes of these gases.
Although the direct chemical impact of bromoform on ODEs is thought to be neg-ligible, recent modeling studies (Calvert and Lindberg, 2004a,b) indicate that reactive
4333

ACPD7, 4285–4403, 2007
Halogens and polarboundary-layerozone depletion
W. R. Simpson et al.
Title Page
Abstract Introduction
Conclusions References
Tables Figures
J I
J I
Back Close
Full Screen / Esc
Printer-friendly Version
Interactive Discussion
EGU
organic iodocarbons such as CH2I2 could play an important role. The Calvert and Lind-berg (2004a,b) studies found that, per molecule, CH2I2 and other iodine compoundsadded to a Br2 and BrCl mixture have a significantly greater ozone depletion effectthan additional Br2 and BrCl molecules. Observed total organic reactive iodine mix-ing ratios of up to 5 pmol/mol (sum of CH2I2+CH2IBr+CH2ICl) in Arctic air (Carpenter5
et al., 2005a) could produce reactive I species that may either couple into bromine ex-plosion chemistry or participate through cross reaction cycles (e.g. IO+BrO). However,these reactive iodine species mixing ratios are significantly smaller than the observedBrCl and Br2 mixing ratios of 0–35 pmol/mol and 0–25 pmol/mol, respectively, observedduring polar sunrise at Alert, Canada (Foster et al., 2001; Spicer et al., 2002).10
4 Impacts of ODEs on polar chemistry
4.1 Effects on halogen – mercury interactions
Mercury (Hg) is a global pollutant emitted from both natural and anthropogenic sources.Anthropogenic contributions are suggested to have increased the atmospheric mercuryloading significantly in comparison to pre-industrial times (Mason et al., 1994). Some15
natural sources of mercury include: forest fires, volcanoes, and emissions from oceans.Anthropogenic mercury sources are: coal fire power plants, chlor-alkali plants, medicalactivities, and products such as fluorescent light bulbs, thermometers, and switches.The high vapor pressure of this metal enables mercury to be transported in the atmo-sphere, primarily in the form of gaseous elemental mercury. Recent data from the de-20
veloping world (e.g., China) indicates that a large fraction of the observed atmosphericmercury is emitted in the form of mercury particles. The particulate fraction depositslocally near point sources, but the gas (Hg0) transports over long ranges. Hg0 is thenoxidized to reactive gaseous mercury (RGM) that is rapidly scavenged. The uniquechemistry of the Arctic region appears very efficient in oxidizing Hg0 and depositing the25
products. Following deposition, mercury can, in part re-enter the atmosphere through
4334
ACPD7, 4285–4403, 2007
Halogens and polarboundary-layerozone depletion
W. R. Simpson et al.
Title Page
Abstract Introduction
Conclusions References
Tables Figures
J I
J I
Back Close
Full Screen / Esc
Printer-friendly Version
Interactive Discussion
EGU
volatalization and (photo)reduction processes. The remaining deposited mercury canultimately reach deep sediments and/or bioaccumulate into wildlife (primarily in the ma-rine environment) and eventually into humans as well. All forms of Hg that have beendetected in the atmosphere have been established as toxic (Hylander and Goodsite,2006), however the level of toxicity of mercury compounds varies significantly, with5
organomercury complexes being particularly neurotoxic compounds.Schroeder et al. (1998) were the first to report rapid depletion of measured gaseous
elemental mercury (GEM) in the marine boundary layer during the springtime in theArctic (see Fig. 18). It was found that within hours GEM decreased from its averagebackground air concentration (∼1.7 ng m−3, in the Northern Hemisphere (Slemr et al.,10
2003) to values lower than 0.5 ng m−3. This finding was contrary to the known GEM at-mospheric residence time of 6–24 months (Schroeder and Munthe, 1998). It was alsofound that the depletion of Hg occurred concurrently with tropospheric ozone deple-tion. The occurrence and mechanisms of these “atmospheric mercury depletion events(AMDEs)” are reviewed by Steffen et al. (2007)1. The observations of Schroeder et al.15
(1998), have led to many field campaigns where observations of AMDEs were madethroughout polar regions (e.g. Schroeder et al., 2003; Ebinghaus et al., 2004) and hasengendered a new field of mercury research. Halogens appear to play a key role inthese AMDEs but a complete understanding of these reaction processes has yet to beachieved (e.g. Ariya et al., 2004).20
Considerable research has been undertaken in the last several years to elucidatethe mechanisms behind these AMDEs and to include this into numerical models us-ing both experimental and calculated kinetic data in regards to mercury and halogeninteractions (e.g. Ariya et al., 2002, 2004; Shepler and Peterson, 2003; Khalizov et al.,2003; Calvert and Lindberg, 2003; Goodsite et al., 2004; Raofie and Ariya, 2004, 2006).This research proposes that, through a series of photochemically initiated interactions,reactive bromine plays the key role in oxidizing mercury in the Arctic and marine bound-ary layer (and possibly the free troposphere) to convert gas-phase elemental mercury
4335

ACPD7, 4285–4403, 2007
Halogens and polarboundary-layerozone depletion
W. R. Simpson et al.
Title Page
Abstract Introduction
Conclusions References
Tables Figures
J I
J I
Back Close
Full Screen / Esc
Printer-friendly Version
Interactive Discussion
EGU
(GEM, or equivalently Hg0) as shown below:
Br + Hg0 → HgBr (R14)
BrO + Hg0 → HgO + Br (R15)
BrO + Hg0 → HgBrO (R16)
BrO + Hg0 → HgBr + O (R17)
These oxidized inorganic Hg species, currently operationally defined as reactivegaseous mercury (RGM), are more reactive than GEM and may directly deposit tosnow/ice or associate with particles in the air that can subsequently deposit onto thesnow and ice surfaces (Lu et al., 2001; Lindberg et al., 2002). Increases in both RGMand particulate adsorbed mercury (p-Hg) have been reported in conjunction with de-5
creases of GEM (Lu et al., 2001; Lindberg et al., 2002; Aspmo et al., 2005). High levelsof mercury are found in snow and ice in regions influenced by ODEs/AMDEs (Lindberget al., 2002; Douglas et al., 2005; Bargagli et al., 2005). Estimates have calculated thatthese spring-time mercury depletion events deposit between 50 and 300 additionaltons of mercury to the Arctic over a period of one year (Schroeder et al., 1998; Banic10
et al., 2002; Ariya et al., 2004). It has been proposed that this input to the polar en-vironment may have consequences for the health of the aboriginal population and theArctic ecosystems following flushing of mercury in the melt water during springtime andsummer (Schroeder et al., 1998; Lu et al., 2001; Lindberg et al., 2002; Hylander andGoodsite, 2006; Poulain et al., 2006). Hg exposure was assessed in two communities15
in Nunavut at two Arctic sites of Igloolik and Repulse Bay. In this study, 33% of partici-pants from Igloolik and 60% of participants from Repulse Bay had exposure estimatesabove the minimal risk level.
Atomic bromine and bromine oxide are thought to play essential roles in AMDEs,however, atomic bromine is suspected to be a more important oxidant in these re-20
actions. Reactions of Cl, Cl2, and Br2 are reportedly too slow to be responsible forAMDEs (e.g. Ariya et al., 2002, 2004; Goodsite et al., 2004). Recent laboratory studiesof I, I2, IO, and ClO initiated reactions of GEM indicate that these reactions are unlikely
4336

ACPD7, 4285–4403, 2007
Halogens and polarboundary-layerozone depletion
W. R. Simpson et al.
Title Page
Abstract Introduction
Conclusions References
Tables Figures
J I
J I
Back Close
Full Screen / Esc
Printer-friendly Version
Interactive Discussion
EGU
to compete with Br-atom oxidation mechanism in the destruction of elemental mercuryin the Arctic (Raofie and Ariya, 2006).
The remaining open questions include the identification of the exact chemical struc-ture of so-called RGM and p-Hg, as the existing analytical techniques are inadequateto determine the detailed chemical speciation of mercury. Further kinetic, theoretical,5
and product studies to determine primary and secondary reactions leading to oxidizedmercury are required. Further studies on redox mechanisms (including photo-redox)in snow, at the air-snow interface, in clouds and fogs, and in molten snow are needed,as they are amongst several factors that dictate the accumulation of mercury in polarenvironments.10
4.2 Effects on hydrocarbons and aldehydes
Ozone depletion and halogen chemistry has a significant impact on VOC and OVOCphotochemistry. Jobson et al. (1994) and Yokouchi et al. (1994) first observed that lighthydrocarbons are rapidly consumed (mostly by Cl atoms) during ODEs. The lifetime ofpropane under normal conditions for example is (kOH×[OH])−1≈14 days (at T=245 K15
and with a global average of [OH]=1.0×106 cm−3). However, during ozone depletionevents, the [Cl] concentrations may be as high as 7.5×104 cm−3 (Boudries and Bot-tenheim, 2000). The high rate constant of Cl with propane (8800 times larger withCl than OH) results in a propane lifetime of ∼8 h. Jobson et al. (1994) and Yokouchiet al. (1994) showed that reactive alkanes, such as butane and n- and iso-pentane are20
nearly completely removed during ODEs. Usually they would decay slowly through thespring season, due to reduced OH radical chemistry at large solar zenith angles andlow absolute [H2O]. Jobson et al. (1994) used the ratio [isobutane]/[n-butane] as anindicator of chlorine atom oxidation to show that during ozone depletion events there isextensive chlorine-atom processing of VOCs (see Fig. 19).25
Possibly more important than the rapid destruction of alkanes, alkenes and mostaromatics is the production of OVOC oxidation products in the stable polar marineboundary layer. For example, during ozone depletion events, there is a substantial
4337

ACPD7, 4285–4403, 2007
Halogens and polarboundary-layerozone depletion
W. R. Simpson et al.
Title Page
Abstract Introduction
Conclusions References
Tables Figures
J I
J I
Back Close
Full Screen / Esc
Printer-friendly Version
Interactive Discussion
EGU
consumption of propane, and a concomitant increase in acetone (Guimbaud et al.,2002). It is important to note, however, that alkane oxidation cannot account for theincrease in gas phase OVOCs during ODEs (Sumner et al., 2002; Guimbaud et al.,2002).
As discussed by Sumner et al. (2002), the precursor HO2 is produced in significantpart by Cl atom reaction with VOCs (e.g. methane and ethane), to produce HO2 directly,or through photolysis of the product HCHO. Therefore, of particular importance is theproduction of HCHO, as this species ties together halogens, VOCs, and ODEs andAMDEs. HCHO can be produced from the following reaction sequence.
Cl + CH4(+O2) → HCl + CH3OO (R18)
CH3OO + NO → CH3O + NO2 (R19)
CH3OO + CH3OO → 2CH3O + O2 (R20)
CH3OO + CH3OO → CH3OH + HCHO + O2 (R21)
CH3O + O2 → HCHO + HO2 (R22)
HCHO + hν(+O2) → 2HO2 + CO (R23)
Hydroperoxy radicals (HO2), produced in the reactions above, can then react with BrO5
as in Reaction (R5) to produce HOBr, a central reactant involved in the “bromine ex-plosion” (see Sect. 1.3) and thus accelerating the halogen, ODE and AMDE chemistry.
Gas phase oxidation cannot account for the observed HCHO. Shown in Fig. 20 is themeasured HCHO at Alert above the snowpack, as a function of ozone concentration.Also shown is the concentration calculated from oxidation of CH4 by Cl atoms, which10
can account for only ∼100 pmol/mol HCHO. However, as much as 300 pmol/mol in thenear-surface boundary layer have been observed during partial ODEs. Production inand emission from the snowpack is discussed in the companion paper on snow pho-tochemistry (see also Fuhrer et al., 1996; Hutterli et al., 1999; Sumner and Shepson,1999; Sumner et al., 2002; Perrier et al., 2002; Grannas et al., 2002; Hutterli et al.,15
2004; Riedel et al., 2005).
4338

ACPD7, 4285–4403, 2007
Halogens and polarboundary-layerozone depletion
W. R. Simpson et al.
Title Page
Abstract Introduction
Conclusions References
Tables Figures
J I
J I
Back Close
Full Screen / Esc
Printer-friendly Version
Interactive Discussion
EGU
A problem with sustaining high concentrations of HCHO during ODEs is that HCHOreacts rapidly with Br atoms, thus as [O3] gets low, BrOx repartitions to a higher fractionof Br and HCHO destruction increases via the reaction:
HCHO + Br → HBr + CHO. (R24)
Although reactive bromine chemistry may also produce HCHO via the reaction (Wagner5
et al., 2002):
BrO + CH3OO → Br + HO2 + HCHO. (R25)
The aircraft vertical profiles obtained during the TOPSE campaign over the ArcticOcean showed elevated HCHO in the near surface layer, consistent with a snow-pack/sea ice source (Ridley et al., 2003). The snowpack chlorine chemistry may also10
contribute to production of CH3CHO (Grannas et al., 2002), which is important sink forNOx. At low temperatures, oxidation of CH3CHO by Br leads to the production of PAN(Dassau et al., 2004).
Other OVOCs, such as acetone, are produced during ozone depletion events. Yok-ouchi et al. (2002) were the first to show the dramatic inverse correlation between ace-15
tone and ozone during ODEs. However, the work of Guimbaud et al. (2002) showed,through measurements and models, that the large (often as much as 500 pmol/mol)increase in acetone concentrations during ODEs cannot be accounted for on the basisof gas phase oxidation of the measured VOCs (e.g. propane). Again, a contributionfrom the snowpack was invoked to explain the high concentrations during ODEs (see20
the companion paper of snow photochemistry).It is also known that halogen-VOC chemistry can be detected through measurements
of halogenated VOC oxidation products. A number of halogen-containing species havebeen detected, including products of chlorine and bromine reaction with ethene andpropene (Keil and Shepson, 2006), halogenated carboxylic acids in particulate matter25
(Narukawa et al., 2003), and diiodomethane and bromo-iodo-methane, suggested tobe produced from HOBr and HOI reaction with organic matter in the sea ice/snowpack
4339

ACPD7, 4285–4403, 2007
Halogens and polarboundary-layerozone depletion
W. R. Simpson et al.
Title Page
Abstract Introduction
Conclusions References
Tables Figures
J I
J I
Back Close
Full Screen / Esc
Printer-friendly Version
Interactive Discussion
EGU
(Carpenter et al., 2005a). It is thus clear that halogen chemistry has an impact onatmospheric composition that goes well beyond ozone and Hg depletion.
4.3 Effects on radiation and of radiation
Tropospheric ozone depletion events change both short-wave UV and long-wave IRradiation balance at the surface. They increase the UV radiation reaching the lower5
atmosphere, but the typical amount of ozone depletion is 30 nmol/mol in a thickness of0.5 km, which is only 1% of the stratospheric amount. Together with the small incidentUV at the high solar zenith angles of the early spring, this decrease results in little extraUV to cause damage either to organisms or humans. Similarly, there is a negligibleincrease in actinic fluxes: at 10◦ solar elevation (80◦ SZA), a decrease in ozone from10
300 to 297 Dobson units increases j (O1D) by 1.5%, and j (NO2) by 0.01% (calculatedby the TUV model: http://cprm.acd.ucar.edu/Models/TUV/).
Ozone is a greenhouse gas and therefore interacts with IR radiation. The size ofthe effect, however, is dependent on the height of the concentration change. A changein ozone mixing ratio at the surface has negligible effects on IR radiation, while an15
increase in ozone in the Upper Troposphere will cause a surface warming (Lacis et al.,1990). Hence, ozone-poor air mixed to the free troposphere may induce a regionalcooling. The predicted radiative forcing of a 3 DU change in tropospheric ozone issmall (see Table 3). A change in the intensity of ODEs could alter the troposphericozone column, and thus give rise to a small climate feedback, which might be coupled20
to sea-ice conditions and thus feedback into further changes in ODEs. In this feedback,ozone-poor air from depletion events, when mixed to the free troposphere, is currentlycausing a small regional cooling. If a reduction in sea ice occurred in a warming world,there might then be an altered frequency of depletion events which could then affectthe surface energy balance. Mixing of ozone-poor air to the lower free troposphere25
in Antarctica was observed by Wessel et al. (1998) and Roscoe et al. (2001). It willprobably mix to the upper troposphere because the ozone replacement time is long inair containing very little NOx, such as that above the Southern Ocean. Here, the ozone
4340

ACPD7, 4285–4403, 2007
Halogens and polarboundary-layerozone depletion
W. R. Simpson et al.
Title Page
Abstract Introduction
Conclusions References
Tables Figures
J I
J I
Back Close
Full Screen / Esc
Printer-friendly Version
Interactive Discussion
EGU
production rate is less than 0.5 nmol/mol/day in summer and even less in the reducedUV of spring (Ayers et al., 1997). At a production rate of 0.5 nmol/mol/day it takes over30 days to recover to normal ozone values of 15–20 nmol/mol.
As well as the effects of ODEs on radiation, there is also an effect of UV radiationintensity on ODEs. Stratospheric ozone depletion in polar regions causes enhanced5
UV radiation flux at the surface. This radiation in the wavelength region of 280–315 nmstrongly affects the photochemistry in the troposphere. It increases photodissociationrates of tropospheric ozone and other trace gases. As a consequence, ODEs mightoccur more frequently or with greater extent or depth. However, this effect remains tobe quantified.10
4.4 Effects on bromine export to the free troposphere
Outside the polar regions, satellite observations show the widespread presenceof BrO in the troposphere with global background vertical columns of about 1–3×10¹³ molec cm−2. These VCDs correspond to BrO mixing ratios of 0.5–2 pmol/mol,if uniformly mixed in the troposphere (e.g. Van Roozendael et al., 2002; Pundt et al.,15
2002). Comparisons with balloon and ground based measurements in mid and highnorthern latitudes, the diurnal variation of ground based BrO column measurementsas well as two direct measurements of BrO indicated that the tropospheric BrO wasmainly located within the free troposphere (Pundt et al., 2002; Van Roozendael et al.,2002), see also discussion and references in von Glasow et al. (2004). Model calcu-20
lations show that these amounts of BrO would lead to significant decreases in globalzonal mean O3 concentrations of 5–20% (von Glasow et al., 2004; Yang et al., 2005).There are two main transport pathways for BrO from the polar boundary layer to thefree troposphere: 1) Rapid vertical transport in association with convection from openleads. 2) “Spill-out” and frontal uplifting. McElroy et al. (1999) have observed BrO in25
the Arctic free troposphere and argue that this is due to strong convection from openleads caused by the very large temperature differences of open sea water and the sur-rounding air. “Spill-out” of BrO clouds to lower latitudes is a feature that can commonly
4341

ACPD7, 4285–4403, 2007
Halogens and polarboundary-layerozone depletion
W. R. Simpson et al.
Title Page
Abstract Introduction
Conclusions References
Tables Figures
J I
J I
Back Close
Full Screen / Esc
Printer-friendly Version
Interactive Discussion
EGU
be observed in satellite images (Hollwedel et al., 2004; Hollwedel, 2005). One suchevent was probably identified in the north Pacific in O3 measurements aboard a com-mercial ship (Watanabe et al., 2005) where very low O3 was measured in airmassesoriginating from an area with increased BrO as detected by GOME. The combinationof “spill-out” of BrO to lower latitudes with frontal uplifting can lead to the transport of5
BrO-rich air into the FT as indicated by the analysis of satellite images in combinationwith back trajectories (Hollwedel, 2005) and ground based measurements combinedwith back-trajectory calculations (Frieß et al., 2004).
4.5 Effects on the sulfur cycle
The sulfur cycle in the clean marine boundary layer is dominated by the emission of10
dimethylsulfide (DMS) from the ocean. Usually, OH and NO3 are assumed to be themain oxidants for DMS, where OH both adds oxygen to and abstracts hydrogen fromDMS and NO3 only abstracts hydrogen. The importance of the different initial productslies in the final products and the fact that only H2SO4, which is mainly produced in theabstraction pathway, can lead to the production of new aerosol particles whereas all15
other DMS products can only grow existing particles. As discussed in von Glasow andCrutzen (2004), the dominance of the addition pathway can result in cloud feedbacksthat counter the increase of cloud albedo caused by DMS emission as proposed in theso-called CLAW hypothesis (Charlson et al., 1987) as fewer new particles are formed.The chlorine atom also adds to DMS but under ODE conditions this effect is probably20
less important compared to the reaction of BrO with DMS. Based on measurementsby Barnes et al. (1991), Toumi (1994) suggested BrO to be a potentially importantadditional oxidant for DMS. The rapid reaction of BrO with DMS leads to the additionof oxygen to DMS and therefore to the above discussed shifts in the final oxidationproducts of DMS25
BrO + DMS → DMSO + Br (R26)
4342

ACPD7, 4285–4403, 2007
Halogens and polarboundary-layerozone depletion
W. R. Simpson et al.
Title Page
Abstract Introduction
Conclusions References
Tables Figures
J I
J I
Back Close
Full Screen / Esc
Printer-friendly Version
Interactive Discussion
EGU
Global model studies have shown that BrO mixing ratios down to 0.5 pmol/mol in themarine boundary layer can significantly affect DMS on the global scale (Boucher et al.,2003; von Glasow et al., 2004).
4.6 Effects on aerosol production
The change in oxidants during ODEs could lead to an increase of aerosol production,5
as long as there are appropriate organic (e.g. aromatics, DMS) or inorganic (e.g. SO2)precursors present which can be oxidized by Cl, Br, or BrO. An intriguing questionis if the coupling between ODE chemistry and long range transported anthropogenicpollutants contributes to Arctic Haze and cloud cover, because radiative impacts arevery dependent on the aerosol type (Hu et al., 2005). Aerosols have been studied in10
the Arctic, starting with the AGASP studies of the early 1980s (Radke et al., 1984, alsosee Sect. 1.2). During the Polar Sunrise Experiment 1992, Staebler et al. (1994) exam-ined relationships between aerosol size and number distributions and ozone, includingduring ODEs. They found that accumulation mode aerosol concentration was weaklynegatively correlated with ozone in the dark period, but was less correlated after sun-15
rise at Alert. The dark period is characterized by long range transport of haze aerosolsto the Arctic region, e.g. from Eurasia. Under these conditions, aerosols correlate wellwith CO2, PAN and other indicators of anthropogenic pollution. In contrast, during Aprilwhen ozone was periodically depleted (with air mass origins from the Arctic Ocean),the small particles were in fact well positively correlated with ozone, i.e. when ozone20
was depleted, accumulation mode (0.07–0.2µm) particle numbers decreased. In con-trast, larger particles (0.7–12µm) correlated negatively with ozone. Indeed, very largeparticles, most likely sea salt, were only observed during ozone depletion events. Theclose positive correlation of ozone with accumulation mode particles at Alert is mostlikely due to long range transport of haze aerosols (i.e. sulfate) in air masses aloft of25
the marine boundary layer. During ozone depletion events at Alert, the air sampledrepresents relatively clean marine boundary layer air, with some associated sea saltparticles, explaining the negative correlation between large particles and ozone. Un-
4343

ACPD7, 4285–4403, 2007
Halogens and polarboundary-layerozone depletion
W. R. Simpson et al.
Title Page
Abstract Introduction
Conclusions References
Tables Figures
J I
J I
Back Close
Full Screen / Esc
Printer-friendly Version
Interactive Discussion
EGU
like iodine, bromine is not known to produce new particles, but it might contribute toparticle mass. The peak in the surface area distribution is at ∼0.2µm diameter, andthus HBr adsorption could cause growth of these particles. Indeed, during ozone de-pletion events, there is a reasonable negative correlation between ozone and aerosolsin the 0.7µm range (R=0.5), consistent not with production of new particles, but growth5
onto existing small sulfate aerosol.In the Arctic, so far no new particle formation events have been observed during
ODEs, so it appears that most of the products of chlorine atom reaction with VOCsremain in the gas phase, or undergo uptake into existing particles (or surface depo-sition). Studies at mid-latitude sites have shown (e.g. O’Dowd and Hoffmann, 2005)10
that new particles can be produced very efficiently under iodine-rich conditions so thatthere might indeed be halogen-induced particle bursts in polar regions under someconditions. This process could be an explanation for the observation of Davison et al.(1996) of ultrafine particle events in the Antartic.
4.7 Effects on ice core chemistry15
Ice cores play a very powerful role in the study of the Earth System because not onlydo they contain records of changing climate, but also of changing atmospheric compo-sition (e.g. Wolff, 2005). These records include both stable trace gases such as CH4and CO2, (e.g. Etheridge et al., 1996; Siegenthaler et al., 2005; Spahni et al., 2005)and aerosol compounds including sea salt ions (Wagenbach et al., 1998; Rankin et al.,20
2002; Wolff et al., 2003; Rothlisberger et al., 2003; Wolff et al., 2006).Sea salt ions such as Na+ are routinely measured in ice cores, and indicate to first
order the amount of sea salt aerosol in the atmosphere above the site. Recent interpre-tations suggest that the primary source of the sea salt in the polar regions may not beopen water but instead saline sea ice surfaces (including frost flowers, see Sect. 3.1).25
This might provide a possibility to study ODEs in the past. During the last glacial max-imum, when there was certainly more sea ice and more sea salt in the atmosphereand snow (Wolff et al., 2003, 2006; Gersonde et al., 2005), it is interesting to ask how
4344

ACPD7, 4285–4403, 2007
Halogens and polarboundary-layerozone depletion
W. R. Simpson et al.
Title Page
Abstract Introduction
Conclusions References
Tables Figures
J I
J I
Back Close
Full Screen / Esc
Printer-friendly Version
Interactive Discussion
EGU
ODEs were affected. Bromide (Br−) has rarely been measured routinely in ice cores,but if it is strongly fractionated in some regions by halogen activation, then ice corestudies in carefully chosen sites, could provide some additional information about theextent of ODE activity. On the other hand, effects of ODEs on ice cores are probablynegligible, since these seasonal episodes of ozone losses are brief and only observed5
at costal sites and not at the more important inland ice core sites. However, there aresome secondary effects of elevated halogen species. For example, halogens play arole in determining hydrocarbon concentrations in coastal Arctic and Antarctic regions.Although there has been little work to date on organic compound concentrations in ice,this is clearly an issue to take into account if such studies become feasible.10
Another important area is the study of sulfur compounds in ice cores. The ratio ofmethane sulfonic acid (MSA) to non-sea-salt sulfate (nssSO2−
4 ) derived from oxidationof DMS has been the subject of numerous ice core studies (e.g. Legrand and Pasteur,1998). Though the mechanisms producing MSA seem to be more important at lowtemperatures (e.g. Bates et al., 1992), highest ratios in Antarctica are usually found in15
summer. As suggested by Toumi et al. (1995) and von Glasow and Crutzen (2004) re-actions of halogens (especially BrO) with DMS may be important, and lead to relativelygreater production of MSA. If halogen concentrations really control sulfur chemistry,then ratios preserved in ice cores might be useful in diagnosing the extent of halogenactivation in the past.20
5 Future scenarios of ozone depletion and open questions
5.1 Anthropogenic influences and atmospheric change
Tropospheric ODEs occur naturally and are not caused by anthropogenic pollution.However, there are anthropogenic influences that could change the frequency and in-tensity of ODEs. When ODEs were first discovered, they were thought to be related25
to anthropogenic pollution known as Arctic Haze (Barrie, 1986). Later studies began
4345

ACPD7, 4285–4403, 2007
Halogens and polarboundary-layerozone depletion
W. R. Simpson et al.
Title Page
Abstract Introduction
Conclusions References
Tables Figures
J I
J I
Back Close
Full Screen / Esc
Printer-friendly Version
Interactive Discussion
EGU
to shift their view more towards influences of the frozen Arctic Ocean. The finding thatODEs also occur in the much more pristine Antarctic soon showed that they could hap-pen without anthropogenic pollution. However, laboratory studies (Fickert et al., 1999)and chemical models (Sander et al., 2006) indicate that an acidification of the snowor ice accelerates the activation of halogens (see Sects. 1.3, 2.1, and 3.1.2), possibly5
providing a role for acid pollution in ODE intensity. In the Arctic, natural processes likeforest fires and pollution outflow from the industrialized parts of the Northern Hemi-sphere provide humic material, acidic aerosols, precursors of inorganic acidity (e.g.SO2, and NOx). Sulfate aerosols, for example, might play a role in the halogen liber-ation process by acting as surfaces for heterogeneous recycling and acid accelerated10
chemistry. Humic material in snow/ice is a likely source of many VOCs and NMHCsand therefore plays a role in the chemistry on the snow/ice surface and the boundarylayer and therefore influences the development of ODEs. The production and world-wide use of CFCs lead to a drastic decrease in stratospheric ozone in polar regions.Connected with that is an enhanced UV radiation flux at the surface. This potentially15
impacts on the photochemistry involved in ODEs; however, this has not been investi-gated yet.
Another important influence is the effect of climate change and global warming onODEs. Polar regions, especially the Northern Arctic, are more affected by climatechange and have experienced a greater increase in temperatures than lower latitudes20
(Serreze and Francis, 2006, and references therein). Higher temperatures directlyaffect the chemical reaction cycles through their temperature-dependent rate coeffi-cients. Significant changes in sea ice extent and thickness due to climate change arealready being observed in the Northern Hemisphere (Johannessen et al., 1999; Over-peck et al., 2005; Serreze et al., 2003; Stroeve et al., 2005; Serreze and Francis, 2006;25
Holland et al., 2006, see also Fig. 21). This sea ice change is very likely to have animpact on ODEs; however, the sign is difficult to discern due to lack of mechanisticunderstanding of the role of sea ice on ODEs (see Sect. 3.1). Thinner winter ice mayincrease the probability for open leads and thus frost flower formation, which seems to
4346
ACPD7, 4285–4403, 2007
Halogens and polarboundary-layerozone depletion
W. R. Simpson et al.
Title Page
Abstract Introduction
Conclusions References
Tables Figures
J I
J I
Back Close
Full Screen / Esc
Printer-friendly Version
Interactive Discussion
EGU
be related to bromine explosions (Kaleschke et al., 2004). Also, thinner ice could en-hance the availability of sea salts on the surface through increased capillary action. Theextent of perennial sea ice, ice that has survived a summer melt season, has declined20% since the mid-1970s (Stroeve et al., 2005). In a warmer climate, an even largerfraction of ice would be first-year ice, which is likely to be involved in bromine activation5
(Wagner et al., 2001; Frieß et al., 2004; Simpson et al., 2007). These processes wouldimply an increase in the extent/frequency of ODEs. Warmer temperatures, however,may also decrease the probability of frost flower formation, which has been shown tobe a strong function of temperature (Martin et al., 1995, 1996). Increasing temper-atures could also interfere with the temperature-dependent precipitation of salts (see10
Sect. 3.1) affecting brine composition and possibly leading to reduced ODE probability.In order to assess the sign of the effect of polar warming on ODEs, we have to improveour mechanistic understanding of ODEs.
Sea-ice models recently showed that the Arctic Ocean may be ice-free during thesummer as early as 2040 (Holland et al., 2006, see also Fig. 21). However, note that15
sea ice during the ODE season (winter/spring) should still fill most of the Arctic basin.This change could substantially benefit shipping, perhaps opening the Arctic Oceanas a major trade route during summer/fall. Shipping could occur both along the NorthWest Passage and the Russian Northern Sea Route. Consequently, this increase inshipping in the Arctic Ocean could amplify the total burden of pollutants entering the20
Arctic environment from ports, ship operations, and accidents. If fossil fuel is still themain power source, then ships would deliver NOx, aerosols, black carbon, and NMHCto the high Arctic, possibly affecting ODEs through an increase of acidic aerosols andpollutants. However, the seasonality of the shipping is nearly opposite from that of theODEs, so mechanisms that store this pollution and re-deliver it during the ODE season,25
such as storage in snow and ice, are necessary to have strong effects of this pollutionon ODEs. Pollution of the Arctic through increased transportation, would have manyadditional effects, though, on biological systems, snowpack photochemistry (Grannaset al., 2007), and ice-albedo climate feedbacks. A similar effect could result from long
4347

ACPD7, 4285–4403, 2007
Halogens and polarboundary-layerozone depletion
W. R. Simpson et al.
Title Page
Abstract Introduction
Conclusions References
Tables Figures
J I
J I
Back Close
Full Screen / Esc
Printer-friendly Version
Interactive Discussion
EGU
range transport of pollution from the rapidly expanding economies in Asia and possiblyalso Russia. Iziomon et al. (2006) showed that summertime pollution events in theArctic are dominated by outflow from Russia (40%) while South Asia, Europe and NorthAmerica each contribute 6% to the observed aerosol loading.
5.2 Global relevance of ODEs5
Locally, ODEs have a dramatic impact on tropospheric chemistry. How large their im-pact is on a global scale, remains to be determined. One possible impact is long rangetransport of BrO to lower latitudes and a contribution to the BrO background levels inthe free troposphere (see Sect. 4.4). Transport to the free troposphere has been ob-served in some cases (McElroy et al., 1999) but needs to be quantified. If export of10
BrO does contribute to tropospheric BrO, changes in polar regions could have moreglobal consequences. Also the transport of O3 depleted air to lower latitudes is pos-sible and would impact the local radiative balance there (see Sect. 4.3) as well as thechemistry, but has not yet been studied. Mercury deposition due to ODE-related halo-gen chemistry is of great concern for its ability to contaminate the Arctic ecosystems15
(see Sect. 4.1 and the Mercury review, in this issue). Any possible changes in ODEfrequency and strength resulting from climate change could therefore have a strongimpact on the bioaccumulation of mercury in the environment. So far, a quantitativeassessment of these points cannot be done, as we still lack important information re-garding the factors controlling ODEs, as outlined in the following section.20
5.3 Open questions
While a lot of progress in our understanding has been made since the first discoveryof ODEs, many open questions remain. The autocatalytic reaction cycle for bromineexplosions consists of an initiation step, propagation, and termination reactions (seeSect. 1.3). We currently believe that brine-derived salts on ice surfaces (frost flowers,25
aerosols, or snow) are key in controlling propagation, while meteorology is important in
4348
ACPD7, 4285–4403, 2007
Halogens and polarboundary-layerozone depletion
W. R. Simpson et al.
Title Page
Abstract Introduction
Conclusions References
Tables Figures
J I
J I
Back Close
Full Screen / Esc
Printer-friendly Version
Interactive Discussion
EGU
providing a somewhat “closed reaction chamber” through temperature inversions andaffecting dispersion and termination of ODEs. However, the initiation step is less wellunderstood. Some possible initiation reactions that can start the bromine explosion aresummarized by Sander et al. (2003a). One example is the photolysis of organohalogenspecies (see Sect. 3.3.2), which is effective even at low concentrations. When consid-5
ering propagation, an important question we have to ask is: Under what conditionsis the bromine explosion cycle really “exploding”, i.e. when is the production of newBrOx fast enough to compensate for termination reactions? This question is difficult toanswer and the maintenance of the autocatalytic bromine release cycle will depend onthe availability of bromide, acidity, temperature, and other factors.10
Another open question is that of the role of ice and snow surfaces in halogen acti-vation (see Sect. 3.1). Salts, originally derived from sea water underlying the ice, areclearly the source of the majority of the atmospheric bromine loading, although manyimportant aspects of the mechanism by which this transport and chemical transforma-tion occurs are still lacking. Specifically, how these salts are transported from the water15
to the atmosphere is still being discussed. The site of halogen activation (on frost flow-ers, aerosol particles, or in snow pack) is still an area of active research. Acidity, a keyprerequisite of ODE chemistry is also an issue. Both H+ and HOx are consumed duringbromine explosion reactions, so there must be sources to maintain halogen activationand ozone depletion conditions. An important question in this respect is: What is the20
effective pH of surfaces of snow, ice and frost flowers, and how is it affected by thetemperature dependent precipitation of alkaline salts like CaCO3 (see Sect. 3.1.2)?
The roles of chlorine and iodine in ODEs still pose many open questions. For exam-ple, how can the release of chlorine be explained quantitatively and how important ischlorine (photo)chemistry (e.g. affecting the fate of hydrocarbons during ODEs)? Most25
of the earlier studies have focused on bromine chemistry, but chlorine and iodine couldalso contribute and in some situations even be the dominant halogens. In the Antarc-tic, high concentrations of IO were observed (see Sect. 2.3). In the Arctic, however,a link between iodine and bromine has so far not been observed. This leads to the
4349

ACPD7, 4285–4403, 2007
Halogens and polarboundary-layerozone depletion
W. R. Simpson et al.
Title Page
Abstract Introduction
Conclusions References
Tables Figures
J I
J I
Back Close
Full Screen / Esc
Printer-friendly Version
Interactive Discussion
EGU
question of the iodine sources and release mechanisms and if this link has so far beenoverlooked or if indeed important differences between the Arctic and Antarctic in termsof halogen interactions exist.
Due to its large ecological impacts, the fate of mercury in the polar environment isimportant. However, the speciation of mercury at the snow-air interface is not well un-5
derstood. The chemical speciation of mercury may affect (photo)reduction processesand its bioavailability.
5.4 Future needs and plans
Future research to address the open questions listed above have several components.One important aspect is the need to perform in-situ measurements during ODEs to10
improve understanding of chemical mechanisms and constrain model simulations. Asdiscussed in Sect. 2, only a small fraction of the halogen compounds thought to beinvolved in the chain reactions has been detected in field measurements to date. Di-rect measurements of halogen activation at locations on the ice, particularly near leadsand frost flowers, are needed to determine the origin of reactive halogens. Better15
understanding of these sources is critical for meaningful prediction of how halogen ac-tivation may be enhanced or reduced by changes in sea ice and temperature in thepolar regions. Continued exploitation of satellite remote sensing data combined withcoordinated field campaigns using multiple platforms and long-duration measurementcan provide key big-picture constraints on the role of sea ice on bromine activation.20
Tethered balloons could increasingly be used to get more information on the verticaldistribution of chemicals. Airships could provide vertical information in addition to beingable to conduct Lagrangian experiments, where the life cycle of an ODE within the air-mass might be studied. Both techniques of course are very challenging to be employedin polar regions.25
Satellite remote sensing data provides direct observations of halogen activation (e.g.measurements of BrO). These measurements continue to improve in data quality, spa-tial and temporal resolution, and availability of ancillary data sets. Clever combinations
4350
ACPD7, 4285–4403, 2007
Halogens and polarboundary-layerozone depletion
W. R. Simpson et al.
Title Page
Abstract Introduction
Conclusions References
Tables Figures
J I
J I
Back Close
Full Screen / Esc
Printer-friendly Version
Interactive Discussion
EGU
of multiple remote sensing data sets have begun to probe relationships between BrOand controlling influences (e.g. sea ice, temperature, open leads/polynyas), howevermore work is needed to identify frost flowers, new sea ice, and open water areas. Fu-ture work is likely to improve understanding of halogen activation events and predictionof events. Also, satellite-observed measurements should assist in making maps of the5
effects of ODEs (e.g. ozone depletion and/or mercury deposition).Model studies are currently limited by both a lack of measurement data for evaluation
and missing data on reaction kinetics, in particular the temperature dependence ofsome key reactions. Important areas of possible improvements in current models arethe representation of aerosols which still is oversimplified in some models and the10
representation of the very shallow polar boundary layer. The eventual aim for modelsshould be to reproduce individual ODEs including knowledge of sea ice forms (e.g. frostflowers, snow), boundary layer inversions without constraining gas phase halogens orthe need for external start and end of the ODE.
Laboratory studies are needed to understand chemistry above frost flowers and other15
ice surfaces as well as the microstructural distribution of impurities on ice surfaces.Many of the rate constants used in modeling of the halogen chemistry need bettermeasurements and better definition of their temperature dependence. Also, methodsneed to be developed to determine in-situ properties of ice surfaces, such as the effec-tive pH of ice surfaces.20
It is also vital to understand the transport and fate of atmospheric mercury. Fieldcampaigns as well as laboratory and theoretical calculations must continue to eluci-date the halogen-mercury interaction and its potential global impact on the transfor-mation of GEM to oxidized mercury with subsequent deposition and ultimate potentialbioaccumulation of mercury in the environment.25
The importance of targeted field campaigns both in the Artic and Antarctic cannotbe overemphasised for the study of ODEs. The International Polar Year (IPY 2007/08)will be an exceptional occasion to bring together expertise and logistical resourcesto perform large simultaneous field campaigns that can provide answers to the most
4351

ACPD7, 4285–4403, 2007
Halogens and polarboundary-layerozone depletion
W. R. Simpson et al.
Title Page
Abstract Introduction
Conclusions References
Tables Figures
J I
J I
Back Close
Full Screen / Esc
Printer-friendly Version
Interactive Discussion
EGU
critical questions.
6 Summary
After the initial discovery of the phenomenon in the Arctic in the late 1980s, the re-search on polar boundary-layer ozone depletions has made major progress. The keyreactions have been identified, with the self reaction of BrO as rate determining step.5
Later, the importance of heterogeneous reactions was recognized, which explainedthe bromine explosion and the efficient recycling of BrOx in the troposphere. Satellitesallowed the first world wide coverage of halogen oxide measurements and confirmedthat BrO clouds existed not only in the Arctic but also in the Antarctic. Though mostof the research reviewed in this paper concentrates on bromine, chlorine and iodine10
chemistry is strongly coupled with bromine chemistry. Interhalogen reactions play animportant role in halogen activation. However, the precise source of halogens remainsan open question and further research is needed to close this gap. Suggestions haveincluded sea salt deposits on snow, young sea-ice surfaces, sea salt aerosol, con-centrated brines on new sea-ice, and frost flowers. Despite large research efforts, the15
question remains and is one of the most debated ones in the community today. ThoughODEs are spatially restricted, they can influence the chemistry in the polar tropospheresignificantly. The main consequence of halogen activation is chemical destruction ofozone, which leads to a shift in oxidants and oxidation products. No measurements ofOH during ODE conditions have yet been reported (but see discussion of HOx chem-20
istry and influence of snow photochemistry in the accompanying paper, Grannas et al.,2007) so it is not established yet whether or not other OH production pathways canmaintain OH conditions at levels comparable to non-ODE conditions. What is estab-lished is that very strong oxidation processes do occur, one of the most dramatic ex-amples is the oxidation of mercury leading to its almost complete removal from the gas25
phase and deposition with impacts on the ecosystems. Also, the oxidation of VOC isdominated by chlorine chemistry under ODE conditions, which may cause feedbacks
4352

ACPD7, 4285–4403, 2007
Halogens and polarboundary-layerozone depletion
W. R. Simpson et al.
Title Page
Abstract Introduction
Conclusions References
Tables Figures
J I
J I
Back Close
Full Screen / Esc
Printer-friendly Version
Interactive Discussion
EGU
through the production of HOx. In coastal regions, the oxidation of DMS by BrO and Clis dramatically increased but also the products are changed compared to “background”chemistry. The production of aldehydes and major effects on the sulfur cycle affectthe interpretation of ice cores. A major question for the future will be: How do cli-mate changes and anthropogenic influences affect ODEs? Specifically, models predict5
scenarios of a seasonally ice-free Arctic Ocean, possible increases in pollution due toshipping, and a very different winter ice pack. How will higher temperatures affect theformation of young sea-ice and the occurrence of ODEs? We need to develop models,laboratory methods, and measurement techniques that will help us to answer thesequestions and to understand the role of halogens in tropospheric ozone depletion in10
the polar regions.Acknowledgements. Each of the three first authors on this work contributed equally to this re-view article, and the subsequent alphabetic list of co-authors includes contributors of majormaterial and review of the manuscript. We thank the International Global Atmospheric Chem-istry (IGAC) project and the Atmosphere-Ice Chemical Interactions (AICI) task for organizing15
the workshop that led to this review article. We acknowledge the financial support of fundingagencies (e.g. NSF in the U.S. and EU sources) and our research institutions. We would like tothank the following people for helpful discussions, for making unpublished material available tous and/or for very helpful comments on this and/or earlier drafts of this review: J. McConnell,J. Dibb, G. Carver, M. Piot, J. Savarino, and S. Morin.20
References
Abbatt, J. P. D.: Heterogeneous reaction of HOBr with HBr and HCl on ice surfaces at 228 K,Geophys. Res. Lett., 21, 665–668, 1994. 4299
Abbatt, J. P. D.: Interactions of Atmospheric Trace Gases with Ice Surfaces, Chem. Rev., 103,4783–4800, 2003. 430625
Abbatt, J. P. D. and Nowak, J. B.: Heterogeneous interactions of HBr and HOCl with cold sulfuricacid solutions: Implications for Arctic boundary layer bromine chemistry, J. Phys. Chem. A,101, 2131–2137, 1997. 4299
Adams, J. W., Holmes, N. S., and Crowley, J. N.: Uptake and Reaction of HOBr on Frozen and
4353

ACPD7, 4285–4403, 2007
Halogens and polarboundary-layerozone depletion
W. R. Simpson et al.
Title Page
Abstract Introduction
Conclusions References
Tables Figures
J I
J I
Back Close
Full Screen / Esc
Printer-friendly Version
Interactive Discussion
EGU
dry Salt Surfaces, Atmos. Chem. Phys., 2, 79–91, 2002,http://www.atmos-chem-phys.net/2/79/2002/. 4299, 4300, 4305, 4314
Alam, A. and Curry, J.: Lead-Induced Atmospheric Circulations, J. Geophys. Res., 100, 4643–4651, 1995. 4326
Anlauf, K. G., Mickle, R. E., and Trivett, N. B. A.: Measurement of ozone during Polar Sunrise5
Experiment 1992, J. Geophys. Res., 99, 25 345–25 353, 1994. 4292Aranda, A., Le Bras, G., La Verdet, G., and Poulet, G.: The BrO + CH3O2 reaction: Kinetics
and role in the atmospheric ozone budget, Geophys. Res. Lett., 24, 2745–2748, 1997. 4298Ariya, P., Dastoor, A. P., Amyot, M., Schroeder, W. H., Barrie, L., Anlauf, K., Raofie, F., Ryzhkov,
A., Davignon, D., Lalonde, J., and Steffen, A.: The Arctic: a sink for mercury, Tellus, 56B,10
397–403, 2004. 4335, 4336Ariya, P. A., Jobson, B. T., Sander, R., Niki, H., Harris, G. W., Hopper, J. F., and Anlauf, K. G.:
Measurements of C2-C7 hydrocarbons during the Polar Sunrise Experiment 1994: Furtherevidence for halogen chemistry in the troposphere, J. Geophys. Res., 103, 13 169–13 180,1998. 4311, 431515
Ariya, P. A., Khalizov, A., and Gidas, A.: Reactions of Gaseous Mercury with Atomic and Molec-ular Halogens: Kinetics, Product Studies, and Atmospheric Implications, J. Phys. Chem. A,106, 7310–7320, 2002. 4335, 4336
Ashworth, S. H., Allan, B. J., and Plane, J. M. C.: High resolution spectroscopy of the OIOradical: implications for the ozone-depletion potential of iodine in the marine boundary layer,20
Geophys. Res. Lett., 29, 1456, doi:10.1029/2001GL013851, 2002. 4302Aspmo, K., Gauchard, P.-A., Steffen, A., Temme, C., Berg, T., Bahlmann, E., Banic, C., Dom-
mergue, A., Ebinghaus, R., Ferrari, C., Pirrone, N., Sproviere, F., and Wibetoe, G.: Measure-ments of atmospheric mercury species during an international study of mercury depletionevents at Ny-Alesund, Svalbard, spring 2003. How reproducible are our present methods?,25
Atmos. Environ., 39, 7607–7619, 2005. 4336Atkinson, R., Baulch, D. L., Cox, R. A., Crowley, J. N., Hampson, R. F., Hynes, R. G., Jenkin,
M. E., Rossi, M. J., and Troe, J.: Evaluated kinetic and photochemical data for atmosphericchemistry: Volume II – reactions of organic species, Atmos. Chem. Phys., 6, 3625–4055,2006, http://www.atmos-chem-phys.net/6/3625/2006/. 4297, 438730
Atlas, E. L., Ridley, B. A., and Cantrell, C. A.: The Tropospheric Ozone Production aboutthe Spring Equinox (TOPSE) Experiment: Introduction, J. Geophys. Res., 108, 8353,doi:10.1029/2002JD003172, 2003. 4380
4354

ACPD7, 4285–4403, 2007
Halogens and polarboundary-layerozone depletion
W. R. Simpson et al.
Title Page
Abstract Introduction
Conclusions References
Tables Figures
J I
J I
Back Close
Full Screen / Esc
Printer-friendly Version
Interactive Discussion
EGU
Avallone, L. M., Toohey, D. W., Fortin, T. J., McKinney, K. A., and Fuentes, J. D.: In situ measure-ments of bromine oxide at two high-latitude boundary layer sites: Implications of variability,J. Geophys. Res., 108, 4089, doi:10.1029/2002JD002843, 2003. 4303, 4307, 4308, 4323
Ayers, G. P., Granek, H., and Boers, R.: Ozone in the Marine Boundary Layer at Cape Grim:Model Simulation, J. Atmos. Chem., 27, 179–195, 1997. 43415
Banic, C., Beauchamp, S. T., Tordon, R. J., Schroeder, W. H., Steffen, A., and Anlauf, K. A.:Vertical distribution of gaseous elemental mercury in Canada, J. Geoph. Res., 108, 4264–4278, 2002. 4336
Bargagli, R., Agnorelli, C., Borghini, F., and Monaci, F.: Enhanced deposition and bioaccumu-lation of mercury in Antarctic terrestrial ecosystems facing a coastal polynya, Environ. Sci.10
Technol., 39, 8150–8155, 2005. 4336Barnes, I., Becker, K. H., and Starcke, J.: Fourier-transform IR spectroscopic observation of
gaseous nitrosyl iodine, nitryl iodine, and iodine nitrate, J. Phys. Chem., 95, 9736–9740,1991. 4342
Barrie, L. and Platt, U.: Arctic tropospheric chemistry: an overview, Tellus, 49B, 450–454, 1997.15
4380Barrie, L. A.: Arctic air pollution: an overview of current knowledge, Atmos. Environ., 20, 643–
663, 1986. 4288, 4345Barrie, L. A., Bottenheim, J. W., Schnell, R. C., Crutzen, P. J., and Rasmussen, R. A.: Ozone
destruction and photochemical reactions at polar sunrise in the lower Arctic atmosphere,20
Nature, 334, 138–141, 1988. 4289, 4293, 4294, 4295, 4297, 4301, 4307, 4322, 4331, 4384Barrie, L. A., den Hartog, G., Bottenheim, J. W., and Landsberger, S.: Anthropogenic aerosols
and gases in the lower troposphere at Alert, Canada in April 1986, J. Atmos. Chem., 9,101–127, 1989. 4288, 4289
Barrie, L. A., Bottenheim, J. W., and Hart, W. R.: Polar Sunrise Experiment 1992 (PSE 1992):25
Preface, J. Geophys. Res., 99, 25 313–25 314, 1994. 4294, 4380Bates, T. S., Calhoun, J. A., and Quinn, P. K.: Variations in the methanesulfonate to sulfate
molar ratio in submicrometer marine aerosol particles over the Southern Pacific Ocean, J.Geophys. Res., 97, 9859–9865, 1992. 4345
Beine, H. J., Domine, F., Ianniello, A., Nardino, M., Allegrini, I., Teinila, K., and Hillamo, R.:30
Fluxes of nitrates between snow surfaces and the atmosphere in the European high Arctic,Atmos. Chem. Phys., 3, 335–346, 2003, http://www.atmos-chem-phys.net/3/335/2003/. 4380
Berg, W. W., Sperry, P. D., Rahn, A., and Gladney, E. S.: Atmospheric Bromine in the Arctic, J.
4355

ACPD7, 4285–4403, 2007
Halogens and polarboundary-layerozone depletion
W. R. Simpson et al.
Title Page
Abstract Introduction
Conclusions References
Tables Figures
J I
J I
Back Close
Full Screen / Esc
Printer-friendly Version
Interactive Discussion
EGU
Geophys. Res., 88, 6719–6736, 1983. 4293, 4322, 4328Berntsen, T. K. and Isaksen, I. S. A.: A global three-dimensional chemical transport model
for the troposphere.1. Model description and CO and ozone results, J. Geophys. Res., 102,21 239–21 280, 1997. 4382
Bottenheim, J. W. and Chan, E.: A trajectory study into the origin of spring time Arctic boundary5
layer ozone depletion, J. Geophys. Res., 111, D19 301, doi:10.1029/2006JD007055, 2006.4324, 4383
Bottenheim, J. W., Gallant, A. J., and Brice, K. A.: Measurements of NOy species and O3 at82◦N latitude, Geophys. Res. Lett., 13, 113–116, 1986. 4289, 4293, 4327, 4328
Bottenheim, J. W., Dibb, J. E., Honrath, R. E., and Shepson, P. B.: An introduction to the10
ALERT 2000 and SUMMIT 2000 Arctic research studies, Atmos. Environ., 36, 2467–2469,2002. 4292, 4295, 4323, 4380
Bottenheim, W., Barrie, L. A., Atlas, E., Heidt, L. E., Niki, H., Rasmussen, R. A., and Shep-son, P. B.: Depletion of lower tropospheric ozone during Arctic spring: The polar sunriseexperiment 1988, J. Geophys. Res., 95, 18 555–18 568, 1990. 4294, 4333, 438015
Boucher, O., Moulin, C., Belviso, S., Aumont, O., Bopp, L., Cosme, E., von Kuhlmann, R.,Lawrence, M. G., Pham, M., Redyy, M. S., Sciare, J., and Venkataraman, C.: Sensitivitystudy of dimethylsulfide (DMS) atmospheric concentrations and sulphate aerosol indirectradiative forcing to the DMS source representation and oxidation, Atmos. Chem. Phys., 3,49–65, 2003, http://www.atmos-chem-phys.net/3/49/2003/. 434320
Boudries, H. and Bottenheim, J. W.: Cl and Br Atom Concentrations During a Surface BoundaryLayer Ozone Depletion Event in the Canadian High Arctic, Geophys. Res. Lett., 27, 517–520,2000. 4311, 4315, 4337
Boudries, H., Canagaratna, M. R., Jayne, J. T., Alfarra, M. R., Allan, J., Bower, K. N., Coe, H.,Pryor, S. C., Jimenez, J. L., Brook, J. R., Li, S., and Worsnop, D. R.: Chemical and physical25
processes controlling the distribution of aerosols in the Lower Fraser Valley, Canada, duringthe Pacific 2001 field campaign, Atmos. Environ., 38, 5759–5774, 2004. 4330, 4331
Brasseur, G. P., Cox, R. A., Hauglustaine, D., Isaksen, I., Lelieveld, J., Lister, D. H., Sausen,R., Schumann, U., Wahner, A., and Wiesen, P.: European Scientific Assessment of theAtmospheric Effects of Aircraft Emissions, Atmos. Environ., 32, 2329–2418, 1998. 438230
Burrows, J. P., Weber, M., Buchwitz, M., Rozanov, V., Ladstatter-Weißenmayer, A., Richter, A.,DeBeek, R., Hoogen, R., Bramstedt, K., Eichmann, K.-U., Eisinger, M., and Perner, D.: TheGlobal Ozone Monitoring Experiment (GOME): Mission Concept and First Scientific Results,
4356
ACPD7, 4285–4403, 2007
Halogens and polarboundary-layerozone depletion
W. R. Simpson et al.
Title Page
Abstract Introduction
Conclusions References
Tables Figures
J I
J I
Back Close
Full Screen / Esc
Printer-friendly Version
Interactive Discussion
EGU
J. Atmos. Sci., 56, 151–175, 1999. 4308, 4381Calvert, J. G. and Lindberg, S. E.: A modeling study of the mechanism of the halogen-ozone-
mercury homogeneous reactions in the troposphere during the polar spring, Atmos. Environ.,37, 4467–4481, 2003. 4335
Calvert, J. G. and Lindberg, S. E.: Potential influence of iodine-containing compounds on the5
chemistry of the troposphere in the polar spring. I. Ozone depletion, Atmos. Environ., 39,5087–5104, doi:10.1016/j.atmosenv.2004.05.049, 2004a. 4313, 4333, 4334
Calvert, J. G. and Lindberg, S. E.: Potential influence of iodine-containing compounds on thechemistry of the troposphere in the polar spring. II. Mercury depletion, Atmos. Environ., 38,5105–5116, doi:10.1016/j.atmosenv.2004.05.050, 2004b. 4313, 4333, 433410
Carpenter, L. J., Hopkins, J. R., Jones, C. E., Lewis, A. C., Parthipan, R., Wevill, D. J., Poissant,L., Pilote, M., and Constant, P.: Abiotic Source of Reactive Organic Halogens in the Sub-Arctic Atmosphere?, Environ. Sci. Technol., 39, 8812–8816, doi:10.1021/es050918w, 2005a.4333, 4334, 4340, 4399
Carpenter, L. J., Wevill, D. J., O’Doherty, S., Spain, G., and Simmonds, P. G.: Atmospheric15
bromoform at Mace Head, Ireland: Evidence for a peatland source, Atmos. Chem. Phys., 5,2927–2934, 2005b. 4294
Chance, K.: Analysis of BrO Measurements from the Global Ozone Monitoring Experiment,Geophys. Res. Lett., 25, 3335–3338, 1998. 4308, 4309, 4381
Charlson, R. J., Lovelock, J. E., Andreae, M. O., and Warren, S. G.: Oceanic phytoplankton,20
atmospheric sulphur, cloud albedo and climate, Nature, 326, 655–661, 1987. 4342Cleveland, W. S. and Devlin, S. J.: Regression by local fitting: Methods, prospectives and
computational algorithms, J. Am. Stat. Assoc., 83, 596–610, 1988. 4383Couch, T. L., Sumner, A. L., Dassau, T. M., and Shepson, P.: An Investigation of the interaction
of carbonyl compounds with the snowpack, Geophys. Res. Lett., 27, 2241–2244, 2000. 433325
Dassau, T. M., Shepson, P. B., Bottenheim, J. W., and Ford, K. M.: Peroxyacetyl nitratephotochemistry and interactions with the Arctic surface, J. Geophys. Res., 109, D18 302,doi:10.1029/2004JD004562, 2004. 4339
Davidson, C. and Schnell, R.: Arctic air, snow and ice chemistry, Atmos. Environ., 27 A, 2695–3041, 1993. 438030
Davison, B., Hewitt, C., O’Dowd, C., Lowe, J., Smith, M., Schwikowski, M., Baltensperger,U., and Harrison, R.: Dimethyl sulfide, methane sulfonic acid and physicochemical aerosolproperties in Atlantic air from the United Kingdom to Halley Bay, J. Geophys. Res., 101,
4357

ACPD7, 4285–4403, 2007
Halogens and polarboundary-layerozone depletion
W. R. Simpson et al.
Title Page
Abstract Introduction
Conclusions References
Tables Figures
J I
J I
Back Close
Full Screen / Esc
Printer-friendly Version
Interactive Discussion
EGU
22 855–22 867, 1996. 4314, 4344de Serves, C.: Gas phase formaldehyde and peroxide measurements in the Arctic atmosphere,
J. Geophys. Res., 99, 25 391–25 398, 1994. 4295Domine, F. and Shepson, P. B.: Air-Snow Interactions and Atmospheric Chemistry, Science,
297, 1506–1510, 2002. 4330, 43315
Domine, F., Sparapani, R., Ianniello, A., and Beine, H. J.: The origin of sea salt in snow onArctic sea ice and in coastal regions, Atmos. Chem. Phys., 4, 2259–2271, 2004,http://www.atmos-chem-phys.net/4/2259/2004/. 4319, 4396
Domine, F., Taillandier, A. S., Simpson, W. R., and Severin, K.: Specific surfacearea, density and microstructure of frost flowers, Geophys. Res. Lett., 32, L13 502,10
doi:10.1029/2005GL023245, 2005. 4321Douglas, T. A., Sturm, M., Simpson, W. R., Brooks, S., Lindberg, S., and Perovich, D.: Elevated
mercury measured in snow and frost flowers near Arctic sea ice leads, Geophys. Res. Lett.,32, L04 502, doi:10.1029/2004GL022132, 2005. 4336
Ebinghaus, R., Kock, H. H., Temme, C., Einax, J. W., Lowe, A. G., Richter, A., Burrows, J. P.,15
and Schroeder, W. H.: Antarctic Springtime Depletion of Atmospheric Mercury, Environ. Sci.Technol., 36, 1238–1244, 2002. 4309
Ebinghaus, R., Temme, C., Lindberg, S. E., and Scott, K. J.: Springtime accumulation of atmo-spheric mercury in polar ecosystems, J. Phys. IV, 121, 195–208, 2004. 4335
Eisinger, M., Burrows, J. P., Richter, A., and Ladstatter-Weißenmayer, A.: SO2, OClO, BrO, and20
other minor trace gases from the Global Ozone Monitoring Experiment (GOME), in: Proc.3rd ERS symposium, Space at the service of our environment, Florence, Italy, 17–21 March1997, 1997. 4308
EPICA community members: Eight glacial cycles from an Antarctic ice core, Nature, 429, 623–628, 2004. 428825
Etheridge, D. M., Steele, L. P., Langenfelds, R. L., Francey, R. J., Barnola, J. M., and Morgan,V. I.: Natural and anthropogenic changes in atmospheric CO2 over the last 1000 years fromair in Antarctic ice and firn, J. Geophys. Res., 101, 4115–4128, 1996. 4344
Evans, M. J., Jacob, D. J., Atlas, E., Cantrell, C. A., Eisele, F., Flocke, F., Fried, A., Mauldin,R. L., Ridley, B. A., Wert, B., Walega, J., Weinheimer, A., Blake, D., Heikes, B., Snow,30
J., Talbot, R., and Dibb, J.: Coupled evolution of BrOx−ClOx−HOx−NOx chemistry duringbromine-catalyzed ozone depletion events in the Arctic boundary layer, J. Geophys. Res.,108, 8368, doi: 10.1029/2002JD002732, 2003. 4304, 4322
4358

ACPD7, 4285–4403, 2007
Halogens and polarboundary-layerozone depletion
W. R. Simpson et al.
Title Page
Abstract Introduction
Conclusions References
Tables Figures
J I
J I
Back Close
Full Screen / Esc
Printer-friendly Version
Interactive Discussion
EGU
Fan, S.-M. and Jacob, D. J.: Surface ozone depletion in Arctic spring sustained by brominereactions on aerosols, Nature, 359, 522–524, 1992. 4289, 4298, 4304, 4322, 4328
Farman, J. C., Gardiner, B. G., and Shanklin, J. D.: Large losses of total ozone in Antarcticareveal seasonal ClOx/NOx interaction, Nature, 315, 207–210, 1985. 4288
Fickert, S., Adams, J. W., and Crowley, J. N.: Activation of Br2 and BrCl via uptake of HOBr5
onto aqueous salt solutions, J. Geophys. Res., 104, 23 719–23 727, 1999. 4299, 4300, 4314,4319, 4346
Finlayson-Pitts, B. J.: The tropospheric chemistry of sea salt: A molecular-level view of thechemistry of NaCl and NaBr, Chem. Rev., 103, 4801–4822, 2003. 4320
Finlayson-Pitts, B. J. and Pitts Jr., J. N.: Chemistry of the Upper and Lower Atmosphere, Aca-10
demic Press, San Diego, 2000. 4305Finlayson-Pitts, B. J., Livingston, F. E., and Berko, H. N.: Ozone destruction and bromine
photochemistry at ground level in the Arctic spring, Nature, 343, 622–625, 1990. 4301Foster, K. L., Plastridge, R. A., Bottenheim, J. W., Shepson, P. B., Finlayson-Pitts, B. J., and
Spicer, C. W.: The Role of Br2 and BrCl in Surface Ozone Destruction at Polar Sunrise,15
Science, 291, 471–474, 2001. 4295, 4300, 4303, 4308, 4312, 4315, 4323, 4334Frieß, U., Wagner, T., Pundt, I., Pfeilsticker, K., and Platt, U.: Spectroscopic Measurements of
Tropospheric Iodine Oxide at Neumayer Station, Antarctica, Geophys. Res. Lett., 28, 1941–1944, 2001. 4303, 4314, 4393
Frieß, U., Hollwedel, J., Konig-Langlo, G., Wagner, T., and Platt, U.: Dynamics and chemistry20
of tropospheric bromine explosion events in the Antarctic coastal region, J. Geophys. Res.,109, D06 305, doi:10.1029/2003JD004133, 2004. 4290, 4292, 4295, 4307, 4317, 4326,4327, 4342, 4347, 4381, 4389
Fuhrer, K., Hutterli, M., and McConnell, J.: Overview of recent field experiments for the study ofthe air-snow transfer of H2O2 and HCHO, in: Chemical Exchange Between the Atmosphere25
and Polar Snow, edited by: Wolff, E. W. and Bales, R. C., vol. 43, pp. 307–318, Springer-Verlag, 1996. 4295, 4338
Gauss, M., Isaksen, I. S. A., Wong, S., and Wang, W. C.: Impact of H2O emissionsfrom cryoplanes and kerosene aircraft on the atmosphere, J. Geophys. Res., 108, 4304,doi:10.1029/2002JD002623, 2003. 438230
Gersonde, R., Crosta, X., Abelmann, A., and Armand, L.: Sea-surface temperature and seaice distribution of the Southern Ocean at the EPILOG Last Glacial Maximum – a circum-Antarctic view based on siliceous microfossil records, Quat. Sci. Rev., 24, 869–896, 2005.
4359

ACPD7, 4285–4403, 2007
Halogens and polarboundary-layerozone depletion
W. R. Simpson et al.
Title Page
Abstract Introduction
Conclusions References
Tables Figures
J I
J I
Back Close
Full Screen / Esc
Printer-friendly Version
Interactive Discussion
EGU
4344Ghosal, S., Shbeeb, A., and Hemminger, J. C.: Surface Segregation of Bromine doped NaCl:
Implications for the Seasonal Variations in Arctic Ozone, Geophys. Res. Lett., 27, 1879–1882, 2000. 4320
Ghosal, S., Verdaguer, A., Hemminger, J. C., and Salmeron, M.: In Situ Study of Water-Induced5
Segregation of Bromide in Bromide-Doped Sodium Chloride by Scanning Polarization ForceMicroscopy, J. Phys. Chem. A, 109, 4744–4749, 2005. 4320
Gong, S. L., Barrie, L. A., and Blanchet, J.-P.: Modeling sea-salt aerosols in the atmosphere:1. Model development, J. Geophys. Res., 102, 3805–3818, 1997. 4292
Goodsite, M. E., Plane, J. M. C., and Skov, H.: A Theoretical Study of the Oxidation of Hg0 to10
HgBr2 in the Troposphere, Environ. Sci. Technol., 38, 1772–1776, 2004. 4335, 4336Grannas, A. M., Shepson, P. B., Guimbaud, C. G., Sumner, A. L., Albert, M., Simpson, W.,
Domine, F., Boudries, H., Bottenheim, J., Beine, H. J., Honrath, R., and Zhou, X.: A study ofphotochemical processes affecting carbonyl compounds in the Arctic atmospheric boundarylayer, Atmos. Environ., 36, 2733–2742, 2002. 4338, 433915
Grannas, A. M., Jones, A. E., Dibb, J., Ammann, M., Anastasio, C., Ariya, P., Beine, H. J.,Bergin, M., Bottenheim, J., Boxe, C. S., Carver, G., Chen, G., Crawford, J. H., Domine,F., Frey, M. M., Guzman, M. I., Heard, D. E., Helmig, D., Hoffmann, M. R., Honrath,R. E., Huey, L. G., Hutterli, M., Jacobi, H., Klan, P., McConnell, J., Sander, R., Savarino,J., Shepson, P. B., Simpson, W. R., Sodeau, J. R., von Glasow, R., Weller, R., Wolff,20
E., and Zhu, T.: An overview of snow photochemistry: Evidence, mechanisms and im-pacts, Atmos. Chem. Phys. Discuss., 7, 4165–4283, 2007, http://www.atmos-chem-phys-discuss.net/7/4165/2007/. 4295, 4304, 4330, 4331, 4347, 4352
Guimbaud, C., Grannas, A. M., Shepson, P. B., Fuentes, J. D., Boudries, H., Bottenheim,J. W., Domine, F., Houdier, S., Perrier, S., Biesenthal, T. B., and Splawn, B. G.: Snowpack25
processing of acetaldehyde and acetone in the Arctic atmospheric boundary layer, Atmos.Environ., 36, 2743–2752, 2002. 4338, 4339
Hara, K., Osada, K., Kido, M., Hayashi, M., Matsunaga, K., Iwasaka, Y., Yamanouchi, T.,Hashida, G., and Fukatsu, T.: Chemistry of sea-salt particles and inorganic halogen speciesin Antarctic regions: Compositional differences between coastal and inland stations, J. Geo-30
phys. Res., 109, D20 208, doi:10.1029/2004JD004713, 2004. 4318Hausmann, M. and Platt, U.: Spectroscopic measurement of bromine oxide and ozone in the
high Arctic during Polar Sunrise Experiment 1992, J. Geophys. Res., 99, 25 399–25 413,
4360

ACPD7, 4285–4403, 2007
Halogens and polarboundary-layerozone depletion
W. R. Simpson et al.
Title Page
Abstract Introduction
Conclusions References
Tables Figures
J I
J I
Back Close
Full Screen / Esc
Printer-friendly Version
Interactive Discussion
EGU
1994. 4289, 4294, 4303, 4307, 4321, 4327, 4388Hebestreit, K., Stutz, J., Rosen, D., Matveiv, V., Peleg, M., Luria, M., and Platt, U.: DOAS
Measurements of Tropospheric Bromine Oxide in Mid-Latitudes, Science, 283, 55–57, 1999.4292, 4310
Hegels, E., Crutzen, P. J., Klupfel, T., Perner, D., and Burrows, J. P.: Global distribution of5
atmospheric bromine-monoxide from GOME on earth observing satellite ERS-2, Geophys.Res. Lett., 25, 3127–3130, 1998a. 4296, 4308
Hegels, E., Harder, H., Klupfel, T., Crutzen, P. J., and Perner, D.: On the global distributionof the halogen oxides from observations by GOME (Global Ozone Monitoring Experiment)on ERS-2, in: Proceedings of the fourth European symposium, 22–26 September 1997,10
Schliersee, Germany, Air Pollution Report 66, pp. 343–346, 1998b. 4308Holland, M. M., Bitz, C. M., and Tremblay, B.: Future abrupt reductions in the summer Arctic
sea ice, Geophys. Res. Lett., 33, L23 503, doi:10.1029/2006GL028 024, 2006. 4346, 4347,4403
Hollwedel, J., Wenig, M., Beirle, S., Kraus, S., Kuhl, S., Wilms-Grabe, W., Platt, U., and Wagner,15
T.: Year-to- Year Variability of Polar Tropospheric BrO as seen by GOME, Adv. Space Res.,34, 804–808, 2004. 4309, 4342, 4381
Hollwedel, J. C.: Observations of Tropospheric and Stratospheric Bromine Monoxide fromSatellite, Ph.D. thesis, University of Heidelberg, 2005. 4309, 4322, 4329, 4342
Honninger, G.: Halogen Oxide Studies in the Boundary Layer by Multi Axis Differential Optical20
Absorption Spectroscopy and Active Longpath-DOAS, Ph.D. thesis, University of Heidelberg,Germany, 2002. 4314
Honninger, G. and Platt, U.: Observations of BrO and its vertical distribution during surfaceozone depletion at Alert, Atmos. Environ., 36, 2481–2489, 2002. 4292, 4303, 4307, 4321,432825
Honninger, G., Bobrowski, N., Palenque, E. R., Torrez, R., and Platt, U.: Reactive bromineand sulfur emissions at Salar de Uyuni, Bolivia, Geophys. Res. Lett., 31, L04 101,doi:10.1029/2003GL018818, 2004a. 4310
Honninger, G., Leser, H., Sebastian, O., and Platt, U.: Ground-based measurements of halogenoxides at the Hudson Bay by longpath DOAS and passive MAX-DOAS, Geophys. Res. Lett.,30
31, L04 111, doi:10.1029/2003GL018982, 2004b. 4292, 4303, 4307, 4322Honninger, G., von Friedeburg, C., and Platt, U.: Multi axis differential optical absorption spec-
troscopy (MAX-DOAS), Atmos. Chem. Phys., 4, 231–254, 2004c. 4303
4361

ACPD7, 4285–4403, 2007
Halogens and polarboundary-layerozone depletion
W. R. Simpson et al.
Title Page
Abstract Introduction
Conclusions References
Tables Figures
J I
J I
Back Close
Full Screen / Esc
Printer-friendly Version
Interactive Discussion
EGU
Honrath, R. E., Peterson, M. C., Guo, S., Dibb, J. E., Shepson, P. B., and Campbell, B.: Evi-dence of NOx production within or upon ice particles in the Greenland snowpack, Geophys.Res. Lett., 26, 695–698, 1999. 4295, 4330
Honrath, R. E., Peterson, M. C., Dziobak, M. P., Dibb, J. E., Arsenault, M. A., and Green,S. A.: Release of NOx from Sunlight-irradiated Midlatitude Snow, Geophys. Res. Lett., 27,5
2237–2240, 2000. 4330Hopper, J. F., Peters, B., Yokouchi, Y., Niki, H., Jobson, B. T., Shepson, P. B., and Muthuramu,
K.: Chemical and meteorological observations at ice camp SWAN during Polar Sunrise Ex-periment 1992, J. Geophys. Res., 99, 25 489–25 498, 1994. 4290, 4291, 4292, 4295, 4317,432710
Hopper, J. F., Barrie, L. A., Silis, A., Hart, W., Gallant, A. J., and Dryfhout, H.: Ozone andmeteorology during the 1994 Polar Sunrise Experiment, J. Geophys. Res., 103, 1481–1492,1998. 4290, 4291, 4380
Hu, Y. Y., Tung, K. K., and Liu, J. P.: A closer comparison of early and late-winter atmospherictrends in the northern hemisphere, J. Climate, 18, 3204–3216, 2005. 434315
Huff, A. K. and Abbatt, J. P. D.: Gas-Phase Br2 Production in Heterogeneous Reactions of Cl2,HOCl, and BrCl with Halide-Ice Surfaces, J. Phys. Chem. A, 104, 7284–7293, 2000. 4299,4300, 4314
Huff, A. K. and Abbatt, J. P. D.: Kinetics and Product Yields in the Heterogeneous Reactionsof HOBr with Ice Surfaces Containing NaBr and NaCl, J. Phys. Chem. A, 106, 5279–5287,20
2002. 4299, 4300, 4314Huthwelker, T., Ammann, M., and Peter, T.: The Uptake of Acidic Gases on Ice, Chem. Rev.,
106, 1375–1444, doi:10.1021/cr020506v, 2006. 4306Hutterli, M., Rankin, A. M., Knox, K. J., Jones, A. E., and Wolff, E. W.: A laboratory study of
ozone depletion over frost flowers, in: EGU Conference, vol. 7, p. 06593, Geophys. Res.25
Abs., Vienna, 2006. 4305Hutterli, M. A., Bales, R. C., and Rothlisberger, R.: Atmosphere-to-snow-to-firn transfer studies
of HCHO at Summit, Greenland, Geophys. Res. Lett., 26, 1691–1694, 1999. 4295, 4338Hutterli, M. A., , McConnell, J. R., Chen, G., Bales, R. C., Davis, D. D., and Lenschow, D. H.:
Formaldehyde and hydrogen peroxide in air, snow and interstitial air at South Pole, Atmos.30
Environ., 38, 5439–5450, 2004. 4338Hylander, L. D. and Goodsite, M. E.: Environmental costs of mercury pollution, Sci. Total Envi-
ron., 368, 352–370 Sp. Iss. SI, 2006. 4335, 4336
4362

ACPD7, 4285–4403, 2007
Halogens and polarboundary-layerozone depletion
W. R. Simpson et al.
Title Page
Abstract Introduction
Conclusions References
Tables Figures
J I
J I
Back Close
Full Screen / Esc
Printer-friendly Version
Interactive Discussion
EGU
Ianniello, A., Beine, H. J., Sparapani, R., Di Bari, F., Allegrini, I., and Fuentes, J. D.: Denudermeasurements of gas and aerosol species above Arctic snow surfaces at Alert 2000, Atmos.Environ., 36, 5299–5309, 2002. 4322
Impey, G. A., Shepson, P. B., Hastie, D. R., and Barrie, L. A.: Measurement technique for thedetermination of photolyzable chlorine and bromine in the atmosphere, J. Geophys. Res.,5
102, 15 999–16 004, 1997a. 4307Impey, G. A., Shepson, P. B., Hastie, D. R., Barrie, L. A., and Anlauf, K. G.: Measurements of
photolyzable chlorine and bromine during the Polar Sunrise Experiment 1995, J. Geophys.Res., 102, 16 005–16 010, 1997b. 4295, 4307, 4308, 4312, 4315
Impey, G. A., Mihele, C. M., Anlauf, K. G., Barrie, L. A., Hastie, D. R., and Shepson, P. B.:10
Measurements of photolyzable halogen compounds and bromine radicals during the PolarSunrise Experiment 1997, J. Atmos. Chem., 34, 21–37, 1999. 4304, 4307, 4308
Ingham, T., Cameron, M., and Crowley, J. N.: Photodissociation of IO (355 nm) and OIO (532nm): Quantum Yields for O(3P)/I Production, J. Phys. Chem. A, 104, 8001–8010, 2000.430215
Iziomon, M. G., Lohmann, U., and Quinn, P. K.: Summertime pollution events in the Arctic andpotential implications, J. Geophys. Res., 111, D12 206, doi:10.1029/2005JD006223, 2006.4348
Jacobi, H. W. and Hilker, B.: A mechanism for the photochemical transformation of nitrate insnow, J. Photochem. Photobiol. A, 185, 371–382, 2007. 430520
Jacobi, H.-W., Kaleschke, L., Richter, A., Rozanov, A., and Burrows, J. P.: Observation of a fastozone loss over frost flowers in the marginal ice zone of the Arctic Ocean, J. Geophys. Res.,111, D15 309, doi:10.1029/2005JD006715, 2006. 4290, 4291, 4321, 4328, 4381
Jobson, B. T., Niki, H., Yokouchi, Y., Bottenheim, J., Hopper, F., and Leaitch, R.: Measurementsof C2-C6 hydrocarbons during the Polar Sunrise 1992 Experiment: Evidence for Cl atom and25
Br atom chemistry, J. Geophys. Res., 99, 25 355–25 368, 1994. 4294, 4304, 4311, 4315,4337, 4401
Johannessen, O. M., Shalina, E. V., and Miles, M. W.: Satellite Evidence for an Arctic Sea IceCover in Transformation, Science, 286, 1937–1939, 1999. 4346
Jones, A. E., Weller, R., Wolff, E. W., and Jacobi, H.-W.: Speciation and Rate of Photochemical30
NO and NO2 Production in Antarctic Snow, Geophys. Res. Lett., 27, 345–348, 2000. 4330Jones, A. E., Anderson, P. S., Wolff, E. W., Turner, J., Rankin, A. M., and Colwell, S. R.:
A role for newly forming sea ice in springtime polar tropospheric ozone loss? Ob-
4363

ACPD7, 4285–4403, 2007
Halogens and polarboundary-layerozone depletion
W. R. Simpson et al.
Title Page
Abstract Introduction
Conclusions References
Tables Figures
J I
J I
Back Close
Full Screen / Esc
Printer-friendly Version
Interactive Discussion
EGU
servational evidence from Halley Station, Antarctica, J. Geophys. Res., 111, D08 306,doi:10.1029/2005JD006566, 2006. 4290, 4291, 4295, 4321, 4325, 4327, 4328
Jones, P. D., New, M., Parker, D. E., Martin, S., and Rigor, I. G.: Surface air temperature andits changes over the past 150 years, Rev. Geophys., 37, 173–199, 1999. 4330
Joseph, D. M., Ashworth, S. H., and Plane, J. M. C.: The absorption cross-section and photo-5
chemistry of OIO, J. Photochem. Photobiol. A: Chem., 176, 68–77, 2005. 4302Jungwirth, P. and Tobias, D. J.: Molecular Structure of Salt Solutions: A New View of the
Interface with Implications for Heterogeneous Atmospheric Chemistry, J. Phys. Chem. B,105, 10 468–10 472, 2001. 4320
Jungwirth, P. and Tobias, D. J.: Chloride Anion on Aqueous Clusters, at the Air-Water Interface,10
and in Liquid Water: Solvent Effects on Cl− Polarizability, J. Phys. Chem. A, 106, 379–383,2002. 4320
Kaleschke, L., Lupkes, C., Vihma, T., Haarpaintner, J., Bochert, A., Hartmann, J., and Heygster,G.: SSM/I Sea Ice Remote Sensing for Mesoscale Ocean-Atmosphere Interaction Analysis,Can, J. of Remote Sens., 27, 526–537, 2001. 432415
Kaleschke, L., Richter, A., Burrows, J., Afe, O., Heygster, G., Notholt, J., Rankin, A. M., Roscoe,H. K., Hollwedel, J., Wagner, T., and Jacobi, H.-W.: Frost flowers on sea ice as a source ofsea salt and their influence on tropospheric halogen chemistry, Geophys. Res. Lett., 31,L16 114, doi:10.1029/2004GL020655, 2004. 4296, 4309, 4324, 4329, 4347, 4381, 4397
Kaleschke, L., Hollwedel, J., Richter, A., Burrows, J., Afe, O., Heygster, G., Notholt, J., Roscoe,20
H., Wolff, E. W., and Yang, X.: Boundary-layer ozone loss near the poles - why spring andnot autumn?, Geophys. Res. Abstr., 7, 04 916, 2005. 4324, 4329
Kalnajs, L. E. and Avallone, L. M.: Frost flower influence on springtime boundary-layerozone depletion events and atmospheric bromine levels, Geophys. Res. Lett., 33, L10 810,doi:10.1029/2006GL025809, 2006. 4295, 4320, 432225
Keil, A. D. and Shepson, P. B.: Chlorine and bromine atom ratios in the springtimes Arctictroposphere as determined from measurements of halogenated volatile organic compounds,J. Geophys. Res., 111, D17 303, doi:10.1029/2006JD007119, 2006. 4304, 4315, 4339
Khalizov, A. F., Viswanathan, B., Larregaray, P., and Ariya, P. A.: A Theoretical Study on theReactions of Hg with Halogens: Atmospheric Implications, J. Phys. Chem. A, 107, 6360–30
6365, 2003. 4335Kiehl, J. T.: Solving the Aerosol Puzzle, Science, 283, 1273–1275, 1999. 4382Kieser, B. N., Bottenheim, J. W., Sideris, T., and Niki, H.: Spring 1989 Observations Of Lower
4364

ACPD7, 4285–4403, 2007
Halogens and polarboundary-layerozone depletion
W. R. Simpson et al.
Title Page
Abstract Introduction
Conclusions References
Tables Figures
J I
J I
Back Close
Full Screen / Esc
Printer-friendly Version
Interactive Discussion
EGU
Tropospheric Chemistry In The Canadian High Arctic, Atmos. Environ., 27, 2979–2988,1993. 4294
Kirchner, U., Benter, T., and Schindler, R. N.: Experimental verification of gas phase bromineenrichment in reactions of HOBr with sea salt doped ice surfaces, Ber. Bunsenges. Phys.Chem., 101, 975–977, 1997. 42995
Knight, G. P. and Crowley, J. N.: The reactions of IO with HO2, NO and CH3SCH3: Flow tubestudies of kinetics and product formation, Phys. Chem. Chem. Phys., 3, 393–401, 2001.4298
Knipping, E. M., Lakin, M. J., Foster, K. L., Jungwirth, P., Tobias, D. J., Gerber, R. B., Dab-dub, D., and Finlayson-Pitts, B. J.: Experiments and Molecular/Kinetics Simulations of Ion-10
Enhanced Interfacial Chemistry on Aqueous NaCl Aerosols, Science, 288, 301–306, 2000.4320
Koop, T., Kapilashrami, A., Molina, L. T., and Molina, M. J.: Phase transitions of sea-salt/watermixtures at low temperatures: Implications for ozone chemistry in the polar marine boundarylayer, J. Geophys. Res., 105, 26 393–26 402, 2000. 4318, 439515
Kreher, K., Keys, J. G., Johnston, P. V., Platt, U., and Lui, X.: Ground based measurements ofClO and HCl in austral spring 1993 at Arrival Heights, Antarctica, Geophys. Res. Lett., 23,1545–1548, 1996. 4289, 4295
Kreher, K., Johnston, P. V., Wood, S. W., Nardi, B., and Platt, U.: Ground-based measurementsof tropospheric and stratospheric BrO at Arrival Heights, Antarctica, Geophys. Res. Lett., 24,20
3021–3024, 1997. 4289, 4295, 4303, 4307Lacis, A. A., Wuebbles, D. J., and Logan, J. A.: Radative forcing of climate by changes in the
vertical distribution of ozone, J. Geophys. Res., 95, 9971–9981, 1990. 4340, 4382Leaitch, W. R., Barrie, L. A., Bottenheim, J. W., Li, S. M., Shepson, P. B., Muthuramu, K.,
and Yokouchi, Y.: Airborne Observations Related To Ozone Depletion At Polar Sunrise, J.25
Geophys. Res., 99, 25 499–25 517, 1994. 4292LeBras, G. and Platt, U.: A Possible Mechanism For Combined Chlorine And Bromine Cat-
alyzed Destruction Of Tropospheric Ozone In The Arctic, Geophys. Res. Lett., 22, 599–602,1995. 4297
Legendre, L., Ackley, S. F., Dieckmann, G. S., Gulliksen, B., Horner, R. A., Hoshiai, T., Melnikov,30
I. A., Reeburgh, W. S., Spindler, M., and Sullivan, C. W.: Ecology of sea ice biota. 2. Globalsignificance, Pol. Biol., 12, 471–477, 1992. 4332
Legrand, M.: Ice-Core Records of Atmospheric Sulphur, Phil. Trans. R. Soc. Lond. B, 352,
4365

ACPD7, 4285–4403, 2007
Halogens and polarboundary-layerozone depletion
W. R. Simpson et al.
Title Page
Abstract Introduction
Conclusions References
Tables Figures
J I
J I
Back Close
Full Screen / Esc
Printer-friendly Version
Interactive Discussion
EGU
241–250, 1997. 4288Legrand, M. and Mayewski, P.: Glaciochemistry of polar ice cores: A review, Rev. Geophys.,
35, 219–243, 1997. 4288Legrand, M. and Pasteur, E. C.: Methane sulfonic acid to non-sea-salt sulfate ratio in coastal
Antarctic aerosol and surface snow, J. Geophys. Res., 103, 10 991–11 006, 1998. 43455
Lehrer, E., Honninger, G., and Platt, U.: A one dimensional model study of the mechanism ofhalogen liberation and vertical transport in the polar troposphere, Atmos. Chem. Phys., 4,2427–2440, 2004, http://www.atmos-chem-phys.net/4/2427/2004/. 4301, 4304, 4328, 4329
Li, S. M., Yokouchi, Y., Barrie, L. A., Muthuramu, K., Shepson, P. B., Bottenheim, J. W., Sturges,W. T., and Landsberger, S.: Organic And Inorganic Bromine Compounds And Their Compo-10
sition In The Arctic Troposphere During Polar Sunrise, J. Geophys. Res., 99, 25 415–25 428,1994. 4333
Lindberg, S. E., Brooks, S., Lin, C.-J., Scott, K. J., Landis, M. S., Stevens, R. K., Goodsite, M.,and Richter, A.: Dynamic Oxidation of Gaseous Mercury in the Arctic Troposphere at PolarSunrise, Environ. Sci. Technol., 36, 1245–1256, 2002. 433615
Lizotte, M. P.: The contributions of sea ice algae to Antarctic marine primary production, Am.Zool., 41, 57–73, 2001. 4333
Longhurst, A., Sathyendranath, S., Platt, T., and Caverhill, C.: An estimate of global primaryproduction in the ocean from satellite radiometer data, J. Plankton Res., 17, 1245–1271,1995. 433220
Lønne, O. J.: On productivity in ice-covered polar oceans, in: Ice Physics and the NaturalEnvironment, edited by Wettlaufer, J. S., Dash, J. G., and Untersteiner, N., vol. I 56 of NATOASI Series, pp. 209–218, Springer-Verlag, Berlin, Heidelberg, 1999. 4332
Lu, J. Y., Schroeder, W. H., Barrie, L. A., Steffen, A., Welch, H. E., Martin, K., Lockhart, L.,Hunt, R. V., Boila, G., and Richter, A.: Magnification of atmospheric mercury deposition to25
polar regions in springtime: the link to tropospheric ozone depletion chemistry, Geophys.Res. Lett., 28, 3219–3222, 2001. 4309, 4336
Marion, G. M.: Carbonate mineral solubility at low temperatures in the Na-K-Mg-Ca-H-Cl-SO4-OH-HCO3-CO3-CO2-H2O system, Geochim. Cosmochim. Acta, 65, 1883–1896, 2001. 4320
Martin, S., Drucker, R., and Fort, M.: A laboratory study of frost flower growth on the surface of30
young sea-ice, J. Geophys. Res., 100, 7027–7036, 1995. 4305, 4324, 4347Martin, S., Yu, Y., and Drucker, R.: The temperature dependence of frost flower growth on
laboratory sea ice and the effect of the flowers on infrared observations of the surface, J.
4366

ACPD7, 4285–4403, 2007
Halogens and polarboundary-layerozone depletion
W. R. Simpson et al.
Title Page
Abstract Introduction
Conclusions References
Tables Figures
J I
J I
Back Close
Full Screen / Esc
Printer-friendly Version
Interactive Discussion
EGU
Geophys. Res., 101, 12 111–12 125, 1996. 4305, 4324, 4347Martinez, M., Arnold, T., and Perner, D.: The role of bromine and chlorine chemistry for arctic
ozone depletion events in Ny-Alesund and comparison with model calculations, Ann. Geo-phys., 17, 941–956, 1999, http://www.ann-geophys.net/17/941/1999/. 4303, 4307
Mason, R. P., Fitzgerald, W. F., and Morel, F. M. M.: The Biogeochemical Cycling Of Elemental5
Mercury – Anthropogenic Influences, Geochim. Cosmochim. Acta, 58, 3191–3198, 1994.4334
Mauldin, R. L., Kosciuch, E., Henry, B., Eisele, F. L., Shetter, R., Lefer, B., Chen, G., Davis, D.,Huey, G., and Tanner, D.: Measurements of OH, HO2 + RO2, H2SO4, and MSA at the SouthPole during ISCAT 2000, Atmos. Environ., 38, 5423–5437, 2004. 433010
McConnell, J. C., Henderson, G. S., Barrie, L., Bottenheim, J., Niki, H., Langford, C. H., andTempleton, E. M. J.: Photochemical bromine production implicated in Arctic boundary-layerozone depletion, Nature, 355, 150–152, 1992. 4289, 4298, 4304, 4322, 4328
McElroy, C. T., McLinden, C. A., and McConnell, J. C.: Evidence for bromine monoxide in thefree troposphere during the Arctic polar sunrise, Nature, 397, 338–341, 1999. 4289, 4322,15
4327, 4341, 4348McFiggans, G., Plane, J. M. C., Allan, B. J., Carpenter, L. J., Coe, H., and O’Dowd, C.: A
Modelling Study of Iodine Chemistry in the Marine Boundary Layer, J. Geophys. Res., 105,14 371–14 377, 2000. 4313
Michalowski, B. A., Francisco, J. S., Li, S.-M., Barrie, L. A., Bottenheim, J. W., and Shepson,20
P. B.: A computer model study of multiphase chemistry in the Arctic boundary layer duringpolar sunrise, J. Geophys. Res., 105, 15 131–15 145, 2000. 4304, 4322, 4330
Mickle, R. E., Bottenheim, J. W., Leaitch, R. W., and Evans, W.: Boundary layer ozone depletionduring AGASP-II, Atmos. Environ., 23, 2443–2449, 1989. 4292, 4380
Mickley, L. J., Jacob, D. J., and Rind, D.: Uncertainty in preindustrial abundance of tropospheric25
ozone: implications for radiative forcing calculations, J. Geophys. Res., 106, 3389–3399,2001. 4382
Mihele, C. M. and Hastie, D. R.: The sensitivity of the radical amplifier to ambient water vapour,Geophys. Res. Lett., 25, 1911–1913, 1998. 4295
Mitchell, J. M. J.: Visual range in the polar regions with particular reference to the alaskan30
Arctic, J. Atm. Terr. Phys., Spec. Suppl., 1, 195–211, 1957. 4288Molina, M. J. and Rowland, F. S.: Stratospheric sink for chlorofluoromethanes: Chlorine-atom
catalysed destruction of ozone, Nature, 249, 810–812, 1974. 4288
4367

ACPD7, 4285–4403, 2007
Halogens and polarboundary-layerozone depletion
W. R. Simpson et al.
Title Page
Abstract Introduction
Conclusions References
Tables Figures
J I
J I
Back Close
Full Screen / Esc
Printer-friendly Version
Interactive Discussion
EGU
Moore, R. M., Groszko, W., and Niven, S. J.: Ocean-atmosphere exchange of methyl chloride:Results from NW Atlantic and Pacific Ocean studies, J. Geophys. Res., 101, 28 529–28 538,1996. 4332
Moortgat, G. K., Meller, R., and Schneider, W.: Temperature dependence (256-296K) of theabsorption cross sections of bromoform in the wavelength range 285-360 nm, in: Tropo-5
spheric Chemistry of Ozone in Polar Regions, NATO ASI Ser, Subser 1: Global Environmen-tal Change, edited by: Niki, H. and Becker, K. H., pp. 359–370, Springer Verlag, New York,1993. 4294
Morin, S., Hoenninger, G., Staebler, R. M., and Bottenheim, J.: A high time resolution study ofboundary layer ozone chemistry and dynamics over the Arctic Ocean near Alert, Nunavut,10
Geophys. Res. Lett., 32, doi:10.1029/2004GL022098, 2005. 4291, 4328, 4380, 4398Muthuramu, K., Shepson, P. B., Bottenheim, J. W., Jobson, B. T., Niki, H., and Anlauf, K. G.:
Relationships between organic nitrates and surface ozone destruction during Polar SunriseExperiment 1992, J. Geophys. Res., 99, 25 369–25 378, 1994. 4311
Narukawa, M., Kawamura, K., Anlauf, K. G., and Barrie, L. A.: Fine and coarse modes of15
dicarboxylic acids in the Arctic aerosols collected during the Polar Sunrise Experiment 1997,J. Geophys. Res., 108, 4575, doi:10.1029/2003JD003646, 2003. 4339
Neff, W., Helmig, D., Grachev, A., and Davis, D. D.: A study of boundary layer behavior associ-ated with high NO concentrations at the South Pole using a minisodar, tethered balloon, andsonic anemometer, Atmos. Environ., in press, doi:10.1016/j.atmosenv.2007.01.033, 2007.20
4325, 4326Nghiem, S. V., Martin, S., Perovich, D. K., Kwok, R., Drucker, R., and Gow, A. J.: A laboratory
study of the effect of frost flowers on C band radar backscatter from sea ice, J. Geophys.Res., 102, 3357–3370, 1997. 4305
O’Dowd, C. D. and Hoffmann, T.: Coastal New Particle Formation: A Review of the Current25
State-Of-The-Art, Environ. Chem., 2, 245–255, 2005. 4302, 4314, 4344O’Driscoll, P., Lang, K., Minogue, N., and Sodeau, J.: Freezing halide ion solutions
and the release of interhalogens to the atmosphere, J. Chem. Phys. A, 110, 4615,doi:10.1021/jp060491v, 2006. 4306
Oltmans, S. J.: Surface ozone measurements in clean air, J. Geophys. Res., 86, 1174–1180,30
1981. 4289, 4293Oltmans, S. J. and Komhyr, W.: Surface ozone distributions and variations from 1973 - 1984
measurements at the NOAA Geophysical Monitoring for Climate Change Baseline observa-
4368

ACPD7, 4285–4403, 2007
Halogens and polarboundary-layerozone depletion
W. R. Simpson et al.
Title Page
Abstract Introduction
Conclusions References
Tables Figures
J I
J I
Back Close
Full Screen / Esc
Printer-friendly Version
Interactive Discussion
EGU
tories, J. Geophys. Res., 91, 5229–5236, 1986. 4289, 4327, 4328Oltmans, S. J., Schnell, R. C., Sheridan, P. J., Peterson, R. E., Li, S. M., Winchester, J. W., Tans,
P. P., Sturges, W. T., Kahl, J. D., and Barrie, L. A.: Seasonal surface ozone and filterablebromine relationship in the high Arctic, Atmos. Environ., 23, 2431–2441, 1989. 4289
Overpeck, J. T., Sturm, M., Francis, J. A., Perovich, D. K., Serreze, M. C., Benner, R., Carmack,5
E. C., III, S. C., Gerlach, S. C., Hamilton, L. C., Hinzman, L. D., Holland, M., Huntington,H. P., Key, J. R., Lloyd, A. H., MacDonald, G. M., McFadden, J., Noone, D., Prowse, T. D.,Schlosser, P., and Vorosmarty, C.: Arctic System on Trajectory to New, Seasonally Ice-FreeState, Eos Trans. AGU, 86, 309, 2005. 4346
Papadimitriou, S., Kennedy, H., Kattner, G., Dieckmann, G. S., and Thomas, D. N.: Experi-10
mental evidence for carbonate precipitation and CO2 degassing during sea ice formation,Geochim. Cosmochim. Acta, 68, 1749–1761, 2003. 4305
Pena, D., Tiao, G. C., and Tsay, R. S.: A Course in Time Series Analysis, John Wiley, Hoboken,N. J., 2000. 4383
Perner, D., Harder, H., Martinez, M., Hegels, E., Grund, A., and Klupfel, T.: Observation of BrO15
in the atmosphere by remote sensing and its significance for the global budget of bromine,in: Proceedings of the fourth European symposium, 22–26 September 1997, Schliersee,Germany, Air Pollution Report 66, pp. 378–381, 1998. 4308
Perner, D., Arnold, T., Crowley, J., Klupfel, T., Martinez, M., and Seuwen, R.: The measure-ments of active chlorine in the atmosphere by chemical amplification, J. Atmos. Chem., 34,20
9–20, 1999. 4312Perovich, D. K. and Richter-Menge, J. A.: Surface characteristics of lead ice, J. Geophys. Res.,
99, 16 341–16 350, 1994. 4317Perrier, S., Houdier, S., Domine, F., Cabanes, A., Legagneux, L., Sumner, A. L., and Shepson,
P. B.: Formaldehyde in Arctic snow. Incorporation into ice particles and evolution in the25
snowpack, Atmos. Environ., 36, 2695–2705, 2002. 4338Peterson, M. C. and Honrath, R. E.: Observations of Rapid Photochemical Destruction of
Ozone in Snowpack Interstitial Air, Geophys. Res. Lett., 28, 511–514, 2001. 4331Platt, U. and Honninger, G.: The role of halogen species in the troposphere, Chemosphere, 52,
325–338, 2003. 4296, 430130
Platt, U. and Janssen, C.: Observation and Role of the Free Radicals NO3, ClO, BrO and IO inthe Troposphere, Faraday Discuss., 100, 175–198, 1995. 4296, 4299
Platt, U. and Lehrer, E.: Arctic Tropospheric Ozone Chemistry, ARCTOC, Final Report of the
4369

ACPD7, 4285–4403, 2007
Halogens and polarboundary-layerozone depletion
W. R. Simpson et al.
Title Page
Abstract Introduction
Conclusions References
Tables Figures
J I
J I
Back Close
Full Screen / Esc
Printer-friendly Version
Interactive Discussion
EGU
EU-Project NO. EV5V-CT93-0318, 1996. 4298, 4299, 4301, 4380Platt, U. and Moortgat, G. K.: Heterogeneous and Homogeneous Chemistry of Reactive Halo-
gen Compounds in the Lower Troposphere, J. Atmos. Chem., 34, 1–8, 1999. 4296Poulain, A. J., Orihel, D. M., Amyot, M., Paterson, M. J., Hintelmann, H., and Southworth,
G. R.: Relationship to aquatic between the loading rate of inorganic mercury ecosystems5
and dissolved gaseous mercury production and evasion, Chemosphere, 65, 2199–2207,2006. 4336
Pundt, I., Pommereau, J.-P., Chipperfield, M. P., Roozendael, M. V., and Goutail, F.: Climatologyof the stratospheric BrO vertical distribution by balloon-borne UV-visible spectrometry, J.Geophys. Res., 107, 4806, doi:10.1029/2002JD002230, 2002. 434110
Radke, L. F., Lyons, J. H., Hegg, D. A., Hobbs, P. V., and Bailey, I. H.: Airborne observationsof Arctic aerosols. I: Characteristics of Arctic haze, Geophys. Res. Lett., 11, 393–396, 1984.4343
Ramacher, B., Rudolph, J., and Koppmann, R.: Hydrocarbon measurements during tropo-spheric ozone depletion events: Evidence for halogen atom chemistry, J. Geophys. Res.,15
104, 3633–3653, 1999. 4311, 4315Rankin, A. M. and Wolff, E. W.: A year-long record of size-segregated aerosol composition at
Halley, Antarctica, J. Geophys. Res., 108, 4775, doi:10.1029/2003JD003993, 2003. 4318,4319
Rankin, A. M., Wolff, E. W., and Martin, S.: Frost flowers: Implications for tropospheric chem-20
istry and ice core interpretation, J. Geophys. Res., 107, 4683, doi:10.1029/2002JD002492,2002. 4295, 4317, 4318, 4320, 4321, 4324, 4344
Raofie, F. and Ariya, P.: Reaction of gaseous mercury with molecular iodine and iodine radicals:Kinetics, product states, and atmospheric implications, in: AGU Fall meeting 2006, SanFrancisco, 2006. 4335, 433725
Raofie, F. and Ariya, P. A.: Product study of the gas-phase BrO-initiated oxidation of Hg-0:evidence for stable Hg1+ compounds, Environ. Sci. Technol., 38, 4319–4326, 2004. 4335
Reifenhauser, W. and Heumann, K. G.: Bromo- and Bromochloromethanes in the Antarcticatmosphere and the South Polar Sea, Chemosphere, 24, 1293–1300, 1992a. 4331
Reifenhauser, W. and Heumann, K. G.: Determinations of methyl iodide in the Antarctic atmo-30
sphere and the South Polar Sea, Atmos. Environ., 26A, 2905–2912, 1992b. 4332Richardson, C.: Phase relationships in sea ice as a function of temperature, J. Glaciol., 17,
507–519, 1976. 4305, 4318, 4320
4370

ACPD7, 4285–4403, 2007
Halogens and polarboundary-layerozone depletion
W. R. Simpson et al.
Title Page
Abstract Introduction
Conclusions References
Tables Figures
J I
J I
Back Close
Full Screen / Esc
Printer-friendly Version
Interactive Discussion
EGU
Richter, A., Eisinger, M., Wittrock, F., and Burrows, J. P.: Measurements of halogen oxides byGOME, Earth Observation Quarterly, 58, 19–20, 1998a. 4309
Richter, A., Eisinger, M., Wittrock, F., Schlieter, S., Ladstatter-Weißenmayer, A., and Burrows,J.: Zenith Sky and GOME DOAS measurements of atmospheric trace gases above Bremen,53◦ N, 1994–1997, in: Proceedings of the fourth European symposium, 22–26 September5
1997, Schliersee, Germany, Air Pollution Report 66, pp. 482–485, 1998b. 4308Richter, A., Wittrock, F., Eisinger, M., and Burrows, J. P.: GOME Observations of Tropospheric
BrO in Northern Hemispheric Spring and Summer 1997, Geophys. Res. Lett., 25, 2683–2686, 1998c. 4290, 4291, 4296, 4303, 4308, 4309, 4327, 4381
Richter, A., Wittrock, F., Ladstatter-Weißenmayer, A., and Burrows, J. P.: GOME measurements10
of stratospheric and tropospheric BrO, Adv. Space Res., 29, 1667–1672, 2002. 4309, 4381Ridley, B. A., Atlas, E. L., Montzka, D. D., Browell, E. V., Cantrell, C. A., Blake, D. R., Blake,
N. J., Cinquini, L., Coffey, M. T., Emmons, L. K., Cohen, R. C., DeYoung, R. J., Dibb, J. E.,Eisele, F. L., Flocke, F. M., Fried, A., Grahek, F. E., Grant, W. B., Hair, J. W., Hannigan, J.,Heikes, B. J., Lefer, B. L., Mauldin, R. L., Moody, J. L., Shetter, R. E., Snow, J. A., Talbot,15
R. W., Thornton, J. A., Walega, J. G., Weinheimer, A. J., Wert, B. P., and Wimmers, A. J.:Ozone Depletion Events Observed in the High Latitude Surface Layer During the TOPSEAircraft Program, J. Geophys. Res., 108, 8356, doi:10.1029/2001JD001507, 2003. 4290,4291, 4292, 4339
Riedel, K., Allan, W., Weller, R., and Schrems, O.: Discrepancies between formaldehyde20
measurements and methane oxidation model predictions in the Antarctic troposphere: Anassessment of other possible formaldehyde sources, J. Geophys. Res., 110, D15 308,doi:10.1029/2005JD005859, 2005. 4338
Roscoe, H. K. and Roscoe, J.: Polar tropospheric ozone depletion events observed in theInternational Geophysical Year of 1958, Atmos. Chem. Phys., 6, 3303–3314, 2006,25
http://www.atmos-chem-phys.net/6/3303/2006/. 4291, 4296Roscoe, H. K., Kreher, K., and Friess, U.: Ozone loss episodes in the free Antarctic tropo-
sphere, suggesting a possible climate feedback, Geophys. Res. Lett., 28, 2911–2914, 2001.4340
Rothlisberger, R., Mulvaney, R., Wolff, E. W., Hutterli, M. A., Bigler, M., Angelis, M. D., Hansson,30
M. E., Steffensen, J. P., and Udisti, R.: Limited dechlorination of sea-salt aerosols during thelast glacial period: Evidence from the European Project for Ice Coring in Antarctica (EPICA)Dome C ice core, J. Geophys. Res., 108, 4526, doi:4510.1029/2003JD003604, 2003. 4344
4371

ACPD7, 4285–4403, 2007
Halogens and polarboundary-layerozone depletion
W. R. Simpson et al.
Title Page
Abstract Introduction
Conclusions References
Tables Figures
J I
J I
Back Close
Full Screen / Esc
Printer-friendly Version
Interactive Discussion
EGU
Rudolph, J., Fu, B., Thompson, A., Anlauf, K., and Bottenheim, J.: Halogen atom concentra-tions in the Arctic trophosphere derived from hydrocarbon measurements: impact on thebudget of formaldehyde, Geophys. Res. Lett., 26, 2941–2944, 1999. 4311, 4315
Saiz-Lopez, A. and Plane, J. M. C.: Novel iodine chemistry in the marine boundary layer,Geophys. Res. Lett., 31, L04 112, doi:10.1029/2003GL019215, 2004. 43135
Saiz-Lopez, A., Shillito, J. A., Coe, H., and Plane, J. M. C.: Measurements and modelling ofI2, IO, OIO, BrO and NO3 in the mid-latitude marine boundary layer, Atmos. Chem. Phys., 6,1513–1528, 2006, http://www.atmos-chem-phys.net/6/1513/2006/. 4303
Salawitch, R.: Atmospheric chemistry: Biogenic bromine, Nature, 439, 275–277, 2006. 4291Sander, R., Vogt, R., Harris, G. W., and Crutzen, P. J.: Modeling the chemistry of ozone,10
halogen compounds, and hydrocarbons in the arctic troposphere during spring, Tellus, 49B,522–532, 1997. 4304, 4322
Sander, R., Keene, W. C., Pszenny, A. A. P., Arimoto, R., Ayers, G. P., Baboukas, E., Cainey,J. M., Crutzen, P. J., Duce, R. A., Honninger, G., Huebert, B. J., Maenhaut, W., Mihalopou-los, N., Turekian, V. C., and Dingenen, R. V.: Inorganic bromine compounds in the marine15
boundary layer: A critical review, Atmos. Chem. Phys., 3, 1301–1336, 2003a. 4322, 4349Sander, R., Burrows, J., and Kaleschke, L.: Carbonate precipitation in brine – the trigger for
tropospheric ozone depletion events, Atmos. Chem. Phys., 6, 4653–4658, 2006,http://www.atmos-chem-phys.net/6/4653/2006/. 4319, 4322, 4328, 4346
Sander, S. P., Friedl, R. R., Golden, D. M., Kurylo, M. J., Huie, R. E., Orkin, V. L., Moortgat,20
G. K., Ravishankara, A. R., Kolb, C. E., Molina, M. J., and Finlayson-Pitts, B. J.: ChemicalKinetics and Photochemical Data for Use in Stratospheric Modeling, Tech. Rep. JPL Publi-cation 02-25, Jet Propulsion Laboratory, Pasadena, CA, 2003b. 4387
Schall, C. and Heumann, K. G.: GC determination of volatile organoiodine and organobrominecompounds in Arctic seawater and air samples, Fresenius J. Anal. Chem., 346, 717–722,25
1993. 4331Schall, C., Laturnus, F., and Heumann, K. G.: Biogenic volatile organoiodine and
organobromine compounds released from polar macroalgae, Chemosphere, 28, 1315–1324,1994. 4331, 4332
Schnell, R. C.: Arctic haze and the Arctic Gas and Aerosol Sampling Program (AGASP), Geo-30
phys. Res. Lett., 11, 361–364, 1983. 4288Schroeder, W. H. and Munthe, J.: Atmospheric Mercury – An Overview, Atmos. Environ., 32,
809–822, 1998. 4335
4372

ACPD7, 4285–4403, 2007
Halogens and polarboundary-layerozone depletion
W. R. Simpson et al.
Title Page
Abstract Introduction
Conclusions References
Tables Figures
J I
J I
Back Close
Full Screen / Esc
Printer-friendly Version
Interactive Discussion
EGU
Schroeder, W. H., Anlauf, K. G., Barrie, L. A., Lu, J. Y., Steffen, A., Schneeberger, D. R., andBerg, T.: Arctic springtime depletion of mercury, Nature, 394, 331–332, 1998. 4335, 4336,4400
Schroeder, W. H., Steffen, A., Scott, K., bender, T., Prestbo, E., Ebinghas, R., Lu, J. Y., andLindberg, S. E.: Summary report: first international Arctic atmospheric mercury research5
workshop, Atmos. Environ., 37, 2551–2555, 2003. 4335Serreze, M. C. and Francis, J. A.: The Arctic amplification debate, Clim. Chang., 76, 241–264,
doi:10.1007/s10 584–005–9017–y, 2006. 4346Serreze, M. C., Maslanik, J. A., Rehder, M. C., Schnell, R. C., Kahl, J. D., and Andreas, E. L.:
Theoretical Heights Of Buoyant Convection Above Open Leads In The Winter Arctic Pack10
Ice Cover, J. Geophys. Res., 97, 9411–9422, 1992. 4326, 4327Serreze, M. C., Maslanik, J. A., Scambos, T. A., Fetterer, F., Stroeve, J., Knowles, K., Fowler,
C., Drobot, S., Barry, R. G., and Haran, T. M.: A record minimum arctic sea ice extent andarea in 2002, Geophys. Res. Lett., 30, 1110, doi:10.1029/2002GL016406, 2003. 4346
Shaw, G. E.: The arctic haze phenomenon, Bull. Am. Meteorol. Soc., 76, 2403–2413, 1995.15
4288Shepler, B. C. and Peterson, K. A.: Mercury monoxide: A systematic investigation of its ground
electronic state, J. Phys. Chem. A, 107, 1783–1787, 2003. 4335Shepson, P., Matrai, P., Barrie, L., and Bottenheim, J.: Ocean-Atmosphere-Sea Ice-Snowpack
Interactions in the Arctic and Global Change, EOS Transactions, 84, 349, 2003. 432620
Shepson, P. B., Mackay, E., and Muthuramu, K.: Henry’s Law Constants and Removal Pro-cesses for Several Atmospheric β-Hydroxy Alkyl Nitrates, Environ. Sci. Technol., 30, 3618–3623, 1996. 4295
Sheridan, P. J., Schnell, R. C., Zoller, W. H., Carlson, N. D., Rasmussen, R. A., Harris, J. M.,and Sievering, H.: Composition of Br-containing aerosols and gases related to boundary25
layer ozone destruction in the Arctic, Atmos. Environ., 27 A, 2839–2849, 1993. 4294Siegenthaler, U., Stocker, T. F., Monnin, E., Luthi, D., Schwander, J., Stauffer, B., Raynaud, D.,
Barnola, J. M., Fischer, H., Masson-Delmotte, V., and Jouzel, J.: Stable carbon cycle-climaterelationship during the late Pleistocene, Science, 310, 1313–1317, 2005. 4344
Simpson, W. R., King, M. D., Beine, H. J., Honrath, R. E., and Peterson, M. C.: Atmospheric30
photolysis rate coefficients during the Polar Sunrise Experimeny ALERT2000, Atmos. Envi-ron., 36, 2471–2480, 2002. 4294
Simpson, W. R., Alvarez-Aviles, L., Douglas, T. A., Sturm, M., and Domine, F.: Halogens in the
4373

ACPD7, 4285–4403, 2007
Halogens and polarboundary-layerozone depletion
W. R. Simpson et al.
Title Page
Abstract Introduction
Conclusions References
Tables Figures
J I
J I
Back Close
Full Screen / Esc
Printer-friendly Version
Interactive Discussion
EGU
coastal snow pack near Barrow, Alaska: Evidence for active bromine air-snow chemistry dur-ing springtime, Geophys. Res. Lett., 32, L04 811, doi:10.1029/2004GL021748, 2005. 4300,4315, 4319, 4321, 4323
Simpson, W. R., Carlson, D., Honninger, G., Douglas, T. A., Sturm, M., Perovich, D., and Platt,U.: First-year sea-ice contact predicts bromine monoxide (BrO) levels at Barrow, Alaska5
better than potential frost flower contact, Atmos. Chem. Phys., 7, 621–627, 2007,http://www.atmos-chem-phys.net/7/621/2007/. 4317, 4324, 4347
Sjostedt, S. J., Huey, L. G., Tanner, D. J., Peischl, J., Chen, G., Dibb, J. E., Lefer, B., Hutterli,M. A., Beyersdorf, A. J., Blake, N. J., Blake, D. R., Sueper, D., Ryerson, T., Burkhart, J., andStohl, A.: Observations of hydroxyl and the sum of peroxy radicals at Summit, Greenland10
during summer 2003, Atmos. Environ., in press, doi:10.1016/j.atmosenv.2006.06.058, 2007.4330
Slemr, F., Brunke, E., Ebinghaus, R., Temme, C., Munthe, J., Wangberg, I., Schroeder, W. H.,Steffen, A., and Berg, T.: Worldwide Trend of Atmospheric Mercury since 1977, Geophys.Res. Lett., 30, 1516, doi:10.1029/2003GL016954, 2003. 433515
Solberg, S., Schmidbauer, N., Semb, A., and Stordal, F.: Boundary-layer ozone depletion asseen in the Norwegian arctic in spring, J. Atmos. Chem., 23, 301–332, 1996. 4292, 4311,4315
Solomon, S., Garcia, R. R., Rowland, F. S., and Wuebbles, D. J.: On the depletion of Antarcticozone, Nature, 321, 755–758, 1986. 428820
Solomon, S., Garcia, R. R., and Ravishankara, A. R.: On the role of iodine in ozone depletion,J. Geophys. Res., 99, 20 491–20 499, 1994. 4297
Sommar, J., Wangberg, I., Berg, T., Grdfeldt, K., Munthe, J., Richter, A., Urba, A., Wittrock,F., and Schroeder, W. H.: Circumpolar transport and air-surface exchange of atmosphericmercury at NyAlesund (79 N), Svalbard, spring 2002, Atmos. Chem. Phys., 7, 151–166,25
2007, http://www.atmos-chem-phys.net/7/151/2007/. 4309Spahni, R., Chappellaz, J., Stocker, T. F., Loulergue, L., Hausammann, G., Kawamura, K.,
Fluckiger, J., Schwander, J., Raynaud, D., Masson-Delmotte, V., and Jouzel, J.: AtmosphericMethane and Nitrous Oxide of the Late Pleistocene from Antarctic Ice Cores, Science, 310,1317–1321, 2005. 434430
Spicer, C. W., Plastridge, R. A., Foster, K. L., Finlayson-Pitts, B. J., Bottenheim, J. W., Grannas,A. M., and Shepson, P. B.: Molecular halogens before and during ozone depletion events inthe Arctic at polar sunrise: concentrations and sources, Atmos. Environ., 36, 2721–2731,
4374
ACPD7, 4285–4403, 2007
Halogens and polarboundary-layerozone depletion
W. R. Simpson et al.
Title Page
Abstract Introduction
Conclusions References
Tables Figures
J I
J I
Back Close
Full Screen / Esc
Printer-friendly Version
Interactive Discussion
EGU
2002. 4303, 4308, 4312, 4323, 4334, 4390Staebler, R. M., Denhartog, G., Georgi, B., and Dusterdiek, T.: Aerosol-Size Distributions In
Arctic Haze During The Polar Sunrise Experiment 1992, J. Geophys. Res., 99, 25 429–25 437, 1994. 4343
Stroeve, J. C., Serreze, M. C., Fetterer, F., Arbetter, T., Meier, W., Maslanik, J., and Knowles,5
K.: Tracking the Arctic’s shrinking ice cover: Another extreme September minimum in 2004,Geophys. Res. Lett., 32, L04 501, doi:10.1029/2004GL021810, 2005. 4346, 4347
Strong, C., Fuentes, J. D., Davis, R. E., and Bottenheim, J. W.: Thermodynamic attributes ofArctic boundary layer ozone depletion, Atmos. Environ., 36, 2641–2652, 2002. 4292
Sturges, W. T.: Excess particulate and gaseous bromine at a remote coastal location, Atmos.10
Environ., 24, 167–171, 1990. 4293Sturges, W. T. and Shaw, G. E.: Halogens in aerosols in central Alaska, Atmos. Environ., 27A,
2969–2977, 1993. 4294, 4331, 4380Sturges, W. T., Cota, G. F., and Buckley, P. T.: Bromoform emission form Arctic ice algae,
Nature, 358, 660–662, 1992. 433115
Sturges, W. T., Schnell, R. C., Dutton, G. S., Garcia, S. R., and Lind, J. A.: Spring measure-ments of tropospheric bromine at Barrow, Alaska, Geophys. Res. Lett., 20, 201–204, 1993.4294
Stutz, J., Ackermann, R., Fast, J. D., and Barrie, L.: Atmospheric Reactive Chlo-rine and Bromine at the Great Salt Lake, Utah, Geophys. Res. Lett., 29, 1380,20
doi:10.1029/2002GL014812, 2002. 4310Sumner, A. L. and Shepson, P. B.: Snowpack production of formaldehyde and its effect on the
Arctic troposphere, Nature, 398, 230–233, 1999. 4295, 4330, 4338Sumner, A. L., Shepson, P. B., Grannas, A. M., Bottenheim, J. W., Anlauf, K. G., Worthy,
D., Schroeder, W. H., Steffen, A., Domine, F., Perrier, S., and Houdier, S.: Atmospheric25
chemistry of formaldehyde in the Arctic troposphere at polar sunrise, and the influence of thesnowpack, Atmos. Environ., 36, 2553–2562, 2002. 4338, 4402
Swanson, A. L., Blake, N. J., Dibb, J. E., Albert, M. R., Blake, D. R., and Rowland, F. S.:Photochemically induced production of CH3Br, CH3I, C2H5I, ethene, and propene withinsurface snow at Summit, Greenland, Atmos. Environ., 36, 2671–2682, 2002. 433330
Tackett, P. J., Cavender, A., Shepson, P. B., Bottenheim, J. W., Morin, S., Deary, J., and Steffen,A.: A Study of the vertical scale of halogen chemistry in the Arctic troposphere during polarsunrise at Barrow, AK, J. Geophys. Res., in press, 2007. 4292, 4312, 4392
4375

ACPD7, 4285–4403, 2007
Halogens and polarboundary-layerozone depletion
W. R. Simpson et al.
Title Page
Abstract Introduction
Conclusions References
Tables Figures
J I
J I
Back Close
Full Screen / Esc
Printer-friendly Version
Interactive Discussion
EGU
Tang, T. and McConnell, J. C.: Autocatalytic release of bromine from Arctic snow pack duringpolar sunrise, Geophys. Res. Lett., 23, 2633–2636, 1996. 4298, 4304, 4322
Tarasick, D. W. and Bottenheim, J. W.: Surface ozone depletion episodes in the Arctic andAntarctic from historical ozonesonde records, Atmos. Chem. Phys., 2, 197–205, 2002,http://www.atmos-chem-phys.net/2/197/2002/. 4290, 42925
Tarasick, D. W., Fioletov, V. E., Wardle, D. I., Kerr, J. B., and Davies, J.: Changes in the verticaldistribution of ozone over Canada from ozonesondes: 1980–2001, J. Geophys. Res., 110,D02 304, doi:10.1029/2004JD004643, 2005. 4292
Theys, N., Smedt, I. D., Roozendael, M. V., Fayt, C., Chabrillat, S., Chipperfield, M., Post, P.,and van der A, R.: Total and tropospheric BrO derived from GOME and SCIAMACHY as part10
of the TEMIS project, in: Proc. Envisat/ERS Symposium, Salzburg, 6–10 September 2004,2004. 4309
Toom-Sauntry, D. and Barrie, L. A.: Chemical composition of snowfall in the high Arctic: 1990–1994, Atmos. Environ., 36, 2683–2693, 2002. 4322
Toumi, R.: BrO as a sink for dimethylsulphide in the marine atmosphere, Geophys. Res. Lett.,15
21, 117–120, 1994. 4342Toumi, R., Bekki, S., and Law, K.: Climate And CCN – Reply, Nature, 375, 111–111, 1995.
4345Tucceri, M. E., Holscher, D., Rodriguez, A., Dillon, T. J., and Crowley, J. N.: Absorption cross
section and photolysis of OIO, Phys. Chem. Chem. Phys., 8, 834–846, 2006. 430220
Tuckermann, M., Ackermann, R., Golz, C., Lorenzen-Schmidt, H., Senne, T., Stutz, J., Trost,B., Unold, W., and Platt, U.: DOAS-observation of halogen radical-catalysed Arctic bound-ary layer ozone destruction during the ARCTOC-campaigns 1995 and 1996 in Ny-Alesund,Spitsbergen, Tellus, 49B, 533–555, 1997. 4307, 4312, 4314, 4321, 4328
Van Roozendael, M., Fayt, C., Lambert, J.-C., Pundt, I., Wagner, T., Richter, A., and Chance, K.:25
Development of a bromine oxide product from GOME, in: Proc. ESAMS’99-European Sym-posium on Atmospheric Measurements from Space, ESTEC, Noordwijk, The Netherlands,18–22 January 1999, ESA WPP-161, pp. 543–547, 1999. 4309
Van Roozendael, M., Wagner, T., Richter, A., Pundt, I., Arlander, D. W., Burrows, J. P., Chip-perfield, M., Fayt, C., Johnston, P. V., Lambert, J. C., Kreher, K., Pfeilsticker, K., Platt, U.,30
Pommereau, J. P., Sinnhuber, B. M., Tornkvist, K. K., and Wittrock, F.: Intercomparison ofBrO measurements from ERS-2 GOME, ground-based and balloon platforms, in: RemoteSensing Of Trace Constituents In The Lower Stratosphere, Troposphere And The Earth’s
4376

ACPD7, 4285–4403, 2007
Halogens and polarboundary-layerozone depletion
W. R. Simpson et al.
Title Page
Abstract Introduction
Conclusions References
Tables Figures
J I
J I
Back Close
Full Screen / Esc
Printer-friendly Version
Interactive Discussion
EGU
Surface: Global Observations, Air Pollution And The Atmospheric Correction, Adv. SpaceRes., 29(11), 1661–1666, 2002. 4309, 4341
Vogt, R., Crutzen, P. J., and Sander, R.: A mechanism for halogen release from sea-salt aerosolin the remote marine boundary layer, Nature, 383, 327–330, 1996. 4300
Vogt, R., Sander, R., von Glasow, R., and Crutzen, P.: Iodine Chemistry and its Role in Halogen5
Activation and Ozone Loss in the Marine Boundary Layer: A Model Study, J. Atmos. Chem.,32, 375–395, 1999. 4302, 4313
von Glasow, R. and Crutzen, P. J.: Tropospheric halogen chemistry, in: The Atmosphere, editedby: Keeling, R. F., Vol. 4, Treatise on Geochemistry, edited by: Holland, H. D. and Turekian,K. K., pp. 21–64, Elsevier-Pergamon, Oxford, 2003. 4296, 4302, 438710
von Glasow, R. and Crutzen, P. J.: Model study of multiphase DMS oxidation with a focus onhalogens, Atmos. Chem. Phys., 4, 589–608, 2004,http://www.atmos-chem-phys.net/4/589/2004/. 4342, 4345
von Glasow, R. and Crutzen, P. J.: Tropospheric halogen chemistry, in: The Atmosphere, editedby: Keeling, R. F., Vol. 4, Treatise on Geochemistry, edited by: Holland, H. D. and Turekian,15
K. K., p. in press, Elsevier-Pergamon, Oxford, 2007. 4296, 4302, 4310von Glasow, R., von Kuhlmann, R., Lawrence, M. G., Platt, U., and Crutzen, P. J.: Impact of
reactive bromine chemistry in the troposphere, Atmos. Chem. Phys., 4, 2481–2497, 2004,http://www.atmos-chem-phys.net/4/2481/2004/. 4341, 4343
Wagenbach, D., Ducroz, F., Mulvaney, R., Keck, L., Minikin, A., Legrand, M., Hall, J. S., and20
Wolff, E. W.: Sea-salt aerosol in coastal Antarctic regions, J. Geophys. Res., 103, 10 961–10 974, 1998. 4318, 4344
Wagner, T.: Observations of Atmospheric Halogen Species, Ph.D. thesis, Univ. of Heidelberg,1999. 4309
Wagner, T. and Platt, U.: Satellite mapping of enhanced BrO concentrations in the troposphere,25
Nature, 395, 486–490, 1998a. 4290, 4291, 4295, 4303, 4308, 4309, 4327, 4381Wagner, T. and Platt, U.: Mapping of tropospheric BrO by GOME, Earth Observation Quarterly,
ESA, March, 1998b. 4309Wagner, T., Pfeilsticker, K., and Platt, U.: GOME global BrO observations, validation with
ground based and balloon measurements, in: Proceedings of the fourth European sympo-30
sium, 22–26 September 1997, Schliersee, Germany, Air Pollution Report 66, pp. 397–400,1998a. 4308
Wagner, T., Pfeilsticker, K., and Platt, U.: GOME observations of enhanced tropospheric BrO
4377

ACPD7, 4285–4403, 2007
Halogens and polarboundary-layerozone depletion
W. R. Simpson et al.
Title Page
Abstract Introduction
Conclusions References
Tables Figures
J I
J I
Back Close
Full Screen / Esc
Printer-friendly Version
Interactive Discussion
EGU
concentrations in the polar spring, in: Proceedings of the fourth European symposium, 22–26 September 1997, Schliersee, Germany, Air Pollution Report 66, pp. 401–404, 1998b.4309
Wagner, T., Leue, C., Wenig, M., Pfeilsticker, K., and Platt, U.: Spatial and temporal distributionof enhanced boundary layer BrO concentrations measured by the GOME instrument aboard5
ERS-2, J. Geophys. Res., 106, 24 225–24 235, 2001. 4291, 4309, 4317, 4327, 4347, 4381Wagner, V., von Glasow, R., Fischer, H., and Crutzen, P. J.: Are CH2O Measurements in the
Marine Boundary Layer Suitable for Testing the Current Understanding of CH4 Photooxida-tion?, J. Geophys. Res., 107, 4029, doi:10.1029/2001JD000722, 2002. 4339
Watanabe, A., Nojiria, Y., and Kariyab, S.: Measurement on a commercial vessel of the ozone10
concentration in the marine boundary layer over the northern North Pacific Ocean, J. Geo-phys. Res., 110, D11 310, doi:10.1029/2004JD005514, 2005. 4342
Wayne, R. P., Poulet, G., Biggs, P., Burrows, J. P., Cox, R. A., Crutzen, P. J., Hayman, G. D.,Jenkin, M. E., le Bras, G., Moortgat, G. K., Platt, U., and Schindler, R. N.: Halogen oxides:Radicals, sources and reservoirs in the laboratory and in the atmosphere, Atmos. Environ.,15
29, 2677–2884, 1995. 4296Wennberg, P.: Bromine explosion, Nature, 397, 299–301, 1999. 4298, 4299Wessel, S., Aoki, S., Winkler, P., Weller, R., Herber, A., Gernandt, H., and Schrems, O.: Tro-
pospheric ozone depletion in polar regions. A comparison of observations in the Arctic andAntarctic, Tellus, 50B, 34–50, 1998. 4289, 4295, 434020
Wever, R., Tromp, M. G. M., Kronn, B. E., Marjani, A., and van Tol, M.: Brominating activity ofthe seaweed Ascophyllum nodosum: Impact on the Biosphere, Environ. Sci. Technol., 25,446–449, 1991. 4331
Wingenter, O., Sive, B. C., Blake, D. R., Rowland, F. S., and Ridley, B. A.: Unexplained en-hancements of CH3Br in Artic and sub-Arctic lower tyroposphere during TOPSE spring 2000,25
Geophys. Res. Lett., 30, 2160, doi:10.1029/2003GL018159, 2003. 4333Wittrock, F., Muller, R., Richter, A., H. Bovensmann, H., and Burrows, J. P.: Measurements of
Iodine monoxide (IO) above Spitsbergen, Geophys. Res. Lett., 27, 1471–1474, 2000. 4303,4314
Wolff, E. W.: Understanding the past - climate history from Antarctica, Antarct. Sci., 17, 487–30
495, 2005. 4344Wolff, E. W., Rankin, A. M., and Roethlisberger, R.: An ice core indicator of Antarctic sea ice
production?, Geophys. Res. Lett., 30, 2158–2161, 2003. 4295, 4318, 4344
4378

ACPD7, 4285–4403, 2007
Halogens and polarboundary-layerozone depletion
W. R. Simpson et al.
Title Page
Abstract Introduction
Conclusions References
Tables Figures
J I
J I
Back Close
Full Screen / Esc
Printer-friendly Version
Interactive Discussion
EGU
Wolff, E. W., Fischer, H., Fundel, F., Ruth, U., Twarloh, B., Littot, G. C., Mulvaney, R., Rothlis-berger, R., de Angelis, M., Boutron, C. F., Hansson, M., Jonsell, U., Hutterli, M. A., Bigler, M.,Lambeck, K., Kaufmann, P., Stauffer, B., Stocker, T. F., Steffensen, J. P., Siggaard-Andersen,M. L., Udisti, R., Becagli, S., Castellano, E., Severi, M., Wagenbach, D., Barbante, C.,Gabrielli, P., and Gaspari, V.: Southern Ocean sea-ice extent, productivity and iron flux over5
the past eight glacial cycles, Nature, 440, 491–496, 2006. 4344Yang, J., Honrath, R. E., Peterson, M. C., Dibb, J. E., Sumner, A. L., Shepson, P. B., Frey, M.,
Jacobi, H. W., Swanson, A., and Blake, N.: Impacts of snowpack emissions on deducedlevels of OH and peroxy radicals at Summit, Greenland, Atmos. Environ., 36, 2523–2534,2002. 433310
Yang, X., Cox, R. A., Warwick, N. J., Pyle, J. A., Carver, G. D., O’Connor, F. M., and Savage,N. H.: Tropospheric bromine chemistry and its impacts on ozone, J. Geophys. Res., 110,D23 311, doi:10.1029/2005JD006244, 2005. 4291, 4341
Yokouchi, Y., Akimoto, H., Barrie, L. A., Bottenheim, J. W., Anlauf, K., and Jobson, B. T.: Se-rial Gas-Chromatographic Mass-Spectrometric Measurements Of Some Volatile Organic-15
Compounds In The Arctic Atmosphere During The 1992 Polar Sunrise Experiment, J. Geo-phys. Res., 99, 25 379–25 389, 1994. 4294, 4337
Yokouchi, Y., Barrie, L. A., Toom, D., and Akimoto, H.: The seasonal variation of selected naturaland anthropogenic halocarbons in the Arctic troposphere, Atmos. Environ., 30, 1723–1727,1996. 4294, 433220
Yokouchi, Y., Ikeda, M., Inuzuka, Y., and Yukawa, T.: Strong emissions of methyl chloride fromtropical plants, Nature, 416, 163–165, 2002. 4339
Yung, Y. L., Pinto, J. P., Watson, R. T., and Sander, P.: Atmospheric bromine and ozone pertur-bations in the lower stratosphere, J. Atmos. Sci., 37, 339–353, 1980. 4289
Zeng, T., Wang, Y., Chance, K., Browell, E. V., Ridley, B. A., and Atlas, E. L.: Widespread25
persistent near-surface ozone depletion at northern high latitudes in spring, Geophys. Res.Lett., 30, 2298, doi:10.1029/2003GL018587, 2003. 4290, 4304, 4323, 4326, 4327, 4381
Zeng, T., Wang, Y., Chance, K., Blake, N., Blake, D., and Ridley, B.: Halogen-driven low-altitude O3 and hydrocarbon losses in spring at northern high latitudes, J. Geophys. Res.,111, D17 313, doi:10.029/2005JD006706, 2006. 438130
Zhou, X., Beine, H. J., Honrath, R. E., Fuentes, J. D., Simpson, W., Shepson, P. B., andBottenheim, J. W.: Snowpack Photochemical production of HONO: A Major Source of OH inthe Arctic Boundary Layer in Springtime, Geophys. Res. Lett., 28, 4087–4090, 2001. 4330
4379

ACPD7, 4285–4403, 2007
Halogens and polarboundary-layerozone depletion
W. R. Simpson et al.
Title Page
Abstract Introduction
Conclusions References
Tables Figures
J I
J I
Back Close
Full Screen / Esc
Printer-friendly Version
Interactive Discussion
EGU
Table 1. Major field campaigns related to ODEs in the Arctic and Antarctic. The following areacronyms in the table: Arctic Gas and Aerosol Sampling Program (AGASP), Polar Sunrise Ex-periment (PSE), Tropospheric Ozone Production during the Spring Equinox (TOPSE), NItrogenCycle and Effects on the oxidation of atmospheric trace species at high latitudes (NICE), OutOn The Ice (OOTI), Chemistry of the Antarctic Boundary Layer and the Interface with Snow(CHABLIS). ARCTOC was an ozone depletion campaign in Ny-Alesund, and LEADX involvedexperiments at an open lead near Barrow. Some campaigns do not yet have an overview paperand thus do not have a reference.
Campaign Location year Reference
AGASP-II Arctic Ocean 1986 Mickle et al. (1989)PSE 88 Alert, Canada 1988 Bottenheim et al. (1990)
AGASP-III Barrow, Alaska 1989 Sturges and Shaw (1993)PSE 92 Alert, Canada 1992 Barrie et al. (1994)
AGASP-IV Arctic Ocean 1992 Davidson and Schnell (1993)PSE 94 Alert, Canada 1994 Hopper et al. (1998)
ARCTOC Ny-Alesund, Svalbard 1995, 1996 Platt and Lehrer (1996); Barrie and Platt (1997)PSE 98 Alert, Canada 1998
ALERT2000 Alert, Canada 2000 Bottenheim et al. (2002)TOPSE North American Arctic 2000 Atlas et al. (2003)NICE Ny-Alesund, Svalbard 2001 Beine et al. (2003)OOTI Alert, Canada 2004, 2005 Morin et al. (2005)
LEADX Barrow, Alaska 2004, 2005CHABLIS Halley, Antarctica 2004 Jones et al. (2007)5
5Jones, A. E., W., W. E., Salmon, R. A., and Bauguitte, S. J.-B.: Chemistry of the AntarcticBoundary Layer and the Interface with Snow: An overview of the CHABLIS campaign, Atmos.Chem. Phys. Discuss., in preparation, 2007.
4380

ACPD7, 4285–4403, 2007
Halogens and polarboundary-layerozone depletion
W. R. Simpson et al.
Title Page
Abstract Introduction
Conclusions References
Tables Figures
J I
J I
Back Close
Full Screen / Esc
Printer-friendly Version
Interactive Discussion
EGU
Table 2. Satellite measurements of BrO.
Instrument Hemisphere Time period (MM.YYYY) Reference
GOME SH Sep 1996 Wagner and Platt (1998a)GOME NH Feb 1997–July 1997 Richter et al. (1998c)GOME NH April 1997, May 1997 Chance (1998)GOME NH April 1997 Burrows et al. (1999)GOME NH + SH Jan 1997–Dec 1997 Wagner et al. (2001)GOME NH + SH July 1999–June 2000 Richter et al. (2002)GOME NH March 2000–April 2000 Zeng et al. (2003)GOME NH + SH Feb 1996–Oct 2001 Hollwedel et al. (2004)GOME SH Aug 1999, Sep 1999, Aug 2000, Sep 2000 Frieß et al. (2004)GOME NH + SH Aug 1997, March 2001 Kaleschke et al. (2004)
SCIAMACHY NH March 2003 Jacobi et al. (2006)GOME NH Feb 2000–May 2000 Zeng et al. (2006)
4381

ACPD7, 4285–4403, 2007
Halogens and polarboundary-layerozone depletion
W. R. Simpson et al.
Title Page
Abstract Introduction
Conclusions References
Tables Figures
J I
J I
Back Close
Full Screen / Esc
Printer-friendly Version
Interactive Discussion
EGU
Table 3. Some literature calculations of radiative forcing (mostly longwave) by troposphericozone, linearly interpolated or extrapolated to a change of +3 DU. Most papers report radiativeforcing rather than the change in surface temperature, and we have used a climate sensitivity of2.5 W m−2 K−1 to relate them. Although the model comparison by Gauss et al. (2003) examinesresults from 11 different CTMs, the ozone change from each is fed into the radiative model ofBerntsen and Isaksen (1997), so does not produce independent calculations for a given ozonechange.
Citation Model type Height of O3 change location Forcing (W m−2) Change in surface T
Lacis et al. (1990) rad.-convect tropopause mid-latitudes 0.14 0.055 KBerntsen and Isaksen (1997) radiative mixed 30◦ S annual 0.10 ∼0.04 KBrasseur et al. (1998) CTM mixed SH winter 0.14 ∼0.06 KKiehl (1999) radiative mixed 0.11 ∼0.04 KMickley et al. (2001) GCM mixed global annual 0.09 ∼0.04 K
4382
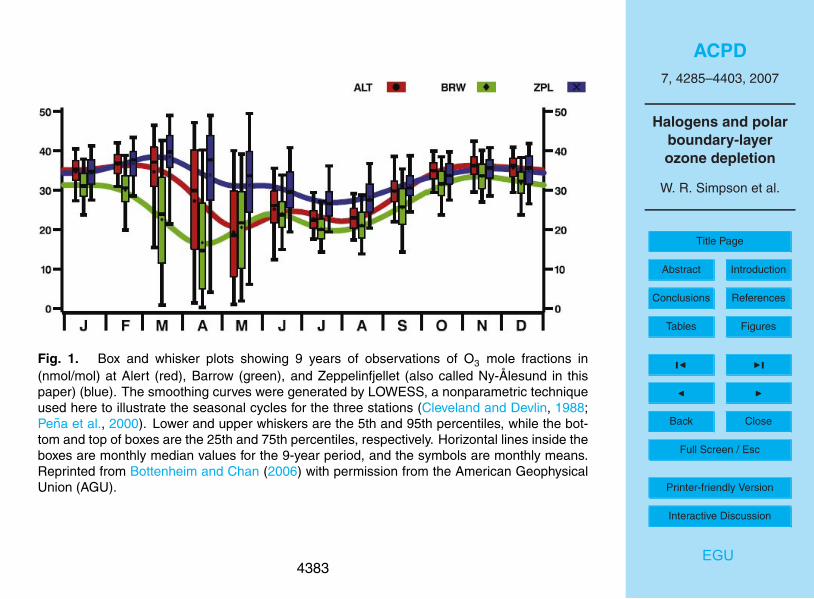
ACPD7, 4285–4403, 2007
Halogens and polarboundary-layerozone depletion
W. R. Simpson et al.
Title Page
Abstract Introduction
Conclusions References
Tables Figures
J I
J I
Back Close
Full Screen / Esc
Printer-friendly Version
Interactive Discussion
EGU
Fig. 1. Box and whisker plots showing 9 years of observations of O3 mole fractions in(nmol/mol) at Alert (red), Barrow (green), and Zeppelinfjellet (also called Ny-Alesund in thispaper) (blue). The smoothing curves were generated by LOWESS, a nonparametric techniqueused here to illustrate the seasonal cycles for the three stations (Cleveland and Devlin, 1988;Pena et al., 2000). Lower and upper whiskers are the 5th and 95th percentiles, while the bot-tom and top of boxes are the 25th and 75th percentiles, respectively. Horizontal lines inside theboxes are monthly median values for the 9-year period, and the symbols are monthly means.Reprinted from Bottenheim and Chan (2006) with permission from the American GeophysicalUnion (AGU).
4383

ACPD7, 4285–4403, 2007
Halogens and polarboundary-layerozone depletion
W. R. Simpson et al.
Title Page
Abstract Introduction
Conclusions References
Tables Figures
J I
J I
Back Close
Full Screen / Esc
Printer-friendly Version
Interactive Discussion
EGU
Ozone (nmol/mol) and f-Br (µg/m3 )
Fig. 2. The first published observation of the anticorrelation between ozone and filterablebromine. Filled squares show filterable Br (f-Br) in ng/m3, from 24 h filter pack, open squaresshow daily averaged ozone in nmol/mol (ppbV). Reprinted by permission from Macmillan Pub-lishers LTD: Nature, Barrie et al. (1988), copyright 1988.
4384

ACPD7, 4285–4403, 2007
Halogens and polarboundary-layerozone depletion
W. R. Simpson et al.
Title Page
Abstract Introduction
Conclusions References
Tables Figures
J I
J I
Back Close
Full Screen / Esc
Printer-friendly Version
Interactive Discussion
EGU
Fig. 3. Key reactions for the XO self reaction ozone destruction reaction cycle.
4385

ACPD7, 4285–4403, 2007
Halogens and polarboundary-layerozone depletion
W. R. Simpson et al.
Title Page
Abstract Introduction
Conclusions References
Tables Figures
J I
J I
Back Close
Full Screen / Esc
Printer-friendly Version
Interactive Discussion
EGU
Fig. 4. A simplified set of bromine explosion reactions. The blue area at the bottom is meantto represent the condensed phase (liquid brine or ice surface). Figure prepared by R. Sander.
4386
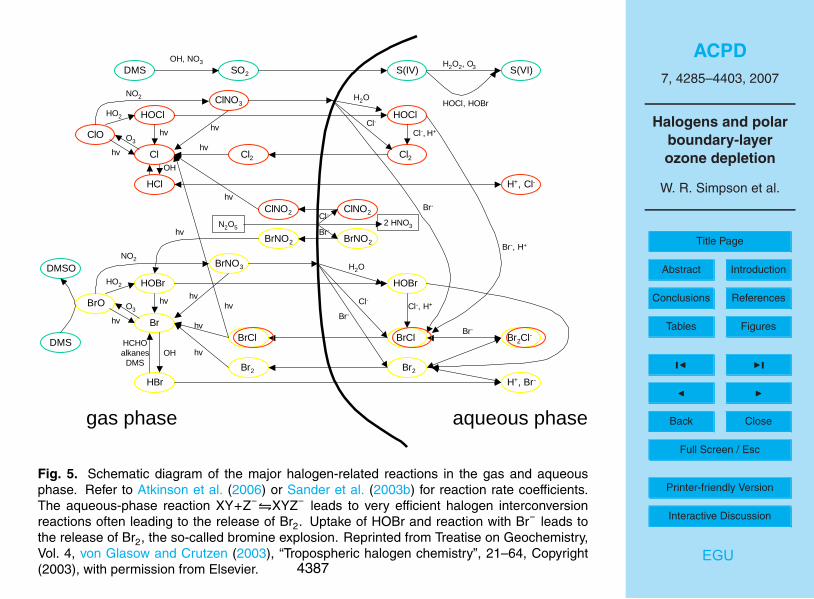
ACPD7, 4285–4403, 2007
Halogens and polarboundary-layerozone depletion
W. R. Simpson et al.
Title Page
Abstract Introduction
Conclusions References
Tables Figures
J I
J I
Back Close
Full Screen / Esc
Printer-friendly Version
Interactive Discussion
EGU
ClO
S(VI)S(IV)SO2DMS
Cl
ClNO2 ClNO2
HOCl
ClNO3
H+, Cl-
Cl2
HOCl
HCl
BrCl
BrO
HOBr
Br
HBr H+, Br-
Br2Cl-
Br2
BrCl
HOBr
BrNO3
BrNO2BrNO2
Br2
Cl2
gas phase aqueous phase
hv
hv
hvhv
hv
hv
hv
hv
hv
hv
hv
O3
NO2
OH
OH
NO2
HO2
HO2
O3
Br-
Br-
Br-
Cl-, H+
Cl-, H+Cl-
Cl-
HCHOalkanes
DMS
H2O
H2O
Br-, H+
OH, NO3 H2O2, O3
DMS
DMSO
HOCl, HOBr
N2O52 HNO3
Cl-
Br-hv
Fig. 5. Schematic diagram of the major halogen-related reactions in the gas and aqueousphase. Refer to Atkinson et al. (2006) or Sander et al. (2003b) for reaction rate coefficients.The aqueous-phase reaction XY+Z−�XYZ− leads to very efficient halogen interconversionreactions often leading to the release of Br2. Uptake of HOBr and reaction with Br− leads tothe release of Br2, the so-called bromine explosion. Reprinted from Treatise on Geochemistry,Vol. 4, von Glasow and Crutzen (2003), “Tropospheric halogen chemistry”, 21–64, Copyright(2003), with permission from Elsevier. 4387

ACPD7, 4285–4403, 2007
Halogens and polarboundary-layerozone depletion
W. R. Simpson et al.
Title Page
Abstract Introduction
Conclusions References
Tables Figures
J I
J I
Back Close
Full Screen / Esc
Printer-friendly Version
Interactive Discussion
EGU
Fig. 6. Comparison of in situ ozone, filterable bromine (f-Br), and BrO. Reprinted from Haus-mann and Platt (1994) with permission from the American Geophysical Union (AGU).
4388

ACPD7, 4285–4403, 2007
Halogens and polarboundary-layerozone depletion
W. R. Simpson et al.
Title Page
Abstract Introduction
Conclusions References
Tables Figures
J I
J I
Back Close
Full Screen / Esc
Printer-friendly Version
Interactive Discussion
EGU
Fig. 7. Observations of enhanced BrO from 30 August to 15 September 1999. The stackedplots show the BrO differential slant column density (dSCD), duration of sea ice contact (shownin colors on the altitude – time plot), light path enhancement factor (a measurement of thelight scattering in the atmosphere), and surface ozone mixing ratio. Reprinted from Frieß et al.(2004) with permission from the American Geophysical Union (AGU).
4389

ACPD7, 4285–4403, 2007
Halogens and polarboundary-layerozone depletion
W. R. Simpson et al.
Title Page
Abstract Introduction
Conclusions References
Tables Figures
J I
J I
Back Close
Full Screen / Esc
Printer-friendly Version
Interactive Discussion
EGU
Fig. 8. Time series of O3, Br2, BrCl, and global irradiance at Alert for 10–11 March 2000 (notethat the global irradiance results have not been adjusted for a negative offset). Reprinted fromSpicer et al. (2002), copyright 2002, with permission from Elsevier.
4390

ACPD7, 4285–4403, 2007
Halogens and polarboundary-layerozone depletion
W. R. Simpson et al.
Title Page
Abstract Introduction
Conclusions References
Tables Figures
J I
J I
Back Close
Full Screen / Esc
Printer-friendly Version
Interactive Discussion
EGU
Fig. 9. Vertical columns for BrO for both hemispheres in spring. Data from SCIAMACHY,courtesy of A. Richter.
4391
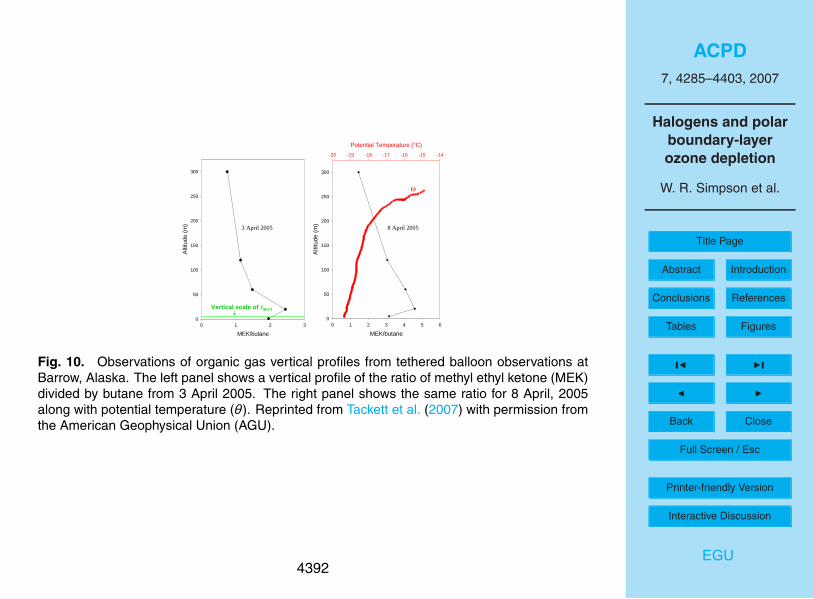
ACPD7, 4285–4403, 2007
Halogens and polarboundary-layerozone depletion
W. R. Simpson et al.
Title Page
Abstract Introduction
Conclusions References
Tables Figures
J I
J I
Back Close
Full Screen / Esc
Printer-friendly Version
Interactive Discussion
EGU
MEK/butane0 1 2 3
Alti
tude
(m)
0
50
100
150
200
250
300
3 April 2005
8 April 2005
MEK/butane0 1 2 3 4 5 6
Alti
tude
(m)
0
50
100
150
200
250
300
Potential Temperature (°C)-20 -19 -18 -17 -16 -15 -14
8 April 2005
Θ
Vertical scale of τBrCl
Fig. 10. Observations of organic gas vertical profiles from tethered balloon observations atBarrow, Alaska. The left panel shows a vertical profile of the ratio of methyl ethyl ketone (MEK)divided by butane from 3 April 2005. The right panel shows the same ratio for 8 April, 2005along with potential temperature (θ). Reprinted from Tackett et al. (2007) with permission fromthe American Geophysical Union (AGU).
4392

ACPD7, 4285–4403, 2007
Halogens and polarboundary-layerozone depletion
W. R. Simpson et al.
Title Page
Abstract Introduction
Conclusions References
Tables Figures
J I
J I
Back Close
Full Screen / Esc
Printer-friendly Version
Interactive Discussion
EGU
Fig. 11. Upper panel: Diurnal variation of the IO slant column density observed at NeumayerStation, Antarctica by zenith sky DOAS in spring 1999. Left-hand axis: inferred IO differentialslant column density with unknown offset; Right-hand axis: absolute IO slant column densityunder the assumption that photochemistry leads to a complete removal of IO from the atmo-sphere at a solar zenith angles above 95◦. Lower Panel: RMS residual of the spectral retrievalon 27 October. Adapted from Frieß et al. (2001) with permission from the American Geophysi-cal Union (AGU).
4393

ACPD7, 4285–4403, 2007
Halogens and polarboundary-layerozone depletion
W. R. Simpson et al.
Title Page
Abstract Introduction
Conclusions References
Tables Figures
J I
J I
Back Close
Full Screen / Esc
Printer-friendly Version
Interactive Discussion
EGU
Fig. 12. A photograph of frost flowers growing on newly forming sea ice. The width of thefigure is 12 cm. Courtesy of T. A. Douglas.
4394

ACPD7, 4285–4403, 2007
Halogens and polarboundary-layerozone depletion
W. R. Simpson et al.
Title Page
Abstract Introduction
Conclusions References
Tables Figures
J I
J I
Back Close
Full Screen / Esc
Printer-friendly Version
Interactive Discussion
EGU
Fig. 13. Properties of sea ice as a function of temperature. Panel (a) shows molalities forspecific ions in the residual brine. Precipitation temperatures of various salt hydrates are shownon the top of the plot. Panel (b) shows total ion molality and ionic strength of the un-frozenbrine as a function of temperature. Reprinted from Koop et al. (2000) with permission from theAmerican Geophysical Union (AGU).
4395

ACPD7, 4285–4403, 2007
Halogens and polarboundary-layerozone depletion
W. R. Simpson et al.
Title Page
Abstract Introduction
Conclusions References
Tables Figures
J I
J I
Back Close
Full Screen / Esc
Printer-friendly Version
Interactive Discussion
EGU
Fig. 14. Illustration of the main three processes suspected of supplying sea salt ions to marinesnow: wind-transport of sea spray, upward migration from sea ice, and wind-blown frost flowers.Reprinted from Domine et al. (2004) with the permission of the authors.
4396

ACPD7, 4285–4403, 2007
Halogens and polarboundary-layerozone depletion
W. R. Simpson et al.
Title Page
Abstract Introduction
Conclusions References
Tables Figures
J I
J I
Back Close
Full Screen / Esc
Printer-friendly Version
Interactive Discussion
EGU
Fig. 15. The spatial match between potential frost flowers (PFF), shown by stars and regionsof enhanced BrO (shown in red isocontours). Reprinted from Kaleschke et al. (2004) withpermission from the American Geophysical Union (AGU).
4397

ACPD7, 4285–4403, 2007
Halogens and polarboundary-layerozone depletion
W. R. Simpson et al.
Title Page
Abstract Introduction
Conclusions References
Tables Figures
J I
J I
Back Close
Full Screen / Esc
Printer-friendly Version
Interactive Discussion
EGU
2 0 : 3 0 2 0 : 3 9 2 0 : 4 8 2 0 : 5 70
1 02 03 04 0
02468
1 01 21 4
012345
0 3 : 4 5 0 3 : 5 4 0 4 : 0 3 0 4 : 1 201 02 03 04 0
- 2 0- 1 5- 1 0- 5009 01 8 02 7 03 6 0
T e m p e r a t u r e s 0 . 5 m a g l 2 . 5 m a g l s n o w
����
�����
����
t i m e , U T C , A p r i l 2 2 , 2 0 0 4
O O T I o z o n e
w i n d s p e e d��
������
�����
����� w i n d d i r e c t i o n
H 2 O� ��
����
�������
t i m e , U T C , A p r i l 2 3 , 2 0 0 4
O O T I o z o n e
����
�����
���� ��
�����
������
�� T e m p e r a t u r e s
0 . 5 m a g l 2 . 5 m a g l s n o w
H 2 O
w i n d d i r e c t i o n �����
������
������
�
w i n d s p e e d
Fig. 16. Close-up on the onset and end of the wind episode over the Arctic Ocean thatrecovered normal ozone levels. From OOTI 2004 measurements. Reprinted from Morin et al.(2005) with permission from the American Geophysical Union (AGU).
4398

ACPD7, 4285–4403, 2007
Halogens and polarboundary-layerozone depletion
W. R. Simpson et al.
Title Page
Abstract Introduction
Conclusions References
Tables Figures
J I
J I
Back Close
Full Screen / Esc
Printer-friendly Version
Interactive Discussion
EGU
Fig. 17. Organoiodines observed at Hudson Bay, Canada during 5–10 March 2004. Shownare the mixing ratios of CH2I2 (red), CH2IBr (green), CH2ICl (blue), net solar radiation (pink)and wind direction (black). Adapted from Carpenter et al. (2005a), reproduced with permissionfrom Environmental Science and Technology 2005, 39, 8812–8816. Copyright 2005 AmericanChemical Society.
4399

ACPD7, 4285–4403, 2007
Halogens and polarboundary-layerozone depletion
W. R. Simpson et al.
Title Page
Abstract Introduction
Conclusions References
Tables Figures
J I
J I
Back Close
Full Screen / Esc
Printer-friendly Version
Interactive Discussion
EGU
Date 1995
Jan Feb Mar Apr May Jun Jul Aug Sep Oct Nov Dec Jan
Ozo
ne (p
.p.b
)
0
10
20
30
40
50
60
Ozone
TGM
(ng
m-3
)
1
2
3
TGM
Tem
pera
ture
(o C)
-40
-30
-20
-10
0
10
Air temperature(daily)
ozone0 10 20 30 40 50
TGM
0
1
2
3
y= 0.04x + 0.38
R2=0.8
Fig. 18. Time series of air temperature, total gaseous mercury (TGM), and ozone concentra-tions at Alert, Canada, in 1995. The inset shows concentrations of TGM versus ozone at Alertfor the period from 9 April 1995 to 29 May 1995. Note that R2=0.8 for the correlation betweenTGM and ozone concentrations during this period. From Alexandra Steffen based upon dataof Schroeder et al. (1998). Reprinted by permission from Macmillan Publishers LTD: Nature,copyright 1998.
4400

ACPD7, 4285–4403, 2007
Halogens and polarboundary-layerozone depletion
W. R. Simpson et al.
Title Page
Abstract Introduction
Conclusions References
Tables Figures
J I
J I
Back Close
Full Screen / Esc
Printer-friendly Version
Interactive Discussion
EGU
Fig. 19. Observed ratios of hydrocarbons during normal and low ozone condition. Reprintedfrom Jobson et al. (1994) with permission from the American Geophysical Union (AGU).
4401

ACPD7, 4285–4403, 2007
Halogens and polarboundary-layerozone depletion
W. R. Simpson et al.
Title Page
Abstract Introduction
Conclusions References
Tables Figures
J I
J I
Back Close
Full Screen / Esc
Printer-friendly Version
Interactive Discussion
EGU
500
400
300
200
100
0
HC
HO
, ppt
50403020100
Ozone, ppb
1400
1200
1000
800
600
400
200
0[B
r] / [Cl]
1998 Data2000 Data
Calculated Steady State HCHO
SmoothedFit
[Br] / [Cl]
Fig. 20. Formaldehyde measurements and modeling during partial ODEs. Reprinted fromSumner et al. (2002), copyright 2002, with permission from Elsevier.
4402

ACPD7, 4285–4403, 2007
Halogens and polarboundary-layerozone depletion
W. R. Simpson et al.
Title Page
Abstract Introduction
Conclusions References
Tables Figures
J I
J I
Back Close
Full Screen / Esc
Printer-friendly Version
Interactive Discussion
EGU
Fig. 21. (a) Northern Hemisphere September ice extent for a model (black), that model five-year running mean (blue), and the observed five-year running mean (red). The range from theensemble members is in dark grey. Light grey indicates the abrupt event. (b) The model (black)and observed (red) 1990s averaged September ice edge (50% concentration) and model con-ditions averaged over 2010–2019 (blue) and 2040–2049 (green). The arctic region used in thisanalysis is in grey. Reprinted from Holland et al. (2006) with permission from the AmericanGeophysical Union (AGU).
4403
Related Documents