ASIAN INSIGHTS VICKERS SECURITIES sa- CW BUY (Upgrade from HOLD) Last Traded Price ( 7 Jun 2017):HK$21.00 (HSI : 25,974) Price Target 12-mth: HK$24.31 (16% upside) (Prev HK$18.01) Analyst Eric YEE, CFA +86 21 6888 3360 [email protected] Mavis HUI +852 2863 8879 [email protected] What’s New • Channel checks reveal that Haier Electronics is exploring to unlock value of its fast-growing logistics unit • More corporate exercises could potentially take place to ultimately seal a separate listing, in our view • Upgrade Haier Electronics from HOLD to BUY, with new TP of HKD 24.31 as we value Goodaymart Logistics separately at 30x PE to align with logistics peers. Price Relative Forecasts and Valuation FY Dec (RMB m) 2015A 2016A 2017F 2018F Turnover 62,826 63,855 71,040 77,836 EBITDA 3,398 3,767 4,324 4,838 Pre-tax Profit 3,344 3,494 4,124 4,602 Net Profit 2,703 2,786 3,233 3,585 Net Profit Gth (Pre-ex) (%) 10.5 3.1 16.0 10.9 EPS (RMB) 0.98 1.00 1.16 1.29 EPS (HK$) 1.13 1.15 1.34 1.48 EPS Gth (%) 6.4 2.1 16.0 10.9 Diluted EPS (HK$) 1.09 1.12 1.30 1.45 DPS (HK$) 0.12 0.18 0.20 0.30 BV Per Share (HK$) 6.19 7.25 9.51 11.28 PE (X) 18.6 18.2 15.7 14.2 P/Cash Flow (X) 19.9 14.1 14.7 13.5 P/Free CF (X) 32.7 21.1 22.5 19.8 EV/EBITDA (X) 12.1 10.4 8.7 7.2 Net Div Yield (%) 0.6 0.8 1.0 1.4 P/Book Value (X) 3.4 2.9 2.2 1.9 Net Debt/Equity (X) CASH CASH CASH CASH ROAE (%) 20.5 17.2 15.9 14.3 Earnings Rev (%): NIl Nil Consensus EPS (RMB) 1.15 1.29 Other Broker Recs: B: 10 S: 0 H: 3 Source of all data on this page: Company, DBSV, Thomson Reuters, HKEx Unlocking value of Goodaymart Logistics Mulling separate listing. We noticed from various channels about Haier Electronic’s intention to unlock the value of its high-growth logistics unit (Goodaymart Logistics). With separate listing as the ultimate goal, management is currently working on 1) optimizing the shareholding structure, and 2) expanding the proportion of external revenue to dilute sales contribution from Haier Group and Alibaba in order to meet necessary requirements. Considering management’s steady execution on the above, and our positive view on the Goodaymart Logistics’s growth trajectory being the market leader in China’s large-format logistics industry, we now appraise the business separately using SOTP valuation, and lift our TP to HKD24.31. Upgrade to BUY. Where we differ? Separate valuation of logistics unit. While rapid growth of the logistics business is well-expected (especially for the e-commerce logistics segment), we are amongst the first to perform deep dive study into the business prospect of the unit, taking into account the industry landscape, key milestones of the business, opportunities abound, as well as the execution progress of the value-unlocking exercise. We estimate that, in the event of a separate listing, the value of Goodaymart Logistics attributable to Haier Electronics could be HKD 3.42. Potential catalysts. We expect more corporate exercises could be possible during the interim. These could include capital injections from new strategic investors, more acquisitions of relevant logistics businesses that could complete its network and service offerings, etc. Valuation: We upgrade Haier Electronics from HOLD to BUY with new TP of HKD 24.31, as we value the logistics business separately at 30x FY18 PE to factor in the value-unlocking scenario, and the white goods business (incl. the related channel services business) at 12x FY18 PE. (Previous: pegged at 14x FY17 PE for the entire group.) Key Risks to Our View: Regulatory blockade of separate listing, possibly due to concerns on shareholding structure, connected transactions, etc. At A Glance Issued Capital (m shrs) 2,793 Mkt. Cap (HK$m/US$m) 58,654 / 7,526 Major Shareholders Haier Group Corporation (%) 56.0 HCH (HK) Inv. Mgmt. Co. Ltd (%) 12.1 Free Float (%) 32.0 3m Avg. Daily Val. (US$m) 13.4 ICB Industry : Consumer Goods / Household Goods 83 103 123 143 163 183 203 9.8 11.8 13.8 15.8 17.8 19.8 21.8 23.8 25.8 27.8 Jun-13 Jun-14 Jun-15 Jun-16 Jun-17 Relative Index HK$ Haier Electronics (LHS) Relative HSI (RHS) DBS Group Research . Equity 7 Jun 2017 China / Hong Kong Company Guide Haier Electronics Version 8 | Bloomberg: 1169 HK Equity | Reuters: 1169.HK Refer to important disclosures at the end of this report

Welcome message from author
This document is posted to help you gain knowledge. Please leave a comment to let me know what you think about it! Share it to your friends and learn new things together.
Transcript
ASIAN INSIGHTS VICKERS SECURITIESsa- CW
BUY (Upgrade from HOLD)
Last Traded Price ( 7 Jun 2017):HK$21.00 (HSI : 25,974) Price Target 12-mth: HK$24.31 (16% upside) (Prev HK$18.01) Analyst Eric YEE, CFA +86 21 6888 3360 [email protected] Mavis HUI +852 2863 8879 [email protected]
What’s New • Channel checks reveal that Haier Electronics is exploring
to unlock value of its fast-growing logistics unit • More corporate exercises could potentially take place to
ultimately seal a separate listing, in our view • Upgrade Haier Electronics from HOLD to BUY, with new
TP of HKD 24.31 as we value Goodaymart Logistics separately at 30x PE to align with logistics peers.
Price Relative
Forecasts and Valuation FY Dec (RMB m) 2015A 2016A 2017F 2018FTurnover 62,826 63,855 71,040 77,836 EBITDA 3,398 3,767 4,324 4,838 Pre-tax Profit 3,344 3,494 4,124 4,602 Net Profit 2,703 2,786 3,233 3,585 Net Profit Gth (Pre-ex) (%) 10.5 3.1 16.0 10.9 EPS (RMB) 0.98 1.00 1.16 1.29 EPS (HK$) 1.13 1.15 1.34 1.48 EPS Gth (%) 6.4 2.1 16.0 10.9 Diluted EPS (HK$) 1.09 1.12 1.30 1.45 DPS (HK$) 0.12 0.18 0.20 0.30 BV Per Share (HK$) 6.19 7.25 9.51 11.28 PE (X) 18.6 18.2 15.7 14.2 P/Cash Flow (X) 19.9 14.1 14.7 13.5 P/Free CF (X) 32.7 21.1 22.5 19.8 EV/EBITDA (X) 12.1 10.4 8.7 7.2 Net Div Yield (%) 0.6 0.8 1.0 1.4 P/Book Value (X) 3.4 2.9 2.2 1.9 Net Debt/Equity (X) CASH CASH CASH CASH ROAE (%) 20.5 17.2 15.9 14.3
Earnings Rev (%): NIl Nil Consensus EPS (RMB) 1.15 1.29 Other Broker Recs: B: 10 S: 0 H: 3
Source of all data on this page: Company, DBSV, Thomson Reuters, HKEx
Unlocking value of Goodaymart Logistics Mulling separate listing. We noticed from various channels about Haier Electronic’s intention to unlock the value of its high-growth logistics unit (Goodaymart Logistics). With separate listing as the ultimate goal, management is currently working on 1) optimizing the shareholding structure, and 2) expanding the proportion of external revenue to dilute sales contribution from Haier Group and Alibaba in order to meet necessary requirements. Considering management’s steady execution on the above, and our positive view on the Goodaymart Logistics’s growth trajectory being the market leader in China’s large-format logistics industry, we now appraise the business separately using SOTP valuation, and lift our TP to HKD24.31. Upgrade to BUY. Where we differ? Separate valuation of logistics unit. While rapid growth of the logistics business is well-expected (especially for the e-commerce logistics segment), we are amongst the first to perform deep dive study into the business prospect of the unit, taking into account the industry landscape, key milestones of the business, opportunities abound, as well as the execution progress of the value-unlocking exercise. We estimate that, in the event of a separate listing, the value of Goodaymart Logistics attributable to Haier Electronics could be HKD 3.42. Potential catalysts. We expect more corporate exercises could be possible during the interim. These could include capital injections from new strategic investors, more acquisitions of relevant logistics businesses that could complete its network and service offerings, etc.
Valuation: We upgrade Haier Electronics from HOLD to BUY with new TP of HKD 24.31, as we value the logistics business separately at 30x FY18 PE to factor in the value-unlocking scenario, and the white goods business (incl. the related channel services business) at 12x FY18 PE. (Previous: pegged at 14x FY17 PE for the entire group.) Key Risks to Our View: Regulatory blockade of separate listing, possibly due to concerns on shareholding structure, connected transactions, etc.
At A Glance Issued Capital (m shrs) 2,793 Mkt. Cap (HK$m/US$m) 58,654 / 7,526
Major Shareholders Haier Group Corporation (%) 56.0 HCH (HK) Inv. Mgmt. Co. Ltd (%) 12.1
Free Float (%) 32.0 3m Avg. Daily Val. (US$m) 13.4 ICB Industry : Consumer Goods / Household Goods
83
103
123
143
163
183
203
9.8
11.8
13.8
15.8
17.8
19.8
21.8
23.8
25.8
27.8
Jun-13 Jun-14 Jun-15 Jun-16 Jun-17
Relative IndexHK$
Haier Electronics (LHS) Relative HSI (RHS)
DBS Group Research . Equity 7 Jun 2017
China / Hong Kong Company Guide
Haier Electronics Version 8 | Bloomberg: 1169 HK Equity | Reuters: 1169.HK Refer to important disclosures at the end of this report
ASIAN INSIGHTS VICKERS SECURITIES
Page 2
Company Guide
Haier Electronics
GOODAYMART LOGISTICS – A POTENTIAL SPIN-OFF
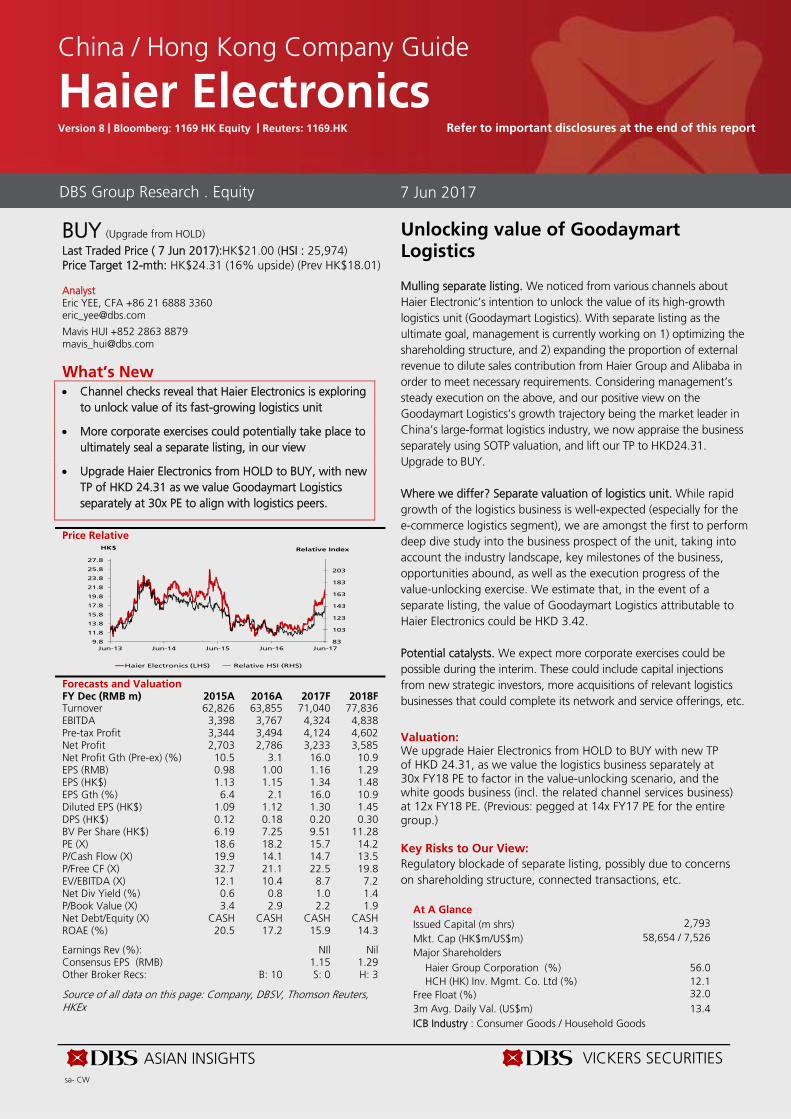
Value-unlocking exercise We noticed Haier Electronic’s intention to realize the value of its high-growth logistics unit (Goodaymart Logistics), with a series of corporate exercises, which include the separate reporting of logistics unit since 4Q16 (previously combined together with channel services division, known as ICS – Integrated Channel Services division) and CB conversion of Alibaba into holding a 34% equity stake. We understand that the final target is to have a separate listing of the logistics unit.
To reach the ultimate goals, the group would need to 1) optimize the shareholdings structure, and 2) expand the external revenue base to lower the percentage contribution from Haier Group and Alibaba in meeting listing requirements, in our view. As such, we are anticipating more interim corporate exercises, such as capital injections and additional acquisitions of relevant logistics business to complete its service offerings and dilute revenue attributable to contributions from Haier Group and Alibaba.
Potential value. In view of the potential spin-off, we try to estimate the market value of the logistics unit, and examine the inherent incremental value attached to the counter. Our assumptions are as follows:
(a) Listing in A-share market: Given more comparable peers, and higher valuation multiples (c. average PE of c. 30x) ascribed to the logistics names
(b) 20% revenue CAGR in FY16-18, coupled with steady PBT margin uplift to c.5%.
(c) Successful spin-off in about 1.5 years (i.e. by end-FY18).
We value the logistics business separately at 30x PE based on FY18 estimated earnings, and white goods business (incl. the related channel services business) at 12x PE. Adjusting for the group’s net cash, our SOTP valuation arrives at a new TP of HKD24.31. Upgrade the counter from HOLD to BUY.
Goodaymart Logistics’s value estimate
FY16A FY18F Re ma rks Revenue (Rmb m) 7,562 10,889 at 20% CAGR PBT margin 4.3% 5%PBT 325 544Tax rate 21% 21%Total Profit 257 430Net Profit 284 66% of ownershipPE multiples 30 A-share average Enterprise value 8,517No. of shares 2,793Value/ share (Rmb) 3.05Value/ share (HKD) 3.42
Source: DBS Vickers
Haier Electronics’s SOTP valuation
F Y18F netprof it
V aluat ionmult iple
EnterpriseV alue
(a) White goods business 3,301 12 39,613(incl. related channel serv ices)
(b) Goodaymart Logisticsunit
284 30 8,517
(c) Net cash (Dec 16) 12,486Total EV 60,616
No. of shares 2,793FV/ share (Rmb) 21.70
F V / share (HKD) 24.31
Business segment
Source: DBS Vickers
MORE ABOUT GOODAYMART LOGISTICS
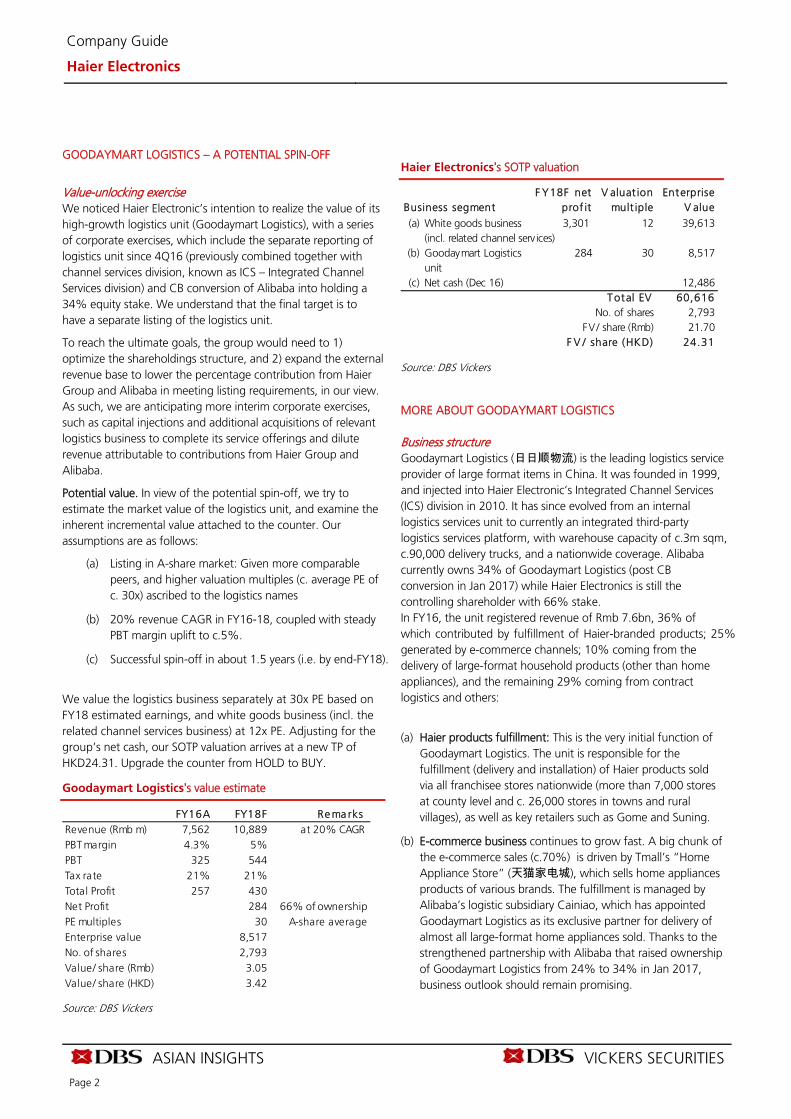
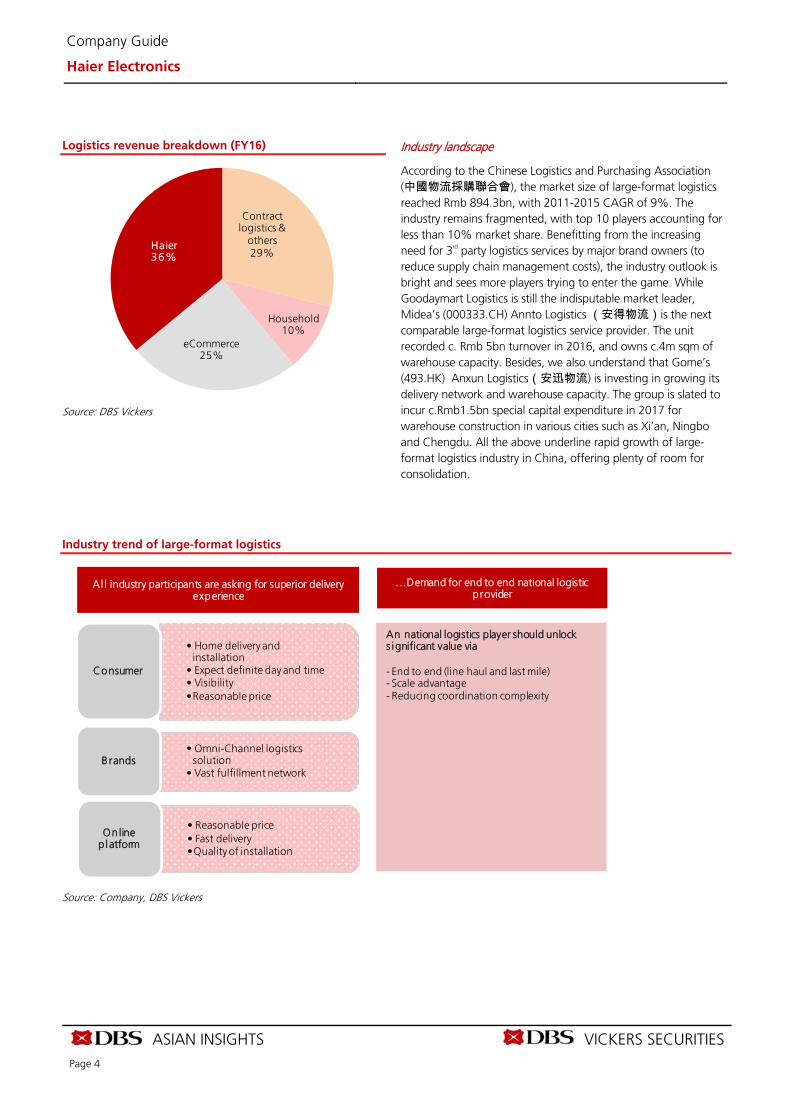
Business structure Goodaymart Logistics (日日顺物流) is the leading logistics service provider of large format items in China. It was founded in 1999, and injected into Haier Electronic’s Integrated Channel Services (ICS) division in 2010. It has since evolved from an internal logistics services unit to currently an integrated third-party logistics services platform, with warehouse capacity of c.3m sqm, c.90,000 delivery trucks, and a nationwide coverage. Alibaba currently owns 34% of Goodaymart Logistics (post CB conversion in Jan 2017) while Haier Electronics is still the controlling shareholder with 66% stake. In FY16, the unit registered revenue of Rmb 7.6bn, 36% of which contributed by fulfillment of Haier-branded products; 25% generated by e-commerce channels; 10% coming from the delivery of large-format household products (other than home appliances), and the remaining 29% coming from contract logistics and others:
(a) Haier products fulfillment: This is the very initial function of Goodaymart Logistics. The unit is responsible for the fulfillment (delivery and installation) of Haier products sold via all franchisee stores nationwide (more than 7,000 stores at county level and c. 26,000 stores in towns and rural villages), as well as key retailers such as Gome and Suning.
(b) E-commerce business continues to grow fast. A big chunk of the e-commerce sales (c.70%) is driven by Tmall’s “Home Appliance Store” (天猫家电城), which sells home appliances products of various brands. The fulfillment is managed by Alibaba’s logistic subsidiary Cainiao, which has appointed Goodaymart Logistics as its exclusive partner for delivery of almost all large-format home appliances sold. Thanks to the strengthened partnership with Alibaba that raised ownership of Goodaymart Logistics from 24% to 34% in Jan 2017, business outlook should remain promising.
ASIAN INSIGHTS VICKERS SECURITIES
Page 3
Company Guide
Haier Electronics
(c) Household products: In early 2014, Haier Electronics acquired Shanghai Boyol New Brothers Supply Chain Management Company Limited (“Boyol”), a leading logistic service provider of furniture and bathroom fixtures in China, serving clients such as Ikea, Kohler, Yihua Timber and Red Star Macalline.
(d) Contract logistics and others: In January 2015, Goodaymart Logistics paid c.Rmb 700m to acquire 58% stake in Fujian
Shengfeng Logistics: a full-solution contract logistics service provider serving clients such as Haier, Lenovo, Fuyao Glass, Mengniu, LG, etc. This unit now contributes c.20% of Goodaymart Logistics revenue, with the remaining 9% constituting revenues pertaining to exports and cross-border e-commerce logistics.
Logistics business structure (FY16)
Logistics
Haier HouseholdContract logistics
& o thers
Tmall
JD
eHaier & Shunguang
O thers
Less than truck load
Contractlogistics
O thers
e-commerce
36% 25% 10% 29%
Source: DBS Vickers
ASIAN INSIGHTS VICKERS SECURITIES
Page 4
Company Guide
Haier Electronics
Logistics revenue breakdown (FY16)
Contract logistics &
others29%
Household10%
eCommerce25%
Haier36%
Source: DBS Vickers
Industry landscape
According to the Chinese Logistics and Purchasing Association (中國物流採購聯合會), the market size of large-format logistics reached Rmb 894.3bn, with 2011-2015 CAGR of 9%. The industry remains fragmented, with top 10 players accounting for less than 10% market share. Benefitting from the increasing need for 3rd party logistics services by major brand owners (to reduce supply chain management costs), the industry outlook is bright and sees more players trying to enter the game. While Goodaymart Logistics is still the indisputable market leader, Midea’s (000333.CH) Annto Logistics (安得物流)is the next comparable large-format logistics service provider. The unit recorded c. Rmb 5bn turnover in 2016, and owns c.4m sqm of warehouse capacity. Besides, we also understand that Gome’s (493.HK) Anxun Logistics(安迅物流) is investing in growing its delivery network and warehouse capacity. The group is slated to incur c.Rmb1.5bn special capital expenditure in 2017 for warehouse construction in various cities such as Xi’an, Ningbo and Chengdu. All the above underline rapid growth of large-format logistics industry in China, offering plenty of room for consolidation.
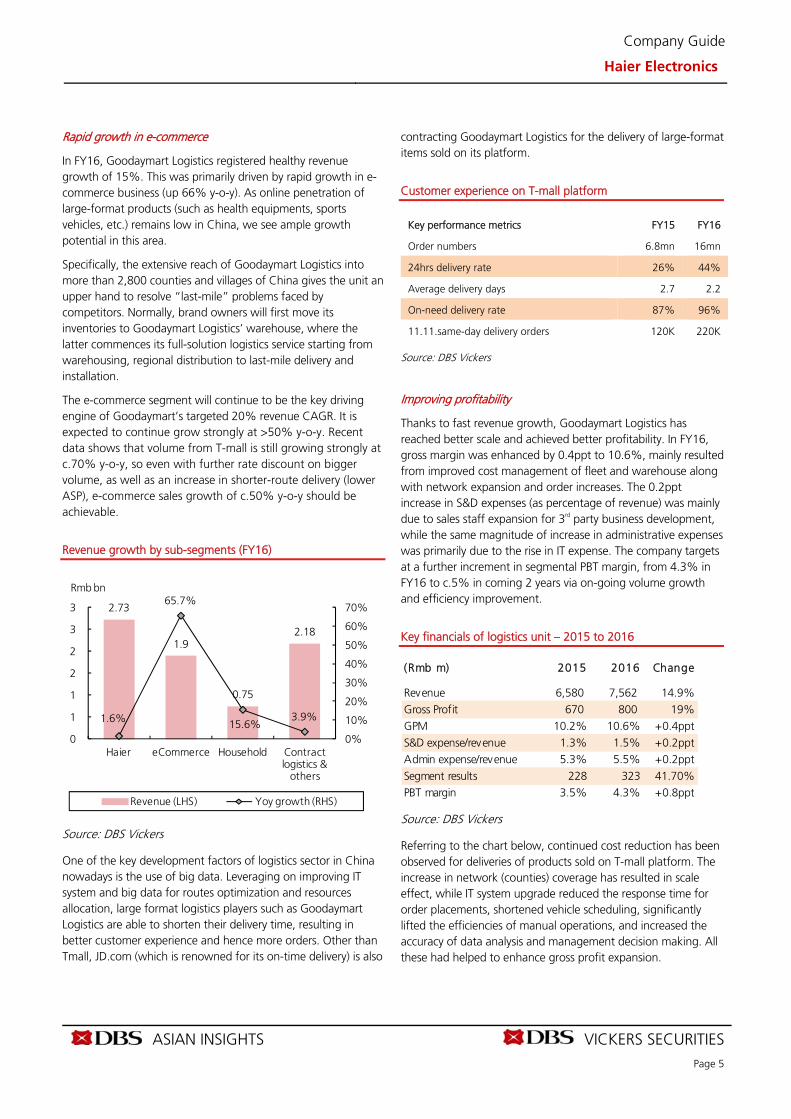
Industry trend of large-format logistics
Source: Company, DBS Vickers
Al l industry participants are asking for superior delivery experience
...Demand for end to end national logistic provider
• Home delivery and installation
• Expect definite day and time• Visibility•Reasonable price
Consumer
• Omni-Channel logistics solution
• Vast fulfillment networkBrands
• Reasonable price• Fast delivery•Quality of installation
Online p latform
An national logistics player should unlock s ignificant value via
- End to end (line haul and last mile)- Scale advantage- Reducing coordination complexity
ASIAN INSIGHTS VICKERS SECURITIES
Page 5
Company Guide
Haier Electronics
Rapid growth in e-commerce
In FY16, Goodaymart Logistics registered healthy revenue growth of 15%. This was primarily driven by rapid growth in e-commerce business (up 66% y-o-y). As online penetration of large-format products (such as health equipments, sports vehicles, etc.) remains low in China, we see ample growth potential in this area.
Specifically, the extensive reach of Goodaymart Logistics into more than 2,800 counties and villages of China gives the unit an upper hand to resolve “last-mile” problems faced by competitors. Normally, brand owners will first move its inventories to Goodaymart Logistics’ warehouse, where the latter commences its full-solution logistics service starting from warehousing, regional distribution to last-mile delivery and installation.
The e-commerce segment will continue to be the key driving engine of Goodaymart’s targeted 20% revenue CAGR. It is expected to continue grow strongly at >50% y-o-y. Recent data shows that volume from T-mall is still growing strongly at c.70% y-o-y, so even with further rate discount on bigger volume, as well as an increase in shorter-route delivery (lower ASP), e-commerce sales growth of c.50% y-o-y should be achievable.
Revenue growth by sub-segments (FY16)
Source: DBS Vickers
One of the key development factors of logistics sector in China nowadays is the use of big data. Leveraging on improving IT system and big data for routes optimization and resources allocation, large format logistics players such as Goodaymart Logistics are able to shorten their delivery time, resulting in better customer experience and hence more orders. Other than Tmall, JD.com (which is renowned for its on-time delivery) is also
contracting Goodaymart Logistics for the delivery of large-format items sold on its platform.
Customer experience on T-mall platform
Key performance metrics FY15 FY16
Order numbers 6.8mn 16mn
24hrs delivery rate 26% 44%
Average delivery days 2.7 2.2
On-need delivery rate 87% 96%
11.11.same-day delivery orders 120K 220K
Source: DBS Vickers
Improving profitability
Thanks to fast revenue growth, Goodaymart Logistics has reached better scale and achieved better profitability. In FY16, gross margin was enhanced by 0.4ppt to 10.6%, mainly resulted from improved cost management of fleet and warehouse along with network expansion and order increases. The 0.2ppt increase in S&D expenses (as percentage of revenue) was mainly due to sales staff expansion for 3rd party business development, while the same magnitude of increase in administrative expenses was primarily due to the rise in IT expense. The company targets at a further increment in segmental PBT margin, from 4.3% in FY16 to c.5% in coming 2 years via on-going volume growth and efficiency improvement.
Key financials of logistics unit – 2015 to 2016
Source: DBS Vickers
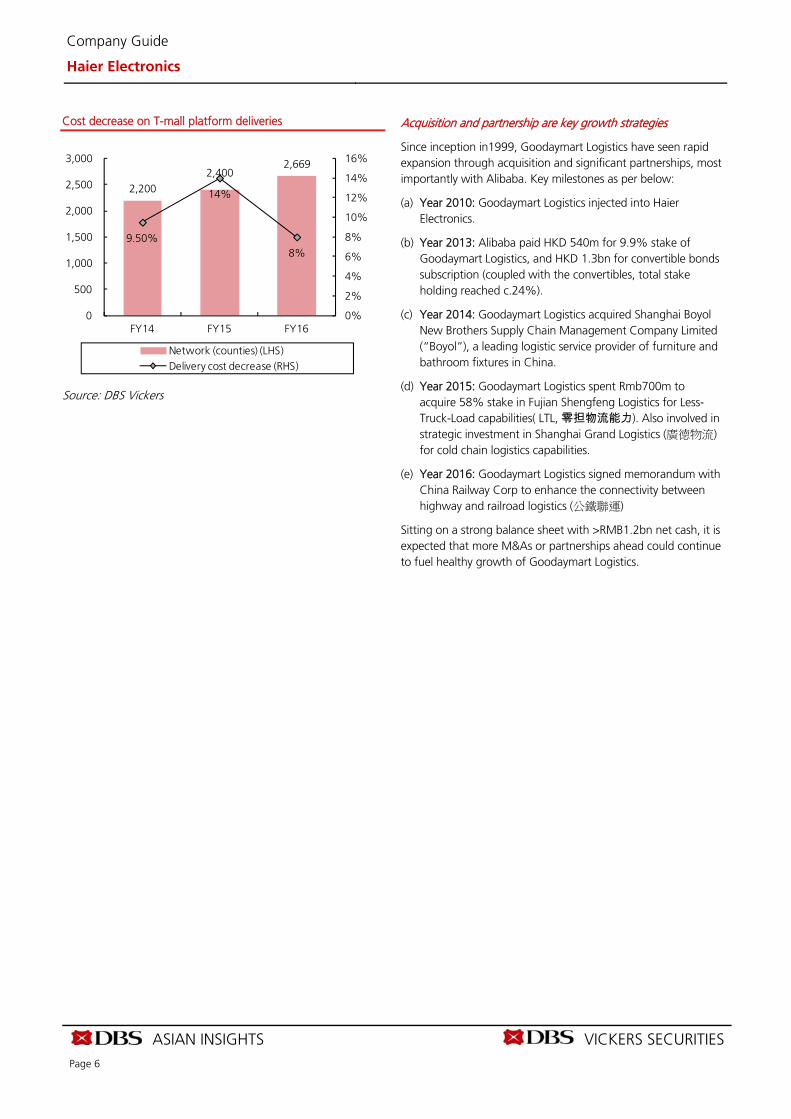
Referring to the chart below, continued cost reduction has been observed for deliveries of products sold on T-mall platform. The increase in network (counties) coverage has resulted in scale effect, while IT system upgrade reduced the response time for order placements, shortened vehicle scheduling, significantly lifted the efficiencies of manual operations, and increased the accuracy of data analysis and management decision making. All these had helped to enhance gross profit expansion.
2.73
1.9
0.75
2.18
1.6%
65.7%
15.6%3.9%
0%
10%
20%
30%
40%
50%
60%
70%
0
1
1
2
2
3
3
Haier eCommerce Household Contract logistics &
others
Revenue (LHS) Yoy growth (RHS)
Rmb bn
(Rmb m) 2015 2016 Change
Revenue 6,580 7,562 14.9%
Gross Profit 670 800 19%GPM 10.2% 10.6% +0.4ppt
S&D expense/revenue 1.3% 1.5% +0.2pptAdmin expense/revenue 5.3% 5.5% +0.2ppt
Segment results 228 323 41.70%PBT margin 3.5% 4.3% +0.8ppt
ASIAN INSIGHTS VICKERS SECURITIES
Page 6
Company Guide
Haier Electronics
Cost decrease on T-mall platform deliveries
2,2002,400
2,669
9.50%
14%
8%
0%
2%
4%
6%
8%
10%
12%
14%
16%
0
500
1,000
1,500
2,000
2,500
3,000
FY14 FY15 FY16
Network (counties) (LHS)Delivery cost decrease (RHS)
Source: DBS Vickers
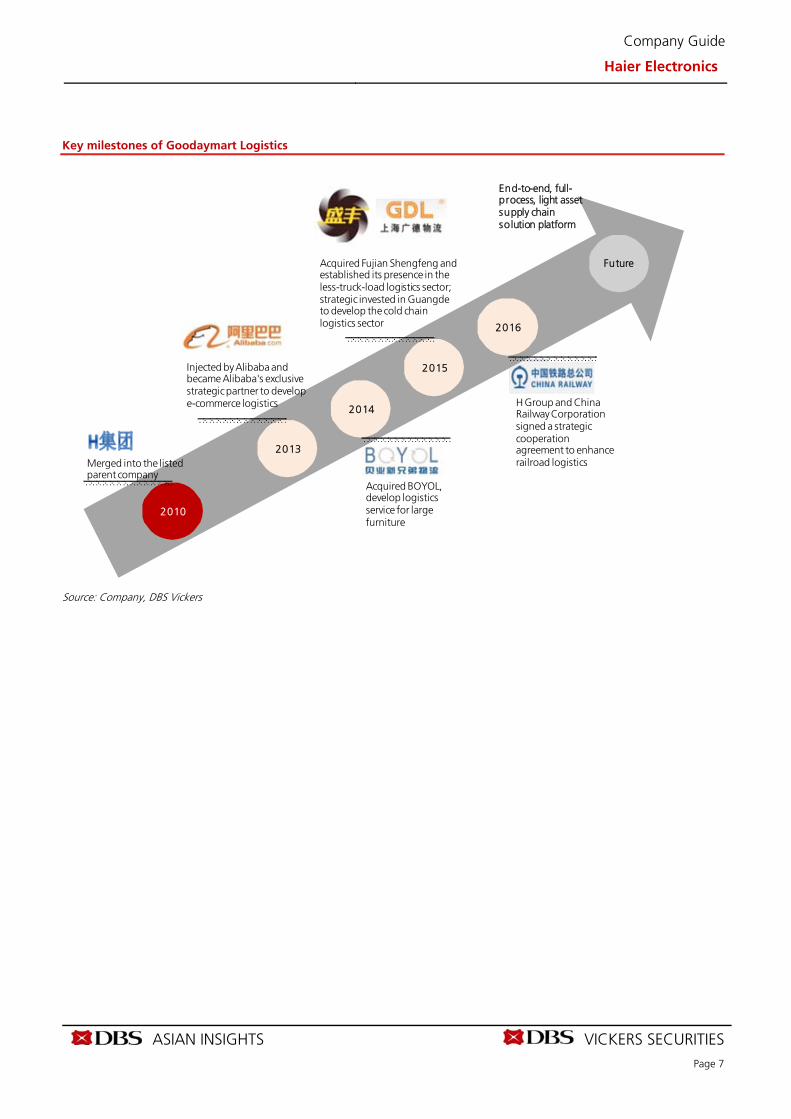
Acquisition and partnership are key growth strategies
Since inception in1999, Goodaymart Logistics have seen rapid expansion through acquisition and significant partnerships, most importantly with Alibaba. Key milestones as per below:
(a) Year 2010: Goodaymart Logistics injected into Haier Electronics.
(b) Year 2013: Alibaba paid HKD 540m for 9.9% stake of Goodaymart Logistics, and HKD 1.3bn for convertible bonds subscription (coupled with the convertibles, total stake holding reached c.24%).
(c) Year 2014: Goodaymart Logistics acquired Shanghai Boyol New Brothers Supply Chain Management Company Limited (“Boyol”), a leading logistic service provider of furniture and bathroom fixtures in China.
(d) Year 2015: Goodaymart Logistics spent Rmb700m to acquire 58% stake in Fujian Shengfeng Logistics for Less-Truck-Load capabilities( LTL, 零担物流能力). Also involved in strategic investment in Shanghai Grand Logistics (廣德物流) for cold chain logistics capabilities.
(e) Year 2016: Goodaymart Logistics signed memorandum with China Railway Corp to enhance the connectivity between highway and railroad logistics (公鐵聯運)
Sitting on a strong balance sheet with >RMB1.2bn net cash, it is expected that more M&As or partnerships ahead could continue to fuel healthy growth of Goodaymart Logistics.
ASIAN INSIGHTS VICKERS SECURITIES
Page 7
Company Guide
Haier Electronics
Key milestones of Goodaymart Logistics
2010
2013
2014
2015
2016
Future
Merged into the listed parent company
Injected by Alibaba and became Alibaba's exclusive strategic partner to develop e-commerce logistics
Acquired Fujian Shengfeng and established its presence in the less-truck-load logistics sector; strategic invested in Guangde to develop the cold chain logistics sector
H Group and China Railway Corporation signed a strategic cooperation agreement to enhance railroad logistics
Acquired BOYOL, develop logisticsservice for large furniture
End-to-end, full-process, light asset supply chain solution platform
Source: Company, DBS Vickers
ASIAN INSIGHTS VICKERS SECURITIES
Page 8
Company Guide
Haier Electronics
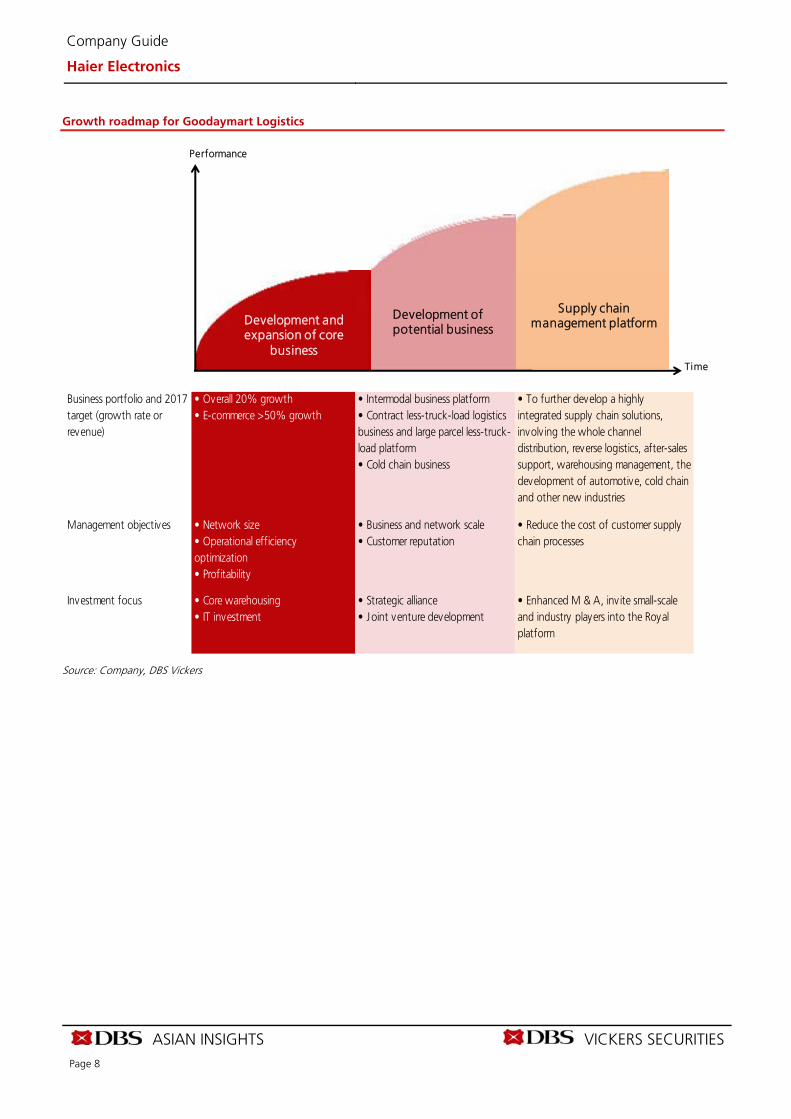
Growth roadmap for Goodaymart Logistics
Source: Company, DBS Vickers
Performance
Time
Development and expansion of core
business
Development ofpotential business
Supply chain management platform
Business portfolio and 2017target (growth rate orrevenue)
• Overall 20% growth• E-commerce >50% growth
• Intermodal business platform• Contract less-truck-load logisticsbusiness and large parcel less-truck-load platform• Cold chain business
• To further develop a highlyintegrated supply chain solutions,involv ing the whole channeldistribution, reverse logistics, after-salessupport, warehousing management, thedevelopment of automotive, cold chainand other new industries
Management objectives • Network size• Operational efficiencyoptimization• Profitability
• Business and network scale• Customer reputation
• Reduce the cost of customer supplychain processes
Investment focus • Core warehousing• IT investment
• Strategic alliance• Joint venture development
• Enhanced M & A, inv ite small-scaleand industry players into the Royalplatform
ASIAN INSIGHTS VICKERS SECURITIES
Page 9
Company Guide
Haier Electronics
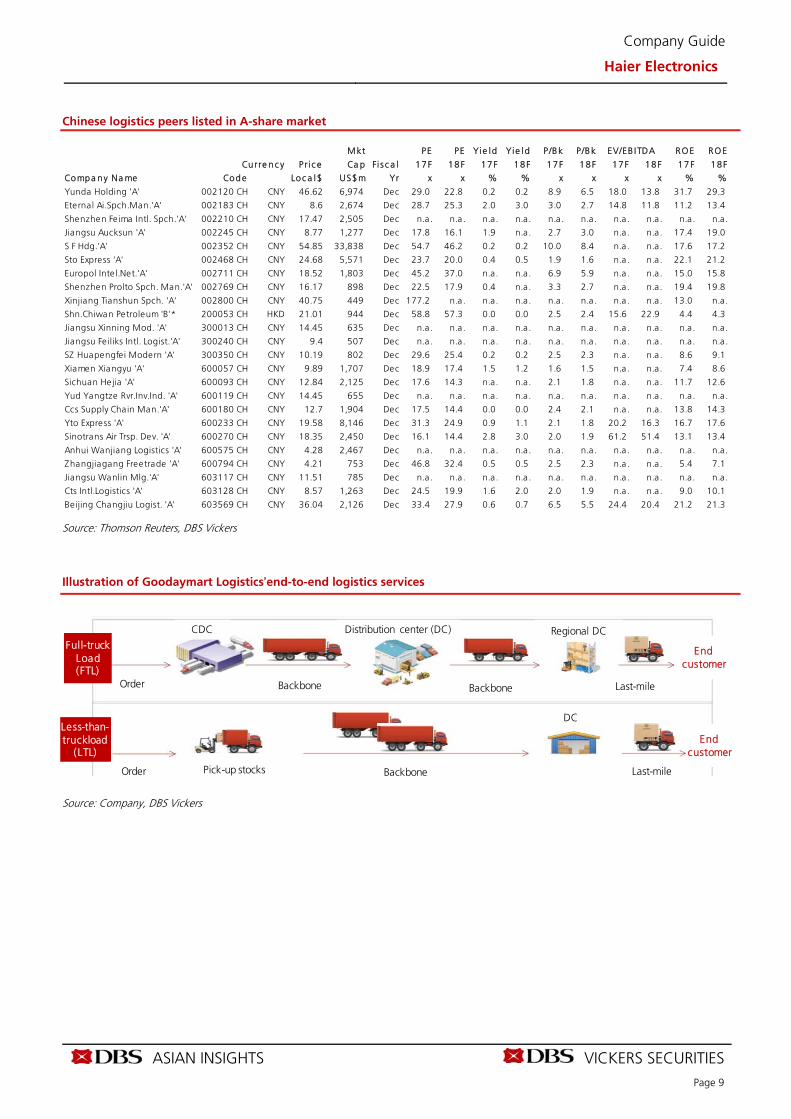
Chinese logistics peers listed in A-share market
M kt PE PE Yie ld Yie ld P/Bk P/B k EV/EB ITDA RO E RO E
Curre n c y Pr i c e Ca p Fi s c a l 17F 18 F 1 7F 1 8F 17F 18F 17F 18 F 17 F 1 8F
Compa ny Na me Cod e Loc a l$ US$m Yr x x % % x x x x % %
Yunda Holding 'A' 002120 CH CNY 46.62 6,974 Dec 29.0 22.8 0.2 0.2 8.9 6.5 18.0 13.8 31.7 29.3
Eternal Ai.Spch.Man.'A' 002183 CH CNY 8.6 2,674 Dec 28.7 25.3 2.0 3.0 3.0 2.7 14.8 11.8 11.2 13.4
Shenzhen Fe ima Intl. Spch.'A' 002210 CH CNY 17.47 2,505 Dec n.a. n.a . n.a. n.a. n.a . n.a . n.a . n.a . n.a. n.a.
Jiangsu Aucksun 'A' 002245 CH CNY 8.77 1,277 Dec 17.8 16.1 1.9 n.a. 2.7 3.0 n.a. n.a . 17.4 19.0
S F Hdg.'A' 002352 CH CNY 54.85 33,838 Dec 54.7 46.2 0.2 0.2 10.0 8.4 n.a. n.a . 17.6 17.2
Sto Express 'A' 002468 CH CNY 24.68 5,571 Dec 23.7 20.0 0.4 0.5 1.9 1.6 n.a. n.a . 22.1 21.2
Europol Inte l.Net.'A' 002711 CH CNY 18.52 1,803 Dec 45.2 37.0 n.a. n.a. 6.9 5.9 n.a. n.a . 15.0 15.8
Shenzhen Prolto Spch. Man.'A' 002769 CH CNY 16.17 898 Dec 22.5 17.9 0.4 n.a. 3.3 2.7 n.a. n.a . 19.4 19.8
Xinjiang Tianshun Spch. 'A' 002800 CH CNY 40.75 449 Dec 177.2 n.a. n.a. n.a. n.a . n.a . n.a . n.a . 13.0 n.a.
Shn.Chiwan Petroleum 'B'* 200053 CH HKD 21.01 944 Dec 58.8 57.3 0.0 0.0 2.5 2.4 15.6 22.9 4.4 4.3
Jiangsu Xinning Mod. 'A' 300013 CH CNY 14.45 635 Dec n.a. n.a . n.a. n.a. n.a . n.a . n.a . n.a . n.a. n.a.
Jiangsu Fe iliks Intl. Logist.'A' 300240 CH CNY 9.4 507 Dec n.a. n.a . n.a. n.a. n.a . n.a . n.a . n.a . n.a. n.a.
SZ Huapengfei Modern 'A' 300350 CH CNY 10.19 802 Dec 29.6 25.4 0.2 0.2 2.5 2.3 n.a. n.a . 8.6 9.1
Xiamen Xiangyu 'A' 600057 CH CNY 9.89 1,707 Dec 18.9 17.4 1.5 1.2 1.6 1.5 n.a. n.a . 7.4 8.6
Sichuan Hejia 'A' 600093 CH CNY 12.84 2,125 Dec 17.6 14.3 n.a. n.a. 2.1 1.8 n.a. n.a . 11.7 12.6
Yud Yangtze Rvr.Inv.Ind. 'A' 600119 CH CNY 14.45 655 Dec n.a. n.a . n.a. n.a. n.a . n.a . n.a . n.a . n.a. n.a.
Ccs Supply Chain Man.'A' 600180 CH CNY 12.7 1,904 Dec 17.5 14.4 0.0 0.0 2.4 2.1 n.a. n.a . 13.8 14.3
Yto Express 'A' 600233 CH CNY 19.58 8,146 Dec 31.3 24.9 0.9 1.1 2.1 1.8 20.2 16.3 16.7 17.6
Sinotrans Air Trsp. Dev. 'A' 600270 CH CNY 18.35 2,450 Dec 16.1 14.4 2.8 3.0 2.0 1.9 61.2 51.4 13.1 13.4
Anhui Wanjiang Logistics 'A' 600575 CH CNY 4.28 2,467 Dec n.a. n.a . n.a. n.a. n.a . n.a . n.a . n.a . n.a. n.a.
Zhangjiagang Freetrade 'A' 600794 CH CNY 4.21 753 Dec 46.8 32.4 0.5 0.5 2.5 2.3 n.a. n.a . 5.4 7.1
Jiangsu Wanlin Mlg.'A' 603117 CH CNY 11.51 785 Dec n.a. n.a . n.a. n.a. n.a . n.a . n.a . n.a . n.a. n.a.
Cts Intl.Logistics 'A' 603128 CH CNY 8.57 1,263 Dec 24.5 19.9 1.6 2.0 2.0 1.9 n.a. n.a . 9.0 10.1
Beijing Changjiu Logist. 'A' 603569 CH CNY 36.04 2,126 Dec 33.4 27.9 0.6 0.7 6.5 5.5 24.4 20.4 21.2 21.3
Source: Thomson Reuters, DBS Vickers
Illustration of Goodaymart Logistics’end-to-end logistics services
Order Backbone
CDC
Full-truck Load(FTL)
Less-than-truckload
(LTL)
Backbone Last-mile
Distribution center (DC) Regional DC
End customer
Order Pick-up stocks Backbone
DC
Last-mile
End customer
Source: Company, DBS Vickers
ASIAN INSIGHTS VICKERS SECURITIES
Page 10
Company Guide
Haier Electronics
CRITICAL FACTORS TO WATCH
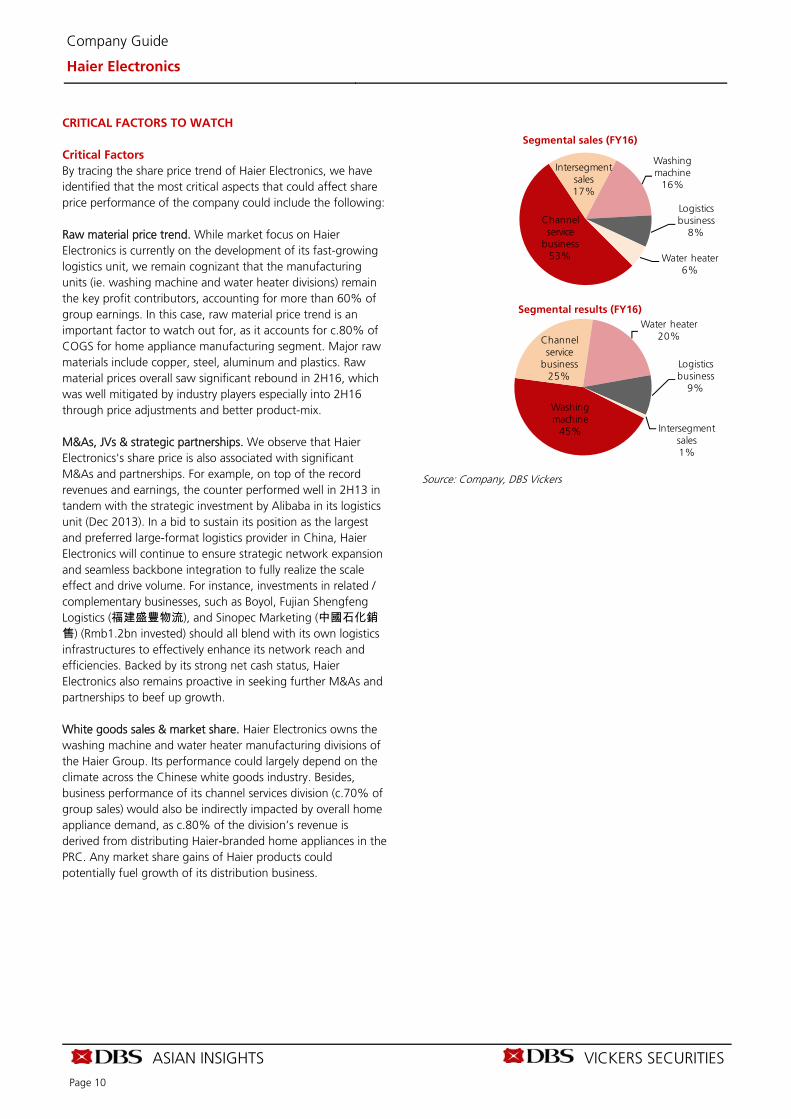
Critical Factors By tracing the share price trend of Haier Electronics, we have identified that the most critical aspects that could affect share price performance of the company could include the following: Raw material price trend. While market focus on Haier Electronics is currently on the development of its fast-growing logistics unit, we remain cognizant that the manufacturing units (ie. washing machine and water heater divisions) remain the key profit contributors, accounting for more than 60% of group earnings. In this case, raw material price trend is an important factor to watch out for, as it accounts for c.80% of COGS for home appliance manufacturing segment. Major raw materials include copper, steel, aluminum and plastics. Raw material prices overall saw significant rebound in 2H16, which was well mitigated by industry players especially into 2H16 through price adjustments and better product-mix. M&As, JVs & strategic partnerships. We observe that Haier Electronics's share price is also associated with significant M&As and partnerships. For example, on top of the record revenues and earnings, the counter performed well in 2H13 in tandem with the strategic investment by Alibaba in its logistics unit (Dec 2013). In a bid to sustain its position as the largest and preferred large-format logistics provider in China, Haier Electronics will continue to ensure strategic network expansion and seamless backbone integration to fully realize the scale effect and drive volume. For instance, investments in related / complementary businesses, such as Boyol, Fujian Shengfeng Logistics (福建盛豐物流), and Sinopec Marketing (中國石化銷售) (Rmb1.2bn invested) should all blend with its own logistics infrastructures to effectively enhance its network reach and efficiencies. Backed by its strong net cash status, Haier Electronics also remains proactive in seeking further M&As and partnerships to beef up growth. White goods sales & market share. Haier Electronics owns the washing machine and water heater manufacturing divisions of the Haier Group. Its performance could largely depend on the climate across the Chinese white goods industry. Besides, business performance of its channel services division (c.70% of group sales) would also be indirectly impacted by overall home appliance demand, as c.80% of the division’s revenue is derived from distributing Haier-branded home appliances in the PRC. Any market share gains of Haier products could potentially fuel growth of its distribution business.
Segmental sales (FY16)
Channel service
business53%
Intersegment sales17%
Washing machine
16%
Logistics business
8%
Water heater6%
Segmental results (FY16)
Washing machine
45%
Channel service
business25%
Water heater20%
Logistics business
9%
Intersegment sales1%
Source: Company, DBS Vickers
ASIAN INSIGHTS VICKERS SECURITIES
Page 11
Company Guide
Haier Electronics
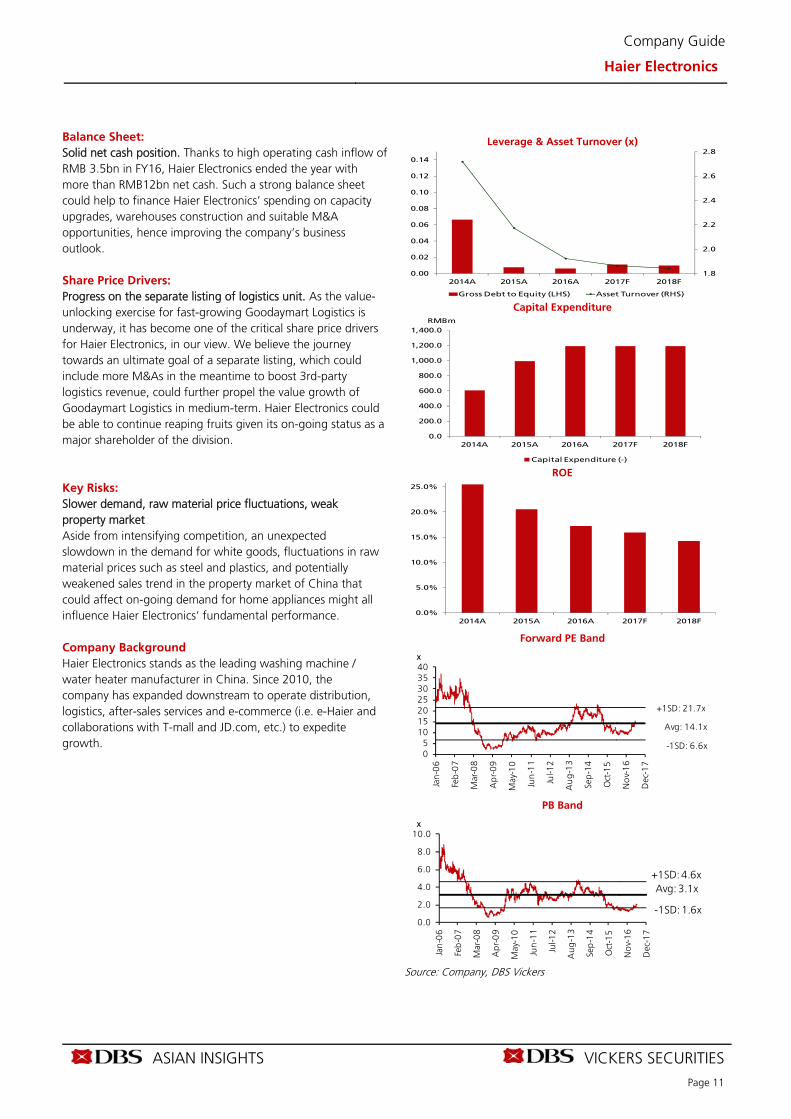
Balance Sheet: Solid net cash position. Thanks to high operating cash inflow of RMB 3.5bn in FY16, Haier Electronics ended the year with more than RMB12bn net cash. Such a strong balance sheet could help to finance Haier Electronics’ spending on capacity upgrades, warehouses construction and suitable M&A opportunities, hence improving the company’s business outlook. Share Price Drivers: Progress on the separate listing of logistics unit. As the value-unlocking exercise for fast-growing Goodaymart Logistics is underway, it has become one of the critical share price drivers for Haier Electronics, in our view. We believe the journey towards an ultimate goal of a separate listing, which could include more M&As in the meantime to boost 3rd-party logistics revenue, could further propel the value growth of Goodaymart Logistics in medium-term. Haier Electronics could be able to continue reaping fruits given its on-going status as a major shareholder of the division. Key Risks: Slower demand, raw material price fluctuations, weak property market Aside from intensifying competition, an unexpected slowdown in the demand for white goods, fluctuations in raw material prices such as steel and plastics, and potentially weakened sales trend in the property market of China that could affect on-going demand for home appliances might all influence Haier Electronics’ fundamental performance. Company Background Haier Electronics stands as the leading washing machine / water heater manufacturer in China. Since 2010, the company has expanded downstream to operate distribution, logistics, after-sales services and e-commerce (i.e. e-Haier and collaborations with T-mall and JD.com, etc.) to expedite growth.
Leverage & Asset Turnover (x)
Capital Expenditure
ROE
Forward PE Band
PB Band
Source: Company, DBS Vickers
1.8
2.0
2.2
2.4
2.6
2.8
0.00
0.02
0.04
0.06
0.08
0.10
0.12
0.14
2014A 2015A 2016A 2017F 2018F
Gross Debt to Equity (LHS) Asset Turnover (RHS)
0.0
200.0
400.0
600.0
800.0
1,000.0
1,200.0
1,400.0
2014A 2015A 2016A 2017F 2018F
Capital Expenditure (-)
RMBm
0.0%
5.0%
10.0%
15.0%
20.0%
25.0%
2014A 2015A 2016A 2017F 2018F
05
10152025303540
Jan
-06
Feb
-07
Mar
-08
Ap
r-0
9
May
-10
Jun
-11
Jul-1
2
Au
g-1
3
Sep
-14
Oct
-15
No
v-1
6
Dec
-17
x
Avg: 14.1x
+1SD: 21.7x
-1SD: 6.6x
0.0
2.0
4.0
6.0
8.0
10.0
Jan
-06
Feb
-07
Mar
-08
Ap
r-0
9
May
-10
Jun
-11
Jul-1
2
Au
g-1
3
Sep
-14
Oct
-15
No
v-1
6
Dec
-17
x
Avg: 3.1x+1SD: 4.6x
-1SD: 1.6x
ASIAN INSIGHTS VICKERS SECURITIES
Page 12
Company Guide
Haier Electronics
Appendix: A look at company’s listed history – what drives its share price?
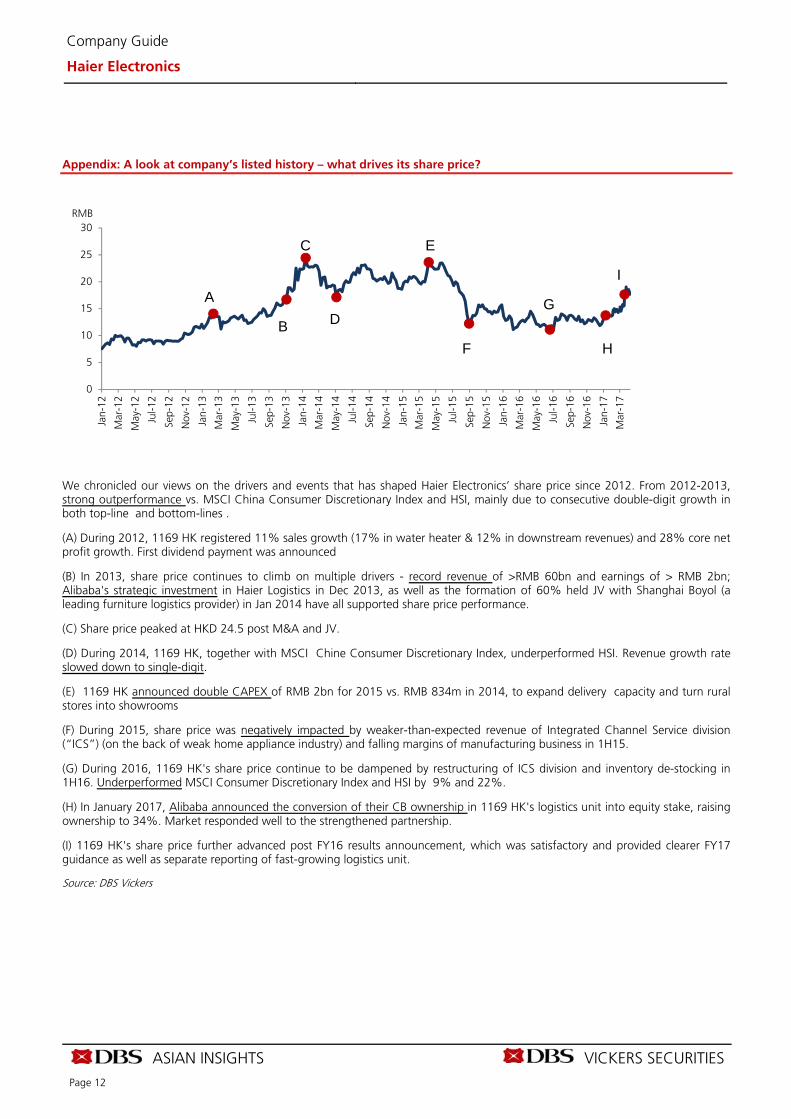
We chronicled our views on the drivers and events that has shaped Haier Electronics’ share price since 2012. From 2012-2013, strong outperformance vs. MSCI China Consumer Discretionary Index and HSI, mainly due to consecutive double-digit growth in both top-line and bottom-lines .
(A) During 2012, 1169 HK registered 11% sales growth (17% in water heater & 12% in downstream revenues) and 28% core net profit growth. First dividend payment was announced
(B) In 2013, share price continues to climb on multiple drivers - record revenue of >RMB 60bn and earnings of > RMB 2bn; Alibaba's strategic investment in Haier Logistics in Dec 2013, as well as the formation of 60% held JV with Shanghai Boyol (a leading furniture logistics provider) in Jan 2014 have all supported share price performance.
(C) Share price peaked at HKD 24.5 post M&A and JV.
(D) During 2014, 1169 HK, together with MSCI Chine Consumer Discretionary Index, underperformed HSI. Revenue growth rate slowed down to single-digit.
(E) 1169 HK announced double CAPEX of RMB 2bn for 2015 vs. RMB 834m in 2014, to expand delivery capacity and turn rural stores into showrooms
(F) During 2015, share price was negatively impacted by weaker-than-expected revenue of Integrated Channel Service division (“ICS”) (on the back of weak home appliance industry) and falling margins of manufacturing business in 1H15.
(G) During 2016, 1169 HK's share price continue to be dampened by restructuring of ICS division and inventory de-stocking in 1H16. Underperformed MSCI Consumer Discretionary Index and HSI by 9% and 22%.
(H) In January 2017, Alibaba announced the conversion of their CB ownership in 1169 HK's logistics unit into equity stake, raising ownership to 34%. Market responded well to the strengthened partnership.
(I) 1169 HK's share price further advanced post FY16 results announcement, which was satisfactory and provided clearer FY17 guidance as well as separate reporting of fast-growing logistics unit.
Source: DBS Vickers
0
5
10
15
20
25
30
Jan-
12
Mar
-12
May
-12
Jul-1
2
Sep-
12
Nov
-12
Jan-
13
Mar
-13
May
-13
Jul-1
3
Sep-
13
Nov
-13
Jan-
14
Mar
-14
May
-14
Jul-1
4
Sep-
14
Nov
-14
Jan-
15
Mar
-15
May
-15
Jul-1
5
Sep-
15
Nov
-15
Jan-
16
Mar
-16
May
-16
Jul-1
6
Sep-
16
Nov
-16
Jan-
17
Mar
-17
RMB
A
B
C
D
E
F
G
H
I
ASIAN INSIGHTS VICKERS SECURITIES
Page 13
Company Guide
Haier Electronics
Segmental Breakdown (RMB m)
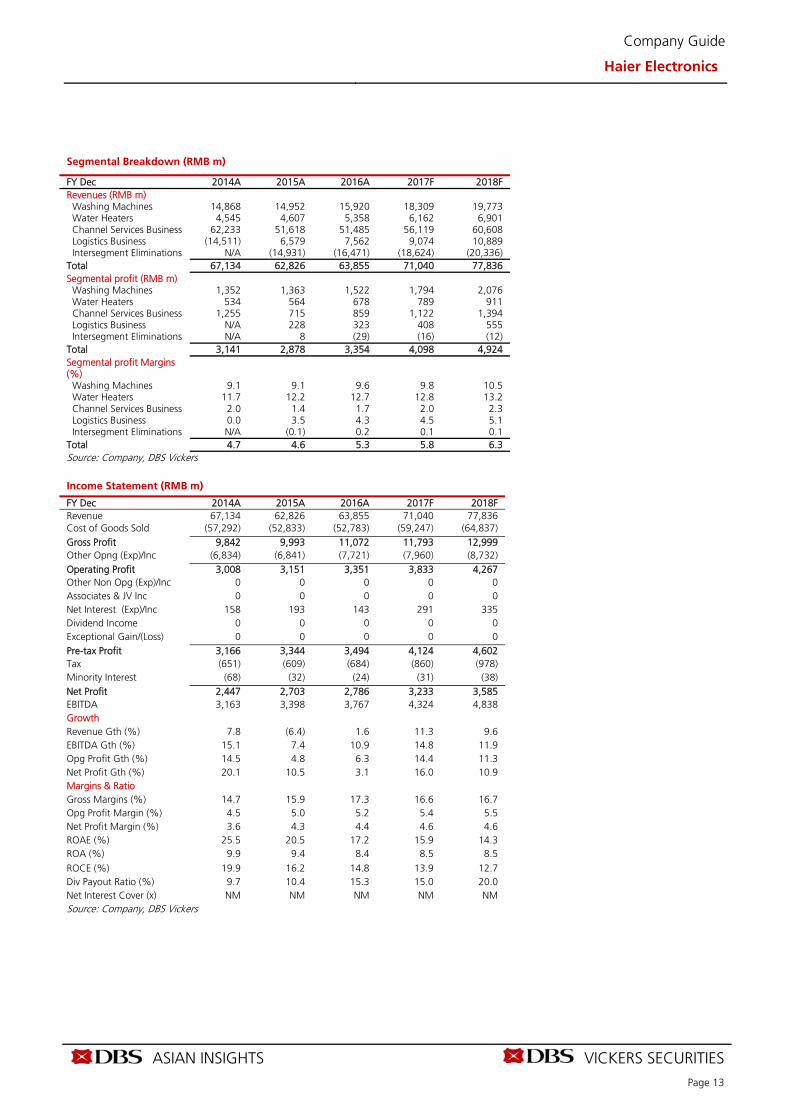
FY Dec 2014A 2015A 2016A 2017F 2018F Revenues (RMB m) Washing Machines 14,868 14,952 15,920 18,309 19,773 Water Heaters 4,545 4,607 5,358 6,162 6,901 Channel Services Business 62,233 51,618 51,485 56,119 60,608 Logistics Business (14,511) 6,579 7,562 9,074 10,889 Intersegment Eliminations N/A (14,931) (16,471) (18,624) (20,336) Total 67,134 62,826 63,855 71,040 77,836 Segmental profit (RMB m) Washing Machines 1,352 1,363 1,522 1,794 2,076 Water Heaters 534 564 678 789 911 Channel Services Business 1,255 715 859 1,122 1,394 Logistics Business N/A 228 323 408 555 Intersegment Eliminations N/A 8 (29) (16) (12) Total 3,141 2,878 3,354 4,098 4,924 Segmental profit Margins (%)
Washing Machines 9.1 9.1 9.6 9.8 10.5 Water Heaters 11.7 12.2 12.7 12.8 13.2 Channel Services Business 2.0 1.4 1.7 2.0 2.3 Logistics Business 0.0 3.5 4.3 4.5 5.1 Intersegment Eliminations N/A (0.1) 0.2 0.1 0.1 Total 4.7 4.6 5.3 5.8 6.3 Source: Company, DBS Vickers
Income Statement (RMB m) FY Dec 2014A 2015A 2016A 2017F 2018F Revenue 67,134 62,826 63,855 71,040 77,836 Cost of Goods Sold (57,292) (52,833) (52,783) (59,247) (64,837) Gross Profit 9,842 9,993 11,072 11,793 12,999 Other Opng (Exp)/Inc (6,834) (6,841) (7,721) (7,960) (8,732) Operating Profit 3,008 3,151 3,351 3,833 4,267 Other Non Opg (Exp)/Inc 0 0 0 0 0 Associates & JV Inc 0 0 0 0 0 Net Interest (Exp)/Inc 158 193 143 291 335 Dividend Income 0 0 0 0 0 Exceptional Gain/(Loss) 0 0 0 0 0 Pre-tax Profit 3,166 3,344 3,494 4,124 4,602 Tax (651) (609) (684) (860) (978) Minority Interest (68) (32) (24) (31) (38) Net Profit 2,447 2,703 2,786 3,233 3,585 EBITDA 3,163 3,398 3,767 4,324 4,838 Growth Revenue Gth (%) 7.8 (6.4) 1.6 11.3 9.6 EBITDA Gth (%) 15.1 7.4 10.9 14.8 11.9 Opg Profit Gth (%) 14.5 4.8 6.3 14.4 11.3 Net Profit Gth (%) 20.1 10.5 3.1 16.0 10.9 Margins & Ratio Gross Margins (%) 14.7 15.9 17.3 16.6 16.7 Opg Profit Margin (%) 4.5 5.0 5.2 5.4 5.5 Net Profit Margin (%) 3.6 4.3 4.4 4.6 4.6 ROAE (%) 25.5 20.5 17.2 15.9 14.3 ROA (%) 9.9 9.4 8.4 8.5 8.5
ROCE (%) 19.9 16.2 14.8 13.9 12.7 Div Payout Ratio (%) 9.7 10.4 15.3 15.0 20.0 Net Interest Cover (x) NM NM NM NM NM Source: Company, DBS Vickers
ASIAN INSIGHTS VICKERS SECURITIES
Page 14
Company Guide
Haier Electronics
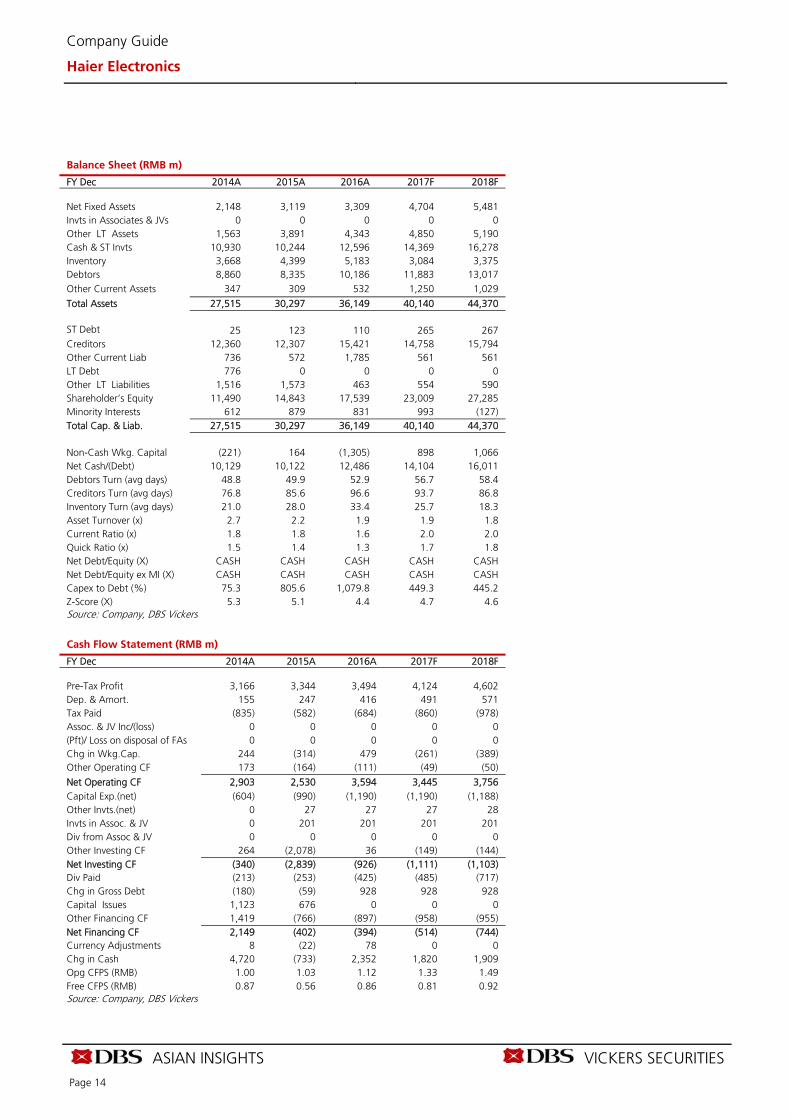
Balance Sheet (RMB m)
FY Dec 2014A 2015A 2016A 2017F 2018F Net Fixed Assets 2,148 3,119 3,309 4,704 5,481 Invts in Associates & JVs 0 0 0 0 0 Other LT Assets 1,563 3,891 4,343 4,850 5,190 Cash & ST Invts 10,930 10,244 12,596 14,369 16,278 Inventory 3,668 4,399 5,183 3,084 3,375 Debtors 8,860 8,335 10,186 11,883 13,017 Other Current Assets 347 309 532 1,250 1,029
Total Assets 27,515 30,297 36,149 40,140 44,370 ST Debt
25 123 110 265 267 Creditors 12,360 12,307 15,421 14,758 15,794 Other Current Liab 736 572 1,785 561 561 LT Debt 776 0 0 0 0 Other LT Liabilities 1,516 1,573 463 554 590 Shareholder’s Equity 11,490 14,843 17,539 23,009 27,285 Minority Interests 612 879 831 993 (127) Total Cap. & Liab. 27,515 30,297 36,149 40,140 44,370 Non-Cash Wkg. Capital (221) 164 (1,305) 898 1,066 Net Cash/(Debt) 10,129 10,122 12,486 14,104 16,011 Debtors Turn (avg days) 48.8 49.9 52.9 56.7 58.4 Creditors Turn (avg days) 76.8 85.6 96.6 93.7 86.8 Inventory Turn (avg days) 21.0 28.0 33.4 25.7 18.3 Asset Turnover (x) 2.7 2.2 1.9 1.9 1.8 Current Ratio (x) 1.8 1.8 1.6 2.0 2.0 Quick Ratio (x) 1.5 1.4 1.3 1.7 1.8 Net Debt/Equity (X) CASH CASH CASH CASH CASH Net Debt/Equity ex MI (X) CASH CASH CASH CASH CASH Capex to Debt (%) 75.3 805.6 1,079.8 449.3 445.2 Z-Score (X) 5.3 5.1 4.4 4.7 4.6 Source: Company, DBS Vickers
Cash Flow Statement (RMB m)
FY Dec 2014A 2015A 2016A 2017F 2018F Pre-Tax Profit 3,166 3,344 3,494 4,124 4,602 Dep. & Amort. 155 247 416 491 571 Tax Paid (835) (582) (684) (860) (978) Assoc. & JV Inc/(loss) 0 0 0 0 0 (Pft)/ Loss on disposal of FAs 0 0 0 0 0 Chg in Wkg.Cap. 244 (314) 479 (261) (389) Other Operating CF 173 (164) (111) (49) (50)
Net Operating CF 2,903 2,530 3,594 3,445 3,756 Capital Exp.(net) (604) (990) (1,190) (1,190) (1,188) Other Invts.(net) 0 27 27 27 28 Invts in Assoc. & JV 0 201 201 201 201 Div from Assoc & JV 0 0 0 0 0 Other Investing CF 264 (2,078) 36 (149) (144) Net Investing CF (340) (2,839) (926) (1,111) (1,103) Div Paid (213) (253) (425) (485) (717) Chg in Gross Debt (180) (59) 928 928 928 Capital Issues 1,123 676 0 0 0 Other Financing CF 1,419 (766) (897) (958) (955) Net Financing CF 2,149 (402) (394) (514) (744) Currency Adjustments 8 (22) 78 0 0 Chg in Cash 4,720 (733) 2,352 1,820 1,909 Opg CFPS (RMB) 1.00 1.03 1.12 1.33 1.49 Free CFPS (RMB) 0.87 0.56 0.86 0.81 0.92 Source: Company, DBS Vickers
ASIAN INSIGHTS VICKERS SECURITIES
Page 15
Company Guide
Haier Electronics
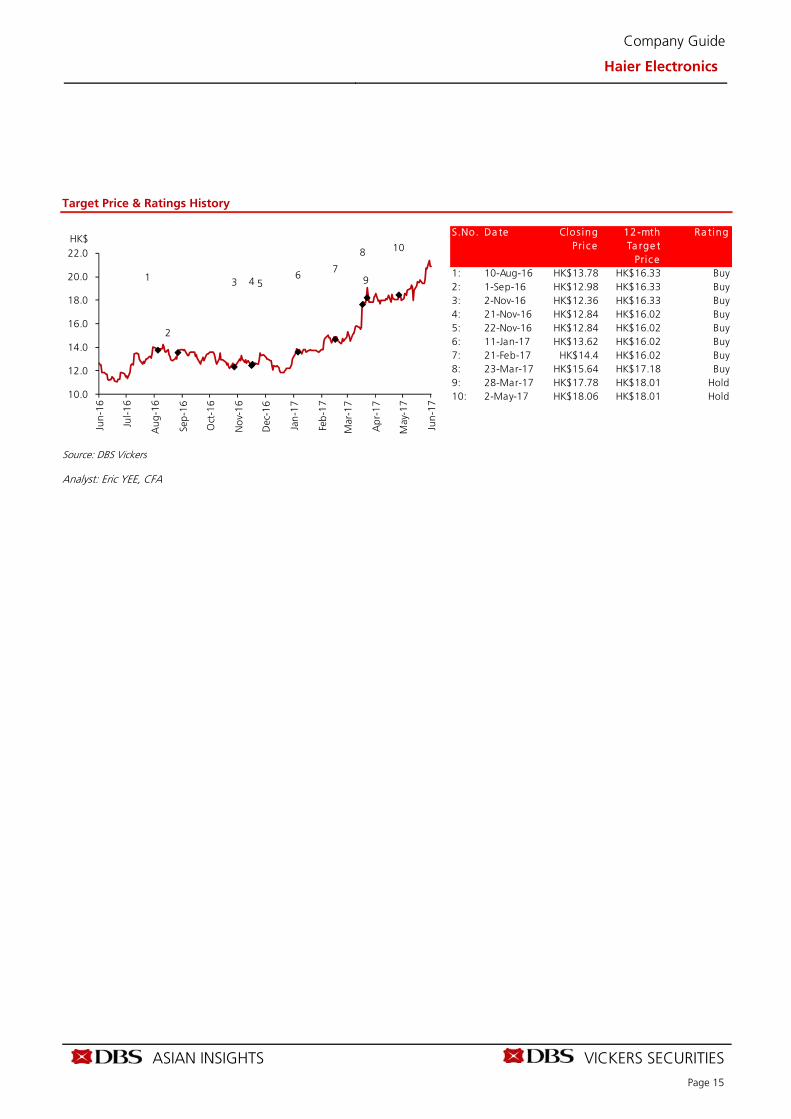
Target Price & Ratings History
Source: DBS Vickers
Analyst: Eric YEE, CFA
1
2
3 4 56
7
8
9
10
10.0
12.0
14.0
16.0
18.0
20.0
22.0
Jun-
16
Jul-1
6
Au
g-16
Sep-
16
Oct
-16
No
v-1
6
Dec
-16
Jan
-17
Feb
-17
Mar
-17
Ap
r-17
May
-17
Jun-
17
HK$S.No. Da te Clos ing 12-mth Ra ting
Pric e Ta rge tPri c e
1: 10-Aug-16 HK$13.78 HK$16.33 Buy2: 1-Sep-16 HK$12.98 HK$16.33 Buy3: 2-Nov-16 HK$12.36 HK$16.33 Buy4: 21-Nov-16 HK$12.84 HK$16.02 Buy5: 22-Nov-16 HK$12.84 HK$16.02 Buy6: 11-Jan-17 HK$13.62 HK$16.02 Buy7: 21-Feb-17 HK$14.4 HK$16.02 Buy8: 23-Mar-17 HK$15.64 HK$17.18 Buy9: 28-Mar-17 HK$17.78 HK$18.01 Hold10: 2-May-17 HK$18.06 HK$18.01 Hold
ASIAN INSIGHTS VICKERS SECURITIES
Page 16
Company Guide
Haier Electronics
DBSVHK recommendations are based an Absolute Total Return* Rating system, defined as follows:
STRONG BUY (>20% total return over the next 3 months, with identifiable share price catalysts within this time frame)
BUY (>15% total return over the next 12 months for small caps, >10% for large caps)
HOLD (-10% to +15% total return over the next 12 months for small caps, -10% to +10% for large caps)
FULLY VALUED (negative total return i.e. > -10% over the next 12 months)
SELL (negative total return of > -20% over the next 3 months, with identifiable catalysts within this time frame)
Share price appreciation + dividends Completed Date: 7 Jun 2017 16:58:05 (HKT) Dissemination Date: 7 Jun 2017 19:07:42 (HKT) Sources for all charts and tables are DBS Vickers unless otherwise specified.
GENERAL DISCLOSURE/DISCLAIMER This report is prepared by DBS Vickers (Hong Kong) Limited (“DBSV HK”). This report is solely intended for the clients of DBS Bank Ltd., DBS Bank (Hong Kong) Limited (DBS HK), DBSV HK, and DBS Vickers Securities (Singapore) Ptd Ltd. (“DBSVS”), its respective connected and associated corporations and affiliates only and no part of this document may be (i) copied, photocopied or duplicated in any form or by any means or (ii) redistributed without the prior written consent of DBSV HK. The research set out in this report is based on information obtained from sources believed to be reliable, but we (which collectively refers to DBS Bank Ltd., DBS HK, DBSV HK, DBSVS, its respective connected and associated corporations, affiliates and their respective directors, officers, employees and agents (collectively, the “DBS Group”) have not conducted due diligence on any of the companies, verified any information or sources or taken into account any other factors which we may consider to be relevant or appropriate in preparing the research. Accordingly, we do not make any representation or warranty as to the accuracy, completeness or correctness of the research set out in this report. Opinions expressed are subject to change without notice. This research is prepared for general circulation. Any recommendation contained in this document does not have regard to the specific investment objectives, financial situation and the particular needs of any specific addressee. This document is for the information of addressees only and is not to be taken in substitution for the exercise of judgement by addressees, who should obtain separate independent legal or financial advice. The DBS Group accepts no liability whatsoever for any direct, indirect and/or consequential loss (including any claims for loss of profit) arising from any use of and/or reliance upon this document and/or further communication given in relation to this document. This document is not to be construed as an offer or a solicitation of an offer to buy or sell any securities. The DBS Group, along with its affiliates and/or persons associated with any of them may from time to time have interests in the securities mentioned in this document. The DBS Group, may have positions in, and may effect transactions in securities mentioned herein and may also perform or seek to perform broking, investment banking and other banking services for these companies. Any valuations, opinions, estimates, forecasts, ratings or risk assessments herein constitutes a judgment as of the date of this report, and there can be no assurance that future results or events will be consistent with any such valuations, opinions, estimates, forecasts, ratings or risk assessments. The information in this document is subject to change without notice, its accuracy is not guaranteed, it may be incomplete or condensed, it may not contain all material information concerning the company (or companies) referred to in this report and the DBS Group is under no obligation to update the information in this report. This publication has not been reviewed or authorized by any regulatory authority in Singapore, Hong Kong or elsewhere. There is no planned schedule or frequency for updating research publication relating to any issuer. The valuations, opinions, estimates, forecasts, ratings or risk assessments described in this report were based upon a number of estimates and assumptions and are inherently subject to significant uncertainties and contingencies. It can be expected that one or more of the estimates on which the valuations, opinions, estimates, forecasts, ratings or risk assessments were based will not materialize or will vary significantly from actual results. Therefore, the inclusion of the valuations, opinions, estimates, forecasts, ratings or risk assessments described herein IS NOT TO BE RELIED UPON as a representation and/or warranty by the DBS Group (and/or any persons associated with the aforesaid entities), that: (a) such valuations, opinions, estimates, forecasts, ratings or risk assessments or their underlying assumptions will be achieved, and (b) there is any assurance that future results or events will be consistent with any such valuations, opinions, estimates, forecasts, ratings or risk
assessments stated therein. Please contact the primary analyst for valuation methodologies and assumptions associated with the covered companies or price targets. Any assumptions made in this report that refers to commodities, are for the purposes of making forecasts for the company (or companies) mentioned herein. They are not to be construed as recommendations to trade in the physical commodity or in the futures contract relating to the commodity referred to in this report. DBSVUSA, a US-registered broker-dealer, does not have its own investment banking or research department, has not participated in any public offering of securities as a manager or co-manager or in any other investment banking transaction in the past twelve months and does not engage in market-making.
ASIAN INSIGHTS VICKERS SECURITIES
Page 17
Company Guide
Haier Electronics
ANALYST CERTIFICATION The research analyst(s) primarily responsible for the content of this research report, in part or in whole, certifies that the views about the companies and their securities expressed in this report accurately reflect his/her personal views. The analyst(s) also certifies that no part of his/her compensation was, is, or will be, directly or indirectly, related to specific recommendations or views expressed in the report. The research analyst (s) primarily responsible for the content of this research report, in part or in whole, certifies that he or his associate1 does not serve as an officer of the issuer or the new listing applicant (which includes in the case of a real estate investment trust, an officer of the management company of the real estate investment trust; and in the case of any other entity, an officer or its equivalent counterparty of the entity who is responsible for the management of the issuer or the new listing applicant) and the research analyst(s) primarily responsible for the content of this research report or his associate does not have financial interests2 in relation to an issuer or a new listing applicant that the analyst reviews. DBS Group has procedures in place to eliminate, avoid and manage any potential conflicts of interests that may arise in connection with the production of research reports. The research analyst(s) responsible for this report operates as part of a separate and independent team to the investment banking function of the DBS Group and procedures are in place to ensure that confidential information held by either the research or investment banking function is handled appropriately. There is no direct link of DBS Group's compensation to any specific investment banking function of the DBS Group. COMPANY-SPECIFIC / REGULATORY DISCLOSURES 1. DBS Bank Ltd, DBS HK, DBSVS, DBSV HK or their subsidiaries and/or other affiliates have a proprietary position in Haier Electronics
Group Company Limited (1169 HK) recommended in this report as of 02 Jun 2017.
2. Neither DBS Bank Ltd, DBS HK nor DBSV HK market makes in equity securities of the issuer(s) or company(ies) mentioned in this Research Report.
3. Compensation for investment banking services: DBS Bank Ltd, DBS HK, DBSVS, DBSV HK, their subsidiaries and/or other affiliates of DBSVUSA have received compensation, within the past 12 months for investment banking services from CCS Supply Chain Management Company Limited (600180 CH) as of 30 Apr 2017. DBSVUSA does not have its own investment banking or research department, nor has it participated in any public offering of securities as a manager or co-manager or in any other investment banking transaction in the past twelve months. Any US persons wishing to obtain further information, including any clarification on disclosures in this disclaimer, or to effect a transaction in any security discussed in this document should contact DBSVUSA exclusively.
4. Disclosure of previous investment recommendation produced: DBS Bank Ltd, DBSVS, DBSVHK, their subsidiaries and/or other affiliates of DBSVUSA may have published other investment recommendations in respect of the same securities / instruments recommended in this research report during the preceding 12 months. Please contact the primary analyst listed in the first page of this report to view previous investment recommendations published by DBS Bank Ltd, DBSVHK, their subsidiaries and/or other affiliates of DBSVUSA in the preceding 12 months.
1 An associate is defined as (i) the spouse, or any minor child (natural or adopted) or minor step-child, of the analyst; (ii) the trustee of a trust of
which the analyst, his spouse, minor child (natural or adopted) or minor step-child, is a beneficiary or discretionary object; or (iii) another person accustomed or obliged to act in accordance with the directions or instructions of the analyst.
2 Financial interest is defined as interests that are commonly known financial interest, such as investment in the securities in respect of an issuer or a new listing applicant, or financial accommodation arrangement between the issuer or the new listing applicant and the firm or analysis. This term does not include commercial lending conducted at arm's length, or investments in any collective investment scheme other than an issuer or new listing applicant notwithstanding the fact that the scheme has investments in securities in respect of an issuer or a new listing applicant.
ASIAN INSIGHTS VICKERS SECURITIES
Page 18
Company Guide
Haier Electronics
RESTRICTIONS ON DISTRIBUTION
General This report is not directed to, or intended for distribution to or use by, any person or entity who is a citizen or resident of or located in any locality, state, country or other jurisdiction where such distribution, publication, availability or use would be contrary to law or regulation.
Australia This report is being distributed in Australia by DBS Bank Ltd. (“DBS”) or DBS Vickers Securities (Singapore) Pte Ltd (“DBSVS”) or DBS Vickers (Hong Kong) Limited (“DBSVHK”), which are exempted from the requirement to hold an Australian Financial Services Licence under the Corporation Act 2001 (“CA”) in respect of financial services provided to the recipients. Both DBS and DBSVS are regulated by the Monetary Authority of Singapore under the laws of Singapore, and DBSVHK is regulated by the Securities and Futures Commission of Hong Kong under the laws of Hong Kong, which differ from Australian laws. Distribution of this report is intended only for “wholesale investors” within the meaning of the CA.
Hong Kong This report is being distributed in Hong Kong by DBS Bank Ltd., DBS Bank (Hong Kong) Limited and DBS Vickers (Hong Kong) Limited, which is registered with or licensed by the Hong Kong Securities and Futures Commission to carry out the regulated activity of advising on securities
Indonesia This report is being distributed in Indonesia by PT DBS Vickers Sekuritas Indonesia.
Malaysia This report is distributed in Malaysia by AllianceDBS Research Sdn Bhd ("ADBSR"). Recipients of this report, received from ADBSR are to contact the undersigned at 603-2604 3333 in respect of any matters arising from or in connection with this report. In addition to the General Disclosure/Disclaimer found at the preceding page, recipients of this report are advised that ADBSR (the preparer of this report), its holding company Alliance Investment Bank Berhad, their respective connected and associated corporations, affiliates, their directors, officers, employees, agents and parties related or associated with any of them may have positions in, and may effect transactions in the securities mentioned herein and may also perform or seek to perform broking, investment banking/corporate advisory and other services for the subject companies. They may also have received compensation and/or seek to obtain compensation for broking, investment banking/corporate advisory and other services from the subject companies.
Wong Ming Tek, Executive Director, ADBSR
Singapore This report is distributed in Singapore by DBS Bank Ltd (Company Regn. No. 196800306E) or DBSVS (Company Regn No. 198600294G), both of which are Exempt Financial Advisers as defined in the Financial Advisers Act and regulated by the Monetary Authority of Singapore. DBS Bank Ltd and/or DBSVS, may distribute reports produced by its respective foreign entities, affiliates or other foreign research houses pursuant to an arrangement under Regulation 32C of the Financial Advisers Regulations. Where the report is distributed in Singapore to a person who is not an Accredited Investor, Expert Investor or an Institutional Investor, DBS Bank Ltd accepts legal responsibility for the contents of the report to such persons only to the extent required by law. Singapore recipients should contact DBS Bank Ltd at 6327 2288 for matters arising from, or in connection with the report.
Thailand This report is being distributed in Thailand by DBS Vickers Securities (Thailand) Co Ltd. Research reports distributed are only intended for institutional clients only and no other person may act upon it.
United Kingdom
This report is produced by DBSVHK which is regulated by the Hong Kong Securities and Futures Commission This report is disseminated in the United Kingdom by DBS Vickers Securities (UK) Ltd (“DBSVUK”). DBSVUK is authorised and regulated by the Financial Conduct Authority in the United Kingdom. In respect of the United Kingdom, this report is solely intended for the clients of DBSVUK, its respective connected and associated corporations and affiliates only and no part of this document may be (i) copied, photocopied or duplicated in any form or by any means or (ii) redistributed without the prior written consent of DBSVUK. This communication is directed at persons having professional experience in matters relating to investments. Any investment activity following from this communication will only be engaged in with such persons. Persons who do not have professional experience in matters relating to investments should not rely on this communication.
Dubai
This research report is being distributed by DBS Bank Ltd., (DIFC Branch) having its office at PO Box 506538, 3rd Floor, Building 3, East Wing, Gate Precinct, Dubai International Financial Centre (DIFC), Dubai, United Arab Emirates. DBS Bank Ltd., (DIFC Branch) is regulated by The Dubai Financial Services Authority. This research report is intended only for professional clients (as defined in the DFSA rulebook) and no other person may act upon it.
United States This report was prepared by DBSVHK. DBSVUSA did not participate in its preparation. The research analyst(s) named on this report are not registered as research analysts with FINRA and are not associated persons of DBSVUSA. The research analyst(s) are not subject to FINRA Rule 2241 restrictions on analyst compensation, communications with a subject company, public appearances and trading securities held by a research analyst. This report is being distributed in the United States by DBSVUSA, which accepts responsibility for its contents. This report may only be distributed to Major U.S. Institutional Investors (as defined in SEC Rule 15a-6) and to such other institutional investors and qualified persons as DBSVUSA may authorize. Any U.S. person receiving this report who wishes to effect transactions in any securities referred to herein should contact DBSVUSA directly and not its affiliate.
Other jurisdictions
In any other jurisdictions, except if otherwise restricted by laws or regulations, this report is intended only for qualified, professional, institutional or sophisticated investors as defined in the laws and regulations of such jurisdictions.
DBS Vickers (Hong Kong) Limited
18th Floor Man Yee building, 68 Des Voeux Road Central, Central, Hong Kong
Tel: (852) 2820-4888, Fax: (852) 2868-1523
Company Regn. No. 31758
Related Documents

![Haier Electronics Group [1169.HK] - jrj.com.cnpg.jrj.com.cn/acc/Res/HK_RES/STOCK/2014/6/3/0a...Haier Electronics Group [1169.HK] Haier is a leading white goods manufacturer and an](https://static.cupdf.com/doc/110x72/5fedcac136c40f2819328dd9/haier-electronics-group-1169hk-jrjcomcnpgjrjcomcnaccreshkresstock2014630a.jpg)