PRACTICAL THERAPEUTICS Drugs 41 (6): 857-874. 1991 00 12-6667/91/0006-0857/$09.00/0 © Adis International Limited. All rights reserved. DRU127 Haemodynamic Monitoring Problems, Pitfalls and Practical Solutions Leo L. Bossaert, Hendrik E. Demey, Raj De Jongh and Luc Heytens Department of Intensive Care. University of Antwerp - University Hospital, Edegem, Belgium Contents 857 859 860 860 860 62 62 862 63 864 865 866 866 867 867 867 868 868 868 869 869 869 69 869 870 870 70 71 71 72 872 Summary Summary I. Global Therapeutic Approach to Shock 1.1 Optimal Haemoglobin Concentration 1.2 Oxygen-Haemoglobin Dissociation Curve 1.3 Blood Oxygen Saturation 104 Cardiac Output 104.1 Heart Rate 1.4.2 Preload 104.3 Afterload 1.404 Inotropic Agents 2. Problems with the Correct Measurement and Interpretation of PCWP 2.1 Correct Measurement of PCWP 2.2 PCWP-LAP Relationship 2.3 LAP-LVEDP Relationship 204 LVEDP-L VEDV Relationship 2.5 Influence of Juxtacardiac Pressure 3. Measuring 'Effective Pulmonary Capillary' Pressures 4. Pulmonary Shunt and Real-Time Mixed Venous Oxygen Saturation Monitoring 5. Measuring the COP 6. Measuring Cardiac Output 7. Cardiac Disorders 7.1 Arrhythmias 7.2 Pacing Swan Ganz Catheter 7.3 Haemodynamic Subsets in Acute Infarction 704 Right Ventricular Infarction 7.5 New Murmur after Acute Myocardial Infarction 7.6 Pericardial Tamponade 8. Pulmonary Embolism 9. Sepsis 10. Complications of Invasive Haemodynamic Monitoring II. Conclusion The synthesis of adenosine triphosphate (ATP) depends on the coordinated interaction of oxygen delivery and glucose breakdown in the Krebs cycle. Cellular oxygen depots are non- PRACTICAL THERAPEUTICS Drugs 41 (6): 857-874. 1991 00 12-6667/91/0006-0857/$09.00/0 © Adis International Limited. All rights reserved. DRU127 Haemodynamic Monitoring Problems, Pitfalls and Practical Solutions Leo L. Bossaert, Hendrik E. Demey, Raj De Jongh and Luc Heytens Department of Intensive Care. University of Antwerp - University Hospital, Edegem, Belgium Contents 857 859 860 860 860 62 62 862 63 864 865 866 866 867 867 867 868 868 868 869 869 869 69 869 870 870 70 71 71 72 872 Summary Summary I. Global Therapeutic Approach to Shock 1.1 Optimal Haemoglobin Concentration 1.2 Oxygen-Haemoglobin Dissociation Curve 1.3 Blood Oxygen Saturation 104 Cardiac Output 104.1 Heart Rate 1.4.2 Preload 104.3 Afterload 1.404 Inotropic Agents 2. Problems with the Correct Measurement and Interpretation of PCWP 2.1 Correct Measurement of PCWP 2.2 PCWP-LAP Relationship 2.3 LAP-LVEDP Relationship 204 LVEDP-L VEDV Relationship 2.5 Influence of Juxtacardiac Pressure 3. Measuring 'Effective Pulmonary Capillary' Pressures 4. Pulmonary Shunt and Real-Time Mixed Venous Oxygen Saturation Monitoring 5. Measuring the COP 6. Measuring Cardiac Output 7. Cardiac Disorders 7.1 Arrhythmias 7.2 Pacing Swan Ganz Catheter 7.3 Haemodynamic Subsets in Acute Infarction 704 Right Ventricular Infarction 7.5 New Murmur after Acute Myocardial Infarction 7.6 Pericardial Tamponade 8. Pulmonary Embolism 9. Sepsis 10. Complications of Invasive Haemodynamic Monitoring II. Conclusion The synthesis of adenosine triphosphate (ATP) depends on the coordinated interaction of oxygen delivery and glucose breakdown in the Krebs cycle. Cellular oxygen depots are non- PRACTICAL THERAPEUTICS Drugs 41 (6): 857-874. 1991 00 12-6667/91/0006-0857/$09.00/0 © Adis International Limited. All rights reserved. DRU127 Haemodynamic Monitoring Problems, Pitfalls and Practical Solutions Leo L. Bossaert, Hendrik E. Demey, Raj De Jongh and Luc Heytens Department of Intensive Care. University of Antwerp - University Hospital, Edegem, Belgium Contents 857 859 860 860 860 62 62 862 63 864 865 866 866 867 867 867 868 868 868 869 869 869 69 869 870 870 70 71 71 72 872 Summary Summary I. Global Therapeutic Approach to Shock 1.1 Optimal Haemoglobin Concentration 1.2 Oxygen-Haemoglobin Dissociation Curve 1.3 Blood Oxygen Saturation 104 Cardiac Output 104.1 Heart Rate 1.4.2 Preload 104.3 Afterload 1.404 Inotropic Agents 2. Problems with the Correct Measurement and Interpretation of PCWP 2.1 Correct Measurement of PCWP 2.2 PCWP-LAP Relationship 2.3 LAP-LVEDP Relationship 204 LVEDP-L VEDV Relationship 2.5 Influence of Juxtacardiac Pressure 3. Measuring 'Effective Pulmonary Capillary' Pressures 4. Pulmonary Shunt and Real-Time Mixed Venous Oxygen Saturation Monitoring 5. Measuring the COP 6. Measuring Cardiac Output 7. Cardiac Disorders 7.1 Arrhythmias 7.2 Pacing Swan Ganz Catheter 7.3 Haemodynamic Subsets in Acute Infarction 704 Right Ventricular Infarction 7.5 New Murmur after Acute Myocardial Infarction 7.6 Pericardial Tamponade 8. Pulmonary Embolism 9. Sepsis 10. Complications of Invasive Haemodynamic Monitoring II. Conclusion The synthesis of adenosine triphosphate (ATP) depends on the coordinated interaction of oxygen delivery and glucose breakdown in the Krebs cycle. Cellular oxygen depots are non- PRACTICAL THERAPEUTICS Drugs 41 (6): 857-874. 1991 00 12-6667/91/0006-0857/$09.00/0 © Adis International Limited. All rights reserved. DRU127 Haemodynamic Monitoring Problems, Pitfalls and Practical Solutions Leo L. Bossaert, Hendrik E. Demey, Raj De Jongh and Luc Heytens Department of Intensive Care. University of Antwerp - University Hospital, Edegem, Belgium Contents 857 859 860 860 860 62 62 862 63 864 865 866 866 867 867 867 868 868 868 869 869 869 69 869 870 870 70 71 71 72 872 Summary Summary I. Global Therapeutic Approach to Shock 1.1 Optimal Haemoglobin Concentration 1.2 Oxygen-Haemoglobin Dissociation Curve 1.3 Blood Oxygen Saturation 104 Cardiac Output 104.1 Heart Rate 1.4.2 Preload 104.3 Afterload 1.404 Inotropic Agents 2. Problems with the Correct Measurement and Interpretation of PCWP 2.1 Correct Measurement of PCWP 2.2 PCWP-LAP Relationship 2.3 LAP-LVEDP Relationship 204 LVEDP-L VEDV Relationship 2.5 Influence of Juxtacardiac Pressure 3. Measuring 'Effective Pulmonary Capillary' Pressures 4. Pulmonary Shunt and Real-Time Mixed Venous Oxygen Saturation Monitoring 5. Measuring the COP 6. Measuring Cardiac Output 7. Cardiac Disorders 7.1 Arrhythmias 7.2 Pacing Swan Ganz Catheter 7.3 Haemodynamic Subsets in Acute Infarction 704 Right Ventricular Infarction 7.5 New Murmur after Acute Myocardial Infarction 7.6 Pericardial Tamponade 8. Pulmonary Embolism 9. Sepsis 10. Complications of Invasive Haemodynamic Monitoring II. Conclusion The synthesis of adenosine triphosphate (ATP) depends on the coordinated interaction of oxygen delivery and glucose breakdown in the Krebs cycle. Cellular oxygen depots are non-

Welcome message from author
This document is posted to help you gain knowledge. Please leave a comment to let me know what you think about it! Share it to your friends and learn new things together.
Transcript

PRACTICAL THERAPEUTICS
Drugs 41 (6): 857-874. 1991 00 12-6667/91/0006-0857/$09.00/0 © Adis International Limited. All rights reserved.
DRU127
Haemodynamic Monitoring Problems, Pitfalls and Practical Solutions
Leo L. Bossaert, Hendrik E. Demey, Raj De Jongh and Luc Hey tens Department of Intensive Care. University of Antwerp - University Hospital, Edegem, Belgium
Contents
857 859 860 860 860 62 62
862 63
864 865 866 866 867 867 867 868 868 868 869 869 869
69 869 870 870
70 71 71 72
872
Summary
Summary I. Global Therapeutic Approach to Shock
1.1 Optimal Haemoglobin Concentration 1.2 Oxygen-Haemoglobin Dissociation Curve 1.3 Blood Oxygen Saturation 104 Cardiac Output
104.1 Heart Rate 1.4.2 Preload 104.3 Afterload 1.404 Inotropic Agents
2. Problems with the Correct Measurement and Interpretation of PCWP 2.1 Correct Measurement of PCWP 2.2 PCWP-LAP Relationship 2.3 LAP-LVEDP Relationship 204 L VEDP-L VEDV Relationship 2.5 Influence of Juxtacardiac Pressure
3. Measuring 'Effective Pulmonary Capillary' Pressures 4. Pulmonary Shunt and Real-Time Mixed Venous Oxygen Saturation Monitoring 5. Measuring the COP 6. Measuring Cardiac Output 7. Cardiac Disorders
7.1 Arrhythmias 7.2 Pacing Swan Ganz Catheter 7.3 Haemodynamic Subsets in Acute Infarction 704 Right Ventricular Infarction 7.5 New Murmur after Acute Myocardial Infarction 7.6 Pericardial Tamponade
8. Pulmonary Embolism 9. Sepsis 10. Complications of Invasive Haemodynamic Monitoring II. Conclusion
The synthesis of adenosine triphosphate (ATP) depends on the coordinated interaction of oxygen delivery and glucose breakdown in the Krebs cycle. Cellular oxygen depots are non-

858 Drugs 41 (6) 1991
existent, therefore the peripheral cells are totally dependent on the circulation for sufficient oxygen delivery. Shock is the clinical manifestation of cellular oxygen craving. The commonly measured variables - blood pressure, heart rate, urinary output, cardiac output and systemic vascular resistance - are not sensitive or accurate enough to warn of impending death in acutely ill patients nor are they appropriate for monitoring therapy. Calculated oxygen transport and oxygen consumption parameters provide the best available measures of functional adequacy of both circulation and metabolism.
In order to optimise oxygen delivery (D02), 4 interacting factors must be taken into account: cardiac output, blood haemoglobin content, haemoglobin oxygen saturation and avidity of oxygen binding to haemoglobin. For viscosity reasons, the optimal haemoglobin concentration is in the vicinity of90 to 100 gil, but for optimising the oxygen transport 100 to 115 gil or a haematocrit of 30 to 35% seems better. The p50 (the p02 at which haemoglobin is 50% saturated) describes the oxygen-haemoglobin dissociation curve; normally its value is ± 27mm Hg. It can be influenced by attaining normal body temperature, pH, pC02 and serum phosphorous levels. In order to obtain an arterial blood saturation (Sa02) of more than 90% with acceptable haemodynamics, the ventilation mode and inspired oxygen fraction (Fj02) must be adapted; care must be taken not to stress the labile circulation with haemodynamic compromising ventilation techniques [e.g. high positive end expiratory pressure (PEEP) levels, inverse-ratio ventilation, etc.).
The factor most amenable to manipulation is the cardiac output, with its 4 determinants -preload, afterload, contractility and heart rate. In daily clinical practice, heart rate should be between 80 and 120 beats/min; small variations are acceptable. Important deviations must be treated by chemically [isoprenaline (isoproterenol») or electrically (pacing techniques) accelerating the heart, or with the different antiarrhythmic drugs. A wide variety of agents is available to decrease the preload: diuretics [especially furosemide (frusemide»), venodilators like nitroglycerin (glyceryl trinitrate), isosorbide dinitrate (sorbide nitrate) and sodium nitroprusside, ACE inhibitors, phlebotomy, and haemofiltration techniques (peritoneal or haemodialysis, continuous arteriovenous haemofiltration). To increase the preload, volume loading using a rigid protocol ('rule of 7 and 3'), preferably with colloids, or vasopressor agents [norepinephrine (noradrenaline), epinephrine (adrenaline), dopamine) are useful. Arterial vasopressors are needed to improve perfusion pressure of 'critical' (coronary and cerebral) arteries. Afterload can be decreased by arterial vasodilators. Predominantly arterial dilators are hydralazine and c1onidine, while sodium nitroprusside, nitroglycerin and isosorbide dinitrate have combined arterial and venous dilating actions. Norepinephrine, epinephrine and dopamine combine inotropic with vasoconstricting properties; dobutamine, dopexamine and the phosphodiesterase inhibitors amrinone, milrinone and enoximone are combined positive inotropic and afterload reducing drugs. The phosphodiesterase inhibitors possess lusitropic (i.e. promoting myocardial relaxation) I.:ffects. Myocardial oxygen consumption is certainly increased by norepinephrine, epinephrine, isoprenaline and dopamine, while dobutamine only has minimal effects and the phosphodiesterase inhibitors lower it.
To treat a critically ill patient according to the abovementioned strategy, the intensive care physician must rely on invasive haemodynamic measurements. Several derived parameters, all critically dependent on a correct determination of the cardiac output, give insight into pathophysiological process; they are also necessary to guide sometimes complex pharmacological manipulations in order to maximise oxygen delivery and consumption.
All cells of the human body need an adequate delivery of nutrients and oxygen for optimal functioning. The supply of the cell fuel adenosine triphosphate (A TP) depends on the coordinated interaction of oxygen delivery and glucose breakdown in the Krebs cycle. Whereas limited amounts of glucose can be stockpiled in the cells, depots of
oxygen are nonexistent. Therefore, peripheral cells are totally dependent on the circulation for an adequate delivery of this essential nutrient. Under normal conditions, global systemic oxygen delivery (D02) is sufficient to make the local tissue oxygen consumption (V02) independent of 02 supply. Under a certain critical level, however, autoregu-

Haemodynamic Monitoring
latory mechanisms can no longer adapt 02 supply to local tissue needs and local V02 becomes supply dependent. This critical level differs for all major organs and tissues, thereby obscuring the exact position of the critical level of 002 on the 002/ V02 curve (Pinsky & Schlichtig 1990).
The term 'shock' nonspecifically characterises the entire spectrum of pathophysiological processes leading to global cellular dysfunCtion or cell death. Accordingly, recent ideas about shock treatment stress the importance of augmenting oxygen transport and stimulating oxygen consumption by peripheral cells.
The variables that are commonly monitored in shock, such as heart rate, systolic and diastolic blood pressure, urine output, cardiac output, and vascular resistances, unfortunately provide only a useful description of the end-stage of circulatory failure . They are not sensitive or accurate enough to warn of impending death in acutely ill patients; neither are they appropriate for monitoring therapy. These variables are used because they are convenient to measure, not because · they have predictive capability.
According to the work of Shoemaker and others, 'optimal' instead of 'normal' haemodynamic parameters must be pursued in order to secure survival of the shock victim (Edwards 1990; Edwards et al. 1989; Shoemaker 1989; Shoemaker et al. 1990). Calculated oxygen transport and oxygen consumption parameters provide the best available measuresofthe functional adequacy of both circulation and metabolism.
Data .collection on oxygen metabolism in critically ill patients depends on invasive catheterisation using the Swan Ganz pulmonary artery catheter (PAC). Furthermore, Eisenberg et al. (1984) have convincingly shown that clinical evaluation of the critically ill patient is frequently wrong and that invasive haemodynamic monitoring changes therapy in 50% of patients. Information gathered from clinical and radiographic elements correlates poorly with the parameters obtained invasively using the PAC (Dash et al. 1980). BasicaIly,the PAC has 3 fundamental applications: pressure monitoring, flow measurement, and blood sampling. Newer
859
developments in catheter manufacturing have broadened its scope to include monitoring of mixed venous oxygen saturation, right ventricular ejection fraction and cardiac pacing.
This article provides an overview of haemodynamic monitoring and oxygen-dependent parameters in the everyday management of intensive care patients. Furthermore, it demonstrates that good haemodynamic monitoring is more than just the observation of wedge pressures and cardiac output; much more valuable information can be obtained by performing a complete haemodynamic observation, including calculation of derived parameters (Shoemaker 1989).
1. Global Therapeutic Approach to Shock
In order to optimise 002 to the peripheral cells, 4 interacting factors must be manipulated: blood haemoglobin content (HgB); avidity of oxygen binding to haemoglobin; haemoglobin oxygen saturation (02Sat); and cardiac output (CO) [fig. I].
I Blood haemoglobin
I Haemoglobin oxygen
conlenl saturation
I
." " I
Oxygen delivery (DO,,) • [1.39 x HgB (gil) x 0aSal + 0.0031 x paOJ x CO (Umin)
J~ J~
I Oxygen haemoglobin
I Cardiac output
dissociation curve • Preload • Afterload • Inotropic state • Heart rate
Fig. 1. Factors determining oxygen delivery. Abbreviations: D02 = oxygen delivery; HgB = blood haemoglobin content; 02 Sat = haemoglobin oxygen saturation; CO = cardiac output; pa02 = partial pressure of oxygen. The figure of 1.39 is the Hufner factor (the amount of oxygen in ml bound to Ig of haemoglobin).

860
100
90
§ 80 .~ 70 :::l
gj 60 C\I
050 (])
~ 40
~ 30 ,f 20
10
Ou.~-r~~~-r~r-~~-'--' o 10 20 30 40 50 60 70 80 90 100
p02 (mm Hg)
Fig. 2. The oxygen-haemoglobin dissociation curve with changes in the p50 (p02 at which haemoglobin is 50% saturated). Diminished p50 ("') is associated with a decrease in 2,3-DPG, decrease in pC02, hypothermia, decrease in adenosine triphosphate (A Tp) and alkaiosis. Increased p50 (_) is associated with an increase in 2,3-DPG and pC02, hyperthermia, increase in A TP and acidosis.
1.1 Optimal Haemoglobin Concentration
Defining the 'optimal' haemoglobin concentration or haematocrit is a matter of discussion. For optimal oxygen transport, the haemoglobin concentration should be as normal as possible. On the other hand, a high haemoglobin concentration increases plasma viscosity, jeopardising capillary blood flow. Furthermore, large vessel haematocrit, routinely measured in daily clinical practice, is higher than the haematocrit in small vessels and capillaries, due to plasma skimming. For viscosity reasons, optimal haemoglobin concentration is in the vicinity of 90 to 100 giL, but for optimising the transport of oxygen a haemoglobin level of 100 to 115 giL (Bryan-Brown 1988) or a haematocrit of 30 to 35% (Dhainaut et al. 1990) has been recommended.
1.2 Oxygen Haemoglobin Dissociation Curve
The binding avidity of oxygen to haemoglobin is described by the sigmoidally shaped oxygenhaemoglobin dissociation curve (OHDC): strong binding favours oxygen uptake in the lung capil-
Drugs 41 (6) 1991
laries but will hamper its unloading in the peripheral tissues (fig. 2). The degree of binding can be appreciated through the p50 (the pOz at which haemoglobin is 50% saturated). Normally this value is ± 27mm Hg. Several factors will alter the OHDC, and thus the p50.
The p50 is difficult to measure but can be calculated according to the formula of Giovannini et al. (1989):
p50 = (0.75 X PV02) - (0.43 X SV02) + 29.13 [Eq. 1]
where PV02 = venous partial pressure of 02; SV02 = mixed venous blood saturation. The importance of the OHDC can be seen during correction of existing metabolic acidosis using sodium bicarbonate: this will shift the OHDC to the left (i.e. stronger binding of oxygen to haemoglobin), resulting in less oxygen unloading in the tissues, and possibly leading to tissue hypoxia and organ dysfunction. Mild acidosis potentiates oxygen unloading and increases oxygen delivery.
1.3 Blood Oxygen Saturation
Haemoglobin oxygen saturation can be augmented by increasing the inspired oxygen fraction (Fi02), but high inspired oxygen fractions are toxic for the pulmonary parenchyma. A critically ill patient often has to be intubated and ventilated to optimise ventilation and protect against aspiration. Furthermore, sedation and eventually muscle paralysis will reduce oxygen consumption CV02) and C02 production by respiratory muscles, thereby lowering the demands put on the circulation by 20 to 25%. The ventilation mode and Fi02 must be adapted in order to obtain an arterial blood saturation (Sa02) of more than 90% with acceptable haemodynamics. Care must be taken not to stress the labile circulation with haemodynamic compromising ventilation techniques [e.g. high positive end expiratory pressure (PEEP) levels,inverse-ratio ventilation] if not absolutely indicated. Oxygen saturation must always be measured and not calculated. The equations used in the different blood

Haemodynamic Monitoring 861
Table I. Haemodynamic effects of the various catecholamines and phosphodiesterase inhibitors
Drug Usual Usual Diuresis Preload Afterload Positive Tachycardia
indication dosage inotropy reduction increase reduction increase range
Furosemide Preload 20-200mg .... .... .... in .... in case of
reduction case of hypovolaemia
hypo-
volaemia
Atropine Symptomatic 0.S-1mg .... bradycardia bolus IV
Isoprenaline Symptomatic 2-20 I'g/min; .... .... bradycardia titrate as
needed Nitroglycerin; 1. Preload and O.S-S I'g/kg/ .... in high
ISDN afterload min doses
reduction 2. Coronary
ischaemia Sodium Afterload and Starting .... in high
nitroprusside preload from O.S doses
reduction I'g/kg/min upwards
ACE inhibitors 1. Afterload 12.S-2Smg
(captopril) reduction SL or PO,
2. Suppression 2-4 times
of renin- daily
aldosterone-
angiotensin II system
Norepinephrine; 1. Vaso- 21'9/min, epinephrine constriction titrated
2. Positive upwards inotropy
Dopamine 1. Stimulation 2-S I'g/kg/ .... of renal and min
splanchnic blood flow
2. Vaso- S I'g/kg/min, .... .... .... .... in case of
constriction titrated hypovolaemia
3. Positive upwards .... .... .... .... inotropy above 20
I'g/kg/min Dobutamine Positive 51'9/kg/min .... in .... in high
inotropy titrated high doses upwards doses
Amrinone Positive 5-2O I'9/k9/ .... inotropy; min after a
lusitropic loading effects bolus of 2.5
mg/kg
Abbreviations: ISDN = isosorbide dinitrate; ACE = angiotensin converting enzyme; IV = intravenous; SL = sublingual; PO = oral.

862
gas analysers give results for oxygen saturation that differ from the true, or measured, saturation (Breuer et aL 1989).
104 Cardiac Output
The most important factor in optimising oxygen transport, and the one most amenable to manipulation, is cardiac output, with its 4 determinants: preload, afterload, contractility and heart rate. Table I lists the catecholamines and phosphodiesterase inhibitors used, and their effects; table II lists the most important vasoactive drugs.
1.4.1 Heart Rate Extreme bradycardia and tachycardia both in
terfere with cardiac output. Bradycardia results in increased ventricular end-diastolic volume, increasing myocardial wall tension and myocardial oxygen consumption. Coronary perfusion falls due to increased wall tension and compression of nutritive myocardial vessels. Loss of effective atrial contraction (atrial fibrillation, atrioventricular dissociation) leads to loss of 'atrial kick' or the atrial contribution to ventricular filling.
Therapy consists of chemically [atropine, isoprenaline (isoproterenol)] or electrically increasing the heart rate (pacing). Isoprenaline must be used cautiously: inadvertent use may lead to severe hypotension and/or excessive tachycardia. Pacing techniques include atrial, ventricular and A V sequentiaipacing, the former being the easiest to implement and the latter giving the best haemodynamic results. Increases of up to 30% of the cardiac output can be obtained with properly used A V sequential pacing and correct choice pf the sometimes critical A-V interval (Hartzler et al. 1977). Tachycardia interferes with coronary perfusion, increases myocardial oxygen consumption and lowers stroke volume (SV), especially in the case of mitral or aortic stenosis.
Proper therapy consists of correct electrophysiological diagnosis of the type of tachyarrhythmia and appropriateJ.lse of antiarrhythmic drugs (Rinkenberger & Nacarrelli 1 989a,b).In daily clinical
Drugs 41 (6) 1991
practice, heart rate should be between 80 and 120 beats/min; . small variations are acceptable.
1.4.2 Preload To decrease the preload (table III) a wide variety
of agents and techniques is available: diuretics, venodilators, ACE inhibitors, phlebotomy, and haemofiltration techniques (e.g. peritoneal or haemodialysis, continuous arteriovenous haemofiltration). The most widely used diuretic is furosemide (frusemide). Within a few minutes · of administration, it dilates venous capacitance vessels and lowers preload. About 30 to 45 minutes later, it increases chloride and secondarily sodium loss in the ascending loop of Henle (Narins & Chusid 1986). A recent report (Kraus et al. 1990) even describes an initial increase in pulmonary capillary wedge pressure (PCWP). Nitroglycerin (glyceryl trinitrate), isosorbide dinitrate (sorbide nitrate), and sodium nitroprusside dilate the venous system. Intravenous doses start at 0.5 J,Lg/kg/milititrated upwards every 5 to 10 minutes according to the observed effects (Parrillo 1983). Intravenous nitroglycerin preparations are unstable in water and therefore contain different amounts of alcohol and propylene glycol that can lead to inebriatioIl, hyperosmolality, coma, lactic acidosis and haemolysis (Demey et al. 1988). Nitroglycerin itself can induce intracranial hypertension (Ohar et al. 1985) while induction of possible · heparin resistance is under discussion (Bode et al. 1990; Habbab & Haft 1987). ACE inhibitors inhibit the breakdown of vasodilating kinins and the conversion of angiotensin into angiotensin II" resulting in diuresis, vasodilation, and decreased circulating catecholamine and vasopressin . concentrations (Deedmania 1990). Given sublingually (e.g. captopril12.5 to 25mg), a clinical effect is observed after about 15 minutes (Haude et al. 1989, 1990).
To increase preload, volume loading is frequently appropriate, The type of fluid, crystalloid versus colloid, is a matter of longlasting debate. For haemodynamic reasons, it is important to expand the circulating volume in the intravascular space and only secondarily the interstitial space, Accordingly, the use of colloidal solutions (hy-

Haemodynamic Monitoring 863
Table II. The most important vasoactive drugs and their effects (adapted from Goethals & Demey 1984; Wynands 1989; Zaritsky & Chernow 1983)
Effect on cardiovascular receptors
U1 U2 (31
Norepinephrine 4+ 4+
Epinephrine 4+ (in high 3+ 4+ (in low
doses) doses)
Isoprenaline 0 2+ 4+
Dopamine o to 4+ + 4+
(above 5 J.!g/ kg/min)
Dobutamine o to + 0 4+
Phosphodiesterase inhibitors
droxy ethyl starch, gelatins or plasma proteins) is preferred. Some authors advocate the use of colloids and crystalloids in a 1 : 2 ratio (Hillman 1986; Klotz & Kroemer 1987; Shoemaker 1987; Twigley & Hillman 1985). Any fluid challenge must be administered in a standardised manner in order to avoid sudden increases in PCWP and pulmonary congestion due to poor ventricular compliance. The 'rule of 7 and 3' describes how to infuse fluid under controlled conditions (fig. 3).
Preload can also be increased by a I-adrenoceptor agonists such as norepinephrine (noradrenaline), epinephrine (adrenaline) and dopamine. These agents have a venoconstrictive effect. This action, together with the lowering of ventricular compliance ('stiffer' myocardium; see below) leads
Table III. Methods and agents used to decrease and increase
preload
To decrease preload
Diuretics (furosemide) Venodilators (nitroglycerin,
sodium nitroprusside) ACE inhibitors (captopril) Phlebotomy Haemofiltration, dialysis
To increase preload
Fluid bolus (colloid, crystalloid)
Venoconstrictive agents (norepinephrine,epinephrine, dopamine)
(32
+
2+
4+
2+
2+
Chronotropic Increase in Lusitropic effect myocardial effect
dopamine ol(ygen consumption
0 3+ 4+ Negative
0 4+ 4+ Negative
0 4+ 4+ Negative
2+ 2+ 2+ Negative
in high
doses
0 + o to + 2+
o to + 0 4+
to increases in PCWP. After haemodynamic stabilisation, it is frequently possible to decrease the infusion rate of these drugs, thereby lowering the PCWP, and allowing additional fluid to be infused to increase the circulating blood volume. Reducing these drugs, so to speak, 'creates space'.
1.4.3 Afterload Severe arterial hypotension can compromise the
critical perfusion pressure of vital organs like the myocardium. An indication for the use of arterial vasoconstrictors is a gradient of less than 50mm Hg between arterial diastolic pressure and PCWP. This situation entails a high risk for myocardial ischaemia and pump failure. In that case, pure vasopressors or drugs with combined vasopressor and inotropic actions should be used. Ephedrine and phenylephrine are drugs with predominantly peripheral vascular action; unfortunately, they are difficult to titrate and tachyphylaxis occurs rapidly. More commonly used pressor drugs are norepinephrine, epinephrine and dopamine (Zaritsky & Chernow 1983).
Afterload can be decreased by arterial vasodilators. Pure arterial dilators are hydralazine and c1onidine; nitroprusside, nitroglycerin and isosorbide dinitrate have combined arterial and venous

864 Drugs 41 (6) 1991
Ar-------------1~P1llnitial wedge pressure
I
.... .....
.... -...
Initial wedge pressure <12mm Hg
200m I colloid IV over 10 minutes
During 10-minute infusion period changes in PCWP >7mm Hg: .top lIuld IV
Initial wedge pressure <16mm Hg
l00ml colloid IV over 10 minutes
At end of 10-minute infusion period change in PCWP ~3mm Hg: repeat IV colloid
I ~
Change in PCWP (according to basal
At end of 10-minute infusion period change in PCWP >3 but <7mm Hg: wait 10 minutes and remeasure
1 1
Change in PCWP (according to basal
PCWP, measured before PCWP, measured before fluid IV administration) fluid IV administration) :s; 3mm Hg: repeat > 3mm Hg: stop IV colloid fluid IV
Fig. 3. The 'rule of 7 and 3' describing how to infuse fluid under controlled conditions.
dilating actions (Parrillo 1983). An important benefit of these last 3 drugs is their short half-life and rapid onset of action, making small but important adjustments in the infused dose possible. Dobutamine, dopexamine and the phosphodiesterase inhibitors amrinone, milrinone and enoximone are combined positive inotropic and afterload reducing drugs (Wynands 1989).
1.4.4 Inotropic Agents All positive inotropic agents increase myocard
ial contractility by increasing intracellular Ca++. This effect can be obtained via 3 different mech-
anisms: exogenous supplements of Ca++ (I to 2g CaCb intravenously in ± 5 minutes); non-cAMPlinked inotropy through ai-adrenergic stimulation; or inotropic agents in the strictest sense. The glycosides inhibit the cellular membrane sodium-potassium ATPase, resulting in a small increase in intracellular sodium, which is then exchanged for calcium via the sodium-calcium exchange mechanism (Marcus et al. 1983; Wynands 1989). Glucagon also has positive inotropic and chronotropic actions by increasing the intracellular movement of calcium and by potentiating the formation of
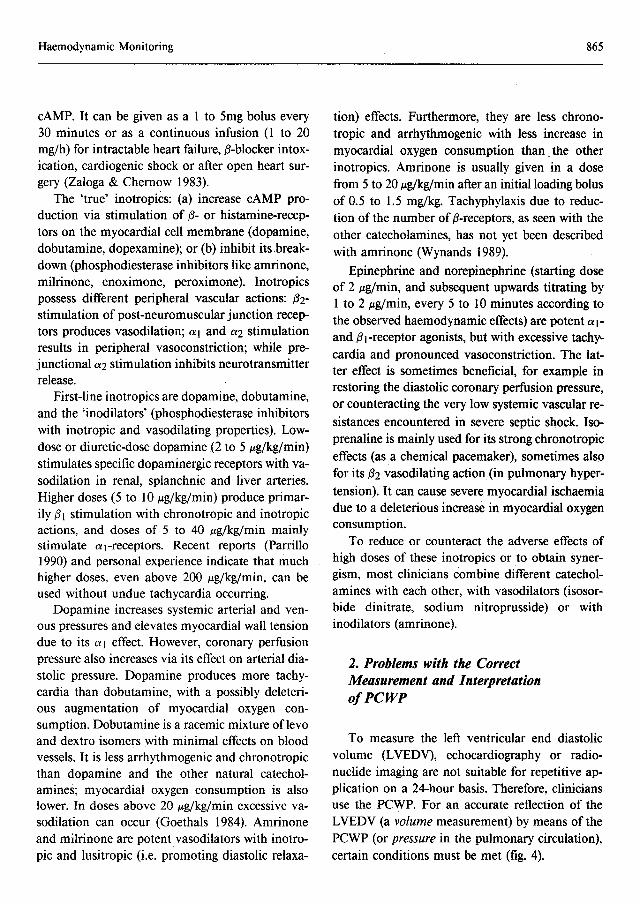
Haemodynamic Monitoring
cAMP. It can be given as a I to 5mg bolus every 30 minutes or as a continuous infusion (I to 20 mg/h) for intractable heart failure, {3-blocker intoxication, cardiogenic shock or after open heart surgery (Zaloga & Chernow 1983).
The 'true' inotropics: (a) increase cAMP production via stimulation of {3- or histamine-receptors on the myocardial cell membrane (dopamine, dobutamine, dopexamine); or (b) inhibit its breakdown (phosphodiesterase inhibitors like amrinone, milrinone, enoximone, peroximone). Inotropics possess different peripheral vascular actions: {32-stimulation of post-neuromuscular junction receptors produces vasodilation; al and a2 stimulation results in peripheral vasoconstriction; while prejunctional a2 stimulation inhibits neurotransmitter release.
First-line inotropics are dopamine, dobutamine, and the 'inodilators' (phosphodiesterase inhibitors with inotropic and vasodilating properties). Lowdose or diuretic-dose dopamine (2 to 5 ~g/kg/min) stimulates specific dopaminergic receptors with vasodilation in renal, splanchnic and liver arteries. Higher doses (5 to 10 ~g/kg/min) produce primarily {31 stimulation with chronotropic and inotropic actions, and doses of 5 to 40 tJ,g/kg/min mainly stimulate ai-receptors. Recent reports (Parrillo 1990) and personal experience indicate that much higher doses, even above 200 ~g/kg/min, can be used without undue tachycardia occurring.
Dopamine increases systemic arterial and venous pressures and elevates myocardial wall tension due to its a I effect. However, coronary perfusion pressure also increases via its effect on arterial diastolic pressure. Dopamine produces more tachycardia than dobutamine, with a possibly deleterious augmentation of myocardial oxygen consumption. Dobutamine is a racemic mixture oflevo and dextro isomers with minimal effects on blood vessels. It is less arrhythmogenic and chronotropic than dopamine and the other natural catecholamines; myocardial oxygen consumption is also lower. In doses above 20 ~g/kg/min excessive vasodilation can occur (Goethals 1984). Amrinone and milrinone are potent vasodilators with inotropic and lusitropic (i.e. promoting diastolic relaxa-
865
tion) effects. Furthermore, they are less chronotropic and arrhythmogenic with less increase in myocardial oxygen consumption than _ the other inotropics. Amrinone is usually given in a dose from 5 to 20 ~g/kg/min after an initial loading bolus of 0.5 to 1.5 mg/kg. Tachyphylaxis due to reduction of the number of {3-receptors, as seen with the other catecholamines, has not yet been described with amrinone (Wynands 1989).
Epinephrine and norepinephrine (starting dose of 2 ~g/min, and subsequent upwards titrating by I to 2 ~g/min, every 5 to 10 minutes according to the observed haemodynamic effects) are potent aland {31-receptor agonists, but with excessive tachycardia and pronounced vasoconstriction. The latter effect is sometimes beneficial, for example in restoring the diastolic coronary perfusion pressure, or counteracting the very low systemic vascular resistances encountered in severe septic shock. Isoprenaline is mainly used for its strong chronotropic effects (as a chemical pacemaker), sometimes also for its {32 vasodilating action (in pulmonary hypertension). It can cause severe myocardial ischaemia due to a deleterious increase in myocardial oxygen consumption.
To reduce or counteract the adverse effects of high doses of these inotropics or to obtain synergism, most clinicians combine different catecholamines with each other, with vasodilators (isosorbide dinitrate, sodium nitroprusside) or with inodilators (amrinone).
2. Problems with the Correct Measurement and Interpretation ojPCWP
To measure the left ventricular end diastolic volume (L VEDV), echocardiography or radionuclide imaging are not suitable for repetitive application on a 24-hour basis. Therefore, clinicians use the PCWP. For an accurate reflection of the L VEDV (a volume measurement) by means of the PCWP (or pressure in the pulmonary circulation), certain conditions must be met (fig. 4).

866
2.1 Correct Measurement of PCWP
Setting up a well-functioning system for pressure measurements remains a major undertaking with quality depending on several different factors:
damping and natural frequency characteristics of the tubing (Gardner 1981); skilful elimination of
air bubbles; correct balancing of the transducers; correct interpretation of artifacts introduced by
spontaneous breathing or mechanical ventilation, etc. The positioning of the transducer at the zero pressure point or 'phlebostatic point' at the fourth intercostal space in the midaxillary line is of critical importance.
A certain inaccuracy persists after correct installation: the 95% confidence interval for repeated measurements of PCWP in stable intensive care unit patients was 4mm Hg; the probability of encountering a PCWP measurement error of at least 4mm Hg was 14% overall, even increasing up to 33% in patients with technical measurement problems (Morris et al. 1985). One of the better practical texts on correct bedside haemodynamics is that of Daily· and Schroeder (1981).
I PCWP J IIIo....l PCWP-lAP L .... J
• ,~
Correct measurement: Faulty catheter position:
Air bubbles in tubing Not in lung zone III
Damping characteristics of Overwedging Eccentric balloon wedging
I
Drugs 41 (6) 1991
2.2 PCWP-LAP Relationship
In order to reflect the LVEDV, PCWP must first correctly reflect left atrial pressure· (LAP); a prerequisite for this assumption is the presence of a patent column of blood between the balloon lumen and the left atrium. Faulty catheter positioning [between trabecular bundles in the right ventricle, not in a lung zone type III according to West et al. (1964), or too peripherally locatedj, eccentric balloon wedging, and overwedging should be avoided. Zone III conditions can be changed to zone II and I when PEEP increases alveolar pressure, airway obstruction (e.g. severe asthma) or during hypovolaemia resulting in low vascular pressures.
Left atrial myxoma/thrombus, pulmonary venous dysplasia/thrombosis, and mediastinitis or mediastinal fibrosis are other conditions that disturb thePCWP-LAP relationship. In the presence of a right bundle branch block, the PCWP will be lower than the LAP and LVEDP due to a delay in right ventricular systole. After pneumonectomy or large pulmonary embolism, the PCW will also be lower: balloon inflation ina diminished pulmonary bed will obliterate so much extra cross-sectional area
~ IAP.LVEDP I ---...1 LVEDP·LVEDV J .... "'L .j~ ~
Mitral valve disease Aortic valve Insufficiency
Lowered compliance: Ischaemia Infiltrative diseases Hypertrophy
tubing Inotropic drugs Position 01 transducer Pulmonary venous pathology:
Increased compliance: Movement 01 tubing Thrombosis
Dilated cardiomyopathies Ventilatory artifacts Dysplasia
Vasodilators Mediastinitis/fibrosis
Left atrial myxoma/thrombus
Fig. 4~ Influences on the PCWP-LVEDV relationship. Abbreviations: PCWP = pulmonary capillary wedge pressure; L VEDP = left ventricular end diastolic pressure; LAP = left atrial pressure; L VEDV = left ventricular end diastolic volume.

Haemodynamic Monitoring
that the venous return to the left heart will diminish, thus decreasing L VEDP. This falsely low PCWP could result in a prescription for extra fluid, leading to pulmonary congestion (Tuman et at. 1989).
2.3 LAP-LVEDP Relationship
The LAP should be equal to the LVEDP. Under clinical circumstances, this means the absence of mitral valve disease (obstruction creates a diastolic pressure gradient while regurgitation allows back~ transmission of left ventricular systolic pressures resulting in large 'v' waves). Aortic valve incompetence increases the LVEDP during diastole, leading to a premature closure of the mitral valve and a pressure gradient between L VEDP and LAP.
2.4 LVEDP-LVEDV Relationship
Coronary ischaemia, myocardial infarction, infiltrative myocardial diseases (amyloidosis, hae~ mochromatosis), ventricular hypertrophy, and inotropic drugs will decrease compliance or increase stiffness characteristics of the left myocardium, thus elevating intraventricular pressures for the same filling volume. On the other hand, dilated cardiomyopathies, sodium nitroprusside and nitroglycerin will improve compliance characteristics with a lower intraventricular pressure for a specified volume. Changing the infusion rate of va soactive drugs or alleviating myocardial ischaemia can alter the measured PCWP without influencing left ventricular volume. A change in PCWP, therefore, can point to a change in preload (L VEDV), a change in compliance (LV stiffness), or both. Sometimes, infusion of small volumes of fluid results in an unexpectedly sharp increase in PCWP, inferring a low compliance of the left ventricle.
Apart from changes in compliance, any increase in right ventricular filling will result in a leftward shift of the interventricular septum by the phenomenon of ventricular. interdependence; therefore, right ventricular disease with increased right-sided preload (e.g. pulmonary hypertension, right ventricular infarction) or agents which alter rightventricular compliance characteristics, will both acton
867
the left ventricular pressure-volume curve, hence on the PCWP-L VEDV relationship.
2.5 Influence of luxtacardiac Pressure
Besides ventricular compliance and ventricular interdependence, another factor altering the PCWPL VEDV relationship is the juxtacardiac pressure. The distending pressure resulting in cardiac filling is the difference between the simultaneously measured intracavitary pressure and the pericardial or juxtacardiac pressure. Increases in this juxtacardiac pressure (resulting from pericardial tamponade or constriction, or from elevated intrathoracic pressures secondary to PEEP ventilation or severe airway obstruction) will lower the true distending or transmural left ventricular pressures; leading to poor ventricular filling. This decreased L VEDP will not be appreciated when only intracardiac pressures (i.e. the PCWP) are measured. High levels of PEEP (i.e. over IOcm H20) will alter the measured PCWP. In clinical practice, it is impossible to measure this influence correctly. Theetfect of PEEP will be transmitted to the pericardium in varying degrees, depending on the pulmonary compliance.
PEEP is mainly used in cases of the adult respiratory distress syndrome, characterised by stiff lungs, only partially transmitting the airway pressure (Teboul et at. 1989). The patient cllll be temporarily disconnected from the ventilator to meaSure the PCWP without PEEP, but this can result in quite profound and long-lasting hypoxaemia .due to alveolar collapse. Furthermore, the obtained measurements give no information about clinical condition when PEEP is in effect: venous return may suddenly increase with rebound hypervolaemia in central vessels. Directly measuring the juxtacardiacpressures in the pleura (after needle puncture with risk of pneumothorax) orin the mediastinum by means of an oesophageal balloon (influence of weight of the mediastinum in the prone or supine position) are also impractical in daily clinical situations. luxtacardiac pressure can also be approximated as ± 50% of the applied PEEP. In practice, it remains easier to measure thePCWP 'as such' without using these approximations, and

868
to interpretthe obtained value with the clinical (i.e. pulmonary) condition in mind (Raper & Sibbald 1986).
3. Measuring 'Effective Pulmonary Capillary' Pressures
Water egress from the lung vessels into the pule monary parenchyma is determined by the Starling equation, i.e. the balance between hydrostatic and oncotic vascular and perivascular pressures in the microvascular exchange vessels (mainly the distal capillaries and smaller venules). The oncotic pressures can be inferred from the measured or calculated colloid oncotic pressure (COP). The balloon-occluded PCWP gives .an idea of the overall intravascular pressure gradient, but does not indicate at what point precisely in the circulation the impedance to pulmonary blood flow occurs. In clinical conditions, characterised by increased pulmonary vascular resistance, true pulmonary capillary pressures can be greatly increased over the balloon-occluded PCWP, leading to a false impression of 'permeability' pulmonary oedema, instead of the more correct diagnosis. of 'pressure' pulmonary oedema. It is possible to measure the true capillary pressure, insteaq of the balloon-occluded PCWP: during balloon inflation an inflection point is frequently seen in the descent of the pulmonary artery pressure tracing. Extrapolation to zero of this inflection point reflects the true capillary pressure (Cope et aL 1986; Holloway et al. 1983; Laine 1986).
4. Pulmonary Shunt and Real-Time Mixed Venous Oxygen Saturation Monitoring
To calculate the pulmonary shunt correctly using the PAC, mixed venous blood should be aspirated slowly (e.g. 2mlover 10 seconds) from the pulmonary artery after at least 6ml· of blood has been removed by gentle aspiration over a minimum of 30 seconds to avoid arterial contamination (Nightingale 1990). Fast blood withdrawal could result in aspiration of oxygenated pulmonary venous blood across the lung capillaries, leading to
Drugs 41 (6) 1991
erroneous shunt values. To differentiate 'true shunt' from ventilation/perfusion inequalities, some authors recommended calculating the shunt at 100% Fj02. Unfortunately, ventilating a critical patient at 100% entails the risk of oxygen toxicity and also the risk of absorption atelectasis. This erroneously increases the calculated shunt, but also worsens hy'poxaemia after lowering the Fj02 to the premeasurement value.
Continuous monitoring of mixed venous 02 saturation has been available for about 10 years. Ongoing technological catheter improvements allow the SV02 to be tracked over a wide range of values without any significant drift. The qualitative differences between catheters using light at 3 different wavelengths versus 2 different wavelengths, as described by Pansard and Desmonts (1989), seem to be eliminated by newer technological developments.
Combining mixed venous saturation monitoring with pulse oximetry ('dual oximetry') can be used to calculate on-line venous admixture. This ventilation-perfusion index (VQI) closely reflects alterations in physiological.intrapulmonary shunting of blood.
An additional advantage of dual oximetry is the simultaneous estimation of the tissue oxygen utilisation coefficient (02EI). Simultaneous use of VQI and 02El allow assessment of both circulatory and respiratory functions continuously and on-line (Rasanen 1989).
5. Measuring the COP
Some authors advocate measurement of the plasma COP or, failing this, its calculation based on published formulae. From this COP, one can then infer the COP-PCWP gradient as a measure of the driving forces operating on lung interstitial fluid. A low COP-PCWP gradient (~ 4mm Hg) is considered a risk factor for the development of pulmonary oedema. Unfortunately, this reasoning is incomplete. Indeed, permeability of the capillary wall is unknown and impossible to measure with the available clinical technology. The COP of the interstitial space is not taken into account, and the

Haemodynamic Monitoring
balloon-occluded PCWP is not the true capillary pressure. Furthermore, Zadrobilek et al. (1989) showed that extravascular lung water content did not correlate with the COP-PCWP gradient.
6. Measuring Cardiac Output
As easy as cardiac output measurements with the thermodilution technique may seem to be, several pitfalls can influence the measured data. The smdothness and speed of injecting the measuring fluid (iced versus room temperature) can influence the obtained value. In a small patient, the catheter injection port can be inside or very near to the introducer sheath, leading to retrograde injection and spuriously high cardiac outputs. Allowing the injection fluid to warm in the operator's hand may produce falsely high output measurements. Also, in ventilated patients, the moment of injection relative to the ventilatory cycle can influence the results. Measurements made at one point in the respiratory cycle are less representative of true average cardiac output; multiple measurements randomly spaced throughout the respiratory cycle are more accurate, but more dispersed (Stevens et al. 1985). The exact measurement of CO is critical, as all other values like LVSW, SVR, SV, 002 and V02 are derived from it. Inaccurate CO values lead to erroneous derived parameters and bad medicine. A complete list of all the important haemodynamic formulae can be found in Shoemaker (1989).
7. Cardiac Disorders 7.1 Arrhythmias
Cardiac arrhythmias can interfere with the correct interpretation of right atrial and wedge pressure tracings. On the other hand, information obtained from the haemodynamic tracings can help in the differential diagnosis of tachyarrhythmias. Furthermore, the saline contained in the Swan Ganz catheter lumina can be used as a salt bridge to capture intracavitary electrical signals, with accentuation of the atrial signal (from 1.5 to 7 times the amplitude obtained in the surface ECG). These
869
ECG tracings can be useful in the differential diagnosis of rhythm disturbances.
7.2 Pacing Swan Ganz Catheter
The addition of an extra right ventricular catheter lumen, opening 19cm from the catheter tip, resulted in the possibility of introducing a stainless steel, teflon-coated 2.4F pacemaker wire for pacing the heart through a PAC already positioned. First results with this pacing PAC are good, with acceptable pacing threshold between 0.5 and 4mA (median 2.0) [Simoons et al. 1988]. This internal pacing electrode gives a more stable electrode tip position in the right ventricle, and is compatible with measuring PCWP, in contrast to the older PAC with external ring electrodes in the atria and ventricles (satisfactory pacing was exceptional and pacing was not usually compatible with obtaining wedge pressures). Further modification of this new pacing Swan Ganz catheter could be the addition of an atrial port for A-V sequential pacing.
7.3 Haemodynamic Subsets in Acute Infarction
In acute myocardial infarction plotting of a systolic ventricular parameter [left ventricular stroke work (L VSW), CO or stroke volume (SV)] versus a diastolic parameter (PCWP) can give therapeutic and prognostic information (fig. 5). According to Forrester et al. (1976) a low filling pressure together with low systolic parameters means the presence of hypovolaemia requiring fluid loading, preferably with a colloidal substance. On the other hand, high filling pressures with (near) normal syStolic parameters point to overfilling; in that case vasodilators or, better still, inodilators like dobutamine, can alleviate pulmonary congestion. The combination of elevated filling pressures . and low systolic parameters points to combined forward and backward failure, or cardiogenic shock. Mortality is at least 50% and therapy includes inotropics, vasodilators, intra-aortic balloon counterpulsation, coronary repermeabilisation or even heart transplantation (ACC/AHA Task Force 1990).

870
CI (L/min/m2j
2.2
Group II
LVSWI (g/m/m2j
~::::::::==:--140
Group IV
18 PCWP(mmHg)
Fig. 5. Haemodynamic subsets (after Forrester et al. 1976). Group I: normal haemodynamics, mortality ± 2%; group II: pulmonary congestion - normal output, mortality ± 9%; group III: hypovolaemia, mortality ± 23%; group IV: pulmonary congestion - low output, mortality ±. 50%. Abbreviations: CI = cardiac index; PCWP = pulmonary capillary wedge pressure; L VSWI = left ventricular stroke work index.
7.4 Right Ventricular Infarction
An inferior wall myocardial infarction can present with severe hypotension due to relative underfilling, while the patient shows signs of extensive right-sided overfilling. The RA pressure will be disproportionately increased over the PCWP with sometimes equalisation of all diastolic pressures. With significant RA pressure elevation, shunting can occur across a patent foramen ovale. Prominent x and y descents on the right atrial pres~ sure curve, Kussmaul's sign and a narrow pulmonary artery pulse pressure are other hallmarks of right ventricular infarction. This haemodynamic profile must be differentiated from pericardial constriction and from restrictive cardiomyopathy.
Therapy consists of vigorous fluid loading together with inotropes and sometimes intra-aortic balloon pulsation in order to increase LVEDV and CO (ACC/ AHA Task Force 1990). The infarcted right ventricle must be thought of as a passive conduit through which fluid must be forced.
Equally, one should remember that moderate to severe tricuspid insufficiency due to papillary muscle dysfunction or ventricular dilatation (e.g. secondary to pulmonary hypertension) yields consistently lower thermodilution cardiac output values (Cigarroa et al. 1989; Hamilton et al. 1989).
7.5 New Murmur after Acute Myocardial Infarction
Drugs 41 (6) 1991
In cases of acute mitral regurgitation, large 'v' waves, caused by the back-transmission ofleft ventricular systolic pressures, will markedly increase the electronically averaged PCWP, leading to erroneously high values. In that case, measuring the height of the 'a' wave on a graph of the PCWP gives a more accurate value. Large 'v' waves do not always point to mitral regurgitation: a poorly compliant atrium, e.g. in the case of myocardial ischaemia or when high doses of inotropes are used, will lead to rapid increase of LAP during atrial filling, sometimes reflected by large 'v' waves (Pichard et al. 1983). In addition, increased pulmonary blood flow due to ventricular septal rupture may also cause a large 'v' wave (Sharkey 1987).
Acute ventricular septal rupture causes fluid overload of the right heart and pulmonarycirculation with secondary tricuspid insufficiency. Within limits, a more correct cardiac output can be calculated from the oxygen saturation values, sampled in the arterial, mixed venous and. right atrial position. Based on the reversed Fick equation [CO = Y02/(Sa02 - SV02)], it is possible, first to calculate the ratio of pulmonary to systemic blood flow [COp/COs = (Sa02 - Sra02)/(Sa02 -Sap02), and then to correct the thermodilution cardiac output [COreal = COthermo/[(Sa02 -Sra02)f(Sa02 - Sap02)].
7.6 Pericardial Tamponade
Pericardial tamponade also presents with equalisation of all diastolic pressures, as in right. ventricular infarction. But in tamponade, the venous or right atrial x descent becomes more prominent with an attenuated or absent y wave, in contrast to the prominent y descent in right ventricular infarction. Furthermore, the typical pattern of pulsus paradoxus (inspiratory fall of systolic blood pressure of > lOmm Hg or > 10% if systolic pressure < 100mm Hg) can be observed. The other haemodynamic parameters are those of obstructive shock.

Haemodynamic Monitoring
8. Pulmonary Embolism
Pulmonary hypertension is observed in ± 70% of patients with pulmonary embolism and generally occurs after obstruction of 25 to 30% of the vascular bed. Even in cases of a massive pulmonary embolism, the AP pressure will not exceed 40mm Hg, as the thin right ventricular wall can not deal with acutely elevated pressures. If higher pressures are measured, a chronic component to the hypertension must be inferred. In cases of embolism, the pulmonary vascular resistances rise, leading to an increased AP diastolic-PCWPgradient of > 5mm Hg. Pulmonary hypertension also leads to right ventricular dilatation and elevated CVP. The systemic vascular resistance is usually increased to compensate for diminished LV preload and decreasing cardiac output. Oxygen transport is compromised due to the fall iri cardiac output, but also due to lower arterial blood saturation caused by patchy areas of ventilation-perfusion mismatch and dead space ventilation.
Amniotic fluid embolism can lead to profound shock and/or respiratory failure evolving to the adult respiratory distress syndrome. Presenting symptoms are similar to those of 'classical' pulmonary embolism. In order to differentiate amniotic fluid embolism from thrombo-embolism, one can examine by light microscopy pulmonary capillary blood collected on EDT A or heparin (aspirated through the Swan Ganz catheter after wedging the balloon) for fetal erythroyctes/haemoglobin and desquamated fetal cells. A positive result will obviate the use of thrombolytic drugs in a dangerous situation. However, a negative result is of no diagnostic value.
9. Sepsis
Life-threatening sepsis can alter tissue oxygenation and function, resulting in multiorgan failure and death. Early in its course sepsis is charactertised by a hyperdynamic state with a low systemic vascular resistance and an increased cardiac output. This loss of integrity and the accompanying
871
attenuation of vascular reactivity is at least partly endotoxin-mediated (Baker & Wilmoth 1984).
The longstanding hypothesis that death from septic shock is due to a late and severe myocardial depression leading to an extremely low cardiac output does not · seem to hold true as serial haemodynamic studies in septic patients have shown that most of them maintain a high CO and a low SVR, even in the terminal stage. However, CO is not a sensitive reflection of myocardial function and septic patients, even those with a normal or elevated CO, often have a moderate to severe depression of the left and right ventricular ejection · fraction (Kimchi et al. 1984; Parker et al. 1984; Parrillo 1990). Two mechanisms have been proposed to explain this myocardial depression: the presence of circulating myocardial depressant substances, and ischaemia due to maldistributedcoronary blood flow.
The · central haemodynamic variables are less important than the variables related to 02 transport or delivery (D02) and 02 consumption (V02). In healthy individuals V02 is independent ofD02 above a certain critical value (10 ml/kg/min). Indeed, as D02 decreases the oxygen extraction increases so that 02demands are still met: Bacterial sepsis impairs the ability of the tissues to increase the oxygen extraction ratio ·and·the minimum D02 required to inaintain a normal 02 uptake is significantly increased. This is the so-called pathological '02-supply dependency', a concept that has important therapeutic consequences. Several hypotheses have been offered to explain the abnormalities of 02 extraction and utilisation: the occurrence . of . microcirculatory arteriovenous· shunts, microvascular embolisation, and impaired 02 diffusion into the tissues through endothelial cell damage. The role of mitochondrial dysfunction is unknown.
The aim ofhaemodynamic management inseptic shock is to maximise 02 transport to the tissues in the hope that this may be beneficial in preventing widespread cellular ischaemia and organ dysfunction (Shoemaker 1987). In order to optimise D02 one can focus on the 2 main limbs of the equation D02 = arterial 02 content X cardiac out-

872
put. To optimise the 02 content, pa02 should be maintained above a minimum level of 60 to 70mm Hg. Increasing the haematocrit to 35 to 40% may also augment D02. Following these measures, fluid loading is the next step. Indeed, a low CO in a septic patient often denotes concomitant hypovolaemia. It is generally advised to maintain a PCWP at around ISmm Hg unless additional increments in fluid loading clearly further augment the CO. Blindly increasing the PCWP risks excessive extravascular lung water accumulation, leadingtoa paradoxical decrease in systemic D02 due to arterial desaturation. Inotropic support is required in septic shock when volume loading alone fails to restore adequate D02. Either dopamine, dobutamine or norepinephrine can be used for this purpose. If MAP is < 60mm Hg and oliguria is present, norepinephrine seems preferable to correct the severely reduced SVR (Hesselvik & Brodin 1989).
10. Complications of Invasive Haemodynamic Monitoring
The use of the pulmonary artery flowcdirected catheter has purportedly assumed 'epidemic' proportions. Therefore, if therapeutic management will not be significantly modified whatever the results obtained by the PAC, then clearly the catheter should not be used (Robin 1985). On the other hand; studies have shown that the clinical differentia I diagnosis of pulmonary oedema (pressure versus permeability type oedema) is often inaccurate in the intensive care setting (Fein et al. 1984). Adhering to the recently published 'Position Statement on Clinical Competence in Hemodynamic Monitoring' will minimise the incidence of complications, while perhaps optimising the results obtained from invasive haemodynamic explorations (Friesinger & Williams 1990). Table IV summarises the possible complications arising from the use of the PAC (Vincent 1990; Wiedemann et al. 1984a,b).
11. Conclusion
The PAC broadens our comprehension of cardiocirculatory phenomena. Correct use of this instrument and optimal implementation of the prof-
Drugs 41 (6) 1991
Table IV. Possible complications arising from the use of the pulmonary artery catheter (PAC)
Complications from vascular puncture Pneumothorax Arterial puncture Venous thrombosis/thrombophlebitis Septic thrombophlebitis Septicaemia
Cardiac arrhythmias Atrial flutter/fibrillation Premature ventricular contractions Nonsustained or sustained ventricular tachycardia Ventricular fibrillation
Right bundle branch block
Endocardial damage
Catheter knotting
Balloon rupture; air embolism
Pulmonary complications Pulmonary infarction Pulmonary artery rupture
Electrical hazards
fered information necessitates attention to detailed knowledge of complex physiological interactions. However, in the unsuspecting clinician dealing with an unstable critically ill patient, the PAC could generate a large body of data, leading to astonishment and defeat.
Correct placement of the PAC and obtaining all measurements takes time. In acute conditions this could lead to unacceptable loss of time and a delayed initiation of life-saving treatment. In an unstable patient, when the treating physician is not adept at interpreting complex haemodynamic data it is perhaps better to delay data collection but to start immediate treatment, rather than document interesting physiological happenings and lose the patient through inactivity. In critical patients it is a vital rule that therapy always takes precedence over data gathering.
Haemodynamic monitoring should lead to optimisation of oxygen transport and consumption. Possible strategies include limited increases in circulating haemoglobin levels, optimisation of the OHDC through manipulation of the p50, increas-

Haemodynamic Monitoring
ing 02 ,saturation by skilful mechanical ventilation, and last but not least complex pharmacological interventions to increase cardiac output. As cardiac output depends on the interplay of cardiac frequency, preload, afterload and inotropic condition, therapy almost always includes vasodilators, vasopressors, and inotropic agents, together with fluid volume management.
References
ACC/AHA Task Force. ACC/AHA guidelines for the early management of patients with acute myocardial infarction. Circulation 82: 664,707, 1990
Baker C, Wilmoth F. Microvascular responses to E-coli endotoxin with altered adrenergic activity. Circulatory Shock 12: 165, 1984
Bode V, Welzel 0 , Franz G, Polensky U. Absence of drug interaction between heparin and nitroglycerin. Archives of Internal Medicine 150: 2117-2119, 1990
Breuer H-WM, Groeben H, Breuer J, Worth H. Oxygen saturation calculation procedures: a critical analysis of six equations for the determination of oxygen saturation. Intensive Care Medicine 15: 385-389, 1989
Bryan-Brown CWo Blood flow to organs: parameters for function and survival in critical illness. Critical Care Medicine 16: 170-178, 1988
Cigarroa RG, Lange RA, Williams RH, Bedotto JB, Hillis D. Underestimation of cardiac output by thermodilution in patients with tricuspid regurgitation. American Journal of Medicine 86: 417-420, 1989
Cope OK, Allison RC, Parmentier JL, Miller JM, Taylor AE. Measurement of effective pulmonary capillary pressure using the pressure profile after pulmonary artery occlusion. Critical Care Medicine 14: 16-22, 1986
Daily EK, Schroeder JS. Techniques in bedside hemodynamic monitoring, The CV Mosby Company, St Louis, Toronto, London, 198 I
Dash H, Lipton MJ, Chatterjee K, Parmley WW. Estimation of pulmonary artery wedge pressure from chest radiograph in patients with chronic congestive cardiomyopathy and ischemic myopathy. British Heart Journal 44: 322-329, 1980
Deedmania Pc. Antiotensin-converting enzyme inhibition in congestive heart failure. Archives of Internal Medicine 150: 1798-1805, 1990
Demey HE, Daelemans RA, Verpooten GA, De Broe ME, Van Campenhout CM, et aL Propylene glycol induced side effects during intravenous nitrogycerin therapy. Intensive Care Medicine 14: 221-226, 1984
Dhainaut JF, Edwards JD. Grootendorst AF, Nightingale P, Pinsky MR, et al. Practical aspects of oxygen transport: conclusions and recommendations of the roundtable conference. Intensive Care Medicine 16 (SuppL 2) SI79-S180, 1990
Edwards JD. Practical application of oxygen transport principles. Critical Care Medicine 18: S45-S48, 1990
Edwards JD, Brown GCS, Nightingale P, Slater RM, Faragher EB. Use of survivors' cardiorespiratory values as therapeutic goals in septic shock. Critical Care Medicine 17: 1098-1103, 1989
Eisenberg PR, Jatte AS, Shuster DP. Clinical evaluation compared to pulmonary artery catheterisation in the haemodynamic assessment of critically ill patients. Critical Care Medicine 12: 549-553, 1984
873
Fein AM, Goldberg SK, Walkenstein MD, Dershaw B: Braitman L, et aL Is pulmonary artery catheterisation necessary for the diagnosis of pulmonary edema? American Review of Respiratory Diseases 129: 1006-1009, 1984
Forrester J, Diamond G, Chatterjee K, Swan H. Medical therapy of acute infarction by application of hemodynamic subsets. New England Journal of Medicine 295: 1356-1362, 1404-1413, 1976
Friesinger GCI, Williams SV. Clinical competence in hemodynamic monitoring: a s,tatement for physicians from the ACP/ ACC/AHA task force on clinical privileges in cardiology. Circulation 81 : 2036-2040, 1990
Gardner RM. Direct blood pressure measurement - dynamic response requirements. Anesthesiology 54: ·227 -236, 1981
Giovannini I, Chiarla C, Siegel JH, Coleman WP. A simple method for rapid estimate of P50. 9th International Symp~ium on Intensive Care and Emergency Medicine, Brussels, 1989
Goethals M, Demey H. Massive dobutamine overdose in a cardiovascular compromised patient. Acta Cardiologica 39: 373-378, 1984
Habbab MA, Haft JI. Heparin resistance induced by intravenous nitroglycerin. Archives ofinternal Medicine 147: 857-860, 1987
Hamilton MA, Stevenson LW, Woo M, Child IS, Tillisch JH. Effect of tricuspid regurgitation on the reliability of the thermodilution cardiac output technique in congestive heart failure. American Journal of Cardiology 64: 945-948, 1989
Hartzler GO, Maloney JD, Curtis JJ, Barnhorst DA. Hemodynamic benefit of atrioventricular sequential paCing after cardiac surgery. American Journal of Cardiology 40: 232-236, 1977
Haude M, Steffen W, Erbel R, Meyer J. Sublingual administration of captopril versus nitroglycerin in patients with severe congestive heart failure. International Journal of Cardiology 27: 351-359, 1990 ,
Haude M, StetTen W, Erbel R, Tschollar W, Belz GG, el aL Hemodynamics after sublingual administration of captopril in severe heart failure: a pilot study. Deutsche Medizinische Wochenschrift 114: 1095-1100, 1989
Hesselvik J, Brodin B. Low dose norepinephrine in .patients with septic shock and oliguria: effects on afterload, urine flow and oxygen transport. Critical Care Medicine 17: 179, 1989
HilIJnan K. Colloid versus crystalloid fluid therapy iilthe critically ilL Intensive and Critical Care Digest 5:1-9, 1986
Holloway H, Perry M, Downey J, Parker J, Taylor A. Estimation of effective pulmonary capillary pressure in intact lungs. Journal of Applied Physiology 54: 846-851, 1983
Kimchi A, Ellrodt A; Bermand D. Right ventricular performance in septic shock: a combined radionuclide and hemodynamic study. Journal of the American College of Cardiology 4: 945, 1984
Klotz U, Kroemer H. Clinical pharmacokinetic considerations in the use of plasma expanders. Clinical Pharmacokinetics 12: 123-135, 1987
Kraus PA, Lipmen J, Becker PJ. Acute preload effects of furosemide. Chest 98: 124-128, 1990
Laine GA. Pulmonary capillary pressure? Critical Care Medicine 14: 76-77, 1986 ,
Marcus FI, Opie LH, Sonnenblick EH. Digitalis and sympathomimetic stimulants. In Opie LH (Ed.) Drugs for the heart, pp. 99-128, Grune & Stratton Inc, Orlando, San Diego, San Francisco, New York, London, Toronto, Montreal, Sydney, Tokyo, Sao Paulo, 1983
Morris AH, Chapman RH, Gardner RM. Frequency of wedge pressure errors in the ICU. Critical Care Medicine 13: 705-708, 1985
Narins RG, Chusid P. Diuretic use in critical care. American Journal of Cardiology 57: 26A-32A, 1986
Nightingale P. Practical points in the application of oxygen transport principles. Intensive Care Medicine 16 (Supp!. 2): S173-SI77,1990
Ohar JM, Fowler AA, Selhorst JB, Glauser FL. Intravenous nitro-

874
glycerin induced intracranial hypertension. Critical Care Medicine 13: 867, 1985
Pansard 1, Desmonts 1. New techniques in ICU cardiorespiratory monitoring. Current Opinion in Anaesthesiology 2: 169-172, 1989
Parker M, Shelhamer 1, Bacharach S. Profound but reversible myocardial depression in patients with septic shock. Annals of Internal Medicine 100: 483, 1984
Parrillo 1 (Moderator). Septic shock in humans: advances in the understanding of pathogenesis, cardiovascular dysfunction, and therapy. Annals of Internal Medicine 113: 227-242, 1990
Parrillo lE. Vasodilator therapy. In Chernow & Lake (Eds) The pharmacologic approach to the critically ill patient, pp. 283-302, Williams and Wilkins, Baltimore, London, 1983
Pichard A, Diaz R, Marchant E, Casanegra P. Large v waves in the pulmonary capillary wedge pressure tracing, without mitral regurgitation: the influence of the pressure/volume relationship on the v wave size. Clinical Cardiology 6: 534-541, 1983
Pinsky MR, Schlichtig R. Regional oxygen delivery in oxygen supply-dependent states. Intensive Care Medicine 16 (Suppl. 2): S169-S171, 1990
Raper R, Sibbald WJ. Misled by the wedge? The Swan-Ganz catheter and left · ventricular preload. Chest 89: 427-434, 1986
Riisanen J. Role of dual oximetry in the assessment of pulmonary function. In Reinhart & Eyrich (Eds) Clinical aspects of 02 transport and tissue oxygenation, pp. 230-240, Springer-Verlag, Berlin, Heidelberg, New York, London, Paris, Tokyo, Hong Kong, 1989
Rinkenberger RL, Nacarrelli GV. Evaluation and acute treatment of wide complex tachycardias. Critical Care Clinics 5: 569-598, 1989a
Rinkenberger RL, Nacarrelli GV. Evaluation and treatment of narrow complex tachycardias. Critical Care Clinics 5: 599-642, 1989b
Robin ER. The cult of the Swan-Ganz catheter: overuse and abuse of pulmonary flow catheters. Annals oflnternal Medicine 103: 445-449, 1985
Sharkey SW. Beyond the wedge: clinical physiology and the SwanGanz catheter. American Journal of Medicine 83: 111-122, 1987
Shoemaker W. Relation of oxygen transport patterns to the pathophysiology and therapy of shock states. Intensive Care Medicine 13: 230-243, 1987
Shoemaker We. Shock states: pathophysiology, monitoring, outcome, prediction, and therapy. In Shoemaker et al. (Eds) Textbook of critical care pp; 977-993, WB Saunder Company, Philadelphia, London, Toronto, Montreal, Sydney, Tokyo, 1989
Shoemaker WC, Kram HB, Appel PL. Therapy of shock based on pathophysiology, monitoring and outcome prediction. Critical Care Medicine 18: S 19-525, 1990
Drugs 41 (6) 1991
Simoons M, Demey H, Bossaert L, Colardyn F, Essed e. The Paceport catheter: a new pacemaker system introduced through a Swan Ganz catheter. Catheterization and Cardiovascular Diagnosis 15: 66-70, 1988
Stevens 1, Raffin T, Mihm F. Thermodilution cardiac output measurement: effects of the respiratory cycle on its reproducibility. Journal of the American Medical Association 253: 2240-2242, 1985
Teboul JL, Zapol WM, Brun-Buisson C, Abrouk F, Rauss A, et al. A comparison of pulmonary artery occluded pressure and left ventricular end-diastolic pressure during mechanical ventilation with PEEP in patients with severe ARDS. Anesthesiology 70: 261-266, 1989
Tuman KJ , Carroll GC, Ivankovich AD. Pitfalls in interpretation of pulmonary artery data. Journal of Cardiothoracic Anesthesia 3: 625-641, 1989
Twigley A, Hillman K. The end of the crystalloid era? A new approach to perioperative fluid administration. Anaesthesia 40: 860-871, 1985
Vincent l-L. The pulmonary artery catheter: twenty years of use. Clinical Intensive Care I: 244-248, 1990
West lB, Dollery CT, Naimark A. Distribution of blood flow in isolated lung; relation to vascular and alveolar pressures. Journal of Applied Physiology 19: 713-724, 1964
Wiedemann HP, Matthay MA, Matthay RA. Cardiovascular-pulmonary monitoring in the intensive care unit (part I). Chest 85: 537-549, 1984a
Wiedemann HP, Mallhay MA, Mallhay RA. Cardiovascular-pulmonary monitoring in the intensive care unit (part 2). Chest 85: 656-668, 1984b
Wynands JE. Amrinone: is it the inotrope of choice? Journal of Cardiovascular Anesthesia 6: 45-47, 1989
Zadrobilek E, Hackl W, Sporn P, Steinbereithner K. Effect of large volume replacement with balanced electrolyte solutions on extravascular lung water in surgical patients with sepsis syndrome. Intensive .Care Medicine 15: 505-510, 1989
Zaloga P, Chernow B. Insulin, glucagon and growth hormone. In Chernow & Lake (Eds) The pharmacologic approach to the critically ill patient, pp. 562-585, Williams and Wilkins, Baltimore, London, 1983
Zaritsky AL, Chernow B. Catecholamines, sympathomimetics. In Chernow & Lake (Eds) The pharmacologic approach to the critically ill Patient, pp. 481-509, Williams & Wilkins, Baltimore, London, 1983
Correspondence and reprints: Prof. Leo L. Bossaert, University Hospital Antwerp, Wilrijkstraat 10, B-2650 Edegem, Belgium.
Related Documents