HADAF TM 1404 Aircraft Design Book TABLE OF CONTESNTS ABOUT THE GROUP 5 LIST OF SYMBOLS 6 1 WEIGHT SIZING 8 1.1 INTRODUCTION 8 1.2 MISSON SPECIFICATION 10 1.2.1 DETERMINATION OF MISSION PAYLOAD WEIGHT 11 1.2.2 DETERMINATION OF MISSION FUEL RESERVES 12 1.3 DATA ANALYSIS 13 1.4 WEIGHT SIZING 15 1.5 SENSETIVITY ANALYSIS 19 1.5.1 SENSITIVITY OF TAKEOFF WEIGHT TO PAYLOAD WEIGHT 20 1.5.2 SENSITIVITY OF TAKEOFF WEIGHT TO EMPTY WEIGHT 21 1.5.3 SENSITIVITY OF TAKEOFF WEIGHT TO RANGE, ENDURANCE, SPEED, SPECIFIC FUEL CONSUMPTION, PROPELLER EFFICIENCY AND LIFT-TO-DRAG RATIO 21 1.6 APPENDIX: 24 1.7 REFERENCES 28 2 PERFORMANCE ESTIMATION 29 2.1 INTRODUCTION 29 2.2 SIZING TO STALL SPEED REQUIREMENTS 29 2.3 SIZING TO TAKE-OFF DISTANCE REQUIREMENTS 31 2.4 . SIZING TO LANDING DISTANCE REQUIREMENT 35 2.5 SIZING TO CLIMB REQUIREMENT 38 2.6 SIZING TO CRUISE SPEED REQUIREMENT 46 2.7 MATCHING OF ALL SIZING REQUIREMENT 50 2.8 ROAD MAP 53 2.9 APPENDIX 54 2.10 REFERENCES 58 3 SELECTION OF ENGINE 59 3.1 INTRODUCTION 59 3.2 SELECTION OF THE PROPULSION SYSTEM TYPE 59 3.3 DETERMINATION OF THE NUMBER OF ENGINES 62 3.4 DISPOSITION OF ENGINE 63 3.5 ENGINE BRANDS 64 3.6 PROPELLER DESIGN 75 3.7 DESIGN CHART (ABSTRACT): 77 PROPELLER DESIGN 77 3.8 REFERENCES 78

Welcome message from author
This document is posted to help you gain knowledge. Please leave a comment to let me know what you think about it! Share it to your friends and learn new things together.
Transcript

HADAFTM
1404 Aircraft Design Book
TABLE OF CONTESNTS
ABOUT THE GROUP 5
LIST OF SYMBOLS 6
1 WEIGHT SIZING 8
1.1 INTRODUCTION 8
1.2 MISSON SPECIFICATION 10
1.2.1 DETERMINATION OF MISSION PAYLOAD WEIGHT 11
1.2.2 DETERMINATION OF MISSION FUEL RESERVES 12
1.3 DATA ANALYSIS 13
1.4 WEIGHT SIZING 15
1.5 SENSETIVITY ANALYSIS 19
1.5.1 SENSITIVITY OF TAKEOFF WEIGHT TO PAYLOAD WEIGHT 20
1.5.2 SENSITIVITY OF TAKEOFF WEIGHT TO EMPTY WEIGHT 21
1.5.3 SENSITIVITY OF TAKEOFF WEIGHT TO RANGE, ENDURANCE, SPEED, SPECIFIC FUEL CONSUMPTION,
PROPELLER EFFICIENCY AND LIFT-TO-DRAG RATIO 21
1.6 APPENDIX: 24
1.7 REFERENCES 28
2 PERFORMANCE ESTIMATION 29
2.1 INTRODUCTION 29
2.2 SIZING TO STALL SPEED REQUIREMENTS 29
2.3 SIZING TO TAKE-OFF DISTANCE REQUIREMENTS 31
2.4 . SIZING TO LANDING DISTANCE REQUIREMENT 35
2.5 SIZING TO CLIMB REQUIREMENT 38
2.6 SIZING TO CRUISE SPEED REQUIREMENT 46
2.7 MATCHING OF ALL SIZING REQUIREMENT 50
2.8 ROAD MAP 53
2.9 APPENDIX 54
2.10 REFERENCES 58
3 SELECTION OF ENGINE 59
3.1 INTRODUCTION 59
3.2 SELECTION OF THE PROPULSION SYSTEM TYPE 59
3.3 DETERMINATION OF THE NUMBER OF ENGINES 62
3.4 DISPOSITION OF ENGINE 63
3.5 ENGINE BRANDS 64
3.6 PROPELLER DESIGN 75
3.7 DESIGN CHART (ABSTRACT): 77
PROPELLER DESIGN 77
3.8 REFERENCES 78
HADAFTM
1404 Aircraft Design Book
4 THE GENERAL ARRANGEMENT AND FUSELAGE DESIGN 79
4.1 INTRODUCTION 79
4.2 OUTLINE OF CONFIGURATION POSSIBILITIES 79
4.2.1 OVERALL CONFIGURATION 80
4.2.2 ENGINE TYPE AND DISPOSITION 81
4.2.3 WING CONFIGURATION 82
4.2.4 EMPENNAGE CONFIGURATION 85
4.2.5 1.5. LANDING GEAR TYPE AND DISPOSITION 87
4.2.6 DETERMINATION OF THE CENTER OF VISION (COV) 90
4.3 OUTLINE OF FUSELAGE DESIGN 92
4.3.1 CROSS-SECTION DESIGN 93
4.3.2 FUSELAGE DIAMETER 93
4.3.3 THE SHEET-METAL TAIL CONE SECTION 94
4.3.4 FUSELAGE SHAPE 95
4.3.5 HADAF CONFIGURATION 97
4.4 DESIGNING DIAGRAM 98
4.5 APPENDIX 100
4.6 REFERENCES: 108
5 WING SIZING 109
5.1 INTRODUCTION 109
5.1.1 DECIDE 1DECIDE ON THE OVERAL WING/FUSELAGE ARRANGMENT 109
5.2 MORE DETAIL DESIGN PARAMETER 109
5.3 AIRFOIL PROFILE DESIGN 111
5.4 WING PLANFORM DESIGN 115
5.4.1 SWEEPANGLE 116
5.4.2 THICKNESS RATIO (T/C) 117
5.4.3 TAPER RATIO 118
5.4.4 TWIST ANGLE 119
5.4.5 INCIDENT ANGLE 119
5.4.6 DIHEDRAL ANGLE 120
5.4.7 WING TEST: 120
5.4.8 LATERAL CONTROL SURFACES 123
5.4.9 VERIFYING CLEAN AIRPLANE MAXIMUM LIFT COEFFICIENT AND SIZING THE HIGH
LIFT DEVICES 125
5.5 DECIDE ON THE OVERALL STRUCTURAL WING CONFIGURATION 129
5.6 COMPUTE THE WING FUEL VOLUME 130
5.7 ROAD MAP 131
5.8 REFERENCES: 132
6 PRELIMINARY TAIL SIZING 133
6.1 INTRODUCTION 133
6.2 EMPENNAGE FUNCTIONS 134

HADAFTM
1404 Aircraft Design Book
6.2.1 PITCH 135
6.2.2 YAW 136
6.2.3 ROLL 136
6.3 EMPENNAGE SIZING 137
6.3.1 EMPENNAGE CONFIGURATION 137
6.3.2 EMPENNAGE DISPOSITION 143
6.3.3 EMPENNAGE SIZE 143
6.3.4 FINAL CALCULATIONS 144
6.4 PLANFORM GEOMETRY OF EMPENNAGE 147
6.4.1 ASPECT RATIO 147
6.4.2 SWEEP ANGLE 149
6.4.3 TAPER RATIO 150
6.4.4 THICKNESS RATIO 150
6.4.5 DIHEDRAL ANGLE 151
6.4.6 INCIDENCE ANGLE 152
6.4.7 AIRFOIL SHAPE 152
6.5 CONTROL SURFACES SIZING 153
6.5.1 ELEVATOR 153
6.5.2 RUDDER 155
6.5.3 SIZE OF ELEVATOR AND RUDDER 156
6.6 REFERENCES 161
7 LANDING GEAR 162
7.1 INTRODUCTION 162
7.2 FIXED / RETRACTABLE LANDING GEAR 164
7.3 LANDING GEAR CONFIGURATION TYPES 165
7.3.1 TAIL-WHEEL(TAIL-DRAGGER)[2] 165
7.3.2 NOSE WHEEL (TRICYCLE) 166
7.3.3 TANDEM 168
7.4 DISPOSITION OF LANDING GEAR AND STRUT 169
7.4.1 TIP-OVER CRITERIA: 169
7.4.2 GROUND CLEARANCE CRITERIA:[2] 170
7.5 COMPUTING THE MAXIMUM STATIC LOAD[4] 173
7.6 SELECTION OF TIRES[2] 174
7.7 LANDING GEAR DATABASE: 176
7.8 FINAL DRAWING OF LANDING GEAR SYSTEM 179
7.9 TABLE OF FINAL RESULTS 181
7.10 ROAD MAP 182
7.11 REFERENDES 183
8 WEIGHT AND BALANCE ANALYSIS 184
8.1 INTRODUCTION 184
8.2 COMPONENT WEIGHT BREAKDOWN 186

HADAFTM
1404 Aircraft Design Book
8.3 PRELIMINARY ARRANGEMENT DRAWING OF AIRPLANE AND EACH COMPONENT C.G LOCATION 186
8.4 CATEGORIZING THE X, Y, Z COORDINATE OF C.G OF EACH COMPONENT 188
8.4.1 FUSELAGE GROUP 188
8.4.2 WING GROUP 189
8.4.3 EMPENNAGE GROUP 189
8.4.4 ENGINE GROUP 189
8.4.5 LANDING GEAR GROUP 189
8.4.6 FIXED EQUIPMENTS GROUP 190
8.4.7 FUEL GROUP 191
8.4.8 PASSENGERS GROUP 191
8.5 CALCULATING THE XC.G&YC.GOF AIRPLANE 192
8.6 WEIGHT C.G EXCURSION DIAGRAM 193
8.7 C.G EXCURSION DIAGRAM ARGUMENT 195
8.8 REFRENCES 196

HADAFTM
1404 Aircraft Design Book
ABOUT THE GROUP
A group of mechanical engineering students of Ferdowsi University of Mashhad
established the airplane-designing group of HADAF, on July 2009. Under the
instruction of Mr Mohammad JavadDarabiMahboub, the team started the conceptual
design phase of a2-seatedultra-light airplane called HADAFTM1
1404.
The students who attended in this project are:
1. Mojtaba Balaj
2. Mehdi BehnamVashani
3. Abbas Daliry
4. Amir Faghihi
5. Sina Heidari
6. Ali Mehrkish
7. Seyyed Mohammad Naghavizadeh
8. Hassan Nami
9. SomayyeNorouzi
10. Ali Omidi
11. Amir Kimiagaran
12. Mohsen Shamsabadi
13. Seyyed Ali Sahhaf
14. Saeid Zare
15. Saman Zare

HADAFTM
1404 Aircraft Design Book List of Symbols
List of Symbols
Performance Estimation
Wing area S
Take-off trust TTO
Take-off power PTO
Maximum required take-off lift coefficient
with flaps up
CL ,max (clean)
Maximum required lift coefficient for take-off CL ,max TO
Maximum required lift coefficient for landing CL ,max L , CL ,max PA
Wing loading W/S
Thrust loading, T/W
power-off stall speed
Density
Aerodynamic drag coefficient CD
ground friction coefficient µG
take-off ground roll STOG
take-off distance
Landing weight WL
Approach speed VA
landing ground run SLG
aspect ratio A
Oswald e
Weight Sizing
Take off gross weight WTO
Empty weight WE
Mission fuel weight WF
Operating empty weight WOE
Payload weight WPL
Trapped fuel & oil weight Wtfo
Crew weight Wcrew
Manufacturer empty weight WME
Fixed equipment weight WFEQ
Range R
Endurance of loiter Eltr
Cruise Velocity Vcr
Fuel Reserve weight
Propeller efficiency ηp
Lift-to-drag ratio L/D
Specific fuel consumption CP
HADAFTM
1404 Aircraft Design Book List of Symbols
zero-lift coefficient
equivalent area
wetted area Swet
power index
Selection of Engine
Mach number
propeller diameter
blade power loading Pb
Wing Sizing
Size S
Aspect ratio A
Sweep angle
Thickness ratio t/c
Taper ratio
Incident angle
Dihedral angle
Preliminary Tail Sizing
static loading factor ns
total gear weight
HADAFTM
1404 Aircraft Design Book Weight Sizing
1 Weight Sizing
1.1 INTRODUCTION
Airplanes normally meet very stringent range, endurance, speed and cruise speed
objectives while carrying a given payload. It is important to predict the minimum
airplane weight and the weight of fuel which is needed to accomplish a given mission.
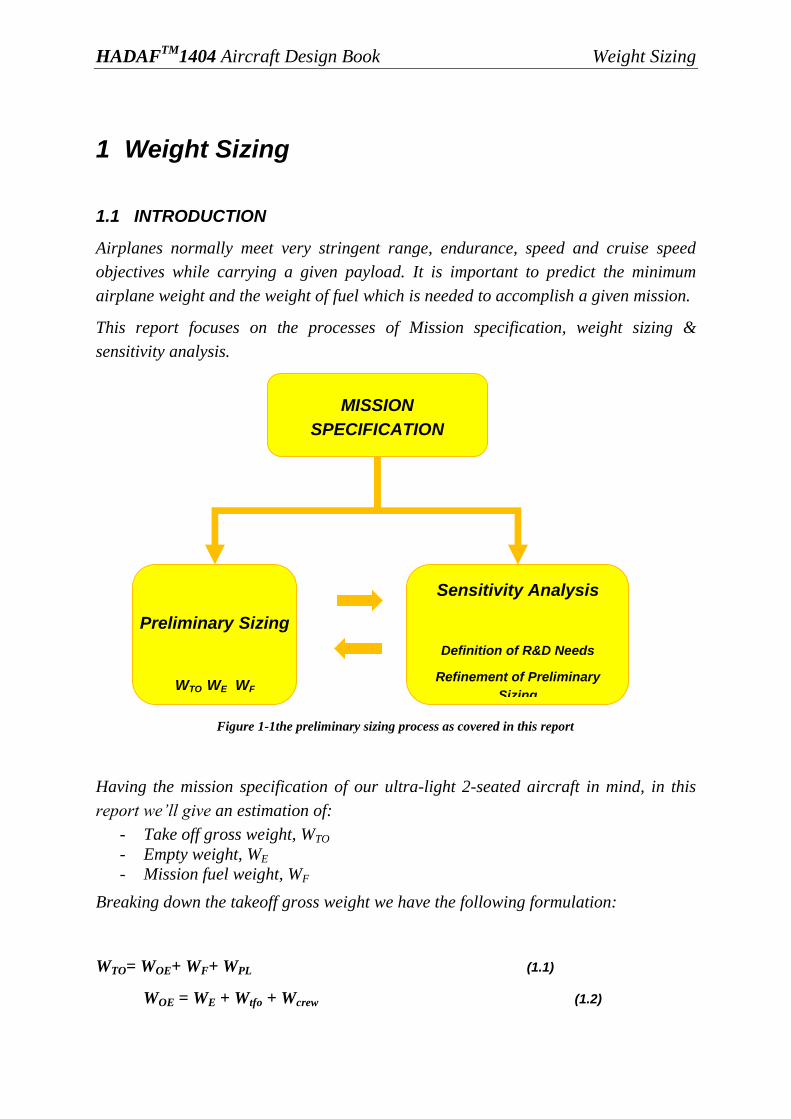
This report focuses on the processes of Mission specification, weight sizing &
sensitivity analysis.
Figure 1-1the preliminary sizing process as covered in this report
Having the mission specification of our ultra-light 2-seated aircraft in mind, in this
report we‟ll give an estimation of:
- Take off gross weight, WTO
- Empty weight, WE
- Mission fuel weight, WF
Breaking down the takeoff gross weight we have the following formulation:
WTO= WOE+ WF+ WPL (1.1)
WOE = WE + Wtfo + Wcrew (1.2)
Preliminary Sizing
WTO WE WF
Sensitivity Analysis
Definition of R&D Needs
Refinement of Preliminary
Sizing
MISSION
SPECIFICATION
HADAFTM
1404 Aircraft Design Book Weight Sizing
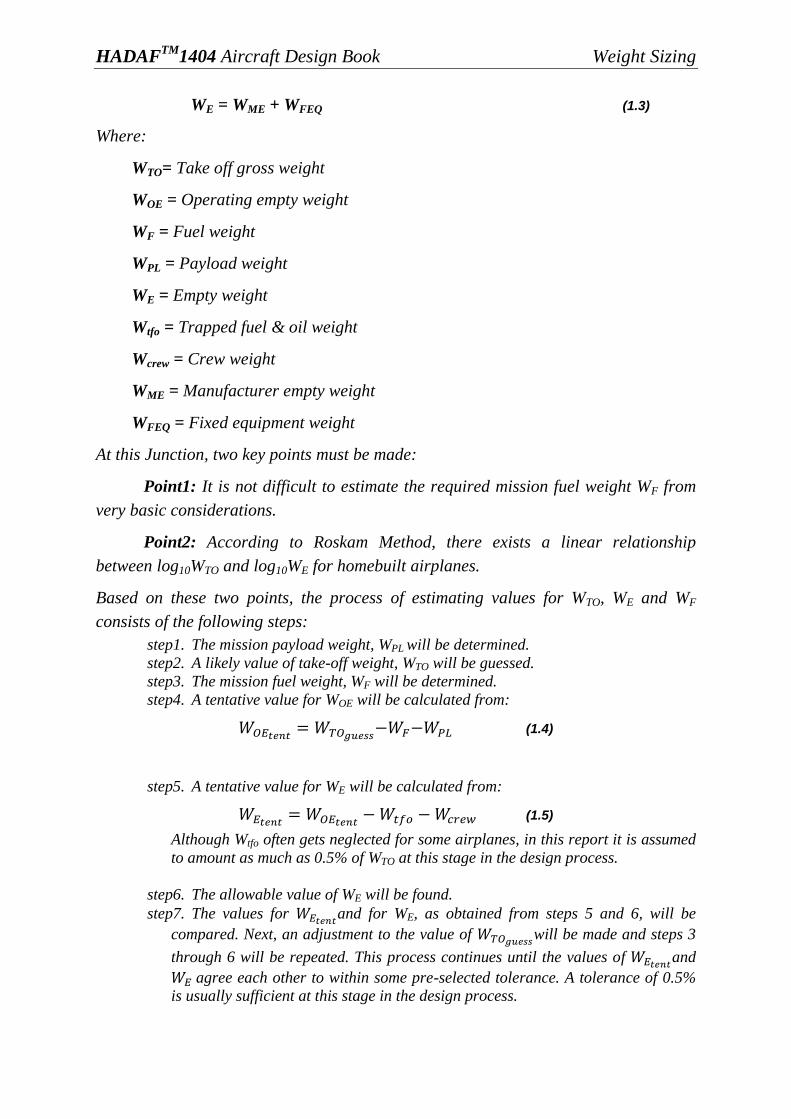
WE = WME + WFEQ (1.3)
Where:
WTO= Take off gross weight
WOE = Operating empty weight
WF = Fuel weight
WPL = Payload weight
WE = Empty weight
Wtfo = Trapped fuel & oil weight
Wcrew = Crew weight
WME = Manufacturer empty weight
WFEQ = Fixed equipment weight
At this Junction, two key points must be made:
Point1: It is not difficult to estimate the required mission fuel weight WF from
very basic considerations.
Point2: According to Roskam Method, there exists a linear relationship
between log10WTO and log10WE for homebuilt airplanes.
Based on these two points, the process of estimating values for WTO, WE and WF
consists of the following steps:
step1. The mission payload weight, WPL will be determined.
step2. A likely value of take-off weight, WTO will be guessed.
step3. The mission fuel weight, WF will be determined.
step4. A tentative value for WOE will be calculated from:
(1.4)
step5. A tentative value for WE will be calculated from:
(1.5)
Although Wtfo often gets neglected for some airplanes, in this report it is assumed
to amount as much as 0.5% of WTO at this stage in the design process.
step6. The allowable value of WE will be found.
step7. The values for and for WE, as obtained from steps 5 and 6, will be
compared. Next, an adjustment to the value of will be made and steps 3
through 6 will be repeated. This process continues until the values of and
agree each other to within some pre-selected tolerance. A tolerance of 0.5%
is usually sufficient at this stage in the design process.

HADAFTM
1404 Aircraft Design Book Weight Sizing
Figure 1-2roadmap of weight sizing process done by HADAFTM group
After estimating takeoff gross weight and aircraft empty weight is completely done by
using Breguit equations, some coefficients called growth factors will be calculated.
This part of weight estimation process will be fully discussed in the last part of this
report.
Weight estimating process is actually the most important part of plane designing
process, because all upcoming calculations in the other parts will be taken into
account based on information gained in this part. So, this part must be done with
much more efforts and strict rational reasoning.
1.2 MISSON SPECIFICATION
In order to define a mission for the goal plane, different aviation regulations must be
considered such as FAR and JAR and mix the information gained this way with our
especial needs and create a mission profile. Correctness of this profile is so important
because any mistake in this step, may accuse every assumption that has been made
earlier, and therefore all other design processes would be incorrect. Not having a
correct and fit view to flight mission profile, causes the designer to be confused in
gathering data for the database too. So second relation between WTO and WE will
HADAFTM
1404 Aircraft Design Book Weight Sizing
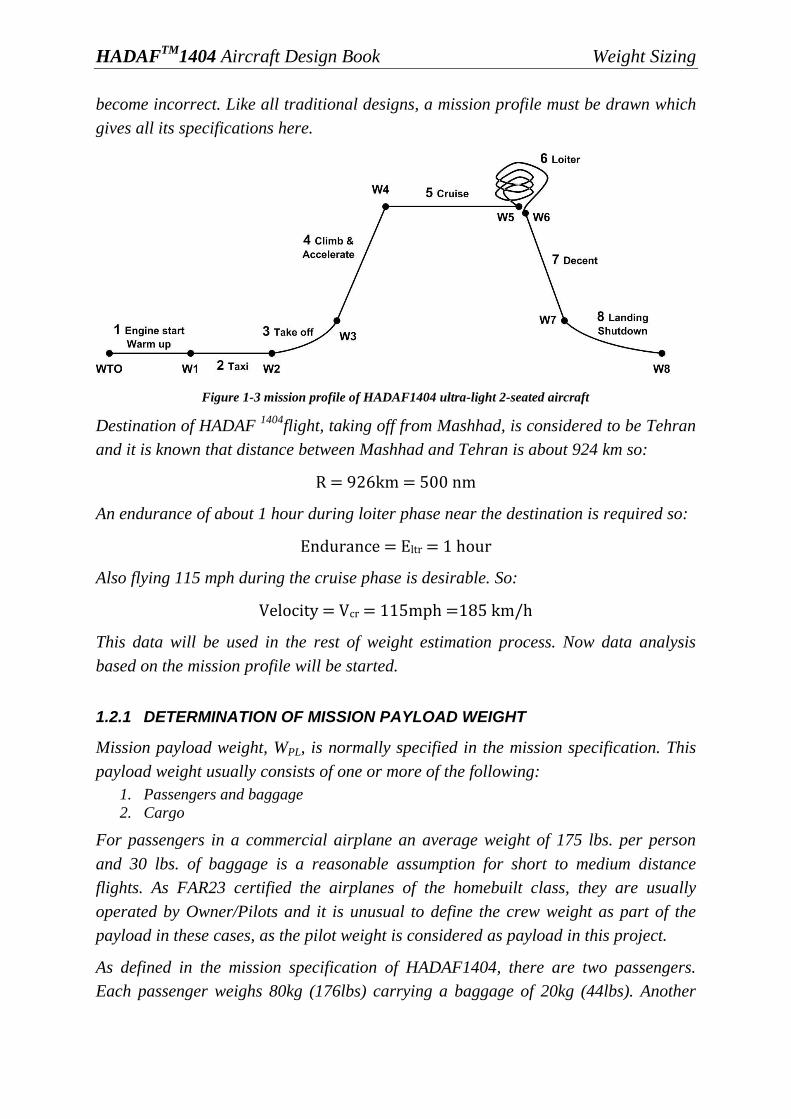
become incorrect. Like all traditional designs, a mission profile must be drawn which
gives all its specifications here.
Figure 1-3 mission profile of HADAF1404 ultra-light 2-seated aircraft
Destination of HADAF 1404
flight, taking off from Mashhad, is considered to be Tehran
and it is known that distance between Mashhad and Tehran is about 924 km so:
R = 926km = 500 nm
An endurance of about 1 hour during loiter phase near the destination is required so:
Endurance = Eltr = 1 hour
Also flying 115 mph during the cruise phase is desirable. So:
Velocity = Vcr = 115mph =185 km/h
This data will be used in the rest of weight estimation process. Now data analysis
based on the mission profile will be started.
1.2.1 DETERMINATION OF MISSION PAYLOAD WEIGHT
Mission payload weight, WPL, is normally specified in the mission specification. This
payload weight usually consists of one or more of the following:
1. Passengers and baggage
2. Cargo
For passengers in a commercial airplane an average weight of 175 lbs. per person
and 30 lbs. of baggage is a reasonable assumption for short to medium distance
flights. As FAR23 certified the airplanes of the homebuilt class, they are usually
operated by Owner/Pilots and it is unusual to define the crew weight as part of the
payload in these cases, as the pilot weight is considered as payload in this project.
As defined in the mission specification of HADAF1404, there are two passengers.
Each passenger weighs 80kg (176lbs) carrying a baggage of 20kg (44lbs). Another

HADAFTM
1404 Aircraft Design Book Weight Sizing
additional 30kg cargo is taken into account. So the total mission payload will be
230kg (507lbs). This payload weight presents a high payload weight for this type of
ultra-light airplanes.
This additional cargo is considered to meet the target applications of HADAF1404.
As a family airplane HADAF1404 can carry a child up to 25Kg (and 5kg for baby-
chair). For Urban, rescue, meteorological, or forestry purposes, this additional cargo
is considered for extra equipment carried by airplane.
1.2.2 DETERMINATION OF MISSION FUEL RESERVES
Fuel reserves are normally specified in the mission specification. They are also
specified in those FAR regulations. Due to Roskam method, fuel reserves are
generally specified in one or more of the following types:
1. As a fraction of WF,used.
2. As a requirement for additional range so that an alternate airport can be reached
3. As a requirement for loiter time
Since a long loiter time has been assumed in mission specifications of HADAF1404,
no additional fuel reserve was held in considerations. So:
Table 1-1 mission specification for HADAFTM1404
Airplane code: HADAF1404
Airplane type: Homebuilt airplane
Payload: Two passengers at 80kg each (includes pilot), 40kg
total baggage and 30kg additional weight
Range: 926km (500 nm) with maximum payload
(No reserved fuel is considered.)
Endurance: 1hour loiter
Altitude: 12,000 ft. (for the design range)
Certification base: FAR23
HADAFTM
1404 Aircraft Design Book Weight Sizing
1.3 DATA ANALYSIS
Data gathering is the next stage. This stage is very important and simultaneously too
time consuming. Gathering the data started by denoting a range for takeoff gross
weight. Having flight mission and this range in mind, team members created a
database which consists of 150 ultra-light aircraft. The initial database included 2-
seated, 3-seated and low weight 4-seated aircrafts. As soon as this database
completed, a number of items were omitted based on some other factors. These factors
are as listed below:
i. Material: Since it was decided to build the aircraft with composite materials
before the start of the design process, all metallic or wooden aircrafts were not
applicable as the entries of the database. Therefore some of these aircrafts
were omitted from the database.
ii. Range: As it is assumed, the range of flight to be about 500 nm, the planes
that their ranges were out of 450 – 600 nm range were omitted from the
database.
iii. Type of plane: Some planes in the database have irrelevant applications. So,
it doesn‟t make any sense to put these planes data in the database.
iv. Lack of data: data sets of some planes were incomplete and despite of many
searches their missing data could not be found.
v. Similarity of some data: For some pairs of planes data, there is a close
similarity. Therefore, one of them should be omitted. Because similarity of data
leads to error when plotting WTO vs. WE diagram and of course leads to gain
incorrect coefficients.
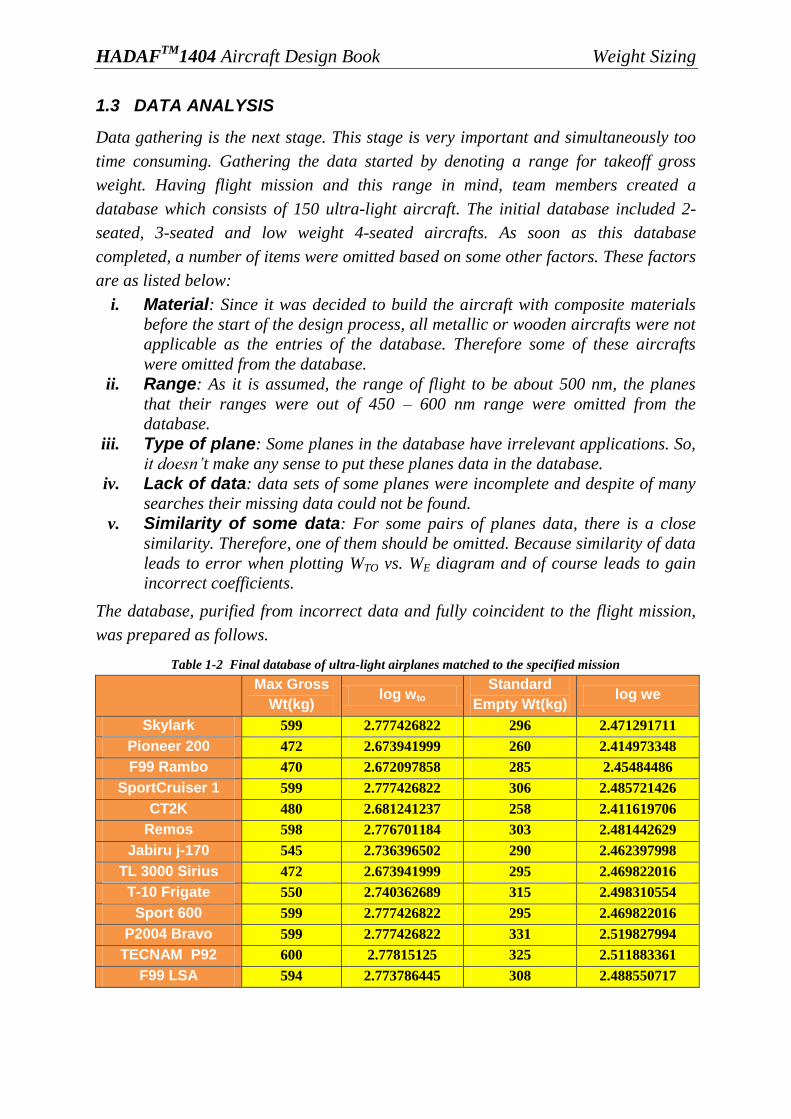
The database, purified from incorrect data and fully coincident to the flight mission,
was prepared as follows.
Table 1-2 Final database of ultra-light airplanes matched to the specified mission
Max Gross
Wt(kg) log wto
Standard
Empty Wt(kg) log we
Skylark 599 2.777426822 296 2.471291711
Pioneer 200 472 2.673941999 260 2.414973348
F99 Rambo 470 2.672097858 285 2.45484486
SportCruiser 1 599 2.777426822 306 2.485721426
CT2K 480 2.681241237 258 2.411619706
Remos 598 2.776701184 303 2.481442629
Jabiru j-170 545 2.736396502 290 2.462397998
TL 3000 Sirius 472 2.673941999 295 2.469822016
T-10 Frigate 550 2.740362689 315 2.498310554
Sport 600 599 2.777426822 295 2.469822016
P2004 Bravo 599 2.777426822 331 2.519827994
TECNAM P92 600 2.77815125 325 2.511883361
F99 LSA 594 2.773786445 308 2.488550717

HADAFTM
1404 Aircraft Design Book Weight Sizing
In section 2.1 of Part1 of Roskam method, point 2 raised the issue of the existence of a
linear relationship between log10WE and log10WTO. Once such relationship is
established, it should be easy to obtain WE from WTO.
It is desirable as small as value for WE for any given WTO. Therefore, it is reasonable
to assume, that a manufacturer will always try to make WE as small as possible for
any given takeoff weight.
For that reason, at any value of WTO in table1-2, the corresponding value of WE
should be viewed as the 'minimum allowable' value at the current 'state-of-the-art' of
airplane design.
The trend of log WTO vs. log WE is plotted and calculation of the coefficients, A and B,
is performed.
Log10 (WTO) = A + B.Log10 (WE) (1.6)
Our based-on-database plot of Log10(WTO)vs.Log10(WE) and the calculated
coefficients of the upcoming equation are:
Log10(WTO) = 1.069 Log10(WE) + 0.096 (1.7)
So A= 0.096 & B= 1.069
Figure 1-4 based-on-database plot of Log10 (WTO) vs. Log10 (WE)
y = 1.069x + 0.096 R² = 0.539
2.66
2.68
2.7
2.72
2.74
2.76
2.78
2.8
2.4 2.42 2.44 2.46 2.48 2.5 2.52 2.54

HADAFTM
1404 Aircraft Design Book Weight Sizing
1.4 WEIGHT SIZING
Illustrated in figure1-2, stages of this part were explained in the previous sections.
Now it‟s the time to present the calculated data for each weight element. The purpose
of this section is the detailed calculations of each term in takeoff gross weight, one by
one, as shown in the introduction.
- Payload weight
Payload weight is assumed to be equaled to 230 kg
- Trapped fuel & oil
Wtfo = 0.005 WTO (1.8)
- Reserved Fuel
Wres = 0 lit
- Fuel Fractions
According to table 2.1 of Roskam book fuel fractions suggested for a homebuilt
aircraft is as listed below:
Table 1-3 table of fuel fractions except cruise and loiter phase
Phase
Engine
start,
warm-up
Taxi Take-
off Climb Descent
Landing,
Taxi
Shut
Down
Homebuilt 0.998 0.998 0.998 0.995 0.995 0.995
- Breguit equations
For cruise and loiter phases, fuel fractions cannot be chosen from such a table,
because for these phases, fuel fractions depend on factors L/D, CP, R, P , V and E. So
for different cases different values for fuel fractions is expectable. For the goal plane,
values as listed in tables1-3 and 1-4 for cruise and loiter phases are assumed.
Fuel fraction of the phase of climb was calculated by Breguit equations, too. But the
fuel fractions presented by statistical information of Roskam were used.
i. Cruise phase:
According to table 2.2 of Roskam book, the suggested value for L/D is 8 to 10. But it is
clear that airplanes with smooth exteriors and/or high wing loadings can have L/D
HADAFTM
1404 Aircraft Design Book Weight Sizing
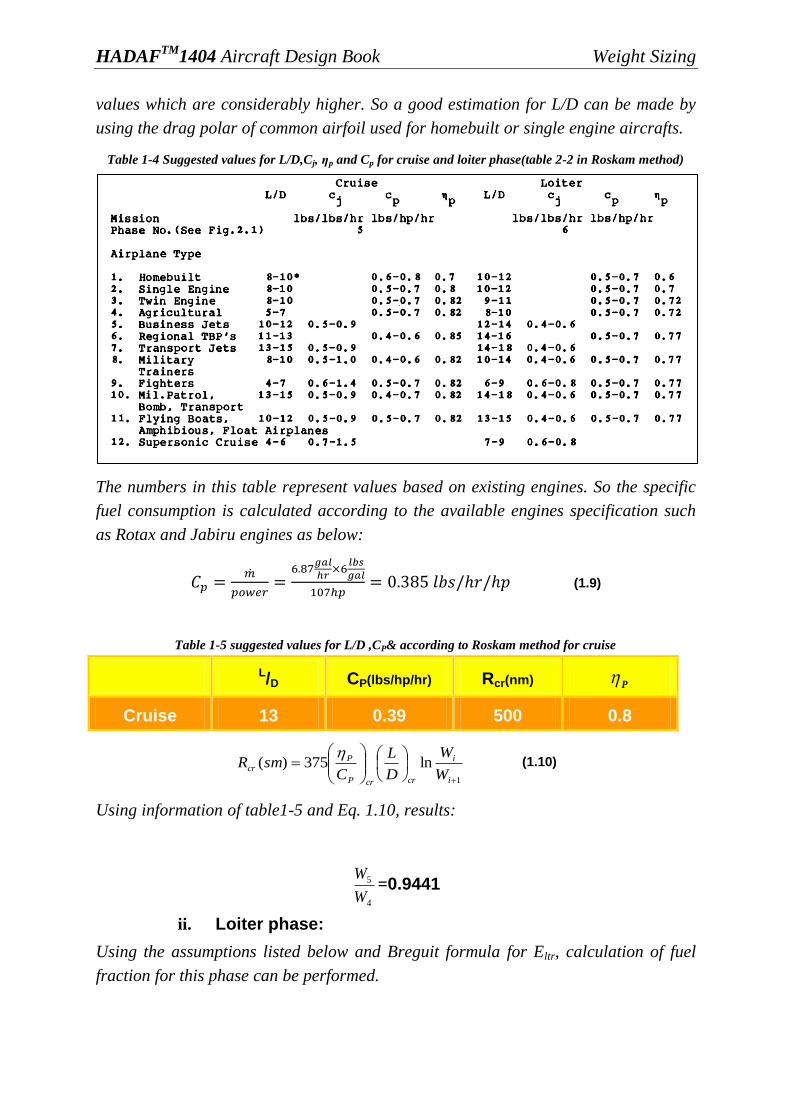
values which are considerably higher. So a good estimation for L/D can be made by
using the drag polar of common airfoil used for homebuilt or single engine aircrafts.
Table 1-4 Suggested values for L/D,Cj,ηp and Cp for cruise and loiter phase(table 2-2 in Roskam method)
The numbers in this table represent values based on existing engines. So the specific
fuel consumption is calculated according to the available engines specification such
as Rotax and Jabiru engines as below:
(1.9)
Table 1-5 suggested values for L/D ,CP& according to Roskam method for cruise
L/D CP(lbs/hp/hr) Rcr(nm) P
Cruise 13 0.39 500 0.8
1
ln375)(
i
i
crcrP
Pcr
W
W
D
L
CsmR
(1.10)
Using information of table1-5 and Eq. 1.10, results:
4
5
W
W=0.9441
ii. Loiter phase:
Using the assumptions listed below and Breguit formula for Eltr, calculation of fuel
fraction for this phase can be performed.

HADAFTM
1404 Aircraft Design Book Weight Sizing
Cp in loiter phase will be increased because the fuel consumption will be increased in
compare with the cruise phase. Cp was assumed to be 0.45 for loiter phase.
ηp in loiter phase will be decreased because the speed of propeller is decreased. So, it
is assumed to be 75 % for loiter phase.
Table 1-6 suggested values for L/D,CP, according to Roskam method for Loiter
L/D CP(lbs/hp/hr) Vltr(mph) Eltr (hours) P
Loiter 14 0.45 70 1 0.75
1
ln1
375)(
i
i
ltrltrP
P
ltr
ltrW
W
D
L
CVhoursE
(1.11)
Using information of table1-5 and Eq. 1.11 results:
5
6
W
W= 0.992
So for Mff:
ffMTOW
W1
1
2
W
W
2
3
W
W
3
4
W
W
4
5
W
W
5
6
W
W
6
7
W
W
7
8
W
W= 0.9170 (1.12)
For reserved fuel below equation is used:
resFWresFTOffF WWMW )1( (1.13)
Substituting the magnitudes in the main equation for WTO, results:
(1.14)
(1.15)
Solving the equation system below results:
(1.16)
(1.17)
HADAFTM
1404 Aircraft Design Book Weight Sizing
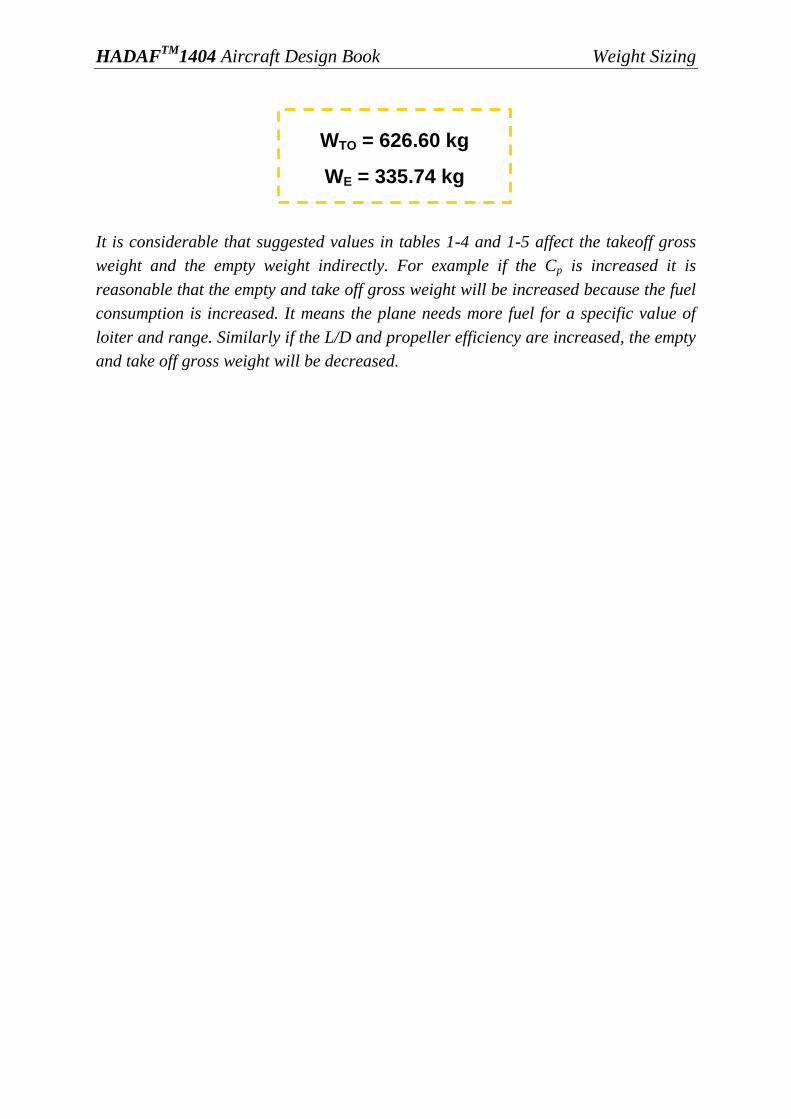
It is considerable that suggested values in tables 1-4 and 1-5 affect the takeoff gross
weight and the empty weight indirectly. For example if the Cp is increased it is
reasonable that the empty and take off gross weight will be increased because the fuel
consumption is increased. It means the plane needs more fuel for a specific value of
loiter and range. Similarly if the L/D and propeller efficiency are increased, the empty
and take off gross weight will be decreased.
WTO = 626.60 kg
WE = 335.74 kg

HADAFTM
1404 Aircraft Design Book Weight Sizing
1.5 SENSETIVITY ANALYSIS
It is evident from the way the results in previous sections were obtained, that their
outcome depends on the values selected for the various parameters in the range and
endurance equations.
Data calculated in this part, shows how the take-off gross weight of HADAF1404,
varies with parameters below.
1. Payload, WPL
2. Empty weight, WE
3. Range, R
4. Endurance, E
5. Lift-to-drag ratio, L/D
6. Specific fuel consumption, CP
7. Propeller efficiency, P
After preliminary sizing it is mandatory to conduct sensitivity studies on the
parameters 1-7 listed above.
The reasons for doing this are:
A. To find out which parameters drive the design
B. To determine which areas of technological change must be pursued, if some
new mission capability must be achieved.
C. If parameters 5, 6 or 7 are selected optimistically (or pessimistically), the
sensitivity studies provide a quick estimate of the impact of such optimism (or
pessimism) on the design.
With the help of Equations (1.1) to (1.3) and assumptions made in the previous part
the following simplifications could be done:
WE = WTO – WF – WPL – Wtfo – Wcrew
WF = (1- Mff)WTO + Wres = (1- Mff)WTO + Mres (1- Mff) WTO (1.19)
With a substitution we have:
WE = WTO {1- (1+ Mres)(1-Mff) – Mtfo)} – (WPL + Wcrew) (1.20)
The latter can be written as:
WE = CWTO – D (1.21)
HADAFTM
1404 Aircraft Design Book Weight Sizing
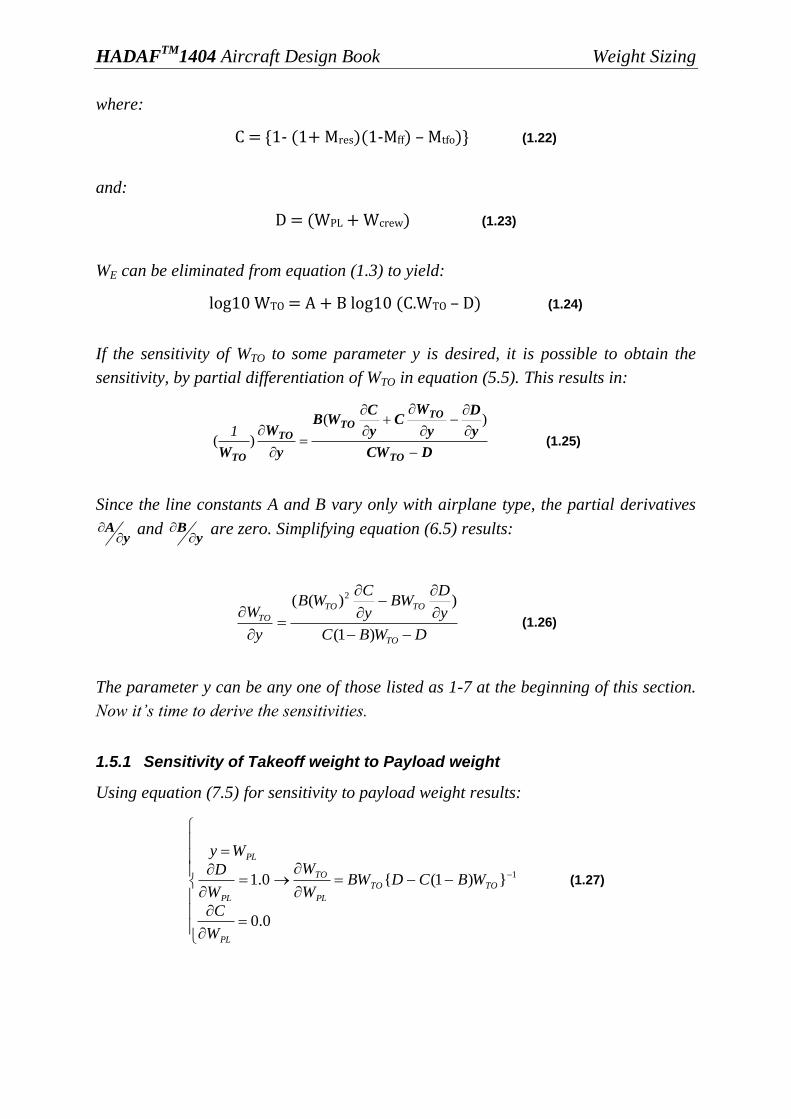
where:
C = {1- (1+ Mres)(1-Mff) – Mtfo)} (1.22)
and:
D = (WPL + Wcrew) (1.23)
WE can be eliminated from equation (1.3) to yield:
log10 WTO = A + B log10 (C.WTO – D) (1.24)
If the sensitivity of WTO to some parameter y is desired, it is possible to obtain the
sensitivity, by partial differentiation of WTO in equation (5.5). This results in:
DCW
y
D
y
WC
y
CWB
y
W
W TO
TOTO
TO
TO
)(
)(1
(1.25)
Since the line constants A and B vary only with airplane type, the partial derivatives
yA
and y
B
are zero. Simplifying equation (6.5) results:
DWBC
y
DBW
y
CWB
y
W
TO
TOTO
TO
)1(
))(( 2
(1.26)
The parameter y can be any one of those listed as 1-7 at the beginning of this section.
Now it‟s time to derive the sensitivities.
1.5.1 Sensitivity of Takeoff weight to Payload weight
Using equation (7.5) for sensitivity to payload weight results:
1})1({
0.0
0.1
TOTO
PL
TO
PL
PL
PL
WBCDBWW
W
W
C
W
D
Wy
(1.27)

HADAFTM
1404 Aircraft Design Book Weight Sizing
Having the assumptions below in mind the result will be:
Assumptions: A= 0.096, B = 1.069, C = 0.9165, D = 230, WTO = 626
1.5.2 Sensitivity of Takeoff weight to Empty weight
By partial differentiation of WTO with respect to WE the take-off weight to empty
weight sensitivity is expressed as:
B
AW
TO
E
TO
TO
e
BW
W
W
)(log
10 (1.28)
Having the assumptions below in mind the result will be:
Assumptions: A= 0.096, B = 1.069, C = 0.9165, D = 230, WTO = 626
53.51
E
TO
W
W
1.5.3 Sensitivity of Takeoff weight to Range, Endurance, Speed, Specific Fuel
Consumption, Propeller Efficiency and Lift-to-Drag Ratio
Withdrawing the time-consuming derivation of the equations, the following set of
relations is derived:
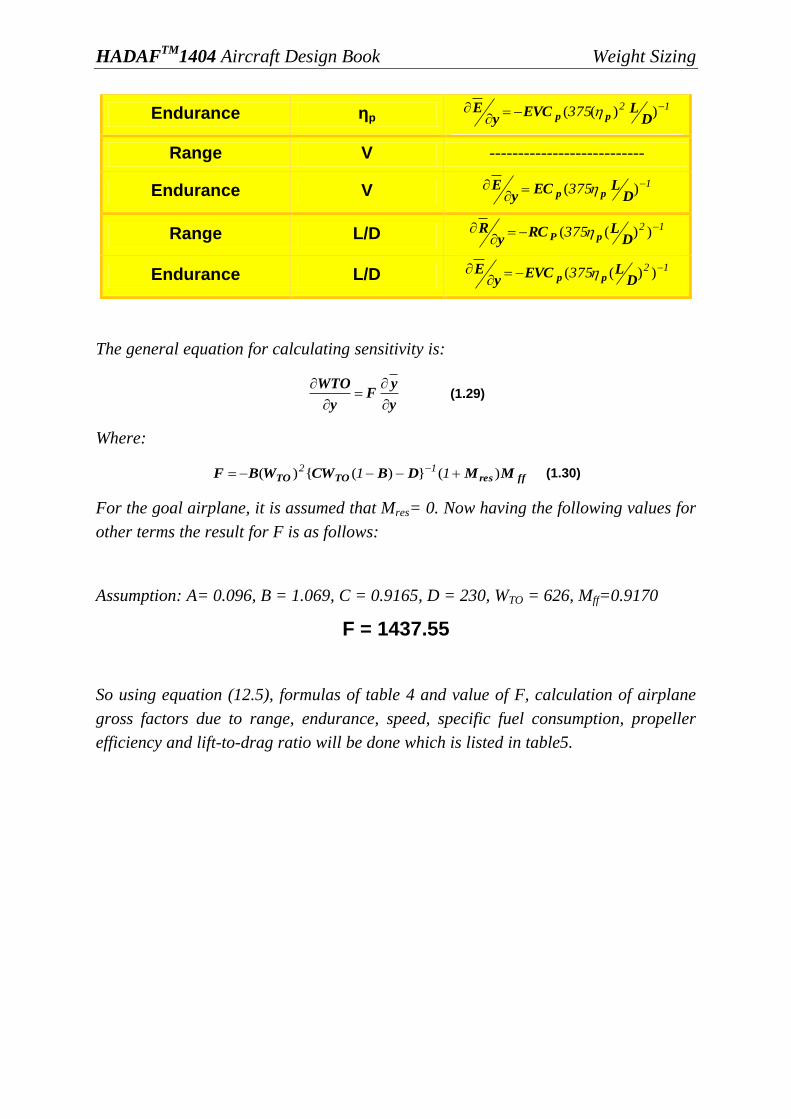
Table 1-7 BreguitpartialsforpropellerdrivenairplanesAdoptedfrom“AirplaneDesign”writtenbyDr.John
Roskam, part I, preliminary sizing
Range/Endurance Case Y ∂R
/∂y / ∂E
/∂y
Range R 1375
)(
DLC
yR
pp
Endurance E 1375
)(
DLVC
yE
pp
Range Cp 1375
)(
DLR
yR
p
Endurance Cp 1375
)(
DLVE
yE
p
Range ηp 12375
))((
DLRC
yR
pP
_ _
481.2
PL
TO
W
W
HADAFTM
1404 Aircraft Design Book Weight Sizing
Endurance ηp 12375
))((
DLEVC
yE
pp
Range V ---------------------------
Endurance V 1375
)(
DLEC
yE
pp
Range L/D 12375
))((
DLRC
yR
pP
Endurance L/D 12375
))((
DLEVC
yE
pp
The general equation for calculating sensitivity is:
y
yF
y
WTO
(1.29)
Where:
ffresTOTO MMDBCWWBF )(})({)( 11 12 (1.30)
For the goal airplane, it is assumed that Mres= 0. Now having the following values for
other terms the result for F is as follows:
Assumption: A= 0.096, B = 1.069, C = 0.9165, D = 230, WTO = 626, Mff=0.9170
F = 1437.55
So using equation (12.5), formulas of table 4 and value of F, calculation of airplane
gross factors due to range, endurance, speed, specific fuel consumption, propeller
efficiency and lift-to-drag ratio will be done which is listed in table5.
HADAFTM
1404 Aircraft Design Book Weight Sizing
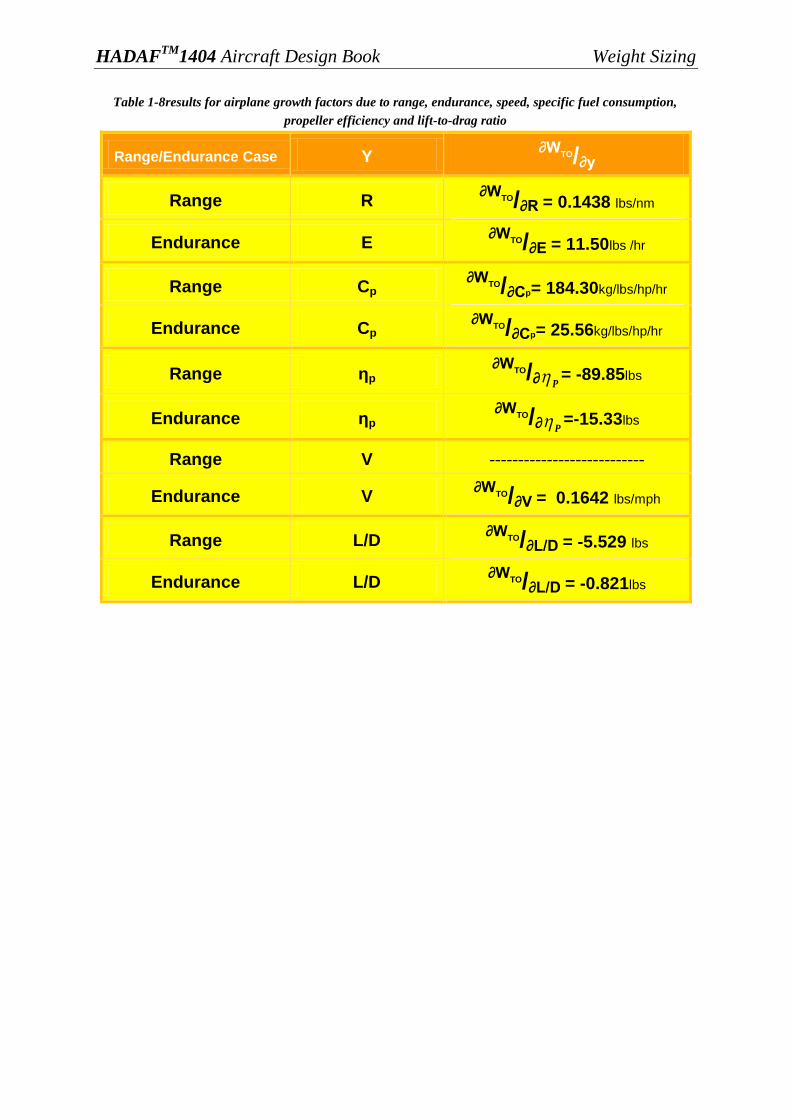
Table 1-8results for airplane growth factors due to range, endurance, speed, specific fuel consumption,
propeller efficiency and lift-to-drag ratio
Range/Endurance Case Y ∂W
TO/∂y
Range R ∂W
TO/∂R = 0.1438 lbs/nm
Endurance E ∂W
TO/∂E = 11.50lbs /hr
Range Cp ∂W
TO/∂Cp= 184.30kg/lbs/hp/hr
Endurance Cp ∂W
TO/∂Cp= 25.56kg/lbs/hp/hr
Range ηp ∂W
TO/∂ P = -89.85lbs
Endurance ηp ∂W
TO/∂ P =-15.33lbs
Range V ---------------------------
Endurance V ∂W
TO/∂V = 0.1642 lbs/mph
Range L/D ∂W
TO/∂L/D = -5.529 lbs
Endurance L/D ∂W
TO/∂L/D = -0.821lbs
HADAFTM
1404 Aircraft Design Book Weight Sizing
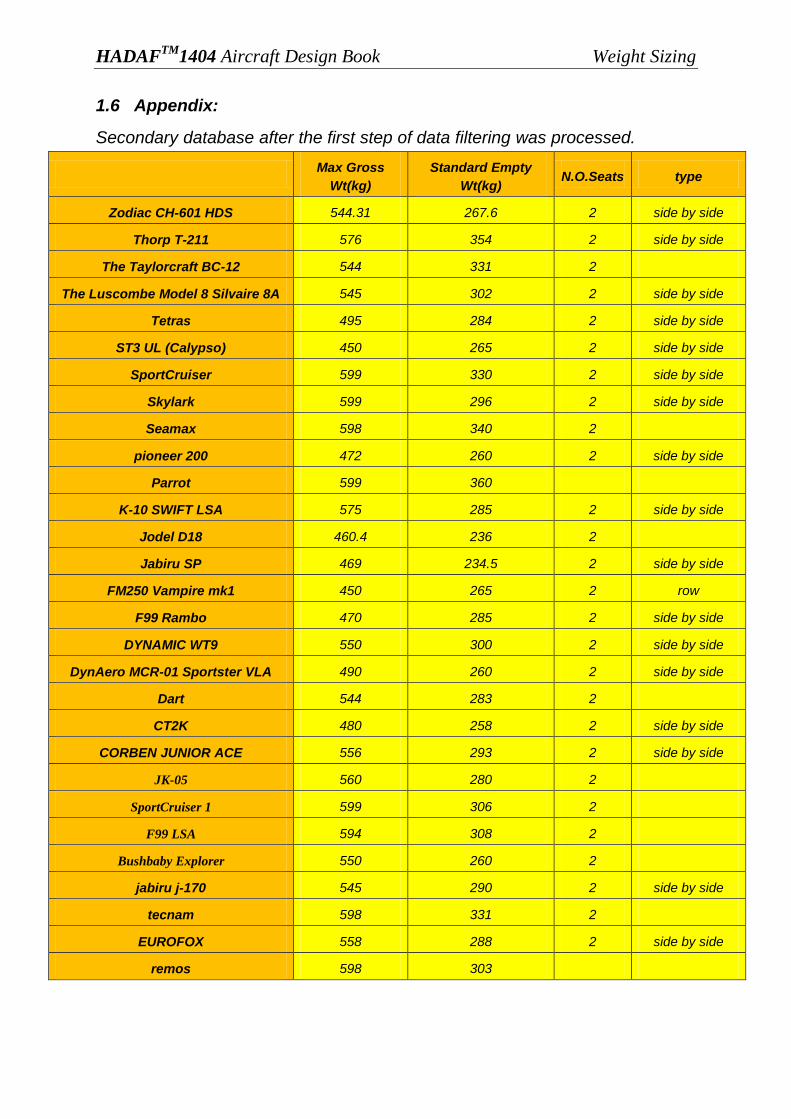
1.6 Appendix:
Secondary database after the first step of data filtering was processed.
Max Gross
Wt(kg)
Standard Empty
Wt(kg) N.O.Seats type
Zodiac CH-601 HDS 544.31 267.6 2 side by side
Thorp T-211 576 354 2 side by side
The Taylorcraft BC-12 544 331 2
The Luscombe Model 8 Silvaire 8A 545 302 2 side by side
Tetras 495 284 2 side by side
ST3 UL (Calypso) 450 265 2 side by side
SportCruiser 599 330 2 side by side
Skylark 599 296 2 side by side
Seamax 598 340 2
pioneer 200 472 260 2 side by side
Parrot 599 360
K-10 SWIFT LSA 575 285 2 side by side
Jodel D18 460.4 236 2
Jabiru SP 469 234.5 2 side by side
FM250 Vampire mk1 450 265 2 row
F99 Rambo 470 285 2 side by side
DYNAMIC WT9 550 300 2 side by side
DynAero MCR-01 Sportster VLA 490 260 2 side by side
Dart 544 283 2
CT2K 480 258 2 side by side
CORBEN JUNIOR ACE 556 293 2 side by side
JK-05 560 280 2
SportCruiser 1 599 306 2
F99 LSA 594 308 2
Bushbaby Explorer 550 260 2
jabiru j-170 545 290 2 side by side
tecnam 598 331 2
EUROFOX 558 288 2 side by side
remos 598 303

HADAFTM
1404 Aircraft Design Book Weight Sizing
Climb rate
(ft/min)
max speed
(kt)
stall speed
(kts)
stall speed
(m/s)
Zodiac CH-601 HDS 1300 140 48 24.6912
Thorp T-211 <750 138 39 20.0616
The Taylorcraft BC-12 500 96 33 16.9752
The Luscombe Model 8 Silvaire 8A 900 185 0
Tetras 1300 113 30 15.432
ST3 UL (Calypso) 1000 116 35 18.004
SportCruiser 1200 139 30 15.432
Skylark 1200 156 36 18.5184
Seamax 1000 139 41 21.0904
pioneer 200 1000 130 33 16.9752
Parrot 1000 137 35 18.004
K-10 SWIFT LSA 984 119 37 19.0328
Jodel D18 650 106 40 20.576
Jabiru SP 1000 110 40 20.576
FM250 Vampire mk1 984 119 35 18.004
F99 Rambo 1200 124 33.5 17.2324
DYNAMIC WT9 1000 151 0
DynAero MCR-01 Sportster VLA 1750 172 47 24.1768
Dart 1200 170 56 28.8064
CT2K 1000 167 33 16.9752
CORBEN JUNIOR ACE 600 113 38 19.5472
JK-05 1574.8 111.24 29.5559 15.235
SportCruiser 1 1181.1 139.32 29.5559 15.235
F99 LSA 1082.675 138.24 499.7634 257.61
Bushbaby Explorer 984.25 112.86 33.85494 17.451
jabiru j-170 700 125 38 19.5472
tecnam 1200 154 37 19.0328
EUROFOX 980 110 35 18.004
remos 1050 120 38 19.5472

HADAFTM
1404 Aircraft Design Book Weight Sizing
fuel capacity
(L) Powerplants
Power
(hp)
Zodiac CH-601 HDS 72.74 Rotax 912ULS (100Hp) 100
Thorp T-211 79.5 0-200-A, 100hp @2700 rpm 100
The Taylorcraft BC-12 68 Continental A-65 flat four piston engine 65
The Luscombe Model 8 Silvaire 8A Continental A-65 flat four piston engine 65
Tetras 85 912 S (100 hp) 100
ST3 UL (Calypso) Jabiru 2200 (85 hp) 85
SportCruiser 114 Rotax 912 ULS(100 hp) 100
Skylark 90 Rotax 912S(100hp) 100
Seamax 93.37 Rotax 100
pioneer 200 54 Rotax 912 - 100 Engine incl.Airbox 100
Parrot 114 Rotax 912ULs (100 PS) or Jabiru 3300 100
K-10 SWIFT LSA 80 4 - Stroke Rotax 912ULS(100hp) 100
Jodel D18 65 Limbach EO2X L2000 80
Jabiru SP 65 Jabiru 2200cc (85hp) 85
FM250 Vampire mk1 65 4 - Cylinder 4 - Stroke Rotax 912UL 80
F99 Rambo Rotax 912 80
DYNAMIC WT9 99.93
DynAero MCR-01 Sportster VLA 75 Rotax (100 hp) 100
Dart 95 VW 2100cc HP Range 80/80-150
CT2K 110 Rotax912S 100
CORBEN JUNIOR ACE 83 Continental, Lycoming
JK-05 60 Rotax 912 80
SportCruiser 1 112 Rotax 912 ULS 100 HP 100
F99 LSA Rotax 912 S 100
Bushbaby Explorer 100 Rotax 912 ULS 100
jabiru j-170 134 Jabiru 2200 85 hp 85
tecnam Rotax 912 ULS2 Engine (100 hp) 100
EUROFOX 75 Rotax 912 80
remos 912 UL-S 100

HADAFTM
1404 Aircraft Design Book Weight Sizing
Wingspan
(m)
Wing Area
(sqm)
wing loading
(lbs/sq.ft) Clmax
Zodiac CH-601 HDS 7.01 9.1 12.25748141 1.5714
Thorp T-211 7.6 9.7 12.1687809 2.3631
The Taylorcraft BC-12 10.98 17.1 6.519272158 1.7682
The Luscombe Model 8 Silvaire 8A 10.68 13 8.591113812 #DIV/0!
Tetras 10.1 15.7 6.461031658 2.1204
ST3 UL (Calypso) 9.4 9.31 9.905106633 2.3883
SportCruiser 8.78 13.2 9.299277628 3.0519
Skylark 7.92 9.38 13.08640348 2.9825
Seamax 8.74 12.07 10.15290299 1.784
pioneer 200 7.55 10.5 9.211895911 2.4985
Parrot 9.5 11 11.15913315 2.6907
K-10 SWIFT LSA 9.1 11.8 9.98578382 2.1545
Jodel D18 7.5 9.84 9.588187959 1.77
Jabiru SP 8.02 7.89 12.18125857 2.2487
FM250 Vampire mk1 7.8 10.05 9.175775398 2.2124
F99 Rambo 9.1 10.1 9.536144135 2.5099
DYNAMIC WT9 9 10.3 10.94263183 #DIV/0!
DynAero MCR-01 Sportster VLA 6.63 5.2 19.31030169 2.582
Dart 7.01 7 15.92565056 1.5
CT2K 10.22 12.06 8.156244798 2.2122
CORBEN JUNIOR ACE 8 10.21 11.15951633 2.2827
JK-05 10.76 9.72 11.80641608 3.9756
SportCruiser 1 8.5 11.8 10.40258175 3.5029
F99 LSA 9.1 10.1 12.05206301 0.0142
Bushbaby Explorer 9.06 12.45 9.052940386 2.3234
jabiru j-170 9.6 9.29 11.8 2.4591
tecnam 8.99 12.4 9.882704761 2.1322
EUROFOX 9.2 11.5 9.943348957 2.3975
remos 9.29 10.96 11.18116232 2.2871

HADAFTM
1404 Aircraft Design Book Weight Sizing
1.7 References
1) Roskam, J., Airplane Design: Part II, Preliminary Configuration Design and
Integration of the Propulsion System.
2) Mattingly, J.D., Elements of Propulsion: Gas Turbines and Rockets
3) Anderson, J.D., Fundamentals of Aerodynamics
HADAFTM
1404 Aircraft Design Book Performance Estimation
2 PERFORMANCE ESTIMATION
2.1 INTRODUCTION
In addition, to meeting range, endurance and cruise speed objectives, airplanes are
usually designed to meet performance objectives in the following flight regimes:
a. Stall speed
b. Take-off field length
c. Landing field length
d. Cruise speed (or maximum speed)
e. Climb rate
There are some airplane design parameters which affect the performance flight
regimes listed above. These parameters are:
1. Wing area, S
2. Take-off trust, TTO or take-off power, PTO
3. Maximum required take-off lift coefficient with flaps up: CL ,max (clean)
4. Maximum required lift coefficient for take-off, CL ,max TO
5. Maximum required lift coefficient for landing, CL ,max L , or CL ,max PA
The purpose of this part is to determine a range of values of wing loading, W/S, thrust
loading, T/W, and maximum lift coefficient, CL,max, within which certain performance
requirements are met. Combination of the highest possible wing loading and the
lowest possible thrust loading (or power loading) which still meets all performance
requirements, results in an airplane with the lowest weight and the lowest cost.
2.2 SIZING TO STALL SPEED REQUIREMENTS
The mission task demands a stall speed not higher than some minimum value. As
certified by the FAR23, single-engine airplanes may not have a stall speed greater
than 61 kts at WTO.
The power-off stall speed of an airplane may be determined from:
(2.1)

HADAFTM
1404 Aircraft Design Book Performance Estimation
By specifying a minimum allowable stall speed at some altitude, Eq. (2.1) defines a
maximum allowable wing loading W/S for a given value of CL. Table2-1 presents
typical values for CL for homebuilt airplanes.
Table 2-1Typical values for maximum lift coefficient
Airplane Type CL ,max CL ,max TO CL ,max L
Homebuilts 1.2-1.8 1.2-1.8 1.2-2.0
Values which are assumed during the design process are as listed in the following
table (table2-2). It is clear that CL max is strongly influenced by wing and airfoil
design, flap type, size and center of gravity location.
Table 2-2Assumptions made for calculating the stall speed requirement meeting criteria
Eq. (2.1) and Table2-2 may be combined to yield:
a. To meet the flaps down requirement:
(
)
(2.2)
b. To meet the flaps up requirement:
(
)
(2.3)
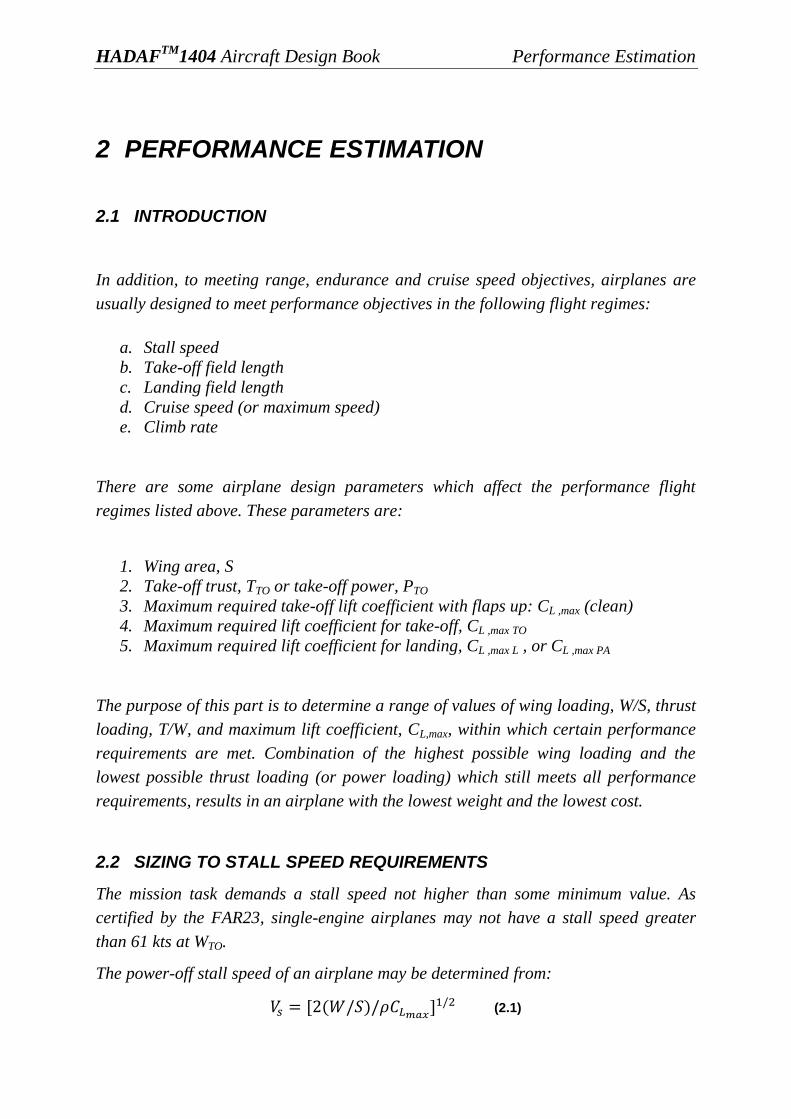
Therefore, to meet both requirements, the take-off wing loading, (W/S) TO must be less
than 10.9783 lbs/sq.ft. Figure2-1 illustrates it. The stall speed requirement was
formulated as a power-off requirement It means that neither power loading nor thrust
loading are important in this case, as seen in figure2-1:
VS(kts) CL ,max(clean) CL ,max TO CL ,max L ρ (lbm/ft2)
45 1.6 1.8 2 0.062
HADAFTM
1404 Aircraft Design Book Performance Estimation
Figure 2-1Stall speed sizing – illustrates the acceptable region for W/S and W/P values in according to stall
speedcriteria
2.3 SIZING TO TAKE-OFF DISTANCE REQUIREMENTS
Take-off distances of airplanes are determined by the following factors:
1. Take-off weight, WTO
2. Take-off speed, VTO
3. Trust-to-weight ratio at take-off, (T/W)TO (or weight-to-power ratio, (W/P)TO
4. Aerodynamic drag coefficient, CD and ground friction coefficient, µG
5. Pilot technique
Take-off requirements are normally given in terms of take-off field length
requirements. FAR23 and FAR25 criteria can be used for doing the design process in
this part. This requirement differs widely and depends on the type of airplane. So
FAR23 requirements are chosen during sizing process because FAR23 airplanes
usually are propeller driven airplanes.
Figure2-2 presents a definition of take-off distances used in the process of sizing an
airplane to FAR23 requirements.
9 9.5 10 10.5 11 11.5 12 12.5 13 13.5 140
20
40
60
80
100
120
140
160
180
200
Wing Loading(lbs/sq.ft)
Pow
er
Loadin
g(lbs/h
p)
Clmax Clean = 1.6
Clmax Take-off = 1.8
Clmax Landing = 2
Stall SpeedRequirements met

HADAFTM
1404 Aircraft Design Book Performance Estimation
Figure 2-2Definition of FAR 23 take-off distances
STOG (take-off ground roll) is proportional to (W/S)TO, (W/P)TO and CL,max TO :
(2.4)
Where TOP23 is take-off parameter for FAR23 airplanes:
Figure 2-3Take-off parameter vs. Take-off distances for HADAF1404 Database
Figure2-3 relates STOG to take-off parameter for a range of single engine. There is a
lot of scatter in the data. Because take off procedures vary widely and take-off thrust
depends strongly on propeller characteristics. Nevertheless, it is useful to employ the
correlation line of figure in the preliminary sizing. It is a polynomial trend line with
2nd
order which has an intercept of zero. The correlation line suggests the following
relationship:
(2.5)
0 10 20 30 40 50 60 700
100
200
300
400
500
600
Ta
ke
-off D
ista
nce
(ft)
TOP 23
y=0.0058*x2 + 6.8552*x
HADAFTM
1404 Aircraft Design Book Performance Estimation
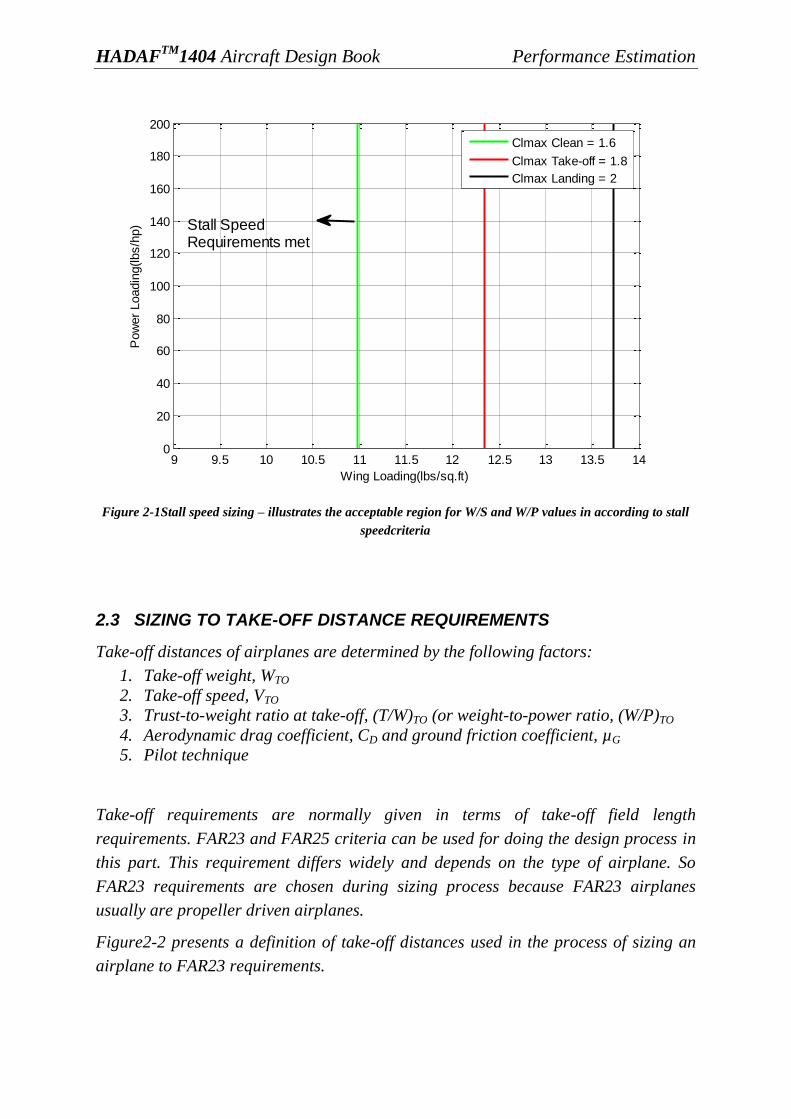
According to figure 3.4 of first part of Roskam book (Figure2-4), STO (take-off
distance) can be related to STOG by the following relationship:
(2.6)
Figure 2-4 Correlation of Ground Distance and Total Distace for Take-off (FAR23)
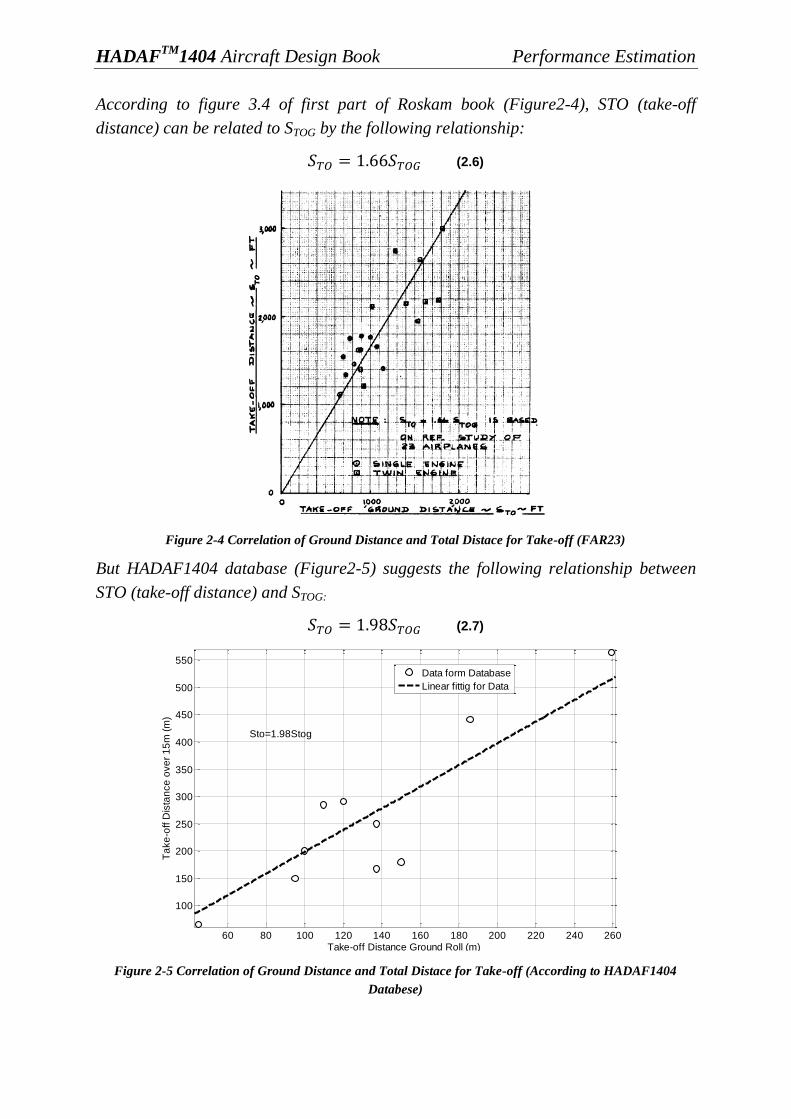
But HADAF1404 database (Figure2-5) suggests the following relationship between
STO (take-off distance) and STOG:
(2.7)
Figure 2-5 Correlation of Ground Distance and Total Distace for Take-off (According to HADAF1404
Databese)
60 80 100 120 140 160 180 200 220 240 260
100
150
200
250
300
350
400
450
500
550
Take-off Distance Ground Roll (m)
Ta
ke
-off D
ista
nce
ove
r 1
5m
(m
)
Data form Database
Linear fittig for Data
Sto=1.98Stog
HADAFTM
1404 Aircraft Design Book Performance Estimation
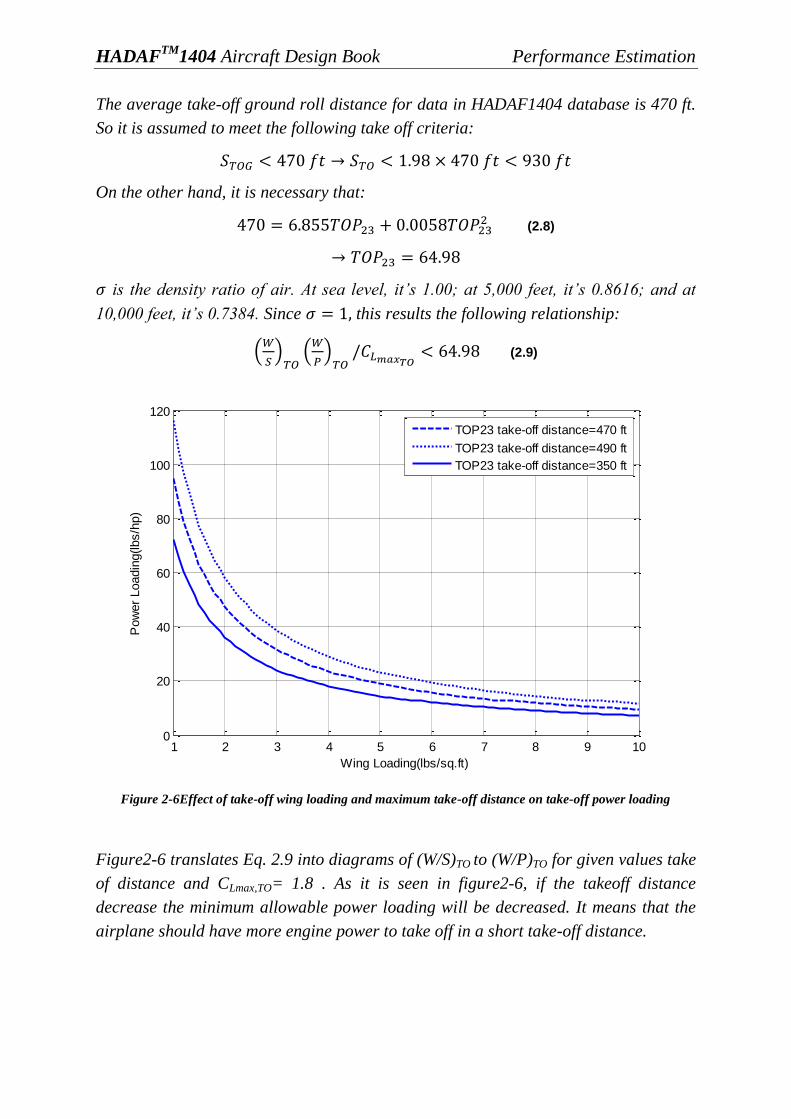
The average take-off ground roll distance for data in HADAF1404 database is 470 ft.
So it is assumed to meet the following take off criteria:
On the other hand, it is necessary that:
(2.8)
is the density ratio of air. At sea level, it‟s 1.00; at 5,000 feet, it‟s 0.8616; and at
10,000 feet, it‟s 0.7384. Since this results the following relationship:
(
)
(
)
(2.9)
Figure 2-6Effect of take-off wing loading and maximum take-off distance on take-off power loading
Figure2-6 translates Eq. 2.9 into diagrams of (W/S)TO to (W/P)TO for given values take
of distance and CLmax,TO= 1.8 . As it is seen in figure2-6, if the takeoff distance
decrease the minimum allowable power loading will be decreased. It means that the
airplane should have more engine power to take off in a short take-off distance.
1 2 3 4 5 6 7 8 9 100
20
40
60
80
100
120
Wing Loading(lbs/sq.ft)
Pow
er
Loadin
g(lbs/h
p)
TOP23 take-off distance=470 ft
TOP23 take-off distance=490 ft
TOP23 take-off distance=350 ft

HADAFTM
1404 Aircraft Design Book Performance Estimation
2.4 . SIZING TO LANDING DISTANCE REQUIREMENT
Landing distances of airplanes are determined by four factors:
1. Landing weight, WL
2. Approach speed, VA
3. Deceleration method used
4. Flying qualities of the airplane
5. Pilot technique
Landing distance requirements are nearly always formulated at the design landing
weight, WL of the airplane. According to first part of Roskam book, WL is related to
WTO as.
Table 2-3Typical values for landing weight to take-off weight ratio for single engine propeller driven
Minimum Average Maximum
0.95 0.997 1
Also according to the before section (weight estimation) and Eq. 4.4 and Eq. 5.4
landing weight is related to take-off weight as below:
(2.10)
On the other hand, according to kinetic energy considerations, total landing distance
is proportional to approach speed with 2nd
order.
Like sizing for take-off distance requirement, in this part FAR23 and Far25 criteria
can be used. We choose FAR23 again because of our propeller driven airplane.
Figure2-7 presents a definition of landing distances used in the process of sizing an
airplane to FAR23 requirements. It is known that there is the following relation for
approach speed and stall speed:
(2.11)
Figure 2-7Definition of FAR 23 landing distances
HADAFTM
1404 Aircraft Design Book Performance Estimation
Also it is known:
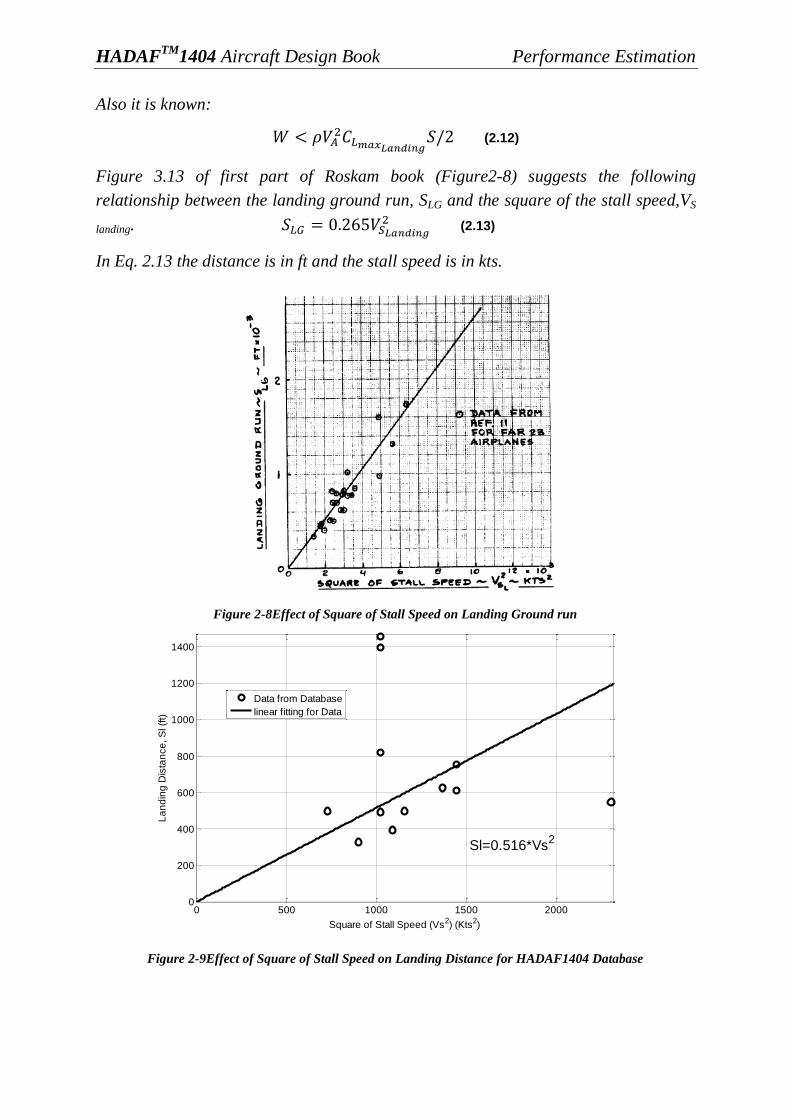
(2.12)
Figure 3.13 of first part of Roskam book (Figure2-8) suggests the following
relationship between the landing ground run, SLG and the square of the stall speed,VS
landing.
(2.13)
In Eq. 2.13 the distance is in ft and the stall speed is in kts.
Figure 2-8Effect of Square of Stall Speed on Landing Ground run
Figure 2-9Effect of Square of Stall Speed on Landing Distance for HADAF1404 Database
0 500 1000 1500 20000
200
400
600
800
1000
1200
1400
Square of Stall Speed (Vs2) (Kts
2)
La
nd
ing
Dis
tan
ce
, S
l (f
t)
Data from Database
linear fitting for Data
Sl=0.516*Vs2

HADAFTM
1404 Aircraft Design Book Performance Estimation
Also Figure2-9 which is drawn according to HADAF1404 Database suggests another
relationship (Eq. 2.14) between the landing distance, SL and the square of the stall
speed.
(2.14)
In Eq. 2.13 the distance is in ft and the stall speed is in kts.
The average landing distance for data in HADAF1404 database is 700 ft. It is
required to size a landing distance of 1100 ft (335 m). So it follows that:
(2.15)
(2.16)
Finally, this translates into the following requirement:
(2.17)
Also as it mentioned above, the design landing weight is specified as:
and it follows that:
(2.18)
At last, figure2-10 Present the range of value of (W/S)TO and for a given
value of which meet the landing distance requirement.
Figure 2-10 the range of value of (W/S)TO and CL,max foragivenvalueofρ=1.225
17.5 18 18.5 19 19.5 200
20
40
60
80
100
120
140
160
180
200
Wing Loading(lbs/sq.ft)
Pow
er
Loadin
g(lbs/h
p)
Landing Distance(SL)= 1100 ft
HADAFTM
1404 Aircraft Design Book Performance Estimation
2.5 SIZING TO CLIMB REQUIREMENT
All airplanes must meet certain climb rate or climb gradient requirements. To size an
airplane for climb requirements, it is necessary to have an estimate for the airplane
drag polar. So a rapid method for estimating drag polar for low speed flight
conditions have been used in this section described as followed.
In a parabolic drag polar, the drag coefficient of an airplane can be written as:
(2.19)
Where A is the aspect ratio and e is the Oswald number and finally the zero-drag
coefficient can be expressed as:
where f is the equivalent area and S is
the wing area.
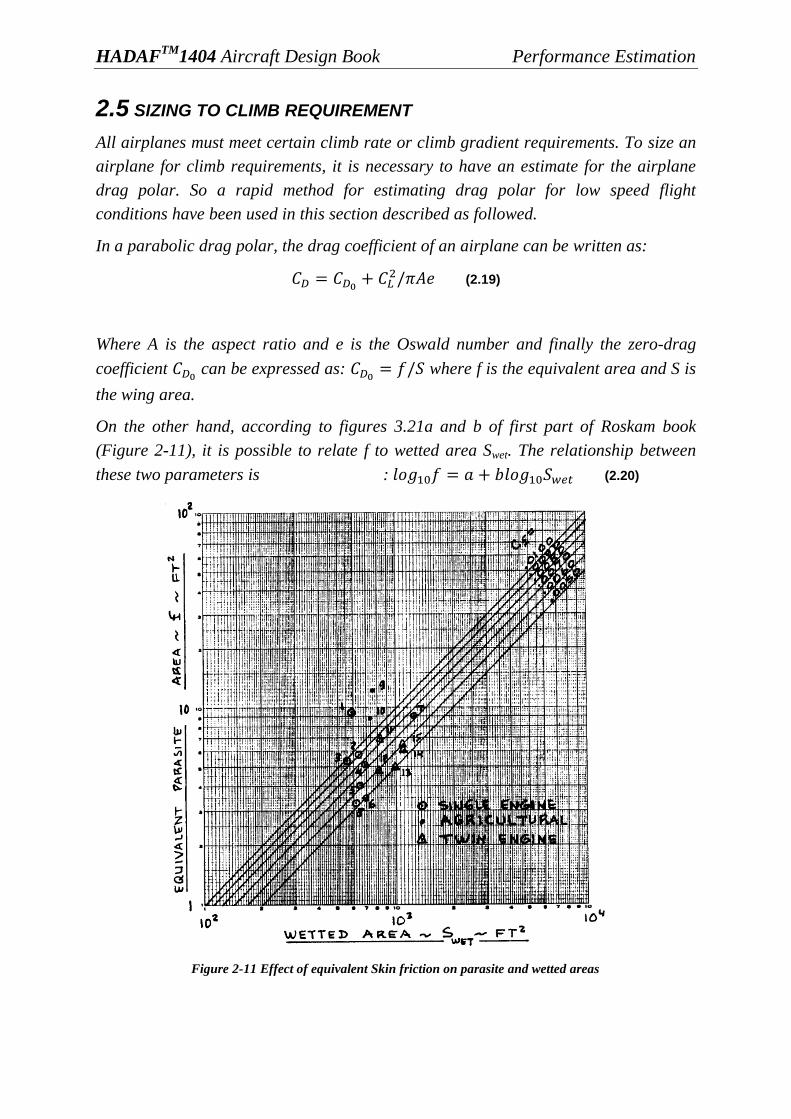
On the other hand, according to figures 3.21a and b of first part of Roskam book
(Figure 2-11), it is possible to relate f to wetted area Swet. The relationship between
these two parameters is : (2.20)
Figure 2-11 Effect of equivalent Skin friction on parasite and wetted areas
HADAFTM
1404 Aircraft Design Book Performance Estimation
It is considerable that the coefficients a and b themselves are a function of the
equivalent skin friction coefficient of an airplane, Cf as seen in figure2-11. The latter
is determined by the smoothness and streamlining designed into the airplane. These
coefficients can be calculated from figure2-11. The Cf is assumed to be 0.005.
Table 2-4Correlation coefficient for Parasite area vs. Wetted area
Cf A B
0.005 -2.3010 1.0000
It is so clear that the method for estimating drag boils down to the ability to predict a
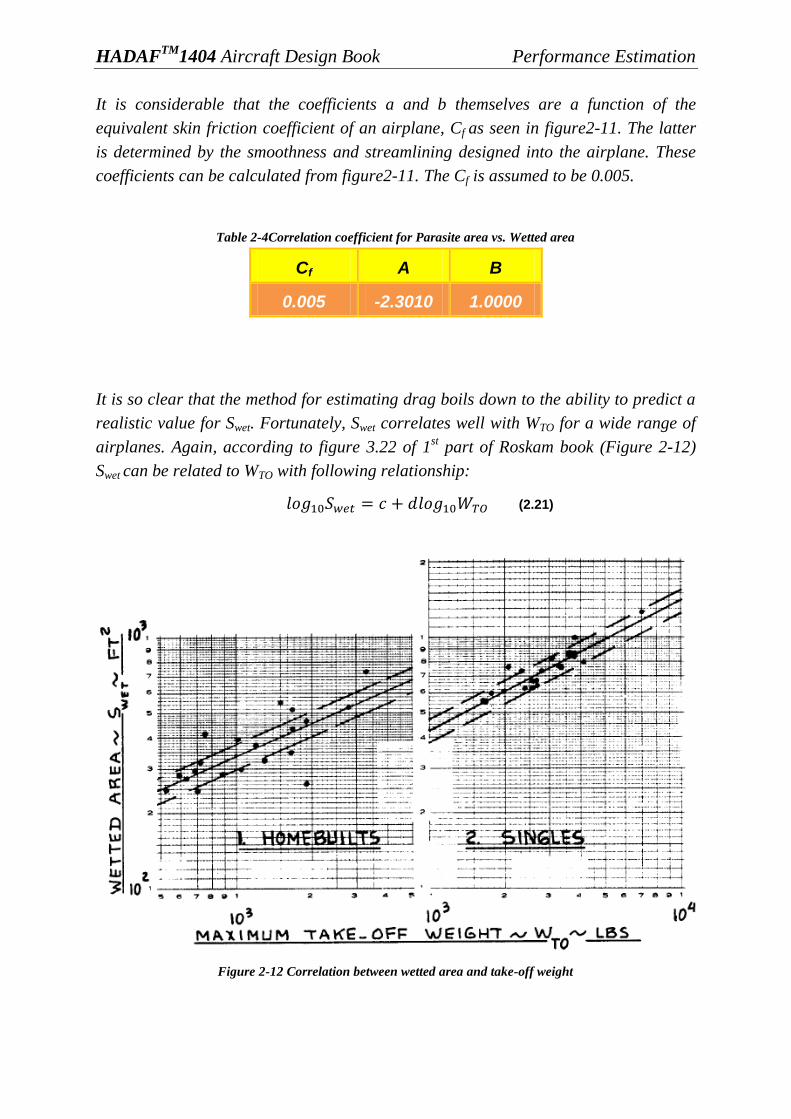
realistic value for Swet. Fortunately, Swet correlates well with WTO for a wide range of
airplanes. Again, according to figure 3.22 of 1st part of Roskam book (Figure 2-12)
Swet can be related to WTO with following relationship:
(2.21)
Figure 2-12 Correlation between wetted area and take-off weight
HADAFTM
1404 Aircraft Design Book Performance Estimation
Values for c and d is obtained by correlating wetted area and take-off weight data
which is done by reference book.
So it is easily possible to abtain an initial estimate for airplane‟s wetted area without
knowing what the airplane actually looks like.
Table 2-5Coefficients A and B of wetted area eqution
Type C d
Homebuilts 1.2362 0.4319
Since an estimate for WTO was already obtained in previous book ( weight estimation),
the drag polar for the clean airplane can now be determined. So the cruise
requirement should be investigated for an airplane with WTO equal to 626kg(1380
lbs). By using the relationship between WTO and SWet,it is possible to estimate Swet as
below:
(2.22)
Then it is possible to estimate parasite area, f, as following:
(2.23)
It is assumed that the aspect ratio to be equal to 7.5. According to Figure 2-13
Oswald number is assumed equal to 0.91. So easily and can be calculated.
Since it is better to minimize CD, the wing area should be maximized. So it is assumed
that the wing area, S, which is the minimum wing area in database to be equal to 8
m2(86 ft
2). It follows:
(2.24)
Now it is possible to find the clean drag polar at low speed:
(2.25)
For take-off and landing the effects of high lift devices and the landing gear, which
are strongly dependent on their size and type, need to be accounted for. These items
are defined as . Typical values for
are given in the following table(Table2-6)

HADAFTM
1404 Aircraft Design Book Performance Estimation
Figure 2-13 Effect of aspect ratio and sweep angle on wing efficiency factor (Oswald number)
Table 2-6 Firstestimatesfor∆CD0 and the Oswald No. "e"
Configuration e
Clean 0 0.8-0.85
Take-off flaps 0.01-0.02 0.75-0.8
Landing flaps 0.055-
0.075 0.7-0.75
Landing gear 0.015-
0.025 No effect
The additional zero-lift drag coefficients due to flaps and landing gear are as follows:
due to :
Take off flaps = 0.02
Landing gear = 0.02
And finally the airplane drag polar at take-off with gear down can be represented as:
(2.26)

HADAFTM
1404 Aircraft Design Book Performance Estimation
It is time to get back to the main goal, sizing to climb requirement. The take off climb
requirements of FAR 23 can be summarized as follow:
- All airplane must have a minimum climb rate at sealevel of 300 fpm and a
steady climb angle of at least 1:12 for landplanes.
Also the balked landing climb requirement of FAR 23 can be summerized as follows:
- The steady climb angle shall be at least 1:30 with the airplane in an specific
configuration.
Loftin has been represented a method for estimating rate of climb (RC) and climb
gradient (CGR) of an airplane in reference 2 (Loftin). All airplanes in this method
should have the following criteria for sizing to rate of climb:
(2.27)
Where :
(2.28)
It is better to maximize RC, so it is evidently necessary to make
as large as
possible. Fortunately, this has been noted before and CD has been minimized.
Also Loftin represents all ingredients needed for sizing to climb gradient criteria as
below :
(2.29)
And
√ (2.30)
Where :
(2.31)
To find the best possible climb gradient, it is necessery to find the minimum value of
CGRP. This minimum value depends on the the lift coefficient and on the
corresponding lift to drag ratio. Evidently, the minimum of this parameter is usually
found at a value of CL very close to . In other hand, some margin relative to stall
speed is alwaye desired. But this margin are not specified by Federal Aviation
Regulation in detail. So it is suggested to ensure that a margin of 0.2 exists between
and
.
HADAFTM
1404 Aircraft Design Book Performance Estimation
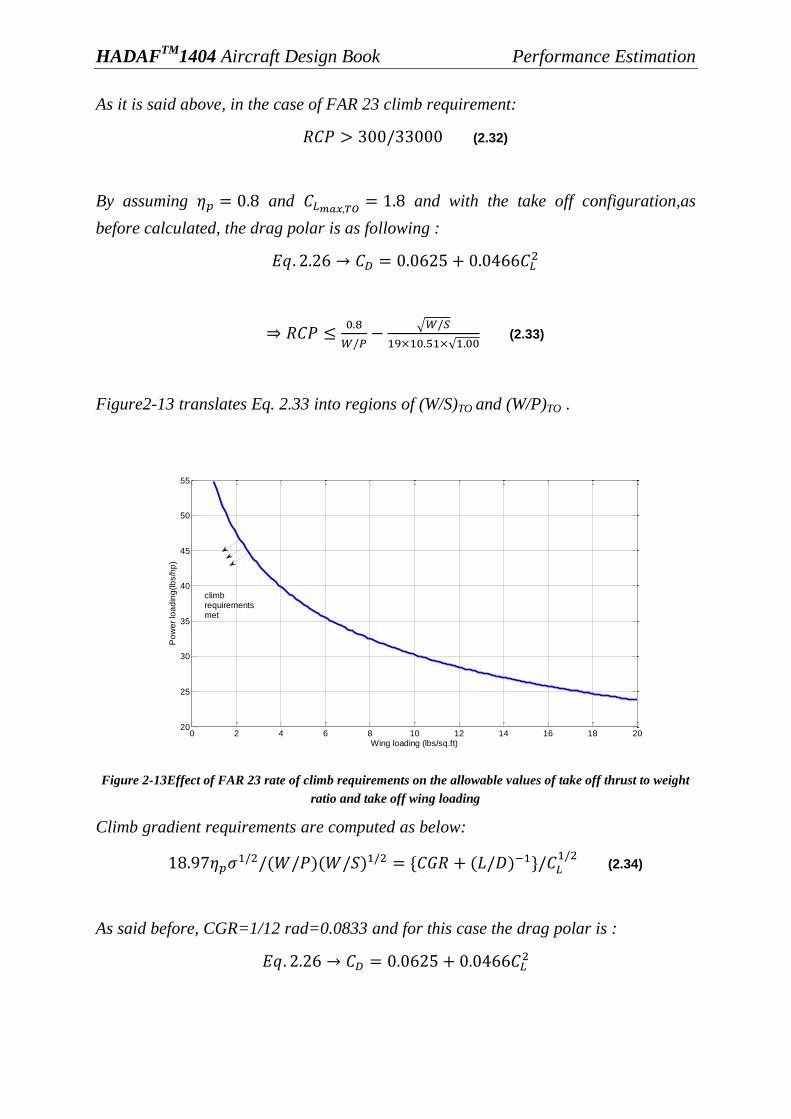
As it is said above, in the case of FAR 23 climb requirement:
(2.32)
By assuming and and with the take off configuration,as
before calculated, the drag polar is as following :
√
√ (2.33)
Figure2-13 translates Eq. 2.33 into regions of (W/S)TO and (W/P)TO .
Figure 2-13Effect of FAR 23 rate of climb requirements on the allowable values of take off thrust to weight
ratio and take off wing loading
Climb gradient requirements are computed as below:
(2.34)
As said before, CGR=1/12 rad=0.0833 and for this case the drag polar is :
0 2 4 6 8 10 12 14 16 18 2020
25
30
35
40
45
50
55
Wing loading (lbs/sq.ft)
Po
we
r lo
ad
ing
(lb
s/h
p)
climbrequirementsmet
HADAFTM
1404 Aircraft Design Book Performance Estimation
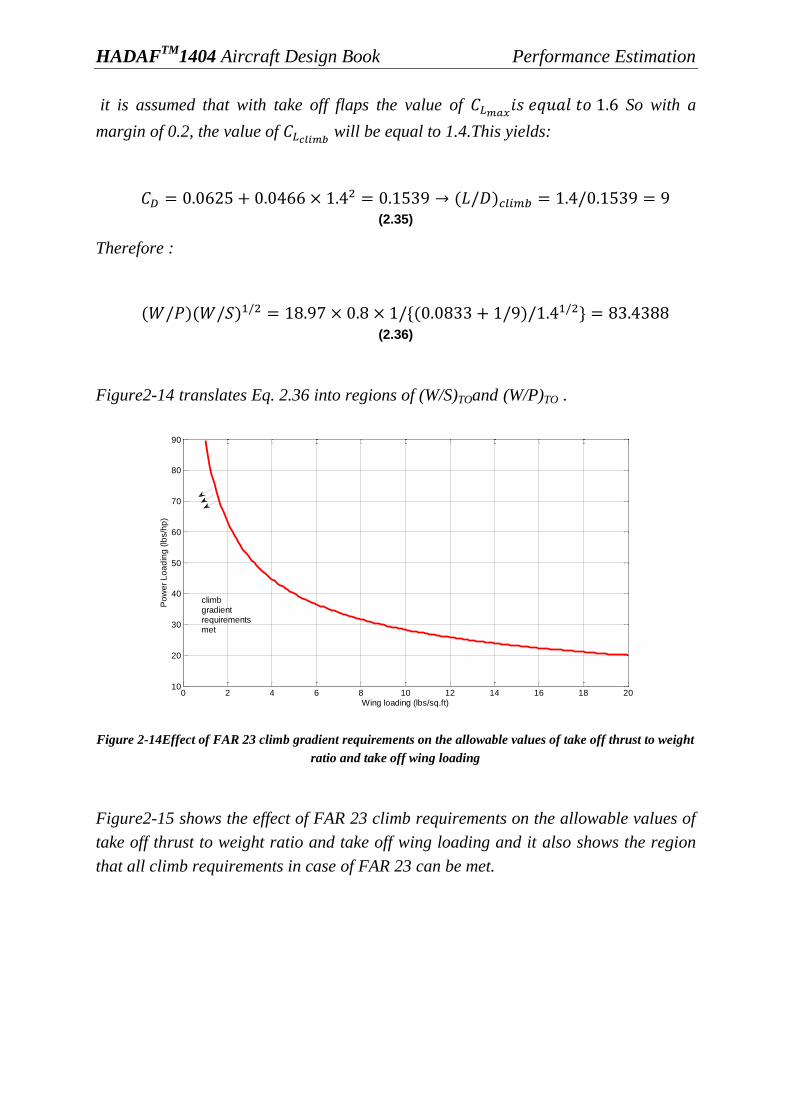
it is assumed that with take off flaps the value of So with a
margin of 0.2, the value of will be equal to 1.4.This yields:
(2.35)
Therefore :
(2.36)
Figure2-14 translates Eq. 2.36 into regions of (W/S)TOand (W/P)TO .
Figure 2-14Effect of FAR 23 climb gradient requirements on the allowable values of take off thrust to weight
ratio and take off wing loading
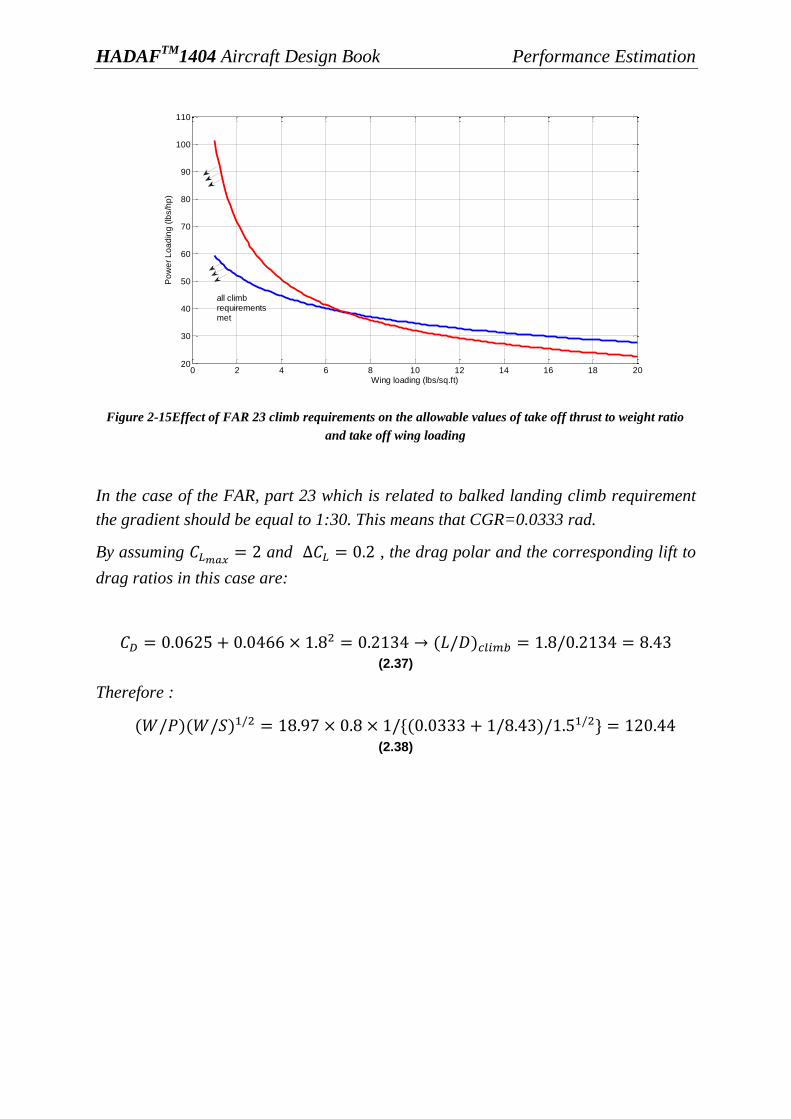
Figure2-15 shows the effect of FAR 23 climb requirements on the allowable values of
take off thrust to weight ratio and take off wing loading and it also shows the region
that all climb requirements in case of FAR 23 can be met.
0 2 4 6 8 10 12 14 16 18 2010
20
30
40
50
60
70
80
90
Wing loading (lbs/sq.ft)
Po
we
r L
oa
din
g (
lbs/h
p)
climbgradientrequirementsmet
HADAFTM
1404 Aircraft Design Book Performance Estimation
Figure 2-15Effect of FAR 23 climb requirements on the allowable values of take off thrust to weight ratio
and take off wing loading
In the case of the FAR, part 23 which is related to balked landing climb requirement
the gradient should be equal to 1:30. This means that CGR=0.0333 rad.
By assuming and , the drag polar and the corresponding lift to
drag ratios in this case are:
(2.37)
Therefore :
(2.38)
0 2 4 6 8 10 12 14 16 18 2020
30
40
50
60
70
80
90
100
110
Wing loading (lbs/sq.ft)
Po
we
r L
oa
din
g (
lbs/h
p)
all climbrequirementsmet
HADAFTM
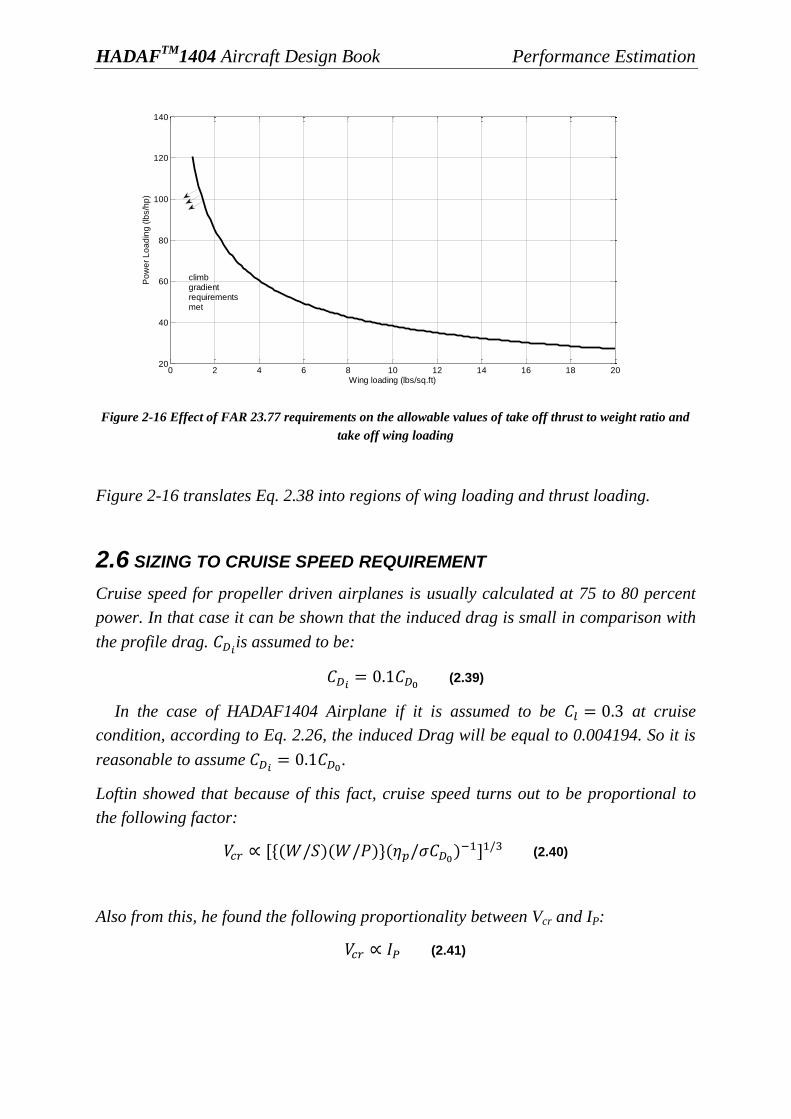
1404 Aircraft Design Book Performance Estimation
Figure 2-16 Effect of FAR 23.77 requirements on the allowable values of take off thrust to weight ratio and
take off wing loading
Figure 2-16 translates Eq. 2.38 into regions of wing loading and thrust loading.
2.6 SIZING TO CRUISE SPEED REQUIREMENT
Cruise speed for propeller driven airplanes is usually calculated at 75 to 80 percent
power. In that case it can be shown that the induced drag is small in comparison with
the profile drag. is assumed to be:
(2.39)
In the case of HADAF1404 Airplane if it is assumed to be at cruise
condition, according to Eq. 2.26, the induced Drag will be equal to 0.004194. So it is
reasonable to assume
.
Loftin showed that because of this fact, cruise speed turns out to be proportional to
the following factor:
(2.40)
Also from this, he found the following proportionality between Vcr and IP:
(2.41)
0 2 4 6 8 10 12 14 16 18 2020
40
60
80
100
120
140
Wing loading (lbs/sq.ft)
Po
we
r L
oa
din
g (
lbs/h
p)
climbgradientrequirementsmet
HADAFTM
1404 Aircraft Design Book Performance Estimation
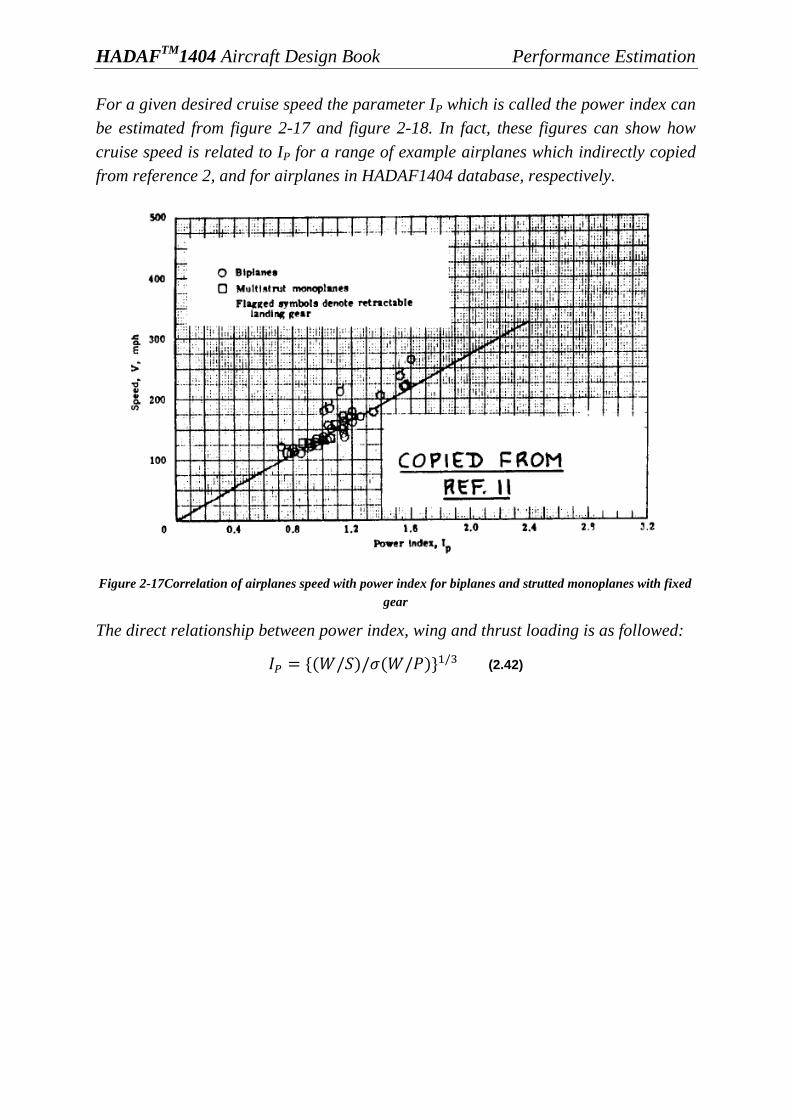
For a given desired cruise speed the parameter IP which is called the power index can
be estimated from figure 2-17 and figure 2-18. In fact, these figures can show how
cruise speed is related to IP for a range of example airplanes which indirectly copied
from reference 2, and for airplanes in HADAF1404 database, respectively.
Figure 2-17Correlation of airplanes speed with power index for biplanes and strutted monoplanes with fixed
gear
The direct relationship between power index, wing and thrust loading is as followed:
(2.42)
HADAFTM
1404 Aircraft Design Book Performance Estimation
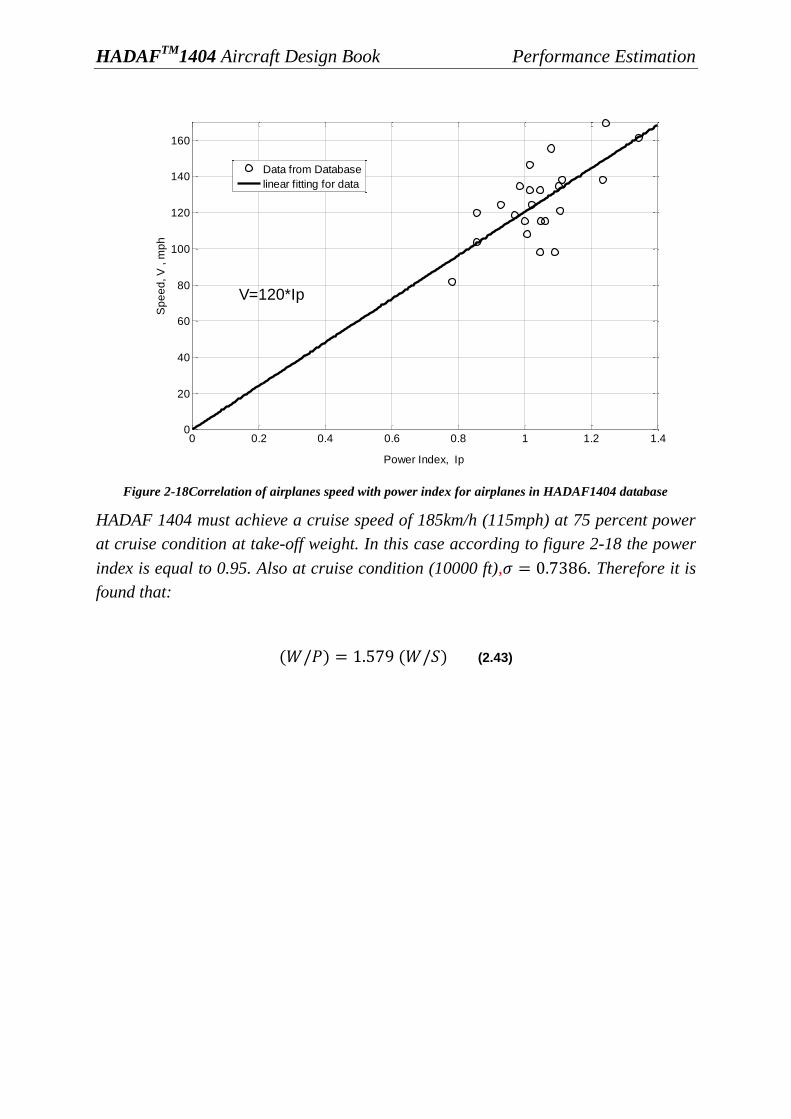
Figure 2-18Correlation of airplanes speed with power index for airplanes in HADAF1404 database
HADAF 1404 must achieve a cruise speed of 185km/h (115mph) at 75 percent power
at cruise condition at take-off weight. In this case according to figure 2-18 the power
index is equal to 0.95. Also at cruise condition (10000 ft), . Therefore it is
found that:
(2.43)
0 0.2 0.4 0.6 0.8 1 1.2 1.40
20
40
60
80
100
120
140
160
Power Index, Ip
Sp
ee
d, V
, m
ph
Data from Database
linear fitting for data
V=120*Ip
HADAFTM
1404 Aircraft Design Book Performance Estimation
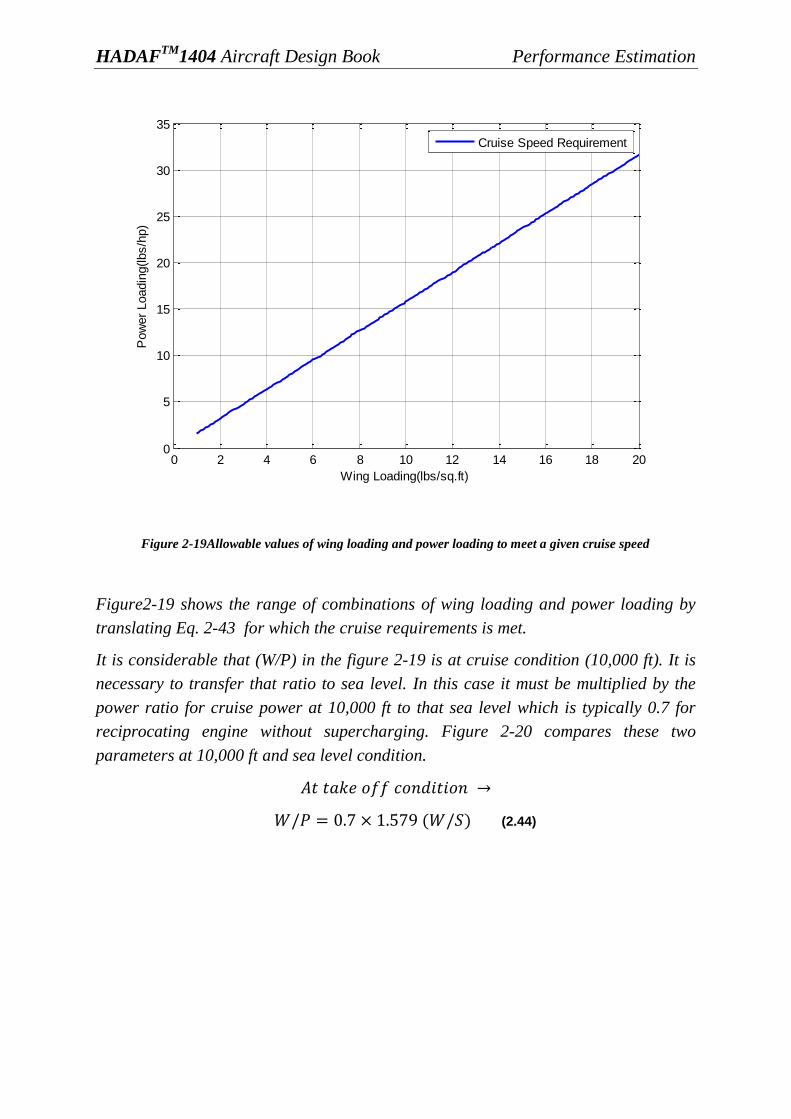
Figure 2-19Allowable values of wing loading and power loading to meet a given cruise speed
Figure2-19 shows the range of combinations of wing loading and power loading by
translating Eq. 2-43 for which the cruise requirements is met.
It is considerable that (W/P) in the figure 2-19 is at cruise condition (10,000 ft). It is
necessary to transfer that ratio to sea level. In this case it must be multiplied by the
power ratio for cruise power at 10,000 ft to that sea level which is typically 0.7 for
reciprocating engine without supercharging. Figure 2-20 compares these two
parameters at 10,000 ft and sea level condition.
(2.44)
0 2 4 6 8 10 12 14 16 18 200
5
10
15
20
25
30
35
Wing Loading(lbs/sq.ft)
Pow
er
Loadin
g(lbs/h
p)
Cruise Speed Requirement

HADAFTM
1404 Aircraft Design Book Performance Estimation
Figure 2-20
2.7 MATCHING OF ALL SIZING REQUIREMENT
Considering a series of relations between:
- Take off power loading ,
- Take off wing loading ,
- Maximum required lift coefficient ,
- And aspect ratio ,
It is now possible to determine the best combination of these quantities for the design.
The word best is used rather than optimum because the latter implies a certain
mathematical precision. What is usually done at this point is to overlay all
requirements and select the highest possible power loading and wing loading which
are consistent with all requirements. This process is also known as matching process
and this selected point is known as the design/matching point.
After calculating all requirements, figure2-15 shows how these requirements restrict
the useful range of combinations of takeoff wing loading (W/S)TO and take off power
loading (W/P)TO.
0 2 4 6 8 10 12 14 16 18 200
5
10
15
20
25
30
35
Wing Loading(lbs/sq.ft)
Pow
er
Loadin
g(lbs/h
p)
Cruise Speed Requirement
Cruise Speed Requirement,Take-off power
HADAFTM
1404 Aircraft Design Book Performance Estimation
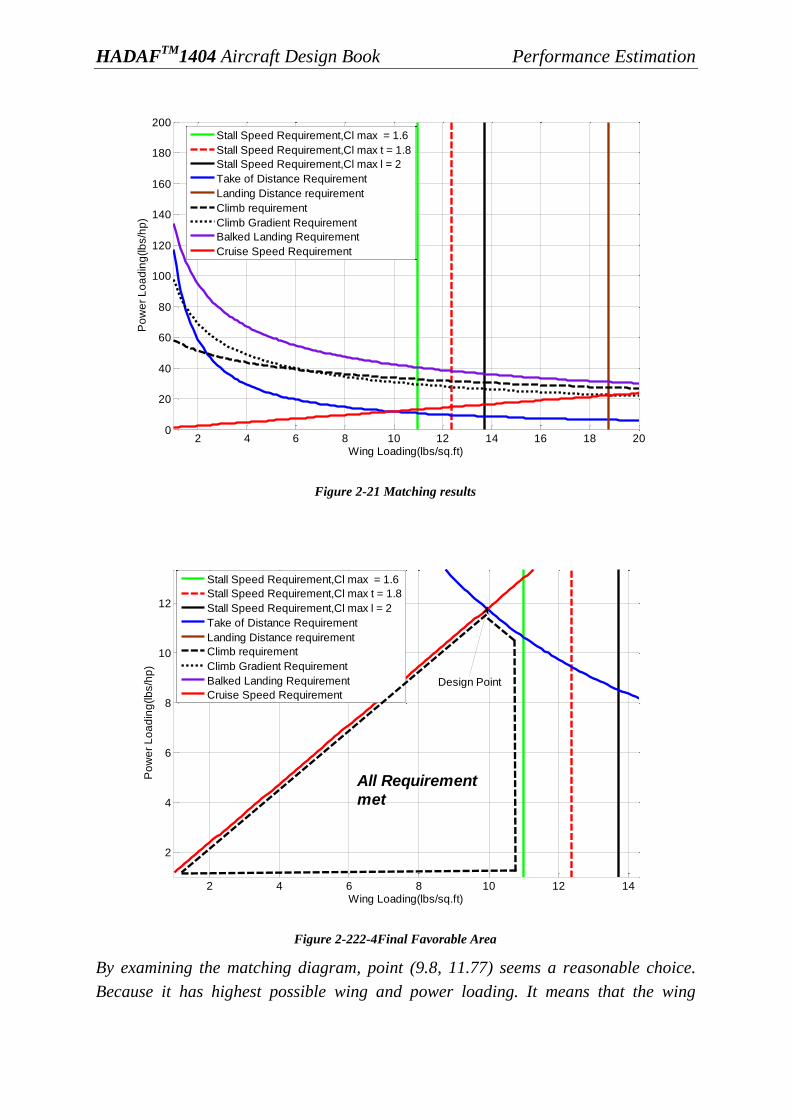
Figure 2-21 Matching results
Figure 2-222-4Final Favorable Area
By examining the matching diagram, point (9.8, 11.77) seems a reasonable choice.
Because it has highest possible wing and power loading. It means that the wing
2 4 6 8 10 12 14 16 18 200
20
40
60
80
100
120
140
160
180
200
Wing Loading(lbs/sq.ft)
Po
we
r L
oa
din
g(lb
s/h
p)
Stall Speed Requirement,Cl max = 1.6
Stall Speed Requirement,Cl max t = 1.8
Stall Speed Requirement,Cl max l = 2
Take of Distance Requirement
Landing Distance requirement
Climb requirement
Climb Gradient Requirement
Balked Landing Requirement
Cruise Speed Requirement
2 4 6 8 10 12 14
2
4
6
8
10
12
Wing Loading(lbs/sq.ft)
Po
we
r L
oa
din
g(lb
s/h
p)
Stall Speed Requirement,Cl max = 1.6
Stall Speed Requirement,Cl max t = 1.8
Stall Speed Requirement,Cl max l = 2
Take of Distance Requirement
Landing Distance requirement
Climb requirement
Climb Gradient Requirement
Balked Landing Requirement
Cruise Speed Requirement
All Requirement
met
Design Point

HADAFTM
1404 Aircraft Design Book Performance Estimation
loading of the airplane is 9.6 lbs/sq.ft and the power loading of the airplane is 13.78
lbs/hp. With this choice, our airplane is now characterized by the following design
parameters:
{
}
(2.45)
The following table shows the results which are extracted from this part (performance
estimation). These results will be used in the future books. The power loading will be
used in engine book to determine the engine power required for HADAF at takeoff.
Also, the wing loading will be used in wing book to determine the required wing area.
Table 2-7Final results
Wing Area
(sq.ft)
Power
(hp)
140.51 116.99

HADAFTM
1404 Aircraft Design Book Performance Estimation
2.8 ROAD MAP
Finally, the below diagram shows the outline we stated in this book visually:

HADAFTM
1404 Aircraft Design Book Performance Estimation
2.9 APPENDIX
All data calculated in this book are computed by a code which is programmed by
MATLAB®, the Language of Technical Computing. The following program is the open
source of this code:
clear all clc grid on %1)Sizing to Stall Speed Requirements p=1.225; vstall=23.15;%(m/s) clmax=1.6;%clmax clean clmaxt=1.8;%clmax take off clmaxl=2;%clmax landing sicma=1; wingloading1=(1/2*p*(vstall^2)*clmax)*0.225/10.764 for i=1:1:201 wing_loading(i)=wingloading1; end powerloading=0:1:200;
hold on plot(wing_loading,powerloading,'g','LineWidth',2) title('') xlabel('Wing Loading(lbs/sq.ft)') ylabel('Power Loading(lbs/hp)') grid on hold on
wingloading2=(1/2*p*(vstall^2)*clmaxt)*0.225/10.764 for i=1:1:201 wing_loading(i)=wingloading2; end powerloading=0:1:200; plot(wing_loading,powerloading,'r','LineWidth',2)
hold on wingloading3=(1/2*p*(vstall^2)*clmaxl)*0.225/10.764 for i=1:1:201 wing_loading(i)=wingloading3; end powerloading=0:1:200; plot(wing_loading,powerloading,'k','LineWidth',2) legend('Clmax Clean = 1.6','Clmax Take-off = 1.8','Clmax Landing = 2')
%2)Sizing to Take off Distance Requirements
STO=470;%ft for l=1:3 if l==1 STOn=STO; elseif l==2 STOn=STO+0.25*STO; else STOn=STO-0.25*STO;
HADAFTM
1404 Aircraft Design Book Performance Estimation
end clear Top23 syms top23 eq1=6.855*top23+0.0058*(top23)^2-STOn; disp('STO = '),disp(eq1); m=solve(eq1);m=double(m) i=length(m); for k=1:i if m(k)>0 TOP23=m(k) end end
wingloading=1:0.1:20; powerloading=(sicma*clmaxt*TOP23)./wingloading; hold on plot(wingloading,powerloading,'b','LineWidth',2) xlabel('Wing Loading(lbs/sq.ft)') ylabel('Power Loading(lbs/hp)') grid on hold on legend('TOP23 take-off distance=90 ft') end
%3)Sizing to Landing Distance Requirements
vapproach=1.3*vstall; SL=1100; SLG=SL/1.938; VsL=sqrt(SL/0.516); VsL=0.514*VsL
wingloading4=(1/2*p*(1.3*VsL^2)*clmaxl)*0.225/10.764 for i=1:1:201 wingloading(i)=wingloading4; end powerloading=0:1:200;
hold on plot(wingloading,powerloading,'g','LineWidth',2) xlabel('Wing Loading(lbs/sq.ft)') ylabel('Power Loading(lbs/hp)') grid on legend('Landing Distance(SL)= 1100 ft')
%Polar Drag estimation
%inputs c=1.2362;d=0.4319;a=-2.3010;b=1; e=0.91;%oswald No. AR=7.5;%aspect ratio wto=1377.889;%pound deltacd0_take_off_flaps=0.020; deltacd0_landing_gear=0.020; Smin=86;%sq.ft
swet=10^(c+(d*log10(wto)))%log10(Swet)=c+d*log10(wto) f=10^(a+b*log10(swet))%log10(f)=a+b*log10(Swet) smin=86;%sq.ft cd0=f/smin
HADAFTM
1404 Aircraft Design Book Performance Estimation
deltacd0=deltacd0_landing_gear+deltacd0_take_off_flaps; cd0=cd0+deltacd0 k=1/(3.14*AR*e) syms cl cd=cd0+k*cl^2 disp(clmax) cd=cd0+k*clmax^2
%4)Rate of climb Requirements
%inputs rc=300;%as in the case of FAR23 Climb Requirements rcp=(1/33000)*rc; etap=0.8;
wingloading=1:0.1:20; powerloading=etap./(rcp+((wingloading).^0.5)/((19*1.345*(AR*e)^0.75)/(cd0^0
.25)));
hold on plot(wingloading,powerloading,'g','LineWidth',2) xlabel('Wing Loading(lbs/sq.ft)') ylabel('Power Loading(lbs/hp)') grid on legend('Rate of Climb Requirement')
%Climb Gradient Requirements
%inputs etap=0.8; CGR=1/12;%Radian
clclimb=clmaxt-0.2; cd=cd0+k*clclimb^2 lift_to_drag_ratio=clclimb/cd wingloading=1:0.1:20; powerloading=18.97*etap*sqrt(sicma)./((((CGR+(cd/clclimb))/sqrt(clclimb))*(
wingloading).^0.5));
hold on plot(wingloading,powerloading,'g','LineWidth',2) xlabel('Wing Loading(lbs/sq.ft)') ylabel('Power Loading(lbs/hp)') grid on legend('Climb Gradient Requirement')
%Balked Landing Requirements
%inputs etap=0.8; CGR=1/30;%Radian
clclimb=clmaxl-0.2; cd=cd0+k*clclimb^2 lift_to_drag_ratio=clclimb/cd wingloading=1:0.1:20; powerloading=18.97*etap*sqrt(sicma)./((((CGR+(cd/clclimb))/sqrt(clclimb))*(
wingloading).^0.5));

HADAFTM
1404 Aircraft Design Book Performance Estimation
hold on plot(wingloading,powerloading,'b','LineWidth',2) xlabel('Wing Loading(lbs/sq.ft)') ylabel('Power Loading(lbs/hp)') grid on legend('Balked Landing Requirement')
%Cruise Speed Requirements
%inputs Ip=0.95;%power index sicma=0.7386; wingloading=1:0.1:20; z=1/(sicma*(Ip^3)) powerloading=z.*wingloading;
hold on plot(wingloading,powerloading,'b','LineWidth',2) xlabel('Wing Loading(lbs/sq.ft)') ylabel('Power Loading(lbs/hp)') grid on legend('Cruise Speed Requirement,75 percent power') %at take-off condition powerloading=0.75*z.*wingloading; hold on plot(wingloading,powerloading,'g','LineWidth',2) xlabel('Wing Loading(lbs/sq.ft)') ylabel('Power Loading(lbs/hp)') grid on legend('Cruise Speed Requirement,Take-off power')

HADAFTM
1404 Aircraft Design Book Performance Estimation
2.10 References
1. Roskam, J., Airplane design: Part , Preliminary Sizing of Airplanes.
2. Loftin, Jr., L.K., Subsonic Aircraft: Evolution and the Matching of Size to
Performance, NASA Reference Publication 1069, 1980.
3. Federal Aviation Regulation, FAR, Part 23.
4. A. Lennon, the Basics Aircraft Design: Published by Air Age Media Inc.2002,
2005.

HADAFTM
1404 Aircraft Design Book Selection of Engine
3 SELECTION OF ENGINE
3.1 INTRODUCTION
Selection of the propulsion system involves the following three decisions:
- Selection of the propulsion system type
- Determination of the number of engines
- Disposition of these engines
3.2 SELECTION OF THE PROPULSION SYSTEM TYPE
The following propulsion system types are available for using in the airplane:
Piston/Propeller
Turbo/Propeller
Prop fan
Inducted fan
Turbojet
Turbofan
Rocket
Ramjet
The following factors play a role in selecting the type of propulsion system to be used:
i. Required cruise speed and maximum speed
Each range of velocity requires specific propulsion system. HADAF is an ultra-light
aircraft with ⁄ cruise speed. Piston/Propeller engines are the most
efficientand popular types in this range of velocity. This part will be discussed in more
details.
ii. Maximum operating altitude
Operating altitude for HADAF aircraft is 12000ft. It is evident that for this altitude
a Piston/Propeller engine is the most suitable one. This part will be investigated in
more details in the following sections.
iii. Range economy

HADAFTM
1404 Aircraft Design Book Selection of Engine
Ultra-light aircrafts are designed for private transports so reducing cost is a mater.
Again it is seen that Piston/Propeller engine is the most efficient one according to its
low costs.
iv. Installed weight
In aviation science vehicles with lower weight are desired in order to lower the
essential fuel (costs) and at the same time exceeding flight range. The
Piston/Propeller engine meets this condition too.
v. Reliability and maintainability
Probability of failure is one the most important issues to be concerned. The
propulsion system must be safe enough. In a simple assessment, the number of moving
parts in the engine is considered as the criterion for evaluating the engine safety. The
less the number of the moving parts, the more reliable the engine would be. According
to this, Jets are the safest ones. Although Piston/propellers are not well ranked from
this point of view, their safety is getting better and better recently.
vi. Fuel amount needed
As mentioned in the installed weight part, the propulsion system must work with the
minimum amount of fuel in order to lower the aircraft weight. Also from the biological
aspect more fuels causes more pollution.
vii. Fuel cost
Generally ultra-light aircrafts are the cheapest ones. So a cheap fuel is preferred for
this sort of vehicles.
viii. Fuel availability
Most aviation fuels available for aircrafts, are kinds of petroleum spirit which are
used in engines with spark plugs (i.e. piston engines and Wankel rotaries) or fuel for
jet turbine engines which is also used in diesel aircraft engines. HADAF is an ultra-
light aircraft and must be used in small or private airports so the fuel must be
available in these kinds of places.
ix. Market demands
The propulsion system must be available and easy to repair and overhaul. Some types
of engines, like Piston/Propeller, are not fully supported in Iran.

HADAFTM
1404 Aircraft Design Book Selection of Engine
x. Timely certification
For selection of engine type, the mission specification should be checked for any
definition of the type of powerplant.Then, a preliminary speed(Mach) versus altitude
envelope should be drawn for the airplane and after that the speed-altitude envelope
of the airplane should be compared with Figure3-1 and the type of powerplant
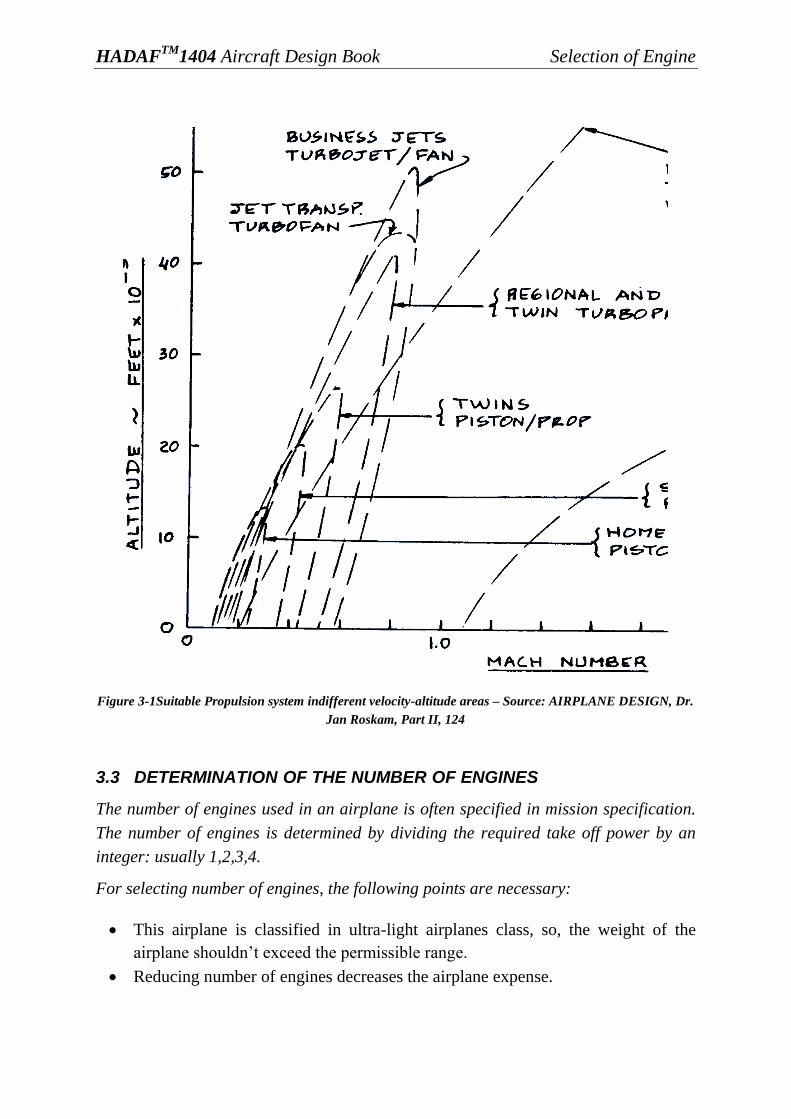
providing the best overall match, must be chosen.
In the present design the maximum flight altitude is 18000 feet and its operating
magnitude is 12000 feet, maximum flight velocity was designed to be 51.7 meter per
second. From performance book it is known that Mach number is:
{
⁄
⁄
(3-1)
Now, referring to Figure 3-1, Piston/propeller engine is the most suitable selection
for this airplane.
HADAFTM
1404 Aircraft Design Book Selection of Engine
Figure 3-1Suitable Propulsion system indifferent velocity-altitude areas – Source: AIRPLANE DESIGN, Dr.
Jan Roskam, Part II, 124
3.3 DETERMINATION OF THE NUMBER OF ENGINES
The number of engines used in an airplane is often specified in mission specification.
The number of engines is determined by dividing the required take off power by an
integer: usually 1,2,3,4.
For selecting number of engines, the following points are necessary:
This airplane is classified in ultra-light airplanes class, so, the weight of the
airplane shouldn’t exceed the permissible range.
Reducing number of engines decreases the airplane expense.
HADAFTM
1404 Aircraft Design Book Selection of Engine
Consideration of space limitation for cockpit design affects the number of
engines.
Maximum required power is low enough to use a four stroke piston motor.
Due to these points, one engine is selected for this airplane.
3.4 DISPOSITION OF ENGINE
When the propeller is located in front of the gravity center, the installation is called
"tractor installation". When the propeller is located behind the gravity center, the
installation is referred to as "pusher installation".
Tractor installations tend to be destabilizing while pusher installations tend to be
stabilizing in both static longitudinal and directional stability.
In design of HADAF1404, tractor installation is selected for engine position. Reasons
are described below:
i. Pusher aircrafts are structurally more complicated than their equivalent
tractor types, especially when it is desired to mount the empennage behind the
rear mounted propeller. This would lead to increase in drag and loss of
empennage effectiveness.
ii. Due to the fact that center of gravity is usually located further behind on
longitudinal axis than most tractor airplanes, the pushers can be more prone to
flat spin, especially if they are loaded improperly.
iii. Normally the engine of a pusher exhausts forward of the propeller, and in this
case the exhaust may contribute to corrosion or other damage to the propeller.
This is usually minimal, and may be mainly visible in the form of soot stains on
the blades.
iv. Since the engine exhaust flows through the propellers, Propeller noise might
increase. This effect may be particularly pronounced when using turboprop
engines due to the large volume of exhaust they produce. Similarly, vibrations
may be induced by the propeller passing through the wing downwash, causing
it to move asymmetrically through air of differing energies and directions.
v. The propeller increases airflow around an air-cooled engine in the tractor
configuration, but does not provide the same benefit to an engine mounted in
the pusher configuration. Some aviation engines experience cooling problems
when used as pushers.
HADAFTM
1404 Aircraft Design Book Selection of Engine
3.5 ENGINE BRANDS
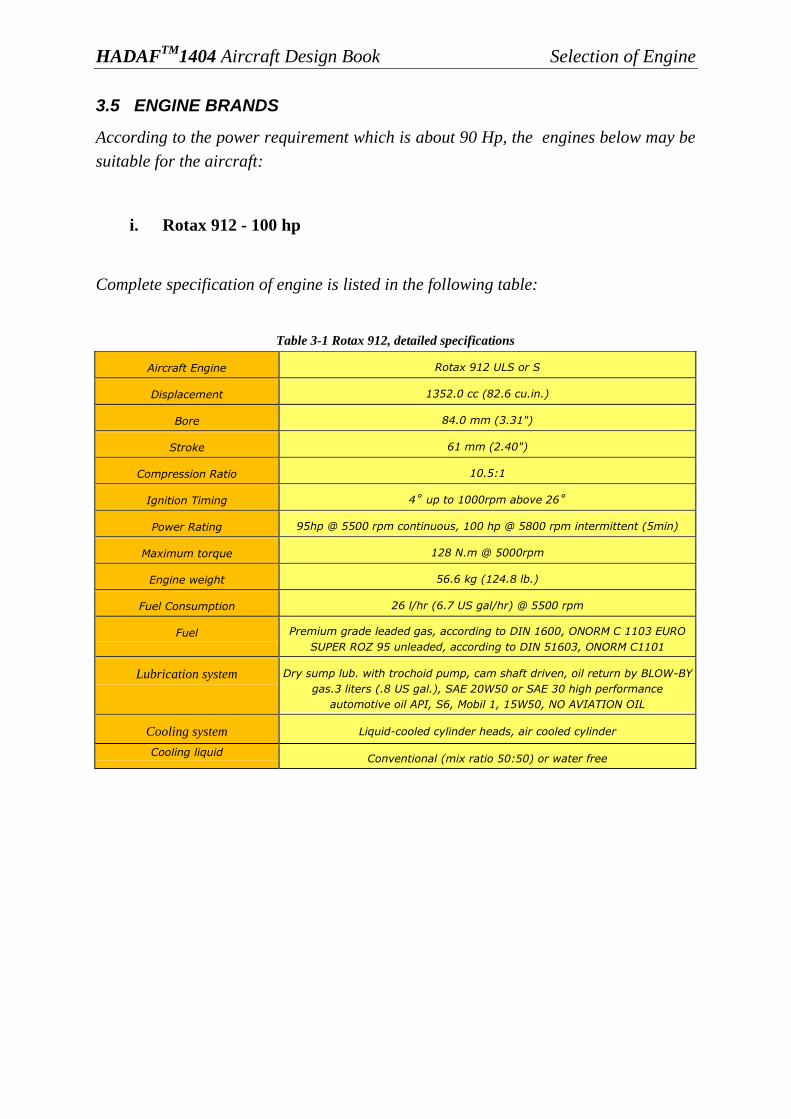
According to the power requirement which is about 90 Hp, the engines below may be
suitable for the aircraft:
i. Rotax 912 - 100 hp
Complete specification of engine is listed in the following table:
Table 3-1 Rotax 912, detailed specifications
Aircraft Engine Rotax 912 ULS or S
Displacement 1352.0 cc (82.6 cu.in.)
Bore 84.0 mm (3.31")
Stroke 61 mm (2.40")
Compression Ratio 10.5:1
Ignition Timing 4˚ up to 1000rpm above 26˚
Power Rating 95hp @ 5500 rpm continuous, 100 hp @ 5800 rpm intermittent (5min)
Maximum torque 128 N.m @ 5000rpm
Engine weight 56.6 kg (124.8 lb.)
Fuel Consumption 26 l/hr (6.7 US gal/hr) @ 5500 rpm
Fuel Premium grade leaded gas, according to DIN 1600, ONORM C 1103 EURO
SUPER ROZ 95 unleaded, according to DIN 51603, ONORM C1101
Lubrication system Dry sump lub. with trochoid pump, cam shaft driven, oil return by BLOW-BY
gas.3 liters (.8 US gal.), SAE 20W50 or SAE 30 high performance
automotive oil API, S6, Mobil 1, 15W50, NO AVIATION OIL
Cooling system Liquid-cooled cylinder heads, air cooled cylinder
Cooling liquid Conventional (mix ratio 50:50) or water free
HADAFTM
1404 Aircraft Design Book Selection of Engine
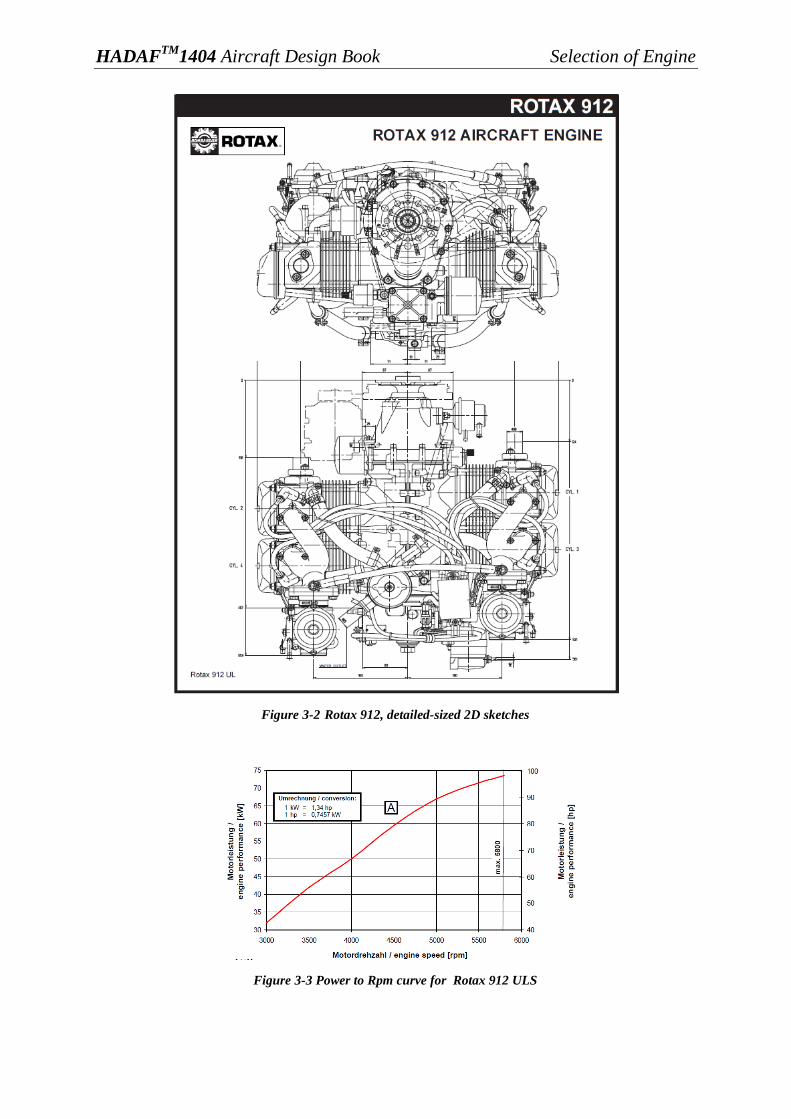
Figure 3-2 Rotax 912, detailed-sized 2D sketches
Figure 3-3 Power to Rpm curve for Rotax 912 ULS

HADAFTM
1404 Aircraft Design Book Selection of Engine
Rotax 914 – 115 hp
Complete specification of engine is listed in the following table:
Table 3-2 Rotax 914, detailed specifications
Figure 3-4 Power to Rpm curve for Rotax 914 UL
Aircraft Engine Rotax® 914UL DCDI or 914F DCDI
Displacement 1211.2 cm3 (73.91 cu. In.)
Bore 79.5 mm (3.13 in.)
Stroke 4 Strokes - 61 mm (2.4 in.)
Compression Ratio 9:1
Ramp Weight 153.5 lbs (70kg) complete including exhaust, carburetor,
electronic dual ignition, electric starter and
External Alternator 40A/12V
Ignition Timing 4˚ up to 1000 RPM 1/min above 26˚/22˚
Cylinders 4 cylinders. with opposed cylinders
Power Rating 100 hp @ 5500 rpm continuous, 115hp @ 5800 rpm intermittent
Fuel Consumption at 75% power* 26 l/hr (6.87 US gal/hr)
Maximum torque 144 Nm (106 ft. lb.) @ 4900rpm
Fuel Min. MON 85 RON 95*. min AKI 91*
Oil API SF or SG
Lubrication system dry sump forced lubrication with separate 3l (.8 gal US) oil tank
Cooling system 50% BASF Glysanthin Anitcorrosion 50% Water

HADAFTM
1404 Aircraft Design Book Selection of Engine
Figure 3-5 Rotax 914, detailed-sized 2D sketches

HADAFTM
1404 Aircraft Design Book Selection of Engine
ii. Jabiru 3300 – 120 hp
Complete specification of engine is listed in the following table:
Table 3-3Jabiru3300, detailed specifications
Aircraft Engine Jabiru 3300cc 120hp
Displacement 3300 cc (201.378cu.in.)
Bore 97.5 mm (3.838")
Stroke 4 Stroke - 3300cc (200 cubic inches)74 mm (2.913")
Compression Ratio 8:1
Directional Rotation of Prop Shaft Clockwise –One Central Camshaft - Pilot's view Tractor applications - Direct Propeller Drive
- 6 Bearing Crankshaft
Ramp Weight 178 lbs (81kg) complete including exhaust, carburetor, starter motor,
alternator and ignition system
Ignition Timing 25˚ BTDC fixed timing
Firing order 1 - 4 - 5 - 2 - 3 - 6
Cylinders 6 Horizontally Opposed
Power Rating 107 hp @ 2750 rpm continuous, 120 hp @ 3300 rpm intermittent
Fuel Consumption at 75% power* 26 l/hr (6.87 US gal/hr)
Fuel Mechanical Fuel Pump - AVGAS 100/130
Oil Wet Sump Lubrication - Aero shell W100 or equivalent
Oil Capacity 3.51 (3.69 quarts)
Spark Plugs NGK D9EA - Automotive
Electrical specifications Electric Starter -Integrated AC Generator
Cooling system Ram Air Cooled
Naturally Aspirated - 1 Pressure Compensating Carburetor
Over Head Valves (OHV)
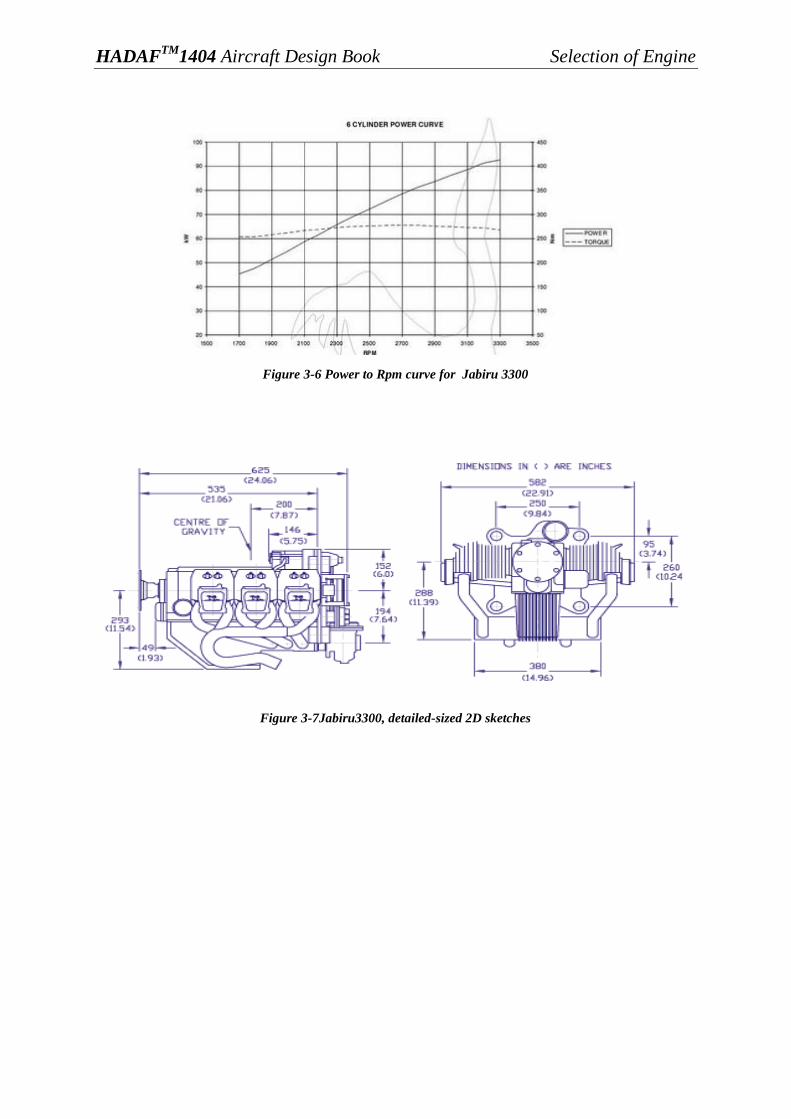
HADAFTM
1404 Aircraft Design Book Selection of Engine
Figure 3-6 Power to Rpm curve for Jabiru 3300
Figure 3-7Jabiru3300, detailed-sized 2D sketches
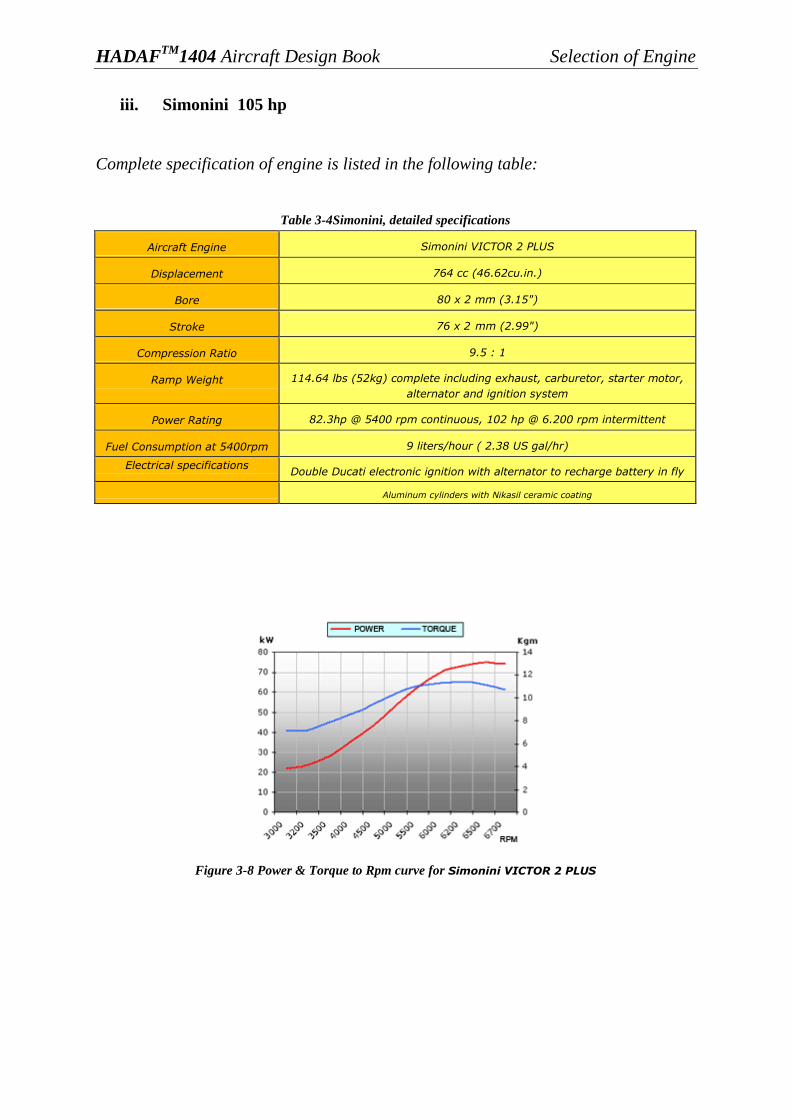
HADAFTM
1404 Aircraft Design Book Selection of Engine
iii. Simonini 105 hp
Complete specification of engine is listed in the following table:
Table 3-4Simonini, detailed specifications
Figure 3-8 Power & Torque to Rpm curve for Simonini VICTOR 2 PLUS
Aircraft Engine Simonini VICTOR 2 PLUS
Displacement 764 cc (46.62cu.in.)
Bore 80 x 2 mm (3.15")
Stroke 76 x 2 mm (2.99")
Compression Ratio 9.5 : 1
Ramp Weight 114.64 lbs (52kg) complete including exhaust, carburetor, starter motor,
alternator and ignition system
Power Rating 82.3hp @ 5400 rpm continuous, 102 hp @ 6.200 rpm intermittent
Fuel Consumption at 5400rpm 9 liters/hour ( 2.38 US gal/hr)
Electrical specifications Double Ducati electronic ignition with alternator to recharge battery in fly
Aluminum cylinders with Nikasil ceramic coating

HADAFTM
1404 Aircraft Design Book Selection of Engine
Figure 3-9 Simonini VICTOR 2 PLUS, detailed-sized 2D sketches
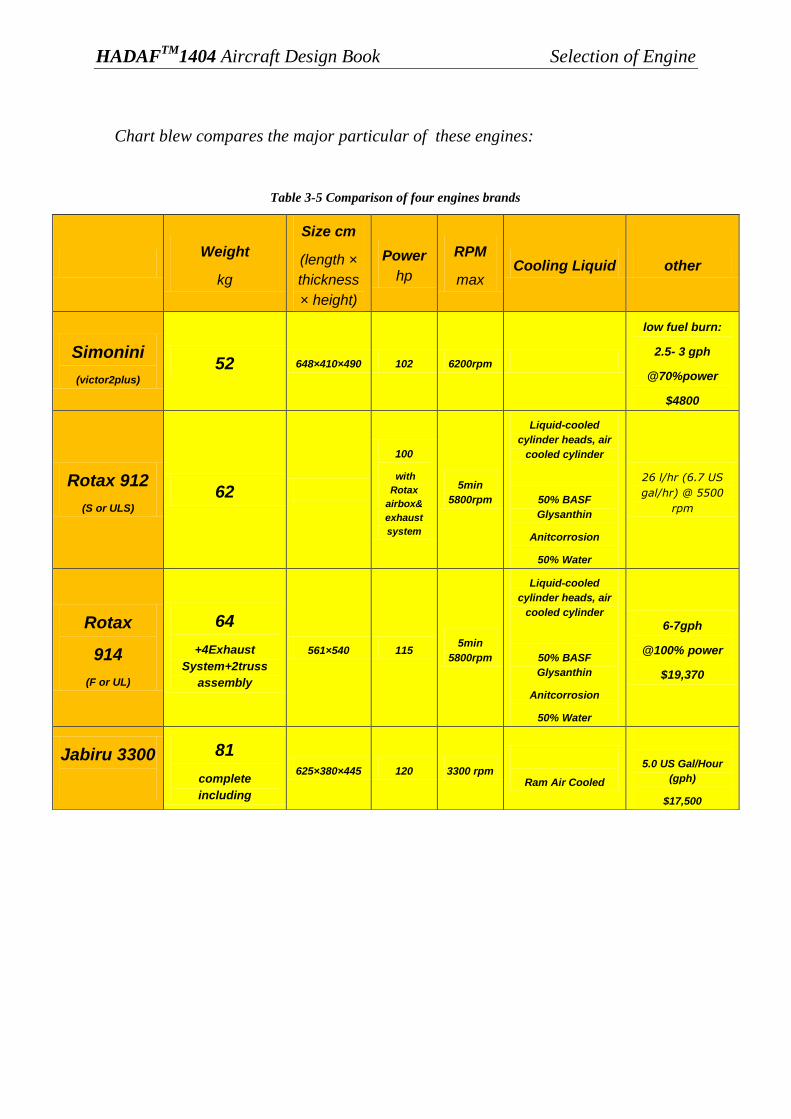
HADAFTM
1404 Aircraft Design Book Selection of Engine
Chart blew compares the major particular of these engines:
Table 3-5 Comparison of four engines brands
Weight
kg
Size cm
(length ×
thickness
× height)
Power
hp
RPM
max Cooling Liquid other
Simonini
(victor2plus) 52 648×410×490 102 6200rpm
low fuel burn:
2.5- 3 gph
@70%power
$4800
Rotax 912
(S or ULS)
62
100
with
Rotax
airbox&
exhaust
system
5min
5800rpm
Liquid-cooled
cylinder heads, air
cooled cylinder
50% BASF
Glysanthin
Anitcorrosion
50% Water
26 l/hr (6.7 US
gal/hr) @ 5500
rpm
Rotax
914
(F or UL)
64
+4Exhaust
System+2truss
assembly
561×540 115 5min
5800rpm
Liquid-cooled
cylinder heads, air
cooled cylinder
50% BASF
Glysanthin
Anitcorrosion
50% Water
6-7gph
@100% power
$19,370
Jabiru 3300
81
complete
including
625×380×445 120 3300 rpm
Ram Air Cooled
5.0 US Gal/Hour
(gph)
$17,500

HADAFTM
1404 Aircraft Design Book Selection of Engine
A brief comparison between engines shows that :
- Simonini has the minimum weight
- Number of air crashes due to engine failure plays an important role in engine
selection. Since Jabiru has the minimum failure, we can consider it as the safest
choice we have got.
- Engine availability is another important factor. Rotax 912 is the most popular
engine in Iran. Jabiru is in the second step.
- Another important factor in engine selection is economy. Jabiru has the
minimum cost through all.
- Rapid and convenience in overhauling also is important. Due to the popularity
Jabiru engines are of the easiest engines to overhaul.
- Fuel consumption is another important factor. Simonini is the best choice from
this aspect. Jabiru is the next one.
According to factors mentioned and other engine preferences like configuration and
weight Jabiru 3300 is selected.
The CADs of Jabiro 3300 are as following:
Figure 3-10 the CAD Models of Jabiru 3300, Modeled by HADAF group
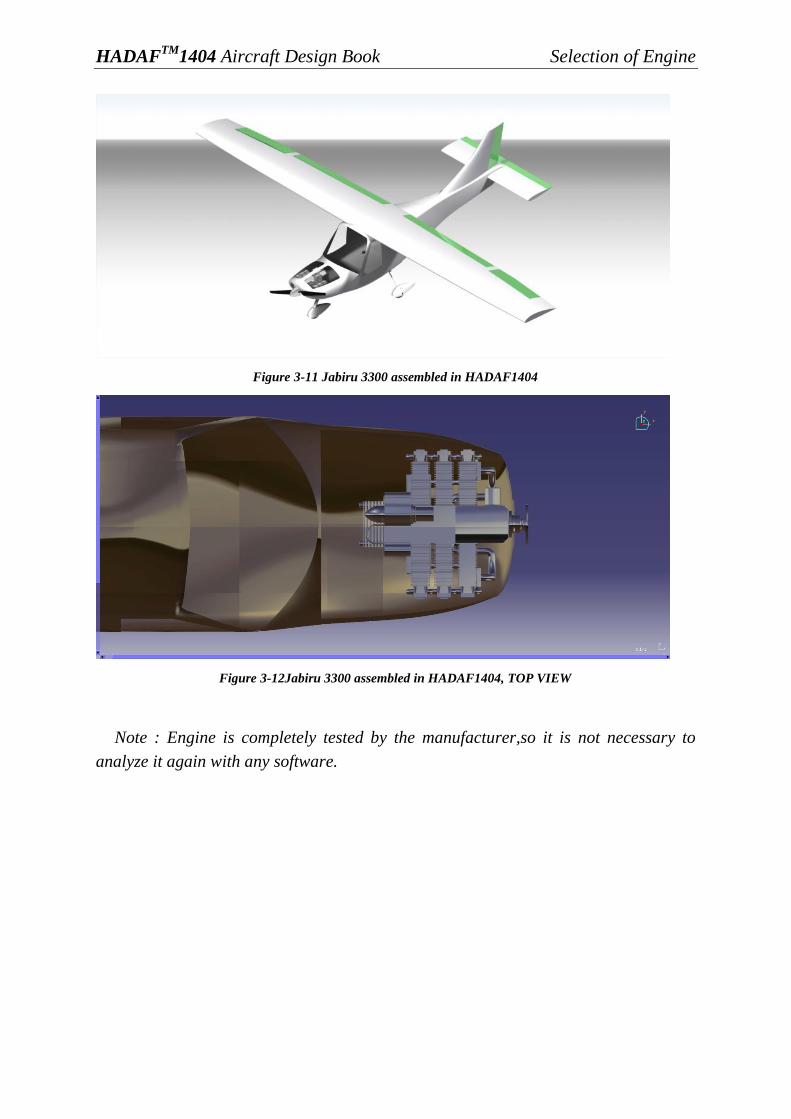
HADAFTM
1404 Aircraft Design Book Selection of Engine
Figure 3-11 Jabiru 3300 assembled in HADAF1404
Figure 3-12Jabiru 3300 assembled in HADAF1404, TOP VIEW
Note : Engine is completely tested by the manufacturer,so it is not necessary to
analyze it again with any software.
HADAFTM
1404 Aircraft Design Book Selection of Engine
3.6 PROPELLER DESIGN
By assuming an initial value for Pb base on the database, the propeller diameter can
be derived. This initial guess can be modified in the next attemps. The equation bellow
is related in AIRPLANE-DESIGN, by Dr. Jan Roskam:
*√
+ (3-2)
Where DP is diameter of propeller, np is nomber of prop blades, Pb is power laoding
per blade and Pmax is maximum power per engine.
Some design data for homebuilt Airplanes can be found in Table 3-3. The term Pb is
assumed to be in a range of 1.7 to 2, corresponds to 2blades, 115 hp engine, though
the computed engine power is 100-110Hp.
Hence by substituting np=2 and Pb = 1.7-2 in the following equation,
and the answers below are derived :
for 110 hp:
5.91<Dp<6.41 ft (3-3)
for 100 hp :
5.6 <Dp<6.11 ft (3-4)
So final range of diameter of prop blades would be as below:
5.6<Dp<6.41 ft (3-5)

HADAFTM
1404 Aircraft Design Book Selection of Engine
Table blew lists maximum engine power, propeller diameter,number of propeller
blades and Pb which is the blade power loading for home built aircrafts:
Table 3-6 Design data for homebuilt airplanes– Source: AIRPLANE DESIGN, Dr. Jan Roskam, Part II, 129
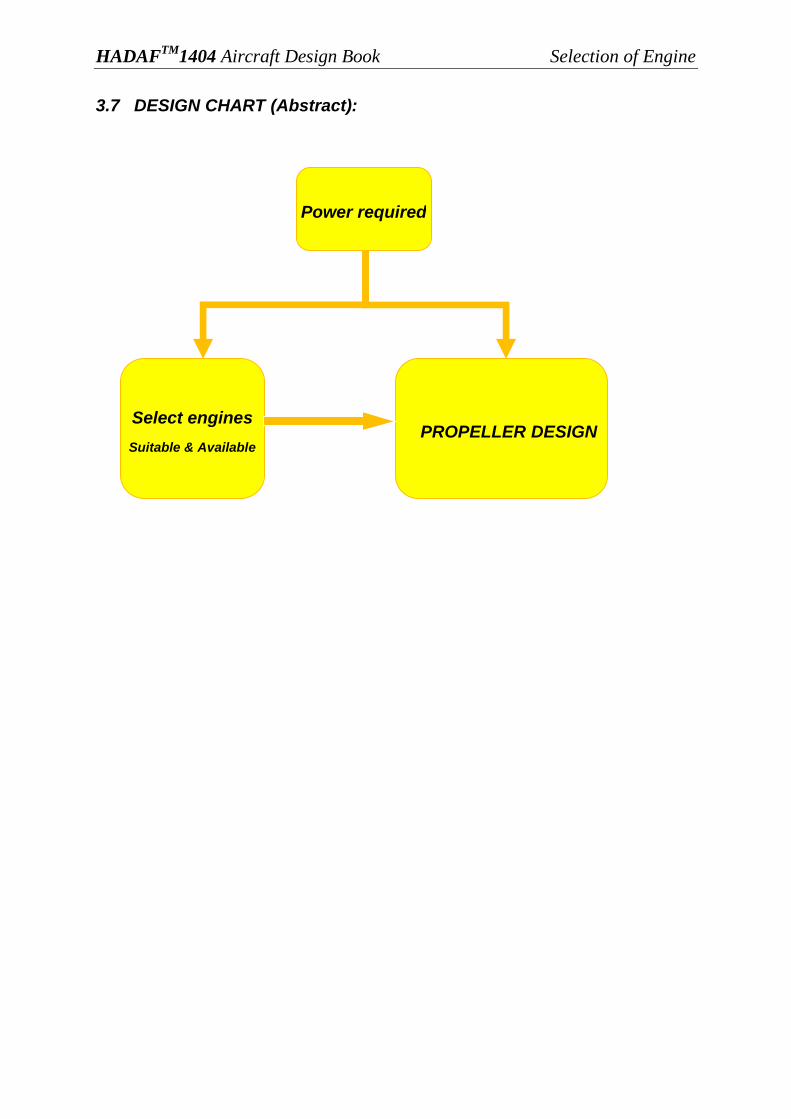
HADAFTM
1404 Aircraft Design Book Selection of Engine
3.7 DESIGN CHART (Abstract):
Select engines
Suitable & Available PROPELLER DESIGN
Power required
HADAFTM
1404 Aircraft Design Book Selection of Engine
3 .8 References
1. Roskam, J., Airplane Design: Part II, Preliminary Configuration Design and
Integration of the Propulsion System.
2. Engines catalogs

HADAFTM
1404 Aircraft Design Book The General Arrangement and…
4 The General Arrangement and Fuselage Design
4.1 INTRODUCTION
The purpose of this book is to determine a suitable and efficient configuration for our
plane and Design of cockpit and fuselage layouts to meet the mission requirements in
terms of payload and other different variables like manufacturability, market and
customer favors.
The design of the fuselage is based on payload, aerodynamic, and structural
requirements. The overall dimensions of the fuselage affect the drag through several
factors. Fuselages with smaller fineness ratios have less wetted area to enclose a given
volume, but more wetted area when the diameter and length of the cabin are fixed. The
higher Reynolds number and increased tail length generally lead to improved
aerodynamics for long, thin fuselages, at the expense of structural weight. Selection of the
best layout requires a detailed study of these trade-offs, but to start the design process,
something needs to be chosen. This is done by selecting a case not so different from
existing aircrafts with similar requirements, for which such a detailed study has been
presumably done.
The following sections are divided in two main parts: The General arrangement and
Fuselage Design.
4.2 Outline of configuration possibilities
Before general arrangement, the sketch of a new design can be drawn on paper. The
choice will be made according to the relative location of the main components including
wing, fuselage, tail surfaces and landing gear. A specific configuration is often inspired
by a trend or line of evolution, which may have its origin somewhere in the past. It may
be that previous experience with aircraft in a similar category has established a tradition,
which cannot be easily discarded. A successful choice of the configuration does not mean
that no major changes will be required as development proceeds. For a given mission it
can be several possible various solutions, each with its own particular merits.
Unfortunately, for various reasons, few examples of design evolution have been
published. It is therefore difficult to draw general conclusions from which
recommendations can deduce. The next few sections will be devoted to discussion of the
general arrangement.
The aspects followed in configuration design are considered as:

HADAFTM
1404 Aircraft Design Book The General Arrangement and…
i. Overall configuration
ii. Engine type and disposition
iii. Wing configuration
iv. Empennage configuration
v. Landing gear type and disposition
vi. Determination of the Center Of Vision (COV)
4.2.1 Overall configuration
Configuration is a term used frequently in aviation. The configuration will determine the
overall aerodynamic performance of the aircraft. When pilots use the term
“configuration”, they are usually referring to the choice of flap and gear setting. In other
words it might be described the configuration as "gear down with flaps 30 degrees" Or
pilots may say „we are clean,‟ which means gear up and flaps up. In aerodynamics,
configuration means the same thing and more. In addition to the gear and flap settings,
which are very important aerodynamically, an aerodynamicist is very interested in the
relative position of the tail and wing
The first stage of the design process is to determine the overall configuration of the
aircraft. This is called „conceptual design‟ stage. Four different configurations are
available for a designer to select which three possible configurations of them are:
i. Conventional (tail at rear)
ii. Canard (tail at front)
iii. Tailless (has no tail)
A basic Conventional configuration will define as one having the following layout
characteristics:
i. A cantilever monoplane wing
ii. Separate vertical and horizontal tail surfaces
iii. A discrete fuselage used to provide volume and continuity airframe
iv. A retractable tricycle landing gear
Conventional configuration simply means that the elevators are at the rear, in other
words behind the center of gravity and the engine is at the front but that is not a defining
characteristic of a conventional design. In a conventional design, the elevators are
usually mounted on a horizontal surface, called "horizontal stabilizer" or "horizontal tail
plane." An exception is the V-tail. All modern aircrafts have a conventional
configuration. Designers have a lot of experience with this configuration. It is a relatively
simple and cheap design. The blended wing is the most advanced design and gives the
best performance out of the four configurations. However, it is also the most expensive
design. The joined wing and three surface configurations give better performance than
the conventional design, but also cost slightly more.
HADAFTM
1404 Aircraft Design Book The General Arrangement and…
In conventional aircraft design, designer first decides on an aircraft configuration, and
then estimates its characteristics. With the inverse design methodology, it is the other
way: the characteristics will be determined first, and then the right configuration to
match the requirements will be found. The disadvantage of the inverse design is that it
requires another step - analyzing the overall performance of the resulting aircraft
configuration from its characteristics but with multi-objective design optimization,
designer can optimize the configuration by simply specifying the multiple performance
aspects they would like to improve, such as aerodynamic drag and sonic booms.
.
In conventional aircraft design, designer first decides on an aircraft configuration, and
then estimates its characteristics. With the inverse design methodology, it is the other
way: the characteristics will be determined first, and then the right configuration to
match the requirements will be found. The disadvantage of the inverse design is that it
requires another step - analyzing the overall performance of the resulting aircraft
configuration from its characteristics but with multi-objective design optimization,
designer can optimize the configuration by simply specifying the multiple performance
aspects they would like to improve, such as aerodynamic drag and sonic booms.
4.2.2 Engine type and disposition
The arrangement of engines influences the aircraft in many important ways. Safety,
structural weight, flutter, drag, control, maximum lift, propulsive efficiency,
maintainability, and aircraft growth potential are all affected. Engines may place in the
wings, on the wings, above the wings, or suspended on pylons below the wings. They may
mount on the aft fuselage, on top of the fuselage, or on the sides of the fuselage. Wherever
the nacelles are, the detailed spacing with respect to the wing, tail, fuselage, or other
nacelles is crucial.
When aircraft becomes smaller, it is difficult to place engines under the wing and still
maintains adequate wing nacelle and nacelle-ground clearances. This is one reason for
the aft-engine arrangements.
At this part according to the results obtained in the “Engine” book, which are taken
again at below, one tractor engine, is selected that logically will install and bury in the
nose of the airplane like the common used designations in the available database.
The results obtained in the “Engine” book:
i. Pusher aircrafts are structurally more complicated than equivalent tractor types,
especially because of efforts to mount the empennage behind the rear propeller. This
results in increased drag .

HADAFTM
1404 Aircraft Design Book The General Arrangement and…
ii. Due to center of gravity often being further behind on longitudinal axis than on most
tractor airplanes, the pushers can be more proneflat spin, especially if loaded
improperly.
iii. Normally the engine of a pusher, exhausts in front of the propeller and in this case the
exhaust may cause corrosion or other damage to the propeller. This is usually minimal,
and may be mainly visible in the form of soot stains on the blades.
iv. Propeller noise might increase since the engine exhaust flows through the props. This
effect may particularly pronounce when using turboprop engines due to the large
volume of exhaust they produce. Similarly, vibration may induce by the propeller,
passing through the wing’s downwash; causing it to move asymmetrically through air
of differing energies and directions.
v. The propeller increases airflow around an air-cooled engine in the tractor
configuration, but does not provide this same benefit to an engine mounted in the
pusher configuration. Some aviation engines experienced cooling problems when used
as pushers.
4.2.3 Wing configuration
4.2.3.1 Wing location:
It will be obvious that the location of the wing relative to the fuselage is to large extent
determined by the operational requirements. Although the aerodynamic and structural
differences are important, they can be only decided as factors when the choice between
high, low and mid wing is not dictated by considerations of maximum operation
flexibility.
Forewing location there are several choices shown in figures below but three of them are
mostly known as conventional and operative sorts, which will be discussed in next
paragraphs.
Figure 4-1 Location of the wing

HADAFTM
1404 Aircraft Design Book The General Arrangement and…
i. Mid wing:
Figure 4-2Example of mid-wing plane
This layout is used when minimum drag in high-speed flight is of paramount importance
Thus the divergence of the airflow over the wing root at high angles of attack is
minimized. For such reasons many mid-wing layouts are found in fighter and trainer
aircrafts. It is not generally feasible to adopt such a scheme for transport aircraft, and a
few mid-wing monoplanes are found in this category. In this case, the cabin floor, which
is located just above the wing center section, is the position relatively high in the fuselage
cross section.
Also with this layout, it is difficult to avoid considerable shift of the center of gravity for
different loading conditions unless serious loading restriction are accepted. Since in a
two-seat airplane, minimum drag is not as important as high-speed flight and mid wing
use for a high-speed flight, it is better to discuss low or high wing structures.
Also in this design the maximum area in cabin is needed which mid-wing airplanes are
opposed to this demand.
ii. High wing & low wing (comparison):
Figure 4-3Example of high-wing plane
Figure 4-4Example of low-wing plane
In the case of a low-wing aircraft of comparable size with high wing, the main deck floor
is higher above the apron. This makes such an aircraft dependent on special loading and
HADAFTM
1404 Aircraft Design Book The General Arrangement and…
boarding equipment, which is unacceptable for military aircraft. But in the case of most
passenger aircraft the height of the cabin floor above the ground is of less importance.
In smaller high-wing propeller aircrafts, it may be possible to retract the main gear into
the engine nacelles or in tail booms but in the case of very large aircraft, doing so would
make it too tall and too heavy. This will unavoidably lead to mounting the gear to the
fuselage, but strengthening of the fuselage structure required for the transmission of the
landing impact loads will result in a weight increase. This is only in offset by the saving
in weight in comparison with a low-wing design, due to the shorter landing gear struts.
In this design, the target is a fixed landing gear -which will discuss in landing gear book-
so application of low wing will cause difficulties in landing gear design. In addition,
braced-wing monoplanes are generally high-wing designs, which cause little
interference.
In the case of a STOL airplane, close proximity of the wing to the ground in takeoff and
landing may cause pronounced and generally undesirable ground effect. Moreover, if a
low wing was adopted, the required clearance of the large, fully deflected trailing edge
flaps and -in the case of propeller-driven STOL aircraft- large propellers, would entail a
very tall and heavy landing gear. In this case, a high-wing design generally has more to
recommend it.
4.2.3.2 Effect of the wing location on the general arrangement:
According to descriptions above, design can continue by paying attention to some points:
i. Interior arrangement
ii. Safety
iii. Performance & flying qualities
iv. Structural aspects
In a high wing aircraft, the fuselage section under the floor is generally flattened .Also
there is a wide area in cabin.
From another view, since the impact is not too heavy, damage and fire in high wing
aircraft will be limited so these kinds of aircrafts have more safety than others do.
The principal difference between characteristics of high and low wing layouts during
takeoff and landing is the ground effect, which decreases by increasing the wing height
relative to ground. Ground effect will generally cause a reduction in vortex-induced drag,
resulting in a decreased distance. In a high wing layout, the minimum ground effect
happens.
Also high wing structure can bring a high stability for performance of target.
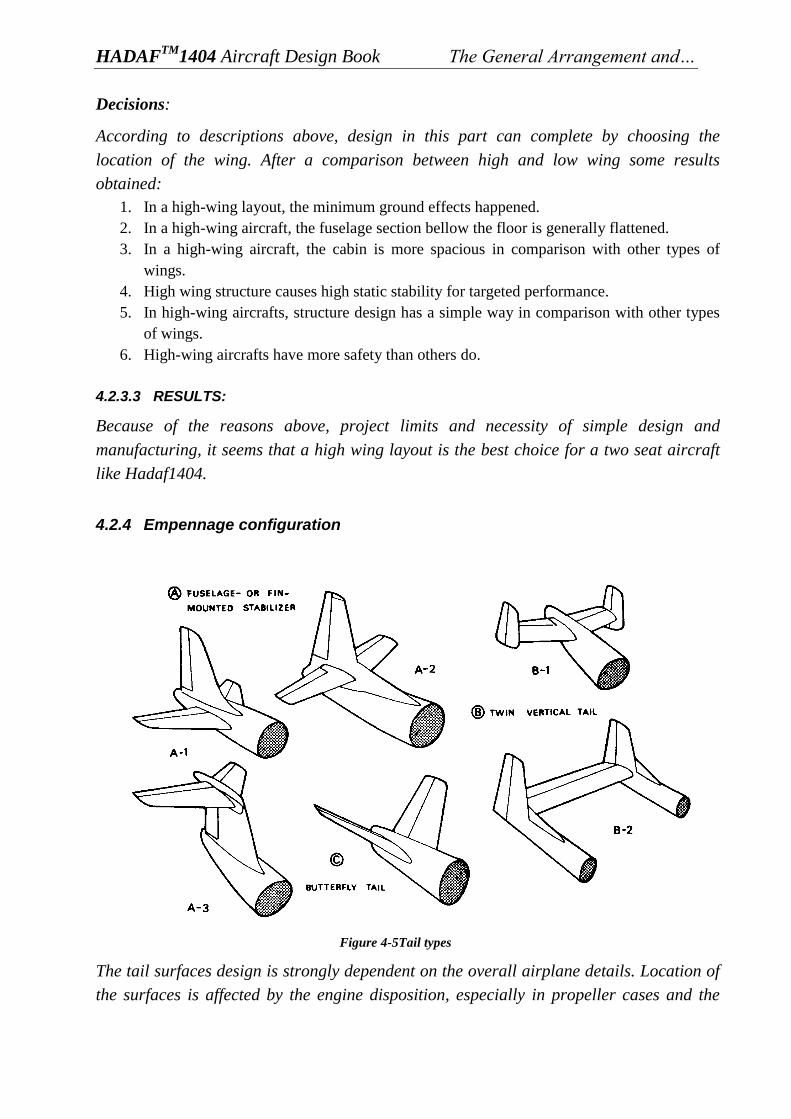
HADAFTM
1404 Aircraft Design Book The General Arrangement and…
Decisions:
According to descriptions above, design in this part can complete by choosing the
location of the wing. After a comparison between high and low wing some results
obtained:
1. In a high-wing layout, the minimum ground effects happened.
2. In a high-wing aircraft, the fuselage section bellow the floor is generally flattened.
3. In a high-wing aircraft, the cabin is more spacious in comparison with other types of
wings.
4. High wing structure causes high static stability for targeted performance.
5. In high-wing aircrafts, structure design has a simple way in comparison with other types
of wings.
6. High-wing aircrafts have more safety than others do.
4.2.3.3 RESULTS:
Because of the reasons above, project limits and necessity of simple design and
manufacturing, it seems that a high wing layout is the best choice for a two seat aircraft
like Hadaf1404.
4.2.4 Empennage configuration
Figure 4-5Tail types
The tail surfaces design is strongly dependent on the overall airplane details. Location of
the surfaces is affected by the engine disposition, especially in propeller cases and the

HADAFTM
1404 Aircraft Design Book The General Arrangement and…
arrangement of the wing with tail. The fact that how tail installation is done, affects on
the empennage structural design and therefore on overall structure of the airplane. Since
we have already determined our wing and engine location, now we can survey their
effects on the tail and prepare a logical discussion for tail architecture. At first, all of the
principal configurations will be included and then the best choice will be chosen. As it is
shown in the figure above, all tails can be classified in three groups. The first group
consists of crucifix tail and T-tail in which the layout includes a vertical and horizontal
stabilizer. In T-tail model, we should pay attention that flutter may happen and from
structural sight it needs a strengthened fin in root, since there is a large bending moment
caused by stabilizer. The crucifix tail is stiffer in these cases but T-tail is more reliable in
Spin. The operative area of the T-tail during spin is equal with total fin area but in
crucifix, the wake caused by stabilizer should be mounted.
Figure 4-6Effect of the rudder during a spin
A geometrical approach to analyze the wake of stabilizers is to draw a tangent line with
60 degrees inclination. The desired tail to pass this analysis is one that this line sweeps
less than one third of the fin efficient area.
The twin vertical tail is a beneficial theme in structural design. Since the center of
pressure of the fin is lowered during the deflections of the rudder. It causes less moment
on the tail root but the operation of this theme, is not desired during spin.
The V-tail is not a popular and common tail. Since the moving surfaces should act as both
of the rudder and elevator, it needs a complicated control system. Since there is not
engine efflux on the tail, according to engine disposition, it acts more efficient in tail
plane design. The distance of the engine and tail surfaces is the highest amount in
HADAF configuration than ones in database.

HADAFTM
1404 Aircraft Design Book The General Arrangement and…
Hadaf is in the group of heavy UL aircrafts and this limit causes to choose the best tail in
performance and structural weight. In order to provide the best performance, we should
choose one of the configurations from A-1, A-2 and A-3. T-tails need more advance
structures, which seems to employ additional weight. So A-1 and A-2 should be surveyed.
Since in configuration A-2 the elevators will receive more efflux from the wing
downwash, it is strongly suggested to use A-1, which has more reliability in this case. In
order to provide security standards of the tail during spin, elevators must move either
back/down or even both such in Remos GX.
4.2.5 1.5. Landing gear type and disposition
Since we have a heavy plane in UL class, choosing an appropriate landing gear is very
important. This importance will be shown when the brake system is going to install and
also in landing process. The requirements that should be met by landing gears are to
strengthen properly over the loads exerted on it while the landing impulses happen; also
transferring less impulses into cockpit.
Various configurations for undercarriage have been adopted up until now, but each of
them was designed for special purposes. Only three of these need be discussed in the
present context.
i. Tandem undercarriage
ii. Tail-wheel undercarriage
iii. Nose-wheel undercarriage
4.2.5.1 Tandem undercarriage
Here the main wheels are arranged practically in the plane of symmetry of the aircraft
and the front and the rear wheels landing impact forces of the same magnitude. use of the
tandem gear is justified when much emphasis has to be placed on the following
advantages:
- Both main legs are placed at nearly equal distances ahead of and behind the center of
gravity, thus locally creating space for payload close to it.
- The wheels may be retracted inside the fuselage without interrupting the wing structure.
The increase if any in fuselage weight will depend on other factors.
Against these we have to set following disadvantages:
- Outrigger wheels will be required to stabilize the aircraft on the ground and these may
increase the all-up weight by approximately 1#.however by using two pairs of main legs
instead of single ones, a certain amount of track may be obtained, resulting in a reduction
of the load on the outriggers.
- The pilots must be carefully maintain the proper touchdown attitude in order to avoid
overstraining the outriggers. It may sometimes be a possible to locate the rear legs close
to the center of gravity of the aircraft, and so reduce this disadvantage, but that means
losing the opportunity to have an unobstructed space.
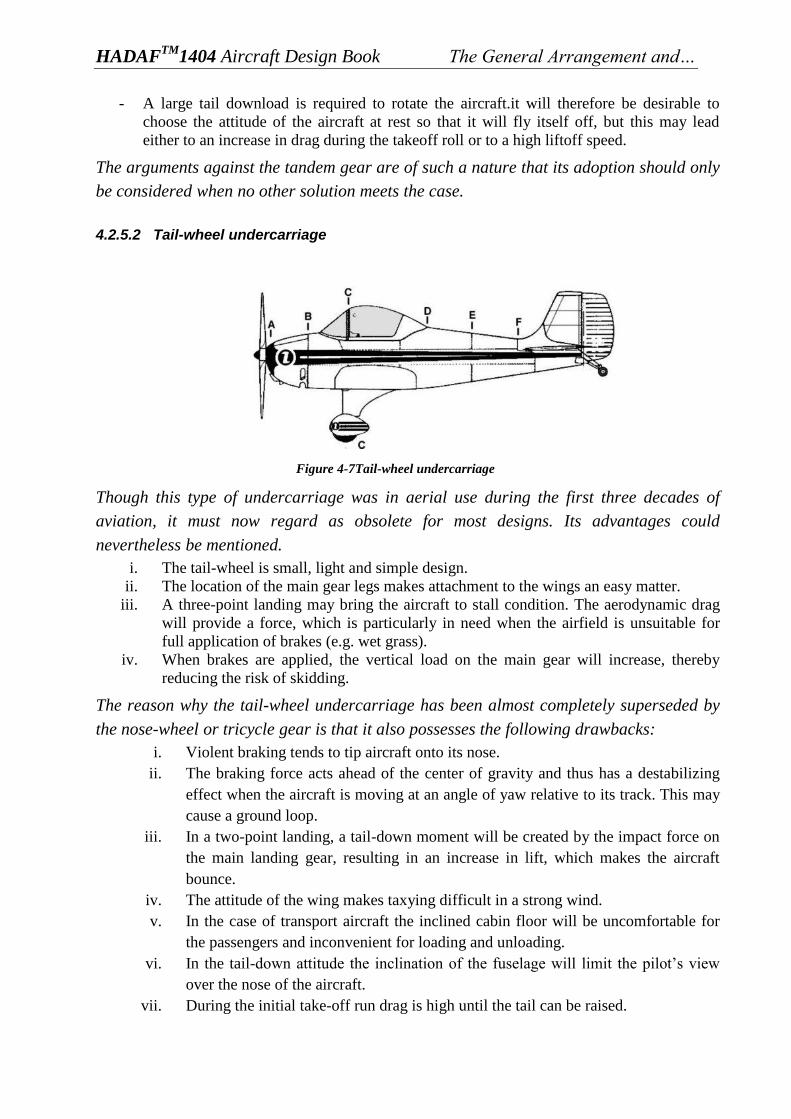
HADAFTM
1404 Aircraft Design Book The General Arrangement and…
- A large tail download is required to rotate the aircraft.it will therefore be desirable to
choose the attitude of the aircraft at rest so that it will fly itself off, but this may lead
either to an increase in drag during the takeoff roll or to a high liftoff speed.
The arguments against the tandem gear are of such a nature that its adoption should only
be considered when no other solution meets the case.
4.2.5.2 Tail-wheel undercarriage
Figure 4-7Tail-wheel undercarriage
Though this type of undercarriage was in aerial use during the first three decades of
aviation, it must now regard as obsolete for most designs. Its advantages could
nevertheless be mentioned.
i. The tail-wheel is small, light and simple design.
ii. The location of the main gear legs makes attachment to the wings an easy matter.
iii. A three-point landing may bring the aircraft to stall condition. The aerodynamic drag
will provide a force, which is particularly in need when the airfield is unsuitable for
full application of brakes (e.g. wet grass).
iv. When brakes are applied, the vertical load on the main gear will increase, thereby
reducing the risk of skidding.
The reason why the tail-wheel undercarriage has been almost completely superseded by
the nose-wheel or tricycle gear is that it also possesses the following drawbacks:
i. Violent braking tends to tip aircraft onto its nose.
ii. The braking force acts ahead of the center of gravity and thus has a destabilizing
effect when the aircraft is moving at an angle of yaw relative to its track. This may
cause a ground loop.
iii. In a two-point landing, a tail-down moment will be created by the impact force on
the main landing gear, resulting in an increase in lift, which makes the aircraft
bounce.
iv. The attitude of the wing makes taxying difficult in a strong wind.
v. In the case of transport aircraft the inclined cabin floor will be uncomfortable for
the passengers and inconvenient for loading and unloading.
vi. In the tail-down attitude the inclination of the fuselage will limit the pilot’s view
over the nose of the aircraft.
vii. During the initial take-off run drag is high until the tail can be raised.
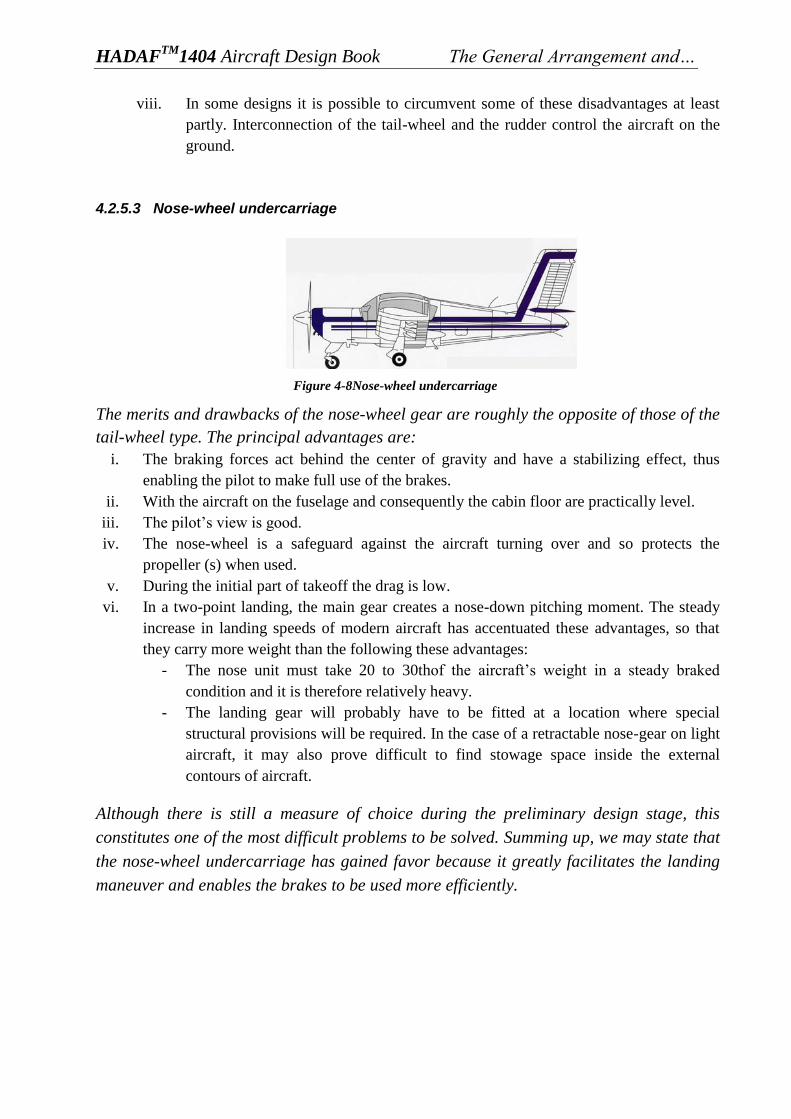
HADAFTM
1404 Aircraft Design Book The General Arrangement and…
viii. In some designs it is possible to circumvent some of these disadvantages at least
partly. Interconnection of the tail-wheel and the rudder control the aircraft on the
ground.
4.2.5.3 Nose-wheel undercarriage
Figure 4-8Nose-wheel undercarriage
The merits and drawbacks of the nose-wheel gear are roughly the opposite of those of the
tail-wheel type. The principal advantages are:
i. The braking forces act behind the center of gravity and have a stabilizing effect, thus
enabling the pilot to make full use of the brakes.
ii. With the aircraft on the fuselage and consequently the cabin floor are practically level.
iii. The pilot’s view is good.
iv. The nose-wheel is a safeguard against the aircraft turning over and so protects the
propeller (s) when used.
v. During the initial part of takeoff the drag is low.
vi. In a two-point landing, the main gear creates a nose-down pitching moment. The steady
increase in landing speeds of modern aircraft has accentuated these advantages, so that
they carry more weight than the following these advantages:
- The nose unit must take 20 to 30thof the aircraft’s weight in a steady braked
condition and it is therefore relatively heavy.
- The landing gear will probably have to be fitted at a location where special
structural provisions will be required. In the case of a retractable nose-gear on light
aircraft, it may also prove difficult to find stowage space inside the external
contours of aircraft.
Although there is still a measure of choice during the preliminary design stage, this
constitutes one of the most difficult problems to be solved. Summing up, we may state that
the nose-wheel undercarriage has gained favor because it greatly facilitates the landing
maneuver and enables the brakes to be used more efficiently.

HADAFTM
1404 Aircraft Design Book The General Arrangement and…
4.2.6 Determination of the Center Of Vision (COV)
Regarding to the development of the UL airplanes in last two decades, after when
Roskam method was published, a database is provided from the seat modes and
dimensions in order to determine the pilot‟s Center of Vision (COV).
The Database of seat dimensions is provided below:
Table 4-1database of seat dimension
1 2 3 4 α Θ
Land Africa 65 38 46 14 16 8
Jabiru 47 38 45 12 18 20
Savannah 54 42 42 10 30 7
Euro Fox 47 40 44 12 21 12
Remos GX 45 35 46 8 24 21
The dimensions announced here are equivalent with some of stated notations in the figure
below. Number 1 is the vertical component of R, number 2 is horizontal component of P,
number 3 is the width of the seat and number 4 is equivalent of C. The angles indicate the
position of the seat in Cartesian coordination. (α) is equal with D and (θ) is equal with E
– 90.
Figure 4-9standard seat dimensions in Roskam methods
According to FAR 25 standards, the distance between COV and the seat joint must be
utmost 80 cm and it is assumed to install the pilot seat in at least 20 cm above the cabin.

HADAFTM
1404 Aircraft Design Book The General Arrangement and…
Using dimensions measured in the following tabulation, the location of COV was
determined.
Table 4-2Roskam to locate COV
A B C D E F G H I J K L M N O P Q R
37 30.25 5 21 101 29.75 10.0 14.5 19 6 9 11.5 36 5 9.25 15 7 25
39 30.758 5 19 101 30.25 9.75 13.75 19 6 9 13.75 35 5 9.25 15 7 25
41 31.5 5 16 101 31.0 9.75 13.5 19 6 9 15.5 34.5 5 9.25 15 7 25
43 31.75 5 16 101 31.25 10.0 13.25 19 6 9 17.5 34.5 5 9.25 15 7 25
Figure 4-10 Definition of joint angle
According to the recent researches, the standard values for human skeleton position
angles is obtained as shown in table-3 which discusses the angles of figure-9. Comparing
these values with ones we obtained from practical measurement and ones announced by
Roskam, leads to a process to choose definite values for these angles and length. Now we
can calculate the COV of the pilot regarding to Hadaf primary configuration and
dimensions, which will be modified later. These body geometrical values are also used to
locate the definite position of the stick and rudder pedals.
Using the data above and calculating for a standard body gesture of seated pilot, the
COV of Hadaf locates 112 cm above the cabin and 110 cm cross the firewall.
Table 4-3Comfort range and most comfort value of joint angles

HADAFTM
1404 Aircraft Design Book The General Arrangement and…
Figure 4-11COV location
Location of the COV and also the downward vision angle are strongly dependent on the
cabin interior configuration and also the nose style which should be surveyed in CAD
files. The minimum angle of vision under the horizontal line of pilot's eye should be 15
degrees and in order to meet visibility requirements during landing phase, this session
must be concentrated. This angle for our plane is 15.97 degrees.
4.3 Outline of fuselage design
The preliminary general arrangement of the aircraft is closely tied up with the fuselage,
the main dimensions of which should be laid down in some detail. In fact, the fuselage
represents such an important item in the total concept that its design might well be
started before the overall configuration is settled.
i. The fuselage is the most suitable part for housing the cockpit, the most function at
location generally being in the nose.
ii. The fuselage may be regarded as the central member structural member to which
the other main parts are joined(wings, tail unit and in some cases the engines) on
the one hand, and the aircraft on the other. In some aircraft a number of these
duties are assigned to tail booms.
iii. Most of the aircraft systems are generally housed in the fuselage, which
sometimes also carries the engines, fuel and/ or the retractable undercarriage.
Many of the requirements laid down in relation to the fuselage limit the designer‟s range
of choice.
The aspects followed in this part are considered as:
1. The selection of cabin cross-section dimensions.
2. Determination of fuselage length and shape.
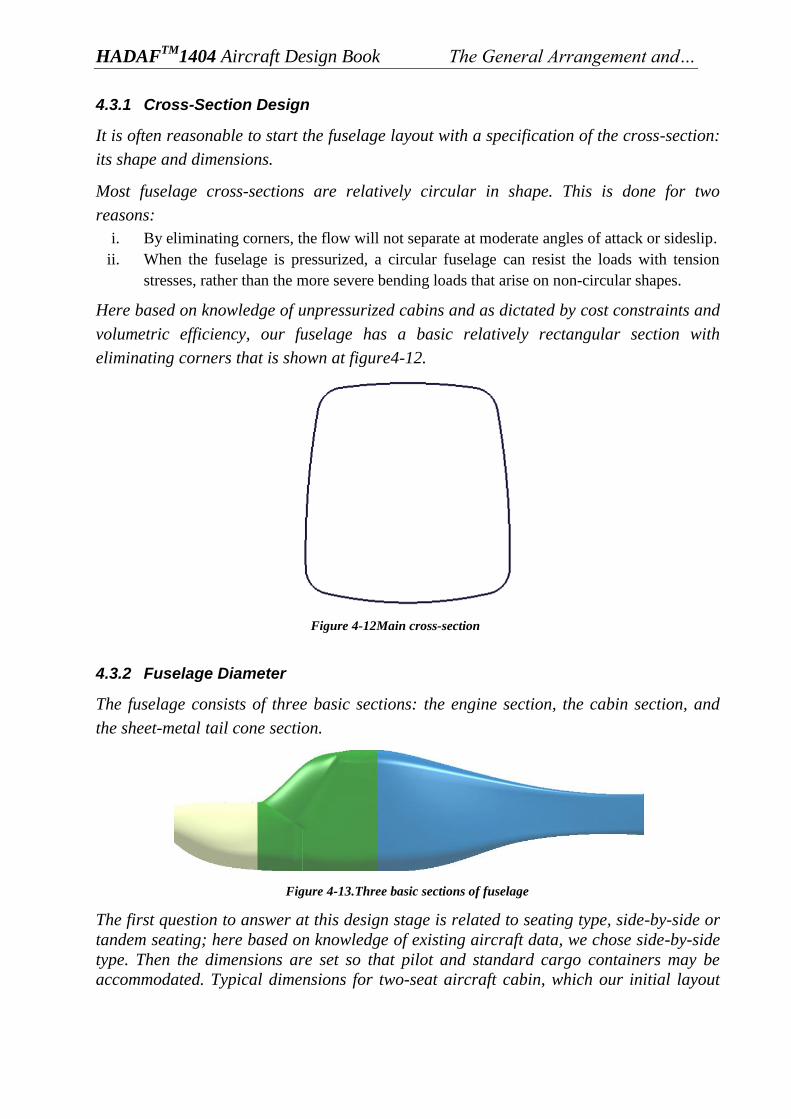
HADAFTM
1404 Aircraft Design Book The General Arrangement and…
4.3.1 Cross-Section Design
It is often reasonable to start the fuselage layout with a specification of the cross-section:
its shape and dimensions.
Most fuselage cross-sections are relatively circular in shape. This is done for two
reasons:
i. By eliminating corners, the flow will not separate at moderate angles of attack or sideslip.
ii. When the fuselage is pressurized, a circular fuselage can resist the loads with tension
stresses, rather than the more severe bending loads that arise on non-circular shapes.
Here based on knowledge of unpressurized cabins and as dictated by cost constraints and
volumetric efficiency, our fuselage has a basic relatively rectangular section with
eliminating corners that is shown at figure4-12.
Figure 4-12Main cross-section
4.3.2 Fuselage Diameter
The fuselage consists of three basic sections: the engine section, the cabin section, and
the sheet-metal tail cone section.
Figure 4-13.Three basic sections of fuselage
The first question to answer at this design stage is related to seating type, side-by-side or
tandem seating; here based on knowledge of existing aircraft data, we chose side-by-side
type. Then the dimensions are set so that pilot and standard cargo containers may be
accommodated. Typical dimensions for two-seat aircraft cabin, which our initial layout

HADAFTM
1404 Aircraft Design Book The General Arrangement and…
based on from FAR 23 standards was taken at “Determination of the Center Of Vision”
part.
4.3.3 The sheet-metal tail cone section
The fuselage cone is normally a smooth transition from the maximum fuselage cross
section to the end of the fuselage. When the „fineness ratio‟ of this cone is too low, there
will be a large base drag penalty although the fuselage weight may be reduced. When the
„fineness ratio‟ of this cone is too large, there will be a large friction drag penalty as well
as a large weight penalty. It is obvious that a long fuselage cone tends to increase the tail
moment arm thereby reducing required tail area and vice versa.
The decision on the fuselage cone fineness ratio is there for one that involves a number of
trade-offs.
4.3.3.1 Database discussion
In books 1 and 2 a database of similar airplanes was used to estimate some of our
specifications. In this book also we do it, but we should note that database planes were
classified in both high wing and low wing configurations. In this book we should survey
ones correspond our configuration‟s outline. So we have to filter our database again to
contain the appropriate cases. In this database new parameters of airplanes should be
determined. These parameters are LFC, LF, DFC and θFC as discussed in reference book.
These data are prepared in tabulation as below:
Table 4-4LFC, LF, DFC andθFC parameters of the database
Name LF LFC θFC DF LF/DF LFC/DF
Parrot 6.4 4.6 9.6 1.18 5.4 3.9
F99Rambo 5.1 3.1 11.7 1.1 4.7 2.8
Tecnam 6.4 3.6 5.1 1.275 5.1 2.8
CTSW 6.2 4.1 6.0 1.324 4.6 3.1
Remos 6.4 4.6 8.4 1.25 5.1 3.7
According to this database, we can estimate the similar values for our plane. Table 2
shows geometric fuselage parameters used on our airplane HADAF1404:
Table 4-5.HADAF1404 Geometric Fuselage Parameters
LF LFC θFC DF LF/DF LFC/DF
6.1 4.0 8.1 1.2 5.0 3.2
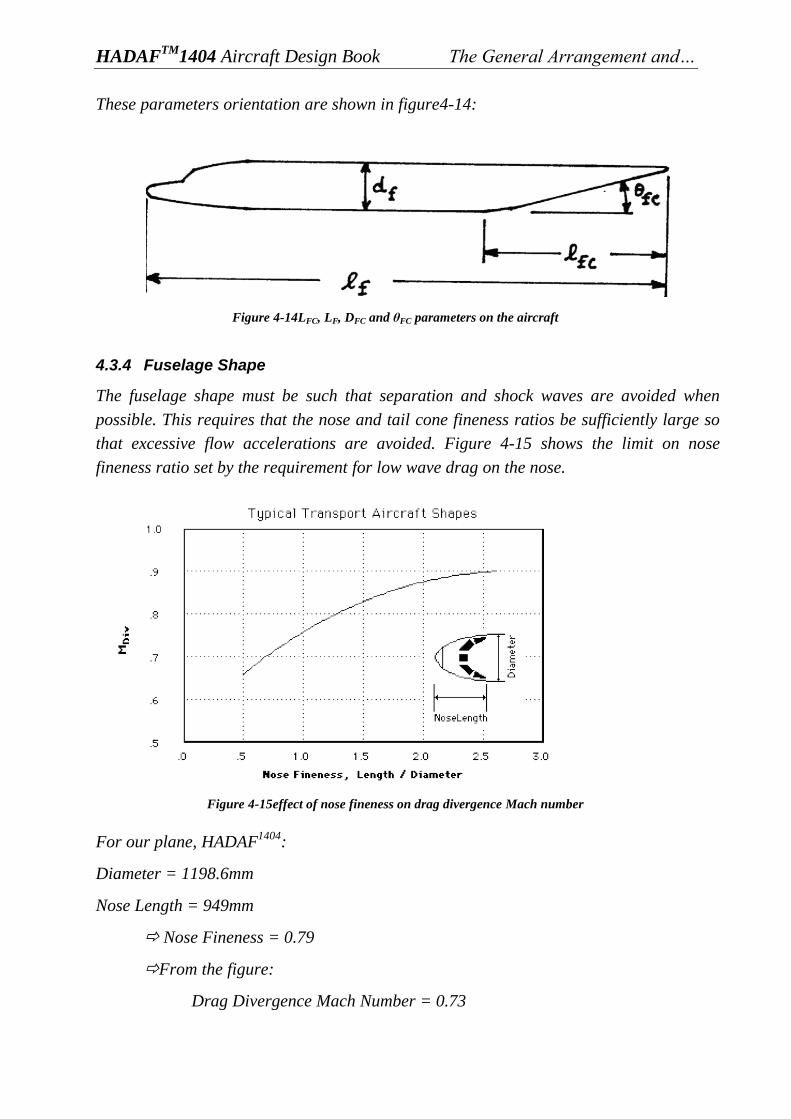
HADAFTM
1404 Aircraft Design Book The General Arrangement and…
These parameters orientation are shown in figure4-14:
Figure 4-14LFC, LF, DFC and θFC parameters on the aircraft
4.3.4 Fuselage Shape
The fuselage shape must be such that separation and shock waves are avoided when
possible. This requires that the nose and tail cone fineness ratios be sufficiently large so
that excessive flow accelerations are avoided. Figure 4-15 shows the limit on nose
fineness ratio set by the requirement for low wave drag on the nose.
For our plane, HADAF1404
:
Diameter = 1198.6mm
Nose Length = 949mm
Nose Fineness = 0.79
From the figure:
Drag Divergence Mach Number = 0.73
Figure 4-15effect of nose fineness on drag divergence Mach number
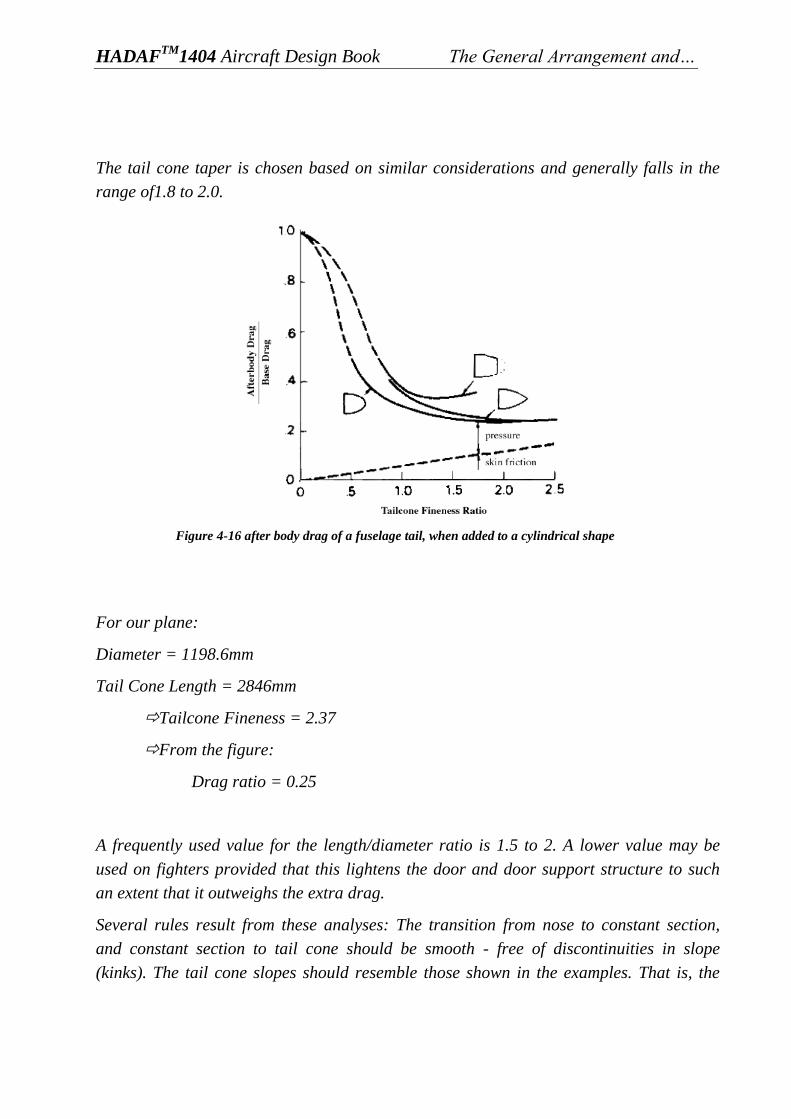
HADAFTM
1404 Aircraft Design Book The General Arrangement and…
The tail cone taper is chosen based on similar considerations and generally falls in the
range of1.8 to 2.0.
Figure 4-16 after body drag of a fuselage tail, when added to a cylindrical shape
For our plane:
Diameter = 1198.6mm
Tail Cone Length = 2846mm
Tailcone Fineness = 2.37
From the figure:
Drag ratio = 0.25
A frequently used value for the length/diameter ratio is 1.5 to 2. A lower value may be
used on fighters provided that this lightens the door and door support structure to such
an extent that it outweighs the extra drag.
Several rules result from these analyses: The transition from nose to constant section,
and constant section to tail cone should be smooth - free of discontinuities in slope
(kinks). The tail cone slopes should resemble those shown in the examples. That is, the

HADAFTM
1404 Aircraft Design Book The General Arrangement and…
slope must change smoothly and the trailing edge should not be blunt. The closure angle
near the aft end should not be too large (half angle less than 14°-20°).
4.3.5 Hadaf configuration
Using data obtained from database and also some comparison between other cases out of
database, a graphical design was drawn. The properties of this configuration, called
Hadaf, are set with mission profile and also requirements that obtained in book 2. Some
individual values in parameters discussed are because of mission defined for Hadaf that
requires special design in cockpit. The ability of containing three passengers needs more
spacious cockpit, which affects the overall configuration. The figures of side and front
view of Hadaf are presented in below:
Figure 4-17
Figure 4-18

HADAFTM
1404 Aircraft Design Book The General Arrangement and…
4.4 Designing diagram
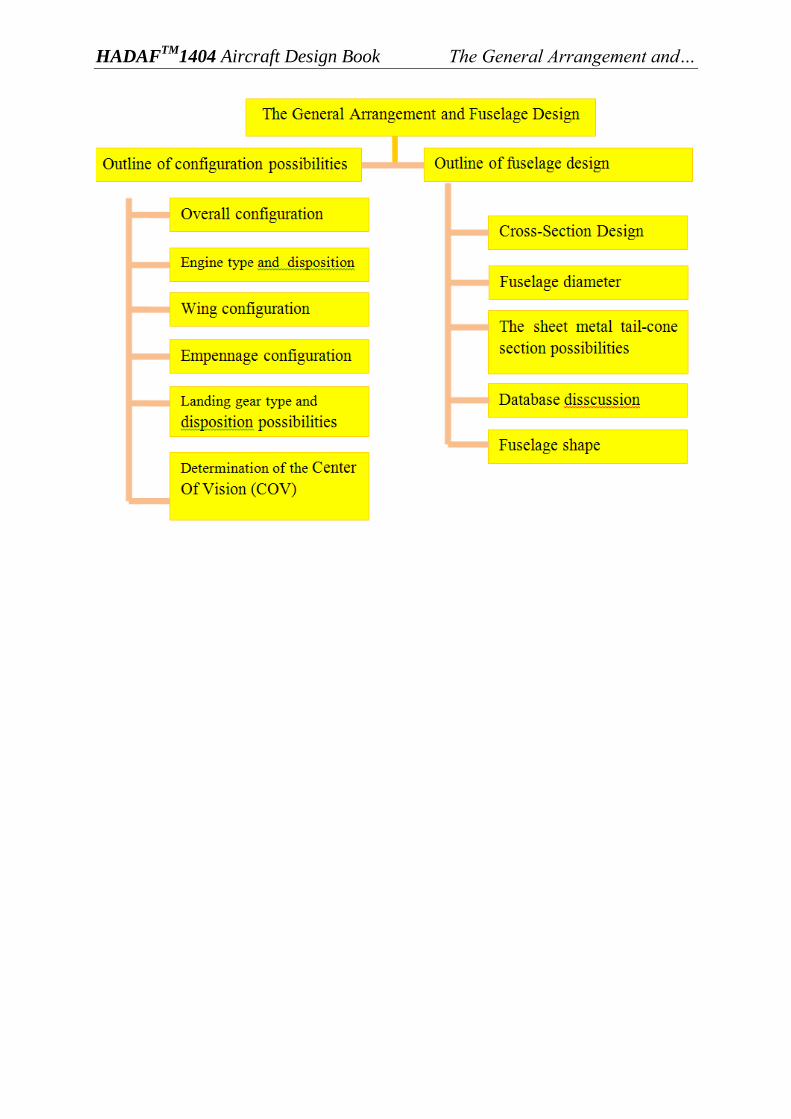
HADAFTM
1404 Aircraft Design Book The General Arrangement and…
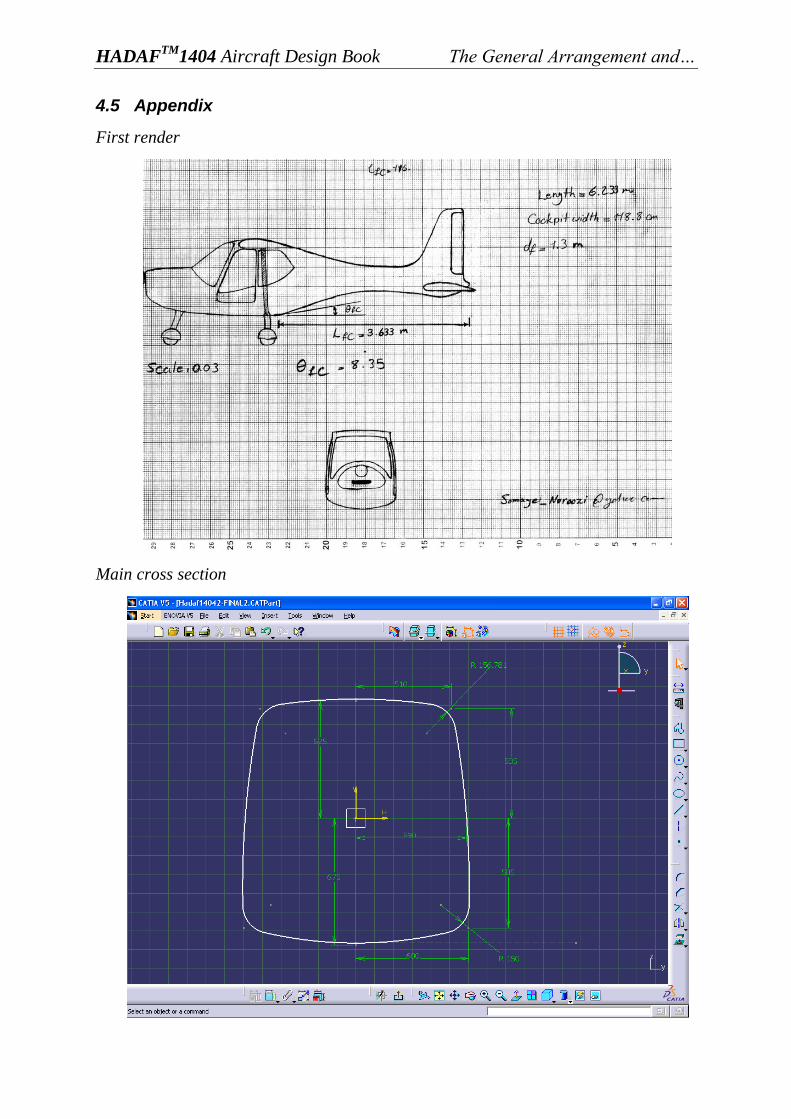
HADAFTM
1404 Aircraft Design Book The General Arrangement and…
4.5 Appendix
First render
Main cross section
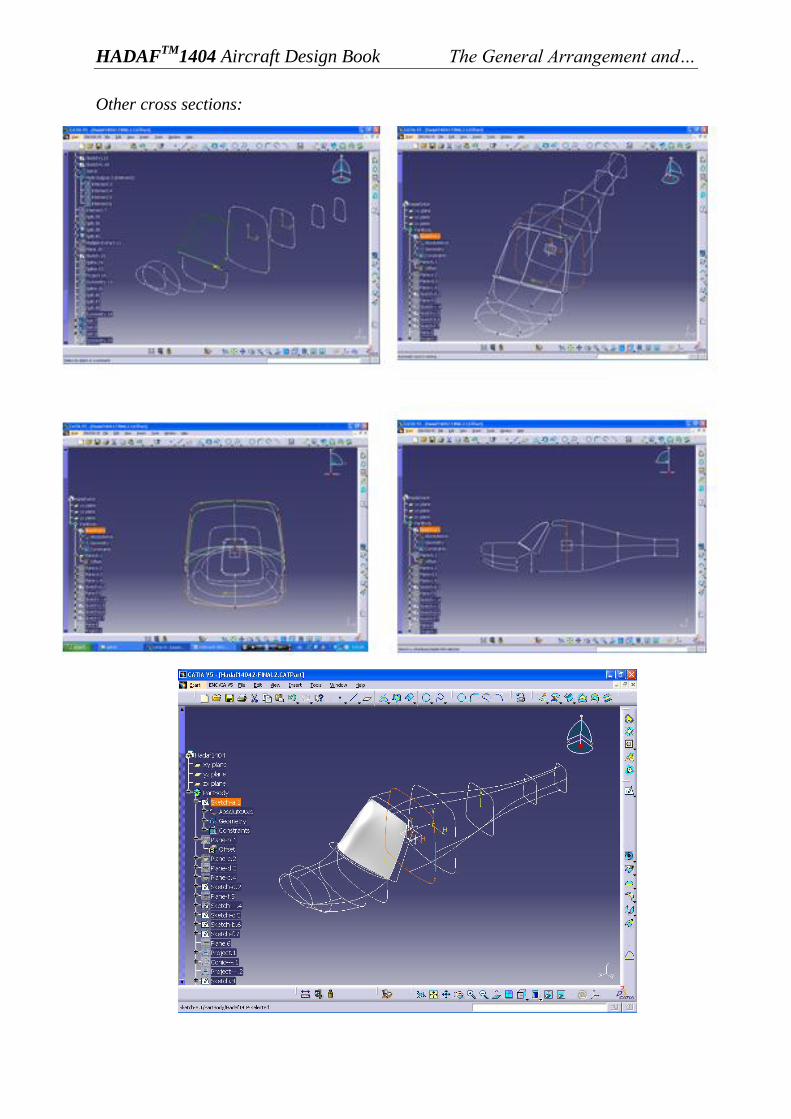
HADAFTM
1404 Aircraft Design Book The General Arrangement and…
Other cross sections:

HADAFTM
1404 Aircraft Design Book The General Arrangement and…
Engine section
Cabin section

HADAFTM
1404 Aircraft Design Book The General Arrangement and…
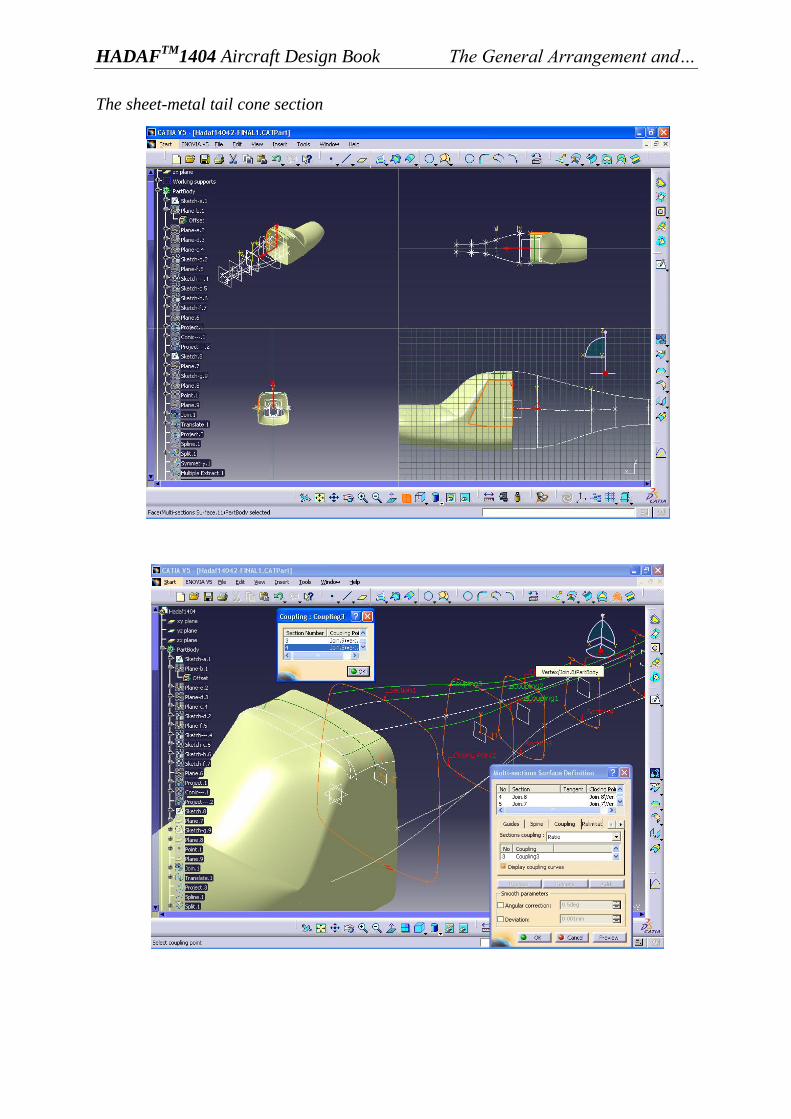
HADAFTM
1404 Aircraft Design Book The General Arrangement and…
The sheet-metal tail cone section

HADAFTM
1404 Aircraft Design Book The General Arrangement and…
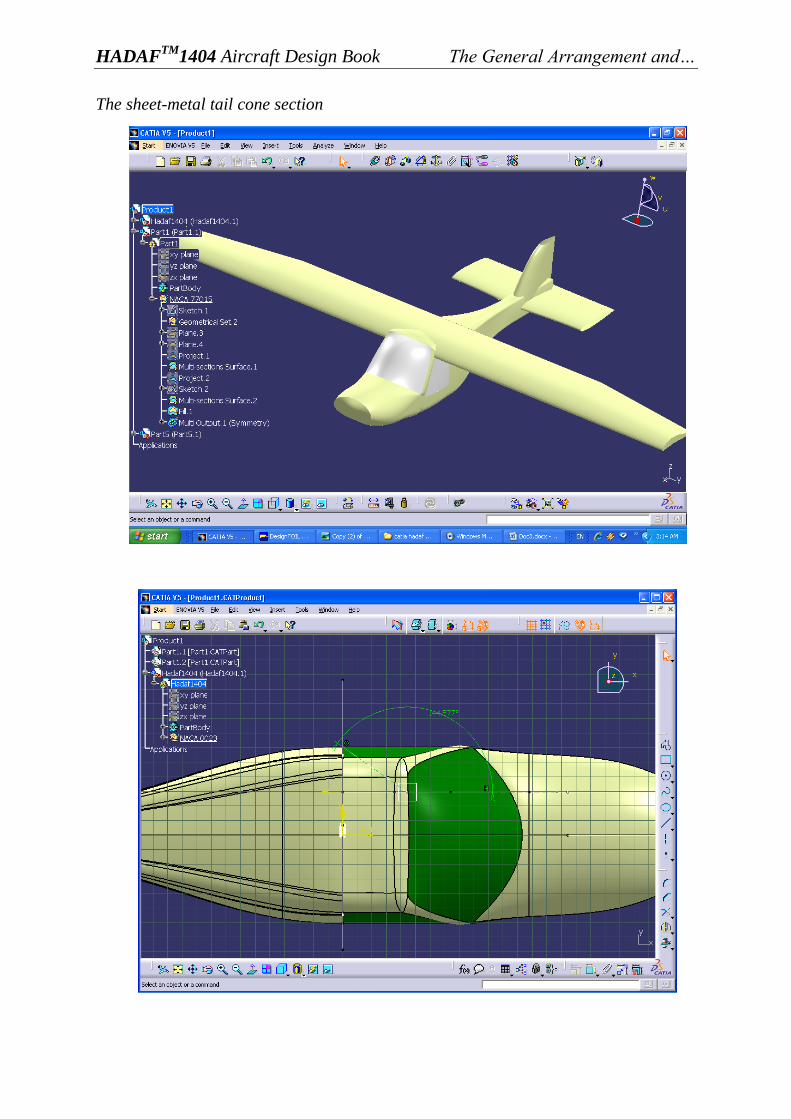
HADAFTM
1404 Aircraft Design Book The General Arrangement and…
The sheet-metal tail cone section
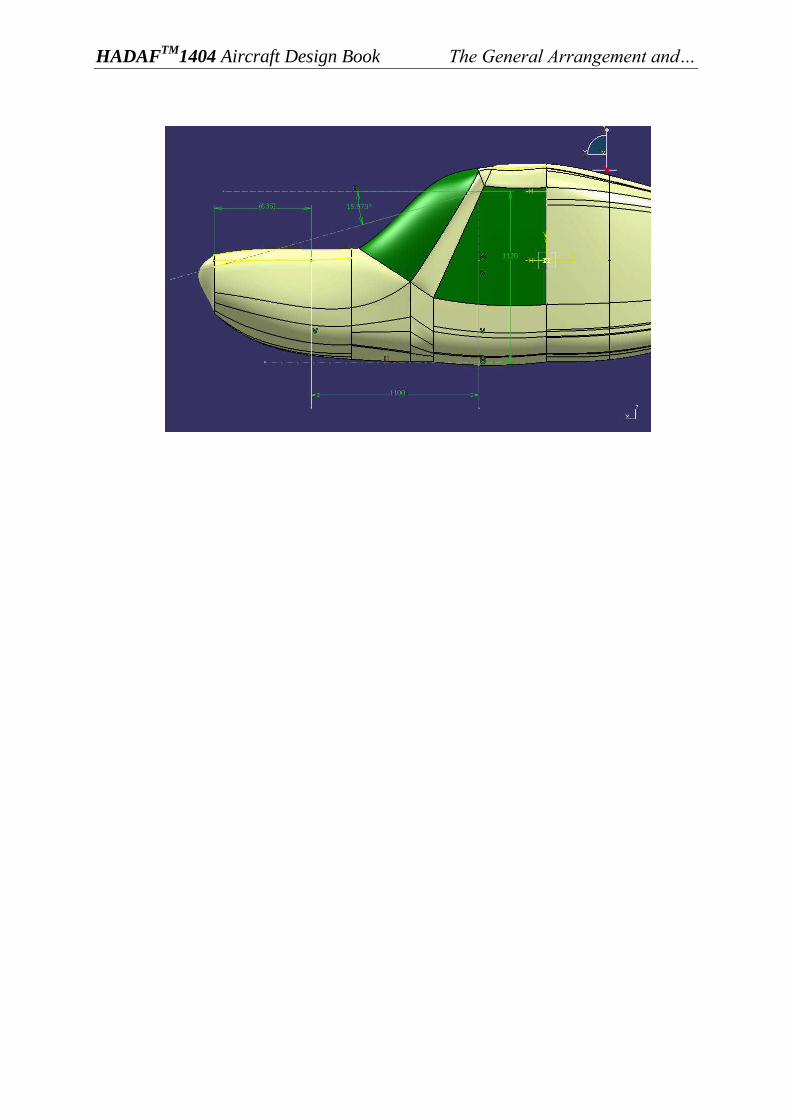
HADAFTM
1404 Aircraft Design Book The General Arrangement and…
HADAFTM
1404 Aircraft Design Book The General Arrangement and…
4.6 References:
5. E.Toreenbeek: “syntheses of subsonic airplane design”, Delft university press,
Rotterdam, 1976.
6. J. Roskam: “Airplane design”, 1985.
7. Kroo: “Engineering aircraft design”, Stanford University press, 2001.
8. “Designworkbook”,airline.http://www.futureflight.org/downloads/designlogbo
ok.pdf
9. http://selair.selkirk.ca/Training/Aerodynamics/configurations.html.
10. http://www.jaxa.jp/article/special/aviation/oonuki01_e.html
HADAFTM
1404 Aircraft Design Book Wing Sizing
5 WING SIZING
5.1 INTRODUCTION
The purpose of this section is designing the aircraft wings in the way that not only
bear the aircraft weight (which is the main duty of the wing for sure), but also have
the desired aerodynamic specifications. The wings must produce enough lift while not
generating so much drag. In order to gain this, the lift to drag (L/D) ratio has to
maximize.
When it comes to design a wing for an aircraft the designer must decide about two
important parameters.
1. The wing section profile (airfoil)
2. The wing planform (wing layout)
All the design parameters are hidden in the two above. So the foregoing book is being
presented, by simply fully define the two parameter mentioned above. In the next
paragraph the more detailed design parameters will be introduced.
5.1.1 DECIDE 1DECIDE ON THE OVERAL WING/FUSELAGE ARRANGMENT
As a result of previous books it is known that the overall configuration of the airplane
is conventional which means that the tail is situated on the aft of the aircraft and the
wing configuration is high. High wing configuration means the wings are connected
to the fuselage on the top. Although the high wing configuration does not have the
least interface drag, but its superior lateral stability was the main reason that it was
selected as the default configuration for wings. Moreover the high wing configuration
helps the passengers to enjoy the broader landscape with more ease.
5.2 MORE DETAIL DESIGN PARAMETER
The aircraft wing designing is finished when the 10 items below are known, for
certain. All the parameters below are defining the planform design except the 4th
item
which is about the wing cross-section.
1. Size (s)
2. Aspect ratio (A)
3. Sweep angle
HADAFTM
1404 Aircraft Design Book Wing Sizing
4. Airfoil profile
5. Thickness ratio (t/c)
6. Taper ratio ( )
7. Incident angle
8. Twist angle
9. Dihedral angle ( )
10. Lateral control surface size and layout
There is no need to note that items 1 and 2 are already known from the previous
books.(i.e. performance) The definition of these 10 parameters exists almost in every
aerodynamic books, but here some of them will introduce in brief.(The reader is
referred to: '' Airplane Design. By Dr. Jan Roskam'' which is one of the greatest books
in this field.)
Aspect ratio:
The ratio of span and the average chord is called, "aspect ratio". In this definition the
average chord is the ratio of wing area and the span. As this parameter increases the
airplane glides in the sky more easily and the sliding angle decreases. But increasing
this parameter is usually bounded by structural problems and also the induced drag
that is the drag due to the lift. For a rectangular wing, there will be:
Sweep angle
The sweep angle( ) is usually measured as the angle between the line of the 25%
chord and a perpendicular to the root chord .sweep angles of the leading edge and of
the trailing edge are also presented with other parameters, since they are of interest
for many applications. The sweep of a wing causes definite changes in the maximum
lift, in the stall characteristics, and in the effects of compressibility.
Taper ratio:
Considering the wing planform to have straight lines for the leading and trailing
edges, the taper ratio, is the ratio of the tip chord to the root chord.
The taper ratio affects the lift distribution and the structural weigh of the wing. A
rectangular wing has the taper ratio 1.00 while a pointed tip delta wing has a taper
ratio of 0.0.
Dihedral angle:
The dihedral angle is the angle between a horizontal plane containing the root chord
and a plane midway between the upper and lower surfaces of the wing .if the wing lies
below the horizontal plane, it is termed an anhedral angle. Generally, the dihedral
angle affects the lateral stability characteristics of the airplane.
Below the subject with a database of the parameters mentioned above in the ultra-
light airplanes is brought up.
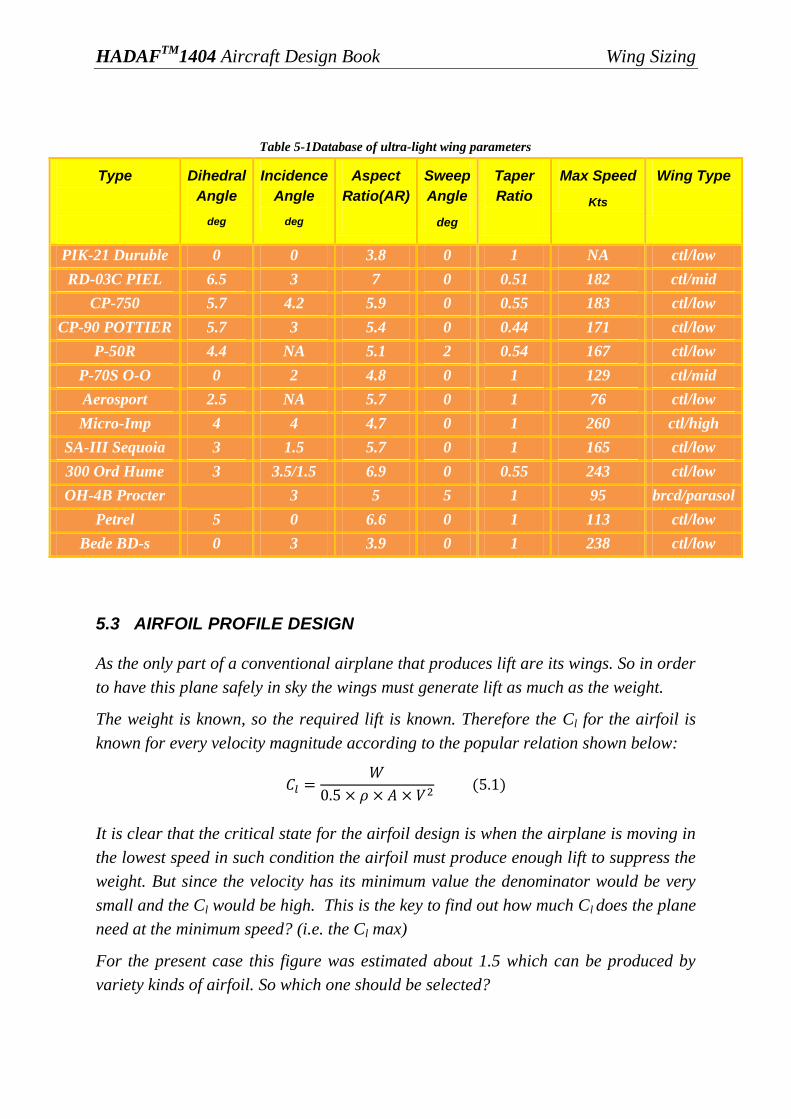
HADAFTM
1404 Aircraft Design Book Wing Sizing
Table 5-1Database of ultra-light wing parameters
Type
Dihedral
Angle
deg
Incidence
Angle
deg
Aspect
Ratio(AR)
Sweep
Angle
deg
Taper
Ratio
Max Speed
Kts
Wing Type
PIK-21 Duruble 0 0 3.8 0 1 NA ctl/low
RD-03C PIEL 6.5 3 7 0 0.51 182 ctl/mid
CP-750 5.7 4.2 5.9 0 0.55 183 ctl/low
CP-90 POTTIER 5.7 3 5.4 0 0.44 171 ctl/low
P-50R 4.4 NA 5.1 2 0.54 167 ctl/low
P-70S O-O 0 2 4.8 0 1 129 ctl/mid
Aerosport 2.5 NA 5.7 0 1 76 ctl/low
Micro-Imp 4 4 4.7 0 1 260 ctl/high
SA-III Sequoia 3 1.5 5.7 0 1 165 ctl/low
300 Ord Hume 3 3.5/1.5 6.9 0 0.55 243 ctl/low
OH-4B Procter 3 5 5 1 95 brcd/parasol
Petrel 5 0 6.6 0 1 113 ctl/low
Bede BD-s 0 3 3.9 0 1 238 ctl/low
5.3 AIRFOIL PROFILE DESIGN
As the only part of a conventional airplane that produces lift are its wings. So in order
to have this plane safely in sky the wings must generate lift as much as the weight.
The weight is known, so the required lift is known. Therefore the Cl for the airfoil is
known for every velocity magnitude according to the popular relation shown below:
It is clear that the critical state for the airfoil design is when the airplane is moving in
the lowest speed in such condition the airfoil must produce enough lift to suppress the
weight. But since the velocity has its minimum value the denominator would be very
small and the Cl would be high. This is the key to find out how much Cl does the plane
need at the minimum speed? (i.e. the Cl max)
For the present case this figure was estimated about 1.5 which can be produced by
variety kinds of airfoil. So which one should be selected?

HADAFTM
1404 Aircraft Design Book Wing Sizing
The answer is, an airfoil which produces appropriate lift at zero angle of attack is
desired. In other words if the incidence angle considered equal to zero as it is in the
present case, the airplane in the cruise condition, must produce enough lift to
overcome the weight. This is very important key point, because if the lift is more than
weight in the cruise condition the airplane would ascend and the cruise speed
decreases and also if the lift is less than weight, then the airplane would descend and
the cruise speed would increase. So the Cl of the airfoil at zero angle of attack must be
around special distinct value. This will confine the range of the airfoil which can be
selected for HADAF aircraft.
Moreover than mentioned above it need to maximize the (L/D) ratio, while not letting
the drag to expand. To do so, a new airfoil ''HADAF 1404'' by the airfoil shape
optimization method was designed. The numerical investigations show that this airfoil
has great aerodynamic behaviors but the results of the numerical analysis must be
verified with the experiment. Having finished the experimental tests the airfoil will be
introduced in details.
Design team tried to find the best airfoil from the existing databases that meets the
criteria mentioned above. Firstly NACA 4415 was tried. But as you can see in the
figure 3-1 it did not produce enough lift in the cruise condition. So, the NACA 5413,
5314, GOE 533 and NACA 5215-62was tried as next efforts. The results are given in
figure 5-1 in brief. The numerical investigations were done using commercial CFD
package, FLUENT. Some special cases were solved in order to verify our CFD
results.
Figure 5-1Sample airfoils wing lift and desired comparison
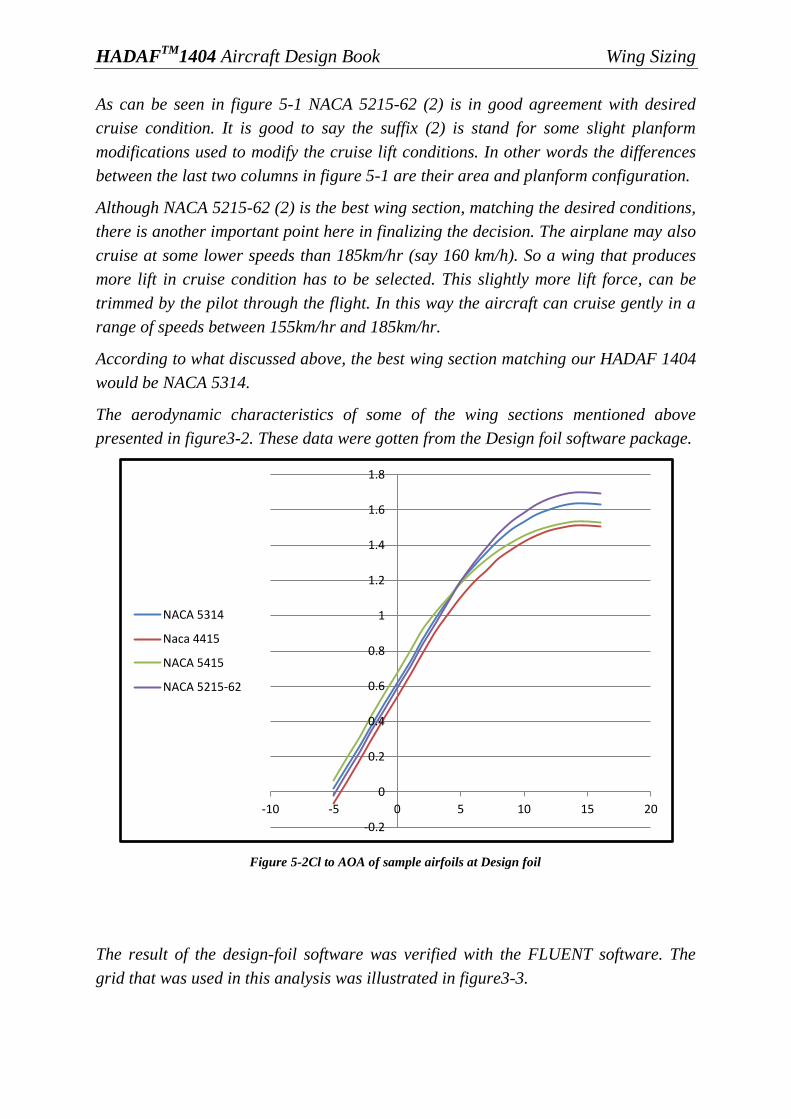
HADAFTM
1404 Aircraft Design Book Wing Sizing
As can be seen in figure 5-1 NACA 5215-62 (2) is in good agreement with desired
cruise condition. It is good to say the suffix (2) is stand for some slight planform
modifications used to modify the cruise lift conditions. In other words the differences
between the last two columns in figure 5-1 are their area and planform configuration.
Although NACA 5215-62 (2) is the best wing section, matching the desired conditions,
there is another important point here in finalizing the decision. The airplane may also
cruise at some lower speeds than 185km/hr (say 160 km/h). So a wing that produces
more lift in cruise condition has to be selected. This slightly more lift force, can be
trimmed by the pilot through the flight. In this way the aircraft can cruise gently in a
range of speeds between 155km/hr and 185km/hr.
According to what discussed above, the best wing section matching our HADAF 1404
would be NACA 5314.
The aerodynamic characteristics of some of the wing sections mentioned above
presented in figure3-2. These data were gotten from the Design foil software package.
Figure 5-2Cl to AOA of sample airfoils at Design foil
The result of the design-foil software was verified with the FLUENT software. The
grid that was used in this analysis was illustrated in figure3-3.
-0.2
0
0.2
0.4
0.6
0.8
1
1.2
1.4
1.6
1.8
-10 -5 0 5 10 15 20
NACA 5314
Naca 4415
NACA 5415
NACA 5215-62
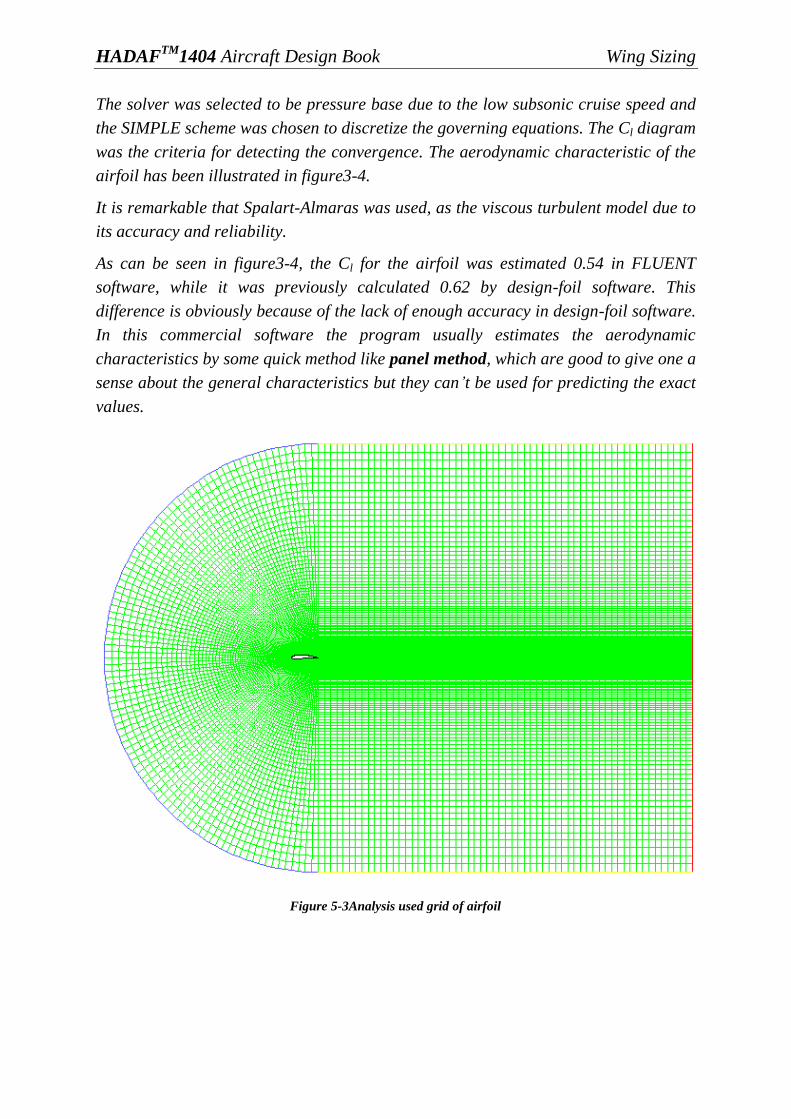
HADAFTM
1404 Aircraft Design Book Wing Sizing
The solver was selected to be pressure base due to the low subsonic cruise speed and
the SIMPLE scheme was chosen to discretize the governing equations. The Cl diagram
was the criteria for detecting the convergence. The aerodynamic characteristic of the
airfoil has been illustrated in figure3-4.
It is remarkable that Spalart-Almaras was used, as the viscous turbulent model due to
its accuracy and reliability.
As can be seen in figure3-4, the Cl for the airfoil was estimated 0.54 in FLUENT
software, while it was previously calculated 0.62 by design-foil software. This
difference is obviously because of the lack of enough accuracy in design-foil software.
In this commercial software the program usually estimates the aerodynamic
characteristics by some quick method like panel method, which are good to give one a
sense about the general characteristics but they can‟t be used for predicting the exact
values.
Figure 5-3Analysis used grid of airfoil
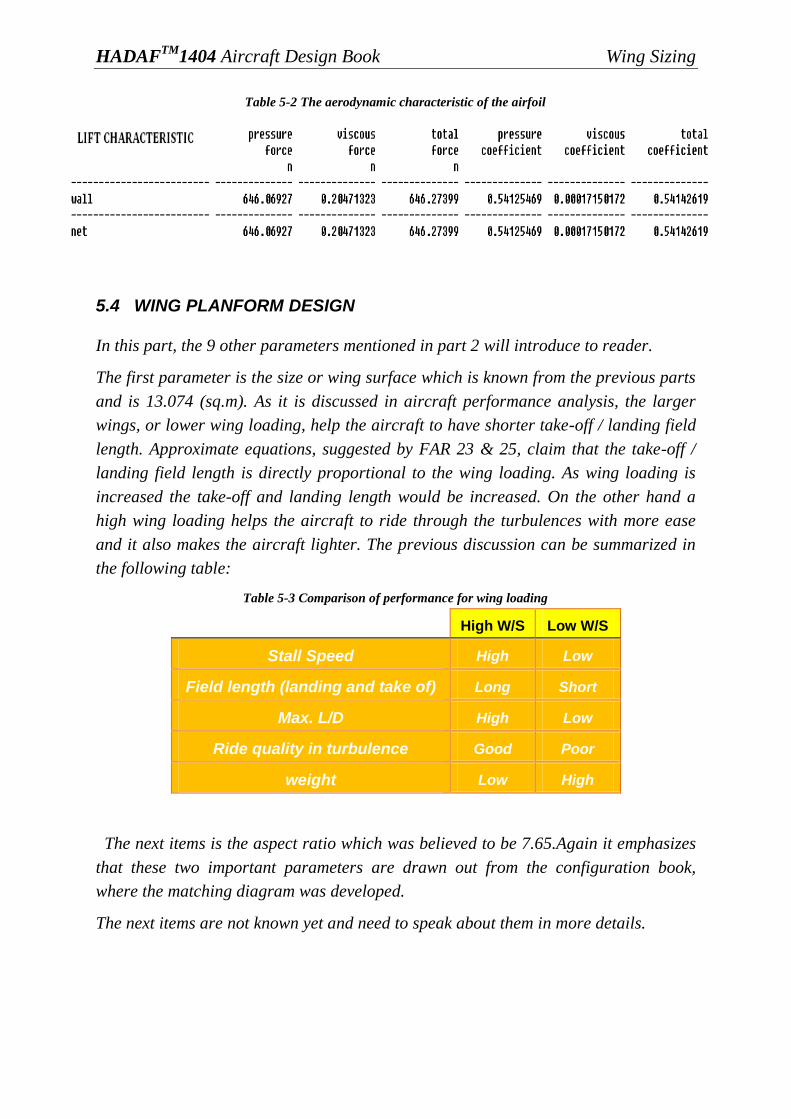
HADAFTM
1404 Aircraft Design Book Wing Sizing
Table 5-2 The aerodynamic characteristic of the airfoil
5.4 WING PLANFORM DESIGN
In this part, the 9 other parameters mentioned in part 2 will introduce to reader.
The first parameter is the size or wing surface which is known from the previous parts
and is 13.074 (sq.m). As it is discussed in aircraft performance analysis, the larger
wings, or lower wing loading, help the aircraft to have shorter take-off / landing field
length. Approximate equations, suggested by FAR 23 & 25, claim that the take-off /
landing field length is directly proportional to the wing loading. As wing loading is
increased the take-off and landing length would be increased. On the other hand a
high wing loading helps the aircraft to ride through the turbulences with more ease
and it also makes the aircraft lighter. The previous discussion can be summarized in
the following table:
Table 5-3 Comparison of performance for wing loading
High W/S Low W/S
Stall Speed High Low
Field length (landing and take of) Long Short
Max. L/D High Low
Ride quality in turbulence Good Poor
weight Low High
The next items is the aspect ratio which was believed to be 7.65.Again it emphasizes
that these two important parameters are drawn out from the configuration book,
where the matching diagram was developed.
The next items are not known yet and need to speak about them in more details.

HADAFTM
1404 Aircraft Design Book Wing Sizing
5.4.1 SWEEPANGLE
Generally speaking, these are the options for the sweep angle:
Zero or negligible sweep angle
Aft sweep ( also called : positive sweep)
Forward sweep (also called: negative sweep)
Variable sweep
Oblique sweep
The last two alternatives are suitable for the flight missions involve cruising in broad
range of the Mach numbers and for high "g" maneuvering. In the variable sweep
configuration a big weight penalty exists, due to the high weight wing pivot structures
which are necessary for altering the sweep angle.
The sweep angle helps us mostly in high Mach numbers especially in the transonic
regimes. But how?
When the wing has a sweep angle, the free stream velocity coming toward the leading
edge, decomposes into two components. One is tangent to the wing and the other is
normal. The normal component is the velocity vector which determines the critical
Mach number. So, the critical Mach number increases. This means that the airplane
can navigate faster than the speed of sound while the flow regime on the wings is
subsonic. The tangential component flows along the wing span. This flow is called the
span-wise flow.
Taking a glance at the database, it is obvious that nearly no U.L. aircraft has been
designed with the swept back or forward wings. This is mainly due to the low Mach
number in their flight regime. Considering that swept wings helps us in the mach
numbers greater than 0.5, especially in the transonic flows; it was concluded that a
swept wing for an U.L. with the cruise Mach 0.1 is somehow wasting money and
energy.
In the case of the sweep aft wings, in low Reynolds numbers(as in this case) the
boundary layer growth is enhanced and this growing boundary layer tends to
approach the wing tip in the aft swept wings because the span-wise flow, moves from
root to chord in sweep back wings. The wing tip is a crucial section and the ailerons
are positioned there. So boundary layer growth in this zone can be very harmful and
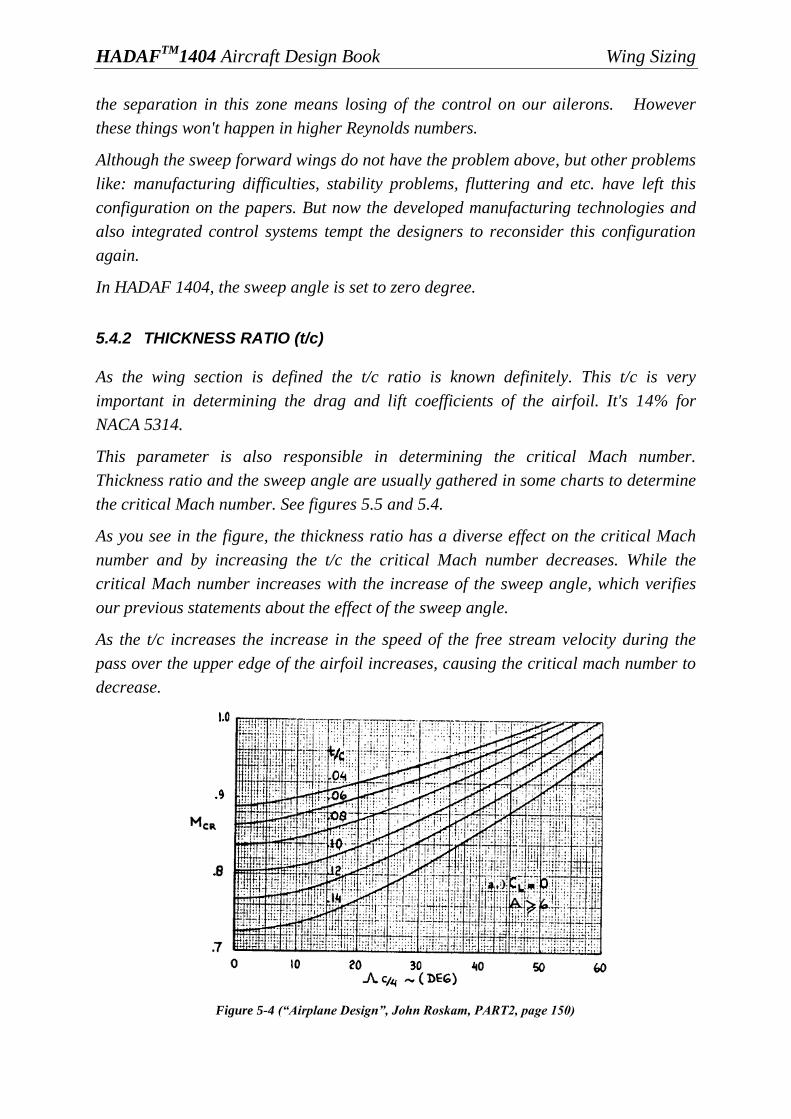
HADAFTM
1404 Aircraft Design Book Wing Sizing
the separation in this zone means losing of the control on our ailerons. However
these things won't happen in higher Reynolds numbers.
Although the sweep forward wings do not have the problem above, but other problems
like: manufacturing difficulties, stability problems, fluttering and etc. have left this
configuration on the papers. But now the developed manufacturing technologies and
also integrated control systems tempt the designers to reconsider this configuration
again.
In HADAF 1404, the sweep angle is set to zero degree.
5.4.2 THICKNESS RATIO (t/c)
As the wing section is defined the t/c ratio is known definitely. This t/c is very
important in determining the drag and lift coefficients of the airfoil. It's 14% for
NACA 5314.
This parameter is also responsible in determining the critical Mach number.
Thickness ratio and the sweep angle are usually gathered in some charts to determine
the critical Mach number. See figures 5.5 and 5.4.
As you see in the figure, the thickness ratio has a diverse effect on the critical Mach
number and by increasing the t/c the critical Mach number decreases. While the
critical Mach number increases with the increase of the sweep angle, which verifies
our previous statements about the effect of the sweep angle.
As the t/c increases the increase in the speed of the free stream velocity during the
pass over the upper edge of the airfoil increases, causing the critical mach number to
decrease.
Figure 5-4 (“AirplaneDesign”,JohnRoskam,PART2,page150)

HADAFTM
1404 Aircraft Design Book Wing Sizing
Figure 5-5 (“AirplaneDesign”,JohnRoskam,PART2, page 150)
5.4.3 TAPER RATIO
Taper ratio is the ratio of the wing tip chord over the wing root chord as illustrated
below.
Figure 5-6Tip and root cord layout
CordRoot
CordTip (5.2)
The effect of the taper ratio is smoothing the variations of the lift along the span. The
elliptic wing as an ideal wing can produce a constant lift along the span, while a
rectangular wing loses lift along the span in the way that at the tip does not produce
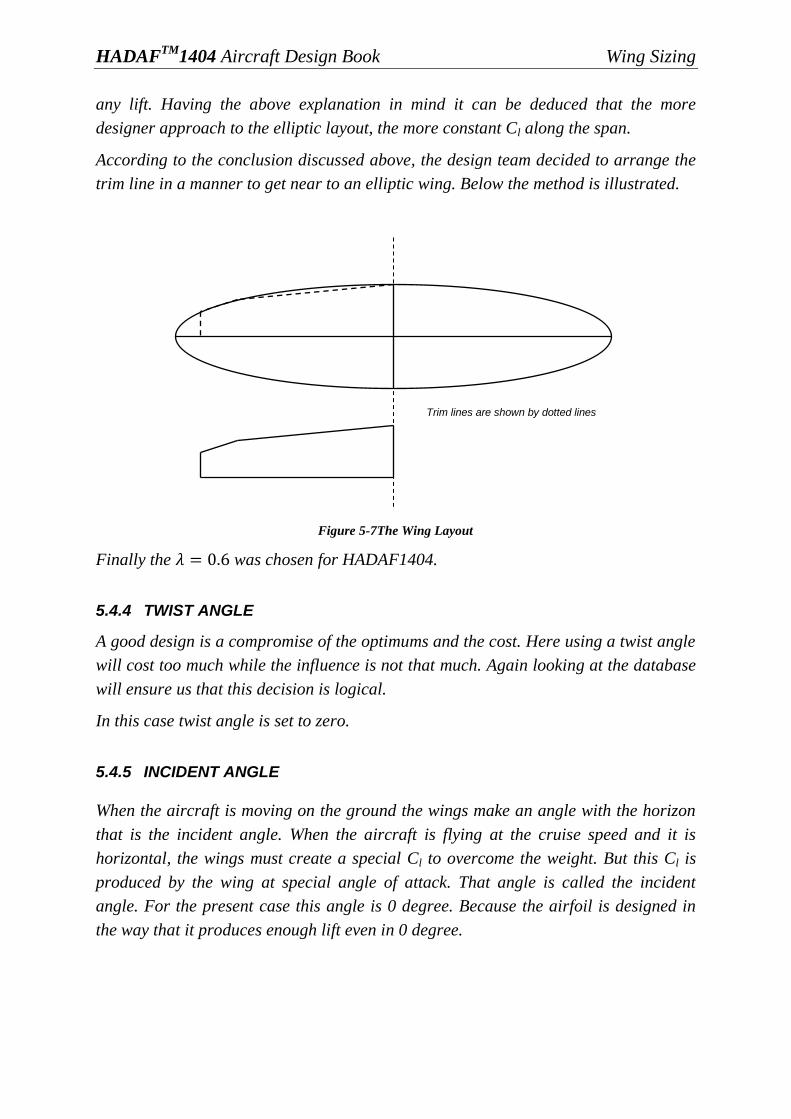
HADAFTM
1404 Aircraft Design Book Wing Sizing
any lift. Having the above explanation in mind it can be deduced that the more
designer approach to the elliptic layout, the more constant Cl along the span.
According to the conclusion discussed above, the design team decided to arrange the
trim line in a manner to get near to an elliptic wing. Below the method is illustrated.
Figure 5-7The Wing Layout
Finally the was chosen for HADAF1404.
5.4.4 TWIST ANGLE
A good design is a compromise of the optimums and the cost. Here using a twist angle
will cost too much while the influence is not that much. Again looking at the database
will ensure us that this decision is logical.
In this case twist angle is set to zero.
5.4.5 INCIDENT ANGLE
When the aircraft is moving on the ground the wings make an angle with the horizon
that is the incident angle. When the aircraft is flying at the cruise speed and it is
horizontal, the wings must create a special Cl to overcome the weight. But this Cl is
produced by the wing at special angle of attack. That angle is called the incident
angle. For the present case this angle is 0 degree. Because the airfoil is designed in
the way that it produces enough lift even in 0 degree.
Trim lines are shown by dotted lines

HADAFTM
1404 Aircraft Design Book Wing Sizing
5.4.6 DIHEDRAL ANGLE
The dihedral angle is shown in the picture below. This angle will have a good
influence in the aircraft roll equilibrium. Generally speaking, this angle is essential to
guarantee the roll stability in low wing aircrafts, but it is also used in high-wing
configurations as a stability booster. In these cases the stability increases in expense
of increase in rolling radius. In the next picture you can see how the dihedral angle
enhances the aircraft equilibrium.
Figure 5-8Dihedral Angle
Figure 5-9Exaggerated Dihedral Angle
In this project, HADAF 1404, the dihedral angle was set to be 2 degree.
5.4.7 Wing test:
At this point the wing cross-section and its planform have designed. But the question
is: How reliable the wings are? Do they really keep the aircraft in the air? How much
drag do they produce?
To answer the questions above, there were two choices: one is to test the wing
prototype in a wind tunnel and the second solution is numerical modeling. The
numerical investigation method due to its inexpensiveness and the ease of it was
chosen. The wings were modeled in a rectangular domain and were exported into the
FLUENT software. The grid is illustrated in figure5.10.
In the figure4-7-1you can see the section view of the grid in the Z direction and
similarly in figure 4-7-2 a section view in the X direction was shown. In figure4-7-3
the whole geometry and the grid was shown.
The lift forces cancel each
other
The lift forces on the right wing keen to
cancel the roll
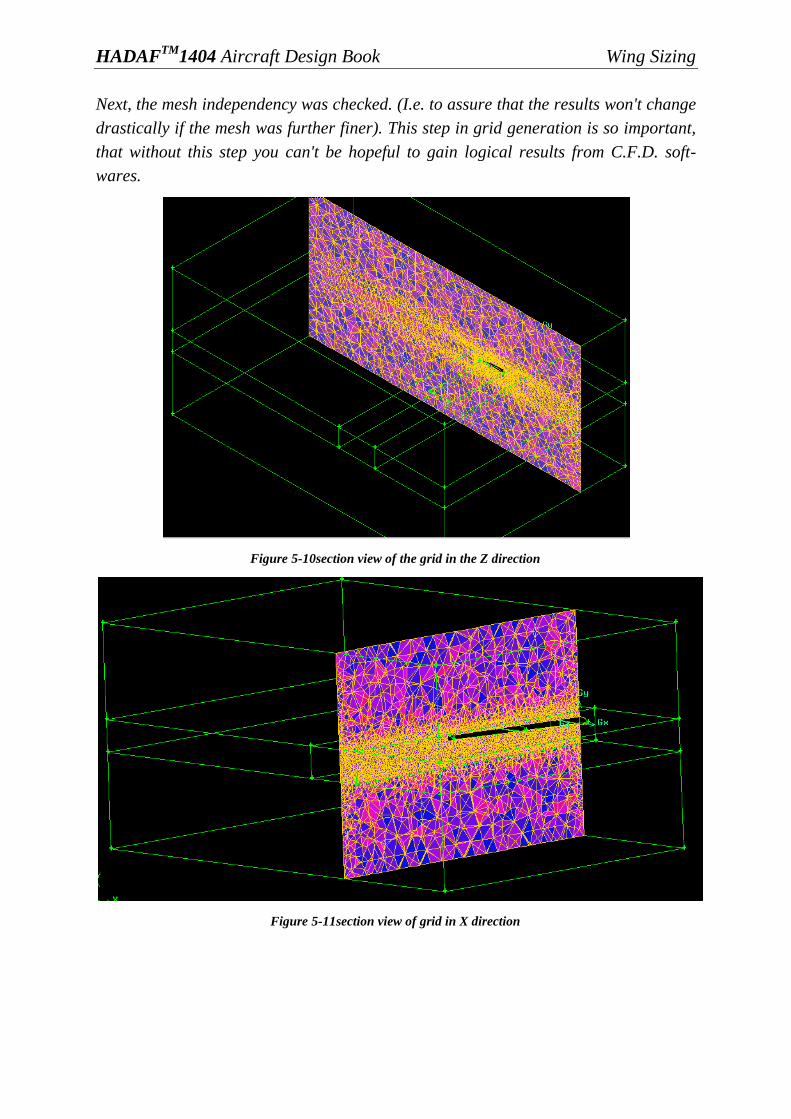
HADAFTM
1404 Aircraft Design Book Wing Sizing
Next, the mesh independency was checked. (I.e. to assure that the results won't change
drastically if the mesh was further finer). This step in grid generation is so important,
that without this step you can't be hopeful to gain logical results from C.F.D. soft-
wares.
Figure 5-10section view of the grid in the Z direction
Figure 5-11section view of grid in X direction
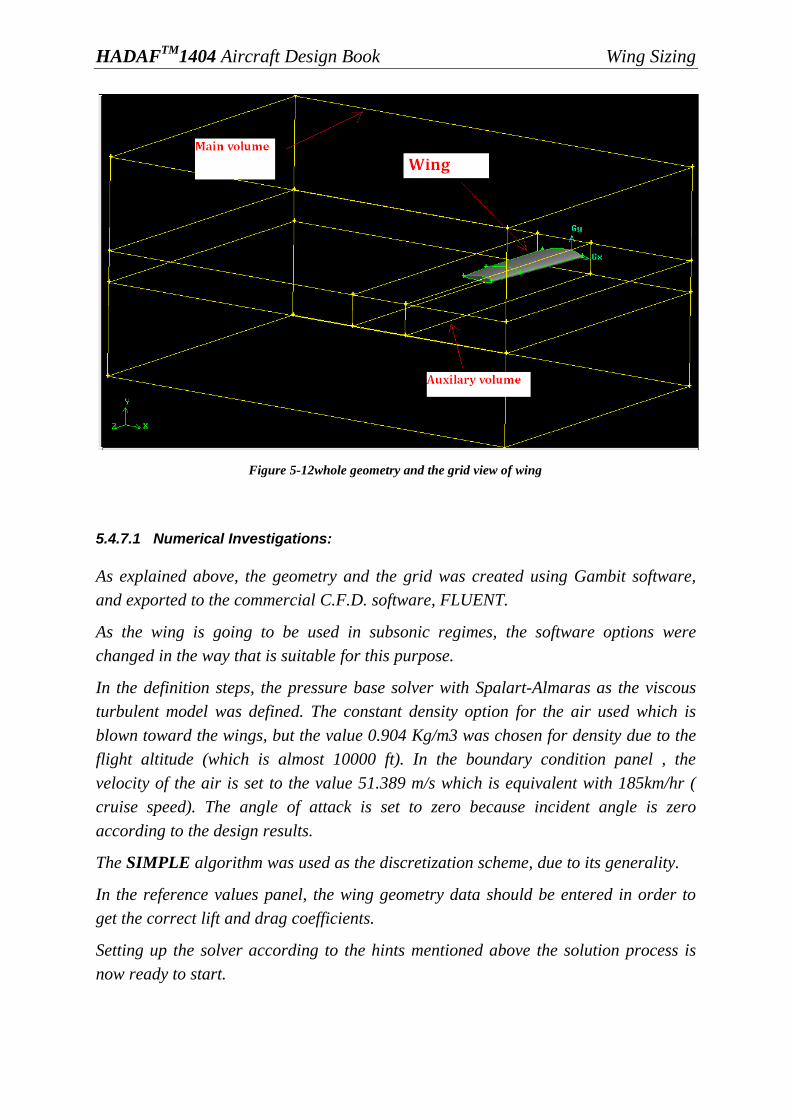
HADAFTM
1404 Aircraft Design Book Wing Sizing
Figure 5-12whole geometry and the grid view of wing
5.4.7.1 Numerical Investigations:
As explained above, the geometry and the grid was created using Gambit software,
and exported to the commercial C.F.D. software, FLUENT.
As the wing is going to be used in subsonic regimes, the software options were
changed in the way that is suitable for this purpose.
In the definition steps, the pressure base solver with Spalart-Almaras as the viscous
turbulent model was defined. The constant density option for the air used which is
blown toward the wings, but the value 0.904 Kg/m3 was chosen for density due to the
flight altitude (which is almost 10000 ft). In the boundary condition panel , the
velocity of the air is set to the value 51.389 m/s which is equivalent with 185km/hr (
cruise speed). The angle of attack is set to zero because incident angle is zero
according to the design results.
The SIMPLE algorithm was used as the discretization scheme, due to its generality.
In the reference values panel, the wing geometry data should be entered in order to
get the correct lift and drag coefficients.
Setting up the solver according to the hints mentioned above the solution process is
now ready to start.
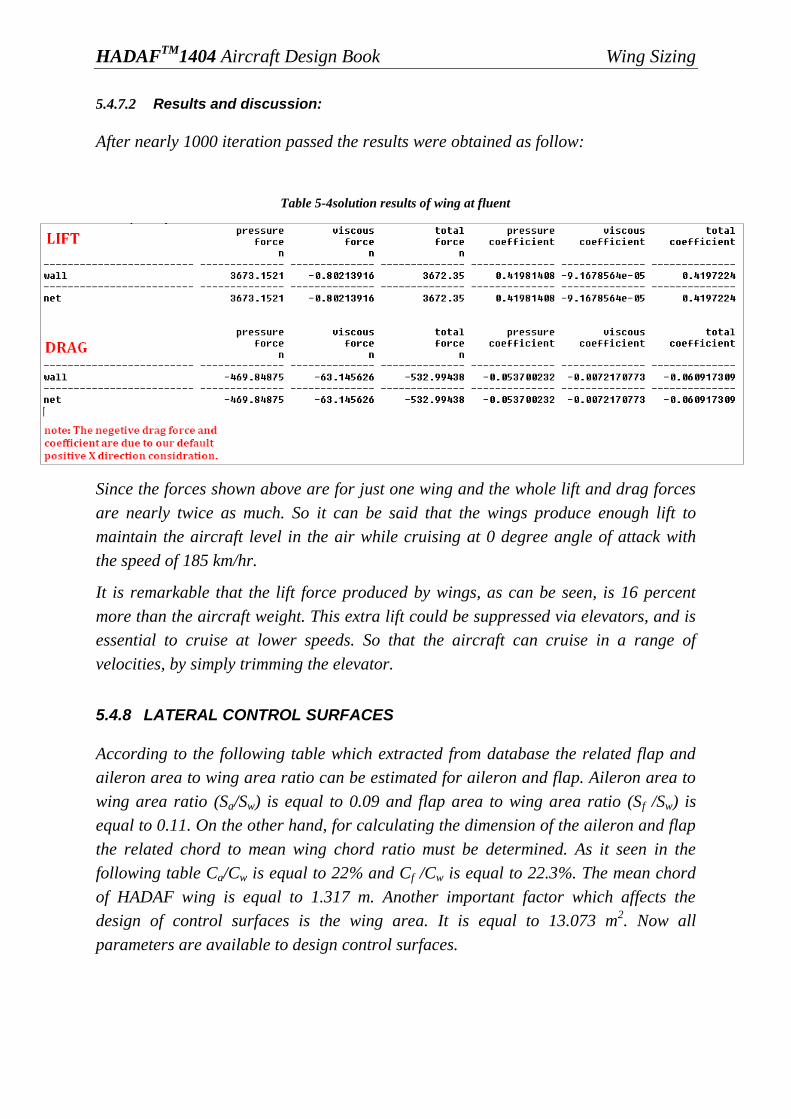
HADAFTM
1404 Aircraft Design Book Wing Sizing
5 .4 .7 .2 Results and discussion:
After nearly 1000 iteration passed the results were obtained as follow:
Table 5-4solution results of wing at fluent
Since the forces shown above are for just one wing and the whole lift and drag forces
are nearly twice as much. So it can be said that the wings produce enough lift to
maintain the aircraft level in the air while cruising at 0 degree angle of attack with
the speed of 185 km/hr.
It is remarkable that the lift force produced by wings, as can be seen, is 16 percent
more than the aircraft weight. This extra lift could be suppressed via elevators, and is
essential to cruise at lower speeds. So that the aircraft can cruise in a range of
velocities, by simply trimming the elevator.
5.4.8 LATERAL CONTROL SURFACES
According to the following table which extracted from database the related flap and
aileron area to wing area ratio can be estimated for aileron and flap. Aileron area to
wing area ratio (Sa/Sw) is equal to 0.09 and flap area to wing area ratio (Sf /Sw) is
equal to 0.11. On the other hand, for calculating the dimension of the aileron and flap
the related chord to mean wing chord ratio must be determined. As it seen in the
following table Ca/Cw is equal to 22% and Cf /Cw is equal to 22.3%. The mean chord
of HADAF wing is equal to 1.317 m. Another important factor which affects the
design of control surfaces is the wing area. It is equal to 13.073 m2. Now all
parameters are available to design control surfaces.

HADAFTM
1404 Aircraft Design Book Wing Sizing
Table 5-5Database of lateral control surfaces parameters
Sa/Sw Sf/Sw Ca/Cw Cf/Cw
CTSW 0.081777 0.128984 21.50113 21.50113
dynamic 0.061648 0.140686
Jabiru 170 0.059266 0.141359 20.74127 20.74127
pioneer 200 0.134182 0.146072 28.01959 28.01959
Rambo 0.080054 0.080054 16.76621 16.76621
sport cruiser 0.091938 0.082014 18.44568 15.96967
Tecnam 0.104255 0.116092 21.91037 21.91037
Zodiac 0.111784 0.111784 28.54085 28.54085
AVERAGE 0.090613 0.118381 22.27501 21.9213
Finally the geometry of wing with control surfaces is as below:
Figure 5-13wing geometry with control
HADAFTM
1404 Aircraft Design Book Wing Sizing
5.4.9 VERIFYING CLEAN AIRPLANE MAXIMUM LIFT COEFFICIENT
AND SIZING THE HIGH LIFT DEVICES
The scope of this section is to present a methodology for determining:
1- Whether or not the wing geometry selected before is consistent with the required
value of clean airplane
2- Verifying the type and size of high lift devices, determined in section 4-8.
5.4.9.1 VERIFYING THE MAXIMUM CLEAN LIFT COEFFICIENT
During the past sections the following parameters have been derived:
Clean : =1.4
Take-off : =1.6
Landing : =1.7
The lift coefficient, produced by wing planform, , must be consistent with the
required value of clean airplane Roskam suggests that:
It It should be noted that, the subscript L is devoted to the wing, while l is selected for
a 2d airfoil. The coefficient was suggested to be 1.05, for long-coupled aircrafts and
1.1, for short-coupled aircrafts. Roskam defines long-coupled and short-coupled
aircrafts as follows:
Short-coupled: if Lh/C < 3.0
Long-coupled: if Lh/C < 5.0
Since HADAF 1404, is a short coupled aircraft, the value of 1.1 is selected. This
coefficient, actually takes the trim effect into account. So, the value of , which is
required, is 1.54. In calculating this value, the
, considered to be 1.4.
To verify whether or not the wing can produce its required value of , the
following approximation may be used:
(
)
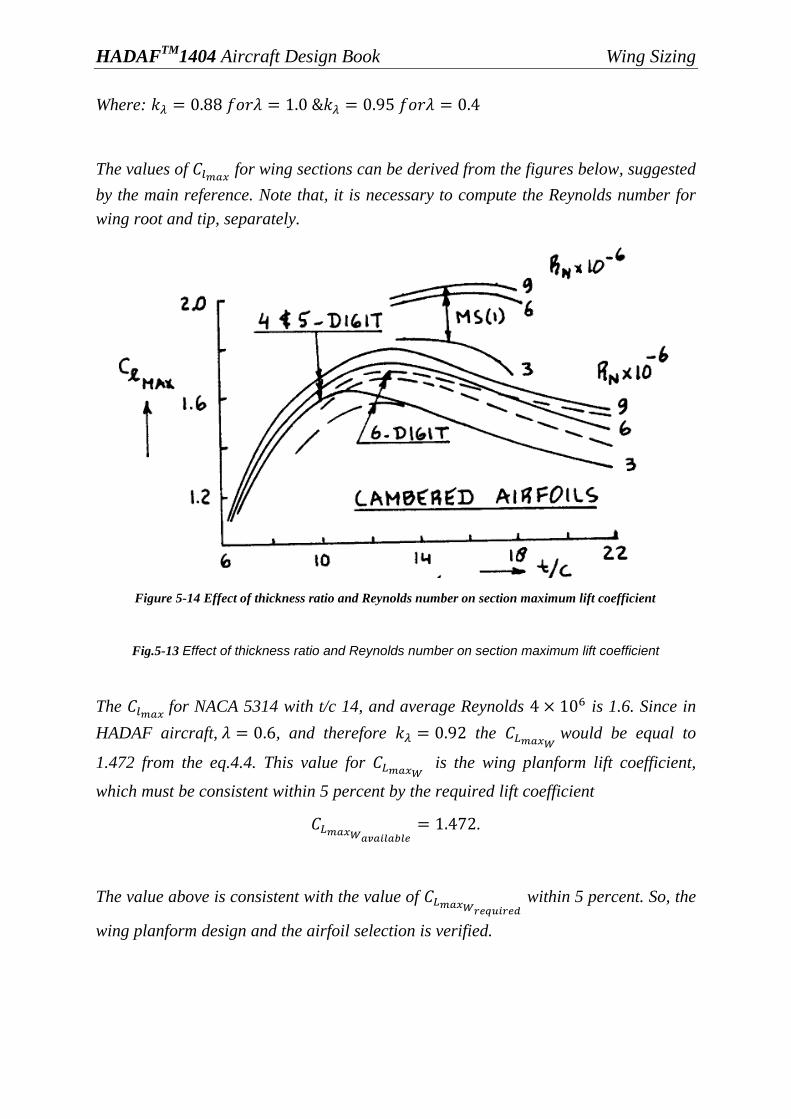
HADAFTM
1404 Aircraft Design Book Wing Sizing
Where:
The values of for wing sections can be derived from the figures below, suggested
by the main reference. Note that, it is necessary to compute the Reynolds number for
wing root and tip, separately.
Figure 5-14 Effect of thickness ratio and Reynolds number on section maximum lift coefficient
Fig.5-13 Effect of thickness ratio and Reynolds number on section maximum lift coefficient
The for NACA 5314 with t/c 14, and average Reynolds is 1.6. Since in
HADAF aircraft, , and therefore the would be equal to
1.472 from the eq.4.4. This value for is the wing planform lift coefficient,
which must be consistent within 5 percent by the required lift coefficient
.
The value above is consistent with the value of within 5 percent. So, the
wing planform design and the airfoil selection is verified.

HADAFTM
1404 Aircraft Design Book Wing Sizing
5.4.9.2 High lift devices design verification
The next step is to determine the maximum lift coefficient increment, which is
produced by high lift devices.
Take-off: (
)
Landing: (
)
The factor 1.05 in the above equations, is for accounting the additional trim penalties
incurred by the use of flaps.
When the flaps are down, the incremental section coefficient can be found as:
(
)
Where is defined in figure 5.14and where is found from:
(
)
Figure 5-15Definition of flapped wing area
The factor accounts for the effect of sweep angle. The sweep angle in HADAF
aircraft is assumed to be 0 degree. For straight, tapered wings the ratio can be
computed from:

HADAFTM
1404 Aircraft Design Book Wing Sizing
Where the span stations and are defined in fig. 5.14 The incremental section lift
coefficient due to flaps, is related to its counterpart , as defined in figure
5.15.
In preliminary design, it is conservative to use:
(
)
Figure 5-16Relationbetween∆Cl and∆Cl,maxL
Where the factor k is found from figure 5.17, the magnitude of incremental section lift
coefficient due to flaps, depends on the following factors:
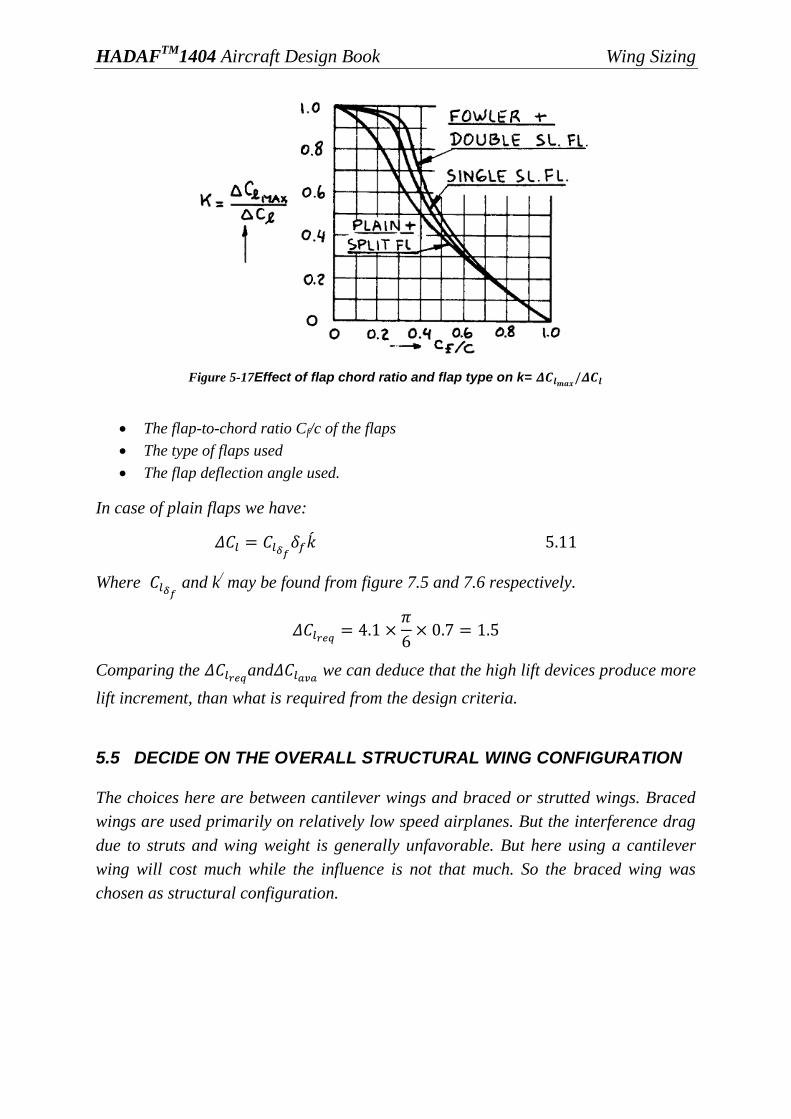
HADAFTM
1404 Aircraft Design Book Wing Sizing
Figure 5-17Effect of flap chord ratio and flap type on k=
The flap-to-chord ratio Cf/c of the flaps
The type of flaps used
The flap deflection angle used.
In case of plain flaps we have:
Where and k
/ may be found from figure 7.5 and 7.6 respectively.
Comparing the and
we can deduce that the high lift devices produce more
lift increment, than what is required from the design criteria.
5.5 DECIDE ON THE OVERALL STRUCTURAL WING CONFIGURATION
The choices here are between cantilever wings and braced or strutted wings. Braced
wings are used primarily on relatively low speed airplanes. But the interference drag
due to struts and wing weight is generally unfavorable. But here using a cantilever
wing will cost much while the influence is not that much. So the braced wing was
chosen as structural configuration.

HADAFTM
1404 Aircraft Design Book Wing Sizing
5.6 COMPUTE THE WING FUEL VOLUME
It will be assumed here that the wing fuel is carried in what called a 'wet wing' which
means there are no separate fuel tanks.
Torenbeek suggest the following equation for estimating wing fuel volume in
preliminary design:
rtW
WWWWWrWF
ctct
ctbSV
)//()/(
})1/()1{()/)(/(54.0 225.02
litVWF 109
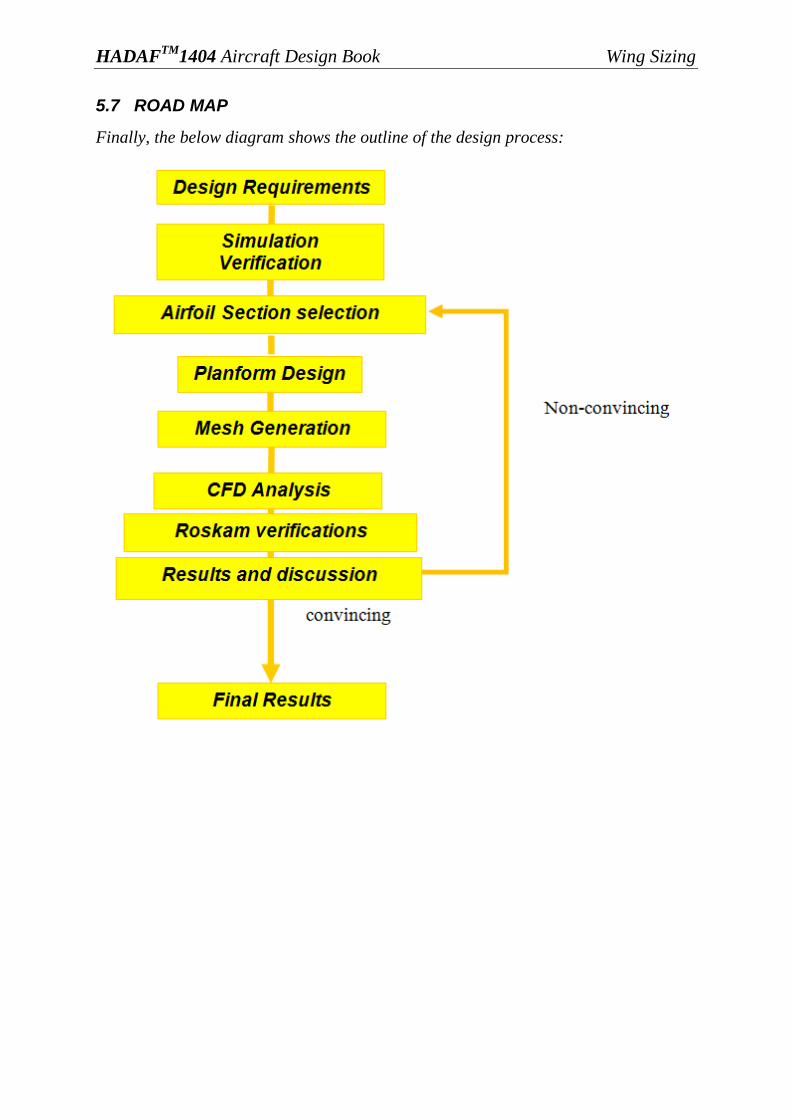
HADAFTM
1404 Aircraft Design Book Wing Sizing
5.7 ROAD MAP
Finally, the below diagram shows the outline of the design process:

HADAFTM
1404 Aircraft Design Book Wing Sizing
5.8 References:
1. Airplane design by: Dr. Jan Roskam: part .2
2. Introduction to Aerodynamics by:Dr. Anderson
3. Aerodynamics for engineers by: Bertin
4. Wing modeling tutorials
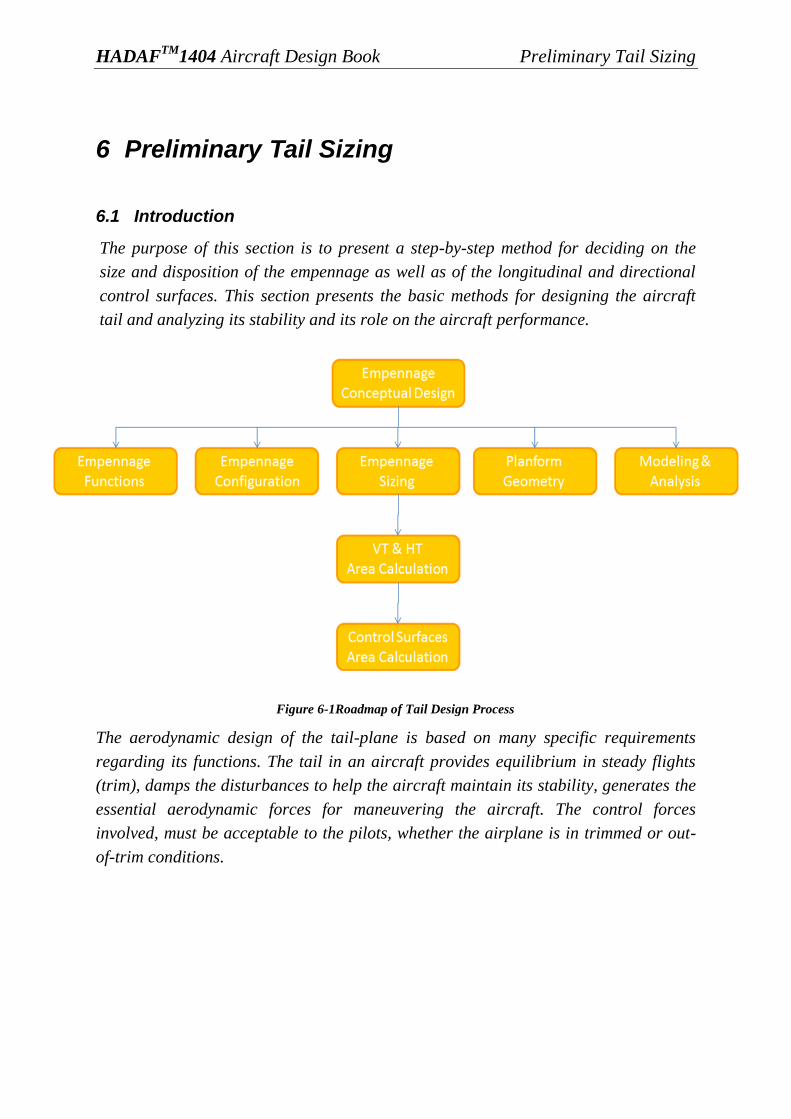
HADAFTM
1404 Aircraft Design Book Preliminary Tail Sizing
6 Preliminary Tail Sizing
6.1 Introduction
The purpose of this section is to present a step-by-step method for deciding on the
size and disposition of the empennage as well as of the longitudinal and directional
control surfaces. This section presents the basic methods for designing the aircraft
tail and analyzing its stability and its role on the aircraft performance.
Figure 6-1Roadmap of Tail Design Process
The aerodynamic design of the tail-plane is based on many specific requirements
regarding its functions. The tail in an aircraft provides equilibrium in steady flights
(trim), damps the disturbances to help the aircraft maintain its stability, generates the
essential aerodynamic forces for maneuvering the aircraft. The control forces
involved, must be acceptable to the pilots, whether the airplane is in trimmed or out-
of-trim conditions.

HADAFTM
1404 Aircraft Design Book Preliminary Tail Sizing
6.2 Empennage Functions
In fact, tails are little wings. Many of the previous discussions, concerning wings, can
also be applied to tail surfaces. The major difference between a wing and a tail is
that, while the wing is designed to operate normally at only a fraction of its lift
potential. Any time in flight that a tail comes close to its maximum lift potential, and
hence its stall angle, something is very wrong!
Tail provides trim, stability, and control to the aircraft. Trim refers to the generation
of a lift force that, by acting through some tail moment arm about the center of
gravity, balances some other moment produced by the aircraft.
The other major function of the tail is control. The tail must be sized in the way that
provides adequate control power at all critical conditions. These critical conditions
for the horizontal tail or canard typically include nose-wheel liftoff, low-speed flight
with flaps down, and transonic maneuvering. For the vertical tail, critical conditions
typically include engine-out flight at low speeds, maximum roll rate, and spin
recovery.
It must be noted that control power depends upon the size and type of the moving
surfaces as well as the overall size of the tail itself. For example, several airlines use
double-hinged rudders to provide more engine-out control power without increasing
the size of the vertical tail beyond what is required for dutch-roll damping.
The aircraft stability and control requirements are usually considered in three flight
regimes. Roll response (motion about the x axis) is conventionally provided by
ailerons but for some aircraft's layouts this is not feasible so differential motion of the
horizontal tail-plane is used. The pitch response, often termed longitudinal stability
(motion about the y axis), dictates the size of horizontal stabilizers (conventional tail,
or canard, or both!). The yaw and sideslip response, termed lateral stability (motion
about the z axis), dictates the vertical stabilizers.
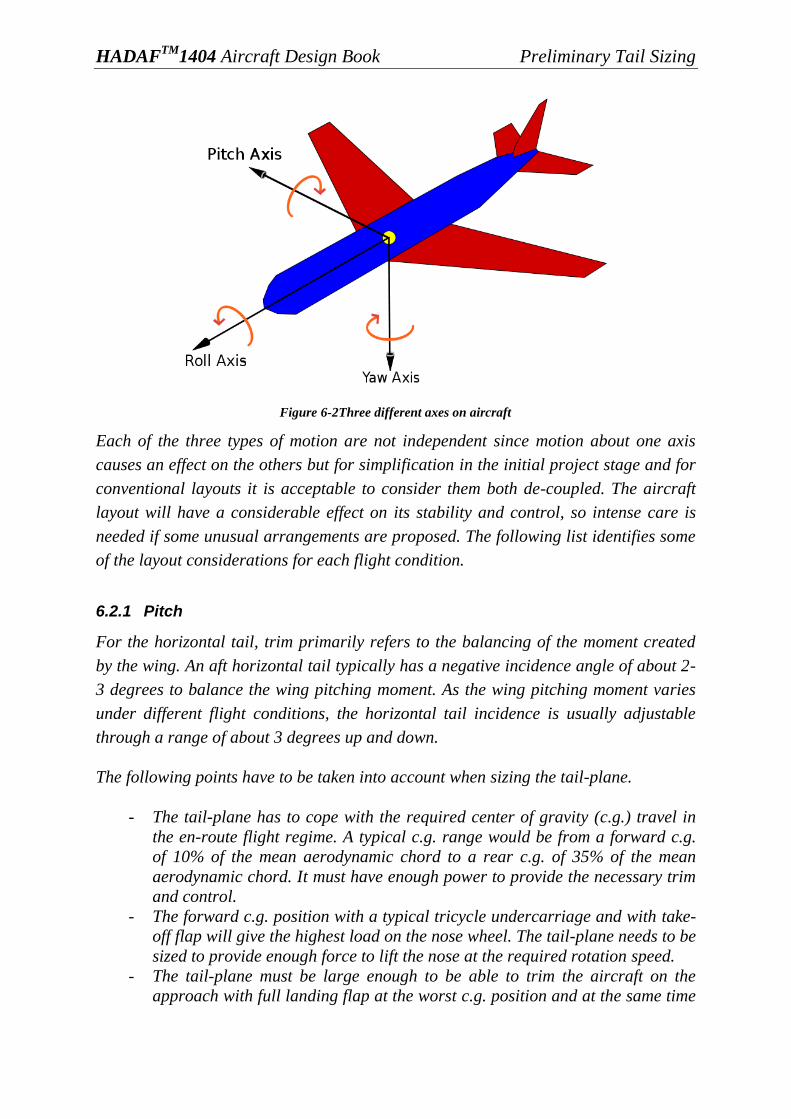
HADAFTM
1404 Aircraft Design Book Preliminary Tail Sizing
Figure 6-2Three different axes on aircraft
Each of the three types of motion are not independent since motion about one axis
causes an effect on the others but for simplification in the initial project stage and for
conventional layouts it is acceptable to consider them both de-coupled. The aircraft
layout will have a considerable effect on its stability and control, so intense care is
needed if some unusual arrangements are proposed. The following list identifies some
of the layout considerations for each flight condition.
6.2.1 Pitch
For the horizontal tail, trim primarily refers to the balancing of the moment created
by the wing. An aft horizontal tail typically has a negative incidence angle of about 2-
3 degrees to balance the wing pitching moment. As the wing pitching moment varies
under different flight conditions, the horizontal tail incidence is usually adjustable
through a range of about 3 degrees up and down.
The following points have to be taken into account when sizing the tail-plane.
- The tail-plane has to cope with the required center of gravity (c.g.) travel in
the en-route flight regime. A typical c.g. range would be from a forward c.g.
of 10% of the mean aerodynamic chord to a rear c.g. of 35% of the mean
aerodynamic chord. It must have enough power to provide the necessary trim
and control.
- The forward c.g. position with a typical tricycle undercarriage and with take-
off flap will give the highest load on the nose wheel. The tail-plane needs to be
sized to provide enough force to lift the nose at the required rotation speed.
- The tail-plane must be large enough to be able to trim the aircraft on the
approach with full landing flap at the worst c.g. position and at the same time
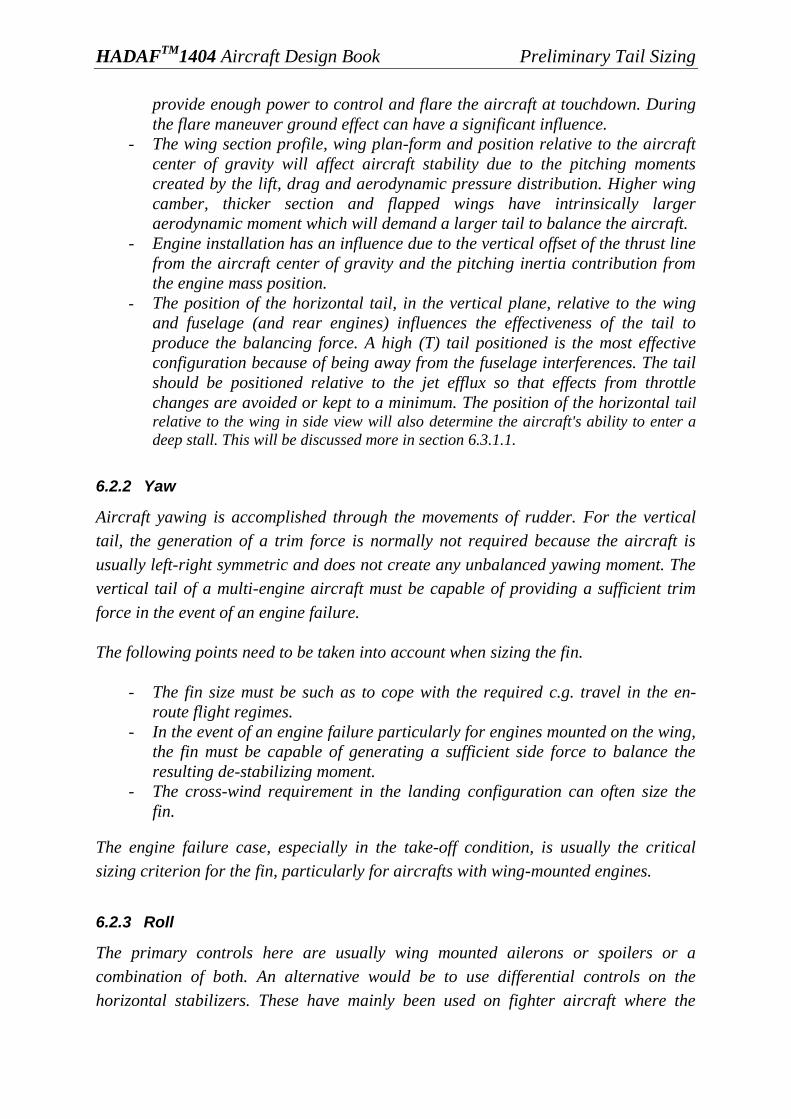
HADAFTM
1404 Aircraft Design Book Preliminary Tail Sizing
provide enough power to control and flare the aircraft at touchdown. During
the flare maneuver ground effect can have a significant influence.
- The wing section profile, wing plan-form and position relative to the aircraft
center of gravity will affect aircraft stability due to the pitching moments
created by the lift, drag and aerodynamic pressure distribution. Higher wing
camber, thicker section and flapped wings have intrinsically larger
aerodynamic moment which will demand a larger tail to balance the aircraft.
- Engine installation has an influence due to the vertical offset of the thrust line
from the aircraft center of gravity and the pitching inertia contribution from
the engine mass position.
- The position of the horizontal tail, in the vertical plane, relative to the wing
and fuselage (and rear engines) influences the effectiveness of the tail to
produce the balancing force. A high (T) tail positioned is the most effective
configuration because of being away from the fuselage interferences. The tail
should be positioned relative to the jet efflux so that effects from throttle
changes are avoided or kept to a minimum. The position of the horizontal tail
relative to the wing in side view will also determine the aircraft's ability to enter a
deep stall. This will be discussed more in section 6.3.1.1.
6.2.2 Yaw
Aircraft yawing is accomplished through the movements of rudder. For the vertical
tail, the generation of a trim force is normally not required because the aircraft is
usually left-right symmetric and does not create any unbalanced yawing moment. The
vertical tail of a multi-engine aircraft must be capable of providing a sufficient trim
force in the event of an engine failure.
The following points need to be taken into account when sizing the fin.
- The fin size must be such as to cope with the required c.g. travel in the en-
route flight regimes.
- In the event of an engine failure particularly for engines mounted on the wing,
the fin must be capable of generating a sufficient side force to balance the
resulting de-stabilizing moment.
- The cross-wind requirement in the landing configuration can often size the
fin.
The engine failure case, especially in the take-off condition, is usually the critical
sizing criterion for the fin, particularly for aircrafts with wing-mounted engines.
6.2.3 Roll
The primary controls here are usually wing mounted ailerons or spoilers or a
combination of both. An alternative would be to use differential controls on the
horizontal stabilizers. These have mainly been used on fighter aircraft where the
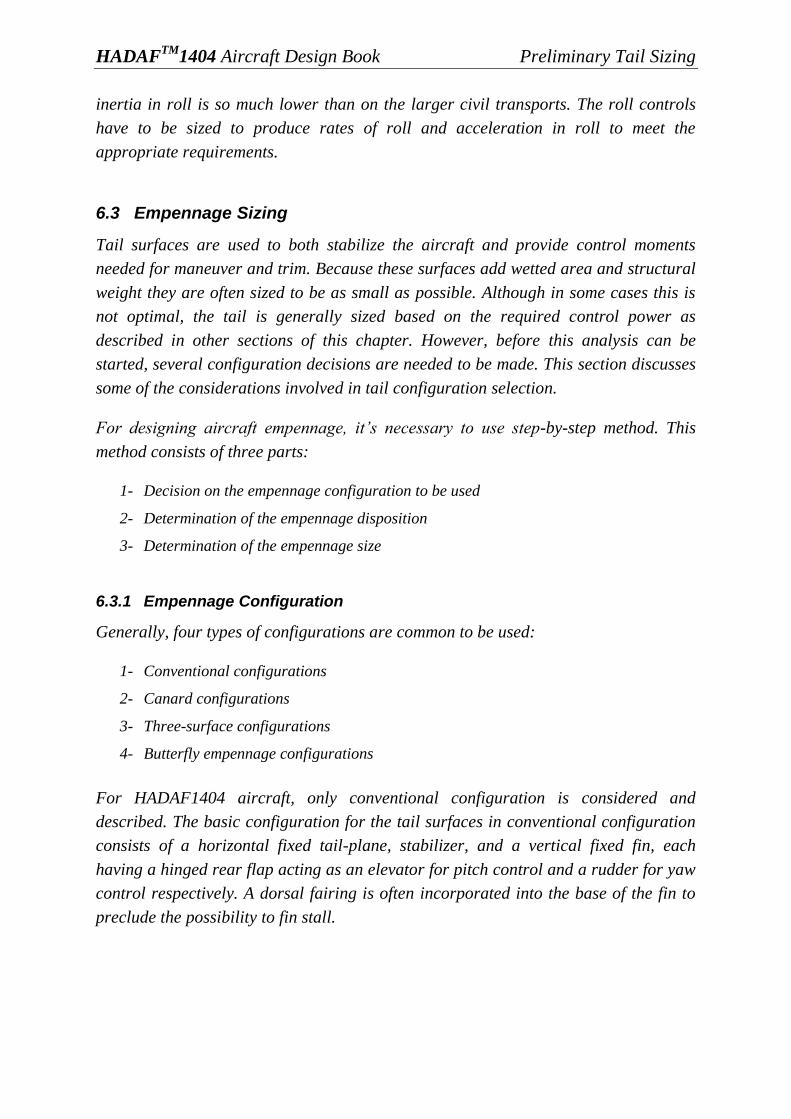
HADAFTM
1404 Aircraft Design Book Preliminary Tail Sizing
inertia in roll is so much lower than on the larger civil transports. The roll controls
have to be sized to produce rates of roll and acceleration in roll to meet the
appropriate requirements.
6.3 Empennage Sizing
Tail surfaces are used to both stabilize the aircraft and provide control moments
needed for maneuver and trim. Because these surfaces add wetted area and structural
weight they are often sized to be as small as possible. Although in some cases this is
not optimal, the tail is generally sized based on the required control power as
described in other sections of this chapter. However, before this analysis can be
started, several configuration decisions are needed to be made. This section discusses
some of the considerations involved in tail configuration selection.
For designing aircraft empennage, it‟s necessary to use step-by-step method. This
method consists of three parts:
1- Decision on the empennage configuration to be used
2- Determination of the empennage disposition
3- Determination of the empennage size
6.3.1 Empennage Configuration
Generally, four types of configurations are common to be used:
1- Conventional configurations
2- Canard configurations
3- Three-surface configurations
4- Butterfly empennage configurations
For HADAF1404 aircraft, only conventional configuration is considered and
described. The basic configuration for the tail surfaces in conventional configuration
consists of a horizontal fixed tail-plane, stabilizer, and a vertical fixed fin, each
having a hinged rear flap acting as an elevator for pitch control and a rudder for yaw
control respectively. A dorsal fairing is often incorporated into the base of the fin to
preclude the possibility to fin stall.
HADAFTM
1404 Aircraft Design Book Preliminary Tail Sizing
Figure 6-3Aft tail Variations
A large variety of tail shapes have been employed on aircraft over the past century.
These include configurations often denoted by the letters whose shapes they resemble
in front view: T, V, H, +, Y and inverted V. The selection of the particular
configuration involves considerations of a complex of design variables, but here are a
few of the reasons these geometries have been used.
The conventional configuration with a low horizontal tail is a natural choice since
roots of both horizontal and vertical surfaces are conveniently attached directly to the
fuselage. In this design, the effectiveness of the vertical tail is large because
interference with the fuselage and horizontal tail increase its effective aspect ratio.
Large areas of the tails are affected by the converging fuselage flow, which can
reduce the local dynamic pressure.
Figure 6-4Scottish Aviation Bulldog
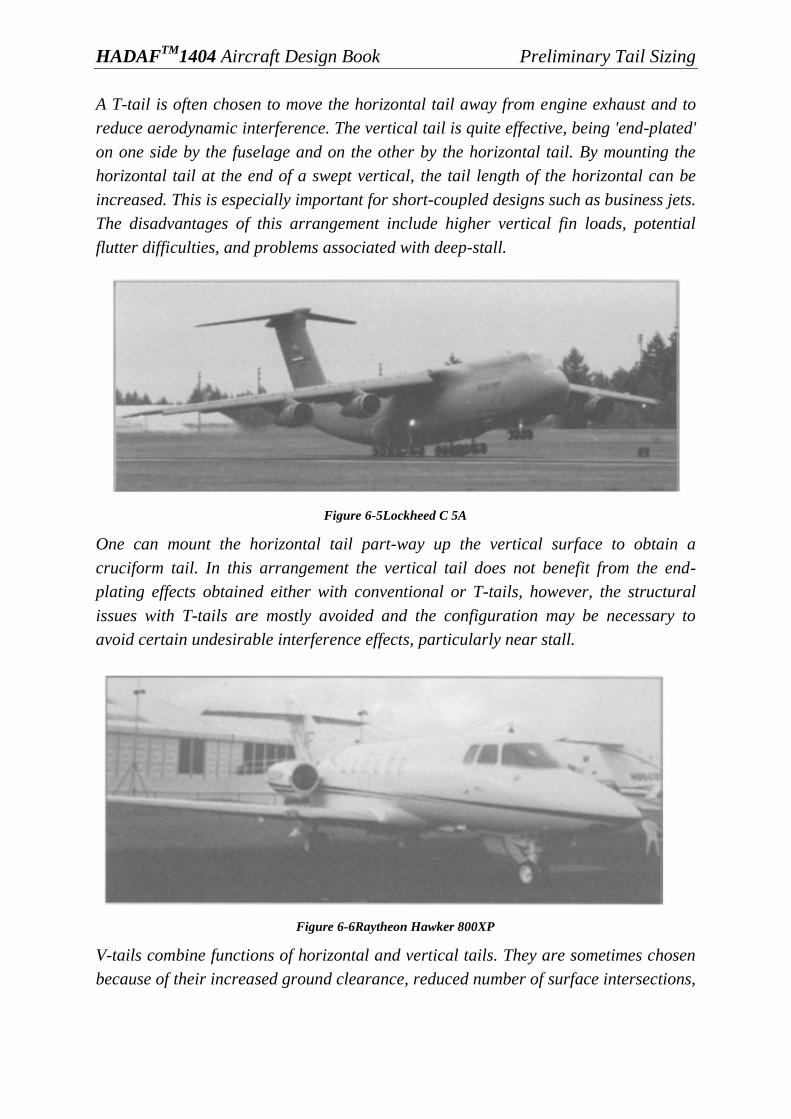
HADAFTM
1404 Aircraft Design Book Preliminary Tail Sizing
A T-tail is often chosen to move the horizontal tail away from engine exhaust and to
reduce aerodynamic interference. The vertical tail is quite effective, being 'end-plated'
on one side by the fuselage and on the other by the horizontal tail. By mounting the
horizontal tail at the end of a swept vertical, the tail length of the horizontal can be
increased. This is especially important for short-coupled designs such as business jets.
The disadvantages of this arrangement include higher vertical fin loads, potential
flutter difficulties, and problems associated with deep-stall.
Figure 6-5Lockheed C 5A
One can mount the horizontal tail part-way up the vertical surface to obtain a
cruciform tail. In this arrangement the vertical tail does not benefit from the end-
plating effects obtained either with conventional or T-tails, however, the structural
issues with T-tails are mostly avoided and the configuration may be necessary to
avoid certain undesirable interference effects, particularly near stall.
Figure 6-6Raytheon Hawker 800XP
V-tails combine functions of horizontal and vertical tails. They are sometimes chosen
because of their increased ground clearance, reduced number of surface intersections,
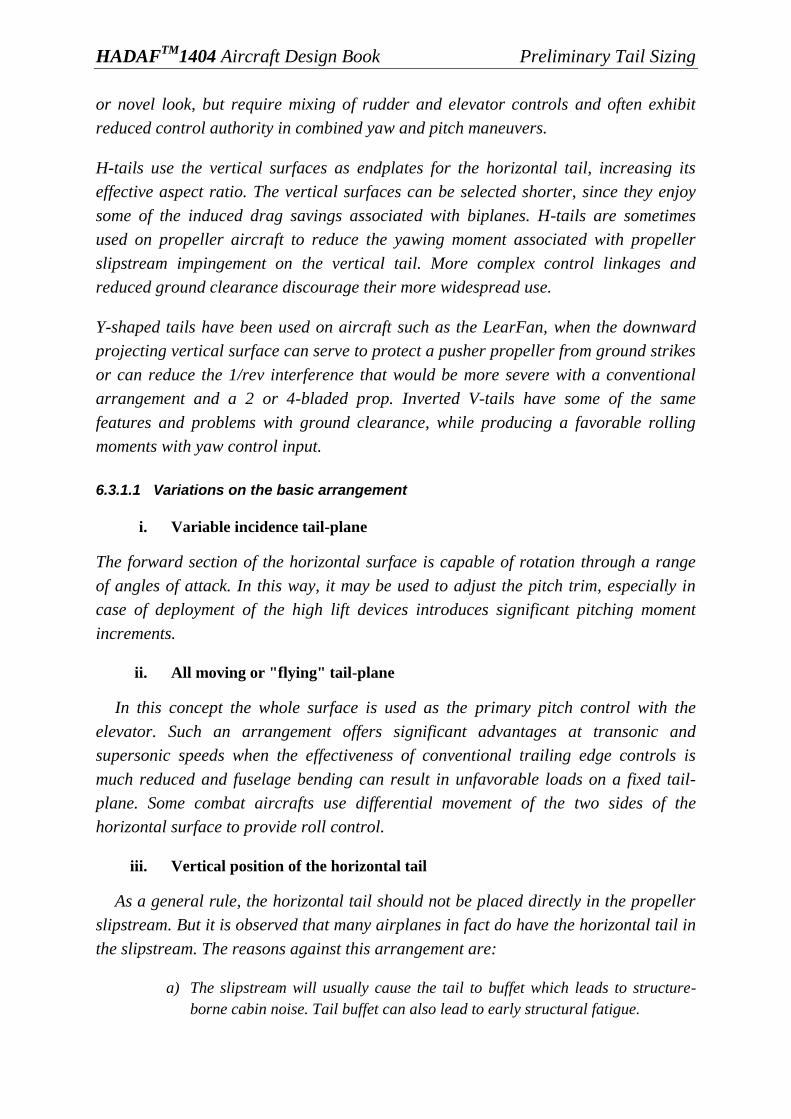
HADAFTM
1404 Aircraft Design Book Preliminary Tail Sizing
or novel look, but require mixing of rudder and elevator controls and often exhibit
reduced control authority in combined yaw and pitch maneuvers.
H-tails use the vertical surfaces as endplates for the horizontal tail, increasing its
effective aspect ratio. The vertical surfaces can be selected shorter, since they enjoy
some of the induced drag savings associated with biplanes. H-tails are sometimes
used on propeller aircraft to reduce the yawing moment associated with propeller
slipstream impingement on the vertical tail. More complex control linkages and
reduced ground clearance discourage their more widespread use.
Y-shaped tails have been used on aircraft such as the LearFan, when the downward
projecting vertical surface can serve to protect a pusher propeller from ground strikes
or can reduce the 1/rev interference that would be more severe with a conventional
arrangement and a 2 or 4-bladed prop. Inverted V-tails have some of the same
features and problems with ground clearance, while producing a favorable rolling
moments with yaw control input.
6.3.1.1 Variations on the basic arrangement
i. Variable incidence tail-plane
The forward section of the horizontal surface is capable of rotation through a range
of angles of attack. In this way, it may be used to adjust the pitch trim, especially in
case of deployment of the high lift devices introduces significant pitching moment
increments.
ii. All moving or "flying" tail-plane
In this concept the whole surface is used as the primary pitch control with the
elevator. Such an arrangement offers significant advantages at transonic and
supersonic speeds when the effectiveness of conventional trailing edge controls is
much reduced and fuselage bending can result in unfavorable loads on a fixed tail-
plane. Some combat aircrafts use differential movement of the two sides of the
horizontal surface to provide roll control.
iii. Vertical position of the horizontal tail
As a general rule, the horizontal tail should not be placed directly in the propeller
slipstream. But it is observed that many airplanes in fact do have the horizontal tail in
the slipstream. The reasons against this arrangement are:
a) The slipstream will usually cause the tail to buffet which leads to structure-
borne cabin noise. Tail buffet can also lead to early structural fatigue.

HADAFTM
1404 Aircraft Design Book Preliminary Tail Sizing
b) Rapid power increases or decreases called for by the pilot can result in
undesirably large trim changes.
Single engine propeller driven airplanes usually do have the empennage mounted in
the slipstream. This does enhance elevator effectiveness and rudder effectiveness
during the take-off roll. On the other hand, it also causes considerable tail buffet
during the take-off roll in some airplanes.
There is not usually a problem with a vertical tail mounted in the slipstream at the aft
end of a fuselage.
The horizontal tail is within the wing downwash field which has the effect of reducing
the effectiveness as a stabilizer. The degree of this reduction is a function of the
vertical location of the tail relative to the wing and the effect may be reduced by
significant upward movement in tail location (Figures 6.6, 6.7, and 6.8). In general a
horizontal tail mounted at the top of the fin can be smaller than would otherwise be
the case. Unfortunately such an arrangement accompanies some disadvantages. There
is a mass penalty on the fin due to higher loading and aero-elastic effects, and there is
also the possibility of a deep stall. Essentially this may occur when the aircraft pitches
nose up rapidly and reaches an attitude such that the tail-plane is virtually ineffective
as a stabilizer in the conventional sense. In this situation, the aircraft is in a stable
stalled condition from which it may be difficult or impossible to recover.
Although means are available to resolve this difficulty it is suggested that a high-
mounted 'T' tail should only be used when it is really necessary, as may be the case of
a high-mounted swept back wing configuration or when an engine intake is placed at
the bottom of the fin. A possible alternative for the 'T' tail which does not suffer from
the deep stall problem is to mount the tail-plane very low. Unfortunately in most cases
this is not an option because of tail down ground clearance limitations, but it is
worthy of consideration on smaller aircraft, such as combat types, especially when the
wing is positioned high on the fuselage, Figure 6.9.
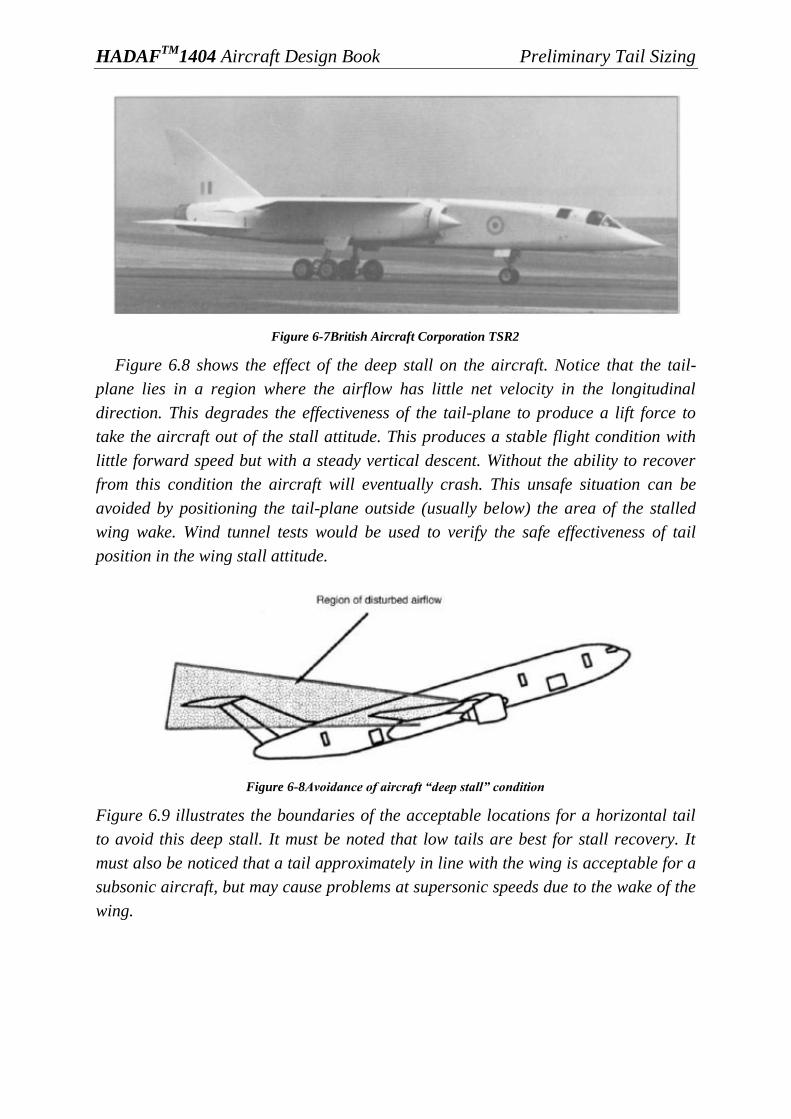
HADAFTM
1404 Aircraft Design Book Preliminary Tail Sizing
Figure 6-7British Aircraft Corporation TSR2
Figure 6.8 shows the effect of the deep stall on the aircraft. Notice that the tail-
plane lies in a region where the airflow has little net velocity in the longitudinal
direction. This degrades the effectiveness of the tail-plane to produce a lift force to
take the aircraft out of the stall attitude. This produces a stable flight condition with
little forward speed but with a steady vertical descent. Without the ability to recover
from this condition the aircraft will eventually crash. This unsafe situation can be
avoided by positioning the tail-plane outside (usually below) the area of the stalled
wing wake. Wind tunnel tests would be used to verify the safe effectiveness of tail
position in the wing stall attitude.
Figure 6-8Avoidanceofaircraft“deepstall”condition
Figure 6.9 illustrates the boundaries of the acceptable locations for a horizontal tail
to avoid this deep stall. It must be noted that low tails are best for stall recovery. It
must also be noticed that a tail approximately in line with the wing is acceptable for a
subsonic aircraft, but may cause problems at supersonic speeds due to the wake of the
wing.

HADAFTM
1404 Aircraft Design Book Preliminary Tail Sizing
Figure 6-9Aft tail positioning
6.3.2 Empennage Disposition
After selection of suitable configuration for tail, now, it comes to decide about the
location of empennage components on the aircraft. In other words, empennage
moment arms (Xh,Xv) and some other parameters must be known.(These parameters
are shown in the figure 6.10).
To achieve a good disposition, these parameters are determined by analyzing the
plans of several ultra- light aircrafts. The database analysis results are used for
HADAF aircraft. The samples of these determinations will be presented in next
sections.
To keep the aircraft weight and drag as low as possible it is desirable to keep the
empennage area as small as possible. This in turn can be achieved by locating the
empennage components in the way that they have the largest possible moment arm
relative to the critical center of gravity.
It must be noticed that in some airplanes (carrier based airplanes are on example)
severe restrictions are place on the allowable length, height and width.
6.3.3 Empennage Size
Sizing the empennage for a conventional configuration means deciding on the
magnitude of Sh and Sv. For a first „cut‟ at the size of either the vertical or the
horizontal tail, the so-called V-method is often used. The tail volume coefficients are
defined as in equations 6-1 and 6-2.
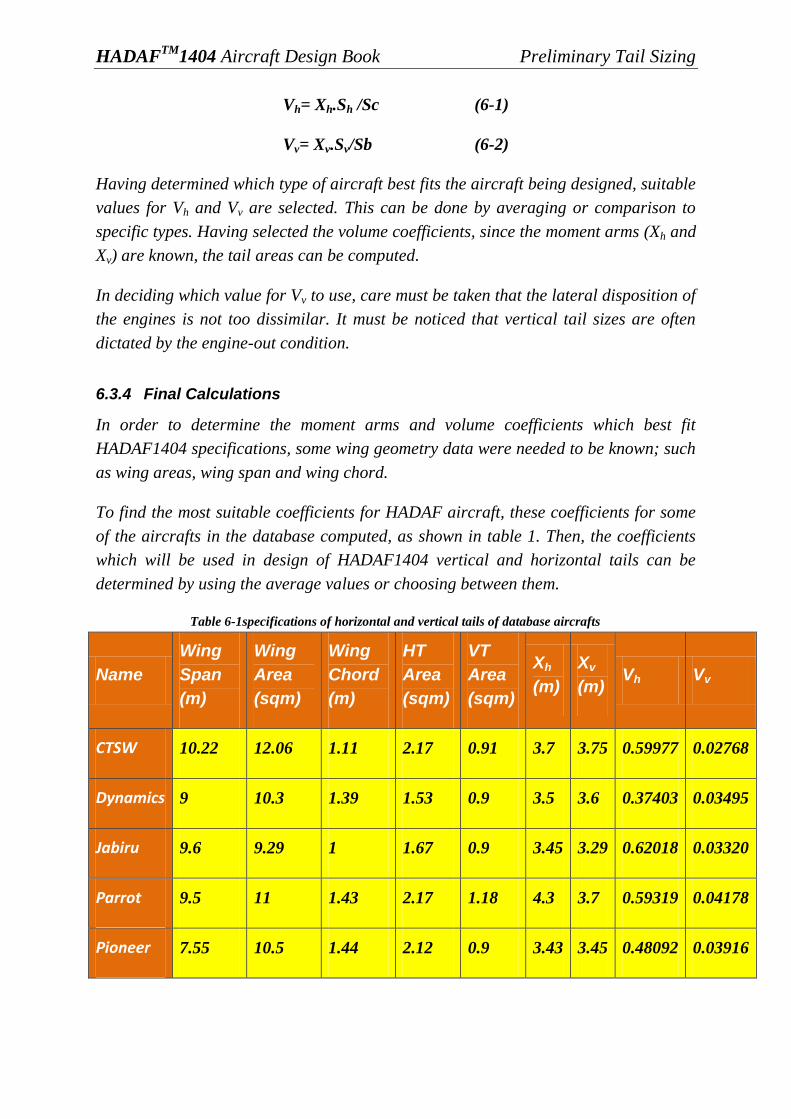
HADAFTM
1404 Aircraft Design Book Preliminary Tail Sizing
Vh= Xh.Sh /Sc (6-1)
Vv= Xv.Sv/Sb (6-2)
Having determined which type of aircraft best fits the aircraft being designed, suitable
values for Vh and Vv are selected. This can be done by averaging or comparison to
specific types. Having selected the volume coefficients, since the moment arms (Xh and
Xv) are known, the tail areas can be computed.
In deciding which value for Vv to use, care must be taken that the lateral disposition of
the engines is not too dissimilar. It must be noticed that vertical tail sizes are often
dictated by the engine-out condition.
6.3.4 Final Calculations
In order to determine the moment arms and volume coefficients which best fit
HADAF1404 specifications, some wing geometry data were needed to be known; such
as wing areas, wing span and wing chord.
To find the most suitable coefficients for HADAF aircraft, these coefficients for some
of the aircrafts in the database computed, as shown in table 1. Then, the coefficients
which will be used in design of HADAF1404 vertical and horizontal tails can be
determined by using the average values or choosing between them.
Table 6-1specifications of horizontal and vertical tails of database aircrafts
Name
Wing
Span
(m)
Wing
Area
(sqm)
Wing
Chord
(m)
HT
Area
(sqm)
VT
Area
(sqm)
Xh
(m)
Xv
(m) Vh Vv
CTSW 10.22 12.06 1.11 2.17 0.91 3.7 3.75 0.59977 0.02768
Dynamics 9 10.3 1.39 1.53 0.9 3.5 3.6 0.37403 0.03495
Jabiru 9.6 9.29 1 1.67 0.9 3.45 3.29 0.62018 0.03320
Parrot 9.5 11 1.43 2.17 1.18 4.3 3.7 0.59319 0.04178
Pioneer 7.55 10.5 1.44 2.12 0.9 3.43 3.45 0.48092 0.03916
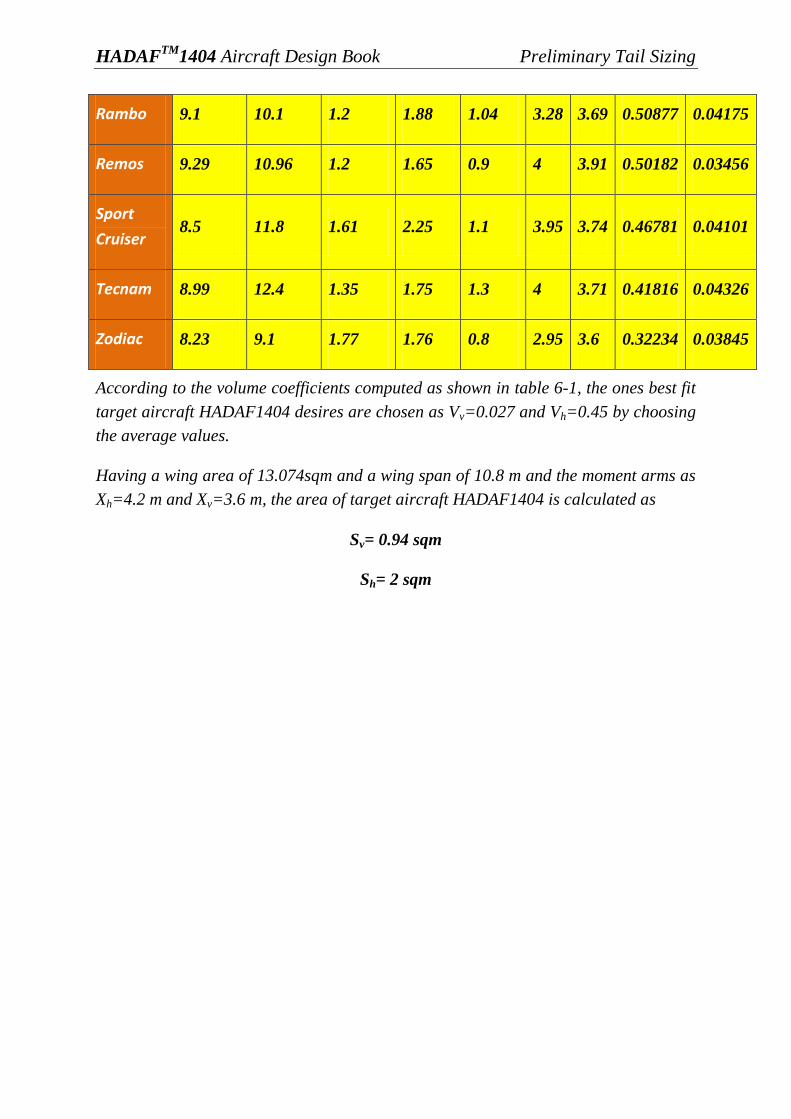
HADAFTM
1404 Aircraft Design Book Preliminary Tail Sizing
Rambo 9.1 10.1 1.2 1.88 1.04 3.28 3.69 0.50877 0.04175
Remos 9.29 10.96 1.2 1.65 0.9 4 3.91 0.50182 0.03456
Sport
Cruiser 8.5 11.8 1.61 2.25 1.1 3.95 3.74 0.46781 0.04101
Tecnam 8.99 12.4 1.35 1.75 1.3 4 3.71 0.41816 0.04326
Zodiac 8.23 9.1 1.77 1.76 0.8 2.95 3.6 0.32234 0.03845
According to the volume coefficients computed as shown in table 6-1, the ones best fit
target aircraft HADAF1404 desires are chosen as Vv=0.027 and Vh=0.45 by choosing
the average values.
Having a wing area of 13.074sqm and a wing span of 10.8 m and the moment arms as
Xh=4.2 m and Xv=3.6 m, the area of target aircraft HADAF1404 is calculated as
Sv= 0.94 sqm
Sh= 2 sqm
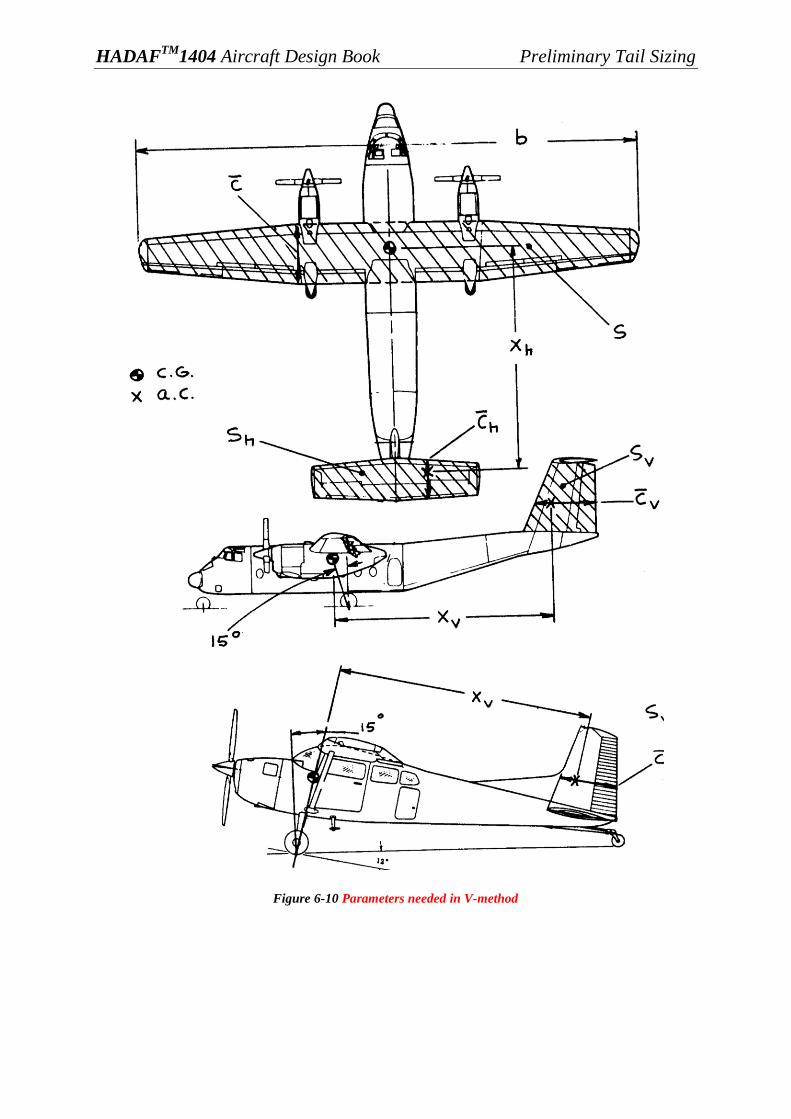
HADAFTM
1404 Aircraft Design Book Preliminary Tail Sizing
Figure 6-10 Parameters needed in V-method
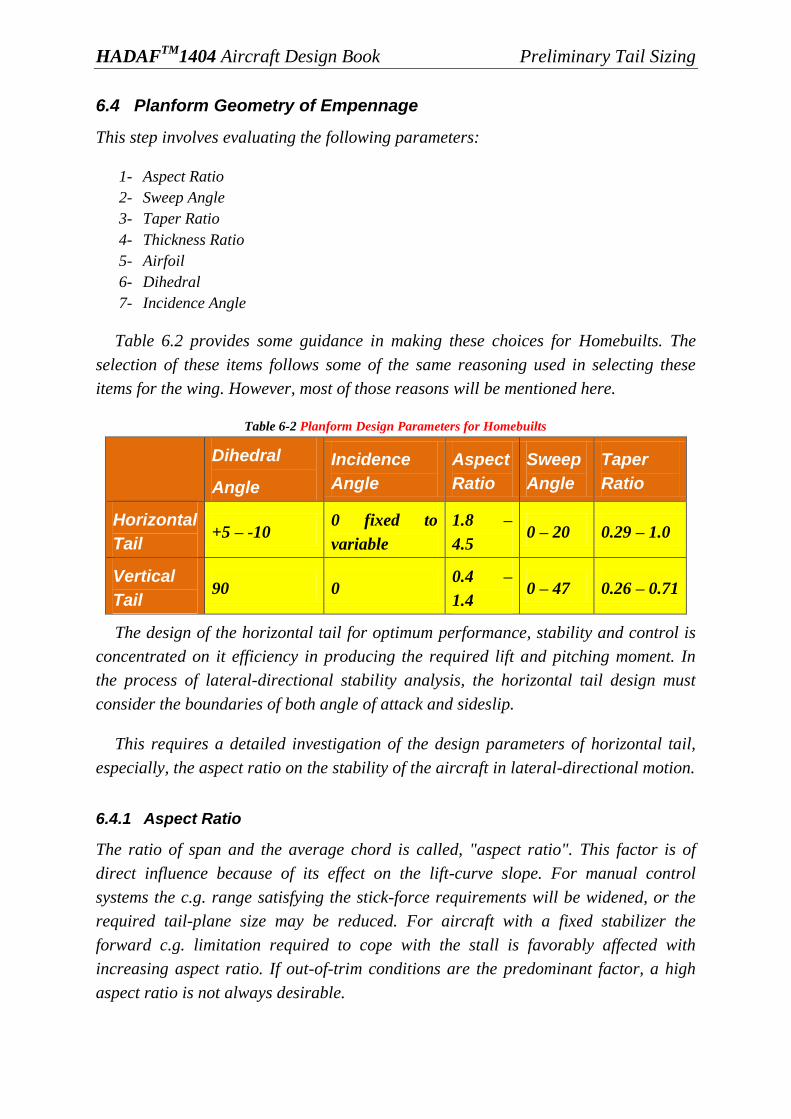
HADAFTM
1404 Aircraft Design Book Preliminary Tail Sizing
6.4 Planform Geometry of Empennage
This step involves evaluating the following parameters:
1- Aspect Ratio
2- Sweep Angle
3- Taper Ratio
4- Thickness Ratio
5- Airfoil
6- Dihedral
7- Incidence Angle
Table 6.2 provides some guidance in making these choices for Homebuilts. The
selection of these items follows some of the same reasoning used in selecting these
items for the wing. However, most of those reasons will be mentioned here.
Table 6-2 Planform Design Parameters for Homebuilts
Dihedral
Angle
Incidence
Angle
Aspect
Ratio
Sweep
Angle
Taper
Ratio
Horizontal
Tail +5 – -10
0 fixed to
variable
1.8 –
4.5 0 – 20 0.29 – 1.0
Vertical
Tail 90 0
0.4 –
1.4 0 – 47 0.26 – 0.71
The design of the horizontal tail for optimum performance, stability and control is
concentrated on it efficiency in producing the required lift and pitching moment. In
the process of lateral-directional stability analysis, the horizontal tail design must
consider the boundaries of both angle of attack and sideslip.
This requires a detailed investigation of the design parameters of horizontal tail,
especially, the aspect ratio on the stability of the aircraft in lateral-directional motion.
6.4.1 Aspect Ratio
The ratio of span and the average chord is called, "aspect ratio". This factor is of
direct influence because of its effect on the lift-curve slope. For manual control
systems the c.g. range satisfying the stick-force requirements will be widened, or the
required tail-plane size may be reduced. For aircraft with a fixed stabilizer the
forward c.g. limitation required to cope with the stall is favorably affected with
increasing aspect ratio. If out-of-trim conditions are the predominant factor, a high
aspect ratio is not always desirable.
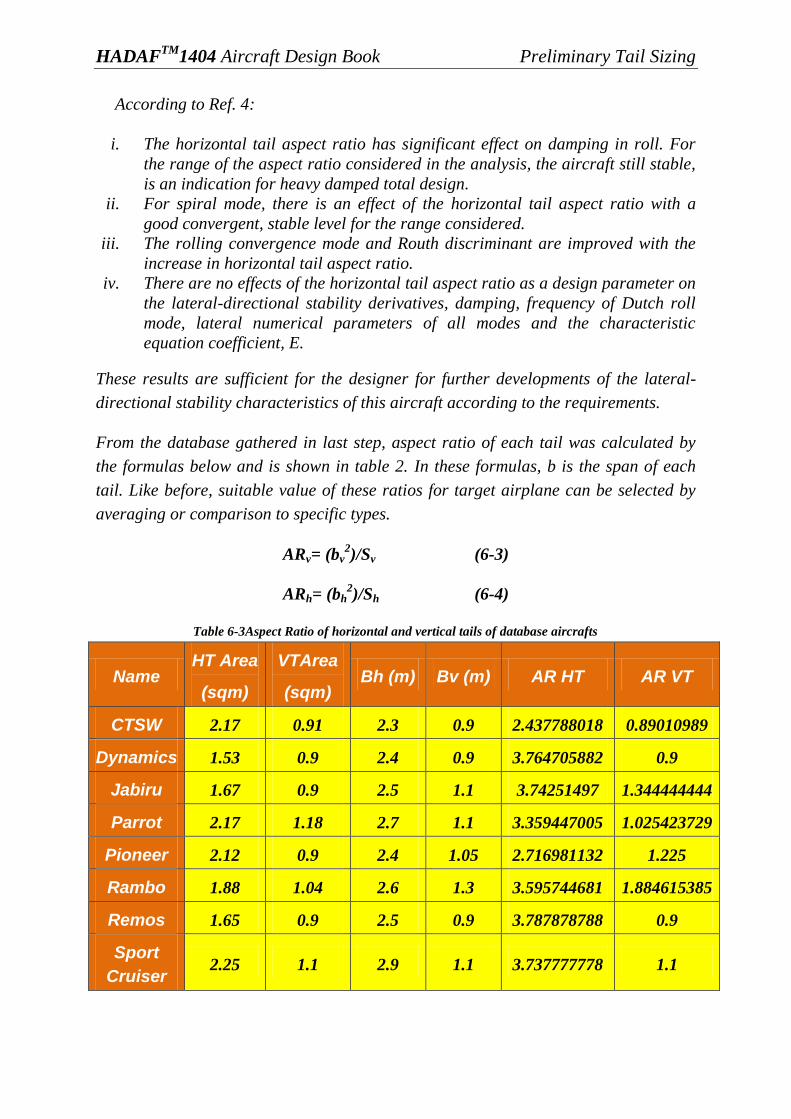
HADAFTM
1404 Aircraft Design Book Preliminary Tail Sizing
According to Ref. 4:
i. The horizontal tail aspect ratio has significant effect on damping in roll. For
the range of the aspect ratio considered in the analysis, the aircraft still stable,
is an indication for heavy damped total design.
ii. For spiral mode, there is an effect of the horizontal tail aspect ratio with a
good convergent, stable level for the range considered.
iii. The rolling convergence mode and Routh discriminant are improved with the
increase in horizontal tail aspect ratio.
iv. There are no effects of the horizontal tail aspect ratio as a design parameter on
the lateral-directional stability derivatives, damping, frequency of Dutch roll
mode, lateral numerical parameters of all modes and the characteristic
equation coefficient, E.
These results are sufficient for the designer for further developments of the lateral-
directional stability characteristics of this aircraft according to the requirements.
From the database gathered in last step, aspect ratio of each tail was calculated by
the formulas below and is shown in table 2. In these formulas, b is the span of each
tail. Like before, suitable value of these ratios for target airplane can be selected by
averaging or comparison to specific types.
ARv= (bv2)/Sv (6-3)
ARh= (bh2)/Sh (6-4)
Table 6-3Aspect Ratio of horizontal and vertical tails of database aircrafts
Name HT Area
(sqm)
VTArea
(sqm) Bh (m) Bv (m) AR HT AR VT
CTSW 2.17 0.91 2.3 0.9 2.437788018 0.89010989
Dynamics 1.53 0.9 2.4 0.9 3.764705882 0.9
Jabiru 1.67 0.9 2.5 1.1 3.74251497 1.344444444
Parrot 2.17 1.18 2.7 1.1 3.359447005 1.025423729
Pioneer 2.12 0.9 2.4 1.05 2.716981132 1.225
Rambo 1.88 1.04 2.6 1.3 3.595744681 1.884615385
Remos 1.65 0.9 2.5 0.9 3.787878788 0.9
Sport
Cruiser 2.25 1.1 2.9 1.1 3.737777778 1.1

HADAFTM
1404 Aircraft Design Book Preliminary Tail Sizing
Tecnam 1.75 1.3 2.8 1.5 4.48 1.730769231
Zodiac 1.76 0.8 2.2 0.9 2.75 1.0125
According to the range of aspect ratios of horizontal and vertical tails of these
aircrafts, aspect ratio of each tail of HADAF 1404 was chosen as below by choosing
the average amounts.
ARv= 1.1
ARh=3.4
These ratios can be reasonable as the ratio for horizontal tail of homebuilt airplanes
can be chosen from 1.8 to 4.5 and from 0.4 to 1.4 for the vertical tail. So the spans of
each tail will be as below.
bv= 1 m
bh=2.6 m
6.4.2 Sweep Angle
The sweep angle ( ) is usually measured as the angle between the line of the 25%
chord and a perpendicular to the root chord.
In selecting sweep angle combinations for tail aft configurations it is important to
ensure that the critical Mach number for the tails is higher that of the wing. An
increment of is usually sufficient.
For horizontal tail, positive sweep is occasionally used on low-speed aircraft to
increase the tail-plane moment arm and the stalling angle of attack, although the
result is a decrease in the lift-curve slope. Up to about 25 degrees of sweepback there
is still an advantage. The sweepback angle may be determined by the condition of a
straight elevator hinge line, which is sometimes imposed in interest of structural
simplicity. For vertical tail of subsonic aircrafts, sweep angle is usually chosen
between 25 and 45 degrees.
If the wing is very highly swept, the horizontal tail sweep is not increased this much
because of the effect on lift curve slope. For supersonic aircrafts, higher sweep angles
may be used if the leading edge Mach number is intended to be subsonic.
So for each tail of HADAF 1404, sweep angle was chosen as moderate values as:
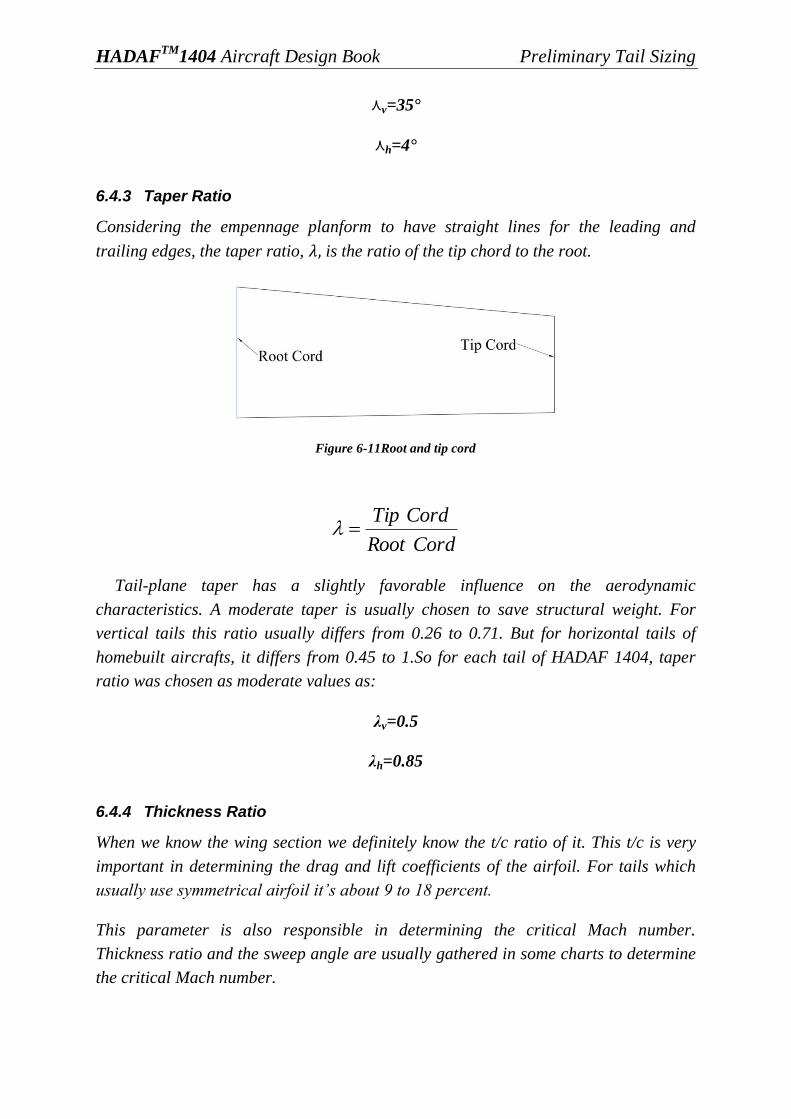
HADAFTM
1404 Aircraft Design Book Preliminary Tail Sizing
v=35°
h=4°
6.4.3 Taper Ratio
Considering the empennage planform to have straight lines for the leading and
trailing edges, the taper ratio, is the ratio of the tip chord to the root.
Figure 6-11Root and tip cord
CordRoot
CordTip
Tail-plane taper has a slightly favorable influence on the aerodynamic
characteristics. A moderate taper is usually chosen to save structural weight. For
vertical tails this ratio usually differs from 0.26 to 0.71. But for horizontal tails of
homebuilt aircrafts, it differs from 0.45 to 1.So for each tail of HADAF 1404, taper
ratio was chosen as moderate values as:
λv=0.5
λh=0.85
6.4.4 Thickness Ratio
When we know the wing section we definitely know the t/c ratio of it. This t/c is very
important in determining the drag and lift coefficients of the airfoil. For tails which
usually use symmetrical airfoil it‟s about 9 to 18 percent.
This parameter is also responsible in determining the critical Mach number.
Thickness ratio and the sweep angle are usually gathered in some charts to determine
the critical Mach number.

HADAFTM
1404 Aircraft Design Book Preliminary Tail Sizing
As we can easily see, the thickness ratio has a diverse effect on the critical Mach
number, and as we increase the t/c the critical Mach number decreases. While the
critical Mach number increases with the increase of the sweep angle. This verifies our
previous statements about the effect of the sweep angle.
As the t/c increases the increase in the speed of the free stream velocity during the
pass over the upper edge of the airfoil increases, causing the critical Mach number to
decrease.
The tail surfaces should have lower thickness and/or higher sweep than the wing
(about 5 degrees usually) to prevent strong shocks on the tail in normal cruise. Tail
t/c values are often lower than that of the wing since t/c of the tail has a less
significant effect on weight.
6.4.5 Dihedral Angle
The dihedral angle of the horizontal tail is the angle between a horizontal plane
containing the root chord and a plane midway between the upper and lower surfaces
of the horizontal tail. This angle will have a good influence in the aircraft roll
equilibrium.
Figure 6-12Dihedral angle
The position of the tail-plane relative to the propeller slipstream or jet efflux may
make it desirable to shift it slightly in an upward direction. This may be achieved by
using a certain degree of dihedral.
Since enough stability is produced by the designed wing, any positive dihedral angle
in horizontal tail will cause more difficult in controlling the airplane in rolling.
As for vertical tails of the homebuilt, dihedral angle is assumed as 90 degrees, it is
assumed for HADAF 1404 that this number is 90 degrees. And for horizontal tail of
HADAF 1404, this angle is considered to be 0 degree.
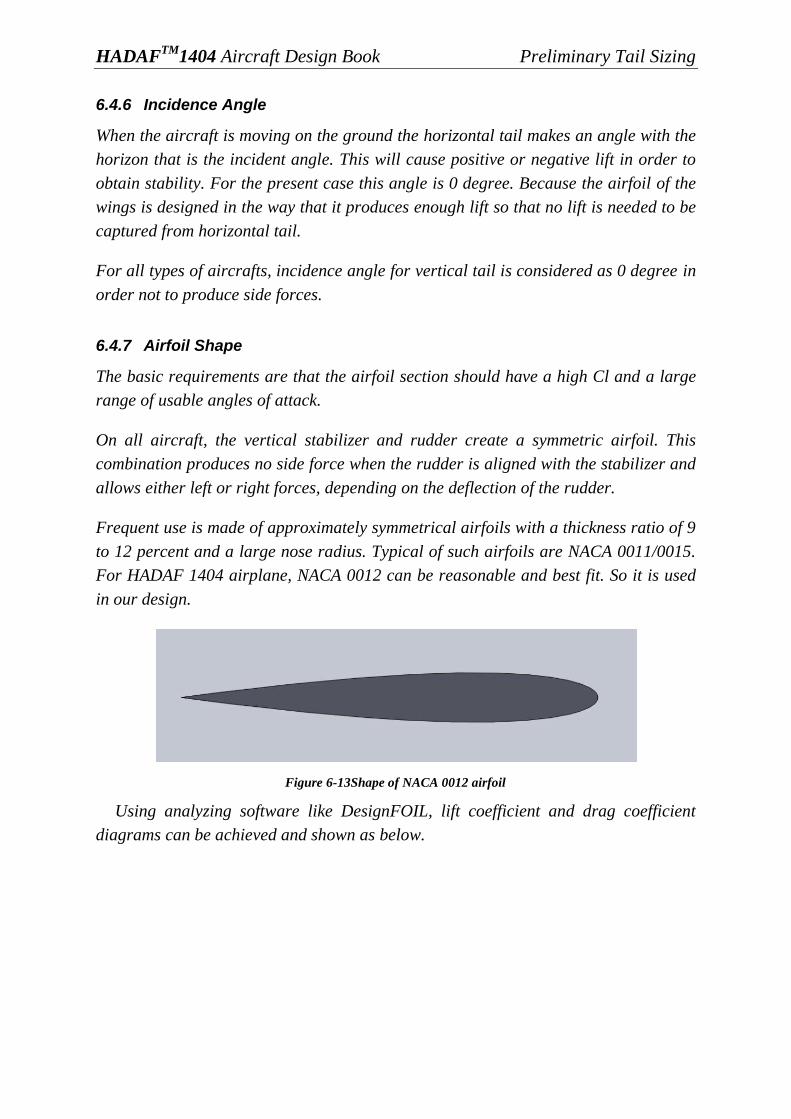
HADAFTM
1404 Aircraft Design Book Preliminary Tail Sizing
6.4.6 Incidence Angle
When the aircraft is moving on the ground the horizontal tail makes an angle with the
horizon that is the incident angle. This will cause positive or negative lift in order to
obtain stability. For the present case this angle is 0 degree. Because the airfoil of the
wings is designed in the way that it produces enough lift so that no lift is needed to be
captured from horizontal tail.
For all types of aircrafts, incidence angle for vertical tail is considered as 0 degree in
order not to produce side forces.
6.4.7 Airfoil Shape
The basic requirements are that the airfoil section should have a high Cl and a large
range of usable angles of attack.
On all aircraft, the vertical stabilizer and rudder create a symmetric airfoil. This
combination produces no side force when the rudder is aligned with the stabilizer and
allows either left or right forces, depending on the deflection of the rudder.
Frequent use is made of approximately symmetrical airfoils with a thickness ratio of 9
to 12 percent and a large nose radius. Typical of such airfoils are NACA 0011/0015.
For HADAF 1404 airplane, NACA 0012 can be reasonable and best fit. So it is used
in our design.
Figure 6-13Shape of NACA 0012 airfoil
Using analyzing software like DesignFOIL, lift coefficient and drag coefficient
diagrams can be achieved and shown as below.
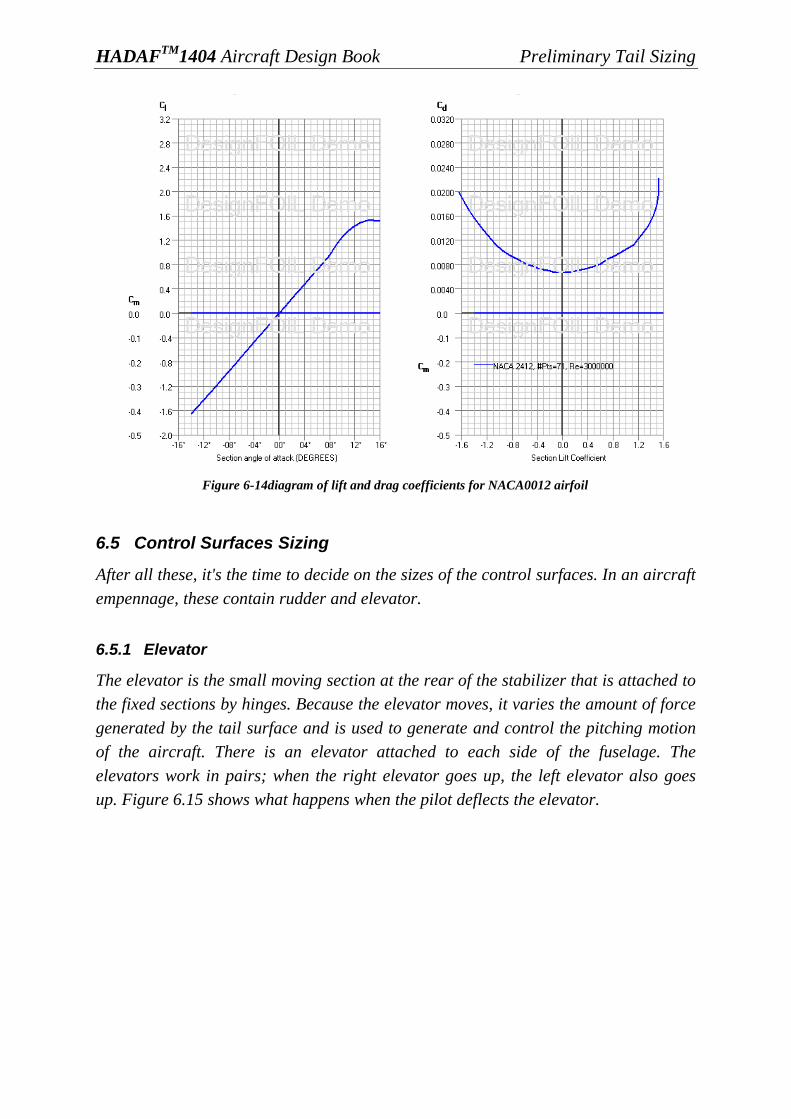
HADAFTM
1404 Aircraft Design Book Preliminary Tail Sizing
Figure 6-14diagram of lift and drag coefficients for NACA0012 airfoil
6.5 Control Surfaces Sizing
After all these, it's the time to decide on the sizes of the control surfaces. In an aircraft
empennage, these contain rudder and elevator.
6.5.1 Elevator
The elevator is the small moving section at the rear of the stabilizer that is attached to
the fixed sections by hinges. Because the elevator moves, it varies the amount of force
generated by the tail surface and is used to generate and control the pitching motion
of the aircraft. There is an elevator attached to each side of the fuselage. The
elevators work in pairs; when the right elevator goes up, the left elevator also goes
up. Figure 6.15 shows what happens when the pilot deflects the elevator.
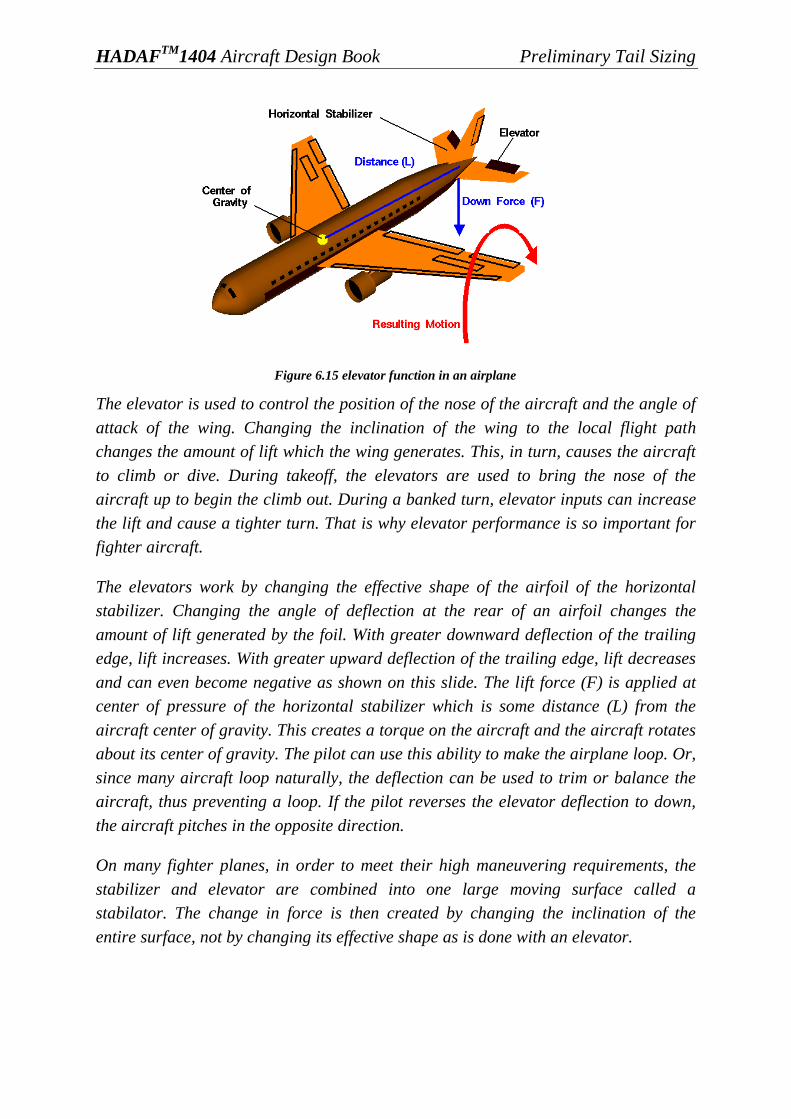
HADAFTM
1404 Aircraft Design Book Preliminary Tail Sizing
Figure 6.15 elevator function in an airplane
The elevator is used to control the position of the nose of the aircraft and the angle of
attack of the wing. Changing the inclination of the wing to the local flight path
changes the amount of lift which the wing generates. This, in turn, causes the aircraft
to climb or dive. During takeoff, the elevators are used to bring the nose of the
aircraft up to begin the climb out. During a banked turn, elevator inputs can increase
the lift and cause a tighter turn. That is why elevator performance is so important for
fighter aircraft.
The elevators work by changing the effective shape of the airfoil of the horizontal
stabilizer. Changing the angle of deflection at the rear of an airfoil changes the
amount of lift generated by the foil. With greater downward deflection of the trailing
edge, lift increases. With greater upward deflection of the trailing edge, lift decreases
and can even become negative as shown on this slide. The lift force (F) is applied at
center of pressure of the horizontal stabilizer which is some distance (L) from the
aircraft center of gravity. This creates a torque on the aircraft and the aircraft rotates
about its center of gravity. The pilot can use this ability to make the airplane loop. Or,
since many aircraft loop naturally, the deflection can be used to trim or balance the
aircraft, thus preventing a loop. If the pilot reverses the elevator deflection to down,
the aircraft pitches in the opposite direction.
On many fighter planes, in order to meet their high maneuvering requirements, the
stabilizer and elevator are combined into one large moving surface called a
stabilator. The change in force is then created by changing the inclination of the
entire surface, not by changing its effective shape as is done with an elevator.
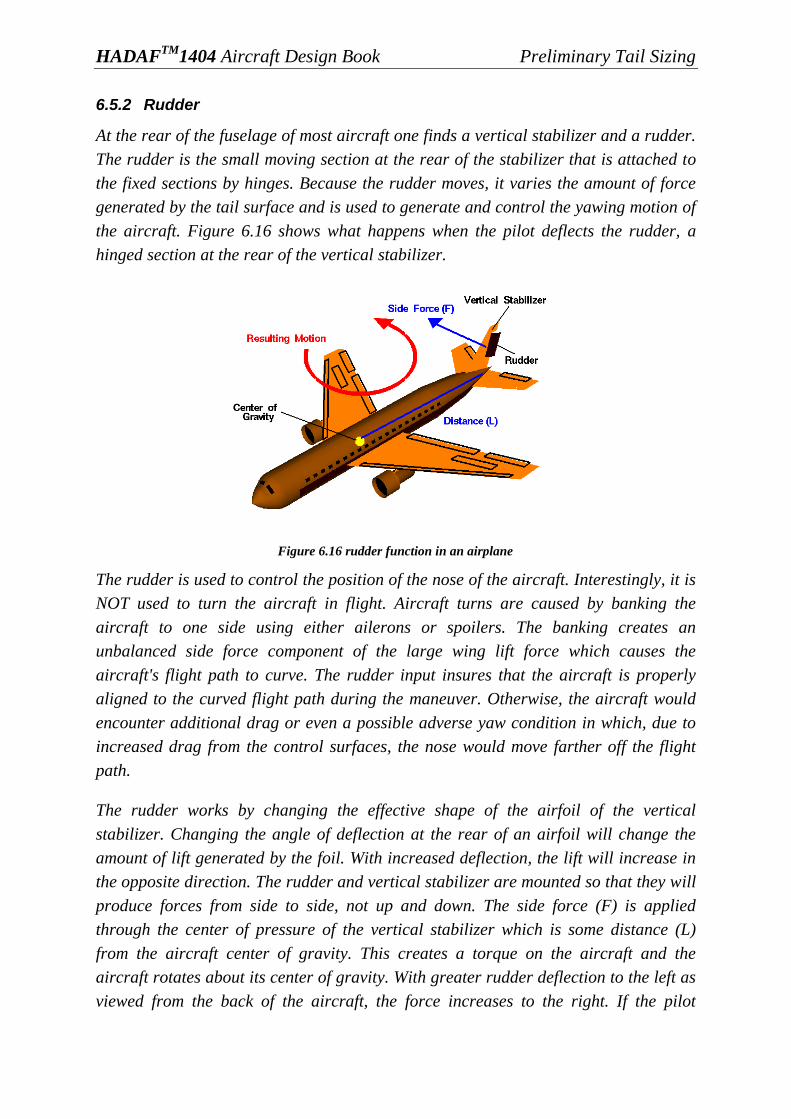
HADAFTM
1404 Aircraft Design Book Preliminary Tail Sizing
6.5.2 Rudder
At the rear of the fuselage of most aircraft one finds a vertical stabilizer and a rudder.
The rudder is the small moving section at the rear of the stabilizer that is attached to
the fixed sections by hinges. Because the rudder moves, it varies the amount of force
generated by the tail surface and is used to generate and control the yawing motion of
the aircraft. Figure 6.16 shows what happens when the pilot deflects the rudder, a
hinged section at the rear of the vertical stabilizer.
Figure 6.16 rudder function in an airplane
The rudder is used to control the position of the nose of the aircraft. Interestingly, it is
NOT used to turn the aircraft in flight. Aircraft turns are caused by banking the
aircraft to one side using either ailerons or spoilers. The banking creates an
unbalanced side force component of the large wing lift force which causes the
aircraft's flight path to curve. The rudder input insures that the aircraft is properly
aligned to the curved flight path during the maneuver. Otherwise, the aircraft would
encounter additional drag or even a possible adverse yaw condition in which, due to
increased drag from the control surfaces, the nose would move farther off the flight
path.
The rudder works by changing the effective shape of the airfoil of the vertical
stabilizer. Changing the angle of deflection at the rear of an airfoil will change the
amount of lift generated by the foil. With increased deflection, the lift will increase in
the opposite direction. The rudder and vertical stabilizer are mounted so that they will
produce forces from side to side, not up and down. The side force (F) is applied
through the center of pressure of the vertical stabilizer which is some distance (L)
from the aircraft center of gravity. This creates a torque on the aircraft and the
aircraft rotates about its center of gravity. With greater rudder deflection to the left as
viewed from the back of the aircraft, the force increases to the right. If the pilot
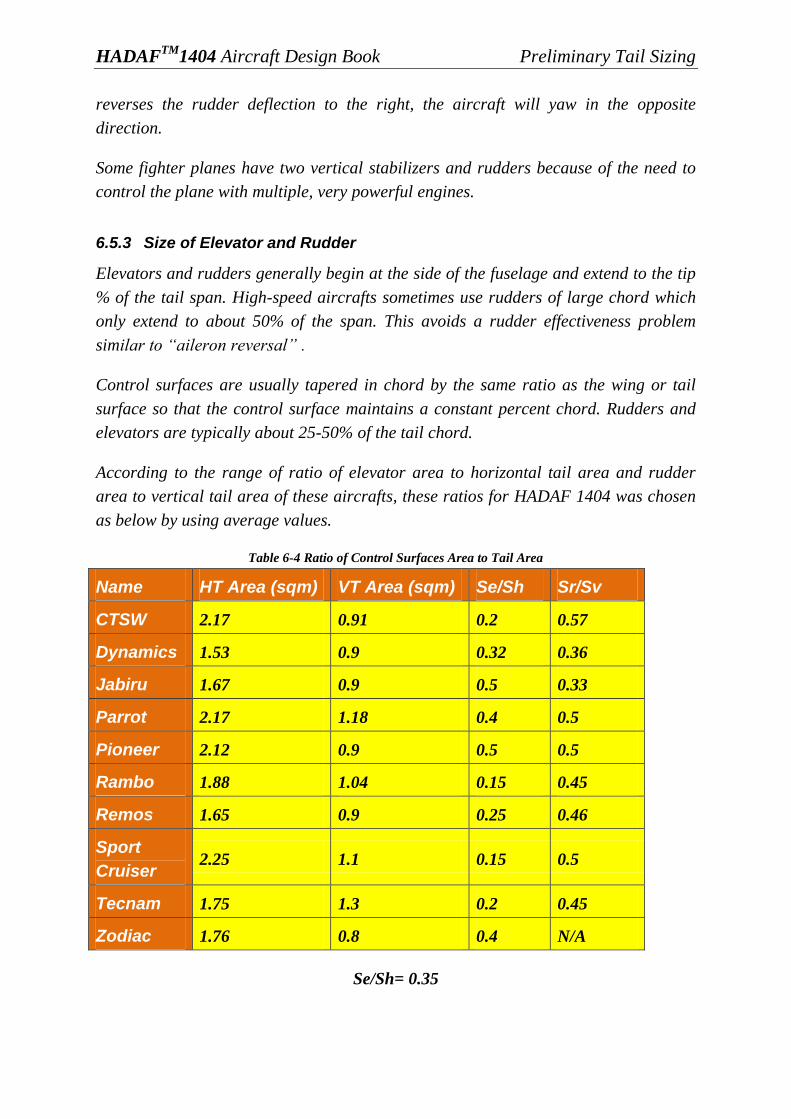
HADAFTM
1404 Aircraft Design Book Preliminary Tail Sizing
reverses the rudder deflection to the right, the aircraft will yaw in the opposite
direction.
Some fighter planes have two vertical stabilizers and rudders because of the need to
control the plane with multiple, very powerful engines.
6.5.3 Size of Elevator and Rudder
Elevators and rudders generally begin at the side of the fuselage and extend to the tip
% of the tail span. High-speed aircrafts sometimes use rudders of large chord which
only extend to about 50% of the span. This avoids a rudder effectiveness problem
similar to “aileron reversal” .
Control surfaces are usually tapered in chord by the same ratio as the wing or tail
surface so that the control surface maintains a constant percent chord. Rudders and
elevators are typically about 25-50% of the tail chord.
According to the range of ratio of elevator area to horizontal tail area and rudder
area to vertical tail area of these aircrafts, these ratios for HADAF 1404 was chosen
as below by using average values.
Table 6-4 Ratio of Control Surfaces Area to Tail Area
Name HT Area (sqm) VT Area (sqm) Se/Sh Sr/Sv
CTSW 2.17 0.91 0.2 0.57
Dynamics 1.53 0.9 0.32 0.36
Jabiru 1.67 0.9 0.5 0.33
Parrot 2.17 1.18 0.4 0.5
Pioneer 2.12 0.9 0.5 0.5
Rambo 1.88 1.04 0.15 0.45
Remos 1.65 0.9 0.25 0.46
Sport
Cruiser 2.25 1.1 0.15 0.5
Tecnam 1.75 1.3 0.2 0.45
Zodiac 1.76 0.8 0.4 N/A
Se/Sh= 0.35
HADAFTM
1404 Aircraft Design Book Preliminary Tail Sizing
Sr/Sv= 0.5
Using these ratios, the area of rudder and elevators become clear as:
Se = 0.7 sqm
Sr= 0.47 sqm

HADAFTM
1404 Aircraft Design Book Preliminary Tail Sizing
6.6 Final Results
As described in last steps, all dimensions and specifications of empennage became
clear. These specifications are listed below.
Table 6-5 Specifications of Each Tail of HADAF1404
Horizontal Tail Vertical Tail
Area 2 0.94
Aspect Ratio 3.4 1.1
C/4 Sweep Angle 4 35
Taper Ratio 0.85 0.5
Thickness Ratio 12 % 12 %
Dihedral Angle 0 90
Incidence Angle 0 0
Airfoil NACA 0012 NACA 0012
Control Surface Ratio 0.35 0.5
Having all dimensions of each tail determined, it's the time to model the whole
empennage in modeling software. One of the most applicable of them is Solidworks
software.
SolidWorks is a 3D mechanical CAD (computer-aided design) program that runs on
Microsoft Windows and was developed by Dassault Systèmes SolidWorks Corp., a
subsidiary of Dassault Systèmes. SolidWorks is currently used by over 1.3 million
engineers and designers at more than 130,000 companies worldwide.
In order to achieve 3D and 2D models of horizontal and vertical tails of HADAF1404
aircraft, airfoil sections must be imported to Solidworks. This can be done by
DesignFOIL. Having this done, those models can be achieved and shown as below.
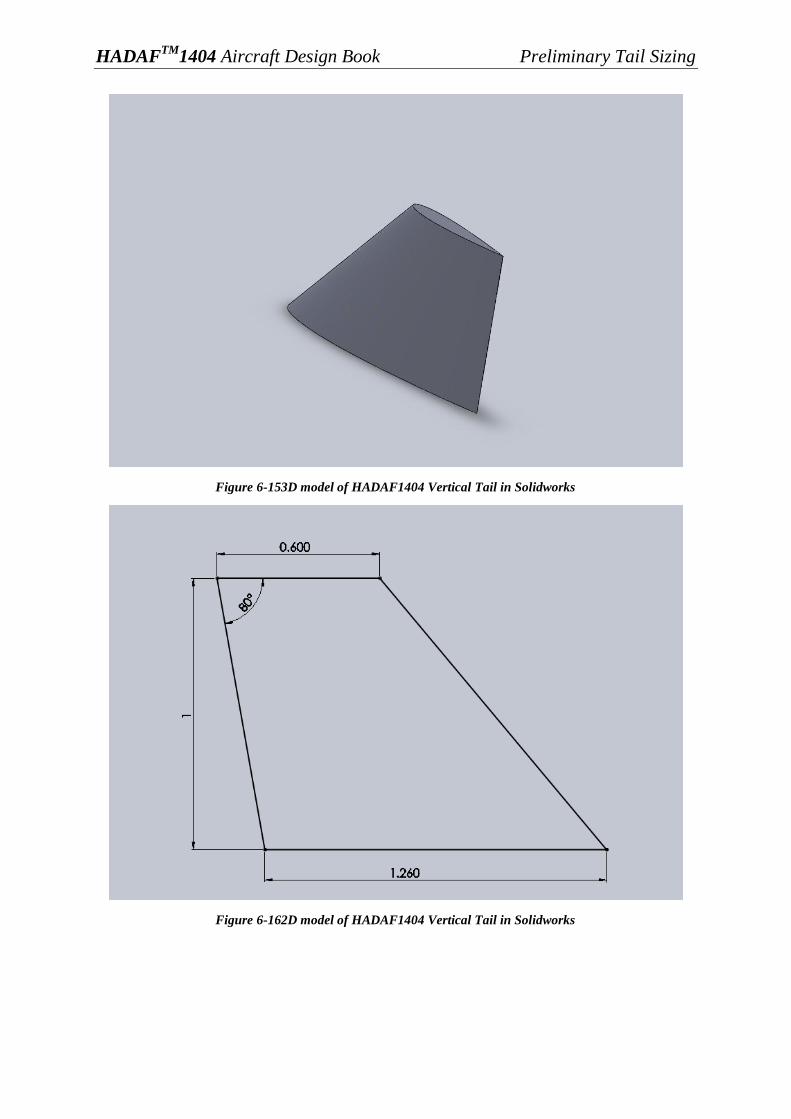
HADAFTM
1404 Aircraft Design Book Preliminary Tail Sizing
Figure 6-153D model of HADAF1404 Vertical Tail in Solidworks
Figure 6-162D model of HADAF1404 Vertical Tail in Solidworks
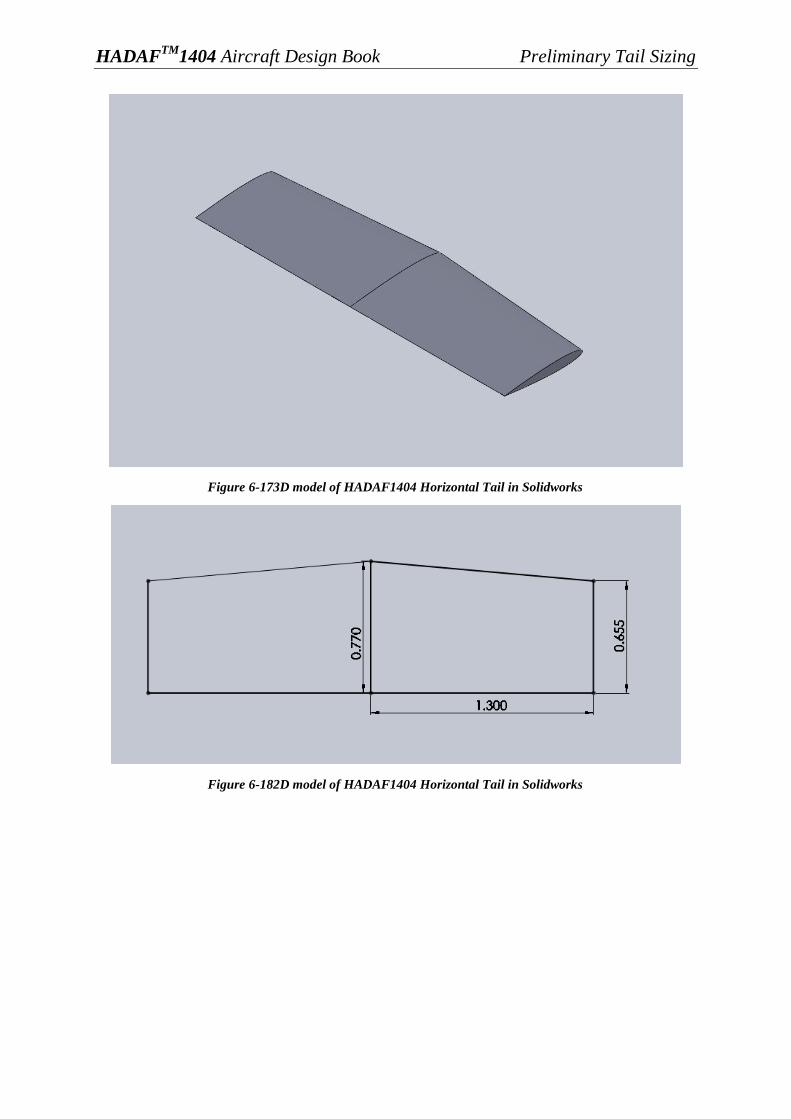
HADAFTM
1404 Aircraft Design Book Preliminary Tail Sizing
Figure 6-173D model of HADAF1404 Horizontal Tail in Solidworks
Figure 6-182D model of HADAF1404 Horizontal Tail in Solidworks

HADAFTM
1404 Aircraft Design Book Preliminary Tail Sizing
6.6 References
1. Roskam, J., Airplane Design: Part II, Preliminary Configuration Design and
Integration of the Propulsion System.
2. Kroo, I., Aircraft Design: Synthesis and Analysis.
3. Torenbeek, E., Synthesis of Subsonic Airplane Design.
4. Yass, M.A.R, Effect of Airplane Tail Aspect Ratio on Lateral-Directional
Stability.
5. Howe, D, Aircraft Conceptual Design Synthesis
6. Raymer, D.P, Aircraft Design: A Conceptual Approach
7. Jenkinson, Simpkin, Rhodes, Civil Jet Aircraft Design
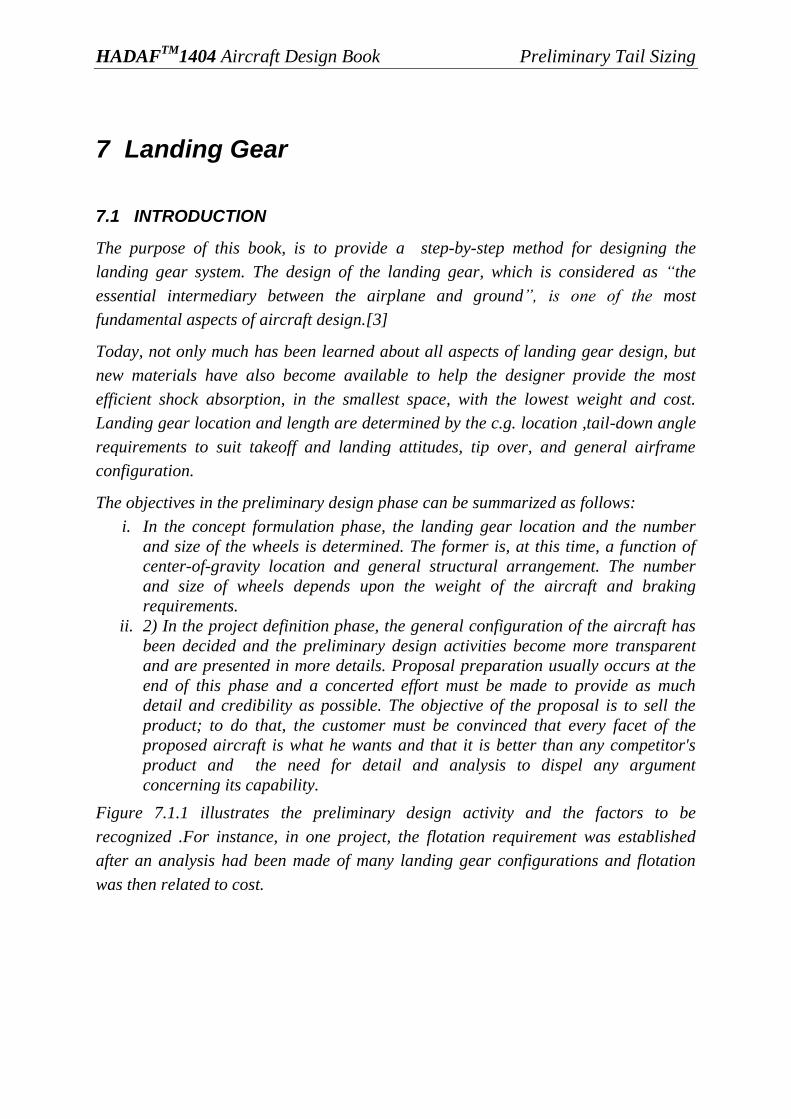
HADAFTM
1404 Aircraft Design Book Preliminary Tail Sizing
7 Landing Gear
7.1 INTRODUCTION
The purpose of this book, is to provide a step-by-step method for designing the
landing gear system. The design of the landing gear, which is considered as “the
essential intermediary between the airplane and ground”, is one of the most
fundamental aspects of aircraft design.[3]
Today, not only much has been learned about all aspects of landing gear design, but
new materials have also become available to help the designer provide the most
efficient shock absorption, in the smallest space, with the lowest weight and cost.
Landing gear location and length are determined by the c.g. location ,tail-down angle
requirements to suit takeoff and landing attitudes, tip over, and general airframe
configuration.
The objectives in the preliminary design phase can be summarized as follows:
i. In the concept formulation phase, the landing gear location and the number
and size of the wheels is determined. The former is, at this time, a function of
center-of-gravity location and general structural arrangement. The number
and size of wheels depends upon the weight of the aircraft and braking
requirements.
ii. 2) In the project definition phase, the general configuration of the aircraft has
been decided and the preliminary design activities become more transparent
and are presented in more details. Proposal preparation usually occurs at the
end of this phase and a concerted effort must be made to provide as much
detail and credibility as possible. The objective of the proposal is to sell the
product; to do that, the customer must be convinced that every facet of the
proposed aircraft is what he wants and that it is better than any competitor's
product and the need for detail and analysis to dispel any argument
concerning its capability.
Figure 7.1.1 illustrates the preliminary design activity and the factors to be
recognized .For instance, in one project, the flotation requirement was established
after an analysis had been made of many landing gear configurations and flotation
was then related to cost.
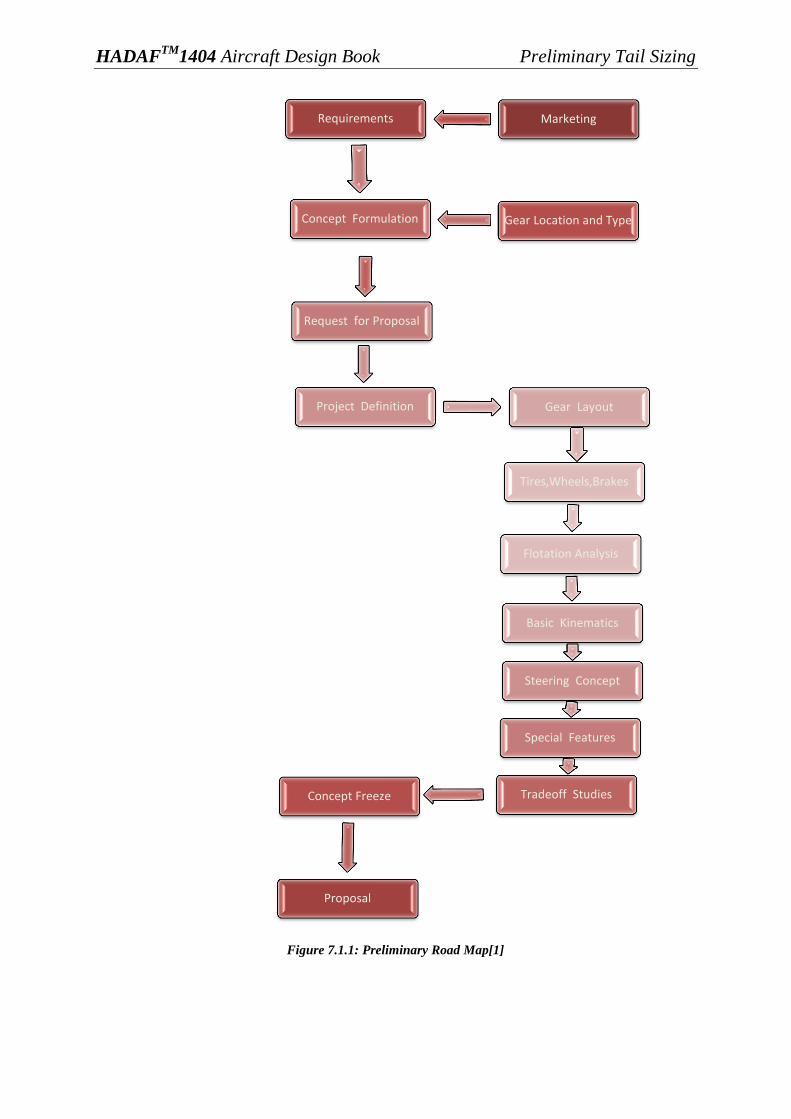
HADAFTM
1404 Aircraft Design Book Preliminary Tail Sizing
Figure 7.1.1: Preliminary Road Map[1]
Marketing Requirements
Gear Location and Type Concept Formulation
Request for Proposal
Project Definition Gear Layout
Tires,Wheels,Brakes
Flotation Analysis
Basic Kinematics
Steering Concept
Special Features
Tradeoff Studies Concept Freeze
Proposal
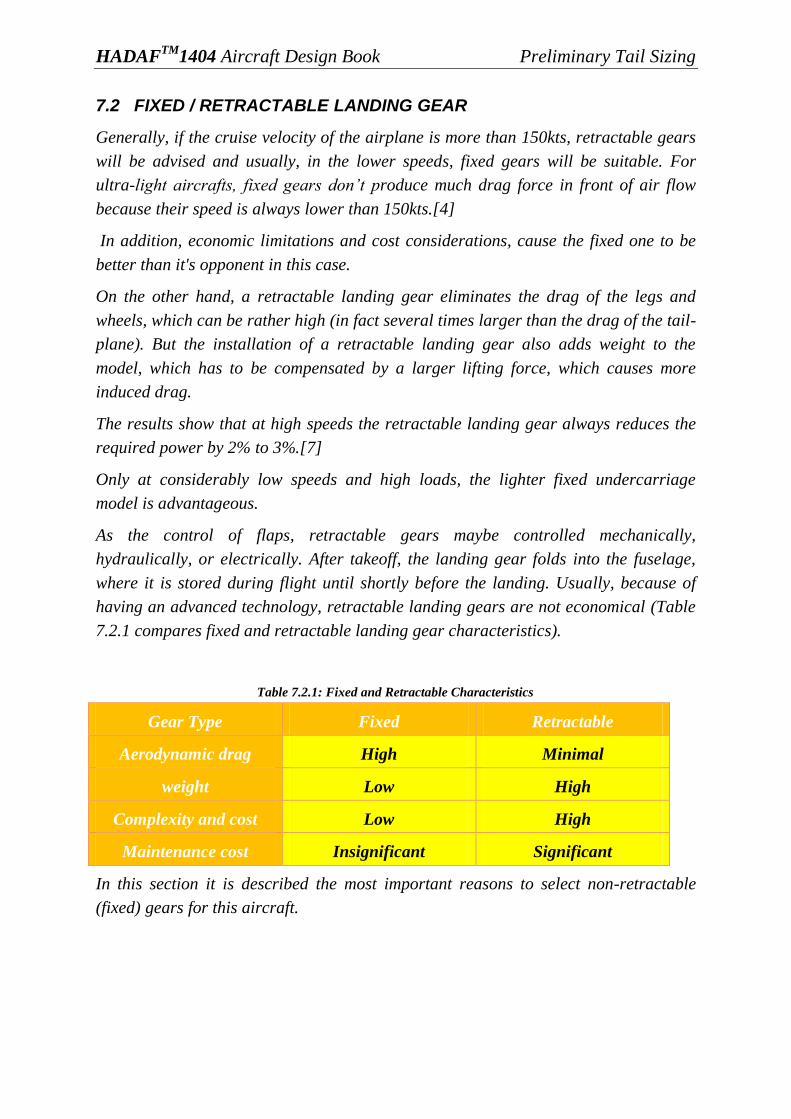
HADAFTM
1404 Aircraft Design Book Preliminary Tail Sizing
7.2 FIXED / RETRACTABLE LANDING GEAR
Generally, if the cruise velocity of the airplane is more than 150kts, retractable gears
will be advised and usually, in the lower speeds, fixed gears will be suitable. For
ultra-light aircrafts, fixed gears don‟t produce much drag force in front of air flow
because their speed is always lower than 150kts.[4]
In addition, economic limitations and cost considerations, cause the fixed one to be
better than it's opponent in this case.
On the other hand, a retractable landing gear eliminates the drag of the legs and
wheels, which can be rather high (in fact several times larger than the drag of the tail-
plane). But the installation of a retractable landing gear also adds weight to the
model, which has to be compensated by a larger lifting force, which causes more
induced drag.
The results show that at high speeds the retractable landing gear always reduces the
required power by 2% to 3%.[7]
Only at considerably low speeds and high loads, the lighter fixed undercarriage
model is advantageous.
As the control of flaps, retractable gears maybe controlled mechanically,
hydraulically, or electrically. After takeoff, the landing gear folds into the fuselage,
where it is stored during flight until shortly before the landing. Usually, because of
having an advanced technology, retractable landing gears are not economical (Table
7.2.1 compares fixed and retractable landing gear characteristics).
Table 7.2.1: Fixed and Retractable Characteristics
Gear Type Fixed Retractable
Aerodynamic drag High Minimal
weight Low High
Complexity and cost Low High
Maintenance cost Insignificant Significant
In this section it is described the most important reasons to select non-retractable
(fixed) gears for this aircraft.

HADAFTM
1404 Aircraft Design Book Preliminary Tail Sizing
7.3 LANDING GEAR CONFIGURATION TYPES
In order to select a suitable landing gear configurations the choices here are as
follows:
1. Tail wheel or Tail-dragger
2. Conventional (nose-wheel or tricycle)
3. Tandem
4. Outrigger
5. Beaching gear
Wheeled undercarriages normally come in two types: "tail-dragger" undercarriage,
where there are two main wheels towards the front of the aircraft and a single, much
smaller, wheel at the rear(i.e. skid); or tricycle undercarriage where there are two
main wheels (or wheel assemblies) under the wings and a third smaller wheel in the
nose.
7.3.1 Tail-wheel(Tail-dragger)[2]
Figure 7.3.1.1: Taildragger Configuration
The tail-dragger arrangement was common during the early propeller era, as it
allows more room for propeller clearance. Tail-draggers are considered harder to
land and take-off because the arrangement is unstable, that is, a small deviation from
straight-line travel is naturally amplified by the greater drag of the mainwheel which
has moved farther away from the plane's center of gravity due to the deviation, and
usually require special pilot training. The Concorde, for instance, had a retractable
tail "bumper" wheel. Delta wing aircrafts need a high angle of attack (AOA) when
taking off. Some aircraft with retractable conventional landing gear have a fixed tail
wheel, which generate minimal drag (since most of the airflow past the tail wheel has
been blanketed by the fuselage) and even improve yaw stability in some cases.
The tail-dragger configuration does have advantages. The rear wheel means the plane
naturally sits in a nose-up attitude when on the ground; this is useful for operations
on unpaved surfaces like gravel, where sands blast, could damage the propeller. The
tail-wheel also transmits loads to the airframe in a way that is less likely to cause
airframe damage over time operating on rough fields. The simpler main gear and
small tail-wheel results in both lighter weight and less complexity in the case of using

HADAFTM
1404 Aircraft Design Book Preliminary Tail Sizing
retractable. Likewise, a fixed-gear tail-dragger exhibits less interference drag and
form drag in flight than a fixed-gear aircraft with tricycle gear. Tail wheels are
smaller and less expensive to buy and maintain and manual-handling of a tail-wheel
aircraft on the ground is easier.
Its advantages can be listed in brief as follows
The tail-wheel is small, light and of simple design.
When brakes are applied the vertical loads on the main gear will increase, therefore
reducing the risk of skidding.
The main reasons why the tail-wheel undercarriage has been almost completely
superseded by the nose-wheel or tricycle gear is that it also suffers the following
drawbacks:
Violent brakes tend to tip the aircraft onto its nose.
The braking force, acts ahead of the center of gravity and thus has a destabilizing
effect when the aircraft is moving at an angle of yaw relative to its track. This may
cause the ground loop.
In a two point landing, a tail-down moment will be created by the impact force on the
main landing gear, resulting in an increase in lift, which makes the aircraft bounce.
The inclined cabin floor will be uncomfortable for the passengers and inconvenient
for loading and unloading.
In the tail-down attitude the inclination of the fuselage will limit the pilot‟s view over
the nose of the aircraft.
During the initial takeoff run, the drag is considerably high until the tail can be
raised.
7.3.2 Nose wheel (Tricycle)
Most modern aircrafts have tricycle undercarriages. Tricycle gear describes an
aircraft undercarriage, or landing gear, arranged in a tricycle fashion.
Figure 7.3.2.1: Nose wheel Configuration

HADAFTM
1404 Aircraft Design Book Preliminary Tail Sizing
The tricycle arrangement has one wheel in the front, called the nose wheel, and two or
more main wheels slightly aft of the center of gravity. Because of the ease of operating
of a tricycle gear aircraft on the ground, the configuration is the most widely used on
aircraft.
Tricycle gear is essentially the reverse of conventional landing gear or tail-dragger.
Tricycle gear aircrafts have the advantage of being much more difficult to be made
'nose up', which is significantly likely to happen for a tail-dragger in the case of
hitting a bump or heavy brakes applied. Tricycle gear planes are also easier to handle
on the ground and reduce the possibility of a ground loop. This is due to the main
gear being behind the center of mass. Tricycle gear also provides an advantage of
better vision for pilot, as the nose of the aircraft is level and, unlike in the aircrafts
with conventional landing gear, does not block the view ahead. Tricycle gear aircrafts
are easier to land because the attitude required to land on the main gear is the same
as that required in the flare, and they are less vulnerable to crosswinds. As a result,
the majority of modern aircraft are fitted with tricycle gear.[2]
Generally, the merits and drawbacks of the nose-wheel gear are the opposite of those
of the tail-wheel type. These advantages are:[6]
The braking forces are located behind the C.G and have the
stabilizing effect. Thus let the pilot to use the brakes with no
limitation.
With the aircraft on the ground, the fuselage and the cabin floor are
practically level.
The pilot enjoys a broad sight ahead, with more ease and comfort.
The nose-wheel is a safeguard against the aircraft turning over and
so protects the propeller when used.
During the initial part of the takeoff, the drag does not increase
excessively.
In a two-point landing the main gear creates the nose-down pitching
moment, which tends to restrain the aircraft and keep it from the
bounce.
The steady increase in landing speeds of modern aircraft has accentuated these advantages,
so that they carry more weight than the following disadvantages.
The nose unit must take 20% to 30% of the aircraft‟s weight in a steady brake
condition and it is therefore relatively heavy.
The landing gear will probably have to be fitted at a location where special structural
provisions will be required. In the case of retractable nose-gear on light aircraft it
may also be very difficult to find a stowage space inside the external contours of the
aircraft.
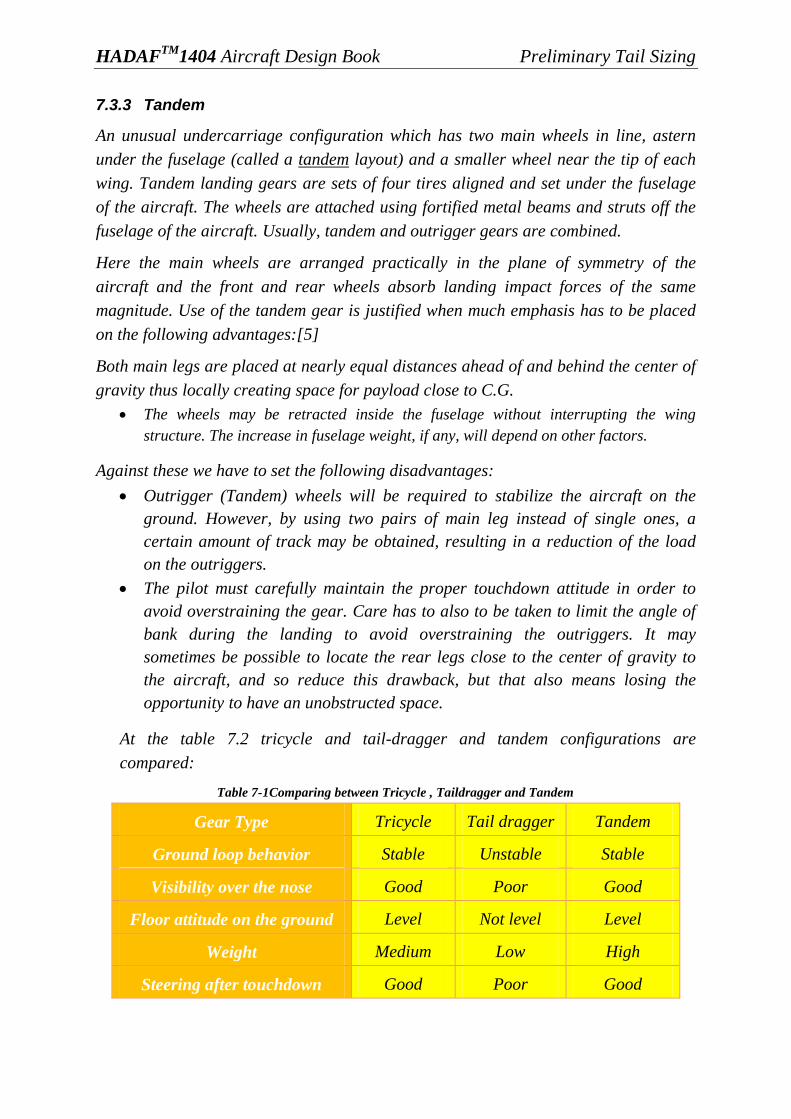
HADAFTM
1404 Aircraft Design Book Preliminary Tail Sizing
7.3.3 Tandem
An unusual undercarriage configuration which has two main wheels in line, astern
under the fuselage (called a tandem layout) and a smaller wheel near the tip of each
wing. Tandem landing gears are sets of four tires aligned and set under the fuselage
of the aircraft. The wheels are attached using fortified metal beams and struts off the
fuselage of the aircraft. Usually, tandem and outrigger gears are combined.
Here the main wheels are arranged practically in the plane of symmetry of the
aircraft and the front and rear wheels absorb landing impact forces of the same
magnitude. Use of the tandem gear is justified when much emphasis has to be placed
on the following advantages:[5]
Both main legs are placed at nearly equal distances ahead of and behind the center of
gravity thus locally creating space for payload close to C.G.
The wheels may be retracted inside the fuselage without interrupting the wing
structure. The increase in fuselage weight, if any, will depend on other factors.
Against these we have to set the following disadvantages:
Outrigger (Tandem) wheels will be required to stabilize the aircraft on the
ground. However, by using two pairs of main leg instead of single ones, a
certain amount of track may be obtained, resulting in a reduction of the load
on the outriggers.
The pilot must carefully maintain the proper touchdown attitude in order to
avoid overstraining the gear. Care has to also to be taken to limit the angle of
bank during the landing to avoid overstraining the outriggers. It may
sometimes be possible to locate the rear legs close to the center of gravity to
the aircraft, and so reduce this drawback, but that also means losing the
opportunity to have an unobstructed space.
At the table 7.2 tricycle and tail-dragger and tandem configurations are
compared:
Table 7-1Comparing between Tricycle , Taildragger and Tandem
Gear Type Tricycle Tail dragger Tandem
Ground loop behavior Stable Unstable Stable
Visibility over the nose Good Poor Good
Floor attitude on the ground Level Not level Level
Weight Medium Low High
Steering after touchdown Good Poor Good

HADAFTM
1404 Aircraft Design Book Preliminary Tail Sizing
Steering while taxing Good Poor Good
Take-off rotation Good Good Good
Take-off procedure Easy Needs skill Easy
So, as noted above, it is suggested to use tricycle gear configuration for designing this
aircraft. Useful operation conditions, economic consideration, safety conditions and
other factors are considered to select this kind of landing gear configuration.
7.4 DISPOSITION OF LANDING GEAR AND STRUT
The positioning of the landing gear is based primarily on stability considerations
during taxiing, liftoff and touchdown, i.e., the aircraft should be in no danger of
turning over on its side once it is on the ground. Compliance with this requirement
can be determined by examining the takeoff/landing performance characteristics and
the relationship between the location of the landing gear and the aircraft c.g. For
instance it is very important for an aircraft that, the touchdown loads exert in a
manner which tip the aircraft, nose down. Otherwise the aircraft would bounce.
There are two geometric criteria which need to be considered in deciding the
disposition of landing gear struts:
1. Tip-over criteria
2. Ground clearance criteria
7 .4 .1 Tip-Over Criteria:
i. Longitudinal Tip over criteria:[4]
The main landing gear must be behind the aft C.G location. The 15 degree angle
shown in figure 7.4.1.1 represents the usual relation between main gear and aft C.G.
Figure 7.4.1.1: Longitudinal Tip over Criteria
ii. Lateral Tip over criteria:[4]

HADAFTM
1404 Aircraft Design Book Preliminary Tail Sizing
The lateral tip over is dictated by ψ angle. Figure 7.4.1.2 shows the ψ angle in the
tricycle:
Figure 7.4.1.2: Stable configuration of Landing Gear System
7 .4 .2 Ground Clearance Criteria:[2]
The Figures 7.4.2.1.a and 7.4.2.1.b show the required ground clearance angles. The
lateral ground clearance angle applies to tricycle and tail-dragger but the
longitudinal ground clearance angle applies to tricycle only.
Figure 7.4.2.1.a
Figure 7.4.2.1.b
The available pitch angle (θ), (based on the landing gear limitations), at liftoff and
touchdown must be equal, or preferably exceed, the requirements imposed by
performance or flight characteristics. A geometric limitation to the pitch angle is
detrimental to the liftoff speed and hence to the takeoff field length. Similarly, a
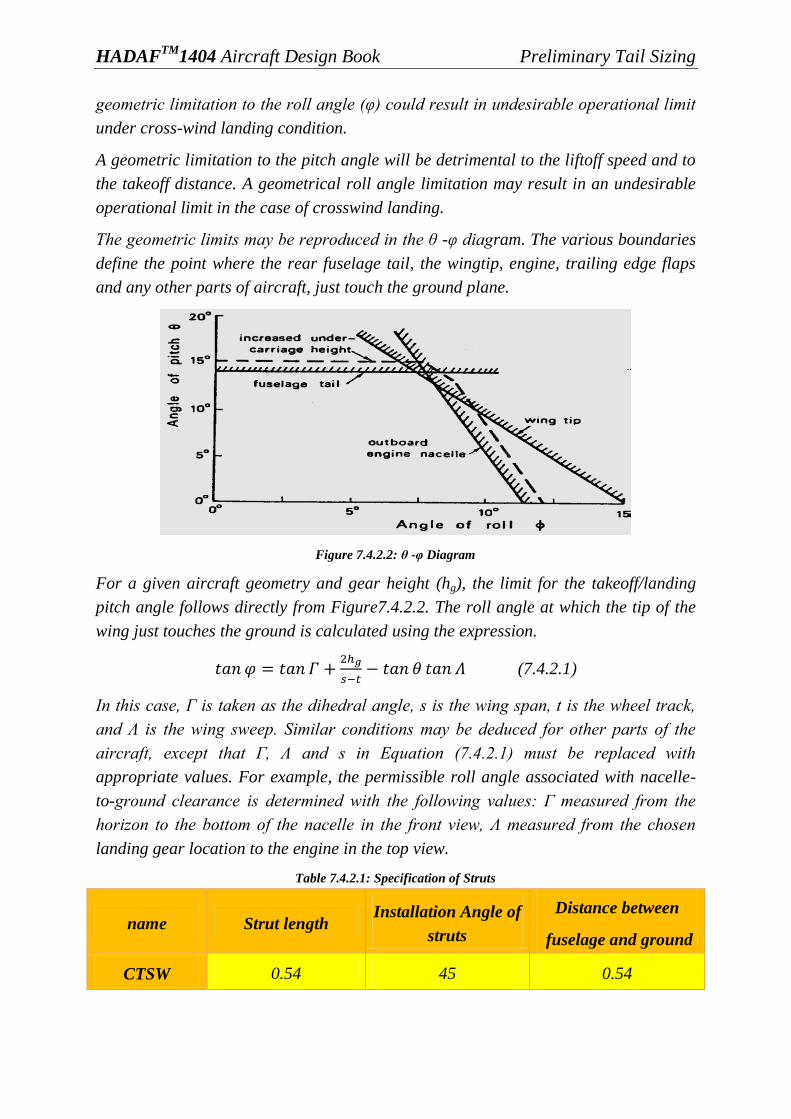
HADAFTM
1404 Aircraft Design Book Preliminary Tail Sizing
geometric limitation to the roll angle (φ) could result in undesirable operational limit
under cross-wind landing condition.
A geometric limitation to the pitch angle will be detrimental to the liftoff speed and to
the takeoff distance. A geometrical roll angle limitation may result in an undesirable
operational limit in the case of crosswind landing.
The geometric limits may be reproduced in the θ -φ diagram. The various boundaries
define the point where the rear fuselage tail, the wingtip, engine, trailing edge flaps
and any other parts of aircraft, just touch the ground plane.
Figure 7.4.2.2: θ-φDiagram
For a given aircraft geometry and gear height (hg), the limit for the takeoff/landing
pitch angle follows directly from Figure7.4.2.2. The roll angle at which the tip of the
wing just touches the ground is calculated using the expression.
(7.4.2.1)
In this case, Γ is taken as the dihedral angle, s is the wing span, t is the wheel track,
and Λ is the wing sweep. Similar conditions may be deduced for other parts of the
aircraft, except that Γ, Λ and s in Equation (7.4.2.1) must be replaced with
appropriate values. For example, the permissible roll angle associated with nacelle-
to-ground clearance is determined with the following values: Γ measured from the
horizon to the bottom of the nacelle in the front view, Λ measured from the chosen
landing gear location to the engine in the top view.
Table 7.4.2.1: Specification of Struts
name Strut length Installation Angle of
struts
Distance between
fuselage and ground
CTSW 0.54 45 0.54
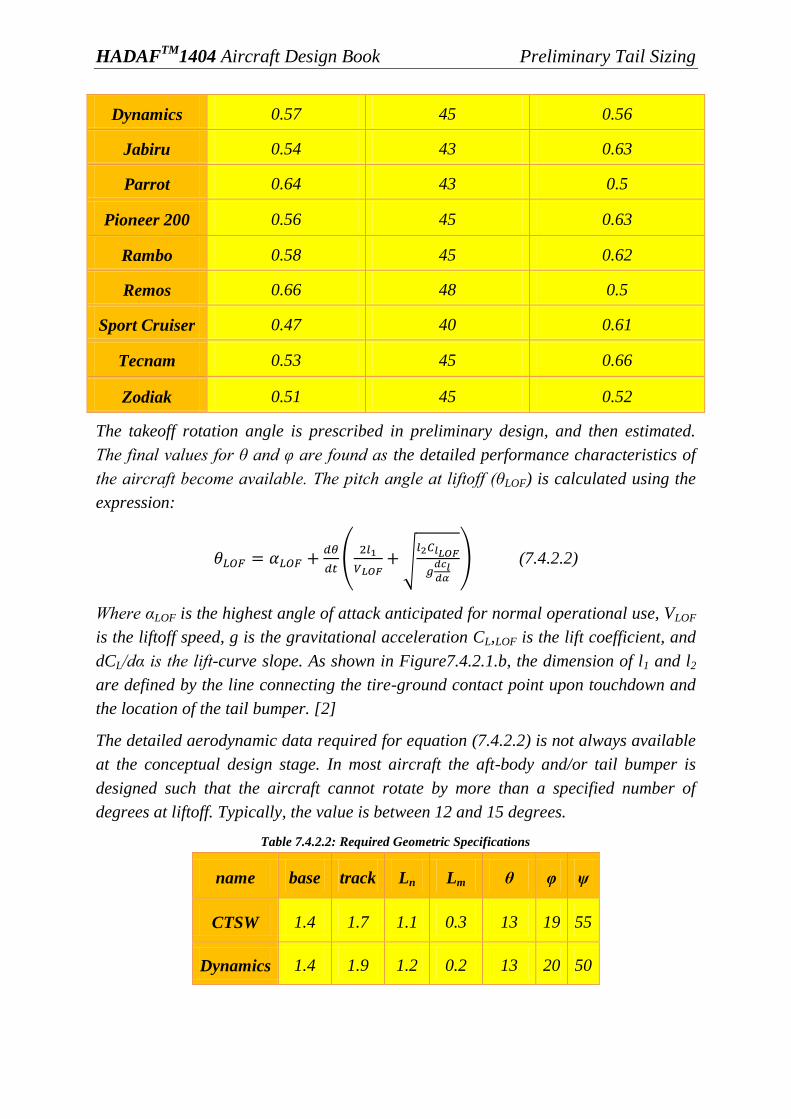
HADAFTM
1404 Aircraft Design Book Preliminary Tail Sizing
Dynamics 0.57 45 0.56
Jabiru 0.54 43 0.63
Parrot 0.64 43 0.5
Pioneer 200 0.56 45 0.63
Rambo 0.58 45 0.62
Remos 0.66 48 0.5
Sport Cruiser 0.47 40 0.61
Tecnam 0.53 45 0.66
Zodiak 0.51 45 0.52
The takeoff rotation angle is prescribed in preliminary design, and then estimated.
The final values for θ and φ are found as the detailed performance characteristics of
the aircraft become available. The pitch angle at liftoff (θLOF) is calculated using the
expression:
(
√
) (7.4.2.2)
Where αLOF is the highest angle of attack anticipated for normal operational use, VLOF
is the liftoff speed, g is the gravitational acceleration CL,LOF is the lift coefficient, and
dCL/dα is the lift-curve slope. As shown in Figure7.4.2.1.b, the dimension of l1 and l2
are defined by the line connecting the tire-ground contact point upon touchdown and
the location of the tail bumper. [2]
The detailed aerodynamic data required for equation (7.4.2.2) is not always available
at the conceptual design stage. In most aircraft the aft-body and/or tail bumper is
designed such that the aircraft cannot rotate by more than a specified number of
degrees at liftoff. Typically, the value is between 12 and 15 degrees.
Table 7.4.2.2: Required Geometric Specifications
name base track Ln Lm θ φ ψ
CTSW 1.4 1.7 1.1 0.3 13 19 55
Dynamics 1.4 1.9 1.2 0.2 13 20 50
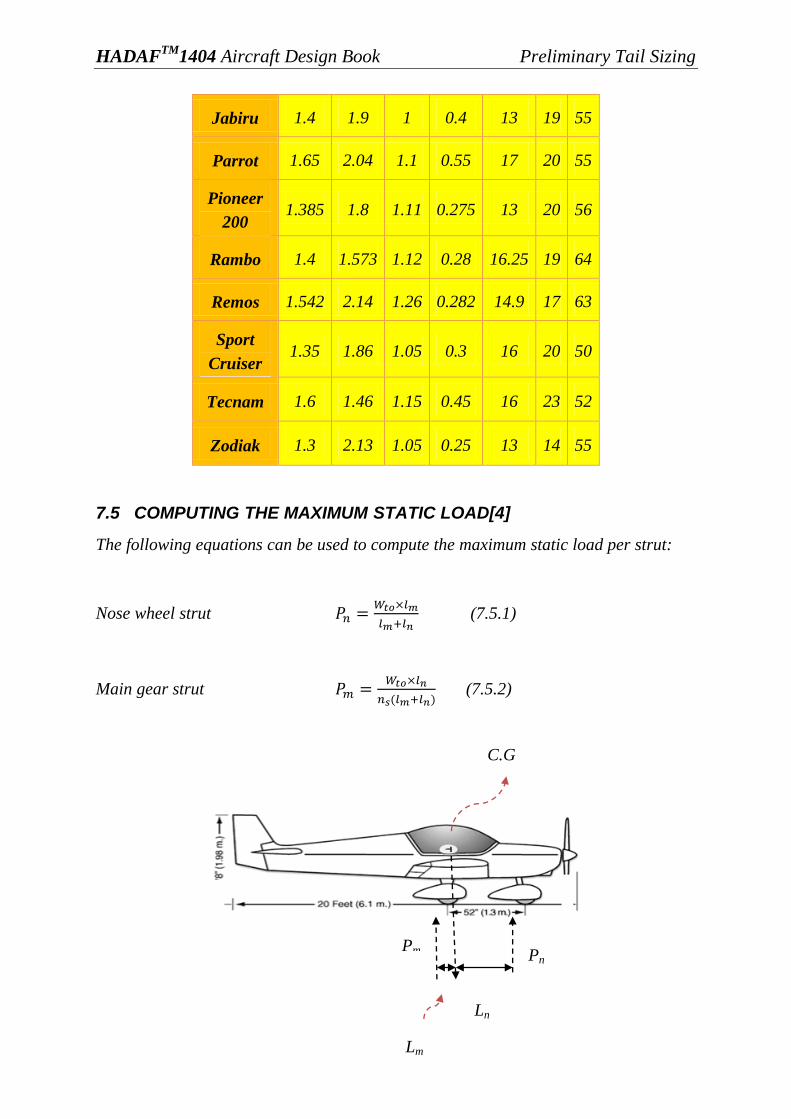
HADAFTM
1404 Aircraft Design Book Preliminary Tail Sizing
Jabiru 1.4 1.9 1 0.4 13 19 55
Parrot 1.65 2.04 1.1 0.55 17 20 55
Pioneer
200 1.385 1.8 1.11 0.275 13 20 56
Rambo 1.4 1.573 1.12 0.28 16.25 19 64
Remos 1.542 2.14 1.26 0.282 14.9 17 63
Sport
Cruiser 1.35 1.86 1.05 0.3 16 20 50
Tecnam 1.6 1.46 1.15 0.45 16 23 52
Zodiak 1.3 2.13 1.05 0.25 13 14 55
7.5 COMPUTING THE MAXIMUM STATIC LOAD[4]
The following equations can be used to compute the maximum static load per strut:
Nose wheel strut
(7.5.1)
Main gear strut
(7.5.2)
Pn Pm
Lm
Ln
C.G
HADAFTM
1404 Aircraft Design Book Preliminary Tail Sizing
7.6 Selection of Tires[2]
The choice of tire type depends on some special factors such as maximum allowable
static loading, maximum allowable runway speed and airfield conditions. Figure
below shows examples of the recommended tires.
i. Grooved tires: This pattern normally used is provided with ribs. This is necessary in
order to obtain good adhesion on wet runways and minimize the effects of cutting
action of stones and flints in the runway surface.
ii. Chinned tires: Aircrafts with engines located in the wing roots or at the sides of the
rear fuselage use tires provided with a chine.
iii. Anti-shimmy tire: They are mainly used on light aircraft with a single, castoring nose
wheel. Shimmy is an oscillatory, combined lateral-yaw motion of the landing gear
caused by the interaction between dynamic tire behavior and landing gear structural
dynamics. The motion typically has a frequency in the range of 10 to 30 Hz. The
amplitude may grow to a level of annoying vibrations affecting the comfort and
visibility of the pilot, or can even result in severe structural damage and landing gear
collapse. Shimmy can occur on both nose and main landing gears, although the latter
case is more rare. Most publications on shimmy found in the open literature typically
deal with twin-wheeled cantilevered landing gears, which apparently are more
susceptible to shimmy vibrations compared to other landing gear configurations.[8]
iv. Smooth Contour: This type was designed for airplanes with non-retractable landing
gears (this type considered obsolete).
v. Low Pressure: This type is comparable to smooth contour and has beads of smaller
diameter, larger volume and lower pressure.
vi. Extra High Pressure: It has high load capacity and narrow width. It is almost
universal on military aircrafts.
vii. Low Profile High Pressure: It is useful for very high take-off speeds.
According to the some safety considerations about strength of tires and the prevention
of dangerous effects of Shimmy phenomenon on the nose gear, the anti-shimmy tire is
suggested for HADAF1404
aircraft.
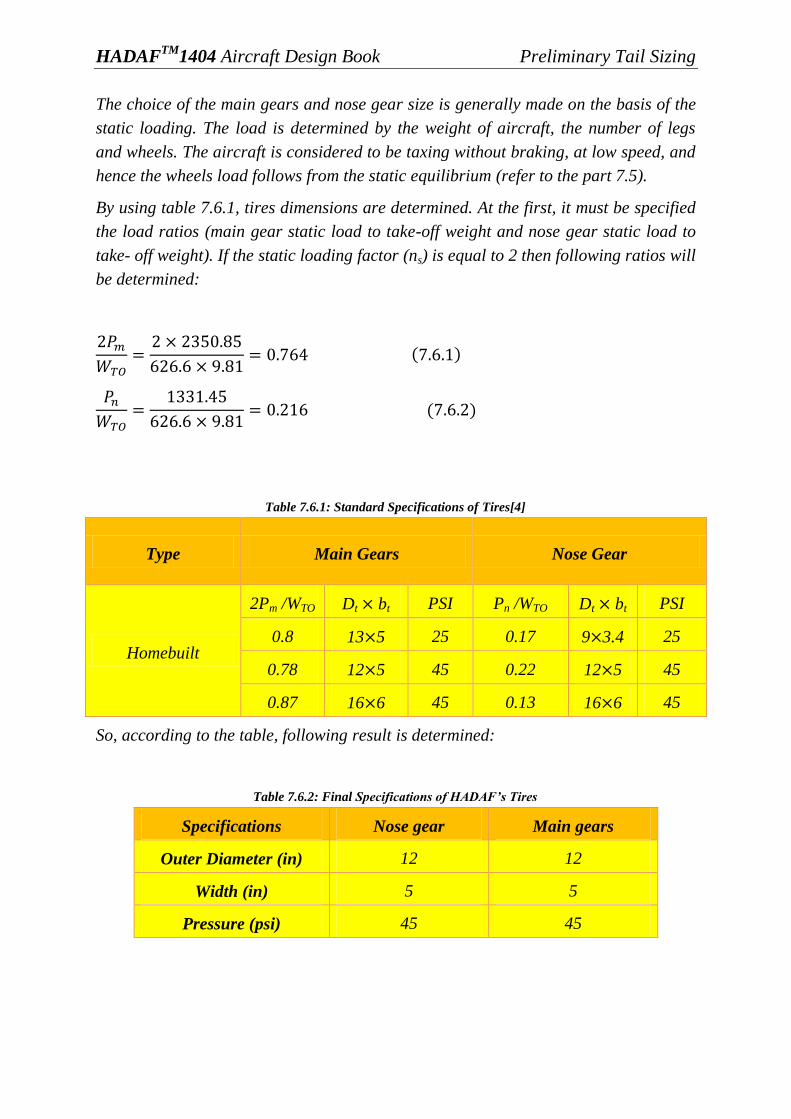
HADAFTM
1404 Aircraft Design Book Preliminary Tail Sizing
The choice of the main gears and nose gear size is generally made on the basis of the
static loading. The load is determined by the weight of aircraft, the number of legs
and wheels. The aircraft is considered to be taxing without braking, at low speed, and
hence the wheels load follows from the static equilibrium (refer to the part 7.5).
By using table 7.6.1, tires dimensions are determined. At the first, it must be specified
the load ratios (main gear static load to take-off weight and nose gear static load to
take- off weight). If the static loading factor (ns) is equal to 2 then following ratios will
be determined:
Table 7.6.1: Standard Specifications of Tires[4]
Type Main Gears Nose Gear
Homebuilt
2Pm /WTO Dt bt PSI Pn /WTO Dt bt PSI
0.8 13 5 25 0.17 9 3.4 25
0.78 12 5 45 0.22 12 5 45
0.87 16 6 45 0.13 16 6 45
So, according to the table, following result is determined:
Table 7.6.2: Final SpecificationsofHADAF’sTires
Specifications Nose gear Main gears
Outer Diameter (in) 12 12
Width (in) 5 5
Pressure (psi) 45 45
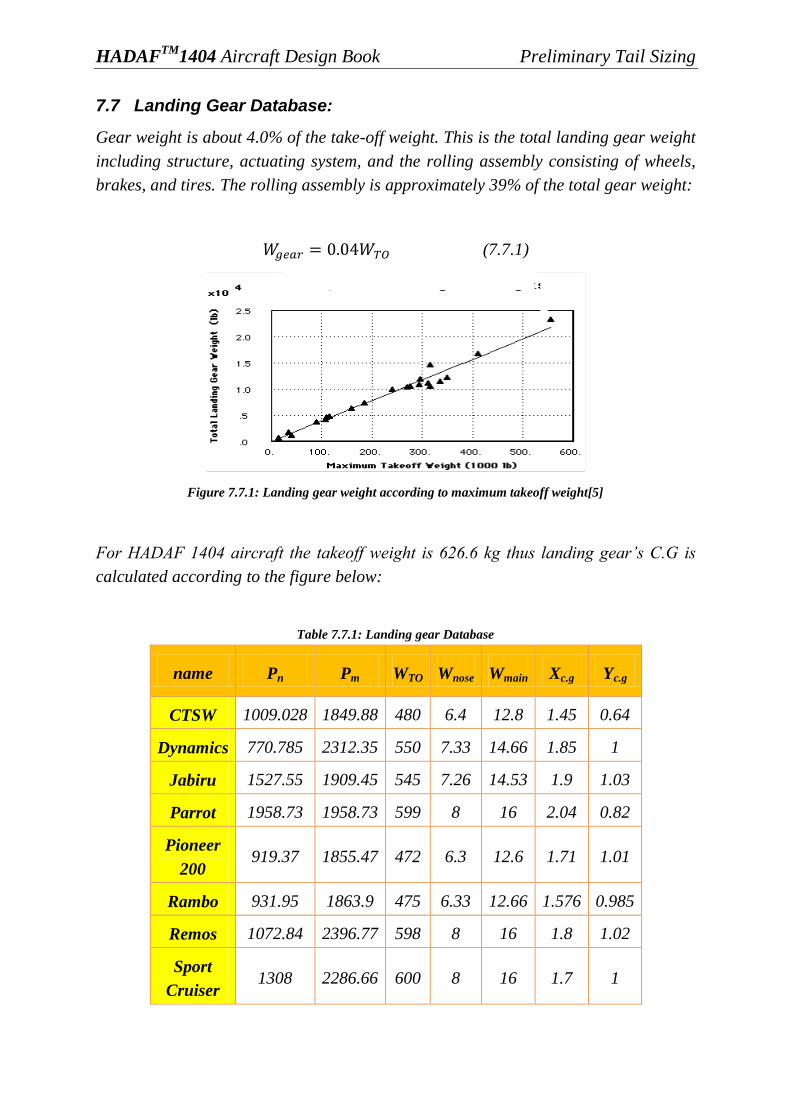
HADAFTM
1404 Aircraft Design Book Preliminary Tail Sizing
7.7 Landing Gear Database:
Gear weight is about 4.0% of the take-off weight. This is the total landing gear weight
including structure, actuating system, and the rolling assembly consisting of wheels,
brakes, and tires. The rolling assembly is approximately 39% of the total gear weight:
(7.7.1)
Figure 7.7.1: Landing gear weight according to maximum takeoff weight[5]
For HADAF 1404 aircraft the takeoff weight is 626.6 kg thus landing gear‟s C.G is
calculated according to the figure below:
Table 7.7.1: Landing gear Database
name Pn Pm WTO Wnose Wmain Xc.g Yc.g
CTSW 1009.028 1849.88 480 6.4 12.8 1.45 0.64
Dynamics 770.785 2312.35 550 7.33 14.66 1.85 1
Jabiru 1527.55 1909.45 545 7.26 14.53 1.9 1.03
Parrot 1958.73 1958.73 599 8 16 2.04 0.82
Pioneer
200 919.37 1855.47 472 6.3 12.6 1.71 1.01
Rambo 931.95 1863.9 475 6.33 12.66 1.576 0.985
Remos 1072.84 2396.77 598 8 16 1.8 1.02
Sport
Cruiser 1308 2286.66 600 8 16 1.7 1

HADAFTM
1404 Aircraft Design Book Preliminary Tail Sizing
Tecnam 1655.43 2115.28 600 8 16 1.63 1.1
Zodiak 1122.49 2357.23 595 7.94 15.86 1.74 0.9
By using the following landing gear data base ,for the nearest aircraft to HADAF, landing gear C.G
information is specified. these information will be used to specify the main aircraft‟s C.G. Thus, the
initial information that is used in C.G modification loop for first step is :

HADAFTM
1404 Aircraft Design Book Preliminary Tail Sizing
Table 7.7.2: Preliminary Specifications of HADAF's Landing Gear System
base length 1.45 m
track length 1.85 m
Ln 1.13 m
Lm 0.32 m
θ 16
φ 20
ψ 50
Pn 1331.45
Pm 2350.85
strut length 0.56
Installation angle of struts 45
WTO 626.6 kg
Wnose 8.3 kg
Wmain 16.6 kg
Xc.g 1.8 m
Yc.g 1 m

HADAFTM
1404 Aircraft Design Book Preliminary Tail Sizing
7.8 Final Drawing of Landing Gear System
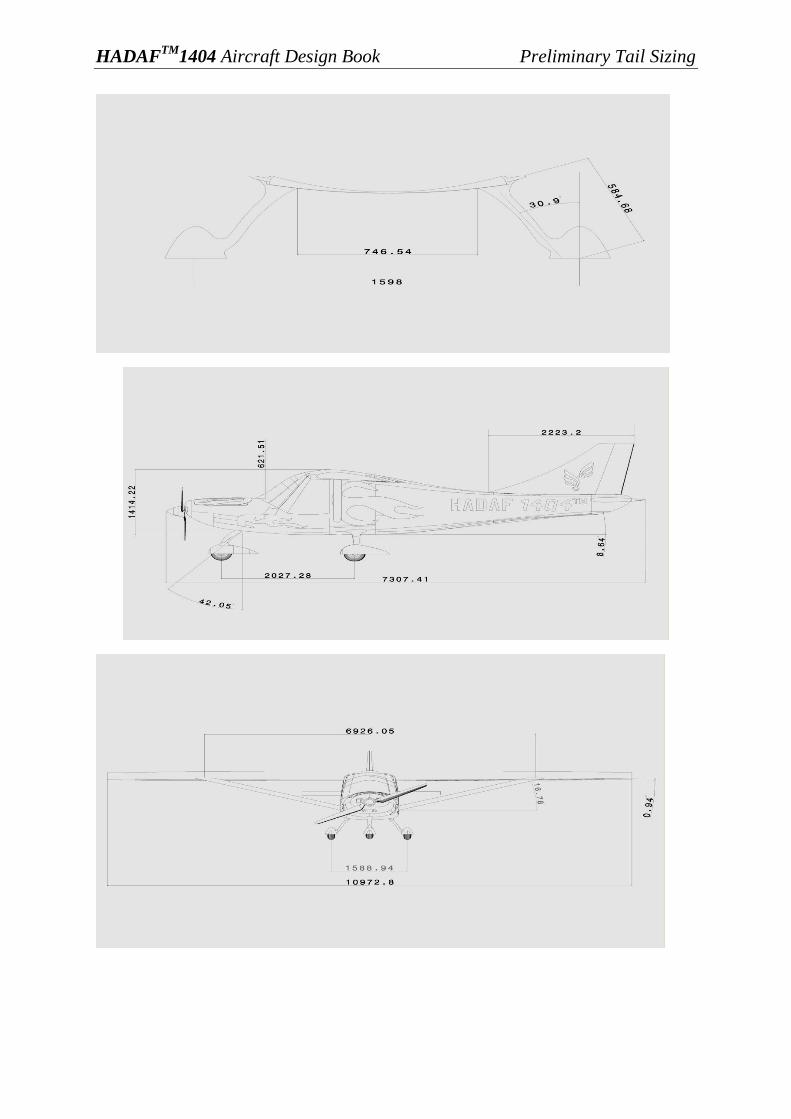
HADAFTM
1404 Aircraft Design Book Preliminary Tail Sizing
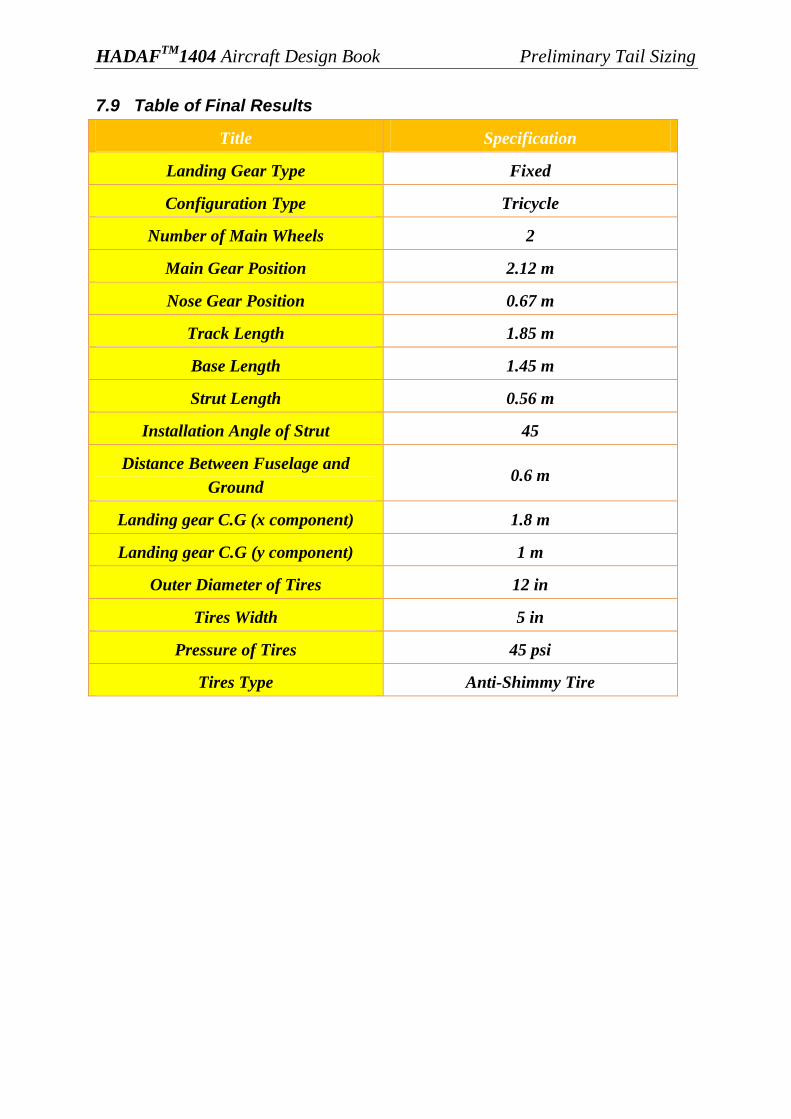
HADAFTM
1404 Aircraft Design Book Preliminary Tail Sizing
7.9 Table of Final Results
Title Specification
Landing Gear Type Fixed
Configuration Type Tricycle
Number of Main Wheels 2
Main Gear Position 2.12 m
Nose Gear Position 0.67 m
Track Length 1.85 m
Base Length 1.45 m
Strut Length 0.56 m
Installation Angle of Strut 45
Distance Between Fuselage and
Ground 0.6 m
Landing gear C.G (x component) 1.8 m
Landing gear C.G (y component) 1 m
Outer Diameter of Tires 12 in
Tires Width 5 in
Pressure of Tires 45 psi
Tires Type Anti-Shimmy Tire

HADAFTM
1404 Aircraft Design Book Preliminary Tail Sizing
7.10 ROAD MAP
Landing Gear Design
Conceptual Design
Fixed or Retractable
Configuration Type
Number of Wheels
Landing Gear Position
Main Gear Position
Nose Gear Position
Selection of Tires
Detail Design
Strut-Wheel Interface
Shock Absorber
Brakes Consideration
HADAFTM
1404 Aircraft Design Book Preliminary Tail Sizing
7.11 REFERENDES
1) Currey,N.S.,Landing Gear Design Handbook, Lockheed Georgia Company , Marietta,
Georgia,30063,1982.
2) Torenbeek, E., Synthesis of Subsonic Airplane Design, Kluwer Boston Inc.,
Hingham, Maine, 1982.
3) Conway, B.G., Landing Gear Design, Chapman Ball,London, England, 1958.
4) Roskam. J., Airplane Flight Dynamics and Automatic Flight Controls, 1981, Roskam
Aviation and Engineering Corp•• Rt 4, Box 274. Ottawa. Kansas. 66067.
5) http://www.flightsimbooks.com/flightsimhandbook/
6) http://www.mh-aerotools.de/airfoils/pylon_retracts.htm
7) Shimmy of Aircraft Main Landing Gears, I.J.M.Besselin
HADAFTM
1404 Aircraft Design Book Weight and Balance Analysis
8 WEIGHT AND BALANCE ANALYSIS
8.1 INTRODUCTION
The purpose of this book is to determine the coordinates of center of gravity of
HADAF1404 ultra-light airplane and place it in the right location for different loading
scenarios.
The precise location of the aircraft C.G is essential in the positioning of the landing
gear, as well as for other MDO applications, e.g., flight mechanics, stability and
control, and performance. So we put this design procedure to the end of conceptual
design process. The road map of C.G location calculation process according to
Roskam airplane design method is shown in the following diagram. Each part will be
introduced precisely in the rest of report.
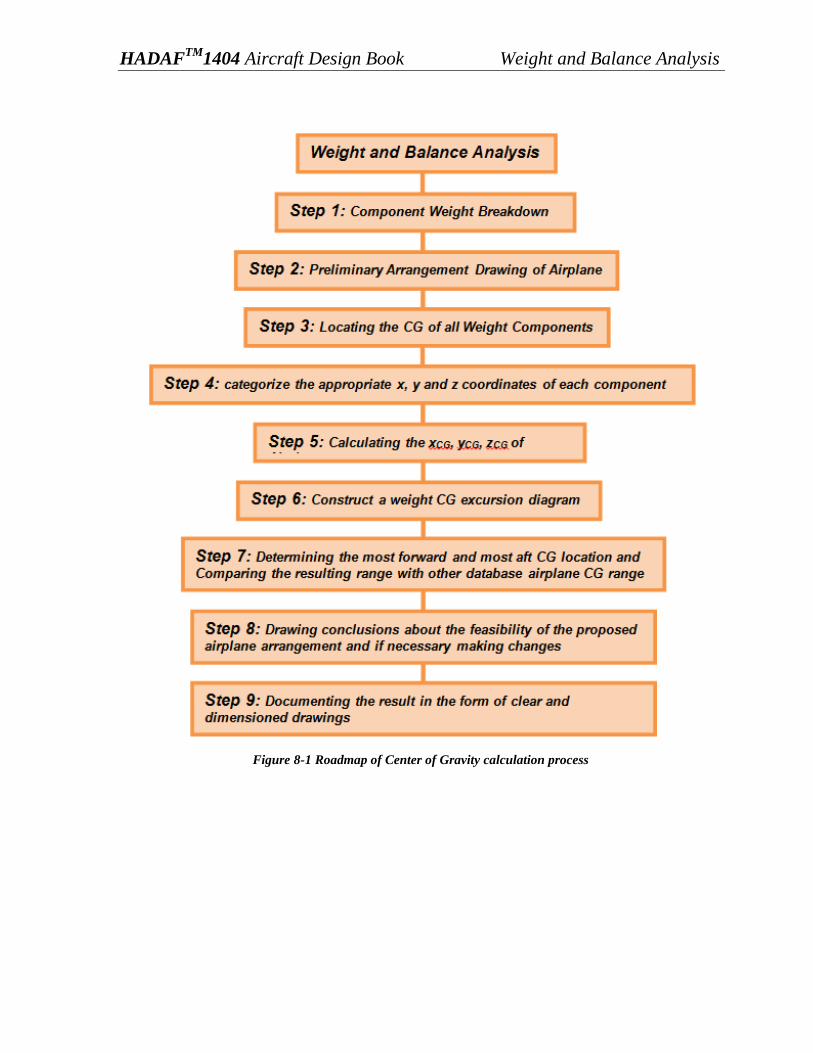
HADAFTM
1404 Aircraft Design Book Weight and Balance Analysis
Figure 8-1 Roadmap of Center of Gravity calculation process
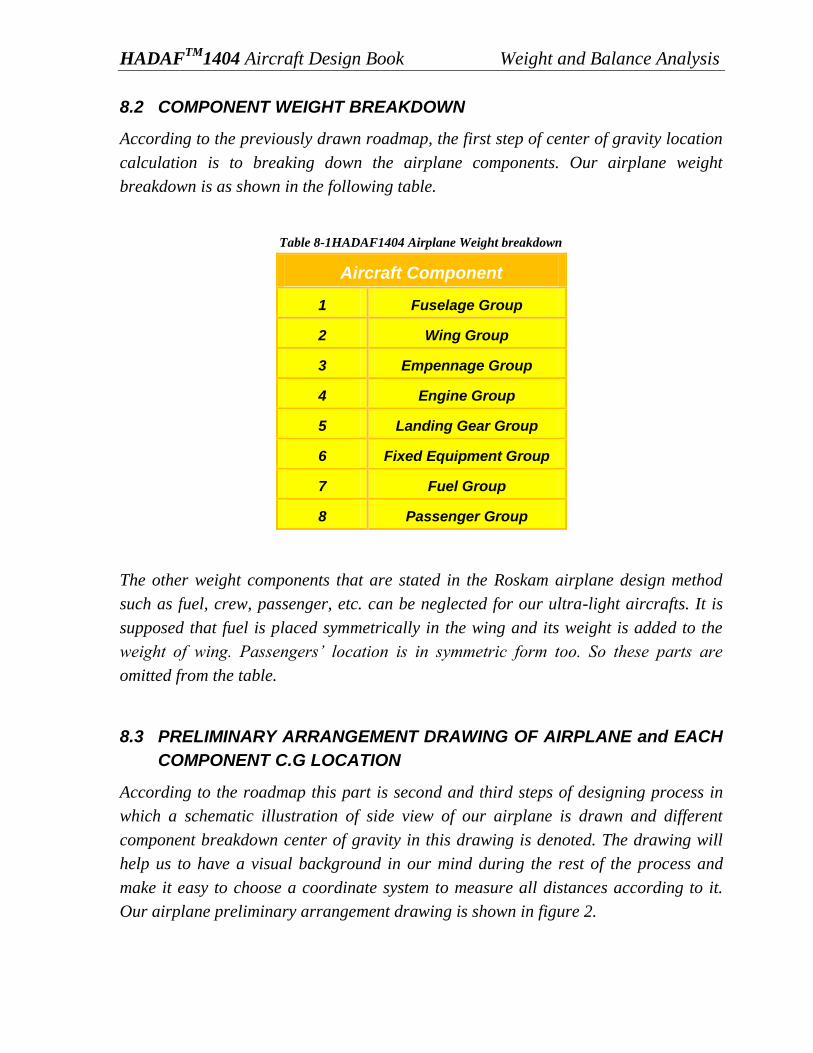
HADAFTM
1404 Aircraft Design Book Weight and Balance Analysis
8.2 COMPONENT WEIGHT BREAKDOWN
According to the previously drawn roadmap, the first step of center of gravity location
calculation is to breaking down the airplane components. Our airplane weight
breakdown is as shown in the following table.
Table 8-1HADAF1404 Airplane Weight breakdown
Aircraft Component
1 Fuselage Group
2 Wing Group
3 Empennage Group
4 Engine Group
5 Landing Gear Group
6 Fixed Equipment Group
7 Fuel Group
8 Passenger Group
The other weight components that are stated in the Roskam airplane design method
such as fuel, crew, passenger, etc. can be neglected for our ultra-light aircrafts. It is
supposed that fuel is placed symmetrically in the wing and its weight is added to the
weight of wing. Passengers‟ location is in symmetric form too. So these parts are
omitted from the table.
8.3 PRELIMINARY ARRANGEMENT DRAWING OF AIRPLANE and EACH
COMPONENT C.G LOCATION
According to the roadmap this part is second and third steps of designing process in
which a schematic illustration of side view of our airplane is drawn and different
component breakdown center of gravity in this drawing is denoted. The drawing will
help us to have a visual background in our mind during the rest of the process and
make it easy to choose a coordinate system to measure all distances according to it.
Our airplane preliminary arrangement drawing is shown in figure 2.
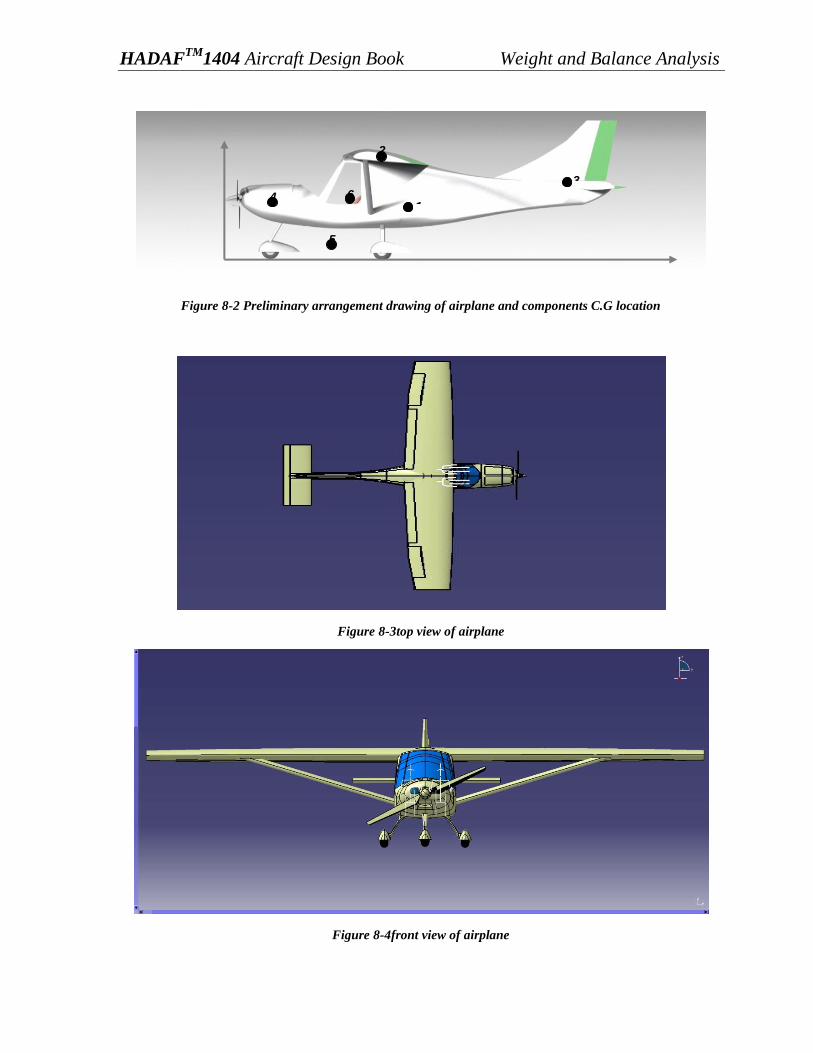
HADAFTM
1404 Aircraft Design Book Weight and Balance Analysis
Figure 8-2 Preliminary arrangement drawing of airplane and components C.G location
Figure 8-3top view of airplane
Figure 8-4front view of airplane
1
2
3
4
5
6
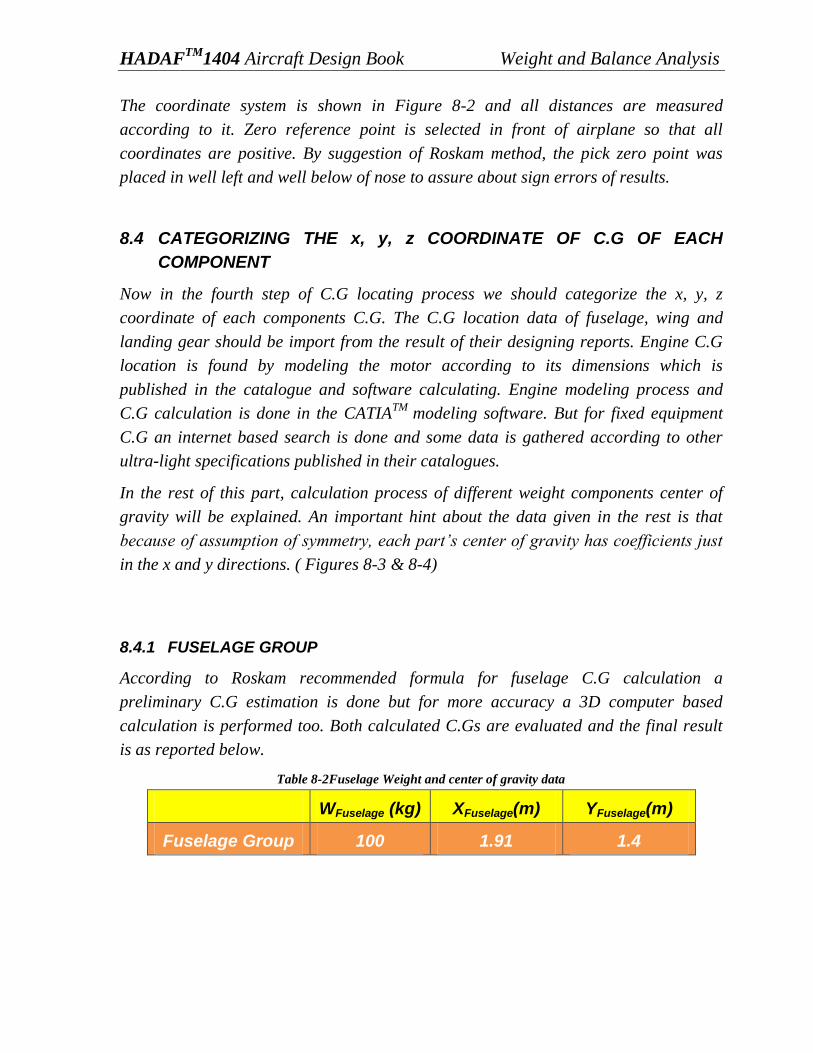
HADAFTM
1404 Aircraft Design Book Weight and Balance Analysis
The coordinate system is shown in Figure 8-2 and all distances are measured
according to it. Zero reference point is selected in front of airplane so that all
coordinates are positive. By suggestion of Roskam method, the pick zero point was
placed in well left and well below of nose to assure about sign errors of results.
8.4 CATEGORIZING THE x, y, z COORDINATE OF C.G OF EACH
COMPONENT
Now in the fourth step of C.G locating process we should categorize the x, y, z
coordinate of each components C.G. The C.G location data of fuselage, wing and
landing gear should be import from the result of their designing reports. Engine C.G
location is found by modeling the motor according to its dimensions which is
published in the catalogue and software calculating. Engine modeling process and
C.G calculation is done in the CATIATM
modeling software. But for fixed equipment
C.G an internet based search is done and some data is gathered according to other
ultra-light specifications published in their catalogues.
In the rest of this part, calculation process of different weight components center of
gravity will be explained. An important hint about the data given in the rest is that
because of assumption of symmetry, each part‟s center of gravity has coefficients just
in the x and y directions. ( Figures 8-3 & 8-4)
8.4.1 FUSELAGE GROUP
According to Roskam recommended formula for fuselage C.G calculation a
preliminary C.G estimation is done but for more accuracy a 3D computer based
calculation is performed too. Both calculated C.Gs are evaluated and the final result
is as reported below.
Table 8-2Fuselage Weight and center of gravity data
WFuselage (kg) XFuselage(m) YFuselage(m)
Fuselage Group 100 1.91 1.4
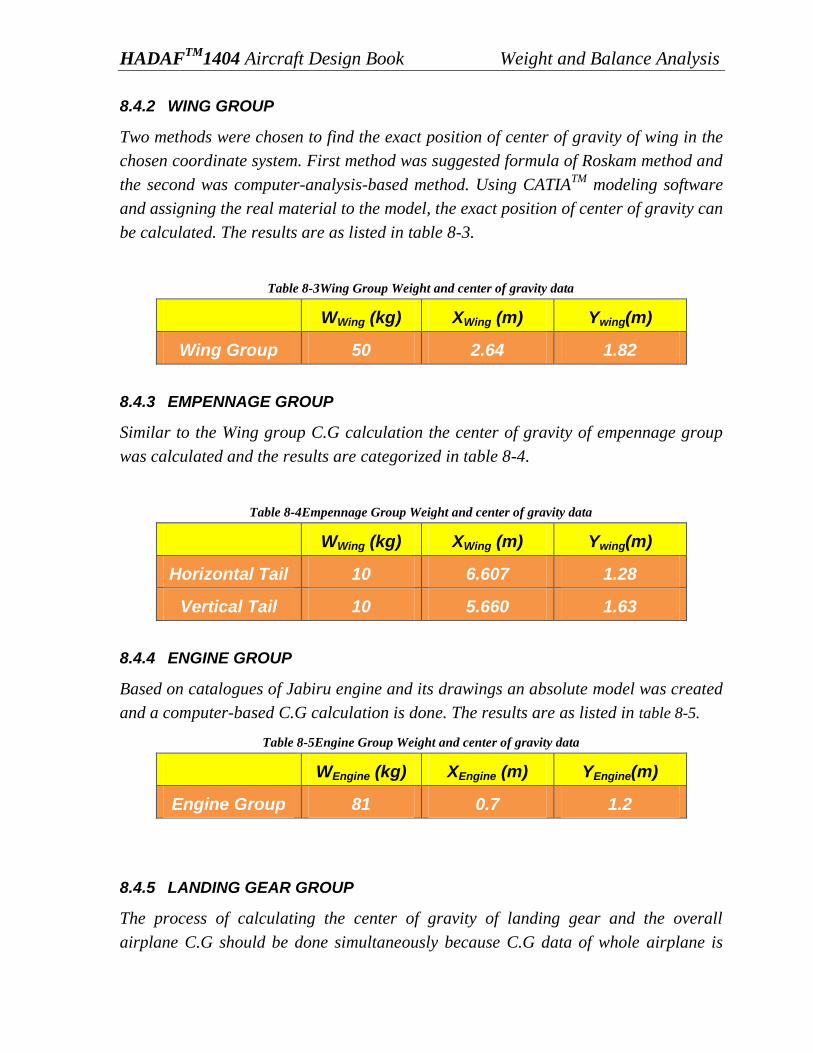
HADAFTM
1404 Aircraft Design Book Weight and Balance Analysis
8.4.2 WING GROUP
Two methods were chosen to find the exact position of center of gravity of wing in the
chosen coordinate system. First method was suggested formula of Roskam method and
the second was computer-analysis-based method. Using CATIATM
modeling software
and assigning the real material to the model, the exact position of center of gravity can
be calculated. The results are as listed in table 8-3.
Table 8-3Wing Group Weight and center of gravity data
WWing (kg) XWing (m) Ywing(m)
Wing Group 50 2.64 1.82
8.4.3 EMPENNAGE GROUP
Similar to the Wing group C.G calculation the center of gravity of empennage group
was calculated and the results are categorized in table 8-4.
Table 8-4Empennage Group Weight and center of gravity data
WWing (kg) XWing (m) Ywing(m)
Horizontal Tail 10 6.607 1.28
Vertical Tail 10 5.660 1.63
8.4.4 ENGINE GROUP
Based on catalogues of Jabiru engine and its drawings an absolute model was created
and a computer-based C.G calculation is done. The results are as listed in table 8-5.
Table 8-5Engine Group Weight and center of gravity data
WEngine (kg) XEngine (m) YEngine(m)
Engine Group 81 0.7 1.2
8.4.5 LANDING GEAR GROUP
The process of calculating the center of gravity of landing gear and the overall
airplane C.G should be done simultaneously because C.G data of whole airplane is

HADAFTM
1404 Aircraft Design Book Weight and Balance Analysis
one of the important parameters for calculating the dimensions of landing gear.On the
other hand the center of gravity location of landing gear is one of the inputs of overall
C.G location calculation process. So an iteration-based process is taken into
existence. The iterations were done with Microsoft Excel. A program was written to
calculate the landing gear dimensions and C.G location and another one prepared for
calculating the overall center of gravity location. In the first step a location for overall
airplane C.G is assumed and given to the landing gear C.G calculation program as an
input. And the output of this section is given to the whole C.G calculation program and
finally a C.G location is achieved. Evaluating the final result and the preliminary
assumption a new C.G location is assumed. This process continues until the
assumption and final result converges. The final C.G location for landing gear is as
listed in table 6.
Table 8-6Engine Group Weight and center of gravity data
WLanding Gear (kg) XLanding Gear (m) YLanding Gear (m)
Landing Gear Group 20 1.71 0.3
8.4.6 FIXED EQUIPMENTS GROUP
The assignment of component C.G range is based on the geometry, planform, and the
type of components involved. In the case of the primary components, e.g., fuselage,
wing and empennage, the location of these items remains relatively unchanged once
the conceptis frozen. Consequently, the C.G range is expected to be centered near the
volumetric centerof the component and is unlikely to shift too much. For ease of
identification, the primary components can be referred to as the constrained items.
As for secondary components, e.g., equipment and operational items, the location
ofeach component varies from one aircraft concept to another, depending on the
philosophy and preference of the airframe manufacturer. Note that as long as the
stowage and functionality constraints are not violated, these components can be
assigned to any available space throughout the aircraft due to their compactness.
Consequently, the corresponding c.grange is defined by the forward and aft
boundaries of the stowage space within which the item is located. Accordingly, these
components are termed the unconstrained items.
For means of calculating the overall C.G location a primary assumption was took into
account but in the upcoming sections to meet the most aft and forward boundaries it

HADAFTM
1404 Aircraft Design Book Weight and Balance Analysis
may be changed. This assumption made according to the other Homebuilt aircrafts
equipment placement which can be found in the technical brochures. Our primary
assumption is as listed below.
Table 8-7Equipment Group Weight and center of gravity data
WEquipment (kg) XEquipment (m) YEquipment (m)
EQUIPMENT GROUP 150 1.6 1.3
8.4.7 FUEL GROUP
The C.G location of the fuel varies as a function of time as the fuel is being consumed
during the duration of the mission. Given the added freedom in terms of the loading
pattern, these components are also classified as unconstrained items. The maximum
capacity of the fuel tank is 70 liters and its center of gravity can be determined to be
coincident of wing‟s C.G location because it is planned to place the fuel tank in the
wing. So the fuel center of gravity location data is as listed in table 8.
Table 8-8Fuel Group Weight and center of gravity data
WFuel (kg) XFuel (m) YFuel (m)
FUEL GROUP 55 2.64 1.82
8.4.8 PASSENGERS GROUP
HADAF 1404 is a 2 seat ultra-light airplane. The maximum passenger weight is 200
kg and the data of its center of gravity is categorized in table 9.
Table 8-9Passanger Group Weight and center of gravity data
WPassenger (kg) XPassenger (m) YPassenger (m)
PASSENGER
GROUP 200 2 1.35
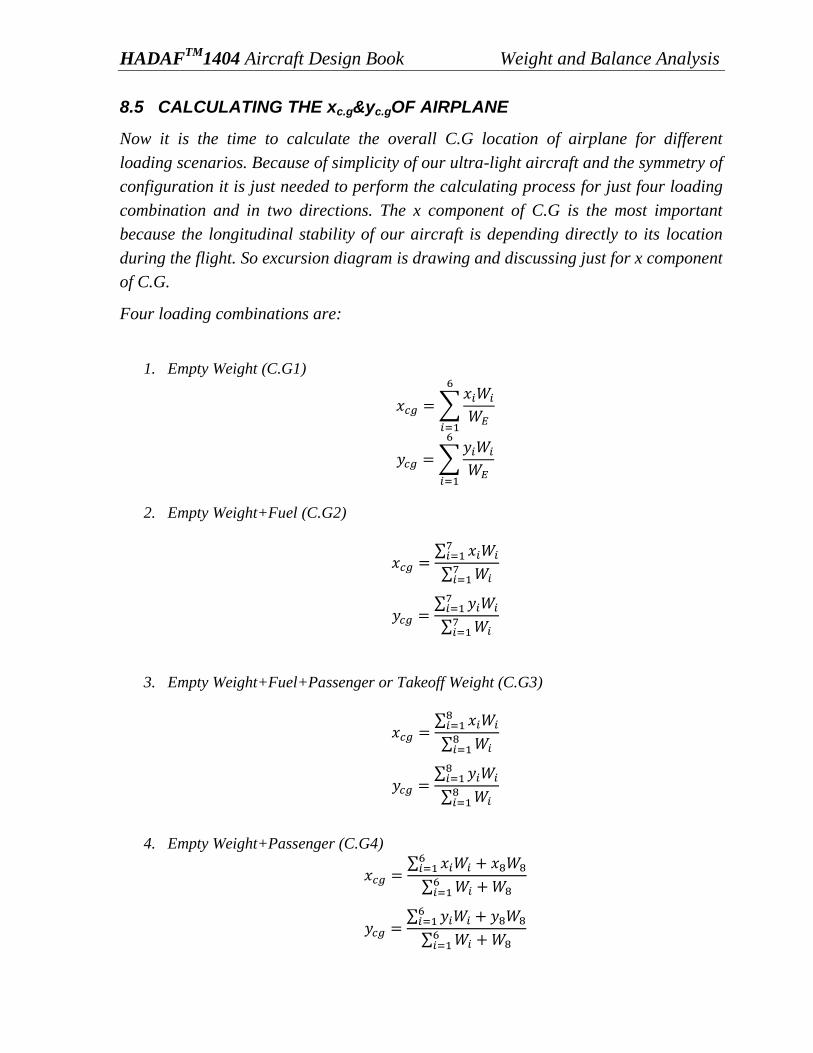
HADAFTM
1404 Aircraft Design Book Weight and Balance Analysis
8.5 CALCULATING THE xc.g&yc.gOF AIRPLANE
Now it is the time to calculate the overall C.G location of airplane for different
loading scenarios. Because of simplicity of our ultra-light aircraft and the symmetry of
configuration it is just needed to perform the calculating process for just four loading
combination and in two directions. The x component of C.G is the most important
because the longitudinal stability of our aircraft is depending directly to its location
during the flight. So excursion diagram is drawing and discussing just for x component
of C.G.
Four loading combinations are:
1. Empty Weight (C.G1)
∑
∑
2. Empty Weight+Fuel (C.G2)
∑
∑
∑
∑
3. Empty Weight+Fuel+Passenger or Takeoff Weight (C.G3)
∑
∑
∑
∑
4. Empty Weight+Passenger (C.G4)
∑
∑
∑
∑
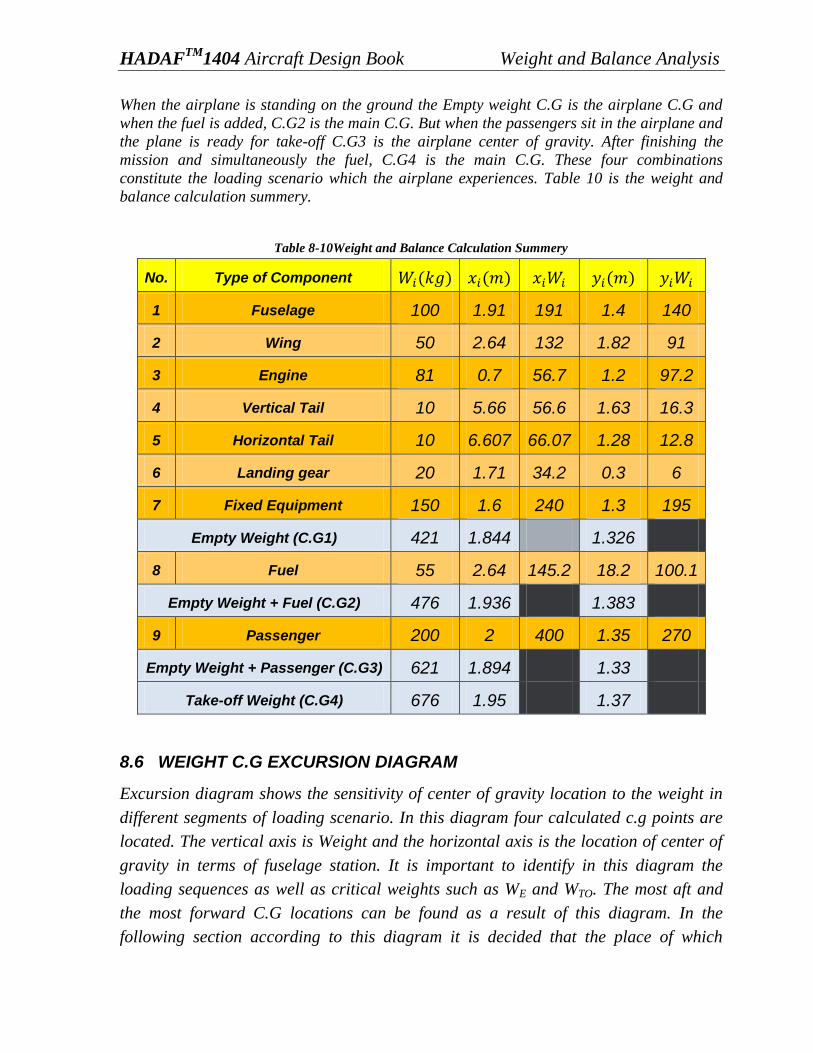
HADAFTM
1404 Aircraft Design Book Weight and Balance Analysis
When the airplane is standing on the ground the Empty weight C.G is the airplane C.G and
when the fuel is added, C.G2 is the main C.G. But when the passengers sit in the airplane and
the plane is ready for take-off C.G3 is the airplane center of gravity. After finishing the
mission and simultaneously the fuel, C.G4 is the main C.G. These four combinations
constitute the loading scenario which the airplane experiences. Table 10 is the weight and
balance calculation summery.
Table 8-10Weight and Balance Calculation Summery
No. Type of Component
1 Fuselage 100 1.91 191 1.4 140
2 Wing 50 2.64 132 1.82 91
3 Engine 81 0.7 56.7 1.2 97.2
4 Vertical Tail 10 5.66 56.6 1.63 16.3
5 Horizontal Tail 10 6.607 66.07 1.28 12.8
6 Landing gear 20 1.71 34.2 0.3 6
7 Fixed Equipment 150 1.6 240 1.3 195
Empty Weight (C.G1) 421 1.844 1.326
8 Fuel 55 2.64 145.2 18.2 100.1
Empty Weight + Fuel (C.G2) 476 1.936 1.383
9 Passenger 200 2 400 1.35 270
Empty Weight + Passenger (C.G3) 621 1.894 1.33
Take-off Weight (C.G4) 676 1.95 1.37
8.6 WEIGHT C.G EXCURSION DIAGRAM
Excursion diagram shows the sensitivity of center of gravity location to the weight in
different segments of loading scenario. In this diagram four calculated c.g points are
located. The vertical axis is Weight and the horizontal axis is the location of center of
gravity in terms of fuselage station. It is important to identify in this diagram the
loading sequences as well as critical weights such as WE and WTO. The most aft and
the most forward C.G locations can be found as a result of this diagram. In the
following section according to this diagram it is decided that the place of which
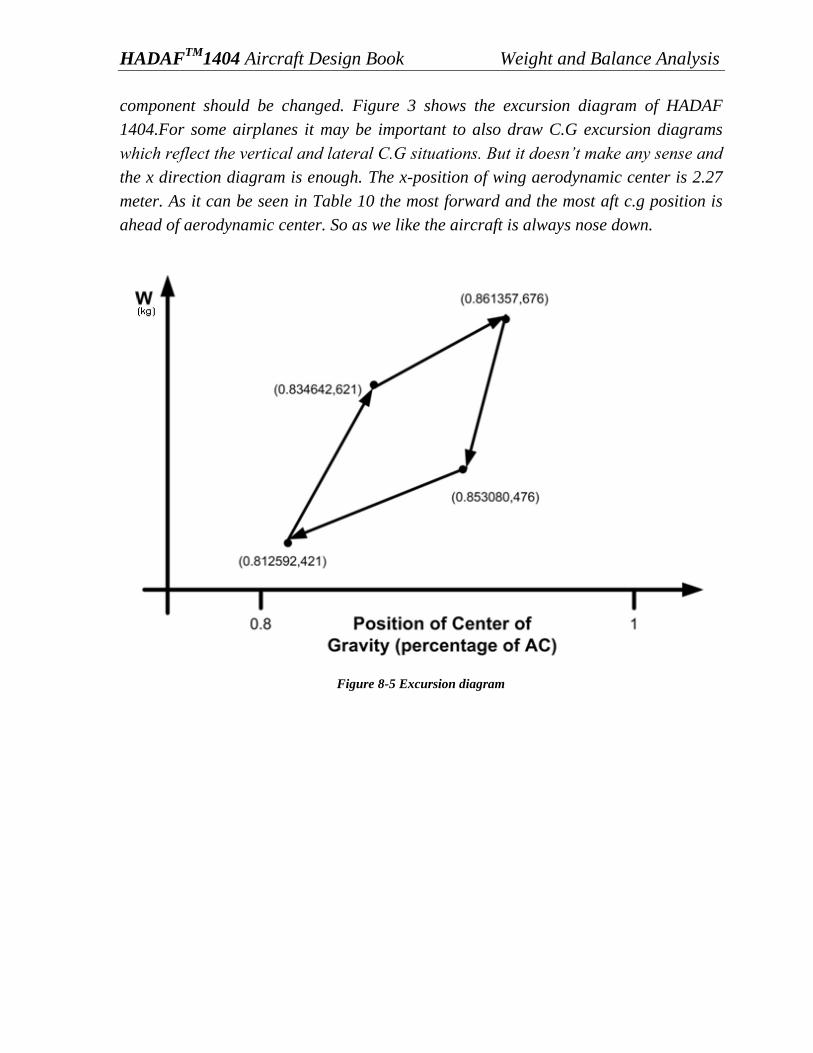
HADAFTM
1404 Aircraft Design Book Weight and Balance Analysis
component should be changed. Figure 3 shows the excursion diagram of HADAF
1404.For some airplanes it may be important to also draw C.G excursion diagrams
which reflect the vertical and lateral C.G situations. But it doesn‟t make any sense and
the x direction diagram is enough. The x-position of wing aerodynamic center is 2.27
meter. As it can be seen in Table 10 the most forward and the most aft c.g position is
ahead of aerodynamic center. So as we like the aircraft is always nose down.
Figure 8-5 Excursion diagram

HADAFTM
1404 Aircraft Design Book Weight and Balance Analysis
8.7 C.G EXCURSION DIAGRAM ARGUMENT
In this part the feasibility of using the configuration will be discussed. At first we
compare our airplane resulting C.G range with the airplanes in the same category.
The Roskam suggested C.G range for homebuilt airplanes is about 5 in. some
important principle should be discussed in this section.
1. As it is obvious from the excursion diagram, the c.g range is ahead of the wing mean
aerodynamic center and it is satisfactory because it is good for airplane to be
somehow noise down.
2. The ideal C.G arrangement is one for which the OWE C.G, the fuel C.G and the
payload C.G are in the same vertical location. But it is not possible to achieve the
ideal configuration. The existing C.G configuration is the closest to the ideal case.
HADAFTM
1404 Aircraft Design Book Weight and Balance Analysis
8.8 REFRENCES
1- Roskam, J., Airplane design: PartII , Preliminary Configuration Design of
Airplane.
2- Federal Aviation Regulation, FAR, Part 23
Related Documents